As filed with the Securities and Exchange Commission on 02 April 201531 March 2017
UNITED STATES SECURITIES AND EXCHANGE COMMISSION
Washington, D.C. 20549
FORM20-F
REGISTRATION STATEMENT PURSUANT TO SECTION 12(B) OR 12(G) OF THE SECURITIES EXCHANGE ACT OF 1934 OR |
ANNUAL REPORT PURSUANT TO SECTION 13 OR 15(D) OF THE SECURITIES EXCHANGE ACT OF 1934 OR |
TRANSITION REPORT PURSUANT TO SECTION 13 OR 15(D) OF THE SECURITIES EXCHANGE ACT OF 1934 OR |
SHELL COMPANY REPORT PURSUANT TO SECTION 13 OR 15(D) OF THE SECURITIES EXCHANGE ACT OF 1934 |
FOR THE FINANCIAL YEAR ENDED 31 December 20142016
Commission file number:1-14846
AngloGold Ashanti Limited
(Exact Name of Registrant as Specified in its Charter)
Republic of South Africa
(Jurisdiction of Incorporation or Organisation)
76 JeppeRahima Moosa Street, Newtown, Johannesburg, 2001
(P.O. Box 62117, Marshalltown, 2107)
South Africa
(Address of Principal Executive Offices)
Kandimathie Christine Ramon, Chief Financial Officer, Telephone: +27 11 6376019
E-mail: cramon@anglogoldashanti.com, 76 JeppeRahima Moosa Street, Newtown, Johannesburg, 2001, South Africa
(Name, Telephone,E-mail and/or Facsimile number and Address of Company Contact Person)
Securities registered pursuant to Section 12(b) of the Act:
| Title of each class | Name of each exchange on which registered | |
American Depositary Shares | New York Stock Exchange | |
Ordinary Shares | New York Stock Exchange* | |
5.375% | ||
| New York Stock Exchange | |
5.125% Notes due 2022 | New York Stock Exchange | |
6.50% Notes due 2040 | New York Stock Exchange |
| * | Not for trading, but only in connection with the registration of American Depositary Shares pursuant to the requirements of the Securities and Exchange Commission |
Securities registered pursuant to Section 12(g) of the Act:
None
Securities for which there is a reporting obligation pursuant to Section 15(d) of the Act:
None
Indicate the number of outstanding shares of each of the issuer’s classes of capital or common stock as of the close of the period covered by the annual report:
Ordinary Shares of 25 ZAR cents each | ||||
| ||||
A Redeemable Preference Shares of 50 ZAR cents each | 2,000,000 | |||
B Redeemable Preference Shares of 1 ZAR cent each | 778,896 |
Indicate by check mark if the registrant is a well-known seasoned issuer, as defined in Rule 405 of the Securities Act.
| Yes |
If this report is an annual or transition report, indicate by check mark if the registrant is not required to file reports pursuant to Section 13 or 15(d) of the Securities Exchange Act of 1934.
| Yes |
Indicate by check mark whether the registrant (1) has filed all reports required to be filed by Section 13 or 15(d) of the Securities Exchange Act of 1934 during the preceding 12 months (or for such shorter period that the registrant was required to file such reports), and (2) has been subject to such filing requirements for the past 90 days.
| Yes |
Indicate by check mark whether the registrant (1) has submitted electronically and posted on its corporate web site, if any, every Interactive Data File required to be submitted and posted pursuant to Rule 405 of RegulationS-T during the preceding 12 months (or for such shorter period that the registrant was required to submit and post such files)*.
| Yes |
Indicate by check mark whether the registrant is a large accelerated filer, an accelerated filer, or anon-accelerated filer. See definition of “accelerated filer and large accelerated filer” in Rule12b-2 of the Exchange Act.
(Check one): Large Accelerated Filer | Accelerated Filer | Non-Accelerated Filer |
Indicate by check mark which basis of accounting the registrant has used to prepare the financial statements included in this filing:
| U.S. GAAP |
International Financial Reporting Standards as issued by the International Accounting Standards Boardx☒ Other¨☐
If this is an annual report, indicate by check mark whether the registrant is a shell company (as defined in Rule12b-2 of the Exchange Act). | Yes |
| * | This requirement does not apply to the registrant. |
| Page | ||||||||
| 3 | ||||||||
| 4 | ||||||||
| 5 | ||||||||
| 5 | ||||||||
| 8 | ||||||||
| 9 | ||||||||
| 10 | ||||||||
Item 1: | 11 | |||||||
Item 2: | 11 | |||||||
Item 3: | ||||||||
| 3A. | 11 | |||||||
| 3B. | 15 | |||||||
| 3C. | 15 | |||||||
| 3D. | 15 | |||||||
Item 4: | Information on the company | 48 | ||||||
| 4A. | 48 | |||||||
| 4B. | 49 | |||||||
| 4C. | 104 | |||||||
| 4D. | 105 | |||||||
Item 4A: | 130 | |||||||
Item 5: | 131 | |||||||
| 5A. | 132 | |||||||
| 5B. | 175 | |||||||
| 5C. | 180 | |||||||
| 5D. | 181 | |||||||
| 5E. | 181 | |||||||
| 5F. | 181 | |||||||
Item 6: | 182 | |||||||
| 6A. | 182 | |||||||
| 6B. | 189 | |||||||
| 6C. | 192 | |||||||
| 6D. | 196 | |||||||
| 6E. | 197 | |||||||
Item 7: | 203 | |||||||
| 7A. | 204 | |||||||
| 7B. | 205 | |||||||
| 7C. | 205 | |||||||
Item 8: | 206 | |||||||
| 8A. | Consolidated financial statements and other financial information | 206 | ||||||
| 206 | ||||||||
| 211 | ||||||||
| 8B. | 211 | |||||||
1
Item 9: | 212 | |||||
| 9A. | ||||||
| 9B. | ||||||
| 9C. | ||||||
| 9D. | ||||||
| 9E. | ||||||
| 9F. | ||||||
Item 10: | 214 | |||||
| 10A. | ||||||
| 10B. | ||||||
| 10C. | ||||||
| 10D. | ||||||
| 10E. | ||||||
| 10F. | ||||||
| 10G. | ||||||
| 10H. | ||||||
| 10I. | ||||||
Item 11: | ||||||
Item 12: | 243 | |||||
| 12A. | ||||||
| 12B. | ||||||
| 12C. | ||||||
| 12D. | 243 | |||||
244 | ||||||
Item 13: | ||||||
Item 14: | Material modifications to the rights of security holders and use of proceeds | |||||
Item 15: | ||||||
Item 16A: | ||||||
Item 16B: | ||||||
Item 16C: | ||||||
Item 16D: | ||||||
Item 16E: | Purchases of equity securities by the issuer and affiliated purchasers | |||||
Item 16F: | ||||||
Item 16G: | ||||||
Item 16H: | ||||||
253 | ||||||
Item 17: | ||||||
Item 18: | ||||||
Item 19 | E pages | |||||
2
AngloGold Ashanti Limited
In this annual report on Form20-F, unless the context otherwise requires, references to AngloGold, AngloGold Ashanti, AGA, the company, the Company and the group are references to AngloGold Ashanti Limited including, as appropriate, subsidiaries and associate companies of AngloGold Ashanti.Ashanti Limited.
IFRS financial statements
As a company incorporated in the Republic of South Africa, AngloGold Ashanti has prepared and filedprepares annual audited consolidated financial statements and unaudited consolidated quarterlyhalf-year financial statements in accordance with International Financial Reporting Standards (IFRS) as issued by the International Accounting Standards Board (IASB) in the English language since 1998.language. These financial statements are distributed to shareholders and are submitted to the JSE Limited (JSE), as well as the New York, Australian and Ghana stock exchanges.
Currency
AngloGold Ashanti presents its consolidated financial statements in United States dollars.
In this annual report, references to rands, ZAR and R are to the lawful currency of the Republic of South Africa, references to US dollars, dollar or $ are to the lawful currency of the United States, references to€ and Euro are to the lawful currency of the European Union, references to C$ or CAD are to the lawful currency of Canada, references to ARS and Argentinean peso are to the lawful currency of Argentina, references to AUD and A$ are to the lawful currency of Australia, references to BRL are to the lawful currency of Brazil, references to NAD are to the lawful currency of Namibia, references to Tsh are to the lawful currency of the United Republic of Tanzania and references to GHC, cedi or Gh¢ are to the lawful currency of Ghana.
See “Item 3A.:3A: Selected financial data – Exchange rate information” for historical information regarding the US dollar/South African rand exchange rate. On 2322 March 2015,2017, the interbank US dollar/South African rand exchange rate as reported by OANDA CorporationReuters was R11.99/R12.57/$1.00.
Non-GAAP financial measures
In this annual report on Form20-F, AngloGold Ashanti presents the financial items “total cash costs”, “total cash costs per ounce”, “total production costs”, “total production costs per ounce”, “all-in“all-in sustaining costs”,“all-in sustaining costs per ounce”, “all-in“all-in costs” and “all-in“all-in costs per ounce”, which have been determined using industry guidelines and practices and are not IFRS measures. An investor should not consider these items in isolation or as alternatives to production costs,cost of sales, profit/(loss) applicable to equity shareholders, profit/(loss) before taxation, cash flows from operating activities or any other measure of financial performance presented in accordance with IFRS. The
While the Gold Institute provided definitions for the calculation of total cash costs and total production costs and during June 2013 the World Gold Council published a Guidance Note on “all-in“all-in sustaining costs” and “all-in“all-in costs” metrics. Themetrics, the calculation of total cash costs, total cash costs per ounce, total production costs, total production costs per ounce, all-in sustaining costs,all-in sustaining costs per ounce,all-in costs andall-in costs per ounce may vary significantly among gold mining companies, and by themselves do not necessarily provide a basis for comparison with other gold mining companies. See “Glossary“—Glossary of selected terms – terms–Financial terms – terms–Total cash costs”, “Total production costs”, “All-in“ —Glossary of selected terms–Financialterms–All-in sustaining costs” and “All-in“—Glossary of selected terms–Financialterms–All-in costs”. Nevertheless, AngloGold Ashanti believes that total cash costs,all-in sustaining costs andall-in costs in total and per ounce are useful indicators to investors and management as they provide:
an indication of profitability, efficiency and cash flows;
the trend in costs as the mining operations mature over time on a consistent basis; and
an internal benchmark of performance to allow for comparison against other mines, both within the AngloGold Ashanti group and at other gold mining companies.
A reconciliation of both cost of sales and total cash costs as included in the company’s audited financial statements to total cash costs,all-in sustaining costs andall-in costs for each of the three years ended 31 December 2014, 2015 and 2016 is presented herein. See “Item 5: Operating and Financial Review and Prospects—Totalall-in sustaining costs,all-in costs and total cash costs”.
Shares and shareholders
In this annual report on Form20-F, references to ordinary shares, ordinary shareholders, equity shareholders and shareholders/members, should be read as common stock, common stockholders and stockholders, respectively, and vice versa.
3
CERTAIN FORWARD-LOOKING STATEMENTS
Certain statements contained in this document, other than statements of historical fact, including, without limitation, those concerning the economic outlook for the gold mining industry, expectations regarding gold prices, production, total cash costs,all-in sustaining costs,all-in costs, cost savings and other operating results, return on equity, productivity improvements, growth prospects and outlook of AngloGold Ashanti’s operations, individually or in the aggregate, including the achievement of project milestones, commencement and completion of commercial operations of certain of AngloGold Ashanti’s exploration and production projects and the completion of acquisitions, dispositions or joint venture transactions, AngloGold Ashanti’s liquidity and capital resources and capital expenditures and the outcome and consequence of any potential or pending litigation or regulatory proceedings or environmental, health and safety issues, are forward-looking statements regarding AngloGold Ashanti’s operations, economic performance and financial condition.
These forward-looking statements or forecasts involve known and unknown risks, uncertainties and other factors that may cause AngloGold Ashanti’s actual results, performance or achievements to differ materially from the anticipated results, performance or achievements expressed or implied in these forward-looking statements. Although AngloGold Ashanti believes that the expectations reflected in such forward-looking statements are reasonable, no assurance can be given that such expectations will prove to have been correct. Accordingly, results could differ materially from those set out in the forward-looking statements as a result of among other factors, changes in economic, social and political and market conditions, the success of business and operating initiatives, changes in the regulatory environment and other government actions, including environmental approvals, fluctuations in gold prices and exchange rates, the outcome of pending or future litigation proceedings and business and operational risk management and other factors as described in “Item 3D.:3D: Risk factors” and elsewhere in this annual report. These factors are not necessarily all of the important factors that could cause AngloGold Ashanti’s actual results to differ materially from those expressed in any forward-looking statements. Other unknown or unpredictable factors could also have material adverse effects on future results. Consequently, readers are cautioned not to place undue reliance on forward-looking statements.
AngloGold Ashanti undertakes no obligation to update publicly or release any revisions to these forward-looking statements to reflect events or circumstances after the date of this annual report or to reflect the occurrence of unanticipated events, except to the extent required by applicable law. All subsequent written or oral forward-looking statements attributable to AngloGold Ashanti or any person acting on its behalf are qualified by the cautionary statements herein.
4
The following explanations are not intended as technical definitions but should assist the reader in understanding terminology used in this annual report. Unless expressly stated otherwise, all explanations are applicable to both underground and surface mining operations.
All injury frequency rate:The total number of injuries and fatalities that occurs per million hours worked.
BIF:Banded Ironstone Formation. A chemically formed iron-rich sedimentary rock.
By-products:Any products that emanate from the core process of producing gold, including silver, uranium and sulphuric acid.
Carbon-in-leach (CIL):Gold is leached from a slurry of gold ore with cyanide in agitated tanks and adsorbed on to activated carbon granules at the same time (i.e. when cyanide is introduced in the leach tank, there is already activated carbon in the tank and there is no distinction between leach and adsorption stages). The carbon granules are separated from the slurry and treated in an elution circuit to remove the gold.
Carbon-in-pulp (CIP): Gold is leached conventionally from a slurry of gold ore with cyanide in agitated tanks. The leached slurry then passes into the CIP circuit where activated carbon granules are mixed with the slurry and gold is adsorbed on to the activated carbon. The gold-loaded carbon is separated from the slurry and treated in an elution circuit to remove the gold.
CLR:Carbon leader reef.
Comminution:Comminution is the crushing and grinding of ore to make gold available for treatment. (See also “Milling”).
Contained gold:The total gold content (tons multiplied by grade) of the material being described.
Depletion:The decrease in the quantity of ore in a deposit or property resulting from extraction or production.
Development:The process of accessing an orebody through shafts and/or tunneling in underground mining operations.
Diorite:An igneous rock formed by the solidification of molten material (magma).
Doré:Impure alloy of gold and silver produced at a mine to be refined to a higher purity.
Electro-winning:A process of recovering gold from solution by means of electrolytic chemical reaction into a form that can be smelted easily into gold bars.
Elution:Recovery of the gold from the activated carbon into solution before zinc precipitation or electro-winning.
Feasibility study:A comprehensive technical and economic study of the selected development option for a mineral project that includes appropriately detailed assessments of applicable Modifying Factors together with any other relevant operational factors and detailed financial analysis that are necessary to demonstrate at the time of reporting that extraction is reasonably justified (economically mineable). The results of the study may reasonably serve as the basis for a final decision by a proponent or financial institution to proceed with, or finance, the development of the project. The confidence level of the study will be higher than that of aPre-Feasibility Study (JORC 2012).
Flotation:Concentration of gold and gold-hosting minerals into a small mass by various techniques (e.g. collectors, frothers, agitation,air-flow) that collectively enhance the buoyancy of the target minerals, relative to unwanted gangue, for recovery into an over-flowing froth phase.
5
Gold Produced:Refined gold in a saleable form derived from the mining process.
Grade:The quantity of gold contained within a unit weight of gold-bearing material generally expressed in ounces per short ton of ore (oz/t), or grams per metric tonne (g/t).
Greenschist:A schistose metamorphic rock whose green colour is due to the presence of chlorite, epidote or actinolite.
Leaching:Dissolution of gold from crushed or milled material, including reclaimed slime, prior to adsorption on to activated carbon or direct zinc precipitation.
Life of mine (LOM):Number of years for which an operation is planning to mine and treat ore, and is taken from the current mine plan.
Metallurgical plant:A processing plant constructed to treat ore and extract gold.
Milling:A process of reducing broken ore to a size at which concentrating can be undertaken. (See also “Comminution”).
Mine call factor:The ratio, expressed as a percentage, of the total quantity of recovered and unrecovered mineral product after processing with the amount estimated in the ore based on sampling. The ratio of contained gold delivered to the metallurgical plant divided by the estimated contained gold of ore mined based on sampling.
Mineral deposit:A mineral deposit is a concentration (or occurrence) of material of possible economic interest in or on the earth’s crust.
Mineral Resource:A concentration or occurrence of solid material of economic interest in or on the earth’s crust is such form, grade (or quality), and quantity that there are reasonable prospects for eventual economic extraction. The location, quantity, grade (or quality), continuity and other geological characteristics of a mineral resourceMineral Resource are known, estimated or interpreted from specific geological evidence and knowledge, including sampling. Mineral resourcesResources aresub-divided in order of increasing geological confidence, into inferred, indicatedInferred, Indicated or measuredMeasured categories (JORC 2012).
Modifying factors:Factors:Modifying Factors’ are considerations used to convert Mineral Resources to Ore Reserves. These include, but are not restricted to, mining, processing, metallurgical, infrastructure, economic, marketing, legal, environmental, social and governmental factors.
Ore Reserve:That part of a mineral deposit which could be economically and legally extracted or produced at the time of the Ore Reserve determination.
Ounce (oz) (troy):Used in imperial statistics. A kilogram is equal to 32.1507 ounces. A troy ounce is equal to 31.1035 grams.
Pay limit:The grade of a unit of ore at which the revenue from the recovered mineral content of the ore is equal to the sum of total cash costs, closure costs, Ore Reserve development andstay-in-business capital. This grade is expressed as anin-situ value in grams per tonne or ounces per short ton (before dilution and mineral losses).
Precipitate:The solid product formed when a change in solution chemical conditions results in conversion of somepre-dissolved ions into solid state.
Probable Ore Reserve:Ore Reserve for which quantity and grade are computed from information similar to that used for Proven Reserves, but the sites for inspection, sampling, and measurement are further apart or are otherwise less adequately spaced. The degree of assurance, although lower than that for Proven Reserves, is high enough to assume continuity between points of observation.
Productivity:An expression of labour productivity based on the ratio of ounces of gold produced per month to the total number of employees in mining operations.
Project capital:Capital expenditure to either bring a new operation into production; to materially increase production capacity; or to materially extend the productive life of an asset.
6
Proven Ore Reserve:A ‘Proven Ore Reserve’ is the economically mineable part of a Measured Mineral Resource. A Proven Ore Reserve implies a high degree of confidence in the Modifying Factors.
Project capital: Capital expenditure to either bring a new operation into production; to materially increase production capacity; or to materially extend the productive life of an asset.
Recovered grade:The recovered mineral content per unit of ore treated.
Reef:A gold-bearing sedimentary horizon, normally a conglomerate band that may contain economic levels of gold.
Refining:The final purification process of a metal or mineral.
Rehabilitation:The process of reclaiming land disturbed by mining to allow an appropriate post-mining use. Rehabilitation standards are defined by country-specific laws, including but not limited to the South African Department of Mineral Resources, the US Bureau of Land Management, the US Forest Service, and the relevant Australian mining authorities, and address among other issues, ground and surface water, topsoil, final slope gradient, waste handling andre-vegetation issues.
Seismic event:A sudden inelastic deformation within a given volume of rock that radiates detectable seismic energy.
Shaft:A vertical or subvertical excavation used for accessing an underground mine; for transporting personnel, equipment and supplies; for hoisting ore and waste; for ventilation and utilities; and/or as an auxiliary exit.
Short ton:Used in imperial statistics. Equal to 2,000 pounds.
Skarn:Smelting A rock of complex mineralogical composition, formed by contact metamorphism and metasomatism of carbonate rocks.
Smelting::A pyro-metallurgical operation in which gold precipitate from electro-winning or zinc precipitation is further separated from impurities.
Stoping:The process of excavating ore underground.
Stripping ratio: The ratio of waste tonnes to ore tonnes mined calculated as total tonnes mined less ore tonnes mined divided by ore tonnes mined.
Tailings:Finely ground rock of low residual value from which valuable minerals have been extracted.
Tonnage:Quantity of material measured in tonnes or tons.
Tonne:Used in metric statistics. Equal to 1,000 kilograms.
Tonnage: Quantity of material measured in tonnes or tons.
Waste:Material that contains insufficient mineralisation for consideration for future treatment and, as such, is discarded.
Yield:The amount of valuable mineral or metal recovered from each unit mass of ore expressed as ounces per short ton or grams per metric tonne.
Zinc precipitation:Zinc precipitation is the chemical reaction using zinc dust that converts gold in solution to a solid form for smelting into unrefined gold bars.
7
All-in costs:All-in Costs costs are All-in Sustainingall-in sustaining costs including additionalnon-sustaining costs which reflect the varying costs of producing gold over the life-cycle of a mine.Non-sustaining costs are those costs incurred at new operations and costs related to ‘major projects’ at existing operations where these projects will materially increase production.All-in costs per ounce is arrived at by dividing the dollar value of the sum of these cost metrics, by the ounces of gold sold.
All-in Sustaining sustaining costs:During June 2013 the World Gold Council (WGC), an industry body, published a Guidance Note on “all-in“all-in sustaining costs” metric, which gold mining companies can use to supplement their overallnon-GAAP disclosure. “All-in“All-in sustaining costs” is an extension of the existing “cash“total cash cost” metric and incorporates all costs related to sustaining production and in particular recognises the sustaining capital expenditure associated with developing and maintaining gold mines. In addition, this metric includes the cost associated with developing and maintaining gold mines. In addition, this metric includes the cost associated with corporate office structures that support these operations, the community and rehabilitation costs attendant with responsible mining and any exploration and evaluation costs associated with sustaining current operations.All-in sustaining costs per ounce is arrived at by dividing the dollar value of the sum of these cost metrics, by the ounces of gold sold.
Average number of employees:The monthly average number of production andnon-production employees and contractors employed during the year, where contractors are defined as individuals who have entered into a fixed-term contract of employment with a group company or subsidiary. Employee numbers of joint ventures represents the group’s attributable share.
Capital expenditure:Total capital expenditure on tangible assets.
Effective tax rate:Current and deferred taxation charge for the year as a percentage of profit before taxation.
OANDA Corporation: An internet-based provider of forex trading and currency information services.
Rated bonds:The $700 million 5.375 percent bonds due 2020, $300 million 6.5 percent bonds due 2040 and the $750 million 5.125 percent bonds due 2022.
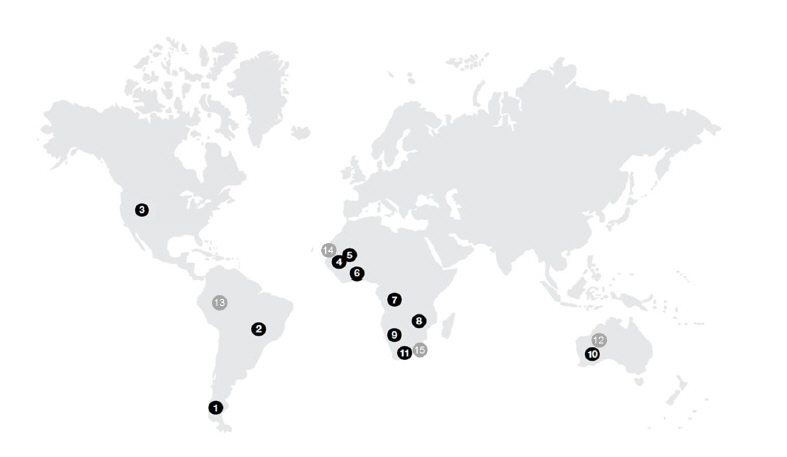
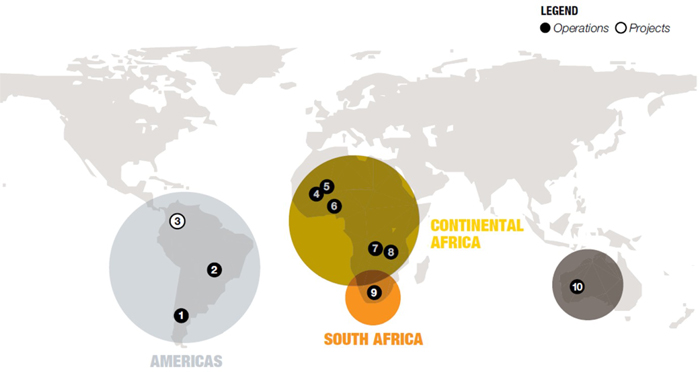
Region:Defines the operational management divisions within AngloGold Ashanti Limited, namely South Africa, Continental Africa (DRC, Ghana, Guinea, Mali and Tanzania), Australasia, and the Americas (Argentina Brazil and United States of America)Brazil).
Related party:Parties are considered related if one party has the ability to control the other party or exercise significant influence over the other party in making financial and operating decisions.
Significant influence:The ability, directly or indirectly, to participate in, but not exercise control over, the financial and operating policy decision of an entity so as to obtain economic benefit from its activities.
STRATE:Stay in business capital:Capital expenditure to extend useful lives of existing production assets. This includes replacement of vehicles, plant and machinery, Ore Reserve development, deferred stripping and capital expenditure related to financial benefit initiatives, safety, health and the environment.
Strate:The licensed Central Securities Depository (CSD) for the electronic settlement of financial instruments in South Africa.
Total cash costs:Total cash costs include site costs for all mining, processing and administration, reduced by contributions fromby-products and are inclusive of royalties and production taxes. Depreciation, depletion and amortization,amortisation, rehabilitation, corporate administration, employee severance costs, capital and exploration costs are excluded. Total cash costs per ounce are the attributable total cash costs divided by the attributable ounces of gold produced.
Total production costs:Total cash costs plus depreciation, depletion and amortization,amortisation, employee severance costs, rehabilitation and othernon-cash costs. Corporate administration and exploration costs are excluded. Total production costs per ounce are the attributable total production costs divided by the attributable ounces of gold produced.
Weighted average number of ordinary shares:The number of ordinary shares in issue at the beginning of the year, increased by shares issued during the year, weighted on a time basis for the period during which they have participated in the income of the group, and increased by share options that are virtually certain to be exercised.
8
$, US$ or dollar | United States dollars | |||||
ARS | Argentinean peso | |||||
A$ or AUD | Australian dollars | |||||
BRL | Brazilian real | |||||
|
| |||||
€ or Euro | European Euro | |||||
GHC, cedi or | Ghanaian cedi | |||||
|
| |||||
Tsh | Tanzanian Shillings | |||||
ZAR, R or rand | South African rands |
9
ADR | American Depositary Receipt | |
ADS | American Depositary Share | |
|
| |
AIFR | All injury frequency rate | |
ASX | Australian Securities Exchange | |
Au | Contained gold | |
BBSY | Bank Bill Swap Bid Rate | |
BEE | Black Economic Empowerment | |
bn | Billion | |
CDI | Chess Depositary Interests | |
CHESS | Clearing House Electronic Settlement System | |
CLR | Carbon Leader Reef | |
CR | Crystalkop Reef | |
DMTNP | Domestic medium-term notes programme | |
DRC | Democratic Republic of the Congo | |
ERP | Enterprise resource planning | |
|
| |
G or g | Grams | |
GhDS | Ghanaian Depositary Share | |
GhSE | Ghana Stock Exchange | |
IASB | International Accounting Standards Board | |
IFRS | International Financial Reporting Standards as issued by the IASB | |
JIBAR | Johannesburg Interbank Agreed Rate | |
JORC | Australasian Code for Reporting Exploration Results, Mineral Resources and Ore Reserves | |
|
| |
JSE | JSE Limited (Johannesburg Stock Exchange) | |
King III | The King Code on Corporate Governance for South Africa | |
Kg or kg | Kilograms | |
Km or km | Kilometres | |
| Squared kilometres | |
Koz | Thousand ounces | |
LIBOR | London Interbank Offer Rate | |
M or m | Metre or million, depending on the context | |
Moz | Million ounces | |
Mt | Million tonnes or tons | |
Mtpa | Million tonnes/tons per annum | |
NYSE | New York Stock Exchange | |
Oz or oz | Ounces (troy) | |
oz/t | Ounces per ton | |
oz/TEC | Ounces per total employee costed | |
SAMREC | South African Code for the Reporting of Exploration Results, Mineral Resources and Mineral Reserves | |
SEC | United States Securities and Exchange Commission | |
The Companies Act | South African Companies Act, No. 71 of 2008, as amended | |
T or t | Tons (short) or tonnes (metric) | |
Tpa or tpa | Tonnes/tons per annum | |
US/USA/United States | United States of America | |
|
| |
VCR | Ventersdorp Contact Reef |
Note:Rounding of figures in this report may result in computational discrepancies.
10
ITEM 1: IDENTITY OF DIRECTORS, SENIOR MANAGEMENT AND ADVISORS
Not applicable.
ITEM 2: OFFER STATISTICS AND EXPECTED TIMETABLE
Not applicable.
| 3A. | SELECTED FINANCIAL DATA |
The selected financial information set forth below for the years ended and as at 31 December 2014, 20132016, 2015 and 20122014 has been derived from, and should be read in conjunction with, the IFRS financial statements included under Item 18 of this annual report. The selected financial information for the years ended and as at 31 December 20102013 and 20112012 has been derived from the IFRS financial statements not included in this annual report.
The financial statements have been prepared under IFRS.
Consolidated income statement Revenue Gold income Cost of sales Gain (loss) onnon-hedge derivatives and other commodity contracts Gross profit Corporate administration, marketing, other expenses and other income Exploration and evaluation costs Other operating expenses Special items Operating profit (loss) Dividends received Interest received Exchange (loss) gain Finance costs and unwinding of obligations Fair value adjustment on issued bonds Share of associates and joint ventures’ profit (loss) Profit (loss) before taxation Taxation Profit (loss) after taxation from continuing operations Discontinued operations (Loss) profit from discontinued operations Profit (loss) for the year Allocated as follows Equity shareholders - Continuing operations - Discontinued operations Non-controlling interests - Continuing operations Basic earnings (loss) per ordinary share (cents) Earnings (loss) per ordinary share from continuing operations (Loss) earnings per ordinary share from discontinued operations Diluted earnings (loss) per ordinary share (cents) Earnings (loss) per ordinary share from continuing operations (Loss) earnings per ordinary share from discontinued operations Dividend per ordinary share (cents) Year ended 31 December 2016 2015 2014 2013 2012 $ $ $ $ $ (in millions, except share and per share amounts) 4,254 4,174 5,110 5,383 6,222 4,085 4,015 4,952 5,172 5,943 (3,263 ) (3,294 ) (3,972 ) (3,947 ) (3,765 ) 19 (7 ) 13 94 (36 ) 841 714 993 1,319 2,142 (61 ) (78 ) (92 ) (201 ) (288 ) (133 ) (132 ) (142 ) (250 ) (390 ) (110 ) (96 ) (28 ) (19 ) (47 ) (42 ) (71 ) (260 ) (2,951 ) (402 ) 495 337 471 (2,102 ) 1,015 - - - 5 7 22 28 24 39 43 (88 ) (17 ) (7 ) 14 8 (180 ) (245 ) (276 ) (293 ) (228 ) 9 66 (17 ) 307 245 11 88 (25 ) (162 ) (30 ) 269 257 170 (2,192 ) 1,060 (189 ) (211 ) (225 ) 237 (285 ) 80 46 (55 ) (1,955 ) 775 - (116 ) 16 (245 ) 140 80 (70 ) (39 ) (2,200 ) 915 63 31 (74 ) (1,985 ) 757 - (116 ) 16 (245 ) 140 17 15 19 30 18 80 (70 ) (39 ) (2,200 ) 915 15 (20 ) (14 ) (568 ) 232 15 8 (18 ) (506 ) 196 - (28 ) 4 (62 ) 36 15 (20 ) (14 ) (631 ) 177 15 8 (18 ) (571 ) 144 - (28 ) 4 (62 ) 33 - - - 10 56
Consolidated balance sheet data ASSETS Non-current assets Tangible assets Intangible assets Investments in associates and joint ventures Other investments Inventories Trade, other receivables and other assets Deferred taxation Cash restricted for use Othernon-current assets Current assets Other investments Inventories Trade, other receivables and other assets Cash restricted for use Cash and cash equivalents Non-current assets held for sale Total assets EQUITY AND LIABILITIES Share capital and premium Accumulated losses and other reserves Shareholders’ equity Non-controlling interests Total equity Non-current liabilities Borrowings Environmental rehabilitation and other provisions Provision for pension and post-retirement benefits Trade, other payables and deferred income Derivatives Deferred taxation Current liabilities Borrowings Trade, other payables and deferred income Bank overdraft Taxation Non-current liabilities held for sale Total liabilities Total equity and liabilities Number of ordinary shares as adjusted to reflect changes in share capital Share capital (exclusive of long-term debt and redeemable preference shares) Net assets11 As at 31 December 2016 2015 2014 2013 2012 $ $ $ $ $ (in millions, except share and per share amounts) 4,111 4,058 4,863 4,815 7,776 145 161 225 267 315 1,448 1,465 1,427 1,327 1,047 125 91 126 131 167 84 90 636 586 610 34 13 20 29 79 4 1 127 177 97 36 37 36 31 29 - 18 25 41 7 5,987 5,934 7,485 7,404 10,127 5 1 - 1 - 672 646 888 1,053 1,213 255 196 278 369 472 19 23 15 46 35 215 484 468 648 892 1,166 1,350 1,649 2,117 2,612 - - - 153 - 1,166 1,350 1,649 2,270 2,612 7,153 7,284 9,134 9,674 12,739 7,108 7,066 7,041 7,006 6,742 (4,393 ) (4,636 ) (4,196 ) (3,927 ) (1,269 ) 2,715 2,430 2,845 3,079 5,473 39 37 26 28 21 2,754 2,467 2,871 3,107 5,494 2,144 2,637 3,498 3,633 2,724 877 847 1,052 963 1,238 118 107 147 152 221 4 5 15 4 10 - - - - 10 496 514 567 579 1,084 3,639 4,110 5,279 5,331 5,287 34 100 223 258 859 615 516 695 820 979 - - - 20 - 111 91 66 81 120 760 707 984 1,179 1,958 - - - 57 - 760 707 984 1,236 1,958 4,399 4,817 6,263 6,567 7,245 7,153 7,284 9,134 9,674 12,739 408,223,760 405,265,315 404,010,360 402,628,406 383,320,962 16 16 16 16 16 2,754 2,467 2,871 3,107 5,494
| Year ended 31 December | ||||||||||||||||||||
| 2014 | 2013 | 2012 | 2011 | 2010(1) | ||||||||||||||||
| $ | $ | $ | $ | $ | ||||||||||||||||
| (in millions, except share and per share amounts) | ||||||||||||||||||||
Consolidated income statement | ||||||||||||||||||||
Revenue | 5,378 | 5,708 | 6,632 | 6,925 | 5,514 | |||||||||||||||
Gold income | 5,218 | 5,497 | 6,353 | 6,570 | 5,334 | |||||||||||||||
Cost of sales | (4,190 | ) | (4,146 | ) | (3,964 | ) | (3,892 | ) | (3,550 | ) | ||||||||||
Gain (loss) on non-hedge derivatives and other commodity contracts | 15 | 94 | (35 | ) | (1 | ) | (702 | ) | ||||||||||||
Gross profit | 1,043 | 1,445 | 2,354 | 2,677 | 1,082 | |||||||||||||||
Corporate administration, marketing and other expenses | (92 | ) | (201 | ) | (291 | ) | (278 | ) | (220 | ) | ||||||||||
Exploration and evaluation costs | (144 | ) | (255 | ) | (395 | ) | (279 | ) | (198 | ) | ||||||||||
Other operating expenses | (28 | ) | (19 | ) | (47 | ) | (31 | ) | (20 | ) | ||||||||||
Special items | (260 | ) | (3,410 | ) | (402 | ) | 163 | (126 | ) | |||||||||||
Operating profit (loss) | 519 | (2,440 | ) | 1,219 | 2,252 | 518 | ||||||||||||||
Dividends received | - | 5 | 7 | - | - | |||||||||||||||
Interest received | 24 | 39 | 43 | 52 | 43 | |||||||||||||||
Exchange gain | (7 | ) | 14 | 8 | 2 | 3 | ||||||||||||||
Finance costs and unwinding of obligations | (278 | ) | (296 | ) | (231 | ) | (196 | ) | (166 | ) | ||||||||||
Fair value adjustment on $1.25bn bonds | (17 | ) | (58 | ) | - | - | - | |||||||||||||
Fair value adjustment on option component of convertible bonds | - | 9 | 83 | 84 | (1 | ) | ||||||||||||||
Fair value adjustment on mandatory convertible bonds | - | 356 | 162 | 104 | (55 | ) | ||||||||||||||
Share of associates and joint ventures’ (loss) profit | (25 | ) | (162 | ) | (30 | ) | 72 | 63 | ||||||||||||
Profit (loss) before taxation | 216 | (2,533 | ) | 1,261 | 2,370 | 405 | ||||||||||||||
Taxation | (255 | ) | 333 | (346 | ) | (737 | ) | (276 | ) | |||||||||||
(Loss) profit for the year | (39 | ) | (2,200 | ) | 915 | 1,633 | 129 | |||||||||||||
Allocated as follows | ||||||||||||||||||||
Equity shareholders | (58 | ) | (2,230 | ) | 897 | 1,587 | 76 | |||||||||||||
Non-controlling interests | 19 | 30 | 18 | 46 | 53 | |||||||||||||||
| (39 | ) | (2,200 | ) | 915 | 1,633 | 129 | ||||||||||||||
Basic (loss) earnings per ordinary share (cents) | (14 | ) | (568 | ) | 232 | 411 | 20 | |||||||||||||
Diluted (loss) earnings per ordinary share (cents) | (14 | ) | (631 | ) | 177 | 355 | 20 | |||||||||||||
Dividend per ordinary share (cents) | - | 10 | 56 | 34 | 18 | |||||||||||||||
|
12
| As at 31 December | ||||||||||||||||||||
| 2014 | 2013 | 2012 | 2011 | 2010(1) | ||||||||||||||||
| $ | $ | $ | $ | $ | ||||||||||||||||
| (in millions, except share and per share amounts) | ||||||||||||||||||||
Consolidated balance sheet data | ||||||||||||||||||||
ASSETS | ||||||||||||||||||||
Non-current assets | ||||||||||||||||||||
Tangible assets | 4,863 | 4,815 | 7,776 | 6,545 | 6,180 | |||||||||||||||
Intangible assets | 225 | 267 | 315 | 210 | 194 | |||||||||||||||
Investments in associates and joint ventures | 1,427 | 1,327 | 1,047 | 691 | 622 | |||||||||||||||
Other investments | 126 | 131 | 167 | 186 | 237 | |||||||||||||||
Inventories | 636 | 586 | 610 | 410 | 345 | |||||||||||||||
Trade and other receivables | 20 | 29 | 79 | 76 | 152 | |||||||||||||||
Derivatives | - | - | - | - | 1 | |||||||||||||||
Deferred taxation | 127 | 177 | 97 | 79 | 20 | |||||||||||||||
Cash restricted for use | 36 | 31 | 29 | 23 | 33 | |||||||||||||||
Other non-current assets | 25 | 41 | 7 | 9 | 9 | |||||||||||||||
| 7,485 | 7,404 | 10,127 | 8,229 | 7,793 | ||||||||||||||||
Current assets | ||||||||||||||||||||
Other investments | - | 1 | - | - | - | |||||||||||||||
Inventories | 888 | 1,053 | 1,213 | 998 | 890 | |||||||||||||||
Trade and other receivables | 278 | 369 | 472 | 354 | 247 | |||||||||||||||
Current portion of other non-current assets | - | - | - | - | 1 | |||||||||||||||
Cash restricted for use | 15 | 46 | 35 | 35 | 10 | |||||||||||||||
Cash and cash equivalents | 468 | 648 | 892 | 1,112 | 575 | |||||||||||||||
| 1,649 | 2,117 | 2,612 | 2,499 | 1,723 | ||||||||||||||||
Non-current assets held for sale | - | 153 | - | 21 | 16 | |||||||||||||||
| 1,649 | 2,270 | 2,612 | 2,520 | 1,739 | ||||||||||||||||
Total assets | 9,134 | 9,674 | 12,739 | 10,749 | 9,532 | |||||||||||||||
EQUITY AND LIABILITIES | ||||||||||||||||||||
Share capital and premium | 7,041 | 7,006 | 6,742 | 6,689 | 6,627 | |||||||||||||||
Accumulated losses and other reserves | (4,196 | ) | (3,927 | ) | (1,269 | ) | (1,706 | ) | (2,638 | ) | ||||||||||
Shareholders’ equity | 2,845 | 3,079 | 5,473 | 4,983 | 3,989 | |||||||||||||||
Non-controlling interests | 26 | 28 | 21 | 137 | 124 | |||||||||||||||
Total equity | 2,871 | 3,107 | 5,494 | 5,120 | 4,113 | |||||||||||||||
Non-current liabilities | ||||||||||||||||||||
Borrowings | 3,498 | 3,633 | 2,724 | 2,456 | 2,569 | |||||||||||||||
Environmental rehabilitation and other provisions | 1,052 | 963 | 1,238 | 782 | 589 | |||||||||||||||
Provision for pension and post-retirement benefits | 147 | 152 | 221 | 195 | 191 | |||||||||||||||
Trade, other payables and deferred income | 15 | 4 | 10 | 14 | 17 | |||||||||||||||
Derivatives | - | - | 10 | 93 | 176 | |||||||||||||||
Deferred taxation | 567 | 579 | 1,084 | 1,148 | 900 | |||||||||||||||
| 5,279 | 5,331 | 5,287 | 4,688 | 4,442 | ||||||||||||||||
Current liabilities | ||||||||||||||||||||
Borrowings | 223 | 258 | 859 | 32 | 135 | |||||||||||||||
Trade, other payables and deferred income | 695 | 820 | 979 | 751 | 705 | |||||||||||||||
Bank overdraft | - | 20 | - | - | - | |||||||||||||||
Taxation | 66 | 81 | 120 | 158 | 134 | |||||||||||||||
| 984 | 1,179 | 1,958 | 941 | 974 | ||||||||||||||||
Non-current liabilities held for sale | - | 57 | - | - | 3 | |||||||||||||||
| 984 | 1,236 | 1,958 | 941 | 977 | ||||||||||||||||
Total liabilities | 6,263 | 6,567 | 7,245 | 5,629 | 5,419 | |||||||||||||||
Total equity and liabilities | 9,134 | 9,674 | 12,739 | 10,749 | 9,532 | |||||||||||||||
Number of ordinary shares as adjusted to reflect changes in share capital | 404,010,360 | 402,628,406 | 383,320,962 | 382,242,343 | 381,204,080 | |||||||||||||||
Share capital (exclusive of long-term debt and redeemable preference shares) | 16 | 16 | 16 | 16 | 16 | |||||||||||||||
Net assets | 2,871 | 3,107 | 5,494 | 5,120 | 4,113 | |||||||||||||||
|
13
Annual dividends
The table below sets forth the amounts of interim, final and total dividends declared in respect of the past five years in cents per ordinary share.
| Year ended 31 December(1) | 2014 | 2013 | 2012 | 2011 | 2010 | 2016 | 2015 | 2014 | 2013 | 2012 | ||||||||||||||||||||||||||||||
South African cents per ordinary share | ||||||||||||||||||||||||||||||||||||||||
First quarter | - | 50 | 200 | 80 | 70 | - | - | - | 50 | 200 | ||||||||||||||||||||||||||||||
Second quarter | - | 50 | 100 | - | - | - | - | - | 50 | 100 | ||||||||||||||||||||||||||||||
Third quarter | - | - | 100 | 90 | 65 | - | - | - | - | 100 | ||||||||||||||||||||||||||||||
Fourth quarter | - | - | 50 | 90 | - | - | - | - | - | 50 | ||||||||||||||||||||||||||||||
Total | - | 100 | 450 | 260 | 135 | - | - | - | 100 | 450 | ||||||||||||||||||||||||||||||
US cents per ordinary share(2) | ||||||||||||||||||||||||||||||||||||||||
First quarter | - | 5 | 26 | 11 | 9 | - | - | - | 5 | 26 | ||||||||||||||||||||||||||||||
Second quarter | - | 5 | 12 | - | - | - | - | - | 5 | 12 | ||||||||||||||||||||||||||||||
Third quarter | - | - | 12 | 12 | 9 | - | - | - | - | 12 | ||||||||||||||||||||||||||||||
Fourth quarter | - | - | 6 | 11 | - | - | - | - | - | 6 | ||||||||||||||||||||||||||||||
Total | - | 10 | 56 | 34 | 18 | - | - | - | 10 | 56 | ||||||||||||||||||||||||||||||
| (1) |
|
| (2) | Dividends for these periods were declared in South African cents. US dollar cents per share figures have been calculated based on exchange rates prevailing on each of the respective payment dates. |
For further information on the company’s policy on dividend distributions, see “Item 8A: Consolidated financial statementsFinancial Statements and other information – Other Information—Dividends”.
Exchange rate information
The following table sets forth, for the periods and dates indicated, certain information concerning US dollar/South African rand exchange rates expressed in rands per $1.00. On 2322 March 2015,2017, the interbank rate between South African rands and US dollars as reported by OANDA CorporationReuters was R11.99/$12.57 /$1.00.
| Year ended 31 December(2) | High | Low | Year end | Average (1) | High | Low | Year end | Average (1) | ||||||||||||||||||||||||
2010 | 8.08 | 6.57 | 6.64 | 7.34 | ||||||||||||||||||||||||||||
2011 | 8.60 | 6.49 | 8.14 | 7.27 | ||||||||||||||||||||||||||||
2012 | 8.95 | 7.46 | 8.47 | 8.20 | 8.95 | 7.46 | 8.47 | 8.20 | ||||||||||||||||||||||||
2013 | 10.51 | 8.47 | 10.49 | 9.63 | 10.51 | 8.47 | 10.49 | 9.63 | ||||||||||||||||||||||||
2014 | 11.69 | 10.28 | 11.60 | 10.84 | 11.69 | 10.28 | 11.60 | 10.84 | ||||||||||||||||||||||||
2015(3) | 12.47 | 11.36 | 11.71 | |||||||||||||||||||||||||||||
2015 | 15.87 | 11.36 | 15.53 | 12.77 | ||||||||||||||||||||||||||||
2016 | 16.87 | 13.18 | 13.73 | 14.68 | ||||||||||||||||||||||||||||
2017(3) | 13.82 | 12.56 | 13.26 | |||||||||||||||||||||||||||||
| (1) | The average rate of exchange on the last business day of each month during the year. |
| (2) | Based on the interbank rate as reported by |
| (3) | Through to |
| Exchange rate information for the months of(1) | High | Low | ||||||
September 2014 | 11.26 | 10.63 | ||||||
October 2014 | 11.33 | 10.86 | ||||||
November 2014 | 11.27 | 10.92 | ||||||
December 2014 | 11.69 | 11.04 | ||||||
January 2015 | 11.71 | 11.39 | ||||||
February 2015 | 11.79 | 11.36 | ||||||
March 2015(2) | 12.47 | 11.65 | ||||||
| Exchange rate information for the months of (1) | High | Low | ||||||
September 2016 | 14.59 | 13.44 | ||||||
October 2016 | 14.36 | 13.46 | ||||||
November 2016 | 14.47 | 13.18 | ||||||
December 2016 | 14.12 | 13.46 | ||||||
January 2017 | 13.82 | 13.23 | ||||||
February 2017 | 13.46 | 12.90 | ||||||
March 2017(2) | 13.33 | 12.56 | ||||||
| (1) | Based on the interbank rate as reported by |
| (2) | Through to |
14
| 3B. | CAPITALISATION AND INDEBTEDNESS |
Not applicable.
| 3C. | REASONS FOR THE OFFER AND USE OF PROCEEDS |
Not applicable.
| 3D. | RISK FACTORS |
This section describes many of the risks that could affect AngloGold Ashanti. There may, however, be additional risks unknown to AngloGold Ashanti and other risks, currently believed to be immaterial, that could turn out to be material. Additional risks may arise or become material subsequent to the date of this document. These risks, either individually or simultaneously, could significantly affect the group’s business, financial results and the price of its securities.
Risks related to AngloGold Ashanti’s results of operations and financial condition as a result of factors that impact the gold mining industry generally.
Commodity market price fluctuations could adversely affect the profitability of operations.
AngloGold Ashanti’s revenues are primarily derived from the sale of gold and, to a lesser extent, uranium, silver and sulphuric acid. The compay’scompany’s current policy is to sell its products at prevailing market prices and not to enter into price hedging arrangements. The market prices for these commodities fluctuate widely. These fluctuations are caused by numerous factors beyond the company’s control. For example, the market price of gold may change for a variety of reasons, including:
speculative positions taken by investors or traders in gold;
monetary policies announced or implemented by central banks, including the U.S. Federal Reserve;
changes in the demand for gold as an investment or as a result of leasing arrangements;
changes in the demand for gold used in jewellery and for other industrial uses, including as a result of prevailing economic conditions;
changes in the supply of gold from production, divestment, scrap and hedging;
financial market expectations regarding the rate of inflation;
the strength of the U.S. dollar (the currency in which the gold price trades internationally) relative to other currencies;
changes in interest rates;
actual or anticipated sales or purchases of gold by central banks and the International Monetary Fund;Fund (IMF);
gold hedging andde-hedging by gold producers;
global or regional political or economic events; and
the cost of gold production in major gold producing countries.
The market price of gold has been and continues to be significantly volatile. During 2014,2016, the gold price traded from a low of $1,141$1,060.24 per ounce to a high of $1,382$1,374.91 per ounce, remaining well below a peak of $1,900 per ounce in September 2011. Between 1 January 2017 and 22 March 2017, the gold price traded between a low of $1,163.40 per ounce and a high of $1,256.56 per ounce. On 2322 March 2015,2017 the afternoon price for gold on the London Bullion Market was $1,186$1,249.05 per ounce. TheIn addition to protracted declines such as the one experienced from 2011 through 2015, the price of gold is also often subject to sharp, short-term changes; forchanges. For example, during thethree-day period from Friday, 12 April 2013, through to Monday, 15 April 2013, the price of gold droppedfell by $228 per ounce.
During 2012 Additionally, the spot price of gold fell by more than four percent to $1,086 per ounce in overnight trading on 20 July 2015 after traders sold 57 tonnes of gold in Shanghai and 2013, a correlation existed between the central banks’ policies andNew York. By taking the price of gold withbelow $1,100 per ounce, the July 2015sell-off triggered a high volume of stop-loss orders that had been put in place by traders to automatically sell when the gold price reached a predetermined level. This caused the gold price to drop further. Any sharp or prolonged fluctuations in the price falling atof gold can have a material adverse impact on the prospectcompany’s profitability and financial condition.
Central banks’ policies can affect the price of gold. If gold is treated as a safe alternative investment during economic downturns, the price of gold may fall when central banks end of quantitative easing in some of the main economies.or increase interest rates. For example, on 19 June 2013, Chairman Ben Bernanke of the Federal Reserve announced that the Federal Reserve may begin reducing its quantitative easing programme in 2013. During the course of the following week, the price of gold fell to $1,180 per ounce, its lowest levelannual lows when the Chairman of the U.S. Federal Reserve announced a reduction in 34 months. Furthermore,quantitative easing in the week following Janet Yellen’s announcement ofJune 2013, the end of the quantitative easing programme of the Federal Reserve on 29in October 2014 and an increase in interest rates in December 2015. Similarly, gold prices continued on a downward trend after the Chairman’s announcement of an increase in interest rates in December 2016. However, the gold price has generally increased since the beginning of gold reached its annual low2017 despite the Chairman’s announcement of $1,141 per ounce.another interest rate increase in March of 2017 and may continue to be unpredictable. Any future announcements or proposals by the U.S. Federal Reserve, or any of its board members or regional presidents or other similar officials relating to any such reduction,in other major economies may materially and adversely affect the price of gold and, as a result, AngloGold Ashanti’s financial condition and results of operations.
15
LikeWhilst overall supply and demand typically do not affect the gold prices, gold demand can fluctuate materially from one yearprice in the same manner or to the next, includingsame degree as other commodities due to the considerable size of historical mined stocks of gold, events that affect supply and demand may nonetheless have an impact. According to the World Gold Council, demand for gold is generally driven by four main sectors, namely jewellery, investment, central banks and technology. The market for gold bullion bar, AngloGold Ashanti’s primary product, is generally limited to bullion banks, the number of which has declined in recent years. Central banks’ purchases can be adversely affected by declines in foreign exchange reserves. For example, this was one of the countriesfactors that drove a 33 percent decline in net gold purchases by central banks in 2016 compared to 2015. Demand for gold is also largely impacted by trends in China and India, which account for the highest gold consumption worldwide. Demand for gold may be particularly affected by government policies in these countries. For example, according to the World Gold Council, gold demand in China fell 38%38 percent in 2014 compared to 2013 according to the World Gold Council. Over the same period,and demand for gold bars and coins fell by 50% both in China and in India. In China, the decline was50 percent due in part to the government’s anti-corruption programme, which put limited pressure on demand for gold ornaments andso-called “gift bars”. WhilstIn India, government intervention to try to reduce the considerable sizetrade deficit, a material portion of historical mined (i.e., above ground) stocks ofwhich is linked to gold imports, led to various import taxes being introduced, which unsettled the metal means that overall supply and demand of gold typically do not affect the gold price in the same manner or degree compared to other commodities, events that impact supply and demand may nonetheless affect gold’sdomestic market price. Demand for gold may be affected, in particular, by2016. The Indian government policies,also introduced measures in 2016 to reduce undeclared income, including taxes and duties. For example, over the course of 2013,a demonetisation policy put in place in November 2016. Although gold imports temporarily increased when the Indian Finance Ministry increasedgovernment announced its decision to retire the500-rupee and1,000-rupee bank notes, assoon-to-be obsolete notes were used to buy gold, import dutiesgold imports registered a 55 percent decline by value the following month due to the lack of liquidity resulting from 2% to 10%, with the most recent increase to 10% occurring in August 2013. In addition, at least a fifth of gold imported into India must be exported. Such increases,demonetisation. These and any similar import duty increasespolicies in India, China or other large gold importinggold-importing countries could adversely affect demand for, and consequently prices of, gold.
Furthermore, the shift in demand from physical gold to gold-related investments and speculative instruments may exacerbate the volatility of the gold price. For example, in March 2015, the Finance Ministry in India which overtook China as the world’s largest consumer of gold in 2014, announced the creationan offering of sovereign gold bonds as an alternative to the purchase of physical gold.gold in March 2015 and conducted severalfollow-on offerings in 2016. This and other policies of the Indian government contributed to a 22 percent decline in gold jewellery demand in India between 2015 and 2016. Slower consumption of physical gold in India, resulting from a move toward gold-tracking investments or otherwise, may have an adverse impact on global demand for, and prices of, bullion.
A sustained period of significant gold price volatility may adversely affect the company’s ability to evaluate the feasibility of undertaking new capital projects or the continuity of existing operations, to meet its operational targets or to make other long-term strategic decisions. Lower and more volatile gold prices, together with other factors, have led AngloGold Ashanti to alter its expansion and development strategy and consider ways to align its asset portfolio to take account of such expectations and trends. As a result, the company may decide to curtail or temporarily or permanently shut down certain of its exploration and production operations, which may be difficult and costly to effect. A further sustained decrease in the price of gold could also have a material adverse effect on AngloGold Ashanti’s financial condition and results of operations, as it may be unable to quickly adjust its cost structure to reflect the reduced gold price environment. Mines with marginal headroom may be subject to decreases in value that are other than temporary, which may result in impairment losses. During 2013, the company reviewedSee “—Certain factors may affect AngloGold Ashanti’s ability to support the carrying valueamount of its miningproperty, plant and equipment, intangible assets (including ore stockpiles),and goodwill and intangibles and, based on revised forecast gold prices, booked a charge of $3,245 million (2014: $12 million) in relation to impairments, derecognition and revaluation of net realisable valuethe balance sheet. If the carrying amount of its mining assets (including ore stockpiles), goodwill and intangibles.is not recoverable, AngloGold Ashanti may be required to recognise an impairment charge, which could be significant.” The market value of gold inventory may be reduced and marginal stockpile and heap leach inventories may be written down to net realisable value or may not be processed further as it may not be economically viable at lower gold prices. In addition, AngloGold Ashanti is obliged to meet certain financial covenants under the terms of its borrowing facilities and its ability to continue to meet these covenants could be adversely affected by a further sustained decrease in the price of gold. The use of lower gold prices in reserve calculationsOre Reserve estimates and life of mine plans could also result in material impairments of the company’s investment in mining properties or a reduction in its Ore Reserves estimates and corresponding restatements of its Ore Reserves and increased amortisation, reclamation and closure charges.
The spot price of uranium has been volatile in past years. During 2014,2016, the price varied between a low of approximately $28$18 per pound and a high of $44$35 per pound. On 2322 March 2015,2017, the spot price of uranium was $40$24.50 per pound. In 2016, high inventory levels, an increase in the use of uranium enrichment at the expense of mined uranium and a slowdown in China’s uranium purchases caused uranium prices to continue aten-year decline. Uranium prices can also be affected by several other factors, including demand for nuclear reactors, uranium production shortfalls and restocking by utilities. EventsAdditionally, events like those surrounding the earthquake and tsunami that occurred in Japan in 2011 can also have a material adverse impact on the price of and demand for uranium.
The price of silver has also experienced significant fluctuations. For example,fluctuations in past years. During 2016, the price varied from a highlow of $32$13.71 per ounce in January 2013,2016 to a high of $21.10 per ounce in July 2016. On 22 March 2017, the price of silver declined to a low of $18was $17.50 per ounce by June 2013. Additionally, after climbing back to $22 per ounce in February 2014, the price declined further to a low of $15 per ounce in November 2014.ounce. Factors affecting the price of silver include investor demand, physical demand for silver bars, industrial and retailoff-take, and silver coin minting. On 23 March 2015, the price of silver was $17 per ounce.
If revenue from sales of gold, uranium, silver or sulphuric acid falls below their respective cost of production for an extended period, AngloGold Ashanti may experience losses and curtail or suspend some or all of its exploration projects and existing operations or sell underperforming assets. Declining commodities prices may also force a reassessment of the feasibility of a particular project or projects, which could cause substantial delays or interrupt operations until the reassessment can be completed.
16
Foreign exchange fluctuations could have a material adverse effect on AngloGold Ashanti’s results of operations and financial condition.
Gold is principally a U.S. dollar-priced commodity and most of the company’s revenues are realised in, or linked to, U.S. dollars, whilst production costscost of sales are largely incurred in the local currency where the relevant operation is located. Given the company’s global operations and local foreign exchange regulations, some of its funds are held in local currencies, such as the South African rand, Ghanaian cedi, Brazilian real, ArgentineanArgentinian peso and the Australian dollar. The weakness of the U.S. dollar against local currencies results in higher production costscost of sales in U.S. dollar terms. Conversely, the strengthening of the dollar lowers local production costscost of sales in U.S. dollar terms.
From time to time, AngloGold Ashanti may implement currency hedges intended to reduce exposure to changes in the foreign currency exchange. Such hedging strategies may not however be successful, and any of AngloGold Ashanti unhedged exchange payments will continue to be subject to market fluctuations.
Exchange rate movements may have a material impact on AngloGold Ashanti’s operating results. For example, based on average exchange rates received in 2016, the company estimates that a 1%one percent strengthening of all of the South African rand, Brazilian real, the ArgentineanArgentinian peso or the Australian dollar against the U.S. dollar will, other factors remaining equal, result in an increase in total cash costs of approximately $6 per ounce, or approximately 1%, of the company’s total cash costs.ounce.
The profitability of mining companies’ operations and the cash flows generated by these operations are significantly affected by fluctuations in input production prices, many of which are linked to the prices of oil and steel.
Fuel, energy and consumables, including diesel, heavy fuel oil, chemical reagents, explosives, tyres, steel and mining equipment consumed in mining operations form a relatively large part of the operating costs and capital expenditure of any mining company.
AngloGold Ashanti has no influence over the cost of these consumables, many of which are linked to some degree to the price of oil and steel. Whilst, from time to time, AngloGold Ashanti may implement diesel hedges intended to reduce exposure to changes in the oil price, such hedging strategies may not always be successful, and any of the company’s unhedged diesel consumption will continue to be subject to market fluctuations.
The price of oil has been volatile, fluctuating between $55$25 and $115$55 per barrel of Brent Crude in 2014.2016. As of 2322 March 2015,2017, the price of oil was at $54$49.46 per barrel of Brent Crude. AngloGold Ashanti estimates that for each U.S. dollar per barrel rise or fall in the oil price, other factors remaining equal, the total cash costs of all its operations change by approximately $0.78$0.76 per ounce. The total cash costs of certain of the company’s mines, particularly Sadiola, Siguiri, Geita, Cripple Creek & Victor, and Tropicana are most sensitive to changes in the price of oil. Even when fuel prices are in decline, expected savings may be partly offset by increases in governments’ fixed fuel levies or the introduction by governments of new levies. For example, in Tanzania, the government introduced a levy charged at 1.5 percent of the price including Cost, Insurance and Freight of fuel, earmarked for railway infrastructure development, effective 1 July 2015. This resulted in an additional annual cost impact at AngloGold Ashanti’s Geita mine of approximately $2.7 million in 2016 and is expected to have a similar annual cost impact going forward.
Furthermore, the price of steel has also been volatile. Steel is used in the manufacture of most forms of fixed and mobile mining equipment, which is a relatively large contributor to the operating costs and capital expenditure of a mine. For example, in 2016 the price of flat hot rolled coil (North American Domestic FOB) steel traded between $608$379 per tonne as of 1 January 2016 and $696$630 per tonne in 2014.as of 29 June 2016. On 2322 March 2015,2017, the price of flat hot rolled coil (North American Domestic FOB) was $481$648 per tonne.
Fluctuations in oil and steel prices have a significant impact on operating costs and capital expenditure estimates and, in the absence of other economic fluctuations, could result in significant changes in the total expenditure estimates for new mining projects or render certain projects non-viable.non-viable, which could have a material adverse impact on the company’s results of operations and financial condition.
Energy cost increases and power fluctuations and stoppages could adversely impact the company’s results of operations and financial condition.
Increasing global demand for energy, concerns about nuclear power and the limited growth of new supply are impacting the price and supply of energy. The transition of emerging markets to higher energy consumption, actual and proposed taxation of carbon taxationemissions as well as unrest and potential conflict in the Middle East, amongst other factors, could result in increased demand or constrained supply and sharply escalating oil and energy prices.
AngloGold Ashanti’s mining operations are substantially dependent upon electrical power generated by local utilities or by power plants situated at some of its operations. The unreliability of these local sources of power can have a material effect on the company’s operations, as large amounts of power are required for ventilation, exploration, development, extraction, processing and other mining activities on the company’s properties.
17
In South Africa, the company’s operations are dependent on electricity supplied by onea parastatal agency of Eskom, a state-owned power generation company, Eskom.company. Although other competitors in the renewable energy market have now entered the power supply market, the power supply is still channelled through the Eskom infrastructure. Electricity is used for most of our business and safety-critical operations, that includeincluding cooling, hoisting and dewatering. Loss of power can therefore impact production and employee safety, and prolonged outages could lead to flooding of workings and ore sterilisation. In 2008, Eskom and the South African government declared a national emergency and warned that they could no longer guarantee the availability of electricity due to a national supply shortage which at the time was blamed on coal supply shortages, heavy rain fall and unplannedgeneration-set outages as a result of maintenance backlog and asset age. The entire country went into a programme of rolling blackouts and AngloGold Ashanti and other mining companies operating in South Africa were forced in late January untilmid-March of 2008 to temporarily suspend mining operations.
A warning of the “very high” risk of blackouts was reissued at the start of 2011 and each year since.until 2015. On 20 February 2014, Eskom declared a power emergency pursuant to its regulatory protocols to protect the national electricity grid. The power emergency was caused by the loss of additional generating units, reduced importsa 1,500MW reduction in imported electricity resulting from the failure of power lines from Coharaat the Cahora Bassa hydro scheme in Mozambique and the extensive use of emergency reserves. Eskom alerted key industrial customers, including AngloGold Ashanti, asking them to reduce their load by a minimum of 10%10 percent during critical periods. Since February 2014, AngloGold Ashanti has reduced its electricity consumption in South Africa by more than 10%10 percent measured in Gigawatt hour usage. Then, inIn November 2014, Eskom reintroduced a schedule of rolling blackouts, or “load shedding”. Whilst a national energy conservation programme isAlthough the last blackout was imposed in place,2015, Eskom cannot guarantee that there will be no power interruptions and is again facing very tight supply reserve margins in 2015, which can be expected to continue for many years to come.the future. Management expects that these interruptions may resume in the future.
Furthermore, the power supply to the company’s South African operations has been and may be load curtailed or interrupted again in the future for reasons other than government action.reasons. For example, lightning or other damage to power stations can also result in power interruptions at the company’s operations. In this regard, AngloGold Ashanti’s two main operational sites in the West Wits region in South Africa had all mainexperienced power interruptedreductions between 13 March 2013 and 15 March 2013 after a fire caused by lightning damaged a transformer at asevere damage to the 500MVA transformers situated close to the main regional substation.road passing through the West Rand area.
Eskom and the National Energy Regulator of South Africa (“NERSA”)(NERSA) recognise the need to increase electricity supply capacity, and a series of tariff increases and proposals have been enacted since 2010 to assist in the funding of this expansion. NERSA originally approved an increase of 24.8% for 2010, 25.8% for 2011, 25.9% for 2012, and 16.0% for 2013. The actual increase implemented for 2012 was lowered to 16.09% after government intervention. In 2013, NERSA announced that Eskom would be allowed to increase electricity tariffs for the five-year period that began in April 2013 at an average yearly increase of 8%,8 percent, which was half of that sought by the utility in its application. InHowever, in October 2014, NERSA granted a 12.69%12.69 percent increase in electricity prices with effect from April 2015. In early 2016, NERSA heard a second application from Eskom to increase tariffs and an increase of 9.4 percent was granted, effective 1 April 2016. Although a lower increase of 2.2 percent was approved in February 2017, effective 1 April 2017, greater tariff increases may be imposed
in future years. Instability in the industry is further exacerbated by uncertainty around the approval, cost and continuation of a nuclear energy programme and additional delays expected in connection with the completion of the Medupi and Ingula coal power stations.
There can be no assurance as to the existence or nature of any government intervention with respect to tariff increases in the future. Other difficulties at Eskom, relating to a large financial deficit, may result in additional tariff increases. As energy represents a large proportion of the company’s operating costs in South Africa, these increases have had, and any future increases will have, a materially adverse impact on the total cash costs of its South African operations.
The company has also identified a risk of energy shortages in Argentina, Brazil, Ghana and the DRC. All theBrazil. The company’s mining operations in Ghana depend on hydroelectric power supplied by the state-controlled Volta River Authority (“VRA”)(VRA), which is supplemented by thermal power from the Takoradi plant and a smaller unit at Tema. AngloGold Ashanti negotiates rates directly with the VRA to power the Obuasi mining operations and the VRA may not agree to a satisfactory rate during future rounds of negotiations. AngloGold Ashanti procures electricity for Iduapriem from the Electricity Company of Ghana (ECG) which is supplied by the VRA.
Ghana has a major power generation deficit that has resulted in significant load shedding across the country. For example, the company experienced extended power interruptions in Ghana in the first quarter of 2014, which limited access to higher grade areas. It also experienced frequent load shedding at Iduapriem in 2015, at times experiencing multiple outages in a single day. During periods of below average inflows from the Volta reservoir, electricity supplies from the Akosombo Dam, the VRA’s primary generation source, may be curtailed as occurred in 1998, 2003, 2006, 2007 and 2007.2016. During periods of limited electricity availability, the grid is subject to disturbances and voltage fluctuations which can damage equipment. Recent disruptionsDisruptions in the natural gas supply from Nigeria in March 2015, via the West Africa Gas Pipeline, hashave led to some reduction in thermal generation capacity and the use of more expensive light crude oil, which is putting upward pressure on power tariffs. In the past, the VRA has obtained power from neighbouring Côte d’Ivoire, which has intermittently experienced political instability and civil unrest. AngloGold Ashanti negotiates rates directly with the VRA and the VRA may not agree to a satisfactory rate during future rounds of negotiations.
In Brazil, severe water shortages from low rainfall have been experiencedatwo-year drought in 2014 and 2015 and are expected to adversely affectaffected hydro-electrical power generation. Similar water shortages in the future could have an adverse impact on AngloGold Ashanti’s operations in Brazil.
The company’s mining operations in Guinea, Tanzania and Mali are dependent on power supplied by outside contractors and supplies of fuel are delivered by road. Power supplies have been disrupted in the past, resulting in production losses due to equipment failure.
Increased energy prices could negatively impact operating costs and cash flow of AngloGold Ashanti’s operations.
18
Global economic conditions could adversely affect the profitability of operations.
AngloGold Ashanti’s operations and performance depend significantly on worldwide economic conditions. Despite signs of economic recovery in certain geographic markets, global financial markets have experienced considerable volatility from uncertainty surrounding the level and sustainability of the sovereign debt of various countries. Concerns remain regarding the sustainability of the European Monetary Union and its common currency, the Euro, in their current form, as well asparticularly following the vote in favour of the United Kingdom’s exit from the European Union in June 2016 and in light of elections to be held in several European countries in 2017. Concerns also exist regarding the negative impacts of the downgrade of the sovereign credit rating of the Republic of South Africa in 2012, 2013, 2014 and 2014. 2015. During 2016, rating agencies warned that weak South African economic growth, government bailouts of state-owned companies and an unfavourable political environment could lead to a downgrade of the sovereign credit rating of the Republic of South Africa below investment grade in 2017.
These conditions and other disruptions to international credit markets and financial systems caused a loss of investor confidence and resulted in widening credit spreads, a lack of price transparency, increased credit losses and tighter credit conditions. Although aggressive measures taken by governments, the private sector and central banks have recently corresponded with signs ofresulted in a modest economic recovery since 2012, any such recovery may remain limited in geographic scope. A significant risk also remains that this recovery could be slow or that the global economy could quickly fall back into an even deeper and longer lasting recession or even a depression. Recently,In 2014 and 2015, the credit ratings of some of the largest South African banks were downgraded by a major credit rating agency.agencies. Any significant weakening of the South African banking system could have a negative effect on the overall South African economy.
Global economic turmoil, or the expectation that economic turmoil could worsen, could havefollow-on effects on AngloGold Ashanti’s business that include inflationary cost pressures, interest rate fluctuations and commodity market fluctuations. Other effects that could negatively affect AngloGold Ashanti’s financial results and results of operations include, for example:
the insolvency of key suppliers or contractors, which could result in contractual breaches and a supply chain breakdown;
the insolvency of one or more joint venture partners, which could result in contractual breaches and disruptions at the operations of the company’s joint ventures;
changes in other income and expense, which could vary materially from expectations, depending on gains or losses realised on the sale or exchange of financial instruments and impairment charges that may be incurred with respect to investments;
the inability of AngloGold Ashanti’s defined benefit pension fund may notto achieve expected returns on its investments, which could require the company to make substantial cash payments to fund any resulting deficits;
a reduction in the availability of credit, which may make it more difficult for the company to obtain financing for its operations and capital expenditures or make that financing more costly;
exposure to the liquidity and insolvency risks of the company’s lenders and customers; and
impairments.
In addition to the potentially adverse impact on the profitability of the company’s operations, any deterioration in or increased uncertainty regarding global economic conditions may increase volatility or negatively impact the market value of itsAngloGold Ashanti’s securities.
Inflation may have a material adverse effect on results of operations.
Many of AngloGold Ashanti’s operations are located in countries that have experienced high rates of inflation during certain periods. It is possible that significantly higher future inflation in the countries in which the company operates may result in an increase in operational costs in local currencies (without a concurrent devaluation of the local currency of operations against the dollar or an increase in the dollar price of gold). This could have a material adverse effect on the company’s results of operations and financial condition. Significantly higher and sustained inflation, with a consequent increase in operational costs, could result in the rationalisation (including closure) of higher cost mines or projects.
Of particular concern is the inflation rate in Argentina which increased from an average of 10 percent in 2012 to 40.5 percent in 2016. Using IMF and National Wholesale Price Index data, AngloGold Ashanti has determined that Argentina was not highly inflationary for the year ended 31 December 2016. If inflation reaches highly inflationary levels, social unrest and union activity may increase in Argentina, and this may have an adverse effect on AngloGold Ashanti’s operational costs and results of operation.
Mining companies face many risks related to the development of mining projects that may adversely affect the company’s results of operations and profitability.
Like other mining companies,Development of AngloGold Ashanti’s profitability depends partly on the actual costs of developing and operating its mines, which may differ significantly from estimates determined at the time the relevant project was approved following completion of its feasibility study. Development of the company’s mining projects may also be subject to unexpected problems and delays that could increase the development and operating costs of the relevant project. In addition, a decrease in budgets relating to current or medium-term exploration and development could increase its development and operating costs in thelong-term.
AngloGold Ashanti’s decision to develop a mineral property is typically based on the results of a feasibility study. Feasibility studies estimate the expected or anticipated economic returns from the project. These estimates are based on assumptions regarding:
future prices of gold, uranium, silver and other metals;
future currency exchange rates;
tonnage, grades and metallurgical characteristics of ore to be mined and processed;
19
anticipated recovery rates of gold, uranium, silver and other metals extracted from the ore;
anticipated capital expenditure and cash operating costs; and
required return on investment.
Actual cash operating costs, production and economic returns may differ significantly from those anticipated by such studies and estimates. Operating costs and capital expenditures are to a significant extent driven by the cost of commodity inputs consumed in mining, including fuel, chemical reagents, explosives, tyres and steel, and also by credits from by-products, such as silver and uranium. They could also fluctuate considerably as a result of changes in the prices of mining equipment used in the construction and operation of mining projects.
There are a number of uncertainties inherent in the development and construction of a new mine or the extension of an existing mine. In addition to those discussed above, theseThese uncertainties include the:
timing and cost of construction of mining and processing facilities, which can be considerable;
availability and cost of mining and processing equipment;
availability and cost of skilled labour, power, water and transportation;
availability and cost of appropriate smelting and refining arrangements;
applicable requirements under national and municipal laws and time needed to obtain the necessary environmental and other governmental permits; and
availability of funds to finance construction, development and developmentenvironmental rehabilitation activities.
The remote location of many mining properties, permitting requirements and/or delays, third-party legal challenges to individual mining projects and broader social or political opposition to mining may increase the cost, timing and complexity of mine development and construction. New mining operations could experience unexpected problems and delays during the development, construction, commissioning and commencement of production.
For example, AngloGold Ashanti may prove unable to successfully develop the La Colosa and Gramalote projects and the Nuevo Chaquiro deposit that is part of the Quebradona project in Colombia as well as other potential exploration sites due to difficulties that could arise in relation to, for example, social and community opposition, litigation and governmental regulatory or administrative proceedings, the classification of land covered by mining titles as environmentally-protected areas, ore body grades, definition of adequate reservesOre Reserves and resources,Mineral Resources and the time taken to prove project feasibility that could result in the expiry of permits. For example, on 11 March 2013, Cortolima, a regionalSee “—Mining companies are subject to extensive environmental authority in Colombia, issued an injunction against AngloGold Ashanti’s Colombian subsidiary, AngloGold Ashanti Colombia S.A. (“AGAC”), alleging that the subsidiary was operating without proper permitslaws and was engaging in activity that was harmful to the environment. Furthermore, at around the same period in time, access to an AngloGold Ashanti drilling site was blockaded by residents of a nearby community. AGAC’s subsequent request to have the injunction annulled was denied by the Director of Cortolima on 27 May 2013,regulations” and as a result, the injunction remains in place. While the injunction remains in place, AGAC is unable to engage in certain activities related to the La Colosa project. In July 2013, local residents of a nearby community, as well as local and regional government, voted in a non-binding referendum to prevent certain mining activities in the Piedras municipality. Local authorities have attempted to introduce regulatory measures seeking to implement such preventative measures and AGAC has initiated legal proceedings challenging such measures. As a result, protracted litigation may ensue, which could adversely affect the company’s ability to conduct any mining or related activities in that area. Refer “Item 8A: Legal Proceedings – Colombia”.
Accordingly, AngloGold Ashanti’s future development activities may not result in the expansion or replacement of current production, or one or more new production sites or facilities may be less profitable than anticipated or may beloss-making. The company’s operating results and financial condition are directly related to the success of its project developments. A failure in the company’s ability to develop and operate mining projects in accordance with, or in excess of, expectations could negatively impact its results of operations, as well as its financial condition and prospects.
Mining companies face uncertainty and risks in exploration, feasibility studies and other project evaluation activities.
AngloGold Ashanti must continually replace Ore ReservesReserve depleted by mining and production to maintain or increase production levels in the long term. This is undertaken by exploration activities that are speculative in nature. The ability of the company to sustain or increase its present levels of gold production depends in part on the success of its projects and it may be unable to sustain or increase such levels.
Feasibility studies and other project evaluation activities necessary to determine the current or future viability of a mining operation are often unproductive. Such activities often require substantial expenditure on exploration drilling to establish the presence, extent and grade (metal content) of mineralised material. AngloGold Ashanti undertakes feasibility studies to estimate the technical and economic viability of mining projects and to determine appropriate mining methods and metallurgical recovery processes. These activities are undertaken to estimate the Ore Reserve.
20
Once mineralisation is discovered, it may take several years to determine whether an adequate Ore Reserve exists, during which time the economic feasibility of the project may change due to fluctuations in factors that affect both revenue and costs, including:
future prices of metals and other commodities;
future foreign currency exchange rates;
the required return on investment as based on the cost and availability of capital; and
applicable regulatory requirements, including those relating to environmental or health and safety matters.
Feasibility studies also include activities to estimate the anticipated:
tonnages, grades and metallurgical characteristics of the ore to be mined and processed;
recovery rates of gold, uranium and other metals from the ore; and
capital expenditure and cash operating costs.
These estimates depend on assumptions made on available data. Ore Reserve estimates are not precise calculations and depend on the interpretation of limited information on the location, shape and continuity of the mineral occurrence and on available sampling results. Further exploration and feasibility studies can result in new data becoming available that may change previous Ore Reserve estimates and impact the technical and economic viability of production from the project. Changes in the forecast prices of commodities, exchange rates, production costs or recovery rates may change the economic status of reservesOre Reserves resulting in revisions to previous Ore Reserve estimates. These revisions could impact depreciation and amortisation rates, asset carrying amounts and/or provisions for closure, restoration and environmental rehabilitation costs.
AngloGold Ashanti undertakes annual revisions to its Ore Reserve estimates based upon asset sales and acquisitions, actual exploration and production results, depletion, new information on geology, model revisions and fluctuations in production, forecasts of commodity prices, economic assumptions and operating and other costs. These factors may result in reductions in Ore Reserve estimates, which could adversely affectlife-of-mine plans and consequently the total value of the company’s mining asset base. Ore Reserve restatements could negatively affect the company’s results of operations, as well as its financial condition and prospects.
The increased overall demand for gold and other commodities, combined withDue to a declining rate of discovery of new gold Ore Reserve in recent years, has resulted in the accelerated depletion of the existing Ore Reserve across the global gold sector. AngloGold Ashanti therefore faces intense competition for
the acquisition of attractive mining properties. From time to time, the company evaluates the acquisition of an Ore Reserve, development properties or operating mines, either as stand-alone assets or as part of existing companies. AngloGold Ashanti’s decision to acquire these properties has been based on a variety of factors, including historical operating results, estimates and assumptions regarding the extent of the Ore Reserve, cash and other operating costs, gold prices, projected economic returns and evaluations of existing or potential liabilities associated with the relevant property and its operations and how these factors may change in the future. Other than historical operating results, these factors are uncertain and could have an impact on revenue, cash and other operating costs, as well as the process used to estimate the Ore Reserve.
As a result of these uncertainties and declining grades, the company’s exploration and acquisitions may not result in the expansion or replacement of current production or the maintenance of its existing Ore Reserve net of production or an increase in Ore Reserve. AngloGold Ashanti’s results of operations and financial condition are directly related to the success of its exploration and acquisition efforts and the ability to replace or increase the existing Ore Reserve as it is depleted. If the company is not able to maintain or increase its Ore Reserve, its results of operations as well as its financial condition and prospects could be adversely affected.
Mining companies face many risks relatedpotential disruptions to their operations, thatwhich may adversely impact cash flows and overall profitability.
Gold mining is susceptible to events that may adversely impact a mining company’s ability to produce gold and meet production and cost targets. These events include, but are not limited to:
environmental, as well as health and safety,accidents or incidents, including due to human error, during exploration, production or transportation resulting in injury, loss of life or damage to equipment;equipment or infrastructure;
groundair, land and surface water pollution;
social or community disputes or interventions;
security incidents;
surface or underground fires or explosions;
electrocution;
falls from heights and accidents relating to mobile machinery, including shaft conveyances and elevators, drilling blasting and mining operations;
21
labour force disputes and disruptions;
loss of information integrity or data;
activities of illegal or artisanal miners;
shortages in material and equipment;
mechanical failure or breakdowns and ageing infrastructure;
failure of unproven or evolving technologies;
energy and electrical power supply interruptions or rationing;
unusual or unexpected geological formations, ground conditions, including lack of mineable face length andore-pass blockages;
water ingress and flooding;
process water shortages;
metallurgical conditions and gold recovery;
unexpected decline of ore grade;
unanticipated increases in goldlock-up and inventory levels at heap-leach operations;
fall-of-ground accidents in underground operations;
cave-ins, sinkholes, subsidence, rock falls, rock bursts or landslides;
failure of mining pit slopes, heap-leach facilities, water or solution dams, waste stockpiles and tailings dam walls;
changes to legal and regulatory restrictions and changes to such restrictions;requirements;
safety-related stoppages;
gold bullion or concentrate theft;
corruption fraud and theft;fraud;
allegations of human rights abuses;
seismic activity; and
other natural phenomena, such as floods, droughts or weather conditions, potentially exacerbated by climate change.
Any of these events could, individually or in the aggregate, have a material adverse effect on the company’s results of operations and financial condition.
Seismic activity is of particular concern in underground mining operations, particularly in South Africa due to the extent and
extreme depth of mining, and also in Australia and Brazil due to the depth of mining and residual tectonic stresses. Despite modifications to mine layouts and support technology, as well as other technological improvements employed with a view to minimising the incidence and impact of seismic activity, seismic events have caused death and injury to employees and contractors as well as safety-related stoppages and seismic activity may do so again in the future, and have in the past, and may again result, in concomitant safety-related stoppages.future.
Seismic activity may also cause a loss of mining equipment, damage to or destruction of mineral properties or production facilities, monetary losses, environmental damagespollution and potential legal liabilities. As a result, these events may have a material adverse effect on AngloGold Ashanti’s results of operations and financial condition. For example, a seismic event at the Savuka section at TauTona in 2016 caused the closure of haulage which is not expected to be accessible before late-2017, if at all. Additionally, in 2015, seismicity in South Africa causedfall-of-ground incidents that led to fatalities, and operations were constrained at Mponeng in the West Wits while ade-risk plan was implemented to address seismicity issues. In August 2014, mining operations at the Great Noligwa and Moab Khotsong mines were suspended following a magnitude 5.3 earthquake. Operations at Mine Waste Solutions were also suspended andIn all cases, the Kopanang mine was taken offline for a limited time as a safety precaution. The company estimates that the earthquake resulted in lost output of approximately 30,000oz of gold. Also, in early 2011, mining of the Ventersdorp Contact Reef shaft pillar at Tau Tona was suspended following a significant seismic event. New equipment had to be purchased and the shutdownshutdowns contributed to the decline in the operational output of the mineapplicable mines as compared to the previous year.
In the past, floods have also disrupted the operations of some of the company’s mines. For example, unprecedented heavy rains in February and March 2011 in Australia flooded the Sunrise Dam Gold Mine and forced a temporary shutdown of operations. The flood event impacted underground production for approximately four months and open pit production for approximately six months. Despite the shutdown, full costs were incurred as the mining contractors worked on remedial activities to repair damage and rehabilitate flooded areas. The considerable remedial work required adversely impacted cash costs per ounce and the impact of the flood event and the pit wall failure together significantly reduced planned production at the plant.
Any seismic, flood or other similar events that occur in the future could have a material adverse effect on the company’s results of operations and financial condition.
Mining companies’ operations are vulnerable to infrastructure constraints.
Mining, processing, development and exploration activities depend on adequate infrastructure. Reliable rail, ports, roads, bridges, power sources, power transmission facilities and water supply are critical to the company’s business operations and affect capital and operating costs. These infrastructures and services are often provided by third parties whose operational activities are outside the control of the company.
Interferences in the maintenance or provision of infrastructure, including unusual weather phenomena, sabotage and social unrest could impede the company’s ability to deliver its products on time and adversely affect AngloGold Ashanti’s business, results of operations and financial condition.
22
Establishing infrastructure for the company’s development projects requires significant resources, identification of adequate sources of raw materials and supplies, and necessary cooperation from national and regional governments, none of which can be assured.
AngloGold Ashanti has operations or potential development projects in countries where government-provided infrastructure may be inadequate and regulatory regimes for access to infrastructure may be uncertain, which could adversely impact the efficient operation and expansion of its business. AngloGold Ashanti may not secure and maintain access to adequate infrastructure in the future, or it may not do so on reasonable terms.
Mining companies face strong competition.
The mining industry is competitive in all of its phases. AngloGold Ashanti competes with other mining companies and individuals for specialised equipment, components and supplies necessary for exploration and development, for mining claims and leases on exploration properties and for the acquisition of mining assets. These competitors may have greater financial resources, operational experience and technical capabilities than AngloGold Ashanti. Competition may increase AngloGold Ashanti’s cost of acquiring suitable claims, properties and assets.assets, which could have a material adverse effect on its financial condition.
Mining companies are subject to extensive health and safety laws and regulations.
AngloGold Ashanti’s gold mining operations are subject to extensive health and safety laws and regulations in every jurisdiction in which it operates. These laws and regulations are, along with international and industry standards, designed to protect and improve the safety and health of employees and require the company to undertake and fund extensive compliance measures.
From time to time, new or updated health and safety laws, regulations and standards are introduced and may be more stringent than those to which AngloGold Ashanti is currently subject. Should compliance with these laws, regulations and standards require a material increase in expenditureexpenditures or material changes or interruptions to operations or production, including as a result of any failure to comply with applicable regulations, the company’s results of operations and financial condition could be adversely affected. Furthermore, AngloGold Ashanti continues to implement its enhanced safety programme, which could result in additional costs for the company.
In some of the jurisdictions in which AngloGold Ashanti operates, the government enforces compulsory shutdowns of operations to enable investigations into the cause of accidents. Certain of the company’s operations have been temporarily suspended for safety reasons in the past. In South Africa,so-called “Section 54 safety stoppages” have become a significant issue as an enforcement mechanism used by the Department of Mineral Resources Mining Inspectorate whose inspectors routinely issue such notices. For example, in 2014, 572016, 115 notices were issued that had a material adverse impact on production at the company’s mines. Safety-relatedSection 54 safety stoppages resulted in the estimated direct loss of 72,900, 72,400, 32,80047,100, 78,887 and 47,10073,208 ounces of gold production from the South African region operations during 2011, 2012, 20132014, 2015 and 20142016 respectively.
AngloGold Ashanti’s reputation could be damaged by any significant governmental investigation or enforcement of health and safety laws, regulations or standards. Any of these factors could have a material adverse effect on the company’s results of operations and financial condition.
Mining companies are increasingly required to operate in a sustainable manner and to provide benefits to affected communities. Failure to comply with these requirements can result in legal suits, additional operational costs to address violations or liabilities, investor divestment and loss of “social licence to operate”, and could adversely impact mining companies’ financial condition.
As a result of public concern about the perceived ill effects of economic globalisation, businesses in general and large multinational mining corporations in particular face increasing public scrutiny of their activities.
These businesses are under pressure to demonstrate that whilst they seek a satisfactory return on investment for shareholders, human rights are respected and other social partners, including employees, host communities and more broadly the countries in which they operate, also benefit from their commercial activities. Such pressures tend to be particularly focused on companies whose activities are perceived to have, or have, a high impact on their social and physical environment. The enhanced usage and scale of social media and otherweb-based tools to publish, share and discuss user-generated content further increases the potential spread and force of public scrutiny. The potential consequences of these pressures and the adverse publicity in cases where companies are believed not to be creating sufficient social and economic benefit may result in additional operating costs to address actual or perceived shortcomings, reputational damage, active community opposition, allegations of human rights abuses, legal suits and investor withdrawal.
23
Existing and proposed mining operations are often located at or near existing towns and villages, natural water courses and other infrastructure. As the impacts of dust generation, waste storage, water pollution or water shortage in particular, may be immediate and directly adverse to those communities, poor environmental management practices, or, in particular, adverse changes in the supply or quality of water can result in community protest, regulatory sanctions or ultimately in the withdrawal of community and government support for company operations. For example, opposition to mining activity in the Tolima province of Colombia, which hosts the La Colosa deposit, has centred on the perception that large-scale mining activity will have a detrimental impact on the region’s river systems. In the town of Cajamarca in the Tolima province, a popular consultation was held in which the town voted to ban new mining projects. The mayor of Cajamarca is expected to issue an administrative act which will reflect the result of the voting. AngloGold Ashanti is evaluating the consequences of the vote and the impact it may have on our ability to develop La Colosa. In the town of Piedras in the Tolima province, AngloGold Ashanti is contesting a referendum attempting to ban all mining activities in the area. See “Item 8A: Legal Proceedings”. Similar votes or referenda may be conducted in the future in these or other locations in Colombia where we have mining licenses. These votes and referenda or future votes or referenda could have an adverse impact on AngloGold Ashanti’s reputation, its ability to develop its mining concessions in Colombia, and its results of operations and financial condition.
Mining operations must be designed to minimise their impact on such communities and the environment, either by changing mining plans to avoid such impact, by modifying operations or by relocating the affected people to an agreed location. Responsive measures may also include the full restoration of livelihoods of those impacted. In addition, AngloGold Ashanti is obliged to comply with the terms and conditions of all the mining rights it holds. In this regard the Social and Labour plan provisions of its mining rights in South Africa must make provision for local economic development (“LED”)(LED) programmes. The LED programmes must take into account the key economic activities of the area in which AngloGold Ashanti operates its mines, the impact its mines will have on the local and labour-sending communities, various infrastructure and poverty eradication projects its mines may be supporting in connection with integrated development plans in the areas its mines operate and also must provide for measures that assist in addressing housing and living conditions of its employees.
In addition, as AngloGold Ashanti has a long history of mining operations in certain regions, issues may arise regarding historical, as well as potential future, environmental or health impacts in those areas. For example, certain parties, includingnon-governmental organisations, community groups and institutional investors, have raised concerns and, in the case of some individuals in Obuasi, threatened or commenced litigation, relating to air pollution or surface and groundwater quality, amongst other issues, in the area surrounding the company’s Obuasi and Iduapriem mines in Ghana, including potential impacts to local rivers and wells used for water from heavy metals, arsenic and cyanide as well as sediment and mine rock waste.
Disputes with surrounding communities may also affect mining operations, particularly where they result in restrictions of access to supplies and to mining operations. The miners’ access to land may be subject to the rights or asserted rights of various community stakeholders, including indigenous people. Access to land and land use is of critical importance to the company for exploration and mining, as well as for ancillary infrastructure. In some cases, AngloGold Ashanti has had difficulty gaining access to new land because of perceived poor community compensation practices. For example, compensation remains a significant area of concern in Siguiri in Guinea. In 2011, a violent community protest interrupted operations for three days, which contributed to the operation’s decline in production as compared to 2010.2010, and protests demanding employment by the communities and youth occurred again in 2016. Delays in projects attributable to a lack of community support can translate directly into a decrease in the value of a project or into an inability to bring the project to production.
The cost of measures and other issues relating to the sustainable development of mining operations could place significant demands on personnel resources, could increase capital and operating costs and could have an adverse impact on AngloGold Ashanti’s reputation, results of operations and financial condition.
Mining companies are subject to extensive environmental laws and regulations.
Mining companiesAngloGold Ashanti’s operations are subject to extensive environmental laws and regulations in the various jurisdictions in which they operate,it operates, in addition to international standards. These regulations and standards establish limits and conditions on a miner’sthe company’s ability to conduct its operations and govern, amongst other things, extraction, use and conservation of water resources; air emissions (including dust control); water treatment and discharge; regulatory and community reporting;clean-up of contamination; land use and conservation of protected areas; community health; and the generation, transportation, storage and disposal of solid and hazardous wastes, such as reagents, radioactive materials and mine tailings.
The cost of compliance with environmental laws and regulations is expected to continue to be significant to AngloGold Ashanti. AngloGold Ashanti could incur fines, penalties and other sanctions,clean-up costs and third-party claims for personal injury or property damage, suffer reputational damage, or be required to install costly pollution control equipment or to modify or suspend operations, as a result of actual or alleged violations of environmental laws and regulations or the terms of AngloGold Ashanti’s permits. For example, the Ghana Environmental Protection Agency (“Ghana EPA”)(Ghana EPA) permit for AngloGold Ashanti’s operations at Obuasi expired on 31 March 2014. AngloGold Ashanti filed its application for permit renewal in September 2013, 6six months prior to the expiry date, as required by law, by submitting an Environment Management Plan (EMP), but the Ghana EPA did not issue a new permit before the expiry date, citing uncertainties about the future of the Obuasi operation. AngloGold Ashanti has been in communication with the Ghana EPA regarding this issue. Concurrently, asAs a result of the complex challenges faced by the Obuasi mine, the company has subsequently adopted a new approach to securing the long term future of the mine. As part of this effort, on 18 July 2014 it submitted an Amendment to Programme of Mining Operations (APMO), which details
24
provides technical, environmental, financial and social details around the transition of its Obuasi operation, to the Government of Ghana and key regulators, that was approved subject to certain conditions. An amended EMP to supersede the one submitted in September 2013 was submitted at the same time to the Ghana EPA but no response has as yet been received. The company can give no assurance that the EMP will be approved in the formsform submitted or at all.
In addition, if AngloGold Ashanti fails to demonstrate or realise its business case for the redevelopment of the Obuasi operation, including because the company is unable to finalise a joint venture or other agreement with a partner to make the substantial investments necessary for redevelopment, to obtain the required consents, approvals or agreements for continued operation or to continue stabilising the security conditions following the withdrawal of state security protection in early 2016, AngloGold Ashanti may be forced to withdraw from the Obuasi mine on a long-term or permanent basis. See “— Illegal and artisanal mining occurs on AngloGold Ashanti’s properties, which can disrupt the company’s business and expose the company to liability.” Closure of the mine could trigger or accelerate obligations, including the conduct of environmental rehabilitation activities and/or to address historical impacts on environmental quality in the area surrounding the mine. Costs incurred by the company in excess of AngloGold Ashanti’s existing provisions for such matters could have a material adverse impact on AngloGold Ashanti’s results of operations and financial condition.
In addition, unknown environmental hazards may exist on the company’s properties which may have been caused by previous owners or operators. An incident at AngloGold Ashanti’s operations could lead to the imposition of legal obligations, to remediateincluding the remediation of environmental contamination and claims for property damage and personal injury from adjacent communities and other consequences.communities. Incidents at AngloGold Ashanti’s operations, andor other mining companies’ operations, could result in the tightening of regulatory requirements and restrictions that are applicable to AngloGold Ashanti’s mining operations.
For example, in 2010, AngloGold Ashanti’s Obuasi mine in Ghana suspendedbrief gold processing operations for five days to implement a revised water management strategy aimed at reducing contaminants contained in its discharge. Brief stoppages after environmental incidents, such as pipeline failures or deficiencies in water management systems, have occurred more recently at that mine.AngloGold Ashanti’s Obuasi mine in Ghana. Furthermore, in 2010, following a temporary suspension of operations at the Iduapriem mine, the company, with the approval of the Ghana Environmental Protection Agency,EPA, constructed an interim tailings storage facility for tailings deposition for a year whilst a new tailings storage facility was being constructed.
Failure to comply with applicable environmental laws and regulations may also result in the suspension or revocation of operating permits. AngloGold Ashanti’s ability to obtain and maintain permits and to successfully operate in particular communities may be adversely impacted by real or perceived effects on the environment or human health and safety associated with AngloGold Ashanti’s or other mining companies’ activities.
For example, in Colombia, various plaintiffs, including the government and various associations that represent local communities, brought legal proceedings against AngloGold Ashanti Colombia S.A. (“AGAC”)(AGAC) alleging that AGAC violated applicable environmental laws in connection with the La Colosa project. IfIn one such proceeding, AGAC filed an action against the plaintiffs were to prevail,Colombian Department of the Environment, Housing and Territorial Development (DoE) after the DoE issued a fine of $70,000 against the company. Following a series of appeals, in January 2017 the appellate court reinstated the fine against the company. Although the amount of the fine is not significant, the finding that the company breached environmental laws could be used as the basis for legal action by the government that could prohibit AGAC from doing business with the Colombian government for a period of five years. As a result, AGAC’s three core concession contracts relating to the La Colosa project may be cancelled. AGAC would be required to abandon the La Colosa project and all other existing mining concession contracts and pending proposals for new mining concession contracts of AGAC, though not those of other companies of the AngloGold Ashanti group operating in Colombia. In addition, AGAC wouldis currently evaluating its options with respect to this matter. Separately, on 10 October 2016, Tolima’s Administrative Court ordered that a technical study be banned from doing business withprepared by April 2017 to determine whether the Colombian government forLa Colosa project presents a period of five years.“threat” to the environment during its exploration phase. If such threat is determined to exist, certain activities at La Colosa may be suspended. See “Item 8A: Legal Proceedings”.
Environmental laws and regulations are continually changing and are generally becoming more stringent. Changes to AngloGold Ashanti’s environmental compliance obligations or operating practicesrequirements could adversely affect the company’s rate of production and revenue. Variations in laws and regulations, assumptions made to estimate liabilities, standards or operating procedures, more stringent emission or pollution thresholds or controls, or the occurrence of unanticipated conditions, may require operations to be suspended or permanently closed, and could increase AngloGold Ashanti’s expenses and provisions. These expenses and provisions could adversely affect the company’s results of operations and financial condition.
For example, the use of sodium cyanidehazardous materials in metallurgical processing isremains under increasing environmental scrutiny and is prohibited in certain jurisdictions.constant scrutiny. As there are few, if any, effective substitutes in extracting gold from the ore, any ban or material restrictions on the use of sodium cyanidematerials in mining operations in the jurisdictions where AngloGold Ashanti conducts its operations could adversely affect the company’s results of operations and financial condition. In addition, leaks or discharges of sodium cyanide or otherof- hazardous materials could result in liabilities forclean-up or personal injury that may not be covered by insurance.
AngloGold Ashanti’s operations are heavily dependent upon access to substantial volumes of water for use in the mining and extractive processes and typically are subject towater-use permits that govern usage and require, amongst other things, that mining operations maintain certain water quality upon discharge. Water quality and usage are areas of concern globally, such as with respect to the company’s mining operations in Ghana and South Africa and its exploration projects in Colombia, where there is significant potential environmental and social impact and a high level of stakeholder scrutiny. Any failure by the company to secure access to suitable water supplies, or achieve and maintain compliance with applicable requirements of the permits or licenses, could result in curtailment or halting of production at the affected operation. Incidents of water pollution or shortage can, in certain cases, lead to community protest and ultimately to the withdrawal of community and government support for AngloGold Ashanti’s operations. A failure by the company to comply with water contamination rehabilitation directives may result in further, more stringent, directives being issued against the company, which may, in some cases, result in a temporary or partial shutdown of some of the company’s operations. Water scarcity has been identified as a significant risk at AngloGold Ashanti’s U.S. operation in particular. Production at the Cripple Creek & Victor Gold Mining Company’s Cresson mine was adversely affected by a severe drought from 2010 through 2013, when the lack of water reduced percolation through the heap-leach pad, which curtailed production and productivity.
25
Mining and mineral processing operations generate waste rock and tailings. The impact of dust generation, breach, leak, or failure of a waste rock or tailings storage facility, can be significant. An incident at AngloGold Ashanti’s operations could lead to, amongst others, obligations to remediate environmental contamination and claims for property damage and personal injury from adjacent communities. Incidents at other mining companies’ operations could result in governments tightening regulatory requirements and restricting mining activities.
Mining companies are required by law to close their operations at the end of the mine life and rehabilitate the impacted areas. Estimates of the total ultimate closure, reclamation and rehabilitation costs for gold mining operations are significant and based principally onlife-of-mine profiles, changing inflation and discount rate assumptions, changing infrastructure and facilities design and current legal and regulatory requirements that may change materially. Environmental liabilities are accrued when they become known, are probable and can be reasonably estimated. Increasingly, regulators are seeking security in the form of cash collateral or bank guarantees in respect of environmental obligations. For example, in South Africa, regulations that came into effect in 2014 require mining companies to make financial provisions for rehabilitation for at least 10 years. The Department of Environmental Affairs (DEA) postponed the compliance deadline for the National Environmental Management Act (NEMA) Financial Provisioning Regulations to February 2019 and acknowledged challenges identified by the industry in collaboration with the Chamber of Mines. In the latest drafts, key issues such as the future of existing rehabilitation trust funds have been amended. The costs required to comply with these obligations which couldand any similar ones enacted in other jurisdictions may have an adverse impact on AngloGold Ashanti’sthe company’s financial condition.
AngloGold Ashanti’s discounted environmental rehabilitation liability wasprovisions for decommissioning and for restoration (excluding joint ventures) totalled $851 million as at 31 Decemberin 2014, compared with $728$683 million as at 31 December 2013. The changes were a consequencein 2015 (following the sale of a number of factors, most notably a decreaseCC&V) and $705 million in the group discount rate used in the calculation of the obligation and changes in the timing of the future cash outflows relating to the obligation. The group discount rate decreased as a result of adjustments to both country, e.g., South Africa, and company credit ratings.2016. Costs associated with rehabilitating land disturbed by mining processes and addressing environmental, health and community issues are estimated and financial provision made based upon current available information. Estimates notably relate to discount rates, which may vary due to changes in global economic assumptions, and mine plans, which may change in line with variations in cash flows, designs of tailings storage facilities and methodologies used to compute liabilities (including as a result of a request from environmental regulatory authorities). Estimates may, however, be insufficient and further costs may be identified at any stage that may exceed the provisions that AngloGold Ashanti has made. Any underestimated or unidentified rehabilitation costs would reduce earnings and could materially and adversely affect the company’s asset values, earnings and cash flows. Further, sudden changes in a life of mine plan or the accelerated closure of a mine may give rise to the recognition of liabilities that are not anticipated.
Compliance with emerging climate change regulations could result in significant costs and climate change may present physical risks to a mining company’s operations.
Greenhouse gases (“GHGs”)(GHGs) are emitted directly by AngloGold Ashanti’s operations, as well as by external utilities from which AngloGold Ashanti purchases electricity. Currently, aA number of international and national measures to address or limit GHG emissions, including the 2007 Bali Action Plan and the Durban Platform,2009 Copenhagen Accord, which included anon-binding commitment to reduce GHG emissions, are in various phases of discussion or implementation in the countries in which the company operates. In particular,As a result of commitments made at the UN climate conference in Durban, Platform commits all partiesSouth Africa in December 2011, certain members of the international community negotiated a treaty at the December 2015 Conference of Parties in Paris. The Paris Agreement, which will require developed countries to set targets for emissions reductions, came into force on 4 November 2016. Additional measures addressing GHG emissions may be implemented at the conference to develop a global mitigation regime which could take effect in 2020, with the specific terms of that legally binding accord, including individual targets, to be finalised by 2015.national or international levels. These, or future, measures could require AngloGold Ashanti to reduce its direct GHG emissions or energy use or to incur significant costs for GHG emissions permits or taxes or have these costs or taxes passed on by electricity utilities which supply the company’s operations. AngloGold Ashanti also could incur significant costs associated with capital equipment, GHG monitoring and reporting and other obligations to comply with applicable requirements.
In South Africa, a draft Carbon Tax Bill was published in November 2015. However, in February 2012, the South African Minister of Finance announced the intention to introduce2016, following a carbon tax in 2015, whichconsultation process, it was followed by the publication of a carbon tax policy paper in 2013. However, the Minister of Finance later announced that the draft bill would be revised and, in the February 2017 budget speech, the government suggested that the implementation of the carbon tax and carbon reporting requirements would not be introduceddelayed until 2016.2018. Other countries, including Brazil, and the United States, have passed or are considering GHG trading or tax schemes and/or other regulation of GHG emissions, although the precise impact on AngloGold Ashanti’s operations cannot yet be determined.
In addition, AngloGold Ashanti’s operations could be exposed to a number of physical risks from climate change, such as changes in rainfall rates, rising sea levels, reduced water availability, higher temperatures and extreme weather events. Events or conditions such as flooding or inadequate water supplies could disrupt mining and transport operations, mineral processing and rehabilitation efforts, create resource shortages or damage the company’s property or equipment and increase health and safety risks on site. Such events or conditions could have other adverse effects on the company’s workforce and on the communities around its mines, such as an increased risk of food insecurity, water scarcity and prevalence of disease.disease, all of which could have a material adverse effect on the company’s results of operations and financial condition.
Compliance with “conflict minerals” and “responsible gold” legislation and standards could result in significant costs.
More stringentStringent standards relating to “conflict minerals” and “responsible” gold that include the:the U.S. Dodd-Frank Act, European proposal for self-certification for importers of gold, Organisation for Economic Cooperation and Development Due Diligence Guidelines for Responsible Supply Chains of Minerals from Conflict-Affected and High-Risk Areas, World Gold Council Conflict Free Gold Standard and London Bullion Market Association Responsible Gold Guidance have been introduced.
26
Any such legislation and standards may result in significant costs to ensure and demonstrate compliance (particularly where standards change rapidly or lack certainty due to court challenges), and difficulties inmay complicate the sale of gold emanating from certain areas. The complexities of the gold supply chain, especially as they relate to “scrap” or recycled gold, and the fragmented and often unregulated supply of artisanal and small-scale mined gold are such that there may be significant uncertainties at each stage in the chain as to the provenance of the gold. As a result of the uncertainties in the process, the costs of due diligence and audit, or the reputational risks of defining their product or a constituent part as containing a “conflict mineral” wouldmay be too burdensome for the company’s customers. Accordingly, manufacturers may decide to switch supply sources or to substitute gold with other minerals not covered by the initiatives. This could have a material negative impact on the gold industry, including on AngloGold Ashanti’s financial results.
Mining operations and projects are vulnerable to supply chain disruption with the result that operations and development projects could be adversely affected by shortages of, as well as the lead times to deliver, strategic spares, critical consumables, mining equipment or metallurgical plant.
AngloGold Ashanti’s operations and development projects could be adversely affected by both shortages and long lead times to deliver strategic spares, critical consumables, mining equipment and metallurgical plant, as well as transportation delays. Import restrictions, such as those introducedimposed by the ArgentineArgentinian government sincefrom 2011 to 2015, can also delay the delivery of parts and equipment. In the past, the company and other gold mining companies experienced shortages in critical consumables, particularly as production capacity in the global mining industry expanded in response to increased demand for commodities. AngloGold Ashanti has also experienced increased delivery times for these items. Shortages have resulted in unanticipated price increases and production delays and shortfalls, resulting in a rise in both operating costs and in the capital expenditure necessary to maintain and develop mining operations.
Individually, AngloGold Ashanti and other gold mining companies have limited influence over manufacturers and suppliers of these items. In certain cases there are a limited number of suppliers for certain strategic spares, critical consumables, mining equipment or metallurgical plant who command superior bargaining power relative to the company. The company could at times face limited supply or increased lead time in the delivery of such items. For example, during 2012, supply of caustic soda was delayed in the Continental Africa Region. In addition, the unreliability of oxygen and lime supply similarly affected production at the Vaal River and West Wits surface operations in South Africa throughout 2011 and poor availability of drill rigs, heavy machinery and fleet equipment hampered underground drilling and overall operational performance at the Serra Grande mine in Brazil, also in 2011.
The company’s procurement policy is to source mining and processing equipment and consumables from suppliers that meet its corporate values and ethical standards although risk remainsbut risks remain around the management of ethical supply chains. In certain locations, where a limited number of suppliers meet these standards, additional strain is placed on the supply chain, thereby increasing the cost of supply and delivery times.
Furthermore, supply chains and rates can be impacted by natural disasters, such as earthquakes, extreme weather patterns and climate change, as well as other phenomena that include unrest, strikes, theft and fires. For example, a three-week transport strike in 2012 delayed the supply of consumables in South Africa. Although potential supply chain disruption in Mali, as a result of the coup d’état and the proliferation of armed combat in 2012 and 2013, has beenwere avoided to date by well managed consumable stock holding, any return toongoing instability orand armed conflict in the country, even following the peace accord struck in 2015, could present material supply chain difficulties. Moreover, although potential gold doré export disruptions at Geita, which were the result of an attempted gold heist, and in Mali, following the closure of Bamako International Airport, were minimised with the introduction of alternative transportation arrangements, such alternatives may not be available upon the occurrence of similar or more severe situations in the future. In February 2013, a fire destroyed the heavy mining equipment stock of spares and components at the Geita gold mine. If AngloGold Ashanti experiences shortages, or increased lead times in the delivery of strategic spares, critical consumables, mining equipment or processing plant, the company might have to suspend some of its operations and its results of operations and financial condition could be adversely impacted.
The Siguiri mine has beenwas impacted as a result of the Ebola virus outbreak sinceof 2014 in Western Africa, where certain crisis management measures were implemented. Whilst no employees have been infectedSee “— AngloGold Ashanti’s Ore Reserve, deposits and mining operations have continued despiteare located in countries that face instability and security risks that may adversely affect both the outbreak, five peopleterms of its mining concessions, as well as its ability to conduct operations in the village at Siguiri have been infected since the outbreak started. These cases were detected by authorities and contained through a quarantine programme. In addition to an extensive education campaign, the mine conducted daily screenings at its entrances, including as daily questionnaire to check the status of staff and family members. Nevertheless, crisis management measures may be insufficient to contain current or future outbreaks. Furthermore,certain countries.” AngloGold Ashanti cannot guarantee that its crisis management measures will be adequate, that the supply chain and/ orand operations will not be adversely affected by thea future Ebola or other epidemic outbreak and that there will be noknock-on effects such as severe food shortages and social impact. ExportEpidemic-related export restrictions could similarly adversely impact the company’s financial condition and results of operations.
27
Concerns about the integrity or reliability of the London Bullion Market Association (LBMA) Gold Fix, even if eventually shown to be without merit,Price Benchmark could adversely affect investor interest in gold and confidence in the gold marketmarket.
AngloGold Ashanti reliesHistorically, the gold market relied on a liquid market for gold in whichprices and trades are made relative to a benchmark known as the London Gold Fix (the “Fix”)(Fix), set by a group of five fixing banks that match buymatched buyers and sell orders. Following a series of allegations regarding the possible manipulation of the Fix by fixing banks, U.S., German and United Kingdom regulators are reviewingundertook a review of the fixing process. While the U.S. Commodity Futures Trading Commission and the German BaFin dismissed allegations of manipulation in 2013 and 2015, respectively, in 2014 Deutsche Bank withdrew from the fixing panels and the UK Financial Conduct Authority (FCA) fined one of the fixing banks. The FCA identified systems and control failures and conflicts of interest in relation to gold fixing over the nine years to 2013 and one instance of gold price manipulation in 2012. Separately, several lawsuits have been filed against fixing banks alleging that they have colluded to manipulate the gold benchmark price. price, including class actions instituted in the United States in 2014 and Canada in 2015. Some of these class actions were settled in the United States in 2016.
In 2015, the London Gold Fix was replaced by the LBMA Gold Price Benchmark, which is run and managed by the Intercontinental Exchange (ICE). ICE is completely independent of the gold market as it does not conduct any trading of gold.
Whilst AngloGold Ashanti hashad no role in the operation of the Fix during the period under review and has no responsibility for the conduct of the market-makersmarket makers in the gold market, the gold market could still be affected if the integrity of the gold benchmark were to beGold Price Benchmark is undermined it could affect the gold market,as a result of ongoing lawsuits, resulting in reduced demand for the company’s gold, greater volatility in gold prices and less liquidity in the gold market. Furthermore, in 2015 AngloGold Ashanti joined the new oversight committee for the LBMA Gold Price Benchmark which is now regulated by the FCA. If further allegations are made against the Gold Price Benchmark in the future, AngloGold could be implicated more directly, which may have an adverse effect on its reputation.
Diversity in interpretation and application of accounting literature in the mining industry may impact reported financial results.
The mining industry has limited industry-specific accounting literature. As a result, there is diverse interpretation and application of accounting literature on mining-specific issues. AngloGold Ashanti, for example, capitalises drilling and costs related to defining and delineating a residual mineral deposit that has not been classified as a “Proven and Probable Ore Reserve” at a development project or production stage mine. Some companies may, however, expense such costs.
As and when this diverse interpretation and application is addressed, the company’s reported results could be adversely impacted should the adopted interpretation differ from the position it currently follows.
Failure to comply with laws, regulations, standards and contractual obligations, whether following a breach or breaches in governance processes or fraud, bribery and corruption may lead to regulatory penalties, loss of licences or permits, negative effects on AngloGold Ashanti’s reported financial results, and adversely affect its reputation.
AngloGold Ashanti’s operations must comply with the United States Foreign Corrupt Practices Act and similar anti-corruption and anti-bribery laws of the jurisdictions in which AngloGold Ashanti operates. There has been a substantial increase in the global enforcement of these laws and recently, an increased focus on the actions of mining companies. Although AngloGold Ashanti has a compliance programprogramme in place designed to reduce the likelihood of violations of such laws, any violation could result in significant criminal or civil sanctions. Conversely, in certain circumstances, strict compliance with anti-bribery laws may conflict with certain local customs and practices. Since the company operates globally in multiple jurisdictions, including those with less developed political and regulatory environments, and within numerous and complex frameworks, its governance and compliance processes may not prevent potential breaches of law, accounting principles or other governance or customary practices.
AngloGold Ashanti’s Code of Business Principles and Ethics and Policy on Anti-Bribery and Anti-Corruption, amongst other policies, standards and guidance, and training thereon may not prevent instances of unethical or unlawful behaviour, including bribery or corruption, norcorruption. They also may not guarantee compliance with legal and regulatory requirements and may fail to enable management to detect breaches not detected by management.thereof.
Sanctions for failure by the company or others acting on its behalf to comply with these laws, regulations, standards and contractual obligations could include fines, penalties, imprisonment of officers, litigation, and loss of operating licences or permits, suspensions of operations and negative effects on AngloGold Ashanti’s reported financial results and may damage its reputation. Such sanctions could have a material adverse impact on the company’s financial condition and results of operations.
Breaches in information technology security and violations of data protection laws may adversely impact AngloGold Ashanti’s business.
AngloGold Ashanti maintains global information technology and communication networks and applications to support its business activities.
The sophistication and magnitude of cybersecurity incidents are increasing and include malicious software, attempts to gain unauthorised access to data and other electronic security and protected information breaches that could lead to production downtimes, operational delays, the compromising of confidential or otherwise protected information, destruction or corruption of data, other manipulation or improper use of AngloGold Ashanti’s systems and networks or financial losses from remedial actions.
Information technology security processes may not prevent future malicious actions,denial-of-service attacks, or fraud, resulting in corruption of operating systems, theft of commercially sensitive data, misappropriation of funds and business and operational disruption. Material system breaches and failures could result in significant interruptions that could in turn affect AngloGold Ashanti’s operating results and reputation.
28
The interpretation and application of consumer and data protection laws in South Africa, the United States and elsewhere are uncertain and evolving. It is possible that these laws may be interpreted and applied in a manner that is inconsistent with AngloGold Ashanti’s data practices. Complying with these various laws is difficult and could cause the company to incur substantial costs or require it to change its business practices in a manner adverse to its business.
Risks related to AngloGold Ashanti’s results of operations and financial condition as a result of factors specific to the company and its operations
AngloGold Ashanti’s Ore Reserve, deposits and mining operations are located in countries that face instability and security risks that may adversely affect both the terms of its mining concessions, as well as its ability to conduct operations in certain countries.
Some of AngloGold Ashanti’s mineral deposits and mining and exploration operations are located in countries that are experiencing political instability and economic and other uncertainty.
Certain of the countries in which AngloGold Ashanti does nothas mineral deposits or mining or exploration operations, including the DRC, Mali, Guinea, Ghana, South Africa, Colombia and Brazil, have any gold hedging instrumentsin the past experienced, and in certain cases continue to experience, a difficult security environment. In particular, various illegal groups active in regions in which the company is present may pose a credible threat of military repression, terrorism, civil unrest and disturbances, sabotage, extortion and kidnapping, which could have an adverse effect on its operations in these and other regions.
For example, Mali continues to experience a difficult security environment since the military coup in March 2012. The situation in Mali remains of heightened concern as a result of the instability in northern Mali, which also spread to Central Mali in 2016.
Eastern DRC also continues to experience tension consistent with the cycles of unrest experienced since the late 2000s. Fighting has caused instability in the area and could expand or long-term sales contracts, exposingintensify, particularly in response to certain political actions such as the postponement of elections in early 2017.
In 2012, AngloGold Ashanti Colombia’s (AGAC) assets and employees were the targets of direct attacks by hostile actors around the La Colosa project’s area of influence. Although a peace agreement was brokered in 2016, the risk of rogue factions joining criminal gangs remains a threat and other similar attacks could adversely affect the company’s activities in Colombia in the future.
In March 2017, the bullion strong room and security employees at Mineração Serra Grande in Brazil were the target of an armed attack. There were no fatalities or serious injuries, but the risk of a future attack remains a threat and other similar attacks could adversely affect the company’s activities in Brazil in the future.
From 2009 to 2015, the company recorded an almost four-fold increase in the instances of injury to security personnel, including members of AngloGold Ashanti’s internal security, private security companies and public security forces in certain jurisdictions. The injury rate increase was caused by a rise in the number and severity of security incidents resulting from increased illegal and artisanal mining due to a steady migration of people into the applicable areas and an increase in the level
of organisation and funding of criminal activity around some of the company’s Continental African operations. Although this trend stabilised in 2016, intrusions onto the company’s tenement and operational areas, including illegal mining-related activities in particular, continue to be a challenge. The most significant security challenges remain in Tanzania, Guinea and Ghana, in areas where there is endemic poverty and high levels of unemployment. See “—Illegal and artisanal mining occurs on AngloGold Ashanti’s properties, which can disrupt the company’s business and expose the company to potential gains from subsequent commodity price increases but exposing it entirely to subsequent commodity price decreases.
AngloGold Ashanti removedliability.” If the last of its gold hedging instruments in October 2010 to provide greater participation in a rising gold price environment. As a result, AngloGold Ashanti no longer has any protection against declines in the market price of gold. A sustained decline in the price of gold could adversely impactsecurity environment surrounding the company’s operatingoperations that are most exposed to these challenges deteriorates, employee, third-party and community member injuries and fatalities could also increase. Any such increase could disrupt the company’s operations in certain mines and adversely affect its reputation, results of operations and its financial condition.
Labour unrest, activism and disruptions (including protracted stoppages)In some instances, risk assessments categorise threats as serious enough to require resorting to public security forces, such as national police or military units on a near-permanent basis. For example, the company relies on the army for support at its mining operations in Ghana. Incursions occurred at the Obuasi mine following withdrawal of such state security protection in February 2016. In the event that continued operations in any of the company’s countries of operations compromise the company’s security or business principles, AngloGold Ashanti may withdraw from any such countries on a temporary or permanent basis. This could have a material adverse effectimpact on AngloGold Ashanti’s results of operations and financial condition.
Furthermore, the company continues to experience strained relationships with certain of its host communities. AngloGold Ashanti’s employeesAshanti operates in several regions where poverty, unemployment and the lack of access to alternative livelihoods mean that the creation and distribution of economic benefit from mining operations is a significant area of focus for community and government. For example, protests demanding employment by the communities and youth occurred at the company’s Siguiri mine in Guinea in 2016. AngloGold Ashanti has also been publicly accused of inadequate resettlement practices at its Siguiri operation by local and internationalnon-governmental organisations, which poses reputational risk. Additionally, AngloGold Ashanti has been involved in disputes with the Merafong City Local Municipality in South Africa Ghana, Guineaover property valuations and Argentina which individually produced approximately 29%, 10%, 7%water services surcharges. These matters have drawn public attention and 7% respectively,have been discussed with the Minister of Mineral Resources.
In addition, infectious diseases are also a threat to the stability of some of the countries in which the company operates, where limited local health infrastructure weakens governments’ ability to manage and contain outbreaks effectively. For example, during August 2014, cases of Ebola virus disease (EVD) were reported in Siguiri, Guinea, which is located near AngloGold Ashanti’s Siguiri mine. EVD was also reported elsewhere in Guinea. The company implemented certain restrictions on travel to and from the Siguiri mine as a precaution. As EVD caused significant disruptions in the company’s total revenueexploration activities, particularly relating to field mapping and geophysics, AngloGold Ashanti also suspended its brownfields work programme and greenfields field work in 2014,the middle of 2014. Although this situation has normalised in Guinea, in the future the company may consider further safety measures which may negatively impact its operations or its exploration projects in neighbouring areas in countries that may be affected by infectious diseases.
AngloGold Ashanti’s mineral deposits, Ore Reserve, and mining operations are highly unionisedlocated in countries where political, tax and unions are active at someeconomic laws and policies may change rapidly and unpredictably and such changes and policies may adversely affect both the terms of its mining concessions, as well as its ability to conduct operations in certain countries.
Past experience demonstrates that political, tax and economic laws and policies in countries in which AngloGold Ashanti operates can change rapidly. Examples include the 2012 coup d’état and subsequent fighting in Mali, the foreign currency regulations that were imposed from 2011 to 2015 in Argentina and the ban on gold ore exports announced by the Tanzanian government in March 2017. As mining assets are fixed, the adverse impacts of such changes may be unavoidable and immediate.
Any existing and new mining, exploration operations and projects that the company carries out are subject to various national and local laws, policies and regulations governing the ownership, prospecting, development and mining of Ore Reserves, taxation and royalties, exchange controls, import and export duties and restrictions, investment approvals, employee and social community relations and other operations. Trade unions, therefore,matters.
In many of the countries in which AngloGold Ashanti operates, there is an ongoing focus by governments seeking greater economic benefit and increased financial and social benefits from extractive industries and mining in particular. This entails the review of mining codes and stability agreements, which were in many cases designed under particular economic conditions, and the formulation or amendment of laws, policies and regulations relating to issues such as mineral rights and asset ownership, royalties, taxation and taxation disputes, “windfall” or “super” taxation,non-recovery of taxation refunds, import and export duties, currency transfers, restrictions on foreign currency holdings and repatriation of earnings. The laws, policies and
regulations are increasingly uncertain, changing and generally require progressively higher payments to governments, notably in the form of increased royalties and taxes, mandated beneficiation, export levies and increasing or retaining state or national ownership of resources. In particular, changes to the fiscal terms governing AngloGold Ashanti’s operations may have a significantmaterial adverse impact on the company’s labour relations, as well as on socialresults of operations or financial condition, threaten the viability of existing operations, and political reforms, most notablydiscourage future investments in South Africa. There is a risk that strikes or other types of conflict with unions or employeescertain jurisdictions. This may occur at any of the company’s operations, particularly where the labour force is unionised or there is inter-union rivalry. Labour disruptions may be used to advocate labour, political or social goals in the future. For example, labour disruptions may occur in sympathy with retrenchments, strikes or labour unrest in other sectors of the economy and for political goals. Labour unrest in South Africa can also be fuelled by migrant labour conditions and mine worker debt levels. Furthermore, such labour disruptions may themselves affect or be perceived to affect local political and social stability. Acts of vandalism affecting mines and mine equipment are possible during periods of labour unrest.
For example, following a wave of labour unrest and unprotected strike action that took place throughout the South African mining, transport and agricultural sectors since early August 2012, workers from AngloGold Ashanti’s Kopanang mine, three West Wits mines and the Vaal River region’s other operations engaged in unprotected strikes in September 2012. More than 100,000 miners were involved in the strikes across the mining sector during the last four months of 2012. Workers at AngloGold Ashanti’s mines in South Africatherefore have also staged sit-ins which prompted the company to suspend operations at some of its mines. These work stoppages pose significant safety risks and operating challenges. The protracted period of inactivity caused by the strike, coupled by the depth of the affected mines, complicated the consequent ramping up of production following the termination of the strikes and resulted in a lengthened ramp-up period to ensure employee safety. The unprotected strike action at the South African operations had an adverse impact on the company’s third quarter resultsability to access new assets and potentially reduce future growth opportunities.
For example, on 9 September 2011, a new mining code for Guinea was enacted. The new mining code significantly adversely impacted its fourth quarter results.increased the share of state ownership in the mining industry, extending a 15 percent share of future mining projects to the government, without financial compensation. The company estimates thatgovernment also had the unprotected strike action cost approximately 235,000 ouncesoption to purchase up to an additional 20 percent of each project. However, the new mining code was suspended in lost productionOctober 2012 due to the work stoppages and the slow ramp-up to full production. In lateunfavourable reception. On 8 April 2013, the Guinean parliament voted to amend the 2011 Mining Code. The amendment was promulgated shortly thereafter by Presidential Decree on 17 April 2013. The new legislation provided that existing mining conventions would be amended through addenda which would contain various provisions, including provisions relating to taxation, state equity participation in mining companies and other matters. AngloGold Ashanti’s new convention came into effect in January 2017 and includes, among other terms, a numberfive percent royalty on gold and a 15 percent free-carried,non-contributory interest in the mine for the Republic of workers at Moab KhotsongGuinea. See “Item 4B: Business Overview—The Regulatory Environment Enabling AngloGold Ashanti to Mine”. Any future amendments to the mining code or attempts to renegotiate the convention could have further adverse effects on the company’s financial condition and all workers at Mponeng failedprofitability.
In 2012, the government of Ghana amended its fiscal mining regime, increasing its corporate taxation to report for their shifts35 percent and royalty rates of five percent. Furthermore, the government of Ghana has constituted a review committee to review andre-negotiate stability agreements with mining companies. AngloGold Ashanti is waiting to be invited to participate in a dispute over Saturday working arrangements but returned soon after. Subsequently around 600 workers were dismissed for disciplinary reasons afternegotiations with the strikes.Ghanaian review committee. The Labour Court is currently reviewing someoutcome of these dismissals. Furthermore, AngloGold Ashanti experienced a 48-hour strike at its Vaal River operations in September 2013.
In addition, the emergence of the Association of Mineworkers and Construction Union (“AMCU”), a relative newcomer with respect to AngloGold Ashanti’s South African operations and the gold sector as a whole, impacted productivity in 2013, as employees changed union affiliations and rivalry with the established National Union of Mineworkers increased. This was evidenced during the first half of 2013 by sporadic, unprotected work interruptions at some operations and some incidents of violence and intimidation. A drive to increase AMCU membership at the company’s Vaal River operations resulting in the AMCU achieving a majority, as exists at West Wits, could increase the risk of industrial action.
Lower production and payroll increases resulting from the labour disruptions have adversely impacted the financial performance of all South African operations, threatening viability in some cases, and similar disruptions in the futurenegotiations may have a material adverse effect on the company’s results of operations or financial condition.
AngloGold Ashanti and other major mining companies are in talks with the Tanzanian government regarding new mining legislation and its impact on existing mining agreements. Such talks follow an earlier declaration in July 2012 by the Tanzanian Minister of Energy and Minerals that the mining contracts were under review. The new mining legislation and the outcome of the review of the mining contracts may have a material adverse impact on the company’s results of operations and financial condition. For example, subsequentIn 2012, the Tanzanian Minister of Energy and Minerals increased the royalty rate levied on gold extracted in Tanzania by AngloGold Ashanti’s operations by one percent, which had a direct impact on the revenues earned from the operations in Tanzania. This change was ratified on 9 October 2014, together with the cancellation of a capital allowance previously applicable to unredeemed qualifying capital expenditure and a new levy payable to the 2012 strikes,Geita District Council. In 2015, a 30 percent capital gains tax on sales of shares and a new act cancelling VAT exemptions on company purchases came into force. Then, in 2016, Tanzanian regulations came into effect mandating the sale of shares in Tanzanian operations to nationals by way of a public offering and listing on the Dar es Salaam Stock Exchange that may apply to companies that carry out large scale mining operations. The company believes that the listing requirement conflicts with the development agreements, and has initiated discussions with the government of Tanzania to be exempted from the listing requirements. However, the company can provide no assurance that the listing requirement will not apply to AngloGold Ashanti, along with its major gold-producing peersand if this new requirement and the other new laws identified above are applied to the company, there may be an adverse impact on the company’s results of operations in Tanzania.
On 1 July 2012, Australia’s Minerals Resource Rent Tax (MRRT) came into effect after the legislation was passed in March 2012. The MRRT, which was repealed in 2014, applied only to the bulk commodities of coal and iron ore, and replaced the previously proposed Resource Super Profits Tax (RSPT), which covered all minerals. The Australian federal government did not include gold and uranium in the final MRRT. However, should Australia consider reintroducing the RSPT, or if similar “super profit” taxes were to be introduced and implemented in any other country in which AngloGold Ashanti operates, the company’s results of operations and financial condition could be materially adversely affected.
In addition, some of AngloGold Ashanti’s mineral deposits and mining and exploration operations are located in countries that are experiencing social and political instability as well as economic uncertainty. In these countries, there is a risk that political influence may delay or hinder strategic imperatives for cost rationalisation especially in the areas of procurement and labour reductions. For example, in South Africa, country risk has increased the entry-level pay of employees; established a new pay category for equipment operators; provided an allowance for rock-drill operators; and increased pay by 2% for most categories of workers. The net impactin light of the settlementviolent strike action, social unrest and protest. In addition, allegations of corruption in Brazil and Guinea against top political and industry leaders have increased political instability and distrust, and efforts at political and economic reform in Brazil may lead to increased instability. Additionally, the political rhetoric and incentives prior to national elections in Ghana late in 2016 may have influenced and slowed the national response to the illegal mining at Obuasi. The high levels of unemployment, poverty and inequality remain in each of these countries, further increasing the risk of social instability that will continue to negatively impact their economies, business and the mining industry.
The MPRDA Amendment Bill of 2013, passed by the National Assembly of Parliament of the Republic of South Africa on 12 March 2014 (and referred back to the National Assembly by the President on 16 January 2015), could, if ruled to be constitutional, impact AngloGold Ashanti’s business by empowering the Minister of Mineral Resources to set developmental pricing conditions for certain minerals for beneficiation purposes, impose export permits on designated minerals and give the State an open-ended free carried interest and State participation.
In June 2013, the Brazilian government proposed changes to the mining legislation that are still being discussed in congress. The proposals could make the rules governing access to mining titles more discretionary and could shorten the duration of exploitation rights. Following the November 2015 tailings dam collapse in Minas Gerais on the payroll cost for mining properties of companies not affiliated with AngloGold Ashanti, the Brazilian government has also considered including tougher requirements related to tailings dams (e.g., mandatory insurance in case of environmental catastrophe).
Mining is a long-term activity and assets may be located in jurisdictions with elevated risk. Political instability and the resulting unstable business environment in such countries in which companies operate may discourage future investment in those jurisdictions, and may have an adverse impact on the company’s ability to access new assets, potentially reducing growth opportunities.
AngloGold Ashanti is $16 million per annum.subject to an uncertain tax environment. Increased taxes are expected in most countries of operation. Changes in tax laws could result in higher tax expense and payments. Furthermore, legislation changes could materially impact AngloGold Ashanti’s tax receivables and liabilities as well as deferred tax assets and deferred tax liabilities. In addition, the uncertain tax environment in some regions could limit AngloGold Ashanti’s ability to enforce its rights. As a global company, AngloGold Ashanti conducts its business in countries subject to complex tax rules, which may be interpreted in different ways. Further interpretations or developments of tax regimes may affect the company’s tax liability, return on investments and business operations. AngloGold Ashanti is regularly examined by tax authorities in its various jurisdictions of operation
29
In South Africa, amendments to labour legislationGuinea, Mali, DRC and Tanzania, AngloGold Ashanti is due refunds of input tax and fuel duties which have been proposed, which, if implemented, may have negative consequencesremained outstanding for periods longer than those provided for in the company.respective statutes. For example, AngloGold Ashanti calculates that overdue recoverable value added tax, fuel duties and appeal deposits of $57 million are owed to AngloGold Ashanti and held by the proposed amendment with respect to labour brokers could mandate that labourers who are provided by labour brokers to performTanzanian government and it is not certain services forwhen, if ever, AngloGold Ashanti will be refunded this amount. Similarly, it is not certain when or whether AngloGold Ashanti will be refunded all amounts due from any other government.
The countries in which the company couldoperates may also introduce export restrictions, strict exchange controls, impose restrictions to source materials and services locally, or impose other similar restrictions that hinder foreign companies’ operations within such countries. For example, in March 2017, the Tanzanian government announced an immediate ban on gold, silver, copper and nickel ore exports, in an attempt to ensure that mineral value-addition activities would be viewed as AngloGold Ashanti’s employees, which could increase its labour costs and reduce operational flexibility.
In South Africa, the restructuring of mining operations that result in layoffs or redundancies are currently a highly contentious matter. Whilst the Department of Minerals and Energycarried outin-country. This regulatory change does not have any statutory right oncurrently impact the basisGeita mine or Tanzanian operations as the company does not export unrefined or refractory ore out of existing labour legislationTanzania. Additionally, from 2011 to intervene in any such restructuring process, it may intervene by placing external pressure on2015, the Argentinian government introduced stricter exchange controls and related protracted approval processes which limited the company’s ability to repatriate dividends from its Argentinian subsidiaries. In October 2011, the Argentinian government decreed that mining, oil and energy companies must repatriate export earnings and additionally, the purchase of U.S. dollars required authorisation from the Argentinian central bank and the purpose for which the currency would be used had to be stated. In May 2012, the Argentine Mining Secretariat issued new regulations requiring mining companies in respectArgentina to boost their domestic purchases of equipment and services and mining companies were required to resort exclusively to locally established suppliers for their export-related shipping and logistics operations. While the new government, elected in November 2015, started a process to ease these controls and return to an open economy and free market, not all restrictions had been lifted as of March 2017.
If, in one or more of the renewalcountries in which it operates, AngloGold Ashanti were not able to obtain or cancellation of their mining rights.
On 10 February 2014 workers employed by a contractor at Sadiolamaintain necessary permits, authorisations or agreements to implement planned projects or continue its operations under conditions or within timeframes that make such plans and Yatela went on a five day strike demanding improved redundancy payments. On 25 March 2014,operations economically viable, or if the company signed an agreementapplicable legal, ownership, fiscal (including all royalties and duties), exchange control, employment, environmental and social laws or regimes change materially, or if the governing political authorities change resulting in amendments to increase social benefits for workers at these mines. Furthermore, between 18 July 2012such laws and 20 July 2012, fourteen employees went on strike at Sadiola. Following the strike, the company’s joint venture in Mali has been involved in legal proceedings against the workers, which are ongoing.
Increased labour costsregimes, this could have a material adverse effect on AngloGold Ashanti’s operating results, financial condition, and, in extreme situations, on the viability of operations and financial condition.
Labour costs represent a substantial proportion of the company’s total operating costs and at many operations, including its South African, Ghanaian and Tanzanian operations, constitute the company’s single largest component of operating costs. Failing to obtain any simultaneous increase in productivity, any change to the company’s wage agreements or other factors that could increase labour costs may have a material adverse effect on AngloGold Ashanti’s results of operations and financial condition.
In South Africa, the established practicean operation. The risk is to negotiate wages and conditions of employment with the unions every two years through the Chamber of Mines of South Africa. South African employment law sets out minimum terms and conditions of employment for employees, which form the benchmark for all employment contracts. In mid-July 2013, the Chamber of Mines of South Africa undertook wage negotiations on behalf of the gold sector. Wage negotiations were completed following the 48-hour strike at the company’s Vaal River operations and a wage agreement was extended to all employees irrespective of union affiliation. At present, the mining unions and gold mining companies in South Africa are in the second year of the latest two-year wage agreement, with the latest increases of up to 8% as well as increases in living-out allowances awarded to the majority of the workforce in September 2013. At the start of 2014, AMCU embarked upon protracted strike action in the platinum sector and served strike notices at three gold companies to challenge the extension of the 2013 Wage Agreement for AMCU members to obtain substantially higher wages, though the strike was later ruled unprotected. The next round of wage negotiations in South Africa is expected to begin in early 2015.
During 2014, approximately 60% of the company’s workforce, excluding contractors, was locatedparticularly acute in South Africa.
See “—AngloGold Ashanti’s results may be further impaired if it incurs penalties for failing to meet standards set by labour laws regarding workers’mining rights or incurs costs complying with new labour laws, rules and regulations. For example, employment law in South Africa imposes monetary penalties for neglecting to report to government authorities on progress made towards achieving employment equity in the workplace. Ghanaian law also contains broad provisions requiringcountries in which it operates could be altered, suspended or cancelled for a variety of reasons, including breaches in its obligations in respect of such mining companiesrights” and “Item 4B: Business Overview—The Regulatory Environment Enabling AngloGold Ashanti to recruit and train Ghanaian personnel and to use the services of Ghanaian companies. In Australia, the federal government has recently introduced a new industrial relations system that includes “good faith bargaining” obligations for employers, fewer restrictions on the content of collective agreements and an enhanced role for union officials as bargaining representatives, parties to agreements and participants in dispute resolution. Penalties and compliance costs, as well as increased costs due to laws and regulations less favourable to employers, could have a material adverse effect on the company’s results of operations and financial condition.Mine”.
AngloGold Ashanti’s mining rights in the countries in which it operates could be altered, suspended or cancelled for a variety of reasons, including breaches in its obligations in respect of itssuch mining rights.
AngloGold Ashanti’s right to own and exploit MineralOre Reserves and deposits is governed by the laws and regulations of the jurisdictions in which the mineral properties are located. See “Item 4B: Business Overview—The Regulatory Environment Enabling AngloGold Ashanti to Mine”. Currently, a significant portion of the company’s MineralOre Reserves and deposits are located in countries where mining rights could be suspended or cancelled should it breach its obligations in respect of the acquisition and exploitation of these rights.
In each of the countries in which AngloGold Ashanti operates, the formulation or implementation of government policies on certain issues may be unpredictable. This may include changes in laws relating to mineral rights and ownership of mining assets and the right to prospect and mine, and in extreme cases, nationalisation, expropriation or nullification of existing
30
concessions, licenses, permits, agreements and contracts. In May 2012, for example, the Argentine government nationalised the oil company Yacimientos Petrolíferos Fiscales (“YPF”) by expropriating 51% of the shares from the majority Spanish shareholder.
Any existing and new mining and exploration operations and projects are subject to various national and local laws, policies and regulations governing the ownership and the right to prospect or mine or develop proposed projects. For more details on the risks surrounding ownership of mining assets, see “–“— Title to AngloGold Ashanti’s properties may be uncertain and subject to challenge” and “–“— AngloGold Ashanti’s Mineral Reserve, deposits and mining operations are located in countries that face political, economic and security risks that may affect both the terms of its mining concessions, as well as its ability to conduct operations in certain countries”.
Project implementation delays could result in licences not being renewed and the loss of mining rights. Some of AngloGold Ashanti’s mining concessions, authorisations, licences and permits are subject to expiry, limitations on renewal and various other risks and uncertainties. For example, in 2012 the company experienced certification delays at Cripple Creek & VictorDRC Mines Minister announced a reform of the DRC’s mining code that could have had a material adverse impact on the protections enjoyed by AngloGold Ashanti’s projects in the United States earlyDRC. While the reform plans were postponed in 2014, which increased costs and decreased annual production. February 2016, there can be no assurance that the DRC Mines Minister will not undertake similar reforms in the future.
In addition, any dispute with governments or other stakeholders, including labour unions, involving an AngloGold Ashanti operation, as a result of rationalisation efforts or otherwise, could negatively affect AngloGold Ashanti’s relationship with such government or stakeholders in respect of other operations within the same country, which could result in adverse consequences, including unfavourable regulatory action, claims and labour disputes. Such adverse consequences could be exacerbated due to the holding company structure of AngloGold Ashanti’s subsidiaries in some of the countries in which it operates.
In 2012, the DRC Mines Minister announced a reform of the DRC’s mining code. According to recent available data, the proposed laws seek to, amongst other things, increase the government stakeMoreover, in mining operations to 15% from the existing 5%, substantially increase royalties on some minerals, reduce in a significant way the protections AngloGold Ashanti currently enjoys on its projects in the DRC, impose new conditions on the company’s ability to retain and renew licences and introduce a 50% levy on certain profits. Should such laws be enacted in the future, these may have a material adverse impact on the company’s results of operations in the DRC.
Moreover,South Africa, AngloGold Ashanti’s mining rights in South Africa may be suspended or cancelled by the Minister of Mineral Resources, and the company may be unable to obtain new mining rights if it breaches its obligations under the Mineral and Petroleum Resources Development Act (“MPRDA”)(MPRDA). In particular, South Africa’s changing Black Economic Empowerment (“BEE”)(BEE) policies may adversely affect both the terms of AngloGold Ashanti’s mining concessions, as well as its ability to conduct operations. Mining rights are linked to meetingcompliance with various obligations, that includeincluding the Revised Mining Charter. Compliance with the Revised Mining Charter is measured using a designated scorecard relating to equity ownership and management control of mining companies by historically disadvantaged South Africans (“HDSAs”) by no later than(HDSAs). The deadline for compliance was originally set for the end of 2014, andat which time HDSAs musthad to constitute 40%40 percent of all levels of management by 2014. In 2013, AngloGold Ashanti achieved all Mining Charter targets with the exception of senior management (33% versus the target of 40%) and in the procurement services area (57% versus the target of 60%).management.
Whilst AngloGold Ashanti believes that it is compliantcomplied with ownership targets that had to be achieved by the end of 2014, it has not yet received its scorecard from the government assessing its compliance with applicable requirements and it may need to make further progress to achieve future targets, including further participation by HDSAs in senior and top management levels, the upgrade of housing and accommodation at the company’s mines, further human resource development, mine community development, sustainable development and growth as well as procurement and enterprise development.
The company will incur expenses in giving further effect to the Revised Mining Charter and the scorecard. AngloGold Ashanti may not meet all of the various requirements by the required dates. Additionally, the South African government may decide that the Revised Mining Charter has not gone far enough to achieve its underlying goals and therefore decide to expand the obligations of mining companies thereunder and the Minister of Mineral Resources may opt to disregard certain historical BEE transactions in connection with its review of new mining rights applications.
In March 2015, the Minister of Mineral Resources announced that the Department of Mineral Resources (DMR) and the Chamber of Mines of South Africa had jointly agreed to submit certain matters relating to the interpretation of the Revised Mining Charter, including the qualification of certain historical BEE transactions for meeting the HDSA ownership thresholds, to the courts in South Africa for determination and clarification. On 9 March 2016, AngloGold Ashanti received a notice from the DMR stating that the company was not compliant with the 26 percent HDSA ownership requirement. AngloGold Ashanti timely
responded to the order and as the DMR has taken no further action, its original notice has lapsed. However, in April 2016, the DMR published a new draft mining charter (Draft 2016 Mining Charter) which would, amongst other aspects, require mining companies to retain the minimum target of 26 percent HDSA ownership threshold per mining right for as long as they hold the right, even if the original HDSA participants sell out, and would require mining companies to achieve a minimum representation of Black People in certain management and skilled positions. The Minister of Mineral Resources has indicated that it is the DMR’s intention to publish a final version of the Draft 2016 Mining Charter in March 2017 based on the DMR’s engagement with stakeholders in the industry and without a further formal public participation process. See “Item 4B: Business Overview – The Regulatory Environment Enabling AngloGold Ashanti to Mine”. Should AngloGold Ashanti be found in breach its obligations in complyingto comply with the MPRDA, Revised Mining Charter or any future amendments to the Revised Mining Charter, it may be compelled to conduct additional BEE transactions or its mining rights in South Africa could be suspended or cancelled by the Minister of Mineral Resources and it may be unable to obtain any new mining rights. Any such suspension or cancellation could have a material adverse effect on AngloGold Ashanti’s results of operations and financial condition.
In addition, and as discussed in more detail in “Item 4B: Business Overview – The Regulatory Environment Enabling AngloGold Ashanti to Mine” –, South Africa recently enacted the BBBEE Amendment Act, which amended the Broad-based Black Economic Empowerment Act 53 of 2003. There are several areas of potential conflict between the BBBEE Amendment Act and the Revised Charter, and it is unclear whether theMining Charter. The BBBEE Amendment Act will overrulebecame effective on 24 October 2016 and is understood to override any conflicting law, including the Revised Mining Charter. Although the Draft 2016 Mining Charter seeks to align the Revised Mining Charter with the BBBEE Amendment Act, similar regulatory conflicts and uncertainty may continue to prevail in the future.
In Colombia, a government agency grants exclusive concession contracts for exploration and exploitation. With the award of the mining concession or tenement contract, there are specified timelines for the completion of the various phases of a mining project, e.g. exploration, construction, exploitation. The company must comply with these timelines unless performance is excused, for example, due to force majeure or if extensions or modifications to the timelines are received. If the company does not comply with the specified timelines for the completion of the various phases of a mining project, the mining authority may revoke the company’s concession contracts or mining licenses. The company’s core mining concession contracts provide that the mining authority has the discretion to declare the underlying concession void AGAC breaches applicable environmental laws or regulations. If the mining authority were to exercise such discretion against AGAC, AGAC would be required to abandon its projects and all of its other existing mining concession contracts. Pending proposals for new mining concession contracts would also be cancelled and AGAC would be banned from doing business with the Colombian government for a period of five years.
AGAC has applied for consolidation of its tenement contracts related to La Colosa, some of which are currently not in compliance with their specified timelines. The company is waiting for approval of its application for consolidation, which would remedy thenon-compliance of each consolidated tenement, but can provide no assurance that its application will be approved.
31
AngloGold Ashanti’s insurance does not cover most losses caused by the risks described above; see “–“— The occurrence of events for which AngloGold Ashanti is not insured or for which its insurance is inadequate may adversely affect cash flows and overall profitability”.
If AngloGold Ashanti is not able to obtain or maintain necessary permits, authorisations or agreements to prospect or mine or to implement planned projects, or continue its operations, or comply with all laws, regulations or requirements, or do so within time-framestimeframes that make such plans and operations economically viable, or if the laws impacting the company’s ownership of its mineral rights or the right to prospect or mine change materially, or should governments increase their ownership in the mines or nationalise them, AngloGold Ashanti’s results of operations and financial condition could be adversely affected.
Title to AngloGold Ashanti’s properties may be uncertain and subject to challenge.
AngloGold Ashanti has operations in several countries where ownership of land is uncertain and where disputes may arise in relation to ownership. Certain of the company’s properties may be subject to the rights or the asserted rights of various community stakeholders, including indigenous people. The presence of those stakeholders may have an impact on AngloGold Ashanti’s ability to develop or operate its mining interests. For example, in Australia, the Native Title Act (1993) provides for the establishment and recognition of native title under certain circumstances. In South Africa, the Extension of Security of Tenure Act (1997) and the Restitution of Land Rights Act (1994) provide for various landholding rights. Such legislation is complex, difficult to predict and outside of the company’s control, and could therefore negatively affect the business results of
new or existing projects. In Ghana in February 2012, the company negotiated the relocation of the Sansu Community, which lies within its local mining concession; the cost of this relocation was approximately $30 million. Where consultation with stakeholders is statutorily or otherwise mandated, relations may not remain amicable and disputes may lead to reduced access to properties or delays in operations.
Moreover, amendments to the laws regulating mining in South Africa became effective on 7 June 2013. One of these amendments relates to the possible “expropriation” of mine dumps that were created before the coming into effect of the MPRDA on 1 May 2004. Although the legal position is not clear in this regard, it is possible that some pre-2004 mine dumps are now subject to the MPRDA and, as a result, the Minister of Mineral Resources may issue rights over such dumps to third parties.
Title to the company’s properties, particularly undeveloped ones, may also be defective or subject to challenge. Title insurance generally is not available, and title review does not necessarily preclude third parties from contesting ownership. Where surveys have not been conducted, the precise area and location of the company’s claims may be in doubt.doubt and concessions granted under various titles in a single area may turn out not to be perfectly contiguous, leaving title to areas between concessions open to challenge. Accordingly, AngloGold Ashanti’s mineral properties may be subject to prior unregistered liens, agreements, transfers or claims, including native land claims, and title may be affected by, amongst other things, undetected defects.
AngloGold Ashanti may experience unforeseen difficulties, delays or costs in successfully implementing its business strategy and projects, including any cost-cutting initiatives, temporary or permanent shutdowns, divestments and other portfolio rationalisation initiatives and any such strategy or project may not result in the anticipated benefits.
The successful implementation of the company’s business strategy and projects depends upon many factors, including those outside its control. For example, the successful management of costs will depend on prevailing market prices for input costs. The ability to grow the business will depend on the successful implementation of the company’s existing and proposed project development initiatives and continued exploration success, as well as on the availability of attractive merger and acquisition opportunities, all of which are subject to the relevant mining and company specific risks as outlined in these risk factors.
Since 2013, AngloGold Ashanti is in the process of implementinghas implemented initiatives relating to strategic alignment, portfolio review, restructuring and cost-cutting, temporary or permanent shutdowns, and divestments, including in connection with the consolidation of its business activities and assets. Any future contribution of these measures to profitability will be influenced by the actual savings achieved and by the company’s ability to sustain these ongoing efforts. Strategic alignment, restructuring and cost-cutting initiatives may involve various risks, including, for example, labour unrest, operating licence withdrawal, and potentialknock-on effects to other company projects and jurisdictions. The risk is elevated in South Africa, given calls for withdrawal of mining licences for “mothballed shafts” and hostile reaction to proposed mining industry retrenchments.
The risk mayis also be elevatedsignificant in Ghana, where the restructuring and repositioning of the Obuasi mine have resulted in a substantial reduction inhalting of the mine’s existing operations and significant workforce redundancies. In 2014 alone, these redundancies and where,resulted in the company incurring $210 million in retrenchment costs. Furthermore, three months after entering into a conditional investment agreement with AngloGold Ashanti may failin 2015 for the purpose of redeveloping and operating the Obuasi mine, Randgold Resources Limited (Randgold) informed AngloGold Ashanti that it wished to terminate the agreement, as the proposed investment did not meet Randgold’s investment criteria.
If AngloGold Ashanti fails to demonstrate or realise its business case for the mine’s redevelopment. redevelopment of the Obuasi operation, including because the company is unable to finalise a joint venture or other agreement with a partner to make the substantial investments necessary for redevelopment, to obtain the required consents, approvals or agreements for continued operation or to continue to stabilise security conditions following the withdrawal of state security protection in early 2016, AngloGold Ashanti may be forced to withdraw from the Obuasi mine on a long-term or permanent basis.
Finally, the risk may also be high in the DRC, wherein light of the company has exitedgovernment’s expressed intention to reform the Mongbwalu project, see “– mining code. See “—AngloGold Ashanti’s mining rights in the countries in which it operates could be altered, suspended or cancelled for a variety of reasons, including breaches in its obligations in respect of itssuch mining rights”.
32
In addition, these measures may not be implemented as planned, turn out to be less effective than anticipated, only become effective later than anticipated or not be effective at all. Any of these outcomes, individually or in combination, may adversely impact the company’s business, results of operations and financial condition.
Expectations for and trends in the price of gold, combined with increased costs for project financing and exploration in certain regions, have led AngloGold Ashanti to increase its efforts to focus capital expenditure on its highest quality assets, whilst freeing up capital by curtailing capital expenditure or suspending operations at those projects that the company believes are of lower quality. AngloGold Ashanti may also consider finding partners or conducting asset sales relating to certain of its projects. With respect to dispositions, the company may not be able to obtain prices that it expects for the assets it seeks to dispose of or divest some of its activities as planned or to obtain all of the required approvals, and the divestitures that are carried out could have a negative impact on AngloGold Ashanti’s business, results of operations, financial condition and reputation.reputation, including as a result of subsequent claims brought by acquirers in connection with divested assets.
AngloGold Ashanti may also prove unable to deliver on production targets, including in potentially critical areas as well as on the timely, cost-effective and successful execution, includingramping-up, of key capital projects. For example, in South Africa, the company experienced declining production rates (1.21(967,000 ounces in 2016, compared with 1.00 million ounces of gold in 2012, compared with 1.622015, 1.22 million ounces of gold in 2011,2014, and 1.781.30 million ounces in 2010)2013), principally due to continued safety and associated stoppages, mining flexibility constraints and overall falls in grades. The significant decreaseManagement estimates that stoppages in 2012 was also mainly attributable to the industrial strike action at the company’s South African mines, which2016 resulted in theproduction loss of production of 235,000 ounces of gold.104,000 ounces. In addition, Colombia is an untested jurisdiction, so permitting, licensing, stakeholder expectations and demands and other external factors could affect timelines and cause capital overruns. Unforeseen difficulties, delays or costs may adversely affect the successful implementation of the company’s business strategy and projects, and such strategy and projects may not result in the anticipated benefits, which could have a material adverse effect on its financial results and prospects.
Any acquisition or acquisitions thatLabour unrest, activism and disruptions (including protracted stoppages) could have a material adverse effect on AngloGold Ashanti may complete may expose the company to new geographic, political, legal, social, operating,Ashanti’s results of operations and financial and geological risks.condition.
AngloGold Ashanti may pursue the acquisition of producing, developmentAshanti’s employees in South Africa, Ghana, Guinea, Mali, Brazil and advanced stage exploration propertiesArgentina are highly unionised and companies. Any such acquisition may change the scale of the company’s business and operations and may expose it to new geographic, geological, political, social, operating, financial, legal, regulatory and contractual risks. For example: there may be a significant change in commodity prices after the company has committed to complete the transaction and established the purchase price or share exchange ratio; a material ore body may prove below expectations; AngloGold Ashanti may have difficulty integrating and assimilating the operations and personnel of any acquired companies, realising anticipated synergies and maximising the financial and strategic position of the combined enterprise, and maintaining uniform standards, policies and controls; the integration may disrupt the company’s ongoing business and its relationships with employees, suppliers and contractors; and the acquisition may divert management’s attention from AngloGold Ashanti’s day-to-day business. Furthermore, the company operates and acquires businesses in different countries, with different regulatory and operating cultures, which may exacerbate the risks described above. In addition, the acquired business may have undetected liabilities which may be significant.
In the event that the company chooses to raise debt capital to finance any acquisition, the company’s leverage will be increased. Should the company choose to use equity as consideration for an acquisition, existing shareholders may suffer dilution. Alternatively, the company may choose to finance any acquisition with its existing resources, which could decrease its ability to fund future capital expenditures.
The company may not be successful in overcoming these risks or any other problems encountered in connection with acquisitions. Failure by AngloGold Ashanti to implement its acquisition strategy or to integrate acquired businesses successfully could have material adverse effects on its growth and business results.
Ageing infrastructureunions are active at some of its other operations. Trade unions, therefore, have a significant impact on the general labour relations environment, including labour relations at an operational level. The extent of the unions’ influence also impacts the socio-economic and socio-political operating environments, most notably in South Africa. Union involvement in wage negotiations and collective bargaining increases the risk of strike action. In South Africa, the emergence of the Association of Mining Construction Union (AMCU) challenging the dominance of the longstanding National Union of Mineworkers (NUM) lends itself to conflict, inter union rivalry and a risk of labour relations instability. Management expects that unions will continue to use their collective power and ability to withhold labour to advocate for improved conditions of employment, labour regulatory change, political and social goals in the future.
Under the prevailing unstable global economic climate in particular, unions could utilise disruptions, strikes and protest action to oppose restructuring and downscaling of the mining industry. In South Africa, a variety of legacy issues such as housing, migrant labour, education, poor service delivery and youth unemployment can lead to communities and unions working together to create instability in and around mining operations. As such, there is a risk to the safety of people and damage to company infrastructure and property.
The contagion effect of a wave of unprotected strike action and labour unrest which occurred in South Africa and particularly in the mining sector during 2012 led to asix-week unprotected strike at all of AngloGold Ashanti’s South African operations could adversely impact its business.
Deep level gold mining shafts are usually designed with a lifespanin September of 25 to 30 years. Vertical shafts consistthat year. The strike action was fuelled by several issues, including the emergence of large quantitiesAMCU, expectations of infrastructure steelwork for guiding conveyanceshigher wage increases, and accommodating services such as highgeneral social and low tension electric cables, air and water pipe columns. Rising temperatureseconomic conditions. Similar disruptions in the deeper mining areas can also lead to increased cooling requirements in the form of upgraded and expanded ice plants. Maintaining this infrastructure requires skilled human resources, capital allocation, management and planned maintenance. Once a shaft has reached the end of its intended lifespan, higher than normal maintenance and care is required. Incidents resulting in production delays, increased costs or industrial accidents may occur. Such incidentsfuture may have ana material adverse effect on the company’s results of operations and financial condition.
In South Africa, a three-year wage agreement was reached in 2015 with unions representing the majority of the company’s employees. This agreement was extended to all employees irrespective of their union affiliation. However, AMCU did not sign the agreement and challenged the extension of the agreement’s terms to its members. The success of challenges like these could have an adverse impact on the company’s financial condition as a result of increases in labour costs. See “—Increased labour costs could have a material adverse effect on AngloGold Ashanti’s results of operations and financial condition”.
33
Asset integrityIn South Africa, the broader labour relations climate remains fragile. Unresolved issues emanating from the 2015 wage review could result in strike action. In addition, wage negotiations in other mining sectors may influence the stance unions adopt leading up to the 2018 gold negotiations. The labour relations climate is further exacerbated by a number of other issues such as (i) pressure building amongst all unions and reliability issuesemployees regarding legislation reform affecting pensions and provident funds; (ii) demonstrations by the citizenry and students about public services and free education; (iii) public outcry relating to ageing infrastructureracism; and (iv) the effect of confrontations between political parties in thelead-up to elections, all of which may have repercussions in the workplace.
In South Africa, companies’ ability to undertake a restructuring of mining operations that could result in layoffs or redundancies is curtailed by governmental intervention. Going forward, management expects that the Department of Minerals and Energy will invoke its powers to intervene in any such restructuring process and will be able to place external pressure on mining companies due to its control over the renewal and cancellation of mining rights.
In West Africa, union negotiations are increasingly impacted by a focus on broader social grievances. In Mali and Guinea,pro-labour andpro-union practices supported by government labour authorities may result in increased labour union activity and the breach of concernobligations contained in agreements with labour unions.
Any future labour unrest and disruptions could have a material adverse effect on AngloGold Ashanti’s results of operations and financial condition.
Increased labour costs could have a material adverse effect on AngloGold Ashanti’s results of operations and financial condition.
Labour costs represent a substantial proportion of the company’s total operating costs and at many operations but are of particular concern in South Africa and at the Obuasi mine in Ghana. Furthermore in Tanzania, cracks were discovered in the mill feed end in September 2008 and at the discharge end in February 2010 at the Geita gold mine. The Geita gold mine is oneAmericas, constitute approximately 40 to 50 percent of the group’s principal assetsoperations’ operating costs. Absent any simultaneous increase in productivity, any change to the company’s wage agreements or other factors that could increase labour costs may have a material adverse effect on AngloGold Ashanti’s results of operations and sourcesfinancial condition.
During 2016, approximately 65 percent of cash flow. After initial repairs, the feed endcompany’s workforce, excluding contractors, was replaced during Maylocated in South Africa. In South Africa, the historical practice has been to negotiate wages and June 2011. Production throughputconditions of employment with the unions every two years through the Chamber of Mines of South Africa. However, the 2015 wage agreement was negotiated to cover a period of three years. Nevertheless, AMCU, which did not sign the agreement, continued its efforts to challenge the extension of the wage agreement to its members, although its legal challenge was ultimately unsuccessful. Separately, in 2011 was 1 million tonnes less than planned, as2015 the Labour Court found in favour of AMCU regarding the dismissal of 542 employees at Moab Khotsong in April 2013. The relevant employees werere-instated and AngloGold Ashanti paid each employee an amount equivalent to 12 months’ basic pay, which had an adverse impact on the company’s financial condition. As a result of mill downtimeAMCU’s challenges, the risk of potential strike action remains high and further adverse findings could increase labour costs of the company, which could have a material adverse impact on its financial condition.
AngloGold Ashanti’s results may be further impaired if the company incurs penalties for failing to meet standards set by labour laws regarding workers’ rights or incurs costs complying with new labour laws, rules and regulations. For example, employment law in South Africa imposes monetary penalties for neglecting to report to government authorities on progress made towards achieving employment equity in the workplace. Ghanaian law also contains broad provisions requiring mining companies to recruit and train Ghanaian personnel and to use the services of Ghanaian companies. In Australia, the federal government put in place an industrial relations system that included feed end replacement; ore grade was, however, sufficientincludes “good faith bargaining” obligations for employers, fewer restrictions on the content of collective agreements and an enhanced role for union officials as bargaining representatives, parties to achieve 494,000 ounces. The Geita gold mine produced approximately 531,000 ouncesagreements and participants in 2012, with production throughput approximately 100,000 tonnes short of budget. A decision was subsequently takendispute resolution. Penalties and compliance costs, as well as increased costs due to replace the entire mill aslaws and regulations less favourable to employers, could have a result of shell distortion. After new mill manufacture delays, installation was completed during March 2013. Ageing infrastructure may have anmaterial adverse effect on the company’s results of operations and financial condition in the future.condition.
SomeIllegal and artisanal mining occurs on AngloGold Ashanti’s properties, which can disrupt the company’s business and expose the company to liability.
Illegal and artisanal miners are active on, or adjacent to at least 15 of AngloGold Ashanti’s technologiesproperties, which leads at times to interference with the company’s operations and results in conflict situations that present a security threat to property and human life. Illegal artisanal and small-scale mining is associated with a number of negative impacts, including environmental degradation, flouting of land rights, poor working practices, erosion of civil society, human rights abuse and funding of conflict. The environmental, social, safety and health impacts of artisanal mining are unprovenfrequently attributed to formal mining activity, and failureit is often assumed that artisanally-mined gold is channelled through large-scale mining operators, even though artisanal and large-scale miners have distinct supply chains. These misconceptions impact negatively on the reputation of the industry.
The activities of the illegal miners, which include theft and shrinkage, could adversely impact costscause damage to AngloGold Ashanti’s properties, including pollution, underground fires, or personal injury or death, for which AngloGold Ashanti could potentially be held responsible. Illegal mining could result in the depletion of mineral deposits, potentially making the future mining of such deposits uneconomic. The presence of illegal miners could lead to project delays and production.disputes regarding the development or operation of commercial gold deposits. Furthermore, in 2011 and 2012, the company recorded an increase in the number and severity of security incidents, due to a steady migration of people into the areas and an increase in the level of organisation and funding of criminal activity around some of the company’s Continental African operations, likely encouraged by an escalating gold price at that time. The most significant security challenges have occurred in Tanzania and Ghana in areas where there is endemic poverty and high levels of unemployment. For example, in February 2016, AngloGold Ashanti withdrew its employees performingnon-essential functions from its idled Obuasi gold mine following the incursion of illegal miners inside the fenced areas of the site. An AngloGold Ashanti employee was killed in the incursions. More generally, illegal mining and theft could also result in lost gold Ore Reserves, mine stoppages, and have other material adverse effects on AngloGold Ashanti’s results of operations or financial condition.
AngloGold Ashanti competes with mining and other companies for key human resources with critical skills and its inability to retain key personnel could have an adverse effect on its business.
AngloGold Ashanti competes on a global basis with mining and other companies to attract and retain key human resources at all levels with the appropriate technical skills and operating and managerial experience necessary to operate and supervise its business. This is exacerbated by the global shortage of persons with critical mining skills, including geologists, mining engineers, metallurgists and skilled artisans. Furthermore, the often remote locations of mining operations may make the mining industry unattractive to potential employees. Changes in taxation and the regulatory environment where AngloGold Ashanti operates may also impact the company’s ability to attract and retain key personnel, especially those from abroad.
The retention of staff is particularly challenging in South Africa, where, in addition to the impacts of global industry shortages of skilled labour, AngloGold Ashanti is required to achieve employment equity targets of participation by HDSAs in management and other positions. AngloGold Ashanti competes with all companies in South Africa to attract and retain a small but growing pool of HDSAs with the necessary skills and experience. AngloGold Ashanti has createdhistorically faced difficulty recruiting and retaining young graduates and qualifiedmid-level management in South Africa and may encounter greater difficulties in the future as the government attempts to impose increasingly stringent HDSA participation requirements. See “—AngloGold Ashanti’s mining rights in the countries in which it operates could be altered, suspended or cancelled for a Technology Innovation Consortium (ATIC)variety of reasons, including breaches in its obligations in respect of such mining rights” and teamed up with various specialists“Item 4B: Business Overview—The Regulatory Environment Enabling AngloGold Ashanti to engineer new solutionsMine”. Recruitment of skilled personnel has also been challenging in Continental Africa due to environmental management, mine design,university offerings that are often not well-suited to the specific needs of the mining technologyindustry, as well as other factors such as language barriers and methods and underground logistics, amongst other matters. low literacy skills.
The company has invested in new technologies, including phyto-technologies to reduce seepage and address soil and groundwater contamination, and in mine support technologies to minimise the impactrecruitment of seismic activity. The companyskilled workers is also attemptinghighly competitive in South America as a result of a shortage of skills and intense competition between mining companies.
Additionally, the company may incur significant costs to develop technologiesbuild talent, capacity and expertise across its global operations. Despite AngloGold Ashanti’s investments, the company may not be able to accessretain and attract sufficient skilled and experienced employees in all areas of the deeper reachesbusiness. Should it fail to do so or lose any of its South African mines, including rock boring, different hammer configurationskey personnel with critical skills, business and dimensions for drilling, thermal spalling and an ultra-high strength backfill product and system.
Some aspects of these technologies are unproven and their eventual operational outcome or viability cannot be assessed with certainty. AngloGold Ashantigrowth prospects may be unable to successfully put into operation the technological step changes developedharmed and proposed by ATIC. The costs, productivity and other benefits from these initiatives, and the consequent effectsthis could have an adverse impact on AngloGold Ashanti’s future earningsresults of operations and financial condition.
AngloGold Ashanti’s inability to retain its senior management may have an adverse effect on its business.
The company’s success depends largely upon the continued service of its senior management, including its chief executive officer, chief financial officer, the executive officers at each of its business divisions and general managers at its mines.
The loss of one or more members of the senior management teams, coupled with the reduced attractiveness of the gold mining sector, could lead to other members of the management team leaving, disrupt the company’s operations, and have a material adverse impact on the company’s business, results of operations and financial condition.
The use of contractors at certain of the company’s operations may expose AngloGold Ashanti to delays or suspensions in mining activities and increases in mining costs.
AngloGold Ashanti uses contractors at certain of its operations to mine and deliver ore to processing plants as well as for other purposes. At mines employing mining contractors, contracting costs represent a significant proportion of the total operating costs of these operations and the company does not own all of the mining equipment. For example, increased contractor rates at the Sadiola mine in Mali contributed to a significant rise in total cash costs in the final quarter of 2011. Increased contractor costs at Sunrise Dam in Australia and Geita in Tanzania contributed to higher cash costs in the first quarter of 2012.
AngloGold Ashanti’s operations could be disrupted, resulting in additional costs and liabilities, if the mining contractors at affected mines have financial difficulties, or if a dispute arises in renegotiating a contract, or if there is a delay in replacing an existing contractor and its operating equipment to meet business needs at expected cost levels. Increases in contract mining rates, in the absence of associated productivity increases, will also have an adverse impact on the company’s results of operations and financial condition. For example, on 13 October 2012, AngloGold Ashanti terminated the underground development contract with a third-party contractor at the Obuasi mine in Ghana. The costs of the termination amounted to $17 million. On 10 February 2014 workers employed by a contractor at Sadiola and Yatela went on afive-day strike demanding improved redundancy payments. See “—Labour unrest, activism and disruptions could have a material adverse effect on AngloGold Ashanti’s results of operations and financial condition”. Furthermore disagreements over costs with contractors at Siguiri in Guinea and Iduapriem in Ghana resulted in a dispute in 2015.
Contractor disputes can also arise after the termination of the contractual relationship or the sale of the applicable mine. For example, the company is currently involved in arbitration proceedings with contractors in Ghana with regard to its Obuasi mine and in the United States with regard to its former Cripple Creek & Victor mine. See “Item 8A: Legal Proceedings”
In addition, AngloGold Ashanti’s reduced control over those aspects of operations which are the responsibility of contractors, their failure to comply with applicable legal, human rights and regulatory requirements, or their inability to manage their workforce or provide high quality services or a high level of productivity could adversely affect AngloGold Ashanti’s reputation, results of operations and financial condition, and may vary from expectations. The company’s failure to realise the anticipated benefits could result in increased costs, an inabilitythe company’s incurrence of liability to realise production or growth plans, or adversely affect its operational performance.third parties due to the actions of contractors.
The level of AngloGold Ashanti’s indebtedness could adversely impact its business.
As at 31 December 2014,2016, AngloGold Ashanti had gross borrowings of $3.721$2.178 billion (2013: $3.891(2015: $2.737 billion), excluding all finance leases and fair value adjustments on bonds.
AngloGold Ashanti’s indebtedness could have a material adverse effect on its flexibility to conduct business. For example, the company may be required to use a large portion of its cash flow to pay the principal and interest on its debt, which will reduce funds available to finance existing operations and the development of new organic growth opportunities and further acquisitions. In addition, under the terms of the company’s borrowing facilities from its banks, AngloGold Ashanti is obliged to meet certain financial and other covenants. AngloGold Ashanti’s ability to continue to meet these covenants and to service its debt will depend on its future financial performance, which will be affected by its operating performance as well as by financial and other factors, andincluding in particular the gold price, certain of which are beyond its control.
Should the cash flow from operations be insufficient, AngloGold Ashanti could breach its financial and other covenants. Covenant breaches, if interpreted as events of default under one or more debt agreements, could allow lenders to accelerate payment of such debt. Any such acceleration could result in the acceleration of indebtedness under other financial instruments. As a result, the company may be required to refinance all or part of the existing debt, use existing cash balances, issue additional equity or sell assets. However, the company may be unable to sell assets on reasonable or profitable terms as and when necessary. Additionally, AngloGold Ashanti cannot be sure that it will be able to refinance its debt on commercially reasonable terms, if at all. The company’s ability to access the bank, public debt or equity capital markets on an efficient basis may be constrained by dislocation in the credit markets or capital and liquidity constraints in the banking, debt or equity markets at the time of issuance.
Any downgrade of credit ratings assigned to AngloGold Ashanti’s debt securities could increase future interest costs and adversely affect the availability of new financing.
An actual, anticipated or unexpected negative development of AngloGold Ashanti’s results of operations or cash flows, country risk, financial metrics, or an increase in net debt position could result in a deterioration of the compay’scompany’s credit ratings. AngloGold Ashanti’s ratings are influenced inter alia, by the location of its domicile and its operations.
34
FollowingOn 22 January 2016, a rating agency placed the downgraderatings of South Africa’s sovereign debt55 mining companies globally, including AngloGold Ashanti’s, on review for downgrade. This action reflects the agency’s global effort to recalibrate its ratings in the mining sector to align with the continued downside volatility observed in global commodities. The review will consider each mining company’s asset base, cost structure, cash flows and liquidity, as well as management’s strategy for coping with downside price volatility and the ability to execute on the same. While the rating agency affirmed the rating for the company in March 2016 and updated its outlook from negative to stable, there is no assurance that this or other rating agencies will not conduct similar reviews in the future or that the company will not be downgraded as a result of strikes, social tensionsuch further assessments.
A second rating agency downgraded South Africa’s long-term foreign and policy uncertainty inlocal currency rating to‘BBB-’ from ‘BBB’ and to ‘BBB’ from ‘BBB+’, respectively on 4 December 2015. Furthermore, the first agency’s government issuer rating for South Africa AngloGold Ashanti was placed on “credit watch negative” by aaffirmed but the outlook was changed to negative. A third rating agency warned that weak South African economic growth and government bailouts of state-owned companies could lead the country to be downgraded tosub-investment grade. Although the country maintained its investment grade rating in 2016, downgrades may occur in the future. Any downgrade of the government issuer rating for South Africa could have a material adverse impact on 17 October 2012. In July 2013, two ratings agencies loweredAngloGold Ashanti’s creditworthiness and could dampen investors’ interest in the company’s long-term credit rating.securities.
Any further downgrade by ratings agenciesany rating agency could further increase the company’s cost of capital, and reduce theits investor base and negatively and materially affecthave a material adverse effect on AngloGold Ashanti’s business, results of operations and financial condition.
AngloGold Ashanti expects to have significant financing requirements.
AngloGold Ashanti’s existing board-approved development projects and exploration initiatives will require significant funding.
The company’s capital expenditure plans and requirements are subject to a number of risks, contingencies and other factors, some of which are beyond its control, including volatile or sustained lower gold prices, and therefore the actual future capital expenditure and investments may differ significantly from the current planned amounts.
AngloGold Ashanti’s operating cash flow and credit facilities may be insufficient to meet all of these expenditures, depending on the timing and cost of development of these and other projects as well as operating performance and available headroom under its credit facilities. As a result, new sources of capital may be needed to help meet the funding requirements of these developments, to fund ongoing business activities and to pay dividends. AngloGold Ashanti’s ability to further raise and service significant new sources of capital will be a function of macroeconomic conditions, the condition of the financial markets, future gold prices, the company’s operational performance and operating cash flow and debt position, amongst other factors. The company’s ability to raise further debt financing in the future and the cost of such financing will depend on, amongst other factors, its prevailing credit rating, which may be affected by the company’s ability to maintain its outstanding debt and financial ratios at levels acceptable to the credit ratings agencies, its business prospects risks relating to the countries in which it operates or other factors. As a result, in the event of depressed gold prices, unanticipated operating or financial challenges, any dislocation in financial markets or new funding limitations, AngloGold Ashanti’s ability to pursue new business opportunities on reasonable terms, invest in existing and new projects, fund its ongoing business activities, exit projects and retire or service outstanding debt and pay dividends could be significantly constrained, all of which could adversely impact the company’s results of operations and financial condition.
Certain factors may affect AngloGold Ashanti’s ability to support the carrying amount of its property, plant and equipment, intangible assets and goodwill on the balance sheet. If the carrying amount of its assets is not recoverable, AngloGold Ashanti may be required to recognise an impairment charge, which could be significant.
AngloGold Ashanti reviews and tests the carrying amount of its assets when events or changes in circumstances suggest that the carrying amount may not be recoverable. The company values individual mining assets at the lowest level for which cash flows are identifiable and independent of cash flows of other mining assets and liabilities.
If there are indications that impairment may have occurred, AngloGold Ashanti prepares estimates of a recoverable amount for each group of assets. Expected future cash flows are inherently uncertain, and could materially change over time. Recoverable amounts are significantly affected by reserveOre Reserve and production estimates, together with economic factors such as spot and forward gold prices and currency exchange rates, as well as discount rates and estimates of costs to produce reservesOre Reserves and future capital expenditure. Estimated rehabilitation and closure costs could also materially affect the company’s financial performance and could result in the need to recognise an impairment charge.
If any of these uncertainties occur, either alone or in combination, management could be required to recognise an impairment, which could have a material adverse effect on the company’s results of operations and financial condition. For example, during 2013, AngloGold Ashanti reviewed the carrying value of its mining assets (including ore stockpiles), goodwill and intangibles and, based on revised forecast gold prices, the company booked a charge of $3,245 million (2014: $12 million) in relation to impairments.impairments, derecognition and revaluation of net realisable value of its mining assets (including ore stockpiles), goodwill and intangibles.
AngloGold Ashanti is subject to the risk of litigation, the causes and costs of which are not always known.
AngloGold Ashanti is subject to litigation, arbitration and other legal proceedings arising in the normal course of business and may be involved in disputes that may result in litigation. The causes of potential future litigation cannot be known and may arise from, amongst other things, business activities, environmental and health and safety concerns, share price volatility or failure to comply with disclosure obligations. The results of litigation cannot be predicted with certainty but could include costly damage awards or settlements, fines, and the loss of licenses, concessions, or rights, amongst other things.
In the event of a dispute, AngloGold Ashanti may be subject to the exclusive jurisdiction of foreign courts or may not be successful in subjecting foreign persons to the jurisdiction of courts in South Africa.
AngloGold Ashanti is subject to numerous claims, including class actions or similar group claims relating to silicosis and other OLD, and could be subject to similar claims in the future. For further information, see “Item 8A: Legal Proceedings – South Africa – Silicosis litigation”. It is possible that additional class actions and/or individual claims relating to silicosis and/or other
OLD will be filed against AngloGold Ashanti in the future. AngloGold Ashanti will defend all and any subsequent claims as filed on their merits. Should AngloGold Ashanti be unsuccessful in defending any such claims, or in otherwise favourably resolving perceived deficiencies in the national occupational disease compensation framework that were identified in the earlier decision by the Constitutional Court, such matters would have an adverse effect on its financial position, which could be material.
In Colombia, the company is also involved in class action lawsuits in relation to AGAC’s Santa Maria-Montecristo and La Colosa projects. One of these class action lawsuits led to a preliminary injunction suspending the mining concession contracts of the Santa Maria-Montecristo project in September 2011. Additionally, in Colombia, AGAC is involved in an action in the Administrative Superior Court of the Cundinamarca District against the Department of the Environment, Housing and Territorial Development (DoE) following its issuance of a fine against AGAC on the basis that AGAC was in breach of its mining terms of reference. See “Item 8A: Legal Proceedings – Colombia”.
Should the company be unable to resolve disputes favourably or to enforce its rights, this may have a material adverse impact on the company’s financial performance, cash flow and results of operations.
AngloGold Ashanti does not have any gold hedging instruments which exposes it entirely to commodity price decreases.
AngloGold Ashanti removed the last of its gold hedging instruments in October 2010 to provide greater participation in a rising gold price environment. As a result, AngloGold Ashanti no longer has any protection against declines in the market price of gold. The sustained decline in the price of gold experienced from 2011 through 2015 has had an adverse impact on the company’s financial condition and further deterioration could have a material adverse impact on the company’s operating results and its financial condition.
Any acquisition or acquisitions that AngloGold Ashanti may complete may expose the company to new geographic, political, legal, social, operating, financial and geological risks.
AngloGold Ashanti may pursue the acquisition of producing, development and advanced stage exploration properties and companies. Any such acquisition may change the scale of the company’s business and operations and may expose it to new geographic, geological, political, social, operating, financial, legal, regulatory and contractual risks. For example, there may be a significant change in commodity prices after the company has committed to complete the transaction and established the purchase price or share exchange ratio; a material ore body may prove below expectations; AngloGold Ashanti may have difficulty integrating and assimilating the operations and personnel of any acquired companies, realising anticipated synergies and maximising the financial and strategic position of the combined enterprise, and maintaining uniform standards, policies and controls; the integration may disrupt the company’s ongoing business and its relationships with employees, suppliers and contractors; and the acquisition may divert management’s attention from AngloGold Ashanti’sday-to-day business. Furthermore, the company operates and acquires businesses in different countries, with different regulatory and operating cultures, which may exacerbate the risks described above. In addition, the acquired business may have undetected liabilities which may be significant.
In the event that the company chooses to raise debt capital to finance any acquisition, the company’s leverage will be increased. Should the company choose to use equity as consideration for an acquisition, existing shareholders may suffer dilution. Alternatively, the company may choose to finance any acquisition with its existing resources, which could decrease its ability to fund future capital expenditures.
The company may not be successful in overcoming these risks or any other problems encountered in connection with acquisitions. Failure by AngloGold Ashanti to implement its acquisition strategy or to integrate acquired businesses successfully could have material adverse effects on its growth and business results.
Ageing infrastructure at some of AngloGold Ashanti’s operations could adversely impact its business.
Deep level gold mining shafts are usually designed with a lifespan of 25 to 30 years. Vertical shafts consist of large quantities of infrastructure steelwork for guiding conveyances and accommodating services such as high and low tension electric cables, air and water pipe columns. Rising temperatures in the deeper mining areas can also lead to increased cooling requirements in the form of upgraded and expanded ice plants. Maintaining this infrastructure requires skilled human resources, capital allocation, management and planned maintenance. Once a shaft has reached the end of its intended lifespan, higher than normal maintenance and care is required. Incidents resulting in production delays, increased costs or industrial accidents may occur. Such incidents may have an adverse effect on the company’s results of operations and financial condition.
Asset integrity and reliability issues relating to ageing infrastructure are of concern at many operations, but are of particular concern in South Africa and at the Obuasi mine in Ghana. Furthermore in Tanzania, cracks were discovered in the mill feed end in September 2008 and at the discharge end in February 2010 at the Geita gold mine. The Geita gold mine is one of the group’s principal assets and sources of cash flow. After initial repairs, the feed end was replaced during May and June 2011. Production throughput in 2011 was one million tonnes lower than planned, as a result of mill downtime that included feed end replacement. The Geita gold mine produced approximately 531,000 ounces in 2012, with production throughput approximately 100,000 tonnes short of budget. A decision was subsequently taken to replace the entire mill as a result of shell distortion. After new mill manufacture delays, installation was completed during March 2013. Ageing infrastructure may have an adverse effect on the company’s results of operations and financial condition in the future.
Some of AngloGold Ashanti’s technologies are unproven and the failure of such technologies could adversely impact costs and production.
AngloGold Ashanti has created a Technology Innovation Consortium (ATIC) and teamed up with various specialists to engineer new solutions to environmental management, mine design, mining technology and methods and underground logistics, amongst other matters. The company has invested in new technologies, including phyto-technologies to reduce seepage and address soil and groundwater contamination, andin-mine support technologies to minimise the impact of seismic activity. The company is also attempting to develop technologies to access the deeper reaches of its South African mines, including rock boring, different hammer configurations and dimensions for drilling, thermal spalling and an ultra-high strength backfill product and system.
Some aspects of these technologies are unproven and their eventual operational outcome or viability cannot be assessed with certainty. AngloGold Ashanti may be unable to successfully put into operation the technological step changes developed and proposed by ATIC. The costs, productivity and other benefits from these initiatives, and the consequent effects on AngloGold Ashanti’s future earnings and financial condition, may vary from expectations. The company’s failure to realise the anticipated benefits could result in increased costs, an inability to realise production or growth plans, or adversely affect its operational performance.
AngloGold Ashanti does not have full management control over some of its significant joint venture projects and other interests. If the operators of these projects do not manage these effectively and efficiently, the company’s investment in these projects could be adversely affected and its reputation could be harmed.
AngloGold Ashanti’s joint ventures at Morila in Mali and at Kibali in the DRC are managed by the company’s joint venture partner Randgold Resources Limited (“Randgold”)(Randgold). In addition, certain of AngloGold Ashanti’s exploration ventures are managed by the relevant joint venture partner.
35
Whilst AngloGold Ashanti provides strategic management and operational advice to its joint venture partners in respect of these projects, the company cannot ensure that these projects are operated in compliance with the standards that AngloGold Ashanti applies in its other operations. If these joint ventures are not operated effectively or efficiently, including as a result of weaknesses in the policies, procedures and controls implemented by the joint venture partners, the company’s investment in the relevant project could be adversely affected. In addition, negative publicity associated with operations that are ineffective or inefficiently operated, particularly relating to any resulting accidents or environmental incidents, could harm the company’s reputation and therefore its prospects and potentially its financial condition. Furthermore, any failure of joint venture partners to meet their obligations to AngloGold Ashanti or to third parties, or any disputes with respect to the parties’ respective rights and obligations, could have a material adverse impact on AngloGold Ashanti’s results of operations and financial condition. In particular, the company and Randgold retain equal representation, with neither party holding a deciding vote, on the board of the two companies that have overall management control of the Morila project in Mali and the Kibali project in the DRC, respectively, and all major management decisions for each of these two projects, including approval of the budget, require board approval. If a dispute arises between the company and Randgold with respect to the Kibali or Morila project and the parties are unable to amicably resolve such dispute, it may be difficult for the parties to make strategic decisions relating to the project affected by such dispute, theday-to-day operations and the development of such project may be adversely affected and the company may have to participate in proceedings to resolve the dispute, which could adversely affect the company’s results of operations and financial condition.
AngloGold Ashanti’s joint venture partners may have economic or business interests or goals that are not consistent with the company’s or may, as a result of financial or other difficulties, be unable or unwilling to fulfill their obligations under the joint venture or other agreements. Disputes between the company and its joint venture partners may lead to legal action, including litigation between AngloGold Ashanti and its joint venture partners. Such disputes could adversely affect the operation of the joint venture and may prevent the realisation of the joint ventures’ goals. There is no assurance that the company’s joint venture partners will continue their relationship with the company in the future or that the company will be able to achieve its financial or strategic objectives relating to the joint ventures.
AngloGold Ashanti’s mineral deposits, Mineral Reserve, and mining operations are located in countries where political, tax and economic laws and policies may change rapidly and unpredictably and such changes and policies may adversely affect both the terms of its mining concessions, as well as its ability to conduct operations in certain countries.
Past experience demonstrates that political, tax and economic laws and policies in countries in which AngloGold Ashanti operates can change rapidly. Examples include the coup d’état and subsequent fighting in Mali and the recent changes to the foreign currency regulations in Argentina. As mining assets are fixed, the adverse impacts of such changes may be unavoidable and immediate.
Any existing and new mining, exploration operations and projects that the company carries out are subject to various national and local laws, policies and regulations governing the ownership, prospecting, development and mining of mineral reserves, taxation and royalties, exchange controls, import and export duties and restrictions, investment approvals, employee and social community relations and other matters.
In many of the countries in which AngloGold Ashanti operates, there is an ongoing focus by governments seeking greater economic benefit and increased financial and social benefits from extractive industries and mining in particular. This entails the review of mining codes and stability agreements, which were in many cases designed under particular economic conditions, and the formulation or amendment of laws, policies and regulations relating to issues such as mineral rights and asset ownership, royalties, taxation and taxation disputes, “windfall” or “super” taxation, non-recovery of taxation refunds, import and export duties, currency transfers, restrictions on foreign currency holdings and repatriation of earnings. The laws, policies and regulations are increasingly uncertain, changing and generally require progressively higher payments to governments, notably in the form of increased royalties and taxes, mandated beneficiation, export levies and increasing or retaining state or national ownership of resources. In particular, changes to the fiscal terms governing AngloGold Ashanti’s operations may have a material adverse impact on the company’s results of operations or financial condition, threaten the viability of existing operations, and discourage future investments in certain jurisdictions. This may therefore have an adverse impact on the company’s ability to access new assets and potentially reduce future growth opportunities.
For example, on 9 September 2011, a new mining code for Guinea was enacted. The new mining code significantly increased the share of state ownership in the mining industry, extending a 15% share of future mining projects to the government, without financial compensation. The government also had the option to purchase up to an additional 20% of each project. However, the new mining code was suspended in October 2012 due to unfavourable reception. On 8 April 2013, the Guinean parliament voted to amend the 2011 Mining Code. The amendment was promulgated shortly after by Presidential Decree on 17 April 2013. The new legislation provides that existing mining conventions will be amended through addenda which will contain various provisions, including provisions relating to taxation, state equity participation in mining companies and other matters.
36
The government of Ghana amended its fiscal mining regime, increasing its corporate taxation to 35% and royalty rates of 5%. Furthermore, the government of Ghana has constituted a review committee to review and re-negotiate stability agreements with mining companies. AngloGold Ashanti is currently participating in negotiations with the Ghanaian review committee. The outcome of these negotiations may have a material adverse effect on the company’s results of operations or financial condition.
AngloGold Ashanti and other major mining companies are in talks with the Tanzanian government regarding new mining legislation and its impact on existing mining agreements. Such talks follow an earlier declaration in July 2012 by the Tanzanian Minister of Energy and Minerals that the mining contracts were under review. The new mining legislation and the outcome of the review of the mining contracts may have a material adverse impact on the company’s results of operations and financial condition. Recently, the Tanzanian Minister of Energy and Minerals increased the royalty rate levied on gold extracted in Tanzania by AngloGold Ashanti’s operations by 1% and this has a direct impact on the revenues earned from the operations in Tanzania. Proposed Tanzanian regulations set out the requirement to sell shares to nationals by way of a public offering and listing on the Dar es Salaam Stock Exchange that may apply to companies that carry out large scale mining operations.
In 2012, the DRC Mines Minister announced a reform of the DRC’s mining code. According to recent available data, the proposed laws seek to, amongst other things, increase the government stake in mining operations to 15% from the existing 5%, substantially increase royalties on some minerals, reduce in a significant way the protections AngloGold Ashanti currently enjoys on its projects in the DRC, impose new conditions on the company’s ability to retain and renew licences and introduce a 50% levy on certain profits. Should such laws be enacted in the future, these may have a material adverse impact on the company’s results of operations in the DRC.
On 1 July 2012, Australia’s Minerals Resource Rent Tax (“MRRT”) came into effect after the legislation was passed in March 2012. The MRRT applies only to the bulk commodities of coal and iron ore, and replaced the previously proposed Resource Super Profit Tax (“RSPT”), which covered all minerals. The Australian federal government did not include gold and uranium in the final MRRT. However, should Australia consider reintroducing the RSPT, or if similar “super profit” taxes were to be introduced and implemented in any other country in which AngloGold Ashanti operates, the company’s results of operations and financial condition could be materially adversely affected.
In addition, some of AngloGold Ashanti’s mineral deposits and mining and exploration operations are located in countries that are experiencing social and political instability as well as economic uncertainty. For example, in South Africa, country risk has increased in light of the violent strike action, social unrest and protest. The risk of contagion from the tense industrial relations environment in the platinum sector remains, despite the government’s efforts. The high levels of unemployment, poverty and inequality remain, further increasing the risk of social instability that will continue to negatively impact the South African economy, business and the mining industry.
In December 2012, though the ruling African National Congress rejected the concept of wholesale nationalisation, a “resource rent” tax on windfall profits has been discussed, and it is uncertain whether such a tax will become law. The MPRDA Amendment Bill of 2013, passed by the National Assembly of Parliament of the Republic of South Africa on 12 March 2014 (and referred back to the National Assembly by the President on 16 January 2015), could impact AngloGold Ashanti’s business by empowering the Minister of Mineral Resources to set developmental pricing conditions for certain minerals for beneficiation purposes, impose export permits on designated minerals and give the State an open-ended free carried interest and State participation.
In June 2013, the Brazilian government announced increased royalties of up to 4% and changes to exploration rights.
Mining is a long term activity and assets may be located in jurisdictions with elevated risk. Political instability and the resulting unstable business environment in such countries in which companies operate may discourage future investment in those jurisdictions, and may have an adverse impact on the company’s ability to access new assets, potentially reducing growth opportunities.
AngloGold Ashanti is subject to an uncertain tax environment. Increased taxes are expected in most countries of operation. Changes in tax laws could result in higher tax expense and payments. Furthermore, legislation changes could materially impact AngloGold Ashanti’s tax receivables and liabilities as well as deferred tax assets and deferred tax liabilities. In addition, the uncertain tax environment in some regions could limit AngloGold Ashanti’s ability to enforce its rights. As a global company, AngloGold Ashanti conducts its business in countries subject to complex tax rules, which may be interpreted in different ways. Further interpretations or developments of tax regimes may affect the company’s tax liability, return on investments and business operations. AngloGold Ashanti is regularly examined by tax authorities in the various jurisdictions of operation.
37
In Guinea, Mali and Tanzania, AngloGold Ashanti is due refunds of input tax and fuel duties which have remained outstanding for periods longer than those provided for in the respective statutes. For example, AngloGold Ashanti calculates that overdue recoverable value added tax, fuel duties and appeal deposits of $71 million are owed to AngloGold Ashanti and held by the Tanzanian government and it is not certain when AngloGold Ashanti will be refunded this amount, if at all.
The countries in which the company operates may also introduce strict exchange controls, impose restrictions to source materials and services locally, or impose other similar restrictions that hinder foreign companies’ operations within such countries. For example, the Argentine government introduced stricter exchange controls and related protracted approval processes, which may limit the company’s ability to repatriate dividends from its Argentine subsidiaries. In October 2011, the Argentina government decreed that mining, oil and energy companies must repatriate export earnings. Additionally, the purchase of U.S. dollars requires authorisation from the Argentine tax agency and the purpose for which the currency will be used must be stated. In May 2012, the Argentine Mining Secretariat issued new regulations requiring mining companies in Argentina to boost their domestic purchases of equipment and services. Mining companies are now required to resort exclusively to locally established suppliers for their export-related shipping and logistics operations. A separate norm requires companies to open an import substitution division which will be in charge of submitting procurement plans to the Mining Secretariat on a quarterly basis. Such requirements are hindering the company’s operations within Argentina and these or similar requirements may continue to do so in the future and may have a material adverse effect on AngloGold Ashanti’s results of operations and financial condition.
If, in one or more of the countries in which it operates, AngloGold Ashanti were not able to obtain or maintain necessary permits, authorisations or agreements to implement planned projects or continue its operations under conditions or within timeframes that make such plans and operations economically viable, or if the applicable legal, ownership, fiscal (including all royalties and duties), exchange control, employment, environmental and social laws or regimes change materially, or if the governing political authorities change resulting in amendments to such laws and regimes, this could have a material adverse effect on AngloGold Ashanti’s operating results, financial condition, and, in extreme situations, on the viability of an operation.
For example, in South Africa mining rights are linked to meeting various obligations that include the Revised Charter. Compliance with the Revised Charter is measured using a designated scorecard relating to equity ownership and management control of mining companies by historically disadvantaged South Africans (“HDSAs”) by no later than the end of 2014 and HDSAs must constitute 40% of all levels of management by 2014. In 2013, AngloGold Ashanti achieved all Mining Charter targets with the exception of senior management (33% versus the target of 40%) and in the procurement services area (57% versus the target of 60%).
Whilst AngloGold Ashanti believes that it is compliant with ownership targets that had to be achieved by the end of 2014, it has not yet received its scorecard from the government assessing its compliance with applicable requirements and it may need to make further progress to achieve future targets, including further participation by HDSAs in senior and top management levels, the upgrade of housing and accommodation at the company’s mines, further human resource development, mine community development, sustainable development and growth as well as procurement and enterprise development.
The company will incur expenses in giving further effect to the Revised Charter and the scorecard. AngloGold Ashanti may not meet all of the various requirements by the required dates. Additionally, the South African government may decide that the Mining Charter has not gone far enough to achieve its underlying goals and therefore decide to expand the obligations of mining companies thereunder and the Minister of Mineral Resources may opt to disregard certain historical BEE transactions in connection with its review of new mining rights applications. In March 2015, the Minister of Mineral Resources announced that the Department of Mineral Resources and the Chamber of Mines of South Africa had jointly agreed to submit certain matters relating to the interpretation of the Revised Charter, including the qualification of certain historical BEE transactions for meeting the HDSA ownership thresholds, to the courts in South Africa for determination and clarification. Should AngloGold Ashanti breach its obligations in complying with the MPRDA, Revised Charter or any future amendments to the Mining Charter, its mining rights in South Africa could be suspended or cancelled by the Minister of Mineral Resources and it may be unable to obtain any new mining rights. Any such suspension or cancellation could have a material adverse effect on AngloGold Ashanti’s results of operations and financial condition.
AngloGold Ashanti’s Mineral Reserve, deposits and mining operations are located in countries that face instability and security risks that may adversely affect both the terms of its mining concessions, as well as its ability to conduct operations in certain countries.
Some of AngloGold Ashanti’s mineral deposits and mining and exploration operations are located in countries that are experiencing political instability and economic and other uncertainty.
Certain of the countries in which AngloGold Ashanti has mineral deposits or mining or exploration operations, including the DRC, Mali, Guinea and Colombia, have in the past experienced, and in certain cases continue to experience, a difficult security environment. In particular, various illegal groups active in regions in which the company is present may pose a credible threat of military repression, terrorism, civil unrest and disturbances, sabotage, extortion and kidnapping, which could have an adverse effect on its operations in these and other regions.
38
For example, Mali continues to experience a difficult security environment since the military coup in March 2012. The situation in Mali remains of heightened concern as a result of the instability in northern Mali.
Eastern DRC also continues to experience tension consistent with the cycles of unrest experienced since the late 2000s. Fighting has caused instability in the area and could expand or intensify.
In 2012, and for the first time in approximately seven years, Anglo Gold Ashanti Colombia’s (“AGAC”) assets and employees were the targets of direct attacks by hostile actors around the La Colosa project’s area of influence. These and other such attacks could adversely affect the company’s operations in Colombia.
Since 2009, the company has recorded an almost four-fold increase in the instances of injury to security personnel, including members of AngloGold Ashanti’s internal security, private security companies and public security forces in certain jurisdictions. The rise in the number and severity of security incidents has come as a result of both increased illegal and artisanal mining due to a steady migration of people into the areas and an increase in the level of organisation and funding of criminal activity around some of the company’s Continental African operations. This trend has stabilised, but in 2013 and 2014, intrusions onto the company’s tenement and operational areas resulted in a marked increase in crime, specifically illegal mining-related activities. The most significant security challenges remain in Tanzania and Ghana, in areas where there is endemic poverty and high levels of unemployment. If the security environment surrounding the company’s operations that are most exposed to these challenges deteriorates, employee, third-party and community member injuries and fatalities could also increase. Any such increase could disrupt the company’s operations in certain mines and adversely affect its reputation, results of operations and financial condition.
In some instances, risk assessments categorise threats as serious enough to require resorting to public security forces, such as national police or military units on a near-permanent basis. In the event that continued operations in any of the company’s countries of operations compromise the company’s security or business principles, AngloGold Ashanti may withdraw from any such countries on a temporary or permanent basis. This could have a material adverse impact on AngloGold Ashanti’s results of operations and financial condition.
Furthermore, the company continues to experience strained relationships with certain of its host communities. AngloGold Ashanti operates in several regions where poverty, unemployment and the lack of access to alternative livelihoods mean that the creation and distribution of economic benefit from mining operations is a significant area of focus for community and government. During 2013 there were a total of 21 community opposition incidents that were of minor or moderate consequence, mostly at the company’s exploration projects, particularly at Mongbwalu and in Colombia. There were five protests during 2013 at Cerro Vanguardia, Obuasi, Siguiri and Iduapriem.
In addition, infectious diseases are also a threat to the stability of some of the countries in which the company operates, where limited local health infrastructure weakens governments’ ability to manage and contain outbreaks effectively. For example, during August 2014, cases of Ebola virus disease (“EVD”) were reported in Siguiri, Guinea, which is located near AngloGold Ashanti’s Siguiri mine. EVD was also reported elsewhere in Guinea. The company has implemented certain restrictions on travel to and from the Siguiri mine as a precaution. As EVD caused significant disruptions in the company’s exploration activities, particularly relating to field mapping and geophysics, AngloGold Ashanti also suspended its brownfields work programme and greenfields field work in the middle of 2014. In the future the company may consider further safety measures which may negatively impact the operations at the Siguiri mine or its exploration projects in neighbouring areas.
Illegal and artisanal mining occurs on AngloGold Ashanti’s properties, which can disrupt the company’s business and expose the company to liability.
Illegal and artisanal miners are active on, or adjacent to at least 15 AngloGold Ashanti’s properties, which leads at times to interference with the company’s operations and results in conflict situations that present a security threat to property and human life. Artisanal mining is associated with a number of negative impacts, including environmental degradation, flouting of land rights, poor working practices, erosion of civil society, human rights abuse and funding of conflict. The environmental, social, safety and health impacts of artisanal mining are frequently attributed to formal mining activity, and it is often assumed that artisanally-mined gold is channelled through large-scale mining operators, even though artisanal and large-scale miners have distinct supply chains. These misconceptions impact negatively on the reputation of the industry.
The activities of the illegal miners, which include theft and shrinkage, could cause damage to AngloGold Ashanti’s properties, including pollution, underground fires, or personal injury or death, for which AngloGold Ashanti could potentially be held responsible. Illegal mining could result in the depletion of mineral deposits, potentially making the future mining of such deposits uneconomic. The presence of illegal miners could lead to project delays and disputes regarding the development or
39
operation of commercial gold deposits. Furthermore, in 2012, the company recorded an increase in the number and severity of security incidents, due to a steady migration of people into the areas and an increase in the level of organisation and funding of criminal activity around some of the company’s Continental African operations, likely encouraged by an escalating gold price at that time. The most significant security challenges have occurred in Tanzania and Ghana in areas where there is endemic poverty and high levels of unemployment. Illegal mining and theft could also result in lost gold reserves, mine stoppages, and have a material adverse effect on AngloGold Ashanti’s results of operations or financial condition.
The use of contractors at certain of the company’s operations may expose AngloGold Ashanti to delays or suspensions in mining activities and increases in mining costs.
AngloGold Ashanti uses contractors at certain of its operations to mine and deliver ore to processing plants as well as for other purposes. At mines employing mining contractors, contracting costs represent a significant proportion of the total operating costs of these operations and the company does not own all of the mining equipment. For example, increased contractor rates at the Sadiola mine in Mali contributed to a significant rise in total cash costs in the final quarter of 2011. Increased contractor costs at Sunrise Dam in Australia and Geita in Tanzania contributed to higher production costs in the first quarter of 2012. Furthermore disagreements over costs with contractors at Siguiri in Guinea and Iduapriem in Ghana resulted in a dispute in 2015.
AngloGold Ashanti’s operations could be disrupted, resulting in additional costs and liabilities, if the mining contractors at affected mines have financial difficulties, or if a dispute arises in renegotiating a contract, or if there is a delay in replacing an existing contractor and its operating equipment to meet business needs at expected cost levels. Increases in contract mining rates, in the absence of associated productivity increases, will also have an adverse impact on the company’s results of operations and financial condition. For example, on 13 October 2012, AngloGold Ashanti terminated the underground development contract with a third-party contractor at the Obuasi mine in Ghana. The costs of the termination amounted to $17 million. On 10 February 2014 workers employed by a contractor at Sadiola and Yatela went on a five day strike demanding improved redundancy payments. See “ – Labour unrest, activism and disruptions could have a material adverse effect on AngloGold Ashanti’s results of operations and financial condition”.
In addition, AngloGold Ashanti’s reduced control over those aspects of operations which are the responsibility of contractors, their failure to comply with applicable legal, human rights and regulatory requirements, or their inability to manage their workforce or provide high quality services or a high level of productivity could adversely affect AngloGold Ashanti’s reputation, results of operations and financial condition, and may result in the company’s incurrence of liability to third parties due to the actions of contractors.
AngloGold Ashanti competes with mining and other companies for key human resources with critical skills and its inability to retain key personnel could have an adverse effect on its business.
AngloGold Ashanti competes on a global basis with mining and other companies to attract and retain key human resources at all levels with the appropriate technical skills and operating and managerial experience necessary to operate and supervise its business. This is exacerbated by the global shortage of persons with critical mining skills, including geologists, mining engineers, metallurgists and skilled artisans. Furthermore, the often remote locations of mining operations may make the mining industry unattractive to potential employees. Changes in taxation and the regulatory environment where AngloGold Ashanti operates may also impact the company’s ability to attract and retain key personnel, especially those from abroad.
The retention of staff is particularly challenging in South Africa, where, in addition to the impacts of global industry shortages of skilled labour, AngloGold Ashanti is required to achieve employment equity targets of participation by HDSAs in management and other positions. AngloGold Ashanti competes with all companies in South Africa to attract and retain a small but growing pool of HDSAs with the necessary skills and experience. AngloGold Ashanti has historically faced difficulty recruiting and retaining young graduates and qualified mid-level management in South Africa. Recruitment of skilled personnel has been challenging in Continental Africa due to university offerings that are often not well-suited to the specific needs of the mining industry, as well as other factors such as language barriers and low literacy skills.
The recruitment of skilled workers is also highly competitive in South America as a result of a shortage of skills and intense competition between mining companies.
Additionally, the company may incur significant costs to build talent, capacity and expertise across its global operations. Despite AngloGold Ashanti’s investments, the company may not be able to retain and attract sufficient skilled and experienced employees in all areas of the business. Should it fail to do so or lose any of its key personnel with critical skills, business and growth prospects may be harmed and this could have an adverse impact on AngloGold Ashanti’s results of operations and financial condition.
40
AngloGold Ashanti’s inability to retain its senior management may have an adverse effect on its business.
The company’s success depends largely upon the continued service of its senior management, including its chief executive officer, chief financial officer, the executive officers at each of its business divisions and general managers at its mines.
The loss of one or more members of the senior management teams, coupled with the reduced attractiveness of the gold mining sector, could lead to other members of the management team leaving, disrupt the company’s operations, and have a material adverse impact on the company’s business, results of operations and financial condition.
The prevalence of occupational health diseases and other diseases and the potential costs and liabilities related thereto may have an adverse effect on the business and results of operations of AngloGold Ashanti.
The primary areas of focus in respect of occupational health of employees within the company’s operations are noise-induced hearing loss and occupational lung diseases (“OLD”)(OLD), which include pulmonary diseases such as tuberculosis from various causes and silicosis in individuals exposed to silica dust. These require active dust management strategies in underground operations, particularly in South Africa where a significant number of silicosis cases by current and former employees alleging past exposures are still reported each year to the board for statutory compensation. AngloGold Ashanti provides occupational health services to its employees at its occupational health centres and clinics and continues to improveruns preventative occupational hygiene initiatives, such as implementing various dust control measures and supplying the company’s employees with respiratory protection equipment. If the costs associated with providing such occupational health services, implementing such dust control measures or supplying such equipment increase significantly beyond anticipated or budgeted amounts, this could have an adverse effect on AngloGold Ashanti’s results of operations and financial condition. Actual and alleged health and safety incidents or breaches of standards may also adversely impact the company’s reputation.
AngloGold Ashanti is currently subject to numerous claims, including class action litigation, with respect to alleged occupational lung diseases (see “—AngloGold Ashanti is subject to the risk of litigation, the causes and costs of which are not always known”). AngloGold AshantAshanti is working with the industry to engage with government (and other stakeholders) to seek an appropriate industry-wide solution. An industry-wide solution may not be reached or the terms thereofof any such solution may have a material adverse effect on AngloGold Ashanti’s financial condition. See “Item 8A: Legal Proceedings” and “Item 18: Note 3631 – Contractual Commitments and Contingencies”.
In response to the effects of silicosis in labour-sending communities, a number of mining companies (under the auspices of the Chamber of Mines of South Africa) together with the NUM, which is the largest union in the mining sector in South Africa, and the national and regional departments of health, have embarked on a project to assist in delivering compensation and relief by mining companies under the Occupational Diseases in Mines and Works Act (“ODMWA”)(ODMWA) to affected communities.
AngloGold Ashanti also faces certain risks in dealing with HIV/AIDS, particularly at its South African operations, and with tropical disease outbreaks such as malaria, and other diseases which may have an adverse effect on the company’s results of operations and financial condition. AIDS and associated diseases remain one of the major health care challenges faced by AngloGold Ashanti’s South African operations. Workforce prevalence studies indicate that HIV prevalence rates amongst AngloGold Ashanti’s South African workforce may be as high as 30%.30 percent.
Malaria and other tropical diseases pose significant health risks at all of the company’s operations in central, west and east Africa where such diseases may assume epidemic proportions because of ineffective national control programmes. Malaria is a major cause of death in young children and pregnant women but also gives rise to fatalities and absenteeism in adult men. Other conditions such as heart disease, chronic diseases and obesity are of increasing incidence and concern.
Such diseases impair the health of workers and negatively affect productivity and profitability as a result of workers’ diminished focus or skill, absenteeism, treatment costs and allocated resources. Any current or future medical programme may not be successful in preventing or reducing the infection rate amongst AngloGold Ashanti’s employees or in affecting consequent illness or mortality rates. AngloGold Ashanti may incur significant costs in addressing this issuethese issues in the future, which could also adversely impact the company’s results of operations and financial condition.
The costs and impacts associated with the pumping of water inflows from closed mines adjacent to the company’s operations could have an adverse effect on its results of operations.
Certain of AngloGold Ashanti’s mining operations are located adjacent to the mining operations of other mining companies. The closure of a mining operation may have an impact upon continued operations at the adjacent mine if appropriate preventative steps are not taken. In particular, this can includetaken, including the ingress of underground water when pumping operations at the adjacent closed mine are suspended. Such ingress could have an adverse effect on any one of the company’s mining operations as a result of property damage, disruption to operations, additional pollution liabilities and pumping costs and, consequently, could have an adverse impact on its results of operations and financial condition.
41
Some of the mining operations adjacent to AngloGold Ashanti’s operations in South Africa have been closed. For example, in May 2013, Village Main Reef (“VMR”)(VMR) announced its intention to wind down its Buffels (Hartebeesfontein and Buffelsfontein) operations adjacent to AngloGold Ashanti’s Vaal River operations, effectively transitioning their operations to closure. After VMR has ceased pumping of underground water at its Buffelsfontein and Hartebeesfontein operations, but AngloGold Ashanti is preparing and implementing plans to manage the underground water when it reaches the company’s operations in several months’ time. The company has not released VMR from any environmental obligations as relates to such water infiltration, however, and it intends to enforce any rights that it has against VMR and Buffelsfontein, including under the directive issued by the Department of Water Affairs in 2005.
AngloGold Ashanti prepared plans to manage underground water that it anticipated would eventually reach its operations. The infrastructure to pump this water out from underground was completed in December 2015, with an accelerated project plan. Water entered Great Noligwa on 23 January 2016. The water is currently being used by the process plants as water inventories are low as a result of the recent drought. |
In the West Wits district, Blyvooruitzicht Gold Mining Company was placed in provisional liquidation in August 2013. AngloGold Ashanti has secured a court order for access rights to Blyvoor 4 and 6 shafts to keep pumping going. AngloGold Ashanti has also incorporated Covalent Water Company, which has purchased rights of access, electricity etc. to the 4 and 6 shafts as well as the relevant infrastructure, to continue pumping underground water. This has reduced the risk of flooding at the company’s West Wits Operations, but the company can provide no assurance that the risk of flooding will not materialise,occur, which could have an adverse impact on its results of operations and financial condition.
The potential costs associated with the remediation and prevention of groundwater contamination from the company’s operations or due to flooding from closed mines adjacent to the company’s operations could have a material adverse effect on AngloGold Ashanti’s results of operations and financial condition.
AngloGold Ashanti has identified groundwater contamination plumes at certain of its operations that have occurred primarily as a result of seepage from surface operations and facilities, including tailings storage facilities and waste rock piles.
Deep groundwater contamination is a significant issue in South Africa, where groundwater in some older mining regions has infiltratedmined-out workings. Potential contamination risk to shallow ground and surface water resources can occur when water is exposed to sulphide-bearing rock in such situations. AngloGold Ashanti has identified a flooding and future pollution risk posed by deep groundwater in the Klerksdorp and Far West Rand goldfields. AngloGold Ashanti’s Vaal River operations are part of the Klerksdorp goldfields and its West Wits operations are part of the Far West Rand goldfields. As a result of the interconnected nature of underground mining operations in South Africa, any proposed solution needs to be a combined one supported by all the companies owning mines located in these goldfields.
In view of the limitation of current information for the accurate estimation of liabilities, no reliable estimate can be made for these obligations. The potential costs of remediation and prevention of groundwater contamination at AngloGold Ashanti’s operations could be significant and may have a material adverse impact on AngloGold Ashanti’s results of operations and financial condition.
The occurrence of events for which AngloGold Ashanti is not insured or for which its insurance is inadequate may adversely affect cash flows and overall profitability.
AngloGold Ashanti maintains insurance to protect only against catastrophic events which could have a significant adverse effect on its operations and profitability. This insurance is maintained in amounts that the company believes to be reasonable depending upon the circumstances surrounding each identified risk. However, damage and third-party claims arising from catastrophic events may exceed the limit of liability oncovered under these insurance policies the company has in place.policies. Furthermore, AngloGold Ashanti’s insurance does not cover all potential risks associated with its business and may exclude certain parts of its business. AngloGold Ashanti may elect not to insure certain risks due to the high premiums or for various other reasons, including an assessment that the risks are remote.
The companyIn order to mitigate the cost of its insurance program, AngloGold Ashanti may not be able to obtain insurance coverage at acceptable premiums. The company believes negotiations with insurance providers have become more difficult forin some instances retain a number of reasons, including prevailing macroeconomic conditions and the risk profileportion of the mining industry. financial loss associated with an insurable event. These financial losses could be significant and have an adverse effect on its financial condition.
Insurance for certain risks in particular, such as loss of title to mineral property, political risks in certain jurisdictions, environmental pollution, or other hazards resulting from exploration and production, is not generally available to mining companies on acceptable terms. The availability and cost of insurance coverage can vary considerably from year to year as a result of events beyond the company’s control or from claims, and thisas a result of previous claims. This can result in higher premiums and periodically being unable to maintain the levels or types of insurance the company typically carries.
The failure to obtain adequate insurance could impair the company’s ability to continue to operate in the normal course or could result in the occurrence of events for which AngloGold Ashanti is not insured, either of whichits business. This could adversely impact its cash flows, results of operations and financial condition.
42
AngloGold Ashanti is subject to the risk of litigation, the causes and costs of which are not always known.
AngloGold Ashanti is subject to litigation, arbitration and other legal proceedings arising in the normal course of business and may be involved in disputes that may result in litigation. The causes of potential future litigation cannot be known and may arise from, amongst other things, business activities, environmental and health and safety concerns, share price volatility or failure to comply with disclosure obligations. The results of litigation cannot be predicted with certainty but could include costly damage awards or settlements, fines, and the loss of licenses, concessions, or rights, amongst other things.
In the event of a dispute, AngloGold Ashanti may be subject to the exclusive jurisdiction of foreign courts or may not be successful in subjecting foreign persons to the jurisdiction of courts in South Africa or the United States.
AngloGold Ashanti is subject to numerous claims, including class actions or similar group claims relating to silicosis and other OLD, and could be subject to similar claims in the future.
AngloGold Ashanti has received notice of two applications for class certification relating to silicosis in which the company is a respondent. It has also received a significant number of notices of individual claims. For further information, please refer to “Item 8A: Legal Proceedings – South Africa – Silicosis litigation”. It is possible that additional class actions and/or individual claims relating to silicosis and/or other OLD will be filed against AngloGold Ashanti in the future. AngloGold Ashanti will defend all and any subsequent claims as filed on their merits. AngloGold Ashanti cannot predict whether or when more individual claims will be filed in the future or whether the classes described above or other classes will be certified. Should any such claims result in an adverse outcome for AngloGold Ashanti, or if AngloGold Ashanti is unsuccessful in otherwise favourably resolving perceived deficiencies in the national occupational disease compensation framework that were identified in an earlier decision by the Constitutional Court of South Africa, such matters would have an adverse effect on its financial position, which could be material.
In Colombia, the company is also involved in class action lawsuits in relation to AGAC Santa Maria-Montecristo and La Colosa projects. One of these class action lawsuits led to a preliminary injunction suspending the mining concession contracts of the Santa Maria-Montecristo project in September 2011. Additionally, in Colombia, AGAC is involved in an action in the Administrative Superior Court of the Cundinamarca District against the Department of the Environment, Housing and Territorial Development (“DoE”) following its issuance of a fine against AGAC on the basis that AGAC was in breach of its mining terms of reference. Please see “Item 8A: Legal Proceedings – Colombia”.
Should the company be unable to resolve disputes favourably or to enforce its rights, this may have a material adverse impact on the company’s financial performance, cash flow and results of operations.
The implementation of an integrated Enterprise Resource Planning (“ERP”)(ERP) system could have an adverse effect on AngloGold Ashanti’s results of operations and financial condition.
AngloGold Ashanti continues to implement a single, global ERP system to support all the operations that it manages. The implementation and operationalisation of an ERP system on a global basis is an inherently a high riskhigh-risk initiative due to the potential for implementation cost and time overruns. In addition, suchif AngloGold Ashanti experiences difficulties with the implementation could affect AngloGold Ashanti’sand operation of the system, the company’s ability to report and manage technical and financial information if difficulties in the implementation and operation of the system are experienced,could be compromised, which could have an adverse effect on the company’s results of operations and financial condition.
Any similar future problems with the implementation, operation or maintenance of the ERP system could have an adverse effect on the company’s financial condition.
Sales of large quantities of AngloGold Ashanti’s ordinary shares and American Depository Shares (ADSs), and the perception that these sales may occur or other dilution of the company’s equity, could adversely affect the prevailing market price of the company’s securities.
The bulk of AngloGold Ashanti’s shares are held by a relatively small number of investors. According to information available to the company, AngloGold Ashanti’s fourfive largest shareholders beneficially owned 29.30%30.20 percent and the top 10 largest beneficially owned 48.35%42.33 percent of AngloGold Ashanti’s ordinary shares as at 31 December 2014.2016.
Poor returns, soaring costs, higher capital expenditure,ill-conceived corporate activity, rising geopolitical and labour risk, a material decrease in the price of gold and low dividend yields over the past few yearsfrom 2011 through 2015 have resulted in a change in market sentiment towards gold equities. The market price of the company’s securities could fall if large quantities of ordinary shares or ADSs are sold in the public market, if there is divestment by certain types or groupings of investors, or if there is the perception in the marketplace that such sales could occur. Subject to applicable securities laws, holders of the company’s ordinary shares or ADSs may decide to sell them at any time.
The market price of the company’s ordinary shares or ADSs could also fall as a result of any future offerings AngloGold
43
Ashanti makes of its ordinary shares, ADSs, or securities exchangeable or exercisable for the company’s ordinary shares or ADSs, or the perception in the marketplace that these offerings might occur. AngloGold Ashanti may make such offerings, including offerings of additional ADS rights, share rights or similar securities, at any time or from time to time in the future.
Fluctuations in the exchange rate of currencies may reduce the market value of AngloGold Ashanti’s securities, as well as the market value of any dividends or distributions paid by the company.
AngloGold Ashanti has historically declared all dividends in South African rands. As a result, exchange rate movements may have affected and may continue to affect the Australian dollar, the British pound, the Ghanaian cedi and the U.S. dollar value of these dividends, as well as of any other distributions paid by the relevant depositary to investors that holdholders of the company’s securities. This may reduce the value of these securities to investors.
Furthermore, AngloGold Ashanti’s Memorandum of Incorporation allows for dividends and distributions to be declared in any currency at the discretion of the board of directors or the company’s shareholders at a general meeting. If, and to the extent that, AngloGold Ashanti opts to declare dividends and distributions in U.S. dollars, exchange rate movements will not affect the U.S. dollar value of any dividends or distributions. Nevertheless, the value of any dividend or distribution in Australian dollars, Ghanaian cedis or South African rands will continue to be affected. If and to the extent that dividends and distributions are declared in South African rands in the future, exchange rate movements will continue to affect the Australian dollar, Ghanaian cedi and U.S. dollar value of these dividends and distributions. Furthermore,This may reduce the value of the company’s securities to investors. Additionally, the market value of AngloGold Ashanti’s securities as expressed in Australian dollars, Ghanaian cedis, U.S. dollars and South African rands will continue to fluctuate in part as a result of foreign exchange fluctuations.
AngloGold Ashanti may not pay dividends or make similar payments to shareholders in the future.
AngloGold Ashanti pays cash dividends only if there are sufficient funds available for that purpose. Fund availability depends upon many factors, that includeincluding the amount of cash available, in relation totaking into account AngloGold Ashanti’s capital expenditure on existing infrastructure and exploration and other projects.
Under Additionally, under South African law, a company is entitled to pay a dividend or similar payment to its shareholders only if the company meets the solvency and liquidity tests set out in legislation and the company’s founding documents.
Given these factors, including the capital and investment needs of AngloGold Ashanti, and the board of directors’ discretion to declare a dividend that includes(including the amount and timing thereof,thereof), cash dividends may not be paid in the future.
U.S. securities laws do not require AngloGold Ashanti to disclose as much information to investors as a U.S. issuer is required to disclose, and investors may receive less information about the company than they might otherwise receive from a comparable U.S. company.
44AngloGold Ashanti is subject to the periodic reporting requirements of the SEC and the New York Stock Exchange that apply to “foreign private issuers”. The periodic disclosure required of foreign private issuers under applicable rules is more limited than the periodic disclosure required of U.S. issuers. For example, on 22 February 2016, AngloGold Ashanti announced that it would no longer voluntarily publish reviewed financial statements and analyses of operating and financial results for the quarters ended 31 March and 30 September each year. As a result of this transition to half-yearly reporting, investors will receive less information about AngloGold Ashanti than they have in previous years. They will also receive less timely financial reports than they otherwise might receive from a comparable U.S. company or from certain of the company’s peers in the industry. This may have an adverse impact on investors’ ability to make decisions about their investment in AngloGold Ashanti.
ITEM 4: INFORMATION ON THE COMPANY
| 4A. | HISTORY AND DEVELOPMENT OF THE COMPANY |
GROUP INFORMATION
AngloGold Limited was formed in June 1998 with the consolidation of the gold mining interests of Anglo American plc. AngloGold Ashanti Limited, as the company exists today, was formed on 26 April 2004 following the business combination between AngloGold and Ashanti Goldfields Company Limited.
CURRENT PROFILE
AngloGold Ashanti Limited is headquartered in Johannesburg, South Africa. The company (Registration number 1944/017354/06) was incorporated in the Republic of South Africa in 1944 under the name of Vaal Reefs Exploration and Mining Company Limited and operates under the South African Companies Act.Act, No. 71 of 2008, as amended (the Companies Act).
Its registered office is at 76 JeppeRahima Moosa Street, Newtown, Johannesburg, South Africa, 2001. Telephone: +27 11 6376000.637 6000.
While AngloGold Ashanti’s primary listing is on the Johannesburg Stock Exchange (JSE), the company is also listed on the New York Stock Exchange (NYSE), the Ghana Stock Exchange (GhSE) and the Australian Securities Exchange (ASX).
HISTORY AND SIGNIFICANT DEVELOPMENTS
Below are highlights of key corporate activities from 1998:
1998
Formation of AngloGold Limited through the consolidation of East Rand Gold and Uranium Company Limited; Eastvaal Gold Holdings Limited; Southvaal Holdings Limited; Free State Consolidated Gold Mines Limited; Elandsrand Gold Mining Company Limited; H.J. Joel Gold Mining Company Limited and Western Deep Levels Limited into a single, focused, independent gold mining company. Vaal Reefs Exploration and Mining Company Limited (Vaal Reefs), the vehicle for the consolidation, changed its name to AngloGold Limited and increased its authorised share capital, effective 30 March 1998.
1998-2004
Expansion of AngloGold Limited’s operations outside of South Africa.
2004
ConcludedConclusion of the business combination with Ashanti Goldfields Company Limited, at which time the company changed its name to AngloGold Ashanti Limited.
2007
Sale by Anglo American plc soldof 69,100,000 ordinary shares of AngloGold Ashanti, thereby reducing Anglo American’s shareholding in AngloGold Ashanti from 41.7 percent to 16.6 percent.
2009
Sale by Anglo American plc soldof its remaining shareholding in AngloGold Ashanti to Paulson & Co. Inc.
2010
Elimination of AngloGold Ashanti eliminated itsAshanti’s hedge book, thereby gaining full exposure to spot gold prices.
2012
AngloGold Ashanti acquiredAcquisition of the remaining 50 percent interest in Serra Grande in Brazil for $215 million.
The company acquiredAcquisition of 100 percent of First Uranium (Proprietary) Limited for $335 million.
2013
CommissioningCommission of two new gold projects – Tropicana and Kibali – in the second half of 2013.
2015
Sale of the Cripple Creek & Victor gold mine in the USA for $819 million.
CAPITAL EXPENDITURE
For information concerning the company’s principal capital expenditures and divestitures currently in progress, including the distribution of these investments geographically and the method of financing, refer “Item 4B: Business Overview – Overview–AngloGold Ashanti Global Operations: 2014”2016”, “Item 5A: Operating Results – Results–Capital expenditure” and “Item 5B: Liquidity and Capital Resources”.
45
| 4B. | BUSINESS OVERVIEW |
AngloGold Ashanti, is a global gold mining company with a geographicallyglobally diverse, world-class portfolio of mining operations and projects, with more than 97% ofis headquartered in Johannesburg, South Africa. AngloGold Ashanti is the company’s revenue derived fromthird largest gold mining company in the sale of gold produced at its operations located around the world. The company works acrossworld, measured by production.
Our business activities span the full spectrum of the mining value chain.chain and take into account the impact of our activities on the varied and many communities and environments in which we operate.
PRODUCTS
AngloGold Ashanti’s main product is gold. Once mined, the gold ore is processed into doré (unrefined gold bars) on site and then dispatched to precious metals refineries for refining to a purity of at least 99.5%, in accordance with the standards of ‘good delivery’ as determined by the London Bullion Market Association (LBMA). This refined gold is then sold directly to bullion banks.
By-products of our gold mining operations, often a function of local geological characteristics, include silver (Argentina),in Argentina, sulphuric acid (Brazil)in Brazil and uranium (South Africa).in South Africa.
OPERATIONS
AngloGold Ashanti’s 20Our portfolio of 17 mines in nine countries, comprises long-life, relativelylow-cost assets with differing ore body types, located in key gold-producing regions. A number of these assets are strongly leveraged to energy costs and currencies.
Our operations are located in 10 countries.grouped regionally as follows:
Following a strategic review of AngloGold Ashanti’s asset portfolio at the start of 2013, particularly as it pertains to development
South Africa (Vaal River, West Wits and exploration projects, the company embarked on significant restructuring in response to current challenges in the gold sector, including increasing costs of production and fall in gold prices. The gold price continued to decline in 2014. The focus on the qualitySurface Operations)
Continental Africa (Democratic Republic of the portfolio and conservative planning was sustained.
The business segments comprise South Africa, Continental Africa, Americas and Australasia. South Africa comprises operations and assets in South Africa namely West Wits, Vaal River and surface operations, which includes First Uranium SA which owns Mine Waste Solutions (MWS). The company’s operating assets outside of South Africa are Continental Africa with operations in the DRC,Congo, Ghana, Guinea, Mali and Tanzania. Tanzania)
Americas (Argentina and Brazil)
Australasia which comprises two operations(Australia)
These operating assets are supported by greenfield projects and a focused exploration programme.
Given the current market environment, and with limited access to financial capital, we are working to allocate available capital responsibly and in Australia. Americasline with operations in Argentina, Brazilbusiness requirements. At the same time we are identifying and implementing operational efficiencies, reducing overhead structures, improving capital discipline and pursuing other initiatives to improve underlying business performance, with an emphasis on workplace safety. Our overall focus remains continued debt reduction to further strengthen our balance sheet, while working to improve the United States. Thequality of our portfolio and to unlock value from the Colombian portfolio and Obuasi.
By using our human capital efficiently and effectively, group support functions from corporate consist ofcover planning and technical, strategy, sustainability, finance, human resources, and legal sustainability,and stakeholder relations andrelations. The planning and technical. Planning and Technicaltechnical function focuses on the management of opportunities and the maintenance of long-term optionality, in the businessensuring optimal use of our human capital and expertise, through a range of activities whichthat includes brownfieldsbrownfield and greenfieldsgreenfield exploration, innovative research theand technology development and technical assurance of technology andwith a continuing focus on mining excellence.
On 30 June 2014 the sale of Navachab gold mine in Namibia was completed.
EXPLORATION
ExplorationOur exploration programme is aimed at protecting future sustainability and creatingproviding an organic growth pipeline through which to create significant value for the company.
Greenfields and brownfields exploration takes place in both established and new gold-producing regions through managed andnon-managed joint ventures, strategic alliances and wholly-owned ground holdings. AngloGold Ashanti’s discoveries include La Colosa, Gramalote and GramaloteQuebradona (Nuevo Chaquiro) in Colombia and Tropicana in Australia.
GOLD MARKET
AngloGold Ashanti’s gold is refined at various precious metal refineries. In refined and marketable form, gold normally takes the shape of bars, varying in size from 12.5 kilogram to smaller bars weighing 1 kilogram or less, all of which contain 99.5 percent gold. Through the refineries2016, the gold is sold directlyprice was a story of two halves, where the price turned higher from late 2015 and continued to bullion banks. Bullion banks are registered commercial banks which deal in gold, distributing bullion bought from mining companies and refineries to markets worldwide. These banks hold consignment stocks in all major physical markets and finance these inventoriesrally during the first half of 2016, with the price peaking at $1,374.91/oz. The year was eventful worldwide – from the margins they charge physical buyers.sharpsell-off in Chinese equities to apick-up in friction between Saudi Arabia and Iran – helping to drive up the gold price. The most surprising global events of 2016 – the British referendum to leave the European Union (Brexit), and the unexpected victory of Donald Trump as US president elect – each had an impact on the gold price.
As always, there were more factors which contributed to the rise and fall of the gold price, and the most influential factor during 2016 was the US dollar. The Federal Reserve’s monetary policy andabsence of any increase in US interest rates during the first half of the year allowed gold to rally. However, as the US economy started to improve towards the end of quantitative easing continued to depressthe year, increasing the likelihood of a rate hike in quarter four, the gold price in 2014.began to wane. The prospect of higherFederal Open Market Committee (FOMC) meeting on 14 December 2016 decided to increase US interest rates reducedby 25 basis points but more importantly, the needFOMC signalled a more hawkish stance toward the US interest rate environment ahead, signalling the potential for safe-haven investments. Demandthree further rate hikes in 2017. This supported the US dollar and placed gold under considerable pressure with the price touching a low of $1,122.35/oz on 15 December, before recovering and closing the year at $1,151.46/oz.
The rally in the gold price for physical bars and coins had declined in 2013, in partthe first half of the year was driven largely by the revival of exchange-traded fund (ETF) demand which saw many investors returning to gold. In addition to the headline events described above, continued sluggish economic growth across the globe, despite the attempts by central banks to reflate economies, made gold the preferredgo-torisk-off asset. ETF holdings were up 45 percent at their peak, at 72.8Mozs. However, as investors digested their heavy buying in 2012 and early 2013. Investors began a sell off of their gold holdingsthe outlook for the US economic growth started to improve in the second half of 2013the year, this demand started to fade and this continued into 2014. In particular, liquidations from exchange traded funds (ETFs) resulted in ETF gold holdings declining by almost 160t, significantly less thaneven reverse. Following the 903t of liquidation in 2013. ETFs have now lost a third of their holdings since their peak at the end of 2012, when they held 89Moz (2,778t). Slowing growth in China, prospects for monetary stimulus in Europe and seemingly no end to Japanese deflation helped to boost the attractivenessoutcome of the US dollarelections in November, this liquidation intensified on the back of a combination of higher interest rates and expectations of a stronger US dollar. ETF holdings closed the year at 65.02Moz which in turn weighed on gold.
46
In contrast, central banks remained steady net buyers of gold, a trend that has lasted several years, with net purchases of 14Moz in 2014 (2013: 13Moz). Russia’sSince 2011, the central bank startedcommunity has established itself as a very important demand side factor, adding to accumulate domestically produced metal as Ukraine-related sanctions hindered normalexisting gold exports.
Jewellery demand was largely sustained during 2014 at the 7Moz level. Indian demandholdings in the latter half of the year took up most of the slack occasioned by slower Chinese demand. This followed the lifting of import restrictions by the Indian government. The Chinese jewellery market has been consolidating after the exceptional growth of 2013 and as warehouse stocks of bullionorder to either diversify or bolster reserves. Central banks continued to be drawn down. Apartnet buyers in 2016 with their purchasing trend, although to a lesser extent compared to the previous years. In 2016, central banks collectively purchased 383.6t of gold compared to 566t in 2015, a reduction of 33 percent. Despite this, 2016 was the seventh consecutive year of net purchases by central banks. Central bank purchases in 2016 were led by Russia, China and Kazakhstan. Together they accounted for around 80 percent of purchases for the full year.
Sales from central banks were, once again, negligible for the 2015-2016 period at 3.07 tonnes (2014-2015 period at 3.39t). The bulk of these were made by the German Bundesbank as part of its gold coin programme.
JEWELLERY DEMAND
Investment demand continued to decline in December as gold ETF and fund outflows remained at a relatively high level of 3.1Moz in December, albeit lower than November outflows of 3.9Moz.
Demand from the gold jewellery market, dominated by India and China, which together account for almost 60% of jewellery demand, was somewhat disappointing. In China, households seemed to be spending their income on luxury items and investing in property rather than gold. India, on the other hand, had various hindrances including asix-week strike by jewellers, increased government regulations (including higher taxes and duties on gold imports), and a poor harvest. The poor harvest led to apick-up in the United Statesrural community selling gold in order to make up for loss of income from farming, whilst the impact of demonetisation continued to affect gold demand.
The higher gold prices during the year encouraged an increase in scrap metal entering the market while recycled gold increased by 17 percentyear-on-year to 42.07Moz in 2016. Mine supply remained virtually unchanged from 2015 levels with production of 3.236t and UK, where economies have been recovering3.233t recorded for the two periods respectively.
COMPETITION
As gold mining is a mature and lifting jewellery demand, demandregulated industry, and very significant volumes of gold and gold derivatives trade in muchthe world markets independent of gold mine supply, AngloGold Ashanti does not consider that competition for sales plays any role in its operations as a gold producer. For more information on a geographical analysis of gold income by destination, refer “Item 18: Note 2 – Segmental Information”.
However, gold producers do compete against each other for acquisition of mining assets, exploration opportunities and human resources. See “Item 3D: Risk Factors”.
SEASONALITY
Subject to other factors and unforeseen circumstances, quarter one production is generally lower than production during the rest of the world has tended to be weaker.year as a result of theramp-up of operations after annual holiday production declines.
RAW MATERIALS
AngloGold Ashanti uses chemicals, including cyanide and lime, in the production of gold. These chemicals are available from a large number of suppliers.
COMPETITION
As gold mining issuppliers and do not represent a mature and regulated industry, and very significant volumes of gold and gold derivatives trade in the world markets independent of gold mine supply, AngloGold Ashanti does not consider that competition for sales plays any role in its operations as a gold producer. However, gold producers do compete against each other for acquisition of mining assets, exploration opportunities and human resources. For more information on a geographical analysis of gold income by destination, refer Item 18: Note 2 – “Segmental Information”.
INTELLECTUAL PROPERTY
AngloGold Ashanti, as a group, is not dependent on intellectual property for the conduct of its business as a whole.
SEASONALITY
Subject to other factors and unforeseen circumstances, quarter one production is generally lower than production during the restmaterial portion of the year as a result of the ramp-up of operations after annual holiday production declines.company’s costs.
STRATEGY
AngloGold Ashanti’s core strategic focus is to generate sustainable free cash flow improvements and returns by focusing on five key business objectives,areas, namely: people, safety and sustainability; ensuring financial flexibility; actively managing all expenditures; improving the quality of our portfolio; and maintaining long-term optionality.
Strategic focus areas
AngloGold Ashanti’s five strategic focus areas are set out below:
Focus on people, safety and sustainability. People are the foundation of our business. Our business must operate according to our values if it is to remain sustainable in the long term.
Promote financial flexibility. We must protectensure our balance sheet’s abilitysheet always remains able to meet our core funding needs.
Optimise overhead costs and capital expenditure. All spending decisions must be checked and double checkedthoroughly scrutinised to ensure they are optimally structured and necessary to fulfil our core business objective.
Improve portfolio quality. We have a portfolio of assets that must be actively managed to improve the overall mix of our production base as we strive for a competitive valuation as a business.
Maintain long-term optionality. While we are focused on promotingensuring the most efficientday-to-day operation of our business we must keep an eye on creating a competitive pipeline of long-term opportunities.
Managing performanceINTELLECTUAL PROPERTY
The five strategic focus areas are reflected inAngloGold Ashanti, as a group, is not dependent on intellectual property for the role descriptionsconduct of each executive and senior manager in the group.its business as a whole.
47
THE REGULATORY ENVIRONMENT ENABLING ANGLOGOLD ASHANTI TO MINE
AngloGold Ashanti’s rights to own and exploit mineral reservesOre Reserve and deposits are governed by the laws and regulations of the jurisdictions in which these mineral properties lie.
AngloGold Ashanti is subject to a wide range of laws and regulations governing all aspects of its operations, including such areas as environmental protection, reclamation, exploration, development, production, taxes, immigration, labour standards and employment issues, occupational health, mine safety, toxic substances and wastes, securities and foreign corrupt practices. AngloGold Ashanti has made, and expects to amongst other things, make in the future, significant expenditures to comply with these laws and regulations.Non-compliance can result in violations and legal claims, as well as substantial fines, penalties, reputational damage and delays inday-to-day operations. Pending or proposed changes to existing laws and regulations, as well as any proposed or contemplated new laws or regulations could also have significant impacts on AngloGold Ashanti’s business and results of operations, the extent of which cannot always be predicted.
There are in some cases certain restrictions on AngloGold Ashanti’s ability to independently move assets out of certain countries in which it has operations, or transfer assets within the group, without the prior consent of the local government or minority shareholders involved. See “Item 10D.:10D: Exchange controls” for details.
For more information on the risks and uncertainties associated with AngloGold Ashanti’s mining rights, see “Item 3D.:3D: Risk factors”, in particular the risk factors entitled “AngloGold Ashanti’s mining rights in the countries in which it operates could be altered, suspended or cancelled for a variety of reasons, including breaches in its obligations in respect of its mining rights”, “Failure to comply with laws, regulations, standards, contractual obligations whether following a breach or breaches in governance processes or fraud, bribery and corruption may lead to regulatory penalties, loss of licences or permits, negative effects on AngloGold Ashanti’s reported financial results, and loss ofadversely affect its reputation”, “Title to AngloGold Ashanti’s properties may be uncertain and subject to challenge”, “AngloGold Ashanti’s Mineralmineral deposits, Ore Reserve, deposits and mining operations are located in countries where political, tax and economic laws and policies may change rapidly and unpredictably and such changes and policies may adversely affect both the terms of its mining concessions, as well as its ability to conduct operations in certain countries” and “AngloGold Ashanti’s MineralOre Reserve, deposits and mining operations are located in countries that face instability and security risks that may adversely affect both the terms of its mining concessions, as well as its ability to conduct operations in certain countries”.
South Africa
The MPRDA and the Revised Mining Charter
The Mineral and Petroleum Resources Development Act (MPRDA) came into effect on 1 May 2004. The objectives of the MPRDA are, amongst other things, to allow for state sovereignty over all mineral and petroleum resources in the country, to promote economic growth and the development of these resources and to expand opportunities for the historically disadvantaged. Another objective of the MPRDA is to ensure security of tenure for the respective operations concerning prospecting, exploration, mining and production. By virtue of the provisions of the MPRDA, the state ensures that holders of mining and prospecting rights contribute to the socioeconomic development of the areas in which they operate.
The Mineral and Petroleum Resources Development Amendment Act (MPRDAA) was passed by Parliament in 2008 and became effective on 7 June 2013. Its purpose is to amend the MPRDA in order to, amongst other things:
make the Minister of Mineral Resources (Minister) the responsible authority for implementing the requirements of the National Environmental Management Act of 1998 (NEMA) and specific environmental legislation as they relate to prospecting, mining, exploration, production and related activities incidental thereto on the prospecting, mining, exploration or production area;
align the MPRDA with the NEMA in order to provide for one environmental management system;
remove ambiguities in certain definitions;
add functions to the Regional Mining Development and Environmental Committee;
amend transitional arrangements so as to further afford statutory protection to certain existing old order rights; and
provide for matters connected therewith.
48
When the MPRDAA came into effect on 7 June 2013, only selected provisions became effective immediately. The MPRDAA contains the following provisions, amongst others:
ProhibitionEnvironmental authorisations: Provides for a prohibition on any prospecting and mining, or conducting technicalco-operation operations, reconnaissance operations or any incidental work without an environmental authorisation (since 7 December 2014), permit and at least 21 days’ written notice to the landowner or lawful occupier.
Historic residues:residues: Provides that the definitions of “residue stockpile” and “residue deposit” now include an old order right. This provision is intended to make old order dumps subject to the MPRDA so that old order dumps which are part of a mining area covered by a new order mining right could only be treated by the holder of the new order rights. Old order dumps not covered by a new order mining right would be considered a residue deposit to which the Minister would have discretion to grant rights.
Applications:Applications: Provides that applicants for prospecting and mining rights must (since 7 December 2014) lodge an application for an environmental authorisation simultaneously with the application for rights. The Department of Mineral Resources should no longer accept more than one application in respect of the same area and mineral.
Environmental Regulation:regulation: Provides that the Minister is the responsible authority for implementing environmental provisions in terms of the National Environmental Management Act (NEMA)under NEMA as it relates to prospecting, mining, exploration, production or activities incidental thereto on a prospecting, mining, exploration or production area. An environmental authorisation issued by the Minister shall be a condition prior to the issuing of a permit or the granting of a right in terms of the MPRDA.
Closure Certificates:certificates: Provides that previous holders of old order rights or previous owners of works that have ceased to exist remain responsible for any environmental liability until the Minister issues a closure certificate.
On 27 December 2012, the Minister published the Draft Mineral and Petroleum Resources Development Bill, 2012 (2012 Bill) which sought to amend the MPRDA and invited the mining industry and interested and affected parties to comment on it by 8 February 2013. On 21 June 2013, a revised version of the Bill (2013 Bill) was introduced to the National Assembly. The 2013 Bill underwent an extensivea public participation process and extensive comments were received from the general public. Following a consultative process with the DMR,Department of Mineral Resources (DMR), the State Law Advisors and the general public, the Portfolio Committee on Mineral Resources (Portfolio Committee) introduced an amended version of the 2013 Bill to the South African Parliament.
The 2013 Bill seeks to amend the MPRDA, to, amongst other things:
remove ambiguities;
provide for regulation of associated minerals;minerals, partitioning of rights, and enhanced provisions on mineral beneficiation;
promote national energy security;
streamline administrative processes; and
enhance sanctions.
The 2013 Bill, as currently drafted, contains, amongst others, the following provisions:
Applications:Applications: The 2013 Bill proposes revising the application system by replacing the “first come, first served” system with a tender and allocation system. This would dramatically affect the way applications are made.
Beneficiation:Beneficiation: The 2013 Bill extends the concept of beneficiation (which has been defined in the 2013 Bill as “transformation, value addition or downstream beneficiation of a mineral or mineral product (or a combination of minerals) to a higher value product, over baselines to be determined by the Minister, which can either be consumed locally or exported”) and would allow the Minister to prescribe the quantities, qualities and timelines at which certain designated commodities must be supplied to local beneficiators at a mine gate price or an agreed price. The reference to the mine gate price appears to suggest companies can recover costs, capital expenditure and make a profit. It is not clear whether the “agreed price” will have general application or whether it will be determined on acase-by-case basis. Another proposed amendment provides that written consent would have to be obtained before exporting of “designated minerals” if the producer or associated company has not offered minerals to local beneficiators. The Minister would have discretion to decide which minerals are to be designated.
Residue stockpiles:stockpiles: The MPRDAA’s inclusion of residue deposits and residue stockpiles in the definition of land, creating a “statutory accession” of movable dumps back to the land, is discussed above. The 2013 Bill would extend this definition to include historic mines and dumps created before the implementation of the MPRDA. The 2013 Bill also seeks to make these historic dumps subject to the MPRDA. This is to be achieved by making the working of these dumps subject to a mining right issued under the MPRDA. There is a transition period of two years to enable owners of these dumps to either apply for mining rights or incorporate them in existing mining rights.
Partitioning of rights and transfers of interests in companies:companies: Section 11 of the MPRDA currently requires that transfer of a controlling interest in an unlisted company be consented to by the Minister. The 2013 Bill proposes amending the MPRDA so that transfer of a controlling interest in listed companies and transfer of any interest in unlisted companies must be consented to by the Minister. The 2013 Bill further proposes amending the MPRDA to allow for an application for ministerial consent to be made to transfer a part of a right.
49
Mine closure:closure: The 2013 Bill makes provisionprovides for two major changes to mine closure under the MPRDA. Firstly, the MPRDA would be amended so that a mining company could still incur environmental liability even after obtaining a closure certificate relative to a mine is obtained.mine. Secondly, any portion of the financial provision paid to the Minister in terms of section 41 of the MPRDA may be retained by the Minister for latent and residual environmental impactimpacts which may become known in the future for such time period as the Minister may determine, having regard to the circumstances relating to the relevant operation, which portion and time period must be determined in the prescribed manner.
Penalties:Penalties: The 2013 Bill would also provideprovides for revised penalties for violations of the MPRDA by making provision for both an administrative fine not exceeding 10 per cent of the person or holder’s annual turnover and exports during the preceding year, and imprisonment not exceeding four years.
Legislative force of the Charter and Codes:Codes: The 2013 Bill proposes amending the definition of “this Act” in the MPRDA so that the MPRDA will include the Revised Mining Charter (defined below), the Code of Good Practice for the South African Mineral Industry (Code) and the Housing and Living Conditions Standard. This would give these documents the force of law.
The 2013 Bill was passed by the National Assembly on 12 March 2014 and passed by the National Council of Provinces (NCOP) on 27 March 2014. The 2013 Bill was sent to the President of the Republic of South Africa (President) for assent. On 16 January 2015, the President referred the 2013 Bill back to the National Assembly to accommodate his reservations
around the constitutionality of the 2013 Bill. The National Assembly must now reconsider2013 Bill was considered by the Portfolio Committee on Mineral Resources who tablednon-substantial revisions to the 2013 Bill, in light of the President’s reservations around its constitutionality. Oncewhich revisions were passed by the National Assembly considersand referred to the NCOP on 1 November 2016. The NCOP select committee on land and mineral resources is currently undergoing a public participation process on this version of the 2013 Bill. If the NCOP makes no further changes to the 2013 Bill, and sends it backis sent to the President for assent,Assent, the President will then either assent tomight be of the 2013 Bill or, if he thinksview that his reservations around the constitutionality of the 2013 Bill have stillwere not been addressed and he can either assent to the 2013 Bill anyway (i.e. accept that the 2013 Bill should become law despite his reservations) or he canmight refer the 2013 Bill to the Constitutional Court of South Africa for a decision on its constitutionality. If the President does assent to the 2013 Bill, either after the NCOP makes substantial changes to the 2013 Bill or not, the 2013 Bill might still be subject to constitutional challenge.
The Mining Charter
The Mining Charter sprang from the MPRDA and also took effect on 1 May 2004. The Mining Charter committed all stakeholders in the mining industry to transfer ownership of 26 percent of their assets to black or historically disadvantaged South Africans (HDSAs) within 10 years. The Charter also sets targets for, amongst other things, the advancement of HDSAs into management positions, the employment of women, procurement of goods and services from HDSA-owned companies, training, community development and the upgrading of mine housing. Mining companies are required to devise plans to achieve these targets, must identify current levels of beneficiation and must indicate opportunities for growth.
The objectives of the Mining Charter are to:
promote equitable access to the nation’s Mineral Resources by all the people of South Africa;
substantially and meaningfully expand opportunities for HDSAs, including women, to enter the mining and minerals industry and to benefit from the exploitation of the nation’s Mineral Resources;
use the industry’s existing skills base for the empowerment of HDSAs;
expand the skills base of HDSAs in order to serve the community;
promote employment and advance the social and economic welfare of mining communities and the major labour-sending areas; and
promote beneficiation of South Africa’s mineral commodities.
The Mining Charter envisages measuring progress on transformation of ownership by:
taking into account, amongst other things, attributable units of production controlled by HDSAs;
allowing flexibility by credits or offsets, so that, for example, where HDSA participation exceeds any set target in a particular operation, the excess may be offset against shortfalls in another operation;
taking into account previous empowerment deals in determining credits and offsets; and
considering special incentives to encourage the retention by HDSAs of newly acquired equity for a reasonable period.
Under the Mining Charter, the mining industry as a whole agreed to assist HDSA companies in securing finance to fund participation in an amount of RandZAR 100 billion ($10.9 billion) over the first five years. Beyond the RandZAR 100 billion commitment, HDSA participation willwas to be increased on a willing seller, willing buyer basis, at fair market value, where the mining companies are not at risk.
50
Following a review, the Department of Mineral Resources (DMR)DMR amended the Mining Charter and the Revised Mining Charter was released on 13 September 2010. The requirement under the Mining Charter for mining entities to achieve a 26 percent HDSA ownership of mining assets by the year 2014 was retained. Amendments to the Mining Charter in the Revised Mining Charter require mining companies to:
facilitate local beneficiation of mineral commodities;
procure a minimum of 40 percent of capital goods, 70 percent of services and 50 percent of consumer goods from HDSA suppliers (i.e., suppliers in which a minimum of 25 percent + 1 vote of share capital is owned by HDSAs) by 2014, these targets being, however, exclusive ofnon-discretionary procurement expenditure;
ensure that multinational suppliers of capital goods put a minimum of 0.5 percent of their annual income generated from South African mining companies into a social development fund beginning in 2010, to contribute to the socioeconomic development of South African communities;
achieve a minimum of 40 percent HDSA demographic representation by 2014 at executive management (board) level, senior management (EXCO) as well as in those positions requiring core and critical skills, middle management level and junior management level;
invest up to 5five percent of annual payroll in essential skills development activities; and
implement measures to improve the standards of housing and living conditions for mineworkers by converting or upgrading mineworkers’ hostels into family units, attaining an occupancy rate of one person per room and facilitating home ownership options for all mineworkers in consultation with organised labour, all of which must be achieved by 30 April 2014.
In addition, mining companies are required to monitor and evaluate their compliance with the Revised Mining Charter, and must submit annual compliance reports to the DMR.
The government takes a “Scorecard” approach to the different facets of promoting the objectives of the Charter. It uses the Scorecard when considering applications for the conversion of existing old order rights into new order rights. The Scorecard sets out the requirements of the Charter in tabular form which allows the DMR to “tick off” areas where a mining company is in compliance. It covers the following areas:
human resource development;
employment equity;
migrant labour;
mine community and rural development;
housing and living conditions;
ownership and joint ventures;
beneficiation; and
reporting.
The new Scorecard attached to the Revised Mining Charter makesmade provision for aphased-in approach for compliance with the above targets over the 5-yearfive-year period endingended on 30 April 2014. For measurement purposes, the Scorecard allocatesallocated various weightings to the different elements of the Revised Mining Charter.
Failure to comply with the provisions of the Revised Mining Charter will amount to a breach of the MPRDA, may result in the cancellation or suspension of a mining company’s existing mining rights and may prevent AngloGold Ashanti’s South African operations from obtaining any new mining rights. However, AngloGold Ashanti has not yet received its “Scorecard” from the government assessing its compliance with the requirements of the Charter. Further, in
In March 2015, the Minister of Mineral Resources announced that the Department of Mineral Resources and the Chamber of Mines of South Africa had jointly agreed to submit certain matters relating to the interpretation of the Revised Mining Charter, including the qualification of certain historical BEEBBBEE transactions (defined below) for meeting the HDSA ownership thresholds, to the courts in South Africa for determination and clarification. Papers were filed by the Chamber of Mines of South Africa and the DMR (the “DMR/Chamber of Mines application”). Separately, the law firm Malan Scholes launched an application challenging the constitutionality of the Mining Charter and the Revised Mining Charter and requesting that these Charters be set aside. The court subsequently postponed the DMR/Chamber of Mines application. Judgement on the Malan Scholes application has been reserved.
On 9 March 2016, AngloGold Ashanti received a notice from the DMR stating that the company was not compliant with the 26 percent HDSA ownership requirement. The notice directed the company to remedy thenon-compliance within 60 days. Failure to comply with the order could constitute an offence under the MPRDA and, as such, could negatively impact AGA’s “Scorecard” assessment. On 14 March 2016, AngloGold Ashanti timely responded to thenon-compliance notice. The DMR provided no further response and, consequentially, the notice has lapsed.
On 15 April 2016, the Minister of Mineral Resources published a draft mining charter (the “Draft 2016 Mining Charter”). The Draft 2016 Mining Charter seeks to align the Revised Mining Charter with the Broad-Based Black Economic Empowerment Act, 53 of 2003, in order to ensure meaningful participation of black people and provide for policy and regulatory certainty to ease the investment in and the development of the mining industry. Interested and affected parties were invited by the DMR to submit written representations on the Draft 2016 Mining Charter until 31 May 2016.
Below are the new requirements introduced by the Draft 2016 Mining Charter:
South African mining companies retain the minimum target of 26% ownership threshold by black people per mining right, and for as long as they hold the right, to enable meaningful economic participation of black people in the industry.
A minimum of 5% ownership must be allocated to each of the following groups: workers, black entrepreneurs and communities. All black participants are required to participate collectively in a special purpose vehicle.
Mining companies must procure 60% of capital goods, 80% of services and 70% of consumables goods from Black Economic Empowerment (“BEE”) compliant and locally based entities.
Multinational suppliers of capital goods must annually contribute 1% of their annual income generated from local mining companies towards the socio-economic development of local communities.
Locally based entities must analyse mineral samples across the mining value chain.
Mining companies must achieve a minimum representation of Black People in the following management positions: 50% in executive (25% of which must be black female), 60% in senior management (30% of which must be black female); 75% in middle level (38% of which must be black female); 88% in junior level (44 percent of which must be black female) and 40% in core and critical skills. In addition; Black People with disabilities must constitute 2% of all employees.
The mining industry must continue to invest up to 5% of its annual payroll in skills development activities. 15% of such investment must be invested to the Ministerial Skills Development Trust Fund.
One percent of the annual turnover of mining companies must be contributed toward the development of local communities and areas from which a majority of mineworkers both historical and current were or are recruited.
All performance, investment, ownership and other targets in the Revised Mining Charter will apply throughout the life of a mine, unless the specific target specifies otherwise.
The issues such as reporting, mine and rural development are similar to the Revised Mining Charter, save for the fact that the Draft 2016 Mining Charter proposes that 1% of the annual turnover of the mining companies must be contributed towards local development and labour sending areas.
In addition, the Draft 2016 Mining Charter provides for the applicability of the Revised Mining Charter to mining entities with permits / licences granted under the Precious Metals Act, 2005 and the Diamonds Act, 1986.
All targets stipulated in the Revised Mining Charter will apply throughout the life of a mine, unless the specific target specifies otherwise.
The Draft 2016 Mining Charter gives existing holders a maximum of three years to comply with the revised targets of the Revised Mining Charter from the date of its publication. The Minister of Mineral Resources has indicated that it is the DMR’s intention to publish a final version of the Draft 2016 Mining Charter in March 2017 based on the DMR’s engagement with stakeholders in the industry and without a further formal public participation process.
The Code
Section 100(1)(b) of the MPRDA obliged the Minister to develop a code of good practice for the minerals industry. On 29 April 2009, as required bythe Minister published a Code pursuant to section 100(1)(b) of the MPRDA, the Minister published the Code.MPRDA. The Code is a guiding document and its purpose of the Code wasis to set out administrative principles to enhance implementation of the Mining Charter and the MPRDA. The Code is to be read in combination with the Mining Charter and other legislation relating to measurement of socio-economic transformation in the South African mining industry. The Code does not replace the Charter nor any key legislation and laws relating to the minerals and the petroleum industry but serves as a statement of policy and principles that assists in the implementation of both the MPRDA and the Charter.
Environmental laws relating to mining and prospecting
The MPRDAA repealed the sections in the MPRDA that dealt with environmental regulation of mining and prospecting operations. This was the first step in migrating the environmental regulation provisions from the MPRDA into NEMA. NEMA was then amended by the National Environmental Management Amendment Act no. 62 of 2008 and then again by the National Environmental Management Laws Amendment Act 25 of 2014, and now includes provisions to deal with environmental regulation of mining and prospecting which provisions are administered by the Minister of Mineral Resources. In addition, The Regulations Pertaining to the Financial Provision for Prospecting, Exploration, Mining or Production Operations were published in the government gazette on 20 November 2015 under GNR 1147 Notice 39425 (New Financial Provision Regulations), and now fall under NEMA.
While the New Financial Provision Regulations are similar to the previous provisions under the MPRDA, some of the significant changes are set forth below:
broadening the definition of “financial provision” to require making financial provision for the adverse impacts that might arise from operations rather than only those listed in the environmental management plan (EMP), as was previously the case;
requiring the holder to annually assess environmental liability and adjust the financial provision to the satisfaction of the Minister of Mineral Resources;
requiring the holder to submit an audit report to the Minister of Mineral Resources on the adequacy of the financial provision from an independent auditor. If the Minister of Mineral Resources is not satisfied with the assessment, he is entitled to appoint his own auditor;
requiring that a holder maintain and retain financial provision notwithstanding the issuance of a closure certificate. Furthermore, the Minister may retain such portion of the financial provision as may be required to rehabilitate the closed mining or prospecting operation in respect of latent, residual or any other environmental impacts, including the pumping of polluted or extraneous water, for a prescribed period. This is not only in respect of holders of rights, but also now in respect of holders of old order rights and holders of works;
before the coming in to effect of the New Financial Provision Regulations, holders could make financial provision for annual rehabilitation, final rehabilitation and post-closure residual impacts and water pumping by adding up the total amount for these three types of rehabilitation and making financial provision in one go using one or a mix of four methods: depositing cash in to the DMR bank account, keeping the amount in a rehabilitation trust in accordance with the Income Tax Act, 1962, obtaining a financial guarantee or a bank guarantee in respect of the amount, or using a method determined by the Director-General (this was not common in practice). Under the New Financial Provision Regulations, if the holder wishes to use a rehabilitation trust in accordance with the Income Tax Act, 1962, the amount in the trust can only relate to financial provision for post-closure residual impacts and water pumping. Holders can no longer make financial provision for annual and final closure through a trust fund;
a holder’s financial provision must be equal to the sum of actual costs of implementing all three broad classes of rehabilitation for at least 10 years; and
the financial provision liability associated with annual rehabilitation, final closure or latent or residual environmental impacts may not be deferred against assets at mine closure or mine infrastructure salvage value.
Failure to realign to the new system constitutesnon-compliance with section 24P of NEMA, which would entitle the DMR to issue a directive and failure to comply with the directive is an offence under section 49A(g) of NEMA. A person convicted of an offence under section 49A(g) of NEMA is liable to a fine not exceeding ZAR10 million or to imprisonment for a period not exceeding 10 years, or to both.
The mining industry has raised concerns with the New Financial Provision Regulations, including
confusion regarding the applicability of the New Financial Provision Regulations to applicants and to previous holders;
duplicate funding or double provisioning;
unclear methods and periods for determining financial provision;
legal barriers to use of trust funds;
burdensome public consultation and disclosure requirements;
transitional provisions and time frames:
requirements for an additional 3 (three) plans;
over-auditing – time and cost implications; and
inclusion of care and maintenance.
On 26 October 2016, proposed Amendments to the New Financial Provision Regulations were published for comment. The mining industry has been engaging the Department of Environmental Affairs regarding the New Financial Provision Regulations and the proposed Amendments. A revised version of the Financial Provision Regulations is expected to be published during the course of 2017, with a revised compliance deadline of February 2019.
Pursuant to section 24N(8) of NEMA, directors of a company are jointly and severally liable for any negative impact on the environment, whether advertently or inadvertently caused by the company they represent, including damage, degradation and pollution.
See also “Item 4B: Business Overview—Mine Site Rehabilitation and Closure” and “Item 4B: Business Overview—Environmental, Health and Safety Matters”.
AngloGold Ashanti’s rights and permits
A mining right will be granted to a successful applicant for a period not exceeding 30 years. Mining rights may be renewed for additional periods not exceeding 30 years at a time. A mining right can be cancelled if the mineral to which such mining right relates is not mined at an “optimal” rate.
AngloGold Ashanti holds seven mining rights in South Africa (three in West Wits and four in Vaal River) which have been successfully converted, executed and registered as new order mining rights at the Mineral and Petroleum Resources Titles Registration Office (MPRTO)(MPTRO).
A prospecting right will be granted to a successful applicant for a period not exceeding five years, and may only be renewed once for three years. The MPRDA also provides for a retention period of up to three years after prospecting, with one renewal up to two years, subject to certain conditions.
51
AngloGold Ashanti holds two prospecting rights. In addition, a thirdone prospecting right has been granted but has not been executed.in Vaal River.
AngloGold Ashanti also holds a mining permit for the recovery of sand and clay. A renewal applicationclay in West Wits, which has been timely submitted andrenewed until 22 March 2017. AngloGold Ashanti awaits renewal.is in the process of renewing this permit.
AngloGold Ashanti holds a refining licence and an import and export permit from the South African Diamond and Precious Metals Regulator. The import and export permit is currently in the process of being renewed.
The BBBEE Amendment Act
The President of South Africa assented to the BBBEE Amendment Act on 2723 January 2014. The BBBEE Amendment Act came into effect on 24 October 2014 with the object of amending the Broad-based Black Economic Empowerment Act 53 of 2003 (BBBEE Act) to provide a framework of principles, strategies and guidelines aimed at promoting the broad-based socio-economic empowerment of HDSAs across the South African economy and society in the form of ownership, management, employment equity, skills development, preferential procurement, enterprise development and socio-economic development. The BBBEE Amendment Act includes a number of changes to the current framework under the BBBEE Act, including:
amending and clarifying the definition of the intended beneficiaries of such framework;
amending the definition of “Broad-Based Black Economic Empowerment”, or BBBEE, to introduce the concept of viable BBBEE and providing standards for that preferential procurement;
expanding the scope of the Codes of Good Practice (BBBEE Codes), and the related transformation charters, on BBBEE matters that the Minister of Trade and Industry can issue under the BBBEE Act for specific sectors of the South African economy and making it compulsory for public authorities, governmental agencies and other public entities to apply such codes;codes (Sector Codes);
introducing into the BBBEE Act itself the definition of fronting BBBEE practices, which to date has been developed outside of the BBBEE Act and has now been expanded to capture the more sophisticated and unsuspecting fronting transactions, making fronting a criminal offense that is punishable with imprisonment and fines under certain circumstances, reasserting in the BBBEE Act the common law remedies for misrepresentation and more generally enhancing the enforcement mechanism against fronting;
establishing a BBBEE Commission responsible for overseeing, supervising and promoting compliance with the BBBEE Act, as well as receiving and investigating BBBEE-related complaints; and
providing that DTIthe Department of Trade and Industry (DTI) may impose special requirements for specific industries.
Before the BBBEE Amendment Act came into effect, the BBBEE Act provided that in the event of a conflict between the BBBEE Act and any other law in force immediately prior to the commencement of the BBBEE Act, the BBBEE Act would prevail if the conflict specifically relates to a matter addressed in the BBBEE Act. As enacted, theThe BBBEE Amendment Act inserted a new provision in the BBBEE Act whereby the BBBEE Act trumps the provisions of any other law in South Africa with which it conflicts, provided such conflicting law was in force immediately prior to the effective date of the BBBEE Amendment Act. The BBBEE Amendment Act also stipulates that this provision would only bebecame effective one year after the BBBEE Amendment Act is brought into effect, i.e.as from 24 October 2015. It is unclear whether, on that basis,2016.
On 27 October 2015, the Minister for Trade and Industry published Government Notice 1047 of Government Gazette 39350, which declared an exemption in favour of the DMR from applying the requirements contained in section 10(1) of the BBBEE Act andfor a period of 12 months. The exemption can be read as confirmation that the BEEDTI sees the BBBEE Codes may overruleas “applicable” to the Mining Charter inIndustry after the future.exemption is lifted on 27 October 2016.
Additionally, the revised Broad-Based Black Economic EmpowermentBBBEE Codes of Good Practice or the Revised(Revised BEE CodesCodes) became available for voluntary use on 11 October, 2013 and will become effective on 30 April01 May 2015. Entities may however elect to be measured under the Revised BEE Codes immediately. Both the BBBEE Amendment Act and the Revised BEE Codes expressly stipulate that where an economic sector in South Africa has a Sector Code in place for BEE purposes, companies in that sector must comply with the Sector Code. For purposes of the BBBEE Act, the Revised Mining Charter is not a Sector Code. It is not, at this stage, clear what the interplay between the Revised Mining Charter and the CodeBBBEE Act and Revised BEE Codes is. The government may designate the Revised Mining Charter as a Sector Code in which case it willwould be under the auspices of the BBBEE Act. OnAct, but has not chosen to do so in its government gazette notice of 17 February 2016. Until such determination is made, if at all, the other hand, theRevised Mining Charter may remain asremains a stand-alone document under the auspices of the MPRDA and may bebecome subject to the trumping provision discussed above. This uncertainty might be resolved either by government clarification in this regard or by the matter receiving judicial attention.
The Royalty Act
The Mineral and Petroleum Resources Royalty Act, 2008, or the Royalty Act, was promulgated on 24 November 2008 and came into operation on 1 March 2010. The Royalty Act imposes a royalty on refined and unrefined minerals payable to the state.
52
The royalty in respect of refined minerals (which include gold and platinum)silver) is calculated by dividing earnings before interest and taxes, or EBIT, as calculated under IFRS, by the product of 12.5 times gross revenue calculated as a percentage, plus an additional 0.5 percent. EBIT refers to taxable mining income (with certain exceptions such as no deduction for interest payable and foreign exchange losses) before assessed losses but after capital expenditure. A maximum royalty of 5five percent of revenue has been introduced for refined minerals.
The royalty in respect of unrefined minerals (which include uranium) is calculated by dividing EBIT by the product of nine times gross revenue calculated as a percentage, plus an additional 0.5 percent. A maximum royalty of 7 percent of revenue was introduced for unrefined minerals. Where unrefined Mineral Resources (such as uranium) constitute less than 10 percent in value of the total composite Mineral Resources, the royalty rate in respect of refined Mineral Resources may be used for all gross sales and a separate calculation of EBIT for each class of Mineral Resources is not required. For AngloGold Ashanti, this means that currently the company will pay a royalty based on refined Mineral Resources (as the unrefined Mineral Resources (such as uranium) for AngloGold Ashanti for 20132016 constituted less than 10 percent in value of the total composite Mineral Resources). The rate of royalty tax payable for 20142016 was 1.280.50 percent of revenue of the company’s South African operations.
The President has appointed a committee to review the current mining tax regime. The committee, which is undergoing a review not just of the mining tax regime but of the entire South African tax regime, is currently sitting and has not yet made reportssitting. On 13 August 2015, the committee released for public comment the First Interim Report on Mining which was submitted on 01 July 2015 to the Minister of Finance. The committee has not proposed any changes to the royalty regime in this First Interim Report.
Some of the other preliminary recommendations of the committee have included the upfront capital expenditurewrite-off regime being discontinued and replaced with an accelerated capital expenditure depreciation regime, which is in parity with thewrite-off periods provided for in respect of the manufacturing (40/20/20/20) basis. Another recommendation has been to bring the taxation of newly established gold mines into line with the tax regime applicable tonon-gold mining taxpayers (in so far as possible). The committee has recommended that the so called “gold formula” be retained for existing gold mines. Given the retention of the gold formula for existing gold mines, it will be necessary to retain ring fences in mines where the gold formula subsists. With regard to the additional capital allowances available to gold mines, the committee has recommended that such allowances should be phased out so as to bring the gold mining corporate income tax regime into parity with the tax system applicable to taxpayers as a whole.
CONTINENTAL AFRICA
Democratic Republic of the Congo
The mining industry in the Democratic Republic of the Congo (DRC) is regulated primarily by the Mining Code enacted in July 2002 and its ancillary Mining Regulations, promulgated in March 2003 (DRC Mining Code). The DRC Mining Code vests the Minister of Mines with the authority to grant, refuse, suspend and terminate mineral rights, although such authority is to be exercised upon conditions set out in the Mining Code. Mineral rights may be granted in the form of exploration permits for an initial period of four years or in the form of mining permits which are granted for an initial period of 30 years. An exploration permit may, at any time before expiry, be transformed partially into a mining licence or a small-scale mining permit. Mining permits are granted upon successful completion of exploration and satisfaction of certain requirements, including approval of a feasibility study, an environmental impact study and an environmental management plan.
The holder of a mining permit is required to commence development and mine construction within three years of the award of such permit. Failure to do so may lead to forfeiture of the mining permit. A permit holder must comply with specific rules relating to, amongst others, protection of the environment, cultural heritage, health and safety, construction and infrastructure planning. Mining and exploration activities are required to be undertaken so as to affect as little as possible the interests of lawful occupants of land and surface rights holders, including their customary rights. The exercise of mineral rights by title holders which effectively deprives or interferes with the rights of occupants and surface rights holders requires payment of fair compensation by the mineral title holder.
To protect and enforce rights acquired under an exploration or mining permit, the DRC Mining Code provides, depending on the nature of a dispute or threat, administrative, judicial and national or international arbitral recourses.
The DRC Mining Code sets out taxes, charges, royalties and other fees payable to the treasury by a mining title holder in respect of its activities. It also provides for a level of fiscal stability, in that existing tax, customs, exchange and benefits applicable to the mining activities of a mining title holder are guaranteed to remain unchanged, for a period of 10 years in favouras from the date of a mining title holder in the event thatany amendments to the DRC Mining Code that would result in less favourable payment obligations.
On 1 January 2012, a value added tax (VAT) replaced the previously applicable sales tax. The standard rate of VAT is 16 percent and is applicable to mining companies.
On 1 January 2013, a withholding tax of 14 percent became effective. The tax is applicable to service fees payable to anon-resident service provider by a resident of the DRC.
On 18 July 2012, the Convention between the Government of the Republic of South Africa and the Government of the Democratic Republic of the Congo for the avoidance of double taxation and the prevention of fiscal evasion with respect to taxes on income (Convention) came into effect, and is applicable to:
withholding taxes on amounts paid or credited on or after 1 January 2013; and
other income taxes, levied in respect of taxable periods beginning on or after 1 January 2013.
53
The Convention reduces the withholding tax on dividends paid by companies resident in the DRC to companies resident in South Africa from 20 percent to 5five percent and on interest paid by companies resident in the DRC to companies resident in South Africa from 20 percent to 10 percent. A South African company must own at least 25 percent of a relevant DRC entity’s outstanding shares in order to take advantage of the reduced rates.
In 2012, the DRC Mines Minister announced a reform of the DRC’s mining code. Following such announcement, a number of proposed draft bills were circulated and a number of official meetings held amongst key players. According to recent available data, the proposed laws seek to, amongst other things, increaseThe reform, which would have increased royalties payable on certain minerals, boosted the government stake in mining operations to 15 percent from the existing 5 percent, substantially increase royalties on some minerals, reduce in a significant way the protections AngloGold Ashanti currently enjoys on its projects in the DRC, impose new conditions on the company’s ability to retain and renew licences and introduceintroduced a 50 percent levy on certain profits. Shouldprofits, among other changes, was postponed in February 2016 in light of the adverse impact of the collapse in commodity prices on existing mining activities. However, should such laws be enacted in the future, these may have a material adverse impact on the company’s results of operations in the DRC.
AngloGold Ashanti holds a stake in the Kibali gold project located in north-eastern DRC. The project is operated by Randgold Resources and is owned by Randgold Resources (45 percent), AngloGold Ashanti (45 percent) and SOKIMOSociété Minière de Kilo-Moto SA (SOKIMO) (10 percent), which latter share represents the interest of the DRC government in the Kibali gold project.
On 27 February 2015 AGA sold its stakeKibali comprises 10 permits, 7 expiring in Ashanti Goldfields Kilo,2029 and 3 in 2030 and covering an exploration and mining joint venture with Société Minière de Kilo-Moto (SOKIMO), to Fimosa Capital.
AngloGold Ashanti remains investedarea of 1,836 square kilometres in the DRC throughMoto goldfields of the Kibali Gold Project which it holds through a joint venture with Randgold Resources and SOKIMO.northeast DRC.
Ghana
The Constitution of Ghana as well as the Minerals and Mining Act, 2006 (Act 703) (GMM Act) provide that all minerals in Ghana in their natural state are the property of the State and title to them is vested in the President on behalf of and in trust for the people of Ghana, with rights of reconnaissance, prospecting, recovery and associated land usage being granted under licence or lease.
The grant of a mining lease by the Ghana Minister of MinesLands & Natural Resources (MOLNR) upon the advice of the Minerals Commission is normally subject to parliamentary ratification unless the mining lease falls into a class of transactions exempted by Parliament.
Control of mining companies
The Ghana Minister of MinesMOLNR has the power to object to a person becoming or remaining a shareholder controller a majority shareholder controller or an “indirect controller” of a company which has been granted a mining lease if the Minister believes, on reasonable grounds, that the public interest would be prejudiced by the person concerned becoming or remaining such a controller.
Stability agreement
The GMM Act provides for stability agreements as a mechanism to ensure that the incentivesguarantee certain terms and protection afforded by laws in force at the time of the stability agreementconditions, mainly fiscal, to which a company’s operations are guaranteedsubject for a period of 15 years. Stability agreements are subject to ratification by Parliament.
Prior to the business combination between AngloGold and Ashanti in AprilOn 18 February 2004, AngloGold and the governmentGovernment of Ghana agreed on the terms of a stability agreement (the “Ghana(Ghana Stability Agreement”)Agreement) to govern certain aspects of the fiscal and regulatory framework under which AngloGold Ashanti would operate in Ghana following the implementation of the business combination. The Ghana Stability Agreement necessitated the amendment of the Obuasi mining lease which had been ratified by Parliament.
Under the Ghana Stability Agreement, the governmentGovernment of Ghana agreed:
to extend the term of the mining lease relating to the Obuasi mine until 2054 on terms existing prior to the business combination;
to maintain, for a period of 15 years, the royalties payable by AngloGold Ashanti with respect to its mining operations in Ghana at a rate of 3 percent per annum of the total revenue from minerals obtained by AngloGold Ashanti from such mining operations;
to ensure the income tax rate would be 30 percent for a period of 15 years. The agreement was amended in December 2006 to make the tax rate equal to the prevailing corporate rate for listed companies if the rate was less than 30 percent; and
to permit AngloGold Ashanti and any or all of its subsidiaries in Ghana to retain up to 80 percent of export proceeds in foreign currencies offshore, or if such foreign currency is held in Ghana, to guarantee the availability of such foreign currency.
54
The Ghana Stability Agreement also stipulates that a sale of AngloGold Ashanti’s or any of its subsidiaries’ assets located in Ghana remains subject to the government’sGovernment’s approval. Furthermore, the governmentGovernment retains its special rights (Golden Share) under the provisions of the GMM Act pertaining to the control of a mining company, in respect of its assets and operations in Ghana.
The governmentGovernment of Ghana agreed that AngloGold Ashanti’s Ghanaian operations will not be adversely affected by any new enactments or orders, or by changes to the level of payments of any customs or other duties relating to mining operations, taxes, fees and other fiscal imports or laws relating to exchange control, transfer of capital and dividend remittance for a period of 15 years after the completion of the business combination.
The government of Ghana has constituted a review committee to review and renegotiate stability agreements with the mining companies. Within the committee’s powers of review are the redrafting of such stability agreements, the determination of whether stability agreements comply with the miningTax laws of Ghana and the Ghanaian legal regime for mining (fiscal requirements, foreign exchange regulations and the provisions of the tax laws), and the preparation of guidelines to govern the granting of stability agreements in the mining industry. We are currently participating in negotiations with the Ghanaian review committee.
In March 2012 the tax laws of Ghana were amended. Changes to the tax laws included:
An increase in the income tax rate applicable to mining businesses from 25 percent to 35 percent. AngloGold Ashanti is currently protected until 2019 from any increase of its income tax rate to greater than the rate provided for under the Ghana Stability Agreement.
Introduction of a new capital allowance regime for class 3 assets (which include mineral and petroleum exploration and production rights, buildings, structures and works of a permanent nature used in mineral and petroleum exploration and production and plant and machinery used in mining and petroleum operations) that provides for a 20 percent straight line rate for a period of five years. Pursuant to the Ghana Stability Agreement, this change will not affect AngloGold Ashanti until 2019.
Elimination of the 5five percent allowance on prior year additions. Prior to the 2012 amendment, the tax code granted an additional 5five percent of the value of assets acquired and qualified to be classified as class 3 assets for the purpose of granting capital allowances. Capital allowance is now 20 percent each year on the total value of the assets. Pursuant to the Ghana Stability Agreement, this change will not affect AngloGold Ashanti until 2019.
A ring fencing rule to prevent mining businesses from deducting or setting off costs from one mining area with another’s income. Pursuant to the Ghana Stability Agreement, this change will not affect AngloGold Ashanti until 2019.
While the Stability Agreement protects AngloGold Ashanti from any new enactments that would impose obligations upon AngloGold Ashanti or any of its Ghanaian subsidiaries, the Government of Ghana has constituted a team to renegotiate stability agreements with mining companies. A government committee has invited AngloGold Ashanti for discussions and requested certain information. The government may intend to review the Ghana Stability Agreement.Golden Share
Under the Stability Agreement, the Government of Ghana (Government) has confirmed and agreed that the Government’s rights with respect to the Golden Share apply only in respect of AngloGold Ashanti’s assets and operations in Ghana. The rights do not extend to any other assets or operations of AngloGold Ashanti outside Ghana, nor to any assets or operations of AngloGold Ashanti.
The Government has also agreed to waive any right it may have under Section 60(I) of the Minerals and Mining Law, 1986, as amended to acquire a special share in AngloGold Ashanti or any of its direct or indirect subsidiaries or joint ventures.
The Golden Share may only be held by or transferred to a Minister of the Government or any person acting on behalf of such Government and authorised in writing by such Minister.
The following matters require, and will not be effective without, the written consent of the holder of the Golden Share:
| (i) | any amendment to or removal of the relevant provisions of the AngloGold Ashanti (Ghana) Limited Regulations setting out the rights and restrictions attaching to the Golden Share; |
| (ii) | the voluntarywinding-up or voluntary liquidation of AngloGold Ashanti (Ghana) Limited; |
| (iii) | the redemption of or purchase by AngloGold Ashanti of the Golden Share; |
| (iv) | the disposal of any mining lease held by AngloGold Ashanti (Ghana) Limited or any subsidiary of AngloGold Ashanti (Ghana) Limited; and |
55
| (v) | any disposal by AngloGold Ashanti (Ghana) Limited (other than any disposal in the ordinary course of business of AngloGold Ashanti) which, alone or when aggregated with any disposal or disposals forming part of, or connected with, the same or a connected transaction, constitutes a disposal of the whole or a material part of the assets of the AngloGold Ashanti group taken as a whole. For this purpose, a part of the AngloGold Ashanti group’s assets will be considered material if either (a) its book value (calculated by reference to the then latest audited consolidated accounts), or the total consideration to be received on its disposal, is not less than 25 percent of the book value of the net assets of the AngloGold Ashanti group or (b) the average profits attributable to it represent at least 25 percent of the average profits of the AngloGold Ashanti group for the last three years for which audited accounts are available (before deducting all charges, except taxation and extraordinary items). |
Upon a return of assets in awinding-up or liquidation of AngloGold Ashanti (Ghana) Limited, the holder of the Golden Share is entitled to the sum of 0.10 cedis (approximately 5 US cents) in priority to any payment to other members, but the Golden Share confers no further right to participate in the profits or assets of AngloGold Ashanti. The Golden Share carries no right to any dividend or any right to participate in any offer of securities to existing shareholders or in any capitalisation issue.
The holder of the Golden Share may require AngloGold Ashanti (Ghana) Limited to redeem the Golden Share at any time in consideration of the payment to such holder of 0.10 cedis (approximately 5 US cents).cedis.
VAT
In December 2013, the Parliament of Ghana (Parliament) passed an amendment to the Internal Revenue Act, 2000 (Act 592) known as the Internal Revenue (Amendment) (No. 2) Act 2013, (Act 871). This, amongst other changes, increased the withholding tax for goods and services supplied by non residents,non-residents, payments tonon-resident individuals and payment for management and technical services from 15%15 percent to 20%.20 percent. A new Value Added Tax Act, (VAT) 2013 (Act 870) wasimposes a 15 percent VAT payable on goods and services. The National Health Insurance Act 2012 (Act 852) also passed which increases theimposes a 2.5 percent VAT payable on goods and services. The total VAT payable on goods and services from 15% to 17.5%.is therefore 17.5 percent. The Value Added Tax 2013, (Act 870) extended the coverage of the tax to some business activities which were hitherto outside the tax net. These included the supply of financial services that are rendered for a fee, commission or a similar charge and the manufacture or supply of pharmaceuticals. The implementation of the charging of VAT in relation to these two services havehas however been suspended until further notice. These taxes do not have an adverse effect on the Company since they do not directly impact its operations.
Income taxes
In November 2015, Parliament passed the Income Tax Act, 2015 (Act 896) (ITA) which repealed the Internal Revenue Act, 2000, (Act 592), as amended. The ITA became effective from 1 January 2016 for the 2016 year of assessment. The ITA ring fences and taxes income derived from mining operations at the rate of 35 percent. For the purpose of ascertaining the income of a person for taxation, each separate mineral operation is treated as independent business and taxed accordingly. Pursuant to section 2.06 of the Stability Agreement, the ring fencing provision will not apply to AngloGold Ashanti until 2019 and until then the company’s tax exposure will not exceed 30 percent.
The ITA provides for the carrying forward of losses for up to five years. Losses carried forward can only be used in the order in which they were generated or incurred. The ITA further provides that capital allowances calculated or granted shall be taken in that year and shall not be deferred.
The ITA states that expenditure incurred in the course of reconnaissance or prospecting operations shall be placed in a single pool, and the balance in that pool is to be carried forward year to year until commencement of production. When production commences, the amount in the pool must be capitalised and the Commissioner-General of the Ghana Revenue Authority shall grant a capital allowance in respect thereof. The ITA also provides guidance on how costs incurred during the reconnaissance and exploration phase of a mine ought to be treated.
The ITA imposes a withholding tax on dividends paid by a person conducting mineral operations in Ghana at eight percent. This is regardless of the amount of shareholding a shareholder or shareholders may have in the entity paying the dividend. Under section 59 (3) of the ITA, an exemption from tax exists where the recipient of the dividend holds or controls directly or indirectly at least 25 percent of the voting power of the company paying the dividend.
The ITA also introduces some variation in the rates of withholding taxes. For example payments for the supply of services (Payments with a Source in Ghana to Persons Other Than Individuals) has been increased from 5 percent to 15 percent; the withholding tax on resident Directors’ remuneration has been increased from 10 percent to 20 percent; and withholding taxes on natural resource payments and royalties have been increased from 10 percent to 15 percent. This may have an indirect impact on AngloGold Ashanti’s operations as this rate will have a material impact on the margins of suppliers and possibly their working capital. Suppliers may therefore seek to pass this on to AngloGold Ashanti by increasing their fees and charges.
The ITA also abolishes the flat 15 percent rate of tax on capital gains. Capital gains are now to be included in business or investment income and taxed at the applicable income tax rate which, for persons engaged in mineral operations, is 35 percent.
Various amendments were made to the ITA as follows:
Income Tax (Amendment) Act, 2015 (Act 902) to provide for new rates of tax on the chargeable income of resident individuals for a year of assessment, introducing the withholding tax rate applicable to fees payable to an individual for services considered as “any other supply of services” and increases the monetary threshold for an individual to whom a presumptive tax applies and for related matters.
Income Tax (Amendment) Act 2016 (Act 907) to remove the 1% tax on interests earned by investors, and also reduce withholding tax on services from 15% to 7.5% under the ITA.
The Income Tax Regulations L.I. 2244 pursuant to the provisions of the ITA was also introduced to reduce the income tax imposed on the wages of casual and temporary workers from the previous rate of7.5%-15% to a fixed rate of 5%.
Retention of foreign earnings
AngloGold Ashanti’s operations in Ghana are permitted to retain 80 percent of their foreign exchange earnings in an offshore foreign exchange account. In addition, the company has permission from the Bank of Ghana to retain and use US dollars, outside of Ghana, required to meet paymentsfulfill payment obligations to the company’s hedge counterparties which cannot be met from the cash resources of its treasury company.Oncompany. On 4 February 2014, the Bank of Ghana issued new directives as part of measures to streamline the collection and repatriation of export proceeds to Ghana. These directives included an instruction to all banks and authorised dealers to, within five working days of receipt of export proceeds, convert the proceeds into Ghana cedis based on the average Interbank Foreign Exchange Rate prevailing on the day of conversion with a spread not exceeding 200 percentage in points (pips). Exporters with retention accounts were to continue to operate these accounts in accordance with their retention agreements. Retention proceeds which were sold to the banks were to be converted into Ghana cedis based on the average Interbank Foreign Exchange Rate prevailing on the day of conversion with a spread not exceeding 200 pips. It further advised that offshore foreign exchange transactions by resident companies, including exporters, were strictly prohibited and exporters were to ensure that all export proceeds are repatriated in full. Failure to comply with the provisions attracts penalties including pecuniary sanctions, jail terms, suspension and revocation of the operating licence as applicable.
Following engagement with relevant stakeholders, the Bank of Ghana issued another notice clarifying that the transfer of foreign exchange to meet external payment obligations remains permissible for transactions such as:
|
|
|
redemptions and coupon payments on Bonds held bynon-residents;
investment income, technology and management transfer entitlements, expatriate emoluments, and other incentive packages and overseas commitments under provisions in various legislation and legislative instruments such as the GMM Act, and the Technology Transfer Regulations ( L.I.1547 ); and
other outward payments for imports of goods and services.
The notice also stated that all balances in Foreign Currency Accounts (FCAs) and Foreign Exchange Accounts (FEAs) will continue to be held in foreign currency, and will not be converted into Ghana Cedis. External transfers of up to $10,000 per annum without documentation from FEA and FCA are still permitted. Balances held in FEAs and FCAs continue to remain available for all legitimate external transactions.
56
The Bank of Ghana on 9 August 2014 further revised the rules on foreign exchange operations, effectively reversing the initial directives controlling transactions in foreign exchange. The details are as follows:
The limit of $1000.00 onover-the-counter foreign exchange cash withdrawal is removed.
|
|
|
|
|
|
|
|
|
|
|
Exporters shall continue to repatriate in full export proceeds in accordance with the terms agreed between the trading parties. Such proceeds shall be credited to their FEAs and converted on a need basis.
FEAs and FCAs will continue to be opened and operated as they were before the Notices of February 4, 2014.
Except for transfers from FEA to FCA which are still prohibited, all other transfers between accounts are permitted.
For the avoidance of doubt:
FCAs shall be fed only with unrequited transfers such as transfers from abroad for investment or embassy transfers.
FEAs shall be fed with foreign exchange generated from activities in Ghana such as proceeds from exports of goods and services.
The threshold for transfers abroad without initial documentation remains at $50,000.00. Where documentation in respect of a transfer remains outstanding, any subsequent import transaction by an importer, irrespective of value, shall only be made on prior provision of documentation required for the current import transaction.
Importers who usenon-cash instruments (plastic cards) may continue to load up to $50,000 to meet their legitimate needs abroad subject to the necessary documentation requirements.
Foreign currency denominated loans may be granted by resident banks to their customers subject to their own internal procedures and processes and in compliance with the risk management guidelines of the Bank of Ghana.
Cheques and cheque books may be issued by banks to holders of FEAs and FCAs.
The Bank of Ghana reiterated that the Ghana cedi remains the sole legal tender in Ghana. Therefore, pricing, advertising, invoicing, receiving, and making payments for goods and services should be done in Ghana cedis, unless otherwise authorized by the Bank of Ghana.
Existing measures that were not amended by this Notice continue to remain in force.
In light of the recent clarifications, AGAAngloGold Ashanti maintains and operates its FCA, FEA and Retention Accounts in compliance with the directives.
Localisation policy
Mining companies must submit a detailed programme for the recruitment and training of Ghanaians with a view to achieving “localisation”, which is the replacement of expatriate personnel in a company’s Ghanaian operations by Ghanaian personnel. In addition, mining companies must give preference to Ghanaian products and personnel, to the maximum extent possible, consistent with safety, efficiency and economies. Recently passed Minerals and Mining (General) Regulations, 2012 (L.I. 2173) give further details on the localisation policy.
Except as otherwise provided in a specific mining lease, all immovable assets of the holder of the mining lease vest in the State upon termination, as does all moveable property that is fully depreciated for tax purposes. Moveable property that is not fully depreciated is to be offered to the state at the depreciated cost. The holder must exercise his rights subject to such limitations relating to surface rights as the Minister of Mines may prescribe.
Ground rent
In 2012, the Ghanaian Parliament passed the Fees and Charges Amendment Legislation 2012 (Ll 2191), which fixed mineral concession rent at GH¢Gh¢9,016 per square kilometre per annum as opposed to the previous rate of GH¢Gh¢0.50 per acre per annum. However, on 19 March 2014, the Office of the Administrator of Stool Lands informed the Ministry of Finance in writing that it has agreed with the Ghana Chamber of Mines to revise the fees to GH¢Gh¢15.0 per acre per annum. The Chamber has since 2 September 2014 informedinstructed all mining companies to pay the agreed sum. The CompanyFees and Charges (Amendment) Instrument 2015 (LI 2208), was passed by Parliament on December 23, 2015, which, among other things, fixes the payment of ground rent by mining companies at Gh¢15 per acre per annum. The company has since paid the agreed ground rent for its Binsere Leases but paid $36 per km2km2 for the Obuasi lease as specifically provided for in the lease. The Companycompany also indicated to the Office of the Administrator of Stool Lands that by virtue of the Ghana Stability Agreement, the Companycompany is protected from the incrementincrease in the ground rent for the duration of the Stability Agreement, and that the Company’scompany’s payment of same cannot be deemed as a waiver of its rights under the Stability Agreement.
National Fiscal Stabilisation (Amendment) Act, 2014 (Act 882)
The National Fiscal Stabilisation (Amendment) Act has extended the application of the National Fiscal Stabilisation Levy to net profits before tax up to and including the 2017 year of assessment. In the past, AngloGold Ashanti has sought protection under the Stability Agreement and this has been granted. AngloGold Ashanti will therefore continue seeking the protection.
Special Import Levy Act, 2014 (Act 884)
The Special Import Levy Act has extended the application of the National Fiscal Stabilisation Levy to profits before tax up to and including the 2017 year of assessment.
Customs and Excise (Petroleum Taxes and Petroleum Related Levies) (Amendment) Act, 2014 (Act 886)
57The Customs and Excise (Petroleum Taxes and Petroleum Related Levies) (Amendment) Act reversed the excise tax on petroleum products (petroleum, gas oil, residual fuel oil, unified gasoline, kerosene, liquefied petroleum gas and local marine gas) from ad valorem to specific tax.
Following the passage of the Customs (Amendment) Act, 2015 (Act 905), by the Ghana Revenue Authority, the ECOWAS Regional Common External Tariff (CET) came into effect on 1 February 2016. It replaces the Harmonised Systems: Common External Tariff and Other Schedules. The CET is one of the instruments of harmonising ECOWAS Member States and strengthening its Common Market.
Energy Sector Levies Act, 2015 (Act 899)
The Energy Sector Levies Act, which received assent on 24 December 2015, consolidates existing energy sector levies and imposes a new levy, the Price Stabilization and Recovery Levy. The Price Stabilization and Recovery Levy, which is to be collected by the National Petroleum Authority and paid into the Price Stabilisation and Recoveries Account, applies to petrol at a rate of 12 Ghana pesewas per litre, to diesel at a rate of 10 Ghana pesewas per litre, and to liquefied petroleum gas at a rate of 10 Ghana pesewas per kilogram.
Minerals and Mining (Amendment) Act 20142015 (Act 900)
A draft Minerals and Mining (Amendment) Bill is currently being consideredAct was passed by Parliament.Parliament and assented to by the President on 16 December 2015. It proposes to replacereplaces the existing royalty provisions introduced by the Minerals and Mining Amendment Act, 2010 (Act 794) in terms ofpursuant to which the rate of royalties iswas fixed by an Act of Parliament to a situation whereParliament. Under the new regime, the Minister wouldwill prescribe the rate payable and the manner of payment throughby passing a Legislative Instrument or other subsidiary legislation. The existing royalty rate of 5% wouldfive percent however remainremains the same until such time as the rate is altered in the manner prescribed. The Minerals and Mining (Amendment) Act 2015 also makes provision for the confiscation of the equipment of illegal miners.
Minerals Development Fund Bill, 2014Act 2016 (Act 912)
Parliament is also currently consideringhas passed the Minerals Development Fund Bill, 2014.Act, 2016 (Act 912). The purpose of the Billlaw is to establish a Minerals Development Fund (MDF) to provideaddress the legal basis for the distribution of 20%development challenges affecting mining communities by setting aside 20 percent of mineral royalties received by Government which has been apportionedthe government for development projects. The MDF is to specified bodiesprovide financial resources for their use. It alsothe direct benefit of communities within mining areas. The law introduces the Mining Community Development Scheme to directly sponsor-socio-economicsponsor socio-economic development in communities in which mining operations take place or which are affected by mining operations.activities.
Mining & Environmental Guidelines
In June 2014, the Ghana Environmental Protection Agency and the Minerals Commission circulated draft Mining and Environmental Guidelines to all mining companies for comment. The guidelines concern environmental management, reclamation, closure requirements and the proposed Mining Community Development Scheme. The Mining Community Development Scheme has since been established pursuant to the Minerals Development Fund Act 2016 (Act 912), discussed above. Although the guidelines are yet to be agreed upon by stakeholders, it is proposed that the scheme would be funded by said 20% of mineral royalties, additional contributions from the mining companies, donations and grants from other sources.
Rules regarding the export of gold and diamonds
The Bank of Ghana introduced new measures to regulate and monitor the export of gold and diamonds from Ghana. From 15 September 2015, all exports of gold and diamonds must be carried out through the Precious Minerals Marketing Company, except where the exporter is the holder of a licence that permits it to export directly, and the Ghana Revenue Authority (Customs Division) only permits gold to be exported by a licensed gold exporter who has a completed Form FEX A4 bearing Bank of Ghana’s embossment. The export measures do not apply to AngloGold Ashanti because the company holds a licence granted by the Minister for Lands and Natural Resources to sell and export its production.
The Bank of Ghana issued a notice on (Notice No. BG/GOV/SEC/2016/02) which, among other things, now allows mining companies to sell the portion of foreign exchange receipts from export that was earmarked for surrender to the Bank of Ghana directly to the commercial banks.
In November 2016 the Ministry of Lands and Natural Resources issued a ministerial directive appointing the Precious Minerals Marketing Company Ltd (PMMC) as designated laboratory for assaying in Ghana. The directive requests all persons holding export licenses for gold to submit all gold to be exported to the PMMC for assay before export. Mining businesses, including AngloGold Ashanti, acting through the Ghana Chamber of Mines are opposed to this and the Chamber has initiated measures to get the directive reversed or modified due to its potential negative impact on mining companies in the region.
Budget StatementStatements
In the November 2014 Budget Statement, the following taxes were proposed:
Imposition ofa Special Petroleum Tax of 17.5 percent was proposed as part of a rationalizationrationalisation of the VAT regime and change in the petroleum pricing structure – this policy comes with a mitigation account to manage extremely low and high prices that result in sporadic price increases or decreases under the automatic adjustment formula;structure.
Reversal of the excise tax on petroleum from ad valorem to specific;
Extension of the National Fiscal Stabilisation Levy of 5 percent and special import levy of 1-2 percent to 2017; and
Increase the withholding tax on Directors’ remuneration from 10 percent to 20 percent;
Mining properties
The company is required to pay ground rent to the Government of Ghana and such other fees as are prescribed by legislation, including royalties on timber felled within the lease area.
Obuasi
The current mining lease for the Obuasi area was granted by the Government of Ghana on 5 March 1994. It grants mining rightsconcessions to land with an area of approximately 334338 square kilometres in the Amansie East and Adansi West districts of the Ashanti region for a term of 30 years from the date of the agreement. In addition, a mining lease over an adjacent 140 square kilometres was also granted, resulting in the total area under the mining lease increasing to 474 square kilometres.
The Government of Ghana agreed to extend the term of the mining lease relating to the Obuasi mine until 2054. The mining lease was formally ratified by Parliament on 23 October 2008.
On 20 January 2014, AGAG submitted an application to3 March 2016, the Minerals Commission approved AngloGold Ashanti Ghana’s application to surrender approximately 289.34273.54 square kilometres of the area to the Government of Ghana. Upon issuance by the Government of the certificate of surrender,Ghana, reducing the lease areas will be reduced to 185.66201.46 square kilometres.Thekilometres. The remaining parcel of land that will be subject to the mining lease is situated within various villages and townships in the region, but excludes the municipality of Obuasi.
58
Iduapriem
Iduapriem has title to a 3331 square kilometre mining lease granted on 19 April 1989 for a period of 30 years. In January 2009 Iduapriem obtained a new mining lease, the Ajopa Concession, for a period of 10 years. The concession covers an area of 48.34 square kilometres. In December 2011 the Minister of Lands and Natural Resources gave his consent for Teberebie’s title to a 25.83 square kilometre mining lease, granted in June 1992 for a period of 30 years, to be assigned to Iduapriem. While ownership of the lease has passed to Iduapriem, the registration of the transfer of the lease is still in process.
Guinea
In Guinea, all mineral substances are the property of the state.State. Mining activities are currently regulated by law L/2011/006/CNT dated 9 September 2011 (the “2011 Code”), as amended by law L/2013/053/CNT dated 8 April 2013 and promulgated by Decreedecree D/2013/075/PRG/SGG dated 17 April 2013(together2013 (together, the “New Mining Code”)Code).
The Mining Code is accompanied and implemented by various implementation decrees. To date, various decrees have been adopted, including decree D/2014/015/PRG/SGG adopting a model of mining convention, dated 17 January 2014, order A/2016/1584/MMG/SGG related to the administration’s capacities for the management of integrated mining projects(PARCA-GPI) and its steering committee, dated 6 June 2016, decree D/2016/163/PRG/SGG on the national agency for the development of mining infrastructures (ANAIM), dated 13 June 2016, and decree D/2016/215/PRG/SRG on the appointment of executives to the Ministry of Mines and Geology, dated 8 July 2016.
The right to undertake mining operations can only be acquired by virtue of one of the following mining titles: surveying permit, small-scale mining licence, mining prospectingexploration licence, mining licence or mining concession.
The group’s Guinea subsidiary, Société AngloGold Ashanti de Guinée SA (“SAG”)(SAG), has title to the Siguiri mine in the form of a mining concession, granted by virtue of Presidential Decree D/97/171/PRG/SGG dated 4 August 1997, for a period of 25 years (the Mining Concession). The Mining Concession was originally covered by a mining convention which was entered into with the Republic of Guinea on 11 November 1993 (the “Convention de Base”). The mining concession, granted to SAG following the execution of the Convention de Base, was redefined by virtue of Presidential Decree D/97/171/PRG/SGG dated 4 August 1997. The Convention de Base wasBase) and amended in 2005. The Convention de Base providesprovided for aan initial duration of 25 years with an eventual extension/renegotiation after 23 years for such periods as may be required to exhaust the economic Ore Reserve.and would have expired in 2018.
At Siguiri, the original area granted of 8,384 square kilometres was reduced to a concession area of four blocks totalling 1,495 square kilometres. SAG has the exclusive right to explore and mine in the remaining Siguiri concession area for the duration of the initial period of the Convention de Base.
Key elements of the Convention de Base are that:
The Republic of Guinea holds a 15 percent free-carried or non-contributory interest; is entitled to a royalty of 3 percent based on a spot gold price of less than $475 per ounce; and is owed 5 percent of the value of gold exported, based on a spot gold price above $475 per ounce, as fixed on the London Gold Bullion Market;
A local development tax of 0.4 percent is payable on gross sales revenue;
Salaries of expatriate employees are subject to a 10 percent income tax;
Mining goods imported into Guinea are exempt from all import taxes and duties for the first two years of commercial production; and
SAG is committed to adopting and progressively implementing a plan for the effective rehabilitation of the mining areas disturbed or affected by operations.
The Convention de Base is subject to early termination if both parties formally and expressly agree to it, if all project activities are voluntarily suspended for a continuous period of eight months or are permanently abandoned by AngloGold Ashanti’s subsidiary; or if SAG goes into voluntary liquidation or is placed into liquidation by a court of competent jurisdiction.
New Mining Code
Pursuant to the New Mining Code, existing mining titles in effect on the date on which the New Mining Code came into force remain valid for their duration and forafter the substances for which they have beenconclusion of the Mining Convention, confirms the validity of mining titles previously issued. The New Mining Code does not allow mining conventions to derogate from its provisions butalso provides that for holders of validly signed and ratified mining conventions, the application of the Mining Code will take place by way of amendments to the relevant mining convention (in the case of SAG, the Convention de Base), which amendments are set out in an Addendum to be negotiated between the mining convention holder and the StateState.
On 28 June 2016, SAG and the Government of Guinea concluded a revised and consolidated convention de base (the “Addendum”). The Addendum is required to be approved by the Council of Ministers, signed by the Minister of Mines, transmitted to the Supreme Court for its opinion and then to the National Assembly for ratification. Mining companies must cooperate in viewRevised Convention de Base) which encompasses a renewal of the conclusionterm of the Addendum within a 24-month delay following the publication of the New Mining Code. The 24-month delay period is expected to end on or shortly before June 2015. To that effect, the Government has established a Technical Committee, supported by a Strategic Committee, to conduct the renegotiations of all the mining contracts including the Convention de Base. Until ratification of the Addendum, the terms of the currentoriginal Convention de Base apply.
59
The type of amendments expected to be contained in the Addendum, are categorised below by the method and timing of implementation:
|
|
|
Once signed and ratified, the provisions of the Mining Code, the Revised Convention de Base as amendedwas ratified by the Addendum, will govern mining activities onGuinean National Assembly (law L/2016/N°067/AN dated 30 December 2016, promulgated by decree D/2017/015/PRG/SGG dated 24 January 2017), submitted to the Siguiri concession. WhileGuinean Supreme Court which rendered a favourable opinion (judgment N°AC 005 dated 16 January 2017), and ratified by the exact contentPresident of the Addendum will depend onRepublic (decree D/2017/021/PRG/SGG dated 24 January 2017).
As a consequence, as and from 24 January 2017, the outcome of the negotiations with the Technical Committee, it can be anticipated that the Addendum will contain the Mandatory Provisions and will also provide a time table for the implementation of the Progressive Provisions.
With respect to the Mandatory Provisions, the New Mining Code provides that mining companies must adhere to the principles of the Extractive Industries Transparency Initiative (EITI). The EITI sets a global standard for oil, gas and mining companies to disclose payments to governments and for governments to disclose what they receive. The Mandatory Provisions also provide for the requirement to obtain ministerial consent in respect to any transfer of a mining right as well as any form of direct or indirect transfer of interest in a mining title of 5 percent or greater. In addition, the Mandatory Provisions also provide for a transfer tax regime entailing the payment of a 10percent registration fee, in addition to capital gain tax on the assignment of titles, on the transfer of shares in the company holding the mining titles and on an acquisition of participation leading to an indirect change of control of the title holder.
The Progressive Provisions require, amongst others, the implementation of a training and development plan contemplating a transfer of technology as well as preference for Guinea companies. The Progressive Provisions also establish fixed minimum quotas of Guinean personnel. These quotas depend on the stage of the project and the level of hierarchy. The Progressive Provisions further require that certain positions (General Manager, Deputy General Manager) be filled by Guinean citizens by certain deadlines.The Progressive Provisions provide for minimum quotas of contracts with SMEs, SMIs and businesses belonging to or controlled by Guineans to be complied with by title holders and their sub-contractors.
In addition, certain provisions introduced by the New Mining Code that were not otherwise covered by the previous mining legislation or are not covered by theRevised Convention de Base are likelyhas cancelled and replaced the original Convention de Base, and governs the operations at the Siguiri mine and under the Mining Concession.
Key elements of the Revised Convention de Base include the following:
a duration of 25 years, expiring 23 January 2042, subject to apply to SAG, including a limitation on tax stability. The current tax regime applicable to SAG is only guaranteed until November 2018.further renewal if mining operations continue at that time; and with the term of the Mining Concession being aligned with the term of the Revised Convention de Base such that the Mining Concession will be renewed as long as the Revised Convention de Base remains in force;
The NewSAG’s operations remain governed by the 1995 Mining Code isand are only subject to be accompanied and implemented by various implementation decrees. To date, decree D/2014/012/PRG/SGG on the management of mining authorisation and titles, D/2014/013/PRG/SGG relating to the application of the financial provisions of the New Mining Code decree D/2014/014/PRG/SGGto the extent they are expressly set out in the Revised Convention de Base;
the stability of the customs and tax regime is guaranteed for the entire initial term of the Revised Convention de Base, and subject to certain condition being met, any renewal period(s);
the Republic of Guinea holds a 15 percentfree-carried/non-contributory interest;
the Republic of Guinea is entitled to a royalty on gold of 5% based on a spot gold price as per LBMA fixing (PM) up until the date of steady state commercial production of the first phase of the Expansion, after which the royalty rate applicable to gold will vary depending on threshold prices as per LBMA fixing (PM), namely: 3% if the gold price is USD 1,300 or less, 5%, if above USD 1,300 and up to USD 2,000 and 7% if above USD 2,000;
SAG will enjoy a 5 year income tax holiday as and from the beginning of steady state commercial production of the first phase of the Expansion, after which the income tax rate is set at 30%;
a local development tax of 0.4 percent is payable on the adoptionsale price for gold and silver received by SAG up until 31 December 2027, after which it will be increased to 0.6 percent;
salaries of expatriate employees are subject to a directive10 percent income tax;
goods imported into Guinea for purposes related to the construction and commissioning of the first phase of the Expansion are exempt from all customs taxes and duties; and
SAG is committed to adopting and progressively implementing a plan for the realisationeffective rehabilitation of the mining areas disturbed or affected by its operations.
The Mining Concession covers an environmentalarea divided into four blocks and social impact studytotalling 1,495 square kilometres. SAG has the exclusive right to explore and mine in any part of the concession area for the duration of the period of the Revised Convention de Base. The Revised Convention de Base also grants SAG with the option to secure certain land rights over additional areas currently covered by exploration permits, but to which SAG may need access for purposes of establishing roads or storage of tailings.
The Revised Convention de Base is subject to early termination if the parties formally and expressly agree to it, if the last of the mining operations and decree D/2014/015/PRG/SGG adoptingtitle held by SAG expires or is relinquished without any renewal application having been filed, if all project activities are voluntarily suspended for a modelcontinuous period of mining convention, all dated 17 January 2014, have been adopted. In addition, decree D/2015/016/PRG/SGG on the government appointmenttwelve months or are permanently abandoned by SAG; or if SAG goes into voluntary liquidation or is placed into liquidation by a court of Guinean directors of mining companies, was adopted on 12 February 2015.competent jurisdiction.
Mali
Mineral rights in Mali are governed by lawn°2010-015 dated 27 February 2012 bearing Malian Mining Code (the “New(New Mining Code”)Code), replacing ordinance No.99-32/P-RM of 19 August 1999 enacting the previous mining code, as amended by ordinancen°013/2000/P-RM of 10 February 2000 and ratified by lawn°00-011 of 30 May 2000 (the “1999(1999 Mining Code”)Code), and DecreeNo. 99-255/P-RM of 15 September 1999 implementing the Mining Code.
Due to stabilisation clauses in the agreement defining the mining rights and obligations of AngloGold Ashanti entities in Mali (further described below), the mining operations carried out by the AngloGold Ashanti entities in Mali are subject to the provisions of the previous mining codes of 1970 and 1991 but also, for residual matters, expressly subject to the provisions of the 1999 Mining Code (see “Applicable mining regime” below). As a consequence the New Mining Code does not apply to the relevant mining operations.
60
Applicable mining regime
Prospecting activities are carried out under prospecting authorisations (authorisation(autorisation de prospection). The authorisations give an individual or corporate entity the exclusive right to carry out prospecting activities over a given area for a period of three years renewable without a reduction in the area covered by the authorisation. Exploration activities may be carried out under exploration permits (permis de recherche). The latter are granted to corporate entities only by order of the Minister of Mines. Exploration permits are granted for a period of three years, renewable twice for additional three-year periods. Each renewal requires the permit holder to relinquish 50 percent of the area covered by such permit. The entity applying for such a permit must provide proof of technical and financial capabilities.
An exploitation permit (permis d’exploitation) is required to mine a deposit located within the area of a prospecting authorisation or an exploration permit. The exploitation permit grants an exclusive right to prospect, explore and exploit the named substances for a maximum period of 30 years renewable three times for an additional 10 years. The exploitation permit is granted only to the holder of an exploration permit or of a prospecting authorisation and covers only the area governed by the exploration permit or the prospecting authorisation. An application must be submitted to the Minister of Mines and to the National Director of Mines.
As soon as the exploitation permit is granted, the permit holder must incorporate a company under the law of Mali. The permit holder will assign the permit for free to this company. The State will have a 10 percent free carried interest in the company. This interest will be converted into priority shares and the State’s participation will not be diluted in case of an increase in capital.
Applications for exploitation permits must contain various documents attesting to the financial and technical capacity of the applicant, a detailed environmental study in respect of the impact of the project on the environment, a feasibility study and a bank deposit. The permit is granted by decree of the Head of Government. Refusal to grant a permit may only be based on two grounds: insufficient evidence to support the exploitation of the deposit or the failure of the environmental study.
Applications for prospecting authorisations and exploration permits must contain various documents attesting to the financial and technical capacity of the applicant, a detailed works and costs programme, a map defining the area which is being requested and providing geographical coordinates, the exact details relating to the identity of the applicant and evidence of the authority of the signatory of the application. Such titles are granted by ministerial order. Any refusal to grant such titles shall be notified by letter from the Minister of Mines to the applicant.
All mining titles mentioned above require an establishment convention (convention d’etablissement)d’établissement) to be signed by the State and the titleholder defining their rights and obligations. A standard form of such establishment convention has been approved by decree of the Head of Government.
AngloGold Ashanti has interests in Morila, Sadiola and Yatela, all of which are governed by establishment conventions covering exploration, mining, treatment and marketing in a comprehensive document. These documents include general provisions regarding exploration (work programme, fiscal and customs framework) and exploitation (formation of a local limited liability mining company, State interest, fiscal and customs framework governing construction and exploitation phases, exchange controls, marketing of the product, accounting regime, training programmes for local labour, protection of the environment, reclamation, safety, hygiene and dispute settlement).
AngloGold Ashanti has complied with all applicable requirements and the relevant permits have been issued. Morila, Sadiola and Yatela have30-year permits which expire in 2029, 2024 2020 and 20242030 respectively. Morila’s Exploitation Permit covers approximately 200 square kilometres and was issued on 4 August 1999. Sadiola’s prospecting and exploitation agreement covers approximately 303 square kilometres and was originally entered into on 5 April 1990. Yatela is implementing a closure plan in order to relinquish the property.
Tanzania
Mineral rights
Mineral rights in the United Republic of Tanzania are principally governed by the Mining Act of 2010 (Tanzania Mining Act), and the Mining Regulations, 2010 (Tanzania Mining Regulations), which include: Mining (Mineral Rights) Regulations 2010; Mining (Environmental Protection For Small Scale Mining) Regulations 2010; Mining (Mineral Beneficiation) Regulations 2010; Mining (Mineral Trading) Regulations 2010; Mining (Safety, Occupational Health and Environmental Protection) Regulations 2010; and the Mining (Radioactive Mineral) Regulations 2010.
The Tanzania Mining Act and the Tanzania Mining Regulations came into force in November 2010. Ownership of and control over minerals on, in or under the land vest in the President of the United Republic of Tanzania. No person is allowed to prospect for minerals or carry on mining operations except pursuant to the authority of a mineral right licence granted, or deemed to have been granted, under the Tanzania Mining Act or its predecessor acts.
61
To enable a company to prospect or mine, the Ministry of Energy and Minerals (MEM) initially grants an exclusive prospecting licence. Upon presentation of a feasibility study, together with certain other environmental, social and financial assurances, the MEM may then grant a form of licence for mining. Licensing decisions take into account the abilities of the company (including its mining, financial and technical capabilities), projected rehabilitation programmes, environmental compliance and the payment of royalties.
The following licences can be applied for under the Tanzania Mining Act:
Licences for Exploration:
prospecting licence;
gemstone prospecting licence; and
retention licence.
Licences for Mining:
special mining licence (if the proposed capital investment is equal to at least US$100 million);
mining licence (if the proposed capital investment is equal to between $100,000 and $100 million); and
primary mining licence (reserved for Tanzanian citizens).
Licences for Ancillary Activities:
processing licence;
smelting licence; and
refining licence.
For purposes of AngloGold Ashanti’s Geita Gold Mine, only prospecting, retention and special mining licences are relevant.
A prospecting licence grants the holder the exclusive right to prospect in the area covered by the licence for all minerals within the class of minerals applied for. The classes that can be applied for include (amongst others):
metallic minerals;
energy minerals;
gemstones other than kimberlitic diamonds; and
kimberlitic diamonds.
An application for a prospecting licence is made to the Commissioner for Minerals and the licence is valid for a period of four years. After the initial term, the licence is renewable for three further periods – the first period being for three years and the second and third periods being for two years each. Upon each renewal, 50 percent of the area covered by the licence must be relinquished. A company applying for a prospecting licence must, amongst other things, state the financial and technical resources available to it.
If the holder of a prospecting licence has identified a mineral deposit within the prospecting area that is potentially of commercial significance but that cannot be developed immediately because of technical constraints, adverse market conditions or other economic factors of a temporary character, it can apply for a retention licence. A retention licence can also be requested from the Minister after the expiry of a prospecting licence period, for reasons ranging from financial to technical considerations. A retention licence is valid for a period not exceeding five years and is thereafter renewable for a single period of five years. The advantage of converting a prospecting licence into a retention licence is that the MEM may not revoke a retention licence if the licence holder fails to meet its obligations within the time frame agreed on application for the licence (as would be the case with a prospecting licence).
Holders of prospecting or retention licences over a tenement will not automatically have first right to any mining licence granted over that tenement. However, in practice, they will be best positioned to meet the requirements to be granted a form of licence for mining. The holder of a retention licence may also apply for a special mining licence for the area under the retention licence while the retention licence subsists.
Mining is mainly carried out through either a mining licence or a special mining licence, both of which confer on their holder the exclusive right to conduct mining operations in or on the area covered by the licence. A special mining licence is granted for the shorter of either the estimated life of the ore body indicated in the feasibility study report or such period as the applicant may request. It is renewable for a further period not exceeding the estimated life of the remaining ore body.
62
Except in the case of a special mining licence, a mineral right may be freely transferred by its holder (in whole or in part) to another person or entity without requiring consent from the MEM. However, the Commissioner for Minerals must be notified of any transfer of a prospecting or retention licence and will refuse to register the transfer unless the transferee proves that it meets the financial and technical capability criteria required to apply for such licences. The assignment of a special mining licence generally requires the prior consent of the MEM, such consent not to be unreasonably withheld or delayed. There are limited exceptions to the requirement for the Minister’s consent (such as transfers to an affiliate company of the licence holder or to a financial institution or bank as security for any loan or guarantee in respect of mining operations).
Special mining licences have certain fiscal and other advantages over mining licences, as the holder of a special mining licence may enter into a mining development agreement with the government of Tanzania to guarantee the fiscal stability of a long-term mining project and make special provision for the payment of royalties, taxes, fees and other fiscal imposts and a special mining licence holder may, in certain circumstances, unilaterally amend the programme of the mining operations agreed with the MEM.
AngloGold Ashanti has concluded a development agreement with the Ministry and was issued a special mining licence covering approximately 196 square kilometres for a period of 25 years, which expires in 2023.on 26 August 2024.
On 9 October 2014 an addendum to the development agreement was entered into ratifying the following prior changes:
An increase in the royalty rate from 3%three percent to 4%four percent with effect from 1 May 2012;
With effect from the financial year 2015, the capital allowance applicable to the unredeemed qualifying capital expenditure (15%(15 percent per annum) referred to in section 18(a) of the Income Tax Act No 33 of 1973 shall no longer apply; and
With effect from 1 July 2014, GGMLGeita Gold Mining Limited is liable to pay the Geita District Council Levy at a rate of 0.3%0.3 percent on turnover (no longer capped at US$200,000 / year)per annum).
The Fiscal Regime
The Finance Act, 20122015 which was passedassented to on 11 October 2012 introduced some important changes to the fiscal regime with effect from28 June 2015 and came into force on 1 July 2012 that impact upon AngloGold Ashanti, in particular:
Introduction of2015 contains a provision for a 30 percent capital gains tax on the sale of shares by anoff-shore parent company. ChangesThis provision was introduced by the Finance Act, 2012 and in this legislation, additional changes were also made to the procedure for payment of capital gains tax by the seller of shares. Tax at the rate of 30 percent is payable by way of an initial instalment of 20 percent on the transfer, based on the notional gain that the seller would make where after a further instalment of the remaining 10 percent is due.
Prior to 2012 budgetary changes under theThe Value Added Tax Act, 2014 (the VAT Act) which came into force on 1 July 2015 restricts VAT relief on purchases made by mining companies. The VAT Act 1997,is specific in that it provides that no purchase by companies is exempt or zero rated unless specified by the law. Previously mining companies were entitled to 100 percent VAT relief. This implied that no VAT was applicable on purchases made by mining companies. Following amendments to the VAT Act through the Finance Act 2012, the provision providing VAT relief to mining companies was repealed. As a result mining companies are no longer eligible for VAT relief.
Local Government Levies
As mentioned above, following the signature of the addendum to the development agreement Geita Gold Mine is required to pay local government a service levy of 0.3%0.3 percent of its gross annual turnover in line with the Local Government Finance Act No.9 of 1982.
Potential regulatoryRegulatory changes
In 2013, the Tanzanian Commissioner for Minerals issued the first draft of theThe Mining (Minimum Shareholding and Public Offering) Regulations, 2013.2016 came into force by Government Notice No. 286 published on 7 October 2016 and revised by amendment on 24 February 2017.
The regulations set out the requirement to sell shares to Tanzanian nationals, by way of a public offering and listing on the Dar es Salaam Stock Exchange, which will apply to companies that are carrying out large scale mining operations.
The listing requirement
The draft regulations also require all existing holders of a special mining licence to list a minimum of 30 percent of their shares on either the Main Investment Market or the Enterprise Growth Market Segment of the Dar es Salaam Stock Exchange within two yearssix months of the regulations coming into force.force, which was on 24 February 2017. However, we believe the listing requirement conflicts with the development agreement, and have initiated discussions with the government of Tanzania to be exempted from the listing requirement.
Companies that are issuedNew labour law requirements
On 15 September 2015, theNon-Citizens (Employment Regulation) Act (theNon-Citizens Act), 2015 came into force. TheNon-Citizens Act vests powers concerning work permit with a new special mining licence after the dateLabour Commissioner. Thereforenon-citizens wishing to be employed in the draft regulations come into forcecountry are required to list 30 percentapply and be granted a work permit before applying for a residence permit. Moreover, the Commissioner General of their shares within one yearImmigration is required to take into consideration conditions of the date of the issue of their special mining licence.
63
The listing rules
The listing of shares on the Dar es Salaam Stock Exchange is to be done in accordance with the existing regulatory framework and listing rules, although the restrictions that would normallywork permit up to 60 percent of a company’s listed shares to be owned by foreign investors has been removed. The effect of this is that all shares of Tanzanian mining companies that are locally listed can only be purchased by either Tanzanian citizens or locally incorporated companies.
The listing rules require companies that are seeking to list their shares on the Main Investment Market to satisfy a number of criteria, including minimum share value requirements, profitability requirements, management incumbency requirements and financial disclosure requirements.
In the case of a listing on the Enterprise Growth Market Segment these requirements are substantially reduced or removed altogether.
The one year timeframe imposed by the draft regulations that applies to the listing of shares issued by the holderLabour Commissioner when granting a residence permit.
Previously, the issuance of a new special mining licence may conflict withresidence permit was inclusive of a work permit. The resident permit covered working and living in Tanzania.
Further, the current requirementNon-Citizens Act introduced the Short Term Permit (STP). The STP is granted tonon-citizens who wish to work in the country for a period of not more than six months; foreigners intending to work in Tanzania for more than 3 months are required to apply for an STP. The application for STP is made to the Ministry of Labour and Employment.
Transparency and Accountability requirements
In 2015, the Tanzania Extractive Industries (Transparency and Accountability) Act, 2015 (the TEI Act) came into force.
The TEI Act establishes the Tanzania Extractive Industries (Transparency and Accountability) Committee (the Committee), which is an independent Government entity which is an oversight body for promoting and enhancing transparency and accountability in the extractive industry.
The Committee has powers under the TEI Act to impose obligations on specified extractive industries and statutory recipients to receive information on reconciliation on payments made and revenues received by the Government. In addition, an extractive industry is required under the TEI Act to submit to the Committee annual reports containing information on local content and corporate social responsibility.
Amendment of the Main Investment Market for a management and profitability track record, however the draft regulations do not deal with this issue.
Failure to listMining Act
The regulations do contemplateTanzania Mining Act has been amended by the possibility that a company may proceed with a listingTEI Act to confer more responsibilities to the Tanzania Minerals Audit Agency (the Minerals Agency). The Minerals Agency has been made responsible for matters related to auditing and failmonitoring of mineral production in Tanzania. The Minerals Agency has powers to secureaudit quality and quantity of mineral produced and exported by mining entities, financial records of mining entities for the minimum local shareholding. In such circumstances the Ministerpurposes of Energytax assessments, and Minerals may at the requestenvironmental management expenditures of the companymining entities for the purpose of assessment of compliance to the mine closure plan.
Environmental Impact Assessment Regulations
The Environmental Management (Fees and Charges) (Amendment) Regulations, 2016 (the Regulations) which came into effect on 2 May 2016 introduced new fees in relation to the review of the Environmental Impact Assessment on projects by the National Environmental Management Council (NEMC). According to the Regulations, the fees involved are ‘0.1% of the total project costs’. However the Regulations have not defined the phrase ‘project cost’ nor have they provided a detailed breakdown on the recommendationdetermination of the Capital Markets and Securities Authority grant a waiver to the minimum local shareholding requirement. However, it is not clear from the regulations whether the waiver may be general and so exempt the company from the requirement to list altogether or whether the waiver is in effect an extension of the timeframe in which the company must list.
Where a company fails to comply with the listing requirement in the regulations the Minister is empowered to revoke the special mining licence.project cost.
AUSTRALASIA
Australia
In Australia, with a few exceptions, all onshore minerals are owned by the Crown. The respective Minister for each state and territory is responsible for administering the relevant mining legislation enacted by the states and territories.
Native Title legislation applies to certain mining tenures within Australia. Australia recognises and protects a form of Native Title that reflects the entitlement of Aboriginal people to their traditional lands in accordance with their traditional custom and laws. Should Native Title claims or determinations exist, certain Native Title processes and procedures will apply under the Native Title Act 1993 (Cth) before the tenure is granted. Tenure may be granted subject to conditions relating to Native Title
rights. In the mining context, Native Title matters are managed as part of the tenement grant process. If disputes arise in relation to the grant of a particular tenement, they can be referred to the National Native Title Tribunal, established under the Native Title Act, for resolution.
Other federal and state Aboriginal heritage laws operate in parallel to the Native Title legislation. They exist predominantly for the purposes of protecting Aboriginal sites and areas of significance from disturbance. To date, there has not been any significant impact on any of AngloGold Ashanti’s tenure due to Native Title or Aboriginal Heritage legislation.
AngloGold Ashanti’s operating properties are located in the state of Western Australia where tenure is issued under, and mining operations are governed by, the Mining Act 1978 (WA). The most common forms of tenure are exploration and prospecting licences, mining leases, miscellaneous licences and general purpose leases. In most Australian states, if the holder of an exploration licence establishes indications of an economic mineral deposit in the area covered by the exploration licence and complies with the conditions of the grant, the holder of the exploration licence has a priority right against all others to be granted a mining lease which gives the holder exclusive mining rights with respect to minerals on the property. A general purpose lease may also be granted for one or more of a number of permitted purposes. These purposes include erecting, placing and operating machinery and plants in connection with mining operations, depositing or treating minerals or tailings and using the land for any other specified purpose directly connected with mining operations.
Mining tenures will be granted with endorsements and conditions relating to protection of the environment. Exploration and mining operations may also require separate approval from the state, territory or federal environment minister, which may require completion of an environmental impact assessment pursuant to applicable protection legislation prior to commencement. Further, an operating licence under the relevant environmental protection legislation in the state or territory may also be required for certain mine processing or mining-related operations.
64
It is possible for an individual or entity to own an area of land for infrastructure purposes and for another individual or entity to be granted the right to explore for or mine any minerals located on or under the surface of the same area. Typically, the maximum initial term of a mining lease is 21 years and the holder has the right to renew the lease for an additional 21 years. Subsequent renewals are granted at the discretion of the respective state or territory’s minister responsible for mining rights. In Western Australia, mining leases can only be assigned with the prior written consent of the minister.
Government royalties are payable by the holder of mining tenure in respect of minerals obtained from the relevant area of land at the rates specified in the relevant legislation in each state or territory. The royalty on gold production in Western Australia is payable quarterly at a fixed rate of 2.5 percent of the royalty value of gold metal produced and sold. The royalty value is calculated by multiplying the amount of gold produced during a given month by the average gold spot price for that month. In addition, the holder of a mining tenure may beis required to pay annual rent in respect of the tenure. In Western Australia there is a minimum annual expenditure requirement for prospecting and exploration licences and mining leases. Exemptions from the expenditure requirement can be obtained if certain conditions are satisfied.
AngloGold Ashanti has been granted21-year term mining leases with rights of renewal to all of its mining areas in Australia, including its proportionate share of joint venture operations and accordingly it has, together with its joint venture partners where applicable, the exclusive right to mine in those areas. Both the group and its joint venture partners are fully authorised to conduct operations in accordance with relevant laws and regulations. The mining leases and rights of renewal cover the currentlife-of-mine at AngloGold Ashanti’s operations in Australia. At Sunrise Dam the deposit spans two mining leases covering approximately 1,429 hectares. Both leases are currently in good standing, with expiry dates in 2032 and 2037 respectively. At Tropicana the deposit is situated upon a single mining lease covering approximately 27,228 hectares, which is currently in good standing, with an expiry date in 2036.
AMERICAS
Argentina
Land ownership & mining rights
The Argentinean Mining Code governs mining activity in the country. Special regimes exist for hydrocarbons and nuclear minerals. In the case of most minerals, the Argentinean Mining Code establishes that the owner of the land is not the owner of the mineral rights; these are held by the national or provincial governments (depending on the location of the minerals). The national or provincial government, as applicable, is required by the Argentinean Mining Code to grant whomever discovers a new mine title to the mining concession.
The Argentinean Mining Code regulates exploration permits and mining concessions. Exploration permits grant their holders exclusivity rights to any mineral discoveries, including those made by a third party within the exploration area covered by the permit. Exploration permits are limited in time and as to the extent of the exploration area, are subject to the payment of a single-time fee, and also require a minimum exploration work programme and schedule to keep the permit in force.
The Argentinean Mining Code also regulates mining concessions, or exploitation rights. Priority for receiving a mining concession is given to the registered discoverer of the mine, which holds the exploration permit. Once the application for a mine has been submitted, the applicant may commence works and must submit a legal survey of the units requested for the new mine. The application and the legal survey may be opposed by third parties following specific proceedings set forth in the Argentinean Mining Code. Approval and registration of the legal survey by the Provincial mining authority constitutes formal title to the mining concession.
Any mining company wishing to commence or modify any mining-related activity, as defined by the Argentinean Mining Code, including prospecting, exploration, exploitation, development, preparation, extraction, and storage of mineral substances, as well as property abandonment or mine closure activity, is required to prepare and submit to the competent Provincial environmental authority an Environmental Impact Assessment (EIA) prior to commencing the work. Each EIA is required to describe the nature of the proposed work, its potential risk to the environment, and the measures that will be taken to mitigate that risk. If accepted by the competent authority, the EIA is used as the basis to create a Declaration of Environmental Impact (DEI) to which the mining company is required to adhere during the mining-related activity at issue. The DEI is required to be updated at least on a biannual basis. Sanctions and penalties fornon-compliance with the DEI are outlined in the Environmental Protection section of the Argentinean Mining Code, and may include warnings, fines, suspension of quality certifications, restoration of the environment, temporary or permanent closure of activities, and withdrawal of authorisation to conduct mining-related activities.
Holders of mining concessions must comply with three main conditions: payment of an annual fee, investment of a minimum amount of capital, and the carrying out of a reasonable level of exploitation. Failure to do so could lead to forfeiture of the mining concession, which would then revert back to the Province.
65
In the case of Cerro Vanguardia, AngloGold Ashanti’s operation in Argentina, the mining concession holder is AngloGold Ashanti’s partner, FomentoMinero de Santa Cruz S.A. (Fomicruz). On 27 December 1996, Fomicruz entered into a usufruct agreement whereby Cerro Vanguardia S.A. was granted an irrevocable right to exploit the Cerro Vanguardia deposit (encompassing an area of approximately 543 square kilometres) for a40-year period, which expires on 2726 December 2036. Cerro Vanguardia S.A. is an Argentinean company controlled by AngloGold Ashanti, with Fomicruz as minority shareholder.
In addition to the Argentinean Mining Code, between 1993 and 1995, Argentina implemented several federal laws to offer foreign companies attractive incentives for exploration and mining in Argentina, the Mining Investment Law (Law No. 24, 196, as amended, and related legal provisions) being the most important one. Such incentives include, amongst others, import duty exemptions, accelerated depreciation of fixed assets, a 3 percent cap on Provincial royalties, value added tax refunds for exploration-related expenses incurred by companies registered under the Mining Investment Law, and, subject to the filing of a feasibility study for the relevant mining project, a30-year stability as to tax, customs and foreign exchange duties. Cerro Vanguardia S.A. obtained its tax, customs and foreign exchange stability certificate in 1996.
RecentPast and potential regulatory changes
On 30 September 2010, the National Law on Minimum Requirements for the Protection of Glaciers was enacted in Argentina, banning new mining exploration and exploitation activities on glaciers and “peri-glacial” areas. The law also subjects the on-going mining activities in those areas to an environmental audit. If such audit results in material impacts on glaciers and “peri-glacial” areas, the relevant authority is empowered to take action, including suspension or relocation of the activity. The law establishes a broad definition of “peri-glacial” areas that, together with glacial areas, must yet be surveyed by an existing national Government Agency specifically appointed to this end. The constitutionality of the law has been challenged by some mining companies along with the Province of San Juan (which hosts large mining projects). Injunctions that had been granted by lower courts thatwhich had suspended the application of the law in that Province were lifted by the National Supreme Court of Justice of Argentina, that presides over the case, which is in its early stages.Argentina. Although the injunction hasinjunctions have been lifted, the language that the Court used in the decision implies that until an inventory of glaciers is completed as mandated by the Law, the case is moot, and thereforemoot. Therefore, the case has no practical implications for the operations of CVSA.Cerro Vanguardia at this time.
On 26 October 2011, Decree 1722/2011 (Repatriation Decree) was issued, which imposes on oil, gas and mining companies operating in Argentina the obligation to repatriate all the proceeds of their exports from Argentina and to exchange such proceeds for Argentinean legal currency in the domestic banking system. All exporters, other than oil, gas and mining companies, have been operating under such regime since late 2001. Mining companies, on the other hand, were entitled to two exceptions: (i) a decree of 2003 applicable to mining companies with tax, customs and foreign exchange stability certificates obtained prior to the date on which such a decree was enacted (which is the case of Cerro Vanguardia S.A.)Vanguardia); and (ii) a decree of 2004 applicable to mining companies with tax, customs and foreign exchange stability certificates obtained after the date on which such decree was enacted. Both exceptions have not been formally superseded by the Repatriation Decree, but appear to conflict with it, and such conflict may result, in some cases, in a violation of mining companies’ rights under the Mining Investment Law.
On 27 December 2011, the Argentinean National Congress passed Law 26,737 which implemented a set of rules restricting the ownership of rural land by foreigners (including foreign individuals or any kind of legal entity controlled by foreign individuals or legal entities). The main restrictions are as follows: (i) foreigners cannot own in the aggregate more than 15 percent of the entire rural land of Argentina, the same cap being applicable to each province and municipality; (ii) foreigners will not be allowed to purchase more than 1,000 hectares in theso-called “zona nùcleo”, which comprises the main agricultural areas of central Argentina or an “equivalent” surface depending on the location of the land and its productive potential; and (iii) foreigners will not be allowed to buy land that contains, or is adjacent to, relevant and permanent water bodies (such as rivers and lakes). Although exploration permits and mining concessions are not the subject matter of the restrictions placed by this law, certain rights granted to foreign mining companies under the Argentinean Mining Code may be restricted by this new law. For example, the right that holders of mining concessions currently have to force the surface owner to sell the land to the holder of the mining concession might be restricted if the concession holder is a foreign individual or a legal entity controlled by foreigners.
Ten provinces in whose territories the main mining projects of Argentina are located, signed a document with the Federal Government entitled Federal Mining Agreement (FMA). The purpose of the FMA is, amongst other things, to increase provincial revenues from the mining industry by creating legal entities owned by provincial governments that would work in association with private mining companies. This scheme is not new in Argentina and it has been used by some provincial governments, amongst them the Santa Cruz Province (through Fomicruz), in which the Cerro Vanguardia project.project is located. The FMA also contemplates other forms of revenues such as the formation of special trusts to be funded by mining companies in order to finance education, health and other programmes. Increase in royalty rates is not specifically contemplated in the FMA. The Provinces that signed the FMA had previously formed a special association of provinces, supported by the National Government.
66
In Argentina, the current regulatory regime of royalty payments is expected to change and several different options and payment thresholds have been discussed. TheIn December 2012, the Santa Cruz Province has changed the mining royalty from 1one percent to 3three percent.
Brazil
Land ownership and mining rights
General legal aspects
The Brazilian Constitution of 1934 states that, for purposes of exploration and exploitation, deposits and other Mineral Resources constitute property separate from the soil and belong to the Federal Union. Exploration and exploitation of such Mineral Resources may take place only with the Federal Union’s concession and in such a way as to protect the national interest. Federal law sets out penal and administrative sanctions for conduct and activities deemed harmful to the environment.
In Brazil, the National Department of Mineral Production (DNPM) is the state body within the Mines and Energy Ministry (the “MME”)(MME) that is responsible for: (i) the registration of mining titles, (ii) the grant of authorisations and concessions, (iii) the supervision of mining activities and mining titleholders, and (iv) the issuance of supplementary rules in relation to mining activity.
Under the current Mining Code, there are two kinds of mines: (i) claimstake mines (“Minas Manifestadas”)(Minas Manifestadas), for which rights were acquired before 1934 and exist independently of any mining licence or authorisation from the Federal Government and for which the Mineral Resources constitute property of the landowner and (ii) granted mines, which are those that rely on grants from the Federal Government for mineral exploration or exploitation (pursuant to the Constitution). AngloGold Ashanti’s operations in Brazil consist of both claimstake mines and granted mines.
At AGA Mineraçao, Cuiabá has a single concession covering a total area of 3,662 hectares, Lamego is covered by three geographically contiguous concessions totally 1,622 hectares and Córrego do Sítío is hosted by five geographically contiguous concessions covering a total area of 6,017 hectares. All of these are in good standing. At Serra Grande, the company has interests in or agreements over 61,500 hectares in Crixas Greentone belt, representing approximately 87 percent of the relevant tenements that correspond to all current exploration and mining activities. These have been held since 1987. Brazilian mining concessions remain valid up to the depletion of the Ore Reserve and Mineral Resource.
Mining activities in granted mines must be performed in two defined stages: (i) exploration, which entails defining and evaluating the deposit and determining the feasibility of exploitation, and (ii) exploitation, which involves coordinating operations aimed at the industrial exploitation of the mineral deposit, from the extraction of useful minerals to their processing. Exploration authorisations issued by DNPM are valid for one to three years. Extensions can be obtained if necessary. In contrast, exploitation rights, once granted, are valid for the lifetime of the deposit, provided the mining titleholder complies with all legal requirements. Pursuant to these requirements, for example, titleholders must (i) start work on mineral exploitation within six (6) months from the date of publication of the Exploitation Concession, (ii) continue their mining activities until the mineral deposit has been exhausted, in accordance with the Economic Exploitation Plan (Plano de Aproveitamento Econômico) approved by DNPM and (iii) refrain from suspending mining activities without prior notice to DNPM.
During the exploration period, the mining titleholder has to pay an Annual Rate per Hectare (“TAH”(TAH – Taxa Anualpor Hectare), subject to a maximum value set by law. In the exploitation period, regardless of the legal regime governing the project (whether claimstake or granted mines), the mining titleholder has to pay the Financial Compensation for Exploiting Mineral Resources (“CFEM”(CFEM – Compensação Financeirapela Exploração Mineral). The CFEM is currently calculated based on revenues, minus some deductions authorised by mining law.
At the end of 2011 and the beginning of 2012 the states of Minas Gerais, Pará, Amapá and Mato Grosso do Sul each created a new tax (duty) on research, extraction and exploration activities as well as on the use of Mineral Resources carried out in those states. This tax could range from BRL3.00 to BRL6.50 per ton. In the state of Minas Gerais, however, gold ore was exempted from the collection of this new duty.
Potential regulatory changes
The Federal Government is contemplating changes to the mining legislation, and those proposed changes were submitted in 2013 to the National Congress for discussion and consideration. Its goals would be to (i) strengthen the role of the Federal Government in regulating the mining industry, (ii) attract more and better investments to the mineral sector, (iii) encourage maximal use of mineral reservesOre Reserves, and (iv) encourage members of the industry to add value to mineral products.
The government’s proposals have institutional, legal and financial facets. Institutionally, the proposals would create a National Council of Mineral Policy to advise the Presidency of Brazil and the MME on, and develop guidelines and directives for, the mining sector. They would also transform the DNPM into a regulatory agency with negotiation and inspection powers.
Legally, the proposals would change the rules governing access to mining titles. While exploration authorisations would be effective for a longer period of five (5) years, they would be renewable for only one extra year, at the discretion of authorities.
67
Companies would also have to demonstrate that they are investing in exploration activities on a yearly basis.
Exploitation rights would be limited to35- or40-year grants renewable at the discretion of authorities. The granting of rights would become a more discretionary process and would result in a Formal Adhesion Contract for Exploitation rather than in an open-ended concession.
The proposals would raise CFEM rates for trade in gold ore from 1one percent on net invoicing to 2two percent on gross invoicing. They would also create new calculation methods and incidence hypotheses, notably with regard to transactions between related parties.
In light of the November 2015 tailings dam collapse in Minas Gerais, there has been discussion of including tougher requirements related to tailings dams (e.g., mandatory insurance in case of environmental catastrophe).
Colombia
Land ownership and mining rights
In Colombia, all mineral substances are the property of the state of Colombia. The underlying principle of Colombian mining legislation isfirst-in-time,first-in-right.
Mining activities are regulated by the Mining Code, Act 685, 2001. Amendments to the Mining Code enacted in 2010 pursuant to Act 1382 were found unconstitutional. The Constitutional Court stayed its ruling for two years to give the government the opportunity to present a new law. The government was expected to makepublish new changes to the Mining Code public in the second half of 2012, but has not yet presented any projectrevisions of the law to Congress.
The filing of an exploration and exploitation proposal triggers a right of preference to obtain rights over the targeted area, provided it is available. Such area cannot exceed 10,000 hectares. Upon receipt of a proposal, the relevant government agency determines whether another proposal or contract already governs the area. If there are nopre-existing claims, the government agency grants the applicant a “free zone”.
The concession contract
The government agency grants exclusive concession contracts for exploration and exploitation. Such concessions allow concessionaires to conduct the studies, works and installations necessary to establish the existence of minerals and to organise their exploitation. Upon being awarded a mining concession, a company must take out an insurance policy to cover any possiblethe costs associated with potential environmental damage as well as breaches of its mining obligations. It may then proceed with exploration activities. Once the exploration phase is complete, the concessionaire files a new plan regarding proposed works and installations. An environmental impact studyWith the award of the mining concession or tenement contract, there are specified timelines for the completion of the various phases of a mining project, e.g. exploration, construction, exploitation. The company must also be filed andcomply with these timelines unless performance is excused, for example, due to force majeure or extensions/modifications to the timelines are received.
If the company does not comply with the specified timelines for the completion of the various phases of a mining project, the mining authority may revoke the company’s concession contracts or mining licenses. AngloGold Ashanti Colombia S.A. (AGAC) applied for consolidation of its concession contracts related to La Colosa, in respect of which AGAC was not in compliance with some of the specified timelines. The application for consolidation was approved in March 2017, which remedied thenon-compliance of each consolidated concession and reset the specified timelines. La Colosa has a single concession which covers a total area of 9,210 hectares and expires in 2037.
In order to obtain an authorization from the National Environmental Licensing Authority of Colombia to carry out the Project at the stages of construction and assembly, exploitation tasks and works, closure and abandonment of the mine, the Company must prepare an Environmental Impact Study for approval by this authority.
Environmental licenses are granted for the concessionaire to receive an environmental licence prior to beginningentire life of the project and cover all phases: construction, assembly, operation, maintenance, dismantling, final restoration, abandonment and development./ or termination.
The initial term of concessions is 30 years. To receive an extension, a concessionaire must file a request two years before the termination of the initial term, and must substantiate the application with economic, environmental and technical information. Because the extension is not automatic, the concessionaire must renegotiate the conditions of the grant. Any company holding a concession that wishes to obtain a renewal of the contract must be up to date in all its legal and contractual obligations and must present a new plan of works and installations to be executed after the contract is renewed. The term of a concession and all the contractual obligations that arise from it are deemed to take effect as of the date of registration of the contract at the National Mining Register.
AngloGold Ashanti’s core mining concession contracts at the La Colosa project provide that Agencia Nacional Minera (ANM), the new Colombian regulatory agency for mining activities,authority has the discretion to declare the underlying concession void if AngloGold Ashanti Colombia S.A. (AGAC) breaches applicable environmental laws or regulations. If ANMthe mining authority were to exercise such discretion against AGAC, AGAC would be required to abandon the La Colosa projectits projects and all of its other existing mining concession contracts. Pending proposals for new mining concession contracts would also be cancelled and AGAC would be banned from doing business with the Colombian government for a period of five years. As a result, AGAC would be unable to conduct any mining exploration or development activities during such period. However, this would not affect other AngloGold Ashanti subsidiaries operating in Colombia, which hold singularly or in concert with joint venture partners the majority of the company’s concession contracts in Colombia.
There are some areas where mining activity is prohibited. These areas are:
National parks;
Regional parks;
Protected forest reserves;
ParamusPáramos (included in Act 1382, introduced in 2010); and
Wetlands, pursuant to the Ramsar Convention.
68
| • | Wetlands, pursuant to the Ramsar Convention. |
Some forest reserves are not “protected”, but are set aside for active forestry purposes. Such forest reserves must be “extracted” after initial prospection, meaning that the concessionaire must obtain a specific permit to partially and temporarily change the use of the soil before pursuing exploration activities. Resolution 187/2016, passed by the federal government in
late 2016, identifies areas that the Ministry of the Environment has determined to be “páramos” areas, or páramos transition areas. In these areas there are limitations on industrial or commercial work being performed, including mining. The regulation also specifies a process to determine what work, if any, can be performed in a páramos-designated area. Certain areas designated as “páramos” are within the mining footprint currently envisioned for La Colosa. The company is evaluating the impact of the Resolution 187/2016, if any, to the current plan for La Colosa. Further, the company is working with the federal government to determine if the designations contained in Resolution 187/2016 are technically accurately and legally defensible, and what the process will be to determine what work, if any, can be performed in certain páramos areas.
Cannon fees and royalties
Cannon fees are due from the moment the area is declared available for the company (rather than from the time the concession contract is signed). Such fees change based on the number hectares held by the concessionaire, as follows:
0-20000-2,000 hectares, one legal daily minimum wage (approximately $9.00) per hectare per year
2001-50002,001-5,000 hectares, two legal daily minimum wages (approximately $18.00) per hectare per year
5001-10,0005,001-10,000 hectares, three legal daily minimum wages (approximately $27.00) per hectare per year
Once exploration is complete and the mining infrastructure is in place, the concessionaire must begin paying royalties. Royalties paid to the Colombian government consist of a percentage of the primary product andsub-products being exploited. For gold, the percentagegross monthly income is multiplied by 0.8, to be paidwhich a four percent royalty is 4 percent.applied.
Potential regulatory changesPINES programme
In 2013 the Federal government instituted the CONPESPINES programme that will aid in promoting certain projects designated by the government asthat are deemed to have a national projects of interest. This designation provides for greater oversight from the Federalnational government. The La Colosa, Gramalote and GramaloteNuevo Chaquiro projects are two such designated projects, and AngloGold Ashanti has requested that its Nuevo Chaquiro project be included in the programme as well.
United States of America
Land ownership & mining rights
Mineral and surface rights in the United States are owned by private parties, state governments or the federal government. Although not the case at Cripple Creek & Victor Gold Mining Company’s (CC&V) Cresson Project, the majority of land utilised for precious metals exploration, development and mining in the western United States is owned by the federal government. The right to mine on such land is governed by the General Mining Law of 1872, as amended (General Mining Law). The General Mining Law allows mining claims on certain federal lands upon the discovery of a valuable mineral deposit and proper compliance with claim location and maintenance requirements. Until 1993, unpatented mining claim holders could apply for patents to their claims from the federal government, and, if granted, those patented mining claims became private lands owned by the mining claimant, limited only by reservations and restrictions contained in the patent from the federal government, and subject to the same permitting, environmental and reclamation laws and regulations as other private lands.
Individual states, including Colorado, typically follow a leasing system for state-owned minerals. Private parties have the right to sell, lease or enter into other agreements, such as joint ventures, with respect to minerals that they own or control. CC&V’s Cresson Project covers approximately 7,100 acres, the vast majority of which consists of owned, patented mining claims from former public lands, with a small percentage of private and state lands, some of which are critical to the Cresson Project, being leased.PINES projects. All of the Cresson Project’s current reservesour three advanced exploration projects are within the patented claims.
Permitting and reclamation
CC&V’s Cresson Project is subject to a numberconsidered of state and local permitting requirements, including permitting requirements imposed by the Colorado Mined Land Reclamation Act (MLRA) and Teller County. Under the MLRA, the Colorado Mined Land Reclamation Board (MLRB) issues and enforces mining and reclamation permits for all non-coal mines in Colorado on state, federal or private lands. In carrying out the statutory requirements of the MLRA, the MLRB (i) reviews mine permit applications and amendments and related matters, (ii) inspects active mine sites and prospecting sites and (iii) ensures financial warranties are posted for the actual cost of reclamation.national strategic interest.
CC&V’s Cresson Project is currently operating under a permit generally referred to as mine life extension one (MLE1) issued by the MLRB and Teller County. Amongst other things, MLE1 permits CC&V to continue active mining at the Cresson Project through 2016 and imposes reclamation and other requirements on CC&V, including requiring (i) the stabilisation and re-vegetation of disturbed lands, (ii) the control of storm water and drainage from overburden storage areas, (iii) the removal of roads and structures, (iv) the treatment and the elimination of process solutions, (v) the treatment of mine water prior to discharge into the environment and (vi) visual mitigation. In September 2012, CC&V’s permit application for mine life extension two (MLE2) was approved by both the MRLB and Teller County.
69
Potential regulatory changes
Over the years, the U.S. Congress has considered a number of proposed amendments to the General Mining Law. Amongst the significant features contained in previously proposed legislation were a production royalty obligation, new and more stringent environmental standards and conditions, additional reclamation requirements, extensive new procedural steps which would likely result in delays in permitting, and granting counties the ability to petition the Secretary of the Interior to make certain areas unavailable for the location of unpatented mining claims. The ultimate content of future proposed legislation, if enacted, is uncertain. If any of the above-referenced provisions were imposed, CC&V’s operations could be adversely affected. Although no such legislation has been adopted to date, there can be no assurance that such legislation will not be adopted in the future.
MINE SITE REHABILITATION AND CLOSURE
Closure, an integral part of operations
All mining operations eventually cease. An integral aspect of operating AngloGold Ashanti’s mines is ongoing planning for and, where feasible, implementation of concurrent rehabilitation, together with an estimate of associated liability costs and the placement of adequate financial provisions and assurances to cover these costs.
AngloGold Ashanti revised its group closure planning management standard in 2013 and all of its operations are now required to comply with the standard as their closure plans are reviewed and updated.
Closure planning is an activity that starts at the exploration and mine design stage and continues throughout the life of mine:
New projects include a closure plan which takes into account future closure and associated rehabilitation and other costs.
The closure plan is reviewed annually and updated every three years (annually in the final three years of a mine’s life) or whenever significant changes are made, and takestaking into account operational conditions, planning and legislativeregulatory requirements, international protocols, technological developments and advances in practice.
For many of the older mines, closure planning and the evaluation of environmental liabilities is a complex process. This is particularly so in Brazil, Ghana and South Africa, where many of the mining and other operations have taken place for more than fifty years.
A particular challenge is concurrent rehabilitation, which is carried out while a mine is still operational. This practice serves to decrease the ultimate liability and reduces the final rehabilitation and closure work that must be undertaken, but has the potential to sterilise mineral reserves,Ore Reserve, which the company might wish to exploit should conditions, such as the gold price, change.
OurThe company’s closure standard stipulates that closure planning must be undertaken in consultation with the community. In the course of these consultations, different issues are raised which require site-specific solutions. Livelihood preservation and infrastructure are often key requirements. Previous employees may receive education and training so as to enable them to seek viable employment alternatives. Communities also require information on the Company’scompany’s rehabilitation of the landscape and on any lasting environmental impacts.
In addition, long-term Long-term remediation obligations, including decommissioning and restoration liabilities relating to past operations, are based on environmental management plans and comply with current environmental and regulatory requirements.
Provisions for remediationdecommissioning and rehabilitation costs are made when there is a present obligation, it is probable that expenditure on remediationdecommissioning and rehabilitation work will be required and the cost can be estimated within a reasonable range of possible outcomes. These costs are based on currently available facts, technology expected to be available at the time of theclean-up, laws and regulations presently or virtually certain to be enacted and previous experience in the remediationrehabilitation of mine sites.
Decommissioning costs and restoration costs are provided at the present value of the expenditures expected to settle the obligation, using estimated cash flows based on current prices. Estimates are discounted at apre-tax rate that reflects current market assessments of the time value of money.
Discounted closure liabilitiesProvisions for decommissioning and for restoration (excluding joint ventures) increased from $728$683 million in 20132015 to $851$705 million in 2014.2016. This change mainly relates to differing, site-specific changes, including progress in rehabilitation, changes in discount rates due to changes inbased on global economic assumptions and applicationchanges in mine plans, resulting in a change in cash flows and changes in design of new technologies.tailings storage facilities and in methodology following requests from the environmental regulatory authorities.
70
ENVIRONMENTAL, HEALTH AND SAFETY MATTERS
In addition to post-mining land reclamationrehabilitation and closure requirements, AngloGold Ashanti is subject to extensive environmental, health and safety (EHS) laws and regulations in the various jurisdictions in which the company operates. These requirements govern, among other things, extraction, use, conservation and discharge of water; air emissions (including dust control); regulatory and community reporting;clean-up of contamination; land use and conservation of protected areas; worker health and safety and community health; and the generation, transportation, storage and disposal of solid and hazardous wastes, such as reagents, radioactive materials, and mine tailings. In addition, environmental laws and regulations, including the requirements contained in environmental permits, are generally becoming more restrictive. Significant EHS requirements, risks and trends affecting our mining and processing operations are described below.
Regulatory Compliance
Capital and operating costs to comply with EHS laws and regulations have been, and are expected to continue to be, significant to AngloGold Ashanti. In addition, AngloGold Ashanti could incur fines, penalties and other sanctions, environmentalclean-up costs, and third-party claims for personal injury or property or natural resources damages; suffer reputational damage; and be required to install costly pollution control equipment or to modify or suspend operations, as a result of actual or alleged violations or liabilities under EHS laws and regulations. Failure to comply with applicable EHS laws and regulations may also result in the suspension or revocation of permits.permits and, in some jurisdictions, our right to mine a given concession. AngloGold Ashanti’s ability to obtain and maintain permits and other approvals and to successfully operate in particular communities may be adversely impacted by real or perceived effects on the environment or human health and safety associated with AngloGold Ashanti’s or other mining companies’ activities. In addition, unknown environmental hazards may exist on the company’s properties which may have been caused by previous owners or operators.
Water Management
AngloGold Ashanti’s mining and processing operations are heavily dependent upon access to substantial volumes of water required for such operations. Typically,water-use permits or water rights in each country impose limits on the quantity of water that can be extracted from certain sources and require, among other things, that wastewater from mining operations meet certain water quality criteria upon discharge. Water supply, quality and usage are areas of concern globally, but are particularly significant for operations in the USA,Brazil, Ghana and South Africa, and for exploration projects in Colombia, where there is significant potential environmental and social impact and a high level of stakeholder scrutiny. Any failure to secure access to suitable water supplies, or achieve and maintain compliance with the requirements of the permits or licenses, could result in curtailment or suspension of production at the affected operation. Incidents of water pollution or shortage can, in extreme cases, lead to community protest and ultimately result in the withdrawal of community and government support for the company’s operations.
Where feasible, the company operates a “closed loop” system which recycles the water used in its operations without discharging it to the environment. In some areas, however, such as Ghana and Brazil, high levels of rainfall and surface water runoff mean that a closed loop system is not feasible and that discharges, after water treatment if necessary, must take place. During 2011, the company commissioned a reverse osmosis plant in the northern section of the Obuasi mine which functions in conjunction with complementary water treatment technologies to ensure that water released is compliant with Ghana’s water quality standards. At the southern section of the mine, a 250m3/hour water treatment plant was commissioned in early 2012 and a 500 m3/hour plant was commissioned in September 2014. At the Iduapriem mine, a water treatment plant was commissioned in 2010 to ensure that the operation can release excess water while meeting effluent discharge standards.
At AngloGold Ashanti’s South African operations, ongoing upgrades of process water containment infrastructure to reduce potential environmental discharges have led to a reduction in reportable incidents since 2009.
Waste Management
Mining and mineral processing operations generate waste rock and tailings.
Duringopen-pit mining, large volumes of soil and/or rock (overburden) are generated to expose the ore body. Similarly, waste rock is generated during drilling and developing access to underground ore bodies. Overburden and waste rock typically containsub-economic levels of gold and are deposited as large waste rock dumps. Mine tailings are the process waste generated once grinding and extraction of gold from the ore is completed in the milling process and are deposited as slurry in large storage facilities specifically designed for this purpose.
71
The impact of a breach, leak or other failure of a tailings storage facility can be significant, and the company therefore monitors such facilities closely in accordance with the company’s internal standards, independent review, national regulatory requirements and commitments made to local communities. The occasional well-publicised failure of a third-party tailings facility and the potential impact of such failure also mean that these facilities are generally tightly regulated. An incident at the company’s operations could result, among other things, in enforcement, obligations to remediate environmental contamination, and claims for property or natural resources damages and personal injury and negative press coverage. Even anAn incident at another company’s operations has potential to result in governments tightening regulatory requirements and restricting other mine operators in response.
Groundwater Impacts and Environmental Remediation
AngloGold Ashanti has identified groundwater contamination plumes at certain of its operations. Numerous scientific, technical and legal studies have been undertaken to assist in determining the magnitude of the impact and to find sustainable remediation solutions. Based on those studies as well as discussion with regulators, the company has taken steps, including monitored natural attenuation and phyto-technologies, to address soil and groundwater contamination. Subject to the completion of trials and the technology being a proven remediation technique, no reliable estimate can be made for the obligation. Should these obligations be significant, this could have a material adverse impact upon AngloGold Ashanti’s results and its financial condition.
As AngloGold Ashanti or its predecessors have a long history of mining operations in certain regions, issues may arise regarding historical as well as potential future environmental impacts on those areas. For example, certain parties, including Non-Governmental Organisations (NGOs), community groups and institutional investors, have raised concerns, and threatened or commenced litigation, relating to air pollution or surface and groundwater quality, among other issues, in the areas surrounding the company’s Obuasi and Iduapriem mines in Ghana, including potential impacts on local rivers and wells used for water, from heavy metals, arsenic and cyanide as well as sediment and mine rock waste. Following temporary shutdowns at both mines in 2010, the company has made improvements in effluent quality management and constructed a new tailings impoundment at Iduapriem as well as three additional water treatment plants at Obuasi to reduce the risk of incidents that have the potential to degrade local water sources. AngloGold Ashanti is continuing to investigate allegations of impacts by the company’s operations on water quality in mining areas and is implementing, as appropriate, additional responsive actions, such as remediation, engineering and operational changes at the mine sites and community outreach programmes.
In addition, AngloGold Ashanti has identified a flooding and future pollution risk to deep groundwater in the Klerksdorp, Orkney, Stilfontein and Hartebeesfontein (KOSH) area and Far West Rand goldfields in South Africa. AngloGold Ashanti’s Vaal River operations are part of the Klerksdorp goldfieldsKOSH area and its West Wits operations are part of the Far West Rand goldfields. The premature closure of neighbouring mines owned by anotherother mining companycompanies in both areas has led to increased pumping obligations on AngloGold Ashanti and these are anticipated to increase in future, requiring additional legal requirements including permits, andrisk mitigation which may lead to increased costs for the group. Various studies have been undertaken by
For example, several gold mining companies operate and operated underground mines upstream from AngloGold Ashanti’s Vaal River Operations. In 2005, DRD Gold owned and operated the Buffelsfontein Gold Mining Company and the Hartebeesfontein Gold Mining Company (now both known as Buffelsfontein Gold Mining Company or Buffelsfontein). Buffelsfointein operated mines upstream from AngloGold Ashanti. DRDGold had entered into a contract with Stilfontein Gold Mining Company to pump water from its Margaret Shaft in order to keep the Buffelsfontein shafts dry. In 2005 DRDGold announced that it was ceasing its operations at Buffelsfontein and would also stop pumping the 52Ml/day of underground water from the Stilfontein Margaret Shaft. Stilfontein was in final liquidation at the time. DRDGold also threatened to place Buffelsfontein into liquidation.
AngloGold Ashanti since 1999approached the courts on an urgent basis asking the court to better understand groundwater conditionsorder that Buffelsfontein continue pumping underground water at the Margaret shaft and at its Buffelsfontein shafts. If underground water pumping stopped at Margaret Shaft it would flood the downstream mines and the downstream mines would not be able to handle the sudden ingress of water.
The Department of Water Affairs (now known as the Department of Water and Sanitation) responded to the urgent application by issuing a series of Directives. The final Directives directed AGA, Harmony Gold (the owner of Shafts 1 to 7 previously owned by AGA and ARM and currently owned by Chinese Africa Precious Metals (CAPM)), and Buffelsfontein to jointly pump the underground water from Margaret Shaft and to pump any water arising in mined-out workings, including potential groundwater infiltrationtheir own operations. Harmony acquired the issued share capital of ARMGold in September 2003 and acidification concerns. Asmanaged the gold operations of ARMGold in the Vaal River area. In August 2007 ARMGold sold its mining operation to Pamodzi Gold Orkney (Pty) Ltd (“Pamodzi”). Pamodzi subsequently went into liquidation and the shafts are now owned and operated by CAPM.
Pursuant to the Directives the companies formed a result ofnot for profit company, Margaret Water Company, to manage the interconnected natureunderground water pumping at Margaret Shaft.
Also, from July to December 2014 Buffelsfontein Mine (owned by Village Main Reef (VMR), now Heaven-Sent), ceased all pumping of underground miningwater at its Buffelsfontein operations, AngloGold Ashanti had already implemented its plans to manage underground water that it anticipated would eventually reach its operations. The infrastructure to pump this water out from underground was completed in South Africa, any proposed solution needsDecember 2015, with the water reaching the company’s Great Noligwa boundary on 23 January 2016. Pumping is currently continuing with the Vaal River metallurgical process utilising this recovered water.
AngloGold Ashanti continues to be a combined one supported by allcomply with the companies owning mines locatedDirective and continues to pay its financial contribution towards the maintenance and pumping of water at Margaret Water Company, Water from Margaret Water Company is being utilised in these goldfields.
In viewthe Mine Waste Solutions and Vaal River metallurgical process. Whilst AngloGold Ashanti has been proactive in planning and installing of infrastructure to manage this water, the limitationrisk of current information for the accurate estimation of liabilities, no reliable estimate can be made for these obligations. The potential costs of remediation and prevention of groundwater contamination at AngloGold Ashanti’s operationsflooding remains, which could be significant and may have a materialan adverse impact on AngloGold Ashanti’sits results of operations and financial condition.
In the West Wits district, after Blyvooruitzicht Gold Mining Company was placed in provisional liquidation in August 2013, AngloGold Ashanti secured a court order for unfettered access rights to Blyvooruitzicht 4 and 6 shafts to continue the pumping of underground water. AngloGold Ashanti then purchased from Blyvooruitzicht the rights of access to the 4 and 6 shafts as well as the relevant infrastructure to continue pumping underground water and transferred the assets and rights to its newly incorporated subsidiary Covalent Water Company. In November 2014 the Department of Water and Sanitation issued a directive directing AngloGold Ashanti through Covalent to dewater4 and 6 shafts and discharge the water.
Climate Change and Greenhouse Gas Regulation
Greenhouse gases, or “GHGs”, are emitted directly by AngloGold Ashanti’s operations, as well as by external utilities from which AngloGold Ashanti purchases power.electricity. Currently, a number of international and national measures to address or limit GHG emissions including the Bali Action Plan and the Durban Platform, are in various phases of discussion or implementation in the countries in which the company operates.
The outcome of the climate change negotiations may, in due time, have the effect of requiring AngloGold Ashanti to reduce its direct GHG emissions or energy use or to incur significant costs for GHG emissions permits or taxes including through costs passed on by electricity utilities which supply the company. AngloGold Ashanti also could incur significant costs associated associated.
with capital equipment, GHG monitoring and reporting and other obligations to comply with applicable requirements. The most likely source of these company-level obligations is unlikely to be by operation of international law but more likely to come through domesticstate-level implementation of statenew obligations pursuant to evolving climate change regulatory regimes.
As a result of commitments made at the UN climate conference in Durban, South Africa in December 2011, certain members of the international community negotiated a treaty at the December 2015 Conference of the Parties in Paris (COP 21). The Paris Agreement came into force in November 2016. Additional measures addressing GHG emissions may be implemented at the national or international levels. These, or future, measures could require AngloGold Ashanti to reduce its direct GHG emissions or energy use or to incur significant costs for GHG emissions permits or taxes or have these costs or taxes passed on by electricity utilities which supply the company’s operations. AngloGold Ashanti also could incur significant costs associated with capital equipment, GHG monitoring and reporting and other obligations to comply with applicable requirements.
72
For example, the Australian government implemented a carbon trading scheme in July 2012, with a carbon price applying to facilities which emitted more than 25,000 t/yr, commencing at A$23/tCO2-e (for 2012 to 2013), however this was repealed by a new government in 2013.
Also, in 2011, theIn 2015 South African governmentNational Treasury released a climate change response white paper and in 2013 a Carbon Tax Policy Paper. In February 2014, the South African Minister of Finance announced his intention to introduce adraft bill for proposed carbon tax with the view of bringing the tax into effect in 2016.2017, however these arrangements have been deferred to 2017, making the likelihood of implementation closer to 2018. AngloGold Ashanti’s liability for direct CO2 emissions is significantly lower than that the liability for indirect CO2 emissions for which AngloGold Ashanti already pays a levy of ZAR0.035 per kilowatt hour of purchased electricity that it purchases and is generated from fossil fuels. In February 2015, the Minister announced that the government was considering an increase in the levy to ZAR0.055 per kilowatt hour.
The 2013 Budget Reviewdraft Carbon Tax Bill provides an indication of the expected levels of the carbon tax rate as beingstarting at ZAR120 (approximately $10)$9) per tonne of CO2e emitted above certain thresholds. Under emitted. The draft Bill allows discretion to the proposal,Minister of Finance to increase the tax rate would increase by 10 percentannually, whilst offset mechanisms are provided for in the draft bill, it is unlikely that they will present a year, reaching ZAR193 (approximately US$17) per tonne by 2020. The end of the decade also marks the end of the first phase of the carbon tax. Depending on the nature of the emitter, a basic tax-free threshold of up to 60 percent of the tax liability will apply.
viable opportunity for AngloGold Ashanti in cost reductions. It is probable that the tax will be levied on sectors that comprise elements of the AngloGold Ashanti supply chain. Consequently, it is likely that the costs associated with those elements of the supply chain will increase for the medium- and long-term.
In 2010, Brazil launched the National Climate Change Policy, which established a voluntary reduction target of 1.2 billion tonnes of CO2 below the projected emissions in 2020. The policy required the development of sector-specific plans in order to meet the target. Amongst other plans, it is intended to reduce deforestation in the Cerrado biome, where AngloGold Ashanti operates, by 40 percent compared to the average deforestation in 1999-2008 and expand renewable energy production and energy efficiency programmes. The policy also provided for a Brazilian GHG trading scheme, which is yet to be designed. While Brazil is not yet requiring mandatory GHG emissions reporting at the national level, some state environmental agencies have requested companies to voluntarily submit GHG emissions management plans.plans, however Goiás and Minas Gerais State (in which AngloGold Ashanti operates) do not currently require GHG emissions management plans for mining projects.
In Australia, the government introduced the carbon emissions Safeguard Mechanism, aimed at limiting future growth in Greenhouse Gas (GHG) emissions. After setting baseline emission thresholds, the Safeguard Mechanism requires that companies submit carbon credits or pay penalties for excess emissions. Sunrise Dam successfully applied using its baseline emissions in accordance with the regulatory scheme’s default mechanism. Tropicana will apply for a baseline emission level using an alternative calculated baseline method during 2017 to ensure that it is not penalised for its planned ramp up in production rate. Whilst the baseline emissions set for Sunrise Dam and Tropicana aim to mitigate the need for additional penalties or taxes to be levied, AngloGold Ashanti could incur significant costs associated with capital equipment, GHG monitoring and reporting and other obligations to comply with changing legal requirements.
In addition, potential physical risks to our operations as a result of climate change include changes in rainfall rates or reduced water availability, rising sea levels, higher temperatures and extreme weather events. Events or conditions such as flooding or inadequate water supplies could disrupt mining and transport operations, mineral processing and rehabilitation efforts, could create resource shortages and could damage the company’s property or equipment and increase health and safety risks on site. Such events or conditions could have other adverse effects on the company’s workforce and on the communities in the area around its mines, such as an increased risk of food insecurity, water scarcity and prevalence of disease.
Occupational and Community Safety and Health and Tropical Diseases
AngloGold Ashanti’s operations are subject to a variety of laws and regulations designed to protect and improve the safety and health of employees. In some of the jurisdictions in which AngloGold Ashanti operates, the government enforces compulsory shutdowns of operations to enable investigations into the cause of accidents at those operations. Certain of the company’s operations have been temporarily suspended for safety reasons in the past. In South Africa, in particular,so-called Section 54 safety stoppages have become a significant issue for mining companies. The business has been exposed to safety stoppages which can, individually and/or in aggregate, have a material impact on operations. AngloGold Ashanti is also enhancing safety programmes, and a revised Group Safety strategy have been introduced. In South Africa in line withparticular the overall ONE initiative and industry Best Practice,work culminated in a revised “Safe Production Strategy” which could resultforms the basis of the work in the Region to ensure a highly effective compliant organisation, resulting in a reduction of incidentsin Section 54 stoppages and associated Section 54 safety stoppages.improved levels of performance with regard to fatalities, ultimately striving for Zero Harm.
In addition, AngloGold Ashanti is subject to health and safety regulations relating to occupational disease. The primary areas of focus in respect of occupational health of employees within the company’s operations are noise-induced hearing loss (“NIHL”)(NIHL) and occupational lung diseases (“OLD”)(OLD), which include occupational tuberculosis and silicosis in individuals exposed to silica dust. Silicosis has been particularly prevalent in South Africa and has also arisen at the company’s Continental Africa and Brazilian operations, albeit to a far lesser extent. AngloGold Ashanti provides occupational health services to its employees at its occupational health centers and clinics, and continues to improve preventative occupational hygiene initiatives, such as implementing various dusthazard control measures and supplying itsproviding employees with respiratory protective equipment.Personal Protective Equipment. If the costs associated with providing such occupational health services, implementing such control measures or supplying such equipment increase significantly beyond anticipated or budgeted amounts, this could have an adverse effect on AngloGold Ashanti’s results of operations and its financial condition. Actual and alleged health and safety incidents or breaches of standards may also adversely impact the company’s reputation.
73
The South African government, by way of a cabinet resolution in 1999, proposed a possible combination and alignment of benefits of the Occupational Diseases in Mines and Works Act (“ODMWA”)(ODMWA) that provides for compensation to miners who have OLD, and the Compensation for Occupational Injuries and Diseases Act (“COIDA”)(COIDA), that provides for compensation in respect of job related injuries and compensation ofnon-miners who have OLD. It appears less likely that the proposed combination ofWork on merging the two actsActs is underway, although it remains unclear as to what progress will occurbe made in the short- to medium-term, but some alignment of benefits may be considered in the future. The South African government has indicated that it may also consider amendments in the short-term to address shortcomings in ODMWA.medium term. COIDA provides for compensation payments to workers suffering permanent disabilities which are classified as pension liabilities if the permanent disability is above a certain threshold, or a lump sum compensation payment if the permanent disability is below a certain threshold. ODMWA only provides for a lump sum compensation payment to workers suffering from OLD as well as the payment of medical expenses over the claimant’s lifetime. If the proposed combination of COIDA and ODMWA or amendments to ODMWA were to occur, this could further increase the amount of statutory compensation that miners employed by AngloGold Ashanti could claim, which consequently could have an adverse effect on AngloGold Ashanti’s financial condition.
On 23 November 2010, the Chamber of Mines of South Africa applied to the North Gauteng High Court for a declaratory order as to whether or not the Compensation Commissioner may include in the levy to be paid by any specific mine under ODMWA any amount that is intended to be used for funding benefits payable to: (1) ex-mine workers who had never worked at that mine; or (2) ex-mine workers who used to work at the mine, but no longer work at the mine. On 29 April 2011, the Honorable Judge Zondo dismissed the Chamber’s application with costs. The judge concluded that the Compensation Commissioner has authority under ODMWA to address an historical or actuarial deficit in the Compensation Fund by increasing the levy payable by current mines and works to cover the shortfall in respect of all ex-mine workers. The Chamber lodged an appeal to the Supreme Court of Appeal. The appeal was dismissed with costs. The effect of the judgement is that ODMWA levies may be increased in respect of the category of former employees referred to above.
AngloGold Ashanti is subject to numerous claims, including a consolidated class action and individual claims related to silicosis and other OLD, and could be subject to similar claims in the future. AngloGold Ashanti has received notice of an application for class certification relating to silicosis in which the company is a respondent. It has also received notice of individual claims. Please refer to “Item 8: Financial Information – Legal Proceedings – South Africa – Silicosis litigation.”
In addition to OLD, AIDS and associated diseases remain major health care challenges faced by AngloGold Ashanti’s South African operations. Workforce prevalence studies indicate that HIV prevalence rates among AngloGold Ashanti’s South African workforce may be as high as 30 percent. AngloGold Ashanti continues to develop and implement programmes to help those infected with HIV and prevent new infections from spreading. Since 2001, the company has offered a voluntary counseling and HIV testing programme for employees in South Africa and, since 2003, has offered anti-retroviral therapy to HIV positive employees who meet the current medical criteria and who desire this treatment.
Malaria and other tropical diseases also pose health risks at all of the company’s operations in Central, West and East Africa where such diseases may assume epidemic proportions because of ineffective national control programmes. Malaria is a major cause of death in young children and pregnant women but also gives rise to deaths and absenteeism in adult men. All affected company operations have malaria control programmes in place.
Other conditions such as heart disease, chronic diseases and obesity are of increasing incidence and concern. Such diseases impair the health of workers and negatively affect productivity and profitability as a result of workers’ diminished focus or skill, absenteeism, treatment costs and allocated resources.
AngloGold Ashanti cannot guarantee that any current or future medical programme will be successful in preventing or reducing the injury and illness rates amongst its employees or in affecting consequent morbidity or mortality rates. AngloGold Ashanti may incur significant costs in addressing this issue in the future, which could also adversely impact the company’s results of operations and financial condition.
74
ANGLOGOLD ASHANTI GLOBAL OPERATIONS: 20142016
Operations and projects
AMERICAS | AMERICAS | CONTINENTAL AFRICA | AUSTRALASIA | EXPLORATION AND TECHNOLOGY | AMERICAS | CONTINENTAL AFRICA | SOUTH AFRICA | |||||||||||||||||
| 1. | Argentina | 4. | Guinea | 10. | Australia | 12. | Australia | Argentina | 4. | Guinea | 9. | South Africa | ||||||||||||
| Cerro Vanguardia (92.5%) | Siguiri (85%) | Sunrise Dam | 13. | Colombia | Cerro Vanguardia (92.5%) | Siguiri (85%) | Vaal River | |||||||||||||||||
| 2. | Brazil | 5. | Mali | Tropicana (70%) | 14. | Guinea | Brazil | 5. | Mali | Kopanang | ||||||||||||||
| Serra Grande | Morila (40%)(1) | 15. | South Africa | Serra Grande | Morila (40%)(1) | Moab Khotsong | ||||||||||||||||||
| AGA Mineração | Sadiola (41%) | SOUTH AFRICA | AGA Mineração | Sadiola (41%) | West Wits | |||||||||||||||||||
| 3. | United States | Yatela (40%) | 11. | South Africa | Colombia | 6. | Ghana | Mponeng | ||||||||||||||||
| Cripple Creek & Victor (CC&V) | 6. | Ghana | Vaal River | Gramalote (51%) | Iduapriem | TauTona | ||||||||||||||||||
| Iduapriem | Great Noligwa | La Colosa | Obuasi | Surface Operations(2) | ||||||||||||||||||||
| Obuasi | Kopanang | Quebradona (92.72%) | 7. | DRC | ||||||||||||||||||||
| 7. | DRC | Moab Khotsong | Kibali (45%)(1) | |||||||||||||||||||||
| AUSTRALASIA | AUSTRALASIA | 8. | Tanzania | |||||||||||||||||||||
| 10. | Australia | Geita | ||||||||||||||||||||||
| Kibali (45%)(1) | West Wits | Sunrise Dam | ||||||||||||||||||||||
| 8. | Tanzania | Mponeng | Tropicana (70%) | |||||||||||||||||||||
| Geita | TauTona | |||||||||||||||||||||||
| 9. | Namibia | Surface Operations (3) | ||||||||||||||||||||||
| Navachab(2) | ||||||||||||||||||||||||
Percentages indicate the ownership interest in AngloGold Ashanti, whether held directly or indirectly. All operations are 100%-owned unless otherwise indicated.
| (1) | Both Morila and Kibali are managed and operated by Randgold Resources Limited. |
| (2) |
|
|
75
OPERATING PERFORMANCE
Group description
HeadquarteredAngloGold Ashanti, a gold mining company with a globally diverse, world-class portfolio of operations and projects, is headquartered in Johannesburg, South Africa, AngloGold Ashanti has 20 operations in 10 countries.
Africa. AngloGold Ashanti is a globalthe third largest gold mining and exploration company with a diversein the world, measured by production.
Our portfolio of mining17 operating mines in nine countries, comprises long-life, relatively low cost assets with differing ore body types located in key gold-producing regions. A number of these assets are strongly leveraged to energy costs and currencies.
Our operations are grouped regionally as follows:
South Africa (Vaal River, West Wits and projects on four continents, with more than 97%Surface Operations)
Continental Africa (Democratic Republic of the company’s revenue derived from the sale of gold produced at its operations located around the world. Working across the full spectrum of the mining value chain, the impact of the company’sCongo, Ghana, Guinea, Mali and Tanzania)
Americas (Argentina and Brazil)
Australasia (Australia)
These operating activities on the local communities and environments remain at the core of the business.
Following a strategic review of AngloGold Ashanti’s asset portfolio at the start of 2013, the company embarked on significant restructuring in response to current challenges in the gold sector, including increasing costs of productionassets are supported by greenfield projects and a fallfocused exploration programme.
In 2016, Obuasi was in gold prices.
Gold production increased for the second consecutive year, boosted by the contributions of new mines, Kibalicare and Tropicana, which had their first full year of production in 2014. The rationalisation of corporate structures and marginal production continued with the planned restructuring of the South African operationsmaintenance and the transition to limited productionclosure process at Obuasi in Ghana. On 30 June 2014, the sale of the Navachab mine in Namibia was completed.
AngloGold Ashanti’s brownfield and greenfield exploration programmes take place in both established and new gold producing regions through managed and non-managed joint ventures, strategic alliances and wholly-owned ground holdings.Yatela continued. All other assets remained fully operational.
AngloGold Ashanti’s operations and joint ventures employed, on average, 58,05752,649 people (including contractors) in 2014 (2013: 66,434)2016 (2015: 52,266).
Performance
In 2014,2016, AngloGold Ashanti produced attributable 4.43.6 million ounces of gold (2013: 4.1(2015: 3.9 million ounces) as well as 1.3 million810,000 pounds of uranium oxide, 3.55.2 million ounces of silver and 192183 tonnes of sulphuric acid asby-products.
Production of 4.43.6 Moz was achieved at a cost of sales of $3.3 billion and a groupall-in sustaining cost of $1,026/$986/oz compared to 4.13.8 Moz at $1,174/$910/oz the previous year.(from continuing operations) in 2015.
The attributable Ore Reserve at 31 December 20142016 was 57.550.0 Moz, down from 67.951.7 Moz at 2013.2015. This annual decrease reflects theof 1.7Moz includes depletion of 3.9Moz, which was partly offset by 3.4Moz of additions in Ore Reserve resulting from changes in economic assumptions depletionbetween 2015 and the sale of Navachab.2016, exploration and modelling changes and other factors. See “Item 4D – Ore Reserves”.
Capital expenditure, including equity accounted joint ventures, in 20142016 amounted to $1,209$811 million (2013: $1,993 million)(2015: $799 million – excluding discontinued operations).
Safety
Regrettably, there were 67 fatalities across the group’s operations in 2014.2016. The all injury frequency rate was 7.367.71 per million hours worked compared to 7.487.18 in 2013.2015.
76
OPERATIONS AT A GLANCE for the years ended 31 December
| Attributable tonnes treated/milled (Mt) | Average grade recovered (g/t) | Attributable production | Total cash ($ per ounce) | All-in sustaining costs ($/oz sold) | Attributable capital (1) expenditure ($m) | |||||||||||||||||||||||||||||||||||||||||||||||||||||||||||||||||
| 2014 | 2013 | 2012 | 2014 | 2013 | 2012 | 2014 | 2013 | 2012 | 2014 | 2013 | 2012 | 2014 | 2013 | 2012 | 2014 | 2013 | 2012 | |||||||||||||||||||||||||||||||||||||||||||||||||||||
SOUTH AFRICA | ||||||||||||||||||||||||||||||||||||||||||||||||||||||||||||||||||||||
Vaal River | ||||||||||||||||||||||||||||||||||||||||||||||||||||||||||||||||||||||
Great Noligwa | 0.4 | 0.4 | 0.5 | 6.44 | 6.15 | 5.72 | 78 | 83 | 84 | 1,074 | 1,100 | 1,226 | 1,185 | 1,305 | 1,530 | 7 | 13 | 27 | ||||||||||||||||||||||||||||||||||||||||||||||||||||
Kopanang | 0.8 | 1.0 | 0.9 | 5.55 | 5.23 | 5.40 | 140 | 178 | 164 | 1,023 | 918 | 1,015 | 1,256 | 1,255 | 1,497 | 26 | 52 | 94 | ||||||||||||||||||||||||||||||||||||||||||||||||||||
Moab Khotsong | 0.7 | 0.7 | 0.6 | 11.04 | 9.47 | 8.16 | 234 | 212 | 162 | 685 | 797 | 1,040 | 903 | 1,223 | 1,634 | 45 | 117 | 159 | ||||||||||||||||||||||||||||||||||||||||||||||||||||
West Wits | ||||||||||||||||||||||||||||||||||||||||||||||||||||||||||||||||||||||
Mponeng | 1.1 | 1.6 | 1.3 | 8.99 | 7.10 | 9.40 | 313 | 354 | 405 | 746 | 719 | 639 | 981 | 1,016 | 883 | 97 | 171 | 195 | ||||||||||||||||||||||||||||||||||||||||||||||||||||
Savuka(1) | 0.2 | 6.09 | 37 | 1,041 | 1,607 | 20 | ||||||||||||||||||||||||||||||||||||||||||||||||||||||||||||||||
TauTona(1) | 0.9 | 1.0 | 0.8 | 8.21 | 7.34 | 7.63 | 232 | 235 | 189 | 882 | 920 | 924 | 1,059 | 1,149 | 1,316 | 35 | 59 | 73 | ||||||||||||||||||||||||||||||||||||||||||||||||||||
Surface Operations | ||||||||||||||||||||||||||||||||||||||||||||||||||||||||||||||||||||||
Surface | 34.5 | 34.5 | 17.9 | 0.20 | 0.22 | 0.30 | 223 | 240 | 172 | 941 | 883 | 943 | 1,153 | 969 | 754 | 46 | 39 | 15 | ||||||||||||||||||||||||||||||||||||||||||||||||||||
Other(3) | 3 | - | - | 8 | ||||||||||||||||||||||||||||||||||||||||||||||||||||||||||||||||||
CONTINENTAL AFRICA | ||||||||||||||||||||||||||||||||||||||||||||||||||||||||||||||||||||||
Ghana | ||||||||||||||||||||||||||||||||||||||||||||||||||||||||||||||||||||||
Iduapriem | 4.9 | 4.8 | 4.6 | 1.13 | 1.43 | 1.22 | 177 | 221 | 180 | 865 | 861 | 955 | 1,020 | 1,025 | 1,437 | 21 | 28 | 95 | ||||||||||||||||||||||||||||||||||||||||||||||||||||
Obuasi(4) | 2.2 | 1.7 | 2.1 | 4.67 | 4.94 | 4.79 | 243 | 239 | 280 | 1,086 | 1,406 | 1,187 | 1,374 | 2,214 | 2,021 | 82 | 196 | 185 | ||||||||||||||||||||||||||||||||||||||||||||||||||||
Guinea | ||||||||||||||||||||||||||||||||||||||||||||||||||||||||||||||||||||||
Siguiri (85%) | 10.1 | 10.2 | 10.1 | 0.89 | 0.82 | 0.76 | 290 | 268 | 247 | 799 | 918 | 938 | 917 | 1,085 | 1,105 | 26 | 25 | 28 | ||||||||||||||||||||||||||||||||||||||||||||||||||||
Mali | ||||||||||||||||||||||||||||||||||||||||||||||||||||||||||||||||||||||
Morila (40%) | 1.3 | 1.4 | 1.8 | 1.06 | 1.23 | 1.41 | 44 | 57 | 81 | 1,162 | 773 | 767 | 1,298 | 1,051 | 765 | 6 | 13 | 1 | ||||||||||||||||||||||||||||||||||||||||||||||||||||
Sadiola (41%) | 2.1 | 2.0 | 1.9 | 1.28 | 1.34 | 1.64 | 85 | 86 | 100 | 1,028 | 1,334 | 1,169 | 1,133 | 1,510 | 1,249 | 6 | 42 | 37 | ||||||||||||||||||||||||||||||||||||||||||||||||||||
Yatela (40%) | 0.9 | 1.0 | 1.1 | 0.59 | 0.93 | 1.06 | 11 | 27 | 29 | 1,438 | 1,530 | 1,758 | 1,795 | 1,653 | 1,888 | - | 3 | 2 | ||||||||||||||||||||||||||||||||||||||||||||||||||||
Namibia | ||||||||||||||||||||||||||||||||||||||||||||||||||||||||||||||||||||||
Navachab(5) | 0.7 | 1.4 | 1.4 | 1.44 | 1.39 | 1.59 | 33 | 63 | 74 | 752 | 691 | 1,036 | 719 | 781 | 1,329 | 1 | 5 | 15 | ||||||||||||||||||||||||||||||||||||||||||||||||||||
Tanzania | ||||||||||||||||||||||||||||||||||||||||||||||||||||||||||||||||||||||
Geita | 5.2 | 4.0 | 4.8 | 2.86 | 3.54 | 3.47 | 477 | 459 | 531 | 599 | 515 | 427 | 890 | 833 | 816 | 129 | 154 | 216 | ||||||||||||||||||||||||||||||||||||||||||||||||||||
DRC | ||||||||||||||||||||||||||||||||||||||||||||||||||||||||||||||||||||||
Kibali (45%)(7) | 2.5 | 0.4 | 2.95 | 3.41 | 237 | 40 | 578 | 471 | 588 | 9,065 | 179 | 341 | 263 | |||||||||||||||||||||||||||||||||||||||||||||||||||||||||
AUSTRALASIA | ||||||||||||||||||||||||||||||||||||||||||||||||||||||||||||||||||||||
Australia | ||||||||||||||||||||||||||||||||||||||||||||||||||||||||||||||||||||||
Sunrise Dam | 3.8 | 3.5 | 3.4 | 2.13 | 2.46 | 2.39 | 262 | 276 | 258 | 1,105 | 1,110 | 1,126 | 1,214 | 1,321 | 1,470 | 31 | 39 | 49 | ||||||||||||||||||||||||||||||||||||||||||||||||||||
Tropicana (70%)(7) | 4.0 | 0.9 | 2.78 | 2.40 | 358 | 66 | 545 | 568 | 752 | 1,113 | 59 | 241 | 315 | |||||||||||||||||||||||||||||||||||||||||||||||||||||||||
AMERICAS | ||||||||||||||||||||||||||||||||||||||||||||||||||||||||||||||||||||||
Argentina | ||||||||||||||||||||||||||||||||||||||||||||||||||||||||||||||||||||||
Cerro Vanguardia | 3.0 | 2.3 | 1.7 | 6.08 | 6.58 | 6.48 | 246 | 241 | 219 | 692 | 622 | 576 | 938 | 912 | 935 | 54 | 64 | 88 | ||||||||||||||||||||||||||||||||||||||||||||||||||||
Brazil | ||||||||||||||||||||||||||||||||||||||||||||||||||||||||||||||||||||||
AGA Mineração(4) | 2.5 | 2.3 | 2.2 | 5.65 | 5.70 | 6.07 | 403 | 391 | 388 | 644 | 646 | 696 | 966 | 1,023 | 1,114 | 127 | 123 | 162 | ||||||||||||||||||||||||||||||||||||||||||||||||||||
Serra Grande(6) | 1.3 | 1.3 | 0.9 | 3.28 | 3.42 | 3.36 | 136 | 138 | 98 | 748 | 719 | 821 | 1,062 | 970 | 1,168 | 38 | 40 | 33 | ||||||||||||||||||||||||||||||||||||||||||||||||||||
United States | ||||||||||||||||||||||||||||||||||||||||||||||||||||||||||||||||||||||
Cripple Creek & Victor | 19.3 | 20.8 | 20.9 | 0.32 | 0.34 | 0.40 | 211 | 231 | 247 | 829 | 732 | 638 | 1,147 | 927 | 817 | 169 | 157 | 100 | ||||||||||||||||||||||||||||||||||||||||||||||||||||
|
|
|
|
|
|
|
Rounding of figures may result in computational discrepancies.
77
SOUTH AFRICA
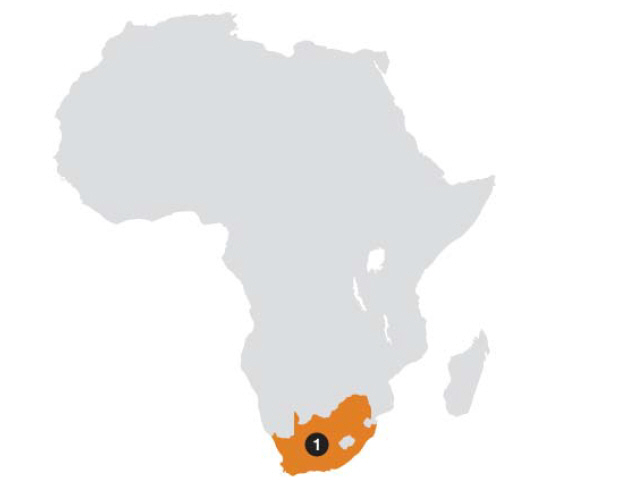
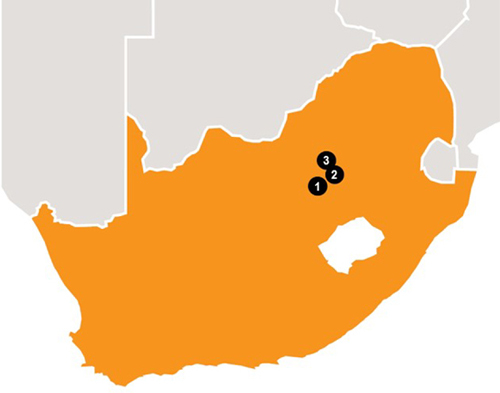
AngloGold Ashanti’s South African operations comprise fivefour deep-level mines and surface production facilities. They are:
The Vaal River operations – Great Noligwa, Kopanang and Moab Khotsong;
The West Wits operations – Mponeng and TauTona; and
Surface operations.
| Gold production (000oz) | Average number of employees | Gold production (000oz) | Average number of employees | |||||||||||||
Operations | Operations |
| Operations |
| ||||||||||||
1. South Africa | ||||||||||||||||
Vaal River | ||||||||||||||||
Great Noligwa | 78 | 2,207 | ||||||||||||||
South Africa | ||||||||||||||||
1. Vaal River | ||||||||||||||||
Kopanang | 140 | 4,424 | 91 | 4,055 | ||||||||||||
Moab Khotsong | 234 | 4,573 | 280 | 6,310 | ||||||||||||
West Wits | ||||||||||||||||
2. West Wits | ||||||||||||||||
Mponeng | 313 | 6,737 | 254 | 6,105 | ||||||||||||
TauTona | 232 | 4,712 | 146 | 4,723 | ||||||||||||
Surface operations(1) | 223 | 3,058 | ||||||||||||||
3. Surface operations(1) | 186 | 3,140 | ||||||||||||||
| (1) | Includes MWS for purposes of this report. It is operated and managed as a separate |
78
South Africa Key Statistics
| Unit | 2014 | 2013 | 2012 | Unit | 2016 | 2015 | 2014 | |||||||||
Operation | ||||||||||||||||
Tonnes treated/milled | Mt | 38.4 | 39.2 | 22.2 | Mt | 39.6 | 36.8 | 38.4 | ||||||||
Pay limit(1) | oz/t | 0.39 | 0.36 | 0.40 | oz/t | 0.37 | 0.39 | 0.39 | ||||||||
| g/t | 14.35 | 13.37 | 12.41 | g/t | 13.81 | 14.38 | 14.35 | |||||||||
Recovered grade(1) | oz/t | 0.239 | 0.204 | 0.219 | oz/t | 0.219 | 0.225 | 0.239 | ||||||||
| g/t | 8.19 | 7.00 | 7.50 | g/t | 7.51 | 7.70 | 8.19 | |||||||||
Gold production | 000oz | 1,223 | 1,302 | 1,212 | 000oz | 967 | 1,004 | 1,223 | ||||||||
Cost of sales | $m | 1,041 | 1,083 | 1,324 | ||||||||||||
Total cash costs(2) | $/oz | 849 | 850 | 873 | $/oz | 896 | 881 | 849 | ||||||||
Total production costs(2) | $/oz | 1,087 | 1,070 | 1,097 | ||||||||||||
All-in sustaining costs(2)(3) | $/oz | 1,064 | 1,120 | 1,189 | $/oz | 1,081 | 1,088 | 1,064 | ||||||||
Capital expenditure | $m | 264 | 451 | 583 | $m | 182 | 206 | 264 | ||||||||
Safety | ||||||||||||||||
Number of fatalities | 4 | 6 | 11 | 6 | 9 | 4 | ||||||||||
AIFR | Per million hours worked | 11.85 | 12.63 | 13.24 | Per million hours worked | 12.02 | 10.81 | 11.85 | ||||||||
People | ||||||||||||||||
Average no of employees: Total | 29,511 | 32,406 | 34,186 | 28,507 | 28,325 | 29,511 | ||||||||||
Permanent employees | 26,056 | 28,526 | 29,740 | 25,205 | 25,274 | 26,056 | ||||||||||
Contractors | 3,455 | 3,880 | 4,446 | 3,302 | 3,051 | 3,455 | ||||||||||
| (1) | Refers to underground operations only. |
| (2) | Total cash costs |
| (3) | Excludes stockpile impairments. |
Performance in the South Africa Region in 20142016
Production and costs
Production declined by 6%, predominantlyfrom the South Africa region was 4 percent down on 2015 due to the lower volumes mined, a consequenceresult of safety-related stoppages, reduced levels of productivity and a decline in underground yield. The most significant grade decline was at TauTona. Overall, production lost by the aftermathSouth Africa region due to safety stoppages totalled 104,000oz in 2016, mostly at Kopanang, Moab Khotsong and TauTona.
At West Wits Mponeng delivered the best performance in the region, with a 16 percentyear-on-year improvement in production following the successful implementation of the earthquake experienced on 5 August 2014,so-called‘de-risk plan’, which effectively called for the withdrawal from certain mining areas where analysis showed elevated risk levels, and unscheduled shaft maintenance at Mponeng.
The 5.3 magnitude earthquake affected the Vaal River mines. Production was halted at these operations for fiveestablishment of critical infrastructure to ten days to allowsupport the aftershocks to subside and to undertake repairs beforeramp up in production resumed. At Mponeng,from the below 120 level project area. Although mining of the higher grade areas declined, Mponeng’s production was suspended for seven daysaugmented by high-quality mining practices and an improved mining mix. There were also fewer safety-related disruptions at Mponeng in 2016 compared to allow significant repair work on damaged shaft steelwork and to return the shaft to safe levels of service.previous year.
Production from Surface OperationsTauTona’s production was negatively affected by several incidents. A gravity-inducedfall-of-ground fatality early in the decreased gradefirst quarter of the material sourced fromyear halted development work in the marginal ore dumps. Mining flexibility has been improved so asaffected section for most of the quarter while work was completed to enable more active blending. The region’s contributionmodify and enhance the secondary support standards at all development ends. A significant seismic event in the Savuka section in April 2016, which caused two fatalities, led to group attributable goldthe subsequent suspension of production moved from 32%in most of that section and the level 116 haulage (the access way to 28% in 2014.two new raise lines), which is expected to remain inaccessible until late 2017, if at all. In addition, the Vaal River operations produced 1.3Mlb of uranium.
The focus on cost containment continued in 2014, in line with the Project 500 initiative to reduce overall group costs by $500ma fatal underground locomotive accident in the 18 monthsthird quarter resulted in operations being suspended for a prolonged period while steps were taken to end 2014, cost reduction initiatives were undertaken in the region. The emphasis on the management of labour costs, reef mining-related activities, power consumption, contractorsimprove procedures and the implementation of service optimisation strategies as well as a robust critical review of commodity- and services-related contracts all contributed to lower operating costs. Inflationary pressures, which included increases in electricity tariffs that exceeded inflation, were partially compensated for by cost savings from the Project 500 initiatives and also a weaker local currency. All-in sustaining costs for the year declined 5% to $1,064/oz.ensure safe working conditions.
Capital expenditure
Capital expenditure declined by 41%, in line with the groupwide cost optimisation and rationalisation programme and the resultant scaling back of project investment. Capital expenditure in 2014 was again predominantly on ore reserve development across all underground operations and on the Mponeng deepening project, as well as stay-in-business items and activities across all underground operations.
Safety
There were tragically four fatalities during 2014 (2013: six) – oneProduction at the Vaal River operations remained largely unchanged at 371,000oz. A 10 percentyear-on-year increase in production from Moab Khotsong offset the decline at Kopanang. At Moab Khotsong, increased production was driven by higher volumes mined, additional face length availability, a 5 percent increase in the mine call factor and threethe higher underground grade mined during the year.
However, these increases in production were offset by issues at Kopanang, including safety-related stoppages in the second quarter of the year, lower volumes and a 6 percent decrease in grade mined. Lower volumes mined were attributed to lower efficiencies caused by face time constraints as mining is largely conducted at the West Wits operations. Threeextremities of thesethe operation, causing significant travel times to production areas. To mitigate this, the mining cycle has been modified to allow for more efficient use of the limited face time available. The decline in underground grade was expected as the mining fronts move towards the lower grade western areas.
While tonnage throughput for the year increased by 8 percent at Surface Operations, lower feed grades and recoveries resulted in decreased productionyear-on-year. Optimisation of the plant circuit to improve recoveries continued. Recommissioning of the uranium plant began in the third quarter with uranium production recommencing in August.
As stockpiles of high-grade, hard-rock material were caused by fallsdepleted during the year, processing of groundlower-grade tailings increased, contributing to the decline in feed grades. This posed significant challenges to the operation. A blending strategy was initiated and onein an effort to optimise the ratio of marginal ore dump and tailings material at the plant, and to mitigate the lower than anticipated grade fed into the Savuka plant. Additionally, a project was launched to screen and truck marginal ore from Moab Khotsong to further improve the resultgrades.
The focus at all the South African operations was on identifying improvement projects to both rationaliseoff-mine costs and driveon-mine efficiencies. The consolidation of an incident involving pipingthe region’s operations into three operating entities, to eliminate any duplication of services and construction work.
Capital expenditure
79
All mines and plantsOverall, capital expenditure in the region achieved 1 million fatality-free shifts and Kopanang, most notably, has recorded three million fatality-free shifts. This was achieved despitedeclined by 12 percentyear-on-year, due to the impact of the 5.3 magnitude earthquake which resulted in minor injuries to 30 employees and the evacuation and safe return to surface of 3,300 people in all at the Vaal River operations.
People
The South Africa region employed an average of 29,511 people in 2014 – 26,056 full-time employees and 3,455 contractors – as compared to 32,406 in 2013 and 34,186 in 2012 – a decline of 14% in two years. This decline in the number employed was a resultvalue of various cost rationalisation initiatives implemented across the group over the past two years. Productivity declined to 4.40oz/TECrand. Capital expenditure in 2014 (2013: 4.47oz/TEC).rand terms remained in line with 2015.
The next round of wage negotiations is due to beginSafety
Regrettably, six fatalities occurred in the first half of 2015 as the current wage agreement comes to an end on 30 June 2015.
In the South Africa region 94%in 2016. Four of these occurred at TauTona with two at the workforce is represented by four industry unions: AMCU, NUM, SolidaritySavuka section followingfall-of-ground and Uasa.tramming incidents. A further two fatalities occurred followingfall-of-ground related incidents at Kopanang.
Ore Reserve
As at 31 December 2014,2016, the total Ore Reserve for the South AfricaAfrican region is 27.45Moz (2013: 30.9Moz)was 25.1Moz (2015: 26.1Moz). This is equivalent to around 48%50 percent of the group’s total attributableGroup’s Ore Reserve.
Growth and improvement
ProjectMponeng
Phase 1 of Mponeng’s below 120 level project is in its productionbuild-up phase. Infrastructure development on 123 level progressed according to schedule with four raise lines holed during the year. Construction of capital infrastructure, execution of ore reserve development and logistical efficiency improvements all proceeded as planned. Ramp up to steady state ore reserve development is expected to begin in the second half of 2017, once ore handling infrastructure has been commissioned.
The Mponenglife-of-mine extension project – Phase 2 – will be advanced to feasibility stage with the related study scheduled to be completed bymid-2018. This follows concept and prefeasibility studies on a CLR extension project that were undertaken during 2016, the results of which were presented to the board early in 2017. Critical path activities will continue on the project throughout 2017.
The project design intends to establish asub-vertical shaft extension to access the majority of the CLR and VCR ounces (excluding Phase 1) below the current 120 level through a single common infrastructure. This contrasts the phased approach previously envisaged to access the ore body via a series of ramp and decline extensions with independent focus on each of the ore bodies. Most of the revised approach to Phase 2 includes ramp up of development and other preparatory work for shaft sinking and access development. This phase of the project is expected to access six levels on the CLR and four levels on the VCR by means of a vertical shaft extension.
Phase 2 commissioning of the surface substation was completed by Eskom at the end of 2016 and other activities continued, including equipping of the inter-level ice hole, construction of the 116 level substation and the water handling infrastructure complex on 121 level.
Zaaiplaats
Initial development of project Zaaiplaats at Moab Khotsong which was temporarily halted in 2013, remains on hold. Additional geological information gathered inundertaken to facilitate exploitation of additional ore blocks adjacent and contiguous to current mining areas. The most important are the interim reflected a deterioration inlower mine blocks (Zaaiplaats and areas A, B and C), located southwest of current mine infrastructure and extending below the grade ofexisting mine. Over the project, making it economically unviable atpast few years, the current gold price.
At Mponeng, phase 1 of the deepening project to access the VCR progressed well. Although safety stoppages following a shaft incident led to some delays, stoping and ledging operations have begun. The emphasis in the coming year is expected to be to increase the volume of ore reserve development so as to open up high-grade reserves. Given the slumpdecline in the gold price, phase 2together with changes in key parameters and economic assumptions, reduced the economic viability of this project to accessand it was placed on hold. While Zaaiplaats is included in Moab Khotsong’slife-of-mine plan and Ore Reserve base, it is currently the CLR was delayed in 2014. Critical path work continued and included the installationsubject of ventilation and refrigeration infrastructure to enable the ramp-up to full project execution in 2015, should the capital budget be approved. This project is also expected to investigate the viability of optimised shift schedules with a view to improving productivity and speeding up access to the higher-grade areas.
The uranium plant at Mine Waste Solutions (MWS) was successfully completed with the first deliveries in the fourth quarter of the year. The recovery in the uranium price during the year was encouraging.
The Technology Innovation Consortium continued to make significant progress towards the development of the new deep-level mining technology. The aim, ultimately, is to develop a cost-efficient, safe, mining method to implement at our deep-level underground operations in South Africa to extract stability pillars and areas that might otherwise not be safe or viable to mine. In 2015, the final element of work is expected to be to compile a deep-level mining method based on this mining style. Key to maximising the efficacy of this method will be enhanced machine efficiencies. This in turn would entail increasing machine availability and a 24-hour mining cycle. While such working arrangements are still to be negotiated with labour, the company believes that they would increase the global competitiveness of the South Africa mining industry.prefeasibility study.
80
CONTINENTAL AFRICA
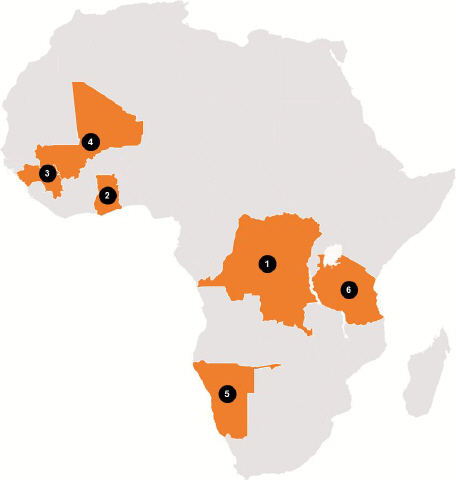
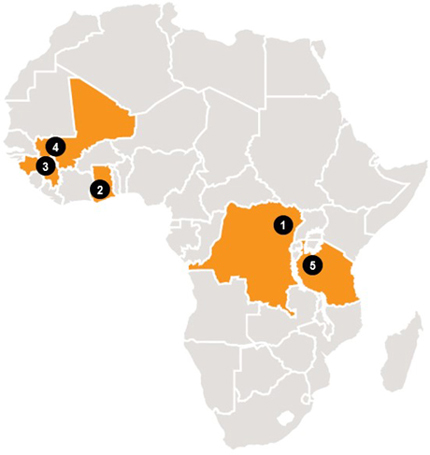
AngloGold Ashanti has seven mines in the region, six of which are producing mines and processing operations, (ofand five of which the group manages four)AngloGold Ashanti manages. Obuasi is in five countries in the Continental Africa region, following much activity in 2014 with the sale of the Navachab mine in Namibia, the transition to limited miningcare and maintenance. Closure is underway at Obuasi in Ghana and the cessation of mining at Yatela in Mali.Yatela.
| Attributable gold production (000oz) | Average number of employees | |||||||
Operations | ||||||||
1. Democratic Republic of the Congo | ||||||||
Kibali 45% | 237 | 2,245 | ||||||
2. Ghana | ||||||||
Iduapriem | 177 | 1,352 | ||||||
Obuasi | 243 | 3,541 | ||||||
3. Guinea | ||||||||
Siguiri 85% | 290 | 3,494 | ||||||
4. Mali | ||||||||
Morila 40% | 44 | 500 | ||||||
Sadiola 41% | 85 | 654 | ||||||
Yatela 40% | 11 | 226 | ||||||
5. Namibia | ||||||||
Navachab(1) | 33 | 793 | ||||||
6. Tanzania | ||||||||
Geita | 477 | 3,265 | ||||||
|
| Attributable gold production (000oz) | Average number of employees | |||||||
Operations | ||||||||
| ||||||||
1. Democratic Republic of the Congo | ||||||||
Kibali 45% | 264 | 2,180 | ||||||
2. Ghana | ||||||||
Iduapriem | 214 | 1,576 | ||||||
Obuasi | 3 | 766 | ||||||
3. Guinea | ||||||||
Siguiri 85% | 260 | 3,509 | ||||||
4. Mali | ||||||||
Morila 40% | 22 | 324 | ||||||
Sadiola 41% | 70 | 588 | ||||||
5. Tanzania | ||||||||
Geita | 489 | 3,748 | ||||||
81
Continental Africa - Key Statistics
| Unit | 2014 | 2013 | 2012 | Unit | 2016 | 2015 | 2014 | |||||||||
Operation | ||||||||||||||||
Tonnes treated/milled | Mt | 29.9 | 26.9 | 27.8 | Mt | 28.2 | 27.2 | 29.9 | ||||||||
Pay limit | oz/t | 0.039 | 0.049 | 0.041 | oz/t | 0.034 | 0.036 | 0.039 | ||||||||
| g/t | 1.345 | 1.669 | 1.273 | g/t | 1.175 | 1.233 | 1.345 | |||||||||
Recovered grade | oz/t | 0.054 | 0.054 | 0.055 | oz/t | 0.047 | 0.053 | 0.054 | ||||||||
| g/t | 1.66 | 1.69 | 1.70 | g/t | 1.46 | 1.64 | 1.66 | |||||||||
Gold production (attributable) | 000oz | 1,597 | 1,460 | 1,521 | 000oz | 1,321 | 1,435 | 1,597 | ||||||||
Cost of sales | Sm | 1,331 | 1,347 | 1,636 | ||||||||||||
Total cash costs(1) | $/oz | 783 | 869 | 830 | $/oz | 717 | 678 | 783 | ||||||||
Total production costs(1) | $/oz | 977 | 1,086 | 1,060 | ||||||||||||
All-in sustaining costs(1)(2) | $/oz | 968 | 1,202 | 1,235 | $/oz | 904 | 815 | 968 | ||||||||
Capital expenditure | $m | 454 | 839 | 925 | $m | 291 | 315 | 454 | ||||||||
Safety | ||||||||||||||||
Number of fatalities | 0 | 2 | 5 | 0 | 1 | 0 | ||||||||||
AIFR | Per million hours worked | 1.56 | 1.97 | 2.26 | Per million hours worked | 0.51 | 0.50 | 1.56 | ||||||||
People | ||||||||||||||||
Average no of employees: Total | 16,070 | 16,625 | 16,621 | 12,691 | 11,942 | 16,070 | ||||||||||
Permanent employees | 8,739 | 10,778 | 10,014 | 5,331 | 5,061 | 8,739 | ||||||||||
Contractors | 7,331 | 5,847 | 6,607 | 7,360 | 6,881 | 7,331 | ||||||||||
| (1) | Total cash costs |
| (2) | Excludes stockpile impairments. |
Production and costs
The ramp up and first full year ofProduction in the Continental Africa region decreased 8 percent with increased production at Kibali more than offsetIduapriem, Siguiri and Sadiola offsetting production declines elsewhere in the decline at Yatela and the half-year contribution by Navachab which was sold in June 2014.region. The region’s attributabledecreased production increased by 9%.
Kibali produced its first gold in 2013, ahead of schedule, and delivered 527,000oz in 2014, of which 45%year-on-year is attributable to AngloGold Ashanti.
During 2014, productionplanned lower recovered grades at Kibali came largelyGeita as the first underground operations ramp up to commercial quantities at average resource grades; a setback from the open pit, while significant development of underground workings was carried out. Underground mining began following the start of blastingplant stability challenges that were encountered in first half of the first stope inyear while dealing with multiple ore sources at Kibali; the latter parttransition to treatment of the year. The oxide plant was successfully ramped up in early 2014 with the sulphide plant being commissioned in the second half. Kibali’s Ore Reserve is currently estimated at around 11Moz (attributable: 4.94Moz), accounting for 26% of the Continental Africa region’s Ore Reserve.
Our largest operations in the region, Geita and Siguiri, recorded strong performances for the year. At Geita, tonnes milled of hard sulphide ore surpassed 5Mt for the first time, a result of better mill running time and fragmentation control. This followed improvements in blast fragmentation, the installation of a secondary crusher and improved carbon management systems in the leach circuit. These improvements offsetlow grade declines at the Star & Comet pit; the failure of the pit wall at Nyakanga Cut 7; and delays at Geita Hill East pit.
At Siguiri, tonnes treated remained stable with a higher than expected improvement in recovered grades contributing to an increase in production. The grades, however, declinedtailings storage material in the latter part of the year as higher-grade ore resources were depleted.at Morila; and no production at Obuasi, which transitioned to care and maintenance status.
In Mali,At Kibali, production decreased overallfell 9 percent from 2015, to 264,000oz in 2016. Kibali’s performance improved significantly in the second half of 2016 as the mines continuedplant stability issues encountered in the first half of the year were resolved. Production increased 32 percent in the second half of the year over the first half due to wind down in line with planned transition to closure, treating lower grade waste tonnes.
At Obuasi, while output increased marginally year-on-year, underground production was haltedimproved plant throughput at higher metallurgical recoveries, following the introduction of satellite open-pits in the fourth quarter. Processingquarter which provided higher grade material and greater flexibility in managing the multiple ore sources. The operational challenges encountered in the first half of tailingsthe year occurred while testing both plant streams to run on sulphides as per the design specification, ahead of the depletion of oxide ore. A drop in recoveries was compounded by bearing failure on one of the ball mills, causing a sharp drop in production and aboveground stockpilesa steep increase in costs. The introduction of the Kombokolo and Rhino satellite pits in the fourth quarter of the year also increased production towardsyear-end, by adding higher grades and improving mining flexibility. Kibali reported record tonnage throughput in the fourth quarter of the year.
At Iduapriem, production increased by 11 percentyear-on-year as a result of mining in deeper, higher-grade areas. This was accompanied by a 9 percent increase in tonnage treated from higher plant availability, compared to the previous year when the plant had an extended major shutdown to upgrade the semi-autogenous (SAG) mill. Throughput of 5.1Mt for the year was a record for the Iduapriem plant. Total tonnes mined increased by 28 percentyear-on-year to 28Mt in 2016 as the mine commenced a major waste stripping programme to access the ore sources in the Block 7&8 pit that would provide the foundation for the sustainability of the futurelife-of-mine. The improved performance is continuing.attributable to higher plant and mining fleet productivity as well as the efficiency gains stemming from major modifications and repair work completed in the milling circuit in the previous year.
Siguiri’s increase in production was boosted by higher tonnage treated, up 3 percent as the plant maintained consistent availability relative to the previous period. This was partly offset by a planned decrease in recovered grade in the first half of the year as lower grade stockpile material was processed whilst preparations for access to the Area 1 mining zone were being completed. Mining commenced in the higher grade Area 1 zone in the third quarter, with ramp up in the last quarter contributing significantly to increased production in the second half of the year.
At Geita, although there was a 5 percent increase in plant throughput due to treatment of softer ore and improved plant availability through consistent maintenance of operations, production was down owing to a planned 12 percent decrease in recovered grade. This decrease was in line with the initiativemining plan which introduced ore sourced from the initial underground operations at the Star & Comet mining area at lower than the average grades. Higher grades are expected to downscalebe realised as development progresses and commercial quantities are achieved.
Sadiola maintained production levels consistent with the previous year despite the limited mining flexibility as remaining oxide ore mining sources are depleted. The mine delivered the planned 5 percent increase in recovered grade, partly offset by a 3 percent decrease in tonnage throughput as a result of an increase in the treatment of transitional material. Tonnage throughput is flexed with a combination of the limited newly mined ore, marginal ore stockpile sources at lower grades and periodic drawdown from the higher, full-grade ore stockpiles. Plant operations were efficient and consistent, which provided the flexibility to maintain a steady quarterly production and revenue profile.
Morila completed the mining and processing of mineralised waste ore during the year and from the last quarter of the year has transitioned to a full tailings-storage material treatment operation temporarily whilewhich is expected to continue for the next two years, after which the mine will transition to full closure. Morila delivered a feasibility study is undertaken to explore options for its long-term sustainability.
Tailings retreatment continued23 percent increase in tonnage throughput during the year contributing to an22,000oz, as a result of consistent plant availability and treatment of softer ore, which partially offset the decrease in recovered grade.
During 2016, AngloGold Ashanti consolidated its continuous improvement of close to 2% in ounces produced year-on-year, as we continued to discharge our environmental responsibilities. Development of a decline from surface toand operational review processes together with the existing mining blocks continued in 2014. The decline is expected to allow developmentvarious cost management initiatives under the umbrella of the appropriate infrastructure to enable mechanised operations‘Operational Excellence’ programme, focused on delivering systemic and de-bottlenecksustainable operational improvements and aimed at each operation rapidly progressing towards targetedall-in sustaining unit costs that reflect the mine, which was constrained by an outmoded, labour-intensive mining methodinherent opportunity and also ageing and sub-optimal vertical hoisting infrastructure.
82
By year-end Obuasi had successfully transitioned to limited operations andvalue set within the entire work force had been retrenched. Refer “Item 18 - note 7: Special Items”. A limited number of employees were recruited on a one-year fixed-term contract to oversee the mine while the feasibility study is underway. The study is due to be completed in the first half of 2015.
Project 500 gained significant traction in the region, with noteworthy gains made in several areas. In looking to improve process recoveries, an initiative to optimise dissolved oxygen levels improved recoveries across all major operating sites, particularly at Geita, Siguiri and Iduapriem. Mine plans were optimised, with low-margin or loss-making ounces removed and labour efficiencies were realised across the region, both among permanent employees and contractors. The expatriate contingent was reduced and consultant services curtailed. At Geita, mining efficiencies resulted in greater tonnages moved with no additions to the fleet, helping reduce unit mining costs. Work was done to realise benefit of a more favourable environment for buyers of contract mining services due to excess capacity across the globe. Competitive bidding processes for mining and related contracts were held at Siguiri, Geita, Sadiola and Iduapriem, with all resulting in new contractors or more favourable contracts agreed. Considerable effort was also directed at reducing working capital through the optimisation of consumable stores across the regional portfolio, and engagement with governments in Tanzania and Guinea to reduce indirect tax lock-ups.
The region as a whole also continued to realise the benefit of more consistent operating performance with tight management of all costs and capital. The region benefited from the inclusion of the first full-year’s production from the Kibali mine, which contributed production at lower-than-average cash cost. The sharply lower fuel price in the fourth quarter also aided cost control efforts, particularly for open pits mines which operate large truck and shovel fleets and generate all or part of their own power from diesel or heavy fuel oil, like the major mines in the region Geita, Kibali and Siguiri. As with the rest of the group, the focus on strict capital allocation and more concentrated exploration programme was also a strong feature in Continental Africa. The net result of these initiatives was a 19% reduction in all-in-sustaining costs to $968/oz, the lowest in the group.operation.
Capital expenditure
With completion of much of the work to establish operations at Kibali, capitalCapital expenditure for Continental Africa droppedthe region was lower compared to $454m in 2014 from 2013’s $839m and a further fall is anticipated in 2015, with the constructionreduction mainly due to cessation of work on capital projects at Obuasi and a reduction capitalised waste stripping at Geita as thecut-backs reached commercial production levels. The year’s capital expenditure at Geita included the purchase of a fleet of Caterpillar dump trucks for a scheduled retirement of the sulphideexisting fleet which is nearing the end of its useful economic life.
It is expected that capital expenditure in 2017 will increase as stripping of waste rock begins from the Teberebie ore body to extend the mine life at Iduapriem; the Siguiri mine begins constructing the Combination plant largely completedand associated power plant; underground production isramped-up at Kibali. Capital expenditure was reduced almost entirelyGeita while the mine’s20-year old power plant is replaced; and additional ore reserve development is conducted ahead of aramp-up in underground production at Obuasi which was placed on limited mining.Kibali.
Safety
Overall2016 saw a slight regression in safety performance from the record performance recorded during 2015. In terms of numbers, the Region equalled its 2015 performance of 16 recordable injuries during the year. However, due to a 4 percent reduction in the number of hours worked across the region, an increase of 2 percent in the all injury frequency rate (AIFR) from 0.50 in 2015 to 0.51 in 2016, has been realised. Notwithstanding this regression, safety performance in the Continental Africa region continued to improve. Therehas improved over the last three years with injury rates improving approximately 80 percent since 2013. Four of the 16 injuries were no fatalities during the year and the allclassified as lost-time injuries, with a lost-time injury frequency rate improved to 1.56(LTIFR) of 0.13 injuries per million hours worked, (2013: 1.97).
People
The average numberwhich compared favourably against the rate of people employed in the region declined, largely a result of the retrenchment process undertaken at Obuasi, from 16,625 in 2013 to 16,070 in 2014. Regional productivity improved significantly to 14.36oz/TEC (2013: 9.97oz/TEC). Most retrenchments were undertaken at the end of the year.0.22 recorded for 2015.
Ore Reserve
The total attributable Continental Africa Region Ore Reserve is 18.93was 17.8 million ounces (2013: 24.41(2015: 19.3 million ounces). This amounts to 3337 percent of the group’s Ore Reserve.
Growth and improvement
Our emphasisThe Convention de Base, an extension of the stability agreement between AngloGold Ashanti and the Guinean government, was ratified by the government in January 2017, following access to Area 1 mining zone which was secured in June 2016. The Hard Rock Combination Plant Project, for the expansion and conversion of the processing plant infrastructure will now commence. This will facilitate the processing of harder sulphide ore thereby extending the mine life, lowering costs and increasing production while also improving exploration potential in the area surrounding the mine. Allied to the mine-life extension project capital has also been approved for the construction of an owner- operated 39MW power plant, which will secure the future power requirements of the mine at lower power unit cost, and further lower the unit costs for the mine.
The updated feasibility study for the mining and treatment of sulphide ores at Sadiola, expected to increase processing plant throughput, lower costs and extend mine life, has been completed with our joint venture partner IAMGOLD. Further work on improving operationalthe project is subject to requisite government approvals, agreements and cost efficiencies in responsepermits. Discussions are currently underway with ministries of the government of the Republic of Mali with a view to gold’s persistent price decline and to caution over the metal’s immediate price direction. Kibali’s cost-efficient production ramp up has already contributed to overall production and a containment of overall costs per ounce. The focusexpeditiously achieving these approvals. Capital expenditure for 2015this project is now expected to be completion$410 million (100 percent) over 2 to 3 years.
Geita has successfully transitioned to underground mining the Star & Comet mining area. The first full year of underground commercial production will be during 2017 and this will supplement production fromopen-pit ore sources. Preparatory work to access the Nyankanga underground resource has been completed and blasting operations will begin in 2017. Permitting for Nyankanga was obtained from the government of Tanzania in early 2017. The long-term strategy for Geita is to extend the mine’s life by extracting the resources utilising bothopen-pit and underground mining methods. In 2017, the Company plans is to also replace the mine’s original20-year-old power plant to ensure reliable power supply.
At Iduapriem, plans are underway for an extensive waste stripping campaign at the Teberebie ore body to extend mine life, increase production levels, and lower costs. Major cutbacks commenced at blocks 7 and 8 pit in early 2017. In addition to the waste mining plan, regulatory permits have been obtained for exploratory work at the Nueng pit and to explore for high-grade,low-strip ratio ore bodies within the concession, with a view to further drive costs down and improve efficiencies and margins. To improve plant recovery, the current CIP leaching and adsorption circuit configuration is being modified to a hybrid CIP circuit configuration with commissioning scheduled for the second quarter of 2017.
At Kibali, after reaching a depth of 751.2m with shaft sinking and having completed equipping of the paste plant andshaft, the focus over the second hydro-power station – Ambarau. The sinkinghalf of 2016 was onoff-shaft underground development, which achieved 780m. First ore from the vertical shaft remained aheadis expected by the fourth quarter of schedule2017. At the Ambarau hydropower plant, commissioning commenced in February 2017, with first power now scheduled for the first half of 2017, with a shaft depth of 720m12MW capacity. The Azambi hydropower plant, the third to be built at the mine, was about 10 percent complete by the end of the year2016 and on track to be completed in 2018. This will provide Kibali with only 40m sinking remaining.
At Obuasi, following a two-year review of operational efficiencies, mining operations were significantly curtailed. A feasibility study investigating options42MW hydropower capacity at much reduced costs relative to modernise and improve the life-of-mine plan is underway. The focusthermal power. Off shaft development of the study is not onlycrusher and materials handling system was on track for commissioning of ore in the economicsecond half of 2017. With the commissioning of ore production from the shaft, this will bring an end to Kibali’s initial project scope and technical aspects but also security, environmental obligationscapital. A new pit was opened at Kombokolo, as mining progressed at Pakaka and community relations.Mengu Hill. Plant modifications to add four fine-grinding mills and expand the pump cell circuit are on schedule for commissioning in the second quarter of 2017.
Obuasi – An Update
In Guinea, despite indicationsearly February 2016, the military contingent that had provided security to Obuasi since March 2013, in terms of promising new developments, greenfields exploration teams had to bean agreement between Ghana’s military and members of the country’s Chamber of Mines, was withdrawn duringfrom the lattersite. No reason was given for the withdrawal and Obuasi was the only operation affected among dozens of other mines which enjoy this form of security. Shortly after the withdrawal, the site was invaded by hundreds of illegal miners who immediately began mining activities in the northern part of the year as a precaution againstconcession. Police were unable to repel these miners.
Following the outbreakincursion of hundreds of illegal miners inside the fenced area of the Ebola virus disease.Obuasi mine site, AngloGold Ashanti was forced to declare force majeure and, in the interests of safety, withdrew all employees performingnon-essential work on the site. However, we continued with provision of critical services, such as water pumping and treatment, medical services and the provision of electricity (including to some local communities).
AngloGold Ashanti has, during this incursion, continued to lobby vigorously at all levels of government for the authorities to bring a peaceful end to the illegal occupation of parts of its concession by these illegal miners, and restore AngloGold Ashanti Ghana’s rights as the lawful and sole permit holder of the concession.
On 8 April 2016, AngloGold Ashanti Ghana filed a Request for Arbitration with the International Centre for Settlement of Investment Disputes (ICSID). The case was registered on Monday, 2 May 2016. ICSID is an international arbitration institution, headquartered in Washington, D.C., which facilitates dispute resolution between international investors and host states. The relevant authorities in Ghana, including the Attorney General, were duly notified of the commencement of proceedings.
83In May 2016, the Ministry of Lands and Natural Resources implemented the voluntary process, which had commenced in November 2013, to surrender some 60 percent of the Obuasi mine concession to the Government of Ghana. This relinquished concession will provide an opportunity for the Government/ Ministry of Lands and Natural Resources to use the land as it sees fit, including to encourage a range of socio-economic development activities in the Obuasi region. The area covers about 273km2and excludes the Obuasi mine, which lies on land retained by AngloGold Ashanti Ghana.
On 18 October 2016, the Security Task Force took the first concerted steps to restore safety and security at the Obuasi concession. At each step along the way, AngloGold Ashanti Ghana petitioned authorities to ensure that the process of clearing illegal mining activity from site was done with deference to the Voluntary Principles on Security and Human Rights.
All areas within our fenced operational area have been cleared of illegal miners, and all identified illegal mining holes within the fence have been closed. Following a review of the safety, surface and underground conditions we have notified the Ghanaian authorities that the circumstances that led to the declaration of force majeure no longer existed and as such lifted the force majeure in February 2017. Work continues to completely remove the illegal mining activities within the Obuasi concession area. Only once that process is complete, and the feasibility study for the redevelopment of the mine has been updated with the relevant information, will the company be in a position to outline its plans for Obuasi. We are currently preparing a new Amendment to Programme of Mining Operations and will review all future options.
AUSTRALASIA
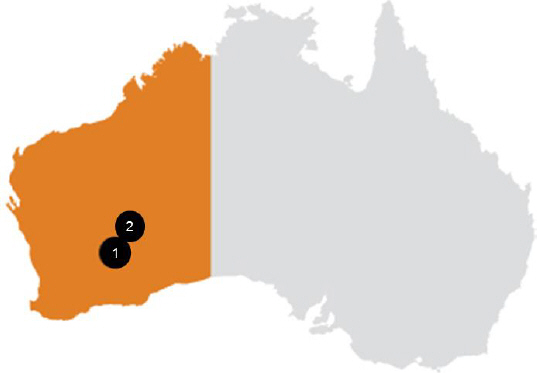
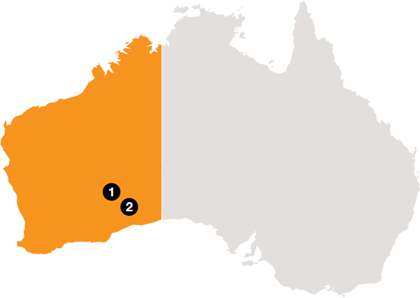
| Attributable gold production (000oz) | Average number of employees | Attributable gold production (000oz) | Average number of employees | |||||||||||||
Operations | ||||||||||||||||
Australia | ||||||||||||||||
1. Sunrise Dam | 262 | 374 | 228 | 422 | ||||||||||||
2. Tropicana 70% | 358 | 458 | 292 | 503 | ||||||||||||
AngloGold Ashanti’s Australasian assets comprise the wholly owned Sunrise Dam and the 70 percent-owned Tropicana Gold mine, Australia’s newest gold mine. Tropicana completed its firstsecond full year of production in 2014.2015.
Australasia - Key Statistics
| Unit | 2014 | 2013 | 2012 | Unit | 2016 | 2015 | 2014 | |||||||||||||||||
Operation | ||||||||||||||||||||||||
Tonnes treated/milled | Mt | 7.8 | 4.3 | 3.4 | Mt | 8.9 | 8.2 | 7.8 | ||||||||||||||||
Pay limit | oz/t | 0.07 | 0.09 | 0.08 | oz/t | 0.06 | 0.06 | 0.07 | ||||||||||||||||
| g/t | 2.29 | 2.82 | 2.42 | g/t | 1.86 | 1.85 | 2.29 | |||||||||||||||||
Recovered grade | oz/t | 0.072 | 0.072 | 0.070 | oz/t | 0.058 | 0.068 | 0.078 | ||||||||||||||||
| g/t | 2.45 | 2.45 | 2.39 | g/t | 1.82 | 2.12 | 2.43 | |||||||||||||||||
Gold production (attributable) | 000oz | 620 | 342 | 258 | 000oz | 519 | 560 | 620 | ||||||||||||||||
Cost of sales | $m | 540 | 525 | 660 | ||||||||||||||||||||
Total cash costs(1) | $/oz | 804 | 1,047 | 1,211 | $/oz | 793 | 702 | 804 | ||||||||||||||||
Total production costs(1) | $/oz | 1,070 | 1,333 | 1,358 | ||||||||||||||||||||
All-in sustaining costs(1)(2) | $/oz | 986 | 1,376 | 1,680 | $/oz | 1,067 | 875 | 986 | ||||||||||||||||
Capital expenditure | $m | 91 | 285 | 369 | $m | 109 | 78 | 91 | ||||||||||||||||
Safety | ||||||||||||||||||||||||
Number of fatalities | 0 | 0 | 0 | 0 | 0 | 0 | ||||||||||||||||||
AIFR | Per million hours worked | 10.73 | 7.91 | 6.33 | Per million hours worked | 9.49 | 8.56 | 10.73 | ||||||||||||||||
People | ||||||||||||||||||||||||
Average no of employees: Total | 832 | 925 | 494 | 925 | 836 | 832 | ||||||||||||||||||
Permanent employees | 194 | 281 | 110 | 211 | 195 | 194 | ||||||||||||||||||
Contractors | 638 | 644 | 384 | 714 | 641 | 638 | ||||||||||||||||||
| (1) | Total cash costs |
| (2) | Excludes stockpile impairments. |
84
Production and costs
With the ramp upA planned decrease in productionhead grades at Tropicana duringimpacted the course of 2014, the mine’s first full year of operation, and increased levels of output at Sunrise Dam,region’s total production for the Australasia region was 81% higheryear, which although within guidance, ended lower than the previous year. Sunrise Dam however delivered a 5 percent improvement in 2013.outputyear-on-year, largely due to increased mill throughput and improved head grades.
At Sunrise Dam, while underground mining has been providing supplementarytransitioned from the GQ ore since 2004,body into the underground mine transitioned to becomeVogue ore body during the year, with the Dolly and Cosmo ore bodies also contributing significant mill feed. Underground ore was the primary source of mill feed and underground ore mined of 2.8Mt was higher in 2014, delivering 2.43Mt of2016 than in 2015. Underground ore to the mill for the year. Stockpiledis blended with intermediate grade of 1.45g/t stockpiled ore (average 1.45g/t) was blended with the underground ore(accumulated during open pit mining) to meet the processing plant capacity, which saw throughput reach 3.8Mtreached 4Mt in 2014,2016.
Underground ore production continued to improve, achieving a 10%record annualised rate of 3.3Mtpa in the fourth quarter of 2016 as the 800,000t Dolly stope was brought into full production. This continues the improvement on 2013, despite the higher proportion of harder underground ore treated. Plant performance improved due to the focus on engineering reliability which reduced plant down time.
A two-year project on planning systems and operational efficiencies resulted in productivity improvements in the underground mine culminatingwith the shift to bulk mining methods.
Tropicana again achieved the annual guidance given at the start of the mine for 2016, producing a total of 417,000oz, 292,000oz of which is attributable to AngloGold Ashanti. Gold production was 15 percent lower in 675,503t2016 than in 2015 due to the planned decrease in the average head grade for the year from 2.48g/t to 2.10g/t. This is consistent with the grade streaming strategy that involved preferential treatment of undergroundhigher grades in the first years of the mine’s production, gradually declining to thelife-of-mine head grade of approximately 2.0 g/t. During 2016 low and medium grade ore beingwas stockpiled.
The lower grades mined in 2016 were partially offset by an increase, to 6.9Mt (2015: 6.2Mt) of throughput in the Decemberprocessing plant as the plant optimisation project was completed towards year end. This project, which was introduced as a strategy to address the planned decline in production following the end of grade streaming, has successfully lifted design throughput capacity of the processing plant to 7.5Mtpa. Metallurgical recoveries remained steady at approximately 89 percent, andmine-to-mill reconciliation, for both tonnes and grades, continued to align well. Mining was carried out in the Tropicana, Havana and Boston Shaker pits during 2016.
Cost of sales, total cash costs andall-in sustaining costs for the region increased due to a stronger Australian dollar against the US dollar, planned lower production at Tropicana and increased mining spend at Sunrise Dam, where a third jumbo was added to the fleet to set up new mining areas and carry out decline development, as well as contributing to the additional ore tonnes mined. ‘Operational excellence’ initiatives resulted in significant productivity improvements and a reduction in mining unit costs. This work will continue in 2017. Additionally, in the last quarter – equivalentof 2016, a Caterpillar 6060,600-tonne class shovel was introduced to the open pit mining fleet at Tropicana to increase mining rates to an annualised rate of 2.7Mt. This mining rate is expected80Mtpa and to be maintained in 2015. The multi-pronged productivity improvement strategy included an innovative approach to grade control based on reverse circulation (RC) drilling that emulatedbetter match the successful grade control process in the open pit. The change to RC drilling combined with productivity improvements gained in the underground mine drove mining costs down by more than 50% over the two-year period.
Tropicana completed its first full yearhigher throughput requirements of operation. In total, the mine produced 511,000oz of which AngloGold Ashanti’s share was 358,000oz. Open pit mining focused on the Havana and Tropicana pits in 2014. During the year additional mining fleet was brought to the site to counteract a decrease in mining rates caused by structural failure that caused part of a tank wall to buckle, remediation of a wall slippage, poor equipment availability and lower-than-planned productivity. Mining productivity improved in the fourth quarter and it is anticipated that productivity rates will be back on target in early 2015. Despite these challenges, feed to the processing plant was on budget, enabling treatment of 5.7Mt for the year at a head grade of 3.06g/t and metallurgical recovery of 90%. Reconciliation of mine to mill, in terms of both tonnes and grade, aligned well.
Production decreased at Sunrise Dam, as lower grades were mined in line with the mine plan.
Total cash costs for the region declined by 23% and all-in sustaining costs by 28%. Costs for the Australasian region were positively affected by the ramp-up to full production at Tropicana, and productivity improvements at Sunrise Dam. However, at Tropicana, these were impacted by higher mining costs resulting from fleet productivity issues and increased plant maintenance costs. These cost increases however were offset by the savings in other areas resulting in the operation delivering on the cost performance anticipated in the feasibility study.plant.
Capital expenditure
CapitalOverall, capital expenditure for Australasia reduced significantlyin the region increased, primarily due to $91mincreased waste stripping in 2014 (2013: $285 million)the Tropicana 2 cutback. Also at Tropicana the processing plant optimisation project was successfully completed during the year.
At Sunrise Dam capitalised mining spend increased in 2016 with the completionaddition of much ofan extra jumbo, which commenced on site in June, increasing the development at Tropicana, as well as completion of the transitionmining fleet from two to three jumbos. The jumbo will open up new mining areas and is focussed initially on capitalised decline development.
Stay-in-business capital spend at Sunrise Dam from openpitis expected to underground mining. Capital expenditure at Tropicana fellrise in 2017 with the construction of the flotation and ultra-fine grind circuit to $59m from $241m in 2013 while at Sunrise Dam expenditure was $31m against $39m in the previous year.improve gold recovery.
Safety
SafetyThe region’s safety performance continued to be an area of focus withremains strong. Again there were no fatalities reported. Theduring the year, while the AIFR for the region was 10.739.24 per million hours worked (2013: 7.91).
People
A totalworked. The severity rate, a measure of 832 people were employed on average bytime lost due to injury, is low at both operations indicating the Australia region – 194 full time employees and 638 contractors. Productivity inminor nature of the Australia region was 62.00oz/TEC in 2014 (2013: 49.64oz/TEC), the highest in the group.injuries.
Ore Reserve
At the end of 2014,2016, the total attributable Ore Reserve for the Australasia Region was 3.534.0 million ounces (2013: 3.81(2015: 3.1 million ounces). This makes up around 6eight percent of the group’s Ore Reserve.
Growth and improvement
At Tropicana, additional maintenance and engineering work wasThroughout 2016 a study has been carried out on a recovery enhancement project at Sunrise Dam. The presence of moderate levels of refractory sulphide ores has led to recoveries averaging around 85 percent over the mine’s19-year life. To date, the study work indicates that a significant improvement in recovery can be achieved through the processing plant during the year to close out construction work following commissioning and to optimise sectionsaddition of the plant with a view to lifting throughput beyond nameplate capacityflotation/ultra-fine grind circuit. The study is scheduled for completion in 2015. At year-end regulatory approvals were received to complete an expansion of the process water supply borefield that provides water to the operation. By the end of the first quarter of 2015, an additional 27 bores2017 after which approval for the project will have been installedbe sought.
Work is also continuing on a materials handling system to underpin the long-term viability of the underground mine. This project involves underground crushing and commissioned to take the numberconveyor haulage of bores servicing the plant to 51 and capacity from approximately 750t of water per hour (tph) to more than 1,000 tph.
85
Analysis of data from a 3D seismic survey which was conducted across the Tropicana ore bodies is expected to be completed in the first half of 2015. This analysis is expected to enable more accurate and more cost effective targeting of deep drill holes to test for extensions of mineralisation beneath the current open pit. This drilling data will augment work already carried out in the Havana Deeps study to determine if the down plunge extensions to the surfacerun-of-mine pad. Should it prove viable, it will reduce material rehandling and truck haulage costs, enabling the Company to mine the ore bodies continue tobody by loweringcut-off grades and maximising production rates.
At Tropicana the north below Tropicanahigher mining and Boston Shaker. Ultimately, this informationthroughput rates introduced in late 2016 will determine whether these ore bodies could be mined via a large open pit or by underground methods.
In July 2014, AngloGold Ashanti signed agreements with a natural gas infrastructure companyenable the resumption of grade streaming frommid-2017 for the transportation of natural gas to Sunrise Dam and Tropicana. It is expected that this will provide continuity of fuel supply, reduce exposure to diesel price volatility and significantly reduce the number of trucks on the site access roads.at least two years. This is expected to yield important safety benefitsincrease production to the annual guidance of between450,000-490,000oz (at 100 percent) from the second half of 2017.
Work is continuing on the Long Island study, which is investigating large cutbacks to the pits utilisinglow-cost mining options. These include strip mining the depth extensions to the Tropicana mineralised system and will help in reducing road maintenance costs. Construction is scheduled to start in February 2015 with first gas expected to be available atusing the mines in January 2016. The power stations at both mines are expected to be modified socompleted Tropicana pit as to run on 100% natural gas. Backup diesel capabilitya void into which waste will be retained for emergencies. Gas power generationbackfilled. The proposed backfilling of the Tropicana pit, in conjunction with strip mining, is expected to reduce cash operating costs.the cost of mining waste significantly by introducing short horizontal hauls instead of requiring the long uphill hauls out of the pit to surface waste dumps that would be required by conventional mining.
It is anticipated that the study will be completed inmid-2017. If the proposed mining method is implemented, the initial Long Island cutback would begin in 2019 when the Tropicana pit has been mined to its full depth. An extensive 161,000m programme of reverse circulation and diamond drilling carried out in 2015 and 2016 resulted in a 45 percent increase in the mine’s Ore Reserve and a 27 percent, or 1.73Moz, increase in the Mineral Resource, as at 31 December 2016. The increase in the Mineral Resource was achieved largely through significant additions in the Havana South and Boston Shaker zones following application of the Long Island mining methods and costs, and through an increase to the underground Mineral Resource along the entire strike length of the Tropicana mineralised system. Further increases are anticipated in 2017, depending on the outcome of the Long Island study.
Towards the end of 2016, AngloGold Ashanti entered into afarm-in agreement with Saracen Mineral Holdings Ltd to earn up to 70 percent in Saracen’s Carosue Dam North tenements. The joint venture encompasses two tenement packages, Butcher Well and Lake Carey, covering 339.56km2, approximately 120km to the north of Saracen’s Carosue Dam project. Field work, including the first phase of drilling at Butcher Well, will begin in the first quarter of 2017.
86
THE AMERICAS
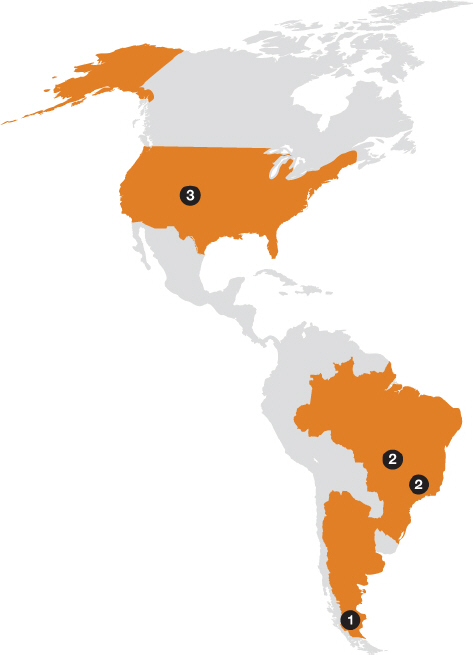
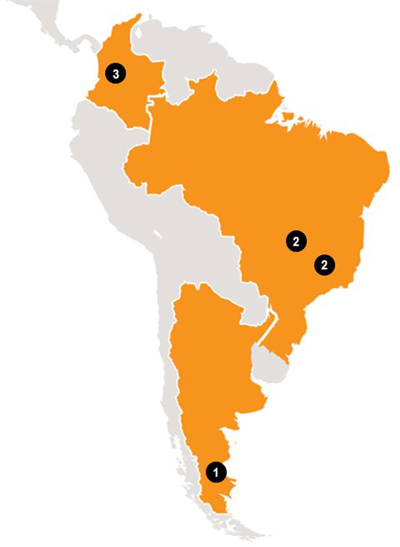
AngloGold Ashanti has fourthree mining operations – both open pit and deep level mining – in the Americas region. In addition, there is an active greenfields exploration programme underway in Colombia.
|
|
| ||||||||||||||
Attributable gold production | Average number of employees | Attributable gold production (000oz) | Average number of employees | |||||||||||||
|
|
| ||||||||||||||
Operations | ||||||||||||||||
1. Argentina | ||||||||||||||||
Cerro Vanguardia 92.5% | 246 | 1,640 | 281 | 1,877 | ||||||||||||
|
|
| ||||||||||||||
2. Brazil | ||||||||||||||||
AGA Mineração | 403 | 4,398 | 407 | 4,662 | ||||||||||||
Serra Grande | 136 | 1,403 | 131 | 1,587 | ||||||||||||
|
|
| ||||||||||||||
3. United States | ||||||||||||||||
Cripple Creek & Victor | 211 | 1,147 | ||||||||||||||
3. Colombia – exploration programme | ||||||||||||||||
|
|
| ||||||||||||||
87
Americas - Key Statistics (1)
| Unit | 2014 | 2013 | 2012 | Unit | 2016 | 2015 | 2014 | |||||||||||||||||||||||||||||||||||||||||||
Operation | ||||||||||||||||||||||||||||||||||||||||||||||||||
Tonnes treated/milled | Mt | 26.1 | 26.7 | 25.7 | Mt | 7 | 7 | 6.8 | ||||||||||||||||||||||||||||||||||||||||||
Pay limit | oz/t | 0.034 | 0.026 | 0.024 | oz/t | 0.100 | 0.098 | 0.092 | ||||||||||||||||||||||||||||||||||||||||||
| g/t | 1.156 | 0.897 | 0.822 | g/t | 3.421 | 3.351 | 3.152 | |||||||||||||||||||||||||||||||||||||||||||
Recovered grade | oz/t | 0.035 | 0.036 | 0.034 | oz/t | 0.106 | 0.108 | 0.104 | ||||||||||||||||||||||||||||||||||||||||||
| g/t | 1.13 | 1.20 | 1.16 | g/t | 3.64 | 3.71 | 3.58 | |||||||||||||||||||||||||||||||||||||||||||
Gold production (Attributable) | 000oz | 996 | 1,001 | 953 | 000oz | 820 | 831 | 785 | ||||||||||||||||||||||||||||||||||||||||||
Total cash costs(1) | $/oz | 709 | 671 | 669 | ||||||||||||||||||||||||||||||||||||||||||||||
Total production costs(1) | $/oz | 942 | 886 | 907 | ||||||||||||||||||||||||||||||||||||||||||||||
All-in sustaining costs(1)(2) | $/oz | 1,010 | 970 | 1,006 | ||||||||||||||||||||||||||||||||||||||||||||||
Capital expenditure(3) | $m | 388 | 391 | 387 | ||||||||||||||||||||||||||||||||||||||||||||||
Silver (attributable) | Moz | 4.9 | 4.4 | 3.1 | ||||||||||||||||||||||||||||||||||||||||||||||
Cost of sales | $m | 752 | 719 | 745 | ||||||||||||||||||||||||||||||||||||||||||||||
Total cash costs (2) | $/oz | 578 | 576 | 676 | ||||||||||||||||||||||||||||||||||||||||||||||
All-in sustaining costs (2)(3) | $/oz | 875 | 792 | 974 | ||||||||||||||||||||||||||||||||||||||||||||||
Capital expenditure (4) | $m | 225 | 196 | 225 | ||||||||||||||||||||||||||||||||||||||||||||||
Safety | ||||||||||||||||||||||||||||||||||||||||||||||||||
Number of fatalities | 2 | 0 | 1 | 1 | 1 | 2 | ||||||||||||||||||||||||||||||||||||||||||||
AIFR | Per million hours worked | 3.81 | 4.74 | 5.20 | Per million hours worked | 3.96 | 5.61 | 3.81 | ||||||||||||||||||||||||||||||||||||||||||
|
| |||||||||||||||||||||||||||||||||||||||||||||||||
People | ||||||||||||||||||||||||||||||||||||||||||||||||||
Average no of employees: Total | 8,588 | 8,374 | 7,896 | 8,126 | 7,679 | 8,588 | ||||||||||||||||||||||||||||||||||||||||||||
Permanent employees | 5,944 | 5,979 | 5,509 | 5,653 | 5,492 | 5,944 | ||||||||||||||||||||||||||||||||||||||||||||
Contractors | 2,644 | 2,395 | 2,387 | 2,473 | 2,187 | 2,644 | ||||||||||||||||||||||||||||||||||||||||||||
|
| |||||||||||||||||||||||||||||||||||||||||||||||||
Key statistics are for the continuing operations in the region and exclude CC&V which was sold effective 3 August 2015. |
Total cash costs |
Excludes stockpile impairments. |
|
Production and costs
The year was a challenging one overall forProduction from the Americas operations and overall productionregion declined in 2016, due to lower output from the region declined marginally. Increased production atBrazilian operations. AGA Mineração was negatively affected by delayed access to certain high-grade stopes early in the year, a deficit in secondary development, ongoing geotechnical and at Cerro Vanguardia failedsupport challenges, licensing delays and geological modelling issues. Production was also negatively impacted by a fatal accident in late September.
The mine plan has been amended and is expected to help the operations deliver improved performance going forward. The revised mine plan comprises the treatment of additional ore from lower-grade zones, with higher tonnages helping to offset declines at CC&V and Serra Grande. Production was dampened by low grades for some mines as well as negative stockpile movements. Cerro Vanguardia’s production for 2014 was the highest in 11 years, due mainly to improved heap-leach production.lower grades.
AGA Mineração continued to deliver a strong performance with increased tonnage and feed grades at both the Cuiabá andAt Córrego do Sítio, complexes despite operationala 2 percent increase in tonnages treated from both the oxide and sulphide operations, overall production was impacted by reduced grades from the main underground ore body, a deficit in secondary development and a longer-than-planned stoping cycle.
At Serra Grande, delays in high grade areas, changes in mining plan at Cuiabá Complex, andthe award of permits required for the Corpo Sul open pit, along with geotechnical challenges affecting the ramp to access high-grade areas at underground Mina Nova in the Pequizão ore body, had a negative impact on operations.
Cerro Vanguardia delivered an increase in production, achieving the highest level in 17 years, due to an increase in tonnes treated at the new oxide pit. Development here exceeded expectationsplant together with operational and metallurgical improvements. This positive performance was partially offset by lower grades mined, owing to variability in the mining model.
As the region continued to focus on cost management and production beganimprovements resulting from the new ore body at Córrego do Sítio (Sulphide II)Project 500 efficiency programme, costs remained virtually unchanged. This was achieved despite lower production and full production ratessignificant inflationary pressures, including annual salary increases. In Brazil, costs were achieved at the underground Mine I.
At CC&V, production was negativelymainly affected by several factors including increased amountshigher capital expenditure.
In Argentina, costs were favourably impacted by the reimbursement by the government of clay in the ore that resulted in reduced volumes and lower grade ore being suppliedArgentina relating to the crusher. Certification delays for an exposed liner necessitated modifications to the heap-leach stacking plan leading to deferred production in the early part of 2014.
The Americas region’s contribution to group attributable production declined to 22%. In addition, the region produced 3.1Moz (attributable) of silver as a by-product.
Despite the focus on limiting cost increases over the past year, regional cash costs increased by around 5%, due largely to inflationary pressures in the South American countries. The higher levels of production at AGA Mineração and Cerro Vanguardia failed to offset increased costs at Serra Grande and CC&V. Although overall costs increasedexports through Patagonian ports. Cost management initiatives at Cerro Vanguardia due to deferred stripping adjustments, the negative impact of stockpile movement and inflationary pressures and wage increases, these were partially offset by the increased production and weaker exchange rates. The depreciation of both the Brazilian real and Argentinean peso helped to limit cost increases in those countries, as did various cost management initiatives implemented. Operating challenges at CC&V also affected negatively the cost performance of the region. Taxation and royalty payments were lower at all operations, in line with subdued gold and silver prices.
In line with the group cost optimisation drive, the focus of savings initiatives in the Americas region was on labour, contractors, energy, consumables and working and stay-in-business capital. The regional all-in sustaining costs increased by 4% year on year.
88
These cost and cash management programmes involved productivity improvements, process optimisation, and reductions in power costs, materials pricing and in administrative expenses.
At CVSA various initiatives aimed at efficiency and production improvements (underground mine design optimisation, the prolonging of the extension operational life tyres, and the optimisation and stabilisation of CIL and regeneration circuits), continued.
Cost savings initiatives at CC&V focused on improving efficiencies derived from consumables and tyres, and better fleet time management. This enhanced crusher throughput and resulted in savings derived from higher mill throughput and silver recovery; reduced use of $4m.consumables; negotiated price reductions for key inputs such as ammonium nitrate, grinding media; gold refining services; cost reductions in open pit mining; backfilling of depleted pits and improved maintenance of heavy mining equipment.
In Brazil, potential savings identified in 2013 were addressed by initiatives implemented in 2014.
Capital expenditure
In line withCapital expenditure for the continuing group-wide costregion increased by 15 percent over 2015 levels, and strategic review,was mostly spent in Brazil to increase ore reserve development in order to improve mine flexibility at all operations, raise tailings dam at Cerro Vanguardia and Mineração, and convert the metallurgical leaching process at Serra Grande.
At Cerro Vanguardia, capital expenditure was lower compared to 2015 mainly due to lower deferred stripping and the underground expansion project executed in 2015 and not repeated in 2016, which was partially offset by higher capitalised ore reserve development related to higher underground production. The depreciation of $388mthe Argentinean peso against the US dollar also aided the reduction in the Americas region for 2014 was approximately 1% less than the previous year. Much of this wasdollar-denominated expenditure.
The region’s capital expenditure is expected to increase in 2017 as Cerro Vanguardia focuses on site exploration to extend the mine life expansion project at CC&V ($145m) and Ore Reserve Development at AGAlife; Mineração of $53m. Additional expenditure was underground expansionaccelerates ore reserve development at CVSAthe Cuiabá complex and evaluatesore-sorting prototypes at the CdS complex; and Serra Grande develops the high-grade Palmeiras and Inga ore developmentbodies, to increase production and general stay-in-business activities at all operations.extend mine life.
Safety
Two fatalities were reportedAt the Cuiabá complex, there was a fatal accident in September when one of our contractors’ employees was fatally injured in a heavy mobile equipment accident. In order to reinforce contractor safety behaviour, the Americas region (2013: 0). Two contractor employees lost their lives in an incident at AGA Mineração’s Cuiabá mine duringwill standardise the renovation of the ventilation shaft when the braking mechanismsafety practices for a rope holding a suspended platform in place failed. The AIFR for the region was 3.81 per million hours worked in 2014 (2013: 4.74– restated).
People
A total of 8,588 people were employed on average by the Americas region in 2014 – 5,944 full-time employeesall contractors to be aligned with AngloGold Ashanti’s policies and 2,644 contractors. Productivity for the region was 16.35oz/TEC as compared to 16.63oz/TEC in 2013.practices.
Ore Reserve
At the end of 2014,2016, the total attributable Ore Reserve for the Americas Region, was 7.563.1 million ounces (2013: 8.82(2015: 3.2 million ounces). This makes up around 13six percent of the group’s Ore Reserve.
Growth and improvement
Various growth programmes areAt Mineração, additional development work is underway at all operations in the region, the most significantto improve mining flexibility; implementation of whichore sorting prototypes is CC&V’s expansion project. The first part of the two-phase mine life expansion (MLE) project began production in 2011planned; and is expected to continue until 2016. MLE2 will expand the operation to include a second valley heap-leach facility (VLF), a CIP mill to process sulphide material and an associated gold recovery plant. The mill began commissioningnew pushback at the end of 2014 and production is scheduled to begin in the first half of 2015. The second VLF is expected to start production in the second half of 2016.
At Cerro Vanguardia, an underground mining expansion project is being undertaken to improve efficiencies and productivity through underground mine design optimisation and optimisation and stabilisation of the carbon-in-pulp and regeneration circuits.
At the Brazilian operations, the focus was principally on optimisation initiatives to improve operational efficiencies. At AGA Mineração’s Córrego do Sítio complex, full production rates were improved at both the sulphide and oxide mines. The brownfields drilling programmeopen pit at Córrego do Sítiotío is being studied.
Work began at Cuiabá on the ventilation and transportation systems, for operating at depths between 1,500 to 2,500 metres from 2020 while doing the necessary work to ensure stable production levels in the interim. The drilling campaign at Córrego do Sítío aims to confirm the ore sources that will help improve production in the medium term and extend the life of mine from a new open pit (CdS III) and new underground mines at the Mina II and São Bento Deep ore bodies.
At Serra Grande, exploration work is delivering positive results for future production improvements while negotiations continue with owners of Palmeiras Sul ahead of accelerating exploration to confirm the area’s potential. Diamond directional drilling underground proved the continuity of current structures with the new Inga ore body to begin production in 2017. A new open pit pipeline is in place while drilling campaigns are underway at the Pequizão orebody. Exploration at current structures is delivering positive results and new positive drill holes are delineating a new orebody (Mangaba) at structure IV.
At Cerro Vanguardia, the underground expansion continues according to schedule, following the initiative launched in 2015 to accelerate open pit and underground operations for optimisation oflife-of-mine economic performance and increase production over the coming five years.
In Colombia,pre-feasibility evaluation work continued throughout 2016 with the Gramalote and identified satellite ore bodies closeLa Colosa projects and these studies are expected to existing infrastructure.
Colombia remains a key areabe completed by the end of focus for the exploration programme2017 and continues to yield promising results. A particular success was the release of the maiden Inferred Mineral Resource estimate formid-2018 respectively. The Nuevo Chaquiro which is part ofproject successfully completed a conceptual study and the Quebradona greenfieldsapproval to advance topre-feasibility phase will be sought during 2017. Greenfields exploration programme. Studies and engagement withactivities were slowed down in 2016 although field activity continued all year at the local communities continue.Guintar prospect.
89
EXPLORATION REVIEW
Our exploration programme covers – greenfieldsis focused on creating value by providing long-term optionality and brownfields projects.improving the portfolio quality. The first stepsobjectives are to identify prospective gold deposit targets, which, once identified as being worthwhile, merit intensive further evaluation.met by:
Greenfields exploration, which aims to discover large, high-value gold depositsMineral Resources that can provide a pipeline of furtherhigh-quality and rigorously prioritised exploration projects, which in turnwill eventually lead to the development of new gold mines. Our greenfields exploration team was recognised by a leading industry research group, in 2015 as the industry’s most successful in Mineral Resource discovery. The team has a proven track record that includes the discovery of world-class ore bodies at La Colosa, Gramalote, Tropicana and Nuevo Chaquiro. These discoveries are attributed to our committed and professional team of geoscientists working on a portfolio of highly prospective and rigorously prioritised greenfields ground holdings.
Brownfields exploration, which focuses on delivering value through incremental additions to reservesour Ore Reserve in existing mines as well as new discoveries in defined areas around existing operations. Brownfields exploration actively drives the creation of value by growing our major asset, our Mineral Resource and Ore Reserve. TheReserve, our major assets. Our brownfields exploration programme is based on innovation ininnovative geological modelling and mine planning and continual optimisation of our asset portfolio.
Greenfields exploration
AngloGold Ashanti’s greenfields exploration team has a proven track record that includes the world-class discoveries of La Colosa, Gramalote, Tropicana, and Nuevo Chaquiro. These discoveries are attributed to our team of geologists working on a portfolio of prospective and strategic ground holdings.
In 2014, the greenfields exploration business unit delivered exploration successes while, simultaneously, reducing costs aggressively. It has been successful in delivering new quality gold ounces and, now, copper tonnes into our resource inventory. The copper-gold maiden resource for Nuevo Chaquiro in Colombia exemplifies the unit’s success. This is a significant copper-gold porphyry-style mineralised system, one of five known porphyry centres on the property.
During the year, greenfields activities became more focused, helped by rationalising tenures in Colombia and Australia. In 2014, realised expenditure was $41m. AngloGold Ashanti remains committed to its core greenfields projects andGreenfields has over 13,000km29,000km2 of highly-prospective ground in three countries; Australia, Colombia and Guinea along withBrazil, and also has small ground positions in ArgentinaTanzania, the USA and Brazil. Advanced greenfields explorationArgentina. Greenfields also initiated focused generative activities were conducted in four countries with the completion of over 100,000m of diamond, reverse circulation and aircore drilling. Drilling programmes aimed to test new high-priority targets in Australia and further delineate existing discoveries in Colombia, Guinea and Brazil.operational synergies.
InColombiaAustralia: Exploration success continued at the Nuevo Chaquiro project, in joint venture with B2Gold (AngloGold Ashanti 89.75%). In November, AngloGold Ashanti announced a maiden Inferred Mineral Resource estimate for Nuevo Chaquiro. It represents a realistic inventory of mineralisation within a conceptual underground mine design, based on two lifts using a combination of block caving and panel caving. Results from the latest Mineral Resource drilling in December 2014 continue to return multiple consistently mineralised intersections, in the high-grade (>0.6% Cu) intrusive phase within the declared Mineral Resource. Drilling is now aimed at better defining and extending the high-grade (>0.6% Cu) zone and bringing this to indicated status.
Brazil: Exploration progressed on the Graben project, in joint venture with Graben Mineração (AngloGold Ashanti 51%). Following the completion of high-resolution ground magnetics surveying and 3D inversion modelling, approximately 1,100m of diamond drilling were completed in December on priority targets within the highly prospective Juruena Belt. These holes targeted de-magnetised intrusive rocks associated with alteration and possible sulphide mineralisation. The holes successfully intersected altered and mineralised rocks.
Guinea: Exploration work continued in Siguiri Blocks 2, 3 and 4 (AngloGold Ashanti 85%) until 20 July, after which work was suspended due to the outbreak of the Ebola virus in the immediate region. On the Kounkoun trend located within 50km of the Siguiri mine, in Block 3, 7,259m of reverse circulationLaverton district, aircore (AC) drilling was completed to testover numerous AngloGold Ashanti-held targets with 617 holes drilled for a total of 40,719m. Drilling encountered strong carbonate-sericite ± silica alteration with minor pyrite or arsenopyrite in several holes with brecciated quartz veins also observed. Several encouraging results from both Ahab and Pioneer were received. The positive AC samples from Pioneer werefollowed-up by six reverse circulation (RC) holes with three diamond drilling (DD) tails (702m/471m) and results of this drilling will be available in early in 2017.
In the continuationfourth quarter of mineralisation2016 the Butcher Well and Lake Careyfarm-in agreement was signed between KK1AngloGold Ashanti and KK2. This mineralisation model was confirmedSaracen Mineral Holdings Limited. AngloGold Ashanti has acquiredearn-in rights for 340 km2 of tenements on and passed toalong the BFX evaluations department for Mineral Resource calculations. IP and drill testingwestern margin of other targetsLake Carey in the region delivered negative results. In December, the greenfields exploration unit withdrew from Guinea and transferred responsibility for Siguiri Blocks 2-4 to the Siguiri brownfields unit.
Australia: InLaverton district of Western Australia, exploration activities onincluding those hosting the Tropicana project, in joint venture with Independence Group NLhistorically-mined Butcher Well gold deposits. AngloGold Ashanti (70%), progressed solidly through the year with more than 60,000m of aircore, 1,800m of reverse circulation and 500m of diamond drilling being completed. Encouraging results were returned from Madras prospect approximately 25km southcan earn up to 70 percent of the Tropicana Gold Mine.JV by spending A$15 million within 48 months from commencement date to earn 51 percent and a further A$10 million within 24 months thereafter to earn 70 percent. The conditions precedent for the agreement were met on 22 December 2016, and the first phase of drilling at Butcher Well is expected to commence in the first quarter of 2017.
At the Strawbridge Project (AngloGold Ashanti 100%) in Western Australia, the planned AC drilling programme was addedcompleted with 257 AC holes drilled for a total of 12,770m. Results at Strawbridge from the AC drilling and geochemical sampling in 2016 returned no significant results.
InColombia, drilling was completed at the Guintar project (AngloGold Ashanti 100 percent) situated 40km west of Medellin. Three DD holes for 1,219 m were drilled on epithermal targets above a potential buried porphyry.
Several narrow(2-6m) intervals of anomalous gold mineralisation >1g/t were intersected. Are-evaluation of the regional geology at Guintar, identified subtle multi-element epithermal signatures in gravels associated withN-S trending graben structures.Follow-up exploration at this new target, Nuevo Guintar, indicates a potentially preserved epithermal target. Detailed mapping, soil sampling and ground geophysics was completed to the portfolio latedelineate drill targets.
InBrazil, Greenfields signed a newfarm-in and JV agreement with Luna Gold to explore a ~2,000km2 tenement package, located in the year. In New South Wales atMaranhão state of Brazil. Under the Mullion Projectterms of the agreement, AngloGold Ashanti (100%)can spend $14m over four years to earn a 70 percent interest in the tenements, which includes a minimum commitment of $2m. The JV officially initiated in August and regional mapping and soil sampling programmes were completed.11 200km of a high resolution aeromagnetic and radiometric survey were flown. In parallel, considerable effort has also been placed on obtaining environmental permits for planned drilling expected to start in the first quarter of 2017.
InTanzania,Guinea,Argentina and theUnited States, significant geophysical surveying was completed.early stage grassroots evaluation and reconnaissance programmes progressed.
90
Brownfields exploration
Brownfields exploration was carried out in 11ten countries, in and around ourAngloGold Ashanti operations. A total of 389,900m656,350m of diamondDD and reverse circulationRC drilling was completed during the year.
South Africa: Five surfaceExploration in the South Africa region continued with three holes were drilled during the year – four at the West Wits operationsbeing drilling at Mponeng’s Western Ultra Deep Levels (WUDLs). Surface drill holes UD59, UD60 and one atUD58A all intersected the Vaal River operations – achieving a total length of 6,923m.VCR during the year with only UD58A continuing to drill as it completes its short deflection programme. UD61 and UD63 will start in 2017.
Argentina: At Cerro Vanguardia, drilling programmes for Mineral Resource expansioncreation and explorationdelineation continued at Cerro Vanguardiaduring the year with follow-up drilling forfocus on delineating vein extensions along strike and at depth identifying additional mill ore.in the Cerro Vanguardia tenements. Mapping, trenching and channel sampling work definedcontinued as part of the reconnaissance programme to identify new drilling targets. In 2016, a new exploration targets.earn-in project started in the Claudia concessions located to the south of the mine. Work completed at Claudia included mapping, sampling, geophysics, and initial phase drilling RC and DD drilling.
Brazil: In the Iron Quadrangle, the underground drilling programmes for depth extension related Mineral Resource development drillingconversion continued at both the Cuiabá and Lamego mines to support long-term planning and Mineral Resource definition ahead of mining. Surfacemines. At Cuiabá, additional drilling was directed toward satellite mineralisation bodies that may be accessible from existing infrastructure. The surface drilling programmes at the Córrego do Sítiotío mine continued to infill and expand the oxide Mineral Resource. Regional exploration tested near-mine satellite projects. Resource while the underground programme added extensions to several orebodies.
At Serra Grande, exploration drilling continued to delineate the Inga mineralised structure. A new mineralised structure called Mangaba was discovered during the year through underground drilling and will be followed up. Geophysical surveys and soil sampling campaigns were completedcontinued as part of the target generation programmes inprogram for the district.
Colombia: Exploration in the Gramalote area focused on infill drilling to support the updated Mineral Resource estimate forcontinued with programmes in and around the Gramalote Central deposit. Drilling wasdeposit to complete infill drilling on the saprolite horizon. Limited drilling programmes were also directed at expandingconducted within the nearby Monjas West target. joint venture area.
At La Colosa, Mineral Resource developmentthe emphasis on other project related drilling continued at a slower pace comparedwith support to previous years with other drilling expanded to support geotechnical, hydrological and site infrastructure studies.
The geological model was updated with expansion of the deposit to the northwest and at depth.
USA: Mineral Resource development drilling continued at Cripple Creek and Victor andQuebradona project work was directed toward identifying expansion opportunities formetallurgical and infrastructure drilling studies during the current open pit operations through high wall laybacks. Selective drilling also tested deeper targets below or adjacent to planned open pit designs.year.
Tanzania: Focus has largely been onDrilling activities included infill drilling within Geita’s current open pits (Geita Hill,at Nyankanga andBlock 5 UG (Cut 9), Nyankanga Cut 7/8, Star & Comet)Comet Cut 3, Geita Hill East Cut 2, and their extensions. Limited pre-resourceMineral Resource delineation drilling programmes were undertaken to test the underground potential at Star & Comet Deeps.UG (Cut 2 and 3) and Geita Hill East UG. A total of 111 holes (20,220m)28,574m exploration drilling was completed.completed, comprising 10,783m DD from surface, 10,407m underground DD, and 7,383m RC drilling.
Routine geological pit mapping continued at Nyankanga Cut 7 and 8, Geita Hill East and West as well as Star & Comet Underground. In addition, a review of the preliminary geological interpretations of Kukuluma and Matandani was conducted. Detailed mapping was also conducted at Selous, ahead of planned drill-testing of this target.
The 3D Seismic Survey data acquisition within the central Geita area was successfully and an interpretation session of the initial processed data was conducted during December. A final interpretation and targeting session on site is planned for the first quarter of 2017.
Guinea: At Siguiri, 17,823mExploration drilling focused on infill and reconnaissance drilling at Seguelen, Bidini, Tubani, Kami, Silakoro, Soloni, Kalamagna PB2, Boukaria West and Balato NE. A total of reverse circulation56,975m was drilled during the year, comprising 3,336m DD, 7,894m RCDD, 43,714m RC, and diamond drilling were done across six projects in Block 1. These3,030m AC drilling. Other exploration activities included reconnaissance, Mineral Resource delineation, and infill projects for oxide and fresh rock mineralisation. The Ebola epidemic in West Africa led to significant disruptions, particularly with field mapping and geophysicsgeochemical soil sampling, geometallurgical investigations, and the work programme was suspended in the second halfcompletion of the year.LIDAR and airborne geophysical surveys.
Ghana: UndergroundNo exploration was conducted at ObuasiObuasi. Exploration at Iduapriem focused on a portion of the Red Zone 6 (Block 9) area above 50 level with the aim of upgrading the block’s Inferred Mineral Resource. At Iduapriem, the main focus in early-2014 was the logging, sampling and analysis of core from 2013’sinfill drilling at Block 7&8, infill drilling. Several new targetsMineral Resource delineation drilling at Block 4S and reconnaissance drilling at the Bankyem (Block 1 East), Block 1 West, Mile 5 and Nueng targets. A total of 11,316m was drilled, comprising 8,275m DD and 3,041m RC. Soil geochemical surveys were produced from the existing regional magnetic dataalso completed over the Iduapriem concession. Analysisvarious target areas as part of a distinct magnetic anomaly in an area west of the Teberebie warehouse, which is also being exploited by artisanal and small-scale miners, led to the identification of hydrothermal, vein-hosted, mineralisation. Initial sampling results show some promise and a detailed follow-up is expected to begin in 2015.lease-scale programme.
Democratic Republic of the Congo: Drilling at Kibali totalled 19,018m, with an additional 1,666m drilled28,110m, of which 19,434m was mine based drilling and 8,677m was on regional projects.targets. DD drilling comprised 6,660m with the remaining 21,450m being RC drilling. The aim isexploration aimed to add material tofulfil three main objectives: MineralResource-Ore Reserve replacement, potential oxide displacement ounces, and identify and develop new targets.
Mine based exploration took place at the Ore Reserve at above run-of-mine grade, to find gap fillers where required, or to add sufficient new material (3-5Moz) to justify a step change toRhino-Agbarabo-Kombokolo area, Pakaka, Pamao, Tete Bakangwe, Kanga Sud, Ndala Village, Aerodrome and Sessenge Southwest, regional exploration was focused on the operation. At Gorumbwa, three phases of infill drilling were completed duringKalimva-Ikamva targets in the year.north, Memekazi Ridge, and the Aindi Watsa-Dilolo-Zambula targets in the south.
Mali: A numbertotal of key oxide targets were identified21,383m of exploration drilling was completed at Sadiola. Research by the CentreSadiola, comprising of 20,671m RC and 712m DD. Reconnaissance drilling for Exploration Targetting continued during the yearoxides concentrated on FNa,FNb-c and a structural framework for mineralisation was defined for Tambali and the FE complex. The most promising target, FE2S, shows potential for low-grade, wide ore zones over a 1.2km strike length. Some results remain outstanding for drillingFN3 along the Sadiola northern extension. Limited fresh rock exploration was conductedNorth East mineralisation trend, FE2S, Voyager East and FE1W. While infill and deeper Mineral Resource delineation drilling targeted primarily SSP North and Tambali in support of the FE3 and FE4 pits with positive results at both. A scoping- study was done for the newly generated Tambali Mineral Resource. Drilling targets were defined for a possible infill programme. Field mapping and sampling continued over the lease area and the geological map has been refined with new information from most target area.Sadiola Sulphide Project (SSP).
91
Australia: A 3D seismic survey to image the mineralised zone down dip of Tropicana was designed and completed duringUnderground Mineral Resource development drilling continued at Sunrise Dam throughout the year. Its dataset is high quality and is being interpreted to create a structural model that is expected to be used to help plan drill holes in 2015. At Sunrise Dam all mine exploration wasExploration DD focused primarily on Mineral Resource definition and extension to support the underground mine. Drilling totalled 53,100m for the year – 67% diamond core and 33% UGRC. Drilling in 2014 targeted the Vogue/Dolly area (42%); Cosmo East (23%); Sunrise Shear (22%) and GQ South (13%). Drilling in Vogue/Dolly defined anincreasing Indicated Mineral Resource above the 1,700mRL,(primarily in line with the plan to start mining stopesVogue South), Reconnaissance drilling in Vogue Deeps and Mineral Resource creation drilling in the upper part of Vogue/Dolly area in 2015. In Cosmo East,Carey Shear. Underground RC drilling continued to focus on converting the mining area has now been upgraded to an Indicated Mineral Resource downinto a minable Grade Control block model for use in stope development designs. Key DD drilling platforms are being developed, which will be used over the life of mine to drill test exploration targets along the strike length of the deposit.
At Tropicana, the Long Island 100m x 100m drilling programme to test the strike extent anddown-dip extensions of the known mineralised system at Tropicana was completed during December, 2016. In the second half of 2016, additional closer spaced drilling was undertaken at Boston Shaker to achieve Indicated Mineral Resource classification, and minor infill drill programmes were completed at Tropicana, Havana and Havana South. A total of 35,618m of RC and 55,516m of DD drilling were completed.
Regional brownfields exploration based out of TGM consisted of AC, RC and DD drilling totalling 50,083m. In detail, this consisted of 29,927m of AC, 9,971m of RC and 3,852m of DD drilling. A number of encouraging Au assay results were intercepted from RC and AC drilling at the Sanpan, Voodoo Child, Madras, Angel Eyes, Paradise and New Zebra prospects, with results at the newly established New Zebra prospect particularly significant. Drilling at Tumbleweed did not produce significant results.
Data from the seismic survey completed over the Crouching Tiger and Havana South areas merged with the 2014 Tropicana-Havana seismic survey. Currently work is focusing on interpretation of the merged seismic survey model to identify potential strike anddown-dip extensions to the ~1,500mRL, enabling planned mining belowTropicana gold system. A significantre-interpretation of the current 1,625mRL level. The 2015 programme is on more extensional drillingstructural architecture of the belt was developed and defining new areas to replenish the Inferred Mineral Resource.delivered a considerable pipeline of exploration targets.
TECHNOLOGY AND INNOVATION
Towards a new mining method for ultra-deep South African mines
The long-term future of our South African mining operations lies in extracting ore from depths never before achieved and where safety and cost considerations preclude the use of conventional mining practices. Refer Item 3D: “Risk Factors – some of AngloGold Ashanti’s technologies are unproven and failure could adversely impact costs and production”. Safety is paramount, and at AngloGold Ashanti our approach to addressing the challenges of depth is to design and develop innovative mechanised methodsprogress that remove miners from hazardous and unhealthy working places.
To overcome the challenges of depth we established the Technology Innovation Consortium charged with investigatingmade in 2016 and devising ways of safely mining allthe highlights of the gold, allproject are set out below:
Reef Boring - Small Range:
In 2016 the Sandvik/Cubex machine was commissioned at the Savuka section of the timemine but due to challenges faced during the stage gate reviews, the programme had to be discontinued and at greater depths than those at which we currently operate. The key componentthe machine will be decommissioned.
Medium Range:
MK IV Machine Test Site
During 2016 the MK IV machine was commissioned in the test site and has drilled 23 holes, with four holes drilled in the fourth quarter of 2016. It was determined that the quality of the holes regressed due to the self-pinning cylinders failing during the drilling cycle. This caused the machine to veer off the planned trajectory. Several new designs were investigated with the OEM Atlantis and improvements are ongoing. The addition of active sensors/pegs verified the potential of the machine to orientate, locate and direct itself to the next drilling position.
A decision was made to designate the MKIV for all research and development trials and to ensure that design targets are met on this proto-type machine prior to any further reef boring machine purchases taking place. These trials will include the results from the integrity test and furthermore improvements on the active peg system, hydro-transport, self-pinning cylinders and in hole cleaning. A structural integrity test was conducted by a company specialising in this field of work to determine the integrity of the machine with the report scheduled for finalization in the first quarter in 2017, upon which decisions regards potential alterations or design changes will be made.
MK III Machines
Carbon Leader Reef (CLR) prototype site
Drilling continued with three MK III machines in the CLR block, machines drilled 33 holes in the first half of the year. At the end of the second quarter, geotechnical concerns resulted in a revised extraction strategy that resulted in the loss of some current mining method under developmentground and consequently the reduction of one machine.
Ventersdorp Contact Reef (VCR) prototype site
After a premature failure of the 980mm reamer, a decision was made to continue drilling with the 660mm reamer. Work will continue to enhance the design of the 980mm reamer. Seven holes were drilled in the fourth quarter of 2016.
During the year, an MK III machine was installed in the VCR site and drilling commenced in third quarter after commissioning. The usual teething problems associated with a commissioning process were resolved.
Work will continue at both sites in a stage gate approach. The aim is to achieve consistent performance to prove the useeconomic viability of mechanical boring techniques targeting the gold reefs alone, thereby minimising dilution, while reducing or even eliminating seismicity risks.project.
An initial test siteOre Body Knowledge and Exploration
The goal in 2016 was establishedto improve accuracy of the Sandvik/Cubex machine. Analysis indicated that the drilled holes followed a similar trend implying that a correction factor could be applied to ensure an accurate end point is reached. The drilling trials with the Bohrmeisterfit-for-purpose drill rig commenced in the fourth quarter after it’s commissioning at TauTona minemine. The first stage gates were met after drilling four holes at the set drilling target rate (8m/hr) and hole depth (100m) at different inclinations. After the compressor started losing pressure the trial was stopped for repairs on the unit. This machine was replaced with the fit for purpose Bohrmeister drill rig during the fourth quarter.
Drilling for the next stage will commence in South Africa where reef-boring applications are being tested along with thatthe first half of 2017. This stage will aim to improve on the accuracy of the drilled holes. In hole surveying of these holes for data collection remains a technical challenge and design modifications on the deployment mechanism is currently underway.
Ultra-High Strength Backfill
To date, two ultra-high strength backfill (UHSB). The success plants were successfully commissioned; one plant at the CLR site and the other at the VCR site at TauTona mine. These plants are in full operation and have the capabilities of this technology would enablemixing the wider deploymentdry tailings underground with the other ingredients, thereafter pumping the final product at 4m³/hour over a distance of small-scale prototype units, initially targeting mining opportunities not currently available using conventional practices. Five additional test sites have been identified.600m.
In 2014, the Technology Innovation Consortium, which includes a group of original-equipment manufacturers, made progress in advancingEngineering construction and differentiating the profilesequipping of the individual key technology projects. Progress on developing technologies for safe, automated mining for selective use at our deep-level minesSavuka CLR plant and the TauTona B120 plant will commence as soon as the site excavation is as follows:
Ore body knowledge and exploration – geological drilling
Geological drillingcompleted which is a key areaanticipated to be in the first half of development for2017. In the new mining method. The consortium has identified that a solution for fast and accurate geological informationfourth quarter, the construction of the complex vein structures will be required to ensure that only the gold is being mined during the reef boring process. During 2014, progresssurface solution plant was made in achieving targeted drilling rates with no loss in accuracy. An overall 294m depth (drill string length available) was reached in line with the set target of 8m/hour and depths of between 270m-300m.
Reef boring
The developments of the reef boring technologies have progressed beyond initial trials and are in the preliminary stages of producing ore from trial sites. Reef boring machines in three different sizes have been commissioned in an attempt to address the variable reef channel widths that reside in the deep underground mining environment of AngloGold Ashanti’s assets. These machines have been commissioned and, in many cases, deployed to the operating environment for testing and further improvement. The biggest challenges were found in areas with softer footwall conditions, typically associated with the C-reef ground. The commissioning, application and development of reef boring machinescompleted. This plant is expected to continue at various prototype sites. Work teams are expectedallow for pumping the UHSB solution (UHSB product excluding cement) from surface to continue to focus on improving technical and work management aspectsthe B120 plant underground.
Mponeng extraction ratio improvement project product development is in progress. A range of machine performance toward design expectations.
Machine manufacturing: All four of the medium-reef (width 40-80cm) machinesdesigns have been tested and the two small-reef (width 0-400mm) machines were manufactured and delivered.
TauTona – test site: 30 holes were drilled during the year, at diameters of between 660mm and 720mm, to address changing reef channel. Improvement in the drilling theory remainscharacteristics modelled by rock engineering. Final results are pending before a focus area and different reamer cutter configurations were tested. Due to the reef channel increasing, more holes are expected to be drilled with the 660mm and 720mm reamers and the further information obtained will allow us to evaluate the extent to which the reamerssuitable product can be deployed at the prototype sites.
92
TauTona mine– prototype site: Three medium-reef (width 400mm-800mm) Atlantis machines were commissioned at TauTona and were progressively deployed at different prototype sites on 97 Level where 11 holes were drilled. Industrial and mechanical engineering support assisted the work teams in identifying technical and work management aspects to achieve machine performance that reach design expectations.
Great Noligwa and Kopanang: Testing started using the new hydro-power equipment, the narrow-reef (0-400mm) machine. Nine holes have been drilled to date. This drilling method requires a double-pass drilling sequence where an initial pilot or direction hole is drilled, followed by a larger diameter cutter that reams the initial hole to a greater width. Drilling of the 115mm pilot holes succeeded in delivering acceptable drilling rates and directions. However, reaming with 250mm and 350mm reamers remains a challenge as the softer footwall conditions associated with the C-reef ground caused the cutter head to diverge from the direction hole into the barren rock below the reef.
It was decided to test the technology in the Vaal Reef where footwall conditions are more consistent, and the machine was moved to Kopanang.
A Sandvik machine was delivered and installed underground, but was removed from underground and returned to the manufacturer for modifications.
Site equipping: In 2014 equipping of the prototype sites was completed and work continues on equipping sites for 2015.
Ultra high-strength backfill (UHSB)
The successful development of the UHSB product, together with the reef-boring technology for use in mining applications as a support medium, creates the potential for the earlier mining of shaft pillars, the pre-extraction of planned stabilising pillars, post-extraction of existing stabilising pillars and change from conventional mining to mechanical reef-boring mining.
During the year, alterations were made to the underground backfill plant at TauTona mine to enhance the efficiency of the system. All available reef-bored holes in the prototype production block and test site have been filled. As part of the process to install instrumentation a datalogging software system was installed and commissioned in the prototype production site. Data are currently been captured and analysed. A tailings dry plant has been commissioned on surface.
Surface testing to increase the mixing volume from 4m³/hour to 8m³/hour has seen positive results. Alternative mixing methodologies have been developed with a laboratory scale mixer in Germany. A full-scale prototype mixer was manufactured, delivered and commissioned. Initial trials gave positive results. Mixing trials to increase the volume per mix as well as to reduce the mixing times continued during the first quarter of 2015.identified.
93
| 4C. | ORGANISATIONAL STRUCTURE |
GROUP STRUCTURE
AngloGold Ashanti’s operations are divided into the following regions:
South Africa – operations in Vaal River, West Wits and surface operations;
Continental Africa – operations in Ghana, Guinea and Tanzania and joint venture operations in the DRC and Mali;
Australasia – operations in Australia; and
Americas – operations in Argentina Brazil and the United States.Brazil.
The above four regions also correspond to AngloGold Ashanti’s four business segments.
Day-to-day management of the group is entrusted to AngloGold Ashanti’s executive management team, chaired by the Chief Executive Officer. See “Item 6.:6: Directors, senior managementSenior Management and employees”Employees”.
Support is provided to the executive management team in managing AngloGold Ashanti’s corporate activities at both the central and local levels. Group support functions include planning and technical, strategy, sustainability, finance, human resources, legal and stakeholder relations, risk, insurance and information technology.
SUBSIDIARIES
AngloGold Ashanti Limited has investments in principal subsidiaries and joint venture interests, see “Item 19.:19: Exhibits – Exhibit 19.8 Principal subsidiaries and operating entities” for details.
94
| 4D. | PROPERTY, PLANTS AND EQUIPMENT |
For more information about ourAngloGold Ashanti’s mines, including as to the company’s mining rights and licences refer “Item 4B: Business overview”Overview—The regulatory environment enabling AngloGold Ashanti to mine”.
AngloGold Ashanti’s operating mines are all accessible by road.
SOUTH AFRICA - GEOLOGY
The Witwatersrand Basin comprises a six kilometresix-kilometre thick sequence of inter-bedded argillaceous and arenaceous sediments that extend laterally for some 300 kilometres north-east/south-west and 100 kilometres north-west/south-east on the Kaapvaal Craton. The upper portion of the basin, which contains the orebodies, crops out at its northern extent near Johannesburg. Further west, south and east the basin is overlain by up to four kilometres of Archaean, Proterozoic and Mesozoic volcanic and sedimentary rocks. The Witwatersrand Basin is late Archaean in age and is considered to be in the order of 2.7 to 2.8 billion years old.
Gold occurs in laterally extensive quartz pebble conglomerate horizons or reefs, generally less than two metres thick, which are widely considered to represent laterally extensive braided fluvial deposits. Separate fan systems were developed at different entry points and these are preserved as distinct goldfields. The most fundamental control to the gold distribution in the Basin remains the sedimentary features, such as facies variations and channel directions. Gold generally occurs in native form often associated with pyrite and carbon, with quartz being the main gangue mineral.
Operations in the South Africa region are powered by electricity from Eskom Holdings Limited which supplies 95 percent of the electricity used in South Africa.
•Vaal River operations
Description
The Vaal River operations consist of Great Noligwa, Kopanang, Moab Khotsong as well as the surface operations.
AngloGold Ashanti holds a number of mining rights in the Vaal River operations which have been successfully converted, executed and registered as new order mining rights at the Mineral and Petroleum Resources Titles Office (MPRTO).
Geology
In order of importance, the reefs mined at the Vaal River operations are the Vaal Reef the VCR(VR) and the “C” Reef:Crystalkop Reef (CR):
The Vaal ReefVR contains approximately 8598 percent of the reserveOre Reserve tonnage with mining grades between 5 – 10 and 20g/g/t and comprises a series of oligomictic conglomerates and quartzite packages developed on successive unconformities. Several distinct facies have been identified, each with its unique gold distribution and grade characteristic.
The VCR has a lower grade than the Vaal Reef, and contains approximately 15 percent of the estimated reserves. The economic portion is mainly concentrated in the western part of the lease area and can take the form of a massive conglomerate, a pyritic sand unit with intermittent pebble layers or a thin conglomerate horizon. The reef is located at the contact between the overlying Kliprivierberg Lavas of the Ventersdorp SuperGroup and the underlying sediments of the Witwatersrand SuperGroup which creates a distinctive seismic reflector. The VCR is located up to one kilometre above the Vaal Reef.
The “C” ReefCR is a thin, small pebble conglomerate with a carbon-rich basal contact, located approximately 270 metres above the Vaal Reef.VR. It has less than 1two percent of the estimated reservesOre Reserves with grades similar to the Vaal Reef,VR, but is more erratic. The most significant structural features are the north-east striking normal faults which dip to the north-west and south-east, resulting in zones of fault loss.
Vaal River – Summary of metallurgical operations
|
| |||||||||||||||||||||||||||||||
| West Gold Plant | Noligwa Gold Plant | Mispah Gold Plant | Kopanang Gold Plant | |||||||||||||||||||||||||||||
| West Gold Plant | Noligwa Gold Plant | Mispah Gold Plant | Kopanang Gold Plant |
| ||||||||||||||||||||||||||||
Gold plants | ||||||||||||||||||||||||||||||||
Capacity (000 tonnes/month) | 180 | 260 | 140 | 420 | 180 | 260 | 140 | 420 | ||||||||||||||||||||||||
Uranium plants | ||||||||||||||||||||||||||||||||
Capacity (000 tonnes/month) | – | 260 | – | – | — | 260 | — | — | ||||||||||||||||||||||||
|
| |||||||||||||||||||||||||||||||
95
Vaal River – Great Noligwa
Description
Great Noligwa, which began operations in 1972, is a mature operation which adjoins Kopanang and Moab Khotsong and is located close to the town of Orkney, near the Vaal River. The Vaal Reef, the operation’s primary reef, and the Crystalkop Reef, a secondary reef, are mined from a twin-shaft system over eight main levels at an average depth of 2,400 metres. Given the geological complexity of the orebody at Great Noligwa, a pillar mining method is employed.
The mine shares a milling and treatment circuit with Moab Khotsong and Kopanang.
Vaal River – Kopanang
Description
Kopanang is an underground operation located in the Free State province, roughly 170 kilometres southwest of Johannesburg and approximately 10 kilometres southeast of the town of Orkney on a lease area of 35km2. The operation, which started in 1984, is west of neighbour Great Noligwa (now part of Moab Khotsong) and bound to the south by the Jersey Fault. Gold is the primary output, with uranium oxide as aby-product from a single underground shaft system to a depth of 2,600 metres.
Kopanang almost exclusively exploits the Vaal Reef, although minor amounts of gold are also extracted from the secondary Crystalkop Reef.CR. Given the geologically complex orebody, scattered mining is used.
Vaal River – Moab Khotsong
Description
Moab Khotsong is an underground mine that started operations in 2003 and is AGA’sAngloGold Ashanti’s newest gold mine in South Africa. It is situated near Orkney, Klerksdorp and Viljoenskroon, about 180 kilometres southwest of Johannesburg. Given the geological complexity of the Vaal Reef, scattered mining is employed. Great Noligwa mine was merged with Moab Khotsong in 2014 and operations are now collectively referred to as Moab Khotsong. Great Noligwa commenced production in 1968.
Surface Operations
Surface Operations consistsin South Africa produce gold by processing surface material such as low grade stockpiles and there-treatment of Hard RockTailings Storage Facilities. Surface Sourcesoperations comprise Vaal River Surface, West Wits Surface and Mine Waste Solutions (MWS).
Hard Rock Surface SourcesLow grade stockpiles
Description
Hard Rock Surface Sources extract gold from marginal ore dumps at variousThe Vaal River and West Wits operations extract gold from various low grade stockpiles where there is morespare metallurgical capacity than reef mined.capacity. Uranium is produced as aby-product at Vaal River South Uranium Plant. In addition, backfill product is produced and used as support in the underground mining operations. The Hard Rock Surface Sources includes the rail transport infrastructure, the Vaal River and West Wits Laboratories and tailings management facilities.
Mine Waste SolutionsTailings Storage Facilities (TSF)
Description
The tailings dams consist of tailings material which originated from the processing of the underground ore from the Vaal River Operations (VR Surface), the West Wits Operations (WW Surface) and Buffels, Hartebeestfontein and Stilfontein Gold Mines (MWS).
The gold mines are deep-level gold mines, which predominantly extract the tabular, conglomeratic VR, Carbon Leader Reef (CLR) and Ventersdorp Contract Reef (VCR). The VR, CLR and VCR have been predominantly mined for gold in the past although the reef also contains uranium oxide. The material contained in the tailings dams is fine in nature. The footprints of the MWS tailings dams and Vaal River Surface Operations tailings dams cover an area of approximately 1,100ha.
MWS is a gold and uranium tailings recovery operation located in the western portion of the Witwatersrand Basin, some 160 kilometres from Johannesburg, approximately 8eight kilometres from the town of Klerksdorp near Stilfontein in the North West Province. It has been operational since 1964 and was previously owned by First Uranium Corp.
MWS consists of 14 tailings dams, which are made up of deposits from three gold and uranium mines that operated for 50 years.
The tailings dams are scattered over an area that stretches approximately 13.5 kilometres north to south and 14 kilometres east to west. The footprints of the 14 tailings dams cover an area of approximately 1,100 hectares.
The MWS gold plants have the capacity to treat tailings of 1.932.2 million tonnes per month. The uranium plant has a design capacity of 100,000 tonnes per month. The uranium plant was commissioned in the fourth quarter of 2014.
The tailings dams are comprised of tailings material which originated from the processing of underground ore from the now defunct Buffelsfontein Gold Mine (“BGM”) and Stilfontein Gold Mine (“SGM”). Both BGM and SGM predominately extracted gold from conglomerate reefs of the Witwatersrand Basin. The material contained in the tailings dams is generally fine.
96
West Wits operations
Description
The West Wits operations, Mponeng and TauTona, are situated southwest of Johannesburg, on the border between Gauteng and North West Province. From 1 January 2013 the Savuka mine was incorporated into the TauTona mine to access Savuka’s remaining Ore ReservesReserve via TauTona’s infrastructure and Savuka and TauTona operate as a single mine.
AngloGold Ashanti holds a number of mining rights in the West Wits area which have been successfully converted, executed and registered as new order mining rights at the Mineral and Petroleum Resources Titles Office (MPRTO).
Geology
Two reef horizons are exploited at the West Wits operations, the VCRVentersdrop Contact Reef (VCR) located at the top of the Central Rand Group and the CLR near the base. The separation between the two reefs increases from east to west from 400 to 900 metres, due to unconformity in the VCR.VCR unconformity. TauTona exploits both reefs, whereas Mponeng only mines the VCR. Faults of greater than 70 metres are rare. The CLR consists of one or more conglomerate units and varies from several centimetres to more than threetwo metres in thickness. Regionally, the VCR dips at approximately 21 degrees but may vary between 5 degrees and 50 degrees, accompanied by changes in thickness of the conglomerate units. Where the conglomerate has the attitude of the regional dip, it tends to be thick, well-developed, up to three metres in thickness, and is accompanied by higher gold accumulations. Where the attitude departs significantly from the regional dip, the reef is thin, varying from severalat times only a few centimetres to more than three metres in thickness.
West Wits – Mponeng
Description
Mponeng, in operation since 1986, is located between the towns of Carletonville and Fochville on the border between Gauteng and the North West Province, southwest of Johannesburg. The underground operation, the world’s deepest mine, currently extracts the VCR at depths between 2,4003,160 metres and 3,9003,740 metres BMD* through sequential-grid mining.mining and is currently the deepest mine in the world with development at 3,841 metres BMD. Future mining is planned to deepen the shaft bottom to 4,227m BMD. In the future, the mining of the CLR from Mponeng will steadily increase. The Mponeng lease area is constrained to the north by the TauTona mine, to the east by Sibanye’s Driefontein mine and to the west by Harmony’s Kusasalethu mine. Mponeng comprises a twin-shaft system housing two surface shafts and twosub-shafts. Ore is treated and smelted at the mine’s gold plant. The plant has a monthly capacity of 170,000 tonnes.
West Wits – TauTona
Description
TauTona, in operation since 1961, lies on the West Wits Line, just south of Carletonville in Gauteng, about 70 kilometres southwest of Johannesburg. MiningUnderground mining takes place predominantly on the CLR horizon at depths of between 1,850 metres and 3,450 metres.ranging from 2,900m to 3,480m BMD*. The mine has a three shaft system, supported by secondary and tertiary shafts and employs mainly sequential grid mining method to mine the CLR. Savuka, which is adjacent to and shared a processing plant with TauTona, was incorporated into TauTona in 2013 following a study in 2012 that concluded that the optimal, most efficient means of accessing Savuka’s remaining resourcesOre Reserve would be through TauTona’s infrastructure. The merging of Savuka into TauTona early in 2013 was determined as the most efficient way of mining the remainder of Savuka’s lower grade reserves, while minimising operational and infrastructure maintenance costs. A link between the two mines reduces dependency on a single infrastructure system, including ore passes.
The TauTona and Mponeng reef material is processed through the Mponeng Gold Plant.
The Savuka Gold Plant has a monthly capacity of 165,000280,000 tonnes, processing mainly material from the Mponeng marginal ore dump.
* BMD is 1,828.8m Above Mean Sea Level (AMSL)
97
CONTINENTAL AFRICA
GHANA - Summary of metallurgical operations
| Obuasi | Iduapriem | |||||||||||||||
| Sulphide Treatment Plant | Tailings Treatment Plant | Alternate Ore Treatment Plant | Iduapriem Plant | |||||||||||||
Capacity (000 tonnes/month) | 195 | 180 | 120 | 392 | ||||||||||||
| Obuasi | Iduapriem | |||||||||||||||
| Sulphide Treatment Plant | Tailings Treatment Plant | Alternate Ore Treatment Plant | Iduapriem Plant | |||||||||||||
Capacity (000 tonnes/month) | 195 | 180 | 120 | 418 | ||||||||||||
Ghana – Iduapriem
Description
Iduapriem, wholly owned by AngloGold Ashanti since September 2007, comprises the Iduapriem and Teberebie properties on a 110km105km2 concession. The mine, which began operations in 1992, is situated in the western region of Ghana, some 7085 kilometres north of the coastal city of Takoradi and 10eight kilometres southwest of Tarkwa.
Iduapriem is anopen-pit mine and its processing facilities include aCarbon-in-pulp (CIP) plant.
Geology
The Iduapriem and Teberebie properties are located along the southern end of the Tarkwa basin. The mineralisation is contained in the Banket Series of rocksquartz pebble conglomerates, breccia conglomerates and metasediments within the Tarkwaian System of Proterozoic age. The outcropping Banket Series of rocks in the mine area form prominent, arcuate ridges extending southwards from Tarkwa, westwards through Iduapriem and northwards towards Teberebie. The gold is hosted within the conglomerates.
Ghana – Obuasi
Description
Obuasi, wholly owned by AngloGold Ashanti since 2004 and currently in a care and maintenance phase, is located in the Ashanti Region of Ghana, some 320 kilometres north-west of the capital Accra and approximately 60 kilometres south of Kumasi. Mining operations are primarily underground, to a depth of 1.5 kilometres. However, some surface mining in the form of open pit and tailings reclamation also occurs. Obuasi originally opened in 1897.
Geology
The gold deposits at Obuasi are part of a prominent gold belt of Proterozoic (Birimian) volcano-sedimentary and igneous formations which extend for a distance of approximately 300 kilometres in a north-east/south-west trend insouth-western Ghana. Obuasi mineralisation is shear-zone related and there are three main structural trends hosting gold mineralisation: the Obuasi trend, the Gyabunsu trend and the Binsere trend.
Two main ore types are mined:
quartz veins which consist mainly of quartz with free gold in association with lesser amounts of various metal sulphides such as iron, zinc, lead and copper. The gold particles are generally fine-grainedcoarse-grained and occasionally visible to the naked eye. This ore type is generallynon-refractory; and
sulphide ore which is characterised by the inclusion of gold in the crystal structure of a sulphide material. The gold in these ores is fine-grained and often locked in arsenopyrite. Higher gold grades tend to be associated with finer grained arsenopyrite crystals. Other prominent minerals include quartz, chlorite and sericite. Sulphide ore is generally refractory.
Power is supplied to the mines by the Volta River Authority and the transmission is done by the GridCo Company.
GUINEAAUSTRALASIA
Description
Siguiri, a multiple open-pit oxide gold mine which opened in 1997, is AngloGold Ashanti’s sole operation in the Republic of Guinea. It is located in the district of Siguiri, around 850 kilometres northeast of the country’s capital Conakry. Conventional mining activities are performed by contractors in multiple open pits using conventional techniques. On surface, Siguiri’s gold processing plant treats about 998,000 tonnes per month. Power to the mine is self-generated.
AngloGold Ashanti holds an 85 percent interest in Siguiri and the balance of 15 percent is held by the Government of Guinea.
98
| Attributable gold production (000oz) | Average number of employees | |||||||
Operations | ||||||||
Australia | ||||||||
1. Sunrise Dam | 228 | 422 | ||||||
2. Tropicana 70% | 292 | 503 | ||||||
AngloGold Ashanti’s Australasian assets comprise the wholly owned Sunrise Dam and the 70 percent-owned Tropicana Gold mine, Australia’s newest gold mine. Tropicana completed its second full year of production in 2015.
GeologyAustralasia - Key Statistics
This concession
| Unit | 2016 | 2015 | 2014 | |||||||||||||
Operation | ||||||||||||||||
Tonnes treated/milled | Mt | 8.9 | 8.2 | 7.8 | ||||||||||||
Pay limit | oz/t | 0.06 | 0.06 | 0.07 | ||||||||||||
| g/t | 1.86 | 1.85 | 2.29 | |||||||||||||
Recovered grade | oz/t | 0.058 | 0.068 | 0.078 | ||||||||||||
| g/t | 1.82 | 2.12 | 2.43 | |||||||||||||
Gold production (attributable) | 000oz | 519 | 560 | 620 | ||||||||||||
Cost of sales | $m | 540 | 525 | 660 | ||||||||||||
Total cash costs(1) | $/oz | 793 | 702 | 804 | ||||||||||||
All-in sustaining costs(1)(2) | $/oz | 1,067 | 875 | 986 | ||||||||||||
Capital expenditure | $m | 109 | 78 | 91 | ||||||||||||
Safety | ||||||||||||||||
Number of fatalities | 0 | 0 | 0 | |||||||||||||
AIFR | Per million hours worked | 9.49 | 8.56 | 10.73 | ||||||||||||
People | ||||||||||||||||
Average no of employees: Total | 925 | 836 | 832 | |||||||||||||
Permanent employees | 211 | 195 | 194 | |||||||||||||
Contractors | 714 | 641 | 638 | |||||||||||||
| (1) | Total cash costs andall-in sustaining costs arenon-GAAP measures. For further information on thesenon-GAAP measures, see “Item 5A – Operating Results”. |
| (2) | Excludes stockpile impairments. |
Production and costs
A planned decrease in head grades at Tropicana impacted the region’s total production for the year, which although within guidance, ended lower than the previous year. Sunrise Dam however delivered a 5 percent improvement in outputyear-on-year, largely due to increased mill throughput and improved head grades.
At Sunrise Dam, mining transitioned from the GQ ore body into the Vogue ore body during the year, with the Dolly and Cosmo ore bodies also contributing significant mill feed. Underground ore was the primary source of mill feed and underground ore mined of 2.8Mt was higher in 2016 than in 2015. Underground ore is dominated by Proterozoic Birimian rocksblended with intermediate grade of 1.45g/t stockpiled ore (accumulated during open pit mining) to meet the processing plant capacity, which consistreached 4Mt in 2016.
Underground ore production continued to improve, achieving a record annualised rate of turbidite facies sedimentary sequences. The two main types of gold deposits which occur3.3Mtpa in the Siguiri basin and are mined are:
laterite mineralisation (CAP) which occursfourth quarter of 2016 as surficial aprons of colluvium or aspalaeo-channels of alluvial lateritic gravel adjacent to, and immediately above in-situ deposits; and
in-situ quartz-vein related mineralisation hostedthe 800,000t Dolly stope was brought into full production. This continues the improvement in meta-sedimentsproductivity in the underground mine with the better mineralisation associated with vein stockworks that occurs preferentiallyshift to bulk mining methods.
Tropicana again achieved the annual guidance given at the start of the mine for 2016, producing a total of 417,000oz, 292,000oz of which is attributable to AngloGold Ashanti. Gold production was 15 percent lower in 2016 than in 2015 due to the planned decrease in the coarser, brittle siltstonesaverage head grade for the year from 2.48g/t to 2.10g/t. This is consistent with the grade streaming strategy that involved preferential treatment of higher grades in the first years of the mine’s production, gradually declining to thelife-of-mine head grade of approximately 2.0 g/t. During 2016 low and sandstones.medium grade ore was stockpiled.
The lower grades mined in 2016 were partially offset by an increase, to 6.9Mt (2015: 6.2Mt) of throughput in the processing plant as the plant optimisation project was completed towards year end. This project, which was introduced as a strategy to address the planned decline in production following the end of grade streaming, has successfully lifted design throughput capacity of the processing plant to 7.5Mtpa. Metallurgical recoveries remained steady at approximately 89 percent, andmine-to-mill reconciliation, for both tonnes and grades, continued to align well. Mining was carried out in the Tropicana, Havana and Boston Shaker pits during 2016.
Cost of sales, total cash costs andall-in sustaining costs for the region increased due to a stronger Australian dollar against the US dollar, planned lower production at Tropicana and increased mining spend at Sunrise Dam, where a third jumbo was added to the fleet to set up new mining areas and carry out decline development, as well as contributing to the additional ore tonnes mined. ‘Operational excellence’ initiatives resulted in significant productivity improvements and a reduction in mining unit costs. This work will continue in 2017. Additionally, in the last quarter of 2016, a Caterpillar 6060,600-tonne class shovel was introduced to the open pit mining fleet at Tropicana to increase mining rates to an annualised rate of 80Mtpa and to better match the higher throughput requirements of the processing plant.
Capital expenditure
Overall, capital expenditure in the region increased, primarily due to increased waste stripping in the Tropicana 2 cutback. Also at Tropicana the processing plant optimisation project was successfully completed during the year.
At Sunrise Dam capitalised mining spend increased in 2016 with the addition of an extra jumbo, which commenced on site in June, increasing the mining fleet from two to three jumbos. The jumbo will open up new mining areas and is focussed initially on capitalised decline development.
Stay-in-business capital spend at Sunrise Dam is expected to rise in 2017 with the construction of the flotation and ultra-fine grind circuit to improve gold recovery.
Safety
The mineralised rocks have been deeply weatheredregion’s safety performance remains strong. Again there were no fatalities during the year, while the AIFR was 9.24 per million hours worked. The severity rate, a measure of time lost due to below 100 metres in places to form saprolite mineralisation (SAP). Withinjury, is low at both operations indicating the percentageminor nature of available CAP ore decreasing, a CIP plant is used to treat predominantly SAP ore.the injuries.
MALIOre Reserve
At the end of 2016, the total attributable Ore Reserve for the Australasia Region was 4.0 million ounces (2015: 3.1 million ounces). This makes up around eight percent of the group’s Ore Reserve.
Growth and improvement
Throughout 2016 a study has been carried out on a recovery enhancement project at Sunrise Dam. The presence of moderate levels of refractory sulphide ores has led to recoveries averaging around 85 percent over the mine’s19-year life. To date, the study work indicates that a significant improvement in recovery can be achieved through the addition of a flotation/ultra-fine grind circuit. The study is scheduled for completion in the first quarter of 2017 after which approval for the project will be sought.
Work is also continuing on a materials handling system to underpin the long-term viability of the underground mine. This project involves underground crushing and conveyor haulage of ore to the surfacerun-of-mine pad. Should it prove viable, it will reduce material rehandling and truck haulage costs, enabling the Company to mine the ore body by loweringcut-off grades and maximising production rates.
At Tropicana the higher mining and throughput rates introduced in late 2016 will enable the resumption of grade streaming frommid-2017 for at least two years. This is expected to increase production to the annual guidance of between450,000-490,000oz (at 100 percent) from the second half of 2017.
Work is continuing on the Long Island study, which is investigating large cutbacks to the pits utilisinglow-cost mining options. These include strip mining the depth extensions to the Tropicana mineralised system and using the completed Tropicana pit as a void into which waste will be backfilled. The proposed backfilling of the Tropicana pit, in conjunction with strip mining, is expected to reduce the cost of mining waste significantly by introducing short horizontal hauls instead of requiring the long uphill hauls out of the pit to surface waste dumps that would be required by conventional mining.
It is anticipated that the study will be completed inmid-2017. If the proposed mining method is implemented, the initial Long Island cutback would begin in 2019 when the Tropicana pit has been mined to its full depth. An extensive 161,000m programme of reverse circulation and diamond drilling carried out in 2015 and 2016 resulted in a 45 percent increase in the mine’s Ore Reserve and a 27 percent, or 1.73Moz, increase in the Mineral Resource, as at 31 December 2016. The increase in the Mineral Resource was achieved largely through significant additions in the Havana South and Boston Shaker zones following application of the Long Island mining methods and costs, and through an increase to the underground Mineral Resource along the entire strike length of the Tropicana mineralised system. Further increases are anticipated in 2017, depending on the outcome of the Long Island study.
Towards the end of 2016, AngloGold Ashanti entered into afarm-in agreement with Saracen Mineral Holdings Ltd to earn up to 70 percent in Saracen’s Carosue Dam North tenements. The joint venture encompasses two tenement packages, Butcher Well and Lake Carey, covering 339.56km2, approximately 120km to the north of Saracen’s Carosue Dam project. Field work, including the first phase of drilling at Butcher Well, will begin in the first quarter of 2017.
THE AMERICAS
AngloGold Ashanti has interests in three gold mining operations – both open pit and deep level mining – in Mali, namely, Sadiola, Yatelathe Americas region. In addition, there is an active greenfields exploration programme underway in Colombia.
| ||||||||
| Attributable gold production (000oz) | Average number of employees | |||||||
| ||||||||
Operations | ||||||||
1. Argentina | ||||||||
Cerro Vanguardia 92.5% | 281 | 1,877 | ||||||
| ||||||||
2. Brazil | ||||||||
AGA Mineração | 407 | 4,662 | ||||||
Serra Grande | 131 | 1,587 | ||||||
| ||||||||
3. Colombia – exploration programme | ||||||||
| ||||||||
Americas - Key Statistics (1)
| Unit | 2016 | 2015 | 2014 | |||||||||||||||||||||||||
Operation | ||||||||||||||||||||||||||||
Tonnes treated/milled | Mt | 7 | 7 | 6.8 | ||||||||||||||||||||||||
Pay limit | oz/t | 0.100 | 0.098 | 0.092 | ||||||||||||||||||||||||
| g/t | 3.421 | 3.351 | 3.152 | |||||||||||||||||||||||||
Recovered grade | oz/t | 0.106 | 0.108 | 0.104 | ||||||||||||||||||||||||
| g/t | 3.64 | 3.71 | 3.58 | |||||||||||||||||||||||||
Gold production (Attributable) | 000oz | 820 | 831 | 785 | ||||||||||||||||||||||||
Silver (attributable) | Moz | 4.9 | 4.4 | 3.1 | ||||||||||||||||||||||||
Cost of sales | $m | 752 | 719 | 745 | ||||||||||||||||||||||||
Total cash costs (2) | $/oz | 578 | 576 | 676 | ||||||||||||||||||||||||
All-in sustaining costs (2)(3) | $/oz | 875 | 792 | 974 | ||||||||||||||||||||||||
Capital expenditure (4) | $m | 225 | 196 | 225 | ||||||||||||||||||||||||
Safety | ||||||||||||||||||||||||||||
Number of fatalities | 1 | 1 | 2 | |||||||||||||||||||||||||
AIFR | Per million hours worked | 3.96 | 5.61 | 3.81 | ||||||||||||||||||||||||
| ||||||||||||||||||||||||||||
People | ||||||||||||||||||||||||||||
Average no of employees: Total | 8,126 | 7,679 | 8,588 | |||||||||||||||||||||||||
Permanent employees | 5,653 | 5,492 | 5,944 | |||||||||||||||||||||||||
Contractors | 2,473 | 2,187 | 2,644 | |||||||||||||||||||||||||
| ||||||||||||||||||||||||||||
| (1) | Key statistics are for the continuing operations in the region and exclude CC&V which was sold effective 3 August 2015. |
| (2) | Total cash costs andall-in sustaining costs arenon-GAAP measures. For further information on thesenon-GAAP measures, see “Item 5A: Operating Results”. |
| (3) | Excludes stockpile impairments. |
| (4) | 100 percent, (not attributable) and includes Colombia |
Production and Morila. It manages twocosts
Production from the Americas region declined in 2016, due to lower output from the Brazilian operations. AGA Mineração was negatively affected by delayed access to certain high-grade stopes early in the year, a deficit in secondary development, ongoing geotechnical and support challenges, licensing delays and geological modelling issues. Production was also negatively impacted by a fatal accident in late September.
The mine plan has been amended and is expected to help the operations deliver improved performance going forward. The revised mine plan comprises the treatment of theseadditional ore from lower-grade zones, with higher tonnages helping to offset the lower grades.
At Córrego do Sítio, despite a 2 percent increase in tonnages treated from both the oxide and sulphide operations, Sadiolaoverall production was impacted by reduced grades from the main underground ore body, a deficit in secondary development and Yatela.a longer-than-planned stoping cycle.
At Serra Grande, delays in the award of permits required for the Corpo Sul open pit, along with geotechnical challenges affecting the ramp to access high-grade areas at underground Mina Nova in the Pequizão ore body, had a negative impact on operations.
Cerro Vanguardia delivered an increase in production, achieving the highest level in 17 years, due to an increase in tonnes treated at the plant together with operational and metallurgical improvements. This positive performance was partially offset by lower grades mined, owing to variability in the mining model.
As the region continued to focus on cost management and production improvements resulting from the Project 500 efficiency programme, costs remained virtually unchanged. This was achieved despite lower production and significant inflationary pressures, including annual salary increases. In Brazil, costs were mainly affected by higher capital expenditure.
In Argentina, costs were favourably impacted by the reimbursement by the government of Argentina relating to exports through Patagonian ports. Cost management initiatives at Cerro Vanguardia resulted in savings derived from higher mill throughput and silver recovery; reduced use of consumables; negotiated price reductions for key inputs such as ammonium nitrate, grinding media; gold refining services; cost reductions in open pit mining; backfilling of depleted pits and improved maintenance of heavy mining equipment.
Capital expenditure
Capital expenditure for the region increased by 15 percent over 2015 levels, and was mostly spent in Brazil to increase ore reserve development in order to improve mine flexibility at all operations, raise tailings dam at Cerro Vanguardia and Mineração, and convert the metallurgical leaching process at Serra Grande.
At Cerro Vanguardia, capital expenditure was lower compared to 2015 mainly due to lower deferred stripping and the underground expansion project executed in 2015 and not repeated in 2016, which was partially offset by higher capitalised ore reserve development related to higher underground production. The depreciation of the Argentinean peso against the US dollar also aided the reduction in dollar-denominated expenditure.
Mali – MorilaThe region’s capital expenditure is expected to increase in 2017 as Cerro Vanguardia focuses on site exploration to extend the mine life; Mineração accelerates ore reserve development at the Cuiabá complex and evaluatesore-sorting prototypes at the CdS complex; and Serra Grande develops the high-grade Palmeiras and Inga ore bodies, to increase production and extend mine life.
DescriptionSafety
At the Cuiabá complex, there was a fatal accident in September when one of our contractors’ employees was fatally injured in a heavy mobile equipment accident. In order to reinforce contractor safety behaviour, the mine will standardise the safety practices for all contractors to be aligned with AngloGold Ashanti has an effective 40Ashanti’s policies and practices.
Ore Reserve
At the end of 2016, the total attributable Ore Reserve for the Americas Region, was 3.1 million ounces (2015: 3.2 million ounces). This makes up around six percent stake in Morila, as does Randgold Resources Limited (which manages the mine). The state of Mali owns the remaining 20 percent.
The Morila mine has operated for 14 years and is situated 280 kilometres southeast of Bamako, the capital of Mali. The operation treats low-grade stockpiles while the plant, which incorporates a conventional CIL process with an upfront gravity section to extract the free gold, has annual throughput capacity of 3.7 million tonnes. Since mining was concluded in 2009 with the depletion of the orebody, operations at Morila currently involve processinggroup’s Ore Reserve.
Growth and improvement
At Mineração, additional development work is underway to improve mining flexibility; implementation of the stockpile which stood at 1.3 million tonnes (mineralised waste) as at year-end. In addition,ore sorting prototypes is planned; and a push backnew pushback at the open pit provided limited amountsat Córrego do Sítío is being studied.
Work began at Cuiabá on the ventilation and transportation systems, for operating at depths between 1,500 to 2,500 metres from 2020 while doing the necessary work to ensure stable production levels in the interim. The drilling campaign at Córrego do Sítío aims to confirm the ore sources that will help improve production in the medium term and extend the life of ore. Powermine from a new open pit (CdS III) and new underground mines at the Mina II and São Bento Deep ore bodies.
At Serra Grande, exploration work is supplieddelivering positive results for future production improvements while negotiations continue with owners of Palmeiras Sul ahead of accelerating exploration to confirm the area’s potential. Diamond directional drilling underground proved the continuity of current structures with the new Inga ore body to begin production in 2017. A new open pit pipeline is in place while drilling campaigns are underway at the Pequizão orebody. Exploration at current structures is delivering positive results and new positive drill holes are delineating a new orebody (Mangaba) at structure IV.
At Cerro Vanguardia, the underground expansion continues according to schedule, following the initiative launched in 2015 to accelerate open pit and underground operations for optimisation oflife-of-mine economic performance and increase production over the coming five years.
In Colombia,pre-feasibility evaluation work continued throughout 2016 with the Gramalote and La Colosa projects and these studies are expected to be completed by the end of 2017 andmid-2018 respectively. The Nuevo Chaquiro project successfully completed a conceptual study and the approval to advance topre-feasibility phase will be sought during 2017. Greenfields exploration activities were slowed down in 2016 although field activity continued all year at the Guintar prospect.
EXPLORATION REVIEW
Our exploration is focused on creating value by providing long-term optionality and improving the portfolio quality. The objectives are met by:
Greenfields exploration, which aims to discover large, high-value Mineral Resources that will eventually lead to the development of new gold mines. Our greenfields exploration team was recognised by a subcontractor.leading industry research group, in 2015 as the industry’s most successful in Mineral Resource discovery. The team has a proven track record that includes the discovery of world-class ore bodies at La Colosa, Gramalote, Tropicana and Nuevo Chaquiro. These discoveries are attributed to our committed and professional team of geoscientists working on a portfolio of highly prospective and rigorously prioritised greenfields ground holdings.
Brownfields exploration, which focuses on delivering value through incremental additions to our Ore Reserve in existing mines as well as new discoveries in defined areas around existing operations. Brownfields exploration actively drives the creation of value by growing our Mineral Resource and Ore Reserve, our major assets. Our brownfields exploration programme is based on innovative geological modelling and mine planning and continual optimisation of our asset portfolio.
Greenfields exploration
GeologyGreenfields has over 9,000km2 of highly-prospective ground in three countries; Australia, Colombia and Brazil, and also has small ground positions in Tanzania, the USA and Argentina. Greenfields also initiated focused generative activities in countries with operational synergies.
InAustralia, in the Laverton district, aircore (AC) drilling was completed over numerous AngloGold Ashanti-held targets with 617 holes drilled for a total of 40,719m. Drilling encountered strong carbonate-sericite ± silica alteration with minor pyrite or arsenopyrite in several holes with brecciated quartz veins also observed. Several encouraging results from both Ahab and Pioneer were received. The positive AC samples from Pioneer werefollowed-up by six reverse circulation (RC) holes with three diamond drilling (DD) tails (702m/471m) and results of this drilling will be available in early in 2017.
In the fourth quarter of 2016 the Butcher Well and Lake Careyfarm-in agreement was signed between AngloGold Ashanti and Saracen Mineral Holdings Limited. AngloGold Ashanti has acquiredearn-in rights for 340 km2 of tenements on and along the western margin of Lake Carey in the Laverton district of Western Australia, including those hosting the historically-mined Butcher Well gold deposits. AngloGold Ashanti can earn up to 70 percent of the JV by spending A$15 million within 48 months from commencement date to earn 51 percent and a further A$10 million within 24 months thereafter to earn 70 percent. The conditions precedent for the agreement were met on 22 December 2016, and the first phase of drilling at Butcher Well is expected to commence in the first quarter of 2017.
At the Strawbridge Project in Western Australia, the planned AC drilling programme was completed with 257 AC holes drilled for a total of 12,770m. Results at Strawbridge from the AC drilling and geochemical sampling in 2016 returned no significant results.
InColombia, drilling was completed at the Guintar project (AngloGold Ashanti 100 percent) situated 40km west of Medellin. Three DD holes for 1,219 m were drilled on epithermal targets above a potential buried porphyry.
Several narrow(2-6m) intervals of anomalous gold mineralisation >1g/t were intersected. Are-evaluation of the regional geology at Guintar, identified subtle multi-element epithermal signatures in gravels associated withN-S trending graben structures.Follow-up exploration at this new target, Nuevo Guintar, indicates a potentially preserved epithermal target. Detailed mapping, soil sampling and ground geophysics was completed to delineate drill targets.
InBrazil, Greenfields signed a newfarm-in and JV agreement with Luna Gold to explore a ~2,000km2 tenement package, located in the Maranhão state of Brazil. Under the terms of the agreement, AngloGold Ashanti can spend $14m over four years to earn a 70 percent interest in the tenements, which includes a minimum commitment of $2m. The JV officially initiated in August and regional mapping and soil sampling programmes were completed.11 200km of a high resolution aeromagnetic and radiometric survey were flown. In parallel, considerable effort has also been placed on obtaining environmental permits for planned drilling expected to start in the first quarter of 2017.
InTanzania,Guinea,Argentina and theUnited States, early stage grassroots evaluation and reconnaissance programmes progressed.
Brownfields exploration
Brownfields exploration was carried out in ten countries, in and around AngloGold Ashanti operations. A total of 656,350m of DD and RC drilling was completed during the year.
South Africa: Exploration in the South Africa region continued with three holes being drilling at Mponeng’s Western Ultra Deep Levels (WUDLs). Surface drill holes UD59, UD60 and UD58A all intersected the VCR during the year with only UD58A continuing to drill as it completes its short deflection programme. UD61 and UD63 will start in 2017.
Argentina: At Cerro Vanguardia, drilling programmes for Mineral Resource creation and delineation continued during the year with focus on delineating vein extensions along strike and at depth in the Cerro Vanguardia tenements. Mapping, trenching and channel sampling continued as part of the reconnaissance programme to identify new drilling targets. In 2016, a new explorationearn-in project started in the Claudia concessions located to the south of the mine. Work completed at Claudia included mapping, sampling, geophysics, and initial phase drilling RC and DD drilling.
Brazil: In the Iron Quadrangle, the underground drilling programmes for depth extension related Mineral Resource conversion continued at both the Cuiabá and Lamego mines. At Cuiabá, additional drilling was directed toward satellite mineralisation bodies that may be accessible from existing infrastructure. The surface drilling programmes at the Córrego do Sítío mine continued to infill and expand oxide Mineral Resource while the underground programme added extensions to several orebodies.
At Serra Grande, exploration drilling continued to delineate the Inga mineralised structure. A new mineralised structure called Mangaba was discovered during the year through underground drilling and will be followed up. Geophysical surveys and soil sampling campaigns continued as part of the target generation program for the district.
Colombia: Exploration in the Gramalote area continued with programmes in and around the Gramalote Central deposit to complete infill drilling on the saprolite horizon. Limited drilling programmes were also conducted within the joint venture area.
At La Colosa, the emphasis on other project related drilling continued with support to geotechnical, hydrological and site infrastructure studies.
The Quebradona project work was directed toward metallurgical and infrastructure drilling studies during the year.
Tanzania: Drilling activities included infill drilling at Nyankanga Block 5 UG (Cut 9), Nyankanga Cut 7/8, Star & Comet Cut 3, Geita Hill East Cut 2, and Mineral Resource delineation drilling at Star & Comet UG (Cut 2 and 3) and Geita Hill East UG. A total of 28,574m exploration drilling was completed, comprising 10,783m DD from surface, 10,407m underground DD, and 7,383m RC drilling.
Routine geological pit mapping continued at Nyankanga Cut 7 and 8, Geita Hill East and West as well as Star & Comet Underground. In addition, a review of the preliminary geological interpretations of Kukuluma and Matandani was conducted. Detailed mapping was also conducted at Selous, ahead of planned drill-testing of this target.
The 3D Seismic Survey data acquisition within the central Geita area was successfully and an interpretation session of the initial processed data was conducted during December. A final interpretation and targeting session on site is planned for the first quarter of 2017.
Guinea: Exploration drilling focused on infill and reconnaissance drilling at Seguelen, Bidini, Tubani, Kami, Silakoro, Soloni, Kalamagna PB2, Boukaria West and Balato NE. A total of 56,975m was drilled during the year, comprising 3,336m DD, 7,894m RCDD, 43,714m RC, and 3,030m AC drilling. Other exploration activities included geochemical soil sampling, geometallurgical investigations, and the completion of LIDAR and airborne geophysical surveys.
Ghana: No exploration was conducted at Obuasi. Exploration at Iduapriem focused on infill drilling at Block 7&8, Mineral Resource delineation drilling at Block 4S and reconnaissance drilling at the Bankyem (Block 1 East), Block 1 West, Mile 5 and Nueng targets. A total of 11,316m was drilled, comprising 8,275m DD and 3,041m RC. Soil geochemical surveys were also completed over various target areas as part of a lease-scale programme.
Democratic Republic of the Congo: Drilling at Kibali totalled 28,110m, of which 19,434m was mine based drilling and 8,677m was on regional targets. DD drilling comprised 6,660m with the remaining 21,450m being RC drilling. The exploration aimed to fulfil three main objectives: MineralResource-Ore Reserve replacement, potential oxide displacement ounces, and identify and develop new targets.
Mine based exploration took place at the Rhino-Agbarabo-Kombokolo area, Pakaka, Pamao, Tete Bakangwe, Kanga Sud, Ndala Village, Aerodrome and Sessenge Southwest, regional exploration was focused on the Kalimva-Ikamva targets in the north, Memekazi Ridge, and the Aindi Watsa-Dilolo-Zambula targets in the south.
Mali: A total of 21,383m of exploration drilling was completed at Sadiola, comprising of 20,671m RC and 712m DD. Reconnaissance drilling for oxides concentrated on FNa,FNb-c and FN3 along the Sadiola North East mineralisation trend, FE2S, Voyager East and FE1W. While infill and deeper Mineral Resource delineation drilling targeted primarily SSP North and Tambali in support of the Sadiola Sulphide Project (SSP).
Australia: Underground Mineral Resource development drilling continued at Sunrise Dam throughout the year. Exploration DD focused primarily on increasing Indicated Mineral Resource (primarily in Vogue South), Reconnaissance drilling in Vogue Deeps and Mineral Resource creation drilling in the Carey Shear. Underground RC drilling continued to focus on converting the Indicated Mineral Resource into a minable Grade Control block model for use in stope development designs. Key DD drilling platforms are being developed, which will be used over the life of mine to drill test exploration targets along the strike length of the deposit.
At Tropicana, the Long Island 100m x 100m drilling programme to test the strike extent anddown-dip extensions of the known mineralised system at Tropicana was completed during December, 2016. In the second half of 2016, additional closer spaced drilling was undertaken at Boston Shaker to achieve Indicated Mineral Resource classification, and minor infill drill programmes were completed at Tropicana, Havana and Havana South. A total of 35,618m of RC and 55,516m of DD drilling were completed.
Regional brownfields exploration based out of TGM consisted of AC, RC and DD drilling totalling 50,083m. In detail, this consisted of 29,927m of AC, 9,971m of RC and 3,852m of DD drilling. A number of encouraging Au assay results were intercepted from RC and AC drilling at the Sanpan, Voodoo Child, Madras, Angel Eyes, Paradise and New Zebra prospects, with results at the newly established New Zebra prospect particularly significant. Drilling at Tumbleweed did not produce significant results.
Data from the seismic survey completed over the Crouching Tiger and Havana South areas merged with the 2014 Tropicana-Havana seismic survey. Currently work is focusing on interpretation of the merged seismic survey model to identify potential strike anddown-dip extensions to the Tropicana gold system. A significantre-interpretation of the structural architecture of the belt was developed and delivered a considerable pipeline of exploration targets.
TECHNOLOGY AND INNOVATION
The Morila deposit is hostedprogress that the Technology Innovation Consortium made in 2016 and the highlights of the project are set out below:
Reef Boring - Small Range:
In 2016 the Sandvik/Cubex machine was commissioned at the Savuka section of the mine but due to challenges faced during the stage gate reviews, the programme had to be discontinued and the machine will be decommissioned.
Medium Range:
MK IV Machine Test Site
During 2016 the MK IV machine was commissioned in the test site and has drilled 23 holes, with four holes drilled in the fourth quarter of 2016. It was determined that the quality of the holes regressed due to the self-pinning cylinders failing during the drilling cycle. This caused the machine to veer off the planned trajectory. Several new designs were investigated with the OEM Atlantis and improvements are ongoing. The addition of active sensors/pegs verified the potential of the machine to orientate, locate and direct itself to the next drilling position.
A decision was made to designate the MKIV for all research and development trials and to ensure that design targets are met on this proto-type machine prior to any further reef boring machine purchases taking place. These trials will include the results from the integrity test and furthermore improvements on the active peg system, hydro-transport, self-pinning cylinders and in hole cleaning. A structural integrity test was conducted by a company specialising in this field of work to determine the integrity of the machine with the report scheduled for finalization in the first quarter in 2017, upon which decisions regards potential alterations or design changes will be made.
MK III Machines
Carbon Leader Reef (CLR) prototype site
Drilling continued with three MK III machines in the CLR block, machines drilled 33 holes in the first half of the year. At the end of the second quarter, geotechnical concerns resulted in a flat lying fold structure which rises sharply to surfacerevised extraction strategy that resulted in the loss of some current mining ground and consequently the reduction of one machine.
Ventersdorp Contact Reef (VCR) prototype site
After a premature failure of the 980mm reamer, a decision was made to continue drilling with the 660mm reamer. Work will continue to enhance the design of the 980mm reamer. Seven holes were drilled in the fourth quarter of 2016.
During the year, an MK III machine was installed in the VCR site and drilling commenced in third quarter after commissioning. The usual teething problems associated with a commissioning process were resolved.
Work will continue at both sites in a stage gate approach. The aim is to achieve consistent performance to prove the economic viability of the project.
Ore Body Knowledge and Exploration
The goal in 2016 was to improve accuracy of the Sandvik/Cubex machine. Analysis indicated that the drilled holes followed a similar trend implying that a correction factor could be applied to ensure an accurate end point is reached. The drilling trials with the Bohrmeisterfit-for-purpose drill rig commenced in the fourth quarter after it’s commissioning at TauTona mine. The first stage gates were met after drilling four holes at the set drilling target rate (8m/hr) and hole depth (100m) at different inclinations. After the compressor started losing pressure the trial was stopped for repairs on the unit. This machine was replaced with the fit for purpose Bohrmeister drill rig during the fourth quarter.
Drilling for the next stage will commence in the first half of 2017. This stage will aim to improve on the accuracy of the drilled holes. In hole surveying of these holes for data collection remains a technical challenge and design modifications on the deployment mechanism is currently underway.
Ultra-High Strength Backfill
To date, two ultra-high strength backfill (UHSB) plants were successfully commissioned; one plant at the CLR site and the other at the VCR site at TauTona mine. These plants are in full operation and have the capabilities of mixing the dry tailings underground with the other ingredients, thereafter pumping the final product at 4m³/hour over a distance of 600m.
Engineering construction and equipping of the Savuka CLR plant and the TauTona B120 plant will commence as soon as the site excavation is completed which is anticipated to be in the first half of 2017. In the fourth quarter, the construction of the surface solution plant was completed. This plant is expected to allow for pumping the UHSB solution (UHSB product excluding cement) from surface to the B120 plant underground.
Mponeng extraction ratio improvement project product development is in progress. A range of designs have been tested and the characteristics modelled by rock engineering. Final results are pending before a suitable product can be identified.
| 4C. | ORGANISATIONAL STRUCTURE |
GROUP STRUCTURE
AngloGold Ashanti’s operations are divided into the following regions:
South Africa – operations in Vaal River, West Wits and surface operations;
Continental Africa – operations in Ghana, Guinea and Tanzania and joint venture operations in the DRC and Mali;
Australasia – operations in Australia; and
Americas – operations in Argentina and Brazil.
The above four regions also correspond to AngloGold Ashanti’s four business segments.
Day-to-day management of the group is entrusted to AngloGold Ashanti’s executive management team, chaired by the Chief Executive Officer. See “Item 6: Directors, Senior Management and Employees”.
Support is provided to the executive management team in managing AngloGold Ashanti’s corporate activities at both the central and local levels.
SUBSIDIARIES
AngloGold Ashanti Limited has investments in principal subsidiaries and joint venture interests, see “Item 19: Exhibits – Exhibit 19.8 Principal subsidiaries and operating entities” for details.
| 4D. | PROPERTY, PLANTS AND EQUIPMENT |
For more information about AngloGold Ashanti’s mines, including as to the company’s mining rights and licences refer “Item 4B: Business Overview—The regulatory environment enabling AngloGold Ashanti to mine”.
AngloGold Ashanti’s operating mines are all accessible by road.
SOUTH AFRICA - GEOLOGY
The Witwatersrand Basin comprises asix-kilometre thick sequence of inter-bedded argillaceous and arenaceous sediments that extend laterally for some 300 kilometres north-east/south-west and 100 kilometres north-west/south-east on the Kaapvaal Craton. The upper portion of the basin, which contains the orebodies, crops out at its northern extent near Johannesburg. Further west, south and west.east the basin is overlain by up to four kilometres of Archaean, Proterozoic and Mesozoic volcanic and sedimentary rocks. The depositWitwatersrand Basin is late Archaean in age and is considered to be in the order of 2.7 to 2.8 billion years old.
Gold occurs within a sequence Birimian metal-arkoses of amphibolite metamorphic grade. Mineralisation is characterised by silica-feldspar alterationin laterally extensive quartz pebble conglomerate horizons or reefs, generally less than two metres thick, which are widely considered to represent laterally extensive braided fluvial deposits. Separate fan systems were developed at different entry points and sulphide mineralisation consists of arsenopyrite, pyrrhotite,these are preserved as distinct goldfields. The most fundamental control to the gold distribution in the Basin remains the sedimentary features, such as facies variations and channel directions. Gold generally occurs in native form often associated with pyrite and chalcopyrite.carbon, with quartz being the main gangue mineral.
Operations in the South Africa region are powered by electricity from Eskom Holdings Limited which supplies 95 percent of the electricity used in South Africa.
Mali – Sadiola• Vaal River operations
Description
The Sadiola mine is situated in western Mali, some 77 kilometres south-southwestVaal River operations consist of Kopanang, Moab Khotsong as well as the regional capital Kayes. The mine is a joint venture between surface operations.
AngloGold Ashanti (41 percent)holds a number of mining rights in the Vaal River operations which have been successfully converted, executed and IAMGOLD (41 percent)registered as new order mining rights at the Mineral and the state of Mali (18 percent)Petroleum Resources Titles Office (MPRTO). The mine has been operating since 1996. Mining reduced considerably to adapt to the 2014 gold price decrease but continued predominantly in Tambali. On-site surface infrastructure includes a 4.9 million tonnes per annum CIP gold plant where the ore is eluted and smelted. Power to the Sadiola and Yatela mines is self-generated.
Geology
In order of importance, the reefs mined at the Vaal River operations are the Vaal Reef (VR) and the Crystalkop Reef (CR):
The Sadiola deposit occurs within an inlierVR contains approximately 98 percent of greenschistthe Ore Reserve tonnage with mining grades between 5 – 10 g/t and comprises a series of oligomictic conglomerates and quartzite packages developed on successive unconformities. Several distinct facies metamorphosed Birimian rocks known as the Kenieba Window. The specific rocks which host the mineralisation are marbles and greywackes which have been intensely weatheredidentified, each with its unique gold distribution and grade characteristic.
The CR is a thin, small pebble conglomerate with a carbon-rich basal contact, located approximately 270 metres above the VR. It has less than two percent of the estimated Ore Reserves with grades similar to a maximum depththe VR, but is more erratic. The most significant structural features are the north-east striking normal faults which dip to the north-west and south-east, resulting in zones of 200 metres. As a resultfault loss.
Vaal River – Summary of an east-west regional compression event, deformation occurs along a north-south striking marble-greywacke contact, increasing the porosity of this zone. North-east striking structures which intersect the north-south contact have introduced mineralisation, mainly with the marble where the porosity was greatest. The Sadiola Hill deposit generally consists of two zones, an upper oxidised cap and an underlying sulphide zone. From 1996 until 2010, oxide and transitional ore from the Sadiola Hill pit was the primary ore source for the mine while being increasingly supplemented from the outlying satellite pits during the latter years. From 2011 when the Sadiola Main pit was mined out, the satellite pits became the dominant source of oxide and transitional ore.
Gold plants Capacity (000 tonnes/month) Uranium plants Capacity (000 tonnes/month) 99 West Gold
Plant Noligwa Gold
Plant Mispah Gold
Plant Kopanang Gold
Plant 180 260 140 420 — 260 — —
MaliVaal River – YatelaKopanang
Description
Yatela, operational since 2001,Kopanang is 80 percent ownedan underground operation located in the Free State province, roughly 170 kilometres southwest of Johannesburg and approximately 10 kilometres southeast of the town of Orkney on a lease area of 35km2. The operation, which started in 1984, is west of neighbour Great Noligwa (now part of Moab Khotsong) and bound to the south by the Sadiola Exploration Company Limited,Jersey Fault. Gold is the primary output, with uranium oxide as a joint venture betweenby-product from a single underground shaft system to a depth of 2,600 metres.
Kopanang almost exclusively exploits the Vaal Reef, although minor amounts of gold are also extracted from the secondary CR. Given the geologically complex orebody, scattered mining is used.
Vaal River – Moab Khotsong
Description
Moab Khotsong is an underground mine that started operations in 2003 and is AngloGold Ashanti and IAMGOLD, giving each a 40 percent stakeAshanti’s newest gold mine in Yatela. The balance of 20 percent is owned by the state of Mali.
The Yatela mine which is a heap leach operationSouth Africa. It is situated in western Mali, some 25near Orkney, Klerksdorp and Viljoenskroon, about 180 kilometres northsouthwest of Sadiola and approximately 50 kilometres south-southwestJohannesburg. Given the geological complexity of the regional capital Kayes. Ore extraction ceasedVaal Reef, scattered mining is employed. Great Noligwa mine was merged with Moab Khotsong in September 20132014 and operations are now collectively referred to as Moab Khotsong. Great Noligwa commenced production in 1968.
Surface Operations
Surface Operations in South Africa produce gold by processing is planned to end during 2015. The main activity at Yatela issurface material such as low grade stockpiles and the implementationre-treatment of the closure plan in order to relinquish the property.Tailings Storage Facilities. Surface operations comprise Vaal River Surface, West Wits Surface and Mine Waste Solutions (MWS).
GeologyLow grade stockpiles
Yatela mineralisation occursDescription
The Vaal River and West Wits operations extract gold from various low grade stockpiles where there is spare metallurgical capacity. Uranium is produced as a keel-shaped body in Birimian metacarbonates. The ‘keel’by-product at Vaal River South Uranium Plant. In addition, backfill product is centered on a fault which was the feeder for the original mesothermal mineralisation, with an associated weakly mineralised diorite intrusion. Mineralisation occursproduced and used as a layer along the sides andsupport in the bottom ofunderground mining operations. The Hard Rock Surface Sources includes the ‘keel’. The ore dips almost vertically onrail transport infrastructure, the west limbVaal River and more gently towards the west on the east limb, with tight closure to the south.
TANZANIAWest Wits Laboratories and tailings management facilities.
Tanzania – GeitaTailings Storage Facilities (TSF)
Description
The Geitatailings dams consist of tailings material which originated from the processing of the underground ore from the Vaal River Operations (VR Surface), the West Wits Operations (WW Surface) and Buffels, Hartebeestfontein and Stilfontein Gold Mines (MWS).
The gold mines are deep-level gold mines, which predominantly extract the tabular, conglomeratic VR, Carbon Leader Reef (CLR) and Ventersdorp Contract Reef (VCR). The VR, CLR and VCR have been predominantly mined for gold in the past although the reef also contains uranium oxide. The material contained in the tailings dams is fine in nature. The footprints of the MWS tailings dams and Vaal River Surface Operations tailings dams cover an area of approximately 1,100ha.
MWS is a gold and uranium tailings recovery operation located in the western portion of the Witwatersrand Basin, some 160 kilometres from Johannesburg, approximately eight kilometres from the town of Klerksdorp near Stilfontein in the North West Province. It has been operational since 1964 and was previously owned by First Uranium Corp.
The MWS gold plants have the capacity to treat tailings of 2.2 million tonnes per month. The uranium plant has a design capacity of 100,000 tonnes per month. The uranium plant was commissioned in the fourth quarter of 2014.
West Wits operations
Description
The West Wits operations, Mponeng and TauTona, are situated southwest of Johannesburg, on the border between Gauteng and North West Province. From 1 January 2013 the Savuka mine was incorporated into the TauTona mine to access Savuka’s remaining Ore Reserve via TauTona’s infrastructure and Savuka and TauTona operate as a single mine.
AngloGold Ashanti holds a number of mining rights in the West Wits area which have been successfully converted, executed and registered as new order mining rights at the Mineral and Petroleum Resources Titles Office (MPRTO).
Geology
Two reef horizons are exploited at the West Wits operations, the Ventersdrop Contact Reef (VCR) located at the top of the Central Rand Group and the CLR near the base. The separation between the two reefs increases from east to west from 400 to 900 metres, due to the VCR unconformity. TauTona exploits both reefs, whereas Mponeng only mines the VCR. Faults of greater than 70 metres are rare. The CLR consists of one or more conglomerate units and varies from several centimetres to more than two metres in thickness. Regionally, the VCR dips at approximately 21 degrees but may vary between 5 degrees and 50 degrees, accompanied by changes in thickness of the conglomerate units. Where the conglomerate has the attitude of the regional dip, it tends to be thick, well-developed, up to three metres in thickness, and is accompanied by higher gold accumulations. Where the attitude departs significantly from the regional dip, the reef is at times only a few centimetres in thickness.
West Wits – Mponeng
Description
Mponeng, in operation since 1986, is located between the towns of Carletonville and Fochville on the border between Gauteng and the North West Province, southwest of Johannesburg. The underground operation, the world’s deepest mine, currently extracts the VCR at depths between 3,160 metres and 3,740 metres BMD* through sequential-grid mining and is currently the deepest mine in the world with development at 3,841 metres BMD. Future mining is planned to deepen the shaft bottom to 4,227m BMD. In the future, the mining of the CLR from Mponeng will steadily increase. The Mponeng lease area is constrained to the north by the TauTona mine, to the east by Sibanye’s Driefontein mine and to the west by Harmony’s Kusasalethu mine. Mponeng comprises a twin-shaft system housing two surface shafts and twosub-shafts. Ore is treated and smelted at the mine’s gold plant. The plant has a monthly capacity of 170,000 tonnes.
West Wits – TauTona
Description
TauTona, in operation since 1961, lies on the West Wits Line, just south of Carletonville in Gauteng, about 70 kilometres southwest of Johannesburg. Underground mining takes place predominantly on the CLR horizon at depths ranging from 2,900m to 3,480m BMD*. The mine has a three shaft system, supported by secondary and tertiary shafts and employs mainly sequential grid mining method to mine the CLR. Savuka, which is adjacent to TauTona, was incorporated into TauTona in 2013 following a study in 2012 that concluded that the optimal, most efficient means of accessing Savuka’s remaining Ore Reserve would be through TauTona’s infrastructure. A link between the two mines reduces dependency on a single infrastructure system, including ore passes.
The TauTona and Mponeng reef material is processed through the Mponeng Gold Plant.
The Savuka Gold Plant has a monthly capacity of 280,000 tonnes, processing mainly material from the Mponeng low grade stockpile and tailings material from the Old North TSF.
* BMD is 1,828.8m Above Mean Sea Level (AMSL)
CONTINENTAL AFRICA
GHANA - Summary of metallurgical operations
| Obuasi | Iduapriem | |||||||||||||||
| Sulphide Treatment Plant | Tailings Treatment Plant | Alternate Ore Treatment Plant | Iduapriem Plant | |||||||||||||
Capacity (000 tonnes/month) | 195 | 180 | 120 | 418 | ||||||||||||
Ghana – Iduapriem
Description
Iduapriem, wholly owned by AngloGold Ashanti since September 2007, comprises the Iduapriem and Teberebie properties on a 105km2 concession. The mine, which began operations in 1992, is situated in the western region of Ghana, some 85 kilometres north of the coastal city of Takoradi and eight kilometres southwest of Tarkwa.
Iduapriem is anopen-pit mine and its processing facilities include aCarbon-in-pulp (CIP) plant.
Geology
The Iduapriem and Teberebie properties are located along the southern end of the Tarkwa basin. The mineralisation is contained in the Banket Series of quartz pebble conglomerates, breccia conglomerates and metasediments within the Tarkwaian System of Proterozoic age. The outcropping Banket Series of rocks in the mine area form prominent, arcuate ridges extending southwards from Tarkwa, westwards through Iduapriem and northwards towards Teberebie. The gold is hosted within the conglomerates.
Ghana – Obuasi
Description
Obuasi, wholly owned by AngloGold Ashanti since 2004 and currently in a care and maintenance phase, is located in the Lake Victoria goldfieldsAshanti Region of Ghana, some 320 kilometres north-west of the Mwanza regioncapital Accra and approximately 60 kilometres south of Tanzania, about 120 kilometres from Mwanza and 5 kilometres westKumasi. Mining operations are primarily underground, to a depth of the town of Geita. It has been1.5 kilometres. Obuasi originally opened in operation for 15 years.
The Geita gold mine is a multiple open pit operation with underground potential and is currently serviced by a 5.1 million tonnes per annum CIL processing plant. Power to the mine is self-generated.1897.
Geology
Geita isThe gold deposits at Obuasi are part of a multi- open pit operation with the dominant ore sources being from the Nyankangaprominent gold belt of Proterozoic (Birimian) volcano-sedimentary and Geita Hill pits. Historically, other pits such as Star and Comet, Matandani and Kukuluma have also contributed to the ore feed. The terrain is Archaeanigneous formations which extend for a distance of approximately 300 kilometres in age and generally characterised by Greenschist metamorphism, although amphibolitic metamorphism n occursa north-east/south-west trend in places. Ore zones are usually associated with Banded Iron Formation (BIF) or other iron rich rocks and typically when they are in contact with intrusive rocks such as diorites. These contacts have been deformed and act as fluid pathways for the mineralising fluids. Goldsouth-western Ghana. Obuasi mineralisation is associatedshear-zone related and there are three main structural trends hosting gold mineralisation: the Obuasi trend, the Gyabunsu trend and the Binsere trend.
Two main ore types are mined:
quartz veins which consist mainly of quartz with alteration that includesfree gold in association with lesser amounts of various metal sulphides such as pyriteiron, zinc, lead and arsenopyrite, whilst other minerals such as hematite, magnetite, quartz, calcite, dolomite, biotitecopper. The gold particles are generally coarse-grained and chlorite also occur.
occasionally visible to the naked eye. This ore type is generallyDEMOCRATIC REPUBLIC OF THE CONGOnon-refractory; and
Kibali
Description
The Kibali Gold Minesulphide ore which is a Joint venture between AngloGold Ashanti (45 percent), Randgold Resources Limited (45 percent) with Société Miniere de Kilo-Moto (SOKIMO), a state-ownedcharacterised by the inclusion of gold company owning the balance. Randgold Resources is the operator and project manager.
Kibali comprises 10 permits covering an area of 1,836 km2 in the Moto goldfieldscrystal structure of the north-east DRC.
a sulphide material. The minegold in these ores is located within 10 kilometres of the town of Watsafine-grained and often locked in the north east portion of the DRC in the Orientale Province. Accessarsenopyrite. Higher gold grades tend to be associated with finer grained arsenopyrite crystals. Other prominent minerals include quartz, chlorite and sericite. Sulphide ore is generally refractory.
Power is supplied to the area is available by gravel road from the Ugandan border town of Arua over a distance of 180 kilometres. Power to the mine is self-generated.
The Kibali Gold Mine has a processing operation capable of producing an average of 600koz of gold per annum by treating 7.2Mtpa throughput. The processing plant has a capability of process oxide and sulphide material. Once the project is completed, the mine is expected to consist of:
An open pit generating a peak run of mine capacity of 7Mtpa;
Vertical shaft complex generating a peak run of mine capacity of 3Mtpa;
Decline underground development providing a run of mine capacity of 1.4Mtpa;
100
Tailings storage facilities with a total capacity of 75Mt; and
Associated infrastructure.
In October 2013, the oxide circuit was commissioned. During 2014 the oxide plant was successfully ramped up. The sulphide circuit has been commissioned and ramped during the second quarter of 2014.
On the mining front, the development of the decline system continued. Blasting of the first stope took place in quarter four, hence the commencement of underground mining. On the vertical shaft, the shaft depth at the end of December was 719.5 metres.
Geology
The Kibali Gold Mine is located within the Moto Greenstone Belt, which consists of Archean Kibalian volcano sedimentary rocks and ironstone-chert horizons that have been metamorphosed to greenschist facies.
The combined Karagba, Chauffeur and Durba (KCD) deposit is host to the majority of the currently defined Mineral Resource and Ore Reserve, as well as the current open pit and underground mining operations. KCD is hosted within a mineralised corridor that also hosts the Sessenge, Gorumbwa and Pakaka deposits and a number of exploration prospects.
The known deposits of the Kibali project are hosted along a reactivated thrust plane that creates plunging lodes of mineralisation as exemplifiedmines by the KCD deposit. The majority of gold mineralisation identified to dateVolta River Authority and the transmission is disseminated style, hosted within a sequence of coarse volcaniclastic and sedimentary rocks. The mineralisation is generally stratigraphically bound and associated with carbonate-silica-albite alteration with minor sulphide.done by the GridCo Company.
AUSTRALASIA
| Attributable gold production (000oz) | Average number of employees | |||||||
Operations | ||||||||
Australia | ||||||||
1. Sunrise Dam | 228 | 422 | ||||||
2. Tropicana 70% | 292 | 503 | ||||||
AngloGold Ashanti’s Australasian assets comprise the wholly owned Sunrise Dam and the 70 percent-owned Tropicana Gold mine, Australia’s newest gold mine. Tropicana completed its second full year of production in 2015.
Australasia - Key Statistics
| Unit | 2016 | 2015 | 2014 | |||||||||||||
Operation | ||||||||||||||||
Tonnes treated/milled | Mt | 8.9 | 8.2 | 7.8 | ||||||||||||
Pay limit | oz/t | 0.06 | 0.06 | 0.07 | ||||||||||||
| g/t | 1.86 | 1.85 | 2.29 | |||||||||||||
Recovered grade | oz/t | 0.058 | 0.068 | 0.078 | ||||||||||||
| g/t | 1.82 | 2.12 | 2.43 | |||||||||||||
Gold production (attributable) | 000oz | 519 | 560 | 620 | ||||||||||||
Cost of sales | $m | 540 | 525 | 660 | ||||||||||||
Total cash costs(1) | $/oz | 793 | 702 | 804 | ||||||||||||
All-in sustaining costs(1)(2) | $/oz | 1,067 | 875 | 986 | ||||||||||||
Capital expenditure | $m | 109 | 78 | 91 | ||||||||||||
Safety | ||||||||||||||||
Number of fatalities | 0 | 0 | 0 | |||||||||||||
AIFR | Per million hours worked | 9.49 | 8.56 | 10.73 | ||||||||||||
People | ||||||||||||||||
Average no of employees: Total | 925 | 836 | 832 | |||||||||||||
Permanent employees | 211 | 195 | 194 | |||||||||||||
Contractors | 714 | 641 | 638 | |||||||||||||
| (1) | Total cash costs andall-in sustaining costs arenon-GAAP measures. For further information on thesenon-GAAP measures, see “Item 5A – Operating Results”. |
| (2) | Excludes stockpile impairments. |
Production and costs
A planned decrease in head grades at Tropicana impacted the region’s total production for the year, which although within guidance, ended lower than the previous year. Sunrise Dam however delivered a 5 percent improvement in outputyear-on-year, largely due to increased mill throughput and improved head grades.
At Sunrise Dam, mining transitioned from the GQ ore body into the Vogue ore body during the year, with the Dolly and Cosmo ore bodies also contributing significant mill feed. Underground ore was the primary source of mill feed and underground ore mined of 2.8Mt was higher in 2016 than in 2015. Underground ore is blended with intermediate grade of 1.45g/t stockpiled ore (accumulated during open pit mining) to meet the processing plant capacity, which reached 4Mt in 2016.
Underground ore production continued to improve, achieving a record annualised rate of 3.3Mtpa in the fourth quarter of 2016 as the 800,000t Dolly stope was brought into full production. This continues the improvement in productivity in the underground mine with the shift to bulk mining methods.
Tropicana again achieved the annual guidance given at the start of the mine for 2016, producing a total of 417,000oz, 292,000oz of which is attributable to AngloGold Ashanti. Gold production was 15 percent lower in 2016 than in 2015 due to the planned decrease in the average head grade for the year from 2.48g/t to 2.10g/t. This is consistent with the grade streaming strategy that involved preferential treatment of higher grades in the first years of the mine’s production, gradually declining to thelife-of-mine head grade of approximately 2.0 g/t. During 2016 low and medium grade ore was stockpiled.
The lower grades mined in 2016 were partially offset by an increase, to 6.9Mt (2015: 6.2Mt) of throughput in the processing plant as the plant optimisation project was completed towards year end. This project, which was introduced as a strategy to address the planned decline in production following the end of grade streaming, has successfully lifted design throughput capacity of the processing plant to 7.5Mtpa. Metallurgical recoveries remained steady at approximately 89 percent, andmine-to-mill reconciliation, for both tonnes and grades, continued to align well. Mining was carried out in the Tropicana, Havana and Boston Shaker pits during 2016.
Cost of sales, total cash costs andall-in sustaining costs for the region increased due to a stronger Australian dollar against the US dollar, planned lower production at Tropicana and increased mining spend at Sunrise Dam, where a third jumbo was added to the fleet to set up new mining areas and carry out decline development, as well as contributing to the additional ore tonnes mined. ‘Operational excellence’ initiatives resulted in significant productivity improvements and a reduction in mining unit costs. This work will continue in 2017. Additionally, in the last quarter of 2016, a Caterpillar 6060,600-tonne class shovel was introduced to the open pit mining fleet at Tropicana to increase mining rates to an annualised rate of 80Mtpa and to better match the higher throughput requirements of the processing plant.
Capital expenditure
Overall, capital expenditure in the region increased, primarily due to increased waste stripping in the Tropicana 2 cutback. Also at Tropicana the processing plant optimisation project was successfully completed during the year.
At Sunrise Dam capitalised mining spend increased in 2016 with the addition of an extra jumbo, which commenced on site in June, increasing the mining fleet from two to three jumbos. The jumbo will open up new mining areas and is focussed initially on capitalised decline development.
Stay-in-business capital spend at Sunrise Dam is expected to rise in 2017 with the construction of the flotation and ultra-fine grind circuit to improve gold recovery.
Safety
The region’s safety performance remains strong. Again there were no fatalities during the year, while the AIFR was 9.24 per million hours worked. The severity rate, a measure of time lost due to injury, is low at both operations indicating the minor nature of the injuries.
Ore Reserve
At the end of 2016, the total attributable Ore Reserve for the Australasia Region was 4.0 million ounces (2015: 3.1 million ounces). This makes up around eight percent of the group’s Ore Reserve.
Growth and improvement
Throughout 2016 a study has been carried out on a recovery enhancement project at Sunrise Dam. The presence of moderate levels of refractory sulphide ores has led to recoveries averaging around 85 percent over the mine’s19-year life. To date, the study work indicates that a significant improvement in recovery can be achieved through the addition of a flotation/ultra-fine grind circuit. The study is scheduled for completion in the first quarter of 2017 after which approval for the project will be sought.
Work is also continuing on a materials handling system to underpin the long-term viability of the underground mine. This project involves underground crushing and conveyor haulage of ore to the surfacerun-of-mine pad. Should it prove viable, it will reduce material rehandling and truck haulage costs, enabling the Company to mine the ore body by loweringcut-off grades and maximising production rates.
At Tropicana the higher mining and throughput rates introduced in late 2016 will enable the resumption of grade streaming frommid-2017 for at least two years. This is expected to increase production to the annual guidance of between450,000-490,000oz (at 100 percent) from the second half of 2017.
Work is continuing on the Long Island study, which is investigating large cutbacks to the pits utilisinglow-cost mining options. These include strip mining the depth extensions to the Tropicana mineralised system and using the completed Tropicana pit as a void into which waste will be backfilled. The proposed backfilling of the Tropicana pit, in conjunction with strip mining, is expected to reduce the cost of mining waste significantly by introducing short horizontal hauls instead of requiring the long uphill hauls out of the pit to surface waste dumps that would be required by conventional mining.
It is anticipated that the study will be completed inmid-2017. If the proposed mining method is implemented, the initial Long Island cutback would begin in 2019 when the Tropicana pit has been mined to its full depth. An extensive 161,000m programme of reverse circulation and diamond drilling carried out in 2015 and 2016 resulted in a 45 percent increase in the mine’s Ore Reserve and a 27 percent, or 1.73Moz, increase in the Mineral Resource, as at 31 December 2016. The increase in the Mineral Resource was achieved largely through significant additions in the Havana South and Boston Shaker zones following application of the Long Island mining methods and costs, and through an increase to the underground Mineral Resource along the entire strike length of the Tropicana mineralised system. Further increases are anticipated in 2017, depending on the outcome of the Long Island study.
Towards the end of 2016, AngloGold Ashanti entered into afarm-in agreement with Saracen Mineral Holdings Ltd to earn up to 70 percent in Saracen’s Carosue Dam North tenements. The joint venture encompasses two tenement packages, Butcher Well and Lake Carey, covering 339.56km2, approximately 120km to the north of Saracen’s Carosue Dam project. Field work, including the first phase of drilling at Butcher Well, will begin in the first quarter of 2017.
THE AMERICAS
AngloGold Ashanti has three mining operations – both open pit and deep level mining – in the Americas region. In addition, there is an active greenfields exploration programme underway in Colombia.
| ||||||||
| Attributable gold production (000oz) | Average number of employees | |||||||
| ||||||||
Operations | ||||||||
1. Argentina | ||||||||
Cerro Vanguardia 92.5% | 281 | 1,877 | ||||||
| ||||||||
2. Brazil | ||||||||
AGA Mineração | 407 | 4,662 | ||||||
Serra Grande | 131 | 1,587 | ||||||
| ||||||||
3. Colombia – exploration programme | ||||||||
| ||||||||
Americas - Key Statistics (1)
| Unit | 2016 | 2015 | 2014 | |||||||||||||||||||||||||
Operation | ||||||||||||||||||||||||||||
Tonnes treated/milled | Mt | 7 | 7 | 6.8 | ||||||||||||||||||||||||
Pay limit | oz/t | 0.100 | 0.098 | 0.092 | ||||||||||||||||||||||||
| g/t | 3.421 | 3.351 | 3.152 | |||||||||||||||||||||||||
Recovered grade | oz/t | 0.106 | 0.108 | 0.104 | ||||||||||||||||||||||||
| g/t | 3.64 | 3.71 | 3.58 | |||||||||||||||||||||||||
Gold production (Attributable) | 000oz | 820 | 831 | 785 | ||||||||||||||||||||||||
Silver (attributable) | Moz | 4.9 | 4.4 | 3.1 | ||||||||||||||||||||||||
Cost of sales | $m | 752 | 719 | 745 | ||||||||||||||||||||||||
Total cash costs (2) | $/oz | 578 | 576 | 676 | ||||||||||||||||||||||||
All-in sustaining costs (2)(3) | $/oz | 875 | 792 | 974 | ||||||||||||||||||||||||
Capital expenditure (4) | $m | 225 | 196 | 225 | ||||||||||||||||||||||||
Safety | ||||||||||||||||||||||||||||
Number of fatalities | 1 | 1 | 2 | |||||||||||||||||||||||||
AIFR | Per million hours worked | 3.96 | 5.61 | 3.81 | ||||||||||||||||||||||||
| ||||||||||||||||||||||||||||
People | ||||||||||||||||||||||||||||
Average no of employees: Total | 8,126 | 7,679 | 8,588 | |||||||||||||||||||||||||
Permanent employees | 5,653 | 5,492 | 5,944 | |||||||||||||||||||||||||
Contractors | 2,473 | 2,187 | 2,644 | |||||||||||||||||||||||||
| ||||||||||||||||||||||||||||
| (1) | Key statistics are for the continuing operations in the region and exclude CC&V which was sold effective 3 August 2015. |
| (2) | Total cash costs andall-in sustaining costs arenon-GAAP measures. For further information on thesenon-GAAP measures, see “Item 5A: Operating Results”. |
| (3) | Excludes stockpile impairments. |
| (4) | 100 percent, (not attributable) and includes Colombia |
Production and costs
Production from the Americas region declined in 2016, due to lower output from the Brazilian operations. AGA Mineração was negatively affected by delayed access to certain high-grade stopes early in the year, a deficit in secondary development, ongoing geotechnical and support challenges, licensing delays and geological modelling issues. Production was also negatively impacted by a fatal accident in late September.
The mine plan has been amended and is expected to help the operations deliver improved performance going forward. The revised mine plan comprises the treatment of additional ore from lower-grade zones, with higher tonnages helping to offset the lower grades.
At Córrego do Sítio, despite a 2 percent increase in tonnages treated from both the oxide and sulphide operations, overall production was impacted by reduced grades from the main underground ore body, a deficit in secondary development and a longer-than-planned stoping cycle.
At Serra Grande, delays in the award of permits required for the Corpo Sul open pit, along with geotechnical challenges affecting the ramp to access high-grade areas at underground Mina Nova in the Pequizão ore body, had a negative impact on operations.
Cerro Vanguardia delivered an increase in production, achieving the highest level in 17 years, due to an increase in tonnes treated at the plant together with operational and metallurgical improvements. This positive performance was partially offset by lower grades mined, owing to variability in the mining model.
As the region continued to focus on cost management and production improvements resulting from the Project 500 efficiency programme, costs remained virtually unchanged. This was achieved despite lower production and significant inflationary pressures, including annual salary increases. In Brazil, costs were mainly affected by higher capital expenditure.
In Argentina, costs were favourably impacted by the reimbursement by the government of Argentina relating to exports through Patagonian ports. Cost management initiatives at Cerro Vanguardia resulted in savings derived from higher mill throughput and silver recovery; reduced use of consumables; negotiated price reductions for key inputs such as ammonium nitrate, grinding media; gold refining services; cost reductions in open pit mining; backfilling of depleted pits and improved maintenance of heavy mining equipment.
Capital expenditure
Capital expenditure for the region increased by 15 percent over 2015 levels, and was mostly spent in Brazil to increase ore reserve development in order to improve mine flexibility at all operations, raise tailings dam at Cerro Vanguardia and Mineração, and convert the metallurgical leaching process at Serra Grande.
At Cerro Vanguardia, capital expenditure was lower compared to 2015 mainly due to lower deferred stripping and the underground expansion project executed in 2015 and not repeated in 2016, which was partially offset by higher capitalised ore reserve development related to higher underground production. The depreciation of the Argentinean peso against the US dollar also aided the reduction in dollar-denominated expenditure.
The region’s capital expenditure is expected to increase in 2017 as Cerro Vanguardia focuses on site exploration to extend the mine life; Mineração accelerates ore reserve development at the Cuiabá complex and evaluatesore-sorting prototypes at the CdS complex; and Serra Grande develops the high-grade Palmeiras and Inga ore bodies, to increase production and extend mine life.
Safety
At the Cuiabá complex, there was a fatal accident in September when one of our contractors’ employees was fatally injured in a heavy mobile equipment accident. In order to reinforce contractor safety behaviour, the mine will standardise the safety practices for all contractors to be aligned with AngloGold Ashanti’s policies and practices.
Ore Reserve
At the end of 2016, the total attributable Ore Reserve for the Americas Region, was 3.1 million ounces (2015: 3.2 million ounces). This makes up around six percent of the group’s Ore Reserve.
Growth and improvement
At Mineração, additional development work is underway to improve mining flexibility; implementation of ore sorting prototypes is planned; and a new pushback at the open pit at Córrego do Sítío is being studied.
Work began at Cuiabá on the ventilation and transportation systems, for operating at depths between 1,500 to 2,500 metres from 2020 while doing the necessary work to ensure stable production levels in the interim. The drilling campaign at Córrego do Sítío aims to confirm the ore sources that will help improve production in the medium term and extend the life of mine from a new open pit (CdS III) and new underground mines at the Mina II and São Bento Deep ore bodies.
At Serra Grande, exploration work is delivering positive results for future production improvements while negotiations continue with owners of Palmeiras Sul ahead of accelerating exploration to confirm the area’s potential. Diamond directional drilling underground proved the continuity of current structures with the new Inga ore body to begin production in 2017. A new open pit pipeline is in place while drilling campaigns are underway at the Pequizão orebody. Exploration at current structures is delivering positive results and new positive drill holes are delineating a new orebody (Mangaba) at structure IV.
At Cerro Vanguardia, the underground expansion continues according to schedule, following the initiative launched in 2015 to accelerate open pit and underground operations for optimisation oflife-of-mine economic performance and increase production over the coming five years.
In Colombia,pre-feasibility evaluation work continued throughout 2016 with the Gramalote and La Colosa projects and these studies are expected to be completed by the end of 2017 andmid-2018 respectively. The Nuevo Chaquiro project successfully completed a conceptual study and the approval to advance topre-feasibility phase will be sought during 2017. Greenfields exploration activities were slowed down in 2016 although field activity continued all year at the Guintar prospect.
EXPLORATION REVIEW
Our exploration is focused on creating value by providing long-term optionality and improving the portfolio quality. The objectives are met by:
Greenfields exploration, which aims to discover large, high-value Mineral Resources that will eventually lead to the development of new gold mines. Our greenfields exploration team was recognised by a leading industry research group, in 2015 as the industry’s most successful in Mineral Resource discovery. The team has a proven track record that includes the discovery of world-class ore bodies at La Colosa, Gramalote, Tropicana and Nuevo Chaquiro. These discoveries are attributed to our committed and professional team of geoscientists working on a portfolio of highly prospective and rigorously prioritised greenfields ground holdings.
Brownfields exploration, which focuses on delivering value through incremental additions to our Ore Reserve in existing mines as well as new discoveries in defined areas around existing operations. Brownfields exploration actively drives the creation of value by growing our Mineral Resource and Ore Reserve, our major assets. Our brownfields exploration programme is based on innovative geological modelling and mine planning and continual optimisation of our asset portfolio.
Greenfields exploration
Greenfields has over 9,000km2 of highly-prospective ground in three countries; Australia, Colombia and Brazil, and also has small ground positions in Tanzania, the USA and Argentina. Greenfields also initiated focused generative activities in countries with operational synergies.
InAustralia, in the Laverton district, aircore (AC) drilling was completed over numerous AngloGold Ashanti-held targets with 617 holes drilled for a total of 40,719m. Drilling encountered strong carbonate-sericite ± silica alteration with minor pyrite or arsenopyrite in several holes with brecciated quartz veins also observed. Several encouraging results from both Ahab and Pioneer were received. The positive AC samples from Pioneer werefollowed-up by six reverse circulation (RC) holes with three diamond drilling (DD) tails (702m/471m) and results of this drilling will be available in early in 2017.
In the fourth quarter of 2016 the Butcher Well and Lake Careyfarm-in agreement was signed between AngloGold Ashanti and Saracen Mineral Holdings Limited. AngloGold Ashanti has acquiredearn-in rights for 340 km2 of tenements on and along the western margin of Lake Carey in the Laverton district of Western Australia, including those hosting the historically-mined Butcher Well gold deposits. AngloGold Ashanti can earn up to 70 percent of the JV by spending A$15 million within 48 months from commencement date to earn 51 percent and a further A$10 million within 24 months thereafter to earn 70 percent. The conditions precedent for the agreement were met on 22 December 2016, and the first phase of drilling at Butcher Well is expected to commence in the first quarter of 2017.
At the Strawbridge Project in Western Australia, the planned AC drilling programme was completed with 257 AC holes drilled for a total of 12,770m. Results at Strawbridge from the AC drilling and geochemical sampling in 2016 returned no significant results.
InColombia, drilling was completed at the Guintar project (AngloGold Ashanti 100 percent) situated 40km west of Medellin. Three DD holes for 1,219 m were drilled on epithermal targets above a potential buried porphyry.
Several narrow(2-6m) intervals of anomalous gold mineralisation >1g/t were intersected. Are-evaluation of the regional geology at Guintar, identified subtle multi-element epithermal signatures in gravels associated withN-S trending graben structures.Follow-up exploration at this new target, Nuevo Guintar, indicates a potentially preserved epithermal target. Detailed mapping, soil sampling and ground geophysics was completed to delineate drill targets.
InBrazil, Greenfields signed a newfarm-in and JV agreement with Luna Gold to explore a ~2,000km2 tenement package, located in the Maranhão state of Brazil. Under the terms of the agreement, AngloGold Ashanti can spend $14m over four years to earn a 70 percent interest in the tenements, which includes a minimum commitment of $2m. The JV officially initiated in August and regional mapping and soil sampling programmes were completed.11 200km of a high resolution aeromagnetic and radiometric survey were flown. In parallel, considerable effort has also been placed on obtaining environmental permits for planned drilling expected to start in the first quarter of 2017.
InTanzania,Guinea,Argentina and theUnited States, early stage grassroots evaluation and reconnaissance programmes progressed.
Brownfields exploration
Brownfields exploration was carried out in ten countries, in and around AngloGold Ashanti operations. A total of 656,350m of DD and RC drilling was completed during the year.
South Africa: Exploration in the South Africa region continued with three holes being drilling at Mponeng’s Western Ultra Deep Levels (WUDLs). Surface drill holes UD59, UD60 and UD58A all intersected the VCR during the year with only UD58A continuing to drill as it completes its short deflection programme. UD61 and UD63 will start in 2017.
Argentina: At Cerro Vanguardia, drilling programmes for Mineral Resource creation and delineation continued during the year with focus on delineating vein extensions along strike and at depth in the Cerro Vanguardia tenements. Mapping, trenching and channel sampling continued as part of the reconnaissance programme to identify new drilling targets. In 2016, a new explorationearn-in project started in the Claudia concessions located to the south of the mine. Work completed at Claudia included mapping, sampling, geophysics, and initial phase drilling RC and DD drilling.
Brazil: In the Iron Quadrangle, the underground drilling programmes for depth extension related Mineral Resource conversion continued at both the Cuiabá and Lamego mines. At Cuiabá, additional drilling was directed toward satellite mineralisation bodies that may be accessible from existing infrastructure. The surface drilling programmes at the Córrego do Sítío mine continued to infill and expand oxide Mineral Resource while the underground programme added extensions to several orebodies.
At Serra Grande, exploration drilling continued to delineate the Inga mineralised structure. A new mineralised structure called Mangaba was discovered during the year through underground drilling and will be followed up. Geophysical surveys and soil sampling campaigns continued as part of the target generation program for the district.
Colombia: Exploration in the Gramalote area continued with programmes in and around the Gramalote Central deposit to complete infill drilling on the saprolite horizon. Limited drilling programmes were also conducted within the joint venture area.
At La Colosa, the emphasis on other project related drilling continued with support to geotechnical, hydrological and site infrastructure studies.
The Quebradona project work was directed toward metallurgical and infrastructure drilling studies during the year.
Tanzania: Drilling activities included infill drilling at Nyankanga Block 5 UG (Cut 9), Nyankanga Cut 7/8, Star & Comet Cut 3, Geita Hill East Cut 2, and Mineral Resource delineation drilling at Star & Comet UG (Cut 2 and 3) and Geita Hill East UG. A total of 28,574m exploration drilling was completed, comprising 10,783m DD from surface, 10,407m underground DD, and 7,383m RC drilling.
Routine geological pit mapping continued at Nyankanga Cut 7 and 8, Geita Hill East and West as well as Star & Comet Underground. In addition, a review of the preliminary geological interpretations of Kukuluma and Matandani was conducted. Detailed mapping was also conducted at Selous, ahead of planned drill-testing of this target.
The 3D Seismic Survey data acquisition within the central Geita area was successfully and an interpretation session of the initial processed data was conducted during December. A final interpretation and targeting session on site is planned for the first quarter of 2017.
Guinea: Exploration drilling focused on infill and reconnaissance drilling at Seguelen, Bidini, Tubani, Kami, Silakoro, Soloni, Kalamagna PB2, Boukaria West and Balato NE. A total of 56,975m was drilled during the year, comprising 3,336m DD, 7,894m RCDD, 43,714m RC, and 3,030m AC drilling. Other exploration activities included geochemical soil sampling, geometallurgical investigations, and the completion of LIDAR and airborne geophysical surveys.
Ghana: No exploration was conducted at Obuasi. Exploration at Iduapriem focused on infill drilling at Block 7&8, Mineral Resource delineation drilling at Block 4S and reconnaissance drilling at the Bankyem (Block 1 East), Block 1 West, Mile 5 and Nueng targets. A total of 11,316m was drilled, comprising 8,275m DD and 3,041m RC. Soil geochemical surveys were also completed over various target areas as part of a lease-scale programme.
Democratic Republic of the Congo: Drilling at Kibali totalled 28,110m, of which 19,434m was mine based drilling and 8,677m was on regional targets. DD drilling comprised 6,660m with the remaining 21,450m being RC drilling. The exploration aimed to fulfil three main objectives: MineralResource-Ore Reserve replacement, potential oxide displacement ounces, and identify and develop new targets.
Mine based exploration took place at the Rhino-Agbarabo-Kombokolo area, Pakaka, Pamao, Tete Bakangwe, Kanga Sud, Ndala Village, Aerodrome and Sessenge Southwest, regional exploration was focused on the Kalimva-Ikamva targets in the north, Memekazi Ridge, and the Aindi Watsa-Dilolo-Zambula targets in the south.
Mali: A total of 21,383m of exploration drilling was completed at Sadiola, comprising of 20,671m RC and 712m DD. Reconnaissance drilling for oxides concentrated on FNa,FNb-c and FN3 along the Sadiola North East mineralisation trend, FE2S, Voyager East and FE1W. While infill and deeper Mineral Resource delineation drilling targeted primarily SSP North and Tambali in support of the Sadiola Sulphide Project (SSP).
Australia: Underground Mineral Resource development drilling continued at Sunrise Dam throughout the year. Exploration DD focused primarily on increasing Indicated Mineral Resource (primarily in Vogue South), Reconnaissance drilling in Vogue Deeps and Mineral Resource creation drilling in the Carey Shear. Underground RC drilling continued to focus on converting the Indicated Mineral Resource into a minable Grade Control block model for use in stope development designs. Key DD drilling platforms are being developed, which will be used over the life of mine to drill test exploration targets along the strike length of the deposit.
At Tropicana, the Long Island 100m x 100m drilling programme to test the strike extent anddown-dip extensions of the known mineralised system at Tropicana was completed during December, 2016. In the second half of 2016, additional closer spaced drilling was undertaken at Boston Shaker to achieve Indicated Mineral Resource classification, and minor infill drill programmes were completed at Tropicana, Havana and Havana South. A total of 35,618m of RC and 55,516m of DD drilling were completed.
Regional brownfields exploration based out of TGM consisted of AC, RC and DD drilling totalling 50,083m. In detail, this consisted of 29,927m of AC, 9,971m of RC and 3,852m of DD drilling. A number of encouraging Au assay results were intercepted from RC and AC drilling at the Sanpan, Voodoo Child, Madras, Angel Eyes, Paradise and New Zebra prospects, with results at the newly established New Zebra prospect particularly significant. Drilling at Tumbleweed did not produce significant results.
Data from the seismic survey completed over the Crouching Tiger and Havana South areas merged with the 2014 Tropicana-Havana seismic survey. Currently work is focusing on interpretation of the merged seismic survey model to identify potential strike anddown-dip extensions to the Tropicana gold system. A significantre-interpretation of the structural architecture of the belt was developed and delivered a considerable pipeline of exploration targets.
TECHNOLOGY AND INNOVATION
The progress that the Technology Innovation Consortium made in 2016 and the highlights of the project are set out below:
Reef Boring - Small Range:
In 2016 the Sandvik/Cubex machine was commissioned at the Savuka section of the mine but due to challenges faced during the stage gate reviews, the programme had to be discontinued and the machine will be decommissioned.
Medium Range:
MK IV Machine Test Site
During 2016 the MK IV machine was commissioned in the test site and has drilled 23 holes, with four holes drilled in the fourth quarter of 2016. It was determined that the quality of the holes regressed due to the self-pinning cylinders failing during the drilling cycle. This caused the machine to veer off the planned trajectory. Several new designs were investigated with the OEM Atlantis and improvements are ongoing. The addition of active sensors/pegs verified the potential of the machine to orientate, locate and direct itself to the next drilling position.
A decision was made to designate the MKIV for all research and development trials and to ensure that design targets are met on this proto-type machine prior to any further reef boring machine purchases taking place. These trials will include the results from the integrity test and furthermore improvements on the active peg system, hydro-transport, self-pinning cylinders and in hole cleaning. A structural integrity test was conducted by a company specialising in this field of work to determine the integrity of the machine with the report scheduled for finalization in the first quarter in 2017, upon which decisions regards potential alterations or design changes will be made.
MK III Machines
Carbon Leader Reef (CLR) prototype site
Drilling continued with three MK III machines in the CLR block, machines drilled 33 holes in the first half of the year. At the end of the second quarter, geotechnical concerns resulted in a revised extraction strategy that resulted in the loss of some current mining ground and consequently the reduction of one machine.
Ventersdorp Contact Reef (VCR) prototype site
After a premature failure of the 980mm reamer, a decision was made to continue drilling with the 660mm reamer. Work will continue to enhance the design of the 980mm reamer. Seven holes were drilled in the fourth quarter of 2016.
During the year, an MK III machine was installed in the VCR site and drilling commenced in third quarter after commissioning. The usual teething problems associated with a commissioning process were resolved.
Work will continue at both sites in a stage gate approach. The aim is to achieve consistent performance to prove the economic viability of the project.
Ore Body Knowledge and Exploration
The goal in 2016 was to improve accuracy of the Sandvik/Cubex machine. Analysis indicated that the drilled holes followed a similar trend implying that a correction factor could be applied to ensure an accurate end point is reached. The drilling trials with the Bohrmeisterfit-for-purpose drill rig commenced in the fourth quarter after it’s commissioning at TauTona mine. The first stage gates were met after drilling four holes at the set drilling target rate (8m/hr) and hole depth (100m) at different inclinations. After the compressor started losing pressure the trial was stopped for repairs on the unit. This machine was replaced with the fit for purpose Bohrmeister drill rig during the fourth quarter.
Drilling for the next stage will commence in the first half of 2017. This stage will aim to improve on the accuracy of the drilled holes. In hole surveying of these holes for data collection remains a technical challenge and design modifications on the deployment mechanism is currently underway.
Ultra-High Strength Backfill
To date, two ultra-high strength backfill (UHSB) plants were successfully commissioned; one plant at the CLR site and the other at the VCR site at TauTona mine. These plants are in full operation and have the capabilities of mixing the dry tailings underground with the other ingredients, thereafter pumping the final product at 4m³/hour over a distance of 600m.
Engineering construction and equipping of the Savuka CLR plant and the TauTona B120 plant will commence as soon as the site excavation is completed which is anticipated to be in the first half of 2017. In the fourth quarter, the construction of the surface solution plant was completed. This plant is expected to allow for pumping the UHSB solution (UHSB product excluding cement) from surface to the B120 plant underground.
Mponeng extraction ratio improvement project product development is in progress. A range of designs have been tested and the characteristics modelled by rock engineering. Final results are pending before a suitable product can be identified.
| 4C. | ORGANISATIONAL STRUCTURE |
GROUP STRUCTURE
AngloGold Ashanti’s operations are divided into the following regions:
South Africa – operations in Vaal River, West Wits and surface operations;
Continental Africa – operations in Ghana, Guinea and Tanzania and joint venture operations in the DRC and Mali;
Australasia – operations in Australia; and
Americas – operations in Argentina and Brazil.
The above four regions also correspond to AngloGold Ashanti’s four business segments.
Day-to-day management of the group is entrusted to AngloGold Ashanti’s executive management team, chaired by the Chief Executive Officer. See “Item 6: Directors, Senior Management and Employees”.
Support is provided to the executive management team in managing AngloGold Ashanti’s corporate activities at both the central and local levels.
SUBSIDIARIES
AngloGold Ashanti Limited has investments in principal subsidiaries and joint venture interests, see “Item 19: Exhibits – Exhibit 19.8 Principal subsidiaries and operating entities” for details.
| 4D. | PROPERTY, PLANTS AND EQUIPMENT |
For more information about AngloGold Ashanti’s mines, including as to the company’s mining rights and licences refer “Item 4B: Business Overview—The regulatory environment enabling AngloGold Ashanti to mine”.
AngloGold Ashanti’s operating mines are all accessible by road.
SOUTH AFRICA - GEOLOGY
The Witwatersrand Basin comprises asix-kilometre thick sequence of inter-bedded argillaceous and arenaceous sediments that extend laterally for some 300 kilometres north-east/south-west and 100 kilometres north-west/south-east on the Kaapvaal Craton. The upper portion of the basin, which contains the orebodies, crops out at its northern extent near Johannesburg. Further west, south and east the basin is overlain by up to four kilometres of Archaean, Proterozoic and Mesozoic volcanic and sedimentary rocks. The Witwatersrand Basin is late Archaean in age and is considered to be in the order of 2.7 to 2.8 billion years old.
Gold occurs in laterally extensive quartz pebble conglomerate horizons or reefs, generally less than two metres thick, which are widely considered to represent laterally extensive braided fluvial deposits. Separate fan systems were developed at different entry points and these are preserved as distinct goldfields. The most fundamental control to the gold distribution in the Basin remains the sedimentary features, such as facies variations and channel directions. Gold generally occurs in native form often associated with pyrite and carbon, with quartz being the main gangue mineral.
Operations in the South Africa region are powered by electricity from Eskom Holdings Limited which supplies 95 percent of the electricity used in South Africa.
• Vaal River operations
Description
The Vaal River operations consist of Kopanang, Moab Khotsong as well as the surface operations.
AngloGold Ashanti holds a number of mining rights in the Vaal River operations which have been successfully converted, executed and registered as new order mining rights at the Mineral and Petroleum Resources Titles Office (MPRTO).
Geology
In order of importance, the reefs mined at the Vaal River operations are the Vaal Reef (VR) and the Crystalkop Reef (CR):
The VR contains approximately 98 percent of the Ore Reserve tonnage with mining grades between 5 – 10 g/t and comprises a series of oligomictic conglomerates and quartzite packages developed on successive unconformities. Several distinct facies have been identified, each with its unique gold distribution and grade characteristic.
The CR is a thin, small pebble conglomerate with a carbon-rich basal contact, located approximately 270 metres above the VR. It has less than two percent of the estimated Ore Reserves with grades similar to the VR, but is more erratic. The most significant structural features are the north-east striking normal faults which dip to the north-west and south-east, resulting in zones of fault loss.
Vaal River – Summary of metallurgical operations
| ||||||||||||||||
| West Gold Plant | Noligwa Gold Plant | Mispah Gold Plant | Kopanang Gold Plant | |||||||||||||
| ||||||||||||||||
Gold plants | ||||||||||||||||
Capacity (000 tonnes/month) | 180 | 260 | 140 | 420 | ||||||||||||
Uranium plants | ||||||||||||||||
Capacity (000 tonnes/month) | — | 260 | — | — | ||||||||||||
| ||||||||||||||||
Vaal River – Kopanang
Description
Kopanang is an underground operation located in the Free State province, roughly 170 kilometres southwest of Johannesburg and approximately 10 kilometres southeast of the town of Orkney on a lease area of 35km2. The operation, which started in 1984, is west of neighbour Great Noligwa (now part of Moab Khotsong) and bound to the south by the Jersey Fault. Gold is the primary output, with uranium oxide as aby-product from a single underground shaft system to a depth of 2,600 metres.
Kopanang almost exclusively exploits the Vaal Reef, although minor amounts of gold are also extracted from the secondary CR. Given the geologically complex orebody, scattered mining is used.
Vaal River – Moab Khotsong
Description
Moab Khotsong is an underground mine that started operations in 2003 and is AngloGold Ashanti’s newest gold mine in South Africa. It is situated near Orkney, Klerksdorp and Viljoenskroon, about 180 kilometres southwest of Johannesburg. Given the geological complexity of the Vaal Reef, scattered mining is employed. Great Noligwa mine was merged with Moab Khotsong in 2014 and operations are now collectively referred to as Moab Khotsong. Great Noligwa commenced production in 1968.
Surface Operations
Surface Operations in South Africa produce gold by processing surface material such as low grade stockpiles and there-treatment of Tailings Storage Facilities. Surface operations comprise Vaal River Surface, West Wits Surface and Mine Waste Solutions (MWS).
Low grade stockpiles
Description
The Vaal River and West Wits operations extract gold from various low grade stockpiles where there is spare metallurgical capacity. Uranium is produced as aby-product at Vaal River South Uranium Plant. In addition, backfill product is produced and used as support in the underground mining operations. The Hard Rock Surface Sources includes the rail transport infrastructure, the Vaal River and West Wits Laboratories and tailings management facilities.
Tailings Storage Facilities (TSF)
Description
The tailings dams consist of tailings material which originated from the processing of the underground ore from the Vaal River Operations (VR Surface), the West Wits Operations (WW Surface) and Buffels, Hartebeestfontein and Stilfontein Gold Mines (MWS).
The gold mines are deep-level gold mines, which predominantly extract the tabular, conglomeratic VR, Carbon Leader Reef (CLR) and Ventersdorp Contract Reef (VCR). The VR, CLR and VCR have been predominantly mined for gold in the past although the reef also contains uranium oxide. The material contained in the tailings dams is fine in nature. The footprints of the MWS tailings dams and Vaal River Surface Operations tailings dams cover an area of approximately 1,100ha.
MWS is a gold and uranium tailings recovery operation located in the western portion of the Witwatersrand Basin, some 160 kilometres from Johannesburg, approximately eight kilometres from the town of Klerksdorp near Stilfontein in the North West Province. It has been operational since 1964 and was previously owned by First Uranium Corp.
The MWS gold plants have the capacity to treat tailings of 2.2 million tonnes per month. The uranium plant has a design capacity of 100,000 tonnes per month. The uranium plant was commissioned in the fourth quarter of 2014.
West Wits operations
Description
The West Wits operations, Mponeng and TauTona, are situated southwest of Johannesburg, on the border between Gauteng and North West Province. From 1 January 2013 the Savuka mine was incorporated into the TauTona mine to access Savuka’s remaining Ore Reserve via TauTona’s infrastructure and Savuka and TauTona operate as a single mine.
AngloGold Ashanti holds a number of mining rights in the West Wits area which have been successfully converted, executed and registered as new order mining rights at the Mineral and Petroleum Resources Titles Office (MPRTO).
Geology
Two reef horizons are exploited at the West Wits operations, the Ventersdrop Contact Reef (VCR) located at the top of the Central Rand Group and the CLR near the base. The separation between the two reefs increases from east to west from 400 to 900 metres, due to the VCR unconformity. TauTona exploits both reefs, whereas Mponeng only mines the VCR. Faults of greater than 70 metres are rare. The CLR consists of one or more conglomerate units and varies from several centimetres to more than two metres in thickness. Regionally, the VCR dips at approximately 21 degrees but may vary between 5 degrees and 50 degrees, accompanied by changes in thickness of the conglomerate units. Where the conglomerate has the attitude of the regional dip, it tends to be thick, well-developed, up to three metres in thickness, and is accompanied by higher gold accumulations. Where the attitude departs significantly from the regional dip, the reef is at times only a few centimetres in thickness.
West Wits – Mponeng
Description
Mponeng, in operation since 1986, is located between the towns of Carletonville and Fochville on the border between Gauteng and the North West Province, southwest of Johannesburg. The underground operation, the world’s deepest mine, currently extracts the VCR at depths between 3,160 metres and 3,740 metres BMD* through sequential-grid mining and is currently the deepest mine in the world with development at 3,841 metres BMD. Future mining is planned to deepen the shaft bottom to 4,227m BMD. In the future, the mining of the CLR from Mponeng will steadily increase. The Mponeng lease area is constrained to the north by the TauTona mine, to the east by Sibanye’s Driefontein mine and to the west by Harmony’s Kusasalethu mine. Mponeng comprises a twin-shaft system housing two surface shafts and twosub-shafts. Ore is treated and smelted at the mine’s gold plant. The plant has a monthly capacity of 170,000 tonnes.
West Wits – TauTona
Description
TauTona, in operation since 1961, lies on the West Wits Line, just south of Carletonville in Gauteng, about 70 kilometres southwest of Johannesburg. Underground mining takes place predominantly on the CLR horizon at depths ranging from 2,900m to 3,480m BMD*. The mine has a three shaft system, supported by secondary and tertiary shafts and employs mainly sequential grid mining method to mine the CLR. Savuka, which is adjacent to TauTona, was incorporated into TauTona in 2013 following a study in 2012 that concluded that the optimal, most efficient means of accessing Savuka’s remaining Ore Reserve would be through TauTona’s infrastructure. A link between the two mines reduces dependency on a single infrastructure system, including ore passes.
The TauTona and Mponeng reef material is processed through the Mponeng Gold Plant.
The Savuka Gold Plant has a monthly capacity of 280,000 tonnes, processing mainly material from the Mponeng low grade stockpile and tailings material from the Old North TSF.
* BMD is 1,828.8m Above Mean Sea Level (AMSL)
CONTINENTAL AFRICA
GHANA - Summary of metallurgical operations
| Obuasi | Iduapriem | |||||||||||||||
| Sulphide Treatment Plant | Tailings Treatment Plant | Alternate Ore Treatment Plant | Iduapriem Plant | |||||||||||||
Capacity (000 tonnes/month) | 195 | 180 | 120 | 418 | ||||||||||||
Ghana – Iduapriem
Description
Iduapriem, wholly owned by AngloGold Ashanti since September 2007, comprises the Iduapriem and Teberebie properties on a 105km2 concession. The mine, which began operations in 1992, is situated in the western region of Ghana, some 85 kilometres north of the coastal city of Takoradi and eight kilometres southwest of Tarkwa.
Iduapriem is anopen-pit mine and its processing facilities include aCarbon-in-pulp (CIP) plant.
Geology
The Iduapriem and Teberebie properties are located along the southern end of the Tarkwa basin. The mineralisation is contained in the Banket Series of quartz pebble conglomerates, breccia conglomerates and metasediments within the Tarkwaian System of Proterozoic age. The outcropping Banket Series of rocks in the mine area form prominent, arcuate ridges extending southwards from Tarkwa, westwards through Iduapriem and northwards towards Teberebie. The gold is hosted within the conglomerates.
Ghana – Obuasi
Description
Obuasi, wholly owned by AngloGold Ashanti since 2004 and currently in a care and maintenance phase, is located in the Ashanti Region of Ghana, some 320 kilometres north-west of the capital Accra and approximately 60 kilometres south of Kumasi. Mining operations are primarily underground, to a depth of 1.5 kilometres. Obuasi originally opened in 1897.
Geology
The gold deposits at Obuasi are part of a prominent gold belt of Proterozoic (Birimian) volcano-sedimentary and igneous formations which extend for a distance of approximately 300 kilometres in a north-east/south-west trend insouth-western Ghana. Obuasi mineralisation is shear-zone related and there are three main structural trends hosting gold mineralisation: the Obuasi trend, the Gyabunsu trend and the Binsere trend.
Two main ore types are mined:
quartz veins which consist mainly of quartz with free gold in association with lesser amounts of various metal sulphides such as iron, zinc, lead and copper. The gold particles are generally coarse-grained and occasionally visible to the naked eye. This ore type is generallynon-refractory; and
sulphide ore which is characterised by the inclusion of gold in the crystal structure of a sulphide material. The gold in these ores is fine-grained and often locked in arsenopyrite. Higher gold grades tend to be associated with finer grained arsenopyrite crystals. Other prominent minerals include quartz, chlorite and sericite. Sulphide ore is generally refractory.
Power is supplied to the mines by the Volta River Authority and the transmission is done by the GridCo Company.
GUINEA
Description
Siguiri, a multipleopen-pit oxide gold mine which opened in 1997, is AngloGold Ashanti’s sole operation in the Republic of Guinea. It is located in the district of Siguiri. The mine is located approximately 520 kilometres north-northeast of Conakry, 25 kilometres northwest of the town of Siguiri and 190 kilometres southeast of the Malian capital Bamako, near the Mali boarder. Conventional mining activities are performed by contractors in multiple open pits using conventional techniques. On surface, Siguiri’s gold processing plant treats about 998,000 tonnes per month. Power to the mine is self-generated.
AngloGold Ashanti holds an 85 percent interest in Siguiri and the balance of 15 percent is held by the government of Guinea.
Geology
This concession is dominated by Proterozoic Birimian rocks which consist of turbidite facies sedimentary sequences. The two main types of gold deposits which occur in the Siguiri basin and are mined are:
laterite mineralisation (CAP) which occurs as surficial aprons of colluvium or aspalaeo-channels of alluvial lateritic gravel adjacent to, and immediately abovein-situ deposits; and
in-situ quartz-vein related mineralisation hosted in meta-sediments with the better mineralisation associated with vein stockworks that occurs preferentially in the coarser, brittle siltstones and sandstones.
The mineralised rocks have been deeply weathered to below 100 metres in places to form saprolite mineralisation (oxide). With the percentage of available oxide ore decreasing, a feasibility study to consider the exploitation of the fresh rock material was completed in December 2015. The project will upgrade the current plant and enable processing of a combination of oxides and fresh rock material. The plant throughput will remain at 12Mtpa with a flexible design allowing up to 6Mtpa fresh rock to be processed. Targeted fresh rock pits include Kami, Bidini, Tubani, Sintroko, Seguelen and Sokuno. The feasibility study has been approved by AngloGold Ashanti, AGA has concluded successful negotiations with the Government of Guinea of the Convention de Base and access to the required areas has been received so the project will proceed.
MALI
AngloGold Ashanti has interests in three operations in Mali, namely, Sadiola, Yatela and Morila. It manages two of these operations, Sadiola and Yatela.
Mali – Morila
Description
AngloGold Ashanti has an effective 40 percent stake in Morila, as does Randgold Resources Limited (which manages the mine). The state of Mali owns the remaining 20 percent.
The Morila mine has operated since 2001 and is situated 280 kilometres southeast of Bamako, the capital of Mali. When mining concluded in 2009 with the depletion of the orebody, operations at Morila transitioned to stockpile and tailings retreatment. The plant, which incorporates a conventional CIL process with an upfront gravity section to extract the free gold, has annual throughput capacity of 3.7 million tonnes. Power is supplied by a subcontractor.
Geology
The Morila deposit is hosted in a flat lying fold structure which rises sharply to surface in the south and west. The deposit occurs within a sequence Birimian metal-arkoses of amphibolite metamorphic grade. Mineralisation is characterised by silica-feldspar alteration and sulphide mineralisation consists of arsenopyrite, pyrrhotite, pyrite and chalcopyrite.
Mali – Sadiola
Description
The Sadiola mine is situated in western Mali, 77 kilometres to the south of the regional capital of Kayes and about 440 kilometres north-west of the capital city of Bamako. The mine is a joint venture between AngloGold Ashanti (41 percent) and IAMGOLD (41 percent) and the government of Mali (18 percent). The Sadiola gold deposit has been mined by the Société d’Exploitation des Mines d’Or de Sadiola S.A. (SEMOS) since 1996. Mining reduced considerably to adapt to the 2014 gold price decrease but continued predominantly in various satellite pits.On-site surface infrastructure includes a 4.9 million tonnes per annum CIP gold plant where the ore is eluted and smelted. Power to the Sadiola mine is self-generated.
From 1996 until 2010, oxide and transitional ore from the Sadiola Hill pit was the primary ore source for the mine while being increasingly supplemented from the outlying satellite pits during the latter years. From 2011 when the Sadiola Main pit was mined out, the satellite pits became the dominant source of oxide and transitional ore. A project is currently under consideration to mine the underlying sulphide ore and upgrade the processing plant to treat the hard sulphide ore. The Company is evaluating the possibility of supplying power to the project through the grid and is negotiating fiscal provisions with the government of Mali.
Geology
The Sadiola deposit occurs within an inlier of greenschist facies metamorphosed Birimian rocks known as the Kenieba Window. The specific rocks which host the mineralisation are marbles and greywackes which have been intensely weathered to a maximum depth of 200 metres. As a result of an east-west regional compression event, deformation occurs along a north-south striking marble-greywacke contact, increasing the porosity of this zone. North-east striking structures which intersect the north-south contact have introduced mineralisation, mainly with the marble where the porosity was greatest. The Sadiola Hill deposit generally consists of two zones, an upper oxidised cap and an underlying sulphide zone.
Mali – Yatela
Description
Yatela, operational since 2001, is 80 percent owned by the Sadiola Exploration Company Limited, a joint venture between AngloGold Ashanti and IAMGOLD, giving each a 40 percent stake in Yatela. The balance of 20 percent is owned by the state of Mali.
The Yatela mine, which was a heap leach operation, is situated in western Mali, some 25 kilometres north of Sadiola and approximately 50 kilometres south-southwest of the regional capital Kayes. Ore extraction ceased in September 2013 and processing of the stockpiles and heap leach pads ended in the fourth quarter of 2016. The main activity at Yatela is the implementation of the closure plan in order to relinquish the property. Power to the Yatela operation is self-generated.
Geology
Yatela mineralisation occurs as a keel-shaped body in Birimian metacarbonates. The ‘keel’ is centered on a fault which was the feeder for the original mesothermal mineralisation, with an associated weakly mineralised diorite intrusion. Mineralisation occurs as a layer along the sides and in the bottom of the ‘keel’. The ore dips almost vertically on the west limb and more gently towards the west on the east limb, with tight closure to the south.
TANZANIA
Tanzania – Geita
Description
The Geita gold mine is located in the Lake Victoria goldfields of the Mwanza region of Tanzania, about 120 kilometres west of Mwanza and four kilometres away from the town of Geita. It has been in operation since 1996.
The Geita gold mine is a multiple open pit operation with underground potential and is currently serviced by a 5.1 million tonnes per annum CIL processing plant. Power to the mine is self-generated. In 2015, underground mining commenced at Geita with the development of declines and the opening up of stopes below the Star and Comet pit. The mine is currently evaluating additional underground options to increase production and extend the mine’s life.
Geology
Geita is a multi- open pit operation with the dominant ore sources being from the Nyankanga and Geita Hill pits. Historically, other pits such as Star and Comet, Matandani and Kukuluma have also contributed to the ore feed. The terrain is Archaean in age and generally characterised by Greenschist metamorphism, although amphibolitic metamorphism occurs in places. Ore zones are usually associated with Banded Iron Formation (BIF) or other iron rich rocks and typically when they are in contact with intrusive rocks such as diorites. These contacts have been deformed and act as fluid pathways for the mineralising fluids. Gold mineralisation is associated with alteration that includes sulphides such as pyrite and arsenopyrite, whilst other minerals such as hematite, magnetite, quartz, calcite, dolomite, biotite and chlorite also occur.
DEMOCRATIC REPUBLIC OF THE CONGO
Kibali
Description
The Kibali Gold Mine is a Joint venture between AngloGold Ashanti (45 percent), Randgold Resources Limited (45 percent) with Société Miniere de Kilo-Moto SA UNISARL (SOKIMO), a state-owned gold company owning the balance. Randgold Resources is the operator.
Kibali is located in the north-eastern part of the DRC near the international borders with Uganda and Sudan. The mine is located adjacent to the village of Doko, which is located in the west of the project area. Kibali is approximately 210 kilometres by road from Arua, on the Ugandan border and immediately north of the district capital of Watsa. The operations area falls within the administrative district of Haut Uélé in Orientale Province. Power to the mine is self-generated. Gold production began in the fourth quarter of 2013 from open pit operations and underground mining commenced in 2014. It has a processing operation capable of producing an average of 600koz of gold per annum by treating 7.2Mtpa throughput. The processing plant has a capability of processing both oxide and sulphide material.
The shaft reached the completed depth of 751.2m in the first quarter of 2015 and its equipping was completed in the first half of 2016. The first ore from the shaft is expected in the second half of 2017.
Geology
The Kibali Gold Mine is located within the Moto Greenstone Belt, which consists of Archean Kibalian volcano sedimentary rocks and ironstone-chert horizons that have been metamorphosed to greenschist facies.
The combined Karagba, Chauffeur and Durba (KCD) deposit is host to the majority of the currently defined Mineral Resource and Ore Reserve, as well as the current open pit and underground mining operations. KCD is hosted within a mineralised corridor that also hosts the Sessenge, Gorumbwa and Pakaka deposits and a number of exploration prospects.
The known deposits of the Kibali project are hosted along a reactivated thrust plane that creates plunging lodes of mineralisation as exemplified by the KCD deposit. The majority of gold mineralisation identified to date is disseminated style, hosted within a sequence of coarse volcaniclastic and sedimentary rocks. The mineralisation is generally stratigraphically bound and associated with carbonate-silica-albite alteration with minor sulphide.
AUSTRALASIA
AUSTRALIA
Australia – Sunrise Dam
Description
Sunrise Dam, which is wholly-owned, is located 220km220 kilometres northeast of Kalgoorlie and 55km55 kilometres south of Laverton in Western Australia. Mining of the Crown Pillar at the base of the 490m deep pit was completed in early 2014. By year-end, undergroundUnderground mining, which is conducted by a contract mining company, wasis the primary source of ore, with supplementary mill feed provided by stockpiles. Ore is treated via conventional gravity andcarbon-in-leach (CIL) processing plant, with a nameplate capacity of 2.5Mt per annum, which is owner-managed.
Open pit production began in 1997 and has now been completed at a final depth of 500m below surface and mining of the Crown Pillar at the base of the 490m deep pit was completed in early 2014. Underground mining commenced in 2003 with a number of different mining methods being applied, depending on the style of mineralisation and grade of the geological domain.
Power at Sunrise Dam is self-generated and the mine uses natural gas supplied by APA Operations (Pty) Limited.
Geology
Gold ore at Sunrise Dam is structurally and lithologically controlled within gently dipping high strain shear zones and steeply dipping brittle-ductile low strain shear zones. Host rocks include andesitic volcanic rocks, volcanogenic sediments and magnetic shales.
Australia –- Tropicana
Description
Tropicana, a joint venture between AngloGold Ashanti (70%(70 percent and manager) and Independence Group NL (30%)(30 percent), is located 200 kmkilometres east of Sunrise Dam and 330 kmkilometres east-northeast of Kalgoorlie. First gold was poured ahead of schedule and on budget in September 2013, following development approval in November 2010. The open pit operation features a large scale, modern processing plant which uses conventionalcarbon-in-leach technology and includes high-pressure grinding rolls for energy-efficient comminution. Mining is carried out by a contract mining company and the plant, with a nameplate capacity of 5.8Mt per annum, is owner-managed.
The mine is a fly in fly outfly-infly-out operation, with a mine site village and aviation services operated from Perth and Kalgoorlie. A 220km220 kilometres private road and the public road network provide access for the delivery of supplies to the operation.
The Tropicana JV includes approximately 3,000km1,838km2 of tenure in the prospective Tropicana belt, with active exploration programmes seeking both satellite extensions to the Tropicana Gold Mine and discoveries with standalone potential. A study is currently underway to evaluate possible strip mining of the depth extension of the Tropicana mineralized system, which is expected to be completed in mid 2017.
Power is supplied to the mine by on site gas and diesel power stations, natural gas is supplied by APA Operations (Pty) Limited.
101
Geology
Gold mineralisation at Tropicana occurs in high metamorphic grade gneissic rocks, which dip gently to the south east. Mineralisation is structurally controlled and occurs within a preferred host unit within the gneissic package. Post mineralisation faulting has separated the once continuous ore zone, with the open pits developed on each of the fault bounded blocks.
THE AMERICAS
UNITED STATES OF AMERICA
United States of America – Cripple Creek & Victor
Description
AngloGold Ashanti holds a 100 percent interest in Cripple Creek & Victor (CC&V) Gold Mining Company’s Cresson Project, located in the state of Colorado in the United States. A surface mining operation provides ore to a crusher and valley-leach facility, one of the largest in the world. Production here began in 1994. Production from the mine life extension (MLE1) project, which involved expanding capacity at the heap-leach pad, began in 2011. A further life extension and production expansion project (MLE2), approved in 2012, is in implementation phase and is expected to increase production from 2015. The power for the mine is purchased from Black Hills Energy. The mine became operational in 1976. The mine has been operated by AngloGold Ashanti since 1999.
Geology
The district of Cripple Creek is centered on an intensely altered alkaline, Tertiary-aged, diatreme-volcanic, intrusive complex, approximately circular in shape covering 18.4 square kilometres and surrounded by Precambrian rocks. The Precambrian rocks consist of biotite gneiss, granodiorite and quartz monzonite and granite.
Geologic events that created the intersection of these Precambrian units also formed an area of regional dilation which, subsequently, facilitated the formation of the volcanic complex. The majority of the complex thenin-filled with the eruptive phase of the Cripple Creek Breccia host rock. This complex was subsequently intruded by a series of intrusive dykes and sills that include syenites, phonolites, phonotephrites and lamprophyres. These intrusives occupy all of the dominant district structural orientations. District structures are generally near vertical and strike north-north-west tonorth-east. These structures acted as primary conduits for the late-stage gold mineralising solutions. Higher grade pods of mineralisation occur at structural intersections and/or as sheeted veins along zones of strike deflection. High-grade gold mineralisation is associated with K-feldspar + pyrite +/- carbonate alteration and occurs within the major structural and intrusive dyke zones. The broader zones of disseminated mineralisation occur primarily as micro-fractured halos around the stronger alteration zones in the more permeable Cripple Creek Breccia wall rocks.
The average depth of oxidation is 120 metres and is also developed along major structural zones to even greater depths. Individual orebodies can be tabular, pipe-like, irregular or massive. Individual gold particles are generally less than 20 microns in size. Gold occurs primarily as gold tellurides, gold-silver tellurides or their oxidized equivalents. It can also occur as native gold, native gold with pyrite or native gold with iron and manganese oxides. Silver is present but is economically unimportant. Gold mineralisation can be encapsulated by iron and manganese oxides, pyrite, K-feldspar alteration and minor quartz.
Cripple Creek & Victor – Summary of metallurgical operations
| ||
| ||
| ||
| ||
|
102
ARGENTINA
Argentina – Cerro Vanguardia
Description
AngloGold Ashanti has a 92.5 percent interest in Cerro Vanguardia with Fomicruz (the province of Santa Cruz) owning the remaining 7.5 percent. Located to the northwest of Puerto San Julian in the province of Santa Cruz, Cerro Vanguardia consists of multiple small open pits.pits and underground mines. Shallow underground mining began in 2010 to access high-grade material and accounts for about 2330 percent of the mine’s production. The orebodies comprise a series of hydrothermal vein deposits containing gold and large quantities of silver, which is mined as aby-product. Ore is processed at either the metallurgical plant which has a capacity of 3,1503,450 dry tonnes per day and includes a cyanide recovery facility.facility or the heap leach operation which started in 2012 to process the low grade material. Power for the mine is self-generated but operated by an external contractor. The mine has been operated by AngloGold Ashanti since 1998.
Geology
The oldest rocks in this part of Patagonia are metamorphics of the Precambrian-Cambrian age. These are overlain by Permian and Triassic continental clastic rocks which have been faulted into a series of horsts and grabens and are associated with both limited basaltic sills and dykes and with calc-alkaline granite and granodiorite intrusions. Thick andesite flows of Lower Jurassic age occur above these sedimentary units. A large volume of rhyolitic ignimbrites was emplaced during the Middle and Upper Jurassic age over an area of approximately 100,000 square kilometres. These volcanic rocks include the Chon Aike formation ignimbrite units that host the gold bearing veins at Cerro Vanguardia. Post-mineral units include Cretaceous and Tertiary rocks of both marine and continental origin, the Quaternary La Avenida formation, the Patagonia gravel and the overlying La Angelita basalt flows. These flows do not cover the area of the Cerro Vanguardia veins.
Gold and silver mineralisation at Cerro Vanguardia occurs within a vertical range of about 150 metres to 200 metres in a series of narrow, banded quartz veins that occupy structures within the Chon Aike ignimbrites. These veins form a typical structural pattern related to major north-south (Concepcion) and east-west (Vanguardia) shears. Two sets of veins have formed in response to this shearing. One set of veins strikes about N40W and generally dips 65 to 90 degrees to the east; while the other set strikes about N75W and the veins dip 60 degrees to 80 degrees to the south.
The veins are typical of epithermal,low-temperature, adularia-sericite character and consist primarily of quartz in several forms: as massive quartz, banded chalcedonic quartz, and quartz-cemented breccias. Dark bands in the quartz are due to finely disseminated pyrite, now oxidised to limonite. The veins show sharp contacts with the surrounding ignimbrite which hosts narrow stockwork zones that are weakly mineralised and appear to have been cut by a sequence of north-east-trending faults that have southerly movement with no appreciable lateral displacement.
103
BRAZIL
Brazil – AngloGold Ashanti Córrego do Sítiotío Mineração (AGA Mineração)
Description
AngloGold Ashanti Córrego do Sítiotío Mineração (AGA Mineração) comprises two operational units, namely the Cuiabá and the Córrego do Sítiotío complexes.
The Cuiabá complex includes the Cuiabá and Lamego mines and the Cuiabá and Queiroz plants. In operation for 29 years,The Cuiabá and Lamego mines are located near Sabará, southeast and east respectively of the city of Belo Horizonte, the capital of Minas Gerais State, in the southeast of Brazil. The Cuiabá mine is a mix of sublevel benchcut-and-fill and cut-and-fill minelong hole stoping accessed by ramp and shaft. Lamego is a new mine developed to mine an underground sulphide ore. The first stage of the processing of the ore from Cuiabá and Lamego mines is in the gold plant at the Cuiabá complex, where concentrate is produced. The material is then transported 15 kilometres by aerial ropeway to the Queiroz plant where milling, flotation, roasting, leaching, precipitation and refining occur. Total capacity of the complete circuit is 1.7 million tonnes per year and recoveries of 93 percent are achieved. Power for the mine is both self-generated and supplied by Cemig a state owned company. The CuiabaCuiabá mine became operational in 1988 and the Lamego mine in 2009. However someSome of the older mines which are now closed have been operating since 1834.
The Córrego do Sítio operationtío (CdS) is located in the Municipality of Santa Bárbara, 60 kilometres east of the city of Belo Horizonte, the capital of Minas Gerais state. The southern portion of this mining complex is referred to as CdS I while the northern portion (formerly known as São Bento) has been renamed CdS II. CdS comprises one surface (oxide) and twosub-level stoping underground (sulphide) mines, as well as a heap leach pad and sulphide plant, the latter originally acquired from Eldorado late in 2008 was refurbished and brought into operation in January 2012. There are two metallurgical plants in CdS: the heap-leach plant for the oxide ore and the sulphide plant. The sulphide process consists of crushing, grinding and gravity concentration, flotation, thickening, acidulation, pressure oxidation (POX autoclave), CCD (counter current decantation), CIL extraction, elution, neutralisation, electro winning and tailings disposal. The plant and POX circuit have a capacity as of 600ktpy. The heap-leaching process consists of crushing, agglomeration, stacking, leaching, adsorption, elution and electro winning. Power is supplied to CdS by Cemig a state owned company.
Geology
The area in which BrasilAGA Mineração is located is known as the Iron Quadrangle and is host to historic and current gold mining operations, as well as a number ofopen-pit limestone and iron ore operations. The geology of the Iron Quadrangle is composed of Proterozoic and Archaeanvolcano-sedimentary sequences andPre-Cambrian granitic complexes. The host to the gold mineralisation is the volcano-sedimentary Nova Lima Group (NLG) that occurs at the base of the Rio das Velhas SuperGroup (RDVS). The upper sequence of the RDVS is the meta-sedimentary Maquiné Group. Cuiabá mine, located at Sabara Municipality, has gold mineralisation associated with sulphides and quartz veins in Banded Ironstone Formation (BIF) and volcanic sequences. At this mine, structural control and fluids flow ascension are the most important factors for gold mineralisation with a common association between large-scale shear zones and their associated structures. Where BIF is mineralised the ore appears strongly stratiform due to the selective sulphidation of the iron rich layers. Steeply plunging shear zones tend to control the ore shoots, which commonly plunge parallel to intersections between the shears and other structures.
The controlling mineralisation structures are the apparent intersection of thrust faults with tight isoclinal folds in a ductile environment. The host rocks at Brasil Mineração are BIF, Lapa Seca and mafic volcanics (principally basaltic). Mineralisation is due to the interaction of low salinity carbon dioxide rich fluids with the high-iron BIF, basalts and carbonaceous graphitic schists. Sulphide mineralisation consists of pyrrhotite and pyrite with subordinate pyrite and chalcopyrite; the latter tends to occur as a late-stage fracture fill and is not associated with gold mineralisation. Wallrock alteration is typically carbonate, potassic and silicic.
Brazil – Summary of metallurgical operations
| Corrego do Sitio | Corrego do Sito | AngloGold Ashanti Mineração | Serra Grande | |||||||||||||||||
| Oxide | Sulphide | Cuiaba | Raposos | |||||||||||||||||
Capacity (000 tonnes/month) | 38 | 50 | 147 | 28 | 108 | |||||||||||||||
Brazil – Serra Grande
Description
Serra Grande is located in central Brazil, in the state of Goiás, about 5five kilometers from the city of Crixás. Serra Grande comprises three mechanised underground mines: Mina III (which includes orebody IV), Mina Nova (which includes the Pequizão orebody) and Palmeiras – and an open pit in the outcrop of Mina III orebodies. Recently a newA gold bearing quartz vein was identified just beneath Pequizão Orebody and a new decline is being developed from Mina III (orebody IV) to access and expose this new orebody named Ingá, wichwhich contains high grade content.ore. One dedicated metallurgical plant treats ore from these different sources. The annual capacity of the processing circuit, which has grinding, leaching, filtration, precipitation and smelting facilities, is 1.3 million tonnes. The power for the mine is supplied and purchased in the open market. The mine became operational in 1989 and has been operated by AngloGold Ashanti since 1999.
104
Geology
The gold ore deposits are located in the Rio Vermelho and Ribeirão das Antas Formations of the Archaean Pilar de Goia’s Group which account together for a large proportion of the Crixás Greenstone Belt in central Brazil.
The stratigraphy of the belt is dominated by basics and ultrabasics in the lower sequences with volcano sedimentary units forming the upper successions.
The gold deposits are hosted in a sequence of schists, meta volcanics and dolomites occurring in a typical greenstone belt structural setting. Gold mineralisation is associated with massive sulphides and vein quartz material associated with carbonaceous and sericitic schists and dolomites. The oreshoots plunge to the north-west with dipping between 6six and 35 degrees. The stratigraphy is overturned and thrusted towards the east, being recognized different shear thrust structures that are stacked and controls the mineralization,mineralisation, behaving as frontal and lateral ramps and horses.
The greenstone belt lithologies are surrounded by Archaean tonalitic gneiss and granodiorites of TTG suite. The metamorphic sediments are primarily composed of quartz, chlorite, sericite, carbonaceous material and garnetiferous schists. The carbonates have been metamorphosed to ferroan dolomite marble with development of siderite and ankerite veining in the surrounding wallrock, usually associated with quartz veins. The basalts are relatively unaltered but do show pronounced stretching with elongation of pillow structures being evident.
The Crixás greenstone belt comprises a series of Archaean to Palaeoproterozoic metavulcanics, metasediments and basement granitoids stacked within a series of north to north-east transported thrust sheet. Thrusting (D1) was accompanied by significant F1 folding/foliation development and progressive alteration in a brittle-ductile regime. D1 thrusting was developed with irregular thrust ramp geometry, in part controlled by concealed early basin faults. The main Crixás orebodies are adjacent to a majornorth-northwest structural corridor, and up the main fault ramp/corner, to become dispersed to the east and north in zones of foreland thrust flats. Fluid alteration also diminished to the west away from the main fault corner. A series of concealed east-west tonorthwest-southeast basement block faults may have provided secondary fluid migration, and development of earlyanti-formal warps in the thrust sheets; these structures probably define thequasi-regular spacing of significant mineralisation within the belt. The D1 thrust stack was gently folded bynon-cylindrical folds. Gold mineralising fluids probably migrated during this event, with
similarsouth-south-west tonorth-north-east migration, and focusing on bedding slip during folding. Gold mineralisation became minor and dispersed to the north and east along the formal thrust flat zone. Concentrations of gold along the case of quartz vein may be due to the damming of fluids migrating upward along layering.
Brazil – Summary of metallurgical operations
105
| Córrego do Sítío | Córrego do Sítío | AngloGold Ashanti Mineração | Serra Grande | |||||||||||||||||
| Oxide | Sulphide | Cuiabá | Raposos | |||||||||||||||||
Capacity (000 tonnes/month) | 45 | 55 | 150 | 18 | 110 | |||||||||||||||
ORE RESERVES
The combined Proven and Probable Ore Reserve of the group amounted to 57.550.0 million ounces as at 31 December 2014.2016.
Ore Reserve estimates are reported in accordance with the requirements of the SEC’s Industry Guide 7. Accordingly, as of the date of reporting, all Ore Reserves are planned to be mined out under thelife-of-mine plans within the period of AngloGold Ashanti’s existing rights to mine, or within the renewal periods of AngloGold Ashanti’s rights to mine. In addition, as of the date of reporting, all Ore Reserves are covered by required mining permits. See “Item 4B.: Business overview – The regulatory environment enabling AngloGold Ashanti to mine”.permits or there is a high probability that these approvals will be secured.
AngloGold Ashanti has standard procedures for the estimation of Ore Reserve. These standard procedures are performed by experienced technical personnel at the mining operations and reviewed by regional and corporate competent persons.Competent Persons.
In the case of its underground mines, the procedure is as follows: Firstly, gold content and tonnage are estimated forin-situ mineralized mineralised material at a mining operation. This mineralized material is not necessarily economically viable over the full extent of the operation. Exclusions on the grounds of safety (for example, stability pillars and shaft pillars) are then also defined. Grade-tonnage curves specific for each of the deposits, in conjunction with parameters such as the cost structure; yield;structure, yield, mine call factor and gold price estimates are used to determine an optimal mining mix. This process facilitates the determination of the average grade to be mined by each operation. This grade is then applied to the grade-tonnage curves, which in turn facilitates the determination of thecut-off grade and Ore Reserve tonnage for the operation. A full mine design is carried out on the blocks of mineralizedmineralised material, excluding any large mining areas that do not meet thecut-off grade criterion. This mining plan is reviewed to ensure that it satisfies the economic criteria and practical limitations of access and timing. If the review process is positive then the mineralizedmineralised material (with dilution and discounts) included in the mining plan is declared and published as the Ore Reserve for that operation.
In the case ofopen-pit mines the procedure is as follows: revenue and costs are calculated for each mining block within a three-dimensional model of the ore body using estimated values for gold price, operating costs and metallurgical recoveries. An optimizationoptimisation process is then applied to determine the combination of blocks within the model that make a positive contribution under these estimations. Block selection is within a shell whose limits are defined by the planned slope angles of the pit. Within this process, acut-off grade is applied which determines the ore blocks to be treated and included in the Ore Reserve. These blocks are scheduled with consideration being given to practical mining constraints and limitations. Scheduled ore blocks that are classified as Proven or Probable constitute the Ore Reserve.
The gold price and exchange rate used for determining the 20142016 and 20132015 Ore Reserve are outlined in the following table.
| 2014 (3 year average) | 2014 (Business Plan) | 2013 (3 year average) |
Units | |||||||||||||
Ore Reserve Gold Price | 1,448 | 1,100 | 1,550 | US$ per ounce | ||||||||||||
| 2016 (3 year average) | 2016 (Ore Reserve) | 2015 (3 year average) |
Units | |||||||||||||
Ore Reserve Gold Price | 1,225 | 1,100 | 1,278 | US$ per ounce | ||||||||||||
As in prior years, theThe Ore Reserve determined from the planning process was then tested for economic viability at the three-year historical average gold price shown in the above table for determining the SEC compliant Ore Reserve. This did not result in any changes.The test indicates the vast majority of the SAMREC/JORC Ore Reserves are economically viable and meet the requirements of the SEC. Therefore the SEC and SAMREC/JORC Ore Reserve are all but identical except for TauTona, Kopanang and AGA Mineração where the three year average exchange rate caused small reductions. The resultant SEC compliant Proven and Probable Ore Reserve is shown in the following pages.
In Australia and South Africa, AngloGold Ashanti is legally required to publicly report Ore Reserve and Mineral Resource according to the Australasian Code for Reporting of Exploration Results, Mineral Resources and Ore Reserves (The JORC Code,
2012 edition) and the South African Code for Reporting of Exploration Results, Mineral Resources and Mineral Reserves (The SAMREC Code, 2007 edition and amended July 2009)2016 edition). The SEC’s Industry Guide 7 does not recognizerecognise Mineral Resources. Accordingly, AngloGold Ashanti does not report estimates of Mineral Resource in this annual report on Form20-F.
The AngloGold Ashanti Ore Reserve reduceddecreased from 67.9Moz51.7Moz in December 20132015 to 57.5Moz50.0Moz in December 2014.2016. This gross annual decrease of 10.5Moz1.7Moz includes depletion of 4.9Moz and the sale3.9Moz. The balance of Navachab 1.9Moz. The remaining reduction of 3.7Moz2.2Moz additions in Ore Reserve, results from changes in economic assumptions between 20132015 and 2014 which resulted in a reduction2016 of 3.0Moz to the Ore Reserve,0.2Moz, whilst exploration and modelling changes resulted in further additions of 2.3Moz. Other factors resulted in a decrease0.3Moz decrease. The Ore Reserve has been estimated using a gold price of a further 0.7Moz.US$1,100/oz (2015: US$1,100/oz).
106
The principal changes in AngloGold Ashanti’s Ore Reserves as at 31 December 2014,2016, compared with those published as at 31 December 20132015, are as follows:
| ORE RESERVE | Moz | |||||
| Ore Reserve as at 31 December | ||||||
| -3.9 | |||||
| ||||||
Additions | ||||||
| 1.1 | |||||
AGA Mineração | Ore Reserve variation due to change in costs and revenue factor as well as minor mining method and revised estimation techniques changes. | 0.6 | ||||
Siguiri | Mainly due to model changes. | 0.5 | ||||
Sunrise Dam | 0.4 | |||||
Other | Additions less than | 0.8 | ||||
Reductions | ||||||
| ||||||
| ||||||
| ||||||
| ||||||
Other | Reductions less than | -0.9 | ||||
Ore Reserve as at 31 December | ||||||
AngloGold Ashanti strives to actively create value by growing its major asset – the Ore Reserve. This drive is based on a well-defined brownfields and greenfields exploration programme, innovation in both geological modeling and mine planning and optimizationoptimisation of its asset portfolio.
The Ore Reserve estimates in this document include the Ore Reserve below the current infrastructure in the case of the underground mines. These include mines which are in production in South Africa, Ghana Democratic Republic of the Congo and Brazil.
By-products
Severalby-products are recovered as a result of the processingexploitation of gold Ore Reserve. TheseTheby-products include 122.58123.48 million pounds of uranium oxide from the South African operations, 0.350.46 million tons of sulphur from Brazil and 25.0618.2 million ounces of silver from Argentina.
External reviews of Mineral Resource and Ore Reserve Statement
During the course of 2014,2016, the following AngloGold Ashanti operations were subjectedsubject to an external reviewsreview in line with the policy that each operation /operation/ project will be reviewed by an independent third party on average once every three years:
Mineral Resource and Ore Reserve at MponengSouth African Surface Operations
Mineral Resource and Ore Reserve at Moab KhotsongAGA Mineração – Córrego do Sítio
Mineral Resource and Ore Reserve at IduapriemSadiola
Mineral ResourceThe external reviews were conducted by AMEC, Optiro and Ore Reserve at Sunrise Dam
Mineral Resource and Ore Reserve at Cerro Vanguardia
Mineral Resource and Ore Reserve at Serra Grande
Mineral Resource and Ore Reserve at Obuasi
107
Snowden respectively. The company has been informed that the external reviews identified no material shortcomings in the process by which AngloGold Ashanti’sof evaluation of the grade models were evaluated. The external reviews were conducted byand estimation of the following companies The Mineral Corporation (Mponeng and Moab Khotsong Mines), Coffey Mining (Iduapriem Mine), Snowden (Sunrise Dam Mine), Optiro (Cerro Vanguardia and Serra Grande Mines), AMEC (Obuasi Mineral Resource) and SRK (Obuasi – Mineral Resource and Ore Reserve).Reserve.
Competent Persons
The information in this report relating to the Ore ReservesReserve is based on information compiled by or under the supervision of the Competent Persons as defined in the JORC or SAMREC Codes. All Competent Persons are employed by AngloGold Ashanti, unless stated otherwise, and have sufficient experience relevant to the style of mineralisation and type of deposit under consideration and to the activity which they are undertaking. The Competent Persons consent to the inclusion of Ore Reserve information in this report, in the form and context in which it appears. Details of the Competent Persons per operation are given in the Mineral Resource and Ore Reserve Report 2016, which is available on the corporate website. The legal tenure of each operation and project has been verified to the satisfaction of the accountable Competent Person and all Ore Reserves have been confirmed to be covered by the required mining permits or there is a high probability that these permits will be issued.
During the pastOver more than a decade, the company has developed and implemented a rigorous system of internal and external reviews aimed at providing assurance in respect of Ore Reserve estimates were completed by suitably qualified Competent Persons from within AngloGold Ashanti. A documented chain of responsibility exists from the Competent Persons at the operations to the company’s Mineral Resource and Ore Reserve Steering Committee. Accordingly, the Chairman of the AngloGold Ashanti Mineral Resource and Ore Reserve Steering Committee, VA Chamberlain, MSc (Mining Engineering), BSc (Hons) (Geology), MGSSA, FAusIMM, assumes responsibility for the Mineral Resource and Ore Reserve processes for AngloGold Ashanti and is satisfied that the Competent Persons have fulfilled their responsibilities.
108
| ||||||||||||||||||||||||||||
| Ore Reserve: Imperial | At 31 December 2014 | |||||||||||||||||||||||||||
| Proven Ore Reserve(1)(2) | Probable Ore Reserve(1)(2) | Metallurgical | ||||||||||||||||||||||||||
| Gold | Gold | Recovery | ||||||||||||||||||||||||||
| Tons(5) | Grade Content (1) | Tons(5) | Grade Content (1) | Factor | ||||||||||||||||||||||||
| (million) | (oz/ton) | (Moz)) | (million) | (oz/ton) | (Moz) | percent | ||||||||||||||||||||||
| ||||||||||||||||||||||||||||
South Africa | ||||||||||||||||||||||||||||
Vaal River(6) | ||||||||||||||||||||||||||||
Great Noligwa(10) | 0.00 | 0.000 | 0.00 | 0.00 | 0.000 | 0.00 | 0.0 | |||||||||||||||||||||
Kopanang | 2.00 | 0.174 | 0.35 | 5.11 | 0.176 | 0.90 | 94.3 | |||||||||||||||||||||
Moab Khotsong(2) | 2.95 | 0.268 | 0.79 | 15.73 | 0.298 | 4.69 | 95.0-96.0 (4) | |||||||||||||||||||||
West Wits | ||||||||||||||||||||||||||||
Mponeng(2) | 2.39 | 0.252 | 0.60 | 44.02 | 0.280 | 12.33 | 97.7-98.1 (4) | |||||||||||||||||||||
TauTona | 0.51 | 0.261 | 0.13 | 4.59 | 0.233 | 1.07 | 96.9 | |||||||||||||||||||||
| ||||||||||||||||||||||||||||
Surface | ||||||||||||||||||||||||||||
Surface sources(6)(11) | 139.26 | 0.006 | 0.86 | 717.60 | 0.008 | 5.73 | 30.0-88.0 (4) | |||||||||||||||||||||
| ||||||||||||||||||||||||||||
Continental Africa | ||||||||||||||||||||||||||||
Democratic Republic of the Congo | ||||||||||||||||||||||||||||
Kibali (45 percent)(2)(3) | 2.66 | 0.051 | 0.14 | 38.46 | 0.125 | 4.80 | 84.5-88.9 (9) | |||||||||||||||||||||
| ||||||||||||||||||||||||||||
Ghana | ||||||||||||||||||||||||||||
Iduapriem | 11.23 | 0.034 | 0.38 | 27.10 | 0.049 | 1.32 | 92.0-95.0 (4) | |||||||||||||||||||||
Obuasi(2) | 8.07 | 0.147 | 1.19 | 18.97 | 0.216 | 4.10 | 41.0-87.0 (4) | |||||||||||||||||||||
| ||||||||||||||||||||||||||||
Guinea | ||||||||||||||||||||||||||||
Siguiri (85 percent)(3) | 27.59 | 0.018 | 0.49 | 77.24 | 0.023 | 1.75 | 88.0-93.1 (4) | |||||||||||||||||||||
| ||||||||||||||||||||||||||||
Mali | ||||||||||||||||||||||||||||
Morila (40 percent)(3) | 0.00 | 0.000 | 0.00 | 5.43 | 0.018 | 0.10 | 57.0-91.0 (4) | |||||||||||||||||||||
Sadiola (41 percent)(3) | 0.00 | 0.000 | 0.00 | 25.95 | 0.061 | 1.57 | 75.0-96.0 (4) | |||||||||||||||||||||
| ||||||||||||||||||||||||||||
Namibia | ||||||||||||||||||||||||||||
Navachab(12) | 0.00 | 0.000 | 0.00 | 0.00 | 0.000 | 0.00 | 0.0 | |||||||||||||||||||||
| ||||||||||||||||||||||||||||
Tanzania | ||||||||||||||||||||||||||||
Geita | 0.00 | 0.000 | 0.00 | 31.54 | 0.098 | 3.10 | 48.1-92.7 (4) | |||||||||||||||||||||
| ||||||||||||||||||||||||||||
Australasia | ||||||||||||||||||||||||||||
Australia | ||||||||||||||||||||||||||||
Sunrise Dam | 15.18 | 0.031 | 0.47 | 8.46 | 0.096 | 0.81 | 80.0-82.5 (4) | |||||||||||||||||||||
Tropicana (70 percent)(3) | 15.98 | 0.056 | 0.89 | 22.62 | 0.059 | 1.35 | 89.9 | |||||||||||||||||||||
| ||||||||||||||||||||||||||||
Americas | ||||||||||||||||||||||||||||
Argentina | ||||||||||||||||||||||||||||
Cerro Vanguardia (92.5 percent)(3)(7) | 10.75 | 0.035 | 0.37 | 6.63 | 0.139 | 0.92 | 61.3-95.0 (4) | |||||||||||||||||||||
| ||||||||||||||||||||||||||||
Brazil | ||||||||||||||||||||||||||||
AGA Mineraçáo(2)(8) | 4.90 | 0.147 | 0.72 | 6.89 | 0.158 | 1.09 | 85.0-93.3 (4) | |||||||||||||||||||||
Serra Grande(2) | 3.00 | 0.080 | 0.24 | 2.80 | 0.092 | 0.26 | 92.0-94.0 (4) | |||||||||||||||||||||
| ||||||||||||||||||||||||||||
United States of America | ||||||||||||||||||||||||||||
Cripple Creek & Victor | 118.73 | 0.023 | 2.72 | 64.01 | 0.019 | 1.24 | 53.0-83.2 (4) | |||||||||||||||||||||
| ||||||||||||||||||||||||||||
Total | 365.20 | 0.028 | 10.35 | 1,123.14 | 0.042 | 47.12 | ||||||||||||||||||||||
| ||||||||||||||||||||||||||||
| ||||||||||||||||||||||||||||
|
|
|
|
|
|
|
|
|
|
|
|
Rounding may result in computational differences.A detailed breakdown of Mineral Resource and Ore Reserve and backup detail is provided on the AngloGold Ashanti website (www.anglogoldashanti.com) andwww.aga-reports.com.
109
The 2014 Proven and Probable Ore Reserve includes Ore Reserve below infrastructure in the case of the following underground mines currently in production:
| Mine | Tons (millions) | Grade (ounces/ton) | Gold Content | |||||||
| (million ounces) | ||||||||||
Moab Khotsong | 11.74 | 0.285 | 3.34 | |||||||
Mponeng | 30.46 | 0.280 | 8.54 | |||||||
Kibali | 18.65 | 0.169 | 3.15 | |||||||
Obuasi | 1.75 | 0.631 | 1.11 | |||||||
AGA Mineração | 3.49 | 0.156 | 0.54 | |||||||
Serra Grande | 0.71 | 0.098 | 0.07 | |||||||
Total | 66.81 | 0.251 | 16.75 | |||||||
The Ore Reserve has been determined based on completed economic studies.
110
| ||||||||||||||||||||||||||||||||||||||||||||||||||||||||||||
| Ore Reserve: Imperial | At 31 December 2013 | At 31 December 2016 | ||||||||||||||||||||||||||||||||||||||||||||||||||||||||||
| Proven Ore Reserve(1)(2) | Probable Ore Reserve(1)(2) | Metallurgical | Proven Ore Reserve (1) (2) | Probable Ore Reserve (1) (2) | Metallurgical | Cut-off | ||||||||||||||||||||||||||||||||||||||||||||||||||||||
| Gold | Gold | Recovery | Tons(5) | Grade | Gold Content | Tons(5) | Grade | Gold Content | Recovery Factor | Grade (10) | ||||||||||||||||||||||||||||||||||||||||||||||||||
| Tons(5) | Grade Content (1) | Tons(5) | Grade Content (1) | Factor | (million) | (oz/ton) | (Moz) | (million) | (oz/ton) | (Moz) | percent | (oz/ton) | ||||||||||||||||||||||||||||||||||||||||||||||||
| (million) | (oz/ton) | (Moz) | (million) | (oz/ton) | (Moz) | percent |
| |||||||||||||||||||||||||||||||||||||||||||||||||||||
| ||||||||||||||||||||||||||||||||||||||||||||||||||||||||||||
South Africa | ||||||||||||||||||||||||||||||||||||||||||||||||||||||||||||
Vaal River(6) | ||||||||||||||||||||||||||||||||||||||||||||||||||||||||||||
Great Noligwa | 1.64 | 0.242 | 0.40 | 0.38 | 0.214 | 0.08 | 94.5 | |||||||||||||||||||||||||||||||||||||||||||||||||||||
Kopanang | 2.42 | 0.188 | 0.45 | 5.06 | 0.197 | 1.00 | 95.5 | 1.79 | 0.156 | 0.28 | 1.10 | 0.163 | 0.18 | 95.6-95.7 (4) | 0.278 | |||||||||||||||||||||||||||||||||||||||||||||
Moab Khotsong(2) | 1.37 | 0.331 | 0.45 | 19.62 | 0.289 | 5.67 | 95.1-96.0 (4) | 2.93 | 0.249 | 0.73 | 15.50 | 0.276 | 4.27 | 95.6-96.4 (4) | 0.119-0.170(4) | |||||||||||||||||||||||||||||||||||||||||||||
West Wits | ||||||||||||||||||||||||||||||||||||||||||||||||||||||||||||
Mponeng(2) | 3.08 | 0.255 | 0.79 | 46.98 | 0.293 | 13.78 | 97.9-98.4(4) | 1.34 | 0.278 | 0.37 | 41.47 | 0.292 | 12.11 | 97.4-98.0(4) | 0.122-0.208(4) | |||||||||||||||||||||||||||||||||||||||||||||
Savuka(10) | 0.00 | 0.00 | 0.00 | 0.00 | 0.000 | 0.00 | 0.00 | |||||||||||||||||||||||||||||||||||||||||||||||||||||
TauTona | 0.69 | 0.273 | 0.19 | 4.56 | 0.263 | 1.20 | 97.3 | 0.55 | 0.323 | 0.18 | 2.28 | 0.243 | 0.55 | 96.7-97.0(4) | 0.219-0.239(4) | |||||||||||||||||||||||||||||||||||||||||||||
|
|
| ||||||||||||||||||||||||||||||||||||||||||||||||||||||||||
Surface | ||||||||||||||||||||||||||||||||||||||||||||||||||||||||||||
Surface sources(6)(11) | 157.00 | 0.006 | 1.00 | 730.25 | 0.008 | 5.89 | 57.6-90(4) | |||||||||||||||||||||||||||||||||||||||||||||||||||||
Surface sources(6) (9) | 146.21 | 0.006 | 0.92 | 698.63 | 0.008 | 5.48 | 42.0-92.0(4) | 0.007-0.011(4) | ||||||||||||||||||||||||||||||||||||||||||||||||||||
|
|
| ||||||||||||||||||||||||||||||||||||||||||||||||||||||||||
Continental Africa | ||||||||||||||||||||||||||||||||||||||||||||||||||||||||||||
Democratic Republic of the Congo | ||||||||||||||||||||||||||||||||||||||||||||||||||||||||||||
Kibali (45 percent)(2)(3) | 2.67 | 0.069 | 0.18 | 41.04 | 0.121 | 4.98 | 94.5-88.9 (9) | |||||||||||||||||||||||||||||||||||||||||||||||||||||
Kibali (45 percent) (3) (11) | 2.13 | 0.055 | 0.12 | 32.98 | 0.122 | 4.01 | 84.5-88.9(4) | 0.044-0.070(4) | ||||||||||||||||||||||||||||||||||||||||||||||||||||
|
|
| ||||||||||||||||||||||||||||||||||||||||||||||||||||||||||
Ghana | ||||||||||||||||||||||||||||||||||||||||||||||||||||||||||||
Iduapriem | 15.04 | 0.032 | 0.47 | 30.40 | 0.049 | 1.50 | 95.0 | 3.21 | 0.022 | 0.07 | 46.69 | 0.038 | 1.77 | 92.0-96.0(4) | 0.015-0.026(4) | |||||||||||||||||||||||||||||||||||||||||||||
Obuasi(2) | 19.94 | 0.175 | 3.50 | 28.41 | 0.163 | 4.64 | 85.4 | 0.00 | 0.000 | 0.00 | 23.49 | 0.234 | 5.49 | 89.0 | 0.128-0.152(4) | |||||||||||||||||||||||||||||||||||||||||||||
|
|
| ||||||||||||||||||||||||||||||||||||||||||||||||||||||||||
Guinea | ||||||||||||||||||||||||||||||||||||||||||||||||||||||||||||
Siguiri (85 percent)(3) | 37.17 | 0.018 | 0.68 | 57.88 | 0.020 | 1.17 | 88.0-90.0 (4) | 28.11 | 0.019 | 0.53 | 76.07 | 0.025 | 1.92 | 88.0-93.0(4) | 0.015-0.022(4) | |||||||||||||||||||||||||||||||||||||||||||||
|
|
| ||||||||||||||||||||||||||||||||||||||||||||||||||||||||||
Mali | ||||||||||||||||||||||||||||||||||||||||||||||||||||||||||||
Morila (40 percent)(3) | 0.00 | 0.000 | 0.00 | 0.63 | 0.070 | 0.04 | 88.8-91.0 (4) | |||||||||||||||||||||||||||||||||||||||||||||||||||||
Morila (40 percent)(3) (11) | 0.00 | 0.000 | 0.00 | 6.81 | 0.016 | 0.11 | 57.0 | 0.014 | ||||||||||||||||||||||||||||||||||||||||||||||||||||
Sadiola (41 percent)(3) | 0.00 | 0.000 | 0.00 | 25.49 | 0.056 | 1.43 | 76.0-94.0 (4) | 0.01 | 0.069 | 0.00 | 34.85 | 0.052 | 1.80 | 75.0-94.0(4) | 0.013-0.023(4) | |||||||||||||||||||||||||||||||||||||||||||||
Yatela (40 percent)(3)(10) | 0.00 | 0.000 | 0.00 | 0.00 | 0.000 | 0.00 | 0.00 | |||||||||||||||||||||||||||||||||||||||||||||||||||||
| ||||||||||||||||||||||||||||||||||||||||||||||||||||||||||||
Namibia | ||||||||||||||||||||||||||||||||||||||||||||||||||||||||||||
Navachab* | 0.00 | 0.000 | 0.00 | 51.08 | 0.038 | 1.92 | 88.6 | |||||||||||||||||||||||||||||||||||||||||||||||||||||
|
|
| ||||||||||||||||||||||||||||||||||||||||||||||||||||||||||
Tanzania | ||||||||||||||||||||||||||||||||||||||||||||||||||||||||||||
Geita | 0.00 | 0.000 | 0.00 | 40.70 | 0.096 | 3.90 | 46.2-100.0 (4) | 0.00 | 0.000 | 0.00 | 18.09 | 0.109 | 1.97 | 89.3-92.7(4) | 0.028-0.131(4) | |||||||||||||||||||||||||||||||||||||||||||||
|
|
| ||||||||||||||||||||||||||||||||||||||||||||||||||||||||||
Australasia | ||||||||||||||||||||||||||||||||||||||||||||||||||||||||||||
Australia | ||||||||||||||||||||||||||||||||||||||||||||||||||||||||||||
Sunrise Dam | 16.47 | 0.032 | 0.54 | 6.83 | 0.094 | 0.64 | 85.5 | 12.87 | 0.029 | 0.37 | 11.64 | 0.083 | 0.97 | 80.9-85.0(4) | 0.018-0.036(4) | |||||||||||||||||||||||||||||||||||||||||||||
Tropicana (70 percent)(3) | 19.21 | 0.066 | 1.27 | 23.10 | 0.059 | 1.36 | 90.0 | 12.10 | 0.043 | 0.52 | 34.27 | 0.062 | 2.14 | 90.0 | 0.020 | |||||||||||||||||||||||||||||||||||||||||||||
|
|
| ||||||||||||||||||||||||||||||||||||||||||||||||||||||||||
Americas | ||||||||||||||||||||||||||||||||||||||||||||||||||||||||||||
Argentina | ||||||||||||||||||||||||||||||||||||||||||||||||||||||||||||
Cerro Vanguardia (92.5 percent)(3)(7) | 11.32 | 0.030 | 0.34 | 8.05 | 0.153 | 1.23 | 61.3-94.3 (4) | |||||||||||||||||||||||||||||||||||||||||||||||||||||
Cerro Vanguardia (92.5 percent)(3) (7) | 6.58 | 0.043 | 0.28 | 4.70 | 0.141 | 0.66 | 61.8-95.9(4) | 0.013-0.146(4) | ||||||||||||||||||||||||||||||||||||||||||||||||||||
|
|
| ||||||||||||||||||||||||||||||||||||||||||||||||||||||||||
Brazil | ||||||||||||||||||||||||||||||||||||||||||||||||||||||||||||
AGA Mineraçáo(2)(8) | 5.49 | 0.148 | 0.81 | 8.66 | 0.134 | 1.16 | 88.0-93.0 (4) | |||||||||||||||||||||||||||||||||||||||||||||||||||||
Serra Grande | 3.77 | 0.080 | 0.30 | 2.70 | 0.098 | 0.26 | 92.1 | |||||||||||||||||||||||||||||||||||||||||||||||||||||
| ||||||||||||||||||||||||||||||||||||||||||||||||||||||||||||
United States of America | ||||||||||||||||||||||||||||||||||||||||||||||||||||||||||||
Cripple Creek & Victor | 134.49 | 0.025 | 3.31 | 66.85 | 0.021 | 1.40 | 43.0-95.0 (4) | |||||||||||||||||||||||||||||||||||||||||||||||||||||
AGA Mineraçáo(2) (8) | 3.88 | 0.140 | 0.55 | 7.68 | 0.152 | 1.16 | 70.0-93.3(4) | 0.017-0.105(4) | ||||||||||||||||||||||||||||||||||||||||||||||||||||
Serra Grande(2) | 2.66 | 0.073 | 0.19 | 3.53 | 0.080 | 0.28 | 88.5-94.7(4) | 0.071 | ||||||||||||||||||||||||||||||||||||||||||||||||||||
|
|
| ||||||||||||||||||||||||||||||||||||||||||||||||||||||||||
Total | 431.77 | 0.034 | 14.68 | 1,198.70 | 0.044 | 53.26 | 224.36 | 0.023 | 5.12 | 1,059.73 | 0.042 | 44.87 | ||||||||||||||||||||||||||||||||||||||||||||||||
|
|
| ||||||||||||||||||||||||||||||||||||||||||||||||||||||||||
| (1) | Ore Reserve includes marginally economic and diluting materials delivered for treatment and allow for losses that may occur during mining. |
| (2) | Proven and/or Probable Ore Reserve includes Ore Reserve below infrastructure. See table that follows. |
| (3) | Ore Reserve attributable to AngloGold Ashanti’s percentage interest shown. |
| (4) | Recovery factor |
| (5) | Tons refers to a short ton, which is equivalent to 2000 pounds avoirdupois. |
| (6) | The Vaal Reef Ore Reserve includes 123.48 million pounds of Uranium oxideby-products; this cannot be accounted for by individual mine as Kopanang, Moab Khotsong and Surface sources in Vaal River feed to a combination of plants. |
| (7) | The Ore Reserve contains 18.24 million ounces of silver to be recovered as aby-product. |
| (8) | The Ore Reserve contains 0.46 million tons of sulphur to be recovered as aby-product. |
| (9) | Includes Mine Waste Solutions (MWS). |
| (10) | In-situcut-off grade. |
| (11) | Ore Reserve is estimated by Competent Persons employed by Randgold Resources Limited. |
Rounding may result in computational differences.
The 2016 Proven and Probable Ore Reserve includes Ore Reserve below infrastructure in the case of the following underground mines currently in production:
| Mine | Tons (millions) | Grade (ounces/ton) | Gold Content (million ounces) | |||
Moab Khotsong | 11.89 | 0.28 | 3.32 | |||
Mponeng | 30.35 | 0.28 | 8.56 | |||
Obuasi | 1.92 | 0.67 | 1.29 | |||
AGA Mineração | 1.97 | 0.18 | 0.35 | |||
Serra Grande | 1.18 | 0.09 | 0.10 | |||
Total | 47.31 | 0.29 | 13.63 |
The Ore Reserve has been determined based on completed economic studies.
South Africa Vaal River(6) Kopanang Moab Khotsong (2) (9) West Wits Mponeng(2) TauTona Surface Surface sources(6) (10) Continental Africa DemocraticRepublicof the Congo Kibali (45 percent)(2) (3) (12) Ghana Iduapriem Obuasi(2) Guinea Siguiri (85 percent)(3) Mali Morila (40 percent)(3) (12) Sadiola (41 percent)(3) Tanzania Geita Australasia Australia Sunrise Dam Tropicana (70 percent)(3) Americas Argentina Cerro Vanguardia (92.5 percent)(3) (7) Brazil AGA Mineraçáo(2) (8) Serra Grande(2) Total Ore Reserve: Imperial At 31 December 2015 Proven Ore Reserve (1) (2) Probable Ore Reserve (1) (2) Metallurgical Cut-off Tons(5) Grade Gold
Content Tons(5) Grade Gold
Content Recovery
Factor Grade (11) (million) (oz/ton) (Moz) (million) (oz/ton) (Moz) percent (oz/ton) 1.90 0.187 0.35 2.01 0.200 0.40 95.3-95.5 (4) 0.278 2.82 0.238 0.67 15.79 0.291 4.59 96.0-96.3 (4) 0.120-0.177(4) 1.89 0.233 0.44 42.20 0.291 12.30 97.6-98.2(4) 0.122-0.208(4) 0.74 0.287 0.21 3.82 0.220 0.84 97.0-97.3(4) 0.228-0.232(4) 129.5 0.006 0.79 705.90 0.008 5.54 40.0-92.0 (4) 0.006-0.015(4) 2.01 0.053 0.11 37.61 0.124 4.66 84.5-88.9(4) 0.044-0.073(4) 3.68 0.023 0.09 54.28 0.040 2.18 94.5 0.024-0.027(4) 0.00 0.000 0.00 21.55 0.267 5.74 86.9 0.128-0.146(4) 29.99 0.018 0.53 66.43 0.023 1.56 88.0-93.0(4) 0.012-0.021(4) 0.00 0.000 0.00 6.82 0.016 0.11 57.0-91.0(4) 0.014-0.027(4) 0.00 0.000 0.00 27.90 0.060 1.69 75.0-96.0(4) 0.025-0.032(4) 0.00 0.000 0.00 26.71 0.097 2.60 89.3-92.7(4) 0.029-0.048(4) 14.12 0.030 0.43 9.64 0.086 0.82 80.6 0.032 14.48 0.049 0.71 19.50 0.058 1.13 90.3 0.015-0.020(4) 8.03 0.028 0.22 8.42 0.119 1.00 61.3-95.4(4) 0.014-0.131(4) 3.43 0.151 0.52 6.25 0.163 1.02 65.0-93.3(4) 0.020-0.132(4) 2.14 0.084 0.18 2.70 0.090 0.24 88.0-94.0 (4) 0.062 214.46 0.024 5.25 1,057.55 0.044 46.42
| (1) | Ore Reserve includes marginally economic and diluting materials delivered for treatment and allow for losses that may occur during mining. |
| (2) | Proven and/or Probable Ore Reserve includes Ore Reserve below infrastructure. See table that follows. |
| (3) | Ore Reserve attributable to AngloGold Ashanti’s percentage interest shown. |
| (4) | Recovery factor andcut-off grade vary according to ore type. |
| (5) | Tons refers to a short ton, which is equivalent to 2000 pounds avoirdupois. |
| (6) | The Vaal Reef Ore Reserve includes 118.38 million pounds of Uranium oxideby-products; this cannot be accounted for by individual mine as Kopanang, Moab Khotsong and Surface sources in Vaal River feed to a combination of plants. |
| (7) | The Ore Reserve contains 26.01 million ounces of silver to be recovered as aby-product. |
| (8) | The Ore Reserve contains 0.32 million tons of sulphur to be recovered as aby-product. |
| (9) | Great Noligwa is reported under Moab Khotsong. |
| (10) | Includes Mine Waste Solutions (MWS). |
| (11) | In-situcut-off grade. |
| (12) | Ore Reserve is estimated by Competent Persons employed by Randgold Resources Limited. |
Rounding may result in computational differences.
The 2015 Proven and Probable Ore Reserve includes Ore Reserve below infrastructure in the case of the following underground mines currently in production:
| Mine | Tons (millions) | Grade (ounces/ton) | Gold Content (million ounces) | |||
Moab Khotsong | 11.29 | 0.28 | 3.21 | |||
Mponeng | 29.63 | 0.29 | 8.56 | |||
Kibali | 16.19 | 0.17 | 2.73 | |||
Obuasi | 2.49 | 0.63 | 1.57 | |||
AGA Mineração | 1.79 | 0.16 | 0.29 | |||
Serra Grande | 0.78 | 0.12 | 0.09 | |||
Total | 62.18 | 0.26 | 16.45 |
The Ore Reserve has been determined based on completed economic studies.
South Africa Vaal River(5) Kopanang Moab Khotsong (2) West Wits Mponeng(2) TauTona Surface Surface sources(5) (9) Continental Africa DemocraticRepublic of the Congo Kibali (45 percent) (3) (11) Ghana Iduapriem Obuasi(2) Guinea Siguiri (85 percent)(3) Mali Morila (40 percent)(3) (11) Sadiola (41 percent)(3) Tanzania Geita Australasia Australia Sunrise Dam Tropicana (70 percent)(3) Americas Argentina Cerro Vanguardia (92.5 percent)(3) (7) Brazil AGA Mineraçáo(2) (8) Serra Grande(2) Total Ore Reserve: Metric At 31 December 2016 Proven Ore Reserve (1) (2) Probable Ore Reserve (1) (2) Metallurgical Cut-off Tonnes(6) Grade Gold
Content Tonnes (6) Grade Gold
Content Recovery
Factor Grade(10) (million) (g/t) (tonnes) (million) (g/t) (tonnes) percent (g/t) 1.62 5.36 8.70 1.00 5.57 5.55 95.6-95.7 (4) 9.52 2.66 8.55 22.73 14.06 9.45 132.81 95.6-96.4 (4) 4.07-5.83(4) 1.21 9.54 11.57 37.62 10.01 376.64 97.4-98.0(4) 4.17-7.14(4) 0.50 11.07 5.57 2.06 8.32 17.17 96.7-97.0(4) 7.50-8.18(4) 132.64 0.22 28.58 633.79 0.27 170.42 42.0-92.0(4) 0.24-0.38(4) 1.94 1.90 3.67 29.92 4.17 124.73 84.5-88.9(4) 1.52-2.40(4) 2.91 0.76 2.20 42.34 1.30 55.11 92.0-96.0(4) 0.50-0.90(4) 0.00 0.00 0.00 21.31 8.01 170.74 89.0 4.40-5.20(4) 25.50 0.64 16.42 69.01 0.86 59.57 88.0-93.0(4) 0.53-0.75(4) 0.00 0.00 0.00 6.81 0.55 3.37 57.0 0.47 0.01 2.37 0.02 31.62 1.77 55.90 75.0-94.0(4) 0.45-0.80(4) 0.00 0.00 0.00 16.41 3.73 61.17 89.3-92.7(4) 0.95-4.50(4) 11.67 1.00 11.65 10.56 2.86 30.15 80.9-85.0(4) 0.60-1.23(4) 10.98 1.48 16.22 31.09 2.14 66.48 90.0 0.70 5.97 1.47 8.78 4.26 4.85 20.65 61.8-95.9(4) 0.46-5.00(4) 3.52 4.81 16.96 6.97 5.20 36.21 70.0-93.3(4) 0.58-3.61(4) 2.41 2.51 6.05 3.20 2.75 8.81 88.5-94.7(4) 2.45 203.54 0.78 159.11 961.37 1.45 1,395.49
| (1) | Ore Reserve includes marginally economic and diluting materials delivered for treatment and allow for losses that may occur during mining. |
| (2) | Proven and/or Probable Ore Reserve includes Ore Reserve below infrastructure. See table that follows. |
| (3) | Ore Reserve attributable to AngloGold Ashanti’s percentage interest shown. |
| (4) | Recovery factor andcut-off grade vary according to ore type. |
| (5) | The Vaal Reef Ore Reserve includes |
Tonnes refers to a metric tonne which is equivalent to 1000 kilograms. |
| (7) | The Ore Reserve contains |
| (8) | The Ore Reserve contains 0.42 million |
| (9) |
|
|
Includes Mine Waste Solutions (MWS). |
In-situcut-off grade. Ore Reserve is estimated by Competent Persons employed by Randgold Resources Limited. Rounding may result in computational differences.* On 10 February 2014, AngloGold Ashanti announced that it had signed a binding agreement to sell Navachab subject to certain conditions.(10) (11)
111
The 20132016 Proven and Probable Ore Reserve includes Ore Reserve below infrastructure in the case of the following underground mines currently in production:
| Mine | Tons (millions) | Grade (ounces/ton) | Gold Content (million ounces) | Tonnes (millions) | Grade (grams/tonne) | Gold Content (tonnes) | ||||||
Moab Khotsong | 15.46 | 0.268 | 4.14 | 10.79 | 9.59 | 103.41 | ||||||
Mponeng | 25.69 | 0.354 | 9.09 | 27.53 | 9.67 | 266.21 | ||||||
Kibali | 21.70 | 0.165 | 3.58 | |||||||||
Obuasi | 3.30 | 0.382 | 1.26 | 1.74 | 23.11 | 40.26 | ||||||
AGA Mineração | 3.99 | 0.134 | 0.53 | 1.79 | 6.03 | 10.79 | ||||||
Serra Grande | 1.07 | 3.03 | 3.24 | |||||||||
Total | 70.14 | 0.265 | 18.60 | 42.92 | 9.88 | 423.90 | ||||||
The Ore Reserve has been determined based on completed economic studies.
112
| ||||||||||||||||||||||||||||||||||||||||||||||||||||||||||||
| Ore Reserve: Metric | At 31 December 2014 | At 31 December 2015 | ||||||||||||||||||||||||||||||||||||||||||||||||||||||||||
| Proven Ore Reserve(1)(2) | Probable Ore Reserve(1)(2) | Metallurgical | Proven Ore Reserve (1) (2) | Probable Ore Reserve (1) (2) | Metallurgical | Cut-off | ||||||||||||||||||||||||||||||||||||||||||||||||||||||
Tonnes(6) (million) | Grade (g/t) | Gold | Tonnes(6) (million) | Grade (g/t) | Gold | Recovery | Tonnes(6) | Grade | Gold Content | Tonnes (6) | Grade | Gold Content | Recovery Factor | Grade (11) | ||||||||||||||||||||||||||||||||||||||||||||||
| Content | Content | factor | (million) | (g/t) | (tonnes) | (million) | (g/t) | (tonnes) | percent | (g/t) | ||||||||||||||||||||||||||||||||||||||||||||||||||
| (tonnes) | (tonnes) | percent |
| |||||||||||||||||||||||||||||||||||||||||||||||||||||||||
| ||||||||||||||||||||||||||||||||||||||||||||||||||||||||||||
South Africa | ||||||||||||||||||||||||||||||||||||||||||||||||||||||||||||
Vaal River(5) | ||||||||||||||||||||||||||||||||||||||||||||||||||||||||||||
Great Noligwa(10) | 0.00 | 0.00 | 0.00 | 0.00 | 0.00 | 0.00 | 0.0 | |||||||||||||||||||||||||||||||||||||||||||||||||||||
Kopanang | 1.81 | 5.98 | 10.83 | 4.64 | 6.04 | 28.00 | 94.3 | 1.72 | 6.40 | 11.02 | 1.83 | 6.86 | 12.52 | 95.3-95.5 (4) | 9.52 | |||||||||||||||||||||||||||||||||||||||||||||
Moab Khotsong | 2.68 | 9.20 | 24.61 | 14.27 | 10.23 | 145.89 | 95.0-96.0 (4) | 2.56 | 8.17 | 20.90 | 14.32 | 9.96 | 142.67 | 96.0-96.3 (4) | 4.12–6.08(4) | |||||||||||||||||||||||||||||||||||||||||||||
West Wits | ||||||||||||||||||||||||||||||||||||||||||||||||||||||||||||
Mponeng(2) | 2.16 | 8.64 | 18.71 | 39.94 | 9.60 | 383.43 | 97.7-98.1 (4) | 1.71 | 7.98 | 13.66 | 38.29 | 9.99 | 382.53 | 97.6-98.2 | (4) | 4.17–7.14 | (4) | |||||||||||||||||||||||||||||||||||||||||||
TauTona | 0.47 | 8.93 | 4.16 | 4.16 | 7.99 | 33.26 | 96.9 | 0.67 | 9.83 | 6.56 | 3.47 | 7.54 | 26.16 | 97.0-97.3(4) | 7.83–7.96(4) | |||||||||||||||||||||||||||||||||||||||||||||
|
|
| ||||||||||||||||||||||||||||||||||||||||||||||||||||||||||
Surface | ||||||||||||||||||||||||||||||||||||||||||||||||||||||||||||
Surface sources(5)(11) | 126.33 | 0.21 | 26.89 | 651.00 | 0.27 | 178.13 | 30.0-88.0 (4) | |||||||||||||||||||||||||||||||||||||||||||||||||||||
Surface sources(5)(10) | 117.25 | 0.21 | 24.70 | 640.39 | 0.27 | 172.20 | 40.0-92.0 (4) | 0.21–0.51(4) | ||||||||||||||||||||||||||||||||||||||||||||||||||||
|
|
| ||||||||||||||||||||||||||||||||||||||||||||||||||||||||||
Continental Africa | ||||||||||||||||||||||||||||||||||||||||||||||||||||||||||||
Democratic Republic of the Congo | ||||||||||||||||||||||||||||||||||||||||||||||||||||||||||||
Kibali (45 percent)(2)(3) | 2.41 | 1.76 | 4.25 | 34.89 | 4.28 | 149.44 | 84.5-88.9 (9) | |||||||||||||||||||||||||||||||||||||||||||||||||||||
Kibali (45 percent)(2)(3)(12) | 1.82 | 1.83 | 3.34 | 34.12 | 4.25 | 145.07 | 84.5-88.9(4) | 1.52–2.50(4) | ||||||||||||||||||||||||||||||||||||||||||||||||||||
|
|
| ||||||||||||||||||||||||||||||||||||||||||||||||||||||||||
Ghana | ||||||||||||||||||||||||||||||||||||||||||||||||||||||||||||
Iduapriem | 10.19 | 1.15 | 11.74 | 24.58 | 1.67 | 41.11 | 92.0-95.0 (4) | 3.34 | 0.79 | 2.65 | 49.24 | 1.38 | 67.81 | 94.5 | 0.83–0.92(4) | |||||||||||||||||||||||||||||||||||||||||||||
Obuasi(2) | 7.32 | 5.05 | 36.7 | 17.21 | 7.40 | 127.45 | 41.0-87.0 (4) | 0.00 | 0.00 | 0.00 | 19.55 | 9.14 | 178.65 | 86.9 | 4.40–5.00(4) | |||||||||||||||||||||||||||||||||||||||||||||
|
|
| ||||||||||||||||||||||||||||||||||||||||||||||||||||||||||
Guinea | ||||||||||||||||||||||||||||||||||||||||||||||||||||||||||||
Siguiri (85 percent)(3) | 25.03 | 0.61 | 15.16 | 70.07 | 0.77 | 54.29 | 88.0-93.1 (4) | 27.20 | 0.61 | 16.53 | 60.27 | 0.80 | 48.50 | 88.0-93.0(4) | 0.42–0.72(4) | |||||||||||||||||||||||||||||||||||||||||||||
|
|
| ||||||||||||||||||||||||||||||||||||||||||||||||||||||||||
Mali | ||||||||||||||||||||||||||||||||||||||||||||||||||||||||||||
Morila (40 percent)(3) | 0.00 | 0.00 | 0.00 | 4.92 | 0.63 | 3.11 | 57.0-91.0 (4) | |||||||||||||||||||||||||||||||||||||||||||||||||||||
Morila (40 percent)(3)(12) | 0.00 | 0.00 | 0.00 | 6.19 | 0.56 | 3.45 | 57.0-91.0(4) | 0.49-0.92(4) | ||||||||||||||||||||||||||||||||||||||||||||||||||||
Sadiola (41 percent)(3) | 0.00 | 0.00 | 0.00 | 23.55 | 2.08 | 48.98 | 75.0-96.0 (4) | 0.00 | 0.00 | 0.00 | 25.31 | 2.07 | 52.44 | 75.0-96.0(4) | 0.85–1.10(4) | |||||||||||||||||||||||||||||||||||||||||||||
| ||||||||||||||||||||||||||||||||||||||||||||||||||||||||||||
Namibia | ||||||||||||||||||||||||||||||||||||||||||||||||||||||||||||
Navachab(12) | 0.00 | 0.00 | 0.00 | 0.00 | 0.00 | 0.00 | 0.0 | |||||||||||||||||||||||||||||||||||||||||||||||||||||
|
|
| ||||||||||||||||||||||||||||||||||||||||||||||||||||||||||
Tanzania | ||||||||||||||||||||||||||||||||||||||||||||||||||||||||||||
Geita | 0.00 | 0.00 | 0.00 | 28.61 | 3.37 | 96.29 | 48.1-92.7 (4) | 0.00 | 0.00 | 0.00 | 24.23 | 3.33 | 80.74 | 89.3-92.7(4) | 1.00–1.63(4) | |||||||||||||||||||||||||||||||||||||||||||||
|
|
| ||||||||||||||||||||||||||||||||||||||||||||||||||||||||||
Australasia | ||||||||||||||||||||||||||||||||||||||||||||||||||||||||||||
Australia | ||||||||||||||||||||||||||||||||||||||||||||||||||||||||||||
Sunrise Dam | 13.77 | 1.07 | 14.77 | 7.68 | 3.29 | 25.24 | 80.0-82.5 (4) | 12.81 | 1.04 | 13.29 | 8.74 | 2.93 | 25.63 | 80.6 | 1.11 | |||||||||||||||||||||||||||||||||||||||||||||
Tropicana (70 percent)(3) | 14.50 | 1.92 | 27.79 | 20.52 | 2.04 | 41.85 | 89.9 | 13.14 | 1.67 | 21.98 | 17.69 | 1.98 | 35.06 | 90.3 | 0.50–0.70(4) | |||||||||||||||||||||||||||||||||||||||||||||
|
|
| ||||||||||||||||||||||||||||||||||||||||||||||||||||||||||
Americas | ||||||||||||||||||||||||||||||||||||||||||||||||||||||||||||
Argentina | ||||||||||||||||||||||||||||||||||||||||||||||||||||||||||||
Cerro Vanguardia (92.5 percent)(3)(7) | 9.76 | 1.18 | 11.55 | 6.01 | 4.78 | 28.73 | 61.3-95.0 (4) | 7.29 | 0.95 | 6.94 | 7.64 | 4.08 | 31.13 | 61.3-95.4(4) | 0.47–4.50(4) | |||||||||||||||||||||||||||||||||||||||||||||
|
|
| ||||||||||||||||||||||||||||||||||||||||||||||||||||||||||
Brazil | ||||||||||||||||||||||||||||||||||||||||||||||||||||||||||||
AGA Mineraçáo(2)(8) | 4.45 | 5.05 | 22.48 | 6.25 | 5.42 | 33.86 | 85.0-93.3 (4) | 3.11 | 5.17 | 16.07 | 5.67 | 5.59 | 31.67 | 65.0-93.3(4) | 0.70–4.53(4) | |||||||||||||||||||||||||||||||||||||||||||||
Serra Grande(2) | 2.72 | 2.75 | 7.47 | 2.54 | 3.15 | 8.00 | 92.0-94.0 (4) | 1.94 | 2.88 | 5.59 | 2.45 | 3.10 | 7.60 | 88.0-94.0 (4) | 2.11 | |||||||||||||||||||||||||||||||||||||||||||||
|
|
| ||||||||||||||||||||||||||||||||||||||||||||||||||||||||||
United States of America | ||||||||||||||||||||||||||||||||||||||||||||||||||||||||||||
Cripple Creek & Victor | 107.71 | 0.79 | 84.64 | 58.07 | 0.66 | 38.44 | 53.0-83.2 (4) | |||||||||||||||||||||||||||||||||||||||||||||||||||||
| ||||||||||||||||||||||||||||||||||||||||||||||||||||||||||||
Total | 331.30 | 0.97 | 322.03 | 1,018.90 | 1.44 | 1,465.51 | 194.56 | 0.84 | 163.24 | 959.40 | 1.50 | 1,443.83 | ||||||||||||||||||||||||||||||||||||||||||||||||
|
|
| ||||||||||||||||||||||||||||||||||||||||||||||||||||||||||
| (1) | Ore Reserve includes marginally economic and diluting materials delivered for treatment and allow for losses that may occur during mining. |
| (2) | Proven and/or Probable Ore Reserve includes Ore Reserve below infrastructure. See table that follows. |
| (3) | Ore Reserve attributable to AngloGold Ashanti’s percentage interest shown. |
| (4) | Recovery factor |
| (5) | The Vaal Reef Ore Reserve includes |
| (6) | Tonnes refers to a metric tonne which is equivalent to 1000 kilograms. |
| (7) | The Ore Reserve contains |
| (8) | The Ore Reserve contains |
| (9) |
|
|
Includes Mine Waste Solutions (MWS). |
| (11) | In-situcut-off grade. |
Ore Reserve is estimated by Competent Persons employed by Randgold Resources Limited. |
Rounding may result in computational differences.
113
The 20142015 Proven and Probable Ore Reserve includes Ore Reserve below infrastructure in the case of the following underground mines currently in production:
| Mine | Tonnes (millions) | Grade (grams/tonne) | Gold Content (tonnes) | |||
Moab Khotsong | 10.65 | 9.76 | 103.91 | |||
Mponeng | 27.63 | 9.61 | 265.57 | |||
Kibali | 16.92 | 5.79 | 97.98 | |||
Obuasi | 1.59 | 21.65 | 34.43 | |||
AGA Mineração | 3.17 | 5.34 | 16.91 | |||
Serra Grande | 0.65 | 3.37 | 2.17 | |||
Total | 60.61 | 8.60 | 520.96 |
114
| Ore Reserve: Metric | At 31 December 2013 | |||||||||||||||||||||||||||
| Proven Ore Reserve(1)(2) | Probable Ore Reserve(1)(2) | Metallurgical | ||||||||||||||||||||||||||
Tonnes(6) (million) | Grade (g/t) | Gold | Tonnes(6) (million) | Grade (g/t) | Gold | Recovery | ||||||||||||||||||||||
| Content | Content | factor | ||||||||||||||||||||||||||
| (tonnes) | (tonnes) | percent | ||||||||||||||||||||||||||
| ||||||||||||||||||||||||||||
South Africa | ||||||||||||||||||||||||||||
Vaal River(5) | ||||||||||||||||||||||||||||
Great Noligwa | 1.48 | 8.31 | 12.33 | 0.35 | 7.35 | 2.56 | 94.5 | |||||||||||||||||||||
Kopanang | 2.19 | 6.46 | 14.15 | 4.59 | 6.77 | 31.09 | 95.5 | |||||||||||||||||||||
Moab Khotsong(2) | 1.24 | 11.34 | 14.11 | 17.79 | 9.91 | 176.29 | 95.1-96.0 (4) | |||||||||||||||||||||
| ||||||||||||||||||||||||||||
West Wits | ||||||||||||||||||||||||||||
Mponeng(2) | 2.80 | 8.73 | 24.44 | 42.62 | 10.06 | 428.63 | 97.9-98.4 (4) | |||||||||||||||||||||
Savuka(10) | 0.00 | 0.00 | 0.00 | 0.00 | 0.00 | 0.00 | 0.00 | |||||||||||||||||||||
TauTona | 0.62 | 9.36 | 5.85 | 4.14 | 9.02 | 37.33 | 97.3 | |||||||||||||||||||||
| ||||||||||||||||||||||||||||
Surface | ||||||||||||||||||||||||||||
Surface sources(5)(11) | 142.43 | 0.22 | 31.18 | 662.48 | 0.28 | 183.18 | 57.6-90(4) | |||||||||||||||||||||
| ||||||||||||||||||||||||||||
Continental Africa | ||||||||||||||||||||||||||||
Democratic Republic of the Congo | ||||||||||||||||||||||||||||
Kibali (45 percent)(2)(3) | 2.43 | 2.36 | 5.71 | 37.23 | 4.16 | 154.98 | 94.5-88.9 (9) | |||||||||||||||||||||
| ||||||||||||||||||||||||||||
Ghana | ||||||||||||||||||||||||||||
Iduapriem | 13.64 | 1.08 | 14.75 | 27.58 | 1.69 | 46.54 | 95.0 | |||||||||||||||||||||
Obuasi(2) | 18.09 | 6.02 | 108.87 | 25.77 | 5.60 | 144.36 | 85.4 | |||||||||||||||||||||
| ||||||||||||||||||||||||||||
Guinea | ||||||||||||||||||||||||||||
Siguiri (85 percent)(3) | 33.72 | 0.62 | 21.03 | 52.51 | 0.69 | 36.26 | 88.0-90.0 (4) | |||||||||||||||||||||
| ||||||||||||||||||||||||||||
Mali | ||||||||||||||||||||||||||||
Morila (40 percent)(3) | 0.00 | 0.00 | 0.00 | 0.57 | 2.40 | 1.38 | 88.8-91.0 (4) | |||||||||||||||||||||
Sadiola (41 percent)(3) | 0.00 | 0.00 | 0.00 | 23.13 | 1.93 | 44.53 | 76.0-94.0 (4) | |||||||||||||||||||||
Yatela (40 percent)(3)(10) | 0.00 | 0.00 | 0.00 | 0.00 | 0.00 | 0.00 | 0.00 | |||||||||||||||||||||
| ||||||||||||||||||||||||||||
Namibia | ||||||||||||||||||||||||||||
Navachab* | 0.00 | 0.00 | 0.00 | 46.34 | 1.29 | 59.65 | 88.6 | |||||||||||||||||||||
| ||||||||||||||||||||||||||||
Tanzania | ||||||||||||||||||||||||||||
Geita | 0.00 | 0.00 | 0.00 | 36.92 | 3.28 | 121.29 | 46.2-100.0 (4) | |||||||||||||||||||||
| ||||||||||||||||||||||||||||
Australasia | ||||||||||||||||||||||||||||
Australia | ||||||||||||||||||||||||||||
Sunrise Dam | 14.94 | 1.11 | 16.65 | 6.20 | 3.22 | 19.97 | 85.5 | |||||||||||||||||||||
Tropicana (70 percent)(3) | 17.43 | 2.26 | �� | 39.43 | 20.96 | 2.02 | 42.36 | 90.0 | ||||||||||||||||||||
| ||||||||||||||||||||||||||||
Americas | ||||||||||||||||||||||||||||
Argentina | ||||||||||||||||||||||||||||
Cerro Vanguardia (92.5 percent)(3)(7) | 10.27 | 1.04 | 10.63 | 7.30 | 5.23 | 38.20 | 61.3-94.3 (4) | |||||||||||||||||||||
| ||||||||||||||||||||||||||||
Brazil | ||||||||||||||||||||||||||||
AGA Mineraçáo(2)(8) | 4.98 | 5.08 | 25.33 | 7.85 | 4.58 | 35.97 | 88.0-93.0 (4) | |||||||||||||||||||||
Serra Grande | 3.42 | 2.74 | 9.38 | 2.45 | 3.35 | 8.22 | 92.1 | |||||||||||||||||||||
| ||||||||||||||||||||||||||||
United States of America | ||||||||||||||||||||||||||||
Cripple Creek & Victor | 122.01 | 0.84 | 102.83 | 60.65 | 0.72 | 43.67 | 43.0-95.0 (4) | |||||||||||||||||||||
| ||||||||||||||||||||||||||||
Total | 391.70 | 1.17 | 456.65 | 1,087.44 | 1.52 | 1,656.45 | ||||||||||||||||||||||
| ||||||||||||||||||||||||||||
|
|
|
|
|
|
|
|
|
|
|
| Mine | Tonnes (millions) | Grade (grams/tonne) | Gold Content (tonnes) | |||
Moab Khotsong | 10.24 | 9.75 | 99.89 | |||
Mponeng | 26.88 | 9.90 | 266.21 | |||
Kibali | 14.69 | 5.77 | 84.76 | |||
Obuasi | 2.26 | 21.57 | 48.72 | |||
AGA Mineração | 1.63 | 5.61 | 9.13 | |||
Serra Grande | 0.71 | 4.00 | 2.84 | |||
Total | 56.41 | 9.07 | 511.55 |
* On 10 February 2014, AngloGold Ashanti announced that it had signed a binding agreement to sell Navachab subject to certain conditions.
Rounding may result in computational differences.The Ore Reserve has been determined based on completed economic studies.
115
The 2013 Proven and Probable Ore Reserve includes Ore Reserve below infrastructure in the case of the following underground mines currently in production:
| Mine | Tonnes (millions) | Grade (grams/tonne) | Gold Content (tonnes) | |||
Moab Khotsong | 14.03 | 9.18 | 128.75 | |||
Mponeng | 23.31 | 12.13 | 282.63 | |||
Kibali | 19.69 | 5.66 | 111.33 | |||
Obuasi | 2.99 | 13.11 | 39.23 | |||
AGA Mineração | 3.62 | 4.58 | 16.57 | |||
Total | 63.63 | 9.09 | 578.52 |
116
Stockpiles: Imperial
Stockpiles are previously mined ore scheduled for future process plant feed. The Proven and Probable Ore Reserve includes the following stockpile material:
|
|
| ||||||||||||||||||||||
| Stockpiles | At 31 December 2014 | At 31 December 2016 | ||||||||||||||||||||||
|
|
| ||||||||||||||||||||||
| Tons (million) | Grade (ounces/ton) | Gold content (million ounces) | Tons (million) | Grade (ounces/ton) | Gold content (million ounces) | |||||||||||||||||||
|
|
| ||||||||||||||||||||||
South Africa | ||||||||||||||||||||||||
Surface sources(2) | 856.86 | 0.008 | 6.59 | 844.84 | 0.008 | 6.40 | ||||||||||||||||||
|
|
| ||||||||||||||||||||||
Continental Africa | ||||||||||||||||||||||||
Ghana | ||||||||||||||||||||||||
Iduapriem | 4.30 | 0.025 | 0.11 | 12.83 | 0.021 | 0.27 | ||||||||||||||||||
Obuasi | 5.37 | 0.057 | 0.31 | |||||||||||||||||||||
|
|
| ||||||||||||||||||||||
Guinea | ||||||||||||||||||||||||
Siguiri (85 percent)(1)(3) | 62.81 | 0.017 | 1.04 | |||||||||||||||||||||
Siguiri (85 percent)(1) (3) | 63.33 | 0.017 | 1.08 | |||||||||||||||||||||
|
|
| ||||||||||||||||||||||
Mali | ||||||||||||||||||||||||
Morila (40 percent)(1) | 5.20 | 0.016 | 0.08 | 6.81 | 0.016 | 0.11 | ||||||||||||||||||
Sadiola (41 percent)(1) | 1.87 | 0.058 | 0.11 | 5.80 | 0.033 | 0.19 | ||||||||||||||||||
| ||||||||||||||||||||||||
Namibia | ||||||||||||||||||||||||
Navachab(4) | 0.00 | 0.000 | 0.00 | |||||||||||||||||||||
|
|
| ||||||||||||||||||||||
Tanzania | ||||||||||||||||||||||||
Geita | 7.13 | 0.034 | 0.24 | 4.35 | 0.039 | 0.17 | ||||||||||||||||||
|
|
| ||||||||||||||||||||||
Australasia | ||||||||||||||||||||||||
Australia | ||||||||||||||||||||||||
Sunrise Dam | 15.18 | 0.031 | 0.47 | 12.87 | 0.029 | 0.37 | ||||||||||||||||||
Tropicana (70 percent)(1) | 4.17 | 0.027 | 0.11 | 7.09 | 0.027 | 0.19 | ||||||||||||||||||
|
|
| ||||||||||||||||||||||
Americas | ||||||||||||||||||||||||
Argentina | ||||||||||||||||||||||||
Cerro Vanguardia (92.5 percent)(1) | 12.10 | 0.020 | 0.24 | 7.24 | 0.019 | 0.14 | ||||||||||||||||||
|
|
| ||||||||||||||||||||||
Brazil | ||||||||||||||||||||||||
Serra Grande | 0.32 | 0.052 | 0.02 | 0.07 | 0.058 | 0.00 | ||||||||||||||||||
|
|
| ||||||||||||||||||||||
United States of America | ||||||||||||||||||||||||
Cripple Creek & Victor | 1.33 | 0.036 | 0.05 | |||||||||||||||||||||
| ||||||||||||||||||||||||
| (1) | Ore Reserve attributable to AngloGold Ashanti’s percentage interest shown. |
| (2) | Centralised operations treating material on surface that was previously generated by several underground |
Spent heap included in Ore Reserve. |
|
Rounding may result in computational differences.
117
Stockpiles: Imperial
Stockpiles are previously mined ore scheduled for future process plant feed. The Proven and Probable Ore Reserve includes the following stockpile material:
|
|
| ||||||||||||||||||||||
| Stockpiles | At 31 December 2013 | At 31 December 2015 | ||||||||||||||||||||||
|
|
| ||||||||||||||||||||||
| Tons (million) | Grade (ounces/ton) | Gold content (million ounces) | Tons (million) | Grade (ounces/ton) | Gold content (million ounces) | |||||||||||||||||||
|
|
| ||||||||||||||||||||||
South Africa | ||||||||||||||||||||||||
Surface sources(2) | 887.26 | 0.008 | 6.89 | 835.15 | 0.008 | 6.33 | ||||||||||||||||||
|
|
| ||||||||||||||||||||||
Continental Africa | ||||||||||||||||||||||||
Ghana | ||||||||||||||||||||||||
Iduapriem | 7.81 | 0.025 | 0.19 | 13.30 | 0.021 | 0.28 | ||||||||||||||||||
Obuasi | 6.57 | 0.058 | 0.38 | |||||||||||||||||||||
|
|
| ||||||||||||||||||||||
Guinea | ||||||||||||||||||||||||
Siguiri (85 percent)(1)(3) | 65.75 | 0.016 | 1.08 | |||||||||||||||||||||
Siguiri (85 percent)(1) (3) | 65.21 | 0.017 | 1.09 | |||||||||||||||||||||
|
|
| ||||||||||||||||||||||
Mali | ||||||||||||||||||||||||
Morila (40 percent)(1) | 0.19 | 0.033 | 0.01 | 6.82 | 0.016 | 0.11 | ||||||||||||||||||
Sadiola (41 percent)(1) | 2.91 | 0.032 | 0.09 | 2.38 | 0.057 | 0.14 | ||||||||||||||||||
| ||||||||||||||||||||||||
Namibia | ||||||||||||||||||||||||
Navachab* | 14.62 | 0.021 | 0.31 | |||||||||||||||||||||
|
|
| ||||||||||||||||||||||
Tanzania | ||||||||||||||||||||||||
Geita | 11.55 | 0.036 | 0.41 | 7.41 | 0.033 | 0.24 | ||||||||||||||||||
|
|
| ||||||||||||||||||||||
Australasia | ||||||||||||||||||||||||
Australia | ||||||||||||||||||||||||
Sunrise Dam | 16.47 | 0.032 | 0.54 | 14.12 | 0.030 | 0.43 | ||||||||||||||||||
Tropicana (70 percent)(1) | 2.04 | 0.060 | 0.12 | 7.21 | 0.030 | 0.22 | ||||||||||||||||||
|
|
| ||||||||||||||||||||||
Americas | ||||||||||||||||||||||||
Argentina | ||||||||||||||||||||||||
Cerro Vanguardia (92.5 percent)(1) | 12.00 | 0.017 | 0.20 | 11.61 | 0.019 | 0.22 | ||||||||||||||||||
|
|
| ||||||||||||||||||||||
Brazil | ||||||||||||||||||||||||
Serra Grande | 0.20 | 0.048 | 0.01 | 0.14 | 0.052 | 0.01 | ||||||||||||||||||
|
|
| ||||||||||||||||||||||
United States of America | ||||||||||||||||||||||||
Cripple Creek & Victor | 0.71 | 0.032 | 0.02 | |||||||||||||||||||||
| ||||||||||||||||||||||||
| (1) | Ore Reserve attributable to AngloGold Ashanti’s percentage interest shown. |
| (2) | Centralised operations treating material on surface that was previously generated by several underground |
| (3) | Spent heap included in Ore Reserve. |
* On 10 February 2014, AngloGold Ashanti announced that it had signed a binding agreement to sell Navachab subject to certain conditions.
Rounding may result in computational differences.
118
Stockpiles: Metric
Stockpiles are previously mined ore scheduled for future process plant feed. The Proven and Probable Ore Reserve includes the following stockpile material:
|
|
| ||||||||||||||||||||||
| Stockpiles | At 31 December 2014 | At 31 December 2016 | ||||||||||||||||||||||
|
|
| ||||||||||||||||||||||
| Tonnes (million) | Grade (grams/tonne) | Gold content (tonnes) | Tonnes (million) | Grade (grams/tonne) | Gold content (tonnes) | |||||||||||||||||||
|
|
| ||||||||||||||||||||||
South Africa | ||||||||||||||||||||||||
Surface sources(2) | 777.33 | 0.26 | 205.02 | 766.42 | 0.26 | 199.00 | ||||||||||||||||||
|
|
| ||||||||||||||||||||||
Continental Africa | ||||||||||||||||||||||||
Ghana | ||||||||||||||||||||||||
Iduapriem | 3.90 | 0.87 | 3.40 | 11.64 | 0.72 | 8.37 | ||||||||||||||||||
Obuasi | 4.87 | 1.96 | 9.57 | |||||||||||||||||||||
|
|
| ||||||||||||||||||||||
Guinea | ||||||||||||||||||||||||
Siguiri (85 percent)(1)(3) | 56.98 | 0.57 | 32.45 | |||||||||||||||||||||
Siguiri (85 percent)(1) (3) | 57.45 | 0.59 | 33.71 | |||||||||||||||||||||
|
|
| ||||||||||||||||||||||
Mali | ||||||||||||||||||||||||
Morila (40 percent)(1) | 4.72 | 0.53 | 2.52 | 6.18 | 0.55 | 3.37 | ||||||||||||||||||
Sadiola (41 percent)(1) | 1.70 | 2.00 | 3.39 | 5.26 | 1.13 | 5.94 | ||||||||||||||||||
| ||||||||||||||||||||||||
Namibia | ||||||||||||||||||||||||
Navachab(4) | 0.00 | 0.00 | 0.00 | |||||||||||||||||||||
|
|
| ||||||||||||||||||||||
Tanzania | ||||||||||||||||||||||||
Geita | 6.47 | 1.16 | 7.52 | 3.95 | 1.35 | 5.33 | ||||||||||||||||||
|
|
| ||||||||||||||||||||||
Australasia | ||||||||||||||||||||||||
Australia | ||||||||||||||||||||||||
Sunrise Dam | 13.77 | 1.07 | 14.77 | 11.67 | 1.00 | 11.65 | ||||||||||||||||||
Tropicana (70 percent)(1) | 3.78 | 0.94 | 3.57 | 6.43 | 0.92 | 5.95 | ||||||||||||||||||
|
|
| ||||||||||||||||||||||
Americas | ||||||||||||||||||||||||
Argentina | ||||||||||||||||||||||||
Cerro Vanguardia (92.5 percent)(1) | 10.98 | 0.67 | 7.37 | 6.57 | 0.65 | 4.26 | ||||||||||||||||||
|
|
| ||||||||||||||||||||||
Brazil | ||||||||||||||||||||||||
Serra Grande | 0.29 | 1.79 | 0.52 | 0.06 | 2.00 | 0.12 | ||||||||||||||||||
|
|
| ||||||||||||||||||||||
United States of America | ||||||||||||||||||||||||
Cripple Creek & Victor | 1.20 | 1.22 | 1.47 | |||||||||||||||||||||
| ||||||||||||||||||||||||
| (1) | Ore Reserve attributable to AngloGold Ashanti’s percentage interest shown. |
Centralised operations treating material on surface that was previously generated by several underground |
| (3) | Spent heap included in Ore Reserve. |
|
Rounding may result in computational differences.
119
Stockpiles: Metric
Stockpiles are previously mined ore scheduled for future process plant feed. The Proven and Probable Ore Reserve includes the following stockpile material:
|
|
| ||||||||||||||||||||||
| Stockpiles | At 31 December 2013 | At 31 December 2015 | ||||||||||||||||||||||
|
|
| ||||||||||||||||||||||
| Tonnes (million) | Grade (grams/tonne) | Gold content (tonnes) | Tonnes (million) | Grade (grams/tonne) | Gold content (tonnes) | |||||||||||||||||||
|
|
| ||||||||||||||||||||||
South Africa | ||||||||||||||||||||||||
Surface sources(2) | 804.91 | 0.27 | 214.36 | 757.64 | 0.26 | 196.90 | ||||||||||||||||||
|
|
| ||||||||||||||||||||||
Continental Africa | ||||||||||||||||||||||||
Ghana | ||||||||||||||||||||||||
Iduapriem | 7.08 | 0.86 | 6.06 | 12.07 | 0.73 | 8.82 | ||||||||||||||||||
Obuasi | 5.96 | 1.99 | 11.86 | |||||||||||||||||||||
|
|
| ||||||||||||||||||||||
Guinea | ||||||||||||||||||||||||
Siguiri (85 percent)(1)(3) | 59.65 | 0.56 | 33.49 | |||||||||||||||||||||
Siguiri (85 percent)(1) (3) | 59.16 | 0.57 | 33.83 | |||||||||||||||||||||
|
|
| ||||||||||||||||||||||
Mali | ||||||||||||||||||||||||
Morila (40 percent)(1) | 0.17 | 1.14 | 0.20 | 6.19 | 0.56 | 3.45 | ||||||||||||||||||
Sadiola (41 percent)(1) | 2.64 | 1.11 | 2.92 | 2.16 | 1.96 | 4.22 | ||||||||||||||||||
| ||||||||||||||||||||||||
Namibia | ||||||||||||||||||||||||
Navachab* | 13.26 | 0.73 | 9.66 | |||||||||||||||||||||
|
|
| ||||||||||||||||||||||
Tanzania | ||||||||||||||||||||||||
Geita | 10.48 | 1.22 | 12.83 | 6.72 | 1.12 | 7.51 | ||||||||||||||||||
|
|
| ||||||||||||||||||||||
Australasia | ||||||||||||||||||||||||
Australia | ||||||||||||||||||||||||
Sunrise Dam | 14.94 | 1.11 | 16.65 | 12.81 | 1.04 | 13.29 | ||||||||||||||||||
Tropicana (70 percent)(1) | 1.85 | 2.04 | 3.79 | 6.54 | 1.03 | 6.71 | ||||||||||||||||||
|
|
| ||||||||||||||||||||||
Americas | ||||||||||||||||||||||||
Argentina | ||||||||||||||||||||||||
Cerro Vanguardia (92.5 percent)(1) | 10.89 | 0.58 | 6.27 | 10.53 | 0.65 | 6.84 | ||||||||||||||||||
|
|
| ||||||||||||||||||||||
Brazil | ||||||||||||||||||||||||
Serra Grande | 0.19 | 1.65 | 0.31 | 0.13 | 1.80 | 0.24 | ||||||||||||||||||
|
|
| ||||||||||||||||||||||
United States of America | ||||||||||||||||||||||||
Cripple Creek & Victor | 0.64 | 1.09 | 0.70 | |||||||||||||||||||||
| ||||||||||||||||||||||||
| (1) | Ore Reserve attributable to AngloGold Ashanti’s percentage interest shown. |
Centralised operations treating material on surface that was previously generated by several underground |
| (3) | Spent heap included in Ore Reserve. |
* On 10 February 2014, AngloGold Ashanti announced that it had signed a binding agreement to sell Navachab subject to certain conditions.
Rounding may result in computational differences.
120
Drill hole spacing: Imperial
In determining the Proven and Probable Ore Reserve, AngloGold Ashanti applied the following drill hole spacing:
| Drill Hole Spacing | ||||
| Proven Ore Reserve | Probable Ore Reserve | |||
South Africa | ||||
Underground sources | Ore body opened up, developed and sampled on a 7 to 10 foot spacing on raise lines and on a 16 x 16 foot grid thereafter
| From a 131 x 131 foot spacing up | ||
Surface sources | 164 x 164
| |||
Continental Africa | ||||
Democratic Republic of the Congo | ||||
Kibali | 16 x 33 feet, 49 x 66 feet | 131 x 131 feet | ||
Ghana | ||||
Iduapriem | 33 x 39 feet, 33 x 49 feet, 66 x 49 feet, 66 x 66 feet, 82 x 82 feet, 164 x 164
| 164 x 164 feet, 164 x 246 feet, 164 x 328 feet, 328 x 246 feet | ||
Obuasi | 33 x 33 feet, 66 x 66 feet, 131 x 66 feet, 164 x 164 feet | 98 x 98 feet, 164 x 164 feet, 197 x 197 feet | ||
Guinea | ||||
Siguiri | 16 x 33 feet, 16 x 39 feet, 33 x 33 feet | 66 x 131 feet, 82 x 82 feet, 164 x 82 feet | ||
Mali | ||||
Morila | 33 x 33 feet | 98 x 98 feet, 164 x 328 feet | ||
Sadiola | 16 x 33 feet, 20 x 43 feet, 82 x 82 feet | 82 x 82 feet, 164 x 82 feet | ||
Tanzania | ||||
Geita | 16 x 33 feet, 82 x 49 feet | 33 x 33 | ||
Australasia | ||||
Australia | ||||
Sunrise Dam |
|
| ||
Tropicana | 33 x 39 feet, 82 x 82 feet | 164 x 164 feet | ||
Americas | ||||
Argentina | ||||
Cerro Vanguardia | 20 x 49 feet, 39 x 16 feet | 131 x 131 feet | ||
Brazil | ||||
AGA Mineraçáo | 33 x 39 feet, 39 x 43 feet, 66 x 33 feet, 82 x 82 feet, 66 x 98 feet
| 82 x 131 feet, 66 x 131 feet, 98 x 82 feet, 164 x 98 feet, 164 x 164 feet,
| ||
Serra Grande
| 33 x 33 feet, 66 x 33 feet
|
| ||
| ||||
|
|
| ||
121
Drill hole spacing: Metric
In determining the Proven and Probable Ore Reserve, AngloGold Ashanti applied the following table of drill hole spacing:
| Drill Hole Spacing | ||||
| Proven Ore Reserve | Probable Ore Reserve | |||
South Africa | ||||
Underground sources | Ore body opened up, developed and sampled on a 2 to 3 metre spacing on raise lines and on a 5 x 5 metre grid thereafter
| From a 40 x 40 metre spacing up to 1000 x 1000 metre spacing | ||
Surface sources | 50 x 50 metre to 320 x 250 metre auger drilling, variable sampling strategies:
| |||
| Continental Africa | ||||
Democratic Republic of the Congo | ||||
Kibali | 5 x 10 metre, 15 x 20 metre | 40 x 40 metre | ||
Ghana | ||||
Iduapriem | 10 x 12 metre, 10 x 15 metre, 20 x 15 metre, 20 x 20 metre, 25 x 25 metre, 50 x 50 100 x 50 metre | 50 x 50 metre, 50 x 75 metre, 50 x 100 metre, 100 x 75 metre | ||
Obuasi | 10 x 10 metre, 20 x 20 metre, 40 x 20 metre, 50 x 50 metre | 30 x 30 metre, 50 x 50 metre, 60 x 60 metre | ||
Guinea | ||||
Siguiri | 5 x 10 metre, 5 x 12 metre, 10 x 10 metre | 20 x 40 metre, 25 x 25 metre, 50 x 25 metre | ||
Mali | ||||
Morila | 10 x 10 metre | 30 x 30 metre, 50 x 100 metre | ||
Sadiola | 5 x 10 metre, 6 x 13 metre, 25 x 25 metre | 25 x 25 metre, 50 x 25 metre | ||
Tanzania | ||||
Geita | 5 x 10 metre, 25 x 15 metre | 10 x 10 metre, 20 x 20 metre, 25 x 25 metre, 40 x 20 metre, 40 x 40 metre | ||
| Australasia | ||||
Australia | ||||
Sunrise Dam | ||||
Tropicana | 10 x 12 metre, 25 x 25 metre | 50 x 50 metre | ||
| Americas | ||||
Argentina | ||||
Cerro Vanguardia | 6 x 15 metre, 12 x 5 metre | 40 x 40 metre | ||
Brazil | ||||
AGA Mineraçáo
| 10 x 12 metre, 12 x 13 metre, 20 x 10 metre, 25 x 25 metre,
| 25 x 40 metre, 20 x 40 metre, 30 x 25 metre, 50 x 30 metre, 50 x 50 metre,
| ||
Serra Grande
| 10 x 10 metre, 20 x 10 metre
|
| ||
|
ITEM 4A: UNRESOLVED STAFF COMMENTS
Not applicable.
122
ITEM 5: OPERATING AND FINANCIAL REVIEW AND PROSPECTS
The following discussion provides information that management believes is relevant to an assessment and understanding of the consolidated financial condition and results of operations of AngloGold Ashanti Limited under IFRS for the three years ended and as at 31 December 2014, 20132016, 2015 and 2012.2014.
This item should be read in conjunction with the company’s consolidated financial statements and the notes thereto which are included under Item 18 of this annual report.
The principal accountant of AngloGold Ashanti has made reference to the work of other auditors in its report on the consolidated financial statements of AngloGold Ashanti Limited for the years ended 31 December 2014, 2013 and 2012 and therefore in compliance with Regulation S-X Rule 2-05 the separate reports of the other auditors are included in Item 18.
Overview
AngloGold Ashanti is a global gold mining company headquartered in Johannesburg, South Africa. AngloGold Ashanti’s main product is gold. As part of extracting gold the company also produces silver, uranium oxide and sulphuric acid asby-products. Revenue from the sale ofby-products is recognised as a reduction of cost of sales in the consolidated statement of income.By-product revenue amounted to $132$138 million in 2014 (2013: $1492016 (2015: $127 million; 2012: $2062014: $130 million) out of total revenue of $5,378$4,254 million in 2014 (2013: $5,7082016 (2015: $4,174 million; 2012: $6,6322014: $5,110 million). See “Note 3 – Revenue” to the consolidated financial statements for additional information. The company sells its products on world markets.
AngloGold Ashanti conducts gold-mining operations in the following regions, which represent its business segments:
South Africa (comprising the Vaal River, West Wits and Surface Operations)
Continental Africa (comprising Ghana, Guinea, Mali, Namibia (sold June 2014), the DRC and Tanzania operations)Tanzania)
Australasia (comprising Australia)
Americas (comprising Argentina, Brazil and United States of America)America (sold August 2015))
In particular, AngloGold Ashanti has 20 operations17 mines in the four regions comprisingopen-pit and underground mines and surface metallurgical plants, which are supported by extensive, yet focused exploration activities. For more information on the company’s business and operations, see “Item 4B.:4B: Business Overview – Products, operations and geographical locations”Overview”.
As at 31 December 20142016 the company had on an attributable basis, Proven and Probable Ore Reserves of approximately 57.550.0 million ounces (including our attributable share of joint ventures). For the year ended 31 December 2014,2016, AngloGold Ashanti had an attributable gold production of approximately 4.443.6 million ounces (including joint ventures).
AngloGold Ashanti’s costs and expenses consist primarily of productiontotal cash costs, amortisation, royalties, corporate administration, marketing and other expenses and exploration and evaluation costs. ProductionTotal cash costs include salaries and wages, stores and other consumables (which include explosives, timber and other consumables)reagents amongst others), fuel, power and water, contractors’ costs and costs of environmental rehabilitation.royalties. The company’s mining operations consist of deep-level underground mines as well asopen-pit operations, both of which are labour intensive, therefore salaries and wages isare a significant component of productiontotal cash costs.
Outlook
Gold production (including joint ventures) for 20152017 is forecast to be between 4.03.60 million and 4.33.75 million ounces reflecting Obuasi’s limited operations, the sale of Navachab and production decreases in Mali.ounces. Capital expenditure is expected to be approximately between $1.00 billion$950 million and $1.10 billion$1,050 million in 2015 (2014: $1.21 billion)2017, based on the following assumptions: R11.60/R14.25/$, $0.85/$/A$, BRL2.60/0.75, BRL3.40/$ and ARS9.50/ARS16.50/$; Brent crude at $70$58 per barrel.
AngloGold Ashanti’s results of operations, financial condition and prospects, as well as the company’s ability to meet its targets, may be adversely affected by a number of factors, risks and uncertainties, some of which are beyond the company’s control, including gold prices, exchange rate fluctuations, inflation, as well as political, mining and other risks. In particular, our production outlook is subject to, among other things, labour disruptions, unplanned stoppages and safety-related interventions, the stability and availability of power as well as other operational risks. Certain of these risks, uncertainties and other factors are described in “Item 3D.:3D: Risk factors”. See also “Note regarding forward-looking statements”. Furthermore the forecast assumes no changes to the asset portfolio/operating mines.
123
INTRODUCTION
The market price of gold continues to be significantly volatile. In the first half of 2016, the market price of gold increased steadily, reaching a high of $1,375 per ounce on 6 July 2016. In the second half of 2016 the gold price decreased to $1,122 per ounce on 15 December 2016, and ended the year at $1,151 per ounce.
The gold price was primarily impacted in 2016 by the fluctuations in the US dollar. The absence of any increase in U.S. interest rates during the first half of 2016 resulted in an increase in the gold price. However as the U.S. economy started to improve during the fourth quarter of 2016 and with the likelihood of an increase in U.S. interest rates in the fourth quarter of 2016, the gold price started 2014 on a positive trajectory which was unexpected givento decrease. At the negative price action of14 December 2016 Federal Open Market Committee (“FOMC”) meeting U.S. interest rates were increased by 25 basis points. More importantly, the final quarter of 2013. It appeared that earlier trepidation around the tapering of the Federal Reserve’s quantitative easing program had given way toFOMC signalled a more bullish optimism on global growth.
The slow start tohawkish stance toward the yearU.S. interest rate environment ahead, signalling the potential for three further rate increases in 2017. This supported the US economy on account of an extreme weather front, underpinnedU.S. dollar and placed the gold price under considerable downward pressure.
The increase in the gold price for the first half of the year was driven largely by the increase in demand for Exchange Traded Funds (ETF). In addition, the sharpsell-off in Chinese equities in early 2016, the increased friction between Saudi Arabia and Iran and the vote in favour of the United Kingdom’s exit from the European Union in June 2016 also increased demand for gold. In addition, slow economic growth across the globe in the first quarterhalf of 2016 despite the attempts by central banks to reflate economies also increased demand for gold. The ETF holdings were up 45 percent at their peak, to 72.8 million ounces. However as many saw this slow start as a justificationthe outlook for the Federal Reserve to extend the tenor of its monetary stimulus. The Russian invasion of UkraineU.S. economic growth improved in the first quarter of 2014 added further support to the gold price which traded up to its high of the year at $1,391/oz in March 2014.
The second half of the year, sawthis demand for gold decreased. Following the U.S. election in November, the demand for gold weakened, diminished further by the higher U.S. interest rates and strong US dollar expectations. The ETF holdings closed the year at 65.02 million ounces, 30 percent higher than the holdings at 1 January 2016 of 50.2 million ounces.
The central bank community (Official Sector), has been an important factor in the demand for gold since 2011. Central banks collectively purchased 566 tonnes of gold in 2015, compared to 383.6 tonnes purchased in 2016 a turnaroundreduction of economic events33 percent. Despite this, 2016 was the 7th consecutive year of net purchases by central banks. Central bank purchases in 2016 was led by Russia, China and the US Dollar became the focus of attention; European growth was waning and there seemed to be no strategy or agreement amongst EU members on how to tackle it; Japan was not showing any convincing signs of extricating itself from decades of deflation and there was confirmation that China’s growth was slowing too. The news outKazakhstan. Together they accounted for around 80 percent of the US onfull-year figure.
Sales from central banks were negligible in 2016 at 3.07 tonnes (2015 3.39 tonnes). The bulk of this sale was done by the other hand was becoming more and more positive and hence attention was once again focused on Federal Reserve meetings for confirmation around the timingBundesbank as part of the end of the monetary stimulus and forward looking guidance on interest rates.its gold coin programme.
Against this backdrop, commodity prices suffered as the Euro increasingly reflected investor concerns around the EU member’s ability to agree and implement a suitable economic strategy to deal with Europe’s slowing economy. The US Dollar benefittedDemand from this uncertainty as the market focus turned to speculation around the timing of interest rates hikes in the US.
A stronger US Dollar with rising interest rates has historically been negative for gold (other factors being equal), and the gold price traded under pressurejewellery market, dominated by India and China, which together account for almost 60 percent of jewellery demand, was lower than in 2015. In China, households are spending more on luxury items and are investing in property rather than purchasing gold jewellery. Demand in India was negatively impacted by a six week strike by jewellers, increased government regulations such as higher taxes and duties on gold imports, and a poor harvest which led to increased sales of gold by the rural community in order to make up for lost farming income.
The higher gold prices during 2016 resulted in an increase in scrap entering the market. Recycled gold increased by 17 percent to 42.07 million ounces in 2016. Mine supply in 2016 remained virtually unchanged from 2015 with production recorded at 3,236 tonnes and 3,233 tonnes for the balance of 2014. Nevertheless, thetwo periods respectively.
The average gold price for 2016 was $1,248 per ounce compared to $1,159 per ounce in 2015. The average spot gold price received for AngloGold Ashanti’s gold sales was $1,249 per ounce for the year was $1,266/ozending 31 December 2016.
In August 2015, AngloGold Ashanti completed its disposal of Cripple Creek & Victor (CC&V), its sole operation in North America, to Newmont Mining Corporation for proceeds of $819.4 million. See “Item 18: Group Income Statement” for the operating results of the CC&V discontinued operation up to the date of disposal.
The financial results of CC&V have been presented as discontinued operations in the consolidated financial statements and it closed the year ($1,183/oz) largely unchangedcomparative statements of operations and the statement of cash flows have been presented as if CC&V had been discontinued from its levels at the start of the year ($1,205/oz). This was contrarycomparative periods. The discussion of financial results of AngloGold Ashanti in this Operating and Financial review and Prospects relates to many analyst predictions, but these resultscontinuing operations only unless the context indicates otherwise.
The proceeds from the sale of CC&V were primarily used to execute a partial tender offer for the company’s long-term debt under its 8.50 percent bonds due in line with the performance of most other precious metals2020. See “Item 5B: Liquidity and better than most commodities.Capital Resources”.
Key factors affecting results
Gold prices
AngloGold Ashanti’s operating results are directly related to the price of gold, which can fluctuate widely and is affected by numerous factors beyond its control, including investment, jewellery and industrial demand (particularly in China and India), expectations with respect to the rate of inflation, the strength of the US dollar (the currency in which the price of gold is generally quoted) and of other currencies, interest rates, actual or expected gold sales and purchases by central banks and the International Monetary Fund (“IMF”)(IMF), global or regional political or economic events, and production and cost levels in major gold-producing regions. In addition, the price of gold is often subject to sharp, short-term changes.
The current demand for and supply of gold may affect gold prices, but not necessarily in the same manner as current supply and demand affects the prices of other commodities. The supply of gold consists of a combination of new production and fabricated gold held by governments, public and private financial institutions, industrial organisations and private individuals. As the global gold production in any single year constitutes a small portion of the total potential supply of gold, short term variations in current production do not necessarily have a significant impact on the supply of gold or on its price.
The market for gold bullion bar, the company’s primary product, is generally limited to the bullion banks. The number of these banks has declined over the last few years. Additionally, due to the diversity and depth of the total gold market, the bullion banks do not possess significant pricing power. Approximately 48 percent of the group’s total gold produced was sold to three customers in 2016.
The price of gold is often subject to sharp, short-term changes. The shift in gold demand from physical demand to investment and speculative demand may exacerbate the volatility of gold prices.
Yearly average spot gold prices have changed during the three years under review are as follows:
20122014 - $1,668$1,266 per ounce
20132015 - $1,411$1,159 per ounce
20142016 - $1,266$1,248 per ounce
The average of the spot gold price from 1 January 20152017 to 2322 March 20152017 was $1,221$1,216.64 per ounce. On 2322 March 2015,2017, the afternoon price for gold on the London Bullion Market was $1,186$1,249.05 per ounce.
If income from gold sales falls for an extended period below the company’s productiontotal cash costs at its operations, AngloGold Ashanti could determine that it is not economically feasible to continue production at some or all of its operations. Declining gold prices may also force a reassessment of the feasibility of a particular exploration or development project or projects, and could lead to the curtailment or suspension of such projects. A sustained decrease in gold prices may force the company to
124
change its dividend payment policies, reduce expenditures and undertake measures to address its cost base. In addition, the use of lower gold prices in reserve calculationsOre Reserve estimates andlife-of-mine plans could result in material write-downs of the company’s investment in mining properties and increase amortisation, rehabilitation and closure charges.
Production levels
In addition to gold prices, AngloGold Ashanti’s gold income in any year is also influenced by its level of gold production. Production levels are in turn influenced by grades, tonnages mined and processed through the plant, and metallurgical recoveries. Attributable gold production (including joint ventures) improveddecreased from 4.113.8 million ounces in 20132015 (excluding discontinued operations) to 4.443.6 million ounces in 2014.2016. The increasedecrease in production levels is due to a variety of factors, as follows:
South Africa: 637,000oz or four percent decline in production in 20142016 primarily due to the earthquake near the Vaal River operations on 5 August 2014, which caused infrastructure damage, as well as safety related stoppages across the regional portfolio.portfolio as well as lower volumes mined and grades mined.
Continental Africa: 9114,000oz or eight percent increasedecline in production primarily due to Kibali’s full yearthe transitioning of productionObuasi into a care and maintenance phase in 2014.2016, planned lower grades at Geita and lower grades at Kibali.
Australasia: 8141,000oz or seven percent increasedecline in production primarily due to Tropicana’s full year of productionlower planned grades mined at Tropicana in 2014.2016.
Americas: production declined by 5,000oz from to 996,000oz11,000oz or one percent decline in 2014 from 1,001,000oz in 2013production primarily due to lowlower grades and negative stockpile movements.at AGA Mineração in 2016.
Grades from gold ore bodies tend to decline as they mature over time. With a view to reversing the grade decline, the company embarked on the following initiatives:
Short-term: Ongoing deleveraging of the balance sheet to maintain sufficient liquidity and flexibility in a lower gold price environment, review of the asset portfolio with a view to reduce the net debt levels and balance the portfolio with more profitable ounces and maintain ongoing focus in the management of costs to deliver competitive all-in sustaining costs and all-in costs and continue to target sustainable cash generation.
Medium-term: Active exploration programmes to replenish depletion in existing ore bodies by mine life extensions and new mines.
Long-term: Technology project in South Africa with a view to using reef boring.
Concurrently, AngloGold Ashanti also embarked on ways of increasing the tonnage mined and processed, and processing improvements to enhance metallurgical recoveries.
Foreign exchange fluctuations
ProductionTotal cash costs in all business segments are for local procurement largely incurred in local currency where the relevant operation is located. US dollar denominated productiontotal cash costs and net income tend to be adversely impacted by local currency strength and favourably impacted by local currency weakness, assuming there are no other offsetting factors. AngloGold Ashanti’s financial results can be influenced significantly by the fluctuations in the South African Rand, Brazilian Real, Australian Dollar, and, to a lesser extent, the ArgentineanArgentinian Peso, Ghanaian Cedi and other local currencies. As set out below, during the year ended 31 December 2014,2016, the US dollar strengthened and the South African Rand, Australian dollar, Brazilian Real and Argentinean Peso weakened, which had a favourable impact on AngloGold Ashanti’s US Dollardollar denominated productiontotal cash costs.
Average annual exchange rates to the US dollar
| 2014
| 2013
| 2012
| 2016
| 2015
| 2014
| ||||||||||||||||||
South African Rand | 10.83 | 9.62 | 8.20 | 14.68 | 12.77 | 10.83 | ||||||||||||||||||
Brazilian Real | 2.35 | 2.16 | 1.95 | 3.48 | 3.33 | 2.35 | ||||||||||||||||||
Australian Dollar | 1.11 | 1.03 | 0.97 | 1.35 | 1.33 | 1.11 | ||||||||||||||||||
Argentinian Peso | 8.12 | 5.48 | 4.55 | 14.78 | 9.26 | 8.12 | ||||||||||||||||||
In 2014,2016, the company derived 6470 percent (58(63 percent including joint ventures) of its revenues from South Africa, Brazil, Australia and Argentina, and incurred 6272 percent (57(64 percent including joint ventures) of its productiontotal cash costs in these local currencies.South Africa, Brazil, Australia and Argentina. A one percent strengthening of these local currencies against the US dollar will result in an increase in total cash costs incurred of about $20 million or $6 per ounce.
Certain exchange controls are currentlywere in force in most emerging markets in which the company operates during the period under review, including, for example, South Africa and Argentina. In the case of South Africa, although the exchange rate of the rand is primarily market determined, its value at any time may not be considered a true reflection of the underlying value while exchange controls exist. The government has indicated its intention to relax exchange controls over time. As exchange controls are relaxed, rand exchange rates will be more closely tied to market forces. It is not possible to predict whether or when this will occur or the future value of the rand. For a detailed discussion of these exchange controls, see “Item 10D.:10D: Exchange controls”. Funds in bank accounts in Argentina were subject to regulatory approvals before such funds could be transmitted until a new government elected in November 2015 started the process of easing controls and returning to an open economy and free market. In 2016 the requirement to receive regulatory approval was lifted and over the course of 2016 the group was able to remit funds from Argentina.
125
ProductionTotal cash costs and effects of inflation
ProductionTotal cash costs include salaries and wages, stores and other consumables (which include explosives, timber and other consumables)reagents among others), fuel, power and water, contractors’ costs and costs of environmental rehabilitation.royalties. The mining industry continues to experience price inflation for costs of inputs used in the production of gold, which leads to higher productiontotal cash costs reported by many gold producers.
AngloGold Ashanti is unable to control the prices at which it sells its gold. Accordingly, in the event of significant inflation in South Africa or, to a lesser extent, Brazil, Argentina or Australia, without a concurrent devaluation of the local currency or an increase in the price of gold, there could be a material adverse effect upon the company’s results and financial condition.
AngloGold Ashanti employs over 58,00052,000 people globally, most of whom are members of trade unions, particularly in South Africa, Continental Africa and the Americas. Salaries and wages account for a significant component of productionlocal total cash costs and are impacted by annual wage increases.
Energy costs, comprising power, fuel and lubricants, are another material component of productiontotal cash costs. Due to the remote location of some of its mines in Continental Africa, AngloGold Ashanti uses fuel to generate power and uses fuel and lubricants at its mines to run its fleet and processing plants. The price of oil has recently been volatile, fluctuating between $55$25 and $115$55 per barrel of Brent crude in 2014.2016. AngloGold Ashanti estimates that for each $1 per barrel rise in the oil price, other factors remaining equal, the average total cash costs of all its operations increases by about $0.78$3 million or $0.76 per ounce, with the total cash costs of certain of the company’s mines, particularly Geita, Cripple Creek & Victor, Siguiri, Sadiola and Sadiola,Kibali, which are more dependent on fuel, being more sensitive to changes in the price of oil. Energy costs, even in business segments which are supported by grid power, like South Africa, have increased considerably over the three year period, with price increases from Eskom (South Africa’s power utility) that exceeded average inflation. These increases have adversely impacted productiontotal cash costs.
AngloGold Ashanti has no influence over the cost of most consumables, many of which are linked to some degree to the price of oil and steel and in a number of cases have exceeded inflation. Furthermore, there has also been volatility recently in the price of steel, used in the manufacture of most forms of fixed and mobile mining equipment, which is a relatively large contributor to the operating costs and capital expenditure of a mine. All of these cost pressuresFluctuations in oil and steel prices have adversely impacted net income during the period.a significant impact on operating costs and capital expenditure.
Total group rehabilitation obligationRoyalties (excluding joint ventures) increased from $728 million in 2013 to $851 million in 2014. This change is attributable to changes in discount rates due to changes in global economic assumptions and changes in mine plans resulting in changes in cash flows and changes in design of tailings storage facilities and in methodology following requests from the environmental regulatory authorities.
Royalties,, which are generally calculated as a percentage of revenue, varied over the past three years from $164 million incurred in 2012 to $129 million incurred in 20132014 to $100 million incurred in 2015 and $131$105 million in 2014,2016, primarily due to the variations in the spot gold prices and production.
Royalties are likely to continue to vary in the coming years as in a number of jurisdictions host governments increasingly seek to obtain a higher share of revenue by increasing the royalty rates for gold mines.
Rehabilitation costs
Total provisions for decommissioning and for restoration (excluding joint ventures) totalled $683 million in 2015 and $705 million in 2016. The change is attributable to unwinding of discount rate, changes in discount rates based on global economic assumptions and changes in mine plans and in the design and processes of tailings storage facilities complying with requests from the environmental regulatory authorities.
Amortisation of tangible assets
Amortisation of tangible assets increased during the 2014 – 2016 period, from $749 million to $789 million, largely due to increased production at Geita and Cerro Vanguardia, the exchange rate impact on additions at Córrego do Sítío and the effect of moving between open pit and underground operations at Sunrise Dam. The increase in amortisation was partly offset by the transition of Obuasi into care and maintenance, assets written off in 2015 at Iduapriem, a decrease in South Africa due to lower production and by the weakening of local currencies against the US dollar.
Exploration and evaluation costs
The company has incurred exploration expenditure during the years ended 31 December 2012, 20132014, 2015 and 20142016 in order to replenish depleting gold reservesOre Reserves and bring new ore bodies intopre-feasibility or feasibility. The exploration costs incurred over the last three fiscal years amounted to $395$142 million in 2012, $2552014, $132 million in 20132015 and $144$133 million in 2014.2016. Exploration expenditure was curtailed duringhas been reduced since 2014, with a significant cut back in brownfields and greenfields exploration as well as prefeasibility studies.
126
Corporate administration, marketing and other expenses
In order to meet AngloGold Ashanti’s strategic objectives, management has incurred costs to build talent, capacity and expertise globally and in particular to support its Project ONE initiatives. The corporate administration, marketing and other expenses incurred over such period amounted to $291 million in 2012, $201 million in 2013 and $92 million in 2014.2014, $78 million in 2015 and $61 million in 2016. The costs were lower in 20142016 due to reduced labour costs, consultancy and travel costs as well as increased recoveries for shared service costs, aided by the effects of the weaker Rand.
Amortisation of tangible assets
Amortisation of tangible assets decreased during the 2012 – 2014 period, from $830 million to $750 million, largely due to the reduction in capital expenditure at Obuasi following the impending move to limited operations; lower amortisation at Cripple Creek and Victor and Geita following the impairment of assets in June 2013 and the reset of the amortisation lives; lower production at Sunrise Dam, partly offset by higher amortisation at Tropicana since production started in the fourth quarter of 2013.
ImpairmentsSpecial items
AngloGold Ashanti reviews and tests the carrying value of its assets when events or changes in circumstances suggest that the carrying amount may not be recoverable. AngloGold Ashanti values individual mining assets at the lowest level for which cash flows are identifiable as independent of cash flows of other mining assets and liabilities.
If there are indications that impairment may have occurred, AngloGold Ashanti prepares estimates of expected future cash flows for each group of assets. Expected future cash flows are inherently uncertain, and could materially change over time. They are significantly affected by reserveOre Reserve and production estimates, together with economic factors, such as spot and forward gold prices, discount rates, currency exchange rates, estimates of costs to produce reservesOre Reserves and future capital expenditures. Alternatively, should any of these factors reverse, then AngloGold Ashanti may have to reverse previously recognised impairments.
The impairment charges AngloGold Ashanti incurred on tangible and intangible assets amounted to a charge of $346 million in 2012, a charge of $3,029 million in 2013 and a charge of $10 million in 2014. See “Note 7 – Special Items”, “Note 15 – Tangible assets” and “Note 16 – Intangible assets” to the consolidated financial statements for a detailed description of impairments.
When reviewing goodwill and other tangible assets for impairment, AngloGold Ashanti’s assumption on gold price represents its best estimate of the future price of gold. In arriving at the estimated long-term real gold price, AngloGold Ashanti considers all available market information including current prices, historical averages, and forward pricing information and data. The long term real gold price of $1,267$1,212 per ounce in 20142016 and $1,269$1,179 per ounce in 2013,2015, were based on a range of economic and market conditions, which were, at that time, expected to exist over the remaining useful life of the assets.
AngloGold Ashanti considers the long-term fundamentals that provide support to the gold price assumption. These include, amongst other things, gold as a long-term store of value, hedge against inflation, safe haven status, strong physical demand from emerging markets, central bank purchases, quantitative easing and devaluation of paper currency, falling global mine production and rising costs of producing gold, all of which represent significant and enduring trends supportive of AngloGold Ashanti’s gold price assumption.
The actual spot gold price averaged $1,266$1,248 per ounce in 20142016 and $1,411$1,159 per ounce in 2013.2015. The gold price in 20152017 has been subject to volatile short term swings and has averaged $1,221$1,216.64 per ounce from 1 January 20152017 to 2322 March 20152017 and closed at $1,186$1,249.05 per ounce on 2322 March 2015.2017.
AngloGold Ashanti will continue to monitor the underlying long-term factors driving the gold price and will review its gold price assumption, should it consider it appropriate to do so.
Furthermore, should the gold price fall and remain at such lower levels, management will consider, in addition to other mitigating factors, reviewing and amending the life of mine plans to reduce expenditures, optimise costs and increase cash flows in respect of its mining assets.
127
Taxation
Taxation decreased over the period 20122014 - 20142016 from an expense of $346$225 million in 20122014 to an expense of $255$189 million in 2014.2016. The decrease in the tax charge wasis mainly due to lower taxable income as a resultdeferred taxation from foreign exchange movements on the valuation of the lower gold price as well as tax credits on impairment of assets.non-monetary items in Brazil and Argentina, partly offset by an increase in current taxation mainly due to higher earnings.
Taxation is likely to continue to be volatile in the coming years, as host governments in a number of jurisdictions increasingly seek to obtain a higher share of revenue by increasing rates of existing taxes and introducing new taxes on gold mines.
Business combinations
The global gold mining industry has experienced active consolidation and rationalisation in recent years. Accordingly, AngloGold Ashanti has been, and expects to continue to be, involved in assessing a number of acquisitions, dispositions and joint ventures as part of this global trend and to identify value-adding business combinations and acquisition opportunities.
Acquisitions and dispositions are described in Note 34 to the consolidated financial statements, “Business combinations and disposals”. See also Note 39 to the consolidated financial statements, “Subsequent events”. The consolidated financial statements reflect the operations and financial condition of AngloGold Ashanti, giving effect to the acquisitions and disposals on the effective date.opportunities, where appropriate.
South African economic and other factors
AngloGold Ashanti is a company domiciled in South Africa with significant operations in South Africa. As a result, the company is subject to various economic, fiscal and monetary factors that affect South African companies generally.
For more information about the impact of governmental economic, fiscal, monetary or political policies or factors on our operations, see also “Item 3.D.:3.D: Risk factors”Factors” and “Item 4.B.:4.B: Business Overview – Overview–The Regulatory Environment Enablingregulatory environment enabling AngloGold Ashanti to Mine”mine”.
Comparison of operating performance in 2014, 20132016, 2015 and 20122014
The following table presents selected operating data for the AngloGold Ashanti group for the three yearthree-year period ended 31 December 2014:2016:
| Operating data for AngloGold Ashanti | Year ended 31 December | |||||||||||
| 2014 | 2013 | 2012 | ||||||||||
Total attributable gold production (thousand ounces) | 4,436 | 4,105 | 3,944 | |||||||||
Total attributable gold sold (thousand ounces)(1) | 4,454 | 4,093 | 3,953 | |||||||||
All-in sustaining costs ($/oz)(2) | 1,026 | 1,174 | 1,251 | |||||||||
All-in costs ($/oz)(2)(3) | 1,148 | 1,466 | ||||||||||
Total cost of sales (million US dollars) – per financial statements | 4,190 | 4,146 | 3,964 | |||||||||
Total cash costs ($/oz)(2) | 787 | 830 | 829 | |||||||||
Total production costs ($/oz)(2) | 1,014 | 1,054 | 1,054 | |||||||||
Total cash costs (million US dollars) – per financial statements | 3,292 | 3,297 | 3,135 | |||||||||
Production costs (million US dollars) – per financial statements | 3,410 | 3,384 | 3,212 | |||||||||
Capital expenditure (million US dollars) | 1,209 | 1,993 | 2,322 | |||||||||
- Consolidated entities | 1,018 | 1,582 | 2,019 | |||||||||
- Associates and equity accounted joint ventures | 191 | 411 | 303 | |||||||||
| Operating data for AngloGold Ashanti | Year ended December 31 | |||||||||||
| 2016 | 2015 | 2014 | ||||||||||
Total attributable gold production (thousand ounces)(1) | 3,628 | 3,947 | 4,436 | |||||||||
Total attributable gold sold (thousand ounces)(1) | 3,590 | 3,965 | 4,454 | |||||||||
| (1) |
|
|
|
128
Attributable gold production
Production in 20142016
For the year ended 31 December 2014,2016, AngloGold Ashanti’s total attributable gold production at 4.44of 3.63 million ounces was 330,000320,000 ounces, or 8eight percent, higher whenlower than the 2015 production of 3.95 million ounces which included discontinued operations.
InSouth Africa, gold production decreased by four percent, or 37,000 ounces, in 2016 as compared to 2015. The lower production was due to safety stoppages and lower grades at Tau Tona and Kopanang. The decrease in production was partially offset by higher production at Moab Khotsong and Mponeng due to less safety stoppages in 2016 and higher grades at Moab Khotsong and higher volumes treated at Mponeng.
Production decreased by eight percent, or 114,000 ounces, in 2016, as compared to 2015, inContinental Africa. The decrease was due to the 2013cessation of tailings treatment at Obuasi, lower grades mined at Geita and Kibali, and Morila transitioning toend-of-life treating marginal and tailings grade. The decrease was partially offset by higher production at Iduapriem due to higher grades and an improvement in tonnage throughput in the plant.
Production decreased by seven percent, or 40,000 ounces, in 2016, as compared to 2015, inAustralia mainly due to lower planned grades mined at Tropicana. The decrease was partially offset by higher production at Sunrise Dam due to higher tonnes treated.
In theAmericas region, production decreased by one percent, or 11,000 ounces (excluding discontinued operations) in 2016 as compared to 2015. The decrease was mainly due to lower grades as a result of operational and geotechnical issues in Brazil at AGA Mineração. The decrease was partially offset by a slight increase in production at Cerro Vanguardia as a result of higher tonnes treated.
Production in 2015
For the year ended 31 December 2015, AngloGold Ashanti’s total attributable gold production including discontinued operations of 3.95 million ounces was 490,000 ounces, or 11 percent, lower than the 2014 production of 4.114.44 million ounces.
InSouth Africa, gold production decreased by 618 percent, or 79,000219,000 ounces, in 20142015 as compared to 2013.2014. The lower production was due largelyto safety stoppages that affected the whole region. Furthermore, at Mponeng the lower area mined profile was affected by thede-risk plan. At Moab Khotsong, the volumes milled and the yield recovered was lower than the previous year. At Kopanang the lower volumes mined and lower grade were as a result of mining in lower grade areas and lower grade tonnes coming from the Uranium-plantclean-up. The volume decrease was due to the earthquake nearslowstart-up after the Vaal River operations on 5 August 2014, which caused infrastructure damage, as well as safety related stoppages acrossand limited mining flexibility.
Production decreased by 10 percent, or 162,000 ounces, in 2015, as compared to 2014, inContinental Africa mainly due to Obuasi moving into limited operations in 2015, the regional portfolio.sale of Navachab in Namibia in June 2014 and lower tonnes and grades at Siguiri. The decrease was partially offset by higher production at Moab Khotsong arising from higher gradein Kibali due to lower declared wastehigher tonnes treated and higher production in Geita due to reef tonnes.higher grades.
Production increaseddecreased by 910 percent, or 137,00060,000 ounces, in 2014,2015, as compared to 2013, inContinental Africa mainly due to Kibali’s full year of production in 2014, higher production at Siguiri in Guinea due to higher recovered grades and at Geita in Tanzania due to increased tonnage throughput. The strong results were achieved despite Navachab’s sale at the end of June 2014, the continued winding down of operations in Mali and the treatment of low grade stockpile during the current year at Iduapriem in Ghana.
Production increased by 81 percent, or 278,000 ounces, in 2014, as compared with 2013, inAustralia mainly due to Tropicana’s full year of production in 2014. Lowerlower grades were mined at Sunrise Dam, in line withDam.
In the mine plan partially offsettting the increase in production in this segment.
In theAmericas region, production decreasedincreased by 5,000six percent, or 46,000 ounces in 2014,2015 as compared with 2013. In North America at Cripple Creek & Victor production decreasedto 2014. The increase was due principally to ore being placed further from the liner. This decrease and a further decrease at Serra Grande were partially offset by increases in production in Brazil at AGA Mineração and at Cerro Vanguardia. The increase was mainly due toVanguardia resulting from increased tonnage and higher feed grades at both the Cuiabágrades.
Comparison of financial performance in 2016, 2015 and Córrego do Sítio complexes. Development work improved and production began from the new orebody at Córrego do Sítio (Sulphide II) and full production rates were achieved at the underground Mine l.2014
| Financial performance of AngloGold Ashanti | Year ended 31 December | |||||||||||
| (in millions) | 2016 | 2015 | 2014 | |||||||||
Gold income | 4,085 | 4,015 | 4,952 | |||||||||
Cost of sales | (3,263 | ) | (3,294 | ) | (3,972 | ) | ||||||
Other expenses | (564 | ) | (552 | ) | (785 | ) | ||||||
Share of associates and joint ventures’ profit (loss) | 11 | 88 | (25 | ) | ||||||||
Taxation expense | (189 | ) | (211 | ) | (225 | ) | ||||||
Net profit attributable tonon-controlling interests | 17 | 15 | 19 | |||||||||
Net profit (loss) attributable to equity shareholders – Continuing operations | 63 | 31 | (74 | ) | ||||||||
Net (loss) profit attributable to equity shareholders – Discontinued operations | - | (116 | ) | 16 | ||||||||
ProductionComparison of total cost of sales in 20132016, 2015 and 2014
ForThe following table presents cost of sales from continuing operations for the yearAngloGold Ashanti group for the three-year period ended 31 December 2013, AngloGold Ashanti’s total attributable2016:
| Cost of sales for AngloGold Ashanti | Year ended December 31 | |||||||||||
| 2016 | 2015 | 2014 | ||||||||||
Total cost of sales | 3,263 | 3,294 | 3,972 | |||||||||
Inventory change | 38 | (23 | ) | (28 | ) | |||||||
Amortisation of tangible assets | (789 | ) | (737 | ) | (749 | ) | ||||||
Amortisation of intangible assets | (20 | ) | (40 | ) | (34 | ) | ||||||
Retrenchment costs | (14 | ) | (11 | ) | (24 | ) | ||||||
Rehabilitation and othernon-cash costs | (43 | ) | 10 | (66 | ) | |||||||
|
|
|
|
|
| |||||||
Total cash costs | 2,435 | 2,493 | 3,071 | |||||||||
Royalties | (105 | ) | (100 | ) | (129 | ) | ||||||
Other cash costs | (24 | ) | (27 | ) | (28 | ) | ||||||
|
|
|
|
|
| |||||||
| 2,306 | 2,366 | 2,914 | ||||||||||
By-products revenue | 138 | 127 | 130 | |||||||||
|
|
|
|
|
| |||||||
Cash operating costs | 2,444 | 2,493 | 3,044 | |||||||||
|
|
|
|
|
| |||||||
Comparison of financial performance in 2016 with 2015
Our gold production at 4.11income is only materially impacted by price and volume variances. All of our costs are impacted by the consequences of average exchange rate movements.
When comparing the results of operations for 2016 to 2015 for costs the investor is referred to “Item 5A – Foreign exchange fluctuations” where we report on exchange fluctuations and the average exchange rates in the South African Rand, Brazilian Real, Australian Dollar and the Argentinean Peso which will have effects on the various components that make up our costs based on the level; of local procurement of each of these costs.
Gold income
Gold income increased by $70 million, ouncesor two percent, from $4,015 million in 2015 to $4,085 million in 2016. This increase was 160,000 ounces, or 4 percent, higher when compareddue to the 2012 productionincrease in the gold price received of 3.94 million ounces.
InSouth Africa, gold production increased by 7$91 per ounce, or eight percent, or 90,000 ounces,from $1,158 per ounce during 2015 to $1,249 per ounce in 2013 as compared to 2012.2016. The increase in output was mainly due to increased production from MWS (acquired effective July 2012), non-recurring strike actionthe price of gold resulted in South Africa, fewer safety and associated stoppages, reduced dilution owing to decreasean increase in stoping widths and higher grades mined at Moab Khotsong during 2013.gold income of $299 million. The increase was partially offset by decreased production at Mponeng due to lower grades.a 270,000 ounce decrease in gold sold from continuing operations, which resulted in a decrease in gold income of $229 million.
Production decreased by 4 percent, or 61,000 ounces,Gold income from the South African operations in 2013, as compared to 2012, inContinental Africa mainly due to the mill shutdown at Geita in 2013, lower recovered grades at Morila, Sadiola and Navachab and lower production at Obuasi due to underground mining challenges and backfill constraints. The decrease was partially offset by higher production at Iduapriem in Ghana and Siguiri in Guinea due to higher grades and production starting ahead of schedule at Kibali.
Production2016 increased by 33$41 million, or four percent, or 84,000 ounces,to $1,173 million from $1,132 million in 2013,2015, mainly as compared with 2012, inAustralia mainly due to production starting aheada result of schedule at Tropicana Gold Mine and higher grade ore from the Crown pillar in the base of the open pit at Sunrise Dam.
In theAmericas region, production increased by 5 percent, or 48,000 ounces in 2013, as compared with 2012. In Brazil the increase was mainly due the increase of the company’s ownership in of Serra Grande to 100 percent, effective July 2012. In Argentina at Cerro Vanguardia, the increase in production was mainly due to operational improvements giving rise tothe gold price received, which resulted in an increase in recoveries and grades.gold income of $87 million. The increase was partially offset by lower production at Cripple Creek & Victor in North America due to lower recovered grades.
129
Total all-in sustaining costs, all-in costs and total cash costs and total production costs
Comparison of all-in sustaining costs in 2014 with 2013
All-in sustaining costs per ounce (excluding stockpile impairments) in South Africa decreased in 2014 by $56 per ounce to $1,064 per ounce from $1,120 per ounce in 2013. The decrease was a result of a decrease in total sustaining capital expenditure and the weakening of the rand. The decrease was partially offset by a decrease in gold sold of 79,00040,000 ounces, in 2014 over 2013.primarily as a result of safety stoppages and lower grades at Tau Tona and Kopanang, which accounted for $46 million of the decrease.
InGold income from the Continental Africa all-in sustaining costs (excluding stockpile impairments)operations decreased by $234 per ounce,$20 million, or 19two percent, to $968 per ounce$1,250 million in 20142016 from $1,202 per ounce$1,230 million in 2013. This2015, mainly as a result of the decrease in gold sold of 93,000 ounces, which resulted in a decrease of gold income of $110 million. The decrease in production was mainly due to a decrease in costthe cessation of sales (refer comparison of total cash costs in 2014 with 2013), total sustaining capital expendituretailings treatment at Obuasi and a 153,000 ounce increase in gold sold from 1,462,000 ounces in 2013 to 1,615,000 ounces in 2014.lower grades mined at Geita. The decrease was partially offset by the increase in the gold price received which resulted in an increase in associates and equity joint ventures’ sharegold income of costs and a$90 million.
Gold income from Australia decreased by $20 million, or three percent, from $666 million in 2015 to $646 million in 2016. The decrease in amortisation.
In the Americas, all-in sustaining costs (excluding stockpile impairments) increased by $40 per ounce, or 4 percent, to $1,010 per ounce in 2014 from $970 per ounce in 2013. This increase was mainly due to an increase in costs of sales (refer comparison of total cash costs in 2014 with 2013) and athe 56,000 ounce decrease of 9,000 ounces, or 1 percent, in gold sold in 2014.
In Australia, all-in sustaining costs decreased2016, which resulted in a decrease in gold income of $67 million. The decrease in production was mainly as a result of lower planned grades mined at Tropicana. The decrease was partially offset by $390 per ounce, or 28 percent, to $986 per ouncethe increase in 2014 from $1,376 per ouncethe gold price received which resulted in 2013, mainly due to an increase in gold soldincome of $47 million.
Gold income from the Americas operations increased by $69 million, or seven percent, from $967 million in 2015 to $1,036 million in 2016, mainly as a result of the increase in the gold price received, which was partially offset byresulted in an increase in costs. This was mainly due to Tropicana’s ramp up for the full yeargold income of production in 2014.
Comparison of all-in costs in 2014 with 2013
All-in costs per ounce (excluding stockpile impairments) in South Africa decreased in 2014 by $131 per ounce to $1,107 per ounce from $1,238 per ounce in 2013.$75 million. The decrease was a result of a decrease in all-in sustaining costs, non-sustaining project capex and the weakening of the rand. The decreaseincrease was partially offset by a decrease in gold sold of 79,00021,000 ounces, primarily at AGA Mineração, as a result of lower grades due to operational and geotechnical issues which accounted for $6 million of the decrease in 2014 over 2013.gold income.
Cost of sales
Cost of sales decreased from $3,294 million in 2015 to $3,263 million in 2016, which represents a $31 million or one percent decrease. The decrease was primarily due to the $61 million inventory change in 2016 as a result of an increase in related total cash costs and amortisation of tangible and intangible assets directly related to the production of inventory, being deferred into inventory at year end. This overall decrease in cost of sales was offset by an increase in total amortisation costs of $32m from $777m in 2015 to $809m in 2016. The increase in royalties of $5m is due to the increase in revenue due to the higher gold price achieved in 2016 than 2015. In addition, rehabilitation and othernon-cash costs increased by $53m from a credit of $10m in 2015 to a cost of $43m. This increase arose from the changes to cash flows, inflation rates and discount rates compared to 2015. The $49m decrease in cash operating costs from $2,493 million to $2,444 million, was primarily due the weakness in local currencies and was partially offset by inflationary increases.By-product revenue increased due to higher volumes sold as well as higher average prices received for silver.
In ContinentalSouth Africa all-in costs (excluding stockpile impairments)cost of sales decreased by $433 per ounce,from $1,083 million in 2015 to $1,041million in 2016, which represents a $42 million or 28four percent to $1,105 per ounce in 2014 from $1,538 per ounce in 2013. Thisdecrease. The decrease was mainly due to a decrease in all-in sustaining costs, non-sustaining project capex, non-sustaining exploration and study costs and a 153,000 ounce increase in gold sold from 1,462,000 ounces in 2013 to 1,615,000 ounces in 2014.
In the Americas, all-in costs (excluding stockpile impairments) decreased by $9 per ounce, or 1 percent, to $1,262 per ounce in 2014 from $1,271 per ounce in 2013.
In Australia, all-in costs decreased by $1,075 per ounce, or 52 percent, to $998 per ounce in 2014 from $2,073 per ounce in 2013, mainly due to an increase in gold soldweakening of the rand, which was partially offset by an increase in costs.
Comparison of total cashproduction costs in 2014 with 2013
The currencies of South Africa, Australia, Argentina and Brazil were, on average, weaker against the US dollar during 2014 as compared to 2013 which positively impacted total cash costs for 2014.
Total cash costs per ounce in South Africa, at Kopanang, Moab Khotsong, Great Noligwa, Tau Tona and the surface operations, decreased marginally to $849 per ounce in 2014 from $850 per ounce in 2013. The decrease was a result of the weakening of the rand partially offset by a decrease in production.local currency.
In Continental Africa total cash costscost of sales decreased by $86 per ounce,from $969 million in 2015 to $925 million in 2016, which represents a $44 million or 10five percent to $783 per ounce in 2014 from $869 per ounce in 2013.decrease. The decrease was mainly due to the 137,000 ounces increasedecreases in production.
Total cashlabour costs, at Geita, in Tanzania, increased by 16 percent from $515 per ounce in 2013 to $599 per ounce in 2014. This was mainly due to the utilisation of higher cost ore stockpiles.
In Mali, at Morila, total cash costs increased by 50 percent in 2014 to $1,162 per ounce compared to $773 per ounce in 2013, mainly due to lower productionfuel and an increase in contractor costs. At Sadiola, total cash costs decreased by 23 percent from $1,334 per ounce in 2013 to $1,028 per ounce in 2014. This decrease was primarily due to a decrease in contractor costs. Total cash costs at Yatela decreased by 6 percent from $1,530 per ounce in 2013 to $1,438 per ounce in 2014 mainly due to a decrease in all the costs which was partially offset by lower production.
130
In Ghana, at Obuasi, total cash costs decreased by 23 percent in 2014 to $1,086 per ounce compared to $1,406 per ounce in 2013 mainly due to a decrease in all the costs due to the transition to a limited operating state. At Iduapriem, in Ghana, total cash costs increased marginally to $865 per ounce in 2014 compared to $861 per ounce in 2013 mainly due to decreased production which was partially offset by a decrease in salaries, consumable store costs, power costs, and contractor costs. At Siguiri, in Guinea, total cash costs, decreased by 13 percent to $799 per ounce in 2014 from $918 per ounce in 2013 mainly due topartially offset an increase in production and a decrease in consumable store costs, contractor costs and service related costs.amortisation of tangible assets.
In the DRC, at Kibali, total cash costsAustralasia cost of sales increased by 23from $525 million in 2015 to $540 million in 2016, which represents a $15 million or three percent to $578 per ounce in 2014 from $471 per ounce in 2013 mainly due to an increase in all the costs partially offset by an increase in production. The increase in production and costs are due to Kibali’s ramp up to the full year of production in 2014.
In the Americas, total cash costs increased to $709 per ounce in 2014 from $671 per ounce in 2013.increase. The increase was mainly due to an increase in consumable store costs, contractor costsfuel and a decrease in production.
In the United States, at Cripple Creek, total cash costs increased by 13 percent or $97 per ounce to $829 per ounce in 2014 from $732 per ounce in 2013 due primarily to a decline in production. In Brazil, at AngloGold Ashanti Córrego do Sítio Mineração, total cash costs decreased marginally to $644 per ounce in 2014 from $646 per ounce in 2013 primarily due to higher productionpower which was partially offset by an increase in consumable storelabour costs. At Serra Grande total cash
In the Americas cost of sales increased from $719 million in 2015 to $752 million in 2016, which represents a $33 million or five percent increase. The increase was mainly due an increases in services costs increasedand amortisation of tangible assets which were partially offset by 4 percent or $29 per ounce to $748 per ounce in 2014 as compared to $719 per ounce in 2013 due to an increase in service relatedby-product revenue from silver which was due to higher volumes sold as well as a higher average silver price received in 2016.
Total cash costs and
Total cash costs decreased from $2,493 million in 2015 to $2,435 million in 2016, which represents a $58 million, or two percent, decrease. The decrease was primarily due to a decrease in production. In Argentina at Cerro Vanguardia, total cashsalaries and wages costs, increased to $692 per ounce in 2014 from $622 per ounce in 2013 primarily due to an increase infuel and power costs, contractor costs and service related costs partially offset by higher production.
In Australia, total cash costs decreased by $243 per ounce, or 23 percent, to $804 per ounce in 2014 from $1,047 per ounce in 2013.
In Australia, at Sunrise Dam, total cash costs decreased in 2014 to $1,105 per ounce compared to $1,110 per ounce in 2013, mainly due to the weakening of the Australian Dollar. The decrease was partially offset by a decrease in production. At Tropicana total cash costs decreased in 2014 to $545 per ounce compared to $568 per ounce in 2013, mainly due to an increase in production and the weakening of the Australian Dollar.costs. The decrease was partially offset by an increase in consumable storestores and other consumables costs, power costs, contractorretrenchment costs and service relatedrehabilitation costs. The increase
Labour costs decreased from $869 million in production and costs was2015 to $859 million in 2016, which represents $10 million, or one percent, decrease.
In South Africa labour increased by $4 million, or one percent, from $424 million in 2015 to $428 million in 2016 mainly due to Tropicana’s ramp up to the full year of production in 2014.
Overall the company’s total cash costs in 2014 decreased to $787 per ounce compared to $830 per ounce in 2013. Of this decrease, weaker local currencies accounted for $58 per ounce and acquisitions and disposals accounted for $26 per ounce,$7 million bonuses paid at Mponeng. The increase was partially offset by higher inflation of $44 per ounce.
Comparison of all-in sustaining costs in 2013 with 2012
All-in sustaining costs per ounce in South Africa decreased in 2013 by $69 per ounce to $1,120 per ounce from $1,189 per ounce in 2012. The decrease was a result of an increase in gold sold in 2013 and the weakening of the rand.weaker exchange rate.
In Continental Africa all-in sustaining costs (excluding stockpile impairments)labour decreased by $33 per ounce,$8 million, or 3six percent, from $141 million in 2015 to $1,202 per ounce$133 million in 20132016 mainly due to Obuasi transferred to care and maintenance and a decrease at Siguiri.
In Australia labour decreased by $5 million, or eight percent, from $1,235 per ounce$64 million in 2012. This2015 to $59 million in 2016.
In the Americas labour remained unchanged at $237 million.
Consumable stores increased from $519 million in 2015 to $534 million in 2016, which represents a $15 million, or three percent, increase. Other material increased by $17 million across the group. The increase was partially offset by weaker local currencies.
Fuel and power costs decreased from $443 million in 2015 to $414 million in 2016, which represents a $29 million, or seven percent, decrease.
The decrease was mainly due to athe average $9 dollar per barrel, or 17 percent, decrease in all-in sustaining costs adjusted for non-controlling interests of $110oil prices which resulted in fuel cost decreasing across the group by $34 million, or 628 percent, from $1,886$124 million in 2012 to $1,776 million in 2013. This$90 million.
The decrease was partially offset by a 65,000 ounce decrease$10 million increase in gold sold from 1,527,000 ouncespower costs. Power costs increased by $18 in 2012Australia mainly at Tropicana due to 1,462,000 ounces in 2013.
annual rate increases and the use of gas to generate power. In the Americas all-in sustaining costs decreased by $36 per ounce, or 4 percent, to $970 per ounce in 2013 from $1,006 per ounce in 2012. This decrease was mainly due to an increase of 48,000 ounces, or 5 percent, in gold sold in 2013.
In Australia, all-in sustaining costs decreased by $304 per ounce, or 18 percent, to $1,376 per ounce in 2013 from $1,680 per ounce in 2012, mainly due to an increase in gold sold which was partially offset by an increase in costs. The increase in gold sold and costs are due to Tropicana starting production ahead of schedule.
131
Comparison of all-in costs in 2013 with 2012
No comparison of all-in costs in 2013 with 2012 is presented as all-in costs have been calculated from 2013 onwards.
Comparison of total cash costs in 2013 with 2012
The currencies of South Africa, Australia, Argentina and Brazil were, on average, weaker against the US dollar during 2013 as compared to 2012 which positively impacted total cash costs for 2013.
Total cash costs per ounce in South Africa, at Kopanang, Moab Khotsong, Great Noligwa, Tau Tona and the surface operations, decreased by $23 per ounce, or 3 percent, to $850 per ounce in 2013 from $873 per ounce in 2012. The decrease was a result of an increase in production in 2013 and the weakening of the rand.
In Continental Africa, total cash costspower increased by $39 per ounce, or 5 percent, to $869 per ounce in 2013 from $830 per ounce in 2012.$6 million mainly at Serra Grande and AGA Córrego do Sítío Mineração. The increase was mainly due to the 61,000 ounces decrease in production.
Total cash costs at Geita, in Tanzania, increased by 21 percent from $427 per ounce in 2012 to $515 per ounce in 2013. This was mainly as a result of decreased production and an increase in labour, consumables and contract labour costs.
In Mali, at Morila, total cash costs increased by 1 percent in 2013 to $773 per ounce compared to $767 per ounce in 2012, mainly due to lower production which was partially offset by a decrease in inventory adjustments. At Sadiola, total cashpower costs increased by 14 percent from $1,169 per ounce in 2012 to $1,334 per ounce in 2013. This increase was primarily due to lower production. Total cashproduction mainly in South Africa and Continental Africa.
Contractor costs at Yatela decreased by 13from $460 million in 2015 to $443 million in 2016, which represents a $17 million, or four percent, from $1,758 per ounce in 2012 to $1,530 per ounce in 2013 mainlydecrease which largely due to a decrease in contract labourcontractor costs in Australia due to deferred stripping costs capitalised in 2016 which were expensed in 2015 which was partially offset by increases in contractor costs in Continental Africa.
Service and other charges decreased from $184 million in 2015 to $170 million in 2016. This decrease was mainly due to lower production.ore stockpile adjustments andwrite-off in the 2016 compared to 2015.
In Ghana, at Obuasi,Revenue fromby-products, included in total cash costs, increased by 18 percentfrom $127 million in 20132015 to $1,406 per ounce compared to $1,187 per ounce$138 million in 2012 mainly due to the decline in production. At Iduapriem, in Ghana, total cash costs decreased by 10 percent to $861 per ounce in 2013 compared to $955 per ounce in 2012 mainly due to increased production which was partially offset by an increase in contract labour costs. At Siguiri, in Guinea, total cash costs decreased by 2 percent to $918 per ounce in 2013 from $938 per ounce in 2012 mainly due to an increase in production which was partially offset by an increase in ore stockpile adjustments and increased costs related to labour.
In the DRC, at Kibali, total cash costs were $471 per ounce in 2013. Kibali began commercial production in October 2013.
In the Americas, total cash costs increased marginally to $671 per ounce in 2013 from $669 per ounce in 2012.2016. The increase was mainly due to an increase in commodityrevenue from silver sales that increased from $72 million in 2015 to $99 million in 2016. Silver sold increased from 4.3 million ounces in 2015, at an average price of $17 per ounce, to 5.3 million ounces in 2016, at an average price of $19 per ounce. The increase was mainly at Cerro Vanguardia. The increase was partially offset by a $16 million decrease in uranium revenue in South Africa at Kopanang and Moab Khotsong.
Royalties, which are generally calculated as a percentage of revenue, increased from $100 million in 2015 to $105 million in 2016, primarily due to an increase in the spot gold prices labouroffset by a decrease in production.
Retrenchment costs
Retrenchment costs included in cost of sales increased from $11 million in 2015 to $14 million in 2016, which represents a $3 million, or 27 percent, increase. Retrenchment costs recorded for the year ended 31 December 2016 resulted from the rationalisation of operations in the South African region partially offset by a decrease in the South American region.
Rehabilitation costs
Rehabilitation costs increased from a credit of $25 million in 2015 to a charge of $17 million in 2016, which represents a $42 million increase. The increase was due to changes to cash flows, inflation rates and discount rates compared to 2015.
Amortisation of tangible and intangible assets
Amortisation of tangible and intangible assets expense increased by $32 million, or four percent, to $809 million in 2016 from $777 million in 2015. Amortisation of tangible assets increased by $52 million largely due to higher deferred stripping amortisation at Geita due to higher tonnes mined resulting from a change in the mine plan, higher amortisation at Cerro Vanguardia and at Sunrise Dam due to higher production. The increase was partially offset by an allocation of amortisation costs to care and maintenance costs in 2016 due to the transitioning of Obuasi into care and maintenance. Amortisation of intangible assets is $20 million lower than 2015 mainly due to decreased amortisation of software and licenses at the South African operations.
Other expenses
Other operating expenses increased from $96 million in 2015 to $110 million in 2016, which represents a $14 million, or 15 percent increase. The increase was mainly due to an increase in pension and medical fund provisions of $7 million and government fiscal claims and tailing operations of $7 million. Corporate expenses decreased by $17 million in 2016 compared to 2015 as a result of ongoing cost-cutting measures implemented in the company. Exchange losses increased by $71 million as a result of changes in currencies in which the company transacts.
Special items
Special items decreased from $71 million in 2015 to $42 million in 2016, which represents a $29 million, or 41 percent, decrease. This decrease was mainly due to a decrease of repurchase premium and cost on settlement of bonds of $31 million and a decrease in impairments of $17 million not repeated in 2015, offset by a decrease in indirect tax recoveries of $18 million not repeated in 2015.
Finance costs and service relatedunwinding of obligations
Finance costs decreased by $65 million, or 29 percent, to $158 million in 2016, compared to $223 million in 2015. The decrease was mainly due to a reduction of $65 million of interest attributable to the redeemed $1.25 billion 8.5 percent bond issued in July 2013. Unwinding of obligations expense of $22 million was recorded in 2016 compared with $22 million in 2015.
Share of associates and joint ventures’ profit
Share of associates and joint ventures’ profit decreased to $11 million in 2016 compared to $88 million in 2015, mainly as a result of the decrease in operating profits due to an increase in operating costs and a decrease in revenue due to lower production partially offset by an increase in production.the gold price received. Net impairments reversals decreased to $6 million in 2016 from $24 million in 2015.
InTaxation
A taxation expense of $189 million was recorded in 2016, compared to an expense of $211 million in 2015. Charges for current tax in 2016 amounted to $234 million, compared to $192 million in 2015. The increase in tax is mainly due to higher current tax in Argentina, Ghana and Guinea based on higher earnings. Charges for deferred tax in 2016 amounted to a net deferred tax benefit of $45 million compared to a net deferred tax expense of $19 million in 2015. The decrease in deferred taxation is largely due to foreign exchange effects on the United States, at Cripple Creek, total cash costs increasedtranslation ofnon-monetary items in Brazil and Argentina and adjustments on taxable items in North America and Australia, partly offset by 15an increase in deferred tax in South Africa.
Comparison of financial performance in 2015 with 2014
Gold income
Gold income decreased by $937 million, or 19 percent, or $94from $4,952 million in 2014 to $4,015 million in 2015. This decrease was due to the395,000-ounce decrease in production from continuing operations, which resulted in a decrease in gold income of $458 million, and the decrease in the average spot price of gold of $107 per ounce, or eight percent, from $1,266 per ounce during 2014 to $732$1,159 per ounce in 2013 from $638 per ounce2015. The decrease in 2012 due primarily to a declinethe price of gold resulted in production, rising commodity prices (stores, in particular) and increased labour costs. In Brazil at AngloGold Ashanti Córrego do Sítio Mineração, total cash costs decreased by 7 percent to $646 per ounce in 2013 from $696 per ounce in 2012 primarily due to a decrease in service related costs and higher production. At Serra Grande total cash costsgold income of $452 million.
Gold income from the South African operations in 2015 decreased by 12$395 million, or 26 percent, or $102 per ounce to $719 per ounce$1,132 million from $1,527 million in 20132014, mainly as compared to $821 per ouncea result of the decrease in 2012 due toproduction of 219,000 attributable ounces, primarily as a result of safety related stoppages across the regional portfolio as well as lower volumes and grade mined, which accounted for $253 million of the decrease in gold income. Gold income further decreased as a result of the decrease in the average spot price of gold, which resulted in a decrease in service relatedgold income of $131 million.
Gold income from the Continental Africa operations (including associates and store costs.
In Australia, total cash costsequity accounted joint ventures) decreased by $164$381 million, or 18 percent, to $1,724 million in 2015 from $2,105 million in 2014, mainly as a result of the decrease in production of 163,000 attributable ounces, which resulted in a decrease of gold income of $188 million. The decrease in production was mainly due to Obuasi moving into a limited operations phase in 2015. Gold income further decreased as a result of the decrease in the average spot price of gold, which resulted in a decrease in gold income of $171 million.
Gold income from Australia decreased by $119 per ounce, or 1415 percent, from $785 million in 2014 to $1,047$666 million in 2015. The decrease was due to the59,000-ounce decrease in production in 2015, which resulted in a decrease in gold income of $69 million. The decrease in production was mainly as a result of lower grades mined at Sunrise Dam. Gold income further decreased as a result of the decrease in the average spot price of gold, which resulted in a decrease in gold income of $66 million.
Gold income from the Americas operations decreased by $37 per ounce, or four percent, from $1,004 million in 2013 from $1,211 per ounce2014 to $967 million in 2012.
In Australia, at Sunrise Dam, total cash costs decreased in 2013 to $1,110 per ounce compared to $1,126 per ounce in 2012,2015 mainly due to an increase in production and the weakeningas a result of the Australian Dollar.decrease in the average spot price of gold, which resulted in a decrease in gold income of $84 million. The decrease was partially offset by an increase in production of 46,000 attributable ounces, which resulted in an increase in gold income of $53 million. The increase in production was mainly due to higher tonnes treated and higher grades mined at Cerro Vanguardia.
Cost of sales
Cost of sales decreased from $3,972 million in 2014 to $3,294 million in 2015, which represents a $678 million or 17 percent decrease which was largely due to the $551 million decrease in cash operating costs which was as a result of Obuasi mine being put into limited production during the course of 2015.
In addition, there were further decreases in royalties, retrenchment costs, total amortisation and rehabilitation and othernon-cash costs. The latter resulted in a credit movement of $76 million from a charge of $66 million in 2015 to a credit of $10 million in 2016. This decrease arose from the changes to cash flows, inflation rates and discount rates compared to 2015.
Total cash costs
Total cash costs decreased from $3,071 million in 2014 to $2,493 million in 2015, which represents a $578 million, or 19 percent decrease. The decrease was primarily due to a decrease in salaries and wages costs, stores and other consumables costs, fuel and power costs, contractor costs, service related costs, retrenchment costs and rehabilitation costs.
Labour costs decreased from $1,048 million in 2014 to $869 million in 2015, which represents $179 million, or 17 percent, decrease. In particular, labour costs decreased by $78 million at Obuasi in Ghana following the move to limited operations and by $66 million at the South African operations due to labour profile reduction and completion of Savuka integration project.
Consumable stores decreased from $607 million in 2014 to $519 million in 2015, which represents an $88 million, or 14 percent, decrease. The decrease was mainly due to the scaling down of operations at Obuasi in Ghana and cost saving initiatives.
Fuel and power costs decreased from $609 million in 2014 to $443 million in 2015, which represents a $166 million, or 27 percent, decrease. The decrease was mainly due to decreased mining at Obuasi following the move to limited operations during the first quarter of 2015 and the decrease in fuel prices.
Contractor costs for the group decreased from $505 million in 2014 to $460 million in 2015, which represents a $45 million, or nine percent, decrease. The decrease in contractor costs was primarily a result of the completion of open pit mining at Sunrise Dam in Australia and the weakening of the Australian dollar against the US dollar which resulted in a decrease of $32 million.
Service related costs decreased from $255 million in 2014 to $184 million in 2015, which represents a $71 million, or 28 percent, decrease. This decrease was mainly due to a decrease of services costs at the South African operations, at Obuasi, Serra Grande and Córrego do Sítio and other cash costs at the South African operations and Australia. The decrease was partially offset by a reduction of Capital Ore Reserve Development credits at the South African operations and Obuasi in Ghana.
Retrenchment costs
Retrenchment costs included in cost of sales decreased from $24 million in 2014 to $11 million in 2015, which represents a $13 million, or 54 percent, decrease. Retrenchment costs recorded for the year ended 31 December 2015 resulted from the rationalisation of operations in the South African, Americas, Australia and Continental Africa regions.
Rehabilitation costs
Rehabilitation costs decreased from $66 million in 2014 to a credit of $10 million in 2015, which represents a $76 million decrease. The decrease was due to changes to cash flows, inflation rates and discount rates compared to 2014.
Amortisation of tangible and intangible assets
Amortisation of tangible and intangible assets expense decreased by $6 million, or one percent, to $777 million in 2015 from $783 million in 2014. Amortisation of tangible assets decreased by $12 million largely due to lower amortisation at the South African operations following fatalities and safety stoppages that impacted the production profile and depreciation charge, as well as lower production at Sunrise Dam and Tropicana. The decrease was partly offset by higher amortisation at Geita due to higher production and higher deferred stripping amortisation resulting from a change in mining strategy, higher deferred stripping amortisation at Cerro Vanguardia due to increased ore production, higher amortisation at Córrego do Sítío due to higher production, additional capital expenditure and lower Ore Reserves and higher amortisation at Iduapriem due to higher production. Amortisation of intangible assets is $6 million higher than 2014 due to the amortisation of software and licenses across the Brazilian operations.
Exploration and evaluation costs
Exploration and evaluation costs decreased from $142 million in 2014 to $132 million in 2015, which represents a $10 million, or seven percent, decrease, mainly due to a decrease in prefeasibility expenditure at La Colosa in Colombia. For a discussion of AngloGold Ashanti’s exploration activities in 2015, see “Item 4B: Business Overview–Exploration review”.
Other expenses
Expenses during 2015 include care and maintenance expenditure incurred at Obuasi in Ghana which was incurred when the mine transitioned to limited operations. During 2014, prior to transition, retrenchment costs of $210m were incurred at Obuasi.
The $1.25 billion bonds which were partially redeemed during 2015 incurred a settlement premium of $61 million and a fair value movement on the bonds of $83 million was recognised in the income statement.
Special items
In 2015, AngloGold Ashanti recorded impairments and derecognition of goodwill, tangible and intangible assets amounting to $5 million, compared to net impairments amounting to $10 million in 2014. The $5 million related to the derecognition of assets not expected to generate cash flows at the South African operations. See “Item 18: Note 16–Tangible assets” and “Item 18: Note 17–Intangible assets”.
Finance costs and unwinding of obligations
Finance costs (net of amounts capitalised) decreased by $28 million, or 11 percent, to $223 million in 2015, compared to $251 million in 2014. The decrease was mainly due to a reduction of $17 million of interest attributable to the partially redeemed $1.25 billion 8.500 percent notes issued in recovery from settled insurance claims asJuly 2013 and $11 million attributable to interest on bank debt due to AngloGold Ashanti Australia Limited settling an existing A$600 million four-year revolving credit facility and entering into a new A$500 million five-year revolving credit facility during July 2014. Unwinding of obligations expense of $22 million was recorded in 2015 compared with 2012$25 million in 2014 and relates mainly to the decrease in the decommissioning obligation in Australia and the restoration obligation in Ghana. See “Item 18: Note 8–Finance costs and unwinding of obligations”.
Share of associates and joint ventures’ profit
Share of associates and joint ventures’ profit (loss) changed from a loss of $25 million in 2014 to a profit of $88 million in 2015, mainly as a result of the increase in operating profits due to lower operating costs partially offset by a decrease in revenue due to lower production and gold price received. Net impairments decreased from a charge of $5 million in 2014 to a reversal of $24 million in 2015. Refer “Item 18: Note 9–Share of associates and joint ventures’ profit (loss)”.
Taxation
A taxation expense of $211 million was recorded in 2015, compared to an expense of $225 million in 2014. Charges for current tax in 2015 amounted to $192 million, compared to $170 million in 2014. The increase in the current tax charge in 2015 was mainly due to higher tax provisions in Geita, Brazil and Australia due to higher profits. Charges for deferred tax in 2015 amounted to a net deferred tax expense of $19 million compared to a net deferred tax expense of $55 million in 2014. The decrease in the deferred tax charge in 2015 is mainly due to lower deferred tax in South Africa (related to the change in estimated deferred tax rate and the weakening of the Rand) and First Uranium. Refer “Item 18: Note 13–Taxation”.
Discontinued operations
A loss of $116 million was recorded in 2015, compared to a profit of $16 million in 2014. The Cripple Creek & Victor operation in the United States has been accounted for as a discontinued operation. Refer “Item 18: Note 10–Discontinued operations”.
Capital expenditure
The following table presents capital expenditure data for the AngloGold Ashanti group for the three-year period ended 31 December 2016:
| Capital expenditure data for AngloGold Ashanti | Year ended December 31 | |||||||||||
| 2016 | 2015 | 2014 | ||||||||||
Capital expenditure (million US dollars) | 811 | 857 | 1,209 | |||||||||
- Consolidated entities | 711 | 726 | 1,018 | |||||||||
- Equity accounted joint ventures | 100 | 131 | 191 | |||||||||
Total capital expenditure was $811 million in 2016 compared to $799 million (excluding discontinued operations) in 2015. This represents a $12 million, or two percent, increase from 2015. The increase in capital expenditure during which there was a reimbursement2016 is due to increased capital expenditure on existing operations ($65 million) partially offset by reduced expenditure on growth related projects ($53 million). Capital expenditure increased at Tropicana, in Australia, by $28 million due to an increase in deferred waste stripping of costs$18 million and more spend on sustaining capital of $10 million. Capital expenditure increased by $33 million at Córrego do Sítío due to the raising of the tailings dam, an increase in stay in business spending, an increase in primary development and exploration cost partially offset by the weakening of the local currency against the US dollar. Capital expenditure increased by $10 million at Serra Grande due to increased ore reserve development and the conversion of the leaching process, partially offset by the weakening of the local currency against the US dollar. Capital expenditure increased by $30 million at Siguiri due to cost incurred relating to the pitwall failurecombination plant project and sustainability project. The increase in capital expenditure was partially offset by a decrease of $24 million in South Africa due to a weaker exchange rate, a decrease of $17 million at Sunrise Dam (Australia) inObuasi due to the amountmine transitioning to care and maintenance, a decreased of $30 million. At Tropicana Gold Mine total cash costs were $568 per ounce in 2013. Tropicana began commercial production in October 2013.
Overall the company’s total cash costs in 2013 increased marginally$32 million at Kibali due to $830 per ounce compared to $829 per ounce in 2012. Of these increased costs, inflation accounted for $51 per ounce and unfavourable inventory movements accounted for $10 per ounce,decreased spending on growth projects partly offset by higher productionore reserve development and a decrease of $8 million at Cerro Vanguardia mainly due to a weaker local exchange rate.
Total capital expenditure was $857 million in 2015 compared to $1,209 million in 2014. This represents a $352 million, or 29 percent, decrease from 2014. The decrease in capital expenditure during 2015 relates to reduced capital expenditure on
existing operations ($177 million) and growth related projects ($175 million). Capital expenditure decreased at Cripple Creek & Victor by $111 million due to the mine being sold in August 2015, at Córrego do Sitió by $38 million due to capital savings mainly related to the Cuiabá tailings dam, at Obuasi by $59 million due to current operations reduced to limited operation status, at Kibali by $55 million due to the completion of the sulphide plant and infrastructure in 2014 and in the South Africa region by $58 million due to regulatory stoppages limiting access to working areas, Phase 1 project operational delays, deferral of equipment deliveries and slower than anticipated mechanised support installation. Capital expenditure also decreased due to the weakening of local currencies.
Comparison of financial performance on a segment basis for 2016, 2015 and 2014
The company produces gold as its primary product and does not have distinct divisional segments in terms of principal business activity, but manages its business on the basis of different geographic segments. Therefore, information regarding separate geographic segments is provided.
Gold income
| (in millions) | Year ended 31 December | |||||||||||||||||||||||
| 2016 | 2015 | 2014 | ||||||||||||||||||||||
| $ | percent | $ | percent | $ | percent | |||||||||||||||||||
Geographical analysis of gold income by origin is as follows: | ||||||||||||||||||||||||
South Africa | 1,173 | 29 | 1,132 | 27 | 1,527 | 29 | ||||||||||||||||||
Continental Africa | 1,663 | 41 | 1,724 | 42 | 2,105 | 40 | ||||||||||||||||||
Australasia | 646 | 16 | 666 | 16 | 785 | 15 | ||||||||||||||||||
Americas | 1,036 | 25 | 967 | 23 | 1,004 | 19 | ||||||||||||||||||
| 4,518 | 4,489 | 5,421 | ||||||||||||||||||||||
Less : Associates and equity accounted joint ventures included above | (433 | ) | (11 | ) | (474 | ) | (11 | ) | (469 | ) | (8 | ) | ||||||||||||
Continuing operations | 4,085 | 4,015 | 4,952 | |||||||||||||||||||||
Discontinued operations | - | - | 137 | 3 | 266 | 5 | ||||||||||||||||||
| 4,085 | 100 | 4,152 | 100 | 5,218 | 100 | |||||||||||||||||||
132Assets
| (in millions) | Year ended 31 December | |||||||||||||||||||||||
| 2016 | 2015 | 2014 | ||||||||||||||||||||||
| $ | percent | $ | percent | $ | percent | |||||||||||||||||||
Geographical analysis of assets by origin is as follows: | ||||||||||||||||||||||||
South Africa | 1,818 | 26 | 1,629 | 22 | 2,124 | 23 | ||||||||||||||||||
Continental Africa | 3,090 | 43 | 3,121 | 43 | 3,239 | 36 | ||||||||||||||||||
Australasia | 804 | 11 | 837 | 12 | 906 | 10 | ||||||||||||||||||
Americas | 1,273 | 18 | 1,341 | 18 | 2,409 | 26 | ||||||||||||||||||
Other, includingnon-gold producing subsidiaries | 168 | 2 | 356 | 5 | 456 | 5 | ||||||||||||||||||
Total assets | 7,153 | 100 | 7,284 | 100 | 9,134 | 100 | ||||||||||||||||||
At 31 December 2016, 26 percent of AngloGold Ashanti’s total assets were located in South Africa compared with 22 percent at the end of 2015. The remaining operations collectively accounted for 74 percent of AngloGold Ashanti’s total assets at 31 December 2016 compared to 78 percent at the end of the same period in 2015.
At 31 December 2015, 22 percent of AngloGold Ashanti’s total assets were located in South Africa compared with 23 percent at the end of 2014. The remaining operations collectively accounted for 78 percent of AngloGold Ashanti’s total assets at 31 December 2015 compared to 77 percent at the end of the same period in 2014.
Non-GAAP analysis
Reconciliation ofall-in sustaining costs andall-in costs to cost of sales per the financial statements
During June 2013, the World Gold Council (WGC), an industry body, published a Guidance Note on “all-in“all-in sustaining costs” and “all-in“all-in costs” metrics, which gold mining companies can use to supplement their overallnon-GAAP disclosure. The WGC worked closely with its members (including AngloGold Ashanti) to develop thesenon-GAAP measures which are intended to provide further transparency into the full cost associated with producing gold. It is expected that these new metrics, in particular the “all-in“all-in sustaining cost” and “all-in“all-in cost” metrics which AngloGold Ashanti provides in this annual report on Form20-F, will be helpful to investors, governments, local communities and other stakeholders in understanding the economics of gold mining. “All-in“All-in sustaining costs” is an extension of the existing “cash“total cash cost” metric and incorporates all costs related to sustaining production and in particular, recognises the sustaining capital expenditures associated with developing and maintaining gold mines. In addition, this metric includes the cost associated with Corporate Office structures that support these operations, the community and rehabilitation costs attendant with responsible mining and any exploration and evaluation cost associated with sustaining current operations. “All-in“All-in sustaining costs per ounce” is arrived at by dividing the dollar value of the sum of these cost metrics, by the ounces of gold sold. “All-in“All-in cost” includes additional costs which reflect the varying costs of producing gold over the life-cycle of a mine including costs incurred at new operations and costs related to major projects at existing operations, which are expected to increase production. “All-in“All-in cost per ounce” is arrived at by dividing the dollar value of the sum of these cost metrics, by the ounces of gold sold.
Reconciliation of total cash costs and total production costs to financial statements
Total cash costs and total production costs are calculated in accordance with the guidelines of the Gold Institute industry standard and industry practice and arenon-GAAP measures. The Gold Institute, which has been incorporated into the National Mining Association, is anon-profit international association of miners, refiners, bullion suppliers and manufacturers of gold products, which developed a uniform format for reporting total productioncash costs on a per ounce basis. The guidance was first adopted in 1996 and revised in November 1999.
Total cash costs, as defined in the Gold Institute industry guidelines, are production costs as recorded in the statement of operations, less offsite (i.e. central), general and administrative expenses (including head office costs charged to the mines, central training expenses, industry association fees, refinery charges and social development costs) and rehabilitation costs, plus royalties and employee termination costs.
Total cash costs as calculated and reported by AngloGold Ashanti include costs for all mining, processing, onsite administration costs, royalties and production taxes, as well as contributions fromby-products, but exclusive of amortisation of tangible and intangible assets, rehabilitation costs and othernon-cash costs, retrenchment costs, corporate administration, marketing and other costs, capital costs and exploration costs. Total cash costs per ounce are calculated by dividing attributable total cash costs by attributable ounces of gold produced.
Total production costs, as defined in the Gold Institute industry guidelines, are total cash costs, as calculated using the Gold Institute industry guidelines, plus amortisation, depreciation and rehabilitation costs.
Total production costs as calculated and reported by AngloGold Ashanti include total cash costs, plus amortisation of tangible and intangible assets, retrenchment costs and rehabilitation and other non-cash costs. Total production costs per ounce are calculated by dividing attributable total production costs by attributable ounces of gold produced.
All-in sustaining costs,all-in sustaining costs per ounce,all-in costs,all-in costs per ounce, total cash costs total cash costs per ounce, total production costs and total productioncash costs per ounce should not be considered by investors in isolation or as alternatives to production costs,cost of sales, profit/(loss) applicable to equity shareholders, profit/(loss) before taxation, cash flows from operating activities or any other measure of financial performance presented in accordance with IFRS or as an indicator of the company’s performance. While the WGC has published guidance on how to defineall-in sustaining costs andall-in costs and the Gold Institute has provided definitions for the calculation of total cash costs and total production costs, the calculation of these metrics may vary significantly among gold mining companies, and by themselves do not necessarily provide a basis for comparison with other gold mining companies.
133
However, AngloGold Ashanti believes thatall-in sustaining costs,all-in costs, total cash costs and total productioncash costs in total by mine and per ounce by mine, are useful indicators to investors and management as they provide:
an indication of profitability, efficiency and cash flows;
the trend in costs as the mining operations mature over time on a consistent basis; and
an internal benchmark of performance to allow for comparison against other mines, both within the AngloGold Ashanti group and at other gold mining companies.
A reconciliation of both cost of sales and total cash costs as included in the company’s audited financial statements toall-in sustaining costs,all-in costs, total cash costs and total productioncash costs for each of the three years in the period ended 31 December 20142016 is presented below. In addition, the company has provided below detail of the attributable ounces of gold produced and sold by mine for each of those periods.
The following table presents selected operating data for the AngloGold Ashanti group for the three-year period ended 31 December 2016:
| Operating data for AngloGold Ashanti | Year ended December 31 | |||||||||||
| 2016 | 2015 | 2014 | ||||||||||
Total cash costs (million US dollars) – per financial statements(1) | 2,435 | 2,493 | 3,071 | |||||||||
All-in sustaining costs ($/oz)(2) | 986 | 910 | 1,020 | |||||||||
All-in costs ($/oz)(2) | 1,071 | 1,001 | 1,114 | |||||||||
Total cash costs ($/oz)(2) | 744 | 712 | 785 | |||||||||
- Equity accounted joint ventures | 100 | 131 | 191 | |||||||||
134
| (1) | Excludes discontinued operations. |
| (2) | All-in sustaining costs,all-in costs and total cash costs arenon-GAAP measures. |
Totalall-in sustaining costs,all-in costs and total cash costs
For a detailed reconciliation ofall-in sustaining costs,all-in costs and total cash costs see “Operations” tables.
Comparison ofall-in sustaining costs in 2016 with 2015
All-in sustaining costs per ounce (excluding stockpile impairments) in South Africa decreased in 2016 by $7 per ounce, or one percent, to $1,081 per ounce from $1,088 per ounce in 2015. The decrease was a result of the weakening of the rand. The decrease was partially offset by a40,000-ounce decrease in gold sold.
In Continental Africa,all-in sustaining costs (excluding stockpile impairments) increased by $89 per ounce, or 11 percent, to $904 per ounce in 2016 from $815 per ounce in 2015. This increase was mainly due to a93,000-ounce decrease in gold sold (excludingpre-production ounces) and an increase in sustaining capital expenditure due to increased spending on Kibali. The increase was partially offset by a decrease in cost of sales.
In the Americas,all-in sustaining costs (excluding stockpile impairments) increased by $83 per ounce, or 10 percent, to $875 per ounce in 2016 from $792 per ounce in 2015. This increase was mainly due to an increase in costs of sales, sustaining capital expenditure and a decrease of21,000-ounces in gold sold in 2016.
In Australia,all-in sustaining costs increased by $192 per ounce, or 22 percent, to $1,067 per ounce in 2016 from $875 per ounce in 2015. This increase was mainly due to an increase in costs of sales, sustaining capital expenditure and a decrease of56,000-ounces in gold sold in 2016.
Comparison ofall-in costs in 2016 with 2015
All-in costs per ounce (excluding stockpile impairments) in South Africa decreased by $9 per ounce, or one percent, to $1,122 per ounce in 2016 from $1,131 per ounce in 2015. The decrease was a result of the weakening of the rand. The decrease was partially offset by a40,000-ounce decrease in gold sold.
In Continental Africa,all-in costs (excluding stockpile impairments) increased by $73 per ounce, or eight percent, to $1,030 per ounce in 2016 from $957 per ounce in 2015. This increase was mainly due to a153,000-ounce decrease in gold sold (excludingpre-production ounces). This increase was partially offset by a decrease innon-sustaining project capital expenditure, due to a cessation of work on capital projects at Obuasi in 2016 and a decrease in major project spending at Kibali as projects were completed and commissioned.
In the Americas,all-in costs (excluding stockpile impairments) increased by $74 per ounce, or eight percent, to $959 per ounce in 2016 from $885 per ounce in 2015. This increase was mainly due to an increase inall-in sustaining costs and a21,000-ounce decrease in gold sold.
In Australia,all-in costs decreased by $195 per ounce, or 22 percent, to $1,081 per ounce in 2016 from $886 per ounce in 2015, mainly due to an increase inall-in sustaining costs and a56,000-ounce decrease in gold sold in 2016.
Comparison of total cash costs in 2016 with 2015
The currencies of South Africa, Australia, Argentina and Brazil were, on average, weaker against the US dollar during 2016 as compared to 2015 which positively impacted total cash costs for 2016.
In South Africa, total cash costs increased by $15 per ounce, or two percent, to $896 per ounce in 2016 from $881 per ounce in 2015. The increase was mainly due to a37,000-ounce decrease in production partially offset by the weakening of the rand.
At Kopanang, total cash costs increased by $310 per ounce, or 31 percent, to $1,324 per ounce in 2016 from $1,014 per ounce in 2015. The increase was mainly due to26,000-ounce decrease in production partially offset by the weakening of the rand.
At Tau Tona total cash costs increased by $265 per ounce, or 30 percent, to $1,148 per ounce in 2016 from $883 per ounce in 2015. The increase was mainly due to63,000-ounce decrease in production partially offset by the weakening of the rand.
At Moab Khotsong, total cash costs decreased by $69 per ounce, or nine percent, to $729 per ounce in 2016 from $798 per ounce in 2015. The decrease was mainly due to a26,000-ounce increase in production.
At Mponeng, total cash costs decreased by $95 per ounce, or 11 percent, to $779 per ounce in 2016 from $874 per ounce in 2015. The decrease was mainly due to a35,000-ounce increase in production and the weakening of the rand.
At the Surface Operations, total cash costs decreased by $13 per ounce, or one percent, to $899 per ounce in 2016 from $912 per ounce in 2015. The decrease was mainly due to the weakening of the rand, partially offset by a7,000-ounce decrease in production.
In Continental Africa, total cash costs increased by $39 per ounce, or six percent, to $717 per ounce in 2016 from $678 per ounce in 2015. The increase was mainly due to an114,000-ounce decrease in production (excludingpre-production ounces) offset by a decrease in salaries and wages costs, fuel costs and power costs and service related costs.
Total cash costs at Geita, in Tanzania, increased by $50 per ounce, or 10 percent, to $530 per ounce in 2016 from $480 per ounce in 2015. The increase was mainly due the49,000-ounce decrease in production (excludingpre-production ounces).
In Mali, at Morila, total cash costs increased by $425 per ounce, or 61 percent, to $1,123 per ounce in 2016 from $698 per ounce in 2015. The increase was mainly due to the27,000-ounce decrease in production partially offset by a decrease in stores and consumables costs, fuel costs, contractor costs and service related costs. At Sadiola, total cash costs increased by $173 per ounce, or 21 percent, from $818 per ounce in 2015 to $991 per ounce in 2016. This increase was primarily due to an increase in service related costs partially offset by a1,000-ounce increase in production.
In Ghana, at Obuasi, total cash costs decreased by 83 percent in 2016 to $167 per ounce compared to $966 per ounce in 2015 mainly due to the transition to care and maintenance. At Iduapriem, in Ghana, total cash costs decreased by $87 per ounce, or nine percent, to $908 per ounce in 2016 compared to $995 per ounce in 2015 mainly due to a21,000-ounce increase in production. At Siguiri, in Guinea, total cash costs decreased by five percent to $784 per ounce in 2016 from $827 per ounce in 2015 mainly due to a5,000-ounce increase in production a decrease in salaries and wages costs, fuel costs and service related costs.
In the DRC, at Kibali, total cash costs increased by $131 per ounce, or 22 percent, to $740 per ounce in 2016 from $609 per ounce in 2015 mainly due to the decrease of25,000-ounce in production and an increase in contractor and consumable store costs.
In the Americas, total cash costs increased by $2 per ounce to $578 per ounce in 2016 from $576 per ounce in 2015. The increase was mainly due to a 11,000 ounce decrease (excludingpre-production ounces) in production partially offset by an increase in silver revenue due to a higher average silver price in 2016 compared to 2015 and an increase in silver sold from 4.1 million ounces in 2015 to 5.1 million ounces in 2016.
In Brazil, at AngloGold Ashanti Córrego do Sítío Mineração, total cash costs increased by $44 per ounce, or eight percent, to $562 per ounce in 2016 from $518 per ounce in 2015 primarily due to a14,000-ounce decrease in production and increases in salaries and wages costs, consumables store costs and fuel costs.
In Argentina at Cerro Vanguardia, total cash costs decreased to $563 per ounce in 2016 from $625 per ounce in 2015 primarily due to a 3,000 ounces increase in production and an increase in silver revenue due to a higher average silver price in 2016 compared to 2015 and an increase in silver sold from 4.1 million ounces in 2015 to 5.1 million ounces in 2016 and reimbursement by the Government in respect of exports channelled through Patagonian ports.
In Australia, total cash costs increased by $91 per ounce, or 13 percent, to $793 per ounce in 2016 from $702 per ounce in 2015 primarily due to a40,000-ounce decrease in production and an increase in silver related costs.
At Sunrise Dam, total cash costs decreased by $44 per ounce, or five percent, to $926 per ounce in 2016 compared to $970 per ounce in 2015, mainly due to a12,000-ounce increase in production.
At Tropicana total cash costs increased by $138 per ounce, or 28 percent, to $630 per ounce in 2016 compared to $492 per ounce in 2015, mainly due to a52,000-ounce decrease in production and increases and consumables store costs, fuel costs and service related costs.
Overall the company’s total cash costs increased by $32 per ounce, or four percent, to $744 per ounce in 2016 compared to $712 per ounce in 2015. The increase was mainly due to a212,000-ounce decrease in production.
Comparison ofall-in sustaining costs in 2015 with 2014
All-in sustaining costs per ounce (excluding stockpile impairments) in South Africa increased in 2015 by $24 per ounce, or two percent, to $1,088 per ounce from $1,064 per ounce in 2014. The increase was a result of a218,000-ounce decrease in gold sold in 2015 over 2014. The increase was partially offset by the weakening of the rand and a decrease of cost of sales.
In Continental Africa,all-in sustaining costs (excluding stockpile impairments) decreased by $153 per ounce, or 16 percent, to $815 per ounce in 2015 from $968 per ounce in 2014. This decrease was mainly due to a decrease in cost of sales and total sustaining capital expenditure. The decrease was partially offset by a174,000-ounce decrease in gold sold.
In the Americas,all-in sustaining costs (excluding stockpile impairments) decreased by $182 per ounce, or 19 percent, to $792 per ounce in 2015 from $974 per ounce in 2014. This decrease was mainly due to a decrease in costs of sales and an increase of 41,000 ounces in gold sold in 2015.
In Australia,all-in sustaining costs decreased by $111 per ounce, or 11 percent, to $875 per ounce in 2015 from $986 per ounce in 2014, mainly due to a decrease in cost of sales in 2015, which was partially offset by a47,000-ounce decrease in gold sold in 2015 and a decrease in amortisation.
Comparison ofall-in costs in 2015 with 2014
All-in costs per ounce (excluding stockpile impairments) in South Africa increased by $24 per ounce, or two percent, to $1,131 per ounce in 2015 from $1,107 per ounce in 2014. The increase was a result of a218,000-ounce decrease in gold sold in 2015 compared to 2014. The increase was partially offset by the weakening of the rand and a decrease inall-in sustaining costs.
In Continental Africa,all-in costs (excluding stockpile impairments) decreased by $148 per ounce, or 13 percent, to $957 per ounce in 2015 from $1,105 per ounce in 2014. This decrease was mainly due to a decrease inall-in sustaining costs andnon-sustaining project capital expenditure. The decrease was partially offset by a174,000-ounce decrease in gold sold from 1,615,000 ounces in 2014 to 1,441,000 ounces in 2015 and an increase in care and maintenance costs.
In the Americas,all-in costs (excluding stockpile impairments) decreased by $223 per ounce, or 20 percent, to $885 per ounce in 2015 from $1,108 per ounce in 2014. This decrease was mainly due to a decrease inall-in sustaining costs andnon-sustaining exploration and study costs and a41,000-ounce increase in gold sold from 788,000 ounces in 2014 to 829,000 ounces in 2015.
In Australia,all-in costs decreased by $112 per ounce, or 11 percent, to $886 per ounce in 2015 from $998 per ounce in 2014, mainly due to a decrease inall-in sustaining costs in 2015, which was partially offset by a47,000-ounce decrease in gold sold in 2015.
Comparison of total cash costs in 2015 with 2014
The currencies of South Africa, Australia, Argentina and Brazil were, on average, weaker against the US dollar during 2015 as compared to 2014 which positively impacted total cash costs for 2015.
In South Africa, total cash costs increased by $32 per ounce, or four percent, to $881 per ounce in 2015 from $849 per ounce in 2014. The increase was mainly due to a219,000-ounce decrease in production partially offset by a decrease in salaries and wages costs, power costs, service related costs and the weakening of the rand.
At Moab Khotsong, total cash costs increased by $16 per ounce, or two percent, to $798 per ounce in 2015 from $782 per ounce in 2014 (being the combined cost per ounce of the Moab Khotsong and Great Noligwa mines which are combined in 2015 as one cash-generating unit under Moab Khotsong). The increase was mainly due to a58,000-ounce decrease in production partially offset by a decrease in salaries and wages costs, service related costs and the weakening of the rand.
At Mponeng, total cash costs increased by $128 per ounce, or 17 percent, to $874 per ounce in 2015 from $746 per ounce in 2014. The increase was mainly due to a94,000-ounce decrease in production partially offset by a decrease in salaries and wage costs, service related costs and the weakening of the rand.
At Kopanang, total cash costs decreased by $9 per ounce, or one percent, to $1,014 per ounce in 2015 from $1,023 per ounce in 2014. The decrease was mainly due to a decrease in salaries and wages costs, service related costs and the weakening of the rand partially offset by a24,000-ounce decrease in production.
At the Surface Operations, total cash costs decreased by $29 per ounce, or three percent, to $912 per ounce in 2015 from $941 per ounce in 2014. The decrease was mainly due to a decrease in service-related costs and the weakening of the rand, partially offset by a30,000-ounce decrease in production.
In Continental Africa, total cash costs decreased by $105 per ounce, or 13 percent, to $678 per ounce in 2015 from $783 per ounce in 2014. The decrease was mainly due to a decrease in salaries and wages costs, stores and consumables costs, fuel costs and power costs partially offset by a162,000-ounce decrease in production.
Total cash costs at Geita, in Tanzania, decreased by $119 per ounce, or 20 percent, to $480 per ounce in 2015 from $599 per ounce in 2014. The decrease was mainly due to a decrease in fuel costs and contractor costs and a50,000-ounce increase in production.
In Mali, at Morila, total cash costs decreased by $464 per ounce, or 40 percent, to $698 per ounce in 2015 from $1,162 per ounce in 2014. The decrease was mainly due to a decrease in stores and consumables costs, fuel costs and contractor costs and a5,000-ounce increase in production. At Sadiola, total cash costs decreased by 20 percent from $1,028 per ounce in 2014 to $818 per ounce in 2015. This decrease was primarily due to a decrease in fuel costs and service related costs partially offset by a16,000-ounce decrease in production.
In Ghana, at Obuasi, total cash costs decreased by 11 percent in 2015 to $966 per ounce compared to $1,086 per ounce in 2014 mainly due to a decrease in all the costs due to the transition to a limited operating state. At Iduapriem, in Ghana, total cash costs increased by $130 per ounce, or 15 percent, to $995 per ounce in 2015 compared to $865 per ounce in 2014 mainly due to an increase in contractor costs, fuel costs and store costs partially offset by a16,000-ounce increase in production. At Siguiri, in Guinea, total cash costs increased by four percent to $827 per ounce in 2015 from $799 per ounce in 2014 mainly due to a35,000-ounce decrease in production partially offset by a decrease in consumable store costs, contractor costs, fuel costs and service related costs.
In the DRC, at Kibali, total cash costs increased by $31 per ounce, or five percent, to $609 per ounce in 2015 from $578 per ounce in 2014 mainly due to an increase in contractor and store costs, partially offset by a52,000-ounce increase in production.
In the Americas, total cash costs decreased by $100 per ounce, or 15 percent, to $576 per ounce in 2015 from $676 per ounce in 2014. The decrease was mainly due to a decrease in all costs and a46,000-ounce increase in production.
In Brazil, at AngloGold Ashanti Córrego do Sítío Mineração, total cash costs decreased by $126 per ounce, or 20 percent, to $518 per ounce in 2015 from $644 per ounce in 2014 primarily due to a18,000-ounce increase in production and a decrease in all costs. At Serra Grande total cash costs decreased by 15 percent or $113 per ounce to $635 per ounce in 2015 as compared to $748 per ounce in 2014 due to a decrease in all costs partially offset by a 4,000 ounces decrease in production. In Argentina at Cerro Vanguardia, total cash costs decreased to $625 per ounce in 2015 from $692 per ounce in 2014 primarily due to a 32,000 ounces increase in production partially offset by higher salaries and wages costs.
In Australia, total cash costs decreased by $102 per ounce, or 13 percent, to $702 per ounce in 2015 from $804 per ounce in 2014 primarily due to a decrease in all costs due to the weakening of the Australian Dollar partially offset by a 59,000 ounces decrease in production.
In Australia, at Sunrise Dam, total cash costs decreased by $135 per ounce, or 12 percent, to $970 per ounce in 2015 compared to $1,105 per ounce in 2014, mainly due to a decrease in all costs and the weakening of the Australian Dollar partially offset by a46,000-ounce decrease in production. At Tropicana total cash costs decreased by $53 per ounce, or 10 percent, to $492 per ounce in 2015 compared to $545 per ounce in 2014, mainly due to a decrease in fuel costs and the weakening of the Australian Dollar. The decrease was partially offset by a 14,000 ounces decrease in production.
Overall the company’s total cash costs decreased by $73 per ounce, or nine percent, to $712 per ounce in 2015 compared to $785 per ounce in 2014. Most of this decrease is due to, weaker local currencies of $90 per ounce and acquisitions and disposals of $17 per ounce, offset by higher inflation of $30 per ounce.
For the year ended 31 December 20142016
Operations in South Africa
(in $ millions, except as otherwise noted)
|
|
|
|
|
|
|
|
|
|
|
|
|
|
|
|
|
|
|
|
| ||||||||||||||||||||||||||||||||||||||||||||||||||||||||||||||||
All-in sustaining costs | ||||||||||||||||||||||||||||||||||||||||||||||||||||||||||||||||||||||||||||||||||||
Cost of sales per financial statements | 94 | 201 | 217 | 512 | 313 | 268 | 581 | 231 | - | 1,324 | 1 | |||||||||||||||||||||||||||||||||||||||||||||||||||||||||||||||||||||||||
Cost of sales per segmental information(5) | 144 | 255 | 400 | 259 | 198 | 457 | 185 | (1 | ) | 1,041 | 5 | |||||||||||||||||||||||||||||||||||||||||||||||||||||||||||||||||||||||||
Amortisation of tangible and intangible assets | (8 | ) | (50 | ) | (50 | ) | (107 | ) | (71 | ) | (58 | ) | (129 | ) | (22 | ) | 1 | (258 | ) | (8 | ) | (20 | ) | (49 | ) | (69 | ) | (55 | ) | (28 | ) | (83 | ) | (14 | ) | - | (166 | ) | (6 | ) | ||||||||||||||||||||||||||||||||||||||||||||
Adjusted for decomissioning amortisation | 1 | - | - | 1 | - | - | - | 1 | (2 | ) | - | - | ||||||||||||||||||||||||||||||||||||||||||||||||||||||||||||||||||||||||
Adjusted for decommissioning amortisation | - | - | - | - | - | - | - | 1 | 1 | (2 | ) | |||||||||||||||||||||||||||||||||||||||||||||||||||||||||||||||||||||||||
Corporate administration and marketing related to current operations | - | - | - | - | - | - | - | - | 1 | 1 | 85 | - | - | - | - | - | - | - | - | - | 59 | |||||||||||||||||||||||||||||||||||||||||||||||||||||||||||||||
Inventory writedown to net realisable value and other stockpile adjustments | - | - | - | - | - | - | - | - | 1 | 1 | 1 | - | - | - | - | - | - | - | 5 | 5 | (1 | ) | ||||||||||||||||||||||||||||||||||||||||||||||||||||||||||||||
Total sustaining capital expenditure | 7 | 26 | 44 | 76 | 65 | 35 | 100 | 46 | 7 | 230 | 5 | 16 | 41 | 57 | 52 | 25 | 77 | 17 | 5 | 156 | 4 | |||||||||||||||||||||||||||||||||||||||||||||||||||||||||||||||
Amortisation relating to inventory | - | - | - | - | - | - | (2 | ) | - | (2 | ) | 2 | ||||||||||||||||||||||||||||||||||||||||||||||||||||||||||||||||||||||||
All-in sustaining costs | 94 | 177 | 211 | 482 | 307 | 245 | 552 | 256 | 8 | 1,298 | 84 | 140 | 247 | 388 | 256 | 195 | 451 | 186 | 10 | 1,035 | 61 | |||||||||||||||||||||||||||||||||||||||||||||||||||||||||||||||
Adjusted for non-controlling interests and non-gold producing companies(1) | - | - | - | - | - | - | - | - | - | - | 6 | |||||||||||||||||||||||||||||||||||||||||||||||||||||||||||||||||||||||||
All-in sustaining costs adjusted for non-controlling interests and non-gold producing companies | 94 | 177 | 211 | 482 | 307 | 245 | 552 | 256 | 8 | 1,298 | 90 | 140 | 247 | 388 | 256 | 195 | 451 | 186 | 10 | 1,035 | 61 | |||||||||||||||||||||||||||||||||||||||||||||||||||||||||||||||
Adjusted for stockpile write-offs | - | - | - | - | - | - | - | - | (1 | ) | (1 | ) | (1 | ) | - | - | - | - | - | - | - | (5 | ) | (5 | ) | - | ||||||||||||||||||||||||||||||||||||||||||||||||||||||||||
All-in sustaining costs adjusted for non-controlling interests, non-gold producing companies and stockpile write-offs | 94 | 177 | 211 | 482 | 307 | 245 | 552 | 256 | 7 | 1,297 | 89 | 140 | 247 | 388 | 256 | 195 | 451 | 186 | 5 | 1,030 | 61 | |||||||||||||||||||||||||||||||||||||||||||||||||||||||||||||||
All-in sustaining costs | 94 | 177 | 211 | 482 | 307 | 245 | 552 | 256 | 8 | 1,298 | 84 | 140 | 247 | 388 | 256 | 195 | 451 | 186 | 10 | 1,035 | 61 | |||||||||||||||||||||||||||||||||||||||||||||||||||||||||||||||
Non-sustaining Project Capital expenditure | - | - | 2 | 2 | 32 | - | 32 | - | - | 34 | - | |||||||||||||||||||||||||||||||||||||||||||||||||||||||||||||||||||||||||
Non-sustaining Project capex | - | 2 | 2 | 24 | - | 24 | - | (1 | ) | 25 | - | |||||||||||||||||||||||||||||||||||||||||||||||||||||||||||||||||||||||||
Technology improvements | - | - | - | - | - | - | - | - | 19 | 19 | - | - | - | - | - | - | - | - | 14 | 14 | - | |||||||||||||||||||||||||||||||||||||||||||||||||||||||||||||||
Non-sustaining exploration and study costs | - | - | - | - | - | - | - | - | - | - | 5 | - | - | - | - | - | - | - | - | - | 6 | |||||||||||||||||||||||||||||||||||||||||||||||||||||||||||||||
Corporate and social responsibility costs not related to current operations | - | - | - | - | - | - | - | - | - | - | 7 | - | - | - | - | - | - | - | - | - | 25 | |||||||||||||||||||||||||||||||||||||||||||||||||||||||||||||||
All-in costs | 94 | 177 | 213 | 484 | 339 | 245 | 584 | 256 | 27 | 1,351 | 96 | 140 | 249 | 390 | 280 | 195 | 475 | 186 | 23 | 1,074 | 92 | |||||||||||||||||||||||||||||||||||||||||||||||||||||||||||||||
Adjusted for non-controlling interests and non-gold producing companies(1) | - | - | - | - | - | - | - | - | - | - | 6 | |||||||||||||||||||||||||||||||||||||||||||||||||||||||||||||||||||||||||
All-in costs adjusted for non-controlling interests and non-gold producing companies | 94 | 177 | 213 | 484 | 339 | 245 | 584 | 256 | 27 | 1,351 | 102 | 140 | 249 | 390 | 280 | 195 | 475 | 186 | 23 | 1,074 | 92 | |||||||||||||||||||||||||||||||||||||||||||||||||||||||||||||||
Adjusted for stockpile write-offs | - | - | - | - | - | - | - | - | (1 | ) | (1 | ) | (1 | ) | - | - | - | - | - | - | - | (5 | ) | (5 | ) | - | ||||||||||||||||||||||||||||||||||||||||||||||||||||||||||
All-in costs adjusted for non-controlling interests, non-gold producing companies and stockpile write-offs | 94 | 177 | 213 | 484 | 339 | 245 | 584 | 256 | 26 | 1,350 | 101 | 140 | 249 | 390 | 280 | 195 | 475 | 186 | 18 | 1,069 | 92 | |||||||||||||||||||||||||||||||||||||||||||||||||||||||||||||||
Gold sold – oz (000)(3) | 78 | 140 | 234 | 452 | 313 | 232 | 544 | 223 | 3 | 1,223 | - | |||||||||||||||||||||||||||||||||||||||||||||||||||||||||||||||||||||||||
All-in sustaining cost (excluding stockpile write-offs) per unit – $/oz(4) | 1,185 | 1,256 | 903 | 1,061 | 981 | 1,059 | 1,014 | 1,153 | - | 1,064 | - | |||||||||||||||||||||||||||||||||||||||||||||||||||||||||||||||||||||||||
All-in cost per unit (excluding stockpile | 1,185 | 1,256 | 909 | 1,064 | 1,085 | 1,059 | 1,074 | 1,153 | - | 1,107 | - | |||||||||||||||||||||||||||||||||||||||||||||||||||||||||||||||||||||||||
Gold sold - oz (000)(2) | 91 | 279 | 369 | 253 | 146 | 398 | 185 | 10 | 964 | - | ||||||||||||||||||||||||||||||||||||||||||||||||||||||||||||||||||||||||||
All-in sustaining cost (excluding stockpile write-offs) per unit - $/oz(3) | 1,555 | 884 | 1,049 | 1,011 | 1,345 | 1,133 | 1,004 | - | 1,081 | - | ||||||||||||||||||||||||||||||||||||||||||||||||||||||||||||||||||||||||||
All-in cost per unit (excluding stockpile write-offs) - $/oz(3) | 1,555 | 890 | 1,053 | 1,105 | 1,345 | 1,193 | 1,004 | - | 1,122 | - | ||||||||||||||||||||||||||||||||||||||||||||||||||||||||||||||||||||||||||
| (1) | Adjusting fornon-controlling interest of items included in calculation, to disclose the attributable portions only. Other consists of heap leach inventory. |
| (2) |
|
Attributable portion. |
In addition to the operational performances of the mines,all-in sustaining cost per ounce,all-in cost |
Corporate includesnon-gold producing subsidiaries. |
|
135
For the year ended 31 December 20142016
Operations in South Africa
(in $ millions, except as otherwise noted)
|
|
|
|
|
|
|
|
|
|
| ||||||||||||||||||||||||||||||||||
Total cash costs | ||||||||||||||||||||||||||||||||||||||||||||
Total cash costs per financial statements | 84 | 144 | 160 | 388 | 233 | 205 | 438 | 210 | (1 | ) | 1,035 | (8 | ) | |||||||||||||||||||||||||||||||
Adjusted for non-controlling interests, non-gold producing companies and other(1) | - | - | - | - | - | - | - | - | - | - | 7 | |||||||||||||||||||||||||||||||||
Total cash costs adjusted for non-controlling interests and non-gold producing companies | 84 | 144 | 160 | 388 | 233 | 205 | 438 | 210 | (1 | ) | 1,035 | (1 | ) | |||||||||||||||||||||||||||||||
Retrenchment costs | 2 | 5 | 3 | 9 | 4 | 3 | 7 | - | (1 | ) | 16 | - | ||||||||||||||||||||||||||||||||
Rehabilitation and other non-cash costs | 1 | 3 | 4 | 8 | 4 | 3 | 8 | - | 1 | 16 | - | |||||||||||||||||||||||||||||||||
Amortisation of tangible assets | 6 | 47 | 46 | 100 | 65 | 54 | 119 | 20 | 1 | 239 | 5 | |||||||||||||||||||||||||||||||||
Amortisation of intangible assets | 1 | 2 | 4 | 8 | 5 | 4 | 9 | 2 | 1 | 19 | 3 | |||||||||||||||||||||||||||||||||
Total production costs adjusted for non-controlling interests and non-gold producing companies | 94 | 201 | 217 | 513 | 311 | 269 | 581 | 232 | 1 | 1,325 | 7 | |||||||||||||||||||||||||||||||||
Gold produced – oz (000)(3) | 78 | 141 | 234 | 453 | 313 | 232 | 544 | 223 | 3 | 1,223 | - | |||||||||||||||||||||||||||||||||
Total cash costs per unit – $/oz(4) | 1,074 | 1,023 | 685 | 857 | 746 | 882 | 804 | 941 | - | 849 | - | |||||||||||||||||||||||||||||||||
Total production costs per unit – $/oz(4) | 1,208 | 1,431 | 928 | 1,132 | 1,001 | 1,159 | 1,068 | 1,040 | - | 1,087 | - | |||||||||||||||||||||||||||||||||
|
|
|
|
|
|
|
|
|
| |||||||||||||||||||||||||||||||
Cash costs | ||||||||||||||||||||||||||||||||||||||||
Cost of sales per segmental information | 144 | 255 | 400 | 259 | 198 | 457 | 185 | (1 | ) | 1,041 | 5 | |||||||||||||||||||||||||||||
Inventory change | - | 1 | 1 | 1 | - | 1 | (1 | ) | - | 1 | - | |||||||||||||||||||||||||||||
Amortisation of intangible assets | (1 | ) | (2 | ) | (2 | ) | (1 | ) | (1 | ) | (2 | ) | (1 | ) | - | (5 | ) | (1 | ) | |||||||||||||||||||||
Amortisation of tangible assets | (19 | ) | (48 | ) | (67 | ) | (54 | ) | (27 | ) | (81 | ) | (13 | ) | - | (161 | ) | (3 | ) | |||||||||||||||||||||
Rehabilitation and othernon-cash costs | (2 | ) | 1 | (1 | ) | (3 | ) | (1 | ) | (5 | ) | (2 | ) | - | (8 | ) | - | |||||||||||||||||||||||
Retrenchment costs | (2 | ) | (3 | ) | (5 | ) | (3 | ) | (2 | ) | (5 | ) | - | (1 | ) | (11 | ) | - | ||||||||||||||||||||||
Total cash costs | 121 | 204 | 325 | 198 | 167 | 365 | 167 | - | 857 | - | ||||||||||||||||||||||||||||||
Adjusted fornon-controlling interests,non-gold producing companies and other(1) | - | - | - | - | - | - | - | - | - | 8 | ||||||||||||||||||||||||||||||
Total cash costs adjusted fornon-controlling interests andnon-gold producing companies | 121 | 204 | 325 | 198 | 167 | 365 | 167 | - | 857 | 8 | ||||||||||||||||||||||||||||||
Gold produced – oz (000)(2) | 91 | 280 | 371 | 254 | 146 | 399 | 186 | 10 | 967 | - | ||||||||||||||||||||||||||||||
Total cash costs per unit – $/oz(3) | 1,324 | 729 | 875 | 779 | 1,148 | 914 | 899 | - | 896 | - | ||||||||||||||||||||||||||||||
136
For the year ended 31 December 20142016
Operations in DRC, Ghana, Guinea, Mali Namibia and Tanzania
(in $ millions, except as otherwise noted)
|
|
|
|
|
|
|
| |||||||||||||||||||||||||||||||||||||
|
|
|  |  |  |  |
|  | ||||||||||||||||||||||||||||||||||||
All-in sustaining costs | ||||||||||||||||||||||||||||||||||||||||||||
Cost of sales per financial statements | - | 192 | 303 | 314 | - | - | - | 26 | 403 | 5 | 1,243 | |||||||||||||||||||||||||||||||||
Amortisation of tangible and intangible assets | - | (24 | ) | (19 | ) | (32 | ) | - | - | - | - | (99 | ) | (4 | ) | (178 | ) | |||||||||||||||||||||||||||
Adjusted for decomissioning amortisation | - | - | 1 | 4 | - | - | - | - | 2 | (1 | ) | 6 | ||||||||||||||||||||||||||||||||
Corporate administration and marketing related to current operations | - | - | - | - | - | - | - | - | - | 1 | 1 | |||||||||||||||||||||||||||||||||
Associates and equity accounted joint ventures’ share of | 133 | - | - | - | 51 | 89 | 20 | - | - | 1 | 294 | |||||||||||||||||||||||||||||||||
Inventory writedown to net realisable value and other stockpile adjustments | - | - | - | - | - | - | 8 | - | - | - | 8 | |||||||||||||||||||||||||||||||||
Sustaining exploration and study costs | - | - | 13 | 2 | - | 1 | - | - | 2 | (1 | ) | 17 | ||||||||||||||||||||||||||||||||
Total sustaining capital expenditure | 3 | 21 | 43 | 30 | 6 | 6 | - | 1 | 129 | 1 | 240 | |||||||||||||||||||||||||||||||||
All-in sustaining costs | 136 | 189 | 341 | 318 | 57 | 96 | 28 | 27 | 437 | 2 | 1,631 | |||||||||||||||||||||||||||||||||
Adjusted for non-controlling interests and non-gold producing companies(1) | - | - | - | (48 | ) | - | - | - | - | - | - | (48 | ) | |||||||||||||||||||||||||||||||
All-in sustaining costs adjusted for non-controlling interests and non-gold producing companies | 136 | 189 | 341 | 270 | 57 | 96 | 28 | 27 | 437 | 2 | 1,583 | |||||||||||||||||||||||||||||||||
Adjusted for stockpile write-offs | - | - | - | - | - | - | (8 | ) | (2 | ) | (9 | ) | - | (19 | ) | |||||||||||||||||||||||||||||
All-in sustaining costs adjusted for non-controlling interests, non-gold producing companies and stockpile write-offs | 136 | 189 | 341 | 270 | 57 | 96 | 20 | 25 | 428 | 2 | 1,564 | |||||||||||||||||||||||||||||||||
All-in sustaining costs | 136 | 189 | 341 | 318 | 57 | 96 | 28 | 27 | 437 | 2 | 1,631 | |||||||||||||||||||||||||||||||||
Non-sustaining Project Capital expenditure | 176 | - | 38 | - | - | - | - | - | - | - | 214 | |||||||||||||||||||||||||||||||||
Non-sustaining exploration and study costs | 2 | - | - | 5 | - | - | - | - | - | - | 7 | |||||||||||||||||||||||||||||||||
All-in costs | 314 | 189 | 379 | 323 | 57 | 96 | 28 | 27 | 437 | 2 | 1,852 | |||||||||||||||||||||||||||||||||
Adjusted for non-controlling interests and non-gold producing companies(1) | - | - | - | (48 | ) | - | - | - | - | - | - | (48 | ) | |||||||||||||||||||||||||||||||
All-in costs adjusted for non-controlling interests and non-gold producing companies | 314 | 189 | 379 | 275 | 57 | 96 | 28 | 27 | 437 | 2 | 1,804 | |||||||||||||||||||||||||||||||||
Adjusted for stockpile write-offs | - | - | - | - | - | - | (8 | ) | (2 | ) | (9 | ) | - | (19 | ) | |||||||||||||||||||||||||||||
All-in costs adjusted for non-controlling interests, non-gold producing companies and stockpile write-offs | 314 | 189 | 379 | 275 | 57 | 96 | 20 | 25 | 428 | 2 | 1,785 | |||||||||||||||||||||||||||||||||
Gold sold – oz (000)(3) | 233 | 185 | 248 | 294 | 44 | 85 | 11 | 34 | 481 | - | 1,615 | |||||||||||||||||||||||||||||||||
All-in sustaining cost (excluding stockpile write-offs) per | 588 | 1,020 | 1,374 | 917 | 1,298 | 1,133 | 1,795 | 719 | 890 | - | 968 | |||||||||||||||||||||||||||||||||
All-in cost per unit (excluding stockpile write-offs) – $/oz(4) | 1,351 | 1,020 | 1,530 | 933 | 1,298 | 1,133 | 1,795 | 719 | 890 | - | 1,105 | |||||||||||||||||||||||||||||||||
|
|
|
|
|
|
|
|
|
| 
|
|
|
|
|
|
|
|
|
|
| ||||||||||||||||
|
|
|
|
|
|
|
|
|
|
|
|
|
|
|
|
|
|
|
|
| ||||||||||||||||
All-in sustaining costs | ||||||||||||||||||||||||||||||||||||
Cost of sales per segmental information | 292 | 219 | 1 | 257 | 32 | 81 | 447 | 2 | 1,331 | |||||||||||||||||||||||||||
Amortisation of tangible and intangible assets | (96 | ) | (23 | ) | - | (31 | ) | (6 | ) | (11 | ) | (195 | ) | (3 | ) | (365 | ) | |||||||||||||||||||
Adjusted for decommissioning amortisation | 1 | - | - | 1 | 2 | 1 | 3 | - | 8 | |||||||||||||||||||||||||||
Inventory writedown to net realisable value and other stockpile adjustments | - | - | - | - | - | - | - | 1 | 1 | |||||||||||||||||||||||||||
Sustaining exploration and study costs | - | - | - | 3 | - | 1 | 27 | - | 31 | |||||||||||||||||||||||||||
Total sustaining capital expenditure | 32 | 8 | - | 38 | 1 | 3 | 119 | - | 201 | |||||||||||||||||||||||||||
All-in sustaining costs | 229 | 204 | 1 | 268 | 29 | 75 | 401 | - | 1,207 | |||||||||||||||||||||||||||
Adjusted fornon-controlling interests and non -gold producing companies(1) | - | - | - | (40 | ) | - | - | - | - | (40 | ) | |||||||||||||||||||||||||
All-in sustaining costs adjusted fornon-controlling interests andnon-gold producing companies | 229 | 204 | 1 | 228 | 29 | 75 | 401 | - | 1,167 | |||||||||||||||||||||||||||
Adjusted for stockpile write-offs | - | - | - | - | (1 | ) | - | - | - | (1 | ) | |||||||||||||||||||||||||
All-in sustaining costs adjusted fornon-controlling interests,non-gold producing companies and stockpile write-offs | 229 | 204 | 1 | 228 | 28 | 75 | 401 | - | 1,166 | |||||||||||||||||||||||||||
All-in sustaining costs | 229 | 204 | 1 | 268 | 29 | 75 | 401 | - | 1,207 | |||||||||||||||||||||||||||
Non-sustaining Project capex | 60 | - | 6 | 21 | - | 3 | - | - | 90 | |||||||||||||||||||||||||||
Non-sustaining exploration and study costs | 1 | - | 4 | - | - | - | - | - | 5 | |||||||||||||||||||||||||||
Care and maintenance costs | - | - | 70 | - | - | - | - | - | 70 | |||||||||||||||||||||||||||
All-in costs | 290 | 204 | 81 | 289 | 29 | 78 | 401 | - | 1,372 | |||||||||||||||||||||||||||
Adjusted fornon-controlling interests and non -gold producing companies(1) | - | - | - | (43 | ) | - | - | - | - | (43 | ) | |||||||||||||||||||||||||
All-in costs adjusted fornon-controlling interests andnon-gold producing companies | 290 | 204 | 81 | 246 | 29 | 78 | 401 | - | 1,329 | |||||||||||||||||||||||||||
Adjusted for stockpile write-offs | - | - | - | - | (1 | ) | - | - | - | (1 | ) | |||||||||||||||||||||||||
All-in costs adjusted fornon-controlling interests,non-gold producing companies and stockpile write-offs | 290 | 204 | 81 | 246 | 28 | 78 | 401 | - | 1,328 | |||||||||||||||||||||||||||
Gold sold – oz (000)(2) | 256 | 215 | 3 | 249 | 21 | 70 | 486 | - | 1,299 | |||||||||||||||||||||||||||
All-in sustaining cost (excluding stockpile write-offs) per unit – $/oz(3) | 893 | 950 | 440 | 915 | 1,337 | 1,066 | 844 | - | 904 | |||||||||||||||||||||||||||
All-in cost per unit (excluding stockpile write-offs) – $/oz(3) | 1,132 | 950 | 29,420 | 985 | 1,337 | 1,116 | 844 | - | 1,030 | |||||||||||||||||||||||||||
137
For the year ended 31 December 20142016
Operations in DRC, Ghana, Guinea, Mali Namibia and Tanzania
(in $ millions, except as otherwise noted)
|
|
|
|
|
|
|
| |||||||||||||||||||||||||||||||||||||
|
|
| | | | |
| | ||||||||||||||||||||||||||||||||||||
Total cash costs | ||||||||||||||||||||||||||||||||||||||||||||
Total cash costs per financial statements | - | 153 | 264 | 273 | - | - | - | 25 | 286 | - | 1,001 | |||||||||||||||||||||||||||||||||
Adjusted for non-controlling interests and non-gold producing companies and other(1) | - | - | - | (41 | ) | - | - | - | - | - | - | (41 | ) | |||||||||||||||||||||||||||||||
Associates and equity accounted joint ventures’ share of total cash costs(2) | 137 | - | - | - | 51 | 87 | 16 | - | - | - | 291 | |||||||||||||||||||||||||||||||||
Total cash costs adjusted for non-controlling interests and non-gold producing companies | 137 | 153 | 264 | 232 | 51 | 87 | 16 | 25 | 286 | - | 1,251 | |||||||||||||||||||||||||||||||||
Retrenchment costs | - | - | - | - | - | - | - | - | 1 | - | 1 | |||||||||||||||||||||||||||||||||
Rehabilitation and other non-cash costs | - | 6 | 15 | 5 | - | - | - | - | 7 | - | 33 | |||||||||||||||||||||||||||||||||
Amortisation of tangible assets | - | 24 | 19 | 32 | - | - | - | - | 99 | - | 174 | |||||||||||||||||||||||||||||||||
Amortisation of intangible assets | - | - | - | - | - | - | - | - | - | 4 | 4 | |||||||||||||||||||||||||||||||||
Adjusted for non-controlling interests and non-gold producing companies(1) | - | - | - | (6 | ) | - | - | - | - | - | - | (6 | ) | |||||||||||||||||||||||||||||||
Associates and equity accounted joint ventures’ share of production costs(2) | 67 | - | - | - | 8 | 25 | 4 | - | - | - | 104 | |||||||||||||||||||||||||||||||||
Total production costs adjusted for non-controlling interests and non-gold producing companies | 204 | 183 | 298 | 263 | 59 | 112 | 20 | 25 | 393 | 4 | 1,561 | |||||||||||||||||||||||||||||||||
Gold produced - oz (000)(3) | 237 | 177 | 243 | 290 | 44 | 85 | 11 | 33 | 477 | - | 1,597 | |||||||||||||||||||||||||||||||||
Total cash costs per unit – $/oz(4) | 578 | 865 | 1,086 | 799 | 1,162 | 1,028 | 1,438 | 752 | 599 | - | 783 | |||||||||||||||||||||||||||||||||
Total production costs per unit – $/oz(4) | 860 | 1,035 | 1,223 | 909 | 1,343 | 1,329 | 1,760 | 756 | 821 | - | 977 | |||||||||||||||||||||||||||||||||
|
|
|
|
|
|
|
|
|
|
|
|
|
|
|
|
|
|
|
|
| ||||||||||||||||
|
|
|
|
|
|
|
|
|
|
|
|
|
|
|
|
|
|
|
|
| ||||||||||||||||
Cash costs | ||||||||||||||||||||||||||||||||||||
Cost of sales per segmental information | 292 | 219 | 1 | 257 | 32 | 81 | 447 | 2 | 1,331 | |||||||||||||||||||||||||||
Inventory change | 5 | - | - | 14 | - | - | 7 | 1 | 27 | |||||||||||||||||||||||||||
Amortisation of intangible assets | - | - | - | - | - | - | - | (2 | ) | (2 | ) | |||||||||||||||||||||||||
Amortisation of tangible assets | (96 | ) | (23 | ) | - | (31 | ) | (7 | ) | (10 | ) | (195 | ) | (1 | ) | (363 | ) | |||||||||||||||||||
Rehabilitation and othernon-cash costs | (6 | ) | (2 | ) | (1 | ) | (1 | ) | (1 | ) | (1 | ) | (5 | ) | - | (17 | ) | |||||||||||||||||||
Total cash costs | 195 | 194 | 1 | 239 | 24 | 70 | 253 | - | 976 | |||||||||||||||||||||||||||
Adjusted fornon-controlling interests,non-gold producing companies and other(1) | - | - | - | (36 | ) | - | - | - | - | (36 | ) | |||||||||||||||||||||||||
Total cash costs adjusted fornon-controlling interests andnon-gold producing companies | 195 | 194 | 1 | 203 | 24 | 70 | 253 | - | 940 | |||||||||||||||||||||||||||
Gold produced - oz (000)(2) | 264 | 214 | 3 | 260 | 22 | 70 | 489 | - | 1,321 | |||||||||||||||||||||||||||
Total cash costs per unit - $/oz(3) | 740 | 908 | 167 | 784 | 1,123 | 991 | 530 | - | 717 | |||||||||||||||||||||||||||
138
For the year ended 31 December 20142016
Operations in Australia, United States of America, Argentina and Brazil
(in $ millions, except as otherwise noted)
|
|
|
|
|
|
|
|
|
|
|
|
| ||||||||||||||||||||||||||||||||||||||||||||||||||||||||||||||||
|
|
|
|
|
|
|
|
|
|
|
|
| ||||||||||||||||||||||||||||||||||||||||||||||||||||||||||||||||
All-in sustaining costs | ||||||||||||||||||||||||||||||||||||||||||||||||||||||||||||||||||||||||||||
Cost of sales per financial statements | 344 | 296 | 20 | 660 | 218 | 222 | 362 | 156 | 4 | 962 | ||||||||||||||||||||||||||||||||||||||||||||||||||||||||||||||||||
Cost of sales per segmental information | 242 | 277 | 21 | 540 | 250 | 364 | 134 | 4 | 752 | |||||||||||||||||||||||||||||||||||||||||||||||||||||||||||||||||||
Amortisation of tangible and intangible assets | (47 | ) | (98 | ) | (5 | ) | (150 | ) | (3 | ) | (33 | ) | (107 | ) | (49 | ) | - | (192 | ) | (32 | ) | (83 | ) | (11 | ) | (126 | ) | (77 | ) | (132 | ) | (51 | ) | - | (260 | ) | ||||||||||||||||||||||||||||||||||||||||
Adjusted for decomissioning amortisation | - | 3 | - | 3 | - | - | - | - | 1 | 1 | ||||||||||||||||||||||||||||||||||||||||||||||||||||||||||||||||||
Adjusted for decommissioning amortisation | 1 | 2 | - | 3 | 1 | 1 | - | - | 2 | |||||||||||||||||||||||||||||||||||||||||||||||||||||||||||||||||||
Corporate administration and marketing related to current operations | - | - | - | - | - | - | 1 | - | - | 1 | - | - | - | - | - | 1 | - | (1 | ) | - | ||||||||||||||||||||||||||||||||||||||||||||||||||||||||
Inventory writedown to net realisable value and other stockpile adjustments | - | - | - | - | - | - | 1 | - | - | 1 | - | - | 8 | 8 | - | - | - | - | - | |||||||||||||||||||||||||||||||||||||||||||||||||||||||||
Sustaining exploration and study costs | - | 3 | 6 | 9 | 2 | 2 | 8 | 1 | 10 | 23 | 2 | 12 | 7 | 21 | 2 | 2 | 7 | 7 | 18 | |||||||||||||||||||||||||||||||||||||||||||||||||||||||||
Total sustaining capital expenditure | 31 | 59 | 1 | 91 | 24 | 58 | 127 | 38 | 1 | 248 | 32 | 76 | 1 | 109 | 59 | 121 | 43 | 2 | 225 | |||||||||||||||||||||||||||||||||||||||||||||||||||||||||
All-in sustaining costs | 328 | 263 | 22 | 613 | 241 | 249 | 392 | 146 | 16 | 1,044 | 245 | 284 | 26 | 555 | 235 | 357 | 133 | 12 | 737 | |||||||||||||||||||||||||||||||||||||||||||||||||||||||||
Adjusted for non-controlling interests and non-gold producing companies(1) | - | - | - | - | - | (19 | ) | - | - | (16 | ) | (35 | ) | |||||||||||||||||||||||||||||||||||||||||||||||||||||||||||||||
Adjusted fornon-controlling interests and non -gold producing companies(1) | - | - | 8 | 8 | (17 | ) | - | - | (8 | ) | (26 | ) | ||||||||||||||||||||||||||||||||||||||||||||||||||||||||||||||||
All-in sustaining costs adjusted for non-controlling interests and non-gold producing companies | 328 | 263 | 22 | 613 | 241 | 230 | 392 | 146 | - | 1,009 | 245 | 284 | 34 | 563 | 218 | 357 | 133 | 4 | 711 | |||||||||||||||||||||||||||||||||||||||||||||||||||||||||
Adjusted for stockpile write-offs | - | - | - | - | - | - | (1 | ) | - | - | (1 | ) | - | - | (8 | ) | (8 | ) | (4 | ) | - | (1 | ) | 1 | (4 | ) | ||||||||||||||||||||||||||||||||||||||||||||||||||
All-in sustaining costs adjusted for non-controlling interests, non-gold producing companies and stockpile write-offs | 328 | 263 | 22 | 613 | 241 | 230 | 391 | 146 | - | 1,008 | 245 | 284 | 26 | 555 | 214 | 357 | 132 | 5 | 707 | |||||||||||||||||||||||||||||||||||||||||||||||||||||||||
All-in sustaining costs | 328 | 263 | 22 | 613 | 241 | 249 | 392 | 146 | 16 | 1,044 | 245 | 284 | 26 | 555 | 235 | 357 | 133 | 12 | 737 | |||||||||||||||||||||||||||||||||||||||||||||||||||||||||
Non-sustaining Project Capital expenditure | - | - | - | - | 145 | - | - | - | 1 | 146 | ||||||||||||||||||||||||||||||||||||||||||||||||||||||||||||||||||
Non-sustaining Project capex | - | - | - | - | - | 1 | - | - | 1 | |||||||||||||||||||||||||||||||||||||||||||||||||||||||||||||||||||
Non-sustaining exploration and study costs | - | - | 7 | 7 | - | - | 1 | - | 71 | 72 | - | - | 7 | 7 | - | 6 | 1 | 31 | 38 | |||||||||||||||||||||||||||||||||||||||||||||||||||||||||
Corporate and social responsibility costs not related to current operations | - | - | - | - | - | - | 14 | 2 | 1 | 17 | - | - | - | - | - | 11 | 3 | 1 | 15 | |||||||||||||||||||||||||||||||||||||||||||||||||||||||||
All-in costs | 328 | 263 | 29 | 620 | 386 | 249 | 407 | 148 | 89 | 1,279 | 245 | 284 | 33 | 562 | 235 | 375 | 137 | 44 | 791 | |||||||||||||||||||||||||||||||||||||||||||||||||||||||||
Adjusted for non-controlling interests and non-gold producing companies(1) | - | - | - | - | - | (19 | ) | - | - | (1 | ) | (20 | ) | |||||||||||||||||||||||||||||||||||||||||||||||||||||||||||||||
Adjusted fornon-controlling interests and non -gold producing companies(1) | - | - | 8 | 8 | (17 | ) | - | - | (1 | ) | (18 | ) | ||||||||||||||||||||||||||||||||||||||||||||||||||||||||||||||||
All-in costs adjusted for non-controlling interests and non-gold producing companies | 328 | 263 | 29 | 620 | 386 | 230 | 407 | 148 | 88 | 1,259 | 245 | 284 | 41 | 570 | 218 | 375 | 137 | 43 | 773 | |||||||||||||||||||||||||||||||||||||||||||||||||||||||||
Adjusted for stockpile write-offs | - | - | - | - | - | - | (1 | ) | - | - | (1 | ) | - | - | (8 | ) | (8 | ) | (4 | ) | - | (1 | ) | 1 | (4 | ) | ||||||||||||||||||||||||||||||||||||||||||||||||||
All-in costs adjusted for non-controlling interests, non-gold producing companies and stockpile write-offs | 328 | 263 | 29 | 620 | 386 | 230 | 406 | 148 | 88 | 1,258 | 245 | 284 | 33 | 562 | 214 | 375 | 136 | 44 | 769 | |||||||||||||||||||||||||||||||||||||||||||||||||||||||||
Gold sold – oz (000) | 271 | 350 | - | 622 | 210 | 246 | 404 | 138 | - | 998 | 226 | 293 | - | 519 | 277 | 401 | 130 | - | 808 | |||||||||||||||||||||||||||||||||||||||||||||||||||||||||
All-in sustaining cost (excluding stockpile write-offs) per unit – $/oz | 1,214 | 752 | - | 986 | 1,147 | 938 | 966 | 1,062 | - | 1,010 | 1,080 | 970 | - | 1,067 | 773 | 893 | 1,020 | - | 875 | |||||||||||||||||||||||||||||||||||||||||||||||||||||||||
All-in cost per unit (excluding stockpile write-offs) – $/oz | 1,214 | 752 | - | 998 | 1,837 | 938 | 1,004 | 1,078 | - | 1,262 | 1,080 | 970 | - | 1,081 | 774 | 938 | 1,044 | - | 959 | |||||||||||||||||||||||||||||||||||||||||||||||||||||||||
139
For the year ended 31 December 20142016
Operations in Australia, United States of America, Argentina and Brazil
(in $ millions, except as otherwise noted)
|
|
|
|
|
|
| ||||||||||||||||||||||||||||||||||
|
|
|
|
|
|
| ||||||||||||||||||||||||||||||||||
Total cash costs | ||||||||||||||||||||||||||||||||||||||||
Total cash costs per financial statements | 289 | 195 | 14 | 498 | 222 | 184 | 260 | 102 | (2 | ) | 766 | |||||||||||||||||||||||||||||
Adjusted for non-controlling interests and non-gold producing companies and other(1) | - | - | - | - | (47 | ) | (14 | ) | - | - | - | (61 | ) | |||||||||||||||||||||||||||
Total cash costs adjusted for non-controlling interests and non-gold producing companies | 289 | 195 | 14 | 498 | 175 | 170 | 260 | 102 | (2 | ) | 705 | |||||||||||||||||||||||||||||
Retrenchment costs | - | - | 1 | 1 | - | 2 | 3 | - | 1 | 6 | ||||||||||||||||||||||||||||||
Rehabilitation and other non-cash costs | 4 | 9 | - | 13 | 28 | 5 | (7 | ) | - | 6 | 32 | |||||||||||||||||||||||||||||
Amortisation of tangible assets | 47 | 98 | 4 | 149 | 1 | 32 | 101 | 48 | 1 | 183 | ||||||||||||||||||||||||||||||
Amortisation of intangible assets | - | - | 1 | 1 | 1 | - | 6 | 1 | 1 | 9 | ||||||||||||||||||||||||||||||
Adjusted for non-controlling interests and non-gold producing companies(1) | - | - | - | - | 12 | (3 | ) | - | - | (6 | ) | 3 | ||||||||||||||||||||||||||||
Total production costs adjusted for non-controlling interests and non-gold producing companies | 340 | 302 | 20 | 662 | 217 | 206 | 363 | 151 | 1 | 938 | ||||||||||||||||||||||||||||||
Gold produced – oz (000)(3) | 262 | 358 | - | 619 | 211 | 246 | 403 | 136 | - | 996 | ||||||||||||||||||||||||||||||
Total cash costs per unit – $/oz(4) | 1,105 | 545 | - | 804 | 829 | (6) | 692 | 644 | 748 | - | 709 | |||||||||||||||||||||||||||||
Total production costs per unit – $/oz(4) | 1,301 | 845 | - | 1,070 | 1,031 | 842 | 902 | 1,113 | - | 942 | ||||||||||||||||||||||||||||||
|
|
|
|
|
| |||||||||||||||||||||||||||||||
|
|
|
|
|
| |||||||||||||||||||||||||||||||
Cash costs | ||||||||||||||||||||||||||||||||||||
Cost of sales per segmental information | 242 | 277 | 21 | 540 | 250 | 364 | 134 | 4 | 752 | |||||||||||||||||||||||||||
Inventory change | 1 | - | - | 1 | 8 | 4 | 1 | - | 13 | |||||||||||||||||||||||||||
Amortisation of intangible assets | - | - | (1 | ) | (1 | ) | - | (7 | ) | (3 | ) | (1 | ) | (11 | ) | |||||||||||||||||||||
Amortisation of tangible assets | (32 | ) | (83 | ) | (11 | ) | (126 | ) | (77 | ) | (125 | ) | (48 | ) | - | (250 | ) | |||||||||||||||||||
Rehabilitation and othernon-cash costs | 1 | (10 | ) | (1 | ) | (10 | ) | (8 | ) | (7 | ) | (1 | ) | - | (16 | ) | ||||||||||||||||||||
Retrenchment costs | - | - | - | - | (1 | ) | (1 | ) | - | (1 | ) | (3 | ) | |||||||||||||||||||||||
Total cash costs | 211 | 184 | 9 | 404 | 171 | 229 | 83 | 3 | 486 | |||||||||||||||||||||||||||
Adjusted fornon-controlling interests,non-gold producing companies and other(1) | - | - | - | - | (13 | ) | - | - | - | (13 | ) | |||||||||||||||||||||||||
Total cash costs adjusted fornon-controlling interests andnon-gold producing companies | 211 | 184 | 9 | 404 | 158 | 229 | 83 | 3 | 473 | |||||||||||||||||||||||||||
Gold produced – oz (000)(2) | 228 | 292 | - | 519 | 281 | 407 | 131 | - | 820 | |||||||||||||||||||||||||||
Total cash costs per unit – $/oz(3) | 926 | 630 | - | 793 | 563 | 562 | 634 | - | 578 | |||||||||||||||||||||||||||
140
For the year ended 31 December 20142016
AngloGold Ashanti operations – Total
(in $ millions, except as otherwise noted)
| ||||
All-in sustaining costs | ||||
Cost of sales per | ||||
Amortisation of tangible and intangible assets | ( | ) | ||
Adjusted for | ||||
Corporate administration and marketing related to current operations | ||||
| ||||
Inventory writedown to net realisable value and other stockpile adjustments | ||||
Sustaining exploration and study costs | ||||
Total sustaining capital expenditure | ||||
All-in sustaining costs | ||||
Adjusted fornon-controlling | ||||
| (58 | ) | ||
| 3,537 | |||
Adjusted for stockpile write-offs | ( | ) | ||
All-in sustaining costs adjusted fornon-controlling interests,non-gold producing companies and stockpile write-offs | ||||
All-in sustaining costs | ||||
Non-sustaining Project | ||||
Technology improvements | ||||
Non-sustaining exploration and study costs | 56 | |||
Care and maintenance costs | ||||
Corporate and social responsibility costs not related to current operations | ||||
All-in costs | ||||
Adjusted fornon-controlling | ||||
| (53 | ) | ||
| 3,838 | |||
Adjusted for stockpile write-offs | ( | ) | ||
All-in costs adjusted fornon-controlling interests,non-gold producing companies and stockpile write-offs | ||||
Gold sold – oz (000) | ||||
All-in sustaining cost (excluding stockpile write-offs) per unit – $/oz | ||||
All-in cost per unit (excluding stockpile write-offs) – $/oz | ||||
141
For the year ended 31 December 20142016
AngloGold Ashanti operations – Total
(in $ millions, except as otherwise noted)
| ||||
| ||||
| ||||
| ||||
| ||||
| ||||
| ||||
| ||||
| ||||
Amortisation of intangible assets | ) | |||
| ( | ) | ||
| (51 | ) | ||
Retrenchment costs | ) | |||
Total | ||||
Adjusted fornon-controlling interests,non-gold producing companies and other(1) | (41 | ) | ||
Total cash costs adjusted fornon-controlling interests andnon-gold producing companies | 2,682 | |||
Gold produced – oz (000) | ||||
Total cash | ||||
| ||||
142
For the year ended 31 December 20132015
Operations in South Africa
(in $ millions, except as otherwise noted)
 |  |  |  |  |  |  |  |  |  |  |  |
|  |
|  |  |  |  |
|  |  | |||||||||||||||||||||||||||||||||||||||||||||||||||||||||||||||||||
All-in sustaining costs | ||||||||||||||||||||||||||||||||||||||||||||||||||||||||||||||||||||||||||||||||||||||||
Cost of sales per financial statements | 103 | 215 | 240 | 558 | 347 | - | 262 | 609 | 226 | - | 1,393 | 1 | ||||||||||||||||||||||||||||||||||||||||||||||||||||||||||||||||||||||||||||
Cost of sales per segmental information(5) | 148 | 260 | 408 | 251 | 230 | 481 | 194 | - | 1,083 | (2 | ) | |||||||||||||||||||||||||||||||||||||||||||||||||||||||||||||||||||||||||||||
Amortisation of tangible and intangible assets | (8 | ) | (43 | ) | (60 | ) | (111 | ) | (82 | ) | - | (51 | ) | (133 | ) | (9 | ) | - | (253 | ) | (9 | ) | (24 | ) | (47 | ) | (71 | ) | (53 | ) | (40 | ) | (93 | ) | (17 | ) | - | (181 | ) | (8 | ) | |||||||||||||||||||||||||||||||||||||||||||||||
Adjusted for decomissioning amortisation | (1 | ) | 1 | 1 | 1 | - | - | - | - | - | - | 1 | (1 | ) | ||||||||||||||||||||||||||||||||||||||||||||||||||||||||||||||||||||||||||
Corporate administration and marketing related to current operations | - | - | - | - | - | - | - | - | - | 5 | 5 | 168 | - | - | - | - | - | - | - | - | - | 78 | ||||||||||||||||||||||||||||||||||||||||||||||||||||||||||||||||||
Associates and equity accounted joint ventures’ share of costs(2) | - | - | - | - | - | - | - | - | - | - | - | 2 | ||||||||||||||||||||||||||||||||||||||||||||||||||||||||||||||||||||||||||||
Inventory writedown to net realisable value and other stockpile adjustments | - | - | - | - | - | - | - | - | - | 1 | 1 | (1 | ) | - | - | - | - | - | - | - | 1 | 1 | (3 | ) | ||||||||||||||||||||||||||||||||||||||||||||||||||||||||||||||||
Sustaining exploration and study costs | - | - | - | - | - | - | - | - | - | - | - | (1 | ) | |||||||||||||||||||||||||||||||||||||||||||||||||||||||||||||||||||||||||||
Total sustaining capital expenditure | 14 | 50 | 78 | 142 | 95 | - | 59 | 154 | 16 | - | 312 | 9 | 21 | 46 | 66 | 59 | 28 | 87 | 17 | 8 | 178 | 3 | ||||||||||||||||||||||||||||||||||||||||||||||||||||||||||||||||||
All-in sustaining costs | 108 | 223 | 259 | 590 | 360 | - | 270 | 630 | 233 | 6 | 1,459 | 168 | 145 | 259 | 403 | 257 | 218 | 475 | 194 | 9 | 1,081 | 68 | ||||||||||||||||||||||||||||||||||||||||||||||||||||||||||||||||||
Adjusted fornon-controlling interests and non -gold producing companies(1) | - | - | - | - | - | - | - | - | - | 8 | ||||||||||||||||||||||||||||||||||||||||||||||||||||||||||||||||||||||||||||||
All-in sustaining costs adjusted for non-controlling interests and non-gold producing companies | 108 | 223 | 259 | 590 | 360 | - | 270 | 630 | 233 | 6 | 1,459 | 168 | 145 | 259 | 403 | 257 | 218 | 475 | 194 | 9 | 1,081 | 76 | ||||||||||||||||||||||||||||||||||||||||||||||||||||||||||||||||||
Adjusted for stockpile write-offs | - | - | - | - | - | - | - | - | - | (1 | ) | (1 | ) | 1 | - | - | - | - | - | - | - | (1 | ) | (1 | ) | - | ||||||||||||||||||||||||||||||||||||||||||||||||||||||||||||||
All-in sustaining costs adjusted for non-controlling interests, non-gold producing companies and stockpile write-offs | 108 | 223 | 259 | 590 | 360 | - | 270 | 630 | 233 | 5 | 1,458 | 169 | 145 | 259 | 403 | 257 | 218 | 475 | 194 | 8 | 1,080 | 76 | ||||||||||||||||||||||||||||||||||||||||||||||||||||||||||||||||||
All-in sustaining costs | 108 | 223 | 259 | 590 | 360 | - | 270 | 630 | 233 | 6 | 1,459 | 168 | 145 | 259 | 403 | 257 | 218 | 475 | 194 | 9 | 1,081 | 68 | ||||||||||||||||||||||||||||||||||||||||||||||||||||||||||||||||||
Non-sustaining Project Capital expenditure | - | 1 | 39 | 40 | 76 | - | 1 | 77 | 23 | (1 | ) | 139 | (1 | ) | ||||||||||||||||||||||||||||||||||||||||||||||||||||||||||||||||||||||||||
Non-sustaining Project capex | - | 2 | 2 | 26 | - | 26 | - | - | 28 | - | ||||||||||||||||||||||||||||||||||||||||||||||||||||||||||||||||||||||||||||||
Technology improvements | - | - | - | - | - | - | - | - | - | 14 | 14 | - | - | - | - | - | - | - | - | 15 | 15 | - | ||||||||||||||||||||||||||||||||||||||||||||||||||||||||||||||||||
Non-sustaining exploration and study costs | - | - | - | - | - | - | - | - | - | - | - | 6 | - | - | - | - | - | - | - | - | - | 11 | ||||||||||||||||||||||||||||||||||||||||||||||||||||||||||||||||||
Corporate and social responsibility costs not related to current operations | - | - | - | - | - | - | - | - | - | - | - | 16 | - | - | - | - | - | - | - | - | - | 17 | ||||||||||||||||||||||||||||||||||||||||||||||||||||||||||||||||||
All-in costs | 108 | 224 | 298 | 630 | 436 | - | 271 | 707 | 256 | 19 | 1,612 | 189 | 145 | 261 | 405 | 283 | 218 | 501 | 194 | 24 | 1,124 | 96 | ||||||||||||||||||||||||||||||||||||||||||||||||||||||||||||||||||
Adjusted fornon-controlling interests and non -gold producing companies(1) | - | - | - | - | - | - | - | - | - | 8 | ||||||||||||||||||||||||||||||||||||||||||||||||||||||||||||||||||||||||||||||
All-in costs adjusted for non-controlling interests and non-gold producing companies | 108 | 224 | 298 | 630 | 436 | - | 271 | 707 | 256 | 19 | 1,612 | 189 | 145 | 261 | 405 | 283 | 218 | 501 | 194 | 24 | 1,124 | 104 | ||||||||||||||||||||||||||||||||||||||||||||||||||||||||||||||||||
Adjusted for stockpile write-offs | - | - | - | - | - | - | - | - | - | (1 | ) | (1 | ) | 1 | - | - | - | - | - | - | - | (1 | ) | (1 | ) | - | ||||||||||||||||||||||||||||||||||||||||||||||||||||||||||||||
All-in costs adjusted for non-controlling interests, non-gold producing companies and stockpile write-offs | 108 | 224 | 298 | 630 | 436 | - | 271 | 707 | 256 | 18 | 1,611 | 190 | 145 | 261 | 405 | 283 | 218 | 501 | 194 | 23 | 1,123 | 104 | ||||||||||||||||||||||||||||||||||||||||||||||||||||||||||||||||||
Gold sold – oz (000)(3) | 83 | 178 | 212 | 472 | 354 | - | 235 | 589 | 240 | - | 1,302 | - | ||||||||||||||||||||||||||||||||||||||||||||||||||||||||||||||||||||||||||||
All-in sustaining cost (excluding stockpile | 1,305 | 1,255 | 1,223 | 1,249 | 1,016 | - | 1,149 | 1,069 | 969 | - | 1,120 | - | ||||||||||||||||||||||||||||||||||||||||||||||||||||||||||||||||||||||||||||
All-in cost per unit (excluding stockpile | 1,305 | 1,262 | 1,406 | 1,334 | 1,230 | - | 1,152 | 1,199 | 1,064 | - | 1,238 | - | ||||||||||||||||||||||||||||||||||||||||||||||||||||||||||||||||||||||||||||
Gold sold - oz (000)(2) | 118 | 254 | 371 | 219 | 209 | 428 | 193 | 13 | 1,005 | - | ||||||||||||||||||||||||||||||||||||||||||||||||||||||||||||||||||||||||||||||
All-in sustaining cost (excluding stockpile write-offs) per unit – $/oz(3) | 1,226 | 1,018 | 1,084 | 1,170 | 1,044 | 1,108 | 1,006 | - | 1,088 | - | ||||||||||||||||||||||||||||||||||||||||||||||||||||||||||||||||||||||||||||||
All-in cost per unit (excluding stockpile write-offs) – $/oz(3) | 1,226 | 1,024 | 1,088 | 1,290 | 1,044 | 1,170 | 1,006 | - | 1,131 | - | ||||||||||||||||||||||||||||||||||||||||||||||||||||||||||||||||||||||||||||||
| (1) | Adjusting fornon-controlling interest of items included in calculation, to disclose the attributable portions only. Other consists of heap leach inventory. |
| (2) |
|
Attributable portion. |
In addition to the operational performances of the mines,all-in sustaining cost per ounce,all-in cost per ounce, total cash costs per ounce |
Corporate includesnon-gold producing subsidiaries. |
|
|
143
For the year ended 31 December 20132015
Operations in South Africa
(in $ millions, except as otherwise noted)
| |
|
| |
|
|
| | | | ||||||||||||||||||||||||||||||||||
Total cash costs | ||||||||||||||||||||||||||||||||||||||||||||
Total cash costs per financial statements | 91 | 163 | 169 | 423 | 255 | 216 | 471 | 213 | - | 1,107 | (7 | ) | ||||||||||||||||||||||||||||||||
Adjusted for non-controlling interests, non-gold producing companies and other(1) | - | - | - | - | - | - | - | - | - | - | 6 | |||||||||||||||||||||||||||||||||
Total cash costs adjusted for non-controlling interests and non-gold producing companies | 91 | 163 | 169 | 423 | 255 | 216 | 471 | 213 | - | 1,107 | (1 | ) | ||||||||||||||||||||||||||||||||
Retrenchment costs | 3 | 5 | 6 | 14 | 7 | 6 | 13 | - | - | 27 | - | |||||||||||||||||||||||||||||||||
Rehabilitation and other non-cash costs | 1 | 4 | 6 | 11 | 3 | (10 | ) | (7 | ) | 3 | - | 7 | 1 | |||||||||||||||||||||||||||||||
Amortisation of tangible assets | 7 | 41 | 57 | 105 | 77 | 47 | 124 | 8 | - | 237 | 5 | |||||||||||||||||||||||||||||||||
Amortisation of intangible assets | 1 | 3 | 3 | 7 | 5 | 3 | 8 | - | - | 15 | 2 | |||||||||||||||||||||||||||||||||
Adjusted for non-controlling interests and non-gold producing companies(1) | - | - | - | - | - | - | - | - | - | - | (4 | ) | ||||||||||||||||||||||||||||||||
Associates and equity accounted joint ventures’ share of production costs(2) | - | - | - | - | - | - | - | - | - | - | 1 | |||||||||||||||||||||||||||||||||
Total production costs adjusted for non-controlling interests and non-gold producing companies | 103 | 216 | 241 | 560 | 347 | 262 | 609 | 224 | - | 1,393 | 4 | |||||||||||||||||||||||||||||||||
Gold produced – oz (000)(3) | 83 | 178 | 212 | 472 | 354 | 235 | 589 | 240 | - | 1,302 | - | |||||||||||||||||||||||||||||||||
Total cash costs per unit – $/oz(4) | 1,100 | 918 | 797 | 895 | 719 | 920 | 800 | 883 | - | 850 | - | |||||||||||||||||||||||||||||||||
Total production costs per unit – $/oz(4) | 1,252 | 1,210 | 1,138 | 1,185 | 978 | 1,117 | 1,034 | 933 | - | 1,070 | - | |||||||||||||||||||||||||||||||||
| |
| |  | | |
| |
| |||||||||||||||||||||||||||||||
Cash costs | ||||||||||||||||||||||||||||||||||||||||
Cost of sales per segmental information | 148 | 260 | 408 | 251 | 230 | 481 | 194 | - | 1,083 | (2 | ) | |||||||||||||||||||||||||||||
Inventory change | - | - | - | - | - | - | - | - | - | (1 | ) | |||||||||||||||||||||||||||||
Amortisation of intangible assets | (2 | ) | (4 | ) | (7 | ) | (4 | ) | (4 | ) | (8 | ) | (2 | ) | - | (17 | ) | (3 | ) | |||||||||||||||||||||
Amortisation of tangible assets | (22 | ) | (42 | ) | (65 | ) | (49 | ) | (35 | ) | (84 | ) | (15 | ) | - | (164 | ) | (4 | ) | |||||||||||||||||||||
Rehabilitation and othernon-cash costs | (3 | ) | (8 | ) | (11 | ) | (5 | ) | (4 | ) | (9 | ) | (1 | ) | - | (21 | ) | - | ||||||||||||||||||||||
Retrenchment costs | (2 | ) | (3 | ) | (4 | ) | (2 | ) | (1 | ) | (3 | ) | - | - | (7 | ) | (1 | ) | ||||||||||||||||||||||
Total cash costs | 119 | 202 | 322 | 191 | 185 | 376 | 176 | - | 874 | (9 | ) | |||||||||||||||||||||||||||||
Adjusted fornon-controlling interests,non-gold producing companies and other(1) | - | - | - | - | - | - | - | - | - | 9 | ||||||||||||||||||||||||||||||
Total cash costs adjusted fornon-controlling interests andnon-gold producing companies | 119 | 202 | 322 | 191 | 185 | 376 | 176 | - | 874 | - | ||||||||||||||||||||||||||||||
Gold produced - oz (000)(2) | 117 | 254 | 371 | 219 | 209 | 428 | 193 | 12 | 1,004 | - | ||||||||||||||||||||||||||||||
Total cash costs per unit – $/oz(3) | 1,014 | 798 | 867 | 874 | 883 | 879 | 912 | - | 881 | - | ||||||||||||||||||||||||||||||
144
For the year ended 31 December 20132015
Operations in DRC, Ghana, Guinea, Mali Namibia and Tanzania
(in $ millions, except as otherwise noted)
|
|
|
|
|
|
|
| |||||||||||||||||||||||||||||||||||||
|
|
| | | | |
| | ||||||||||||||||||||||||||||||||||||
All-in sustaining costs | ||||||||||||||||||||||||||||||||||||||||||||
Cost of sales per financial statements | - | 226 | 425 | 324 | - | - | - | 49 | 346 | 23 | 1,393 | |||||||||||||||||||||||||||||||||
Amortisation of tangible and intangible assets | - | (30 | ) | (50 | ) | (27 | ) | - | - | - | (6 | ) | (120 | ) | (6 | ) | (239 | ) | ||||||||||||||||||||||||||
Adjusted for decomissioning amortisation | - | 1 | 1 | 3 | - | - | - | - | 1 | - | 6 | |||||||||||||||||||||||||||||||||
Corporate administration and marketing related to current operations | - | - | 1 | - | - | - | - | - | - | 2 | 3 | |||||||||||||||||||||||||||||||||
Associates and equity accounted joint ventures’ share of costs(2) | 21 | - | - | - | 47 | 118 | 46 | - | - | - | 232 | |||||||||||||||||||||||||||||||||
Inventory writedown to net realisable value and other stockpile adjustments | - | 83 | 4 | - | - | 16 | - | 24 | 89 | - | 216 | |||||||||||||||||||||||||||||||||
Sustaining exploration and study costs | - | 1 | 6 | 18 | - | 2 | - | 1 | 11 | - | 39 | |||||||||||||||||||||||||||||||||
Total sustaining capital expenditure | - | 22 | 154 | 27 | 13 | 11 | - | 5 | 146 | 1 | 379 | |||||||||||||||||||||||||||||||||
All-in sustaining costs | 21 | 303 | 541 | 345 | 60 | 147 | 46 | 73 | 473 | 20 | 2,029 | |||||||||||||||||||||||||||||||||
Adjusted for non-controlling interests and non-gold producing companies(1) | - | - | - | (52 | ) | - | - | - | - | - | (1 | ) | (53 | ) | ||||||||||||||||||||||||||||||
All-in sustaining costs adjusted for non-controlling interests and non-gold producing companies | 21 | 303 | 541 | 293 | 60 | 147 | 46 | 73 | 473 | 19 | 1,976 | |||||||||||||||||||||||||||||||||
Adjusted for stockpile write-offs | - | (83 | ) | (4 | ) | - | - | (16 | ) | - | (24 | ) | (89 | ) | - | (216 | ) | |||||||||||||||||||||||||||
All-in sustaining costs adjusted for non-controlling interests, non-gold producing companies and stockpile write-offs | 21 | 220 | 537 | 293 | 60 | 131 | 46 | 49 | 384 | 19 | 1,760 | |||||||||||||||||||||||||||||||||
All-in sustaining costs | 21 | 303 | 541 | 345 | 60 | 147 | 46 | 73 | 473 | 20 | 2,029 | |||||||||||||||||||||||||||||||||
Non-sustaining Project Capital expenditure | 341 | 5 | 42 | 3 | - | 31 | 2 | - | 8 | 28 | 460 | |||||||||||||||||||||||||||||||||
Non-sustaining exploration and study costs | 1 | - | - | 9 | - | - | - | - | - | 30 | 40 | |||||||||||||||||||||||||||||||||
All-in costs | 363 | 308 | 583 | 357 | 60 | 178 | 48 | 73 | 481 | 78 | 2,529 | |||||||||||||||||||||||||||||||||
Adjusted for non-controlling interests and non-gold producing companies(1) | - | - | - | (54 | ) | - | - | - | - | - | (9 | ) | (63 | ) | ||||||||||||||||||||||||||||||
All-in costs adjusted for non-controlling interests and non-gold producing companies | 363 | 308 | 583 | 303 | 60 | 178 | 48 | 73 | 481 | 69 | 2,466 | |||||||||||||||||||||||||||||||||
Adjusted for stockpile write-offs | - | (83 | ) | (4 | ) | - | - | (16 | ) | - | (24 | ) | (89 | ) | - | (216 | ) | |||||||||||||||||||||||||||
All-in costs adjusted for non-controlling interests, non-gold producing companies and stockpile write-offs | 363 | 225 | 579 | 303 | 60 | 162 | 48 | 49 | 392 | 69 | 2,250 | |||||||||||||||||||||||||||||||||
Gold sold – oz (000)(3) | 40 | 215 | 242 | 272 | 57 | 86 | 28 | 63 | 461 | - | 1,462 | |||||||||||||||||||||||||||||||||
All-in sustaining cost (excluding stockpile write-offs) per unit – $/oz(4) | 9,065 | 1,025 | 2,214 | 1,085 | 1,051 | 1,510 | 1,653 | 781 | 833 | - | 1,202 | |||||||||||||||||||||||||||||||||
All-in cost per unit (excluding stockpile write-offs) – $/oz(4) | 9,168 | 1,049 | 2,388 | 1,122 | 1,051 | 1,875 | 1,734 | 781 | 851 | - | 1,538 | |||||||||||||||||||||||||||||||||
|
|
|
|
|
|
|
|
|
|
|
|
|
|
|
|
|
|
|
|
| ||||||||||||||||
|
|
|
|
|
|
|
|
|
|
|
|
|
|
|
|
|
|
|
|
| ||||||||||||||||
All-in sustaining costs | ||||||||||||||||||||||||||||||||||||
Cost of sales per segmental information | 266 | 219 | 64 | 280 | 45 | 66 | 404 | 3 | 1,347 | |||||||||||||||||||||||||||
Amortisation of tangible and intangible assets | (87 | ) | (32 | ) | (22 | ) | (25 | ) | (11 | ) | (9 | ) | (148 | ) | (5 | ) | (339 | ) | ||||||||||||||||||
Adjusted for decommissioning amortisation | - | - | 4 | 2 | 1 | 1 | 3 | 1 | 12 | |||||||||||||||||||||||||||
Corporate administration and marketing related to current operations | - | - | - | - | - | (2 | ) | - | - | (2 | ) | |||||||||||||||||||||||||
Inventory writedown to net realisable value and other stockpile adjustments | - | 2 | - | - | 2 | - | 3 | - | 7 | |||||||||||||||||||||||||||
Sustaining exploration and study costs | - | 1 | 16 | 6 | - | - | 7 | 1 | 31 | |||||||||||||||||||||||||||
Total sustaining capital expenditure | 7 | 15 | 3 | 29 | 5 | 4 | 116 | 1 | 180 | |||||||||||||||||||||||||||
All-in sustaining costs | 186 | 205 | 65 | 292 | 42 | 60 | 385 | 1 | 1,236 | |||||||||||||||||||||||||||
Adjusted fornon-controlling interests and non -gold producing companies(1) | - | - | - | (44 | ) | - | - | - | - | (44 | ) | |||||||||||||||||||||||||
All-in sustaining costs adjusted fornon-controlling interests andnon-gold producing companies | 186 | 205 | 65 | 248 | 42 | 60 | 385 | 1 | 1,192 | |||||||||||||||||||||||||||
Adjusted for stockpile write-offs | - | (12 | ) | - | - | (2 | ) | - | (3 | ) | - | (17 | ) | |||||||||||||||||||||||
All-in sustaining costs adjusted fornon-controlling interests,non-gold producing companies and stockpile write-offs | 186 | 193 | 65 | 248 | 40 | 60 | 382 | 1 | 1,175 | |||||||||||||||||||||||||||
All-in sustaining costs | 186 | 205 | 65 | 292 | 42 | 60 | 385 | 1 | 1,236 | |||||||||||||||||||||||||||
Non-sustaining Project capex | 117 | - | 20 | - | - | (2 | ) | - | - | 135 | ||||||||||||||||||||||||||
Non-sustaining exploration and study costs | 1 | - | - | 1 | - | - | - | - | 2 | |||||||||||||||||||||||||||
Care and maintenance costs | - | - | 67 | - | - | - | - | - | 67 | |||||||||||||||||||||||||||
Corporate and social responsibility costs not related to current operations | - | - | 1 | - | - | - | - | - | 1 | |||||||||||||||||||||||||||
All-in costs | 304 | 205 | 153 | 293 | 42 | 58 | 385 | 1 | 1,441 | |||||||||||||||||||||||||||
Adjusted fornon-controlling interests and non -gold producing companies(1) | - | - | - | (44 | ) | - | - | - | - | (44 | ) | |||||||||||||||||||||||||
All-in costs adjusted fornon-controlling interests andnon-gold producing companies | 304 | 205 | 153 | 249 | 42 | 58 | 385 | 1 | 1,397 | |||||||||||||||||||||||||||
Adjusted for stockpile write-offs | - | (12 | ) | - | - | (2 | ) | - | (3 | ) | - | (17 | ) | |||||||||||||||||||||||
All-in costs adjusted fornon-controlling interests,non-gold producing companies and stockpile write-offs | 304 | 193 | 153 | 249 | 40 | 58 | 382 | 1 | 1,380 | |||||||||||||||||||||||||||
Gold sold - oz (000)(2) | 290 | 190 | 56 | 256 | 49 | 69 | 531 | - | 1,441 | |||||||||||||||||||||||||||
All-in sustaining cost (excluding stockpile write-offs) per unit – $/oz(3) | 642 | 1,020 | 1,185 | 965 | 815 | 886 | 717 | - | 815 | |||||||||||||||||||||||||||
All-in cost per unit (excluding stockpile write-offs) – $/oz(3) | 1,051 | 1,020 | 2,750 | 969 | 815 | 852 | 717 | - | 957 | |||||||||||||||||||||||||||
145
For the year ended 31 December 20132015
Operations in DRC, Ghana, Guinea, Mali Namibia and Tanzania
(in $ millions, except as otherwise noted)
|
|
|
|
|
|
|
| |||||||||||||||||||||||||||||||||||||
|
|
| | | | |
| | ||||||||||||||||||||||||||||||||||||
Total cash costs | ||||||||||||||||||||||||||||||||||||||||||||
Total cash costs per financial statements | - | 190 | 336 | 290 | - | - | - | 44 | 237 | (3 | ) | 1,094 | ||||||||||||||||||||||||||||||||
Adjusted for non-controlling interests and non-gold producing companies(1) | - | - | - | (43 | ) | - | - | - | - | - | - | (43 | ) | |||||||||||||||||||||||||||||||
Associates and equity accounted joint ventures’ share of total cash costs(2) | 19 | - | - | - | 44 | 114 | 42 | - | - | - | 219 | |||||||||||||||||||||||||||||||||
Total cash costs adjusted for non-controlling interests and non-gold producing companies | 19 | 190 | 336 | 247 | 44 | 114 | 42 | 44 | 237 | (3 | ) | 1,270 | ||||||||||||||||||||||||||||||||
Retrenchment costs | - | 5 | 30 | - | - | - | - | - | - | 3 | 38 | |||||||||||||||||||||||||||||||||
Rehabilitation and other non-cash costs | - | 7 | 4 | 4 | - | - | - | (1 | ) | - | 7 | 21 | ||||||||||||||||||||||||||||||||
Amortisation of tangible assets | - | 30 | 50 | 27 | - | - | - | 6 | 105 | 18 | 236 | |||||||||||||||||||||||||||||||||
Amortisation of intangible assets | - | - | - | - | - | - | - | - | - | 4 | 4 | |||||||||||||||||||||||||||||||||
Adjusted for non-controlling interests and non-gold producing companies(1) | - | - | - | (5 | ) | - | - | - | - | - | - | (5 | ) | |||||||||||||||||||||||||||||||
Associates and equity accounted joint ventures’ share of production costs(2) | 9 | - | - | - | 4 | 5 | 4 | - | - | - | 22 | |||||||||||||||||||||||||||||||||
Total production costs adjusted for non-controlling interests and non-gold producing companies | 28 | 231 | 420 | 273 | 48 | 119 | 46 | 49 | 342 | 29 | 1,586 | |||||||||||||||||||||||||||||||||
Gold produced – oz (000)(3) | 40 | 221 | 239 | 268 | 57 | 86 | 27 | 63 | 459 | - | 1,460 | |||||||||||||||||||||||||||||||||
Total cash costs per unit – $/oz(4) | 471 | 861 | 1,406 | 918 | 773 | 1,334 | 1,530 | 691 | 515 | - | 869 | |||||||||||||||||||||||||||||||||
Total production costs per unit – $/oz(4) | 701 | 1,047 | 1,758 | 1,018 | 838 | 1,389 | 1,702 | 771 | 778 | - | 1,086 | |||||||||||||||||||||||||||||||||
|
|
|
|
|
|
|
| |||||||||||||||||||||||||||||
|
|
|
|
|
|
| ||||||||||||||||||||||||||||||
Cash costs | ||||||||||||||||||||||||||||||||||||
Cost of sales per segmental information | 266 | 219 | 64 | 280 | 45 | 66 | 404 | 3 | 1,347 | |||||||||||||||||||||||||||
Inventory change | - | 1 | (3 | ) | (6 | ) | - | - | (6 | ) | - | (14 | ) | |||||||||||||||||||||||
Amortisation of intangible assets | - | - | - | - | - | - | - | (2 | ) | (2 | ) | |||||||||||||||||||||||||
Amortisation of tangible assets | (87 | ) | (32 | ) | (22 | ) | (26 | ) | (12 | ) | (8 | ) | (148 | ) | (2 | ) | (337 | ) | ||||||||||||||||||
Rehabilitation and othernon-cash costs | (3 | ) | 4 | 12 | 1 | - | (1 | ) | 3 | - | 16 | |||||||||||||||||||||||||
Retrenchment costs | - | - | - | - | 1 | - | - | - | 1 | |||||||||||||||||||||||||||
Total cash costs | 176 | 192 | 51 | 248 | 34 | 57 | 253 | (1 | ) | 1,010 | ||||||||||||||||||||||||||
Adjusted fornon-controlling interests,non-gold producing companies and other(1) | - | - | - | (37 | ) | - | - | - | - | (37 | ) | |||||||||||||||||||||||||
Total cash costs adjusted fornon-controlling interests andnon-gold producing companies | 176 | 192 | 51 | 211 | 34 | 57 | 253 | (1 | ) | 973 | ||||||||||||||||||||||||||
Gold produced - oz (000)(2) | 289 | 193 | 53 | 255 | 49 | 69 | 527 | - | 1,435 | |||||||||||||||||||||||||||
Total cash costs per unit - $/oz(3) | 609 | 995 | 966 | 827 | 698 | 818 | 480 | - | 678 | |||||||||||||||||||||||||||
146
For the year ended 31 December 20132015
Operations in Australia, United States of America, Argentina and Brazil
(in $ millions, except as otherwise noted)
|
|
|
|
|
|
| ||||||||||||||||||||||||||||||||||
|
|
|
|
|
|
| ||||||||||||||||||||||||||||||||||
All-in sustaining costs | ||||||||||||||||||||||||||||||||||||||||
Cost of sales per financial statements | 366 | 64 | 19 | 449 | 201 | 199 | 374 | 133 | 3 | 910 | ||||||||||||||||||||||||||||||
Amortisation of tangible and intangible assets | (67 | ) | (27 | ) | (3 | ) | (97 | ) | (21 | ) | (35 | ) | (103 | ) | (41 | ) | (1 | ) | (201 | ) | ||||||||||||||||||||
Corporate administration and marketing related to current operations | - | - | 1 | 1 | 15 | - | 6 | - | 1 | 22 | ||||||||||||||||||||||||||||||
Sustaining exploration and study costs | 12 | 3 | 8 | 23 | 4 | 7 | 14 | 8 | - | 33 | ||||||||||||||||||||||||||||||
Total sustaining capital expenditure | 39 | 25 | 5 | 69 | 15 | 61 | 118 | 36 | - | 230 | ||||||||||||||||||||||||||||||
All-in sustaining costs | 350 | 65 | 30 | 445 | 214 | 232 | 409 | 136 | 3 | 994 | ||||||||||||||||||||||||||||||
Adjusted for non-controlling interests and non-gold producing companies(1) | - | - | - | - | - | (18 | ) | - | - | - | (18 | ) | ||||||||||||||||||||||||||||
All-in sustaining costs adjusted for non-controlling interests, non-gold producing companies and stockpile write-offs | 350 | 65 | 30 | 445 | 214 | 214 | 409 | 136 | 3 | 976 | ||||||||||||||||||||||||||||||
All-in sustaining costs | 350 | 65 | 30 | 445 | 214 | 232 | 409 | 136 | 3 | 994 | ||||||||||||||||||||||||||||||
Non-sustaining Project Capital expenditure | - | 216 | - | 216 | 148 | 8 | 5 | 4 | 15 | 180 | ||||||||||||||||||||||||||||||
Non-sustaining exploration and study costs | - | - | 9 | 9 | - | - | 6 | - | 114 | 120 | ||||||||||||||||||||||||||||||
Corporate and social responsibility costs not related to current operations | - | - | - | - | - | 1 | 7 | (3 | ) | - | 5 | |||||||||||||||||||||||||||||
All-in costs | 350 | 281 | 39 | 670 | 362 | 241 | 427 | 137 | 132 | 1,299 | ||||||||||||||||||||||||||||||
Adjusted for non-controlling interests and non-gold producing companies(1) | - | - | - | - | - | (18 | ) | - | - | - | (18 | ) | ||||||||||||||||||||||||||||
All-in costs adjusted for non-controlling interests, non-gold producing companies and stockpile write-offs | 350 | 281 | 39 | 670 | 362 | 223 | 427 | 137 | 132 | 1,281 | ||||||||||||||||||||||||||||||
Gold sold – oz (000)(3) | 265 | 58 | - | 323 | 231 | 236 | 399 | 141 | - | 1,007 | ||||||||||||||||||||||||||||||
All-in sustaining cost (excluding stockpile write-offs) per unit – $/oz(4) | 1,321 | 1,113 | - | 1,376 | 927 | 912 | 1,023 | 970 | - | 970 | ||||||||||||||||||||||||||||||
All-in cost per unit (excluding stockpile write-offs) – $/oz(4) | 1,321 | 4,850 | - | 2,073 | 1,567 | 947 | 1,069 | 971 | - | 1,271 | ||||||||||||||||||||||||||||||
147
For the year ended 31 December 2013
Operations in Australia, United States of America, Argentina and Brazil
(in $ millions, except as otherwise noted)
|
|
|
|
|
| |||||||||||||||||||||||||||||||||||||||||||||||||||||||
|
| |||||||||||||||||||||||||||||||||||||||||||||||||||||||||||
|
|
|
|
|
|
| ||||||||||||||||||||||||||||||||||||||||||||||||||||||
| ||||||||||||||||||||||||||||||||||||||||||||||||||||||||||||
| 20 | 525 | 244 | 335 | 137 | 3 | 719 | |||||||||||||||||||||||||||||||||||||||||||||||||||||
Amortisation of tangible and intangible assets | (25 | ) | (88 | ) | (4 | ) | (117 | ) | (58 | ) | (125 | ) | (57 | ) | - | (240 | ) | |||||||||||||||||||||||||||||||||||||||||||
Adjusted for decommissioning amortisation | - | 3 | - | 3 | 1 | - | - | - | 1 | |||||||||||||||||||||||||||||||||||||||||||||||||||
Corporate administration and marketing related to current operations | - | - | - | - | - | 1 | - | - | 1 | |||||||||||||||||||||||||||||||||||||||||||||||||||
Inventory writedown to net realisable value and other stockpile adjustments | - | - | - | - | - | 1 | 3 | 1 | 5 | |||||||||||||||||||||||||||||||||||||||||||||||||||
Sustaining exploration and study costs | 1 | 8 | 6 | 15 | 3 | 2 | 2 | 9 | 16 | |||||||||||||||||||||||||||||||||||||||||||||||||||
Total sustaining capital expenditure | 29 | 48 | 1 | 78 | 67 | 89 | 33 | 1 | 190 | |||||||||||||||||||||||||||||||||||||||||||||||||||
All-in sustaining costs | 244 | 237 | 23 | 504 | 257 | 303 | 118 | 14 | ||||||||||||||||||||||||||||||||||||||||||||||||||||
Adjusted fornon-controlling interests and | - | - | - | - | ( | ) | - | - | (9 | ) | ( | ) | ||||||||||||||||||||||||||||||||||||||||||||||||
All-in sustaining costs adjusted fornon-controlling interests andnon-gold producing companies | 244 | 237 | 23 | 504 | 238 | 303 | 118 | 5 | 664 | |||||||||||||||||||||||||||||||||||||||||||||||||||
Adjusted for stockpile write-offs | - | - | - | - | - | ( | ) | (4 | ) | - | (5 | ) | ||||||||||||||||||||||||||||||||||||||||||||||||
| 23 | 504 | 238 | 302 | 114 | 5 | 659 | |||||||||||||||||||||||||||||||||||||||||||||||||||||
All-in sustaining costs | 244 | 237 | 23 | 504 | 257 | 303 | 118 | 14 | ||||||||||||||||||||||||||||||||||||||||||||||||||||
| ||||||||||||||||||||||||||||||||||||||||||||||||||||||||||||
| ||||||||||||||||||||||||||||||||||||||||||||||||||||||||||||
| ||||||||||||||||||||||||||||||||||||||||||||||||||||||||||||
| - | - | - | - | - | - | - | 6 | 6 | |||||||||||||||||||||||||||||||||||||||||||||||||||
Non-sustaining exploration and study costs | - | - | 6 | 6 | - | 2 | - | 41 | 43 | |||||||||||||||||||||||||||||||||||||||||||||||||||
Corporate and social responsibility costs not related to current operations | - | - | - | - | - | 7 | - | 1 | ||||||||||||||||||||||||||||||||||||||||||||||||||||
All-in costs | 244 | 237 | 29 | 510 | 257 | 312 | 118 | 62 | 749 | |||||||||||||||||||||||||||||||||||||||||||||||||||
Adjusted fornon-controlling interests and | - | - | - | - | ( | ) | - | - | - | ) | ||||||||||||||||||||||||||||||||||||||||||||||||||
| 730 | |||||||||||||||||||||||||||||||||||||||||||||||||||||||||||
Adjusted for stockpile write-offs | - | - | - | - | - | (1 | ) | (4 | ) | - | (5 | ) | ||||||||||||||||||||||||||||||||||||||||||||||||
All-in costs adjusted fornon-controlling interests,non-gold producing companies and stockpile write-offs | 244 | 29 | 510 | 238 | 311 | 114 | 62 | 725 | ||||||||||||||||||||||||||||||||||||||||||||||||||||
Gold | - | - | ||||||||||||||||||||||||||||||||||||||||||||||||||||||||||
| 1,110 | - | 861 | - | ||||||||||||||||||||||||||||||||||||||||||||||||||||||||
| - | 886 | 874 | 733 | 865 | - | 885 | |||||||||||||||||||||||||||||||||||||||||||||||||||||
148
For the year ended 31 December 20132015
Operations in Australia, Argentina and Brazil
(in $ millions, except as otherwise noted)
|
|
|
|
|
| |||||||||||||||||||||||||||||||
|
|
|
|
|
|
| ||||||||||||||||||||||||||||||
Cash costs | ||||||||||||||||||||||||||||||||||||
Cost of sales per segmental information | 239 | 266 | 20 | 525 | 244 | 335 | 137 | 3 | 719 | |||||||||||||||||||||||||||
Inventory change | (4 | ) | (6 | ) | - | (10 | ) | 4 | - | (3 | ) | 1 | 2 | |||||||||||||||||||||||
Amortisation of intangible assets | - | - | (1 | ) | (1 | ) | - | (12 | ) | (5 | ) | - | (17 | ) | ||||||||||||||||||||||
Amortisation of tangible assets | (25 | ) | (88 | ) | (4 | ) | (117 | ) | (58 | ) | (113 | ) | (52 | ) | - | (223 | ) | |||||||||||||||||||
Rehabilitation and othernon-cash costs | (1 | ) | (3 | ) | - | (4 | ) | (1 | ) | 10 | 6 | - | 15 | |||||||||||||||||||||||
Retrenchment costs | - | - | - | - | (1 | ) | (2 | ) | - | - | (3 | ) | ||||||||||||||||||||||||
Total cash costs | 210 | 169 | 14 | 393 | 188 | 218 | 84 | 2 | 492 | |||||||||||||||||||||||||||
Adjusted fornon-controlling interests,non-gold producing companies and other(1) | - | - | - | - | (14 | ) | - | - | - | (14 | ) | |||||||||||||||||||||||||
Total cash costs adjusted fornon-controlling interests andnon-gold producing companies | 210 | 169 | 14 | 393 | 174 | 218 | 84 | 2 | 478 | |||||||||||||||||||||||||||
Gold produced - oz (000)(2) | 216 | 344 | - | 560 | 278 | 421 | 132 | - | 831 | |||||||||||||||||||||||||||
Total cash costs per unit - $/oz(3) | 970 | 492 | - | 702 | 625 | 518 | 635 | - | 576 | |||||||||||||||||||||||||||
For the year ended 31 December 2015
AngloGold Ashanti operations – Total
(in $ millions, except as otherwise noted)
| ||||
All-in sustaining costs | ||||
Cost of sales per | ||||
Amortisation of tangible and intangible assets | ( | ) | ||
Adjusted for | ||||
Corporate administration and marketing related to current operations | ||||
| ||||
Inventory writedown to net realisable value and other stockpile adjustments | ||||
Sustaining exploration and study costs | ||||
Total sustaining capital expenditure | ||||
All-in sustaining costs | ||||
Adjusted fornon-controlling | ||||
| (64 | ) | ||
| 3,517 | |||
Adjusted for stockpile write-offs | ( | ) | ||
All-in sustaining costs adjusted fornon-controlling interests,non-gold producing companies and stockpile write-offs | ||||
All-in sustaining costs | ||||
Non-sustaining Project | ||||
Technology improvements | ||||
Non-sustaining exploration and study costs | 62 | |||
Care and maintenance costs | ||||
Care and maintenance costs, Corporate and social responsibility costs not related to current operations | ||||
All-in costs | ||||
Adjusted fornon-controlling | ||||
| (55 | ) | ||
| 3,866 | |||
Adjusted for stockpile write-offs | ( | ) | ||
All-in costs adjusted fornon-controlling interests,non-gold producing companies and stockpile write-offs | ||||
Gold sold | ||||
All-in sustaining cost (excluding stockpile write-offs) per unit - $/oz | ||||
All-in cost per unit (excluding stockpile write-offs) - $/oz | ||||
149
For the year ended 31 December 20132015
AngloGold Ashanti operations –- Total
(in $ millions, except as otherwise noted)
| ||||
| ||||
| ||||
| ( | ) | ||
| ||||
| ||||
| ||||
| ) | |||
Amortisation of tangible assets | ) | |||
| ||||
| ||||
| ) | |||
Total | ||||
Adjusted fornon-controlling interests,non-gold producing companies and other(1) | (42 | ) | ||
Total cash costs adjusted fornon-controlling interests andnon-gold producing companies | 2,718 | |||
Gold produced | ||||
Total cash | ||||
| ||||
150
For the year ended 31 December 20122014
Operations in South Africa
(in $ millions, except as otherwise noted)
| | | |
|
|
| | | | |||||||||||||||||||||||||||||||
All-in sustaining costs | ||||||||||||||||||||||||||||||||||||||||
Cost of sales per financial statements | 123 | 208 | 246 | 330 | 50 | 238 | 131 | - | 1,326 | (41 | ) | |||||||||||||||||||||||||||||
Amortisation of tangible and intangible assets | (21 | ) | (41 | ) | (89 | ) | (68 | ) | (11 | ) | (61 | ) | (11 | ) | - | (302 | ) | (8 | ) | |||||||||||||||||||||
Adjusted for decomissioning amortisation | - | - | - | - | - | - | - | 1 | 1 | - | ||||||||||||||||||||||||||||||
Corporate administration and marketing related to current operations | - | - | - | - | - | - | - | 9 | 9 | 240 | ||||||||||||||||||||||||||||||
Associates and equity accounted joint ventures’ share of costs(2) | - | - | - | - | - | - | - | - | - | - | ||||||||||||||||||||||||||||||
Sustaining exploration and study costs | - | - | - | - | - | - | - | - | - | - | ||||||||||||||||||||||||||||||
Total sustaining capital expenditure | 26 | 79 | 107 | 96 | 20 | 71 | 11 | - | 410 | 34 | ||||||||||||||||||||||||||||||
All-in sustaining costs | 128 | 246 | 264 | 358 | 59 | 248 | 131 | 10 | 1,444 | 225 | ||||||||||||||||||||||||||||||
Adjusted for non-controlling interests(1) | - | - | - | - | - | - | - | - | - | (1 | ) | |||||||||||||||||||||||||||||
All-in sustaining costs adjusted for non-controlling interests | 128 | 246 | 264 | 358 | 59 | 248 | 131 | 10 | 1,444 | 224 | ||||||||||||||||||||||||||||||
Gold sold – oz (000)(3) | 84 | 164 | 162 | 405 | 37 | 189 | 174 | - | 1,214 | - | ||||||||||||||||||||||||||||||
All-in sustaining cost (excluding stockpile impairments) per | 1,530 | 1,497 | 1,634 | 883 | 1,607 | 1,316 | 754 | - | 1,189 | - | ||||||||||||||||||||||||||||||
Total cash costs | ||||||||||||||||||||||||||||||||||||||||
Total cash costs per financial statements | 103 | 167 | 168 | 259 | 38 | 175 | 149 | - | 1,059 | (50 | ) | |||||||||||||||||||||||||||||
Adjusted for non-controlling interests and non-gold producing companies(1) | - | - | - | - | - | - | - | - | - | 50 | ||||||||||||||||||||||||||||||
Associates and equity accounted joint ventures’ share of total cash costs(2) | - | - | - | - | - | - | - | - | - | - | ||||||||||||||||||||||||||||||
Total cash costs adjusted for non-controlling interests and non-gold producing companies | 103 | 167 | 168 | 259 | 38 | 175 | 149 | - | 1,059 | - | ||||||||||||||||||||||||||||||
Retrenchment costs | 1 | 2 | 1 | 1 | - | 1 | - | - | 6 | 1 | ||||||||||||||||||||||||||||||
Rehabilitation and other non-cash costs | (1 | ) | (1 | ) | (12 | ) | 2 | - | 2 | (29 | ) | - | (39 | ) | 3 | |||||||||||||||||||||||||
Amortisation of tangible assets | 21 | 41 | 89 | 68 | 11 | 61 | 11 | - | 302 | 12 | ||||||||||||||||||||||||||||||
Amortisation of intangible assets | - | - | - | - | - | - | - | - | - | - | ||||||||||||||||||||||||||||||
Adjusted for non-controlling interests and non-gold producing companies(1) | - | - | - | - | - | - | - | - | - | (6 | ) | |||||||||||||||||||||||||||||
Associates and equity accounted joint ventures’ share of production costs(2) | - | - | - | - | - | - | - | - | - | (1 | ) | |||||||||||||||||||||||||||||
Total production costs adjusted for non-controlling interests and non-gold producing companies | 124 | 209 | 246 | 330 | 49 | 239 | 131 | - | 1,328 | 9 | ||||||||||||||||||||||||||||||
Gold produced – oz (000)(3) | 84 | 164 | 162 | 405 | 37 | 189 | 172 | - | 1,212 | - | ||||||||||||||||||||||||||||||
Total cash costs per unit – $/oz(4) | 1,226 | 1,015 | 1,040 | 639 | 1,041 | 924 | 943 | - | 873 | - | ||||||||||||||||||||||||||||||
Total production costs per unit – $/oz(4) | 1,475 | 1,267 | 1,522 | 816 | 1,352 | 1,262 | 1,277 | - | 1,095 | - | ||||||||||||||||||||||||||||||
|
|
|
|
|
|
|
|
|
|
| ||||||||||||||||||||||||||||||||||
All-in sustaining costs | ||||||||||||||||||||||||||||||||||||||||||||
Cost of sales per segmental information(5) | 94 | 201 | 217 | 512 | 313 | 268 | 581 | 231 | - | 1,324 | - | |||||||||||||||||||||||||||||||||
Amortisation of tangible and intangible assets | (8 | ) | (50 | ) | (50 | ) | (107 | ) | (71 | ) | (58 | ) | (129 | ) | (22 | ) | 1 | (258 | ) | (7 | ) | |||||||||||||||||||||||
Adjusted for decommissioning amortisation | 1 | - | - | 1 | - | - | - | 1 | (2 | ) | - | - | ||||||||||||||||||||||||||||||||
Corporate administration and marketing related to current operations | - | - | - | - | - | - | - | - | 1 | 1 | 85 | |||||||||||||||||||||||||||||||||
Inventory writedown to net realisable value and other stockpile adjustments | - | - | - | - | - | - | - | - | 1 | 1 | 1 | |||||||||||||||||||||||||||||||||
Total sustaining capital expenditure | 7 | 26 | 44 | 76 | 65 | 35 | 100 | 46 | 7 | 230 | 5 | |||||||||||||||||||||||||||||||||
All-in sustaining costs | 94 | 177 | 211 | 482 | 307 | 245 | 552 | 256 | 8 | 1,298 | 84 | |||||||||||||||||||||||||||||||||
Adjusted fornon-controlling interests and non -gold producing companies(1) | - | - | - | - | - | - | - | - | - | - | 6 | |||||||||||||||||||||||||||||||||
All-in sustaining costs adjusted fornon-controlling interests andnon-gold producing companies | 94 | 177 | 211 | 482 | 307 | 245 | 552 | 256 | 8 | 1,298 | 90 | |||||||||||||||||||||||||||||||||
Adjusted for stockpile write-offs | - | - | - | - | - | - | - | - | (1 | ) | (1 | ) | - | |||||||||||||||||||||||||||||||
All-in sustaining costs adjusted fornon-controlling interests,non-gold producing companies and stockpile write-offs | 94 | 177 | 211 | 482 | 307 | 245 | 552 | 256 | 7 | 1,297 | 90 | |||||||||||||||||||||||||||||||||
All-in sustaining costs | 94 | 177 | 211 | 482 | 307 | 245 | 552 | 256 | 8 | 1,298 | 84 | |||||||||||||||||||||||||||||||||
Non-sustaining Project capex | - | - | 2 | 2 | 32 | - | 32 | - | - | 34 | - | |||||||||||||||||||||||||||||||||
Technology improvements | - | - | - | - | - | - | - | - | 19 | 19 | - | |||||||||||||||||||||||||||||||||
Non-sustaining exploration and study costs | - | - | - | - | - | - | - | - | - | - | 5 | |||||||||||||||||||||||||||||||||
Corporate and social responsibility costs not related to current operations | - | - | - | - | - | - | - | - | - | - | 7 | |||||||||||||||||||||||||||||||||
All-in costs | 94 | 177 | 213 | 484 | 339 | 245 | 584 | 256 | 27 | 1,351 | 96 | |||||||||||||||||||||||||||||||||
Adjusted fornon-controlling interests and non -gold producing companies(1) | - | - | - | - | - | - | - | - | - | - | 6 | |||||||||||||||||||||||||||||||||
All-in costs adjusted fornon-controlling interests andnon-gold producing companies | 94 | 177 | 213 | 484 | 339 | 245 | 584 | 256 | 27 | 1,351 | 102 | |||||||||||||||||||||||||||||||||
Adjusted for stockpile write-offs | - | - | - | - | - | - | - | - | (1 | ) | (1 | ) | - | |||||||||||||||||||||||||||||||
All-in costs adjusted fornon-controlling interests,non-gold producing companies and stockpile write-offs | 94 | 177 | 213 | 484 | 339 | 245 | 584 | 256 | 26 | 1,350 | 102 | |||||||||||||||||||||||||||||||||
Gold sold - oz (000)(2) | 78 | 140 | 234 | 452 | 313 | 232 | 544 | 223 | 3 | 1,223 | - | |||||||||||||||||||||||||||||||||
All-in sustaining cost (excluding stockpile write-offs) per unit - $/oz(3) | 1,185 | 1,256 | 903 | 1,061 | 981 | 1,059 | 1,014 | 1,153 | - | 1,064 | - | |||||||||||||||||||||||||||||||||
All-in cost per unit (excluding stockpile write-offs) - $/oz(3) | 1,185 | 1,256 | 909 | 1,064 | 1,085 | 1,059 | 1,074 | 1,153 | - | 1,107 | - | |||||||||||||||||||||||||||||||||
| (1) | Adjusting fornon-controlling interest of items included in calculation, to disclose the attributable |
| (2) |
|
Attributable portion. |
In addition to the operational performances of the mines,all-in sustaining cost per ounce,all-in cost per ounce, total cash costs per ounce and |
Corporate includesnon-gold producing subsidiaries. |
|
151
For the year ended 31 December 20122014
Operations in South Africa
(in $ millions, except as otherwise noted)
|
|
|
|
|
|
|
|
|
|
| ||||||||||||||||||||||||||||||||||
Cash costs | ||||||||||||||||||||||||||||||||||||||||||||
Cost of sales per segmental information | 94 | 201 | 217 | 512 | 313 | 268 | 581 | 231 | - | 1,324 | - | |||||||||||||||||||||||||||||||||
Inventory change | - | 1 | - | 1 | - | - | - | - | - | 1 | - | |||||||||||||||||||||||||||||||||
Amortisation of intangible assets | (1 | ) | (2 | ) | (4 | ) | (8 | ) | (5 | ) | (4 | ) | (9 | ) | (2 | ) | - | (19 | ) | (3 | ) | |||||||||||||||||||||||
Amortisation of tangible assets | (6 | ) | (47 | ) | (46 | ) | (100 | ) | (65 | ) | (54 | ) | (119 | ) | (20 | ) | - | (239 | ) | (5 | ) | |||||||||||||||||||||||
Rehabilitation and othernon-cash costs | (1 | ) | (3 | ) | (4 | ) | (8 | ) | (4 | ) | (3 | ) | (8 | ) | - | - | (16 | ) | (1 | ) | ||||||||||||||||||||||||
Retrenchment costs | (2 | ) | (5 | ) | (2 | ) | (9 | ) | (4 | ) | (3 | ) | (7 | ) | - | - | (16 | ) | - | |||||||||||||||||||||||||
Total cash costs | 84 | 144 | 160 | 388 | 233 | 205 | 438 | 210 | (1) | (1 | ) | 1,035 | (8 | ) | ||||||||||||||||||||||||||||||
Adjusted fornon-controlling interests,non-gold producing companies and other(1) | - | - | - | - | - | - | - | - | - | - | 7 | |||||||||||||||||||||||||||||||||
Total cash costs adjusted fornon-controlling interests andnon-gold producing companies | 84 | 144 | 160 | 388 | 233 | 205 | 438 | 210 | (1 | ) | 1,035 | (1 | ) | |||||||||||||||||||||||||||||||
Gold produced - oz (000)(2) | 78 | 141 | 234 | 453 | 313 | 232 | 544 | 223 | 3 | 1,223 | - | |||||||||||||||||||||||||||||||||
Total cash costs per unit - $/oz(3) | 1,074 | 1,023 | 685 | 857 | 746 | 882 | 804 | 941 | - | 849 | - | |||||||||||||||||||||||||||||||||
For the year ended 31 December 2014
Operations in DRC, Ghana, Guinea, Mali Namibia and Tanzania
(in $ millions, except as otherwise noted)
|
|
|
|
|
|
| ||||||||||||||||||||||||||||||||||
|
| | | | |
| | |||||||||||||||||||||||||||||||||
All-in sustaining costs | ||||||||||||||||||||||||||||||||||||||||
Cost of sales per financial statements | 207 | 446 | 292 | - | - | - | 93 | 366 | 7 | 1,411 | ||||||||||||||||||||||||||||||
Amortisation of tangible and intangible assets | (24 | ) | (71 | ) | (24 | ) | - | - | - | (15 | ) | (134 | ) | (8 | ) | (276 | ) | |||||||||||||||||||||||
Adjusted for decomissioning amortisation | 1 | 1 | 2 | - | - | - | - | 1 | 1 | 6 | ||||||||||||||||||||||||||||||
Corporate administration and marketing related to current operations | - | - | 1 | - | - | - | - | - | 10 | 11 | ||||||||||||||||||||||||||||||
Associates and equity accounted joint ventures’ share of costs(2) | - | - | - | 61 | 118 | 51 | - | - | - | 230 | ||||||||||||||||||||||||||||||
Sustaining exploration and study costs | 4 | 12 | 13 | - | 3 | 2 | 5 | 16 | - | 55 | ||||||||||||||||||||||||||||||
Total sustaining capital expenditure | 75 | 181 | 19 | 1 | 6 | 1 | 15 | 195 | 2 | 495 | ||||||||||||||||||||||||||||||
All-in sustaining costs | 263 | 569 | 303 | 62 | 127 | 54 | 98 | �� | 444 | 12 | 1,932 | |||||||||||||||||||||||||||||
Adjusted for non-controlling interests(1) | - | - | (45 | ) | - | - | - | - | - | (1 | ) | (46 | ) | |||||||||||||||||||||||||||
All-in sustaining costs adjusted for non-controlling interests | 263 | 569 | 258 | 62 | 127 | 54 | 98 | 444 | 11 | 1,886 | ||||||||||||||||||||||||||||||
Gold sold – oz (000)(3) | 183 | 281 | 233 | 81 | 101 | 28 | 73 | 546 | - | 1,527 | ||||||||||||||||||||||||||||||
All-in sustaining cost (excluding stockpile impairments) per | 1,437 | 2,021 | 1,105 | 765 | 1,249 | 1,888 | 1,329 | 816 | - | 1,235 | ||||||||||||||||||||||||||||||
Total cash costs | ||||||||||||||||||||||||||||||||||||||||
Total cash costs per financial statements | 172 | 332 | 272 | - | - | - | 76 | 227 | (7 | ) | 1,072 | |||||||||||||||||||||||||||||
Adjusted for non-controlling interests and non-gold producing companies(1) | - | - | (41 | ) | - | - | - | - | - | - | (41 | ) | ||||||||||||||||||||||||||||
Associates and equity accounted joint ventures’ share of total cash costs(2) | - | - | - | 62 | 117 | 51 | - | - | - | 230 | ||||||||||||||||||||||||||||||
Total cash costs adjusted for non-controlling interests and non-gold producing companies | 172 | 332 | 231 | 62 | 117 | 51 | 76 | 227 | (7 | ) | 1,261 | |||||||||||||||||||||||||||||
Retrenchment costs | - | - | - | - | - | - | - | - | - | - | ||||||||||||||||||||||||||||||
Rehabilitation and other non-cash costs | 8 | 41 | 12 | - | - | - | 2 | 7 | - | 70 | ||||||||||||||||||||||||||||||
Amortisation of tangible assets | 24 | 71 | 24 | - | - | - | 15 | 90 | 44 | 268 | ||||||||||||||||||||||||||||||
Amortisation of intangible assets | - | - | - | - | - | - | - | - | 4 | 4 | ||||||||||||||||||||||||||||||
Adjusted for non-controlling interests and non-gold producing companies(1) | - | - | (5 | ) | - | - | - | - | - | - | (5 | ) | ||||||||||||||||||||||||||||
Associates and equity accounted joint ventures’ share of production costs(2) | - | - | - | 3 | 2 | 3 | - | - | - | 8 | ||||||||||||||||||||||||||||||
Total production costs adjusted for non-controlling interests and non-gold producing companies | 204 | 444 | 262 | 65 | 119 | 54 | 93 | 324 | 41 | 1,606 | ||||||||||||||||||||||||||||||
Gold produced – oz (000)(3) | 180 | 280 | 247 | 81 | 100 | 29 | 74 | 531 | - | 1,521 | ||||||||||||||||||||||||||||||
Total cash costs per unit – $/oz(4) | 955 | 1,187 | 938 | 767 | 1,169 | 1,758 | 1,036 | 427 | - | 830 | ||||||||||||||||||||||||||||||
Total production costs per unit – $/oz(4) | 1,134 | 1,590 | 1,065 | 798 | 1,185 | 1,874 | 1,262 | 694 | - | 1,060 | ||||||||||||||||||||||||||||||
 |  |  |  |  |
|
|
| |||||||||||||||||||||||||||||||||||||
 |  |  |  |  |  |  |
|
| ||||||||||||||||||||||||||||||||||||
All-in sustaining costs | ||||||||||||||||||||||||||||||||||||||||||||
Cost of sales per segmental information | 202 | 192 | 303 | 314 | 59 | 112 | 20 | 26 | 403 | 5 | 1,636 | |||||||||||||||||||||||||||||||||
Amortisation of tangible and intangible assets | (69 | ) | (24 | ) | (19 | ) | (32 | ) | (8 | ) | (25 | ) | (1 | ) | - | (99 | ) | (3 | ) | (280 | ) | |||||||||||||||||||||||
Adjusted for decommissioning amortisation | - | - | 1 | 4 | - | 2 | 1 | - | 2 | (1 | ) | 9 | ||||||||||||||||||||||||||||||||
Corporate administration and marketing related to current operations | - | - | - | - | - | - | - | - | - | 1 | 1 | |||||||||||||||||||||||||||||||||
Inventory writedown to net realisable value and other stockpile adjustments | - | - | - | - | - | - | 8 | - | - | - | 8 | |||||||||||||||||||||||||||||||||
Sustaining exploration and study costs | - | - | 13 | 2 | - | 1 | - | - | 2 | (1 | ) | 17 | ||||||||||||||||||||||||||||||||
Total sustaining capital expenditure | 3 | 21 | 43 | 30 | 6 | 6 | - | 1 | 129 | 1 | 240 | |||||||||||||||||||||||||||||||||
All-in sustaining costs | 136 | 189 | 341 | 318 | 57 | 96 | 28 | 27 | 437 | 2 | 1,631 | |||||||||||||||||||||||||||||||||
Adjusted fornon-controlling interests and non -gold producing companies(1) | - | - | - | (48 | ) | - | - | - | - | - | - | (48 | ) | |||||||||||||||||||||||||||||||
All-in sustaining costs adjusted fornon-controlling interests andnon-gold producing companies | 136 | 189 | 341 | 270 | 57 | 96 | 28 | 27 | 437 | 2 | 1,583 | |||||||||||||||||||||||||||||||||
Adjusted for stockpile write-offs | - | - | - | - | - | - | (8 | ) | (2 | ) | (9 | ) | - | (19 | ) | |||||||||||||||||||||||||||||
All-in sustaining costs adjusted fornon-controlling interests,non-gold producing companies and stockpile write-offs | 136 | 189 | 341 | 270 | 57 | 96 | 20 | 25 | 428 | 2 | 1,564 | |||||||||||||||||||||||||||||||||
All-in sustaining costs | 136 | 189 | 341 | 318 | 57 | 96 | 28 | 27 | 437 | 2 | 1,631 | |||||||||||||||||||||||||||||||||
Non-sustaining Project capex | 176 | - | 38 | - | - | - | - | - | - | - | 214 | |||||||||||||||||||||||||||||||||
Non-sustaining exploration and study costs | 2 | - | - | 5 | - | - | - | - | - | - | 7 | |||||||||||||||||||||||||||||||||
All-in costs | 314 | 189 | 379 | 323 | 57 | 96 | 28 | 27 | 437 | 2 | 1,852 | |||||||||||||||||||||||||||||||||
Adjusted fornon-controlling interests and non -gold producing companies(1) | - | - | - | (48 | ) | - | - | - | - | - | - | (48 | ) | |||||||||||||||||||||||||||||||
All-in costs adjusted fornon-controlling interests andnon-gold producing companies | 314 | 189 | 379 | 275 | 57 | 96 | 28 | 27 | 437 | 2 | 1,804 | |||||||||||||||||||||||||||||||||
Adjusted for stockpile write-offs | - | - | - | - | - | - | (8 | ) | (2 | ) | (9 | ) | - | (19 | ) | |||||||||||||||||||||||||||||
All-in costs adjusted fornon-controlling interests,non-gold producing companies and stockpile write-offs | 314 | 189 | 379 | 275 | 57 | 96 | 20 | 25 | 428 | 2 | 1,785 | |||||||||||||||||||||||||||||||||
Gold sold - oz (000)(2) | 233 | 185 | 248 | 294 | 44 | 85 | 11 | 34 | 481 | - | 1,615 | |||||||||||||||||||||||||||||||||
All-in sustaining cost (excluding stockpile write-offs) per unit - $/oz(3) | 588 | 1,020 | 1,374 | 917 | 1,298 | 1,133 | 1,795 | 719 | 890 | - | 968 | |||||||||||||||||||||||||||||||||
All-in cost per unit (excluding stockpile write-offs) - $/oz(3) | 1,351 | 1,020 | 1,530 | 933 | 1,298 | 1,133 | 1,795 | 719 | 890 | - | 1,105 | |||||||||||||||||||||||||||||||||
152
For the year ended 31 December 20122014
Operations in DRC, Ghana, Guinea, Mali and Tanzania
(in $ millions, except as otherwise noted)
|
|
|
|
|
|
|
|
|
|
|
|
|
|
|
|
|
|
|
|
|
|
|
| |||||||||||||||||||||
|
|
|
|
|
|
| 
|
|
| 
|
|
| 
|
|
| 
|
|
| 
|
|
|
|
|
| 
|
| ||||||||||||||||||
Cash costs | ||||||||||||||||||||||||||||||||||||||||||||
Cost of sales per segmental information | 202 | 192 | 303 | 314 | 59 | 112 | 20 | 26 | 403 | 5 | 1,636 | |||||||||||||||||||||||||||||||||
Inventory change | 2 | (9 | ) | (6 | ) | (4 | ) | - | - | - | (1 | ) | (12 | ) | 1 | (29 | ) | |||||||||||||||||||||||||||
Amortisation of intangible assets | - | - | - | - | - | - | - | - | - | (4 | ) | (4 | ) | |||||||||||||||||||||||||||||||
Amortisation of tangible assets | (69 | ) | (24 | ) | (19 | ) | (32 | ) | (8 | ) | (25 | ) | (1 | ) | - | (99 | ) | - | (277 | ) | ||||||||||||||||||||||||
Rehabilitation and othernon-cash costs | 2 | (6 | ) | (15 | ) | (5 | ) | - | 1 | (1 | ) | - | (7 | ) | - | (31 | ) | |||||||||||||||||||||||||||
Retrenchment costs | - | - | - | - | - | (1 | ) | (2 | ) | - | (1 | ) | - | (4 | ) | |||||||||||||||||||||||||||||
Total cash costs | 137 | 153 | 264 | 273 | 51 | 87 | 16 | 25 | 286 | - | 1,292 | |||||||||||||||||||||||||||||||||
Adjusted fornon-controlling interests,non-gold producing companies and other(1) | - | - | - | (41 | ) | - | - | - | - | - | - | (41 | ) | |||||||||||||||||||||||||||||||
Total cash costs adjusted fornon-controlling interests andnon-gold producing companies | 137 | 153 | 264 | 232 | 51 | 87 | 16 | 25 | 286 | - | 1,251 | |||||||||||||||||||||||||||||||||
Gold produced – oz (000)(2) | 237 | 177 | 243 | 290 | 44 | 85 | 11 | 33 | 477 | - | 1,597 | |||||||||||||||||||||||||||||||||
Total cash costs per unit – $/oz(3) | 578 | 865 | 1,086 | 799 | 1,162 | 1,028 | 1,438 | 752 | 599 | - | 783 | |||||||||||||||||||||||||||||||||
For the year ended 31 December 2014
Operations in Australia, United States of America, Argentina and Brazil
(in $ millions, except as otherwise noted)
|
|
|
|
|
|
| ||||||||||||||||||||||||||||||
|
|
|
|
|
| |||||||||||||||||||||||||||||||
All-in sustaining costs | ||||||||||||||||||||||||||||||||||||
Cost of sales per financial statements | 324 | 24 | 348 | 201 | 183 | 401 | 133 | 2 | 920 | |||||||||||||||||||||||||||
Amortisation of tangible and intangible assets | (34 | ) | (2 | ) | (36 | ) | (41 | ) | (35 | ) | (113 | ) | (24 | ) | - | (213 | ) | |||||||||||||||||||
Adjusted for decomissioning amortisation | - | - | - | - | 1 | (1 | ) | - | - | - | ||||||||||||||||||||||||||
Corporate administration and marketing related to current operations | - | 1 | 1 | 18 | - | 11 | - | 1 | 30 | |||||||||||||||||||||||||||
Associates and equity accounted joint ventures’ share of costs(2) | - | - | - | - | - | - | - | - | ||||||||||||||||||||||||||||
Sustaining exploration and study costs | 37 | 26 | 63 | 4 | 6 | 20 | 4 | - | 34 | |||||||||||||||||||||||||||
Total sustaining capital expenditure | 49 | 5 | 54 | 20 | 77 | 107 | 36 | 2 | 242 | |||||||||||||||||||||||||||
All-in sustaining costs | 376 | 54 | 430 | 202 | 232 | 425 | 149 | 5 | 1,013 | |||||||||||||||||||||||||||
Adjusted for non-controlling interests(1) | - | - | - | - | (17 | ) | - | (35 | ) | - | (52 | ) | ||||||||||||||||||||||||
All-in sustaining costs adjusted for non-controlling interests | 376 | 54 | 430 | 202 | 215 | 425 | 114 | 5 | 961 | |||||||||||||||||||||||||||
Gold sold – oz (000)(3) | 257 | - | 257 | 247 | 229 | 382 | 97 | - | 955 | |||||||||||||||||||||||||||
All-in sustaining cost (excluding stockpile impairments) per unit – $/oz(4) | 1,470 | - | 1,680 | 817 | 935 | 1,114 | 1,168 | - | 1,006 | |||||||||||||||||||||||||||
Total cash costs | ||||||||||||||||||||||||||||||||||||
Total cash costs per financial statements | 290 | 22 | 312 | 225 | 136 | 270 | 108 | 3 | 742 | |||||||||||||||||||||||||||
Adjusted for non-controlling interests and non-gold producing companies(1) | - | - | - | (67 | ) | (10 | ) | - | (27 | ) | - | (104 | ) | |||||||||||||||||||||||
Associates and equity accounted joint ventures’ share of total cash costs(2) | - | - | - | - | - | - | - | - | - | |||||||||||||||||||||||||||
Total cash costs adjusted for non-controlling interests and non-gold producing companies | 290 | 22 | 312 | 158 | 126 | 270 | 81 | 3 | 638 | |||||||||||||||||||||||||||
Retrenchment costs | - | - | - | - | 1 | 2 | - | - | 3 | |||||||||||||||||||||||||||
Rehabilitation and other non-cash costs | 2 | - | 2 | 9 | 7 | 17 | (4 | ) | 2 | 31 | ||||||||||||||||||||||||||
Amortisation of tangible assets | 34 | 2 | 36 | 41 | 35 | 112 | 24 | - | 212 | |||||||||||||||||||||||||||
Amortisation of intangible assets | - | - | - | - | - | 1 | - | - | 1 | |||||||||||||||||||||||||||
Adjusted for non-controlling interests and non-gold producing companies(1) | - | - | - | (9 | ) | (3 | ) | - | (8 | ) | - | (20 | ) | |||||||||||||||||||||||
Associates and equity accounted joint ventures’ share of production costs(2) | - | - | - | - | - | - | - | - | - | |||||||||||||||||||||||||||
Total production costs adjusted for non-controlling interests and non-gold producing companies | 326 | 24 | 350 | 199 | 166 | 402 | 93 | 5 | 865 | |||||||||||||||||||||||||||
Gold produced – oz (000)(3) | 258 | - | 258 | 247 | 219 | 388 | 98 | - | 953 | |||||||||||||||||||||||||||
Total cash costs per unit – $/oz(4) | 1,126 | - | 1,211 | 638 | (6) | 576 | 696 | 821 | - | 669 | ||||||||||||||||||||||||||
Total production costs per unit – $/oz(4) | 1,264 | - | 1,358 | 804 | 759 | 1,037 | 958 | - | 907 | |||||||||||||||||||||||||||
|
|
|
|
|
| |||||||||||||||||||||||||||||||
|
|
|
|
|
| |||||||||||||||||||||||||||||||
All-in sustaining costs | ||||||||||||||||||||||||||||||||||||
Cost of sales per segmental information | 344 | 296 | 20 | 660 | 222 | 362 | 156 | 5 | 745 | |||||||||||||||||||||||||||
Amortisation of tangible and intangible assets | (47 | ) | (98 | ) | (5 | ) | (150 | ) | (33 | ) | (107 | ) | (49 | ) | (1 | ) | (190 | ) | ||||||||||||||||||
Adjusted for decommissioning amortisation | - | 3 | - | 3 | - | - | - | 1 | 1 | |||||||||||||||||||||||||||
Corporate administration and marketing related to current operations | - | - | - | - | - | 1 | - | - | 1 | |||||||||||||||||||||||||||
Inventory writedown to net realisable value and other stockpile adjustments | - | - | - | - | - | 1 | - | - | 1 | |||||||||||||||||||||||||||
Sustaining exploration and study costs | - | 3 | 6 | 9 | 2 | 8 | 1 | 10 | 21 | |||||||||||||||||||||||||||
Total sustaining capital expenditure | 31 | 59 | 1 | 91 | 58 | 127 | 38 | 1 | 224 | |||||||||||||||||||||||||||
All-in sustaining costs | 328 | 263 | 22 | 613 | 249 | 392 | 146 | 16 | 803 | |||||||||||||||||||||||||||
Adjusted fornon-controlling interests and non-gold producing companies(1) | - | - | - | - | (19 | ) | - | - | (16 | ) | (35 | ) | ||||||||||||||||||||||||
All-in sustaining costs adjusted fornon-controlling interests andnon-gold producing companies | 328 | 263 | 22 | 613 | 230 | 392 | 146 | - | 768 | |||||||||||||||||||||||||||
Adjusted for stockpile write-offs | - | - | - | - | - | (1 | ) | - | - | (1 | ) | |||||||||||||||||||||||||
All-in sustaining costs adjusted fornon-controlling interests,non-gold producing companies and stockpile write-offs | 328 | 263 | 22 | 613 | 230 | 391 | 146 | - | 767 | |||||||||||||||||||||||||||
All-in sustaining costs | 328 | 263 | 22 | 613 | 249 | 392 | 146 | 16 | 803 | |||||||||||||||||||||||||||
Non-sustaining Project capex | - | - | - | - | - | - | - | 1 | 1 | |||||||||||||||||||||||||||
Non-sustaining exploration and study costs | - | - | 7 | 7 | - | 1 | - | 71 | 72 | |||||||||||||||||||||||||||
Corporate and social responsibility costs not related to current operations | - | - | - | - | - | 14 | 2 | 1 | 17 | |||||||||||||||||||||||||||
All-in costs | 328 | 263 | 29 | 620 | 249 | 407 | 148 | 89 | 893 | |||||||||||||||||||||||||||
Adjusted fornon-controlling interests and non-gold producing companies(1) | - | - | - | - | (19 | ) | - | - | (1 | ) | (20 | ) | ||||||||||||||||||||||||
All-in costs adjusted fornon-controlling interests andnon-gold producing companies | 328 | 263 | 29 | 620 | 230 | 407 | 148 | 88 | 873 | |||||||||||||||||||||||||||
Adjusted for stockpile write-offs | - | - | - | - | - | (1 | ) | - | - | (1 | ) | |||||||||||||||||||||||||
All-in costs adjusted fornon-controlling interests,non-gold producing companies and stockpile write-offs | 328 | 263 | 29 | 620 | 230 | 406 | 148 | 88 | 872 | |||||||||||||||||||||||||||
Gold sold - oz (000)(2) | 271 | 350 | - | 622 | 246 | 404 | 138 | - | 788 | |||||||||||||||||||||||||||
All-in sustaining cost (excluding stockpile write-offs) per unit - $/oz(3) | 1,214 | 752 | - | 986 | 938 | 966 | 1,062 | - | 974 | |||||||||||||||||||||||||||
All-in cost per unit (excluding stockpile write-offs) - $/oz(3) | 1,214 | 752 | - | 998 | 938 | 1,004 | 1,078 | - | 1,108 | |||||||||||||||||||||||||||
| ||||||||||||||||||||||||||||||||||||
153
For the year ended 31 December 20122014
Operations in Australia, Argentina and Brazil
(in $ millions, except as otherwise noted)
|
|
|
|
|
| |||||||||||||||||||||||||||||||
|
|
|
|
|
| |||||||||||||||||||||||||||||||
Cash costs | ||||||||||||||||||||||||||||||||||||
Cost of sales per segmental information | 344 | 296 | 20 | 660 | 222 | 362 | 156 | 5 | 745 | |||||||||||||||||||||||||||
Inventory change | (4) | 6 | 1 | 3 | 2 | 1 | (5) | 1 | (1) | |||||||||||||||||||||||||||
Amortisation of intangible assets | - | - | (1) | (1) | - | (6) | (1) | - | (7) | |||||||||||||||||||||||||||
Amortisation of tangible assets | (47) | (98) | (4) | (149) | (32) | (101) | (48) | (1) | (182) | |||||||||||||||||||||||||||
Rehabilitation and othernon-cash costs | (4) | (9) | - | (13) | (5) | 7 | - | (5) | (3) | |||||||||||||||||||||||||||
Retrenchment costs | - | - | (1) | (1) | (2) | (3) | - | (1) | (6) | |||||||||||||||||||||||||||
Total cash costs | 289 | 195 | 14 | 498 | 184 | 260 | 102 (1) | (1) | 545 | |||||||||||||||||||||||||||
Adjusted fornon-controlling interests,non-gold producing companies and other(1) | - | - | - | - | (14) | - | - | - | (14) | |||||||||||||||||||||||||||
Total cash costs adjusted fornon-controlling interests andnon-gold producing companies | 289 | 195 | 14 | 498 | 170 | 260 | 102 | (1) | 531 | |||||||||||||||||||||||||||
Gold produced – oz (000) (2) | 262 | 358 | - | 620 | 246 | 403 | 136 | - | 785 | |||||||||||||||||||||||||||
Total cash costs per unit – $/oz(3) | 1,105 | 545 | - | 804 | 692 | 644 | 748 | - | 676 | |||||||||||||||||||||||||||
For the year ended 31 December 2014
AngloGold Ashanti operations –- Total
(in $ millions, except as otherwise noted)
| ||||
All-in sustaining costs | ||||
Cost of sales per | ||||
Amortisation of tangible and intangible assets | ( | ) | ||
Adjusted for | ||||
Corporate administration and marketing related to current operations | ||||
| ||||
Inventory writedown to net realisable value and other stockpile adjustments | ||||
Sustaining exploration and study costs | ||||
Total sustaining capital expenditure | ||||
All-in sustaining costs | ||||
Adjusted fornon-controlling interests and non-gold producing companies | (77 | ) | ||
All-in sustaining costs adjusted fornon-controlling interests andnon-gold producing companies | 4,352 | |||
Adjusted for | ( | ) | ||
All-in sustaining costs adjusted fornon-controlling interests,non-gold producing companies and stockpile write-offs | ||||
All-in sustaining costs | 4,429 | |||
Non-sustaining Project capex | 249 | |||
Technology improvements | 19 | |||
Non-sustaining exploration and study costs | 91 | |||
Corporate and social responsibility costs not related to current operations | 24 | |||
All-in costs | 4,812 | |||
Adjusted fornon-controlling interests and non-gold producing companies | (62 | ) | ||
All-in costs adjusted fornon-controlling interests andnon-gold producing companies | 4,750 | |||
Adjusted for stockpile write-offs | (22 | ) | ||
All-in costs adjusted fornon-controlling interests,non-gold producing companies and stockpile write-offs | 4,728 | |||
Gold sold - oz (000) | ||||
All-in sustaining | ||||
| 1,114 | |||
For the year ended 31 December 2014
AngloGold Ashanti operations - Total
(in $ millions, except as otherwise noted)
| TOTAL | ||||
Cash costs | ||||
| ||||
| ( | ) | ||
| ||||
| ||||
| ||||
| ) | |||
Amortisation of tangible assets | ) | |||
| ||||
| ( | ) | ||
| ) | |||
Total | ||||
Adjusted fornon-controlling interests,non-gold producing companies and other(1) | (48 | ) | ||
Total cash costs adjusted fornon-controlling interests andnon-gold producing companies | 3,314 | |||
Gold produced | ||||
Total cash | ||||
| ||||
154
Capital expenditure
Total capital expenditure was $1,209 million in 2014 compared to $1,993 million in 2013. This represents a $784 million, or 39 percent, decrease from 2013. The decreased capital expenditure during 2014 relates to reduced capital expenditure on existing operations of $184 million and decreased capital expenditure of $600 million for growth related projects. Capital expenditure decreased at Tropicana by $182 million with the project being completed during 2013, South Africa region by $187 million due to timing of actual project spend and at Mponeng, a scheduled slippage occurred in the secondary support installation and consequent movement of construction activities and at Moab Khotsong, the Zaaiplaats Phase 2 project was halted and the development contract was terminated. Capital expenditure also decreased at Kibali by $162 million with the completion of the initial phase of the project during 2013, at the Mongbwalu project by $26 million with the operation being in closure mode, at Sadiola and Geita by $36 million and $25 million, respectively, due to the timing of the expenditure and $114 million at Obuasi due to the revised strategy where the decline is completed while the current operations are reduced to limited operation status.
Total capital expenditure was $1,993 million in 2013 compared to $2,322 million in 2012. This represents a $329 million, or 14 percent, decrease from 2012. The decreased capital expenditure during 2013 relates to reduced capital expenditure on existing operations of $237 million and decreased capital expenditure of $91 million for growth related projects. Capital expenditure decreased at Tropicana by $74 million, South Africa region by $132 million following the scaling back of project investment as part of the cost-cutting initiatives across the South African asset portfolio, at the Mongbwalu project by $77 million, at Iduapriem by $67 million, Geita by $62 million, AngloGold Ashanti Mineração by $39 million and Cerro Vanguardia by $24 million. The decrease was partially offset by increased capital expenditure of $78 million at the Kibali joint venture and $57 million at Cripple Creek & Victor.
Comparison of financial performance on a segment basis for 2014, 2013 and 2012
The company produces gold as its primary product and does not have distinct divisional segments in terms of principal business activity, but manages its business on the basis of different geographic segments. Therefore, information regarding separate geographic segments is provided.
Gold income
| (in millions) | Year ended 31 December | |||||||||||||||||||||||
| 2014 | 2013 | 2012 | ||||||||||||||||||||||
| $ | percent | $ | percent | $ | percent | |||||||||||||||||||
Geographical analysis of gold income by origin is as follows: | ||||||||||||||||||||||||
South Africa | 1,527 | 29 | 1,810 | 33 | 2,013 | 32 | ||||||||||||||||||
Continental Africa | 2,105 | 40 | 2,111 | 38 | 2,609 | 41 | ||||||||||||||||||
Australasia | 785 | 15 | 441 | 8 | 426 | 7 | ||||||||||||||||||
Americas | 1,270 | 24 | 1,425 | 26 | 1,656 | 25 | ||||||||||||||||||
| 5,687 | 5,787 | 6,704 | ||||||||||||||||||||||
Less : Associates and equity accounted joint ventures included above | (469 | ) | (8 | ) | (290 | ) | (5 | ) | (351 | ) | (5 | ) | ||||||||||||
Gold income | 5,218 | 100 | 5,497 | 100 | 6,353 | 100 | ||||||||||||||||||
Assets
| (in millions) | Year ended 31 December | |||||||||||||||||||||||
| 2014 | 2013 | 2012 | ||||||||||||||||||||||
| $ | percent | $ | percent | $ | percent | |||||||||||||||||||
Geographical analysis of assets by origin is as follows: | ||||||||||||||||||||||||
South Africa | 2,124 | 23 | 2,325 | 24 | 3,082 | 24 | ||||||||||||||||||
Continental Africa | 3,239 | 36 | 3,391 | 35 | 4,846 | 38 | ||||||||||||||||||
Australasia | 906 | 10 | 1,108 | 11 | 1,045 | 8 | ||||||||||||||||||
Americas | 2,409 | 26 | 2,203 | 23 | 2,878 | 23 | ||||||||||||||||||
Other, including non-gold producing subsidiaries | 456 | 5 | 647 | 7 | 888 | 7 | ||||||||||||||||||
Total assets | 9,134 | 100 | 9,674 | 100 | 12,739 | 100 | ||||||||||||||||||
155
At 31 December 2014, 23 percent of AngloGold Ashanti’s total assets were located in South Africa compared with 24 percent at the end of 2013. The remaining operations collectively accounted for approximately 77 percent of AngloGold Ashanti’s total assets at 31 December 2014 compared to 76 percent at the end of the same period in 2013.
At 31 December 2013, 24 percent of AngloGold Ashanti’s total assets were located in South Africa compared with 24 percent at the end of 2012. The remaining operations collectively accounted for approximately 76 percent of AngloGold Ashanti’s total assets at 31 December 2013 compared to 76 percent at the end of the same period in 2012.
Comparison of financial performance in 2014, 2013 and 2012
Financial performance of AngloGold Ashanti | Year ended 31 December | |||||||||||
| (in millions) | 2014 | 2013 | 2012 | |||||||||
Gold income | 5,218 | 5,497 | 6,353 | |||||||||
Cost and expenses | (4,977) | (7,868) | (5,062) | |||||||||
Share of associates and joint ventures’ loss | (25) | (162) | (30) | |||||||||
Taxation (expense) benefit | (255) | 333 | (346) | |||||||||
Net profit attributable to non-controlling interests | 19 | 30 | 18 | |||||||||
Net (loss) profit attributable to equity shareholders | (58) | (2,230) | 897 | |||||||||
Comparison of financial performance in 2014 with 2013
Gold income
Gold income decreased by $279 million from $5,497 million in 2013 to $5,218 million in 2014, representing a 5 percent decrease over the period. This decrease was mainly due to the decrease in the average gold price received. The average spot price of gold was $1,266 per ounce during 2014, $145 per ounce, or 10 percent, lower than the average spot price of gold of $1,411 per ounce in 2013, which resulted in a decrease in gold income of approximately $595 million. The decrease was partially offset by the increase in production volume of 330,000 ounces, which resulted in an increase in gold income of approximately $418 million, mainly as a result of the production at Tropicana and Kibali.
Gold income from the South African operations in 2014 decreased by $283 million to $1,527 million from $1,810 million in 2013, mainly as a result of the decrease in the average spot price of gold, which resulted in a decrease in gold income of approximately $189 million. Gold income further decreased as a result of a decrease in production of 79,000 attributable ounces, primarily as a result of the earthquake near the Vaal River operations on 5 August 2014 and safety related stoppages across the regional portfolio, which resulted in a decrease of gold income of approximately $100 million.
Gold income from the Continental Africa operations (including associates and equity accounted joint ventures) in 2014 decreased by $6 million to $2,105 million from $2,111 million in 2013, mainly as a result of the decrease in the average spot price of gold, which resulted in a decrease in gold income of approximately $212 million. This decrease was partially offset by the increase in production of 137,000 attributable ounces, which resulted in an increase of gold income of approximately $173 million. The increase in production is mainly due to Kibali’s full year of production in 2014, higher production at Siguiri in Guinea due to higher recovered grades and at Geita in Tanzania due to increased tonnage throughput.
Gold income from Australia increased from $441 million in 2013 to $785 million in 2014. The increase was mainly due to the increase in production of 277,000 ounces, of which 291,000 ounces were at Tropicana Gold Mine due to the operations’ full year of production in 2014, which resulted in an increase in gold income of approximately $351 million. This increase was partially offset by the decrease in the average spot price of gold, which resulted in a decrease in gold income of approximately $50 million.
Gold income from the Americas operations decreased from $1,425 million in 2013 to $1,270 million in 2014 mainly as a result of the decrease in the average spot price of gold, which resulted in a decrease in gold income of approximately $145 million. Gold income further decreased as a result of a decrease in production of 5,000 attributable ounces, which resulted in a decrease in gold income of approximately $6 million.
156
Cost and expenses
Production costs
Production costs increased from $3,384 million in 2013 to $3,410 million in 2014, which represents a $26 million, or 1 percent increase. The increase was primarily due to an increase in rehabilitation costs, power costs and service related costs. The increase was partially offset by a decrease in retrenchment costs, labour costs, consumable stores and contractor costs.
Rehabilitation costs increased from $18 million in 2013 to $94 million in 2014, which represents a $76 million increase. The increase was due to changes in cash flows, inflation rates and lower discount rates.
Power costs increased from $641 million in 2013 to $659 million in 2014. The increase was primarily in Australia due to increased production.
Service related costs increased by $247 million to $243 million in 2014 from a credit of $4 million in 2013. This increase was mainly due to Capital Ore Reserve Development credits reducing by $104 million at the South African operations and ore stockpile adjustments of $124 million in Continetal Africa at Geita in Tanzania, Iduapriem in Ghana and Navachab in Namibia (sold June 2014).
Retrenchment costs included in the production costs decreased to $24 million in 2014 from $69 million in 2013. Retrenchment costs recorded for the year ended 31 December 2014 resulted from the rationalisation of operations in South African, Americas, Australia and Continental Africa regions.
Labour costs decreased from $1,231 million in 2013 to $1,105 million in 2014, which represents $126 million, or 10 percent, decrease. In particular, labour costs at Obuasi in Ghana decreased by $43 million following the move to limited operations and by $75 million at the South African operations due to rationalisation and restructuring.
Consumable stores decreased from $747 million in 2013 to $702 million in 2014, which represents a $45 million, or 6 percent decrease. The decrease was due to the sale of Navachab in Namibia, the scaling down of operations at Obuasi in Ghana, lower stores usage at Geita in Tanzania and cost saving initiatives.
Contractor costs for the group decreased from $632 million in 2013 to $531 million in 2014, which represents a $101 million, or 16 percent decrease. The decrease in contractor costs was primarily a result of the scaling down of operations at Obuasi in Ghana, completion of open pit mining at Sunrise Dam in Australia, new contractor rates at Iduapriem in Ghana and termination of contractor from May 2014 at Geita in Tanzania.
The weakening of local currencies against the US dollar and further attributed to a decrease in production costs.
Exploration and evaluation costs
Exploration and evaluation costs decreased from $255 million in 2013 to $144 million in 2014 mainly due to lower prefeasibility expenditure at La Colosa in Colombia as well as at Sunrise Dam in Australia, together with a decrease in exploration expenditure at Tropicana in Australia, the Colombian Region, Brazil, Mongbwalu in the Democratic Republic of the Congo, Solomon Islands, Siguiri and Geita in Tanzania. For a discussion of AngloGold Ashanti’s exploration activities in 2014, see “Item 4B.: Business overview – Exploration review”.
Amortisation of tangible and intangible assets
Amortisation of tangible and intangible assets expense decreased by $13 million or 2 percent, to $786 million in 2014 from $799 million in 2013, largely due to the reduction in capital expenditure at Obuasi following the impending winding down of operations; lower amortisation at Cripple Creek and Victor and Geita following the impairment of assets in June 2013 and the reset of the amortisation lives; lower production at Sunrise Dam, partly offset by higher amortisation at Tropicana since production started in the fourth quarter of 2013. Amortisation of intangible assets is $12 million higher than 2013 due to the amortisation of software and licenses across South African and Americas operations.
157
Impairment and derecognition of assets
In 2014, AngloGold Ashanti recorded impairments and derecognition of goodwill, tangible and intangible assets amounting to $10 million, compared to net impairments amounting to $3,029 million in 2013. The $10 million related to the derecognition of assets not expected to generate cash flows at Obuasi ($3 million) and at South African operations ($1 million). As part of the stability agreement entered into in 2004, the Government of Ghana agreed to a corporate tax rate concession which was granted at a rate of 30 percent for the Ashanti business combination for 15 years from 2004. The 2014 business plan indicates that no tax payments are expected to be paid to the Government until 2019. As a result the tax rate concession of $6 million was fully impaired during 2014. See “Note 7 – Special items”, “Note 15 – Tangible assets” and “Note 16 – Intangible assets” to the consolidated financial statements for additional information.
Finance costs and unwinding of obligations
Finance costs (net of amounts capitalised) increased by $4 million to $251 million in 2014, compared to $247 million in 2013. The increase is mainly due to the $1.25 billion 8.500 percent notes issued in July 2013, Australian dollar syndicated revolving credit facility related to the Tropicana project which went into production during September 2013, and a net increase in the South Africa borrowings comprising finance costs on commercial papers and revolving credit facilities. The increases were offset by a decrease in the mandatory notes which were settled in September 2013, a decrease in the convertible bond settled in August 2013 and November 2013. Unwinding of obligations expense of $27 million was recorded in 2014 compared with $49 million in 2013 and relates mainly to the unwinding of the convertible bond settled in August 2013 and November 2013. See “Note 8 – Finance costs and unwinding of obligations” to the consolidated financial statements for additional information.
Share of associates and joint ventures’ loss
Share of associates and joint ventures’ loss decreased from $162 million in 2013 to $25 million in 2014, mainly as a result of the decrease in net impairments from $164 million in 2013 to $5 million in 2014.
During the year, Rand Refinery (Pty) Limited (“Rand Refinery”) identified a shortfall in the commodities that it warehouses for third parties and recognised the consequential expense in fulfilling its obligations to its depositors resulting in Rand Refinery financial results reporting a negative balance on shareholder’s equity. As a result AngloGold Ashanti recognised its equity portion of this reported loss of $51 million, reducing its equity investment to nil. In order to fund the fulfilment of Rand Refinery’s obligation to its depositors, the shareholders entered into a loan agreement. AngloGold Ashanti’s share was $44 million and this was assessed for recoverability given the negative shareholders balance in the reported results of Rand Refinery. An impairment loss of $21 million was recorded on the loan. External audit procedures performed subsequent to year end confirmed the gold gap at Rand Refinery has not increased. Therefore any additional loan funding requirements from shareholders is not envisaged at this stage. Refer “Note 18 – Investments in associates and joint ventures” to the consolidated financial statements.
Taxation
A taxation expense of $255 million was recorded in 2014, compared to a benefit of $333 million in 2013. Charges for current tax in 2014 amounted to $165 million, compared to $134 million in 2013. The increase in the current tax charge in 2014 was mainly due to the higher profit to revenue ratio in South Africa as a result of lower capital spend in 2014. Charges for deferred tax in 2014 amounted to a net deferred tax expense of $90 million compared to a net deferred tax benefit of $467 million in 2013. The increase in the deferred tax charge in 2014 is mainly due to the write off of deferred tax assets in North America and utilisation of tax losses in Australia as well as tax credits from impairment of assets in 2013 not repeated in 2014. Refer “Note 12 – Taxation” of the consolidated financial statements for additional information.
Comparison of financial performance in 2013 with 2012
Gold income
Gold income decreased by $856 million from $6,353 million in 2012 to $5,497 million in 2013, representing a 13 percent decrease over the period. This decrease was mainly due to the decrease in the average gold price received. The average spot price of gold was $1,411 per ounce during 2013, $257 per ounce, or 15 percent, lower than the average spot price of gold of $1,668 per ounce in 2012, which resulted in a decrease in gold income of approximately $1,014 million. The decrease was partially offset by the increase in production volume of 160,000 ounces, which resulted in an increase in gold income of approximately $226 million, mainly as a result of the production at Tropicana.
158
Gold income from the South African operations in 2013 decreased by $203 million to $1,810 million from $2,013 million in 2012, mainly as a result of the decrease in the average spot price of gold, which resulted in a decrease in gold income of approximately $312 million. This decrease was partially offset by the increase in production (1,302,000 ounces in 2013 compared to 1,212,000 ounces in 2012), which resulted in an increase of gold income of approximately $126 million. The increase in production was primarily due to production from MWS (acquired effective 20 July 2012) and the non-occurrence of the strike in South Africa.
Gold income from the Continental Africa operations in 2013 decreased by $498 million to $2,111 million from $2,609 million in 2012, mainly as a result of the decrease in the average spot price of gold, which resulted in an decrease in gold income of approximately $391 million. Gold income also decreased as a result of a decrease in production of 61,000 attributable ounces, primarily as a result of the mill shutdown at Geita, which resulted in a decrease in gold income of approximately $85 million.
Gold income from Australia increased from $426 million in 2012 to $441 million in 2013. The increase was mainly due to the increase in production of 84,000 ounces, of which 67,000 ounces were at Tropicana Gold Mine where operations started ahead of schedule, which resulted in an increase in gold income of approximately $118 million. This increase was partially offset by the decrease in the average spot price of gold, which resulted in a decrease in gold income of approximately $66 million.
Gold income from the Americas operations decreased from $1,656 million in 2012 to $1,425 million in 2013 mainly as a result of the decrease in the average spot price of gold, which resulted in a decrease in gold income of approximately $245 million. The decrease was partially offset by an increase in gold production from 953,000 attributable ounces in 2012 to 1,001,000 attributable ounces in 2013, which resulted in an increase in gold income of approximately $67 million. The increase in gold production was due to the increase in the company’s ownership in Serra Grande to 100 percent, effective July 2012 and higher grades recovered.
Cost and expenses
Production costs
Production costs increased from $3,212 million in 2012 to $3,384 million in 2013, which represents a $172 million, or 5 percent increase. The increase was primarily due to an increase in operational costs including labour, contractor costs and retrenchment costs.
Labour costs increased from $1,186 million in 2012 to $1,231 million in 2013, which represents $45 million, or 4 percent, increase. In particular, labour costs in Obuasi in Ghana, Siguiri in Guinea and Tropicana in Australia contributed to higher production costs. The increase in labour costs was primarily a result of annual salary increases and also an increase in employees in Australia due to Tropicana coming into production.
Contractor costs for the Group increased from $560 million in 2012 to $632 million in 2013, which represents a $72 million, or 13 percent increase. In particular, contractor costs in Australia and Iduapriem in Ghana contributed to higher production costs. The increase in contractor costs was primarily a result of annual salary increases.
Retrenchment costs increased to $69 million in 2013 from $10 million in 2012. Retrenchment costs recorded for the year ended 31 December 2013 resulted from the rationalisation of operations in South African, Americas and Continental Africa regions.
Production costs further increased by $30 million because of a reduction in recovery from settled insurance claims as compared with 2012 during which there was a reimbursement of costs relating to the pitwall failure at Sunrise Dam (Australia) in the amount of $30 million.
The increase in production costs was partially offset by the weakening of local currencies against the US dollar and a decrease in royalties paid by AngloGold Ashanti. Royalties decreased from $164 million in 2012 to $129 million in 2013, mainly due to the decrease in the average spot price of gold. Royalties recorded in South Africa decreased from $25 million in 2012 to $13 million in 2013. Royalties paid in Tanzania decreased from $33 million in 2012 to $25 million in 2013. Royalties paid in North America decreased from $11 million in 2012 to $5 million in 2013. Royalties in Argentina decreased from $33 million in 2012 to $29 million in 2013. In Argentina, royalties are payable to Formicruz, a state owned company in the Santa Cruz Province, being the minority shareholder of the Cerro Vanguardia operation and are calculated as a percentage of revenues.
159
Exploration and evaluation costs
Exploration and evaluation costs decreased from $395 million in 2012 to $255 million in 2013 mainly due to lower prefeasibility expenditure at La Colosa in Colombia as well as at Sunrise Dam in Australia, together with a decrease in exploration expenditure at Tropicana in Australia, Mongbwalu in the Democratic Republic of the Congo, Solomon Islands and Geita in Tanzania. For a discussion of AngloGold Ashanti’s exploration activities in 2013, see “Item 4B.: Business overview – Exploration review”.
Amortisation of tangible and intangible assets
Amortisation of tangible and intangible assets expense decreased by $36 million or 4 percent, to $799 million in 2013 from $835 million in 2012, largely due to the impact on amortisation as a result of the impairment and derecognition of assets during 2013.
Impairment and derecognition of assets
In 2013, AngloGold Ashanti recorded impairments and derecognition of goodwill, tangible and intangible assets amounting to $3,029 million, compared to net impairments amounting to $346 million in 2012. This was partly due to the cash generating unit impairment of Moab Khotsong, in South Africa, of $293 million as a result of changes to the mine plan following revision of capital expenditure and from factors such as declining gold price and an increasing discount rate. Furthermore, as a result of declining gold price and an increasing discount rate, cash generating units were impaired at Iduapriem and Obuasi, in Ghana, in the amount of $74 million and $993 million, respectively, at Siguiri, in Guinea, in the amount of $25 million, at Geita, in Tanzania, in the amount of $555 million, in the Americas at Cripple Creek & Victor in the amount of $445 million, AngloGold Ashanti Mineração in the amount of $332 million and Cerro Vanguardia in the amount of $132 million. Assets not expected to generate future cash flows were derecognised at Vaal River Surface Operations, in South Africa, in the amount of $14 million and at Mongbwalu, in the Democratic Republic of the Congo, in the amount of $105 million See “Note 7 – Special items”, “Note 15 – Tangible assets” and “Note 16 – Intangible assets” to the consolidated financial statements for additional information.
Finance costs and unwinding of obligations
Finance costs (net of amounts capitalised) increased by $80 million to $247 million in 2013, compared to $167 million in 2012. The increase is mainly due to the new $1.25 billion 8.500 percent notes issued in July 2013, Australian dollar syndicated revolving credit facility related to the Tropicana project, increase related to the $750 million 5.125 percent notes issued in July 2012. The increases were offset by a decrease in the mandatory notes which were settled in September 2013 and a decrease in the convertible bond settled in August 2013 and November 2013. Unwinding of obligations expense of $49 million was recorded in 2013 compared with $64 million in 2012 and relates mainly to the unwinding of discounted future rehabilitation obligations to present values. See “Note 8 – Finance costs and unwinding of obligations” to the consolidated financial statements for additional information.
Share of associates and joint ventures’ loss
Share of associates and joint ventures’ loss increased from $30 million in 2012 to $162 million in 2013, mainly as a result of reduced operating profits due to lower production and the lower average spot price of gold in 2013. Net impairments recorded in 2013 were $164 million compared to $59 million in 2012. The impairments in 2013 mainly related to the carrying value of the investments in Sadiola, Morila and Trans-Siberian Gold as discussed in “Note 18 – Investments in associates and joint ventures” to the consolidated financial statements.
Taxation
A taxation benefit of $333 million was recorded in 2013, compared to an expense of $346 million in 2012. Charges for current tax in 2013 amounted to $134 million, compared to $414 million in 2012. The decrease in the current tax charge in 2013 was mainly due to lower taxable income as a result of the lower gold price. Charges for deferred tax in 2013 amounted to a net deferred tax benefit of $467 million compared to a net deferred tax benefit of $68 million in 2012. The decrease in the deferred tax charge in 2013 is mainly due to tax credits on impairments of assets and inventory write-downs offset by derecognitions of deferred taxation assets in Obuasi and Cripple Creek & Victor. Refer to “Note 12 – Taxation” of the consolidated financial statements for additional information.
160
| 5B. | LIQUIDITY AND CAPITAL RESOURCES |
In the board’s opinion, AngloGold Ashanti’s working capital is sufficient to meet the company’s present requirements.
Operating activities
20142016
Cash flows from operating activities were $1,220$1,186 million in 2014,2016, $47 million, or four percent, higher than the 2015 amount of $1,139 million. The increase in cash flows provided by operations was mainly due to increased revenues from a higher gold price received partially offset by lower production.
Net cash outflow from operating working capital items amounted to $76 million in 2016, compared with an inflow of $89 million in 2015.
2015
Cash flows from operating activities were $1,139 million in 2015, $81 million, or seven percent, lower than the 20132014 amount of $1,246$1,220 million. The decrease in cash flows provided by operations was mainly as a result ofdue to lower revenues from a lower gold price which more than offset the increase of 8 percent inand production.
Net cash outflowinflow from operating working capital items amounted to $43$89 million in 2014,2015, compared with an outflowinflow of $250$6 million in 2013.
2013
Cash flows from operating activities were $1,246��million in 2013, lower than the 2012 amount of $1,969 million. The decrease in cash flows provided by operations was mainly as a result of higher costs and lower revenues.
Net cash outflow from operating working capital items amounted to $250 million in 2013, compared with an outflow of $218 million in 2012.
Investing activities
2014
Investing activities in 2014 resulted in a net cash outflow of $943 million, a decrease of $1,097 million from an outflow of $2,040 million in 2013. Capital expenditure decreased to $1,013 million in 2014 compared to $1,501 million in 2013. Capital expenditure decreased at Tropicana by $189 million with the project being completed during 2013, South Africa region by $168 million due to timing of actual project spend and at Mponeng, a scheduled slippage occurred in the secondary support installation and consequent movement of construction activities and at Moab Khotsong, the Zaaiplaats Phase 2 project was halted and the development contract was terminated. Capital expenditure also decreased by $111 million at Obuasi due to the revised strategy where the decline is completed and the mine transitioned to limited operations.Funding provided to associates and joint ventures decreased to $65 million in 2014 from $472 million in 2013 largely due to the completion of the work to establish operations at the Kibali joint venture operation.
2013
Investing activities in 2013 resulted in a net cash outflow of $2,040 million, a decrease of $735 million from an outflow of $2,775 million in 2012. Capital expenditure decreased to $1,501 million in 2013 compared to $1,925 million in 2012.2014.
Financing activities
20142016
Cash flows from financing activities in the year ended 31 December 20142016 amounted to ana net outflow of $421$763 million, which is a decreasechange of $981$423 million from an inflowoutflow of $560$1,186 million in the year ended 31 December 2013.2015. Cash inflows from proceeds from borrowings in 20142016 amounted to $611$787 million and included $157a $330 million proceeds on the local borrowings facility and commercial paper in South Africa, $100 million draw downdrawdown on the $1.0 billion syndicated loanrevolving credit facility, $315$157 million draw downdrawdown on the A$500 million syndicated loan for general corporate purposes, $10revolving credit facility, $256 million in proceeds from short-term borrowingsthe local borrowing facilities in ArgentinaSouth Africa and $9 million normal proceeds from various short term borrowings.other small loans amounting to $44 million.
Cash outflows from repayment of borrowings of $761$1,333 million during the year ended 31 December 20142016 included the repayment of $547$471 million of the $1.25 billion 8.500 percent bonds due 2020, $480 million of the US$1.0 billion syndicated revolving credit facility, $290 million of the local borrowing facilities, $89 million of the A$500 million syndicated revolving credit facility and $3 million in connection with other loans.
Bond settlement premium, RCF and bond transaction costs decreased from $61 million in the year ended 31 December 2015 to $30 million in the year ended 31 December 2016. The decrease was due to the remaining premium and fees on the redemption of the $1.25 billion bonds 8.500 percent bonds due 2020. Finance cost paid decreased by $79 million in 2016 mainly due to the redemption of the bonds.
Dividends paid tonon-controlling interests increased from $5 million in 2015 to $15 million in 2016 and were all paid fromnon-wholly owned subsidiaries.
2015
Cash flows from financing activities in the year ended 31 December 2015 amounted to a net outflow of $1,186 million, which is an increase of $765 million from an outflow of $421 million in the year ended 31 December 2014. Cash inflows from proceeds from borrowings in 2015 amounted to $421 million and included a $300 million drawdown on the $1.0 billion syndicated loan facility and $120 million in proceeds from the local borrowing facilities in South Africa.
Cash outflows from repayment of borrowings of $1,288 million during the year ended 31 December 2015 included the repayment of $779 million of the $1.25 billion 8.500 percent bonds due 2020, $200 million of the US$1.0 billion syndicated loan facility, $112 million of the local borrowing facility, $135 million of the A$600 million syndicated loan, $171$14 million of the R10 billion Domestic Medium Term Note Programme (DMTNP) and $45 million in connection with other loans.
Bond settlement premium, RCF and bond transaction costs increased from $9 million in the year ended 31 December 2014 to $61 million in the year ended 31 December 2015. The increase was due to the premium and fees on the local borrowings facility, commercial paper and finance leases in South Africa, $25 million on short-term borrowings in Argentina and normal loan paymentspartial redemption of $18 million.the $1.25 billion bonds 8.500 percent bonds due 2020.
Dividends paid tonon-controlling interests decreased from $62 million in 2013 to $17 million in 2014.2014 to $5 million in 2015 and were all paid fromnon-wholly owned subsidiaries. Dividends are proposed and approved by the board of directors of AngloGold Ashanti, based on the company’s financial performance.
161
2013
Cash flows from financing activities in the year ended 31 December 2013 amounted to an inflow of $560 million, which is a decrease of $31 million from an inflow of $591 million in the year ended 31 December 2012. Cash inflows from proceeds from borrowings in 2013 amounted to $2,344 million and included $1.25 billion 8.500 percent notes due 2020 issued during July 2013, $432 million proceeds on the local borrowings facility and commercial paper in South Africa, $250 million draw down on the $1.0 billion four-year syndicated loan facility, $323 million drawn down on the A$600 million syndicated loan for general corporate purposes, principally on the Tropicana project, $72 million proceeds on the ZAR 750 million bonds issued during December 2013 and $15 million proceeds from short-term borrowings in Argentina.
Cash outflows from repayment of borrowings of $1,486 million during the year ended 31 December 2013 included the repayment of $250 million on the $1.0 billion four-year syndicated loan facility, $733 million on the early settlement of the convertible bonds due 2014, $27 million on the A$600 million syndicated loan, $458 million on local borrowings facility, commercial paper and finance leases in South Africa and normal scheduled loan repayments of $16 million.
Dividends paid decreased from $236 million in 2012 to $62 million in 2013. Dividends are proposed and approved by the board of directors of AngloGold Ashanti, based on the company’s financial performance.
Liquidity
AngloGold Ashanti’s revenues are derived primarily from the sale of gold produced at its mines. Cash flows from operating activities are therefore the function of gold produced sold at a specific price. The market price of gold can fluctuate widely, which impacts the profitability of the company’s operations and the cash flows generated by these operations.
There are no significantwere restrictions on the ability of the group to obtain funds from its subsidiaries by dividend or loan. Asloan in Argentina which were lifted at the end of 2015. At 31 December 20142015 the group had $8$48 million in bank accounts in Argentina subject to regulatory approvals before such funds could be transmittedwith $3.4 million held in the form of dividends or loan repayments. During 2014 the group obtained various approvals to remit funds but has not received any approvals since October 2014.
Asbank accounts at 31 December 2014, the group had $8 million in bank accounts in Argentina that was subject to regulatory approval before such funds could be transmitted in the form of dividends or loan repayments. During 2014 the group obtained various approvals to remit funds but have not received any approvals since October 2014.2016.
AngloGold Ashanti’s cash and cash equivalents decreased to $468$215 million at 31 December 20142016 compared with $628 million, net of a bank overdraft of $20$484 million at 31 December 2013.2015. In accordance with South African Reserve Bank regulations, cash generated by South African operations is held in rands and is therefore subject to exchange controls. At 31 December 2014, 762016, 62 percent of the company’s cash and cash equivalents waswere held in US dollars, 1323 percent waswere held in South African rands and 1115 percent waswere held in other currencies.
During July 2014,April 2010, the group issued two rated bonds fully and unconditionally guaranteed by AngloGold Ashanti Australia Limited settled an existing A$600 million four-year revolving credit facility and entered intoLtd. The issuance consisted of a new A$500 million five10 year revolving credit facility($700m) bond with a syndicationsemi-annual coupon of banks. Interest is currently charged at BBSP plus 2 percent5.375% per annum, and a 30 year ($300m) bond with a semi-annual coupon of 6.50% per annum. Each ofUnless the company redeems the bonds earlier, the bonds will mature on 15 April 2020 and, 15 April 2040 respectively.
During April 2011 AngloGold Ashanti Limited andregistered a R10bn Domestic Medium Term Note Programme (DMTNP) with the JSE. The DMTNP permits the group to access the South African debt capital market for funding required. During December 2016, the floating rate bond (3 month JIBAR + 1.75%), that AngloGold Ashanti Holdings plc has guaranteed all paymentsissued under its DMTNP, matured and other obligations of AngloGold Ashanti Australia Limitedwas repaid in full. This bond was the only remaining issuance under the facility. Amounts may be repaidAGA’s DMTNP and redrawn under the facility during its four year term. A commitment fee of 1 percent of the applicable margin is payable quarterly in arrears on the undrawn portion of the facility. An amount of $255 million was drawn down as at 31 December 2014. This facility will be used to fund general working capital requirements.2016, there were no outstanding issuances under the DMTNP.
During July 2014, AngloGold Ashanti Holdings plc2012, the group entered into a $1.0 billion$750m rated bond. Semi-annual coupons are paid at 5.125% per annum. The bonds are dollar based and unless the company redeems the bonds, earlier they are repayable on 1 August 2022. The notes are fully and unconditionally guaranteed by the group.
During December 2013, the group completed the following financing transactions:
the group entered into a five-year unsecured syndicated revolving credit facility (ZAR RCF1.5bn) of R1.5bn ($109m) with a syndicate of lenders which replaced its existing $1.0 billion revolving credit facility entered into in July 2012.Nedbank and ABSA Bank. Amounts may be repaid and reborrowed under the facility during its five-year term and the facility bears interest at LIBORJIBAR plus an initial margin of 1.5 percent1.2% per annum. The margin will subsequently be calculated by reference to the long term debt rating os the Parent. If the current status of BB+/Baa3 improves the interest margin will reduce and if the current rating worsens then the interest margin will increase. During December 2014 the Company drew down $100 million. AngloGold Ashanti Limited, AngloGold Ashanti Holdings plc. and AngloGold Ashanti USA Inc. each guaranteed the obligations of the borrowers under the facility. A commitment fee of 0.525 percent is payable quarterly in arrears on the undrawn portion of the facility.
On 30 July 2012, the company completed an offering of $750 million aggregate principal amount of 5.125 percent notes due 2022. The notes were issued by AngloGold Ashanti Holdings plc, a wholly-owned subsidiary of the company. The notes are unsecured and fully and unconditionally guaranteed by AngloGold Ashanti Limited.
162
During July 2013, the company issued $1.25 billion aggregate principal amount of 8.500 percent notes at an issue price of 100 percent of the principal amount of the notes. The notes are unsecured and fully and unconditionally guaranteed by the group. The net proceeds from the offering of the notes were used for general corporate purposes, which included the repurchase of the 3.5 percent convertible bonds and the repayment of other indebtedness.
During December 2013, the group entered into a five-year unsecured syndicated revolving credit facility (ZAR RCF) of R1.5 billion ($144 million) with Nedbank and ABSA Bank which is currently charged at JIBAR plus 1.2 percent per annum. It is anticipated that thisThis facility will be used to fund the working capital and development costs associated with the group’s mining operations within South Africa without eroding the group’s headroom under its other facilities and exposing the group to foreign exchange gains/losses each quarter.losses. The facility matures in December 2018.
During December 2013, R750 millionJuly 2014, the group completed the following financing transactions:
A $1bn five-year revolving credit facility with a syndicate of lenders. Amounts may be repaid and reborrowed under the facility during its five-year term and the facility bears interest at LIBOR plus 1.5%. The facility matures in July 2019. The interest margin will reduce should the group’s credit rating improve from its current BB+/BBaa3 status and increase should its credit rating worsen.
A five-year unsecured syndicated revolving credit facility of A$500m ($65 million) aggregate principal amount,361m) with a group of banks which is currently charged at 2% above BBSY. The interest margin will reduce should the group’s credit rating improve from its current BB+/Baa3 status and increase should its credit rating worsen. This facility will be used to fund the working capital and development costs associated with the group’s mining operations within Australia without eroding the group’s headroom under its other facilities and exposing the group to foreign exchange gains/losses. The facility matures in July 2019.
During July 2015, the group entered into a five-year unsecured notes were issued, due 2016syndicated revolving credit facility (ZAR RCF1.4bn) of R1.4bn ($102m) with Nedbank and ABSA Bank. Amounts may be repaid and reborrowed under the facility during its five-year term and the facility bears interest at JIBAR plus 1.75 percent. The objective of1.65% per annum. This facility, as well as the R1.5bn ZAR RCF in conjunctionfacility, will be used to fund the working capital and development costs associated with the issuegroup’s mining operations within South Africa without eroding the group’s headroom under its other facilities and exposing the group to foreign exchange gains/losses. The facility matures in July 2020.
During August 2016, the group completed the following financing transactions:
Three-year unsecured revolving credit facilities of R750 million ($65 million) bonds was$100m. Interest is currently charged at a margin of between 6.2% and 8% above LIBOR. The facilities mature in August 2019.
Amounts are converted to provide a more permanent and reliable sourceUS dollars at exchange rates as of funds for AngloGold Ashanti’s South African operations and mitigate refinancing risk.31 December 2016.
AngloGold Ashanti intends to finance its capital expenditure and debt repayment requirements in 20152017 from cash on hand, cash flow from operations, existing credit facilities and, potentially, if deemed appropriate, long-term debt financing, the issuance of equity and equity linked instruments.
Current borrowings
AngloGold Ashanti’s current borrowings decreased to $223$34 million at 31 December 20142016 from $258$100 million at 31 December 2013. Included in the current borrowings at 31 December 2014, were:2015. See “Item 18: Note 23–Borrowings”
$15 million payable under the Senior Floating Rate Notes (DMTNP) (interest charged at 6.963 percent per annum);
$16 million in interest payable under the $750 million 10-year bond (interest charged at 5.125 percent per annum; the bonds mature in August 2022 and are US dollar-based);
$12 million in interest payable under the $700 million 10-year and $300 million 30-year rated bonds issued April 2010 (interest charged at 5.375 percent and 6.50 percent, respectively, per annum; the bonds mature in April 2020 and April 2040, respectively, and are US dollar-based); and
$49 million under the $1.25 billion bonds issued on 30 July 2013 (interest charged at 8.50 percent per annum; the bonds mature on 30 July 2020 are US dollar-based).
Non-current borrowings
AngloGold Ashanti’snon-current borrowings decreased to $3,498$2,144 million at 31 December 20142016 compared to $3,633$2,637 million at 31 December 2013. 2015. See “Item 18: Note 23–Borrowings”
As at 31 December 2014, the company’s non-current borrowings included:
Unsecured loans:
$986 million outstanding under the $700 million 10-year and $300 million 30-year rated bonds issued April 2010 (interest charged at 5.375 percent and 6.50 percent, respectively, per annum; the bonds mature in April 2020 and April 2040, respectively, and are US dollar-based);
$740 million outstanding under the rated bonds issued July 2012 (interest charged at 5.125 percent per annum; the bonds mature in August 2022 and are US dollar-based);
$1,325 million outstanding under the $1.25 billion bonds issued on 30 July 2013 (interest charged at 8.50 percent per annum; the bonds mature on 30 July 2020 and are US dollar-based);
$65 million outstanding under the R750 million bonds issued on 9 December 2013 (interest charged at JIBAR plus 1.75 percent per annum; the bonds mature on 9 December 2016, and are ZAR-based);
$255 million outstanding under the A$500 million syndicated revolving credit facility (interest charged at BBSY plus 2.6 percent per annum; the loan matures in July 2019 and is Australian dollar-based); and
$92 million outstanding under the $1 billion syndicated loan facility (interest charged at LIBOR plus 1.5 percent per annum; the facility matures on 17 July 2019 and is US dollar-based).
163
Secured capital leases:
$21 million is repayable to Turbine Square Two (Proprietary) Limited for buildings financed (interest charged at an implied rate of 9.8 percent per annum, lease payments are payable in monthly installments terminating in March 2022, are rand-based and the buildings financed are used as security for these loans);
$14 million is repayable to California First National Bank (Interest charged at an average rate of 2.4 percent per annum. Loans are repayable in monthly installments terminating in December 2019 and are US dollar-based. The equipment financed is used as security for these loans); and
$1 million is repayable to Caterpillar Financial Services Corporation (Interest charged at an average rate of 5.46 percent per annum. Loans are repayable in monthly installments terminating in January 2015 and are US dollar-based. The equipment financed is used as security for these loans).
As at 31 December 2014, AngloGold Ashanti’s totalnon-current borrowings, including the short-term portion maturing within 2014,2017, was made up as follows:
| $ (million) | ||||
Unsecured borrowings | 2,101 | |||
Secured finance leases | 77 | |||
Total borrowings | 2,178 | |||
Less: Short-term maturities | 34 | |||
Totalnon-current borrowings | ||||
Amounts falling due are scheduled as follows:
| $ (million) | ||||
Within one year | 34 | |||
Between one and two years | 170 | |||
Between two and five years | 902 | |||
After five years | 1,072 | |||
Total | ||||
At 31 December 2014,
At December 31, 2016 the currencies in which the borrowings were denominated were as follows:
| $ (million) | ||||
United States dollars | 1,844 | |||
Australian dollars | 225 | |||
South African rand | 106 | |||
Brazilian real | 3 | |||
Total | ||||
At 31 December 2014,
At December 31, 2016, AngloGold Ashanti had the following undrawn amounts available under its borrowing facilities:
| $ (million) | ||||
Syndicated revolving credit facility ($1.0 billion) – US dollar | 950 | |||
Syndicated revolving credit facility (A$500 million) – Australian dollar | 191 | |||
Syndicated revolving credit facility (R1.5 billion) – SA rand | 21 | |||
Syndicated revolving credit facility (R1.4 billion) – SA rand | 102 | |||
FirstRand Bank Limited – SA rand | 37 | |||
Revolving credit facilities ($100 million) | 60 | |||
Total undrawn facilities |
AngloGold Ashanti had no other committed lines of credit as of 31 December 2014.2016.
As of 31 December 2014,2016, the company was in compliance with all debt covenants and provisions related to potential defaults.
See “Item 18 –18: Note 38 – 33–Capital Management” and “Item 10C –10C: Material Contracts”.
AngloGold Ashanti, through its executive committee, reviews its short-, medium- and long-term funding, treasury and liquidity requirements and positions monthly. The Audit Committee also reviews these on a quarterly basis at its meetings.
164
Contractual commitments and contingencies
For a detailed discussion of commitments and contingencies, see note 3631 to the consolidated financial statements “Contractual commitments and contingencies”.
As at 31 December 2014,2016, capital commitments(1) can be summarised over the periods shown below as follows:
Expiration per period | Expiration per period | |||||||||||||||||||||||||||||||||||||||
Commitment
(in millions) | Total Amount $ | Less than 1 year $ | 1 – 3 Years $ | 4 – 5 Years $ | Over 5 $ | Total amount $ | Less than 1 year $ | 1 – 3 years $ | 4 – 5 years $ | Over 5 years $ | ||||||||||||||||||||||||||||||
Capital expenditure | ||||||||||||||||||||||||||||||||||||||||
(contracted and not yet contracted)(1) | 946 | 611 | 335 | - | - | |||||||||||||||||||||||||||||||||||
Guarantees | 9 | 9 | - | - | - | |||||||||||||||||||||||||||||||||||
Capital expenditure (contracted and not yet contracted)(1) | 645 | 387 | 258 | - | - | |||||||||||||||||||||||||||||||||||
Other commercial commitments(2) | 508 | 295 | 166 | 41 | 6 | 924 | 641 | 190 | 58 | 35 | ||||||||||||||||||||||||||||||
Total | 1,463 | 915 | 501 | 41 | 6 | 1,569 | 1,028 | 448 | 58 | 35 | ||||||||||||||||||||||||||||||
(1) Including commitments through contractual arrangements with equity accounted joint ventures of $49$138 million.
(2) Excludes commitments through contractual arrangements with equity accounted joint ventures.
Recent developments
Subsequent eventsRecent developments disclosed in Item 18 “Note 39 – Subsequent events”“Item 18: Note 34–Recent developments” include the following details:
The company has initiated
On 21 February 2017, the directors of AngloGold Ashanti declared a plangross cash dividend per ordinary share of 130 South African cents (assuming an exchange rate of ZAR13.10/$, the gross dividend payable per ADS is equivalent to identify a joint venture partner or a purchaser in respect10 US cents).
On 22 February 2017, the South African Minister of its interestsFinance announced an increase in the Cripple Creek & Victor mine in Colorado in the United States for full value. The CC&V gold mine is a surface mining operation which provides oxidised oreSouth African dividend withholding tax rate from 15% to a crusher and valley leach facility, one20% of the largest in the world. It is included in the Americas reporting segment and was acquired by AngloGold Ashanti in 1999. The mine produced 211,000 ounces of gold in 2014. There can be no assurance, however, that a sale and purchase agreement for this transaction will be entered into or that any sales transaction will be completed.dividends declared.
The company currently intends to dispose of its 41% stake in Sadiola and its 40% stake in Yatela. The mines are both situated in western Mali and are included in the Continental Africa reporting segment. The Sadiola and Yatela mines produced 85,000 and 11,000 attributable ounces of gold, respectively, in 2014.
Management was approached by a potential buyer for both mines who meets management’s qualifying criteria and has asked for a binding bid. There can be no assurance, however, that a sale and purchase agreement for these transactions will be entered into or that any sales transactions will be completed.
Related party transactions
For a detailed discussion of related party transactions, see “Item 7B.: Related party transactions”Party Transactions”.
Recently adopted accounting policies and pending adoption of new accounting standards
AngloGold Ashanti’s accounting policies are described in note 1 to the consolidated financial statements “Accounting policies”.
Critical accounting policies
AngloGold Ashanti’s accounting policies are described in note 1 to the consolidated financial statements “Accounting policies”. The preparation of the company’s financial statements requires management to make estimates and assumptions that affect the reported amounts of assets and liabilities and disclosures of contingent assets and liabilities at the date of the financial statements and the reported amounts of revenues and expenses during the year. The following are considered to be the accounting policies that are most critical to the company’s results of operations, financial condition and cash flows.
165
Use of estimates and making of assumptions
The most critical accounting estimates upon which AngloGold Ashanti’s financial reporting depends are those requiring estimates of Proven and Probable Ore Reserves, recoverable ounces therefrom, and/or assumptions of future gold prices. Such estimates and assumptions affect the value of inventories (which are stated at the lower of average cost or net realisable value) and the potential impairment of long-lived assets and intangibles as detailed below. These estimates and assumptions also affect the rate at which depreciation and amortisation are charged to earnings. On an ongoing basis, management evaluates its estimates and assumptions; however, actual amounts could differ significantly due to the ultimate conclusion of uncertainties.
Ore Reserve andlife-of-mines
AngloGold Ashanti estimates on an annual basis its Ore Reserve at its mining operations. There are a number of uncertainties inherent in estimating quantities of reserves,Ore Reserves, including many factors beyond the company’s control. Estimates of Ore Reserve are based upon engineering evaluations of assay values derived from samplings of drill holes and other openings. Additionally, declines in the market price of gold may render certain reservesOre Reserves containing relatively lower grades of mineralisation uneconomic to mine. Further, availability of permits, changes in operating and capital costs, and other factors
could materially and adversely affect the Ore Reserve. The company uses its estimates of Ore Reserve to determine the unit basis for mine depreciation and closure rates, and to evaluate mine asset impairments. Changes in estimates of Ore Reserve could significantly affect these items. At least annually, the company reviews mining schedules, production levels and asset lives in the company’slife-of-mine planning for all of the company’s operating and development properties. Significant changes in thelife-of-mine plans may occur as a result of mining experience, new ore discoveries, changes in mining methods and rates, process changes, investment in new equipment and technology and gold prices. Based on thelife-of-mine analysis the company reviews its accounting estimates and adjusts depreciation, amortisation, reclamation costs and evaluation of each mine for impairment where necessary. Accordingly, this analysis and the estimates made therein have a significant impact on the company’s results of operations and financial condition.
Contingencies
Accounting for contingencies requires the recording of an estimated loss for a loss contingency when information available indicates that it is probable that an asset has been impaired or a liability has been incurred, and the amount of the loss can be reasonably estimated. Accounting for contingencies such as legal and income tax matters requires the use of judgements to determine the amount to be recorded in the financial statements. By their nature, contingencies will only be resolved when one or more future events occur or fail to occur, and typically, those events will occur a number of years into the future. The company assesses such contingent liabilities, which inherently involves the exercise of significant management judgement and estimates of the outcome of future events.
Impairment of tangible and intangible assets
AngloGold Ashanti’s long-lived assets include property, plant and equipment, goodwill and other intangible assets. In assessing the potential impairment of its long-lived assets held for use, the company must make assumptions regarding estimated future cash flows and other factors relating to the respective assets. To the extent that the carrying value of the long-lived asset as recorded in the consolidated financial statements exceeds the discounted cash flows associated with these assets, an impairment charge is recognised in the consolidated financial statements. The company performs impairment tests for goodwill at least annually during the fourth quarter and whenever certain indicators of impairment exist. Impairment calculation assumptions are included in notes to the consolidated financial statements – Note 15 - “Tangible assets”.
Taxation
AngloGold Ashanti follows the liability method of accounting for deferred taxation whereby the company recognises the tax consequences of temporary differences by applying current statutory tax rates applicable to future years to differences between financial statement amounts and the tax bases of certain assets and liabilities. Changes in deferred tax assets and liabilities include the impact of any tax rate changes enacted during the year. Deferred tax is estimated at the future average anticipated taxation rates at which temporary differences are expected to reverse. Future average anticipated taxation rates are determined from revenue and expenditure outlined inlife-of-mine business plans that are revised annually. Deferred tax assets are only recognised to the extent that it is probable that the deductible temporary differences will reverse in the foreseeable future and future taxable profit will be available against which the temporary difference can be utilised. The carrying amount of deferred tax assets is reviewed at each reporting date.
166
Management classifies taxes payable based on the likelihood of the amount required to be settled within twelve months, which are then reported within current liabilities. All other taxes payable are recorded withinnon-current liabilities.
Provision for environmental rehabilitation
AngloGold Ashanti’s mining and exploration activities are subject to various laws and regulations governing the protection of the environment. The company recognises management’s best estimate for asset retirement obligations in the period in which they are incurred. Actual costs incurred in future periods could differ materially from the estimates. Additionally, future changes to environmental laws and regulations, life of mine estimates and discount rates could affect the carrying amount of this provision. Changes in MineralOre Reserves could similarly affect the useful lives of assets depreciated on a straight-line-basis, where those lives are limited to the life of mine.
Discounted closure liabilities (excluding joint ventures) increased from $728 million in 2013 to $851 million in 2014. This change relates to changes in discount rates due to changes in global economic assumptions and changes in mine plans resulting in a change in cash flows and changes in design of tailings storage facilities and in methodology following requests from the environmental regulatory authorities. The increase is partially offset by the impact of weaker local currencies.
Heap leach inventory
The recovery of gold from certain oxide ores is achieved through the heap-leaching process. Under this method, ore is placed on leach pads where it is permeated with a chemical solution, which dissolves the gold contained in the ore. The resulting “pregnant” solution is further processed in a process plant where the gold is recovered. For accounting purposes, costs are added to leach pads based on current mining costs, including applicable depreciation, depletion and amortisation relating to mining operations. Costs are removed from the leach pad as ounces are recovered in circuit at the leach plant based on the average cost per recoverable ounce of gold on the leach pad.
The engineering estimates of recoverable gold on the leach pads are calculated from the quantities of ore placed on the pads (measured tons added to the leach pads), the grade of ore placed on the leach pads (based on assay data) and a recovery percentage (based on metallurgical testing and ore type). Leach pad production cycles vary from several months to multiple years dependent on the height of the heap leach pad. The increased height of the pad and the resultant associated lengthy transport time of the solution to the internal collection ponds from which the pregnant solution is pumped significantly increase the time from placement of ore to the ultimate gold recovery.
Although the quantities of recoverable gold placed on the leach pads are reconciled by comparing the grades of ore placed on pads to the quantities of gold actually recovered (metallurgical balancing), the nature of the leaching process inherently limits the ability to precisely monitor recoverability levels. As a result, the metallurgical balancing process is constantly monitored and the engineering estimates are refined based on actual results over time. Historically, AngloGold Ashanti’s operating results have not been materially impacted by variations between the estimated and actual recoverable quantities of gold on its leach pads. For operations with long-term leach production cycles, variations in recovery estimates from new metallurgical data or production variances would be accounted for as an adjustment to the recoverable ounces and the average cost per recoverable ounce of gold on the leach pad. Variations between actual and estimated quantities resulting from changes in assumptions and estimates that do not result in write-downs to net realisable value are accounted for on a prospective basis. The ultimate recovery of gold from a pad will not be known until the leaching process has been concluded.
As at 31 December 2014 and 2013, $104 million and $111 million, respectively, of heap-leach inventory was classified as current as the company expects the related gold to be recovered within twelve months. The current portion of materials on the leach pad is determined by multiplying the average cost per ounce in inventory by the expected production ounces for the next twelve months. Heap-leach pad inventory occurs in two forms: (1) gold recoverable but yet to be dissolved (i.e. gold still in the ore), and (2) gold recoverable from gold dissolved in solution within the leach pad (i.e. pore water). This estimate calculation was used in determining the current portion of materials on the leach pad as at 31 December 2014. As at 31 December 2014, $521 million was classified as non-current compared with $479 million as at 31 December 2013.
167
| 5C. | RESEARCH AND DEVELOPMENT, PATENTS AND LICENSES, ETC. |
Research and development expenditure included in the income statement amounted to $15 million, $18 million and $21 million $4 millionduring 2016, 2015 and $9 million during 2014, 2013 and 2012, respectively.
| 5D. | TREND INFORMATION |
For a discussion of trends affecting AngloGold Ashanti’s business and operations, see “Item 5A.: Operating Results – Key factors affecting results”.
| 5E. | OFF-BALANCE SHEET ARRANGEMENTS |
AngloGold Ashanti does not engage inoff-balance sheet financing activities, and does not have anyoff-balance sheet debt obligations, special purpose entities or unconsolidated associates. The most significantoff-balance sheet item is the unaccrued future rehabilitation obligations.
See note 28 to the consolidated financial statements “Environmental rehabilitation and other provisions”.Item 5F: Tabular disclosure of contractual obligations.
| 5F. | TABULAR DISCLOSURE OF CONTRACTUAL OBLIGATIONS |
As at 31 December 20142016 AngloGold Ashanti had the following known contractual obligations:
Total $ | Less than 1 year $ | 1 – 3 Years $ | 3 – 5 Years $ | More than 5 years $ | ||||||||||||||||||||||||||||||||||||
| (in millions) | Total $ | Less than 1 year $ | 1 – 3 years $ | 4 – 5 years $ | More than 5 years $ | |||||||||||||||||||||||||||||||||||
Long-term debt obligations including interest(1) | 5,339 | 374 | 748 | 536 | 3,681 | 3,086 | 128 | 584 | 860 | 1,514 | ||||||||||||||||||||||||||||||
Capital lease obligations | 73 | 8 | 14 | 15 | 36 | 126 | 12 | 25 | 26 | 63 | ||||||||||||||||||||||||||||||
Operating lease obligations | 14 | 8 | 2 | 4 | - | 99 | 60 | 36 | 3 | - | ||||||||||||||||||||||||||||||
Purchase obligations | ||||||||||||||||||||||||||||||||||||||||
- Contracted capital expenditure(2) | 178 | 150 | 28 | - | - | 58 | 58 | |||||||||||||||||||||||||||||||||
- Other purchase obligations(3) | 508 | 295 | 166 | 41 | 6 | 924 | 641 | 190 | 58 | 35 | ||||||||||||||||||||||||||||||
Environmental rehabilitation costs(4) | 3,616 | 85 | 76 | 204 | 3,251 | 867 | 82 | 44 | 77 | 664 | ||||||||||||||||||||||||||||||
Pensions and other post-retirement medical obligations(5) | 148 | 11 | 23 | 24 | 90 | 109 | 8 | 18 | 20 | 63 | ||||||||||||||||||||||||||||||
Total | 9,876 | 931 | 1,057 | 824 | 7,064 | 5,269 | 989 | 897 | 1,044 | 2,339 | ||||||||||||||||||||||||||||||
| (1) | Interest calculations are at the rate existing at the year end. Actual rates are set at floating rates for some of the borrowings (Refer Note |
| (2) | Represents contracted capital expenditure for which contractual obligations exist. Amounts stated include commitments of equity accounted joint ventures. |
| (3) | Other purchase obligations represent contractual obligations for mining contract services, purchase of power, supplies, consumables, inventories, explosives and activated carbon. Amounts stated exclude purchase obligations of equity accounted joint ventures. |
| (4) | Operations of gold mining companies are subject to extensive environmental regulations in the various jurisdictions in which they operate. These regulations establish certain conditions on the conduct of operations by AngloGold Ashanti. Pursuant to environmental regulations, AngloGold Ashanti is also obligated to close its operations and reclaim and rehabilitate the lands upon which it conducted its mining and gold recovery operations. The present estimated closure costs at existing operating mines and mines in various stages of closure are reflected in this table. They are calculated using undiscounted real cash flows, not nominal cash flows. The amount will change from year to year depending on rehabilitation work undertaken, changes in design and methodology and new occurrences. For more information of environmental rehabilitation obligations, see “Item |
| (5) | Represents payments for unfunded plans or plans with insufficient funding. |
168
ITEM 6: DIRECTORS, SENIOR MANAGEMENT AND EMPLOYEES
| 6A. | DIRECTORS AND SENIOR MANAGEMENT |
Directors
As at 2331 March 2015,2017, AngloGold Ashanti has a unitary board comprising 11 directors – nine independentnon-executive directors; directors and two executive directors. Certain information with respect to AngloGold Ashanti’s directors is set forth below:
| Name | Age | Position | Year first appointed (1) | Age | Position | Year first appointed(1) | ||||||
Srinivasan Venkatakrishnan | 49 | Executive director and chief executive officer | 2005 | 52 | Executive director and chief executive officer | 2005 | ||||||
Christine Ramon | 47 | Executive director and chief financial officer | 2014 | 49 | Executive director and chief financial officer | 2014 | ||||||
Sipho Pityana(2) | 55 | Independent non-executive director and chairman | 2007 | 57 | Independentnon-executive director and chairman | 2007 | ||||||
Nozipho January-Bardill | 66 | Independentnon-executive director | 2011 | |||||||||
Albert Garner | 61 | Independentnon-executive director | 2015 | |||||||||
Rhidwaan Gasant | 55 | Independent non-executive director | 2010 | 57 | Independentnon-executive director | 2010 | ||||||
Dave Hodgson | 67 | Independent non-executive director | 2014 | 69 | Independentnon-executive director | 2014 | ||||||
Nozipho January-Bardill | 64 | Independent non-executive director | 2011 | |||||||||
Michael J. Kirkwood | 67 | Independent non-executive director | 2012 | 69 | Independentnon-executive director | 2012 | ||||||
Lumkile W (Wiseman) Nkuhlu | 70 | Independent non-executive director | 2006/2009 | 73 | Independentnon-executive director | 2009 | ||||||
Maria Richter | 62 | Independentnon-executive director | 2015 | |||||||||
Rodney J. Ruston | 64 | Independent non-executive director | 2012 | 66 | Independentnon-executive director | 2012 | ||||||
Appointed 1 January 2015 | ||||||||||||
Albert Garner(3) | 59 | Independent non-executive director | 2015 | |||||||||
Maria Richter(3) | 60 | Independent non-executive director | 2015 | |||||||||
| (1) | Directors serve for a period of three years unlessre-elected. At each annual general meeting, directors appointed since the previous annual general meeting are required to retire, but are eligible forre-election. In addition,one-third of the directors |
| (2) | Appointed as Chairman with effect from 17 February 2014. |
|
NON-EXECUTIVE CHAIRMAN:
Sipho Pityana (55)(57)
BA (Hons), MSc, Dtech (Honoris)
Independentnon-executive chairman
Initially appointed a non-executiveAppointed: A director on 13 February 2007. Appointed2007 and Chairman of the Board on 17 February 2014.2014
| • Nominations Committee (Chairman) | |
| • Remuneration and Human Resources Committee | |
• Social, Ethics and Sustainability Committee |
Sipho Mila Pityana is the Chairman of the Board of Directors, having assumed this role in February 2014. Sipho has extensive business experience having served in both an executive andnon-executive capacity on several JSE listed boards of companies as well as running his own company,companies, Izingwe Capital Proprietary Limited,and Izingwe Holdings, which he chairs. He is chairman of theJSE-listed Onelogix andGroup, he is also the chairman of the University of Cape Town Council. He has previously served as chair of Munich Reinsurance of Africa, and a director of a number of manufacturing companies including Aberdare Cables. Hehe also served on the boards of Bytes Technology Group, Afrox, SPESCOM, Scaw Metals Group and the Old Mutual Leadership Group and Scaw Metals.Group. He previously worked as an executive director of Nedcor Investment Bank and managing director of Nedbank.
In addition to his private sector track record, Sipho has extensive public sector experience and international exposure. He was the first Director General of the Department of Labour in a democratic South Africa.the former President Mandela’s Government. As the Foreign Affairs Director General he represented South Africa in various international fora including the United Nations, African Union, Commonwealth and the International Labour Organization. He was one of the founding members of the governing body of the Commission for Conciliation, Mediation and Arbitration (CCMA) and Convenor of the South African government delegation to the National Economic Development and Labour Council (Nedlac).Council. He is a member of the Advisory Council of the Council for the Advancement of the South African Constitution (CASAC).as well as Millennium Labour Council.
169
DEPUTY CHAIRMAN AND LEAD INDEPENDENT DIRECTOR
Wiseman Nkuhlu (70)(73)
BCom, CA (SA)CA(SA), MBA
Deputy chairman
Appointed to the board on 4 August 2006, resigned on 30 April 2009 and re-appointed onAppointed: 1 June 2009.2009
| • Audit and Risk Committee | |
• Investment Committee | ||
• Nominations Committee | ||
• Remuneration and Human Resources Committee |
Wiseman Nkuhlu was first appointed to the board on 4 August 2006 and resigned on 30 April 2009. He was re-appointed to the board on 1 June 2009, appointed Lead Independent Director from February 2014 and Deputy Chairman from March 2014.
Prof Nkuhlu, a respected South African academic, educationist, professional and business leader, served as Economic Adviser to the former President of South Africa, Mr Thabo Mbeki, and as Chief Executivechief executive of the Secretariat of the New Partnership for Africa’s Development (Nepad) from 2000 to 2005. From 1989 to 2000, heDevelopment. He served as a director on a number of major South African companies or subsidiaries, including Standard Bank, South African Breweries, Old Mutual, Tongaat, Hulett BMW and JCI.BMW. Prof Nkuhlu was also president of the South African Institute of Chartered Accountants, from 1998 to 2000 and principal and vice chancellor of the University of Transkei from 1987 to 1991.and president of the Geneva-based International Organisation of Employees. He is currently a member of the Boardboards of the Ethics Institute of South Africa, Datatec Limited, the Nepad Business Foundation, and the Chartered Director Governing body of the Institute of Directors in South Africa. He was elected presidentis the chairman of Rothschild (SA) and chancellor of the Geneva-based International OrganisationUniversity of Employees (IOE) in May 2008 and served for two years.Pretoria. Lastly, he is a trustee of the International Financial Reporting Standards Foundation which provides oversight of the accounting standard setting operations of the International Accounting Standards Board (IASB).
EXECUTIVE DIRECTORS:Board.
Srinivasan Venkatakrishnan (Venkat) (49)(52)
BCom, ACA (ICAI)
Chief Executive Officerexecutive officer and executive director
First appointed to the board onAppointed: 1 August 2005 and as CEO on 8 May 2013.2013
| • Social, Ethics and Sustainability Committee |
Since Venkat’s appointment as CEO in 2013, AngloGold Ashanti has successfully reframed its strategy to improve sustainable free cash flow and returns, through a focus on strict capital discipline and a strong pipeline of brownfields investment options to improve the quality of production and extend mine lives.
Venkat has overseen the successful development of two new mines, the reduction of overhead and operating costs by almost half and the internal generation of funds to reduce debt by a third without diluting shareholders. These operating and balance sheet improvements were undertaken despite a sharply lower gold price and whilst achieving a marked improvement in overall safety trends, reflected in a reduction of fatal accidents.
Venkat was appointed CEO on 8 May 2013, after holdingpreviously the position of joint acting CEO from April of that year. He was previously Chief Financial Officer (CFO)at AngloGold Ashanti, a post he also held at Ashanti Goldfields untilbefore its merger with AngloGold in May 2004, creating what is now AngloGold Ashanti. Venkat became CFO of the combined entity shortly after the merger and joined the board on 1 August 2005. He is chairman of the Executive Committee and also a member of the Social, Ethics and Sustainability Committee.
2004. In histhis role as CFO, he oversaw funding for all of AngloGold Ashanti’sboth companies’ operating activities, giving him a detailed knowledge of allthe portfolio of our mines and operating jurisdictions. He isjurisdictions, with a memberunique perspective of the Financial Reporting Investigation Panel, an advisory panel of the JSE. He was the executive responsibleboth risks and opportunities. During this time he also bore responsibility for eliminating aAngloGold Ashanti’s 12Moz of legacy hedge book, generating significant value for the company,positions. Venkat has extensive experience of gold- and was the key executive behind rebuilding the balance sheet through a series of successful debt financings that introduced long-term tenor and more favourable funding termsother capital markets. Prior to the company’s credit profile. During Venkat’s first year as CEO of AngloGoldjoining Ashanti two new mines were commissioned on time and ahead of budget, the company achieved its best ever safety performance and a significant restructuring was undertaken of operating and overhead costs in order to focus the business on delivery of sustainable free cash flow and returns.Goldfields, Venkat was also previously a director of corporate reorganisation services at Deloitte & Touche in London.
Venkat is also a Director of Business Leadership South Africa and the World Gold Council. He is also a Council member of the South African Chamber of Mines and the International Council on Mining and Metals. He also serves as a member of the Financial Reporting Investigation Panel of the JSE Limited.
170
Christine Ramon (47)(49)
BCompt, BCompt (Hons), CA (SA)CA(SA), Senior Executive Programme (Harvard)
Chief Financial Officerfinancial officer and executive director
Appointed to the board as CFO onAppointed: 1 October 2014.2014
| • Investment Committee |
Christine joined AngloGold Ashanti as CFO and executive director with effect from 1 October 2014, in compliance with the JSE Listings Requirements. Christine has held senior financial management and executive positions in various companies, in particular as CFOchief financial officer and executive director of Sasol Limited from 2006 to 2013. Prior to this, she was CEOchief executive officer of Johnnic Holdings Limited, having previously served as its financial director. Currently, she is a non-executive director on the boards of MTN Group Limited and Lafarge (France). She previouslyChristine has served on the boards of Transnet SOC Limited and Johnnic Communications Limited. She is currently anon-executive director on the board of MTN Group Limited.
Christine is a member of the South African Institute of Chartered Accountants and the Association for the Advancement of Black Accountants of South Africa. She served previously as a member of the Standing Advisory Committee to the International Accounting Standards Board and currently serves as Deputy Chair of the Financial Reporting Standards Council of South Africa.
Christine’s current portfolio includes finance and treasury, insurance services, internal audit, taxation and information technology.
NON-EXECUTIVE DIRECTORS: Christine is also the chairperson of the CFO Forum of South Africa.
Albert Garner (59)(61)
BSE, Aerospace and Mechanical Sciences
Appointed to the board onIndependentnon-executive director
Appointed: 1 January 2015
| • Audit and Risk Committee | |
• Investment Committee |
Albert Garner has extensive experience in capital markets, corporate finance and mergers and acquisitions having worked with Lazard Frères & Co., LLC for 3537 years in various leadership positions. He is one of the most senior bankers at Lazard, currently leading their special committee practice and chairing their fairness opinion committee. He formerly led Lazard’s corporate finance practice. Albert became a general partner in 1989 and is now Vice Chair – US Investment Banking. Over the past 10 years he has advised and acted as lead advisoradviser to more than 50 companies and their boards of directors on transformative transactions.
Rhidwaan Gasant (55)(57)
BCompt (Hons), CA (SA), ACIMA, Executive Development Programme
Appointed to the board onIndependentnon-executive director
Appointed: 12 August 2010
| • Audit and Risk Committee (Chairman) | |
| • Investment Committee |
Rhidwaan Gasant iswas previously the former Chief Executive Officer of Energy Africa Limited, and sits on the boards of international companiesLimited. He serves as a director and chairs the Audit and Risk Committees of international companies in the MTN Group. He is currently Chief Executive Officer ofHis other directorships include those in the Rapid African Energy Holdings Group, a start-upstart up oil and gas exploration company,business focused on Africa.Africa, and Edcon Limited.
Dave Hodgson (67)(69)
MScBSc (Civil Engineering), MScBSc (Mining) (Hons), BComm, Advanced Management ProgrammeAMP(Harvard)
Appointed to the board onIndependentnon-executive director
Appointed: 25 April 2014
| • Investment Committee | |
• Social, Ethics and Sustainability Committee |
Dave Hodgson formerly held a series of senior and executive positions over three decades with the Anglo American and De Beers group of companies, and also held the post of Chief Operating Officer of AngloGold Ashanti from November 2001 through to his retirement in April 2005. In addition, he has heldnon-executive directorships at Moto Gold Mines Limited, Uranium One Inc,Inc., Goliath Gold Mining Limited, Auryx Gold Corporation, and Montero Mining and Exploration Limited, and Acacia Mining.
171
Nozipho January-Bardill (64)(66)
BA, MA Applied Linguistics, Dipl Human Resources Development
Appointed to the board onIndependentnon-executive director
Appointed: 1 October 2011
| • Social, Ethics and Sustainability Committee (Chairman) | |
| • Remuneration and Human Resources Committee |
Ambassador Nozipho January-Bardill was an Executive Director, Corporate Affairshas extensive experience in both the local and spokesperson of the MTN Group whereinternational public and private sectors. Besides AngloGold Ashanti, she also servedserves as an independentnon-executive director on the boards of Credit Suisse Securities and Mercedes Benz South Africa, and as senior adviser to the United Nations Women’s Organisation and the United Nations Global Compact. Before serving as a numberdirector of companies Nozipho was appointed to the MTN Group as Head of Corporate Affairs and Spokesperson, and served on multiple boards of operations in the MTN footprint. She is a formerFootprint. Prior to MTN she was the South African Ambassador to Switzerland, Lichtenstein and the Holy See (Vatican) and formerthe Deputy Director General of Human Capital Management and Head of the Foreign Service Institute in the thenSouth African Department of Foreign Affairs (now DIRCO). She is currently the founderhas worked in leadership positions in a number ofnon-governmental organisations and executive directorrecently completed 12 years of Bardill & Associates, a consulting company focusingservice on strategic communications, high-level government relations, stakeholder management and gender equality in the workplace. She serves on the board of Credit Suisse Securities, Johannesburg and is also a member of the United Nations Expert Committee onfor the Elimination of Racial DiscriminationDiscrimination. Human rights, social justice, sustainable development and was recently appointed Interim Chief of Staff of UN Women in New York.ethical governance remain a central interest to Nozipho.
Michael J Kirkwood (67)(69)
AB, Stanford, Economics & Industrial Engineering
Appointed to the board onIndependentnon-executive director
Appointed: 1 June 2012
| • Remuneration and Human Resources Committee (Chairman) | |
| • Audit and Risk Committee | |
• Nominations Committee |
Michael Kirkwood is a highly experienced and respected former international banker, having worked at the highest levels of Citigroup during his30-year career with the bank. He is currently chairmanSenior Adviser (former chairman) of Ondra Partners LLP, Chairman of Circle Holdings PLC and a senior advisor (former chairman)non-executive director of Ondra Partners LLP.London Scottish International Limited. He formerly served on the boards of Kidde plc, UK Financial Investments Ltd, Eros International plc and as deputy chairman on PwC’s Advisory Board. He also previously servedDuring his career in finance, he held appointments as chairmanChairman of British American Business Inc., as presidentPresident and a fellowFellow of The Chartered Institute of Bankers and as deputy chairmanDeputy Chairman of the British Bankers Association.
Maria Richter (60)(62)
BA, Juris Doctor
Appointed to the board onIndependentnon-executive director
Appointed: 1 January 2015
| • Audit and Risk Committee | |
• Remuneration and Human Resources Committee |
Maria Richter is an experienced FTSE 100non-executive director who has served on a diverse range of UK and International boards. She previously served on the board of National Grid plc in the UK from 2003 to July 2014 where she was the chairperson of the finance committee and member of the audit and nominations committees. She currently sits on the boards of Rexel Group, France, a global leader in the professional distribution of energy products and services, and Bessemer Trust, a US wealth management company, and is a member of the audit and compensation committees of Rexel and the remuneration committee of Bessemer Trust. She also serves on the board of Pro Mujer International, a women’s microfinance network and is chairman of the board of trustees of Pro Mujer UK. Maria’s professional career spanned 1980 to 2002 during which time she served in various positions at the former Dewey Ballantine, Prudential, Salomon Brothers IncInc. and Morgan Stanley & Co.
172
Rodney Ruston (64)(66)
MBA Business, BE (Mining)
Appointed to the board onIndependentnon-executive director
Appointed: 1 January 2012
| • Investment Committee (Chairman) | |
| • Audit and Risk Committee |
Rodney Ruston holds a degree in mining engineerengineering and an MBA and has over 35 years of business experience during which he has led private and publically listedpublicly-listed companies in the resources, oil and gas and construction industries. His international experience as the chief executive of a heavy construction supplyand mining contractor coupled with chief executive roles with operating resource companies provides the board with a broad based director, who can provide insight and advice on the full range of domestic and international activities in the AngloGold Ashanti business. Rodney is currently the chief executive of County Coal Limited, astart-up Australian listed company, which he joined in July 2012. He was previously chief executive officer and President of North American Energy Partners Inc., a large Canadian mining and construction contracting company, which he took public with a listing on the NYSE and the TSX. Prior to that he was managing director of Ticor Ltd, an Australian-based titanium producer with operations in Australia and South Africa.
Board movements during 20142016 and subsequent to year end
The following changes to the board of directors took place during the period from 1 January 20142016 to 31 December 20142016 and subsequent toyear-end:
the following directors retired at the Annual General Meeting on 4 May 2016 and being eligible forre-election werere-elected by the shareholders: Srinivasan Venkatakrishnan, Michael Kirkwood, Rhidwaan Gasant and David Hodgson.
In terms of the company’s Memorandum of Incorporation, the following directors are required to retire at the Annual General Meeting to be held on 16 May 2017: Sipho Pityana, Rodney Ruston, Maria Richter and Lumikile Nkuhlu. Sipho Pityana, Rodney Ruston and Maria Richter are eligible and have offered themselves forre-election. However, Lumikile Nkuhlu has not offered himself forre-election as announced by the company on 21 February 2017.
Executive DirectorsEXECUTIVE COMMITTEE
Richard Duffy resignedAngloGold Ashanti’s executive management team (Executive Committee) comprises nine members of whom two are executive directors. This committee oversees theday-to-day management of the group’s activities and is supported by country and regional management teams as well as by group corporate functions.
In addition to Srinivasan Venkatakrishnan and Christine Ramon, the following people are members of the Executive Committee:
Chris Sheppard (58)
BSc (Min. Eng.)
Chief Operating Officer – South Africa
As the Chief Operations Officer – South Africa, Chris’ portfolio includes three operating areas (West Wits, Vaal River and Surface Operations). He also leads the company’s innovative technology project in South Africa.
Chris, a mining engineer by profession, was most recently Managing Director of Murray & Roberts Cementation, one of Africa’s largest mining contractors and a division of South Africa’s largest publicly traded engineering & construction group.
Prior to that, Chris held positions as head of both mining and technical services at Lonmin Plc for four years, following six years at Anglo American Platinum Ltd., where he most recently held the post of Head Mining Technical Services. Chris is also an alumnus of Anglo American Plc’s Gold & Uranium Division and AngloGold Ltd., where he served latterly as general manager of deep gold mining operations in the Free State between 1997 and 2001. Chris holds a Bsc in Mining Engineering from the University of the Witwatersrand, and also completed an Advanced Management Programme at Harvard Business School.
Tirelo Sibisi (48)
BSSc, Advanced HR Executive DirectorDevelopment Programme, MBA, Post Graduate Diploma in Business Management
Executive Vice President – Group Human Resources
In her role Executive Vice President – Group Human Resources, Tirelo is responsible for people and organisational development, which entails developing a highly engaged, transformed, diverse and productive workforce. She has more than 20 years’ experience in the field of human resources having been the group executive for human resources and corporate social investment at PPC Cement, where she played a key role in the acquisition of new mining licences for the company for their operations in throughout Africa. Tirelo’s experience includes 10 years in the information technology sector at IBM (South Africa and Paris) and at Telkom, making her a well-rounded human resources generalist with strengths in talent management, succession planning, union negotiations and remuneration.
Charles Carter (54)
BA (Hons), DPhil
Executive Vice President – Strategy and Business Development
Charles is responsible for group strategy, business development, corporate finance, investor relations and communications. He has worked in the mining industry in South Africa and the Americas for 25 years and has had responsibility for a range of additional portfolios that include human resources, risk management, business planning and executive responsibility for the company’s business in Colombia.
Graham Ehm (60)
BSc Hons, MAusIMM, MAICD
Executive Vice President – Group Planning and Technical
Graham, who has multi-commodity experience, has held senior leadership positions in AngloGold Ashanti in Tanzania and Australia. His current portfolio entails business planning and portfolio optimisation, capital investment optimisation, monitoring of projects, studies and exploration, and non-managed joint ventures. In 2014 he was also assigned accountability for the closure and redevelopment of the Obuasi Gold Mine.
Ron Largent (56)
BSc (Min. Eng.), MBA
Chief Operating Officer – International
Ron has more than 30 years’ experience in international mining operations and project management. He joined the organisation in 1994 as Manager, Gold Operations for Cripple Creek & Victor and served as Vice President – General Manager at Jerritt Canyon and Cripple Creek & Victor between 2000 and 2007. He was promoted to Executive Vice President – Americas in 2007, and subsequently promoted to Chief Operations Officer – International in 2013. His portfolio was extended to include Continental Africa. Effective January 2014, Australia was also included in his remit. He is currently accountable for overall strategic and operational responsibilities for production at the company’s mining operations across four continents and nine countries.
David Noko (59)
Executive Vice President – Group Sustainable Development
David Noko is a member of the company’s Executive Committee. His portfolio as Executive Vice President: Sustainable Development comprises the disciplines of Safety, Health, Environment, Social and Community Affairs, Human Rights and Global Security, and Government Relations.
David sets the company sustainability strategy and direction, guiding the company’s performance and positioning within the global sustainable development landscape. He also ensures the enablement and full implementation of the company’s strategy particularly on matters relating to the company’s involvement in host countries and global institutions with respect to sustainable development.
He previously served in several executive roles and directorships of other leading mining and manufacturing companies in De Beers, Pepsi Cola, SAB, AstraPak, Harmony Gold and Royal Bafokeng Platinum and the Chamber of Mines in South Africa.
Maria Sanz Perez (51)
BCom LLB, Higher Diploma in Tax, AMP (Harvard), Admitted Attorney
Executive Vice President – Legal, Commercial and Governance and Company Secretary
Maria partners with the company’s business leaders to ensure AngloGold Ashanti complies with legal requirements across the group. Other responsibilities are compliance, company secretarial functions and integrated reporting. She is also accountable for the legal and commercial aspects of global procurement. Maria has been with the group since 2011 and has worked in similar positions for leading South African companies in her career including Investec, Sappi and Afrox.
Executive Committee movements subsequent to year end
Ron Largent will be retiring with effect from 30 June 2017 as Chief Operating Officer: International. In line with the company’s succession plan and to ensure an orderly handover, Ludwig Eybers who has been in the role of Deputy Chief Operating Officer International, has been appointed to succeed Ron as Chief Operating Officer: International. Ludwig replaced Ron on AngloGold Ashanti’s group executive committee effective 22 February 2017 and will continue to work with Ron to complete the well advanced transition.
COMPETENT PERSONS
As part of its suite of annual reports, AngloGold Ashanti produces a Mineral Resource and Ore Reserve Statement and all the information in this report that relates to Exploration Results, Mineral Resources and Ore Reserve is based on information compiled by the Competent Persons.
During the past decade, the company has developed and implemented a system of internal and external reviews aimed at providing assurance in respect of Ore Reserve and Mineral Resource estimates. A documented chain of responsibility exists from the Competent Persons at the operations to the Company’s Mineral Resource and Ore Reserve Steering Committee. Accordingly, the Chairman of the AngloGold Ashanti Mineral Resource and Ore Reserve Steering Committee, Mr VA Chamberlain, assumes responsibility for the Mineral Resource and Ore Reserve processes for AngloGold Ashanti and is satisfied that the Competent Persons have fulfilled their responsibilities.
VA Chamberlain (54)
MSc (Mining Engineering), BSc (Hons) (Geology), FAusIMM
Vaughan holds a Bachelor of Science (Honours) degree in Geology from the University of Natal and a Master’s degree in Mining Engineering from the University of the Witwatersrand. He started his career with Anglo American Corporation in 1987 as a geologist at Western Deep Levels East Mine (now TauTona mine). He joined AngloGold in 1998 and currently holds the position of Senior Vice President: Strategic Technical Group and is Chairman of the AngloGold Ashanti Mineral Resource and Ore Reserve Steering Committee.
| 6B. | COMPENSATION |
REMUNERATION AND HUMAN RESOURCES COMMITTEE
Remuneration and Human Resources Committee (Remco)
The Remco comprises of five non-executive directors and its purpose is to discharge the responsibilities of the board relating to all compensation, including all salary and equity compensation of the company’s executives. The committee establishes and administers the company’s executive remuneration and its broad objectives include; aligning executive remuneration with company performance and shareholder interests; setting remuneration standards aimed at attracting, motivating and retaining a competent executive team; linking individual pay with operational and company performance aligned to strategic objectives; and evaluating compensation of executives including approval of salary, equity and incentive based awards.
With respect to its mandate on human resources, the committee has oversight to all strategic aspects of people development and human resource issues. The committee also considers and makes recommendations to shareholders on non-executive director’s fees.
The performance of the executive team, including the executive directors, is considered relative to the prevailing business climate and market conditions, as well as to annual evaluations of the achievement of key performance objectives. Bonuses paid to the executives are a reflection of performance of each of the executives and the company as a whole.
The members of the committee during 2016 are reflected below:
Members
MJ Kirkwood (Chairperson)
Prof LW Nkuhlu
SM Pityana
NP January-Bardill
M Richter
The meetings of the committee are attended by the Chief Executive Officer, Chief Financial Officer on 30 September 2014 and Christine Ramon was appointed Executive Director and Chief Financial Officer on 1 October 2014.Vice President: Group Human Resources, except when their own remuneration or benefits are being discussed.
Remuneration policy
The remuneration policy is designed to allow AngloGold Ashanti to compete in a global market where we strive to retain and remunerate our employees using fair, robust and appropriate remuneration and reward for their contributions. Cost management and shareholder value remain fundamental drivers of the policy delivery.
Linking pay and performance for our executives is important and by having a large portion of executive pay defined as at risk pay, the policy ensures that executive compensation is aligned with the overall performance of the company, the regions and the business units. The executives have an overriding focus on social sustainability including safety, and a large percentage of variable pay is directly linked to keeping our employees safe.
Total reward
When determining remuneration AngloGold Ashanti considers all elements of short- and long-term fixed and variable pay, and ensures that it is consistent with the overall strategic direction of the company and each employee’s individual performance.
For a description of share-based compensation and awards see “Item 6E: Share Ownership”.
Executive directors do not receive payment of directors fees or committee fees.
Benchmarking
Our executives and non-executives are benchmarked against a global group of competitors. AngloGold Ashanti’s size and complexity as well as each individual executive’s role are reviewed against the benchmark group from a base pay, benefits, guaranteed pay and variable pay perspective (which takes into consideration individual performance). The 2016 bespoke benchmark survey was completed by Mercer.
Our salary benchmarks are targeted at the market median of a global market; where there is a shortage of specialist and/or key technical skills higher than the benchmark median is paid.
Each executive’s role is individually sized to ensure the best match possible. The comparison is done on the same or similar roles irrespective of place of work (including a review of purchasing power parity between countries). Each component of remuneration (base salary, short-term incentives, long-term incentives, Co-investment plan and employee benefits and allowances) is analysed and compared with the benchmarks and the overall package is reviewed accordingly.
Retirement benefits/pension
Retirement benefits are granted to all executives. All new executives and employees receive retirement benefits under defined contribution plans. There are no longer any executives in the legacy defined benefit plans. Contributions vary based on the employee’s retirement plan.
EXECUTIVE DIRECTORS’ AND EXECUTIVE MANAGEMENT REMUNERATION
| Salary(1) | Performance related payments (2) | Pension scheme benefits | Other benefits and encashed leave(3) | Sub total | Pre-tax gain on share options | Total | Total | |||||||||||||||||||||||||
| Figures in thousands | 2016 | SA Rands | US Dollars(4) | |||||||||||||||||||||||||||||
Executive Directors | ||||||||||||||||||||||||||||||||
S Venkatakrishnan | 12,660 | 7,323 | 3,133 | 3,785 | 26,901 | - | 26,901 | 1,832 | ||||||||||||||||||||||||
KC Ramon | 8,007 | 4,354 | 800 | 743 | 13,904 | - | 13,904 | 947 | ||||||||||||||||||||||||
Resigned executive director | - | - | - | - | - | - | - | - | ||||||||||||||||||||||||
| 20,667 | 11,677 | 3,933 | 4,528 | 40,805 | - | 40,805 | 2,779 | |||||||||||||||||||||||||
Prescribed Officers | ||||||||||||||||||||||||||||||||
I Boninelli(5) | 1,607 | - | 161 | 10,124 | 11,892 | 24,995 | 36,887 | 2,513 | ||||||||||||||||||||||||
CE Carter(6) | 10,180 | 4,439 | 1,523 | 2,058 | 18,200 | 4,342 | 22,542 | 1,535 | ||||||||||||||||||||||||
GJ Ehm | 9,466 | 3,740 | 381 | 3,781 | 17,368 | 7,480 | 24,848 | 1,693 | ||||||||||||||||||||||||
RW Largent | 17,722 | 7,728 | 3,314 | 5,810 | 34,574 | 16,291 | 50,865 | 3,465 | ||||||||||||||||||||||||
DC Noko | 6,432 | 2,805 | 643 | 4,227 | 14,107 | - | 14,107 | 961 | ||||||||||||||||||||||||
ME Sanz Perez | 6,404 | 2,985 | 641 | 2,389 | 12,419 | 11,664 | 24,083 | 1,640 | ||||||||||||||||||||||||
CB Sheppard | 6,604 | 2,965 | 674 | 339 | 10,582 | - | 10,582 | 721 | ||||||||||||||||||||||||
TR Sibisi(7) | 4,887 | 2,398 | 497 | 166 | 7,948 | - | 7,948 | 541 | ||||||||||||||||||||||||
Retired prescribed officer | - | - | - | - | - | - | - | - | ||||||||||||||||||||||||
| 63,302 | 27,060 | 7,834 | 28,894 | 127,090 | 64,772 | 191,862 | 13,069 | |||||||||||||||||||||||||
Total Executive Directors’ and Prescribed Officers’ remuneration ZAR | 83,969 | 38,737 | 11,767 | 33,422 | 167,895 | 64,772 | 232,667 | |||||||||||||||||||||||||
Total Executive Directors’ and Prescribed Officers’ remuneration USD | 5,719 | 2,638 | 802 | 2,277 | 11,436 | 4,412 | 15,848 | |||||||||||||||||||||||||
| (1) | Salaries are disclosed only for the period from or to which office is held, and include car allowances where applicable. |
| (2) | The performance related payments are calculated on the year’s financial results. |
| (3) | Includes health care, pension allowance, cash in lieu of dividends, vested CIP match awards, secondment / relocation allowances, group personal accident, disability and funeral cover. Surplus leave days accrued are automatically encashed unless work requirements allow for carry over. |
| (4) | For illustrative purposes only values have been converted using the average annual exchange rate for 2016: R14.6812:$1 (2015: R12.7719:$1; 2014: R10.8295: $1) to arrive at the US dollar equivalent. |
| (5) | No longer a prescribed officer with effect from 31 March 2016. |
| (6) | Benefits for 2016 include a dependent’s scholarship award of $2,500. |
| (7) | TR Sibisi commenced employment on 18 January 2016 and as such her pay reflects just over 11 months of the year. |
NON-EXECUTIVE DIRECTORS’ COMPENSATION
The fees of non-executive directors are fixed by shareholders at the annual general meeting and, other than the fees they receive for their participation on board committees and allowances for travelling internationally to attend board meetings, non-executive directors receive no further payments from the company and are precluded from participation in the company’s share incentive scheme.
NON-EXECUTIVE DIRECTORS’ REMUNERATION
| Director fees(1) | Committee fees(1) | Travel allowance(1) | Total | |||||||||||||
| US Dollars (‘000) | 2016 | |||||||||||||||
SM Pityana (Chairman) | 293,500 | 76,000 | 8,750 | 378,250 | ||||||||||||
AH Garner | 123,500 | 43,500 | 32,500 | 199,500 | ||||||||||||
LW Nkuhlu | 163,500 | 83,500 | 8,750 | 255,750 | ||||||||||||
MJ Kirkwood | 123,500 | 78,500 | 47,500 | 249,500 | ||||||||||||
NP January-Bardill | 123,500 | 56,000 | 10,000 | 189,500 | ||||||||||||
R Gasant | 123,500 | 58,500 | 11,250 | 193,250 | ||||||||||||
RJ Ruston | 123,500 | 56,000 | 51,250 | 230,750 | ||||||||||||
MDC Richter | 123,500 | 43,500 | 32,500 | 199,500 | ||||||||||||
DL Hodgson | 123,500 | 43,500 | 8,750 | 175,750 | ||||||||||||
Total | 1,321,500 | 539,000 | 211,250 | 2,071,750 | ||||||||||||
| (1) | Directors’ compensation is disclosed in US dollars, the amounts reflected are the values calculated using the exchange rate of R14.6812:$1 (2015: R12.7719:$1; 2014: R10.8295:$1). |
Non-Executive Directors do not hold service contracts with the company. Executive Directors do not receive payment of directors’ fees or committee fees.
| 6C. | BOARD PRACTICES |
The Board of Directors
The company is governed by a unitary board of directors, the composition of which promotes the balance of authority and precludes any one director from dominating decision-making. Our board membership at year-end comprised eleven directors, nine independent non-executive directors and two executive directors.
The board is supported by its committees and has delegated certain functions to these committees without abdicating any of its own responsibilities. This process of formal delegation involves approved and documented terms of reference, which are reviewed annually.
Refer Item 6A: “Directors and Senior Management” for information about the composition of the Board and directors’ term of office and year of appointment.
Appointment and rotation of directors
Several factors including the requirements of relevant legislation, best practice recommendations, qualifications and skills of a prospective board member and the requirements of the Director’s Fit and Proper Standards of the company, as well as regional demographics are considered in appointing board members. New directors are appointed pursuant to the recommendations of the Nominations Committee, which conducts a rigorous assessment of the credentials of each candidate. Newly appointed directors are elected at the next annual general meeting following their appointment and to stand for approval by shareholders.
In terms of the company’s Memorandum of Incorporation (MOI), one third of the directors are required to retire at each Annual General Meeting (AGM) and if they are eligible and available for re-election, will be put forward for re-election by the shareholders. The board has determined that the directors to stand for re-election at the AGM on 16 May 2017 are Sipho Pityana, Rodney Ruston, Lumikile Nkuhlu and Maria Richter.
The company’s Memorandum of Incorporation does not set a mandatory retirement age for non-executive directors. However, in accordance with recommendations of King III—any independent non-executive director serving more than nine years should be subjected to a rigorous review of his independence and performance by the board.
Service contracts
Prof LW Nkuhlu SM Pityana NP January-Bardill M Richter The meetings of the committee are attended by the Chief Executive Officer, Chief Financial Officer and Executive Vice President: Group Human Resources, except when their own remuneration or benefits are being discussed. Remuneration policy The remuneration policy is designed to allow AngloGold Ashanti to compete in a global market where we strive to retain and remunerate our employees using fair, robust and appropriate remuneration and reward for their contributions. Cost management and shareholder value remain fundamental drivers of the policy delivery. Linking pay and performance for our executives is important and by having a large portion of executive pay defined as at risk pay, the policy ensures that executive compensation is aligned with the overall performance of the company, the regions and the business units. The executives have an overriding focus on social sustainability including safety, and a large percentage of variable pay is directly linked to keeping our employees safe. Total reward When determining remuneration AngloGold Ashanti considers all elements of short- and long-term fixed and variable pay, and ensures that it is consistent with the overall strategic direction of the company and each employee’s individual performance. For a description of share-based compensation and awards see “Item 6E: Share Ownership”. Executive directors do not receive payment of directors fees or committee fees. Benchmarking Our executives and non-executives are benchmarked against a global group of competitors. AngloGold Ashanti’s size and complexity as well as each individual executive’s role are reviewed against the benchmark group from a base pay, benefits, guaranteed pay and variable pay perspective (which takes into consideration individual performance). The 2016 bespoke benchmark survey was completed by Mercer.
Our salary benchmarks are targeted at the market median of a global market; where there is a shortage of specialist and/or key technical skills higher than the benchmark median is paid.
Each executive’s role is individually sized to ensure the best match possible. The comparison is done on the same or similar roles irrespective of place of work (including a review of purchasing power parity between countries). Each component of remuneration (base salary, short-term incentives, long-term incentives, Co-investment plan and employee benefits and allowances) is analysed and compared with the benchmarks and the overall package is reviewed accordingly.
Retirement benefits/pension
Retirement benefits are granted to all executives. All new executives and employees receive retirement benefits under defined contribution plans. There are no longer any executives in the legacy defined benefit plans. Contributions vary based on the employee’s retirement plan.
EXECUTIVE DIRECTORS’ AND EXECUTIVE MANAGEMENT REMUNERATION
| Salary(1) | Performance related payments (2) | Pension scheme benefits | Other benefits and encashed leave(3) | Sub total | Pre-tax gain on share options | Total | Total | |||||||||||||||||||||||||
| Figures in thousands | 2016 | SA Rands | US Dollars(4) | |||||||||||||||||||||||||||||
Executive Directors | ||||||||||||||||||||||||||||||||
S Venkatakrishnan | 12,660 | 7,323 | 3,133 | 3,785 | 26,901 | - | 26,901 | 1,832 | ||||||||||||||||||||||||
KC Ramon | 8,007 | 4,354 | 800 | 743 | 13,904 | - | 13,904 | 947 | ||||||||||||||||||||||||
Resigned executive director | - | - | - | - | - | - | - | - | ||||||||||||||||||||||||
| 20,667 | 11,677 | 3,933 | 4,528 | 40,805 | - | 40,805 | 2,779 | |||||||||||||||||||||||||
Prescribed Officers | ||||||||||||||||||||||||||||||||
I Boninelli(5) | 1,607 | - | 161 | 10,124 | 11,892 | 24,995 | 36,887 | 2,513 | ||||||||||||||||||||||||
CE Carter(6) | 10,180 | 4,439 | 1,523 | 2,058 | 18,200 | 4,342 | 22,542 | 1,535 | ||||||||||||||||||||||||
GJ Ehm | 9,466 | 3,740 | 381 | 3,781 | 17,368 | 7,480 | 24,848 | 1,693 | ||||||||||||||||||||||||
RW Largent | 17,722 | 7,728 | 3,314 | 5,810 | 34,574 | 16,291 | 50,865 | 3,465 | ||||||||||||||||||||||||
DC Noko | 6,432 | 2,805 | 643 | 4,227 | 14,107 | - | 14,107 | 961 | ||||||||||||||||||||||||
ME Sanz Perez | 6,404 | 2,985 | 641 | 2,389 | 12,419 | 11,664 | 24,083 | 1,640 | ||||||||||||||||||||||||
CB Sheppard | 6,604 | 2,965 | 674 | 339 | 10,582 | - | 10,582 | 721 | ||||||||||||||||||||||||
TR Sibisi(7) | 4,887 | 2,398 | 497 | 166 | 7,948 | - | 7,948 | 541 | ||||||||||||||||||||||||
Retired prescribed officer | - | - | - | - | - | - | - | - | ||||||||||||||||||||||||
| 63,302 | 27,060 | 7,834 | 28,894 | 127,090 | 64,772 | 191,862 | 13,069 | |||||||||||||||||||||||||
Total Executive Directors’ and Prescribed Officers’ remuneration ZAR | 83,969 | 38,737 | 11,767 | 33,422 | 167,895 | 64,772 | 232,667 | |||||||||||||||||||||||||
Total Executive Directors’ and Prescribed Officers’ remuneration USD | 5,719 | 2,638 | 802 | 2,277 | 11,436 | 4,412 | 15,848 | |||||||||||||||||||||||||
| (1) | Salaries are disclosed only for the period from or to which office is held, and include car allowances where applicable. |
| (2) | The performance related payments are calculated on the year’s financial results. |
| (3) | Includes health care, pension allowance, cash in lieu of dividends, vested CIP match awards, secondment / relocation allowances, group personal accident, disability and funeral cover. Surplus leave days accrued are automatically encashed unless work requirements allow for carry over. |
| (4) | For illustrative purposes only values have been converted using the average annual exchange rate for 2016: R14.6812:$1 (2015: R12.7719:$1; 2014: R10.8295: $1) to arrive at the US dollar equivalent. |
| (5) | No longer a prescribed officer with effect from 31 March 2016. |
| (6) | Benefits for 2016 include a dependent’s scholarship award of $2,500. |
| (7) | TR Sibisi commenced employment on 18 January 2016 and as such her pay reflects just over 11 months of the year. |
NON-EXECUTIVE DIRECTORS’ COMPENSATION
The fees of non-executive directors are fixed by shareholders at the annual general meeting and, other than the fees they receive for their participation on board committees and allowances for travelling internationally to attend board meetings, non-executive directors receive no further payments from the company and are precluded from participation in the company’s share incentive scheme.
NON-EXECUTIVE DIRECTORS’ REMUNERATION
| Director fees(1) | Committee fees(1) | Travel allowance(1) | Total | |||||||||||||
| US Dollars (‘000) | 2016 | |||||||||||||||
SM Pityana (Chairman) | 293,500 | 76,000 | 8,750 | 378,250 | ||||||||||||
AH Garner | 123,500 | 43,500 | 32,500 | 199,500 | ||||||||||||
LW Nkuhlu | 163,500 | 83,500 | 8,750 | 255,750 | ||||||||||||
MJ Kirkwood | 123,500 | 78,500 | 47,500 | 249,500 | ||||||||||||
NP January-Bardill | 123,500 | 56,000 | 10,000 | 189,500 | ||||||||||||
R Gasant | 123,500 | 58,500 | 11,250 | 193,250 | ||||||||||||
RJ Ruston | 123,500 | 56,000 | 51,250 | 230,750 | ||||||||||||
MDC Richter | 123,500 | 43,500 | 32,500 | 199,500 | ||||||||||||
DL Hodgson | 123,500 | 43,500 | 8,750 | 175,750 | ||||||||||||
Total | 1,321,500 | 539,000 | 211,250 | 2,071,750 | ||||||||||||
| (1) | Directors’ compensation is disclosed in US dollars, the amounts reflected are the values calculated using the exchange rate of R14.6812:$1 (2015: R12.7719:$1; 2014: R10.8295:$1). |
Non-Executive Directors do not hold service contracts with the company. Executive Directors do not receive payment of directors’ fees or committee fees.
| 6C. | BOARD PRACTICES |
The Board of Directors
On 17 February 2014, Tito Mboweni stepped down as ChairmanThe company is governed by a unitary board of directors, the composition of which promotes the balance of authority and precludes any one director from dominating decision-making. Our board membership at year-end comprised eleven directors, nine independent non-executive directors and two executive directors.
The board is supported by its committees and has delegated certain functions to these committees without abdicating any of its own responsibilities. This process of formal delegation involves approved and documented terms of reference, which are reviewed annually.
Refer Item 6A: “Directors and Senior Management” for information about the composition of the Board and resigned as Non-Executive Director. Sipho Pityana was elected as Chairman bydirectors’ term of office and year of appointment.
Appointment and rotation of directors
Several factors including the Board. Professor Wiseman Nkuhlu assumedrequirements of relevant legislation, best practice recommendations, qualifications and skills of a prospective board member and the new role of Lead Independent Directorrequirements of the board. During March 2014, Prof. Wiseman Nkuhlu wasDirector’s Fit and Proper Standards of the company, as well as regional demographics are considered in appointing board members. New directors are appointed Deputy Chairman.
David Hodgson waspursuant to the recommendations of the Nominations Committee, which conducts a rigorous assessment of the credentials of each candidate. Newly appointed as Independent Non-Executive Director with effect from 25 April 2014.
Albert Garner and Maria Richter were appointed Independent Non-Executive Directors with effect from 1 January 2015.
The following directors retiredare elected at the Annual General Meeting on 14 May 2014next annual general meeting following their appointment and being eligibleto stand for re-election were re-electedapproval by the shareholders: Rhidwaan Gasant, Sipho Pityana and Tito Mboweni. Tito Mboweni did not make himself available for re-election.shareholders.
In terms of the company’s Memorandum of Incorporation (MOI), one third of the following directors willare required to retire at theeach Annual General Meeting (AGM) and if they are eligible and available for re-election, will be put forward for re-election by the shareholders. The board has determined that the directors to be heldstand for re-election at the AGM on 616 May 2015: Prof Wiseman Nkuhlu, Nazipho January-Bardill and2017 are Sipho Pityana, Rodney Ruston, Lumikile Nkuhlu and are eligibleMaria Richter.
The company’s Memorandum of Incorporation does not set a mandatory retirement age for re-election.non-executive directors. However, in accordance with recommendations of King III—any independent non-executive director serving more than nine years should be subjected to a rigorous review of his independence and performance by the board.
EXECUTIVE COMMITTEE
AngloGold Ashanti’s executive management team (Executive Committee) comprises nine members of whom two are executive directors. This committee oversees the day-to-day management of the group’s activities and is supported by country and regional management teams as well as by group corporate functions.
In addition to Srinivasan Venkatakrishnan and Christine Ramon, the following people are members of the Executive Committee:
Mike O’Hare (55)Service contracts
BSc (Min. Eng.)
Chief Operating Officer – South Africa
As the Chief Operations Officer – South Africa, Mike’s portfolio includes three operating areas (West Wits, Vaal River and Surface Operations). He also leads the company’s innovative technology project in South Africa. He has 38 years’ experience in mining, having joined Anglo American in 1977, and has knowledge and skills of deep underground mining that are highly regarded globally.
173
Italia Boninelli (58)
MA (Psychology), Post Graduate Diploma in Labour Relations
Executive Vice President – People and Organisational Development
Holding the portfolio of Human Resources, Italia is responsible for the global people strategy at AngloGold Ashanti where it is well recognised that ‘people are the business, and our business is people’. With more than 25 years’ experience in human resources across a variety of industries, including mining, manufacturing, healthcare and banking, Italia brings a wealth of knowledge, particularly in the labour field, which is crucial to domestic and international operations. She joined the group in 2010 and is responsible for building a highly engaged and productive workforce.
Charles Carter (52)
BA (Hons), DPhil, EDP
Executive Vice President – Strategy and Business Development
Charles is responsible for group strategy, business development, corporate finance, investor relations and communications portfolios. He has worked in the mining industry in South Africa and the Americas for more than 24 years and has had responsibility for a range of additional portfolios that include human resources, risk management, business planning and executive responsibility for the company’s business in Colombia.
Graham Ehm (58)
BSc Hons, MAusIMM, MAICD
Executive Vice President – Planning and Technical
Graham, who has multi-commodity experience, has held senior leadership positions in AngloGold Ashanti in Tanzania and Australia. His current portfolio entails safety, business process framework (BPF), risk, asset optimisation, capital investment optimisation and monitoring of projects, studies and exploration. The Planning and Technical portfolio is his accountability.
Ron Largent (54)
BSc (Min. Eng.), MBA
Chief Operating Officer – International
Ron has more than 30 years’ experience in international mining operations and project management. He joined the organisation in 1994 as Manager, Gold Operations for Cripple Creek & Victor, and was promoted to Executive Vice President – Americas in 2007. He was subsequently promoted to Chief Operations Officer – International in 2013, and his portfolio was extended to include Continental Africa. Effective January 2014, Australia was also included in his remit. He is currently accountable for overall strategic and operational responsibilities for production at the company’s mining operations across four continents and nine countries. In addition, he leads a team mandated to remove $500m from the group’s operating cost base within an 18-month period ended December 2014.
David Noko (57)
MBA, Post Graduate Diploma in Company Direction; Higher National Diploma – Engineering
Executive Vice President: Sustainability
David leads the sustainability portfolio which comprises the disciplines of health, the environment, social and community affairs, corporate social investment, human rights, global security, stakeholder engagement and government relations. In this role he sets the company sustainability direction and strategy and positions the company externally as a leader within the global sustainability landscape. He has extensive experience both within the mining industry and beyond, having been in leadership roles at South African Breweries, Pepsi Cola, Air Chefs and De Beers Consolidated Mines Limited prior to joining AngloGold Ashanti in 2012.
Maria Sanz Perez (49)
BCom LLB, H Dip Tax, Admitted Attorney
Executive Vice President: Legal, Commercial and Governance and Company Secretary
Maria partners with the company’s business leaders to ensure AngloGold Ashanti complies with legal requirements across the group. Other responsibilities are compliance, company secretarial functions, integrated reporting and corporate cost reduction. She is also accountable for the legal and commerciall aspects of global procurement. Maria has been with the group since 2011 and has worked in similar positions for leading South African companies in her career including Investec, Sappi and Afrox.
174
Executive Committee movements subsequent to year end
Chris Sheppard, a thirty-year veteran of South Africa’s ultra-deep underground mining sector, has been appointed as incoming Chief Operating Officer: South Africa. He will replace the incumbent Mike O’Hare who plans to take early retirement during the course of 2015. Chris’ appointment as Chief Operating Officer: South Africa will be effective 1 June 2015 at which point he will also join the Company’s executive committee. Mike will support Chris during the course of the year to facilitate an orderly handover.
COMPETENT PERSONS
As part of its suite of annual reports, AngloGold Ashanti produces a Mineral Resource and Ore Reserve Statement and all the information in this report that relates to Exploration Results, Mineral Resources and Ore Reserve is based on information compiled by the Competent Persons.
During the past decade, the company has developed and implemented a system of internal and external reviews aimed at providing assurance in respect of Ore Reserve and Mineral Resource estimates. A documented chain of responsibility exists from the Competent Persons at the operations to the Company’s Mineral Resource and Ore Reserve Steering Committee. Accordingly, the Chairman of the AngloGold Ashanti Mineral Resource and Ore Reserve Steering Committee, Mr VA Chamberlain, assumes responsibility for the Mineral Resource and Ore Reserve processes for AngloGold Ashanti and is satisfied that the Competent Persons have fulfilled their responsibilities.
VA Chamberlain (52)
MSc (Mining Engineering), BSc (Hons) (Geology), FAusIMM
Vaughan holds a Bachelor of Science (Honours) degree in Geology from the University of Natal and a Master’s degree in Mining Engineering from the University of the Witwatersrand. He started his career with Anglo American Corporation in 1987 as a geologist at Western Deep Levels East Mine (now TauTona mine). He joined AngloGold in 1998 and currently holds the position of Senior Vice President: Strategic Technical Group and is Chairman of the AngloGold Ashanti Mineral Resource and Ore Reserve Steering Committee.
175
|
REMUNERATION AND HUMAN RESOURCES COMMITTEE
Remuneration and Human Resources Committee (Remco)
The Remco comprises of non-executive directors and the purpose of the committee is to discharge the responsibilities of the board relating to all compensation, including all salary and equity compensation of the company’s executives. The committee establishes and administers the company’s executive remuneration with the broad objective of aligning executive remuneration with company performance and shareholder interests, setting remuneration standards aimed at attracting, motivating and retaining a competent executive team, linking individual pay with operational and company performance in relation to strategic objectives; and evaluating compensation of executives including approval of salary, equity and incentive based awards. With respect to its mandate on human resources the committee has oversight to all strategic aspects of people development and human resource issues. The committee also considers and makes recommendations to shareholders on non-executive director’s fees.
The performance of the executive team, including the executive directors, is considered relative to the prevailing business climate and market conditions, as well as to annual evaluations of the achievement of key performance objectives. Bonuses paid to the executives are a reflection of performance of each of the executives and the company as a whole.
The members of the committee during 2014 are reflected below:
Members
MJ Kirkwood (Chairman)
Prof LW Nkuhlu
SM Pityana
NP January-Bardill
M Richter
The meetings of the committee are attended by the Chief Executive Officer, Chief Financial Officer and Executive Vice President: People and Organisational Development,Group Human Resources, except when their own remuneration or benefits are being discussed.
Remuneration policy
The remuneration policy is designed to allow usAngloGold Ashanti to compete in a global market where we strive to retain and remunerate our employees using fair, robust and appropriate remuneration and reward for their contributions. Recognising that costCost management and shareholder value areremain fundamental drivers of the policy delivery, remain a focus.delivery.
Linking pay and performance for our executives is important and by having a large portion of executive pay defined as at risk pay, we are ensuringthe policy ensures that executive compensation is aligned with the overall performance of the company, the regions and the business units and that theunits. The executives have an overriding focus on social sustainability including safety, asand a large percentage of their variable pay is directly linked to keeping our employees safe.
Total reward
When determining remuneration AngloGold Ashanti considers all elements of short- and long-term fixed and variable pay, and ensures that it is consistent with the overall strategic direction of the organisationcompany and the performanceeach employee’s individual performance.
For a description of the organisationshare-based compensation and the individuals.awards see “Item 6E: Share Ownership”.
Executive directors do not receive payment of directors fees or committee fees.
Benchmarking
Our executives and non-executives are benchmarked against a global group of competitors. AngloGold Ashanti’s size and complexity as well as each individual executive’s role and personal performance are reviewed against the benchmark group from a base pay, benefits, guaranteed pay and variable pay perspective.perspective (which takes into consideration individual performance). The 20142016 bespoke benchmark survey was completed by Mercer Consulting (South Africa) (Pty) LimitedMercer.
Our salary benchmarks are targeted at the market median of a global market; where there is a shortage of specialist and/or key technical skills higher than the benchmark median is paid.
176
Each executive’s role is individually sized to ensure the best match possible. The comparison is done on the same or similar roles irrespective of place of work (including a review of purchasing power parity between countries). Each component of remuneration (base salary, short-term incentives, long-term incentives, Co-investment executive share plan and employee benefits and allowances) is analysed and compared with the benchmarks and the overall package is reviewed accordingly.
Retirement benefits/pension
Retirement benefits are granted to all executives. All new executives and employees receive retirement benefits under defined contribution plans. Legacy defined benefit plans remainThere are no longer any executives in place for some executives. Contributions vary from those prescribed by the USA 401(k) defined contribution fund, to the legacy defined benefit plans. Contributions vary based on the employee’s retirement plan.
177
EXECUTIVE DIRECTORS’ AND EXECUTIVE MANAGEMENT REMUNERATION
2014
| All figures in $000(1) |
|
|
|
|
|
|
|
|
| |||||||||||||||||||||||||
S Venkatakrishnan(5) | Full year | 1,108 | - | 274 | 106 | 1,488 | - | 1,488 | ||||||||||||||||||||||||||
RN Duffy(6) | 30 September 2014 | 649 | 234 | 133 | 14 | 1,030 | - | 1,030 | ||||||||||||||||||||||||||
KC Ramon(7) | 1 October 2014 | 162 | 119 | 20 | 1 | 302 | - | 302 | ||||||||||||||||||||||||||
Total executive directors | 1,919 | 353 | 427 | 121 | 2,820 | - | 2,820 | |||||||||||||||||||||||||||
Prescribed officers | ||||||||||||||||||||||||||||||||||
I Boninelli | Full year | 528 | 265 | 56 | 9 | 858 | - | 858 | ||||||||||||||||||||||||||
CE Carter(8) | Full year | 636 | 281 | 68 | 96 | 1,081 | 80 | 1,161 | ||||||||||||||||||||||||||
GJ Ehm(15) | Full year | 742 | 669 | 27 | 1,013 | 2,452 | 93 | 2,544 | ||||||||||||||||||||||||||
RW Largent(9) | Full year | 1,155 | 611 | 19 | 498 | 2,283 | 89 | 2,372 | ||||||||||||||||||||||||||
DC Noko | Full year | 516 | 477 | 55 | 68 | 1,116 | - | 1,116 | ||||||||||||||||||||||||||
MP O’ Hare | Full year | 680 | 321 | 139 | 11 | 1,151 | - | 1,151 | ||||||||||||||||||||||||||
ME Sanz Perez | Full year | 526 | 369 | 56 | 15 | 966 | - | 966 | ||||||||||||||||||||||||||
YZ Simelane(10) | Full year | 31 July 2014 | 206 | - | 46 | 1,072 | 1,324 | 386 | 1,710 | |||||||||||||||||||||||||
Total Prescribed Officers | 4,989 | 2,993 | 466 | 2,782 | 11,230 | 648 | 11,878 | |||||||||||||||||||||||||||
Total executive director and management remuneration 2014 | 6,908 | 3,346 | 893 | 2,903 | 14,050 | 648 | 14,698 | |||||||||||||||||||||||||||
2013
| All figures in $000(1) |
|
|
|
|
|
|
|
|
| |||||||||||||||||||||||||
M Cutifani | Full year | 31 March 2013 | 378 | - | 69 | 199 | 646 | 2,005 | 2,651 | |||||||||||||||||||||||||
RN Duffy | Full year | 685 | 276 | 139 | 16 | 1,116 | - | 1,116 | ||||||||||||||||||||||||||
AM O’Neil(11) | 20 February 2013 | 2 August 2013 | 1,066 | - | 15 | 537 | 1,618 | 1,914 | 3,532 | |||||||||||||||||||||||||
S Venkatakrishnan | Full year | 1,365 | - | 281 | 220 | 1,866 | - | 1,866 | ||||||||||||||||||||||||||
Total executive directors | 3,494 | 276 | 504 | 972 | 5,246 | 3,919 | 9,165 | |||||||||||||||||||||||||||
Prescribed officers | ||||||||||||||||||||||||||||||||||
I Boninelli | Full year | 540 | 384 | 57 | 6 | 987 | - | 987 | ||||||||||||||||||||||||||
CE Carter | Full year | 671 | 232 | 71 | 51 | 1,025 | 317 | 1,342 | ||||||||||||||||||||||||||
GJ Ehm | Full year | 764 | 461 | 24 | 8 | 1,257 | - | 1,257 | ||||||||||||||||||||||||||
RW Largent | Full year | 1,043 | 453 | 173 | 275 | 1,944 | 307 | 2,251 | ||||||||||||||||||||||||||
M MacFarlane(12) (13) | 30 June 2013 | 238 | - | 30 | 350 | 618 | - | 618 | ||||||||||||||||||||||||||
DC Noko | Full year | 498 | 187 | 53 | 1 | 739 | - | 739 | ||||||||||||||||||||||||||
MP O’Hare(14) | Full year | 696 | 283 | 141 | 12 | 1,132 | 54 | 1,186 | ||||||||||||||||||||||||||
ME Sanz Perez | Full year | 505 | 371 | 54 | 6 | 936 | - | 936 | ||||||||||||||||||||||||||
YZ Simelane | Full year | 402 | 94 | 82 | 22 | 600 | - | 600 | ||||||||||||||||||||||||||
Total Prescribed Officers | 5,357 | 2,465 | 685 | 731 | 9,238 | 678 | 9,916 | |||||||||||||||||||||||||||
Total executive director and management remuneration 2013 | 8,851 | 2,741 | 1,189 | 1,703 | 14,484 | 4,597 | 19,081 | |||||||||||||||||||||||||||
| Salary(1) | Performance related payments (2) | Pension scheme benefits | Other benefits and encashed leave(3) | Sub total | Pre-tax gain on share options | Total | Total | |||||||||||||||||||||||||
| Figures in thousands | 2016 | SA Rands | US Dollars(4) | |||||||||||||||||||||||||||||
Executive Directors | ||||||||||||||||||||||||||||||||
S Venkatakrishnan | 12,660 | 7,323 | 3,133 | 3,785 | 26,901 | - | 26,901 | 1,832 | ||||||||||||||||||||||||
KC Ramon | 8,007 | 4,354 | 800 | 743 | 13,904 | - | 13,904 | 947 | ||||||||||||||||||||||||
Resigned executive director | - | - | - | - | - | - | - | - | ||||||||||||||||||||||||
| 20,667 | 11,677 | 3,933 | 4,528 | 40,805 | - | 40,805 | 2,779 | |||||||||||||||||||||||||
Prescribed Officers | ||||||||||||||||||||||||||||||||
I Boninelli(5) | 1,607 | - | 161 | 10,124 | 11,892 | 24,995 | 36,887 | 2,513 | ||||||||||||||||||||||||
CE Carter(6) | 10,180 | 4,439 | 1,523 | 2,058 | 18,200 | 4,342 | 22,542 | 1,535 | ||||||||||||||||||||||||
GJ Ehm | 9,466 | 3,740 | 381 | 3,781 | 17,368 | 7,480 | 24,848 | 1,693 | ||||||||||||||||||||||||
RW Largent | 17,722 | 7,728 | 3,314 | 5,810 | 34,574 | 16,291 | 50,865 | 3,465 | ||||||||||||||||||||||||
DC Noko | 6,432 | 2,805 | 643 | 4,227 | 14,107 | - | 14,107 | 961 | ||||||||||||||||||||||||
ME Sanz Perez | 6,404 | 2,985 | 641 | 2,389 | 12,419 | 11,664 | 24,083 | 1,640 | ||||||||||||||||||||||||
CB Sheppard | 6,604 | 2,965 | 674 | 339 | 10,582 | - | 10,582 | 721 | ||||||||||||||||||||||||
TR Sibisi(7) | 4,887 | 2,398 | 497 | 166 | 7,948 | - | 7,948 | 541 | ||||||||||||||||||||||||
Retired prescribed officer | - | - | - | - | - | - | - | - | ||||||||||||||||||||||||
| 63,302 | 27,060 | 7,834 | 28,894 | 127,090 | 64,772 | 191,862 | 13,069 | |||||||||||||||||||||||||
Total Executive Directors’ and Prescribed Officers’ remuneration ZAR | 83,969 | 38,737 | 11,767 | 33,422 | 167,895 | 64,772 | 232,667 | |||||||||||||||||||||||||
Total Executive Directors’ and Prescribed Officers’ remuneration USD | 5,719 | 2,638 | 802 | 2,277 | 11,436 | 4,412 | 15,848 | |||||||||||||||||||||||||
| (1) |
|
Salaries are disclosed only for the period from or to which office is |
The performance related payments are calculated on the year’s financial results. |
Includes health care, |
| (4) | For illustrative purposes only values have been converted using the average annual exchange rate for 2016: R14.6812:$1 (2015: R12.7719:$1; 2014: R10.8295: $1) to arrive at the US dollar equivalent. |
| (5) |
|
| (6) |
|
| (7) |
|
|
|
|
|
|
|
|
|
Rounding of figures may result in computational discrepancies.
178
EXECUTIVE DIRECTORS’ AND EXECUTIVE MANAGEMENT ONCE-OFF RETENTION BONUS PAYMENT
Appointed with effect from | Resigned/retired with effect from | Cash Retention Bonus $’000 | Long Term Incentive Plan - Retention Bonus Share Awards Number of shares | |||||||||||
Executive directors | ||||||||||||||
S Venkatakrishnan(1) | Full year | - | 23,687 | |||||||||||
RN Duffy | 30-Sep-14 | 243 | 17,458 | |||||||||||
| 243 | 41,145 | |||||||||||||
Prescribed officers | ||||||||||||||
I Boninelli | Full year | 192 | 13,777 | |||||||||||
CE Carter | Full year | 239 | 17,106 | |||||||||||
GJ Ehm | Full year | 248 | 15,469 | |||||||||||
RW Largent | Full year | 372 | 20,185 | |||||||||||
DC Noko | Full year | 177 | 12,697 | |||||||||||
MP O’Hare | Full year | 247 | 17,744 | |||||||||||
ME Sanz Perez | Full year | 170 | 12,177 | |||||||||||
| 1,645 | 109,155 | |||||||||||||
| 1,888 | 150,300 | |||||||||||||
|
NON-EXECUTIVE DIRECTORS’ COMPENSATION
The fees of non-executive directors are fixed by shareholders at the annual general meeting and, other than the fees they receive for their participation on board committees and allowances for travelingtravelling internationally to attend board meetings, non-executive directors receive no further payments from the company and are precluded from participation in the company’s share incentive scheme.
NON-EXECUTIVE DIRECTORS’ REMUNERATION
| 2014 | 2013 | |||||||||||||||||||||||||||||||||||
All figures stated to the nearest $000(1) | Appointment | Directors’ fees(3) | Committee fees | Travel | Total | Directors’ fees(3) | Committee fees | Travel | Total | |||||||||||||||||||||||||||
| From(2) | To(2) | |||||||||||||||||||||||||||||||||||
S M Pityana (Chairman)(2) | 334 | 86 | 10 | 430 | 88 | 98 | - | 186 | ||||||||||||||||||||||||||||
T T Mboweni(3) | 17 Feb 2014 | 50 | 25 | - | 75 | 292 | 52 | - | 344 | |||||||||||||||||||||||||||
FB Arisman | 13 May 2013 | - | - | - | - | 60 | 51 | 9 | 120 | |||||||||||||||||||||||||||
R Gasant | 117 | 63 | 8 | 188 | 72 | 59 | - | 131 | ||||||||||||||||||||||||||||
NP January-Bardill | 117 | 60 | 10 | 187 | 70 | 70 | - | 140 | ||||||||||||||||||||||||||||
MJ Kirkwood | 1 June 2012 | 121 | 91 | 51 | 263 | 107 | 112 | 47 | 266 | |||||||||||||||||||||||||||
WA Nairn | 13 May 2013 | - | - | - | - | 39 | 32 | - | 71 | |||||||||||||||||||||||||||
Prof LW Nkuhlu(4) | 148 | 90 | 8 | 246 | 72 | 112 | - | 184 | ||||||||||||||||||||||||||||
F Ohene-Kena | 13 May 2013 | - | - | - | 25 | 13 | 16 | 54 | ||||||||||||||||||||||||||||
RJ Ruston | 117 | 81 | 42 | 240 | 83 | 121 | 47 | 251 | ||||||||||||||||||||||||||||
DL Hodgson | 88 | 27 | 10 | 125 | ||||||||||||||||||||||||||||||||
Total – non-executive directors | 1,092 | 523 | 139 | 1,754 | 883 | 790 | 119 | 1,747 | ||||||||||||||||||||||||||||
| Director fees(1) | Committee fees(1) | Travel allowance(1) | Total | |||||||||||||
| US Dollars (‘000) | 2016 | |||||||||||||||
SM Pityana (Chairman) | 293,500 | 76,000 | 8,750 | 378,250 | ||||||||||||
AH Garner | 123,500 | 43,500 | 32,500 | 199,500 | ||||||||||||
LW Nkuhlu | 163,500 | 83,500 | 8,750 | 255,750 | ||||||||||||
MJ Kirkwood | 123,500 | 78,500 | 47,500 | 249,500 | ||||||||||||
NP January-Bardill | 123,500 | 56,000 | 10,000 | 189,500 | ||||||||||||
R Gasant | 123,500 | 58,500 | 11,250 | 193,250 | ||||||||||||
RJ Ruston | 123,500 | 56,000 | 51,250 | 230,750 | ||||||||||||
MDC Richter | 123,500 | 43,500 | 32,500 | 199,500 | ||||||||||||
DL Hodgson | 123,500 | 43,500 | 8,750 | 175,750 | ||||||||||||
Total | 1,321,500 | 539,000 | 211,250 | 2,071,750 | ||||||||||||
| (1) | Directors’ compensation is disclosed in US dollars, the amounts reflected are the values calculated using the exchange rate of |
|
|
|
Rounding may result in computational differences.Non-Executive Directors do not hold service contracts with the company. Executive Directors do not receive payment of directors’ fees or committee fees.
179
| 6C. | BOARD PRACTICES |
The Board of Directors
The company is governed by a unitary board of directors, the composition of which promotes the balance of authority and precludes any one director from dominating decision-making. Our board membership at year-end comprised nineeleven directors, sevennine independent non-executive directors and two executive directors. Post yearend, the appointment of an additional two directors became effective.
The board is supported by its committees and has delegated certain functions to these committees without abdicating any of its own responsibilities. This process of formal delegation involves approved and documented terms of reference, which are reviewed annually.
Refer Item 6A: “Directors and Senior Management” for information about the composition of the Board Composition.and directors’ term of office and year of appointment.
Appointment and rotation of directors
Several factors including the requirements of relevant legislation, best practice recommendations, qualifications and skills of a prospective board member and the requirements of the Director’s Fit and Proper Standards of the company, as well as regional demographics are considered in appointing board members. New directors are appointed pursuant to the recommendations of the Nominations Committee, which conducts a rigorous assessment of the credentials of each candidate. Newly appointed directors are elected at the next annual general meeting following their appointment and to stand for approval by shareholders.
In terms of the company’s Memorandum of Incorporation (MOI), one third of the directors are required to retire at each Annual General Meeting (AGM) and if they are eligible and available for reelection,re-election, will be put forward for re-election by the shareholders. The board has determined that the directors to stand for re-election at the AGM on 16 May 2017 are Nozipho January-Bardill, Professor WisemanSipho Pityana, Rodney Ruston, Lumikile Nkuhlu and Rodney Ruston.Maria Richter.
The company’s Memorandum of Incorporation does not set a mandatory retirement age for non-executive directors. However, in accordance with recommendations of King III – III—any independent non-executive director serving more than 9nine years should be subjected to a rigorous review of his independence and performance by the board, and the requirements of the Sarbanes Oxley Act, directors are required to step down from the board after nine consecutive years of service. As at 31 December 2014, none of the company’s independent directors had served for that length of time.board.
Service contracts
Non- ExecutiveNon-Executive Directors
Non-executive directors receive fees for their services as directors which are approved by shareholders at annual general meetings. Non-executive directors do not participate in the company’s share incentive scheme.
Non-executive directors do not hold service contracts with the company.
Executive Committee
All members of the Executive Management team have permanent employment contracts which entitle them to standard group benefits as defined by their specific region and participation in the company’s Bonus Share Plan, and the Long-Term Incentive Plan. All recently updated executive contracts include details on participation in the Co-Investment Plan and the applicable Minimum Share Holding Requirement.Plan.
South AfricanAfrican-based executives (with the exceptionare paid a portion of the CEO and the newly appointed CFO who are remunerated 100% in South Africa) have an off-shore retainertheir remuneration offshore, which is detailed under a separate contract. This reflects the percentageglobal roles and responsibilities and takes account of their time focused on offshore business requirements. The off-shore pay is capped at a maximum of 15% of base pay and as it is a retainer, it is not pensionable.
The Executive Management teamexecutive contracts are reviewed annually and currently continue to include a change of control provision. The change of control is subject to the following triggers:
The acquisition of all or part of AngloGold Ashanti; or
A number of shareholders holding less than 35%thirty-five percent of the company’s issued share capital consorting to gain a majority of the board and make management decisions; and
The contracts of Executive Management team Committee members are either terminated or their role and employment conditions are curtailed.
180
In the event of a change of control becoming effective, the executive will in certain circumstances be subject to both the notice period and the change of control contract terms. The notice period applied per category of executive and the change of control periods as at 31 December 20142016 were as follows:
Executive committee member | Notice period | Change of control | ||
Chief Executive Officer | 12 months | 12 months | ||
Chief Financial Officer | 6 months | 6 months | ||
Other Executive Management team members | 6 months | 6 months |
Key activities of the board and committees during 20142016
The activities of the board and committees during 20142016 were aimed at promoting the economic stability of the business. This entailed ensuring that its operations were conducted with due regard to the expectations and needs of stakeholders, the safety and health of employees and communities, and the development of systems to ensure proper access to and dissemination of credible information.
Board and committee meeting attendance
The composition of the board and committees at the date of this report and attendance at meetings during 20142016 are disclosed in the table below:
| ||||||||||||||||||||||||||||||||||||||||
| ||||||||||||||||||||||||||||||||||||||||
| ||||||||||||||||||||||||||||||||||||||||
| ||||||||||||||||||||||||||||||||||||||||
| ||||||||||||||||||||||||||||||||||||||||
| ||||||||||||||||||||||||||||||||||||||||
| ||||||||||||||||||||||||||||||||||||||||
| ||||||||||||||||||||||||||||||||||||||||
| ||||||||||||||||||||||||||||||||||||||||
| ||||||||||||||||||||||||||||||||||||||||
| ||||||||||||||||||||||||||||||||||||||||
|
|
|
|
|
|
|
|
|
|
|
|
|
| Board | Audit and Risk | Investment | Remuneration and Human Resources | Social, Ethics and Sustainability | Nomination | |||||||||||||||||||
No of Meetings in 2016 | 8 | 5 | 4 | 4 | 5 | 3 | ||||||||||||||||||
SM Pityana | 8 | n/a | n/a | 4 | 5 | 3 | ||||||||||||||||||
LW Nkuhlu | 8 | 5 | 4 | 4 | n/a | 3 | ||||||||||||||||||
R Gasant | 8 | 5 | 4 | n/a | n/a | n/a | ||||||||||||||||||
DL Hodgson | 8 | n/a | 4 | n/a | 5 | n/a | ||||||||||||||||||
NP January-Bardill | 8 | n/a | n/a | 4 | 5 | n/a | ||||||||||||||||||
MJ Kirkwood | 8 | 5 | n/a | 4 | n/a | 3 | ||||||||||||||||||
AH Garner | 8 | 5 | 4 | n/a | n/a | n/a | ||||||||||||||||||
RJ Ruston | 8 | 5 | 4 | n/a | n/a | n/a | ||||||||||||||||||
MDC Richter | 8 | 5 | n/a | 4 | n/a | n/a | ||||||||||||||||||
S Venkatakrishnan | 8 | n/a | n/a | n/a | 5 | n/a | ||||||||||||||||||
KC Ramon | 8 | n/a | 4 | n/a | n/a | n/a | ||||||||||||||||||
Audit and Risk Committee
The Audit and Risk Committee comprises foursix independent Non-Executive Directors who collectively possess the skills and knowledge to oversee and assess the strategies and processes developed and implemented by management to manage the business within a continually evolving mining environment.
181
As part of a reorganisation of the governance structures within AngloGold Ashanti, the accountability for oversight of risk management and information technology governance became part of the mandate of the Audit and Risk Committee during 2014.
The Audit and Risk Committee’s duties as required by section 94(2) of the Companies Act, King III and JSE Listing requirements are set out in its board-approved terms of reference which is reviewed and updated annually. These duties were discharged as follows:
reviewed the quarterly market updates and the half year results;
confirmed the integrity of the group’s integrated reportingIntegrated Report, Annual Financial Statements and annualthe Form 20-F;
reviewed the expertise, experience and performance of the finance function and Chief Financial Officer;
assessed the scope and effectiveness of the systems to identify, manage and monitor financial statements;and non-financial risks;
reviewed the procedures for detecting, monitoring and managing the risk of fraud;
reviewed the scope, resources, results and effectiveness of the internal audit department;
approved the internal audit plan and subsequent changes to the approved plan;
ensured that a combined assurance model is applied to provide a co-ordinated approach to all assurance activities;
nominated the appointment of independent external auditors by the shareholders;
reviewed and approved the terms of engagement as contained in the engagement letter of the external auditors;
approved the remuneration of the external auditors;
pre-approved all non-audit services in line with a revised formal policy on non-audit services;
assessed the internal and external auditors’ independence;
assessed the effectiveness of the group’s internal and external audit function;
approved the internal audit plan and subsequent changes to the approved plan;
reviewed the expertise, experience and performanceappointment of the finance function and Chief Financial Officer;
ensured that a combined assurance model is appliedexternal auditors to provide a coordinated approach to allindependent limited assurance activities;on certain sustainability indicators as included in the Sustainable Development Report;
reviewed developments in reporting standards, corporate governance and best practice;
reviewed the adequacy and effectiveness of the Group’s enterprise wide risk management policies, processes and mitigating strategies;
monitored the governance of information technology (IT) and the effectiveness of the Group’sgroup’s information systems;
reviewed the adequacy and effectiveness of the group’s compliance function; and
evaluated the effectiveness of the committee through a self-assessment.
Proceedings and Performance Review
During 2014,2016, the Audit and Risk Committee (previously known as “Audit and Corporate Governance Committee”) formally met 6five times.
The Chief Financial Officer, Chief Accounting Officer, Group General Counsel and Company Secretary, Senior Vice President: Group Internal Audit, Group Tax Manager, Group Risk Manager, Chief Information Officer, the external auditors, as well as other assurance providers are invited to attend committee meetings in anex officio capacity and provide responses to questions raised by committee members during meetings. The CEO and CFO meetmeets with the auditors before the meeting and attendattends a debrief session with the Audit and Risk Committee.
The Audit and Risk Committee assessed its effectiveness through the completion of a self-assessment process, results were discussed, actions taken and processes put in place to address areas identified for refinement.
Subsequent to year-end, Albert Garner and Maria Richter were appointed to the Audit and Risk Committee, subject to election by the shareholders at the Annual General Meeting of 6 May 2015.
182
Remuneration and Human Resources Committee
The Remuneration and Human Resources Committee activities are governed by the Terms of Reference (these were recently reviewed and approved onat the 30 October 2014)November 2016 Remuneration and Human Resources Committee meeting). The primary purpose of the Committee is to operateassist the Board in an independent role as an overseer of remuneration and human resources matters with the accountability of the board. In performing this function, the Committee dischargesdischarging its oversight responsibilities relating to all compensation, including annual base salary, annual incentive compensation, long-term incentive compensation, employment, contracts, severance pay and on-goingongoing perquisites or special benefit items and equity compensation of the company’s Executive Management team and management,Company’s executives, including the CEOChief Executive Officer as well as retention strategies, the design and application of material compensation programmes and share ownership guidelines.
With respect to its mandate on human resources, the Committee has strategic oversight of matters relating to the development of the Company’s human resources with the main objective of creating a competitive human resource for the Group.
The committee also has oversight of talent management and succession planning strategies; transformation and localisation strategies and any other human resources issues considered strategicoperates in nature.an independent role, operating as an overseer with accountability to the board. This is accomplished by:
Reviewing and approving corporate goals and objectives relevant to the compensation of the Executive Managementexecutive management team;
Evaluating the performance of the Executive Managementexecutive management team in light of these goals and objectives annually and setting each executive’s compensation based on such evaluation;
Ensuring that the mix of fixed and variable pay, in base pay, shares and other elements of compensation meets the company’s requirements and strategic objectives;
Linking individual pay with operational and company performance in relation to strategic objectives;
Considering the sentiments and views of the company’s investors;
Overseeing and reviewing all aspects of any share option scheme operated by or to be established by the company;
Regularly reviewing incentive schemes to ensure continued contribution to shareholder value and ensure that these are administered in terms of the rules; and
Regularly reviewing human resources strategy aimed at ensuring the supply and retention of sufficient skilled resources to achieve the company’s objectives.objectives;
Ensure that the remuneration policy and implementation report is put to a non-binding advisory vote at the general meeting of shareholders once every year; and
Review the outcome of the implementation of the remuneration policy to ensure that the set objectives are being achieved and fairness is addressed.
The current members of the Committee are:
Remuneration and Human Resource Committee Members | MJ Kirkwood (Chairman and independent NED) | |
NP January-Bardill (Independent NED) | ||
Prof LW Nkuhlu (Independent NED) | ||
SM Pityana (Board Chairman) M Richter (Independent NED) | ||
Number of meetings held from January to December | Four | |
Other individuals who regularly attended meetings | S Venkatakrishnan (CEO) | |
T Sibisi (EVP: | ||
M Hopkins representing PwC (Independent Advisor to the Committee) | ||
C van Dyk |
| NED | – Non-Executive Director |
Remuneration Consultants
Where appropriate, the Committee obtains advice from independent remuneration consultants. The consultants are employed directly by the Committee and engage directly with them to ensure independence.
The Committee has appointed PwC to provide specialist, independent remuneration advice on all forms of executive and non-executive pay.
GRS Mercer Consulting (South Africa) Pty Limited performs an independent bespoke executive survey and theirits advice is primarily around salary benchmarking for both executive and non-executive pay.
183
| 6D. | EMPLOYEES |
The average number of attributable employees (including contractors) in the AngloGold Ashanti group over the last 3three financial years was:
| 2014 | 2013 | 2012 | 2016 | 2015 | 2014 | |||||||||||||||||||
South Africa | 29,511 | 32,406 | 34,186 | 28,507 | 28,325 | 29,511 | ||||||||||||||||||
Continental Africa | 16,070 | 16,625 | 16,621 | 12,691 | 11,942 | 16,070 | ||||||||||||||||||
Australasia | 832 | 925 | 494 | 925 | 836 | 832 | ||||||||||||||||||
Americas | 8,588 | 8,374 | 7,896 | 8,126 | 8,432 | 8,588 | ||||||||||||||||||
Other, including corporate and non-gold producing subsidiaries | 3,056 | 8,104 | 6,625 | 2,400 | 2,731 | 3,056 | ||||||||||||||||||
Total | 58,057 | 66,434 | 65,822 | |||||||||||||||||||||
Total* | 52,649 | 52,266 | 58,057 | |||||||||||||||||||||
| * | The number of contractors employed on average during |
| (1) | Includes average number of employees at CC&V until the date of sale. |
Labour relations and collective bargaining
At AngloGold Ashanti, recognises the fundamental right of freedom of association of all employees and contractors, and adhereshave the right to collective bargaining, agreements with due regardwhich we recognise and apply according to the relevant legislationapplicable laws and regulations in each of the countries in which it operates. Relations with organised labour are founded on mutual respect, and wage negotiations are conducted in line with the company’s values.
The majority of AngloGold Ashanti’s full-time employees are members of a union or are otherwise catered for throughwe operate. Only our Australasian operations do not have collective bargaining, agreements. Wage settlements are specific to each jurisdictionas this is not recognised in whichAustralia.
In the South Africa region, the three-year wage agreement signed in 2015 remains in force until 2018. During the year, AngloGold Ashanti operates and the company’s approach iscontinued to engage all unions to ensure that agreements are fair but realistic, taking into account the local economic context and the impact of any settlement on the long-term viabilityobligations of the business.
In South Africa, during 2014, we continuedagreement are implemented. During the year, there was no loss of production due to workprotected and/or unprotected strike action in the region. AngloGold Ashanti has a constructive and robust relationship with all organised labour representatives to engage them more meaningfully in dialogue on business issues. In particular, we have engaged with them on the economics of our industry, the gold market and on the legal and statutory framework regulating industrial relations in South Africa. All unions, participate and are fully integrated into all statutory labour and ad hoc committees. We have identified and secured agreement for a core leadership team across all unions representing the workforce to undertake an entry-level fundamental management programme at a South African university during 2015. The aim of this initiative is to change the nature of the discourse with organised labour and to move closer to a relationship where we can identify joint business and labour aspirations and chart a pathway to achieving them. Formal recognition agreements are in place with AMCU, Solidarity and Uasa while long-standing procedural agreements are in place regarding the NUM.
Towards the middle of 2015, under the auspices of the Chamber of Mines, we in the gold industry expect to begin biennial wage negotiations with our representative unions. The current labour environment differs markedly from that of 2013, and these negotiations will take place in an environment that has been influenced by a protracted five-month strike in the platinum sector, ongoing inter-union rivalry and competition for dominance and members between the National Union of Mineworkers (NUM) andincluding the Association of Mineworkers and Construction Union (AMCU)., the National Union of Mineworkers (NUM), Solidarity and UASA.
In the Continental Africa region, union negotiationsAt Geita in Tanzania, Siguiri in Guinea and Mali during 2014 all continued normallyat our Malian operations, annual wage negotiations were successfully concluded with final wage agreements achieved in all locations. being signed with the respective unions.
In Ghana, an agreement was entered into withIduapriem Mine and the Ghana Mineworkers Union (GMWU) and approved by the Ministryfinalised a review of Labour to retrench the entire workforce of 4,312 full-time AngloGold Ashanti employees, at the Obuasi mine. At Iduapriem, in Ghana, a wage agreement with GMWU was reached.
The Australian and United States operations do not haveselected existing collective bargaining agreements in place. Argentinaitems and Brazil both have unionsagreed a two-year collective agreement for 2016 and as2017. Discussions between management and union representatives are ongoing and it is expected that wage talks will conclude in the Continental Africafirst half of 2017.
In the Americas region, successfully concludedannual wage negotiations in 2014.both Brazil and Argentina were successfully concluded and agreements signed in the latter part of 2016.
184
| 6E. | SHARE OWNERSHIP |
DIRECTORS’ AND PRESCRIBED OFFICERS’ INTERESTS IN ORDINARY SHARES
The interests of directors and prescribed officers in the ordinary shares of the company at 31 December 20142016 which individually did not exceed 1 percent of the company’s issued ordinary share capital, were:
| Beneficial | Beneficial | Beneficial | ||||||||||||||||||||||
| Direct | Indirect | Direct | Indirect | Direct | Indirect | |||||||||||||||||||
| 31 December 2014 | 31 December 2013 | 31 December 2016 | ||||||||||||||||||||||
Non-Executive Directors | ||||||||||||||||||||||||
SM Pityana | 2,990 | - | ||||||||||||||||||||||
MDC Richter(1) | 7,300 | - | ||||||||||||||||||||||
DL Hodgson | 1,500 | - | - | - | 1,500 | - | ||||||||||||||||||
MJ Kirkwood(1) | 8,000 | - | 3,000 | - | 15,000 | - | ||||||||||||||||||
LW Nkuhlu | 3,000 | - | - | 3,000 | 3,000 | - | ||||||||||||||||||
RJ Ruston(2) | - | 1,000 | - | 1,000 | - | 1,000 | ||||||||||||||||||
Total | 12,500 | 1,000 | 3,000 | 4,000 | 29,790 | 1,000 | ||||||||||||||||||
Executive Directors | ||||||||||||||||||||||||
RN Duffy | - | - | 1,180 | - | ||||||||||||||||||||
M Cutifani | - | - | - | - | ||||||||||||||||||||
S Venkatakrishnan | 86 009 | - | 78,437 | - | 213,423 | - | ||||||||||||||||||
AM O’Neill | - | - | - | - | ||||||||||||||||||||
KC Ramon | 12,334 | - | ||||||||||||||||||||||
Total | 86,009 | - | 79,617 | - | 225,757 | - | ||||||||||||||||||
Company Secretary | ||||||||||||||||||||||||
ME Sanz Perez | 7,506 | - | 1,135 | - | 7,921 | 12,747 | ||||||||||||||||||
Total | 7,506 | - | 1,135 | - | 7,921 | 12,747 | ||||||||||||||||||
Prescribed Officers | ||||||||||||||||||||||||
I Boninelli | 5,728 | 2,247 | - | 1,284 | ||||||||||||||||||||
CE Carter | 32,253 | - | 36,500 | - | 43,229 | - | ||||||||||||||||||
GJ Ehm(3) | 8,155 | - | 1,213 | - | ||||||||||||||||||||
MP O’Hare | 2,247 | - | 1,379 | - | ||||||||||||||||||||
RW Largent(4) | 10,410 | - | 1,910 | - | ||||||||||||||||||||
GJ Ehm(2) | 33,782 | - | ||||||||||||||||||||||
RW Largent(1) | 44,470 | - | ||||||||||||||||||||||
DC Noko | 3,690 | - | 615 | - | 28,015 | - | ||||||||||||||||||
Total | 62,483 | 2,247 | 41,617 | 1,284 | 149,496 | - | ||||||||||||||||||
Grand total | 168,498 | 3,247 | 125,369 | 5,284 | 412,964 | 13,747 | ||||||||||||||||||
| (1) | Held on the New York stock exchange as |
| (2) | Held on the Australian stock exchange as |
|
|
DIRECTORS’ INTERESTS IN E ORDINARY SHARES
Mr SM Pityana, Non-Executive Director of AngloGold Ashanti, had an indirect beneficial holding in the company given that he is a trustee and beneficiary of a trust which holds a 44% interest in Izingwe, the company’s BEE partner. As at 31 December 2014, Izingwe held nil E ordinary shares in the issued capital of the company (2013: 350,000 E ordinary shares). The commercial transaction between AngloGold Ashanti and Izingwe was concluded on 27 October 2014.
A register detailing directorsDirectors and prescribed officers’Prescribed Officers’ interests in contracts is available for inspection at the company’s registered and corporate office.
185
CHANGE IN DIRECTOR’S AND PRESCRIBED OFFICER’S INTERESTS IN ANGLOGOLD ASHANTI SHARES SINCE 31 DECEMBER 20142016
Date of transaction | Type of transaction | Number of shares | Direct/ beneficial holding | |||||||
Non-executive directors | ||||||||||
AH Garner | 14 March 2017 | On-market purchase of American Depository Receipts | 7,500 | Direct | ||||||
Executive directors | ||||||||||
S Venkatakrishnan | On-market purchase of ordinary shares pursuant to the AngloGold Ashanti | Direct | ||||||||
| On-market sale of ordinary shares to settle tax costs | 5,367 | Direct | ||||||||
| On-market purchase of ordinary shares pursuant to the AngloGold Ashanti Co-Investment Plan | Direct | ||||||||
KC Ramon | On-market purchase of ordinary shares pursuant to the AngloGold Ashanti Co-Investment Plan | Direct | ||||||||
| On-market purchase of ordinary shares pursuant to the AngloGold Ashanti Co-Investment Plan | 8,427 | Direct | ||||||||
6 March 2017 | On-market purchase of ordinary shares pursuant to the AngloGold Ashanti Co-Investment Plan | 2,328 | Direct | |||||||
Company Secretary | ||||||||||
ME Sanz Perez | On-market purchase of ordinary shares pursuant to the AngloGold Ashanti Co-Investment Plan | Direct | ||||||||
Prescribed officers | ||||||||||
CE Carter |
| On-market purchase of ordinary shares pursuant to the AngloGold Ashanti Co-Investment Plan | ||||||||
| ||||||||||
| Direct | |||||||||
| On-market purchase of ordinary shares pursuant to the AngloGold Ashanti Co-Investment Plan | Direct | ||||||||
GJ Ehm | 2 March | On-market purchase of ordinary shares pursuant to the AngloGold Ashanti Co-Investment Plan | ||||||||
| Direct | |||||||||
| On-market purchase of ordinary shares pursuant to the AngloGold Ashanti Co-Investment Plan | Direct | ||||||||
| ||||||||||
| On-market purchase of ordinary shares pursuant to the AngloGold Ashanti Co-Investment Plan | |||||||||
R Largent |
| On-market purchase of ordinary shares pursuant to the AngloGold Ashanti Co-Investment Plan | ||||||||
| Direct | |||||||||
| 6 March | |||||||||
| On-market purchase of ordinary shares pursuant to the AngloGold Ashanti Co-Investment Plan | Direct | ||||||||
| On-market sale of ordinary shares to settle tax costs | 4,060 | Direct | ||||||||
| On-market purchase of ordinary shares pursuant to the AngloGold Ashanti Co-Investment Plan | Direct | ||||||||
| On-market purchase of ordinary shares pursuant to the AngloGold Ashanti Co-Investment Plan | Direct | ||||||||
| On-market sale of ordinary shares to settle tax costs | 1,385 | Direct | ||||||||
CB Sheppard | 15 March 2017 | On-market purchase of ordinary shares pursuant to the AngloGold Ashanti Co-Investment Plan | 5,344 | Direct | ||||||
TR Sibisi | 28 February 2017 | On-market purchase of ordinary shares pursuant to the AngloGold Ashanti Co-Investment Plan | 4,085 | Direct | ||||||
| (1) |
|
SHARE OWNERSHIP OF EXECUTIVE OFFICERS/EXECUTIVE MANAGEMENT
Under the Listings Requirements of the JSE, AngloGold Ashanti is not required to disclose, and it does not otherwise disclose or ascertain, share ownership of individual executive officers/executive management in the share capital of AngloGold Ashanti. However, to the best of its knowledge, AngloGold Ashanti believes that AngloGold Ashanti ordinary shares held by executive officers, in aggregate, do not exceed 1one percent of the company’s issued ordinary share capital.
MINIMUM SHAREHOLDING REQUIREMENT FOR EXECUTIVES
With effect from March 2013, a minimum shareholding requirement (MSR) will beis applicable to all executives as indicated below:
Executive directors
Within three years of appointment (or for existing executives, from introduction of this rule) executive directors (CEO and CFO) are to accumulate a MSR of AngloGold Ashanti shares to the value of 100 percent of net annual base salary; and
At the end of six years, executive directors are to accumulate a MSR of AngloGold Ashanti shares to the value of 200 percent of net annual base salary (additional 100 percent MSR) which they will be required to hold on an on-going basis.
186
Executive Committee members
Within three years of appointment (or for existing executives, from the introduction of this rule), Executive Committee members are to accumulate a MSR of AngloGold Ashanti shares to the value of 75 percent of net annual base salary; and
At the end of six years, Executive Committee members are to accumulate a MSR of AngloGold Ashanti shares to the value of 150 percent of net annual base salary (additional 75 percent MSR) which they will be required to hold on an on-going basis.
The table below summarises each director and executive committee member’s accomplishment of the MSR:
| Executive | Target Achievement Date | MSR Target Percentage as at 3 year | MSR holding as at 31 Dec 2016 as % of net base pay | Six-year Achievement | |||||||||||||
Executive Directors | |||||||||||||||||
S Venkatakrishnan(1) | March 2016 | 100 | % | 1,046 | % | 200 | % | ||||||||||
KC Ramon(2) | March 2018 | 100 | % | 68 | % | 200 | % | ||||||||||
Prescribed Officers | |||||||||||||||||
CE Carter | March 2016 | 75 | % | 188 | % | 100 | % | ||||||||||
GJ Ehm | March 2016 | 75 | % | 277 | % | 100 | % | ||||||||||
RW Largent(3) | March 2016 | 75 | % | 122 | % | 100 | % | ||||||||||
DC Noko | March 2016 | 75 | % | 364 | % | 100 | % | ||||||||||
ME Sanz Perez | March 2016 | 75 | % | 200 | % | 100 | % | ||||||||||
C Sheppard(4) | March 2019 | 75 | % | 0 | % | 100 | % | ||||||||||
TR Sibisi(5) | March 2020 | 75 | % | 0 | % | 100 | % | ||||||||||
| (1) | The executive director has retained all of his share exposure in the company (net of tax) since he joined AngloGold Ashanti during 2000 |
| (2) | The executive director joined the company 1 October 2014 and the 3 year MSR achievement is only due in March 2018. |
| (3) | The prescribed officer required to sell shares in order to pay for tax on vesting in US, resulting in reduced shareholding. |
| (4) | The prescribed officer joined the company 1 June 2015 and the 3 year MSR achievement is only due in March 2019. |
| (5) | The prescribed officer joined the company 18 January 2016 and the 3 year MSR achievement is only due in March 2020. |
Co-Investment Executive Share Plan
To assist executives in meeting their MSR’s, with effect from February 2013, they were given the opportunity, on a voluntary basis, to participate in the Co-Investment Plan (CIP), and this has been adopted on the conditions below:
Executives will be allowed to take up to 50 percent of their after tax cash bonus to participate in a further matching scheme by purchasing shares in AngloGold Ashanti, and the company will match their initial investment into the scheme at 150 percent, with vesting over a two-year period in two equal tranches.
SHARE OWNERSHIP OF EMPLOYEES
At a general meeting of shareholders held on 11 December 2006, members approved the creation of 4,280,000 E ordinary shares of 25 South African cents pursuant to an employee share ownership plan for the benefit of certain AngloGold Ashanti employees, of which the majority are historically disadvantaged South Africans as defined in the Broad-Based Socio-Economic Empowerment Charter for the South African Mining Industry. For details on the E ordinary share capital, see “Item 7: Shareholders and related party transactions – E Ordinary shares”.
At a general meeting held on 11 May 2011, shareholders approved an amendment to the BEE transaction authorising an additional issue of 48,923 ordinary shares to be made to the ESOP and the reinstatement of lapsed E ordinary shares to be made. The amendment also revised changes to the vesting criteria and duration of the scheme.
On 9 June 2011, a total of 1,329,164 E ordinary shares were reinstated.
On 1 November 2014, the final vesting under the ESOP was concluded and the scheme is now closed.
AngloGold Share Incentive Scheme
AngloGold Ashanti operates a share incentive scheme through which Executive Directors, members of the Executive Committee and other management groups of the company and its subsidiaries are given the opportunity to acquire shares in the company. The objectiveintention of the incentive scheme is to incentivise such employeesensure that the medium to identify themselves more closely with the fortuneslong term interests of the group, support its continued growth,executive and shareholders are aligned, providing rewards to promote the retention of such employees.executives and wealth creation opportunities to the shareholders when the strategic performance drivers are achieved.
Non-Executive Directors are not eligible to participate in the share incentive scheme.
Employees participate in the share incentive scheme to the extent that they are granted options or rights to acquire shares and accept them. All options or rights which have not been exercised within ten years from the date of grant, automatically expire.
The incentives offered by AngloGold Ashanti are reviewed periodically to ensure that they remain globally competitive, so as to attract, reward and retain managers of the highest calibre. As a result, several types of incentives, each with their own issue and vesting criteria, have been granted to employees. These are collectively known as the “AngloGold Ashanti Share Incentive Scheme” or “Share Incentive Scheme”.
Although the Remuneration and Human Resources Committee has the discretion to incentivise employees through the issue of shares, only options or awards have so far been granted.
The type and vesting criteria of the options or awards granted are:
Performance-related options
The granting of performance-related options was approved by shareholders at the Annual General Meeting held on 30 April 2002 and amended at the Annual General Meeting held on 29 April 2005 when it was agreed that no further performance-related options would be granted. All performance-related options granted terminated on 1 November 2014, being the date on which the last options granted expired.
187
Bonus Share Plan (BSP)
The granting of awards in terms of the BSP was approved by shareholders at the Annual General Meeting held on 29 April 2005 and amended at2005. The Scheme has undergone a number of changes, each approved by the General Meeting held on 6 May 2008 when shareholders approved an increase in the maximum level of the bonus payable to eligible participants, as well as shortening of the vesting period. Executive directors, executives and other management groups are eligible for participation. Eachshareholders. Currently, each award made in respect of the BSP entitles the holder to acquire one ordinary share at “nil” cost. In respect of all awards granted to and including 2007, these awards vest in full, three years from the date of grant,cost, provided that the participant remains in the employ of the company at the date of vesting unless an event, such as death, retirement or redundancy occurs, which may result in a pro-rata allocation of awards and an earlier vesting date. In respect of awards granted in 2008 and thereafter, the vesting period has been shortened to two years, with 40 percent of awards granted vesting in year one and 60 percent in year two from the date of grant or, in the event that participants awards remain unexercised after three years from the original grant date, an additional 20 percent will be granted.
Certain changes were approved at the Extraordinary General Meeting of shareholders held on 11 March 2013. The 20 percent uplift for the retention of shares for three years fell away but was added to the initial 100 percent resulting in an allocation of 120 percent share matching for all categories of management. The Executive Committee members receivedreceive an increased allocation fromof 150 percent of their cash bonus while all other participating employees receive a 120 percent to 150 percent.matching. The vesting period has been shortened toruns over two years with 50 percent vesting 12 months after the date of issue and the remaining 50 percent vesting 24 months after the date of issue.
The Share Incentive Scheme does not have sufficient shares under its control to continue to meet awards based on previous criteria. Accordingly the criteria under the scheme are under review and a new incentive scheme is being proposed to shareholders for approval at the May 2017 Annual General Meeting.
Long Term Incentive Plan (LTIP)
The granting of awards in terms of the LTIP was approved by shareholders at the Annual General Meeting held on 29 April 2005. Executive directors and selected senior management are eligible for participation. Each award made in respect of the LTIP entitles the holder to acquire one ordinary share at “nil” cost. Awards granted vest in three years from the date of grant, to the extent that the set company performance targets, under which the awards were made, are met, and provided that the participant remains in the employ of the company at the date of vesting, unless an event, such as death, retirement or redundancy occurs, which may result in a pro-rata allocation of awards and an earlier vesting date.
In 2013,The criteria under the RemunerationLTIP are under review and Human Resources Committee approved a new retention bonusincentive scheme comprising both cash (40 percent of total base pay) and shares (60 percent of base pay) which was implemented on 1 March 2013is being proposed to shareholders for the Executive Committee members. This was implemented over the short term to support a strategy of retaining the top management for a minimum period of 18 months to ensure delivery on key business imperatives, while the new Chief Executive Officer was inducted. The share award comprised of performance-based share (LTIP) granted in March 2013. Subject to the performance conditions, which were met and vestedapproval at the end of August 2014. In line with the LTIP vesting, the cash portion was also paid at the end of August 2014, based on the achievement of the performance conditions.
The CEO did not receive the cash portion of the LTIP Retention bonus. This has been converted to restricted shares which are deferred to retirement, termination of employment, any corporate activity resulting in a change of control, resignation, death or 5 years from date of grant, whichever is earliest.May 2017 Annual General Meeting.
188
PARTICIPATION BY EXECUTIVE DIRECTORS, EXECUTIVE MANAGEMENT AND OTHER MANAGERS IN THE ANGLOGOLD SHARE INCENTIVE SCHEME
Details of the options and rights to subscribe for ordinary shares in the company granted to, and exercised by, executive directors, executive management and other managers on an aggregate basis during the year to 31 December 20142016 and subsequent to year-end are set out in the table below.
Number of options and awards granted
| Appointed with effect from | Resigned/ retired with effect from | Balance at 1 January 2014 | Granted 2014 | Exercised 2014 | Pre-tax gains on share options exercised ($’000) | Lapsed during 2014 | Balance as at 31 December 2014(1) | Balance at 1 January | Granted during 2016 | Exercised during 2016 | Lapsed during 2016 | Balance as at 31 December 2016(1) | ||||||||||||||||||||||||||||||||||||||||
Executive directors | ||||||||||||||||||||||||||||||||||||||||||||||||||||
Executive Directors | ||||||||||||||||||||||||||||||||||||||||||||||||||||
S Venkatakrishnan | Full year | 220,393 | 166,625 | - | - | 20,159 | 366,859 | 676,489 | 49,962 | - | 37,364 | 689,087 | ||||||||||||||||||||||||||||||||||||||||
RN Duffy(3) | 30-Sep-14 | 166,543 | 92,361 | - | - | 14,754 | 244,150 | |||||||||||||||||||||||||||||||||||||||||||||
KC Ramon(4) | 01-Oct-14 | - | 50,201 | - | - | - | 50,201 | |||||||||||||||||||||||||||||||||||||||||||||
KC Ramon | 181,462 | 30,323 | - | - | 211,785 | |||||||||||||||||||||||||||||||||||||||||||||||
| 386,936 | 309,187 | - | - | 34,913 | 661,210 | 857,951 | 80,285 | - | 37,364 | 900,872 | ||||||||||||||||||||||||||||||||||||||||||
Prescribed officers(2) | ||||||||||||||||||||||||||||||||||||||||||||||||||||
Prescribed Officers | ||||||||||||||||||||||||||||||||||||||||||||||||||||
I Boninelli | Full year | 82,472 | 73,930 | - | - | 4,825 | 151,577 | 274,875 | - | 123,379 | 151,496 | - | ||||||||||||||||||||||||||||||||||||||||
CE Carter | Full year | 112,389 | 88,001 | 4,481 | 80 | 39,074 | 156,835 | 235,484 | 36,666 | 21,764 | - | 250,386 | ||||||||||||||||||||||||||||||||||||||||
GJ Ehm | Full year | 122,462 | 103,913 | 5,360 | 93 | 7,316 | 213,699 | 364,297 | 31,602 | 40,145 | 24,400 | 331,354 | ||||||||||||||||||||||||||||||||||||||||
RW Largent | Full year | 113,073 | 161,509 | 4,790 | 89 | 9,184 | 260,608 | 525,801 | 63,828 | 82,174 | 31,839 | 475,616 | ||||||||||||||||||||||||||||||||||||||||
MP O’Hare | Full year | 133,616 | 95,877 | - | - | 5,134 | 224,359 | |||||||||||||||||||||||||||||||||||||||||||||
D Noko | Full year | 45,334 | 68,178 | - | - | - | 113,512 | 244,540 | 20,080 | - | 20,028 | 244,592 | ||||||||||||||||||||||||||||||||||||||||
ME Sanz Perez | Full year | 67,880 | 73,107 | - | - | 5,279 | 135,708 | 261,374 | 19,992 | 56,945 | 19,208 | 205,213 | ||||||||||||||||||||||||||||||||||||||||
YZ Simelane(5) | 31-Jul-14 | 74,035 | 39,091 | 39,875 | 386 | 73,251 | - | |||||||||||||||||||||||||||||||||||||||||||||
CB Sheppard | 17,400 | 10,152 | - | - | 27,552 | |||||||||||||||||||||||||||||||||||||||||||||||
| 751,261 | 703,606 | 54,506 | 648 | 144,063 | 1,256,298 | 1,923,771 | 182,320 | 324,407 | 246,971 | 1,534,713 | ||||||||||||||||||||||||||||||||||||||||||
Other management | 4,550,186 | 3,188,351 | 1,023,416 | 16,614 | 1,212,452 | 5,502,669 | ||||||||||||||||||||||||||||||||||||||||||||||
Other | 8,071,006 | 1,841,162 | 2,634,038 | 1,080,062 | 6,198,068 | |||||||||||||||||||||||||||||||||||||||||||||||
Total share incentive scheme | 5,688,383 | 4,201,144 | 1,077,922 | 17,262 | 1,391,428 | 7,420,177 | 10,852,728 | 2,103,767 | 2,958,445 | 1,364,397 | 8,633,653 | |||||||||||||||||||||||||||||||||||||||||
| (1) | The latest expiry date of all options/awards granted and outstanding at 31 December |
|
|
|
|
Subsequent to year end and up to 1917 March 2015, no2017, options/awards have been exercised by Executive Directors and Prescribed Officers, exceptare for Charles Carter who exercised 38,87358,260 awards for a pre-tax gain of $461,084; Michael O’Hare$561,100; and Ronald Largent who exercised 294112,937 awards for a pre-tax gain of $2,997; and Ronald Largent who exercised 33,882 awards for a pre-tax gain of $393,269.$1,093,891.
A total of 1,902,542 (2013: 1,668,617; 2012: 1,264,872)1,563,056 (2015: 2,248,613) options/awards out of the 7,420,177 (2013: 5,688,383; 2012: 4,580,329)8,633,653 (2015: 10,852,728) options/awards granted and outstanding at 31 December 20142016 are fully vested.
Awards granted since 2005 have been granted at nil cost to participants.
Non-executive directors are not eligible to participate in the share incentive scheme.
In 2016, Cash Settled Long Term Incentive Plan (CSLTIP) awards of 120,000 each were granted to key management personnel.
189
Awards granted in respect of the previous year’s2016 financial results:
| Number of awards issued in | Total(1)(8) 2015 | Total(2) 2014 | Total(3) 2013 | |||||||||
Executive Directors | ||||||||||||
M Cutifani(5) | - | - | 5,429 | |||||||||
S Venkatakrishnan | 233,565 | 166,625 | 99,043 | |||||||||
RN Duffy | 1,481 | 92,361 | 65,193 | |||||||||
KC Ramon | 114,637 | 50,201 | - | |||||||||
AM O’Neill(6) | - | - | 124,961 | |||||||||
Total executive directors | 349,683 | 309,187 | 294,626 | |||||||||
Prescribed officers | ||||||||||||
I Boninelli | 95,191 | 73,930 | 52,314 | |||||||||
CE Carter | 122,367 | 88,001 | 66,929 | |||||||||
GJ Ehm | 120,469 | 103,913 | 59,443 | |||||||||
RW Largent(4) | 213,018 | 161,509 | 76,865 | |||||||||
MP O’Hare | 1,268 | 95,877 | 66,699 | |||||||||
M MacFarlane | - | - | 42,765 | |||||||||
D Noko | 93,843 | 68,178 | 45,334 | |||||||||
ME Sanz Perez | 94,304 | 73,107 | 46,087 | |||||||||
YZ Simelane(7) | - | 39,091 | 36,218 | |||||||||
Total prescribed officers | 740,460 | 703,606 | 492,654 | |||||||||
Total awards to executive management | 1,090,143 | 1,012,793 | 787,280 | |||||||||
| Total awards 2016(1) | ||||
Executive Directors | ||||
S Venkatakrishnan | 49,962 | |||
C Ramon | 30,323 | |||
| 80,285 | ||||
Prescribed Officers | ||||
CE Carter | 36,666 | |||
GJ Ehm | 31,602 | |||
RW Largent | 63,828 | |||
D Noko | 20,080 | |||
ME Sanz Perez | 19,992 | |||
CB Sheppard | 10,152 | |||
TR Sibisi | - | |||
| 182,320 | ||||
Total awards to executive management | 262,605 | |||
| (1) |
|
|
|
|
|
|
|
|
Number of time-related, performance-related, BSP and LTIP awards granted
In accordance with the JSE Listings Requirements and the rules of the AngloGold Share Incentive Scheme, the changes in options and awards granted and the ordinary shares issued as a result of the exercise of options and awards during the period 1 January 20142017 to 28 February 20152017 are disclosed below:
| Performance related | Bonus Share Plan(1) | Long-Term Incentive Plan(1) | Total Share Incentive Scheme | |||||||||||||
At 1 January 2014 | 56,882 | 2,598,887 | 3,032,614 | 5,688,383 | ||||||||||||
Movement during year | ||||||||||||||||
– Granted | - | 1,983,469 | 2,217,675 | 4,201,144 | ||||||||||||
– Exercised | (419 | ) | (868,350 | ) | (209,153 | ) | (1,077,922 | ) | ||||||||
– Lapsed – terminations | (56,463 | ) | (408,491 | ) | (926,474 | ) | (1,391,428 | ) | ||||||||
At 31 December 2014 | - | 3,305,515 | 4,114,662 | 7,420,177 | ||||||||||||
Subsequent to year-end | ||||||||||||||||
– Granted(1) | - | 127,441 | 3,103,155 | 3,230,596 | ||||||||||||
– Exercised | - | (223,000 | ) | (42,346 | ) | (265,346 | ) | |||||||||
– Lapsed – terminations | - | (18,410 | ) | (325,054 | ) | (343,464 | ) | |||||||||
At 28 February 2015 | - | 3,191,546 | 6,850,417 | 10,041,963 | ||||||||||||
| Bonus Share Plan(1) | Long-Term Incentive Plan(1) | Total Share Incentive Scheme | ||||||||||
At 1 January 2016 | 4,708,799 | 6,143,929 | 10,852,728 | |||||||||
Movement during year | ||||||||||||
– Granted | 2,103,767 | - | 2,103,767 | |||||||||
– Exercised | (2,409,907 | ) | (548,538 | ) | (2,958,445 | ) | ||||||
– Lapsed/forfeited | (204,374 | ) | (1,160,023 | ) | (1,364,397 | ) | ||||||
At 31 December 2016 | 4,198,285 | 4,435,368 | 8,633,653 | |||||||||
Subsequent to year-end | ||||||||||||
– Exercised | (41,787 | ) | (58,685 | ) | (100,472 | ) | ||||||
– Lapsed/forfeited | (16,229 | ) | (1,091,688 | ) | (1,107,917 | ) | ||||||
At 28 February 2017 | 4,140,269 | 3,284,995 | 7,425,264 | |||||||||
| (1) | BSP and LTIP awards granted at nil cost to participants. |
190
Following a change inDue to the Schedule 14 of the JSE Listings Requirements (Share Incentive Schemes) on 15 October 2008, the maximumlimited number of shares attributable to the scheme was changed from 2.75 percent of issued share capital from time to time to a fixed figure of 17,000,000. The maximum aggregate number of shares which may be acquired by any one participant in the scheme is 5 percent of the shares attributable to the scheme, being 850,000 ordinary shares in aggregate.
Also,available as a result of a diminishing share pool there were insufficient shares available to do the change to the JSE Listings Requirements, as aforementioned, the recycling of options/awards that have vested and which have been delivered, and for which AngloGold Ashanti shares have been issued, is no longer allowed. LTIP allocation in 2016.
The table below reflects the total number of options/awards that are unissuedavailable for issue in terms of the share incentive scheme, as a result of this rule change:scheme:
| ||||
| ||||
| ||||
| ||||
| ||||
| ||||
| ||||
| ||||
| ||||
| ||||
| ||||
| ||||
| 2016 Awards | 2015 Awards | |||||||
At 1 January | 1,992,078 | 3,679,584 | ||||||
Increase in allotment approved by shareholders at AGM | - | 3,000,000 | ||||||
| 1,992,078 | 6,679,584 | |||||||
Bonus Share Plan awards granted | (2,103,767 | ) | (2,562,313 | ) | ||||
Long Term Incentive Plan awards granted | - | (3,120,555 | ) | |||||
Lapsed/Forfeited Bonus Share Plan | 204,374 | 165,006 | ||||||
Long Term Incentive Plan | 1,160,023 | 830,356 | ||||||
At 31 December | 1,252,708 | 1,992,078 | ||||||
191
ITEM 7: SHAREHOLDERS AND RELATED PARTY TRANSACTIONS
OVERVIEW
DESCRIPTION OF ANGLOGOLD ASHANTI’S SHARE CAPITAL
AngloGold Ashanti’s share capital consists of four classes of stock:
Ordinary shares, par value 25 South African cents each (the “ordinary shares”);
E-Ordinary shares, par value 25 South African cents each (the “E-ordinary shares”);
A redeemable preference shares, par value 50 South African cents each (the “A preference shares”); and
B redeemable preference shares, par value 1 South African cent each (the “B preference shares”); and
C redeemable preference shares of no par value (the “C preference shares”).
The authorised and issued share capital of AngloGold at 31 December 20142016 is set out below:
| Title of class | Authorised | Issued | Authorised | Issued | ||||||||||||
Ordinary shares | 600,000,000 | 404,010,360 | 600,000,000 | 408,223,760 | ||||||||||||
E-Ordinary shares | 4,280,000 | - | ||||||||||||||
A preference shares | 2,000,000 | 2,000,000 | 2,000,000 | 2,000,000 | ||||||||||||
B preference shares | 5,000,000 | 778,896 | 5,000,000 | 778,896 | ||||||||||||
C preference shares | 30,000,000 | 0 | ||||||||||||||
All the issued ordinary shares, E ordinary shares, A redeemable preference shares and B redeemable preference shares are fully paid and are not subject to further calls or assessment by AngloGold Ashanti. As at 31 December 2014 there were no E ordinary shares in issue. For a discussion of rights attaching to the ordinary shares, E ordinary shares, the A redeemable preference shares, and the B redeemable preference shares and the C redeemable preference shares, see “Item 10B.:10B: Memorandum of Incorporation”. A Special Resolution to cancel the E ordinary shares is being proposed to the shareholders at the Annual General Meeting on 6 May 2015.
The following are the movements in the ordinary issued share capital at 31 December:
Ordinary shares
| Number of Shares | Rand | Number of Shares | Rand | Number of Shares | Rand | Number of Shares | Rand | Number of Shares | Rand | Number of Shares | Rand | |||||||||||||||||||||||||||||||||||||
| 2014 | 2013 | 2012 | 2016 | 2015 | 2014 | |||||||||||||||||||||||||||||||||||||||||||
At 1 January | 402,628,406 | 100,657,102 | 383,320,962 | 95,830,241 | 382,242,343 | 95,560,586 | 405,265,315 | 101,316,329 | 404,010,360 | 101,002,590 | 402,628,406 | 100,657,102 | ||||||||||||||||||||||||||||||||||||
Issued during the year: | ||||||||||||||||||||||||||||||||||||||||||||||||
- Settlement of the outstanding 6 percent Mandatory Convertible Subordinated Bonds | – | – | 18,140,000 | 4,535,000 | – | – | ||||||||||||||||||||||||||||||||||||||||||
- Bokamoso ESOP on conversion of E ordinary shares | 154,299 | 38,575 | 145,018 | 36,254 | 84,446 | 21,112 | – | – | – | – | 154,299 | 38,575 | ||||||||||||||||||||||||||||||||||||
- Izingwe on conversion of E ordinary shares | 149,733 | 37,433 | 91,683 | 22,921 | 48,532 | 12,133 | – | – | – | – | 149,733 | 37,433 | ||||||||||||||||||||||||||||||||||||
- Exercise of options by participants in the AngloGold share Incentive Scheme | 1,077,922 | 269,480 | 930,743 | 232,686 | 945,641 | 236,410 | 2,958,445 | 739,611 | 1,254,955 | 313,739 | 1,077,922 | 269,480 | ||||||||||||||||||||||||||||||||||||
| 404,010,360 | 101,002,590 | 402,628,406 | 100,657,102 | 383,320,962 | 95,830,241 | 408,223,760 | 102,055,940 | 405,265,315 | 101,316,329 | 404,010,360 | 101,002,590 | |||||||||||||||||||||||||||||||||||||
During the period 1 January 20152017 to and including 2322 March 2015, 432,7212017, 588,955 ordinary shares were issued at an average issue price of R240.46R193.48 per share, resulting in 404,443,081408,812,715 ordinary shares being in issue at 2322 March 2015.
192
E ordinary shares
The following are the movements in the E ordinary issued share capital at 31 December:
| Number of Shares | Rand | Number of Shares | Rand | Number of Shares | Rand | |||||||||||||||||||
| 2014 | 2013 | 2012 | ||||||||||||||||||||||
At 1 January | 712,006 | 178,001 | 1,617,752 | 404,438 | 2,582,962 | 645,741 | ||||||||||||||||||
Reinstated | ||||||||||||||||||||||||
Issued during the year: | ||||||||||||||||||||||||
- Cancelled in exchange for ordinary shares in terms of the cancellation formula | (712,006 | ) | (178,001 | ) | (905,746 | ) | (226,437 | ) | (965,210 | ) | (241,303) | |||||||||||||
| – | – | 712,006 | 178,001 | 1,617,752 | 404,438 | |||||||||||||||||||
On 11 December 2006, shareholders in general meeting authorised the creation of a maximum of 4,280,000 E ordinary shares to be issued pursuant to an Employee Share Ownership Plan (ESOP) and a Black Economic Empowerment transaction with Izingwe Holdings (Pty) Limited (Izingwe) – (collectively, the BEE transaction).
All the E ordinary shares have vested and were cancelled in exchange for ordinary shares in accordance with the amended cancellation formula during the 2014 financial year. There are as at 31 December 2014 no E ordinary shares in issue.2017.
Redeemable preference shares
The A and B redeemable preference shares, all of which are held by wholly owned subsidiary, Eastvaal Gold Holdings Limited, a wholly owned subsidiary of AngloGold Ashanti, may not be transferred and are redeemable from the realisation of the assets relating to the Moab lease area after the cessation of mining operations in the area. The shares carry the right to receive dividends equivalent to the profits (net of royalty, ongoing capital expenditure and taxation) from operations in the area. No further A and B redeemable preference shares will be issued.
A special resolution to create 30,000,000 new C redeemable preference shares of no par value was approved by shareholders on 4 May 2016. The C redeemable preference shares have no par value but have the same rights as the B preference shares save that the C preference shares rank after the B preference shares (but prior to the A preference shares) as regards the payment of dividends, redemption proceeds and payment on winding up of the company.
193
| 7A. | MAJOR SHAREHOLDERS |
According to information available to the directors, the following are the only shareholders or their associates holding, directly or indirectly, in excess of 5 percent of the ordinary issued share capital of the company:
| Ordinary shares held at | 31 December 2014 | 31 December 2013 | 31 December 2012 | 31 December 2016 | 31 December 2015 | 31 December 2014 | ||||||||||||||||||||||||||||||||||||||||
| Shareholder* | Number of Shares | percent Voting Rights | Number of Shares | percent Voting Rights | Number of Shares | percent Voting Rights | Number of Shares | Percent Voting Rights | Number of Shares | Percent Voting Rights | Number of Shares | Percent Voting Rights | ||||||||||||||||||||||||||||||||||
BlackRock Inc. | 42,966,540 | 10.53 | ||||||||||||||||||||||||||||||||||||||||||||
Public Investment Corp. of South Africa | 31,854,515 | 7.88 | 30,166,288 | 7.49 | 20,050,361 | 5.23 | 25,580,542 | 6.27 | 25,936,314 | 6.40 | 31,854,515 | 7.88 | ||||||||||||||||||||||||||||||||||
First Eagle Investment Management LLC | 31,746,875 | 7.86 | 33,159,762 | 8.24 | ||||||||||||||||||||||||||||||||||||||||||
Van Eck Global | 24,485,374 | 6.00 | 26,941,752 | 6.65 | 24,759,780 | 6.13 | ||||||||||||||||||||||||||||||||||||||||
Investec Asset Management (Pty) Limited (South Africa) | 28,576,916 | 7.07 | 35,614,617 | 8.85 | 20,108,121 | 5.25 | 31,185,069 | 7.69 | 28,576,916 | 7.07 | ||||||||||||||||||||||||||||||||||||
Paulson & Co., Inc | 26,205,400 | 6.49 | 31,424,135 | 7.80 | 28,607,495 | 7.46 | 25,027,300 | 6.18 | 26,205,400 | 6.49 | ||||||||||||||||||||||||||||||||||||
Van Eck Global | 24,759,780 | 6.13 | 21,842,177 | 5.42 | ||||||||||||||||||||||||||||||||||||||||||
Dimensional Fund Advisors | 20,901,571 | 5.16 | ||||||||||||||||||||||||||||||||||||||||||||
*Shares may not necessarily reflect the beneficial shareholder
At 31 December 2014,2016, a total of 194,944,027176,085,993 shares (or 48.2543 percent of issued ordinary share capital) were held by The Bank of New York Mellon, as Depositary for the company’s American Depositary Receipt programme. Each American Depositary Share (ADS) is equivalent to one ordinary share. At 31 December 2014,2016, the number of persons who were registered holders of ADSs was reported at 2,884.2,599. AngloGold Ashanti is aware that many ADSs are held of record by brokers and other nominees, and accordingly the above numbers are not necessarily representative of the actual number of persons who are beneficial holders of ADSs or the number of ADSs beneficially held by these persons.
All shareholders have the same voting rights.
As at 31 December 2014,2016, there were 8,48313,960 holders on record of AngloGold Ashanti ordinary shares. Of these holders 223460 had registered addresses in the United States and held a total of 38,444,52660,478,497 ordinary shares, approximately 1014.82 percent of the total outstanding ordinary shares. In addition, certain accounts on record with registered addresses outside the United States, including The Bank of New York Mellon, hold AngloGold Ashanti ordinary shares, in whole or in part, beneficially for United States persons.
At 1722 March 2015,2017, a total of 196,784,980170,522,240 ADSs or approximately 48.742 percent of total issued ordinary share capital were issued and outstanding and held on record by approximately 2,8612,570 registered holders.
Insofar as is known to AngloGold Ashanti, there was no person who, directly or indirectly, jointly or severally, exercised or could exercise control over AngloGold Ashanti, nor is AngloGold Ashanti aware of any arrangements which might result in a change in control of AngloGold Ashanti.
194
| 7B. | RELATED PARTY TRANSACTIONS |
The Company had the following transactions with related parties during the year ended 31 December 2014:2016:
| At 31 December | 2014 | |||||||
(in millions) | Purchases $ | Amounts $ | ||||||
Purchases of goods and services (by)/from equity accounted joint ventures and associates | ||||||||
Margaret Water Company | 6 | - | ||||||
Société d’Exploitation des Mines d’Or de Sadiola S.A. | (8) | 3 | ||||||
Société d’Exploitation des Mines d’Or de Yatela S.A. | (1) | - | ||||||
Société des Mines d’Or Morila S.A. | (2) | 1 | ||||||
| (5) | 4 | |||||||
| At 31 December | 2016 | |||
(in millions) | Purchases from $ | |||
Purchases of goods and services from related parties | ||||
Rand Refinery (Pty) Limited | 10 | |||
Margaret Water Company | 5 | |||
Société d’Exploitation des Mines d’Or de Sadiola S.A. | 5 | |||
Société d’Exploitation des Mines d’Or de Yatela S.A. | 1 | |||
| 21 | ||||
Amounts due by joint ventureventures and associate related partiesassociates arising from purchases of goods and services are unsecured and non-interest bearing.
| At 31 December | 2016 | |||
(in millions) | Sales and $ | |||
Sales and services rendered to related parties | ||||
Société d’Exploitation des Mines d’Or de Sadiola S.A. | 5 | |||
Société d’Exploitation des Mines d’Or de Yatela S.A. | 5 | |||
Société des Mines de Morila S.A. | 2 | |||
Gramalote | 4 | |||
| 16 | ||||
As at 31 December 2014 there are no2016 the outstanding balances arising from purchasesthe sale of goods and services owed todue by related parties.
AngloGold Ashanti entered into an agreement (“Agreement”) with Izingwe Property Managers (Pty) Limited (“Izingwe Property”) under which Izingwe Property assists AngloGold Ashanti in planning, design, development and construction of 200 units of housing in South Africa for employees of AngloGold Ashanti. Izingwe Property’s roles are those of development and project manager and main contractor. $1.9m was paid to Izingwe Property pursuant to the agreement. The contract was completed on 27 October 2014. Mr Sipho Pityana, Chairman of the Company,parties is Chairman and a 44% shareholder in Izingwe Holdings (Pty) Limited (“Izingwe”), AngloGold Ashanti’s BEE partner. Izingwe Capital (Pty) Limited, an associate company of Izingwe is the majority shareholder of Izingwe Property.$8m.
Loans due by associates as at 31 December
| (in millions) | $ | |||
| ||||
Rand Refinery (Pty) Limited | ||||
| (1) |
|
A shareholder loan of $44m was granted to Rand Refinery (Pty) Limited during December |
As at 31 December 20142016 there are no outstanding balances arising from loans owed to related parties.
| 7C. | INTERESTS OF EXPERTS AND COUNSEL |
Not applicable.
195
| ITEM 8: |
|
| 8A. | CONSOLIDATED FINANCIAL STATEMENTS AND OTHER INFORMATION |
See “Item 18: Financial statements”.
There is no material proceeding in which a director, officer or affiliate of AngloGold Ashanti is either a party adverse or has a material interest adverse to the company.
In addition to the proceedings described below, the company becomes involved, from time to time, in various claims, legal proceedings and complaints incidental to the ordinary course of its business.
The State of Goiás v. Mineração Serra Grande S.A. (MSG): In 2006, MSG received two tax assessments from the State of Goiás related to the payments of state sales taxes at the rate of 12% on gold deliveries for export from one Brazilian state to another during the period from February 2004 to the end of May 2006. The first and second assessments were approximately $62 million and $39 million as at 31 December 2013, respectively. Various legal proceedings have taken place over the years with respect to this matter, as previously disclosed. On 5 May 2014, the State of Goiás published a law which enables companies to settle outstanding tax assessments of this nature. Under this law, MSG settled the two assessments in May 2014 by paying $14 million in cash and by utilising $29 million of existing VAT credits. The utilisation of the VAT credits is subject to legal confirmation from the State of Goiás. Although the State has not yet provided confirmation, management has concluded that the likelihood of the State of Goiás declining the utilisation of the VAT credits or part thereof is remote. As part of the acquisition by AngloGold Ashanti of the remaining 50 percent interest in MSG during June 2012 from Kinross Gold Corporation (Kinross), Kinross provided an indemnity to a maximum amount of BRL255 million against the specific exposures related to the tax assessments from the State of Goiás and the State of Minas Gerais. The May 2014 cash settlement discussed above was set off by an indemnity settlement from Kinross of $6 million.
The State of Goiás v. Mineração Serra Grande S.A. (MSG): In 2013 the Goiás State Treasury filed claims in the tax administration council that formal offenses had been committed by MSG regarding certain tax obligations, specifically the entering of information in certain tax years identifying incorrectly the state in which MSG mined gold. MSG, through a third-party vendor, inadvertently identified another state in the federation, not Goiás, as the production state. The State of Goiás alleges that such procedural errors resulted in an actual loss of revenue to the State, as the Federal government uses the information provided by the company to determine, in part, how much revenue is transferred to the State by the Federal government. The estimated value of the tax challenge is approximately $92 million as of the May 2014 settlement date. MSG filed an administrative challenge at the first level which was denied. Utilising the same settlement law described in the proceeding above, MSG negotiated a settlement in May 2014 with the State of Goiás by paying approximately $2.8 million in cash and by utilising approximately $2.0 million of tax credits. The utilisation of the tax credits is subject to legal confirmation from the State of Goiás. Although the State has not yet provided confirmation, management has concluded that the likelihood of the State of Goiás declining the utilisation of the tax credits or part thereof is remote.
The State of Minas Gerais v. Mineração Serra Grande S.A. (MSG):: In Brazil, MSG received a tax assessment in October 2003 from the State of Minas Gerais related to sales taxesVAT on gold.gold bullion transfers. The tax administrators rejected all MSG’s appealsthe company’s appeal against the assessment. The company subsequently appealedis now appealing the dismissal of the case to the State Court of Minas Gerais. The assessment is approximately $15 million (2013: $16 million).$13 million.
Departamento Nacional de Produção Mineral (DNPM) v. AngloGold Ashanti Brazil Mineração (AABM):: In Brazil, in November 2007, the DNPM, a Brazilian federal mining authority, issued a tax assessment against AABM in the amount of $18 million (2013: $19 million) relating to the calculation and payment by AABM of the financial contribution on mining exploitation in the period from 1991 to 2006.
In 2016, a partial settlement with the Brazilian tax authority reduced this assessment to $9m. AngloGold Ashanti’sAshanti Limited’s subsidiaries in Brazil are involved in various other disputes with tax authorities. These disputes involve federal tax assessments including income tax, royalties, social contributions and annual property tax. The amount involved is approximately $14 million (2013: $19 million).$15 million.
196
Notice from the Colombian Tax Office (DIAN) to AngloGold Ashanti Colombia S.A. (AGAC):: In January 2013, AngloGold Ashanti Colombia S.A. (AGAC)AGAC received notice from the Colombian Tax Office (DIAN)DIAN that it disagreed with the company’s tax treatment of certain items in the 2010 and 2011 income tax returns. On 23 October 2013, AGAC received the official assessments from the DIAN which established that an estimated additional tax of $27$21 million (2013: $35 million) will be payable if the tax returns are amended. Penalties and interest for the additional taxes are expected to be $135 million (2013: $153 million), based on Colombian tax law.$120 million. The company believes that itthe DIAN has applied the tax legislation correctly.incorrectly. AGAC requested in December 2013 that DIAN reconsider its decision. In November 2014, DIAN affirmed its earlier ruling. AGAC has until 16 April 2015 to challengesubsequently challenged the DIAN’s decisionruling by filing a lawsuitlawsuits in March 2015 and April 2015, before the Administrative Tribunal of Cundinamarca (trial(the trial court for tax litigation), which it intends to do.. In July 2016, the tribunal held initial procedural hearings on the tax disputes, and the litigation is proceeding.
Argentina Tax Authority (AFIP) and Cerro Vanguardia S.A. (CVSA): On 12 July 2013, Cerro Vanguardia S.A. (CVSA)CVSA received a notification from the Argentina Tax Authority (AFIP)AFIP requesting corrections to the 2007, 2008 and 2009 income tax returns of about $14$7 million (2013: $18 million) relating to the non-deduction of tax losses previously claimed on hedge contracts. The AFIP is of the view that the financial derivatives at issue shouldcould not have been accounted forbe considered as hedge contracts, as hedge contract losses could only be offset against gains derived from the same kind of hedging contracts. Penalties and interest on the disputed amounts are estimated at a further $39 million (2013: $45 million). A new notification was received$22 million. CVSA and AFIP have corresponded on 16 July 2014 fromthis issue over the tax authorities that disallowed arguments from CVSA’s initial response. CVSA prepared defence argumentspast several years, and evidence which were filed on 8 September 2014. Thethe government responded to the latest submission by CVSA on 22 December, 2014, and continues to assert its position regarding the use of the financial derivatives. CVSA preparedfiled an appeal with the Tax Court on 19 June 2015; and the matter is proceeding.
Ghanaian tax authorities v. AngloGold Ashanti (Ghana) Limited (AGAG): In Ghana, AGAG received tax assessments of $28 million as of 31 December 2013 in respect of the 2006-2008 and 2009-2011 tax years, following an audit by the tax authorities related to withholding taxes on payments to non-resident persons. AGAG believes that the withholding taxes were not properly assessed and has lodged an objection to the assessment. In 2012, AGAG met with the Commissioner-General and provided its position in writing together with the relevant supporting documentation. AGAG has yet to receive a response tofrom the government’sCommissioner-General. Nonetheless, in 2015 the tax authorities again raised the issue of paying withholding taxes as part of their findings which was filed on 9 March 2015.covering the 2012 – 2014 tax years.
SOUTH AFRICA
Silicosis litigation
Silicosis litigation:On 03 March 2011, inMankayi vs. AngloGold Ashanti, the Constitutional Court of South Africa held that section 35(1) of the Compensation for Occupational Injuries and Diseases Act, 1993 does not cover an “employee” who qualifies for compensation in respect of “compensable diseases” under the Occupational Diseases in Mines and Works Act, 1973 (ODMWA). This judgement allows such qualifying employee to pursue a civil claim for damages against the employer. Following the Constitutional Court decision, AngloGold Ashanti has become subject to numerous claims relating to silicosis and other Occupational Lung Diseases (OLD), including several potential class actions and individual claims. In November 2014, Anglo American South Africa, AngloGold Ashanti, Gold Fields Limited, Harmony Gold Mining Company Limited and Sibanye Gold The On 3• AngloGold Ashanti, the Constitutional Court of South Africa held that section 35(1) of the Compensation for Occupational Injuries and Diseases Act, 1993 does not cover an “employee” who qualifies for compensation in respect of “compensable diseases” under the Occupational Diseases in Mines and Works Act, 1973 (ODMWA). This judgement allows such qualifying employee to pursue a civil claim for damages against the employer. Following the Constitutional Court decision, AngloGold Ashanti has become subject to numerous claims relating to silicosis and other Occupational Lung Diseases (OLD), including several potential class actions and individual claims.announced in November 2014 that they hadLimited formed an industry working group on OLD to address issues relating to compensation and medical care for OLDoccupational lung disease in the gold mining industry in South Africa.companies have begun to engage all stakeholders on these matters, including government, organised labour, other mining companies and legal representatives of claimants who have filed legal suits against the companies. These legal proceedings are being defended, and the statusworking group now also includes African Rainbow Minerals (ARM). The working group remains of the proceedings are set forth below.Essentially, the companies are seekingview that achieving a comprehensive solution which dealsis both with the legacy compensation issuesfair to past, present and future legal frameworks,employees, and which, whilst being fairsustainable for the sector, is preferable to employees, also ensures the future sustainability ofprotracted litigation.
The companies are among respondent companies in a number of lawsuits related to OLD. The companies do not believe that they are liable in respect of the industry.claims brought, and they are defending these. They do, however, believe that they should work together to seek a solution to this South African mining industry legacy issue. The working group will continue with its efforts – which have been ongoing for more than two years – to find common ground with all stakeholders, including government, labour and the claimants’ legal representatives.
The Class Actions
On or about 21 August 2012, AngloGold Ashanti, was servedalong with an application instituted by Bangumzi Bennet Balakazi (“the Balakazi Action”) and others in which the applicants seek an order declaring that all mine workers (former or current) who previously worked or continue to work in specified South African gold mines for the period owned by AngloGold Ashanti and who have silicosis or other OLD constitute members of a class for the purpose of proceedings for declaratory relief and claims for damages. On 4 September 2012, AngloGold Ashanti delivered its notice of intention to defend this application.
In addition, on or about 8 January 2013, AngloGold Ashanti and its subsidiary Free State Consolidated Gold Mines (Operations) Limited, alongside other mining companies operating inincluding Anglo American South Africa, ARM, Gold Fields Limited, Harmony Gold Mining Company Limited, DRDGold Limited, Randgold and Exploration Company Limited, and Sibanye Gold Limited, were served with anothera consolidated class action application on 21 August 2013. On 13 May, 2016, the South Gauteng High Court of South Africa ruled in favour of the applicants and found that there were sufficient common issues to certify two industry-wide classes: a class (“the Nkala Action”). The applicants in the case seek to have the court certify two classes, namely: (i) currentSilicosis Class and former mineworkers who have silicosis (whether or not accompanied by any other disease) and who work or have worked on certain specified gold mines at any time from 1 January 1965 to date; and (ii) the dependantsa Tuberculosis Class, each of mineworkers who died as a result of silicosis (whether or not accompanied by any other disease) and who worked on these gold mines at any time after 1 January 1965. AngloGold Ashanti filed a notice of intention to oppose the application.
197
On 21 August 2013, an application was served on AngloGold Ashanti for the consolidation of the Balakazi Action and the Nkala Action, as well as a request for an amendment to change the scope of the classes. The applicants now request certification of two classes (the “silicosis class” and the “tuberculosis class”). The silicosis class would consist of certainwhich covers current and former underground mineworkers who worked in South African mines from 12 March 1965 and who have contracted silicosis, and the dependantsrespective diseases (or the dependents of certain deceased mineworkers who have died of silicosis (whether or not accompanied by any other disease). The tuberculosis class would consist of certain current and former mineworkers who have or had contracted pulmonary tuberculosis and the dependants of certain deceased mineworkers who died of pulmonary tuberculosis (but excluding silico-tuberculosis)those diseases).
In the event the class is certified, such class of workers would be permitted to institute actions by way of The High Court ordered a summons against AngloGold Ashanti for amounts as yet unspecified. The partiestwo-stage process in the class action metaction. The first stage is to resolve common issues and allow the individuals to opt out. The second stage will allow the individuals to opt in to the class to make their claims against the respondent mining companies. The High Court also decided that claims for general damages (i.e., pain and suffering and loss of amenities of life) will be transferable to the estate or executor of any deceased mineworker who dies after the date of filing of the certification application. On 3 June 2016, AngloGold Ashanti, together with certain of the other mining companies, filed an application with the court (South Gauteng High Court Johannesburg) and have tentatively agreed on a timetable for leave to appeal to the court process whereinSupreme Court of Appeal (SCA). On 24 June 2016, leave to appeal was (i) granted in respect of the application to certifyissue of the class action will be heardtransferability of deceased mineworkers’ claims for general damages but (ii) denied in October 2015.
The Individual Claims
In October 2012,respect of all other orders of the High Court. On 15 July 2016 AngloGold Ashanti, received 31 individual summonses and particularsalong with several other respondent companies, filed a petition with the SCA for leave to appeal such other orders of claim relating to silicosis and/or other OLD. The total amount claimed in the 31 summonses is approximately $7 million as at the 31 December 2014 closing rate. On or about 3 March 2014, AngloGold Ashanti received an additional 21 individual summonses and particulars of claim relating to silicosis and/or other OLD. The total amount claimed in the 21 summonses is approximately $4 million as at the 31 December 2014 closing rate. On or about 24 March 2014, AngloGold Ashanti received a further 686 individual summonses and particulars of claim relating to silicosis and/or other OLD. The total amount claimed in the 686 summonses is approximately $100 million as at the 31 December 2014 closing rate. And on or about 1 April 2014, AngloGold Ashanti received a further 518 individual summonses and particulars of claim relating to silicosis and/or other OLD. The total amount claimed in the 518 summonses is approximately $81 million as at the 31 December 2014 closing rate. All these claims were filed in the South Gauteng High Court, Johannesburg.
On 9 October 2014, AngloGold Ashanti and on 13 September 2016, the plaintiffs’ attorneys agreedSCA granted the mining companies leave to refer all ofappeal the individual claimsentire High Court ruling to arbitration. The court proceedings have been suspended as a result of entering into the arbitration agreement.SCA.
It is possible that additional class actions and/or individual claims relating to silicosis and/or other OLD will be filed against AngloGold Ashanti in the future. AngloGold Ashanti will defend all current and subsequently filed claims on their merits. Should AngloGold Ashanti be unsuccessful in defending any such claims, or in otherwise favourably resolving perceived deficiencies in the national occupational disease compensation framework that were identified in the earlier decision by the Constitutional Court, such matters would have an adverse effect on its financial position, which could be material. TheGiven the inherent legal and factual uncertainties with respect to the pending claims and other claims not yet filed with the company, is unable to reasonablyno reliable estimate its share ofcan be made for the amounts claimed.obligation.
Chamber of Mines of South Africa acting in its own name and o.b.o. Harmony Gold Mining Company Ltd, AngloGold Ashanti Ltd and Sibanye Ltd v AMCU (First Respondent): At the start of 2014, the Association of Mineworkers and Construction Union (AMCU) embarked upon protracted strike action in the platinum sector after reaching deadlock during wage negotiations with Anglo Platinum, Impala Platinum and Lonmin respectively. In the Gold Sector, following the extension of the 2013 Wage Agreement to all employees irrespective of their union affiliation, AMCU, on 20 January 2014, served strike notices at three gold companies to challenge the extension of the 2013 Wage Agreement to members of AMCU. An interim interdict was granted to the Chamber of Mines by the Labour Court in Johannesburg on 30 January 2014, declaring the intended strike unprotected and prohibiting unprotected strike action as well as any conduct that might encourage workers to embark on strike action. AMCU was ordered to return to court on 14 March 2014 to explain why the interim interdict should not be made permanent. This deadline was subsequently postponed to 5 June 2014. On 23 June 2014, the Labour Court upheld the interim interdict. AMCU has appealed this ruling to the Labour Appeal Court, and AngloGold Ashanti’s submissionsafter the Appeal Court also upheld the interdict, AMCU appealed to the Constitutional Court. On 21 February 2017, the Constitutional Court dismissed the appeal by AMCU and held that the 2013 Wage Agreement was validly extended to AMCU members and the relevant statutory provisions were submitted by 20 March 2015.constitutionally compliant.
198
COLOMBIA
La Colosa class action lawsuits: Four (4) class action lawsuits are pending before Colombian state and federal courts in relation to AngloGold Ashanti Colombia S.A. (AGAC)’s Santa Maria-Montecristo and La Colosa project,projects, which is currentlyare in itstheir pre-feasibility phase and consists of three core concession contracts:
Usocoello, Cortolima, Procuraduria Regional Tolima, Universidad de Ibagué, Estudiantes de la Universidad del Rosario, Federarroz v. AGAC, Federal Department of Mines, Federal Department of the Environment, Housing and Territorial Development and Ingeominas (September 2010) (Uscocoello);
The Personero de Ibagué v. Federal Department of the Environment, Housing and Territorial Development, Ingeominas, AGAC, Continental Gold Ltda., Oro Barracuda Ltda., Fernando Montoya, Alberto Murillo and Eugenio Gomez (December 2011) (Toche Anaima Belt);
Juan Ceballos v. Federal Department of the Environment, Housing and Territorial Development, Ingeominas, Cortolima and AGAC (February 2012); and
Ibague’s Ombudsman v. Federal Department of Environment, Housing and Territorial Development, National Mining Agency, AGAC (July 2013) (Corridors).
phase. Each lawsuit aims to stop exploration and mining in certain restricted areas affected by the La Colosa projectprojects due to environmental concerns or alleged breaches of environmental laws. Under Colombian law, restricted areas are State-protected land on which certain economic activities are restricted.
The first class action lawsuit was Uscocoello, which was filed beforeIn one of these lawsuits, the Third Administrative Court of the District of Ibagué on 9 September 2010 as the court of first instance. It named each of Ingeominas (the Colombian regulatory agency for mining activities), the Federal Department of the Environment, Housing and Territorial Development, as well as the Federal Department of Mines as defendants. AGAC was subsequently joined to the lawsuit as an additional defendant. The plaintiffs are the User Association of the Land Adequation District of Coello and Cucuana Rivers (Usocoello) (a cooperative representing local farmers), the Autonomous Regional Corporation of Tolima (“Cortolima”), (the government of the State of Tolima), the Office of the Attorney General of the State of Tolima (Procurador Judicial Ambiental y Agrario para el Tolima), the University of Ibagué (Estudiantes de la Universidad del Rosario), (a student association of the University of El Rosario) and Fedearroz (the Colombian association of rice growers).
In Uscocoello, the plaintiffs petitioned the court to order the defendant governmental entities not to declare the La Colosa mining project feasible on the grounds that the project threatens a healthy environment, public health and food safety for Usocoello members and local residents. Such order by the court would result in the revocation of AGAC’s temporary use permit for its exploration activities on 6.39 hectares of forest reserve that are otherwise designated as restricted areas.
In addition, as each of AGAC’s three core mining concession contracts governing the La Colosa project provides that Ingeominas has the discretion to declare the underlying concession void if AGAC breaches applicable environmental laws or regulations, the plaintiffs have petitioned the court to direct Ingeominas to cancel such concession contracts on the ground that AGAC has violated the Code of Natural Resources. If plaintiffs prevail and Ingeominas is ordered to cancel AGAC’s three core concession contracts, the company would be required to abandon the La Colosa project and all of AGAC’s other existing mining concession contracts and pending proposals for new mining concession contracts would also be cancelled. If the Third Administrative Court issues an adverse ruling against AGAC, the ruling can be appealed.
As no settlement was reached at a special conciliation hearing (Pacto de Cumplimiento) held on 27 April 2011, the trial has continued and the court is gathering evidence from the parties in preparation for its ruling.
In connection with the Toche Anaima Belt lawsuit, the Superior Court of the District of Ibagué granted the plaintiff a preliminary injunction, suspending the mining concession contracts relating to certain greenfield exploration activities of the Santa Maria-Montecristo project in September 2011. AGAC has appealed theThe injunction but the company does not believe that the mining concession contracts at issue constitute a critical path item for the project.
With respect to the Juan Ceballos lawsuit, the plaintiff requested the cancellation of the La Colosa mining project tenements, based on allegations that gold mining represents an environmental risk to the Tolima community. In November 2014, the Court requested that the defendants answer a questionnaire before the Court rules on the matter. AGAC and the Colombian government entities appeared before the Court and answered its questions. AGAC is awaiting a decision in this matter.
199
Finally, in connection with the Corridors lawsuit, the plaintiffs requested the banning of AGAC’s Corridor Project due to the alleged detrimental environmental impact of the proposed mining in the area. However, AGAC has not proceeded with the Corridor Project due to technical considerations. Accordingly, AGAC has asked the Court to dismiss the lawsuit (without prejudice)
remains in place and has been challenged by AGAC; however, it is not a critical path item for the project. In another lawsuit, on 10 October 2016, Tolima’s Administrative Court ordered that a technical study be prepared by April 2017 by a panel of seven (7) experts (selected by the plaintiff, AGAC, universities, the government and an NGO) to determine whether the La Colosa project presents a “threat” to the environment during its exploration phase. If the study were to conclude that a “threat” exists, certain activities at La Colosa may be suspended. AGAC successfully appealed the order to prepare the technical study and the order has been temporarily suspended, pending resolution by the State Council (appellate court). |
While plaintiffs in all cases have petitioned the court to cancel concession contracts for the La Colosa mining project,projects, the company believes that courts and judges in Colombia do not have the authority to order such cancellations. Such power, by law, vests solely in the mining authority, which has the discretion to declare concessions void if a contractor breaches applicable environmental laws or regulations. To date, the company is not aware of the Colombian government having ever declared a concession void for these reasons. AGAC continues to oppose, through a variety of integrated legal and political strategies, the class action lawsuits that have been filed against itit. If plaintiffs prevail and believes thatAGAC’s three core concession contracts are cancelled, the cases are likelycompany would be required to abandon the La Colosa project and all of AGAC’s other existing mining concession contracts and pending proposals for new mining concession contracts would also be resolved favorably.cancelled.
Cortolima’s injunction against AGAC: On 11 March 2013, Cortolima issued a regulatory injunction against AGAC alleging, among other things, that in relation to certain of AGAC’s La Colosa exploration activities, AGAC was operating without proper permits and regulatory permission and was engaging in drilling and other activities that were having negative effects on the environment. On 22 March 2013, AGAC appealeddelivered a resolution against the injunction, seeking an annulment of the action and the restoration of AGAC’s rights to continue exploration activities in the area. On 27 May 2013, AGAC’sWhile the injunction remains in place, AGAC will not be able to engage in certain of its activities related to the La Colosa Project. The request to haveannul the injunction order annulled was denied by the Director of Cortolima, and as a result,AGAC is continuing with its plans to challenge the injunction remains in place.through a variety of legal actions. On 31 August 2013, AGAC presented before the State Council itsthe claim for the annulment of the injunction and rights re-establishment. This matter is pending admission. While the injunction remains in place, AGAC is unable to engage in certain activities related to the La Colosa Project.pending.
AngloGold Ashanti anticipates that Cortolima may issue a formal sanction against AGAC. In response, AGAC has filed a disciplinary and criminal complaint against both the Director of Cortolima and its legal counsel based on its approval and issuing of the injunction that AngloGold Ashanti asserts exceeds Cortolima’s authority and is in violation of Colombian law. AGAC has asked the General (Federal) Public Attorney (Procuraduría General) (the “Public Attorney”) to assume control of the case, and has requested a new reconciliation hearing. The Public Attorney is currently investigating the matter.
Department of the Environment, Housing and Territorial Development (DoE) v. AngloGold Ashanti Colombia S.A. (AGAC): On 29 April 29, 2009, the DoE opened an investigation against AGAC and brought a list of charges against it for carrying out exploratory activities at the La Colosa project without having obtained the applicable permit to partially or temporarily use the soil of a forest reserve that was designated as a restricted area. In 2010, while conducting its investigation against AGAC, the DoE also proceeded to update the existing mining terms of reference, which set forth the environmental studies and other environmental activities that each mining company is required to conduct in connection with the exploration phase of its respective mining project. The new terms of reference specify that exploration may not be carried out in restricted areas without a permit sanctioning such exploration. The DoE then resolved that AGAC was in breach of the 2010 terms of reference and issued a fine of $70,000 against the company. AGAC subsequently filed an action against the DoE in the Administrative Superior Court of the Cundinamarca District to annul the fine. Since April 16, 2012 the process has been with the Court Office for admission. In November of 2012, AGA filed a tutela action, which is a legal action alleging a violation of AGA’s constitutional rights. This process often is used to push for a rapid decision by the courts regarding an ongoing dispute. A hearing on the tutela has not yet been scheduled. AGAC hasfine but paid the fine of US$ 70,000 while awaiting the results of the legal actions filed.
Shouldactions. On 27 March 2015, the DoE’sAdministrative Superior Court annulled the fine. The DoE appealed this ruling. In January 2017, the appellate court reinstated the fine ultimatelyagainst the company. Although the amount of the fine is not significant, the finding that the company breached the terms of reference could be upheldused as the basis for a legal action by the courts, Ingeominas would then havegovernment that could prohibit the discretioncompany from entering into any contracts, including mining contracts, with the government for a period of time or to terminate AGAC’s three core mining concession contracts relating to the La Colosa project. AGAC is currently evaluating its options with respect to this matter.
Piedras: In 2013 the Council for the city of Piedras, near the La Colosa project, issued a referendum attempting to ban all mining activities in Piedras. This referendum does not have an immediate impact on the La Colosa project, however, AGAC believes this referendum is in violation of federal law. The referendum was subsequently validated by the local administrative court in Tolima (the Department in which Piedras is located). AGAC subsequently filed a request for annulment of the referendum with the Second Administrative Court of Ibaque and a tutela (a legal action alleging a violation of AGAC’s constitutional rights) with the State Council (Supreme Court for administrative purposes). On 21 August 2014, the State Council dismissed the tutela action for lack of standing, which AGAC appealed to a different division of the State Council. On 11 December 2014, this State Council division affirmed the earlier dismissal on the grounds that AGAC did not have mining tenements in Piedras. However, in the same ruling the court recognised that Piedras did not follow the correct procedure when it issued the 2013 referendum. AGAC’s request for annulment of the referendum is pending.
La Colosa Human Rights Litigation: In November 2014, the Personero (Ombudsman) of IbagueIbaque filed suit against the Colombian government in the Inter-American Court of Human Rights. This Court is an autonomous judicial institution whose purpose is the application and interpretation of the American Convention on Human Rights (Colombia, along with many other Central and South American countries, has ratified this Convention). The suit alleges that the government has failed to protect the interests of the peoples of Ibague by issuing permits for the La Colosa project and by failing to resolve the legal challenges that have been pending for an extended period of time. Although AGAC is not a party to the suit, it is important to the development of the La Colosa project. The first step in the litigation process is for the Court to decide whether to accept the case. If the case is accepted, the government will have to defend itself against the lawsuit and will be bound by the findings of the Court. AGAC is currently assessing this process in order to defend its interests.
200
many other Central and South American countries, has ratified this Convention). The suit alleges that the government has failed to protect the interests of the peoples of Ibaque by issuing permits to AGAC for the La Colosa project and by failing to resolve the class actions that have been pending for an extended period of time. Although AGAC is not a party to the suit, its outcome is important to the development of the La Colosa project. The first step in the litigation process is for the Court to decide whether to accept the case. If the case is accepted, the Colombian government will have to defend itself against the lawsuit and will be bound by the findings of the Court. |
GHANA
Westchester Resources Limited (Westchester) / Africore Ghana Limited (Africore) vs. AngloGold Ashanti (Ghana) Limited (AGAG): This matter arises from two identical exploration agreements concluded between each of Westchester Resources Limited (“Westchester”) and Africore Ghana Limited (“Africore”) (together referred to as “the Plaintiffs”) and AngloGold Ashanti (Ghana) Limited (“AGAG”) on 31 October 2000. In each agreement, the Plaintiff, the holder of a Prospecting license from the Minerals Commission, granted to AGA, the right to explore the concession for a year. The Plaintiffs commenced separate actions in the High Court claiming that AGAG breached the agreements. The cases were consolidated and heard as such. On 31 March 2011 the High Court, Accra, gave judgement in favour of the Plaintiffs and awarded US$17,400,000 damages against AGAG for breach of the agreements. AGAG filed an appeal to the Court of Appeal and subsequently applied to the trial Court for an order for a stay of execution of judgement pending the hearing and determination of the appeal. The Court of Appeal subsequently altered the High Court decision by ordering AGAG to pay each Plaintiff the sum of US$1 million and deposit US$4 million with the Registrar for investment pending the determination of the appeal. On 20 December, 2012, the Court of Appeal affirmed the judgement of High Court and dismissed AGAG’s appeal. AGAG filed an appeal to the Supreme Court contesting the decision of the High Court as affirmed by the Court of Appeal. The hearing on the appeal was fixed for 8 July 2014, however on that day the court adjourned the hearing indefinitely. We await a new hearing date. AGA has attempted to settle this matter on three occasions at US$2 million, US$4 million and US$6 million respectively, but the Plaintiffs have rejected each proposal.
Pompora Treatment Plant LitigationLitigation::On 2 April 2013, AGAG received a summons from Abdul Waliyu and 152 others in which the plaintiffs allege that they were or are residents of the Obuasi municipality or its suburbs and that their health has been adversely affected by emissions and/or other environmental impacts arising in connection with the current and/or historical operations of the Pompora Treatment Plant (PTP), which was decommissioned in 2000. The plaintiffs’ alleged injuries include respiratory infections, skin diseases and certain cancers. The plaintiffs havesubsequently did not filedtimely file their application for directions which was due in the High Court by 31 October 2013.but AGAG is allowingintends to allow some time to pass prior to applying to have the matter struck outdismissed for want of prosecution. On 24 February 2014, executive members of the PTP (AGAG) Smoke Effect Association (PASEA) (Frank Adjei Danso and five others), sued the CompanyAGAG by themselves and on behalf of their members (undisclosed number) on grounds similar to those discussed above, as well as economic hardships as a result of constantresulting from the failure of their crops. To date, plaintiffs have failed to amend their writ and file their statement of claim with the High Court.This matter has been adjourned indefinitely. In view of the limitation of current information for the accurate estimation of a liability, no reliablereasonable estimate can be made for AGAG’s obligation in either matter.
Mining and Building Contractors LimitedLimited::On 11 October 2011, AGAG terminated Mining and Building Contractors Limited’s (“MBC”) underground development agreement, construction on bulkheads agreement and diamond drilling agreement at Obuasi. The Parties reached agreement on the terms of the separation and concluded a separation agreement on 8 November 2012. On 23 July 2013 and 20 February 2014, AGAG was served with writsa writ issued by MBC claiming a total of US$97$97 million. AGAG filed a conditional entry of appearance and a motion of stay ofIn December 2015, the proceedings were stayed in the High Court pending arbitration. On 5 May 2014 the court denied our application to submitIn February 2016, MBC submitted the matter to arbitration. AGA subsequently appealed this decision toarbitration and the Courtparties await the constitution of Appeal. We further filed a Stay of Proceedings at the lower court which was granted on 11 June 2014. On 2 October 2014 we were notified that the records had been transmitted to the Court of Appeal. However, as the transmitted records were incomplete, AGAG timely filed an application for the record to be amended prior to filing its statement of case. The matter remains pending.tribunal.
Ghanaian tax authorities v.Obuasi Arbitration: On 8 April 2016, AngloGold Ashanti (Ghana) Limited (AGAG): In filed a request for arbitration against the Republic of Ghana (GoG). AGAG received tax assessmentsfiled this request with the International Centre for Settlement of $28 million as of 31 December 2013Investment Disputes (ICSID), an international arbitration institution headquartered in respect ofWashington, D.C., which facilitates dispute resolution between international investors and host states. AGAG is seeking relief from GoG for breaching the 2006-2008 and 2009-2011 tax years, following an audit by the tax authorities related to indirect taxes on various items. AGAG believes that the indirect taxes were not properly assessed and has lodged an objectionmining lease relating to the assessment. AGAG has subsequently met with the Commissioner-General and provided its position in writing together with the relevant supporting documentation. AGAG has yet to receive a responseObuasi mine by withdrawing military personnel from the Commissioner-General.Obuasi mine and subsequently failing to restore law and order. In so doing, GoG has allowed and facilitated illegal mining activity at Obuasi. These actions have prevented AGAG from peacefully enjoying the areas exclusively leased to it under the mining lease. GoG may raise counterclaims against AGAG in response to AGAG’s request for arbitration. In October 2016, the tribunal at ICSID (the Tribunal) was formally constituted. On 17 February 2017, the Tribunal joined GoG’s jurisdiction objections with proceedings on the merits. The matter is ongoing.
201
GUINEA
Government of Guinea (National Claim Commission) v. Société AngloGold Ashanti Goldfields de Guinée SA (SAG): A national claim recovery commission established by the government has demanded that SAG pay $43 million in dividends and penalties that would allegedly have been owed to the government for the accounting years 2004 – 2007. SAG opposes the claim. The two parties had originally decided to submit their dispute to an independent audit firm to be appointed by a common accord; however, the independent audit firm was never appointed. In December 2010, the national claim recovery commission was disbanded and the matter was turned over to the Inspector General of the Ministry of Finance. This matter has been dormant since it was handed over to the Inspector General.
NORTH AMERICA
Designated Matters under the Stock Purchase Agreement between AngloGold Ashanti and Newmont:On 3 August 2015, AngloGold Ashanti and Newmont Mining (“Newmont”) concluded the sale of the Cripple Creek & Victor Gold Mine (“CC&V”) in Colorado to Newmont. As part of the negotiated transaction, the parties agreed to a cost/recovery sharing arrangement (the “Arrangement”) relative to cost claims asserted for or against CC&V based on work performed by contractors during the design and manufacture of the High Grade Mill. Under the agreement, AGA had the right to manage any negotiation, settlement, or legal proceedings associated with each cost claim. On 31 October 2016, CC&V and the two contractors entered into a settlement wherein CC&V paid approximately $1.5 million to one contractor and $4 million to the other contractor. Separately, CC&V has cost claims against the mill design contractor, which claims are proceeding in arbitration.
TANZANIA
Jackson Manyelo & others vs. Geita Gold Mining Limited (GGM): In January 2007, the plaintiffs filed a suit against GGM in the Mwanza High Court alleging that they were affected by blasting activities in the Katoma area carried out by GGM and had suffered damages in the amount of Tshs9.6 billion (approximately $6 million). The parties then attemptedOn 30 April 2015, the High Court issued a judgement in favour of GGM. Plaintiffs have appealed to solvethe Court of Appeal, where the matter through mediation, but were unsuccessful. The matter is currently being heard in the Mwanza High Court: it is not known when the Court will issue a decision.pending.
Dividends are proposed by and approved by the board of directors of AngloGold Ashanti, based on the company’s financial performance. Dividends are recognised when declared by the board of directors of AngloGold Ashanti. DuringAngloGold Ashanti’s dividend policy allows the third quarterBoard to declare an annual dividend to be based on 10 percent of 2011, the company changedfree cash flow generated by the timingbusiness for that financial year, before taking into account growth capital expenditure. The Board may exercise its discretion on an annual basis, taking into consideration the prevailing market conditions, balance sheet flexibility and future capital commitments of dividend payments to quarterly rather than half-yearly. However, in 2014, the Company has reverted to half-yearly dividend timetables.group.
Dividends may be declared in any currency at the discretion of the AngloGold Ashanti board or AngloGold Ashanti shareholders at a general meeting. Currently, dividends are declared in South African rands and paid in Australian dollars, South African rands and Ghanaian cedis. Dividends paid to registered holders of AngloGold Ashanti ADSs are paid in US dollars converted from South African rands by The Bank of New York Mellon, as depositary, in accordance with the deposit agreement. Exchange rate fluctuations may therefore affect the value of the dividends received by registered shareholders and distributions paid by the relevant depositary to investors holding AngloGold Ashanti securities. Moreover, fluctuations in the exchange rates of the US dollar may affect the US dollar price of the ADSs on the NYSE. For details on taxation and exchange controls applicable to holders of ordinary shares or ADSs, see “Item 10D.:10D: Exchange controls”Controls”, “Item 10E: Taxation–South African Taxation—Taxation of dividends” and “Item 10E.: Taxation – 10E: Taxation–United States Taxation—Taxation of dividends”.
Dividends declared (in the ordinary course from trading and non tradingnon-trading profits) to foreign shareholders are not subject to the approval by the South African Reserve Bank (SARB) in terms of South African foreign exchange control regulations. Dividends are freely transferable to foreign shareholders from both trading and non-trading profits earned in South Africa by publicly listed companies.Dividendscompanies. Dividends in specie or special dividends may require SARB approval prior to declaration and payment to foreign shareholders.
AngloGold Ashanti has not declared dividends since the first quarter of 2013, but it expects to continue to pay dividends, although there can be no assurance that dividends will be paid in the future or as to the particular amounts that will be paid from year to year. The payment of future dividends will depend upon the board’s ongoing assessment of AngloGold Ashanti’s earnings, after providing for long-term growth, cash/debt resources, compliance with the solvency and liquidity requirements of the Companies Act of 2008 (as amended), the amount of reserves available for dividend, based on the going-concern assessment, any restrictions placed on AngloGold Ashanti by debt facilities, protection of existing credit rating and other factors.
Under South African law, the company may declare and pay dividends from any reserves included in total shareholder’s equity (including share capital and share premium) calculated in accordance with International Financial Reporting Standards (IFRS), subject to the solvency and liquidity test.
202
Withholding tax
South Africa currently imposes a Dividend Withholding Tax on Companies (dividends tax) at a rate of 1520 percent on the net amount of the dividend declared by a resident company, other than a Headquarter Company. On 22 February 2017, the rate increased from 15 percent to 20 percent for any dividends paid after 1 March 2017.
The dividends tax is generally imposed on the beneficial owner. The dividends tax could be reduced to a lower rate under an applicable double tax treaty, if all requirements are met. In the case of dividends paid to a US holder with respect to shares, the Treaty would generally limit the dividends tax rate to 5five percent of the gross amount of the dividends if a corporate US holder (it must be a corporate) holds directly at least 10 percent of the voting stock of AngloGold Ashanti. In all other cases, the maximum tax rate under the Treaty is 1520 percent of the gross amount of the dividend. There are different rules to consider if the beneficial owner of the dividends is a US resident who carries on business in South Africa through a permanent establishment situated in South Africa, or performs in South Africa independent personal services from a fixed base situated in South Africa, and the dividends are attributable to such permanent establishment or fixed base. Moreover, if the dividends tax rate is reduced under the auspices of an applicable double tax treaty, there are certain South African compliance requirements that must be met in order to access the double tax treaty relief.
| 8B. | SIGNIFICANT CHANGES |
Refer “Item 18 – Financial Statements –18: Note 39 “Subsequent Events””34—Recent developments”.
203
| 9A. | OFFER AND LISTING DETAILS |
The following table sets out, for the periods indicated, the reported high and low market quotations for AngloGold Ashanti’s ordinary shares on the JSE and for its sponsored ADSs on the NYSE:
| JSE | NYSE(1) | JSE | NYSE(1) | |||||||||||||
| Year ended 31 December | High | Low | High | Low | High | Low | High | Low | ||||||||
| (South African cents per ordinary share) | (US dollars per ADS) | (South African cents per ordinary share) | (US dollars per ADS) | |||||||||||||
Annual information | ||||||||||||||||
2010 | 36,631 | 26,640 | 52.86 | 34.11 | ||||||||||||
2011 | 39,182 | 27,333 | 51.69 | 38.97 | ||||||||||||
2012 | 36,500 | 25,199 | 47.17 | 29.51 | 36,500 | 25,199 | 47.17 | 29.51 | ||||||||
2013 | 27,048 | 11,401 | 31.88 | 11.14 | 27,048 | 11,401 | 31.88 | 11.14 | ||||||||
2014 | 20,952 | 8,836 | 19.53 | 7.45 | 20,952 | 8,836 | 19.53 | 7.45 | ||||||||
| 2015 | 14,999 | 7,159 | 13.12 | 5.64 | ||||||||||||
| 2016 | 31,775 | 10,700 | 22.91 | 7.09 | ||||||||||||
2013 | ||||||||||||||||
| 2015 | ||||||||||||||||
First quarter | 27,048 | 21,031 | 31.88 | 23.08 | 14,999 | 9,838 | 13.12 | 8.41 | ||||||||
Second quarter | 21,796 | 13,075 | 23.55 | 13.08 | 14,253 | 10,609 | 11.80 | 8.43 | ||||||||
Third quarter | 15,478 | 11,401 | 15.23 | 11.62 | 11,754 | 7,159 | 8.97 | 5.64 | ||||||||
Fourth quarter | 16,524 | 11,545 | 16.49 | 11.14 | 13,472 | 8,647 | 9.95 | 6.20 | ||||||||
2014 | ||||||||||||||||
| 2016 | ||||||||||||||||
First quarter | 20,952 | 12,187 | 19.53 | 11.36 | 22,360 | 10,700 | 14.31 | 7.09 | ||||||||
Second quarter | 19,599 | 15,779 | 18.79 | 15.32 | 27,892 | 19,664 | 18.49 | 13.16 | ||||||||
Third quarter | 20,005 | 13,360 | 18.69 | 11.95 | 31,775 | 20,792 | 22.91 | 15.00 | ||||||||
Fourth quarter | 13,659 | 8,836 | 12.22 | 7.45 | 22,055 | 12,906 | 15.92 | 9.32 | ||||||||
September 2014 | 18,395 | 13,360 | 16.88 | 11.95 | ||||||||||||
October 2014 | 13,659 | 8,916 | 12.22 | 8.07 | ||||||||||||
November 2014 | 11,282 | 9,382 | 10.32 | 8.40 | ||||||||||||
December 2014 | 10,490 | 8,836 | 9.44 | 7.45 | ||||||||||||
January 2015 | 13,899 | 9,838 | 12.38 | 8.41 | ||||||||||||
February 2015 | 14,999 | 12,482 | 13.12 | 11.07 | ||||||||||||
March 2015(2)
| 13,470 | 10,470 | 11.37 | 8.44 | ||||||||||||
| September 2016 | 25,400 | 20,792 | 17.86 | 15.00 | ||||||||||||
| October 2016 | 22,055 | 17,925 | 15.92 | 12.92 | ||||||||||||
| November 2016 | 20,000 | 14,888 | 14.77 | 10.45 | ||||||||||||
| December 2016 | 15,925 | 12,906 | 11.61 | 9.32 | ||||||||||||
| January 2017 | 17,584 | 14,716 | 12.78 | 10.68 | ||||||||||||
| February 2017 | 18,711 | 14,415 | 13.68 | 10.90 | ||||||||||||
| March 2017(2) | 14,560 | 12,502 | 11,41 | 9.67 | ||||||||||||
| (1) | Each ADS represents one ordinary share. |
| (2) | Through |
See “Item 7A.:7A: Major shareholders”Shareholders” for the number of ADSs outstanding at 31 December 2014.2016.
| 9B. | PLAN OF DISTRIBUTION |
Not applicable.
204
| 9C. | MARKETS |
NATURE OF TRADING MARKET
The principal trading markets for AngloGold Ashanti’s ordinary shares are the New York Stock Exchange, in the form of ADSs, under the symbol “AU” and the JSE Limited, in the form of ordinary shares, under the symbol “ANG”.
AngloGold Ashanti’s ordinary shares are also listed on the Ghana Stock Exchange under the symbol “AGA”, the Australian Securities Exchange, in the form of Chess Depositary Interests (each representing one-fifth of an ordinary share) under the symbol “AGG” and on the Ghana Stock Exchange, in the form of Ghanaian Depositary Shares or GhDSs (each representing one one-hundredth of an ordinary share) under the symbol “AADS”. In September 2014 the company delisted from the London Stock Exchange and terminated the related depositary interest programme with effect from 15 October 2014.
| 9D. | SELLING SHAREHOLDERS |
Not applicable.
| 9E. | DILUTION |
Not applicable.
| 9F. | EXPENSES OF THE ISSUE |
Not applicable.
205
ITEM 10: ADDITIONAL INFORMATION
| 10A. | SHARE CAPITAL |
For a discussion of options on AngloGold Ashanti’s ordinary shares available to executive officers from time to time, see “Item 6E: Share Ownership–Share Ownership of Executive Officers/Executive Management”.
Authorised and Issued Shares
At the annual general meeting of shareholders held on 15 May 2009, shareholders approved an increase in the company’s authorised ordinary share capital. AngloGold Ashanti’s authorised and issued share capital as of 31 December 20142016 and 2322 March 20152017 (being the latest practicable date prior to the publication of this document) is set out below:
| Title of Class | Authorised | Issued | Authorised | Issued | ||||||||||||||||||||
| 23 March 2015 | 31 December 2014 | 22 March 2017 | 31 December 2016 | |||||||||||||||||||||
Ordinary shares at par value of R0.25 each | 600,000,000 | 404,436,403 | 404,010,360 | 600,000,000 | 408,812,715 | 408,223,760 | ||||||||||||||||||
E ordinary shares at par value of R0.25 each | 4,280,000 | - | - | |||||||||||||||||||||
A redeemable preference shares at par value of R0.50 each | 2,000,000 | 2,000,000 | 2,000,000 | 2,000,000 | 2,000,000 | 2,000,000 | ||||||||||||||||||
B redeemable preference shares at par value of R0.01 each | 5,000,000 | 778,896 | 778,896 | 5,000,000 | 778,896 | 778,896 | ||||||||||||||||||
C redeemable preference shares at no par value | 30,000,000 | - | - | |||||||||||||||||||||
All of the issued ordinary shares, E ordinary shares, A redeemable preference shares, and B redeemable preference shares are fully paid and are not subject to further calls or assessment by AngloGold Ashanti.
The table below details changes in the issued ordinary share capital of AngloGold Ashanti since 31 December 20112013 through 31 December 2014.2016.
| Period to | Description | Number of Shares | ||||||
31 December | ||||||||
Ordinary shares issued during | AngloGold Share Incentive Scheme | |||||||
| ||||||||
|
| |||||||
Employee Share ownership programme – on conversion of E ordinary shares | ||||||||
| ||||||||
31 December | 404,010,360 | |||||||
Ordinary shares issued during | AngloGold Share Incentive Scheme | |||||||
| 405,265,315 | |||||||
Ordinary shares issued during 2016 | AngloGold Share Incentive Scheme | 2,958,445 | ||||||
31 December | ||||||||
Shares held by AngloGold Ashanti or by its Subsidiaries
See “Item 18: Note 22 – Share capital and premium” for more information.
A and B Redeemable Preferencepreference shares
All of the A redeemable preference shares and B redeemable preference shares are held by Eastvaal Gold Holdings Limited, one of AngloGold Ashanti’s wholly-owned subsidiary. AngloGold Ashanti’s Memorandum of Incorporation provide that the A redeemable preference shares and B redeemable preference shares are not transferable.
206
E ordinaryC preference shares
On 11 December 2006,4 May 2016, shareholders inat the annual general meeting authorised the creation of a maximumnew class of 4,280,000 E ordinary shares to be issued pursuant to an Employee Share Ownership Plan (ESOP) and a black economic empowerment transaction with Izingwe Holdings (Pty) Limited (Izingwe) – (collectively, the BEE transaction). The E ordinary shares will not be listed.
All the E ordinary shares have vested and were cancelled in exchange for ordinarypreference shares in accordance with the amended cancellation formula during the 2014 financial year. There are as at 31 December 2014 no E ordinary shares in issue. A Special Resolution to cancel the E ordinary shares is being proposed to the shareholders at the Annual General Meeting on 6 May 2015.
The table below details changes in the E-ordinary issued share capital of AngloGold Ashanti since 31 December 2011 through 31 December 2014.the company, known as ‘C preference shares’. The terms of the C preference shares are the same as those of the existing B preference shares. However, the C preference shares rank after the B preference shares for purposes of dividends and payments upon redemption.
| ||||||
|
| |||||
| ||||||
|
| |||||
| ||||||
|
| |||||
| ||||||
Unissued shares
In terms of a general authority from shareholders in annual general meeting, granted on 144 May 2014,2016, the directors of the Company are authorised to allot and issue, for such purposes and on such terms as they may, in their discretion, determine, ordinary shares of 25 SA cents each (shares) in the authorised but unissued share capital of the Company up to a maximum of 5 percent of the number of shares in issue from time to time.at the date of the ordinary resolution dated 4 May 2016. The directors annually seek renewal of such authority at the annual general meeting, and the next renewal will be requested at the annual general meeting to be held on 616 May 2015.2017.
Authorised but unissued ordinary Shares under the control of the directors – amounting to 5 percent of Issued shares | ||||
Authorised but unissued ordinary shares attributable to the share incentive scheme (balance of – |
207
| 10B. | MEMORANDUM OF INCORPORATION |
On 1 May 2011, the South African Companies Act 71 of 2008 (as amended) (the Companies Act) came into effect. In terms of the Companies Act, companies were granted a two year period to amend their constitutional documents (previously referred to as the Memorandum and Articles of Association, but known under the Companies Act as a Memorandum of Incorporation (MoI)), in order to harmonise such constitutional documents with the Companies Act or adopt a new MoI. At a general meeting held on 27 March 2013, shareholders voted to adopt a new MoI for AngloGold Ashanti (whichAshanti. The MoI was subsequently amended by special resolutionresolutions of shareholders passed at annual general meetings held on 14 May 2014, 6 May 2015 and 4 May 2016.
The 2016 amendment sought to create a new class of preference shares in the share capital of the company, known as ‘C preference shares’. See “Item 10A: Share Capital—C preference shares”.
At the annual general meeting to be held on 1416 May 2014).
At the Annual General Meeting,2017, AngloGold Ashanti is seekingwill seek approval from the shareholders to cancel,make certain changes required to ensure compliance with the JSE Limited’s listings requirements and remove from its authorized share capital, the E Ordinary shares in their entirety,Companies Act, and to align the reason being that the BEE transaction, in termsMemorandum of which the E Ordinary shares were held, reached its full periodIncorporation with company practice and all the E ordinary shares were exchanged for ordinary shares during November 2014. As at 31 December 2014, no E ordinary shares were in issue.good corporate governance.
REGISTRATION
AngloGold Ashanti is incorporated under the laws of the Republic of South Africa and registered with the Companies and Intellectual Property Commission under registration number 1944/017354/06. The Companies Act has abolished the requirement for specific “object and purpose” provisions to be included in an MoI and although the new MoI is now silent on the matter, the company continues to carry on as its main business, gold exploration, the mining and production of gold, the manufacturing, marketing and selling of gold products and the development of markets for gold.
AngloGold Ashanti’s MoI is available for inspection as set out in “Item 10H.:10H: Documents on Display” and a summary of pertinent provisions, including rights of the holders of shares in AngloGold Ashanti, are set out below.
This summary does not contain all the information pertaining to the rights of holders of AngloGold Ashanti’s ordinary shares and is qualified in its entirety by reference to the laws of South Africa and AngloGold Ashanti’s governing corporate documents. As well as being governed by the provisions of the MoI, the rights of holders of AngloGold Ashanti’s ordinary shares are governed by the JSE Listings Requirements, the Companies Act and the Companies Regulations, 2011, promulgated under the Companies Act (Regulations), which include the Takeover Regulations. Further, the rights of holders of AngloGold Ashanti ADSs are governed by the Deposit Agreement between AngloGold Ashanti and The Bank of New York Mellon. See “Item 10C: Material Contracts – Contracts–The Deposit Agreement”.
The Companies Act provides that shares will no longer have a par or nominal value and hence no new shares having a nominal or par value may be authorised. However any shares which have a nominal or par value authorised prior to the effective date of the Companies Act continue to have that nominal or par value and can be issued as such for so long as there are par value shares in the company’s authorised share capital.
DIRECTORS
The management and control of any business of AngloGold Ashanti is vested in the board of directors (board). The authority of the board to manage and direct the business and affairs of the company is not limited, restricted or qualified by the MoI.
Appointment and Retirement of Directors
The shareholders of the company have the power to elect the directors, and shareholders are also entitled to elect one or more alternate directors, in accordance with the provisions of the MoI.
The board of directors may appoint any person who satisfies the requirements for election as a director to fill any vacancy and serve as a director on a temporary basis until the vacancy is filled by election by shareholders entitled to exercise voting rights in such an election.
The MoI authorises the chairman of the board, subject to the written approval of the majority of the directors, to appoint any person as a director provided that such appointment is approved by shareholders at the next shareholders’ meeting or annual general meeting.
208
At every annual general meeting one-third of the non- executive directors will retire by rotation, or if their number is not a multiple of three, then the number nearest to but not less than one third. The directors so to retire at every annual general meeting will be those who have been the longest in office since their last election. Directors retiring by rotation are eligible for re-election. Directors who voluntarily decide not to make themselves available for re-election may be counted towards the one-third of directors required to retire at the relevant annual general meeting.
The MoI contains no provision for directors to hold qualification shares. The MoI does not impose an age limit for the retirement of directors.
Remuneration
In accordance with the Companies Act, the MoI provides that the directors are entitled to such remuneration for their services as directors as AngloGold Ashanti’s shareholders may approve by special resolution in a general meeting or annual general meeting within the previous two years of the date of payment of such remuneration. If a director is employed in any other capacity, or holds an executive office or performs services that, in the opinion of the board, are outside the scope of the ordinary duties of a director, he may be paid such additonaladditional remuneration as a disinterested quorum of directors may reasonably determine.
Interests of Directors and Restriction on Voting
Although the interests of directors are not dealt with in the MoI, the provisions of the Companies Act in this regard are unalterable and will automatically apply, together with the applicable common law. Under the Companies Act, the procedures to deal with the personal financial interests of directors also apply to prescribed officers (i.e. persons who exercise general executive control over and management of the whole, or a significant portion, of the business and activities of the company or regularly participate to a material degree in the exercise of general executive control over and management of the whole, or a significant portion, of the business and activities of the company, irrespective of the office held or function performed by such persons) and any person who is a member of a committee of the board of the company, whether or not that person is also a member of the company’s board. The Companies Act provides that a director or such other person with a personal financial interest must disclose this to the board and cannot vote on or, after having made the disclosures to the meeting as prescribed by the Companies Act, remain present during the meeting when the matter in which he has interest is being discussed but will be counted as present for the purposes of a quorum.
Share Rights, Preferences and Restrictions
Allotment and Issue of Ordinary Shares
Subject to the JSE Listings Requirements, the Companies Act and/or with approval of shareholders in general meeting, unissued ordinary shares must be offered to existing ordinary shareholders, pro rata to their shareholdings, unless they are issued for the acquisition of assets. The shareholders in general meeting may authorise the AngloGold Ashanti board to issue any unissued ordinary shares as the AngloGold Ashanti board in their discretion think fit.shares.
Dividends, Rights and Distributions
The ordinary shares participate fully in all dividends, other distributions and entitlements as and when declared by AngloGold Ashanti in respect of fully paid ordinary shares. Under South African law, AngloGold Ashanti may declare and pay dividends, subject to the company satisfying the solvency and liquidity test as provided by the Companies Act and the board passing a resolution acknowledging that such test has been applied and has reasonably concluded that the company would satisfy such test immediately after completing the distribution. Dividends are payable to shareholders registered at a record date after the date of declaration of the dividend.
Although not stated in the MoI, dividends may be declared in any currency at the discretion of the board. Currently,In the past, dividends arehave been declared in and paid in South African rands, and also paid in Australian dollars, Ghanaian cedis or United Kingdom pounds. Registered holders of AngloGold Ashanti ADSs are paid dividends in US dollars by The Bank of New York Mellon as depositary, in accordance with the Deposit Agreement. See “Item 10C: Material Contracts – The Deposit Agreement”.
Holders of E ordinary shares would be entitled to receive a dividend equal to 50 percent of the dividend per ordinary share and the residual 50 percent of the dividend would be offset against the loan value of the E ordinary shares. As previously indicated, no E ordinary shares are currently in issue and it is being proposed that the authorised E ordinary shares be cancelled.
209
The holder of the B preference shares is entitled to an annual dividend amounting to the lesser of five percent of the issue price of the B preference shares, or an amount equivalent to the balance of the after-tax profits from income derived from mining the Moab Lease Area (which is part of the Vaal River operations in South Africa) as determined by the directors in each financial year. This annual dividend is a first charge on any profit available for distribution from the Moab Lease Area. The annual dividend is not payable from any of AngloGold Ashanti’s other profits.
The holder of the A preference shares is entitled to an annual dividend equivalent to the balance of the after-tax profits from income derived from mining the Moab Lease Area as determined by AngloGold Ashanti’s directors in each financial year, only once the annual dividend on the B preference shares has been paid in full.
Although not stated in the MoI, but subject to the JSE Listings Requirements, any dividend may be paid and satisfied, either wholly or in part, by the distribution of specific assets, or in paid-up securities of AngloGold Ashanti or of any other company, or in cash, or in any one or more of such ways as the directors may at the time of declaring the dividend determine and direct.
All dividends remaining unclaimed for a period of not less than three years from the date on which they became payable, may, by a resolution of the directors, become forfeited for the benefit of the company.
Voting Rights
Each ordinary share confers the right to vote at all general meetings. Each holder present in person or by proxy or, in the case of a corporate entity, represented, has one vote on a show of hands. If a poll is held, holders present or any duly appointed proxy will have one vote for each ordinary share held. A holder of ordinary shares is entitled to appoint a proxy to attend, speak and vote at any meeting on his or her behalf and the proxy need not be a shareholder. Holders of ADSs are not entitled to vote in person at meetings, but may vote by way of proxy through The Bank of New York Mellon as the ADS issuer. Holders of CDIs and GhDSs are not entitled to vote in person or by proxy at meetings, but may vote by instructing Chess Depository Nominees and NTHC Limited as depositary, respectively, how to vote their shares.
There are no limitations on the right of non-South African registered shareholders to hold or exercise voting rights attaching to any of the ordinary shares.
As indicated above, it is being proposed that shareholders approve the cancellation of the E ordinary shares at the Annual General Meeting of AngloGold Ashanti on 6 May 2015, following which the E ordinary shares shall be removed from the authorised share capital of AngloGold Ashanti. Although no E ordinary shares are currently in issue, the voting rights attaching the E ordinary shares are as follows:
Holders of E ordinary shares would have the right to vote at all general meetings and would be entitled to appoint a proxy to attend, speak and vote at any meeting on their behalf and the proxy didn’t need to be a shareholder. To the extent that holders of E ordinary shares will not be entitled to veto any resolution that would otherwise have been capable of being passed or not by the required majority of votes of holders of ordinary shares and subject to the JSE Listings Requirements holders of E ordinary shares was not to be counted for categorisation purposes in terms of section 9 of the JSE Listings Requirements. These limitations on the E ordinary shares were a function of shareholder approval and the JSE Listings Requirements.
The A redeemable preference shares have similar voting rights to those of ordinary shares. The B redeemable preference shares have limited voting rights exceptonly in the event that a dividend on this class of share has not been paid and remains unpaid for six months or more, or in connection with resolutions directly affecting these preference shares or in limited circumstances affecting AngloGold Ashanti as a whole, such as disposal of substantially all of the company’s assets, winding up AngloGold Ashanti or reducing the company’s share capital.
At any meeting of AngloGold Ashanti at which the holders of the ordinary shares, A redeemable preference shares, and B redeemable preference shares are present and entitled to vote on a poll, each holder of the A redeemable preference shares shall be entitled to 50 votes for every A redeemable preference share held, each holder of the ordinary shares is entitled to 50 votes for every ordinary share held and each holder of the B redeemable preference shares is entitled to one vote for every B redeemable preference share held.
The MoI specifies that the rights relating to any class of shares may be modified or abrogated with the sanction of a resolution passed as if it were a special resolution of the holders of shares in that class at a separate general meeting. The MoI also specifies that the holders of the A and B preference shares may provide written consents to the modification of their rights.
210
Increase and Reduction of Capital
The company is authorised to issue the shares specified in the MoI and all such shares are required to be issued as fully paid up in accordance with the applicable approval and/or other requirements of the JSE Listings Requirements.
The directors are authorised, subject to any requirements of the JSE Listings Requirements and the MoI, to increase or decrease the number of authorised shares of any class of shares, reclassify any shares that have been authorised but not issued, classify any unclassified shares that have been authorised but not issued, and determine the preferences, rights, limitations or other terms of any class of authorised shares or amend any preferences, rights, limitations or other terms as determined. However, such capital amendments require an amendment to the MoI and the JSE Listings Requirements currently does not allow the MoI to be amended to give effect to such capital amendments without the approval of ordinary shareholders by special resolution.
Rights Upon Liquidation
In the event of the winding up of AngloGold Ashanti:
the B redeemableThe A preference shares shall confer the right, on a winding-up of the company, in priority to any payment in respect of the ordinaryOrdinary Shares in the capital of the company then issued, but after any payment in respect of the B preference shares orand the AC preference shares in the capital of AngloGold Ashanti,the company then issued, to receive only so much of the net proceeds from the disposal of the assets relating to the Moab Lease Area as is then available for distribution;
The B preference shares shall confer the right, on a winding-up of the company in priority to any payment in respect of the Ordinary Shares, the A preference shares and the C preference shares then in issue, to receive only so much of the net proceeds from the disposal of the assets relating to the Moab Lease Area as is available for distribution but not exceeding a return for eachper B redeemable preference share of the capital paid up on that sharepaid-up thereon and any share premium paid on the issue of the B redeemable preference shares outstanding at that time;
the A redeemableThe C preference shares shall confer the right, on a winding-up of the company, ranking after and following payment of the holders of the B preference shares, but in priority to any payment in respect of the ordinaryOrdinary Shares and the A preference shares but after any payment in respectthe capital of the B preference shares,company then issued, to receive only so much of the net proceeds from the disposal of the assets relating to the Moab Lease Area as is then available for distribution;distribution but not exceeding a return per C preference share of the capital paid-up on the issue of the C preference shares outstanding at that time;
theThe A, redeemable preferenceB and B redeemableC preference shares doshall not confer the rightbe entitled to any participation, on a winding-up, in any of the surplus funds of AngloGold Ashanti arisingthe company in any other manner;manner arising; and
the ordinary shares confer the right to participate equally in any surplus arising from the liquidation of all other assets of AngloGold Ashanti. This applied equally to the E ordinary shares.
Redemption Provisions
The A redeemable preference shares may be redeemed for their nominal value, plus a premium per share of an amount equal to the net proceeds available from the disposal of the assets relating to the Moab Lease Area, after redemption in full of the B preference shares and payment of the nominal value of the A preference shares, divided by 2,000,000.
The B redeemable preference shares may be redeemed for their nominal value, plus a premium of up to R249.99 per share, but limited to an amount equal to the net proceeds available from the disposal of the assets relating to the Moab Lease Area after payment of the nominal value of the B preference shares.
Shareholders’ meetings
The directors may convene meetings of AngloGold Ashanti shareholders. Subject to the provisions of the Companies Act, the shareholders may requisition for the convening of a meeting.
Notice of each AngloGold Ashanti annual general meeting and general meeting of AngloGold Ashanti shareholders must be delivered at least 15 business days before that shareholders’ meeting is to begin. In accordance with the Companies Act, business days are calculated by excluding the first day, including the last day and excluding Saturdays, Sundays and any public holiday in the Republic of South Africa. In terms of the MoI, all shareholders are entitled to attend shareholders’ meetings.
In the case of a class meeting of the A or B preference shares, the sole holder of such shares shall constitute a quorum. Save as aforesaid, the quorum of a shareholders’ meeting to begin is sufficient persons present, in person or by proxy, at the meeting to exercise, in aggregate, at least 25 percent of all of the voting rights that are entitled to be exercised in respect of at least one matter to be decided at the meeting and a quorum must remain present for the continuation of that shareholders meeting, provided that at least three shareholders must be present at the meeting. Such quorum requirement also applies for the consideration of any matter to be decided at the meeting. If the meeting is not quorate within 30 minutes after the appointed time for the meeting to begin (or such longer or shorter period as the chairperson may determine), it will be postponed, without motion, vote or further notice, for 1 week and the shareholders present, in person or by proxy, at the postponed meeting will constitute a quorum. For an ordinary resolution to be approved by shareholders, it must be supported by more than 50 percent of the voting rights exercised on the resolution. For a special resolution to be approved by shareholders, it must be supported by at least 75 percent of the voting rights exercised on the resolution.
211
Disclosure of Interest in Shares
Under South African law, a person must notify AngloGold Ashanti within three business days after that person acquires a beneficial interest in sufficient securities of a class issued by AngloGold Ashanti such that, as a result of the acquisition, the person holds a beneficial interest in securities amounting to 5five percent, 10 percent, 15 percent or any further whole multiple of 5five percent of the issued securities of that class or disposes of any beneficial interest in sufficient securities of a class issued by AngloGold Ashanti such that the result of the disposition the person no longer holds a beneficial interest in securities amounting to a particular multiple of 5five percent of issued securities of that class. When AngloGold Ashanti has received the notice referred to above it must file a copy with the Takeover Regulation Panel and report the information to holders of the relevant class of securities unless the notice concerned a disposition of less than 1one percent of the class of securities.
If the securities of AngloGold Ashanti are registered in the name of a person who is not the holder of the beneficial interest in all of the securities in AngloGold Ashanti held by that person, that registered holder of the securities must disclose the identity of the person on whose behalf that security is held and the identity of each person with a beneficial interest in securities so held, the number and the class of securities held for each such person with a beneficial interest and the extent of each such beneficial interest. This information must be disclosed in writing to the company within five business days after the end of every month during which a change has occurred in the information or more promptly or frequently to the extent so provided by the requirements of a Central Securities Depository. A company that knows or has reasonable cause to believe that any of its securities are held by one person for the beneficial interest of another may by notice in writing require either of those persons to confirm or deny that fact, provide particulars of the extent of the beneficial interest held during the three years preceding the date of the notice and disclose the identity of each person with a beneficial interest in the securities held by that person, which information must be provided within 10 business days of the receipt of the notice.
AngloGold Ashanti is obligated to establish and maintain a register of the disclosures described above and to publish in its annual financial statements a list of the persons who hold beneficial interests equal to or in excess of 5five percent of the total number of ordinary shares issued by AngloGold Ashanti together with the extent of those beneficial interests.
Rights of Minority Shareholders
Majority shareholders of South African companies have no fiduciary obligations under South African common law to minority shareholders. However, under the Companies Act, a shareholder or director may, under certain circumstances, seek relief from the court if he has been unfairly prejudiced by any act or omission of the company.company or a related person, by the conduct of the business of the company or a related person in a particular manner, the exercise of the powers of the directors of the company or a related person in a particular manner. There may also be personal and derivative actions available to a shareholder of a company.
Pursuant to the Companies Act, a shareholder may petition a South African court for relief from the actions or omissions or, business conduct of the company or the actions of the company’s directors or officers that is oppressive or unfairly prejudicial to, or unfairly disregards the interest of the shareholder. In addition, a shareholder who voted against a resolution to amend the company’s MoI, or to approve a fundamental transaction, (and complied with other requirements set out in the Companies Act) may exercise its appraisal right to demand that the company pay to it the fair value for all the shares of the company held by that shareholder.
Description of ADSs
The Bank of New York Mellon issues AngloGold Ashanti’s American Depositary Shares, or ADSs. Please see “Item 10C: Material Contracts”.
212
| 10C. | MATERIAL CONTRACTS |
Revolving Credit Facilities
General
On 17 July 2014, AngloGold Ashanti Holdings plc and AngloGold Ashanti USA Incorporated, as borrowers, entered into a credit agreement (the US$ Revolving Credit Agreement) with The Bank of Nova Scotia, as facility agent, and certain financial institutions party thereto as lenders. The US$ Revolving Credit Agreement provides for a $1.0 billion revolving credit facility (the US$ Revolving Credit Facility) available for drawing in US dollars. As of 2322 March 2015,2017, we have drawn $100$75 million under the US$ Revolving Credit Facility.
On 25 July 2014, AngloGold Ashanti Australia Limited entered into a credit agreement (the A$ Revolving Credit Agreement), as borrower with Commonwealth Bank of Australia, as facility agent, and certain financial institutions party thereto as lenders. The A$ Revolving Credit Agreement provides for a A$0.5 billion revolving credit facility (the A$ Revolving Credit Facility) available for drawing in Australian dollars. As of 2322 March 2015,2017, we have drawn A$275 million under the A$ Revolving Credit Facility.
On 3 December 2013, AngloGold Ashanti Limited entered into a credit agreement (the ZAR Revolving Credit Agreement), as borrower with Nedbank Limited as facility agent who in conjunction with ABSA Bank Limited constitute the lenders. This ZAR Revolving Credit Agreement was subsequently amended on 9 September 2014 to align it with both the US$ and A$ Revolving Credit Agreements. The ZAR Revolving Credit Agreement provides for a ZAR 1.5 billion revolving credit facility (the ZAR Revolving Credit Facility) available for drawing in South African Rands. As of 2322 March 2015,2017, we have drawn ZAR992 millionZAR1.5 billion under the ZAR Revolving Credit Facility.
On 7 July 2015, AngloGold Ashanti Limited entered into a credit agreement (the ZAR Revolving Credit Agreement II), as borrower with Nedbank Limited as facility agent, who in conjunction with ABSA Bank Limited constitute the lenders. This ZAR Revolving Credit Agreement II is aligned with the other ZAR, US$ and A$ Revolving Credit Agreements. The ZAR Revolving Credit Agreement II provides for ZAR 1.4 billion revolving credit facility (ZAR Revolving Credit Facility II) available for drawing in South African Rands. As of 22 March 2017, the ZAR Revolving Credit Facility II is undrawn.
Guarantees
The US$ Revolving Credit Facility is guaranteed by AngloGold Ashanti Limited, AngloGold Ashanti Holdings plc and AngloGold Ashanti USA Incorporated. The obligations of AngloGold Ashanti USA Incorporated, in its capacity as a guarantor, are subject to certain limitations set forth in the US$ Revolving Credit Agreement in order to comply with applicable U.S. laws. The guarantees constitute unconditional obligations of the guarantors and rank at leastpari passu with all other future unsecured obligations of the guarantors, except for obligations mandatorily preferred by law.
The A$ Revolving Credit Facility is guaranteed by AngloGold Ashanti Limited and AngloGold Ashanti Holdings plc. The guarantees constitute unconditional obligations of the guarantors and rank at least pari passu with all other future unsecured obligations of the guarantors, except for obligations mandatorily preferred by law.
Security
The obligations under all the Revolving Credit Agreements are unsecured.
Amount and repayment of borrowings
Loans under the US$ Revolving Credit Facility must be for a minimum of $10 million (or for the balance of the undrawn total commitments at the time of the drawing), and no more than 1 loan may be outstanding at any time. Each loan must be repaid on the last day of the loan’s interest period, which can be a period of one, two, three or six months or any other period agreed by AngloGold Ashanti Holdings plc, in its capacity as obligors’ agent, and the lenders. All loans must be repaid in full on the final maturity date. The final maturity date is17 July 20192019.
Loans under the A$ Revolving Credit Facility must be for a minimum of A$10 million (or for the balance of the undrawn total commitments at the time of the drawing), and no more than 10 loans may be outstanding at any time. Each loan must be repaid on the last day of the loan’s interest period, which can be a period of one, two, three or six months or any other period agreed by AngloGold Ashanti Australia Limited. All loans must be repaid in full on the final maturity date. The final maturity date is 25 July 20192019.
Loans under the ZAR Revolving Credit Facility must be for a minimum of ZAR 100 million (or for the balance of the undrawn total commitments at the time of the drawing), and no more than 14 loans may be outstanding at any time. Each loan must be repaid on the last day of the loan’s interest period, which can be a period of one, two, three or six months or any other period agreed by AngloGold Ashanti Limited. All loans must be repaid in full on the final maturity date. The final maturity date is 3 December 2018.
213
Interest rates and fees
The annual interest rate on loans drawn under the US$ Revolving Credit Facility is calculated based on LIBOR, plus a margin that varies between 0.95 percent and 2.20 percent per annum depending on the long-term debt rating of AngloGold Ashanti Limited, and certain mandatory costs. Interest on loans is payable on the last day of the loan’s interest period and, if the interest period exceeds six months, on the dates falling at six month intervals after the day the loan was made.
The annual interest rate on loans drawn under the A$ Revolving Credit Facility is calculated based on BBSY, plus a margin that varies between 1.50 percent and 2.50 percent per annum depending on the long-term debt rating of AngloGold Ashanti Limited, and certain mandatory costs. Interest on loans is payable on the last day of the loan’s interest period and, if the interest period exceeds six months, on the dates falling at six month intervals after the day the loan was made.
The annual interest rate on loans drawn under the ZAR Revolving Credit Facility is calculated based on JIBAR, plus a margin of 1.20 percent per annum and certain mandatory costs. Interest on loans is payable on the last day of the loan’s interest period and, if the interest period exceeds six months, on the dates falling at six month intervals after the day the loan was made.
The borrowers under the US$ Revolving Credit Facility are required to pay a commitment fee equal to 35 percent of the then applicable margin per annum on the undrawn and uncancelled amount of each lender’s commitment during the commitment period. The borrowers are also required to pay a utilisation fee of 0.15 percent per annum (if the aggregate outstanding loans are less than one third of the total commitments then in effect), 0.30 percent per annum (if the aggregate outstanding loans are equal to or greater than one third but less than two thirds of the total commitments then in effect) or 0.45 percent per annum (if the aggregate outstanding loans are equal to or greater than two thirds of the total commitments then in effect).
The borrower under the A$ Revolving Credit Facility is required to pay a commitment fee equal to 50 percent of the then applicable margin per annum on the undrawn and uncancelled amount of each lender’s commitment during the commitment period.
The borrower under the ZAR Revolving Credit Facility is required to pay a commitment fee equal to 0.45 percent of the undrawn and uncancelled amount of each lender’s commitment during the commitment period. The borrowers areborrower is also required to pay a utilisation fee of 0.20 percent per annum (if the aggregate outstanding loans are less than one third of the total commitments then in effect), 0.40 percent per annum (if the aggregate outstanding loans are equal to or greater than one third but less than two thirds of the total commitments then in effect) or 0.60 percent per annum (if the aggregate outstanding loans are equal to or greater than two thirds of the total commitments then in effect).
Financial covenant applicable to all Revolving Credit Facilities (RCF)
The Revolving Credit Agreements include a financial maintenance covenant which requires that the ratio of Total Net Financial Indebtedness to EBITDA (as such terms are defined in the Revolving Credit Agreements) does not at any time exceed 3.50 to 1.00, with the proviso that this ratio may exceed 3.50 to 1.00 once during the life of the Revolving Credit Agreement, for one six month period subject to certain criteria. Refer Item 18: note 3833 “Capital Management” for the formulae used in terms of the RCF’s to test compliance with the covenants.
Change of control
If a lender so requires, the commitment of such lender under a Revolving Credit Agreement will be cancelled and the participation of such lender in all outstanding loans, together with accrued interest and all other amounts accrued, will become immediately due and payable in case any person or group of persons acting in concert becomes (directly or indirectly) the beneficial owner of more than 50 percent of the issued share capital of AngloGold Ashanti Limited.
Undertakings applicable to all Revolving Credit Agreements
The Revolving Credit Agreements contain negative pledge covenants, including restrictions on the granting of security, a change of business of AngloGold Ashanti Limited and its subsidiaries, acquisitions or participations in joint ventures and mergers and disposals.
The Revolving Credit Agreements also contain, among others, the following affirmative covenants: mandatory periodic reporting of financial and other information, notice upon the occurrence of events of default and certain other events, compliance with environmental laws, and other obligations requiring each of AngloGold Ashanti Limited and its subsidiaries to maintain its corporate existence and qualifications to conduct its business as currently conducted in all applicable jurisdictions and to maintain insurance coverage.
The covenants are subject to exceptions and materiality thresholds.
214
Events of default applicable to all Revolving Credit Agreements
The Revolving Credit Agreements contain events of default including failure to make payment of amounts due, breach of obligations under the loan documents, defaults under other agreements evidencing indebtedness, certain bankruptcy events and a cessation of business, failure of any of the borrowers to be a wholly-owned subsidiary of AngloGold Ashanti Limited and the occurrence of a material adverse change in the business and financial condition of the borrowers and guarantors under the Revolving Credit Agreements, or AngloGold Ashanti and its subsidiaries as a whole, or in the ability of the borrowers and guarantors to perform their payment obligations under the loan documents. The occurrence of an event of default could result in the immediate and automatic cancellation of all commitments and the acceleration of all payment obligations under the Revolving Credit Agreements and the other loan documents.
The above description is only a summary of certain provisions of the Revolving Credit Agreements and is qualified in its entirety by reference to the provisions of the Revolving Credit Agreements, a copy of each is attached hereto as Exhibit 19.4.4 and is incorporated herein by reference.
Notes
2013 Notes
On 30 July 2013, AngloGold Ashanti Holdings plc (“AGAH”), issued $1,250 million 8.500% Notes due 2020 (the “2013 Notes”)Notes). The interest on the 2013 Notes iswas payable semi-annuallysemi annually on 15 January and 15 JanuaryJuly of each year, commencing on 15 January 2014. AGAH may on any one or more occasions redeem all or part of the 2013 Notes at a redemption price based on a “make-whole” premium. At any time and from time to time on or after 30 July 30, 2016, AGAH may redeem the 2013 Notes, in whole or in part, at redemption prices varying based on the period during which the redemption occurs. In addition, at any time and from time to time prior to 30 July, 2016, AGAH may redeem up to 35% of the original principal amount of the 2013 Notes with the net proceeds from certain equity offerings by AngloGold Ashanti Limited, at a price of 108.500% of the aggregate principal amount thereof, plus accrued and unpaid interest. AGAH has agreed to pay certain additional amounts in respect of any withholdings or deductions for certain types of taxes in certain jurisdictions on payments to holders of the 2013 Notes. The 2013 Notes are unsecured and unsubordinated and are fully and unconditionally guaranteed by AngloGold Ashanti Limited.
AGAH has agreed to observe certain covenants with respect to the 2013 Notes restricting, subject to certain limitations, the ability of AngloGold Ashanti Limited and AGAH to amalgamate, reconstruct, consolidate or merge with another company or other legal entity and the ability of AngloGold Ashanti Limited and its restricted subsidiaries to pledge certain of their respective material assets to secure certain borrowings, create or incur liens on certain of their material property, engage in sale and leaseback transactions and incur indebtedness. In case of a change of control of the guarantor and a rating downgrade, within a specified period, of the 2013 Notes by two rating agencies, holders of the 2013 Notes have the right to require the issuer to repurchase all or any part of their 2013 Notes in cash for a value equal to 101% of the aggregate principal amount of 2013 Notes repurchased, plus accrued and unpaid interest, if any, on the 2013 Notes repurchased to the date of purchase.
The offering of the 2013 Notes was registered under the Securities Act. TheAct and the 2013 Notes were listed on the New York Stock Exchange. On 24 August 2015, AGAH offered to buy back up to $810 million in aggregate principal amount of the outstanding 2013 Notes. The offer was partially accepted and $779 million was settled in September 2015. The balance of the 2013 Notes was redeemed on 1 August 2016.
2012 Notes
On 30 July, 2012, AGAH, issued $750 million 5.125% Notes due 2022 (the “2012 Notes”). The interest on the 2012 Notes is payable semi-annually on 1 February and 1 August of each year, commencing on 1 February, 2013. AGAH may on any one or more occasions redeem all or part of the 2012 Notes, at a redemption price equal to the greater of (1) 100% of the principal amount of the 2012 Notes to be redeemed and (2) the sum of the present values of the remaining scheduled payments of principal and interest on the 2012 Notes (excluding any portion of such payments of interest accrued or unpaid as of the date of redemption) discounted to the redemption date on a semiannual basis (assuming a 360-day year consisting of twelve 30-day months) at the treasury rate, plus 50 basis points, plus accrued and unpaid interest, if any, to the date of redemption. AGAH has agreed to pay certain additional amounts in respect of any withholdings or deductions for certain types of taxes in certain jurisdictions on payments to holders of the 2012 Notes. The 2012 Notes are unsecured and unsubordinated and are fully and unconditionally guaranteed by AngloGold Ashanti Limited.
215
AGAH has agreed to observe certain covenants with respect to the 2012 Notes restricting, subject to certain limitations, the ability of AngloGold Ashanti Limited and AGAH to amalgamate, reconstruct, consolidate or merge with another company or other legal entity, and the ability of AngloGold Ashanti Limited and its restricted subsidiaries to pledge their assets to secure certain borrowings, create or incur liens on certain of their property or to engage in sale and leaseback transactions. In case of a change of control of the guarantor and a downgrade, within a specified period, of the 2012 Notes below an investment grade rating by two rating agencies, holders of the 2012 Notes have the right to require the issuer to repurchase all or any part of their 2012 Notes in cash for a value equal to 101% of the aggregate principal amount of 2012 Notes repurchased, plus accrued and unpaid interest, if any, on the 2012 Notes repurchased to the date of purchase.
The offering of the 2012 Notes was registered under the Securities Act. The 2012 Notes were listed on the New York Stock Exchange.
2010 Notes
On 28 April, 2010, AGAH, issued $700 million 5.375% Notes due 2020 and $300 million 6.500% Notes due 2040 (together, the “2010 Notes”). The interest on the 2010 Notes is payable semi-annually on 15 April and 15 October of each year, commencing on 15 October, 2010. AGAH may on any one or more occasions redeem all or part of the 2010 Notes, at a redemption price equal to the greater of (1) 100% of the principal amount of the 2010 Notes to be redeemed and (2) the sum of the present values of the remaining scheduled payments of principal and interest on the 2010 Notes (excluding any portion of such payments of interest accrued or unpaid as of the date of redemption) discounted to the redemption date on a semiannual basis (assuming a 360-day year consisting of twelve 30-day months) at the treasury rate, plus 25 basis points with respect to the 2010 Notes maturing in 2020 and 30 basis points with respect to the 2010 Notes maturing in 2040, plus accrued and unpaid interest, if any, to the date of redemption. AGAH has agreed to pay certain additional amounts in respect of any withholdings or deductions for certain types of taxes in certain jurisdictions on payments to holders of the 2010 Notes. The 2010 Notes are unsecured and unsubordinated and are fully and unconditionally guaranteed by AngloGold Ashanti Limited.
AGAH has agreed to observe certain covenants with respect to the 2010 Notes restricting, subject to certain limitations, the ability of AngloGold Ashanti Limited and AGAH to amalgamate, reconstruct, consolidate or merge with another company or other legal entity, and the ability of AngloGold Ashanti Limited and its restricted subsidiaries to pledge itstheir assets to secure certain borrowings, and create or incur liens on its property.certain of their property or to engage in sale and leaseback transactions. In case of a change of control of the guarantor and a downgrade, within a specified period, of a series of 2010 Notes below an investment grade rating by two rating agencies, holders of the 2010 Notes have the right to require the issuer to repurchase all or any part of their 2010 Notes in cash for a value equal to 101% of the aggregate principal amount of 2010 Notes repurchased, plus accrued and unpaid interest, if any, on the 2010 Notes repurchased to the date of purchase.
The offering of the 2010 Notes was registered under the Securities Act. The 2010 Notes were listed on the New York Stock Exchange.
For further information, see “Note 27:23: Borrowings” to our Annual Financial Statements included in Item 18 of this Annual Report, “Item 5B.: Liquidity and Capital Resources” and “Item 19: Exhibits to Form 20-F”.
Description of AngloGold Ashanti ADSs
The Bank of New York Mellon issues AngloGold Ashanti’s American Depositary Shares, or ADSs. One ADS represents the ownership interest of one ordinary share of AngloGold Ashanti.
The Deposit Agreement
This section provides a summary description of AngloGold Ashanti’s ADSs.
AngloGold Ashanti has entered into an Amended and Restated Deposit Agreement dated 3 June 2008 with The Bank of New York Mellon as depositary and the owners and beneficial owners of American Depositary Receipts (Deposit Agreement).
The following is a summary of the material provisions of the Deposit Agreement. For more complete information, read the entire Deposit Agreement and the Form of American Depositary Receipt, which AngloGold Ashanti has filed with the SEC as an exhibit to AngloGold Ashanti’s registration statement on FormF-6/A (FileNo. 333-133049) on 27 May 2008. See “Item 10.H.: Documents On Display”. Copies of the Deposit Agreement are also available for inspection at the Corporate Trust Office of The Bank of New York Mellon currently located at 101 Barclay Street, New York, New York, 10286.
216
Description of the ADSs
The Bank of New York Mellon, as depositary, will register and deliver ADSs. Each ADS will represent one ordinary share (or a right to receive one share) deposited with The Standard Bank of South Africa Limited, Société Générale South Africa Limited, FirstRand Bank Limited, National Australia Bank Limited of Australia and New Zealand Banking Group Limited, each as a custodian for The Bank of New York Mellon, and all of which are referred to collectively as “the Custodian”. Each ADS will also
represent any other securities, cash or other property which may be held by The Bank of New York Mellon. The Bank of New York Mellon’s Corporate Trust Office at which the ADSs will be administered is located at 101 Barclay Street, New York, New York 10286. The Bank of New York Mellon’s principal executive office is located at One Wall Street, New York, New York 10286.
ADSs may be held either (A) directly (i) by having an American Depositary Receipt, also referred to as an ADR, which is a certificate evidencing a specific number of ADSs, registered in the holder’s name, or (ii) by having ADSs registered in a holder’s name in the Direct Registration System, or (B) indirectly by holding a security entitlement in ADSs through a broker or other financial institution. If ADSs are held directly, such holders are ADS holders. This description applies to AngloGold Ashanti’s ADS holders. If ADSs are held indirectly, such holders must rely on the procedures of their broker or other financial institution to assert the rights of ADS registered holders described in this section. Such holders should consult with their broker or financial institution to find out what those procedures are.
The Direct Registration System, or DRS, is a system administered by DTC pursuant to which the depositary may register the ownership of uncertificated ADSs, which ownership will be evidenced by periodic statements sent by the depositary to the registered holders of uncertificated ADSs.
AngloGold Ashanti will not treat ADS holders as its shareholders and ADS holders do not have shareholder rights. South African law governs shareholder rights. The Bank of New York Mellon is the holder of the shares underlying the ADSs. Registered holders of ADSs have ADS holder rights. The Deposit Agreement sets out ADS holder rights as well as the rights and obligations of The Bank of New York Mellon. New York law governs the Deposit Agreement and the ADSs.
Dividends and Other Distributions
The Bank of New York Mellon has agreed to pay to holders of ADSs the cash dividends or other distributions it or a custodian receives on AngloGold Ashanti ordinary shares or other deposited securities after deducting any fees and expenses and any applicable withholding taxes. Holders of ADSs will receive these distributions in proportion to the number of AngloGold Ashanti’s ordinary shares that their ADSs represent.
Cash
The Bank of New York Mellon will convert any cash dividend or other cash distribution (in South African rands) that AngloGold Ashanti pays on ordinary shares into US dollars (unless AngloGold Ashanti pays such dividend or cash distribution in US dollars) and distribute to registered holders of ADSs. . If that is no longer possible or if any approval from any government is needed and cannot be obtained, The Bank of New York Mellon may distribute non-US currency only to those ADS holders to whom it is possible to make this type of distribution.
The Bank of New York Mellon may hold the non-US currency it cannot convert for the account of holders of ADSs who for one reason or the other have not been paid. It will not invest the non-US currency, and it will not be liable for interest on such amounts. Before making a distribution, any withholding taxes that must be paid will be deducted. See “Payment of Taxes” below. The Bank of New York Mellon will distribute only whole US dollars and cents and will round fractional cents to the nearest whole cent. If the exchange rates fluctuate during a time when The Bank of New York Mellon cannot convert the non-US currency, holders of ADSs may lose some or all of the value of the distribution.
Ordinary Shares
The Bank of New York Mellon may distribute to holders of ADSs additional ADSs representing ordinary shares that AngloGold Ashanti distributes as a dividend or free distribution, if AngloGold Ashanti provides such distribution promptly with satisfactory evidence that it is legal to do so. If The Bank of New York Mellon does not distribute additional ADSs, the outstanding ADSs will also represent the newly distributed AngloGold Ashanti ordinary shares. The Bank of New York Mellon will only distribute whole ADSs. It will sell AngloGold Ashanti ordinary shares that would require it to deliver a fraction of an ADS and distribute the net proceeds in the same way as it distributes cash. The Bank of New York Mellon may sell a portion of the distributed shares sufficient to pay its fees and expenses in connection with that distribution.
217
Rights to Subscribe for Additional Ordinary Shares
If AngloGold Ashanti offers holders of its ordinary shares any rights to subscribe for additional AngloGold Ashanti ordinary shares or any other rights, The Bank of New York Mellon, after consultation with AngloGold Ashanti, may make these rights
available to holders of ADSs or sell the rights and distribute the proceeds in the same way as it distributes cash. If The Bank of New York Mellon cannot do either of these things for any reason, it may allow these rights to lapse. In that case, holders of ADSs will receive no value for them.
If The Bank of New York Mellon makes these types of subscription rights available to holders of ADSs, upon instruction from holders of ADSs, it will exercise the rights and purchase AngloGold Ashanti’s ordinary shares on their behalf. The Bank of New York Mellon will then deposit the AngloGold Ashanti ordinary shares and deliver ADSs to the holders of ADSs. It will only exercise these rights if holders of ADSs pay it the exercise price and any other charges the rights require them to pay.
US securities laws may restrict the sale, deposit, cancellation and transfer of the ADSs issued after the exercise of rights. For example, holders of ADSs may not be able to trade the ADSs freely in the United States. In this case, The Bank of New York Mellon may deliver ADSs which are “restricted securities” within the meaning of Rule 144 which will have the same provisions as the ADSs described here, except for the changes needed to put the restrictions in place.
Other Distributions
The Bank of New York Mellon will send to holders of ADSs any other distributions that AngloGold Ashanti makes on deposited securities by any means it thinks is legal, fair and practical. If it cannot make the distribution in that way, The Bank of New York Mellon may decide to sell what AngloGold Ashanti distributes, and then distribute the net proceeds in the same way as it distributes cash, or it may decide to hold what AngloGold Ashanti distributes, in which case the outstanding ADSs will also represent the newly distributed property. However, The Bank of New York Mellon is not required to distribute any securities (other than ADSs) to ADS holders unless it receives satisfactory evidence from AngloGold Ashanti that it is legal to make that distribution. The Bank of New York Mellon may sell a portion of the distributed securities or property sufficient to pay its fees and expenses in connection with that distribution.
The Bank of New York Mellon is not responsible if, based on available information, it decides that it is unlawful or impractical to make a distribution available to any ADS holders. AngloGold Ashanti has no obligation to register ADSs, AngloGold Ashanti ordinary shares, rights or other securities under the US Securities Act of 1933. AngloGold Ashanti also has no obligation to take any other action to permit the distribution of ADSs, AngloGold Ashanti ordinary shares, or any other rights to ADS holders. This means that the holders of ADSs may not receive the distribution AngloGold Ashanti makes on its ordinary shares or any value for them if it is illegal or impractical for AngloGold Ashanti to make them available to the holders of ADSs.
Deposit, Withdrawal and Cancellation
The Bank of New York Mellon will deliver ADSs if a holder of AngloGold Ashanti’s ordinary shares or their broker deposits AngloGold Ashanti’s ordinary shares or evidence of rights to receive ordinary shares with the Custodian. Upon payment of its fees and expenses and of any taxes or charges, such as stamp taxes or stock transfer taxes or fees, The Bank of New York Mellon will register the appropriate number of ADSs in the names such holder of AngloGold Ashanti ordinary shares requests and will deliver the ADSs at its Corporate Trust office to the persons such holders request.
Holders of ADSs may turn in their ADSs at The Bank of New York Mellon’s Corporate Trust Office. Upon payment of its fees and expenses and of any taxes or charges, such as stamp taxes or stock transfer taxes or fees, The Bank of New York Mellon will deliver (1) the underlying ordinary shares to an account designated by the relevant holder of ADSs and (2) any other deposited securities underlying the ADSs at the office of the Custodian, or, at the request, risk and expense of ADS holders, The Bank of New York Mellon will deliver the deposited securities at its Corporate Trust Office.
Interchange Between Certificated ADSs and Uncertificated ADSs
ADS registered holders may surrender their ADS to The Bank of New York Mellon for the purpose of exchanging such ADS for uncertificated ADSs. The Bank of New York Mellon will cancel that ADS and will send to the ADS registered holder a statement confirming that the ADS registered holder is the registered holder of uncertificated ADSs. Alternatively, upon receipt by The Bank of New York Mellon of a proper instruction from a registered holder of uncertificated ADSs requesting the exchange of uncertificated ADSs for certificated ADSs, The Bank of New York Mellon will execute and deliver to the ADS registered holder an ADS evidencing those ADSs.
218
Voting Rights
ADS registered holders may instruct The Bank of New York Mellon to vote the number of deposited shares their ADSs represent. The Bank of New York Mellon will notify ADS registered holders of shareholders’ meetings and arrange to deliver AngloGold Ashanti’s voting materials to them if AngloGold Ashanti asks it to. Those materials will describe the matters to be voted on and explain how ADS registered holders may instruct The Bank of New York Mellon how to vote. For instructions to be valid, they must reach The Bank of New York Mellon by a date set by The Bank of New York Mellon.
Otherwise, ADS registered holders will not be able to exercise their right to vote unless they withdraw the shares. However, ADS registered holders may not know about the meeting sufficiently in advance to withdraw the shares.
The Bank of New York Mellon will try, as far as practical, to vote or to have its agents vote the ordinary shares or other deposited securities as holders of ADSs instruct, but this is subject to South African law, the provisions of AngloGold Ashanti’s MoI and of the deposited securities and any applicable rule of the JSE. The Bank of New York Mellon will only vote or attempt to vote as such holders of ADSs instruct.
AngloGold Ashanti cannot assure the holders of ADSs that they will receive the voting materials in time for them to instruct The Bank of New York Mellon to vote their ordinary shares. In addition, The Bank of New York Mellon and its agents are not responsible for failing to carry out voting instructions or for the manner of carrying out voting instructions. This means that holders of ADSs may not be able to exercise their right to vote and there may be nothing they can do if their ordinary shares are not voted as they requested.
Fees and expenses
| ADS holders must pay: | For: | |||
$5.00 (or less) per 100 ADSs | Each issuance of an ADS, including as a result of a distribution of AngloGold Ashanti ordinary shares or rights or other property
Each cancellation of an ADS, including if the Deposit Agreement terminates | |||
$0.02 (or less) per ADS | Any cash payment
| |||
Registration or transfer fees | Transfer and registration of AngloGold Ashanti ordinary shares on the AngloGold Ashanti share register to or from the name of The Bank of New York Mellon or its agent when AngloGold Ashanti ordinary shares are deposited or withdrawn | |||
$0.02 (or less) per ADS per year | Depositary services
| |||
Expenses of The Bank of New York Mellon | Conversion of non-US currency to US dollars
Cable, telex and facsimile transmission expenses
Servicing the deposited securities | |||
Taxes and other governmental charges that The Bank of New York Mellon or any custodian has to pay on any ADS or AngloGold Ashanti ordinary share underlying an ADS, for example, stock transfer taxes, stamp duty or withholding taxes | As necessary | |||
A fee equivalent to the fee that would have been payable if the securities distributed had been ordinary shares deposited for issuance of ADSs | Distribution of securities distributed to holders of deposited securities that are distributed by The Bank of New York Mellon to ADS holders |
219
Payment of Taxes
Holders of ADSs will be responsible for any taxes or other governmental charges payable on their ADSs or on the deposited securities underlying their ADSs. The Bank of New York Mellon may refuse to transfer their ADSs or allow them to withdraw the deposited securities underlying their ADSs until such taxes or other charges are paid. It may apply payments owed to holders of ADSs or sell deposited securities underlying their ADSs to pay any taxes they owe, and they will remain liable for any deficiency. If the Bank of New York sells deposited securities, it will, if appropriate, reduce the number of ADSs to reflect the sale and pay to holders of ADSs any proceeds, or send to them any property remaining after it has paid the taxes.
Reclassifications
If AngloGold Ashanti: | Then: | |||
Reclassifies, splits up or consolidates any of the deposited securities; | The cash, ordinary shares or other securities received by The Bank of New York Mellon will become deposited securities. Each ADS will automatically represent its equal share of the new deposited securities.
| |||
Distributes securities on the ordinary shares that are not distributed to holders of ADSs; or
Recapitalises, reorganises, merges, liquidates, sells all or substantially all of AngloGold Ashanti’s assets, or takes any similar action. | The Bank of New York Mellon may, and will if AngloGold Ashanti asks it to, distribute some or all of the cash, AngloGold Ashanti ordinary shares or other securities it receives. It may also issue new ADSs or ask holders of ADSs to surrender their outstanding ADSs in exchange for new ADSs identifying the new deposited securities. |
Amendment and Termination
AngloGold Ashanti may, for any reason, agree with The Bank of New York Mellon to amend the Deposit Agreement and the ADSs without the consent of holders. If the amendment increases fees or charges (except for taxes and other governmental charges or registration fees, cable, telex or facsimile transmission costs, delivery costs or other such expenses) or if the amendment prejudices an important right of ADS holders, it will only become effective 30 days after The Bank of New York Mellon notifies holders of ADSs of the amendment. At the time an amendment becomes effective, holders of ADSs are considered, by continuing to hold their ADSs, to agree to the amendment and to be bound by the ADSs and the agreement as amended.
The Bank of New York Mellon may terminate the Deposit Agreement by mailing notice of termination to ADS holders at least 30 days prior to the date fixed in the notice if AngloGold Ashanti asks it to do so. The Bank of New York Mellon may also terminate the Deposit Agreement if The Bank of New York Mellon has told AngloGold Ashanti that it would like to resign and AngloGold Ashanti has not appointed a new depositary bank within 90 days. In both cases, The Bank of New York Mellon must notify holders of AngloGold Ashanti ADSs at least 30 days before termination.
After termination, The Bank of New York Mellon and its agents will be required to do only the following under the Deposit Agreement: collect distributions on the deposited securities, sell rights, and, upon surrender of ADSs, deliver AngloGold Ashanti ordinary shares and other deposited securities. Four months after the date of termination or later, The Bank of New York Mellon may sell any remaining deposited securities by public or private sale and will hold the proceeds of the sale, as well as any other cash it is holding under the Deposit Agreement, for the pro rata benefit of the ADS holders who have not surrendered their ADSs. It will not invest the money and will have no liability for interest. The Bank of New York Mellon’s only obligations will be to account for the proceeds of the sale and other cash. After termination, AngloGold Ashanti’s only obligations will be with respect to indemnification of, and payment of certain amounts to, The Bank of New York Mellon.
220
Limitations on Obligations and Liability to ADS Holders
The Deposit Agreement expressly limits AngloGold Ashanti’s obligations and the obligations of The Bank of New York Mellon, and limits AngloGold Ashanti’s liability and the liability of The Bank of New York Mellon. AngloGold Ashanti and The Bank of New York Mellon:
are only obligated to take the actions specifically set forth in the Deposit Agreement without negligence or bad faith;
are not liable if either of AngloGold Ashanti or The Bank of New York Mellon is prevented or delayed by law or circumstances beyond their control from performing their obligations under the Deposit Agreement;
are not liable if either of AngloGold Ashanti or The Bank of New York Mellon exercises discretion permitted under the Deposit Agreement;
are not liable for the inability of any holder of ADSs to benefit from any distribution on deposited securities that is not made available to holders of ADSs under the terms of the Deposit Agreement, or for any special, consequential or punitive damages for any breach of the terms of the Deposit Agreement;
have no obligation to become involved in a lawsuit or other proceeding related to the ADSs or the Deposit Agreement on behalf of the holders of ADSs or on behalf of any other party;
may rely on advice of or information from legal counsel, accountants, and any persons presenting AngloGold Ashanti’s ordinary shares for deposit, any registered holder or any other person believed by AngloGold Ashanti in good faith to be competent to give such advice or information; and
pursuant to the Deposit Agreement, AngloGold Ashanti and The Bank of New York Mellon agree to indemnify each other under certain circumstances.
Requirements for Depositary Action
Before The Bank of New York Mellon will issue, transfer or register the transfer of an ADS, make a distribution on an ADS, or allow withdrawal of AngloGold Ashanti ordinary shares, The Bank of New York Mellon may require:
payment of stock transfer or other taxes or other governmental charges and transfer or registration fees charged by third parties for the transfer of any ordinary shares or other deposited securities;
production of satisfactory proof of the identity and genuineness of any signature or other information it deems necessary; and
compliance with regulations it may establish, from time to time, consistent with the Deposit Agreement, including presentation of transfer documents.
The Bank of New York Mellon may refuse to deliver, transfer or register transfers of ADSs generally when the books of The Bank of New York Mellon or AngloGold Ashanti’s books are closed, or at any time if either AngloGold Ashanti or The Bank of New York Mellon thinks it advisable to do so.
Holders of ADSs have the right to cancel their ADSs and withdraw the underlying ordinary shares at any time except:
when temporary delays arise because: (1) either AngloGold Ashanti or The Bank of New York Mellon have closed AngloGold Ashanti’s transfer books; (2) the transfer of the ordinary shares is blocked in connection with voting at a general meeting of shareholders; or (3) AngloGold Ashanti is paying a dividend on the ordinary shares;
when ADS holders seeking to withdraw the ordinary shares are liable for unpaid fees, taxes and similar charges; or
when it is necessary to prohibit withdrawals in order to comply with any laws or governmental regulations that apply to ADSs or to the withdrawal of the ordinary shares or other deposited securities.
This right of withdrawal may not be limited by any other provision of the Deposit Agreement.
Pre-release of ADSs
In certain circumstances, subject to the provisions of the Deposit Agreement, The Bank of New York Mellon may deliver ADSs before deposit of the underlying ordinary shares. This is called a pre-release of the ADS.
The Bank of New York Mellon may also deliver AngloGold Ashanti ordinary shares upon cancellation of pre-released ADSs (even if the ADSs are cancelled before the pre-release transaction has been closed out). A pre-release is closed out as soon as the underlying AngloGold Ashanti ordinary shares are delivered to The Bank of New York Mellon. The Bank of New York Mellon may receive ADSs instead of ordinary shares to close out a pre-release.
221
The Bank of New York Mellon may pre-release ADSs only under the following conditions:
before or at the time of the pre-release, the person to whom the pre-release is being made must represent to The Bank of New York Mellon in writing that it or its customer: (a) owns the ordinary shares or ADSs to be remitted, (b) assigns all beneficial rights, title and interest in such ADSs or ordinary shares, as the case may be, to The Bank of New York Mellon in its capacity as the depositary and for the benefit of the ADS holders, and (c) will not take any action with respect to such ADSs or ordinary shares, as the case may be, that is consistent with the transfer of beneficial ownership (including, without the consent of The Bank of New York Mellon, disposing of such ADSs or ordinary shares, as the case may be) other than satisfaction of such pre-release;
the pre-release must be fully collateralized with cash, US government securities, or other collateral that The Bank of New York Mellon considers appropriate; and
the Bank of New York Mellon must be able to close out the pre-release on not more than five business days’ notice. Each pre-release will be subject to any further indemnities and credit regulations that The Bank of New York Mellon deems appropriate. The Bank of New York Mellon will normally limit the number of AngloGold Ashanti ordinary shares not deposited but represented by ADSs outstanding at any time as a result of pre-release so that they do not exceed 30 percent of the ordinary shares deposited, although The Bank of New York Mellon may disregard this limit from time to time, if it thinks it is appropriate to do so.
Direct Registration System
In the Deposit Agreement, all parties to the Deposit Agreement acknowledge that the DRS and Profile Modification System, or Profile, will apply to uncertificated ADSs upon acceptance thereof to DRS by The Depository Trust Company, also referred to as DTC. DRS is the system administered by DTC pursuant to which the depositary may register the ownership of uncertificated ADSs, which ownership will be evidenced by periodic statements sent by the depositary to the registered holders of uncertificated ADSs. Profile is a required feature of DRS which allows a DTC participant, claiming to act on behalf of a registered holder of ADSs, to direct the depositary to register a transfer of those ADSs to DTC or its nominee and to deliver those ADSs to the DTC account of that DTC participant without receipt by the depositary of prior authorization from the ADS registered holder to register that transfer.
In connection with and in accordance with the arrangements and procedures relating to DRS/Profile, the parties to the Deposit Agreement understand that The Bank of New York Mellon will not verify, determine or otherwise ascertain that the DTC participant which is claiming to be acting on behalf of an ADS holder in requesting registration of transfer and delivery described in the paragraph above has the actual authority to act on behalf of the ADS holder (notwithstanding any requirements under the Uniform Commercial Code). In the Deposit Agreement, the parties agree that The Bank of New York Mellon’s reliance on and compliance with instructions received by The Bank of New York Mellon through the DRS/Profile System and in accordance with the Deposit Agreement will not constitute negligence or bad faith on the part of The Bank of New York Mellon.
Shareholder Communications: Inspection of Register of Holders of ADSs
The Bank of New York Mellon will make available for inspection at its office all communications that it receives from AngloGold Ashanti as a holder of deposited securities that AngloGold Ashanti makes generally available to holders of deposited securities. The Bank of New York Mellon sends copies of those communications if requested by AngloGold Ashanti. ADS holders have a right to inspect the register of holders of ADSs, but not for the purpose of contacting those holders about a matter unrelated to AngloGold Ashanti’s business or the ADSs.
Share Purchase Agreement
On 8 June 2015, the company entered into an agreement with Newmont Mining Corporation to sell 100 percent of Cripple Creek & Victor (CC&V) gold mine in the United States for $820 million in cash plus a net smelter royalty payable on all ounces of gold to be recovered over the remaining life of CC&V through future underground mining operations or from ongoing surface mining operations (NSR Ore). The net smelting return is payable quarterly in arrears at the rate of 2.5 percent of the net revenue, after refining and smelting costs, based upon the product of the average spot gold price and gold ounces produced from NSR Ore in the relevant quarter.
222The transaction was subject to antitrust, SARB and other governmental approvals. On 3 August 2015, the transaction closed and AngloGold Ashanti received proceeds of $819 million.
Exchange controls and other limitations affecting security holders
The following is a general outline of South African exchange controls and such outline may not apply to former residents of South Africa. Investors should consult a professional advisor as to the exchange control implications of their particular investments.
South African law provides for exchange control regulations, which restrict the export of capital from the Common Monetary Area, which comprises South Africa, the Kingdoms of Lesotho and Swaziland and the Republic of Namibia. The exchange control regulations, which are administered by the Exchange Control Department of the South African Reserve Bank (SARB), are applied throughout the Common Monetary Area and regulate transactions (including capital flows into and out of the Common Monetary Area) involving South African residents, including natural persons and legal entities.
Government officials have from time to time stated their intentions to relax South Africa’s exchange control regulations when economic conditions permit such action. In his budget speech in March 1998, the then Minister of Finance announced that restrictions relating to offshore investments by South African companies and individuals subject to South African exchange control would, to a limited extent, be lifted. Since then, the government has incrementally relaxed aspects of exchange control for financial institutions and individuals. However, it is impossible to predict with any certainty if and when the government will remove exchange controls in their entirety or how the controls may continue to change over time.
The comments below relate, in general, to exchange controls in place at the date of this annual report.
Investments in South African companies
A foreign investor may invest freely in ordinary shares in a South African company. Any foreign investor may also sell shares in a South African company and transfer the proceeds out of South Africa without restriction. Acquisitions of shares or assets of South African companies by non-South African purchasers are not generally subject to review and approval by the SARB when the consideration is in cash, but may require SARB review and approval in certain circumstances, including when the consideration is equity in a non-South African company or when the acquisition is financed by a loan from a South African lender.
Dividends
Dividends declared to foreign stockholders in public companies as listed on the Johannesburg Stock Exchange are not subject to the approval of the SARB. Dividends are freely transferable to foreign stockholders from both trading and non-trading profits earned in South Africa by publicly listed companies.
Voting rights
There are no limitations imposed by South African law or by the Memorandum of Incorporation of AngloGold Ashanti on the rights of non-South African shareholders to vote their ordinary shares.
Overseas financing, interest and investments
Interest on foreign loans, if paid from cash generated from operations in South Africa, may be remittable abroad, provided that the loans and the payment of the relevant interest in respect of such loans have received prior SARB approval.
AngloGold Ashanti and its South African subsidiaries require SARB approval to raise debt from and repay debt to non-residents of the Common Monetary Area, mainly in respect of the interest rate and terms of repayment applicable to the loan.
Debt raised outside the Common Monetary Area by AngloGold Ashanti’s non-South African subsidiaries is not restricted under South African exchange control regulations and can be used for overseas investment, subject to the relevant conditions imposed by the SARB in connection with establishing such a subsidiary or in raising the debt by such subsidiary. For example, AngloGold Ashanti and its South African subsidiaries would require SARB approval in order to provide guarantees for the obligations of any of its subsidiaries with regard to funds obtained from non-residents of the Common Monetary Area and debt raised outside the Common Monetary Area by AngloGold Ashanti’s non-South African subsidiaries must be repaid or serviced by AngloGold Ashanti’s foreign subsidiaries.
A listing by a South African company on any stock exchange other than the JSE in connection with raising capital requires permission from the SARB.
Under current exchange control regulations, offshore investments by AngloGold Ashanti and its subsidiaries require the approval of the SARB. Subject to approval, there is no limit on the amount of capital that may be invested offshore.
223
| 10E. TAXATION |
|
SOUTH AFRICAN TAXATION
The following discussion summarises South African tax consequences of the ownership and disposition of shares or ADSs by a US holder (as defined below). This summary is based upon current South African tax law and South African Revenue Service (SARS) practice, the Convention Between the Government of the United States of America and the Republic of South Africa for the Avoidance of Double Taxation and the Prevention of Fiscal Evasion with Respect to Taxes on Income and Capital Gains, signed 17 February 1997 (the “Treaty”(“Treaty”), and in part upon representations of the depositary, and assumes that each obligation provided for in, or otherwise contemplated by, a Deposit Agreement and any related agreement will be performed in accordance with its respective terms.
The following summary of South African tax considerations does not address the tax consequences to a US holder that is resident in South Africa for South African tax purposes, whose holding of shares or ADSs is effectively connected with a permanent establishment in South Africa through which such US holder carries on business activities or, in the case of an individual who performs independent personal services, with a fixed base situated therein, or who is otherwise not entitled to full benefits under the Treaty.
The statements of law set forth below are subject to any changes (which may be applied retroactively) in South African law or in the interpretation thereof by SARS, or in the Treaty, occurring after the date hereof. It should be expressly noted that South African tax law does not specifically address the treatment of ADSs. However, it is reasonable to assume (although no assurance can be made) that the tax treatment of US holders of shares is also applicable to US holders of ADSs.
Holders are strongly urged to consult their own tax advisors as to the consequences under South African, US federal, state and local, and other applicable laws, of the ownership and disposition of shares or ADSs.
Taxation of dividends
South Africa currently imposes a Dividend Withholding Tax on Companies (dividends tax) at a rate of 1520 percent on the net amount of the dividend declared by a resident company, other than a Headquarter Company. On 22 February 2017, the Minister of Finance announced that the dividends tax would increase to 20 percent on dividends paid with effect from 1 March 2017.
The dividends tax is generally imposed on the beneficial owner. The dividends tax could be reduced to a lower rate under an applicable double tax treaty, if all requirements are met. In the case of dividends paid to a US holder with respect to shares, the Treaty would generally limit the dividends tax rate to 5five percent of the gross amount of the dividends if a corporate US holder (it must be a corporate) holds directly at least 10 percent of the voting stock of AngloGold Ashanti. In all other cases, the maximum tax rate under the Treaty is 1520 percent of the gross amount of the dividend. This rate was increased on 22 February 2017, from a rate of 15 percent previously. There are different rules to consider if the beneficial owner of the dividends is a US resident who carries on business in South Africa through a permanent establishment situated in South Africa, or performs in South Africa independent personal services from a fixed base situated in South Africa, and the dividends are attributable to such permanent establishment or fixed base. Moreover, if the dividends tax rate is reduced under the auspices of an applicable double tax treaty, there are certain South African compliance requirements that must be met in order to access the double tax treaty relief.
The definition of a dividend currently means any amount transferred or applied by a company that is a resident (including AngloGold Ashanti) for the benefit or on behalf of any person in respect of any share in that company, whether that amount is transferred or applied by way of a distribution made by the company, or as consideration for the acquisition of any share in that company. It specifically excludes any amount transferred or applied by the company that results in a reduction of so-called contributed tax capital (CTC), or constitutes shares in the company or constitutes an acquisition by the company of its own securities by way of a general repurchase of securities in terms of the JSE Listings Requirements. A distinction is thus made between a general repurchase of securities and a specific repurchase of securities. If the company embarks upon a general repurchase of securities, the proceeds are not deemed to be a dividend whereas, in the case of a specific repurchase of securities where the purchase price is not funded out of CTC, the proceeds are likely to constitute a dividend.
The concept of CTC effectively means the sum of the stated capital or share capital and share premium of a company that existed on 1 January 2011, excluding any transfers from reserves to the share premium account or stated capital account, plus proceeds from the issue of any new shares by a company. Any application of CTC is limited to the holders of a class of shares and specifically that a distribution of CTC attributable to a specific class must be made proportionately to the number of shares held by a shareholder in a specific class.
Taxation of capital gains on sale or other disposition
South African residents are (subject to certain exemptions) taxed on their worldwide income, while non-residents are only taxed on South African sourced income (subject to the provisions of any relevant double taxation agreement).
Capital gains tax is not a separate tax to income tax; instead, a percentile of the taxpayer’s net capital gain (that is the taxable capital gain) is included in its taxable income on which it is taxed at the income tax rate.
Non-residents are only subject to the South African capital gains tax provisions in respect of the disposal of any immovable property (such as land or mining rights) or any interest or right of whatever nature to or in immovable property situated in South Africa, or any asset of a permanent establishment through which that non-resident is carrying on a trade in South Africa. In the instance of a shareholder holding shares in a South African company, the ‘interest in immovable property’ requirements are met if 80 percent or more of the market value of the shares is directly or indirectly attributable to South African immovable property held on capital account, and that shareholder (whether alone or together with any connected person in relation to that person), directly or indirectly, holds at least 20 percent of the equity shares of that South African company.
IfWith effect from 1 October 2007, gains realized on the sale of ordinary shares are automatically deemed to be on capital account and therefore, subject to capital gains tax, if the ordinary shares have been held for a continuous period of at least three years by the holder thereof. This deeming provision is limited to ordinary shares and does not extend to preference shares or ADSs. The meaning of the word “resident” is different for individuals and corporations and is governed by the South African Income Tax Act, 1962 ( the Act) and by the Treaty. In the event of conflict, the Treaty, which contains a tie breaker clause or mechanism to determine residency if a holder is resident in both countries, will prevail. In terms of the Act and Treaty, a US resident holder of shares or ADSs will not be subject to capital gains tax on the disposal of securities held as capital assets unless the securities are linked to a permanent establishment conducted in South Africa. In contrast, gains on the disposal of securities which are not capital in nature are usually subject to income tax. However, even in the latter case, a US resident holder will not be subject to income tax unless the US resident holder carries on business in South Africa through a permanent establishment situated therein.
Securities transfer tax (STT)
No securities transfer tax, or STT, is payable in South Africa with respect to the issue of a security, but STT is payable upon transfer thereof.
STT on transfers of securities is charged at a rate of 0,25 percent on the ‘taxable amount’ of the ‘transfer’ of every security issued by a company incorporated in South Africa, or a company incorporated outside South Africa but listed on an exchange in South Africa, subject to certain exemptions.
The word ‘transfer’ is broadly defined and includes the transfer, sale, assignment or cession or disposal in any other manner of a security which results in a change in beneficial ownership. The cancellation or redemption of a security is also regarded as a transfer unless the company is being liquidated. However, the transfer of a security that does not result in a change in beneficial ownership is not regarded as a ‘transfer’ for STT purposes. A security is also defined as a depositary receipt in a company. Accordingly, STT is payable on the transfer of a depositary receipt issued by a company. Generally, the central securities depositary that has suchbeen accepted as a rightparticipant in terms of the Financial Markets Act, is liable for the payment of the STT, on the basis that it is recoverable from the person to taxation under its domestic law,whom it is transferred.
STT is levied on the provisions‘taxable amount’ of a security. The taxable amount of a listed security is the greater of the consideration for the security declared by the transferee or the closing price of that security as traded on the stock exchange concerned. In the case of a transfer of a listed security, either the member or the participant holding the security in custody, or where the listed security is not held in custody, the company that issued the listed security, is liable for the tax. The tax must be paid by the fourteenth day of the month following the transfer.
Withholding tax on interest
A withholding tax on interest at the rate of 15% has been introduced with effect from 1 March 2015. This withholding is reduced to zero per cent in terms of the Treaty must be analysed when determiningto the right of taxationextent that the interest is derived and beneficially owned by a resident of the source state (South Africa) compared to the country of residence (the US).other Contracting State.
224
UNITED STATES TAXATION
The following is a general summary of thecertain material US federal income tax consequences of the ownership and disposition of shares or ADSs to a US holder (as defined below) that holds its shares or ADSs as a capital asset. This summary does not address any aspect of US federal gift or estate tax, or the state, local or non-US tax consequences to a US holder of shares or ADSs. This summary is based on US tax laws including the Internal Revenue Code of 1986, as amended (the Code)“Code”), Treasury regulations promulgated thereunder, rulings, judicial decisions, administrative pronouncements, and the Treaty, all as currently in effect as of the date of this annual report, and all of which are subject to change or changes in interpretation, possibly with retroactive effect. In addition, this summary is based in part upon the representations of the depositary and the assumption that each obligation in the Deposit Agreement relating to the ADSs and any related agreement will be performed in accordance with its terms.
This summary does not address all aspects of US federal income taxation that may apply to holders that are subject to special tax rules, including US expatriates, nonresidentnon-resident aliens present in the United States for at least 183 days during the calendar year, insurance companies, tax-exempt entities, banks, certain financial institutions, persons subject to the alternative minimum tax, regulated investment companies, securities broker-dealers, traders in securities who elect to apply a mark-to-market method of accounting, investors that own (directly, indirectly or by attribution) 10 percent or more of the outstanding share capital or voting stock of AngloGold Ashanti, partnerships or other entities treated as partnerships for US federal income tax purposes or persons holding shares or ADSs through such entities, persons holding their shares or ADSs as part of a straddle, hedging or conversion transaction, persons who acquired their shares or ADSs pursuant to the exercise of employee stock options or otherwise as compensation, accrual basis taxpayers, or persons whose functional currency is not the US dollar. Such holders may be subject to US federal income tax consequences different from those set forth below.
As used herein, the term “US holder” means a beneficial owner of shares or ADSs that isis: (a) a citizen or individual resident of the United States for US federal income tax purposes; (b) a corporation (or other entity taxable as a corporation for US federal income tax purposes) created or organised in or under the laws of the United States or any state thereof (including the District of Columbia); (c) an estate the income of which is subject to US federal income taxation regardless of its source; or (d) a trust if (i) a court within the United States can exercise primary supervision over the administration of the trust and one or more US persons are authorised to control all substantial decisions of the trust.trust or (ii) it has a valid election in effect under applicable Treasury regulations to be treated as a United States person. If a partnership (including for this purpose any entity treated as a partnership for US federal income tax purposes) holds shares or ADSs, the tax treatment of a partner generally will depend upon the status of the partner and the activities of the partnership. If a US holder is a partner in a partnership that holds shares or ADSs, the holder is urged to consult its own tax advisor regarding the specific tax consequences of the ownership and disposition of the shares or ADSs.
US holders should consult their own tax advisors regarding the specific South African and US federal, state and local tax consequences of owning and disposing of shares or ADSs in light of their particular circumstances as well as any consequences arising under the laws of any other taxing jurisdiction. In particular, US holders are urged to consult their own tax advisors regarding whether they are eligible for benefits under the Treaty.
For South African and US federal income tax purposes, a US holder of ADSs should be treated as owning the underlying shares represented by those ADSs. Therefore, deposits or withdrawals by a US holder of shares for ADSs or of ADSs for shares will not be subject to US federal income tax. The following discussion (except where otherwise expressly noted) applies equally to US holders of shares and US holders of ADSs.
Taxation of dividends
The gross amount of any distribution (including the amount of any South African withholding tax thereon) paid to a US holder by AngloGold Ashanti generally will be taxable as dividend income to the US holder for US federal income tax purposes on the date the distribution is actually or constructively received by the US holder, in the case of shares, or by the depositary, in the case of ADSs. Corporate US holders will not be eligible for the dividends received deduction in respect of dividends paid by AngloGold Ashanti. For foreign tax credit limitation purposes, dividends paid by AngloGold Ashanti will be income from sources outside the United States.
As noted above in ‘Taxation – “–Taxation–South African Taxation – Taxation–Taxation of dividends,dividends”, the South African government has enacted a dividend withholding tax. As a result, US holders who are eligible for benefits under the current Treaty will be subject to a maximum withholding tax of 1520 percent on the gross amount of dividend distributions paid by AngloGold Ashanti.
The amount of any distribution paid in foreign currency (including the amount of any South African withholding tax thereon) generally will be includible in the gross income of a US holder of shares in an amount equal to the US dollar value of the foreign currency calculated by reference to the spot rate in effect on the date of receipt by the US holder, in the case of shares, or by the depositary, in the case of ADSs, regardless of whether the foreign currency is converted into US dollars on such date. If the foreign currency is converted into US dollars on the date of receipt, a US holder of shares generally should not be required to recognise foreign currency gain or loss in respect of the dividend. If the foreign currency received in the distribution is not converted into US dollars on the date of receipt, a US holder of shares generally will have a tax basis in the foreign currency equal to its US dollar value on the date of receipt. Any gain or loss recognised upon a subsequent conversion or other disposition of the foreign currency generally will be treated as US source ordinary income or loss. In the case of a US holder of
225
ADSs, the amount of any distribution paid in a foreign currency generally will be converted into US dollars by the depositary upon its receipt. Accordingly, a US holder of ADSs generally will not be required to recognise foreign currency gain or loss in respect of the distribution. Special rules govern and specific elections are available to accrual method taxpayers to determine the US dollar amount includible in income in the case of taxes withheld in a foreign currency. Accrual basis taxpayers are therefore urged to consult their own tax advisors regarding the requirements and elections applicable in this regard.
Subject to certain limitations, South African withholding taxes will be treated as foreign taxes eligible for credit against a US holder’s US federal income tax liability. The limitation on foreign taxes eligible for credit is calculated separately with respect to specific classes of income. Dividend income generally will constitute ‘passive category’ income, or in the case of certain US holders, ‘general category’ income. The use of foreign tax credits is subject to complex conditions and limitations. In lieu of a credit, a US holder who itemises deductions may elect to deduct all of such holder’s foreign taxes in the taxable year. A deduction does not reduce US tax on a dollar-for-dollar basis like a tax credit, but the deduction for foreign taxes is not subject to all the same limitations applicable to foreign tax credits. US holders are urged to consult their own tax advisors regarding the availability of foreign tax credits.
Certain US holders (including individuals) are eligible for reduced rates of US federal income tax in respect of “qualified dividend income” received. For this purpose, qualified dividend income generally includes dividends paid by a non-US corporation if, among other things, the US holders meet a certain minimum holding period and other requirements and the non-US corporation satisfies certain requirements, including that either (i) the ordinary shares (or ADSs) with respect to which the dividend has been paid are readily tradable on an established securities market in the United States, or (ii) the non-US corporation is eligible for the benefits of a comprehensive US income tax treaty (such as the Treaty) which provides for the exchange of information. AngloGold Ashanti currently believes that dividends paid with respect to its shares and ADSs should constitute qualified dividend income for US federal income tax purposes. AngloGold Ashanti anticipates that its dividends will be reported as qualified dividends on Forms 1099-DIV delivered to US holders. Each individual US holder of AngloGold Ashanti shares or ADSs is urged to consult his own tax advisor regarding the availability to him of the reduced dividend tax rate in light of his own particular situation.
The US Treasury has expressed concern that parties to whom ADSs are pre-released may be taking actions that are inconsistent with the claiming of foreign tax credits for US holders of ADSs. Such actions would also be inconsistent with the claiming of the reduced rate of tax described above, applicable to dividends received by certain non-corporate holders. Accordingly, the analysis of the creditability of South African withholding taxes or the availability of qualified dividend treatment could be affected by future actions that may be taken by the US Treasury with respect to ADSs.
Taxation of dispositions
If a US holder is a resident of the United States for purposes of the Treaty, such holder will not be subject to South African tax on any capital gain if it sells or disposes of its shares or ADSs. Special rules apply to individuals who are residents of more than one country.
In general,Subject to the passive foreign investment company considerations discussed below, upon a sale, exchange or other disposition of shares or ADSs, a US holder generally will recognise capital gain or loss for US federal income tax purposes in an amount equal to the difference between the US dollar value of the amount realised on the disposition and the holder’s tax basis, determined in US dollars, in the shares or ADSs. Such gain or loss generally will be US source gain or loss, and will be treated as a long-term capital gain or loss if the holder’s holding period in the shares or ADSs exceeds one year at the time of disposition. If the US holder is an individual, any capital gain generally will be subject to US federal income tax at preferential rates if specified minimum holding periods are met. The deductibility of capital losses is subject to significant limitations.
A US holder’s tax basis in a share will generally be its US dollar cost. The US dollar cost of a share purchased with foreign currency will generally be the US dollar value of the purchase price on the date of purchase, or the settlement date for the
purchase in the case of shares traded on an established securities market that are purchased by a cash basis US holder or an electing accrual basis US holder. The amount realised on a sale or other disposition of shares for an amount in foreign currency will be the US dollar value of this amount on the date of sale or disposition. On the settlement date, the US holder will recognise US source foreign currency gain or loss (taxable as ordinary income or loss) equal to the difference (if any) between the US dollar value of the amount received based on the exchange rates in effect on the date of sale or other disposition and the settlement date. However, in the case of shares traded on an established securities market that are sold by a cash basis US holder (or an accrual basis US holder that so elects), the amount realised will be based on the exchange rate in effect on the settlement date for the sale, and no exchange gain or loss will be recognised at that time. If an accrual basis US holder makes either of the elections described above, it must be applied consistently from year to year and cannot be revoked without the consent of the Internal Revenue Services (IRS).
226
Foreign currency received on the sale or other disposition of a share will have a tax basis equal to its US dollar value on the settlement date. Any gain or loss recognised on a sale or other disposition of foreign currency (including its use to purchase shares or upon exchange for US dollars) will be US source ordinary income or loss.
Passive foreign investment company considerations
A non-US corporation will be classified a Passive Foreign Investment Company (PFIC) for any taxable year if at least 75 percent of its gross income consists of passive income (such as dividends, interest, rents or royalties (other than rents or royalties derived in the active conduct of a trade or business and received from an unrelated person), or gains on the disposition of certain minority interests), or at least 50 percent of the average value of its assets consists of assets that produce, or are held for the production of, passive income. AngloGold Ashanti believes that it was not treated as a PFIC for the taxable year ended 31 December 20142016 or any prior taxable years and does not expect to become a PFIC in the foreseeable future. If AngloGold Ashanti were characterised as a PFIC for any taxable year, a US holder would suffer adverse tax consequences with respect to that taxable year and all future years during which it holds AngloGold Ashanti ordinary shares (or ADSs).
These consequences may include having gains realised on the disposition of shares treated as ordinary income rather than capital gains and being subject to punitive interest charges on the receipt of certain dividends and on the proceeds of the sale or other disposition of the shares. Furthermore, dividends paid by AngloGold Ashanti would not be “qualified dividend income” and would be taxed at the higher rates applicable to other items of ordinary income. US holders should consult their own tax advisors regarding the potential application of the PFIC rules to their ownership of the shares.
US information reporting and backup withholding
DividendIn general, dividend payments made to a holder and proceeds paid from the sale, exchange, or other disposition of shares may be subject to information reporting to the IRS.IRS and backup withholding. US federal backup withholding generally is imposed at a current rate of 28 percent on specified payments including dividends and gross sale proceeds to persons who fail to furnish required information. Backup withholding will not apply to a holder who furnishes a correct taxpayer identification number or certificate of foreign status and makes any other required certification, or who is otherwise exempt from backup withholding. US persons who are required to establish their exempt status generally must provide IRS Form W-9 (Request for Taxpayer Identification Number and Certification). Non-US holders generally will not be subject to US information reporting or backup withholding. However, these holders may be required to provide certification of non-US status (generally on IRS Form W-8BEN or W-8B3N-E)W-8BEN-E) in connection with payments received in the United States or through certain US-related financial intermediaries. Backup withholding is not an additional tax. Amounts withheld as backup withholding may be credited against a holder’s US federal income tax liability. A holder may obtain a refund of any excess amounts withheld under the backup withholding rules by filing the appropriate claim for refund with the IRS and furnishing any required information.
Information with respect to foreign financial assets
Individuals that own “specified foreign financial assets” with an aggregate value in excess of $50,000 are generally required to file information reports with respect to such assets with their U.S. federal income tax returns. Depending on the individual’s circumstances, higher threshold amounts may apply. “Specified foreign financial assets” include any financial accounts maintained by foreign financial institutions, as well as any of the following, but only if they are not held in accounts maintained by financial institutions: (i) stocks and securities issued by non–United States persons, (ii) financial instruments and contracts held for investment that have non-United States issuers or counterparties and (iii) interests in non-United States entities. The shares or ADSs may be treated as specified foreign financial assets. YouIn such cases, certain US holders may be subject to this information reporting regime and be required to file IRS form 8938 listing these assets with yourtheir U.S. federal income tax return.returns. Failure to file information reports may subject youa US holder to penalties. YouUS holders are urged to consult yourtheir own tax advisoradvisors regarding yourtheir obligations to file information reports with respect to the shares.shares and ADSs.
227
| 10F. | DIVIDENDS AND PAYING AGENTS |
Not applicable.
| 10G. | STATEMENT BY EXPERTS |
Not applicable.
| 10H. | DOCUMENTS ON DISPLAY |
AngloGold Ashanti files annual reports on Form 20-F and reports on Form 6-K with the SEC. You may read and copy this information at the SEC’s Public Reference Room at 100F Street, N.E., Room 1580, Washington D.C. 20549 or by accessing the SEC’s home page (http://www.sec.gov). You can also request copies of documents, upon payment of a duplicating fee, by writing to the Public Reference Section of the SEC. Please call the SEC at 1-800-SEC-0330 for further information on the operation of the Public Reference Room. In addition, AngloGold Ashanti’s reports and other information may be inspected at the offices of the New York Stock Exchange, 20 Broad Street, New York, New York 10005. Copies of the documents referred to herein may also be inspected at AngloGold Ashanti’s offices by contacting AngloGold Ashanti at 76 JeppeRahima Moosa Street, Newtown, Johannesburg, 2001 (P.O. Box 62117, Marshalltown, 2107) South Africa, Attention: Company Secretary, telephone number: +27 11 637 6000.
No material on the AngloGold Ashanti website forms any part of, or is incorporated by reference into, this annual report on Form 20-F. References herein to the company’s website shall not be deemed to cause such incorporation.
| 10I. | SUBSIDIARY INFORMATION |
Not applicable.
228
ITEM 11: QUANTITATIVE AND QUALITATIVE DISCLOSURES ABOUT MARKET RISK
TREASURY POLICY
Risk management activities within the group are the ultimate responsibility of the board of directors. The Chief ExecutiveFinancial Officer is responsible to the board of directors for the design, implementation and monitoring of the risk management plan. The Audit and Risk Committee is responsible for overseeing risk management plans and systems, as well as financial risks which include a review of treasury activities and exposure to the group’s counterparties.
Under the treasury and risk management policy, hedges may be put in place using approved instruments over the group’s planned gold production and resultant gold sales currency exposures. The tenor of the hedges may extend out to ten years. The treasury and risk management policy sets limits on the extent to which the hedge position may change for the various levels of treasury management from dealer, through treasurer, executive management and board.
The financial risk management activities objectives of the group are as follows:
Safeguarding the group’s core earnings stream from its major assets through the effective control and management of gold and other commodity price risk, foreign exchange risk and interest rate risk;
Effective and efficient usage of credit facilities in both the short- and long-term through the adoption of reliable liquidity management planning and procedures;
Ensuring that investment and hedging transactions are undertaken with creditworthy counterparts; and
Ensuring that all contracts and agreements related to financial risk management activities are co-ordinated and consistent throughout the group and comply where necessary with all relevant regulatory and statutory requirements.
Under the treasury and risk management policy, treasury reports are produced at the following minimum intervals for review by management and the board of directors.
| Daily | Treasurer | ||
| Monthly | Executive Committee | ||
| Quarterly | Audit and Risk Committee, Board of Directors and shareholder reports |
The Treasury Risk Analyst is responsible for monitoring all reports for completeness and accuracy which are reviewed by the Treasurer.
At AngloGold Ashanti, all front office (dealing), middle office (risk reporting), back office (deal confirmations) and payment (treasury settlements) activities are segregated. All treasury transactions are captured on a third party developed treasury and risk management system that is widely used in corporate treasuries. The group internal audit function conducts regular and ad-hoc reviews of the activities of treasury and the group’s treasury system.
GOLD PRICE RISK MANAGEMENT ACTIVITIES
In the normal course of its operations, the group is exposed to gold and other commodity price, currency, interest rate, equity price, liquidity and non-performance risk, which includes credit risk. The group is also exposed to certain by-product commodity price risk. In order to manage these risks, the group may enter into transactions which make use of derivatives. The group has developed a risk management process to facilitate, control and monitor these risks.
Gold price risk arises from the risk of an adverse effect of current or future earnings resulting from fluctuations in the price of gold. The group eliminated its hedge book during 2010 and has since had full exposure to the spot price of gold.
IFRS guidance on derivatives and hedging requires that derivative instruments be accounted for as follows:
Contracts that meet the criteria for hedge accounting are designated as the hedging instruments hedging the variability of forecasted cash flows from the sale of production into the spot market and from capital expenditure denominated in a foreign currency and are classified as cash flow hedges. Cash flow hedge losses pertaining to capital expenditure of $2m as at 31 December 2014 (2013:2016 (2015: $2m) are expected to be reclassified from accumulated other comprehensive income and recognised as an adjustment to depreciation expense over the life of the Serra Grande mine.
All other derivatives are measured at their estimated fair value, with the changes in estimated fair value at each reporting date reported as gains or losses on derivatives in earnings in the period in which they occur.
229
Cash flows related to these instruments designated as qualifying hedges are reflected in the consolidated statement of cash flows in the same category as the cash flow from the items being hedged. Accordingly, cash flows relating to the settlement of forward sale commodity derivatives contracts hedging the forecasted sale of production into the spot market will be reflected upon settlement as a component of operating cash flows.
As at 31 December 20142016 and 20132015 the group had no outstanding commitments against future production as a result of the elimination of the hedge book during 2010.
Foreign exchange price risk protection agreements
The group, from time to time, may enter into currency forward exchange and currency option contracts to hedge certain anticipated transactions denominated in foreign currencies. The objective of the group’s foreign currency hedging activities is to protect the group from the risk that the eventual cash flows resulting from transactions denominated in US dollars will be adversely affected by changes in exchange rates.
As at 31 December 20142016 and 2013,2015, the group had no open forward exchange or currency option contracts in its currency hedge position.
Interest rate and liquidity risk
Fluctuations in interest rates impactsimpact interest paid and received on the short-term cash investments and financing activities, giving rise to interest rate risk.
In the ordinary course of business, the group receives cash from the proceeds of its gold sales and is required to fund working capital requirements. This cash is managed to ensure surplus funds are invested in a manner to achieve market related returns while minimising risks.
The group is able to actively source financing at competitive rates. The counterparts are financial and banking institutions and their credit ratings are regularly monitored by the group.
Cash and loans advanced maturity profile
| 2014 | 2013 | 2016 | 2015 | |||||||||||||||||||||||||||||||||||||||||||||||||||||||||||||||||||||
| Maturity date | Currency | Fixed rate investment amount (million) | Effective rate % | Floating rate investment amount (million) | Effective rate % | Fixed rate investment amount (million) | Effective rate % | Floating rate investment amount (million) | Effective rate % | Currency | Fixed rate investment amount | Effective rate % | Floating rate investment amount (million) | Effective rate % | Fixed rate investment amount | Effective rate % | Floating rate investment amount (million) | Effective rate % | ||||||||||||||||||||||||||||||||||||||||||||||||||||||
All less than one year | $ | - | - | 274 | 0.10 | - | - | 432 | 0.10 | $ | 7 | 0.80 | 37 | 0.42 | 100 | 0.39 | 159 | 0.17 | ||||||||||||||||||||||||||||||||||||||||||||||||||||||
| ZAR | 611 | 5.30 | 156 | 4.00 | 536 | 4.90 | 178 | 3.43 | ZAR | 625 | 6.69 | 127 | 5.49 | 260 | 6.12 | 325 | 5.37 | |||||||||||||||||||||||||||||||||||||||||||||||||||||||
| AUD | - | - | 17 | 3.00 | - | - | 32 | 3.00 | AUD | - | - | 31 | 3.50 | - | - | 28 | 3.00 | |||||||||||||||||||||||||||||||||||||||||||||||||||||||
| BRL | - | - | 36 | 10.86 | - | - | 33 | 8.14 | BRL | - | - | 5 | 14.08 | - | - | 63 | 13.37 | |||||||||||||||||||||||||||||||||||||||||||||||||||||||
| ARS | - | - | 5 | 23.00 | - | - | 9 | 18.00 | ARS | - | - | 1 | 20.00 | - | - | 208 | 20.00 | |||||||||||||||||||||||||||||||||||||||||||||||||||||||
Borrowings maturity profile
| Within one year | Between one and two years | Between two and five years | After five years | Total | Within one year | Between One and two years | Between Two and five years | After five years | Total | |||||||||||||||||||||||||||||||||||||||||||||||||||||||||||||||
| Currency | Borrowings amount (million) | Effective rate % | Borrowings amount (million) | Effective rate % | Borrowings amount (million) | Effective rate % | Borrowings amount (million) | Effective rate % | Borrowings amount (million) | Borrowings amount (million) | Effective rate % | Borrowings amount (million) | Effective rate % | Borrowings amount (million) | Effective rate % | Borrowings amount (million) | Effective rate % | Borrowings amount (million) | ||||||||||||||||||||||||||||||||||||||||||||||||||||||
| $ | 124 | 5.1 | 95 | 1.8 | 9 | 2.4 | 2,975 | 6.7 | 3,203 | 27 | 5.4 | - | - | 783 | 5.2 | 1,034 | 5.5 | 1,844 | ||||||||||||||||||||||||||||||||||||||||||||||||||||||
| ZAR | 1,135 | 7.1 | 777 | 7.1 | 100 | 10.2 | 396 | 13.8 | 2,408 | 30 | 10.2 | 1,238 | 8.6 | 160 | 10.1 | 289 | 15.2 | 1,717 | ||||||||||||||||||||||||||||||||||||||||||||||||||||||
| BRL | 3 | 9.1 | 1 | 6.7 | 2 | 4.1 | 1 | 2.9 | 7 | 3 | 5.7 | 3 | 5.7 | 4 | 5.3 | 1 | 3.2 | 11 | ||||||||||||||||||||||||||||||||||||||||||||||||||||||
| AUD | - | - | 146 | 4.8 | 167 | 4.8 | - | - | 313 | 6 | 6.8 | 108 | 4.4 | 150 | 4.6 | 49 | 6.8 | 313 | ||||||||||||||||||||||||||||||||||||||||||||||||||||||
The table above is based on the borrowings as at 31 December 2016 including borrowing cost and accrued interest but excludes any fair value adjustments.
230
Interest rate risk
| Fixed for less than one year | Fixed for between one and three years | Fixed for greater than three years | ||||||||||||||||||||||||||||||||||||||||||||||||||||||
| Fixed for less than one year | Fixed for between one and three years | Fixed for greater than three years | Total Borrowings amount (million) | |||||||||||||||||||||||||||||||||||||||||||||||||||||
| Currency | Borrowings amount (million) | Effective rate % | Borrowings amount (million) | Effective rate % | Borrowings amount (million) | Effective rate % | Borrowings amount (million) | Effective rate % | Borrowings amount (million) | Effective rate % | Borrowings amount (million) | Effective rate % | Total Borrowings amount (million) | |||||||||||||||||||||||||||||||||||||||||||
| $ | 124 | 5.1 | 97 | 1.8 | 2,982 | 6.7 | 3,203 | 27 | 5.4 | — | — | 1,817 | 5.4 | 1,844 | ||||||||||||||||||||||||||||||||||||||||||
| ZAR | 1,135 | 7.1 | 802 | 7.2 | 471 | 13.3 | 2,408 | 30 | 10.2 | 1,263 | 8.6 | 424 | 13.6 | 1,717 | ||||||||||||||||||||||||||||||||||||||||||
| BRL | 3 | 9.1 | 1 | 3.0 | 3 | 2.9 | 7 | 3 | 5.7 | 3 | 5.3 | 5 | 5.4 | 11 | ||||||||||||||||||||||||||||||||||||||||||
| AUD | - | - | 176 | 4.8 | 137 | 4.8 | 313 | 6 | 6.8 | 245 | 4.4 | 62 | 6.8 | 313 | ||||||||||||||||||||||||||||||||||||||||||
The table above is based on the borrowings as at 31 December 2016 including borrowing cost and accrued interest but excludes any fair value adjustments.
Non-performance risk
Realisation of contracts is dependent upon counterparts’ performance. The group has not obtained collateral or other security to support the financial instruments subject to non-performance risk, but the credit standing of counterparts was monitored on a regular basis throughout the year. The group spreads its business over a number of financial and banking institutions to minimise the risk of potential non-performance risk. Furthermore, the approval process of counterparts and the limits applied to each counterpart were monitored by the board of directors. Where possible, ISDA netting agreements were put in place.
The combined maximum credit risk exposure at balance sheet date amounts to $679$395 million for financial assets (2013: $887(2015: $647 million) and $9$nil million for financial guarantees (2013: $10(2015: nil million). Credit risk exposure netted by open derivative positions with counterparts was nil (2013:(2015: nil). No set-off is applied to balance sheet amounts due to the different maturity profiles of assets and liabilities.
Fair value of financial instruments
The estimated fair values of financial instruments are determined at discrete points in time based on relevant market information. The estimated fair values of the group’s financial instruments, as measured at 31 December 20142016 and 2013,2015, are as follows (assets (liabilities)):
| 31 December 2014 | 31 December 2013 | 31 December 2016 | 31 December 2015 | |||||||||||||||||||||||||||||
| (millions) | Carrying $ | Fair value $ | Carrying $ | Fair value $ | Carrying $ | Fair $ | Carrying $ | Fair $ | ||||||||||||||||||||||||
Cash and cash equivalents | 468 | 468 | 648 | 648 | 215 | 215 | 484 | 484 | ||||||||||||||||||||||||
Restricted cash | 51 | 51 | 77 | 77 | 55 | 55 | 60 | 60 | ||||||||||||||||||||||||
Short-term borrowings | (175 | ) | (175 | ) | (213 | ) | (213 | ) | (34 | ) | (34 | ) | (82 | ) | (82 | ) | ||||||||||||||||
Short-term borrowings at fair value | (48 | ) | (48 | ) | (45 | ) | (45 | ) | — | — | (18 | ) | (18 | ) | ||||||||||||||||||
Long-term borrowings | (2,173 | ) | (2,058 | ) | (2,325 | ) | (2,138 | ) | (2,144 | ) | (2,169 | ) | (2,157 | ) | (1,845 | ) | ||||||||||||||||
Long-term borrowings at fair value | (1,325 | ) | (1,325 | ) | (1,308 | ) | (1,308 | ) | — | — | (480 | ) | (480 | ) | ||||||||||||||||||
Listed investments - available for sale | 47 | 47 | 49 | 49 | 51 | 51 | 30 | 30 | ||||||||||||||||||||||||
Listed investments - held to maturity | 7 | 9 | 6 | 8 | 6 | 8 | 5 | 6 | ||||||||||||||||||||||||
Unlisted investments - held to maturity | 72 | 72 | 77 | 77 | 73 | 73 | 57 | 57 | ||||||||||||||||||||||||
The following methods and assumptions were used to estimate the fair value of each class of financial instrument:
Cash restricted for use, cash and cash equivalents
The carrying amounts approximate fair value.
Trade and other receivables and trade and other payables
The carrying amounts approximate fair value because of the short-term duration of these instruments.
231
Investments and other non-current assets
Listed equity investments classified as available-for-sale are carried at fair value while fixed income investments and other non-current assets are carried at amortised cost. The fair value of fixed income investments and other non-current assets has been calculated using market interest rates. The unlisted equity investments are carried at cost or fair value. Unlisted investments for which fair value can be reliably measured are carried at fair value while other unlisted investments for which there is no active market and the fair value cannot be reliably measured are carried at cost.
Borrowings
The $1.25bn 8.500% bonds due 2020 and the mandatory convertible bonds which were settled in September 2013 are carried at fair value. The convertible bonds, settled 99.1% in August 2013 and the balance in November 2013, and rated bonds are carried at amortised cost and their fair values are their closing market values at the reporting date. This is included in level 1 of the fair value hierarchy.
The interest rate on the remaining borrowings is reset on a short-term floating rate basis, and accordingly the carrying amount is considered to approximate fair value.
Derivatives
The fair values of volatility-based instruments (i.e. options) are estimated based on market prices, volatilities, credit risk and interest rates for the periods under review.
The following is the fair value of the derivative (liabilities)/assets split by accounting designation:
| ||||||||||
| 31 December 2012 | ||||||||||
Liabilities
| ||||||||||
| (millions) | Balance Sheet location | Non-hedge $ | Total $ | |||||||
| ||||||||||
Option component of convertible bonds | Non-current liabilities - derivatives | (9 | ) | (9) | ||||||
Embedded derivatives | Non-current liabilities - derivatives | (1 | ) | (1) | ||||||
|
| |||||||||
Total derivatives | (10 | ) | (10) | |||||||
| ||||||||||
Gain (loss) on non-hedge derivatives and other commodity contracts recognised
| ||||||||
| Year ended 31 December | ||||||||
| 2014 | 2013 | |||||||
| (millions) | $ | $ | ||||||
| ||||||||
Unrealised | ||||||||
Other commodity contracts | 15 | 93 | ||||||
Embedded derivatives | - | 1 | ||||||
|
| |||||||
Gain (loss) on non-hedge derivatives and other commodity contracts | 15 | 94 | ||||||
|
| |||||||
232
| ||||||||
| Year ended 31 December | ||||||||
| 2016 | 2015 | |||||||
| (millions) | $ | $ | ||||||
| ||||||||
Unrealised | ||||||||
Gain (loss) on non-hedge derivatives and other commodity contracts | 18 | (7 | ) | |||||
|
| |||||||
Other comprehensive income
| (millions) | Accumulated other $ | Changes in fair $ | Reclassification $ |
Accumulated other as of 31 December $ | ||||||||||||
| ||||||||||||||||
Derivatives designated as | ||||||||||||||||
Capital expenditure | (2 | ) | - | - | (2 | ) | ||||||||||
|
| |||||||||||||||
Before tax totals | (2 | ) | - | - | (2 | ) | ||||||||||
|
| |||||||||||||||
After tax totals | (1 | ) | - | - | (1 | ) | ||||||||||
|
| |||||||||||||||
| ||||||||||||||||
| (millions) | Accumulated other $ | Changes in fair $ | Reclassification $ |
Accumulated other $ | ||||||||||||
| ||||||||||||||||
Derivatives designated as | ||||||||||||||||
Capital expenditure | (3 | ) | 1 | - | (2 | ) | ||||||||||
|
| |||||||||||||||
Before tax totals | (3 | ) | 1 | - | (2 | ) | ||||||||||
|
| |||||||||||||||
After tax totals | (2 | ) | 1 | - | (1 | ) | ||||||||||
|
| |||||||||||||||
Accumulated other $ Changes in fair $ Reclassification $ Accumulated other $ Derivatives designated as Capital expenditure Before tax totals After tax totals Accumulated other $ Changes in fair $ Reclassification $ Accumulated other 2015 $ Derivatives designated as Capital expenditure Before tax totals After tax totals Maturity profile of derivatives, at carrying value(millions)
comprehensive income
as of 1 January 2016
value recognised
in 2016
adjustments
comprehensive income
as of 31 December
2016 (2 ) - - (2 ) (2 ) - - (2 ) (1 ) - - (1 ) (millions)
comprehensive income
as of 1 January 2015
value recognised
in 2015
adjustments
comprehensive income
as of 31 December (2 ) - - (2 ) (2 ) - - (2 ) (1 ) - - (1 )
| (millions) | Total $ |
2012 Assets $ | Liabilities $ | |||||||||
| ||||||||||||
Amounts to mature within twelve months of balance sheet date | - | - | - | |||||||||
Amounts maturing between one and two years | (9 | ) | - | (9 | ) | |||||||
Amounts maturing between two and five years | - | - | - | |||||||||
Amounts to mature thereafter | (1 | ) | - | (1 | ) | |||||||
|
| |||||||||||
Total | (10 | ) | - | (10 | ) | |||||||
|
| |||||||||||
$1.25bn bonds
The $1.25bn 8.500% bonds due 2020 valuation is primarily linked to market interest rates. A change of +0.5% and -0.5% in market interest rates will generally impact the fair value of the $1.25bn liability in a stable environment by -$25m and +$25m respectively.
Foreign exchange risk
Foreign exchange risk arises on financial instruments that are denominated in a foreign currency.
The following table discloses the approximate foreign exchange risk sensitivities of borrowings at 31 December 20142016 (actual changes in the timing and amount of the following variables may differ from the assumed changes below).
| ||||||
Change in exchange rate |
Change in Total | |||||
| $M | ||||||
| ||||||
Debt | ||||||
ZAR denominated (R/$) | Spot (+R1.50) | |||||
| ||||||
AUD denominated (AUD/$) | Spot (+AUD0.1) | |||||
| ||||||
| ||||||
Change in exchange rate | Change in Total | |||||
| $M | ||||||
| ||||||
Debt | ||||||
ZAR denominated (R/$) | Spot (-R1.50) | |||||
| ||||||
AUD denominated (AUD/$) | Spot (-AUD0.1) | |||||
| ||||||
233
ITEMItem 12: DESCRIPTION OF SECURITIES OTHER THAN EQUITY SECURITIES
| 12A. | Debt Securities |
Not applicable |
| 12B. | Warrants and Rights |
Not applicable |
| 12C. | Other Securities |
Not applicable |
| 12D. | American Depositary Shares |
| 12D.3 | Depositary Fees and Charges |
AngloGold Ashanti’s American Depositary Shares, or ADSs, each representing one of AngloGold Ashanti’s ordinary shares, are traded on the New York Stock Exchange under the symbol “AU.” The ADSs are evidenced by American Depositary Receipts, or ADRs, issued by The Bank of New York Mellon, as Depositary under the Amended and Restated Deposit Agreement dated as of 3 June 2008, among AngloGold Ashanti Limited, The Bank of New York Mellon and owners and beneficial owners of from time to time of ADRs. ADS holders may have to pay the following service fees to the Depositary:
Service | Fees (USD) | |
Issuance of ADSs | Up to 5 cents per ADS(1) | |
Cancellation of ADSs | Up to 5 cents per ADS(1) | |
Distribution of cash dividends or other cash distributions | Up to 2 cents per ADS(2) | |
Distribution of securities pursuant to | ||
(i) stock dividends, free stock distributions or | ||
(ii) exercises of rights to purchase additional ADSs | Up to 5 cents per ADS(2) | |
ADR Depositary Services fee | Up to 2 cents per year(2) | |
| (1) | These fees are typically paid to the Depositary by the brokers on behalf of their clients receiving the newly-issued ADSs from the Depositary and by the brokers on behalf of their clients delivering the ADSs to the Depositary for cancellation. The brokers in turn charge these transaction fees to their clients. |
| (2) | In practice, the Depositary has not collected these fees. If collected, such fees are offset against the related distribution made to the ADR holder. |
In addition, ADS holders are responsible for certain fees and expenses incurred by the Depositary on their behalf including (1) taxes and other governmental charges, (2) such registration fees as may from time to time be in effect for the registration of transfers of ordinary shares generally on the share register and applicable to transfers of ordinary shares to the name of the Depositary or its nominee or the Custodian or its nominee on the making of deposits or withdrawals, and (3) such cable, telex and facsimile transmission expenses as are expressly incurred by the Depositary in the conversion of foreign currency.
Fees and other charges payable by the Depositary, any of the Depositary’s agents, including the Custodian, or the agents of the Depositary’s agents in connection with the servicing of Shares or other Deposited Securities, shall be collected at the sole discretion of the Depositary by billing such owners for such charge or by deducting such charge from one or more cash dividends or other cash distributions.
For further information, refer to “Item 10C.:10C: Material Contracts – The Deposit Agreement”.
| 12D.4 | Depositary Payments for |
For the year ended 31 December 2014,2016, The Bank of New York Mellon, as Depositary, reimbursed AngloGold Ashanti an amount of $789,579 (2013: $587,059)$1,185,580 (2015: $553,697) mainly for investor relations related expenses.
234
ITEM 13: DEFAULTS, DIVIDEND ARREARAGES AND DELINQUENCIES
None.
235
ITEM 14: MATERIAL MODIFICATIONS TO THE RIGHTS OF SECURITY HOLDERS AND USE
OF PROCEEDS
None.
236
ITEMItem 15: CONTROLS AND PROCEDURES
| (a) | Disclosure Controls and Procedures:As of 31 December |
| (b) | Management’s Annual Report on Internal Control over Financial Reporting:Management is responsible for establishing and maintaining adequate internal control over financial reporting for the company, as defined in the Exchange Act Rule |
The company’s internal control over financial reporting includes those policies and procedures that:
Pertain to the maintenance of records that, in reasonable detail, accurately and fairly reflect transactions and dispositions of the assets of the company;
Provide reasonable assurance that the transactions are recorded as necessary to permit preparation of financial statements in accordance with generally accepted accounting principles, and that receipts and expenditures of the company are being made only in accordance with authorisations of management and the Directors of the company; and
Provide reasonable assurance regarding prevention or timely detection of unauthorised acquisition, use, or disposition of the company’s assets that could have a material effect on the financial statements.
Because of inherent limitations, internal control over financial reporting may not prevent or detect misstatements. Projections of any evaluation of effectiveness to future periods is subject to the risk that controls may become inadequate because of changes in conditions, or that the degree of compliance with policies and procedures may deteriorate.
The company’s management assessed the effectiveness of the company’s internal control over financial reporting as of the Evaluation Date. In making this assessment, management used the criteria set forth by the Committee of Sponsoring OrganizationsOrganisations of the Treadway Commission (COSO) in Internal Control – Integrated Framework and related illustrative documents released on May 14, May 2013. Based on this assessment, and using those criteria, management concluded that the company’s internal control over financial reporting was effective as of the Evaluation Date.
| (c) | Changes in Internal Control over Financial Reporting:The Company maintains a system of internal control over financial reporting that is designed to provide reasonable assurance that its books and records accurately reflect transactions and that established policies and procedures are followed. |
There have been no further changes in the company’s internal control over financial reporting identified in connection with the evaluation required by paragraph (d) of Exchange Act Rule 13(a) – 15 during the year ended December 31, 2016 that have materially affected, or are reasonably likely to materially affect, the company’s internal control over financial reporting.
See Item 3D, Risk Factors, of this annual report on Form 20F for risk factors related to the implementation and integration of information technology systems.
| (d) | Attestation Report of the Registered Public Accounting Firm: The Company’s independent registered accounting firm, Ernst & Young Inc., has issued an attestation report on the effectiveness of the company’s internal control over financial reporting. This report appears below. |
/s/ KC Ramon
Kandimathie Christine Ramon
Chief Financial Officer
/s/ S Venkatakrishnan
Srinivasan Venkatakrishnan
Chief Executive Officer
237
REPORT OF THE INDEPENDENT REGISTERED PUBLIC ACCOUNTING FIRM
The board of directors and stockholders of AngloGold Ashanti Limited
We have audited AngloGold Ashanti Limited’s internal control over financial reporting as of 31 December 2014,2016, based on criteria established in Internal Control—Integrated Framework issued by the Committee of Sponsoring Organizations of the Treadway Commission (2013 framework) (the COSO criteria). AngloGold Ashanti Limited’s management is responsible for maintaining effective internal control over financial reporting, and for its assessment of the effectiveness of internal control over financial reporting included in the accompanying management certification.Management’s Annual Report on Internal Control over Financial Reporting. Our responsibility is to express an opinion on the Company’s internal control over financial reporting based on our audit.
We conducted our audit in accordance with the standards of the Public Company Accounting Oversight Board (United States). Those standards require that we plan and perform the audit to obtain reasonable assurance about whether effective internal control over financial reporting was maintained in all material respects. Our audit included obtaining an understanding of internal control over financial reporting, assessing the risk that a material weakness exists, testing and evaluating the design and operating effectiveness of internal control based on the assessed risk, and performing such other procedures as we considered necessary in the circumstances. We believe that our audit provides a reasonable basis for our opinion.
A company’s internal control over financial reporting is a process designed to provide reasonable assurance regarding the reliability of financial reporting and the preparation of financial statements for external purposes in accordance with generally accepted accounting principles. A company’s internal control over financial reporting includes those policies and procedures that (1) pertain to the maintenance of records that, in reasonable detail, accurately and fairly reflect the transactions and dispositions of the assets of the company; (2) provide reasonable assurance that transactions are recorded as necessary to permit preparation of financial statements in accordance with generally accepted accounting principles and that receipts and expenditures of the company are being made only in accordance with authorizations of management and directors of the company; and (3) provide reasonable assurance regarding prevention or timely detection of unauthorisedunauthorized acquisition, use or disposition of the company’s assets that could have a material effect on the financial statements.
Because of its inherent limitations, internal control over financial reporting may not prevent or detect misstatements. Also, projections of any evaluation of effectiveness to future periods are subject to the risk that controls may become inadequate because of changes in conditions, or that the degree of compliance with the policies or procedures may deteriorate.
In our opinion, AngloGold Ashanti Limited maintained, in all material respects, effective internal control over financial reporting as of 31 December 2014,2016, based on the COSO criteria.
We also have audited, in accordance with the standards of the Public Company Accounting Oversight Board (United States), the 20142015 consolidated financial statements of AngloGold Ashanti Limited and our report dated 02 April 201531 March 2017 expressed an unqualified opinion thereon.
/s/ Ernst & Young Inc.
Ernst & Young Inc.
Registered Auditor
Johannesburg, Republic of South Africa
02 April 201531 March 2017
238
ITEM 16A: AUDIT COMMITTEE FINANCIAL EXPERT
Membership of the Audit and Risk Committee, including its chairman, comprises only independent non-executive directors, in compliance with the Sarbanes-Oxley Act. This also fulfils the guidelines of King III, which became effective in March 2010, and the requirements of the Companies Act of 2008, which became effective on 1 May 2011. The Sarbanes-Oxley Act requires the board to identify a financial expert from within its ranks. The board has resolved that Prof. Wiseman Nkuhlu is the Audit and Risk Committee’s financial expert. Three ofIndividually, the fourremaining members of the committee have considerable financial knowledge and experience in associated areas such as audit, risk and corporate governance to help oversee and guide the board and the company in respect of the audit, risk and corporate governance disciplines. Subsequent to year-end, Mr Albert Garner and Ms Maria Richter were appointed to the Audit and Risk Committee, subject to election by the shareholders at the Annual General Meeting of 6 May 2015.company.
239
ITEM 16B: CODE OF ETHICS AND WHISTLE-BLOWING POLICIES
In order to comply with the company’s obligation in terms of the Sarbanes-Oxley Act and King III, and in the interests of good governance, the company has systems and procedures to introduce, monitor and enforce its ethical codes and has adopted a code of business principles and ethics for employees and directors, a code of ethics for the Chief Executive Officer, Chief Financial Officer and Senior Financial Officers, and a whistle-blowing policy that encourages employees to report anonymously if they wish and without fear of retaliation acts of an unethical or illegal nature that affect the company’s interests. The code of business principles and ethics expresses the company’s commitment to the conduct of its business in line with ethical standards and is designed to enable employees and directors to perform their roles and duties with integrity and responsibility.
The whistle-blowing policy provides channels for employees to report acts and practices that are in conflict with the company’s code of business principles and ethics or are unlawful, including financial malpractice or dangers to the public or the environment. Reports may be made to management or through several mediums including the intranet, internet, telephone, short messaging system (sms), fax and post. All reports not made to management are administered by a third party, Tip-Offs Anonymous, to ensure independence of the process. Reported cases are relayed to management through internal audit. A report is provided by compliance and internal audit to the Serious Concerns Committee on a quarterly basis and Audit and Risk Committee on a quarterly basis. Reporters have the option to request feedback on reported cases. The whistle-blowing policy encourages reports to be made in good faith in a responsible and ethical manner. Employees are encouraged to first seek resolution of alleged malpractices through discussion with their direct managers, if appropriate, or other management including legal, compliance, human resources or internal audit.
The code of business principles and ethics for employees and directors and the code of ethics for the Chief Executive Officer, Chief Financial Officer and Senior Financial Officers are available on the company’s website at
http://www.anglogoldashanti.com/en/About-Us/corporategovernance/Pages/default.aspx
240
ITEM 16C: PRINCIPAL ACCOUNTANT FEES AND SERVICES
Ernst & Young Inc. has served as AngloGold Ashanti’s independent public accountants for each of the financial years in the three-year period ended 31 December 2014,2016, for which audited financial statements appear in this annual report on Form 20-F.
The following table presents the aggregate fees for professional services and other services rendered by Ernst & Young Inc. to AngloGold Ashanti in 20142016 and 2013.2015.
| (in millions) | 2014 $ | 2013 $ | 2016 $ | 2015 $ | ||||||||||||
Audit fees(1) | 6.65 | 7.97 | 5.20 | 5.66 | ||||||||||||
Audit-related fees(2) | 2.26 | 4.72 | 0.69 | 1.61 | ||||||||||||
Tax fees(3) | 0.34 | 0.48 | 0.21 | 0.65 | ||||||||||||
All other fees(4) | 0.13 | - | 0.02 | 0.20 | ||||||||||||
Total | 9.38 | 13.17 | 6.12 | 8.12 | ||||||||||||
Rounding may result in computational differences.
| (1) | The Audit fees consist of fees billed for the annual audit services engagement and other audit services, which are those services that only the external auditor reasonably can provide, and include the Company audit; statutory audits; attest services; and assistance with and review of documents filed with the SEC. |
| (2) | Audit-related fees consist of fees billed for assurance and related services. |
| (3) | Tax fees include fees billed for tax advice and tax compliance services. |
| (4) | All other fees include non-audit services. |
Audit and Risk Committee Pre-approval Policies and Procedures
It is the policy of AngloGold Ashanti to maintain compliance with the requirements of the various applicable legislation and good governance practices when appointing or assigning work to the Company’s external auditor. Non-audit services may not be undertaken without an employee of AngloGold Ashanti obtaining the pre-approval of the Audit and Risk Committee as is laid out in the procedures relating to the pre-approval process.
The Audit and Risk Committee has delegated the approval authority to the chairman of the committee, Rhidwaan Gasant or his designated official. The approval may take the form of a written or oral instruction, and in the case of an oral instruction this would be ratified at the next Audit and Risk Committee meeting. On a quarterly basis a summary of all approvals and work to date is tabled at the Audit and Risk Committee meeting.
All non-audit services provided to AngloGold Ashanti by the principal independent registered public accounting firm during 20142016 were reviewed and approved according to the procedures above. None of the services provided during 20142016 were approved under thede minimis exception allowed under the Exchange Act.
No work was performed by persons other than the principal accountant’s employees in respect of the audit of AngloGold Ashanti’s financial statements for 2014.
ITEM 16D: EXEMPTIONS FROM THE LISTING STANDARDS FOR AUDIT COMMITTEES
Not applicable.
ITEM 16E: PURCHASES OF EQUITY SECURITIES BY THE ISSUER AND AFFILIATED PURCHASERS
Neither the issuer nor any affiliate of the issuer purchased any of the company’s shares during 2014.2016.
241
ITEM 16F: CHANGE IN REGISTRANT’S CERTIFYING ACCOUNTANT
Not applicable.
ITEM 16G: CORPORATE GOVERNANCE
The following is a summary of the significant ways in which AngloGold Ashanti’s corporate governance practices do not differ in any significant way from those followed by US domestic companies under the New York Stock Exchange’s corporate governance listing standards (NYSE listing standards).
The NYSE listing standards require the appointment of a Nominations Committee to oversee the appointment of new directors to the board, and that such committee be comprised solely of independent directors. The JSE Listing Requirements also require the appointment of such a committee, but require that it be comprised solely of non-executive directors, the majority of whom must be independent.
The Nominations Committee of AngloGold Ashanti is made up of non-executive directors as required by the JSE Listings Requirements. The Chairman of the Committee is the Chairman of the Board, who although non-executive was not independent until around November 2014 when he was no longer a participant in AngloGold Ashanti’s BEE transaction.standards.
ITEM 16H: MINE SAFETY DISCLOSURE
The information concerning certain mine safety violations or other regulatory matters required pursuant to Section 1503(a) of the Dodd-Frank Wall Street Reform and Consumer Protection Act and this Item 16H is included in Exhibit 19.16 to this annual report on Form 20-F.Not applicable.
242
Not applicable.
243
| ITEM 18: |
The consolidated financial statements for the year ended 31 December 2016 were authorised for issue by the Board of Directors on 31 March 2017 and were signed on its behalf by Srinivasan Venkatakrishnan, Chief Executive Officer, Kandimathie Christine Ramon, Chief Financial Officer, Sipho Pityana, Chairman of the Board of Directors, and Rhidwaan Gasant, Chairman of the Audit and Risk Committee.
244
Report of Independent Registered Public Accounting Firm
The board of directors and stockholdersshareholders of AngloGold Ashanti Limited
We have audited the accompanying consolidated statement of financial position of AngloGold Ashanti Limited (“the Company”) as of 31 December 2014, 20132016, 2015 and 2012,2014, and the related consolidated statements of income, comprehensive income, cash flows and changes in equity and cash flows for each of the three years in the period ended 31 December 2014.2016. These financial statements are the responsibility of the Company’s management. Our responsibility is to express an opinion on these financial statements based on our audits.
We did not audit the financial statements of Kibali (Jersey) Limited (“Kibali”), a corporation in which the Company has a 50 percent interest. In the consolidated financial statements, the Company’s investment in Kibali is stated at $1,369$1,400 million, $1,241$1,406 million, and $797$1,369 million as of 31 December 2014, 20132016, 2015 and 2012,2014, respectively. The Company’s equity in the net income/(loss)income of Kibali is stated at $72$28 million, , $26$70 million and $(1)$72 million for the years ended 31 December 2014, 20132016, 2015 and 2012,2014, respectively. Those statements were audited by other auditors whose report has been furnished to us, and our opinion, insofar as it relates to the amounts included for Kibali, is based solely on the report of the other auditors.
We conducted our audits in accordance with the standards of the Public Company Accounting Oversight Board (United States). Those standards require that we plan and perform the audit to obtain reasonable assurance about whether the financial statements are free of material misstatement. An audit includes examining, on a test basis, evidence supporting the amounts and disclosures in the financial statements. An audit also includes assessing the accounting principles used and significant estimates made by management, as well as evaluating the overall financial statement presentation. We believe that our audits and the report of other auditors provide a reasonable basis for our opinion.
In our opinion, based on our audits and the report of other auditors, the financial statements referred to above present fairly, in all material respects, the consolidated financial position of AngloGold Ashanti Limited at 31 December 2014, 2013,2016, 2015, and 2012,2014, and the consolidated results of its operations and its cash flows for each of the three years in the period ended 31 December 2014,2016, in conformity with International Financial Reporting Standards as issued by the International Accounting Standards Board (“IASB”).Board.
We also have audited, in accordance with the standards of the Public Company Accounting Oversight Board (United States), AngloGold Ashanti Limited’s internal control over financial reporting as of 31 December 2014,2016, based on criteria established in Internal Control-Integrated Framework issued by the Committee of Sponsoring Organizations of the Treadway Commission (2013 framework) and our report dated 02 April 201531 March 2017 expressed an unqualified opinion thereon.
/s/ Ernst & Young Inc.
Registered Auditor
Johannesburg, Republic of South Africa
02 April 201531 March 2017
245
PAGE LEFT BLANK INTENTIONALLY
246
ANGLOGOLD ASHANTI LIMITED
Group – income statement
FOR THE YEARS ENDED 31 DECEMBER 2014, 20132016, 2015 and 20122014
| Figures in millions | Notes | 2014 | 2013 | 2012 | Notes | 2016 | 2015 | 2014 | ||||||||||||||||||||||||||
| US Dollars | US Dollars | |||||||||||||||||||||||||||||||||
Revenue | 3 | 5,378 | 5,708 | 6,632 | 3 | 4,254 | 4,174 | 5,110 | ||||||||||||||||||||||||||
Gold income | 2,3 | 5,218 | 5,497 | 6,353 | 2,3 | 4,085 | 4,015 | 4,952 | ||||||||||||||||||||||||||
Cost of sales | 4 | (4,190) | (4,146) | (3,964) | 4 | (3,263) | (3,294) | (3,972) | ||||||||||||||||||||||||||
Gain (loss) on non-hedge derivatives and other commodity contracts | 37 | 15 | 94 | (35) | 19 | (7) | 13 | |||||||||||||||||||||||||||
Gross profit | 2 | 1,043 | 1,445 | 2,354 | 2 | 841 | 714 | 993 | ||||||||||||||||||||||||||
Corporate administration, marketing and other expenses | 5 | (92) | (201) | (291) | (61) | (78) | (92) | |||||||||||||||||||||||||||
Exploration and evaluation costs | (144) | (255) | (395) | (133) | (132) | (142) | ||||||||||||||||||||||||||||
Other operating expenses | 6 | (28) | (19) | (47) | 5 | (110) | (96) | (28) | ||||||||||||||||||||||||||
Special items | 7 | (260) | (3,410) | (402) | 6 | (42) | (71) | (260) | ||||||||||||||||||||||||||
Operating profit (loss) | 519 | (2,440) | 1,219 | |||||||||||||||||||||||||||||||
Dividends received | 3 | - | 5 | 7 | ||||||||||||||||||||||||||||||
Operating profit | 495 | 337 | 471 | |||||||||||||||||||||||||||||||
Interest received | 3 | 24 | 39 | 43 | 3 | 22 | 28 | 24 | ||||||||||||||||||||||||||
Exchange (loss) gain | (7) | 14 | 8 | |||||||||||||||||||||||||||||||
Exchange loss | (88) | (17) | (7) | |||||||||||||||||||||||||||||||
Finance costs and unwinding of obligations | 8 | (278) | (296) | (231) | 7 | (180) | (245) | (276) | ||||||||||||||||||||||||||
Fair value adjustment on $1.25bn bonds | (17) | (58) | - | |||||||||||||||||||||||||||||||
Fair value adjustment on option component of convertible bonds | - | 9 | 83 | |||||||||||||||||||||||||||||||
Fair value adjustment on mandatory convertible bonds | - | 356 | 162 | |||||||||||||||||||||||||||||||
Share of associates and joint ventures’ loss | 9 | (25) | (162) | (30) | ||||||||||||||||||||||||||||||
Profit (loss) before taxation | 216 | (2,533) | 1,261 | |||||||||||||||||||||||||||||||
Fair value adjustment on issued bonds | 9 | 66 | (17) | |||||||||||||||||||||||||||||||
Share of associates and joint ventures’ profit (loss) | 8 | 11 | 88 | (25) | ||||||||||||||||||||||||||||||
Profit before taxation | 269 | 257 | 170 | |||||||||||||||||||||||||||||||
Taxation | 12 | (255) | 333 | (346) | 11 | (189) | (211) | (225) | ||||||||||||||||||||||||||
(Loss) profit for the year | (39) | (2,200) | 915 | |||||||||||||||||||||||||||||||
Profit (loss) after taxation from continuing operations | 80 | 46 | (55) | |||||||||||||||||||||||||||||||
Discontinued operations | ||||||||||||||||||||||||||||||||||
(Loss) profit from discontinued operations | - | (116) | 16 | |||||||||||||||||||||||||||||||
Profit (loss) for the year | 80 | (70) | (39) | |||||||||||||||||||||||||||||||
Allocated as follows | ||||||||||||||||||||||||||||||||||
Equity shareholders | (58) | (2,230) | 897 | |||||||||||||||||||||||||||||||
- Continuing operations | 63 | 31 | (74) | |||||||||||||||||||||||||||||||
- Discontinued operations | - | (116) | 16 | |||||||||||||||||||||||||||||||
Non-controlling interests | 19 | 30 | 18 | |||||||||||||||||||||||||||||||
- Continuing operations | 17 | 15 | 19 | |||||||||||||||||||||||||||||||
| (39) | (2,200) | 915 | 80 | (70) | (39) | |||||||||||||||||||||||||||||
Basic (loss) earnings per ordinary share (cents) | 13 | (14) | (568) | 232 | ||||||||||||||||||||||||||||||
Basic earnings (loss) per ordinary share (cents) | 12 | |||||||||||||||||||||||||||||||||
Earnings (loss) per ordinary share from continuing operations | 15 | 8 | (18) | |||||||||||||||||||||||||||||||
(Loss) earnings per ordinary share from discontinued operations | - | (28) | 4 | |||||||||||||||||||||||||||||||
Basic earnings (loss) per ordinary share (cents) | 15 | (20) | (14) | |||||||||||||||||||||||||||||||
Diluted (loss) earnings per ordinary share (cents) | 13 | (14) | (631) | 177 | ||||||||||||||||||||||||||||||
Diluted earnings (loss) per ordinary share (cents) | 12 | |||||||||||||||||||||||||||||||||
Earnings (loss) per ordinary share from continuing operations | 15 | 8 | (18) | |||||||||||||||||||||||||||||||
(Loss) earnings per ordinary share from discontinued operations | - | (28) | 4 | |||||||||||||||||||||||||||||||
Diluted earnings (loss) per ordinary share (cents) | 15 | (20) | (14) | |||||||||||||||||||||||||||||||
F - 1
ANGLOGOLD ASHANTI LIMITED
Group – statement of comprehensive income
FOR THE YEARS ENDED 31 DECEMBER 2014, 20132016, 2015 and 20122014
| Figures in million | 2014 | 2013 | 2012 | |||||||||||||||||||||||||||||||||||||
| Figures in millions | 2016 | 2015 | 2014 | |||||||||||||||||||||||||||||||||||||
| US Dollars | US Dollars | |||||||||||||||||||||||||||||||||||||||
(Loss) profit for the year | (39) | (2,200) | 915 | |||||||||||||||||||||||||||||||||||||
Profit (loss) for the year | 80 | (70) | (39) | |||||||||||||||||||||||||||||||||||||
Items that will be reclassified subsequently to profit or loss: | ||||||||||||||||||||||||||||||||||||||||
Exchange differences on translation of foreign operations | (201) | (433) | (92) | 180 | (371) | (201) | ||||||||||||||||||||||||||||||||||
Net loss on available-for-sale financial assets | - | (23) | (27) | |||||||||||||||||||||||||||||||||||||
Release on impairment of available-for-sale financial assets (note 7) | 2 | 30 | 16 | |||||||||||||||||||||||||||||||||||||
Share of associates and joint ventures’ other comprehensive income | - | 1 | - | |||||||||||||||||||||||||||||||||||||
Net gain (loss) on available-for-sale financial assets | 13 | (14) | - | |||||||||||||||||||||||||||||||||||||
Release on impairment of available-for-sale financial assets | - | 9 | 2 | |||||||||||||||||||||||||||||||||||||
Release on disposal of available-for-sale financial assets | (1) | (1) | - | (2) | (3) | (1) | ||||||||||||||||||||||||||||||||||
Cash flow hedges | - | 1 | - | |||||||||||||||||||||||||||||||||||||
Deferred taxation thereon | (1) | 2 | 6 | (2) | 1 | (1) | ||||||||||||||||||||||||||||||||||
| - | 9 | (5) | 9 | (7) | - | |||||||||||||||||||||||||||||||||||
Items that will not be reclassified subsequently to profit or loss: | ||||||||||||||||||||||||||||||||||||||||
Actuarial (loss) gain recognised | (22) | 69 | (14) | (2) | 17 | (22) | ||||||||||||||||||||||||||||||||||
Deferred taxation rate change thereon | - | - | (9) | |||||||||||||||||||||||||||||||||||||
Deferred taxation thereon | 6 | (20) | 3 | - | (3) | 6 | ||||||||||||||||||||||||||||||||||
| (16) | 49 | (20) | (2) | 14 | (16) | |||||||||||||||||||||||||||||||||||
Other comprehensive loss for the year, net of tax | (217) | (375) | (117) | |||||||||||||||||||||||||||||||||||||
Other comprehensive income (loss) for the year, net of tax | 187 | (363) | (217) | |||||||||||||||||||||||||||||||||||||
Total comprehensive (loss) income for the year, net of tax | (256) | (2,575) | 798 | |||||||||||||||||||||||||||||||||||||
Total comprehensive income (loss) for the year, net of tax | 267 | (433) | (256) | |||||||||||||||||||||||||||||||||||||
Allocated as follows | ||||||||||||||||||||||||||||||||||||||||
Equity shareholders | (275) | (2,605) | 780 | |||||||||||||||||||||||||||||||||||||
- Continuing operations | 250 | (332) | (291) | |||||||||||||||||||||||||||||||||||||
- Discontinued operations | - | (116) | 16 | |||||||||||||||||||||||||||||||||||||
Non-controlling interests | 19 | 30 | 18 | |||||||||||||||||||||||||||||||||||||
- Continuing operations | 17 | 15 | 19 | |||||||||||||||||||||||||||||||||||||
| (256) | (2,575) | 798 | 267 | (433) | (256) | |||||||||||||||||||||||||||||||||||
F - 2
ANGLOGOLD ASHANTI LIMITED
Group – statement of financial position
FOR THE YEARS ENDEDAS AT 31 DECEMBER 2014, 20132016, 2015 and 20122014
| Figures in millions | Notes | 2014 | 2013 | 2012 | Notes | 2016 | 2015 | 2014 | ||||||||||||||||||||||
| US Dollars | US Dollars | |||||||||||||||||||||||||||||
ASSETS | ||||||||||||||||||||||||||||||
Non-current assets | ||||||||||||||||||||||||||||||
Tangible assets | 15 | 4,863 | 4,815 | 7,776 | 13 | 4,111 | 4,058 | 4,863 | ||||||||||||||||||||||
Intangible assets | 16 | 225 | 267 | 315 | 14 | 145 | 161 | 225 | ||||||||||||||||||||||
Investments in associates and joint ventures | 18 | 1,427 | 1,327 | 1,047 | 16 | 1,448 | 1,465 | 1,427 | ||||||||||||||||||||||
Other investments | 19 | 126 | 131 | 167 | 17 | 125 | 91 | 126 | ||||||||||||||||||||||
Inventories | 20 | 636 | 586 | 610 | 18 | 84 | 90 | 636 | ||||||||||||||||||||||
Trade and other receivables | 22 | 20 | 29 | 79 | ||||||||||||||||||||||||||
Trade, other receivables and other assets | 19 | 34 | 13 | 20 | ||||||||||||||||||||||||||
Deferred taxation | 30 | 127 | 177 | 97 | 26 | 4 | 1 | 127 | ||||||||||||||||||||||
Cash restricted for use | 23 | 36 | 31 | 29 | 20 | 36 | 37 | 36 | ||||||||||||||||||||||
Other non-current assets | 21 | 25 | 41 | 7 | - | 18 | 25 | |||||||||||||||||||||||
| 7,485 | 7,404 | 10,127 | 5,987 | 5,934 | 7,485 | |||||||||||||||||||||||||
Current assets | ||||||||||||||||||||||||||||||
Other investments | 19 | - | 1 | - | 17 | 5 | 1 | - | ||||||||||||||||||||||
Inventories | 20 | 888 | 1,053 | 1,213 | 18 | 672 | 646 | 888 | ||||||||||||||||||||||
Trade and other receivables | 22 | 278 | 369 | 472 | ||||||||||||||||||||||||||
Trade, other receivables and other assets | 19 | 255 | 196 | 278 | ||||||||||||||||||||||||||
Cash restricted for use | 23 | 15 | 46 | 35 | 20 | 19 | 23 | 15 | ||||||||||||||||||||||
Cash and cash equivalents | 24 | 468 | 648 | 892 | 21 | 215 | 484 | 468 | ||||||||||||||||||||||
| 1,649 | 2,117 | 2,612 | ||||||||||||||||||||||||||||
Non-current assets held for sale | 25 | - | 153 | - | ||||||||||||||||||||||||||
| 1,649 | 2,270 | 2,612 | 1,166 | 1,350 | 1,649 | |||||||||||||||||||||||||
Total assets | 9,134 | 9,674 | 12,739 | 7,153 | 7,284 | 9,134 | ||||||||||||||||||||||||
EQUITY AND LIABILITIES | ||||||||||||||||||||||||||||||
Share capital and premium | 26 | 7,041 | 7,006 | 6,742 | 22 | 7,108 | 7,066 | 7,041 | ||||||||||||||||||||||
Accumulated losses and other reserves | (4,196) | (3,927) | (1,269) | (4,393) | (4,636) | (4,196) | ||||||||||||||||||||||||
Shareholders’ equity | 2,845 | 3,079 | 5,473 | 2,715 | 2,430 | 2,845 | ||||||||||||||||||||||||
Non-controlling interests | 26 | 28 | 21 | 39 | 37 | 26 | ||||||||||||||||||||||||
Total equity | 2,871 | 3,107 | 5,494 | 2,754 | 2,467 | 2,871 | ||||||||||||||||||||||||
Non-current liabilities | ||||||||||||||||||||||||||||||
Borrowings | 27 | 3,498 | 3,633 | 2,724 | 23 | 2,144 | 2,637 | 3,498 | ||||||||||||||||||||||
Environmental rehabilitation and other provisions | 28 | 1,052 | 963 | 1,238 | 24 | 877 | 847 | 1,052 | ||||||||||||||||||||||
Provision for pension and post-retirement benefits | 29 | 147 | 152 | 221 | 25 | 118 | 107 | 147 | ||||||||||||||||||||||
Trade, other payables and deferred income | 31 | 15 | 4 | 10 | 27 | 4 | 5 | 15 | ||||||||||||||||||||||
Derivatives | 37 | - | - | 10 | ||||||||||||||||||||||||||
Deferred taxation | 30 | 567 | 579 | 1,084 | 26 | 496 | 514 | 567 | ||||||||||||||||||||||
| 5,279 | 5,331 | 5,287 | 3,639 | 4,110 | 5,279 | |||||||||||||||||||||||||
Current liabilities | ||||||||||||||||||||||||||||||
Borrowings | 27 | 223 | 258 | 859 | 23 | 34 | 100 | 223 | ||||||||||||||||||||||
Trade, other payables and deferred income | 31 | 695 | 820 | 979 | 27 | 615 | 516 | 695 | ||||||||||||||||||||||
Bank overdraft | 24 | - | 20 | - | ||||||||||||||||||||||||||
Taxation | 32 | 66 | 81 | 120 | 28 | 111 | 91 | 66 | ||||||||||||||||||||||
| 984 | 1,179 | 1,958 | ||||||||||||||||||||||||||||
Non-current liabilities held for sale | 25 | - | 57 | - | ||||||||||||||||||||||||||
| 984 | 1,236 | 1,958 | 760 | 707 | 984 | |||||||||||||||||||||||||
Total liabilities | 6,263 | 6,567 | 7,245 | 4,399 | 4,817 | 6,263 | ||||||||||||||||||||||||
Total equity and liabilities | 9,134 | 9,674 | 12,739 | 7,153 | 7,284 | 9,134 | ||||||||||||||||||||||||
F - 3
ANGLOGOLD ASHANTI LIMITED
Group – statement of cash flows
FOR THE YEARS ENDED 31 DECEMBER 2014, 20132016, 2015 and 20122014
| Figures in millions | Notes | 2014 | 2013 | 2012 | Notes | 2016 | 2015 | 2014 | ||||||||||||||||||||||
| US Dollars | US Dollars | |||||||||||||||||||||||||||||
Cash flows from operating activities | ||||||||||||||||||||||||||||||
Receipts from customers | 5,351 | 5,709 | 6,523 | 4,231 | 4,154 | 5,083 | ||||||||||||||||||||||||
Payments to suppliers and employees | (3,978) | (4,317) | (4,173) | (2,929) | (2,904) | (3,740) | ||||||||||||||||||||||||
Cash generated from operations | 33 | 1,373 | 1,392 | 2,350 | 29 | 1,302 | 1,250 | 1,343 | ||||||||||||||||||||||
Dividends received from joint ventures | - | 18 | 72 | 37 | 57 | - | ||||||||||||||||||||||||
Taxation refund | 32 | 41 | 23 | 54 | 28 | 12 | 21 | 41 | ||||||||||||||||||||||
Taxation paid | 32 | (194) | (187) | (507) | (165) | (184) | (194) | |||||||||||||||||||||||
Net cash inflow from operating activities from continuing operations | 1,186 | 1,144 | 1,190 | |||||||||||||||||||||||||||
Net cash (outflow) inflow from operating activities from discontinued operations | - | (5) | 30 | |||||||||||||||||||||||||||
Net cash inflow from operating activities | 1,220 | 1,246 | 1,969 | 1,186 | 1,139 | 1,220 | ||||||||||||||||||||||||
Cash flows from investing activities | ||||||||||||||||||||||||||||||
Capital expenditure | ||||||||||||||||||||||||||||||
- project capital | (289) | (594) | (779) | (93) | (105) | (144) | ||||||||||||||||||||||||
- stay-in-business capital | (724) | (907) | (1,146) | (613) | (559) | (700) | ||||||||||||||||||||||||
Interest capitalised and paid | (1) | (5) | (12) | |||||||||||||||||||||||||||
Expenditure on intangible assets | (5) | (68) | (79) | (5) | (3) | (5) | ||||||||||||||||||||||||
Proceeds from disposal of tangible assets | 31 | 10 | 5 | 4 | 6 | 31 | ||||||||||||||||||||||||
Other investments acquired | (79) | (91) | (97) | (73) | (86) | (79) | ||||||||||||||||||||||||
Proceeds from disposal of other investments | 73 | 81 | 86 | 61 | 81 | 73 | ||||||||||||||||||||||||
Investments in associates and joint ventures | (65) | (472) | (349) | (11) | (11) | (65) | ||||||||||||||||||||||||
Proceeds from disposal of associates and joint ventures | - | 6 | 20 | 10 | 1 | - | ||||||||||||||||||||||||
Loans advanced to associates and joint ventures | (56) | (41) | (65) | (4) | (5) | (56) | ||||||||||||||||||||||||
Loans repaid by associates and joint ventures | 20 | 33 | 1 | - | 2 | 20 | ||||||||||||||||||||||||
Dividends received | - | 5 | 7 | |||||||||||||||||||||||||||
Proceeds from disposal of subsidiary | 25, 34 | 105 | 2 | 6 | ||||||||||||||||||||||||||
Cash in subsidiary acquired | 34 | - | - | 5 | ||||||||||||||||||||||||||
Cash in subsidiary disposed | 34 | - | - | (31) | ||||||||||||||||||||||||||
Cash balances in assets held for sale | 2 | (2) | - | |||||||||||||||||||||||||||
Acquisition of subsidiary and loan | 34 | - | - | (335) | ||||||||||||||||||||||||||
Proceeds from disposal of business and subsidiary | - | 819 | 105 | |||||||||||||||||||||||||||
Costs on disposal of business | - | (7) | - | |||||||||||||||||||||||||||
Cash balances in assets disposed | - | (2) | 2 | |||||||||||||||||||||||||||
Decrease (increase) in cash restricted for use | 24 | (20) | (3) | 8 | (17) | 24 | ||||||||||||||||||||||||
Interest received | 21 | 23 | 36 | 14 | 25 | 21 | ||||||||||||||||||||||||
Loans advanced | - | - | (45) | |||||||||||||||||||||||||||
Net cash outflow from investing activities | (943) | (2,040) | (2,775) | |||||||||||||||||||||||||||
Net cash (outflow) inflow from investing activities from continuing operations | (702) | 139 | (773) | |||||||||||||||||||||||||||
Net cash outflow from investing activities from discontinued operations | - | (59) | (170) | |||||||||||||||||||||||||||
Net cash (outflow) inflow from investing activities | (702) | 80 | (943) | |||||||||||||||||||||||||||
Cash flows from financing activities | ||||||||||||||||||||||||||||||
Proceeds from issue of share capital | - | - | 2 | |||||||||||||||||||||||||||
Proceeds from borrowings | 611 | 2,344 | 1,432 | 787 | 421 | 611 | ||||||||||||||||||||||||
Repayment of borrowings | (761) | (1,486) | (217) | (1,333) | (1,288) | (755) | ||||||||||||||||||||||||
Finance costs paid | (245) | (200) | (145) | (172) | (251) | (246) | ||||||||||||||||||||||||
Acquisition of non-controlling interest | - | - | (215) | |||||||||||||||||||||||||||
Revolving credit facility and bond transaction costs | (9) | (36) | (30) | |||||||||||||||||||||||||||
Dividends paid | (17) | (62) | (236) | |||||||||||||||||||||||||||
Net cash (outflow) inflow from financing activities | (421) | 560 | 591 | |||||||||||||||||||||||||||
Bond settlement premium, RCF and bond transaction costs | (30) | (61) | (9) | |||||||||||||||||||||||||||
Dividends paid to non-controlling interests | (15) | (5) | (17) | |||||||||||||||||||||||||||
Net cash outflow from financing activities from continuing operations | (763) | (1,184) | (416) | |||||||||||||||||||||||||||
Net cash outflow from financing activities from discontinued operations | - | (2) | (5) | |||||||||||||||||||||||||||
Net cash outflow from financing activities | (763) | (1,186) | (421) | |||||||||||||||||||||||||||
Net decrease in cash and cash equivalents | (144) | (234) | (215) | |||||||||||||||||||||||||||
Net (decrease) increase in cash and cash equivalents | (279) | 33 | (144) | |||||||||||||||||||||||||||
Translation | (16) | (30) | (5) | 10 | (17) | (16) | ||||||||||||||||||||||||
Cash and cash equivalents at beginning of year | 628 | 892 | 1,112 | 484 | 468 | 628 | ||||||||||||||||||||||||
Cash and cash equivalents at end of year | 24 | 468 | 628 | 892 | 21 | 215 | 484 | 468 | ||||||||||||||||||||||
F - 4
ANGLOGOLD ASHANTI LIMITED
Group – statement of changes in equity
FOR THE YEARS ENDED 31 DECEMBER 2014, 20132016, 2015 and 20122014
| Figures in million | Equity holders of the parent | |||||||||||||||||||||||||||||||||||||||||||||||||||||||||||||||||||||||||||||||
| Equity holders of the parent | ||||||||||||||||||||||||||||||||||||||||||||||||||||||||||||||||||||||||||||||||
| Figures in million | Share capital and premium | Other capital | Accumulated losses (2) | Cash flow hedge reserve (3) | Available- for-sale reserve (4) | Actuarial (losses) gains | Foreign currency translation reserve | Total | Non- controlling | Total equity | Share capital and premium | Other capital reserves(1) | Accumulated losses(2) | Cash flow hedge reserve(3) | Available- for-sale reserve(4) | Actuarial (losses) gains | Foreign currency translation reserve | Total | Non- controlling | Total equity | ||||||||||||||||||||||||||||||||||||||||||||||||||||||||||||
US Dollars | ||||||||||||||||||||||||||||||||||||||||||||||||||||||||||||||||||||||||||||||||
Balance at 31 December 2011 | 6,689 | 171 | (1,351 | ) | (2 | ) | 18 | (73 | ) | (469 | ) | 4,983 | 137 | 5,120 | ||||||||||||||||||||||||||||||||||||||||||||||||||||||||||||||||||
Profit for the year | 897 | 897 | 18 | 915 | ||||||||||||||||||||||||||||||||||||||||||||||||||||||||||||||||||||||||||||
Other comprehensive loss | (5 | ) | (20 | ) | (92 | ) | (117 | ) | (117 | ) | ||||||||||||||||||||||||||||||||||||||||||||||||||||||||||||||||||||||
Total comprehensive income (loss) | - | - | 897 | - | (5 | ) | (20 | ) | (92 | ) | 780 | 18 | 798 | |||||||||||||||||||||||||||||||||||||||||||||||||||||||||||||||||||
Shares issued | 53 | 53 | 53 | |||||||||||||||||||||||||||||||||||||||||||||||||||||||||||||||||||||||||||||
Share-based payment for share awards net of exercised | 15 | 15 | 15 | |||||||||||||||||||||||||||||||||||||||||||||||||||||||||||||||||||||||||||||
Acquisition of non-controlling interest(5) | (144 | ) | (144 | ) | (71 | ) | (215 | ) | ||||||||||||||||||||||||||||||||||||||||||||||||||||||||||||||||||||||||
Disposal of subsidiary(6) | - | (45 | ) | (45 | ) | |||||||||||||||||||||||||||||||||||||||||||||||||||||||||||||||||||||||||||
Dividends paid (note 14) | (215 | ) | (215 | ) | (215 | ) | ||||||||||||||||||||||||||||||||||||||||||||||||||||||||||||||||||||||||||
Dividends of subsidiaries | - | (17 | ) | (17 | ) | |||||||||||||||||||||||||||||||||||||||||||||||||||||||||||||||||||||||||||
Translation | (9 | ) | 7 | 3 | 1 | (1 | ) | - | ||||||||||||||||||||||||||||||||||||||||||||||||||||||||||||||||||||||||
Balance at 31 December 2012 | 6,742 | 177 | (806 | ) | (2 | ) | 13 | (90 | ) | (561 | ) | 5,473 | 21 | 5,494 | ||||||||||||||||||||||||||||||||||||||||||||||||||||||||||||||||||
Loss for the year | (2,230 | ) | (2,230 | ) | 30 | (2,200 | ) | |||||||||||||||||||||||||||||||||||||||||||||||||||||||||||||||||||||||||
Other comprehensive income (loss) | 1 | 8 | 49 | (433 | ) | (375 | ) | (375 | ) | |||||||||||||||||||||||||||||||||||||||||||||||||||||||||||||||||||||||
Total comprehensive (loss) income | - | - | (2,230 | ) | 1 | 8 | 49 | (433 | ) | (2,605 | ) | 30 | (2,575 | ) | ||||||||||||||||||||||||||||||||||||||||||||||||||||||||||||||||||
Shares issued(7) | 264 | 264 | 264 | |||||||||||||||||||||||||||||||||||||||||||||||||||||||||||||||||||||||||||||
Share-based payment for share awards net of exercised(8) | (13 | ) | (13 | ) | (13 | ) | ||||||||||||||||||||||||||||||||||||||||||||||||||||||||||||||||||||||||||
Dividends paid (note 14) | (40 | ) | (40 | ) | (40 | ) | ||||||||||||||||||||||||||||||||||||||||||||||||||||||||||||||||||||||||||
Dividends of subsidiaries | - | (23 | ) | (23 | ) | |||||||||||||||||||||||||||||||||||||||||||||||||||||||||||||||||||||||||||
Translation | (28 | ) | 15 | (3 | ) | 16 | - | - | ||||||||||||||||||||||||||||||||||||||||||||||||||||||||||||||||||||||||
Balance at 31 December 2013 | 7,006 | 136 | (3,061 | ) | (1 | ) | 18 | (25 | ) | (994 | ) | 3,079 | 28 | 3,107 | 7,006 | 136 | (3,061 | ) | (1 | ) | 18 | (25 | ) | (994 | ) | 3,079 | 28 | 3,107 | ||||||||||||||||||||||||||||||||||||||||||||||||||||
Loss for the year | (58 | ) | (58 | ) | 19 | (39 | ) | (58 | ) | (58 | ) | 19 | (39 | ) | ||||||||||||||||||||||||||||||||||||||||||||||||||||||||||||||||||
Other comprehensive loss | (16 | ) | (201 | ) | (217 | ) | (217 | ) | (16 | ) | (201 | ) | (217 | ) | (217 | ) | ||||||||||||||||||||||||||||||||||||||||||||||||||||||||||||||||
Total comprehensive loss | - | - | (58 | ) | - | - | (16 | ) | (201 | ) | (275 | ) | 19 | (256 | ) | - | - | (58 | ) | - | - | (16 | ) | (201 | ) | (275 | ) | 19 | (256 | ) | ||||||||||||||||||||||||||||||||||||||||||||||||||
Shares issued | 35 | 35 | 35 | 35 | 35 | 35 | ||||||||||||||||||||||||||||||||||||||||||||||||||||||||||||||||||||||||||
Share-based payment for share awards net of exercised | 6 | 6 | 6 | 6 | 6 | 6 | ||||||||||||||||||||||||||||||||||||||||||||||||||||||||||||||||||||||||||
Dividends of subsidiaries | - | (21 | ) | �� | (21 | ) | - | (21 | ) | (21 | ) | |||||||||||||||||||||||||||||||||||||||||||||||||||||||||||||||||||||
Translation | (10 | ) | 10 | (1 | ) | 1 | - | - | (10 | ) | 10 | (1 | ) | 1 | - | - | ||||||||||||||||||||||||||||||||||||||||||||||||||||||||||||||||
Balance at 31 December 2014 | 7,041 | 132 | (3,109 | ) | (1 | ) | 17 | (40 | ) | (1,195 | ) | 2,845 | 26 | 2,871 | 7,041 | 132 | (3,109 | ) | (1 | ) | 17 | (40 | ) | (1,195 | ) | 2,845 | 26 | 2,871 | ||||||||||||||||||||||||||||||||||||||||||||||||||||
Loss for the year | (85 | ) | (85 | ) | 15 | (70 | ) | |||||||||||||||||||||||||||||||||||||||||||||||||||||||||||||||||||||||||
Other comprehensive income (loss) | 1 | (7 | ) | 14 | (371 | ) | (363 | ) | (363 | ) | ||||||||||||||||||||||||||||||||||||||||||||||||||||||||||||||||||||||
Total comprehensive income (loss) | - | 1 | (85 | ) | - | (7 | ) | 14 | (371 | ) | (448 | ) | 15 | (433 | ) | |||||||||||||||||||||||||||||||||||||||||||||||||||||||||||||||||
Shares issued | 25 | 25 | 25 | |||||||||||||||||||||||||||||||||||||||||||||||||||||||||||||||||||||||||||||
Share-based payment for share awards net of exercised | 8 | 8 | 8 | |||||||||||||||||||||||||||||||||||||||||||||||||||||||||||||||||||||||||||||
Dividends of subsidiaries | - | (4 | ) | (4 | ) | |||||||||||||||||||||||||||||||||||||||||||||||||||||||||||||||||||||||||||
Translation | (24 | ) | 20 | (3 | ) | 7 | - | - | ||||||||||||||||||||||||||||||||||||||||||||||||||||||||||||||||||||||||
Balance at 31 December 2015 | 7,066 | 117 | (3,174 | ) | (1 | ) | 7 | (19 | ) | (1,566 | ) | 2,430 | 37 | 2,467 | ||||||||||||||||||||||||||||||||||||||||||||||||||||||||||||||||||
Profit for the year | 63 | 63 | 17 | 80 | ||||||||||||||||||||||||||||||||||||||||||||||||||||||||||||||||||||||||||||
Other comprehensive income (loss)(5) | 9 | (2 | ) | 180 | 187 | 187 | ||||||||||||||||||||||||||||||||||||||||||||||||||||||||||||||||||||||||||
Total comprehensive income (loss) | - | - | 63 | - | 9 | (2 | ) | 180 | 250 | 17 | 267 | |||||||||||||||||||||||||||||||||||||||||||||||||||||||||||||||||||||
Shares issued | 42 | 42 | 42 | |||||||||||||||||||||||||||||||||||||||||||||||||||||||||||||||||||||||||||||
Share-based payment for share awards net of exercised | (7 | ) | (7 | ) | (7 | ) | ||||||||||||||||||||||||||||||||||||||||||||||||||||||||||||||||||||||||||
Dividends of subsidiaries | - | (15 | ) | (15 | ) | |||||||||||||||||||||||||||||||||||||||||||||||||||||||||||||||||||||||||||
Transfer to reserves | (2 | ) | 2 | - | - | |||||||||||||||||||||||||||||||||||||||||||||||||||||||||||||||||||||||||||
Translation | 7 | (6 | ) | 1 | (2 | ) | - | - | ||||||||||||||||||||||||||||||||||||||||||||||||||||||||||||||||||||||||
Balance at 31 December 2016 | 7,108 | 117 | (3,119 | ) | (1 | ) | 17 | (21 | ) | (1,386 | ) | 2,715 | 39 | 2,754 | ||||||||||||||||||||||||||||||||||||||||||||||||||||||||||||||||||
| (1) | Other capital reserves |
| (2) | Included in accumulated losses are retained earnings |
| (3) | Cash flow hedge reserve represents the effective portion of fair value gains or losses in respect of cash flow hedges that expired in prior periods. The cash flow hedge reserve shall remain in equity and will unwind over the life of Serra Grande mine. |
| (4) | Available-for-sale reserve represents fair value gains or losses on available-for-sale financial assets. |
| (5) |
|
|
|
|
F - 5
NOTES TO THE CONSOLIDATED FINANCIAL STATEMENTS(continued)
ANGLOGOLD ASHANTI LIMITED
Notes to the consolidated financial statements
FOR THE YEARS ENDED 31 DECEMBER 2014, 20132016, 2015 and 20122014
| 1 | ACCOUNTING POLICIES |
Statement of compliance
The consolidated and company financial statements are prepared in compliance with International Financial Reporting Standards (IFRS) and Interpretations of those standards, as issued by the International Accounting Standards Board (IASB) in the English language, the South African Institute of Chartered Accountants Financial Reporting Guides as issued by the Accounting Practices Committee, Financial reportingReporting Pronouncements as issued by Financial Reporting Standards Council, JSE listings requirementsListings Requirements and in the manner required by the South African Companies Act, 2008.
New standards and interpretations issued
The financial statements have been drawn up on the basis of accounting standards, interpretations and amendments effective at the beginning of the accounting period on 1 January 2014.2016. The new standards, interpretations and amendments effective from 1 January 20142016 had no impact on the group.
AngloGold Ashanti Limited is in the process of assessingassesses the significance of new standards, interpretations and amendments to standards in issue that are not yet adopted.adopted but are likely to affect the financial reporting in future years. We have identified that IFRS 15 “Revenue from Contracts with Customers” and IFRS 9 “Financial Instruments”, both of which have an effective date of 1 January 2018, are likely to affect future financial reporting. The group has assessed IFRS 15 and concluded that it does not sell product based on multiple-element arrangements and it does not sell product on a provisional or variable pricing basis and as such the new standard is unlikely to have a significant impact on the timing or amount of the group’s revenue recognition. IFRS 15 will result in the recognition of by-product revenue in revenue for product sales and a consequential increase in cost of sales but will not have an effect on gross profit. We are still assessing the potential consequences of IFRS 9. In addition, IFRS 16 “Leases”, with an effective date of 1 January 2019, is likely to affect future financial reporting and we are still assessing all of the potential consequences. We expect that IFRS 16 will result in an increase in assets and liabilities as fewer contracts will qualify as operating leases and thus will not be expensed as payments are made. We expect an increase in depreciation expense and also an increase in cash flow from operating activities as these lease payments will now be recorded as financing outflows in our cash flow statement.
The significant accounting principles applied in the presentation of the group and company annual financial statements are set out below.
| 1.1 | BASIS OF PREPARATION |
The financial statements are prepared according to the historical cost convention, except for the revaluation of certain financial instruments to fair value. The group’s accounting policies as set out below are consistent in all material respects with those applied in the previous year.
The group financial statements are presented in US dollars.
Based on materiality, certain comparatives in the notes have been aggregated.
The group financial statements incorporate the financial statements of the company, its subsidiaries and its interests in joint ventures and associates. The financial statements of all material subsidiaries, the Environmental Rehabilitation Trust Fund, and joint ventures and associates, are prepared for the same reporting period as the holding company, using the same accounting policies.
Subsidiaries are all entities (including structured entities) over which the group has control. The group controls an entity when it is exposed to, or has rights to, variable returns from its involvement with the entity and has the ability to affect those returns through its power over the entity. Control would generally exist where the group owns more than 50% of the voting rights, unless the group and other investors collectively control the entity where they must act together to direct the relevant
F - 6
NOTES TO THE CONSOLIDATED FINANCIAL STATEMENTS(continued)
activities. In such cases, as no investor individually controls the entity the investment is accounted for as an equity method investment or a joint operation. Subsidiaries are fully consolidated from the date on which control is transferred to the group. They are de-consolidated from the date on which control ceases. The group re-assesses whether or not it controls an investee if facts and circumstances indicate that there are changes to one or more of the three elements of control.
The acquisition of non-controlling interests is reflected as an equity transaction. The entire difference between the cost of the additional interest and the non-controlling interests’ fair value of its share at the date of acquisition is reflected as a transaction between owners.
Disclosures for non-controlling interests are assessed by reference to consolidated non-controlling interest.
Intra-groupMaterial intra-group transactions, balances and unrealised gains and losses on transactions between group companies, including any resulting tax effect are eliminated. Unrealised losses are also eliminated unless the transaction provides evidence of an impairment of the asset transferred.
Subsidiaries are accounted for at cost and are adjusted for impairments, where appropriate, in the company financial statements.
F - 6
NOTES TO THE CONSOLIDATED FINANCIAL STATEMENTS(continued)
| 1.2 | SIGNIFICANT ACCOUNTING JUDGEMENTS AND ESTIMATES |
Use of estimates
The preparation of the financial statements requires the group’s management to make estimates and assumptions that affect the reported amounts of assets and liabilities and disclosure of contingent assets and liabilities at the date of the financial statements, and the reported amounts of revenues and expenses during the reporting period. The determination of estimates requires the exercise of judgement based on various assumptions and other factors such as historical experience, current and expected economic conditions, and in some cases actuarial techniques. Actual results could differ from those estimates.
The more significant areas requiring the use of management estimates and assumptions relate to Ore Reserve that are the basis of future cash flow estimates and unit-of-production depreciation, depletion and amortisation calculations; environmental, reclamation and closure obligations; estimates of recoverable gold and other materials in heap leach pads; asset impairments/reversals (including impairments of goodwill); and write-downs of inventory to net realisable value. Other estimates include post-employment, post-retirement and other employee benefit liabilities and deferred taxation.
Estimates and judgements are continually evaluated and are based on historical experience and other factors, including expectations of future events that are believed to be reasonable under the circumstances.
As a global company, the group is exposed to numerous legal risks. The outcome of currently pending and future proceedings cannot be predicted with certainty. Thus, an adverse decision in a lawsuit could result in additional costs that are not covered, either wholly or partly, under insurance policies and that could significantly influence the business and results of operations.
The judgements that management has applied in the application of accounting policies, and the estimates and assumptions that have a significant risk of causing a material adjustment to the carrying amounts of assets and liabilities within the next financial year, are discussed below.
Carrying value of goodwill and tangible assets
The majority of mining assets are amortised using the units-of-production method where the mine operating plan calls for production from a well-defined proved and probable Ore Reserve.
For mobile and other equipment, the straight-line method is applied over the estimated useful life of the asset which does not exceed the estimated mine life based on proved and probable Ore Reserve as the useful lives of these assets are considered to be limited to the life of the relevant mine.
The calculation of the units-of-production rate of amortisation could be impacted to the extent that actual production in the future is different from current forecast production based on proved and probable Ore Reserve. This would generally arise when there are significant changes in any of the factors or assumptions used in estimating Ore Reserve.
F - 7
NOTES TO THE CONSOLIDATED FINANCIAL STATEMENTS(continued)
These factors could include:
changes in proved and probable Ore Reserve;
the grade of Ore Reserve may vary significantly from time to time;
differences between actual commodity prices and commodity price assumptions;
unforeseen operational issues at mine sites; and
changes in capital, operating, mining, processing and reclamation costs, discount rates and foreign exchange rates.
Changes in proved and probable Ore Reserve could similarly impact the useful lives of assets amortised on the straight-line method, where those lives are limited to the life of the mine.
The group has a number of surface mining operations that are in the production phase for which production stripping costs are incurred. The benefits that accrue to the group as a result of incurring production stripping costs include (a) ore that can be used to produce inventory and (b) improved access to further quantities of material that will be mined in future periods.
F - 7
NOTES TO THE CONSOLIDATED FINANCIAL STATEMENTS(continued)
The production stripping costs relating to improved access to further quantities in future periods are capitalised as a stripping activity asset, if and only if, all of the following are met:
It is probable that the future economic benefit (improved access to the orebody) associated with the stripping activity will flow to the group;
The group can identify the component of the orebody for which access has been improved; and
The costs relating to the stripping activity associated with that component or components can be measured reliably.
Components of the various orebodies at the operations of the group are determined based on the geological areas identified for each of the orebodies and are reflected in the Ore Reserve reporting of the group. In determining whether any production stripping costs should be capitalised as a stripping activity asset, the group uses three operational guidance measures; two of which relate to production measures, while the third relates to an average stripping ratio measure.
Once determined that any portion of the production stripping costs should be capitalised, the group uses the average stripping ratio of the component or components to which the production stripping costs relate to determinedetermines the amount of the production stripping costs that should be capitalised.capitalised with reference to the average mine costs per tonne of the component and the actual waste tonnes that should be deferred. Stripping activity assets are amortised on the units-of-production method based on the Ore Reserve of the component or components of the orebody to which these assets relate.
This accounting treatment is consistent with that for stripping costs incurred during the development phase of a mine,pit, before production commences, except that stripping costs incurred during the development phase of a mine,pit, before production commences, are amortised on the units-of-production method based on the Ore Reserve of the life of the mine as a whole.pit.
Deferred stripping costs are included in ‘Mine development costs’, within tangible assets. These costs form part of the total investment in the relevant cash-generating unit, which is reviewed for impairment if events or a change in circumstances indicate that the carrying value may not be recoverable. Amortisation of stripping activity assets is included in operating costs.
An individual operating mine is not a typical going-concern business because of the finite life of its reserves. The allocation of goodwill to an individual mine will result in an eventual goodwill impairment due to the wasting nature of the mine reporting unit. In accordance with the provisions of IAS 36 “Impairment of Assets”, the group performs its annual impairment review of assigned goodwill during the fourth quarter of each year.
The group reviews and tests the carrying value of tangible assets when events or changes in circumstances suggestindicate that the carrying amount may not be recoverable. Assets are grouped at the lowest level for which identifiable cash flows are largely independent of cash flows of other assets. If there are indications that impairment may have occurred, estimates are prepared of expected future cash flows for each group of assets. Expected future cash flows used to determine the value in use of goodwill and tangible assets are inherently uncertain and could materially change over time and impact the recoverable amounts. The cash flows and value in use are significantly affected by a number of factors including published reserves, resources, exploration potential and production estimates, together with economic factors such as spot and future goldmetal prices, discount rates, foreign currency exchange rates, estimates of costs to produce reserves and future capital expenditure. Refer note 15 for estimates and assumptions used to calculate recoverable amounts. In addition the group considers the reversal of previously recognised impairments at each reporting date. At the reporting date the group assesses whether any of the indicators which gave rise to previously recognised impairments have changed such that the impairment loss no longer exists or may have decreased. The impairment loss is then assessed on the original factors for reversal and if indicated, such reversal is recognised.
F - 8
NOTES TO THE CONSOLIDATED FINANCIAL STATEMENTS(continued)
The recoverable amount is estimated based on the positive indicators. If an impairment loss has decreased, the carrying amount is recorded at the recoverable amount as limited in terms of IAS 36.
During the year it was announced that the Obuasi site, which was in care and maintenance, had been illegally occupied restricting the company from continuing the necessary work to enable the restarting of the mine. Late in the financial year the illegal miners were mostly removed from the mine by the authorities and the company began assessing the damage caused as well as the costs necessary to implement the restarting process. The plans currently in place indicate that no impairment of the carrying value of $156m was necessary.
The carrying amount of goodwill in the consolidated financial statements at 31 December 20142016 was $142m (2013: $154m; 2012: $195m)$126m (2015: $126m; 2014: $142m). The carrying amount of tangible assets at 31 December 20142016 was $4,863m (2013: $4,815m; 2012: $7,776m)$4,111m (2015: $4,058m; 2014: $4,863m). The impairment and derecognition of goodwill and tangible assets recognised in the consolidated financial statements for the year ended 31 December 2014 were nil (2013: $15m; 2012: nil) and $4m (2013: $2,978m; 2012: $356m) respectively.
F - 8
NOTES TO THE CONSOLIDATED FINANCIAL STATEMENTS(continued)
2016 was $3m (2015: $5m; 2014: $4m).
Production start date
The group assesses the stage of each mine construction project, which may be a new open-pit, to determine when a mineconstruction project moves into the production stage. The criteria used to assess the start date are determined by the unique nature of each mine construction project and include factors such as the complexity of a plant and its location. The group considers various relevant criteria to assess when the mineconstruction project is substantially complete and ready for its intended use and moves into the production stage. Some of the criteria would include, but are not limited to the following:
the level of capital expenditure compared to the construction cost estimates;
completion of a reasonable period of testing of the mine plant and equipment;constructed asset;
ability to produce goldmetals in saleable form (within specifications and the de minimis rule); and
ability to sustain ongoing production of gold.metals.
When a mine construction project moves into the production stage, the capitalisation of certain mine construction costs ceases and costs are either regarded as inventory or expensed, except for capitalisable costs related to mining asset additions or improvements, underground mine development, deferred stripping activities, or Ore Reserve development.
Income taxes
The group is subject to income taxes in numerous jurisdictions. Significant judgement is required in determining the worldwide provision for income taxes due to the complexity of legislation. There are many transactions and calculations for which the ultimate tax determination is uncertain during the ordinary course of business. The group recognises liabilities for anticipated tax audit issues based on estimates of whether additional taxes will be due. Where the final tax outcome of these matters is different from the amounts that were initially recorded, such differences will impact the income tax and deferred tax provisions in the period in which such determination is made.
The group recognises the net future tax benefit related to deferred income tax assets to the extent that it is probable that the deductible temporary differences will reverse in the foreseeable future. Assessing the recoverability of deferred income tax assets requires the group to make significant estimates related to expectations of future taxable income. Estimates of future taxable income are based on forecast cash flows from operations and the application of existing tax laws in each jurisdiction. To the extent that future cash flows and taxable income differ significantly from estimates, the ability of the group to realise the net deferred tax assets recorded at the reporting date could be impacted.
Additionally, future changes in tax laws in the jurisdictions in which the group operates could limit the ability of the group to obtain tax deductions in future periods.
Carrying values of the group at 31 December 2014:2016:
deferred tax asset: $127m (2013: $177m; 2012: $97m)$4m (2015: $1m; 2014: $127m);
deferred tax liability: $567m (2013: $579m; 2012: $1,084m)$496m (2015: $514m; 2014: $567m);
taxation liability: $66m (2013: $81m; 2012: $120m)$111m (2015: $91m; 2014: $66m); and
taxation asset: $25m (2013: $51m; 2012: $54m)$14m (2015: $27m; 2014: $25m).
Unrecognised value of deferred tax assets: $563m (2013: $414m; 2012: $89m)$477m (2015: $452m; 2014: $563m).
F - 9
NOTES TO THE CONSOLIDATED FINANCIAL STATEMENTS(continued)
Provision for environmental rehabilitation obligations
The group’s mining and exploration activities are subject to various laws and regulations governing the protection of the environment. The group recognises management’s best estimate for decommissioning and restoration obligations in the period in which they are incurred. Actual costs incurred in future periods could differ materially from the estimates. Additionally, future changes to environmental laws and regulations, life of mine estimates, inflation rates, foreign currency exchange rates and discount rates could affect the carrying amount of this provision.
The carrying amount of the rehabilitation obligations for the group at 31 December 20142016 was $851m (2013: $728m; 2012: $841m)$705m (2015: $683m; 2014: $851m).
Stockpiles and metals in process and ore on leach pad
Costs that are incurred in or benefit the production process are accumulated as stockpiles and metals in process and ore on leach pads.process. Net realisable value tests are performed at least annually and represent the estimated future sales price of the product, based on prevailing and long-term metals prices, less estimated costs to complete production and bring the product to sale.
F - 9
NOTES TO THE CONSOLIDATED FINANCIAL STATEMENTS(continued)
StockpilesSurface and underground stockpiles and metals in process are measured by estimating the number of tonnes added and removed from the stockpile, and from underground, the number of contained gold ounces based on assay data, and the estimated recovery percentage based on the expected processing method. Stockpile and underground ore tonnages are verified by periodic surveys.
Estimates of the recoverable gold on the leach pads are calculated from the quantities of ore placed on the pads based on measured tonnes added to the leach pads, the grade of ore placed on the leach pads based on assay data and a recovery percentage based on metallurgical testing and ore type.
Although the quantities of recoverable metal are reconciled by comparing the grades of ore to the quantities of goldmetals actually recovered (metallurgical balancing), the nature of the process inherently limits the ability to precisely monitor recoverability levels. As a result, the metallurgical balancing process is constantly monitored and engineering estimates are refined based on actual results over time.
Variations between actual and estimated quantities resulting from changes in assumptions and estimates that do not result in write-downs to net realisable value are accounted for on a prospective basis.
The carrying amount of inventories (excluding finished goods and mine operating supplies) for the group at 31 December 20142016 was $1,106m (2013: $1,125m; 2012: $1,309m)$397m (2015: $393m; 2014: $1,106m).
Recoverable tax, rebates, levies and duties
In a number of countries, particularly in Continental Africa, AngloGold Ashanti Limited is due refunds of indirect tax which remain outstanding for periods longer than those provided for in the respective statutes.
In addition, AngloGold Ashanti Limited has unresolved tax disputes in a number of countries, particularly in Continental Africa and in Brazil. If the outstanding input taxes are not received and the tax disputes are not resolved in a manner favourable to AngloGold Ashanti, Limited, it could have an adverse effect upon the carrying value of these assets.
The carrying value of recoverable tax, rebates, levies and duties for the group at 31 December 20142016 was $169m (2013: $229m; 2012: $243m)$148m (2015: $121m; 2014: $169m).
Pension plans and post-retirement medicalPost-retirement obligations
The determination of AngloGold Ashanti Limited’sAshanti’s obligation and expense for pension and provident funds, as well as post-retirement health care liabilities, depends on the selection of certain assumptions used by actuaries to calculate amounts. These assumptions include, among others, the discount rate, the expected long-term rate of return of plan assets, health care inflation costs, rates of increase in compensation costs and the number of employees who reach retirement age before the mine reaches the end of its life. While AngloGold Ashanti Limited believes that these assumptions are appropriate, significant changes in the assumptions may materially affect pension and other post-retirement obligations as well as future expenses, which may result in an impact on earnings in the periods that the changes in these assumptions occur.
The carrying value of the defined benefitpost-retirement plans (including the net asset position disclosed under non-current assets) at 31 December 20142016 was $122m (2013: $111m; 2012: $221m)$118m (2015: $89m; 2014: $122m).
F - 10
NOTES TO THE CONSOLIDATED FINANCIAL STATEMENTS(continued)
Ore Reserve estimates
An Ore Reserve estimate is an estimate of the amount of product that can be economically and legally extracted from the group’s properties. In order to calculate the Ore Reserve, estimates and assumptions are required about a range of geological, technical and economic factors, including quantities, grades, production techniques, recovery rates, production costs, transport costs, commodity demand, commodity prices and exchange rates.
Estimating the quantity and/or grade of the Ore Reserve requires the size, shape and depth of orebodies to be determined by analysing geological data such as the logging and assaying of drill samples. This process may require complex and difficult geological judgements and calculations to interpret the data.
The group is required to determine and report its Ore Reserve in accordance with the South African Code for the reporting of Exploration Results, Mineral Resources and Mineral Reserves (The SAMREC code.
F - 10
NOTES TO THE CONSOLIDATED FINANCIAL STATEMENTS(continued)
Code) 2016 Edition.
Because the economic assumptions used to estimate changes in the Ore Reserve from period to period, and because additional geological data is generated during the course of operations, estimates of the Ore Reserve may change from period to period. Changes in the reported Ore Reserve may affect the group’s financial results and financial position in a number of ways, including the following:
asset carrying values may be affected due to changes in estimated future cash flows;
depreciation, depletion and amortisation charged in the income statement may change where such charges are determined by the units-of-production method, or where the useful economic lives of assets change;
overburden removal costs, including production stripping activities, recorded on the statement of financial position or charged in the income statement may change due to changes in stripping ratios or the units-of-production method of depreciation;
decommissioning site restoration and environmental provisions may change where changes in the estimated Ore Reserve affect expectations about the timing or cost of these activities; and
the carrying value of deferred tax assets may change due to changes in estimates of the likely recovery of the tax benefits.
Development expenditure
Development activities commence after project sanctioning by the appropriate level of management. Judgement is applied by management in determining when a project has reached a stage at which economically recoverable reserves exist such that development may be sanctioned. In exercising this judgement, management is required to make certain estimates and assumptions similar to those described abovein the accounting policy for capitalised exploration and evaluation expenditure.assets. Any such estimates and assumptions may change as new information becomes available. If, after having started the development activity, a judgement is made that a development asset is impaired, the appropriate amount will be written off to the income statement.
Share-based paymentsInvestments in associates and joint ventures
The group issues equity-settled share-based payments to certain employees and third parties outsideIn determining materiality for the group. Equity-settled share-based payments are measureddisclosure requirements of IFRS 12 “Disclosure of Interest in Other Entities”, management has assessed that amounts representing the carrying value of at fair value (excluding the effect of non-market based vesting conditions) at the date of grant. The fair value determined at the grant dateleast 90% of the equity-settled share-based payments is expensed as services are rendered over the vesting period, based on the group’s estimateinvestments in associates and 90% of the shares that will eventually vestinvestments in joint ventures balances, reported in the statement of financial position, constitute quantitative materiality.
The carrying values of investments in associates and adjustedjoint ventures for the effect of non-market-based vesting conditions.
Fair value is measured using the Black-Scholes option-pricing model. The expected life used in the model has been adjusted, based on management’s best estimate, for the effects of non-transferability, exercise restrictions and behavioural considerations.
The income statement charge for the year was $39m (2013: $30m; 2012: $66m)group at 31 December 2016 amount to $1,448m (2015: $1,465m; 2014: $1,427m).
Contingencies
By their nature, contingencies will only be resolved when one or more future events occur or fail to occur. The assessment of such contingencies inherently involves the exercise of significant judgement and estimates of the outcome of future events. Such contingencies include, but are not limited to environmental obligations, litigation, regulatory proceedings, tax matters and losses resulting from other events and developments.
Firstly, when a loss is considered probable and reasonably estimable, a liability is recorded in the amount of the best estimate for the ultimate loss. The likelihood of a loss with respect to a contingency can be difficult to predict and determining a meaningful estimate of the loss or a range of loss may not always be practicable based on the information available at the time and the potential effect of future events and decisions by third parties that will determine the ultimate resolution of the contingency. It is not uncommon for such matters to be resolved over many years, during which time
F - 11
NOTES TO THE CONSOLIDATED FINANCIAL STATEMENTS(continued)
relevant developments and new information is continuously evaluated to determine both the likelihood of any potential loss and whether it is possible to reasonably estimate a range of possible losses. When a loss is probable but a reasonable estimate cannot be made, disclosure is provided.
In determining the threshold for disclosure on a qualitative and quantitative basis, management considers the potential for a disruptive effect on the normal functioning of the group and/or whether the contingency could impact investment decisions. Such qualitative matters considered are reputational risks, regulatory compliance issues and reasonable investor considerations. For quantitative purposes an amount of $20m, has been considered.
F - 11
NOTES TO THE CONSOLIDATED FINANCIAL STATEMENTS(continued)
Litigation and other judicial proceedings as a rule raise difficult and complex legal issues and are subject to uncertainties and complexities including, but not limited to, the facts and circumstances of each particular case, issues regarding the jurisdiction in which each suit is brought and differences in applicable law. Upon resolution of any pending legal matter, the group may be forced to incur charges in excess of the presently established provisions and related insurance coverage. It is possible that the financial position, results of operations or cash flows of the group could be materially affected by the unfavourable outcome of litigation.
| 1.3 | SUMMARY OF SIGNIFICANT ACCOUNTING POLICIES |
Equity-accounted investments
Joint ventures
A joint venture is an entity in which the group holds a long-term interest and which the group and one or more other ventures jointly control under a contractual arrangement, that provides for strategic, financial and operating policy decisions relating to the activities requiring unanimous consent of the parties sharing control. The group’s interests in joint arrangements classified as joint ventures are accounted for using the equity method.
ProfitsMaterial profits and losses realised in connection with transactions between the group and joint ventures are eliminated in proportion to share ownership. Such profits and losses are deducted from the group’s equity and related statement of financial position amount and released in the group accounts when the assets are effectively realised outside the group. Dividends received from joint ventures are included in operating activities in the cash flow statement.
Joint ventures are accounted for at cost and are adjusted for impairments where appropriate in the company financial statements.
Associates
The equity method of accounting is used for an investment over which the group exercises significant influence and normally owns between 20% and 50% of the voting equity. Associates are equity-accounted from the effective date of acquisition to the effective date of disposal. If necessary, impairment losses on loans and equity are reported under share of profit and loss from investments accounted for using the equity method.
ProfitsMaterial profits and losses realised in connection with transactions between the group and associated companies are eliminated in proportion to share ownership. Such profits and losses are deducted from the group’s equity and related statement of financial position amount and released in the group accounts when the assets are effectively realised outside the group. Dividends received from associates are included in investing activities in the cash flow statement.
As the group only has significant influence, it is unable to obtain reliable information at reporting period on a timely basis. The results of associates are equity-accounted from their most recent audited annual financial statements or unaudited interim financial statements, all within three months of the year end of the group. Adjustments are made to the associates’ financial results for material transactions and events in the intervening period.
Associates are accounted for at cost and are adjusted for impairments where appropriate in the company financial statements.
Joint ventures and associates
Any losses of equity-accounted investments are brought to account in the consolidated financial statements until the investment in such investments is written down to zero. Thereafter, losses are accounted for only insofar as the group is committed to providing financial support to such investees.
F - 12
NOTES TO THE CONSOLIDATED FINANCIAL STATEMENTS(continued)
The carrying value of equity-accounted investments represents the cost of each investment, including goodwill, balance outstanding on loans advanced if the loan forms part of the net investment in the investee, any impairment losses recognised, the share of post-acquisition retained earnings and losses, and any other movements in reserves. The carrying value of equity-accounted investments is reviewed when indicators arise and if any impairment in value has occurred; it is recognised in the period in which the impairment arose.
F - 12
NOTES TO THE CONSOLIDATED FINANCIAL STATEMENTS(continued)
Business combinations
Business combinations are accounted for using the acquisition method. The cost of an acquisition is measured as the aggregate of the consideration transferred measured at acquisition date fair value and the amount of any non-controlling interest in the acquiree. Acquisition-related costs are expensed as incurred and included in administrative expenses. Goodwill is initially measured at cost, being the excess of the aggregate of the consideration transferred and the amount recognised for non-controlling interest over the net identifiable assets acquired and liabilities assumed. If the fair value of the net assets acquired is in excess of the aggregate consideration transferred, the gain is recognised in profit or loss.
Unincorporated joint ventures – joint operations
A joint operation is a joint arrangement whereby the parties that have joint control of the arrangement have rights to the use of assets and obligations for the liabilities of the arrangement. The group accounts for activities under joint operations by recognising in relation to the joint operation, the assets it controls and the liabilities it incurs, the expenses it incurs and the revenue from the sale or use of its share of the joint operations output.
Foreign currency translation
Functional currency
Items included in the financial statements of each of the group’s entities are measured using the currency of the primary economic environment in which the entity operates (the ‘functional currency’). The functional currency of the parent company is South African Rands.
Transactions and balances
Foreign currency transactions are translated into the functional currency using the approximate exchange rates prevailing at the dates of the transactions. Foreign exchange gains and losses resulting from the settlement of foreign currency transactions and from the translation at the reporting period exchange rate of monetary assets and liabilities denominated in foreign currencies are recognised in the income statement, except for hedging derivative balances that are within the scope of IAS 39 “Financial Instruments: Recognition and Measurement”. Translation differences on these balances are reported as part of their fair value gain or loss.
Translation differences on non-monetary items, such as equities classified as available-for-sale financial assets, are included in other comprehensive income within equity.
Group companies
The results and financial position of all group entities (none of which has the currency of a hyperinflationary economy) that have a functional currency different from the presentation currency are translated into the presentation currency as follows:
share capital and premium are translated at historical rates of exchange at the reporting date;
retained earnings are converted at historical average exchange rates;
assets and liabilities for each statement of financial position presented are translated at the closing rate at the date of that statement of financial position;
income and expenses for each income statement presented are translated at monthly average exchange rates (unless this average is not a reasonable approximation of the cumulative effect of the rates prevailing on the transaction dates, in which case income and expenses are translated at the rates prevailing at the date of the transaction);
all resulting exchange differences are recognised in other comprehensive income and presented as a separate component of equity (foreign currency translation); and
other reserves, other than those translated above, are converted at the official closing rate at each reporting date. These resulting exchange differences are recognised in retained earnings.
Exchange differences arising from the translation of the net investment in foreign operations, and of borrowings and other currency instruments designated as hedges of such investments, are taken to other comprehensive income on consolidation. On repayment or realisation, permanent loans and investments are recycled from FCTR to the income statement. For the company, the exchange differences on such monetary items are reported in the company income statement.
When a foreign operation is sold, such exchange differences are recognised in the income statement as part of the gain or loss on sale.
Goodwill and fair value adjustments arising from the acquisition of a foreign operation are treated as assets and liabilities of the foreign operation and translated at the closing rate.
F - 13
NOTES TO THE CONSOLIDATED FINANCIAL STATEMENTS(continued)
Segment reporting
An operating segment is a business activity whose results are regularly reviewed by the chief operating decision maker in order to make decisions about resources to be allocated to it and to assess its performance and for which discrete financial information is available. The chief operating decision maker has been determined to be the Executive Committee.
F - 13
NOTES TO THE CONSOLIDATED FINANCIAL STATEMENTS(continued)
Tangible assets
Tangible assets are recorded at cost less accumulated amortisation and impairments/reversals. Cost includes pre-production expenditure incurred during the development of a mine and the present value of related future decommissioning costs.
Interest on borrowings relating to the financing of major capital projects under construction is capitalised during the construction phase as part of the cost of the project. Such borrowing costs are capitalised over the period during which the asset is being acquired or constructed and borrowings have been incurred. Capitalisation ceases when construction is interrupted for an extended period or when the asset is substantially complete. Other borrowing costs are expensed as incurred.
If there is an indication that the recoverable amount of any of the tangible assets is less than the carrying value, the recoverable amount is estimated and an allowance is made for the impairment in value.
Subsequent costs are included in the asset’s carrying amount only when it is probable that future economic benefits associated with the asset will flow to the group, and the cost of the addition can be measured reliably. All other repairs and maintenance are charged to the income statement during the financial period in which they are incurred.
To the extent a legal or constructive obligation to a third party exists, the acquisition cost includes estimated costs of dismantling and removing the asset and restoring the site. A change in estimated expenditures for dismantling, removal and restoration is added to and/or deducted from the carrying value of the related asset. To the extent that the change would result in a negative carrying amount, this effect is recognised as income. The change in depreciation charge is recognised prospectively.
For assets amortised on the units-of-production method, amortisation is calculated to allocate the cost of each asset to its residual value over its estimated useful life.
For those assets not amortised on the units-of-production method, amortisation is calculated over their estimated useful life as follows:
buildings up to life of mine;
plant and machinery up to life of mine;
equipment and motor vehicles up to five years;
computer equipment up to three years; and
leased assets over the shorter of the period of the lease and the useful life.
Major renovations are depreciated over the remaining useful life of the related asset or to the date of the next major renovation, whichever is sooner.
Assets are amortised to residual values. Residual values and useful lives are reviewed, and adjusted if appropriate, at the beginning of each financial year.
Gains and losses on disposals are determined by comparing net sale proceeds with the carrying amount.amount at the date of sale. These are included in the income statement.
Mine development costs
Capitalised mine development costs include expenditure incurred to develop new orebodies, to define further mineralisation in existing orebodies and, to expand the capacity of a mine. Mine development costs include acquired proved and probable Ore Reserve at cost at the acquisition date. These costs are amortised from the date on which commercial production begins.
F - 14
NOTES TO THE CONSOLIDATED FINANCIAL STATEMENTS(continued)
Depreciation, depletion and amortisation of mine development costs are computed by the units-of-production method based on estimated proved and probable Ore Reserve. The proved and probable Ore Reserve reflects estimated quantities of reserves which can be recovered economically in the future from known mineral deposits.
F - 14
NOTES TO THE CONSOLIDATED FINANCIAL STATEMENTS(continued)
Capitalised mine development costs also include stripping activity assets relating to production stripping activities incurred in the production phase of open-pit operations of the group. Once determined that any portion of the production stripping costs should be capitalised, the group uses the average stripping ratio anddetermines the average mine costs per tonne of the component and the waste tonnes to which the production stripping costs relate to determine the amount of the production stripping costs that should be capitalised. Stripping activity assets are amortised on a units-of-production method based on the Ore Reserve of the component of the orebody to which these assets relate.
The average stripping ratio is calculated as the number of tonnes of waste material expected to be removed during the life of the component per tonne of ore mined from the component or components. The average mine cost per tonne of the component is calculated as the total expected costs to be incurred to mine the relevant component of the orebody, divided by the number of tonnes expected to be mined from the component. The average mine stripping ratio and the average mine cost per tonne of the component to which the stripping activity asset relates are recalculated annually in the light of additional knowledge and changes in estimates.
Mine infrastructure
Mine plant facilities, including decommissioning assets, are amortised using the lesser of their useful life or units-of-production method based on estimated proved and probable Ore Reserve. Other tangible assets comprising vehicles and computer equipment are depreciated by the straight-line method over their estimated useful lives.
Land and assets under construction
Land and assets under construction are not depreciated and are measured at historical cost less impairments.
Mineral rights and dumps
Mineral rights are amortised using the units-of-production method based on the estimated proved and probable Ore Reserve. Dumps are amortised over the period of treatment.
Exploration and evaluation assets
All exploration costs are expensed until it is concluded that a future economic benefit will more likely than not be realised. In evaluating if expenditures meet this criterion to be capitalised, several different sources of information are used depending on the level of exploration. While the criterion for concluding that expenditure should be capitalised is always probable, the information used to make that determination depends on the level of exploration.
Costs on greenfields sites, being those where the group does not have any mineral deposits which are already being mined or developed under the planned method of extraction, are expensed as incurred until the group is able to demonstrate that future economic benefits are probable, which generally will be the establishment of proved and probable Ore Reserve at this location.location;
Costs on brownfields sites, being those adjacent to mineral deposits which are already being mined or developed under the planned method of extraction, are expensed as incurred until the group is able to demonstrate that future economic benefits are probable, which generally will be the establishment of increased inclusive proved and probable Ore Reserve after which the expenditure is capitalised as a mine development cost.cost; and
Costs relating to extensions of mineral deposits, which are already being mined or developed, including expenditure on the definition of mineralisation of such mineral deposits, are capitalised as a mine development cost.
Costs relating to property acquisitions are capitalised within development costs.
Intangible assets
Acquisition and goodwill arising thereon
Where an investment in a subsidiary, joint venture or an associate is made, any excess of the consideration transferred over the fair value of the attributable Mineral Resource including value beyond proved and probable, exploration properties and net assets is recognised as goodwill. Goodwill in respect of subsidiaries is disclosed as goodwill. Goodwill relating to equity-accounted joint ventures and associates is included within the carrying value of the investment which is tested for impairment when indicators exist.
Goodwill relating to subsidiaries is tested annually for impairment and carried at cost less accumulated impairment losses. Gains and losses on the disposal of an entity include the carrying amount of goodwill relating to the entity sold. Goodwill is allocated to cash-generating units for the purpose of impairment testing.
F - 15
NOTES TO THE CONSOLIDATED FINANCIAL STATEMENTS(continued)
Royalty rate concession
The royalty rate concession with the government of Ghana was capitalised at fair value at agreement date. Fair value represents a present value of future royalty rate concessions over 15 years. The royalty rate concession has been assessed to have a finite life and is amortised on a straight-line method over a period of 15 years, the period over which the concession runs. The related amortisation expense is charged through the income statement. This intangible asset is tested for impairment when there is an indicator of impairment.
Software
Software purchased, including direct costs associated with customisation and installation of the software, is capitalised.
Internally-developed software is capitalised when it meets the criteria for capitalisation. Other software development expenditure is charged to the income statement when incurred. Software is amortised on a straight-line basis over its useful life which is determined to be the lesser of the license period of the software; the manufacturer’s announced upgrade that management intends to implement; or 3 years. Useful lives are reviewed, and adjusted if appropriate, annually.
Impairment of assets
Intangible assets that have an indefinite useful life and separately recognised goodwill are not subject to amortisation and are tested annually for impairment and whenever events or changes in circumstance indicate that the carrying amount may not be recoverable. Assets that are subject to amortisation are tested for impairment whenever events or changes in circumstance indicate that the carrying amount may not be recoverable.
An impairment loss is recognised for the amount by which the asset’s carrying amount exceeds its recoverable amount. The recoverable amount is the higher of an asset’s fair value less costs to sell and value in use. For the purposes of assessing impairment, assets are grouped at the lowest levels for which there are separately identifiable cash flows (cash-generating units).
Leased assets
Assets subject to finance leases are capitalised at the lower of their fair value or the present value of minimum lease payments measured at inception of the lease with the related lease obligation recognised at the same amount. Capitalised leased assets are depreciated over the shorter of their estimated useful lives and the lease term. Finance lease payments are allocated using the rate implicit in the lease, which is included in finance costs, and the capital repayment, which reduces the liability to the lessor.
Operating lease rentals are charged against operating profits in a systematic manner related to the period the assets concerned will be used.
Non-current assets held for sale
Non-current assets and disposal groups are classified as held for sale if their carrying amount will be recovered principally through a sale transaction rather than through continuing use. This condition is regarded as having been met only when the sale is highly probable and the asset (or disposal group) is available for immediate sale in its present condition. Management must be committed to the sale, which should be expected to qualify for recognition as a completed sale within one year from the date of classification.
Non-current assets (and disposal groups) classified as held for sale are measured at the lower of their previous carrying amount and fair value less costs to sell.
Exploration and research expenditure
Pre-license costs are recognised in profit or loss as incurred. Exploration and research expenditure is expensed in the year in which it is incurred. These expenses include: geological and geographical costs, labour, Mineral Resource and exploratory drilling costs.
F - 16
NOTES TO THE CONSOLIDATED FINANCIAL STATEMENTS(continued)
Inventories
Inventories are valued at the lower of cost and net realisable value after appropriate allowances for redundant and obsolete items. Cost is determined on the following bases:
metals in process are valued at the average total production cost at the relevant stage of production;
gold doré/bullion is valued on an average total production cost method;
ore stockpiles are valued at the average moving cost of mining and stockpiling the ore. Stockpiles are classified as a non-current asset where the stockpile exceeds current processing capacity;
by-products, which include uranium oxide and sulphuric acid, are valued using an average total production cost method. By-products are classified as a non-current asset where the by-products on hand exceed current processing capacity;
mine operating supplies are valued at average cost; and
F - 16
NOTES TO THE CONSOLIDATED FINANCIAL STATEMENTS(continued)
heap leach pad materials are measured on an average total production cost basis. The cost of materials on the leach pad from which metals are expected to be recovered in a period longer than 12 months is classified as a non-current asset.
A portion of the related depreciation, depletion and amortisation charge is included in the cost of inventory.
Provisions
Provisions are recognised when the group has a present obligation, whether legal or constructive, because of a past event for which it is probable that an outflow of resources embodying economic benefits will be required to settle the obligation and a reliable estimate can be made of the amount of the obligation. Where some or all of the expenditure required to settle a provision is expected to be reimbursed by another party, the reimbursement is recognised only when the reimbursement is virtually certain. The amount to be reimbursed is recognised as a separate asset. Where the group has a joint and several liability with one or more other parties, no provision is recognised to the extent that those other parties are expected to settle part or all of the obligation.
Provisions are measured at the present value of management’s best estimate of the expenditure required to settle the obligation at the reporting date. The discount rate used to determine the present value reflects current market assessments of the time value of money and the risks specific to the liability.
Litigation and administrative proceedings are evaluated on a case-by-case basis considering the information available, including that of legal counsel, to assess potential outcomes. Where it is considered probable that an obligation will result in an outflow of resources, a provision is recorded for the present value of the expected cash outflows if these are reasonably measurable. These provisions cover the estimated payments to plaintiffs, court fees and the cost of potential settlements.
AngloGold Ashanti Limited does not recognise a contingent liability on its statement of financial position except in a business combination where the contingent liability represents a possible obligation.
Employee benefits
Pension obligations
Group companies operate various pension schemes. The schemes are funded through payments to insurance companies or trustee-administered funds, determined by periodic actuarial calculations. The group has both defined benefit and defined contribution plans. A defined benefit plan is a pension plan that defines an amount of pension benefit that an employee will receive on retirement, usually dependent on one or more factors such as age, years of service and compensation.
A defined contribution plan is a pension scheme under which the group pays fixed contributions into a separate entity. The group has no legal or constructive obligation to pay further contributions if the fund does not hold sufficient assets to pay all employees the benefits relating to employee service in current and prior periods. The contributions are recognised as employee benefit expenses when they are due. Prepaid contributions are recognised as an asset to the extent that a cash refund or a reduction in future contribution payments is available.
The asset/liability recognised in the statement of financial position in respect of defined benefit pension plans is the present value of the defined benefit obligation at the reporting date less the fair value of plan assets, together with adjustments for past service costs. The defined benefit obligation is calculated annually by independent actuaries using
F - 17
NOTES TO THE CONSOLIDATED FINANCIAL STATEMENTS(continued)
the projected unit credit method. The value of any defined benefit asset recognised is restricted to the sum of any past service cost and the present value of any economic benefits available in the form of refunds from the plan or reductions in future contributions to the plan.
Actuarial gains and losses arising from experience adjustments and changes in actuarial assumptions are immediately recorded in other comprehensive income.
Other post-employment benefit obligations
Some group companies provide post-retirement health care benefits to their retirees. The entitlement to these benefits is usually conditional on the employee remaining in service up to retirement age and completion of a minimum service period. The expected costs of these benefits are accrued over the period of employment using an accounting methodology on the same basis as that used for defined benefit pension plans. Actuarial gains and losses arising from experience adjustments and changes in actuarial assumptions are recorded in other comprehensive income immediately. These obligations are valued annually by independent qualified actuaries.
F - 17
NOTES TO THE CONSOLIDATED FINANCIAL STATEMENTS(continued)
Termination benefits
Termination benefits are payable when employment is terminated before the normal retirement date, or when an employee accepts voluntary redundancy in exchange for these benefits. An entity shall recogniseThe group recognises a liability and expense for termination benefits at the earlier of the following dates: (a) when the entity can no longer withdraw the offer of those benefits; and (b) when the entity recognises costs for a restructuring that is within the scope of IAS 37 “Provisions, Contingent Liabilities and Contingent Assets” and involves the payment of termination benefits. The group recognises termination benefits when it is demonstrably committed to either terminating the employment of current employees according to a detailed formal plan without possibility of withdrawal; or providing termination benefits as a result of an offer made to encourage voluntary redundancy based on the number of employees expected to accept the offer. Benefits falling due more than 12 months after reporting date are discounted to present value.
Profit-sharing and bonus plans
The group recognises a liability and an expense for bonuses and profit-sharing, based on a formula that takes into consideration the profit attributable to the group’s shareholders after certain adjustments. The group recognises a provision where contractually obliged or where there is a past practice that has created a constructive obligation.
Share-based payments
The group’s management awards certain employee bonuses in the form of equity-settled share-based payments on a discretionary basis.
The fair value of the equity instruments granted is calculated at measurement date, for transactions with employees this is at grant date. For transactions with employees, fair value is based on market prices of the equity instruments granted, if available, taking into account the terms and conditions upon which those equity instruments were granted. If market prices of the equity instruments granted are not available, the fair value of the equity instruments granted is estimated using an appropriate valuation model. Vesting conditions, other than market conditions, are not taken into account when estimating the fair value of shares or share options at measurement date.
Over the vesting period, the fair value at measurement date is recognised as an employee benefit expense with a corresponding increase in other capital reserves based on the group’s estimate of the number of instruments that will eventually vest. The income statement charge or credit for a period represents the movement in cumulative expense recognised as at the beginning and end of that period. Vesting assumptions for non-market conditions are reviewed at each reporting date to ensure they reflect current expectations.
When options are exercised or share awards vest, the proceeds received, net of any directly attributable transaction costs, are credited to share capital (nominal value) and share premium.
Where the terms of an equity settled award are modified, as a minimum, an expense is recognised as if the terms had not been modified. In addition, an expense is recognised for any modification which increases the total fair value of the share-based payment arrangement, or is otherwise beneficial to the employee, as measured at the date of the modification.
In the company financial statements, share-based payment arrangements with employees of other group entities are recognised by charging that entity its share of the expense and a corresponding increase in other capital reserves. When options are exercised or share awards vest, the proceeds received, net of any directly attributable transaction costs, are credited to share capital (nominal value) and share premium.
F - 18
NOTES TO THE CONSOLIDATED FINANCIAL STATEMENTS(continued)
Environmental expenditure
The group has long-term remediation obligations comprising decommissioning and restoration liabilities relating to its past operations which are based on the group’s environmental management plans, in compliance with current environmental and regulatory requirements. Provisions for non-recurring remediation costs are made when there is a present obligation, it is probable that expenditure on remediation work will be required and the cost can be estimated within a reasonable range of possible outcomes. The costs are based on currently available facts, technology expected to be available at the time of the clean-up, laws and regulations presently or virtually certain to be enacted and prior experience in remediation of contaminated sites.
F - 18
NOTES TO THE CONSOLIDATED FINANCIAL STATEMENTS(continued)
Contributions for the South African operations are made to Environmental Rehabilitation Trust Funds, created in accordance with local statutory requirements where applicable, to fund the estimated cost of rehabilitation during and at the end of the life of a mine. The amounts contributed to the trust funds are accounted for as non-current assets in the company. Interest earned on monies paid to rehabilitation trust funds is accrued on a time proportion basis and is recorded as interest income. For group purposes, the trusts are consolidated.
Decommissioning costs
The provision for decommissioning represents the cost that will arise from rectifying damage caused before production commences. Accordingly, a provision and a decommissioning asset is recognised and included within mine infrastructure.
Decommissioning costs are provided at the present value of the expenditures expected to settle the obligation, using estimated cash flows based on current prices. The unwinding of the decommissioning obligation is included in the income statement. Estimated future costs of decommissioning obligations are reviewed regularly and adjusted as appropriate for new circumstances or changes in law or technology. Changes in estimates are capitalised or reversed against the relevant asset. Estimates are discounted at a pre-tax rate that reflects current market assessments of the time value of money.
Gains or losses from the expected disposal of assets are not taken into account when determining the provision.
Restoration costs
The provision for restoration represents the cost of restoring site damage after the start of production. Changes in the provision are recorded in the income statement as a cost of production.
Restoration costs are estimated at the present value of the expenditures expected to settle the obligation, using estimated cash flows based on current prices and adjusted for risks specific to the liability. The estimates are discounted at a pre-tax rate that reflects current market assessments of the time value of money.
Revenue recognition
Revenue is recognised at the fair value of the consideration received or receivable to the extent that it is probable that economic benefits will flow to the group and revenue and costs can be reliably measured. The following criteria must also be present:
the sale of mining products is recognised when the significant risks and rewards of ownership of the products are transferred to the buyer;
dividends and royalties are recognised when the right to receive payment is established;
interest is recognised on a time proportion basis, taking account of the principal outstanding and the effective rate over the period to maturity, when it is determined that such income will accrue to the group; and
where a by-product is not regarded as significant, revenue is credited against cost of sales, when the significant risks and rewards of ownership of the products are transferred to the buyer.
Taxation
Deferred taxation is provided on all qualifying temporary differences at the reporting date between the tax bases of assets and liabilities and their carrying amounts for financial reporting purposes.
Deferred tax assets are only recognised to the extent that it is probable that the deductible temporary differences will reverse in the foreseeable future and future taxable profit will be available against which the temporary difference can be utilised.
The carrying amount of deferred tax assets is reviewed at each reporting date.
F - 19
NOTES TO THE CONSOLIDATED FINANCIAL STATEMENTS(continued)
Deferred tax assets and liabilities are measured at future anticipated tax rates, which have been enacted or substantively enacted at the reporting date.
Current and deferred tax is recognised as income or expense and included in profit or loss for the period, except to the extent that the tax arises from a transaction or event which is recognised, in the same or a different period in other comprehensive income or directly in equity, or a business combination that is an acquisition.
F - 19
NOTES TO THE CONSOLIDATED FINANCIAL STATEMENTS(continued)
Current tax is measured on taxable income at the applicable statutory rate enacted or substantively enacted at the reporting date. Interest and penalties, if any, are recognised in the income statement as part of taxation expense.
Special items
Items of income and expense that are material and require separate disclosure, in accordance with IAS 1.97, are classified as special items on the face of the income statement. Special items that relate to the underlying performance of the business are classified as operating special items and include impairment charges and reversals. Special items that do not relate to underlying business performance are classified as non-operating special items and are presented below operating profit (loss) on the income statement.
Dividend distribution
Dividend distribution to the group’s shareholders is recognised as a liability in the group’s financial statements in the period in which the dividends are declared by the board of directors of AngloGold Ashanti Limited.items.
Financial instruments
Financial instruments are initially measured at fair value when the group becomes a party to their contractual arrangements. Transaction costs are included in the initial measurement of financial instruments, except financial instruments classified as at fair value through profit or loss. The subsequent measurement of financial instruments is dealt with below.
A financial asset is derecognised when the right to receive cash flows from the asset has expired or the group has transferred its rights to receive cash and either (a) has transferred substantially all the risks and rewards of the asset, or (b) has neither transferred nor retained substantially all the risks and rewards of the asset, but has transferred control of the asset.
A financial liability is derecognised when the obligation under the liability is discharged, cancelled or expires.
On derecognition of a financial asset, the difference between the proceeds received or receivable and the carrying amount of the asset is included in profit or loss.
On derecognition of a financial liability, the difference between the carrying amount of the liability extinguished or transferred to another party and the amount paid is included in profit or loss.
Regular way purchases and sales of all financial assets and liabilities are accounted for at settlement date.
Derivatives and hedge accounting
The group enters into derivatives to ensure a degree of price certainty and to guarantee a minimum revenue on a portion of future planned gold production. In addition, the group enters into derivatives to manage interest rate and currency risk.
The method of recognising fair value gains and losses depends on whether derivatives are classified as held for trading or are designated as hedging instruments, and if the latter, the nature of the risks being hedged. The group designates derivatives as either hedges of the variability in highly probable future cash flows attributable to a recognised asset or liability, or a forecast transaction (cash flow hedges); or hedges of the fair value of recognised asset or liability or a firm commitment (fair value hedges).
For cash flow hedges, the effective portions of fair value gains or losses are recognised in other comprehensive income until the hedging instrument expires or is sold, or when a hedge no longer meets the criteria for hedge accounting or when the hedge transactions affect earnings. Any cumulative gain or loss existing in equity at that time remains in equity until the forecast transaction is recognised in the income statement. If a hedge of a forecast transaction subsequently results in
F - 20
NOTES TO THE CONSOLIDATED FINANCIAL STATEMENTS(continued)
the recognition of a non-financial asset or liability, the associated cumulative gains and losses that were recognised directly in other comprehensive income are reclassified into earnings in the same periods during which the asset acquired or the liability assumed affects earnings for the period.
When a forecast transaction is no longer expected to occur, the cumulative gain or loss that was reported in other comprehensive income is immediately transferred to the income statement. The ineffective portion of fair value gains and losses is reported in earnings in the period to which they relate. For fair value hedges, the gain or loss from changes in fair value of the hedged item is reported in earnings, together with the offsetting gains and losses from changes in fair value of the hedging instrument.
All other derivatives are classified as held for trading and are subsequently measured at their estimated fair value, with the changes in estimated fair value in the statement of financial position as either a derivative asset or derivative liability, including translation differences, at each reporting date being reported in earnings in the period to which it relates. Fair value gains and losses on these derivatives are included in gross profit in the income statement.
Commodity-based (normal purchase or normal sale) derivative contracts that meet the requirements of IAS 39 are recognised in earnings when they are settled by physical delivery.
The estimated fair values of derivatives are determined at discrete points in time based on the relevant market information. These estimates are calculated with reference to the market rates using industry standard valuation techniques.
F - 20
NOTES TO THE CONSOLIDATED FINANCIAL STATEMENTS(continued)
Other investments
Listed equity investments and unlisted equity investments, other than investments in subsidiaries, joint ventures, and associates, are classified as available-for-sale financial assets and subsequently measured at fair value. Listed investments’ fair values are calculated by reference to the quoted selling price at the close of business on the reporting date. Fair values for unlisted equity investments are estimated using methods reflecting the economic circumstances of the investee. Equity investments for which fair value cannot be measured reliably are recognised at cost less impairment. Changes in fair value are recognised in other comprehensive income in the period in which they arise. These amounts are removed from equityother comprehensive income and reported in income when the asset is derecognised or when there is objective evidence that the asset is impaired based on a significant or prolonged decrease in the fair value of the equity instrument below its cost.
Investments which management has the intention and ability to hold to maturity are classified as held-to-maturity financial assets and are subsequently measured at amortised cost using the effective interest rate method. If there is evidence that held-to-maturity financial assets are impaired, the carrying amount of the assets is reduced and the loss recognised in the income statement.
Other non-current assets
Loans and receivables are subsequently measured at amortised cost using the effective interest rate method. If there is evidence that loans and receivables are impaired, the carrying amount of the assets is reduced and the loss recognised in the income statement.
Post-retirement assets are measured according to the employee benefits policy.
Trade and other receivables
Trade receivables are recognised initially at fair value and subsequently measured at amortised cost using the effective interest method, less accumulated impairment. Impairment of trade and other receivables is established when there is objective evidence as a result of a loss event that the group will not be able to collect all amounts due according to the original terms of the receivables. Objective evidence includes failure by the counterparty to perform in terms of contractual arrangements and agreed terms. The amount of the impairment is the difference between the asset’s carrying amount and the present value of estimated future cash flows, discounted at the original effective interest rate. Impairments relate to specific accounts whereby the carrying amount is directly reduced. The impairment is recognised in the income statement.
Cash and cash equivalents
Cash and cash equivalents are defined as cash on hand, demand deposits and short-term, highly liquid investments which are readily convertible to known amounts of cash and subject to insignificant risk of changes in value. They are measured at amortised cost which is deemed to be fair value as they have a short-term maturity.
Cash restricted for use
Cash which is subject to legal or contractual restrictions on use is classified separately as cash restricted for use.
F - 21
NOTES TO THE CONSOLIDATED FINANCIAL STATEMENTS(continued)
Financial liabilities
Financial liabilities, other than derivatives and liabilities classified as at fair value through profit or loss, are subsequently measured at amortised cost, using the effective interest rate method.
Financial liabilities permitted to be designated on initial recognition as being at fair value through profit or loss are recognised at fair value, with transaction costs being recognised in profit or loss, and are subsequently measured at fair value. Gains and losses on financial liabilities that are designated as at fair value through profit or loss are recognised in profit or loss as they arise. Fair value of a financial liability that is quoted in an active market is the current offer price times the number of units of the instrument held or issued.
Financial guarantee contracts are accounted for as financial instruments and measured initially at estimated fair value. They are subsequently measured at the higher of the amount determined in accordance with IAS 37 “Provisions, Contingent Liabilities and Contingent Assets”, and the amount initially recognised less (when appropriate) cumulative amortisation recognised in accordance with IAS 18 “Revenue”.
Convertible bonds
Convertible bonds, except equity components, are accounted for as liabilities. Option components are treated as derivative liabilities and carried at fair value, with changes in fair value recorded in the income statement as a separate instrument and reported separately except where the host contract is carried at fair value. The bond component is carried at amortised cost using the effective interest rate. Where the fair value option is elected, the bonds are carried at fair value with changes in fair value recorded in the income statement.F - 21
NOTES TO THE CONSOLIDATED FINANCIAL STATEMENTSTreasury shares(continued)
The group’s own equity instruments, which are reacquired or held by subsidiary companies (treasury shares), are deducted from equity. No gain or loss is recognised in profit or loss on the purchase, sale, issue or cancellation of the group’s own equity instruments.
Fair value measurements
The group measures financial instruments at fair value at each reporting date where relevant. Fair value is the price that would be received to sell an asset or paid to transfer a liability in an orderly transaction between market participants at the measurement date. The fair value of an asset or a liability is measured using the assumptions that market participants would use when pricing the asset or liability, assuming that market participants act in their economic best interest.
For the purpose of fair value disclosures, the group has determined classes of assets and liabilities on the basis of the nature, characteristics and risks of the asset or liability and the level of the fair value hierarchy. The group uses valuation techniques that are appropriate in the circumstances and for which sufficient data are available to measure fair value, maximising the use of relevant observable inputs and minimising the use of unobservable inputs.
Accounting for BEE transactions
Where equity instruments are issued to a BEE party at less than fair value, these are accounted for as share-based payments.
Any difference between the fair value of the equity instrument issued and the consideration received is accounted for as an expense in the income statement.
A restriction on the BEE party to transfer the equity instrument subsequent to its vesting is not treated as a vesting condition, but is factored into the fair value determination of the instrument.
F - 22
NOTES TO THE CONSOLIDATED FINANCIAL STATEMENTS(continued)
| 2 | SEGMENTAL INFORMATION |
AngloGold Ashanti Limited’s operating segments are being reported based on the financial information provided to the Chief Executive Officer and the Executive Committee, collectively identified as the Chief Operating Decision Maker (CODM). The group produces gold as its primary product and does not have distinct divisional segments in terms of principal business activity, but manages its business on the basis of different geographic segments. Individual members of the Executive Committee are responsible for geographic regions of the business. |
Group analysis by origin is as follows: |
| Figures in million | Net operating assets | Total assets(2)(3) | ||||||||||||||||||||||||||||||||||||||||||||||
| Figures in millions | Net operating assets | Total assets (2)(3) | ||||||||||||||||||||||||||||||||||||||||||||||
| US Dollars | 2014 | 2013 | 2012 | 2014 | 2013 | 2012 | 2016 | 2015 | 2014 | 2016 | 2015 | 2014 | ||||||||||||||||||||||||||||||||||||
South Africa(1) | 1,754 | 1,941 | 2,619 | 2,124 | 2,325 | 3,082 | 1,520 | 1,352 | 1,754 | 1,818 | 1,629 | 2,124 | ||||||||||||||||||||||||||||||||||||
Continental Africa | 1,424 | 1,339 | 3,184 | 3,239 | 3,391 | 4,846 | 1,278 | 1,349 | 1,424 | 3,090 | 3,121 | 3,239 | ||||||||||||||||||||||||||||||||||||
Australasia(1) | 672 | 776 | 684 | 906 | 1,108 | 1,045 | 581 | 625 | 672 | 804 | 837 | 906 | ||||||||||||||||||||||||||||||||||||
Americas(1) | 1,838 | 1,627 | 2,315 | 2,409 | 2,203 | 2,878 | 923 | 963 | 1,838 | 1,273 | 1,341 | 2,409 | ||||||||||||||||||||||||||||||||||||
Other, including non-gold producing subsidiaries | 37 | 39 | 60 | 456 | 647 | 888 | 26 | 11 | 37 | 168 | 356 | 456 | ||||||||||||||||||||||||||||||||||||
| 5,725 | 5,722 | 8,862 | 9,134 | 9,674 | 12,739 | 4,328 | 4,300 | 5,725 | 7,153 | 7,284 | 9,134 | |||||||||||||||||||||||||||||||||||||
Non-current assets considered material, by country are: | ||||||||||||||||||||||||||||||||||||||||||||||||
South Africa | 1,908 | *2,098 | *2,786 | 1,678 | 1,463 | 1,908 | ||||||||||||||||||||||||||||||||||||||||||
Foreign entities | 5,263 | *4,927 | *7,041 | 4,144 | 4,324 | 5,263 | ||||||||||||||||||||||||||||||||||||||||||
DRC | 1,369 | 1,241 | 1,400 | 1,406 | 1,369 | |||||||||||||||||||||||||||||||||||||||||||
Ghana | 1,388* | 520 | 543 | |||||||||||||||||||||||||||||||||||||||||||||
Tanzania | 1,058 | 437 | 517 | |||||||||||||||||||||||||||||||||||||||||||||
Australia | 743 | 878 | 673 | 703 | 743 | |||||||||||||||||||||||||||||||||||||||||||
Brazil | 730 | 726* | 1,059* | 645 | 657 | 730 | ||||||||||||||||||||||||||||||||||||||||||
United States | 805 | 805 | ||||||||||||||||||||||||||||||||||||||||||||||
Other | 1,616 | 2,082* | 3,536* | |||||||||||||||||||||||||||||||||||||||||||||
|
| Figures in million | Amortisation | Capital expenditure | ||||||||||||||||||||||
| US Dollars | 2014 | 2013 | 2012 | 2014 | 2013 | 2012 | ||||||||||||||||||
South Africa | 258 | 253 | 302 | 264 | 451 | 583 | ||||||||||||||||||
Continental Africa(2) | 281 | 254 | 285 | 454 | 839 | 925 | ||||||||||||||||||
Australasia | 150 | 98 | 36 | 91 | 285 | 369 | ||||||||||||||||||
Americas(2) | 192 | 201 | 213 | 394 | 410 | 409 | ||||||||||||||||||
Other, including non-gold producing subsidiaries | 8 | 8 | 9 | 6 | 8 | 36 | ||||||||||||||||||
| 889 | 814 | 845 | 1,209 | 1,993 | 2,322 | |||||||||||||||||||
Equity-accounted investments included above | (103) | (15) | (10) | (191) | (411) | (303) | ||||||||||||||||||
| 786 | 799 | 835 | 1,018 | 1,582 | 2,019 | |||||||||||||||||||
F - 23
NOTES TO THE CONSOLIDATED FINANCIAL STATEMENTS(continued)
|
Gold production (attributable) (000oz) | ||||||||||||
| 2014 | 2013 | 2012 | ||||||||||
South Africa | 1,223 | 1,302 | 1,212 | |||||||||
Continental Africa | 1,597 | 1,460 | 1,521 | |||||||||
Australasia | 620 | 342 | 258 | |||||||||
Americas | 996 | 1,001 | 953 | |||||||||
| 4,436 | 4,105 | 3,944 | ||||||||||
| Figures in million | Gold income | |||||||||||
| US Dollars | 2014 | 2013 | 2012 | |||||||||
Geographical analysis of gold income by origin is as follows: | ||||||||||||
South Africa | 1,527 | 1,810 | 2,013 | |||||||||
Continental Africa(2) | 2,105 | 2,111 | 2,609 | |||||||||
Australasia | 785 | 441 | 426 | |||||||||
Americas | 1,270 | 1,425 | 1,656 | |||||||||
| 5,687 | 5,787 | 6,704 | ||||||||||
Equity-accounted investments included above | (469) | (290) | (351) | |||||||||
(note 3) | 5,218 | 5,497 | 6,353 | |||||||||
Foreign countries included in the above and considered material are: | ||||||||||||
Brazil | 684 | 758 | 851 | |||||||||
Ghana | 642 | 772 | ||||||||||
Tanzania | 605 | 640 | 906 | |||||||||
Geographical analysis of gold income by destination is as follows: | ||||||||||||
South Africa | 3,065 | 2,944 | 3,600 | |||||||||
North America | 704 | 1,064 | 1,197 | |||||||||
Australia | 775 | 435 | 426 | |||||||||
Asia | 414 | 399 | 387 | |||||||||
Europe | 429 | 355 | 404 | |||||||||
United Kingdom | 300 | 590 | 690 | |||||||||
| 5,687 | 5,787 | 6,704 | ||||||||||
Equity-accounted investments included above | (469) | (290) | (351) | |||||||||
(note 3) | 5,218 | 5,497 | 6,353 | |||||||||
| Figures in million | Gross profit (loss)(5) | |||||||||||
| US Dollars | 2014 | 2013 | 2012 | |||||||||
South Africa | 216 | 510 | 651 | |||||||||
Continental Africa(2) | 469 | 475 | 959 | |||||||||
Australasia | 125 | (9) | 78 | |||||||||
Americas(2) | 309 | 516 | 736 | |||||||||
Corporate and other | - | - | 41 | |||||||||
| 1,119 | 1,492 | 2,465 | ||||||||||
Equity-accounted investments included above | (76) | (47) | (111) | |||||||||
| 1,043 | 1,445 | 2,354 | ||||||||||
| Figures in millions | Amortisation | |||||||||||
| US Dollars | 2016 | 2015 | 2014 | |||||||||
South Africa | 167 | 182 | 258 | |||||||||
Continental Africa(2) | 365 | 339 | 281 | |||||||||
Australasia | 126 | 117 | 150 | |||||||||
Americas(2) | 260 | 240 | 189 | |||||||||
Other, including non-gold producing subsidiaries | 5 | 7 | 8 | |||||||||
| 923 | 885 | 886 | ||||||||||
Equity-accounted investments included above | (114) | (108) | (103) | |||||||||
Continuing operations | 809 | 777 | 783 | |||||||||
Discontinued operations | - | 6 | 3 | |||||||||
| 809 | 783 | 786 | ||||||||||
| (1) | Total assets includes allocated goodwill of |
| (2) | Includes equity-accounted investments. |
| (3) | In 2016, pre-tax impairments, derecognition of tangible assets of $3m were accounted for in South Africa (2015: $5m). In 2014, pre-tax impairments, derecognition of goodwill, tangible assets and intangible assets of $10m were accounted for in Continental Africa. |
F - 23
NOTES TO THE CONSOLIDATED FINANCIAL STATEMENTS(continued)
| 2 | Segmental Information(continued) |
| Figures in millions | Capital expenditure | |||||||||||
| US Dollars | 2016 | 2015 | 2014 | |||||||||
South Africa | 182 | 206 | 264 | |||||||||
Continental Africa(2) | 291 | 315 | 454 | |||||||||
Australasia | 109 | 78 | 91 | |||||||||
Americas(2) | 225 | 196 | 225 | |||||||||
Other, including non-gold producing subsidiaries | 4 | 4 | 6 | |||||||||
| 811 | 799 | 1,040 | ||||||||||
Discontinued operations | — | 58 | 169 | |||||||||
| 811 | 857 | 1,209 | ||||||||||
Equity-accounted investments | (100) | (131) | (191) | |||||||||
| 711 | 726 | 1,018 | ||||||||||
Gold production (attributable) (000oz) | ||||||||||||
| 2016 | 2015 | 2014 | ||||||||||
South Africa | 967 | 1,004 | 1,223 | |||||||||
Continental Africa | 1,321 | 1,435 | 1,597 | |||||||||
Australasia | 520 | 560 | 620 | |||||||||
Americas | 820 | 831 | 785 | |||||||||
Continuing operations | 3,628 | 3,830 | 4,225 | |||||||||
Discontinued operations | — | 117 | 211 | |||||||||
| 3,628 | 3,947 | 4,436 | ||||||||||
| (1) | Total assets includes allocated goodwill of $8m (2015: $7m; 2014: $10m) for South Africa, |
| (2) | Includes equity-accounted investments. |
| (3) | In 2016, pre-tax impairments, derecognition of tangible assets of $3m were accounted for in South Africa |
|
|
F - 24
NOTES TO THE CONSOLIDATED FINANCIAL STATEMENTS(continued)
| Figures in million | 2014 | 2013 | 2012 | |||||||||||||||
| US Dollars | ||||||||||||||||||
3 | REVENUE | |||||||||||||||||
| Revenue consists of the following principal categories: | ||||||||||||||||||
| Gold income (note 2) | 5,218 | 5,497 | 6,353 | |||||||||||||||
| By-products (note 4) | 132 | 149 | 206 | |||||||||||||||
| - silver income | 69 | 80 | 95 | |||||||||||||||
| - uranium income | 47 | 54 | 90 | |||||||||||||||
| - sulphuric acid income | 15 | 13 | 19 | |||||||||||||||
| - other | 1 | 2 | 2 | |||||||||||||||
| Dividends received | - | 5 | 7 | |||||||||||||||
| Royalties received (note 7) | 4 | 18 | 23 | |||||||||||||||
| Interest received (note 33) | 24 | 39 | 43 | |||||||||||||||
| - loans and receivables(1) | 9 | 23 | 13 | |||||||||||||||
| - available-for-sale and held-to-maturity investments | 6 | 8 | 5 | |||||||||||||||
| - cash and cash equivalents | 9 | 8 | 25 | |||||||||||||||
| 5,378 | 5,708 | 6,632 | ||||||||||||||||
(1) Interest received from loans and receivables comprises: | 2 | 1 | 1 | |||||||||||||||
- related parties | - | 5 | 4 | |||||||||||||||
- unwinding of long-term receivables | 7 | 17 | 8 | |||||||||||||||
- other loans | 9 | 23 | 13 | |||||||||||||||
4 | COST OF SALES | |||||||||||||||||
| Cash operating costs(1) | 3,240 | 3,247 | 3,129 | |||||||||||||||
| Insurance reimbursement | - | - | (30) | |||||||||||||||
| By-products revenue (note 3) | (132) | (149) | (206) | |||||||||||||||
| 3,108 | 3,098 | 2,893 | ||||||||||||||||
| Royalties | 131 | 129 | 164 | |||||||||||||||
| Other cash costs | 33 | 43 | 35 | |||||||||||||||
| Share scheme and related costs | 20 | 27 | 43 | |||||||||||||||
| Total cash costs | 3,292 | 3,297 | 3,135 | |||||||||||||||
| Retrenchment costs | 24 | 69 | 10 | |||||||||||||||
| Rehabilitation and other non-cash costs | 94 | 18 | 67 | |||||||||||||||
| Production costs | 3,410 | 3,384 | 3,212 | |||||||||||||||
| Amortisation of tangible assets (notes 15 and 33) | 750 | 775 | 830 | |||||||||||||||
| Amortisation of intangible assets (notes 16 and 33) | 36 | 24 | 5 | |||||||||||||||
| Total production costs | 4,196 | 4,183 | 4,047 | |||||||||||||||
| Inventory change | (6) | (37) | (83) | |||||||||||||||
| 4,190 | 4,146 | 3,964 | ||||||||||||||||
(1) Cash operating costs comprise: | ||||||||||||||||||
- salaries and wages | 1,105 | 1,231 | 1,186 | |||||||||||||||
- stores and other consumables | 702 | 747 | 746 | |||||||||||||||
- fuel, power and water | 659 | 641 | 670 | |||||||||||||||
- contractors | 531 | 632 | 560 | |||||||||||||||
- other | 243 | (4) | (33) | |||||||||||||||
| 3,240 | 3,247 | 3,129 | ||||||||||||||||
| 2 | Segmental Information(continued) |
| Figures in millions | Gold income | |||||||||||
| US Dollars | 2016 | 2015 | 2014 | |||||||||
Geographical analysis of gold income by origin is as follows: | ||||||||||||
South Africa | 1,173 | 1,132 | 1,527 | |||||||||
Continental Africa(2) | 1,663 | 1,724 | 2,105 | |||||||||
Australasia | 646 | 666 | 785 | |||||||||
Americas | 1,036 | 967 | 1,004 | |||||||||
| 4,518 | 4,489 | 5,421 | ||||||||||
Equity-accounted investments included above | (433) | (474) | (469) | |||||||||
Continuing operations (note 3) | 4,085 | 4,015 | 4,952 | |||||||||
Discontinued operations | - | 137 | 266 | |||||||||
| 4,085 | 4,152 | 5,218 | ||||||||||
Foreign countries included in the above and considered material are: | ||||||||||||
Brazil | 659 | 641 | 684 | |||||||||
Tanzania | 591 | 615 | 605 | |||||||||
Geographical analysis of gold income by destination is as follows: | ||||||||||||
South Africa | 1,719 | 2,499 | 3,065 | |||||||||
North America | 893 | 658 | 438 | |||||||||
Australia | 645 | 666 | 775 | |||||||||
Asia | - | 195 | 414 | |||||||||
Europe | 377 | 332 | 429 | |||||||||
United Kingdom | 884 | 139 | 300 | |||||||||
| 4,518 | 4,489 | 5,421 | ||||||||||
Equity-accounted investments included above | (433) | (474) | (469) | |||||||||
Continuing operations (note 3) | 4,085 | 4,015 | 4,952 | |||||||||
Discontinued operations | - | 137 | 266 | |||||||||
Continuing and discontinued operations | 4,085 | 4,152 | 5,218 | |||||||||
Approximately 48% of the group’s total gold produced is sold to three customers of the group.
The market for gold bullion bar, our primary product, is generally limited to the bullion banks. The number of these banks has declined over the last few years. Due to the diversity and depth of the total gold market, the bullion banks do not possess significant pricing power.
| Figures in millions | By product revenue | |||||||||||
| US Dollars | 2016 | 2015 | 2014 | |||||||||
South Africa | 23 | 38 | 49 | |||||||||
Continental Africa(2) | 4 | 3 | 5 | |||||||||
Australasia | 2 | 2 | 2 | |||||||||
Americas | 110 | 84 | 75 | |||||||||
| 139 | 127 | 131 | ||||||||||
Equity-accounted investments included above | (1) | - | (1) | |||||||||
Continuing operations (note 3) | 138 | 127 | 130 | |||||||||
Discontinued operations | - | 1 | 2 | |||||||||
| 138 | 128 | 132 | ||||||||||
| (1) | Total assets includes allocated goodwill of $8m (2015: $7m; 2014: $10m) for South Africa, $110m (2015: $111m; 2014: $124m) for Australasia and $8m (2015: $8m; 2014: $8m) for Americas (note 14). |
| (2) | Includes equity-accounted investments. |
| (3) | In 2016, pre-tax impairments, derecognition of tangible assets of $3m were accounted for in South Africa (2015: $5m). In 2014, pre-tax impairments, derecognition of goodwill, tangible assets and intangible assets of $10m were accounted for in Continental Africa. |
F - 25
NOTES TO THE CONSOLIDATED FINANCIAL STATEMENTS(continued)
| Figures in million | 2014 | 2013 | 2012 | |||||||||||||
| US Dollars | ||||||||||||||||
5 | CORPORATE ADMINISTRATION, MARKETING AND OTHER EXPENSES | |||||||||||||||
| Corporate administration expenses | 80 | 183 | 236 | |||||||||||||
| Marketing expenses | 1 | 6 | 10 | |||||||||||||
| Share scheme and related costs | 11 | 12 | 45 | |||||||||||||
| 92 | 201 | 291 | ||||||||||||||
6 | OTHER OPERATING EXPENSES | |||||||||||||||
| Pension and medical defined benefit provisions | 6 | 14 | 37 | |||||||||||||
| Claims filed by former employees in respect of loss of employment, work-related accident injuries and diseases, governmental fiscal claims and care and maintenance of old tailings operations | 15 | 5 | 10 | |||||||||||||
| Other expenses | 7 | - | - | |||||||||||||
| 28 | 19 | 47 | ||||||||||||||
7 | SPECIAL ITEMS | |||||||||||||||
| Impairment and derecognition of goodwill, tangible and intangible assets (notes 13, 15 and 16) | 10 | 3,029 | 346 | |||||||||||||
| Impairment of other investments (notes 13) | 2 | 30 | 16 | |||||||||||||
| Impairment of other receivables | 1 | - | 1 | |||||||||||||
| Write-down of stockpiles and heap leach to net realisable value and other stockpile adjustments (note 20) | 2 | 216 | - | |||||||||||||
| Write-down of consumable stores inventories | 5 | - | - | |||||||||||||
| Net inventory write-off at Geita due to fire | - | 1 | - | |||||||||||||
| Net (profit) loss on disposal and derecognition of land, mineral rights, tangible assets and exploration properties (notes 13) | (25) | (2) | 15 | |||||||||||||
| Profit on partial disposal of Rand Refinery (Pty) Limited (note 13) | - | - | (14) | |||||||||||||
| Royalties received (note 3)(1) | (4) | (18) | (23) | |||||||||||||
| Indirect tax expenses and legal claims(2) | 19 | 43 | 40 | |||||||||||||
| Legal fees and other costs related to contract terminations and settlement costs(3) | 30 | 19 | 21 | |||||||||||||
| Retrenchment and related costs(4) | 210 | 24 | - | |||||||||||||
| Costs on early settlement of convertible bonds and transaction costs on the $1.25bn bonds and standby facility | - | 61 | - | |||||||||||||
| Write off of a loan (Sokimo) | - | 7 | - | |||||||||||||
| Loss on sale of Navachab mine (note 25) | 2 | - | - | |||||||||||||
| Write off of deferred loan fees | 8 | - | - | |||||||||||||
| 260 | 3,410 | 402 | ||||||||||||||
| 2 | Segmental Information(continued) |
| Figures in millions | Total cash costs | |||||||||||
| US Dollars | 2016 | 2015 | 2014 | |||||||||
South Africa | 857 | 874 | 1,035 | |||||||||
Continental Africa(2) | 976 | 1,010 | 1,292 | |||||||||
Australasia | 404 | 393 | 498 | |||||||||
Americas | 486 | 492 | 545 | |||||||||
ACorporate and other | - | (9) | (8) | |||||||||
| 2,723 | 2,760 | 3,362 | ||||||||||
AEquity-accounted investments included above | (288) | (267) | (291) | |||||||||
AContinuing operations (note 4) | 2,435 | 2,493 | 3,071 | |||||||||
ADiscontinued operations | - | 125 | 222 | |||||||||
| 2,435 | 2,618 | 3,293 | ||||||||||
| AFigures in millions | Cost of sales | |||||||||||
| AUS Dollars | 2016 | 2015 | 2014 | |||||||||
ASouth Africa | 1,041 | 1,083 | 1,324 | |||||||||
AContinental Africa(2) | 1,331 | 1,347 | 1,636 | |||||||||
AAustralasia | 540 | 525 | 660 | |||||||||
AAmericas | 752 | 719 | 745 | |||||||||
ACorporate and other | 5 | (2) | - | |||||||||
| 3,669 | 3,672 | 4,365 | ||||||||||
Equity-accounted investments included above | (406) | (378) | (393) | |||||||||
Continuing operations (note 4) | 3,263 | 3,294 | 3,972 | |||||||||
Discontinued operations | - | 118 | 218 | |||||||||
| 3,263 | 3,412 | 4,190 | ||||||||||
| Figures in millions | Gross profit (loss) | |||||||||||
| US Dollars | 2016 | 2015 | 2014 | |||||||||
South Africa | 149 | 42 | 216 | |||||||||
Continental Africa(2) | 334 | 377 | 469 | |||||||||
Australasia | 106 | 142 | 125 | |||||||||
Americas(2) | 283 | 247 | 259 | |||||||||
Corporate and other(2) | (4) | 2 | - | |||||||||
| 868 | 810 | 1,069 | ||||||||||
Equity-accounted investments included above | (27) | (96) | (76) | |||||||||
Continuing operations | 841 | 714 | 993 | |||||||||
Discontinued operations | - | 19 | 50 | |||||||||
| 841 | 733 | 1,043 | ||||||||||
| (1) |
|
| (2) |
|
|
|
| (3) |
|
|
|
|
|
|
F - 26
NOTES TO THE CONSOLIDATED FINANCIAL STATEMENTS(continued)
| Figures in million | 2014 | 2013 | 2012 | |||||||||||||
| US Dollars | ||||||||||||||||
8 | FINANCE COSTS AND UNWINDING OF OBLIGATIONS | |||||||||||||||
| Finance costs | ||||||||||||||||
| Finance costs on rated bonds and corporate notes | 211 | 148 | 74 | |||||||||||||
| Finance costs on convertible bonds | - | 18 | 27 | |||||||||||||
| Finance costs on bank loans and overdrafts | 30 | 43 | 18 | |||||||||||||
| Finance costs on mandatory convertible bonds | - | 26 | 37 | |||||||||||||
| Amortisation of fees | 5 | 10 | 15 | |||||||||||||
| Finance lease charges | 5 | 5 | 6 | |||||||||||||
| Other finance costs | 1 | 2 | 2 | |||||||||||||
| 252 | 252 | 179 | ||||||||||||||
| Amounts capitalised (note 15) | (1) | (5) | (12) | |||||||||||||
| Total finance costs | 251 | 247 | 167 | |||||||||||||
| Unwinding of obligations, accretion of convertible bonds and other discounts | ||||||||||||||||
| Unwinding of decommissioning obligation (note 28) | 12 | 13 | 11 | |||||||||||||
| Unwinding of restoration obligation (note 28) | 13 | 14 | 17 | |||||||||||||
| Unwinding of other provisions (note 28) | 1 | 2 | 1 | |||||||||||||
| Accretion of convertible bonds discount | 1 | 20 | 30 | |||||||||||||
| Discounting of long-term trade and other receivables | - | - | 5 | |||||||||||||
| Total unwinding of obligations, accretion of convertible bonds and other discounts | 27 | 49 | 64 | |||||||||||||
| Total finance costs, unwinding of obligations, accretion of convertible bonds and other discounts (note 33) | 278 | 296 | 231 | |||||||||||||
9 | SHARE OF ASSOCIATES AND JOINT VENTURES’ LOSS | |||||||||||||||
| Revenue | 519 | 334 | 383 | |||||||||||||
| Operating costs, special items and other expenses | (523) | (315) | (326) | |||||||||||||
| Net interest received | 6 | 4 | 2 | |||||||||||||
| Profit before taxation | 2 | 23 | 59 | |||||||||||||
| Taxation | (22) | (21) | (30) | |||||||||||||
| (Loss) profit after taxation | (20) | 2 | 29 | |||||||||||||
| Impairment of investments in associates (note 18) | (22) | (14) | (20) | |||||||||||||
| Impairment of investments in joint ventures (notes 13 and 18) | (6) | (181) | (39) | |||||||||||||
| Loss on disposal of loan to joint venture (notes 13 and 18) | - | - | (2) | |||||||||||||
| Reversal of impairment in associate (notes 13 and 18) | 3 | - | 2 | |||||||||||||
| Reversal of impairment in joint venture (notes 13 and 18) | 20 | 31 | - | |||||||||||||
| (note 33) | (25) | (162) | (30) | |||||||||||||
U S Dollars | ||||||||||||||||||
| Figures in millions | 2016 | 2015 | 2014 | |||||||||||||||
3 | Revenue | |||||||||||||||||
| Revenue consists of the following principal categories: | ||||||||||||||||||
| Gold income (note 2) | 4,085 | 4,015 | 4,952 | |||||||||||||||
| By-products (notes 2 and 4) | 138 | 127 | 130 | |||||||||||||||
| Royalties received (note 6) | 9 | 4 | 4 | |||||||||||||||
| Interest received (notes 29 and 33) | 22 | 28 | 24 | |||||||||||||||
| 4,254 | 4,174 | 5,110 | ||||||||||||||||
4 | Cost of sales | |||||||||||||||||
| Cash operating costs | 2,444 | 2,493 | 3,044 | |||||||||||||||
| By-products revenue (note 3) | (138) | (127) | (130) | |||||||||||||||
| 2,306 | 2,366 | 2,914 | ||||||||||||||||
| Royalties | 105 | 100 | 129 | |||||||||||||||
| Other cash costs | 24 | 27 | 28 | |||||||||||||||
| Total cash costs | 2,435 | 2,493 | 3,071 | |||||||||||||||
| Retrenchment costs (note 33) | 14 | 11 | 24 | |||||||||||||||
| Rehabilitation and other non-cash costs | 43 | (10) | 66 | |||||||||||||||
| Amortisation of tangible assets (notes 29 and 33) | 789 | 737 | 749 | |||||||||||||||
| Amortisation of intangible assets (notes 29 and 33) | 20 | 40 | 34 | |||||||||||||||
| Inventory change | (38) | 23 | 28 | |||||||||||||||
| 3,263 | 3,294 | 3,972 | ||||||||||||||||
5 | Other operating expenses | |||||||||||||||||
| Pension and medical defined benefit provisions | 25 | 18 | 6 | |||||||||||||||
| Governmental fiscal claims and care and maintenance of old tailings operations | 14 | 7 | 15 | |||||||||||||||
| Care and maintenance costs | 70 | 67 | - | |||||||||||||||
| Other | 1 | 4 | 7 | |||||||||||||||
| 110 | 96 | 28 | ||||||||||||||||
6 | Special items | |||||||||||||||||
| Impairment and derecognition of assets | 3 | 20 | 13 | |||||||||||||||
| Net profit on disposal of assets | (4) | (1) | (25) | |||||||||||||||
| Royalties received (note 3) | (9) | (4) | (4) | |||||||||||||||
| Indirect tax (recoveries) costs | (2) | (20) | 19 | |||||||||||||||
| Legal fees (recoveries) and other costs related to contract terminations and settlement costs | 11 | (1) | 30 | |||||||||||||||
| Write-down of inventories | 12 | 11 | 7 | |||||||||||||||
| Retrenchment and related costs | 1 | 4 | 210 | |||||||||||||||
| Repurchase premium and cost on settlement of debt facilities | 30 | 61 | 8 | |||||||||||||||
| Other | - | 1 | 2 | |||||||||||||||
| 42 | 71 | 260 | ||||||||||||||||
F - 27
NOTES TO THE CONSOLIDATED FINANCIAL STATEMENTS(continued)
| Figures in million | 2014 | 2013 | 2012 | |||||||||||||
| US Dollars | ||||||||||||||||
10 | EMPLOYEE BENEFITS | |||||||||||||||
| Employee benefits including Executive Directors’ and Prescribed Officers’ salaries and other benefits | 1,175 | 1,321 | 1,298 | |||||||||||||
| Health care and medical scheme costs | ||||||||||||||||
| - current medical expenses | 70 | 72 | 77 | |||||||||||||
| - defined benefit post-retirement medical expenses | 10 | 13 | 36 | |||||||||||||
| Pension and provident plan costs | ||||||||||||||||
| - defined contribution | 60 | 64 | 69 | |||||||||||||
| - defined benefit pension plans | - | 11 | 9 | |||||||||||||
| Retrenchment costs | 234 | 82 | 10 | |||||||||||||
| Share-based payment expense (note 11) | 39 | 30 | 66 | |||||||||||||
| Included in cost of sales, other operating expenses, special items and corporate administration, marketing and other expenses | 1,588 | 1,593 | 1,565 | |||||||||||||
| Actuarial defined benefit plan expense analysis | ||||||||||||||||
| Defined benefit post-retirement medical | ||||||||||||||||
| - current service cost | - | 1 | 1 | |||||||||||||
| - interest cost | 10 | 12 | 13 | |||||||||||||
| - recognised past service cost | - | - | 22 | |||||||||||||
| 10 | 13 | 36 | ||||||||||||||
| Defined benefit pension plans | ||||||||||||||||
| - current service cost | 4 | 6 | 7 | |||||||||||||
| - interest cost | 20 | 24 | 27 | |||||||||||||
| - interest income | (24) | (21) | (25) | |||||||||||||
| - recognised past service cost | - | 2 | - | |||||||||||||
| - | 11 | 9 | ||||||||||||||
| Actual return on plan assets | ||||||||||||||||
| - defined benefit pension and medical plans | 26 | 64 | 45 | |||||||||||||
Refer to note 30 for details of Directors’ and Prescribed Officers’ emoluments.
F - 28 NOTES TO THE CONSOLIDATED FINANCIAL STATEMENTS(continued)
Equity-settled share incentive schemes
F - 29 NOTES TO THE CONSOLIDATED FINANCIAL STATEMENTS(continued)
Equity-settled share incentive schemes
Co-Investment Plan (CIP)
The
Award eligibility to The main performance conditions in terms of the
up to 50% of an award will be determined by the performance of total shareholder returns (TSR) compared with that of a group of comparative gold-producing companies; up to 50% of an award will be a safety multiplier of 20% will be three-years’ service is
F - NOTES TO THE CONSOLIDATED FINANCIAL STATEMENTS(continued)
Cash-settled share incentive schemes(continued) Cash-Settled Long Term Incentive Plan (CSLTIP)(continued)
F - 31 NOTES TO THE CONSOLIDATED FINANCIAL STATEMENTS(continued)
F - NOTES TO THE CONSOLIDATED FINANCIAL STATEMENTS(continued)
F - NOTES TO THE CONSOLIDATED FINANCIAL STATEMENTS(continued)
F -
NOTES TO THE CONSOLIDATED FINANCIAL STATEMENTS(continued)
F - NOTES TO THE CONSOLIDATED FINANCIAL STATEMENTS(continued)
F - NOTES TO THE CONSOLIDATED FINANCIAL STATEMENTS(continued)
F - NOTES TO THE CONSOLIDATED FINANCIAL STATEMENTS(continued)
Impairment calculation assumptions for goodwill Based on an analysis carried out by the group in First Uranium (Pty) Limited First Uranium As at 31 December It is estimated that a decrease of Therefore it is possible that outcomes within the next financial year that are different from the assumptions used in the impairment testing process for goodwill Net book value of goodwill allocated to each of the cash generating units (CGUs): - Sunrise Dam - First Uranium - Serra Grande Real pre-tax discount rates applied in impairment calculations on CGUs for which the carrying amount of goodwill is significant are as follows: - Sunrise Dam(1) The estimated value in use of the CGU is $487m in 2016 (2015: $504m; 2014: $785m). F - NOTES TO THE CONSOLIDATED FINANCIAL STATEMENTS(continued)
Financial information of subsidiaries that have material non-controlling interests are provided below:
Summarised financial information of subsidiaries is as follows. The information is based on amounts including inter-company balances.
F - NOTES TO THE CONSOLIDATED FINANCIAL STATEMENTS(continued)
Summarised financial information of subsidiaries is as follows. The information is based on amounts before inter-company eliminations.
F - NOTES TO THE CONSOLIDATED FINANCIAL STATEMENTS(continued)
Detailed disclosures are provided for the years in which investments in associates and joint ventures are considered to be material.
Summarised financial information of immaterial associates is as follows (not attributable):
F - NOTES TO THE CONSOLIDATED FINANCIAL STATEMENTS(continued)
Summarised financial information of joint ventures is as follows (not attributable):
F - NOTES TO THE CONSOLIDATED FINANCIAL STATEMENTS(continued)
The group’s listed available-for-sale equity investments are susceptible to market price risk arising from uncertainties about the future values of the investments. At the reporting date, the majority of equity investments were listed on either the Toronto Stock Exchange
F - NOTES TO THE CONSOLIDATED FINANCIAL STATEMENTS(continued)
F - NOTES TO THE CONSOLIDATED FINANCIAL STATEMENTS(continued)
F - NOTES TO THE CONSOLIDATED FINANCIAL STATEMENTS(continued)
The rights and restrictions applicable to the A and B redeemable preference shares were unchanged during 2016.
F - NOTES TO THE CONSOLIDATED FINANCIAL STATEMENTS(continued)
F - NOTES TO THE CONSOLIDATED FINANCIAL STATEMENTS(continued)
F - NOTES TO THE CONSOLIDATED FINANCIAL STATEMENTS(continued)
F - NOTES TO THE CONSOLIDATED FINANCIAL STATEMENTS(continued)
F - NOTES TO THE CONSOLIDATED FINANCIAL STATEMENTS(continued)
F -
NOTES TO THE CONSOLIDATED FINANCIAL STATEMENTS(continued)
F - NOTES TO THE CONSOLIDATED FINANCIAL STATEMENTS(continued)
Provision has been made for South African income tax or foreign taxes that may result from future remittances of undistributed earnings of foreign subsidiaries or foreign corporate joint ventures, where the group is not able to assert that the undistributed earnings are
F - NOTES TO THE CONSOLIDATED FINANCIAL STATEMENTS(continued)
F - NOTES TO THE CONSOLIDATED FINANCIAL STATEMENTS(continued)
Executive contracts All members of the Executive Committee have permanent employment contracts which entitle them to standard group benefits as defined by their specific region and participation in the company’s short term incentive scheme, the Bonus Share Plan (BSP), and the Long Term Incentive Plan (LTIP) and the Cash Settled Long Term Incentive Plan (CSLTIP). All recently updated Executive Committee contracts include details on participation in the South African based executives The executive contracts are reviewed annually and currently continue to include a change of control provision. The change of control is subject to the following triggers: The acquisition of all or part of AngloGold Ashanti; or A number of shareholders holding less than 35% of the company’s issued share capital consorting to gain a majority of the board and make management decisions; and The contracts of Executive Committee members are either terminated or their role and employment conditions are curtailed. In the event of a change of control becoming effective, the executive will in certain circumstances be subject to both the notice period and the change of control contract terms. The notice period applied per category of executive and the change of control periods as at 31 December
F - NOTES TO THE CONSOLIDATED FINANCIAL STATEMENTS(continued)
Directors and other key management personnel
Executive Directors’ and Prescribed Officers’ remuneration
F - NOTES TO THE CONSOLIDATED FINANCIAL STATEMENTS(continued)
Directors and other key management personnel
Number of options and awards granted
Subsequent to year end and up to
Awards granted since 2005 have been granted at no cost to participants. Non-Executive Directors are not eligible to participate in the share incentive scheme. Number of CSLTIP awards granted: In 2016, Cash Settled Long Term Incentive Plan (CSLTIP) awards of 120,000 each were granted to key management personnel.
F - NOTES TO THE CONSOLIDATED FINANCIAL STATEMENTS(continued)
Directors and other key management personnel
Awards granted in respect of the previous year’s financial results:
Non-Executive Director remuneration The table below details the fees and allowances paid to Non-Executive Directors: Non-Executive Directors’ fees and allowances
Non-Executive Directors do not hold service contracts with the company. Executive Directors do not receive payment of directors’ fees or committee fees.
F - NOTES TO THE CONSOLIDATED FINANCIAL STATEMENTS(continued)
Directors’ and Prescribed Officers’ interests in AngloGold Ashanti shares The interests of directors, prescribed officers and their associates in the ordinary shares of the company at 31 December
A register detailing Directors and Prescribed Officers’ interests in contracts is available for inspection at the company’s registered and corporate office. F - 59 NOTES TO THE CONSOLIDATED FINANCIAL STATEMENTS(continued)
Directors’ and Changes in Directors’ and Prescribed Officers’ interests in AngloGold Ashanti shares, excluding options and awards granted in terms of the group’s BSP and LTIP schemes, after 31 December
| |||||||||||||||||||||||||||||||||||||||||||||||||||||||||||||||||||||||||||||||||||||||||||||||||||||||||||||||||||||||||||||||||||||||||||||||||||||||||||||||||||||||||||||||||||||||||||||||||||||||||||||||||||||||||||||||||||||||||||||||||||||||||||||||||||||||||||||||||||||||||||||||||||||||||||||||||||||||||||||||||||||||||||||||||||||||||||||||||||||||||||||||||||||||||||||||||||||||||||||||||||||||||||||||||||||||||||||||||||||||||||||||||||||||||||||||||||||||||||||||||||||||||||||||||||||||||||||||||||||||||||||||||||||||||||||||||||||||||||||||||||||||||||||||||||||||||||||||||||||||||||||||||||||||||||||||||||||||||||||||||||||||||||||||||||||||||||||||||||||||||||||||||||||||||||||||||||||||||||||||||||||||||||||||||||||||||||||||||||||||||||||||||||||||||||||||||||||||||||||||||||||||||||||||||||||||||||||||||||||||||||||||||||||||||||||||||||||||||||||||||||||||||||||||||||||||||||||||||||||||||||||||||||||||||||||||||||||||||||||||||||||||||||||||||||||||||||||||||||||||
KC Ramon
F - NOTES TO THE CONSOLIDATED FINANCIAL STATEMENTS(continued)
Operating lease charges included in profit before taxation amounts to
F - NOTES TO THE CONSOLIDATED FINANCIAL STATEMENTS(continued)
Purchase obligations
Purchase obligations represent contractual obligations for the purchase of mining contract services, power, supplies, consumables, inventories, explosives and activated carbon. To service these capital commitments, purchase obligations and other operational requirements, the group is dependent on existing cash resources, cash generated from operations and borrowing facilities. Cash generated from operations is subject to operational, market and other risks. Distributions from operations may be subject to foreign investment and exchange control laws and regulations, and the quantity of foreign exchange available in offshore countries. In addition, distributions from joint ventures are subject to the relevant board approval. The credit facilities and other finance arrangements contain financial covenants and other similar undertakings. To the extent that external borrowings are required, the group’s covenant performance indicates that existing financing facilities will be available to meet the commitments detailed above. To the extent that any of the financing facilities mature in the near future, the group believes that sufficient measures are in place to ensure that these facilities can be refinanced. Contingencies
F - NOTES TO THE CONSOLIDATED FINANCIAL STATEMENTS(continued)
F - 63 NOTES TO THE CONSOLIDATED FINANCIAL STATEMENTS(continued)
Contingent liabilities(continued) Litigation claims(continued)
F - 64 NOTES TO THE CONSOLIDATED FINANCIAL STATEMENTS(continued)
Contingent liabilities(continued)
In the normal course of its operations, the group is exposed to gold price, other commodity price, foreign exchange, interest rate, liquidity, equity price and credit risks. In order to manage these risks, the group may enter into transactions which make use of both on- and off-balance sheet derivatives. The group does not acquire, hold or issue derivatives for speculative purposes. The group has developed a comprehensive risk management process to facilitate, control and monitor these risks. The board has approved and monitors this risk management process, inclusive of documented treasury policies, counterparty limits and controlling and reporting structures. Managing risk in the group Risk management activities within the group are the ultimate responsibility of the board of directors. The The financial risk management objectives of the group are defined as follows: safeguarding the group’s core earnings stream from its major assets through the effective control and management of gold price risk, other commodity risk, foreign exchange risk and interest rate risk; effective and efficient usage of credit facilities in both the short and long-term through the adoption of reliable liquidity management planning and procedures; ensuring that investment and hedging transactions are undertaken with creditworthy counterparties; and ensuring that all contracts and agreements related to risk management activities are co-ordinated, consistent throughout the group and that they comply where necessary with all relevant regulatory and statutory requirements. Gold price and foreign exchange risk Gold price risk arises from the risk of an adverse effect on current or future earnings resulting from fluctuations in the price of gold. The group has transactional foreign exchange exposures, which arise from sales or purchases by an operating unit in currencies other than the unit’s functional currency. The gold market is predominately priced in US dollars which exposes the group to the risk that fluctuations in the SA rand/US dollar, Brazilian real/US dollar, Argentinean peso/US dollar and Australian dollar/US dollar exchange rates may also have an adverse effect on current or future earnings. The group is also exposed to certain by-product commodity price risk.
F - NOTES TO THE CONSOLIDATED FINANCIAL STATEMENTS(continued)
Net open hedge position as at 31 December The group had no outstanding commitments against future production potentially settled in cash. Interest rate and liquidity risk
In the ordinary course of business, the group receives cash from the proceeds of its gold sales and is required to fund working capital requirements. This cash is managed to ensure surplus funds are invested in a manner to achieve market-related returns
The group has sufficient undrawn borrowing facilities available to fund working capital requirements (notes The following are the contractual maturities of financial liabilities, including interest Financial liabilities
F - NOTES TO THE CONSOLIDATED FINANCIAL STATEMENTS(continued)
Credit risk Credit risk arises from the risk that a counterparty may default or not meet its obligations timeously. The group minimises credit risk by ensuring that credit risk is spread over a number of counterparties. These counterparties are financial and banking institutions. Counterparty credit limits and exposures are reviewed by the Audit and Risk Committee. Where possible, management ensures that netting agreements are in place. No set-off is applied to the statement of financial position due to the different maturity profiles of assets and liabilities. The combined maximum credit risk exposure of the group is as follows:
Trade and other receivables, generally constituting indirect taxes recoverable from government entities that are past due but not impaired Trade receivables mainly comprise banking institutions purchasing gold bullion. Normal market settlement terms are two working days.
The group does not generally obtain collateral or other security to support financial instruments subject to credit risk, but monitors the credit standing of counterparties. Fair value of financial instruments The estimated fair values of financial instruments are determined at discrete points in time based on relevant market information. The estimated fair value of the group’s other investments and borrowings as at 31 December are as follows: Type of instrument
F - NOTES TO THE CONSOLIDATED FINANCIAL STATEMENTS(continued)
Fair value of financial instruments
Type of instrument
The following methods and assumptions were used to estimate the fair value of each class of financial instrument: Cash restricted for use, cash and cash equivalents, trade and other receivables and trade and other payables The carrying amounts of these items approximate fair Investments and other non-current assets Listed equity investments classified as available-for-sale are carried at fair value in level 1 of the fair value hierarchy while fixed income investments and other non-current assets are carried at amortised cost. Borrowings
Fair value
The group uses the following hierarchy for determining and disclosing the fair value of financial instruments: Level 1: quoted prices (unadjusted) in active markets for identical assets or liabilities;
Level 2: inputs other than quoted prices included in level 1 that are observable for the asset or liability, either directly (as prices) or indirectly (derived from prices); and Level 3: inputs for the asset or liability that are not based on observable market data (unobservable inputs). The following table sets out the group’s financial assets Type of instrument Assets measured at fair value on a recurring basis
F - NOTES TO THE CONSOLIDATED FINANCIAL STATEMENTS(continued)
Interest rate risk on other financial assets and liabilities (excluding derivatives) The group also monitors interest rate risk on other financial assets and liabilities. The following table shows the approximate interest rate sensitivities of other financial assets and liabilities at 31 December 2016 (actual changes in the timing and amount of the following variables may differ from the assumed changes below). As the sensitivity is the same (linear) for both increases and decreases in interest rates only absolute numbers are presented.
A change of 100 basis points in financial assets results in less than a $1m change in the interest amount.
F - NOTES TO THE CONSOLIDATED FINANCIAL STATEMENTS(continued)
Foreign exchange risk arises on financial instruments that are denominated in a foreign currency. The following table discloses the approximate foreign exchange risk sensitivities of borrowings at 31 December (actual changes in the timing and amount of the following variables may differ from the assumed changes below).
The borrowings total in the denominated currency will not be influenced by a movement in its exchange rate.
F - NOTES TO THE CONSOLIDATED FINANCIAL STATEMENTS(continued)
The primary objective of managing the group’s capital is to ensure that there is sufficient capital available to support the funding requirements of the group, including capital expenditure, in a way that optimises the cost of capital, maximises shareholders’ returns and ensures that the group remains in a sound financial position. The group manages and makes adjustments to the capital structure as opportunities arise in the market place, as and when borrowings mature or as and when funding is required. This may take the form of raising equity, market or bank debt or hybrids thereof. The group had no major issuance of equity during the year. During April 2010, the group issued two rated bonds fully and unconditionally guaranteed by AngloGold Ashanti Ltd. The issuance consisted of a 10 year ($700m) bond with a semi-annual coupon of 5.375% per annum, and a 30 year ($300m) bond with a semi-annual coupon of 6.50% per annum. Unless the company redeems the bonds earlier, the bonds will mature on 15 April 2020 and 15 April 2040 respectively. During April 2011 AngloGold Ashanti Limited registered a R10bn Domestic Medium Term Note Programme (DMTNP) with the JSE. The DMTNP permits the group to access the South African debt capital market for funding required. During July 2012, the group entered into a $750m rated bond. Semi-annual coupons are paid at 5.125% per annum. The bonds are dollar based and unless the company redeems the bonds, earlier they are repayable on 1 August 2022. The notes are fully and unconditionally guaranteed by the group. During
the group entered into a five-year unsecured syndicated revolving credit facility (ZAR
During July 2014, the group completed the following financing transactions:
During July 2015, the group entered into a five-year unsecured syndicated revolving credit facility (ZAR RCF1.4bn) of R1.4bn ($102m) with Nedbank and ABSA Bank. Amounts may be repaid and reborrowed under the facility during its five-year term and the facility bears interest at JIBAR plus 1.65% per annum. This facility, During August 2016, the Three-year unsecured revolving credit Amounts are converted to US dollars at year end exchange rates.
F - NOTES TO THE CONSOLIDATED FINANCIAL STATEMENTS(continued)
Gearing ratio (Net debt to
On 21 February 2017, the directors of AngloGold Ashanti declared a gross cash dividend per ordinary share of 130 South African cents (assuming an exchange rate of ZAR13.10/$, the gross dividend payable per ADS is equivalent to 10 US cents). On 22 February 2017, the South African Minister of Finance announced an increase in the South African dividend withholding tax rate from 15% to 20% of dividends declared. F - NOTES TO THE CONSOLIDATED FINANCIAL STATEMENTS(continued)
AngloGold Ashanti Holdings plc (“IOMco”), a 100 percent wholly-owned subsidiary of AngloGold Ashanti, has issued debt securities which are fully and unconditionally guaranteed by AngloGold Ashanti Limited (being the “Guarantor”). See Note
F - NOTES TO THE CONSOLIDATED FINANCIAL STATEMENTS(continued)
F - NOTES TO THE CONSOLIDATED FINANCIAL STATEMENTS(continued)
F - NOTES TO THE CONSOLIDATED FINANCIAL STATEMENTS(continued)
F - NOTES TO THE CONSOLIDATED FINANCIAL STATEMENTS(continued)
F - NOTES TO THE CONSOLIDATED FINANCIAL STATEMENTS(continued)
F - NOTES TO THE CONSOLIDATED FINANCIAL STATEMENTS(continued)
F - NOTES TO THE CONSOLIDATED FINANCIAL STATEMENTS(continued)
F - NOTES TO THE CONSOLIDATED FINANCIAL STATEMENTS(continued)
F -
KIBALI (JERSEY) LIMITED Consolidated Financial Statements for the 31 December
F -
For the year ended 31 December The directors of the Company are Select suitable accounting policies and then apply them consistently; Make judgements and estimates that are reasonable and prudent; State whether applicable accounting standards have been followed, subject to any material departures disclosed and explained in the financial statements; and Prepare the financial statements on the going concern basis unless it is inappropriate to presume that the company will continue in business. The Directors are responsible for keeping proper accounting records which disclose with reasonable accuracy at any time the financial position of the company and the group to enable them to ensure that the financial statements comply with the Companies (Jersey) Law 1991. They are also responsible for safeguarding the assets of the company and the group and hence for taking reasonable steps for the prevention and detection of fraud, error and non-compliance with law and regulations. The directors have elected to prepare the financial statements for the group in accordance with International Financial Reporting Standards (IFRS) as The directors acknowledge that they are ultimately responsible for the system of internal financial control established by the group and places considerable importance on maintaining a strong control environment. These are designed to provide reasonable, but not absolute, assurance as to the reliability of the financial statements of the The going concern basis has been adopted in preparing the financial statements for the group. The directors have no reason to believe that the group will not be a going concern in the foreseeable future based on forecasts and available cash Auditors The current directors have taken all These financial statements for the group were approved by the Board of Directors on /s/ Graham Shuttleworth Director
F -
To the Board of Directors and Shareholders Kibali (Jersey) Limited
Jersey,
Channel Islands We have audited the accompanying consolidated statements of financial position of Kibali (Jersey) Limited as of December 31, We conducted our audits in accordance with the standards of the Public Company Accounting Oversight Board (United States). Those standards require that we plan and perform the audit to obtain reasonable assurance about whether the financial statements are free of material misstatement. The company is not required to have, nor were we engaged to perform, an audit of its internal control over financial reporting. Our audits included consideration of internal control over financial reporting as a basis for designing audit procedures that are appropriate in the circumstances, but not for the purpose of expressing an opinion on the effectiveness of the company’s internal control over financial reporting. Accordingly, we express no such opinion. An audit includes examining, on a test basis, evidence supporting the amounts and disclosures in the financial statements, assessing the accounting principles used and significant estimates made by management, as well as evaluating the overall financial statement presentation. We believe that our audits provide a reasonable basis for our opinion. In our opinion, the consolidated financial statements referred to above present fairly, in all material respects, the financial position of Kibali (Jersey) Limited at December 31, /s/ BDO LLP
London, United Kingdom
F - CONSOLIDATED STATEMENTS OF COMPREHENSIVE INCOME FOR THE YEARS ENDED 31 DECEMBER
The accompanying notes form part of these consolidated financial statements
F - CONSOLIDATED STATEMENTS OF FINANCIAL POSITION
The accompanying notes form part of these consolidated financial
F - CONSOLIDATED STATEMENTS OF CHANGES IN EQUITY
SHARE CAPITAL The share capital comprises the issued ordinary shares of the company at par. SHARE PREMIUM The share premium comprises the excess value recognised from the issue of ordinary shares at par. RETAINED Retained OTHER RESERVES Other reserves comprises the group’s cumulative fair value movement on the NON-CONTROLLING INTERESTS The non-controlling interest represents the total carrying value of the 10% interest The accompanying notes form part of these consolidated financial statements.
F - CONSOLIDATED STATEMENTS OF FOR THE YEARS ENDED 31 DECEMBER
(i) The cash and cash equivalents balance in the 2015 cash flow statement has been re-presented to include the overdraft figure as per the calculation above. The accompanying notes form part of these consolidated financial statements.
F -
The principal accounting policies applied in the preparation of these consolidated financial statements are set out below. These policies have been consistently applied to all the years presented, unless otherwise stated.
The consolidated financial statements have been prepared under the historical cost convention, as modified by the revaluation of available-for-sale financial assets. The preparation of financial statements in conformity with IFRS requires the use of certain critical accounting estimates. It also requires management to exercise its judgement in the process of applying the After reviewing the group’s and company’s budget for the next financial year, and other longer term plans, the directors are satisfied,
The IASB has issued the following new standards,
Certain new standards, amendments and interpretations to existing standards have been published that are relevant to the group’s activities and are mandatory for the group’s accounting periods beginning after 1 January
F - 89
IFRS 15 is intended to introduce a single framework for revenue recognition and clarify principles of revenue recognition. This standard modifies the determination of when to recognise revenue and how much revenue to recognise. The Management have completed an assessment of the existing gold sale contract and, based on the analysis performed, do not anticipate any material impact to the recognition of revenue upon adoption of this standard based on the existing arrangements. IFRS 16 introduces a single lease accounting model. This standard requires lessees to account for all leases under a single on-balance sheet model. Under the new standard, a lessee is required to recognise all lease assets and liabilities on the balance sheet; recognise amortisation of leased assets and interest on lease liabilities over the lease term; and separately present the principal amount of cash paid and interest in the cash flow statement. Management are currently assessing the impact of IFRS 9 “Financial instruments” addresses the classification and measurement of financial assets and financial liabilities. The complete version of IFRS 9 was issued in
The consolidated financial information includes the financial statements of the company, its subsidiaries and the company’s equity
Subsidiaries are entities over which the group has Subsidiaries are fully consolidated from the date on which control is transferred to the group. They are deconsolidated from the date Inter-company transactions, balances and unrealised gains on transactions between group companies are eliminated. Unrealised losses are also eliminated unless the transaction provides evidence of an impairment of the asset transferred. Accounting policies of subsidiaries have been changed where necessary to ensure consistency with the policies adopted by the group. F - 90
The group holds interests in one joint venture. In a joint venture the parties that have joint control of the arrangement (the joint
Except for initial recognition under IFRS 11 transition rules, further investments in additional joint ventures are initially recognised at cost. The cost of an acquisition is measured at the fair value of the assets given, equity instruments issued or liabilities incurred or assumed at the date of exchange, plus costs directly attributable to the acquisition. Goodwill on associated companies and joint ventures represents the excess of the cost of acquisition of the associate or joint venture over the group’s share of the fair value of the identifiable net assets of the associate or joint venture and is included in the carrying amount of the Joint ventures are accounted for using the equity method of accounting. In applying the equity method of accounting, the group’s share of its
exceeds its interest in the Dividends received are classified as operating cash flows in the consolidated cash flow statement. The carrying value of the investment in joint venture is compared to the recoverable amounts whenever circumstances indicate that the net book value may not be recoverable. An impairment is recognised in the profit or loss to the extent that the carrying value exceeds the recoverable amount.
An operating segment is a group of assets and operations engaged in performing mining or advanced exploration that are subject to risks and returns that are different from those of other segments. Other parts of the business are aggregated and treated as part of a The group has only one business segment, being that of gold mining. Segment analysis is based on the mining operations and exploration projects that have a significant amount of capitalised expenditure or other fixed assets.
Functional and presentation currency Items included in the financial statements of each of the group’s entities are measured using the currency of the primary economic environment in which the entity F - 91
Transactions and balances Foreign currency transactions are translated into the relevant functional currency using the exchange rates prevailing at the date of the transactions. Foreign exchange gains and losses resulting from the settlement of such transactions and from the translation at year end exchange rates of monetary assets and liabilities denominated in foreign currencies are recognised in the statement of comprehensive income in other income and other expenses.
Mineral properties Mineral properties acquired are recognised at fair value at the acquisition date. Mineral properties are recognised at fair value if acquired as part of a business combination, whereas they are recognised at cost if acquired as an asset. Mineral properties are tested annually for impairment on the same basis that property, plant and equipment are when there is an indication of impairment. Mineral properties are amortised on
Long-lived assets and mine development costs Long-lived assets including development costs and mine plant facilities (such as Development of ore bodies includes the development cost of shaft systems and waste rock removal that allows access to reserves that are economically recoverable in the future. Cost associated with underground development are capitalised when the works provide access to the ore body, whereas costs associated with ore extraction from operating ore body sections are treated as operating costs.
Where relevant the estimated cost of dismantling the asset and remediating the site is included in the cost of property, plant and equipment, subsequently they are measured at cost less accumulated amortisation and impairment. Development costs consist primarily of direct expenditure incurred to establish or expand productive Costs are capitalised during the construction of a new mine until commercial levels of production are achieved (refer to ‘commercial production’ below), after which the relevant costs are amortised. Costs are capitalised provided that the project is considered to be commercially, technically and economically viable. Such viability is deemed to be achieved when the group is confident that the project will provide a satisfactory return relative to its perceived risks and is sufficiently certain of economic production. Costs which are necessarily incurred while commissioning new assets, in the period before they are capable of operating in the manner intended by management, are capitalised under ‘Long-lived assets and mine development costs’. Development costs incurred after the commencement of production are capitalised to the extent they are expected to give rise to a future economic benefit. Commercial production
The commissioning of an underground mine typically occurs in phases, with sections brought into production whilst deeper levels remain under construction. The shared infrastructures, such as declines of shafts, are assessed to determine whether they contribute to the production areas. Where they contribute to production, the attributable costs are transferred to production assets and start to be depreciated. The costs transferred comprise costs directly attributable to producing zones or, where applicable, estimates of the portion of shared infrastructure that are attributed to the producing zones. F - 92
Development expenditure approval Development activities commence after project sanctioning by the appropriate level of management. Judgement is applied by management in determining when a project has reached a stage at which economically recoverable reserves exists such that development may be sanctioned. In exercising this judgement, management is required to make certain estimates and assumptions similar to those described below for capitalised exploration and evaluation expenditure. Any such estimates and assumptions may Stripping costs In surface mining operations, the group may find it necessary to remove waste materials to gain access to mineral ore deposits prior to and after production commences. This waste removal activity is known as ‘stripping’. Prior to production commencing from a pit, stripping costs are measured internally and capitalised until the point where the overburden has been removed and access to the ore commences. Subsequent to production, waste stripping continues, either as part of ore extraction as a run of mine activity or due to strategic decisions such as pit push-back campaigns. There are two benefits accruing to the group from stripping activity during the production phase: usable ore that can be used to produce inventory and improved access to further quantities of material that will be mined in future periods. Economic ore extracted during this period and subsequently is accounted for as inventory. The production stripping costs relating to improved access to further quantities in future periods are capitalised as a stripping activity asset, if and only if, all of the following are met: it is probable that the future economic benefit (improved access to the ore body) associated with the stripping activity will flow to the group; the group can identify the component of the ore body for which access has been improved; and the costs relating to the stripping activity associated with that component or components can be measured reliably. In determining the relevant component of the ore body for which access is improved, the group componentises its mine into geographically distinct ore body sections or phases to which the stripping activities being undertaken within that component are allocated. Such phases are determined based on assessment of factors such as geology and mine planning.
Once determined that any portion of the production stripping costs should be capitalised, the group typically uses the average stripping ratio of the component or phase of the mine to which the production stripping cost related to determine the amount of the production stripping costs that should be capitalised, unless the direct costs of stripping activity can be separately identified in which case such costs are capitalised. The group depreciates the deferred costs capitalised as stripping assets on a unit of production method, with reference the ex-pit ore production from the relevant ore body component or phase. Short-lived assets Short-lived assets including non-mining assets are shown at cost less accumulated depreciation and impairment. Depreciation and amortisation Long-lived assets include mining properties, such as Depreciation and amortisation are charged over the life of the mine (or over the remaining useful life of the asset, if shorter) based on estimated ore tonnes contained in proven and probable reserves to be extracted using the relevant asset, to reduce the cost to estimated residual values. Depreciation of construction and development costs F - 93
Short-lived assets which include motor vehicles, office equipment and computer equipment are depreciated over estimated useful lives of between two to five years but limited to the remaining mine life. Residual values and useful lives are reviewed, and adjusted if appropriate, at each statement of financial position date. Changes to the estimated residual values or useful lives are accounted for prospectively. Depreciation starts when the assets are ready and available for use. Impairment The carrying amount of the property, plant and equipment An impairment is recognised in the profit or loss to the extent that the carrying amount exceeds the assets’ recoverable amount. Only proven and probable reserves are used in the calculations and the models A previously recognised impairment loss is reversed if the recoverable amount increases as a result of a reversal of the conditions that originally resulted in the impairment. This reversal is recognised in the Assets are grouped at the lowest levels for which there are separately identifiable cash flows (cash-generating units) for purposes of assessing impairment. The estimates of future discounted cash flows are subject to risks and uncertainties including the future gold price. It is therefore reasonably possible that changes could occur which may affect the recoverability of property, plant and
Inventories include ore stockpiles, gold in process and doré, and supplies and spares and are stated at the lower of cost or net realisable value. The cost of ore stockpiles and gold produced is determined principally by the weighted average cost method using related production costs. Costs of stockpiles include costs incurred up to the point of stockpiling, such as mining and grade control costs, but exclude future costs of production. Ore extracted is allocated to separate stockpiles based on estimated grade, with grades below defined cut-off levels treated as waste and expensed. While held in physically separate stockpiles, the group blends the ore from each stockpile The processing of ore in stockpiles occurs in accordance with the Net realisable value of ore stockpiles is determined with reference to estimated contained gold and market gold prices applicable. Ore stockpiles which are blended together or with future ore mined when fed to the plant are assessed as an input to the gold production process to ensure the combined stockpiles are carried at the lower of cost and net Costs of gold inventories include all costs incurred up until production of an ounce of gold such as milling costs, mining costs and directly attributable mine general and administration costs but exclude transport costs, refining costs and royalties. Net F - 94
Stores and materials consist of consumable stores and are valued at weighted average cost after appropriate impairment of redundant and slow moving items. Consumable
Interest is recognised on a time proportion basis, taking into account the principal outstanding and the effective rate over the period to maturity. Borrowing cost is expensed as incurred except to the extent that it relates directly to the construction of property, plant and equipment during the time that is required to complete and prepare the asset for its intended use, when it is capitalised as part of property, plant and equipment. Borrowing
Royalty arrangements based on mineral production are in place at each operating mine. The primary type of royalty is a net smelter return royalty. Under this type of royalty the group pays the holder an amount calculated as the royalty percentage multiplied by the value of gold production at market gold prices less selling costs. A royalty expense is recorded when revenue from the sale of gold is recognised. FINANCIAL INSTRUMENTS Financial instruments are measured as set out below. Financial instruments carried on the statement of financial position include Cash and cash equivalents Cash and cash equivalents are carried in the statement of financial position at cost. For the purpose of the cash flow statement, cash and cash equivalents comprise cash on hand, deposits held at call with banks, other short term highly liquid investments with a maturity of three months or less at the date of purchase and bank overdrafts. In the statement of financial position, bank overdrafts are included in borrowings in current liabilities. Trade and other receivables Trade and other receivables are recognised initially at fair value. There is a rebuttable presumption that the transaction price is fair value unless this could be refuted by reference to market indicators. Subsequently, trade and other receivables are measured at amortised cost using the effective interest method, less provision for impairment. A provision for impairment of trade receivables is established when there is objective evidence that the company will not be able to collect
all amounts due according to the original terms of receivables. Significant financial difficulties of the debtor, probability that the debtor will enter bankruptcy or financial reorganisation, and default or delinquency in payments are considered indicators that the trade receivable may be impaired. The amount of the provision is the difference between the asset’s carrying amount and the present value of estimated future cash flows, discounted at the effective interest rate. The amount of the provision and the discounted TVA is recognised in
Available-for-sale financial assets Available-for-sale financial assets are non-derivatives that are either designated in this category or not classified in any of the other categories. Available-for-sale financial assets are designated on acquisition. They are normally included in current assets and are carried at fair value. Where a decline in the fair value of an available-for-sale financial asset constitutes objective evidence of impairment, the amount of the loss is recognised in the statement of comprehensive income within other expenses, other movements in fair value are recognised in other reserves within other comprehensive income. F - 95
Borrowings are recognised initially at fair value, net of transaction costs incurred. Borrowings are subsequently stated at amortised cost; any difference between the proceeds (net of transaction costs) and the redemption value is recognised in the statement of comprehensive income over the period of the borrowings using the effective interest method. Borrowings are classified as current liabilities unless the company has an unconditional right to defer settlement of the liability for at least 12 months after the statement of financial position date. Trade and other payables Accounts payable and other short term monetary liabilities, are initially recognised at fair value, which equates to the transaction price, and subsequently carried at amortised cost using the effective interest method. REHABILITATION COSTS The net present value of estimated future rehabilitation costs is provided for in the financial statements and capitalized within property, plant and equipment on initial recognition. Rehabilitation will generally occur on closure or after closure of a mine. Initial recognition is at the time of the construction or disturbance occurring and thereafter as and when additional construction or disturbances take place. The estimates are reviewed annually to take into account the effects of inflation and changes in estimated risk adjusted rehabilitation works cost and are discounted using rates that reflect the time value of money. Annual increases in the provision due to the unwinding of the discount are recognized in the statement of comprehensive income as a finance cost. The present value of additional disturbances and changes in the estimate of the rehabilitation liability are recorded to mining assets against an increase/decrease in the rehabilitation provision. The rehabilitation asset is amortized as noted previously. Rehabilitation projects undertaken, included in the estimates, are charged to the provision as incurred. Environmental liabilities, other than rehabilitation costs, which relate to liabilities arising from specific events, are expensed when they are known, probable and may be reasonably estimated.
Provisions are recognised when the company has a present legal or constructive obligation as a result of past events where it is probable that an outflow of resources embodying economic benefits will be required to settle the obligation, and a reliable estimate of the amount of the obligation can be made.
Current tax is the tax expected to be payable on the taxable income for the year calculated using rates (and laws) that have been enacted or substantively enacted by the reporting date. It includes adjustments for tax expected to be payable or recoverable in respect of previous periods.
Deferred tax is provided in full, using the liability method, on temporary differences arising between the tax bases of assets and liabilities and their carrying amounts in the consolidated financial statements. However, if the temporary difference arises from initial recognition of an asset or liability in a transaction other than a business combination that at the time of the transaction affects neither accounting nor taxable profit nor loss, it is not recognised. Deferred tax is determined using tax rates (and laws) that have been enacted or substantively enacted by the statement of financial position date and are expected to apply when the temporary differences reverses. Deferred tax assets are recognised to the extent that it is probable that future taxable profit will be available against which the temporary differences can be utilised. Deferred tax is provided on temporary differences arising on investments in subsidiaries and joint ventures, except where the timing of the reversal of the temporary difference is controlled by the group and it is probable that the temporary difference will not reverse in the foreseeable future.
Ordinary shares are classified as equity. Incremental costs directly attributable to the issue of new shares or options are shown in equity as a deduction from the proceeds. F - 96
The group discloses contingent liabilities when possible obligations exist as a result of past events, unless the possible outflows of economic benefits are considered remote. By their nature, contingencies will often only be resolved when one or more future events occur or fail to occur. The assessment of such contingencies inherently involves the exercise of significant judgement and estimates of the outcome of future events. In certain circumstances, to provide transparency, the group voluntarily elects to disclose information regarding claims for which any outflow of economic benefit is considered remote. LEASES As lessee Determining whether an arrangement is, or contains, a lease is based on the substance of the arrangement and requires an assessment of whether fulfillment of the arrangement is dependent on the use of a specific asset or assets and whether the arrangement conveys a right to use the asset. Leases of plant and equipment where the company assumes a significant portion of risks and rewards of ownership are classified as a finance lease. Finance leases are capitalised at the estimated present value of the underlying lease payments. Each lease payment is allocated between the liability and the finance charges to achieve a constant rate on the finance balance outstanding. The interest portion of the finance payment is charged to the statement of comprehensive income over the lease period. The plant and equipment acquired under the finance lease are depreciated over the useful lives of the assets, or over the lease term if shorter. Leases in which a significant portion of the risks and rewards of ownership are retained by the lessor are classified as operating leases. Payments made under operating leases are charged to the statement of comprehensive income on a straight-line basis over the period of the lease. As lessor Leases in which a significant portion of the risks and rewards of ownership are retained by the lessor are classified as operating leases. Lease income under operating leases is recognised to the statement of comprehensive income on a straight-line basis over the period of the lease. Where a significant portion of the risks and rewards of ownership are transferred the Group is required to account as though it were acting as a lessor in a finance lease. Hire purchase loans disclosed under receivables represent outstanding amounts due under finance lease arrangements less finance charges allocated to future
The group enters into contracts for the sale of gold. Revenue arising from gold sales under these contracts is recognised when the price is determinable, the product has been delivered in accordance with the terms of the contract, the significant risks and rewards of ownership have been transferred to the customer and collection of the sales price is reasonably assured. These criteria are met when the gold leaves the As sales from gold contracts are subject to customer survey adjustment, sales are initially recorded on a provisional basis using the group’s best estimate of the contained metal. Subsequent adjustments are recorded in revenue to take into account final assay and weight certificates from the refinery, if different from the initial certificates. The differences between the estimated and actual contained gold have historically not been significant.
The group expenses all exploration and evaluation expenditures until the directors conclude that a future economic benefit is more likely than not of being realised, F - 97
Exploration and evaluation expenditure on brownfield sites, being those adjacent to mineral deposits which are already being mined or developed, is expensed as incurred until the directors are able to demonstrate that future economic benefits are probable through the completion of a prefeasibility study, after which the expenditure is capitalised as a mine development cost. A ‘prefeasibility study’ consists of a comprehensive study of the viability of a mineral project that has advanced to a stage where the mining method, in the case of underground mining, or the pit configuration, in the case of an open pit, has been established, and which, if an effective method of mineral processing has been determined, includes a financial analysis based on reasonable assumptions of technical, engineering, operating economic factors and the evaluation of other relevant factors. The prefeasibility study, when combined with existing knowledge of the mineral property that is adjacent to mineral deposits that are already being mined or developed, allow the directors to conclude that it is more likely than not that the group will obtain future economic benefit from the expenditures. Exploration and evaluation expenditure on greenfield sites, being those where the group does not have any mineral deposits which are already being mined or developed, is expensed until such time as the directors have sufficient information to determine that future economic benefits are probable, after which the expenditure is capitalised as a mine development cost. The information required by directors is typically a final feasibility study however a prefeasibility study may be deemed to be sufficient where the additional work required to prepare a final feasibility study is not significant or the work done at prefeasibility level clearly demonstrates an economic asset. Exploration and evaluation expenditure relating to extensions of mineral deposits which are already being mined or developed, including expenditure on the definition of mineralisation of such mineral deposits, is capitalised as a mine development cost following the completion of an economic evaluation equivalent to a prefeasibility study. This economic evaluation is distinguished from a prefeasibility study in that some of the information that would normally be determined in a prefeasibility study is instead obtained from the existing mine or development. This information when combined with existing knowledge of the mineral property already being mined or developed allow the directors to conclude that more likely than not the company will obtain future economic benefit from the expenditures. Costs relating to property acquisitions are capitalised within development costs. DIVIDEND DISTRIBUTION Dividend distribution to the company’s shareholders is recognised as a liability in the group’s financial statements in the period in which the dividends are approved by the board of directors and declared to shareholders.
Some of the accounting policies require the application of significant judgement by management in selecting the appropriate assumptions for calculating financial estimates or determining the appropriate accounting treatment for a transaction. By their nature, these judgements are subject to an inherent degree of uncertainty and are based on historical experience, terms of existing contracts, management’s view on trends in the gold mining industry and information from outside sources. The estimates and assumptions that have a significant risk of causing a material adjustment to the carrying amounts of assets and liabilities are discussed below:
The group capitalises costs, associated with stripping activity, to expose the orebody, within mining assets. Judgement is required in determining the relevant section or phase of the orebody to which stripping activity relates, based on assessment of factors such as mine planning, geology of the open cast pits and strategic board decisions such as the pushback campaigns which requires judgement over the eligible costs. The group subsequently depreciates relevant stripping assets as that section of the orebody is mined which requires judgement as to the relevant section of the orebody for depreciation. F - 98
TVA (VALUE ADDED TAX) Included in trade and other receivables (note 11) is a recoverable value added tax (TVA) balance (including recoverable TVA on fuel duty) of US$131.2 million (2015: US$137.4 million) (2014: US$112.2 The group continues to seek recovery of TVA in the DRC, in line with the mining code and the carrying value of the receivable has been assessed considering factors such as the level of receipts in the period and to date, relationships and communications with government officials and the tax authority and the limited quantum of disputed submissions. Judgements exist in assessing recovery of these receivables. Whilst the TVA balance is considered collectible uncertainty exists regarding the timing of receipt. Accordingly the receivable has been discounted by US$ 7.8 million (2015: Nil) (2014: Nil) which required estimates as to the timing of future receipts based on historical trends and the applicable discount rate thereon.
The group assesses at each reporting period whether there is any indication that these assets may be impaired. If such indication exists, the group estimates the recoverable amount of the asset. The recoverable amount is assessed by reference to the higher of ‘value in use’ (being the net present value of expected future cash flows of the relevant cash generating unit) and ‘fair value less cost to sell’. The estimates used for impairment reviews are based on detailed mine plans and operating plans. Future cash flows are based on estimates of: the quantities of the proven and probable reserves being reserves for which there is a high degree of confidence in economic extraction; future production levels; future commodity prices; including oil forecast at $60bbl (2015: $60bbl) (2014: $100bbl) future cash cost of production and capital expenditure associated with extraction of the proven and probable reserves in the approved mine plan; future gold prices – a gold price curve a discount rate equivalent to 7.8% pre-tax (2015: 7.9%) (2014: 7.3%). an inflation rate of A reduction in forward gold prices in excess of
There are several methods that could be adopted for calculating depreciation, The group applies judgement in allocating costs between operating and capital
F - 99
Judgement is required in determining the point at which assets under construction at Kibali
The following gold prices were used in the mineral reserves optimisation calculation:
Changes in the gold price used could result in changes in the mineral reserve optimisation calculations. Mine modelling is a complex process and hence it is not feasible to perform sensitivities on gold price assumptions in respect of ore reserves.
The group estimates its ore reserves and mineral resources based on information compiled by Competent Persons as defined in accordance with the Australasian Code for Reporting of Exploration Results, Mineral Resources and Ore Reserves of December 2012 (the JORC code, 2012 Edition). Reserves determined in this way are used in the calculation of depreciation, amortisation and impairment charges, as well as the assessment of the carrying value of mining assets. There are numerous uncertainties inherent in estimating ore reserves and assumptions that are valid at the time of estimation may change significantly when new information becomes available. Changes in the forecast prices of commodities, exchange rates, production costs or recovery rates may change the economic status of reserves and may, ultimately, result in the reserves being restated.
The net present value of current rehabilitation estimates have been discounted to their present value at
Costs that are incurred in or benefit the productive process are accumulated as stockpiles, gold in process and product inventories. Net realisable value tests are performed at least annually and represent the estimated future sales price of the product based on contained gold and metals prices, less estimated costs to complete production and bring the product to sale.
F - 100
The group has to apply judgement in determining whether exploration and evaluation expenditure should be capitalised or expensed. Management exercises this judgement based on the results of economic evaluations, prefeasibility or feasibility studies. Costs are capitalised where those studies conclude that more likely than not the group will obtain future economic benefit from the expenditures.
The total other income is not considered to be part of the main revenue generating activities and as such the group presents this income separately from revenue.
The net foreign exchange loss primarily refers to the retranslation of TVA receivables (note 11) denominated in Congolese Francs which is translated into the US dollar functional currency of the subsidiary.
F - 101
The tax on the group’s profit before tax differs from the theoretical amount that would arise using the statutory tax rate applicable to the group’s operations.
F - 102
Long-lived assets and development costs Included in plant and equipment are long-lived assets and development costs which are amortised on a units of production basis as detailed in note 2 and include mining properties, such as Short-lived assets Included in property, plant and equipment are short-lived assets which are depreciated over a short life which reflects their likely useful economic life and are comprised of motor vehicles, computer equipment, aircrafts and fixtures and fittings. The net book value of these assets was US$
Rehabilitation asset A rehabilitation asset has been recognised in the period relating to the rehabilitation liability to the value of US$ Leased assets The net carrying amount of property, plant and equipment includes the following amount in respect of assets held under finance lease (refer note
KAS 1 Limited (KAS) is an asset leasing joint venture in which the group has a 50.1% interest. Together with DTP
F - 103
Mineral properties represent the
F - 104
The fair values of trade and other receivables classified as loans and receivables are approximate to the carrying value. The classes within trade and other receivables do not contain impaired The terms of payment of trade receivables is less than seven days, advances to contractors 30 days and TVA is recoverable The loan to SOKIMO bears interest at 8%, the loan and interest will be repaid through future dividends. The hire purchase loans, receivable from a contractor, bear interest at the aggregate of 10% and the Federal Reserve Rate of 0.75%. The hire purchase loans are repayable over 3 years. The balance of “other loans” includes See note 26 for further details. All non-current receivables are due after 12 months.
All inventory and ore stockpiles are stated at the lower of cost or net realisable value. Non-current ore stockpiles reflect ore tonnes not planned to be processed within the next 12
F -
The total authorised number of ordinary shares is 10,000 Randgold Resources Limited (Randgold) and AngloGold Ashanti Limited (AngloGold Ashanti) are joint venture partners and shareholders of Kibali (Jersey) Limited, having acquired all 4,620 outstanding ordinary shares. Refer to the Statement of Changes in Equity on page
The non-controlling interest represents the 10% interest SOKIMO has in Kibali Goldmines SA which is a subsidiary of Kibali (Jersey) Limited.
F -
Finance lease liability The finance lease liability is due to KAS Loan – Randgold Randgold, a joint venture partner and operator of the Kibali gold mine, incurs management fees and other expenses as part of its role as operator of the mine on behalf of the Kibali (Jersey) Limited group. The loan bears no interest and is repayable on a monthly basis. The non-current portion bears no
The provisions for rehabilitation costs include estimates for the effect of inflation and changes in estimates and have been discounted to their present value at
F -
Accruals and other payables include retention, in respect of contracts with suppliers, amounts of US$17.9 million (2015: US$16.0 million) (2014: US$18.6 million). Accruals and other payables include $8.0 million Trade and other payables are all due within a 120
The finance lease liability recognised is in respect of mining vehicles which have been used in excavation and hauling of waste rock and ore under an instalment sale agreement. The lease liability is effectively secured as the rights to the leased asset revert to the lessor in the event of default.
Operating segments have been identified on the basis of internal reports about components of the group that are regularly reviewed by the group’s chief operating decision maker. The operating segments included in the internal reports are determined on the basis of their significance to the group. In particular, the operating mine is reported as a separate segment. KAS
F -
F - 109
In the normal course of its operations, the group is exposed to gold price, currency, interest rate, credit and liquidity risks. In order to manage these risks, the group may enter into transactions which make use of on-balance sheet derivatives, but none were entered into in the current year. The group does not acquire, hold or issue derivatives for trading purposes. The group has developed a risk management process to facilitate, control and monitor these risks. Foreign exchange and commodity price risk In the normal course of business, the group enters into transactions denominated in foreign currencies (primarily Euro, British pound, South African rand,
The group’s exposure to foreign currency arises where a company holds monetary assets and liabilities denominated in a currency different to the functional currency of the holder of the instrument which is the US dollar. The following table shows the impact of a 10% change in the US dollar on profit and equity arising as a result of the revaluation of the group’s foreign currency financial instruments.
F -
The sensitivities are based on financial assets and liabilities held at 31 December where balances were not denominated in the functional currency of the group. The sensitivities do not take into account the group’s income and costs and the results of the sensitivities could change due to other factors such as changes in the value of financial assets and liabilities as a result of non-foreign exchange influenced factors. Interest rate and liquidity risk Fluctuations in interest rates impact on the value of short term cash investments, interest receivable on hire purchase loans and interest payable on financing activities, giving rise to interest rate risk. The group has in the past been able to actively source financing through shareholder
Concentration of credit risk The group’s cash balances do not give rise to a concentration of credit risk because it deals with a variety of major financial institutions. Its receivables are regularly monitored and assessed. Receivables are impaired when it is probable that amounts outstanding are not recoverable as set out in the accounting policy note for receivables. Gold bullion, the group’s principal product, is produced in the DRC. The gold produced is sold F - 111
Capital risk management The group’s objectives when managing capital are to safeguard its ability to continue as a going concern in order to provide future returns for shareholders and benefits for other stakeholders and to maintain an optimal capital structure to reduce the cost of capital. In order to maintain or adjust the capital structure, the group issue new shares (by way of funding from the joint venture partners) or will make use of
The following table analyses the group’s financial liabilities into the relevant maturity groupings based on the remaining period from the Statement of Financial Position to the contractual maturity date.
F - 112
The following table shows the carrying amounts and the fair values of the group’s financial instruments outstanding at 31 December
No derivative financial instruments currently exist.
Trade and other receivables, trade and other payables, cash and cash equivalents, bank overdrafts, loans to and from related parties The carrying amounts are a reasonable estimate of the fair values because of the short maturity of such instruments or their interest bearing nature.
Long term and short term borrowings The carrying amount is a reasonable estimate of the fair value because of the short maturity of such instruments, interest bearing nature and other terms of the agreement.
Non-cash items include a finance lease liability movement of US$
F - 113
Set out below is the summarised financial information for KAS which is accounted for using the equity method (amounts stated at 100% before intercompany eliminations).
The loan to KAS bears interest at 8% and has no fixed repayment terms. Joint control is provided through a joint venture agreement.
F -
SOKIMO has a 10% interest in Kibali Goldmines SA, a subsidiary of the group. $709m (2015: $747m) (2014: $650m) of gold and silver was sold by Rand Refinery under the contract with Kibali Goldmines SA in which Rand Refinery is stated the agent. Rand Refinery are an associate of AngloGold Ashanti. Kibali Goldmines SA have incurred refining costs of $3.1m in the year (2015: $3.6m) (2014: $3.3m) payable to Rand Refinery. It is the obligation of the joint venture parties, Randgold and AngloGold Ashanti, (joint venture partners) to fund The finance lease liability due to KAS Refer to notes 11 and
F -
The consolidated financial statements include the accounts of the company and all of its subsidiaries and jointly controlled entities at 31 December
No significant subsequent events requiring disclosure or adjustment occurred.
The company is a private company limited by shares, incorporated in Jersey with a registered office, 3rd Floor, Unity Chambers, 28 Halkett Street, St Helier, Jersey, JE2 4WJ, Channel Islands. The company’s
F - SIGNATURES The registrant hereby certifies that it meets all of the requirements for filing on Form 20-F and that it has duly caused and authorised the undersigned to sign this annual report on its behalf. ANGLOGOLD ASHANTI LIMITED /s/ Kandimathie Christine Ramon
E - 2
E - 3
| |||||||||||||||||||||||||||||||||||||||||||||||||||||||||||||||||||||||||||||||||||||||||||||||||||||||||||||||||||||||||||||||||||||||||||||||||||||||||||||||||||||||||||||||||||||||||||||||||||||||||||||||||||||||||||||||||||||||||||||||||||||||||||||||||||||||||||||||||||||||||||||||||||||||||||||||||||||||||||||||||||||||||||||||||||||||||||||||||||||||||||||||||||||||||||||||||||||||||||||||||||||||||||||||||||||||||||||||||||||||||||||||||||||||||||||||||||||||||||||||||||||||||||||||||||||||||||||||||||||||||||||||||||||||||||||||||||||||||||||||||||||||||||||||||||||||||||||||||||||||||||||||||||||||||||||||||||||||||||||||||||||||||||||||||||||||||||||||||||||||||||||||||||||||||||||||||||||||||||||||||||||||||||||||||||||||||||||||||||||||||||||||||||||||||||||||||||||||||||||||||||||||||||||||||||||||||||||||||||||||||||||||||||||||||||||||||||||||||||||||||||||||||||||||||||||||||||||||||||||||||||||||||||||||||||||||||||||||||||||||||||||||||||||||||||||||||||||||||||||||