UNITED STATES
SECURITIES AND EXCHANGE COMMISSION
WASHINGTON, D.C. 20549
FORM20-F
(Mark One)
| Registration statement pursuant to section 12(b) or (g) of the Securities Exchange Act of 1934 |
or
| Annual report pursuant to section 13 or 15(d) of the Securities Exchange Act of 1934 |
For the fiscal year ended March 31, 20162017
or
| Transition report pursuant to section 13 or 15(d) of the Securities Exchange Act of 1934 |
or
| Shell company report pursuant to section 13 or 15(d) of the Securities Exchange Act of 1934 |
Date of event requiring this shell company report
From the transition period from to
Commission file number001-33175
Vedanta Limited
(Exact Name of Registrant as specified in its charter)
| Republic of India |
Mumbai - 400 093, Maharashtra, India | |
| (Jurisdiction of Incorporation or Organization) | (Address of Principal Executive Offices) |
Bhumika Sood
Compliance Officer
DLF Atria,Phase-2, Jacaranda Marg, DLF City
Gurgaon – 122002, Haryana, India
(91) 124 4763518
comp.sect@vedanta.co.in
(Name, Telephone,E-mail and/or facsimile number and Address of Company Contact Person)
Securities registered or to be registered pursuant to Section 12(b) of the Act.
American Depositary Shares each representing four equity shares par value | New York Stock Exchange | |
| (Title of Each Class) | (Name of Exchange On Which Registered) |
Securities registered or to be registered pursuant to Section 12(g) of the Act.
None
(Title of Class)
Securities for which there is a reporting obligation pursuant to Section 15(d) of the Act.
None
(Title of Class)
Indicate the number of outstanding shares of each of the issuer’s classes of capital or common stock as of the close of the period covered by the annual report.
As of March 31, 2016, 2,964,694,2392017, 2,965,004,871 equity shares, par value Re.Rs. 1 per equity share, were issued and outstanding, of which 228,184,620217,019,900 equity shares were held in the form of 57,046,15554,254,975
American Depositary Shares or ADSs.
Indicate by check mark if the registrant is a well-known seasoned issuer, as defined in Rule 405 of the Securities Act.
Yes x☒ No ¨☐
If this report is an annual or transition report, indicate by check mark if the registrant is not required to file reports pursuant to Section 13 or 15(d) of the Securities Exchange Act of 1934.
Yes ¨☐ No x☒
Indicate by check mark whether the registrant (1) has filed all reports required to be filed by Section 13 or 15(d) of the Securities Exchange Act of 1934 during the preceding 12 months (or for such shorter period that the registrant was required to file such reports), and (2) has been subject to such filing requirements for the past 90 days.
Yes x☒ No ¨☐
Indicate by check mark whether the registrant has submitted electronically and posted on its corporate Web site, if any, every Interactive Data File required to be submitted and posted pursuant to Rule 405 of RegulationS-T (§232.405 of this chapter) during the preceding 12 months (or for such shorter period that the registrant was required to submit and post such files).
Yes ¨☐ No ¨☐
Indicate by check mark whether the registrant is a large accelerated filer, an accelerated filer, anon-accelerated filer, or a non-accelerated filer.an emerging growth company. See the definitionsdefinition of “large accelerated filer,” “accelerated filer” and “accelerated filer”“emerging growth company” in Rule12b-2 of the Exchange Act.
| Large accelerated filer ☒ | Accelerated filer ☐ | Non-accelerated filer ☐ | ||
| Emerging growth company ☐ |
If an emerging growth company that prepares its financial statements in accordance with U.S. GAAP, indicate by check mark if the registrant has elected not to use the extended transition period for complying with any new or revised financial accounting standards† provided pursuant to Section 13(a) of the Exchange Act. (Check one):☐
Large accelerated filer x Accelerated filer ¨ Non-accelerated filer ¨† The term “new or revised financial accounting standard” refers to any update issued by the Financial Accounting Standards Board to its Accounting Standards Codification after April 5, 2012.
Indicate by check mark which basis of accounting the registrant has used to prepare the financial statements included in this filing:
US GAAP | International Financial Reporting Standards as issued by the International Accounting Standards Board | Other |
If “Other” has been checked in the previous question, indicate by check mark which financial statement item the registrant has elected to follow.
Item 17 ¨☐ Item 18 ¨☐
If this is an annual report, indicate by check mark whether the registrant is a shell company (as defined in Rule12b-2 of the Securities Exchange Act of 1934).
Yes ¨☐ No x☒
| PAGE | ||||||
| 4 | ||||||
ITEM 1. | 4 | |||||
ITEM 2. | 4 | |||||
ITEM 3. | 4 | |||||
ITEM 4. | ||||||
ITEM 4A. | ||||||
ITEM 5. | ||||||
ITEM 6. | ||||||
ITEM 7. | ||||||
ITEM 8. | ||||||
ITEM 9. | ||||||
ITEM 10. | ||||||
ITEM 11. | ||||||
ITEM 12. | ||||||
ITEM 13. | ||||||
ITEM 14. | MATERIAL MODIFICATIONS TO THE RIGHTS OF SECURITY HOLDERS AND USE OF PROCEEDS | |||||
ITEM 15. | ||||||
ITEM 16A. | ||||||
ITEM 16B. | ||||||
ITEM 16C. | ||||||
ITEM 16D. | ||||||
ITEM 16E. | PURCHASES OF EQUITY SECURITIES BY THE ISSUER AND AFFILIATED PURCHASERS | |||||
ITEM 16F. | ||||||
ITEM 16G. | ||||||
ITEM 16H. | ||||||
ITEM 17. | ||||||
ITEM 18. | ||||||
ITEM 19. | ||||||
| F-1 | ||||||
CONVENTIONS USED IN THIS ANNUAL REPORT
In this Annual Report, we refer to information regarding the zinc, oil and gas, iron ore, copper, aluminium and power industries and our competitors from market research reports, analyst reports and other publicly available sources. Although we believe that this information is reliable, we have not independently verified the accuracy and completeness of the information. We caution you not to place undue reliance on this data.
On February 25, 2012, Vedanta Resources Plc (“Vedanta”), the parent company of Sterlite Industries (India) Limited (“Sterlite” or “SIIL”), Sesa Goa Limited (“Sesa Goa”), Vedanta Aluminium Limited (“Vedanta Aluminium”), Sterlite Energy Limited (“Sterlite Energy”), Cairn India Limited (“Cairn India Limited”) and The Madras Aluminium Company Limited (“MALCO”) announced anall-share merger of majority owned subsidiaries, Sesa Goa and SIIL, to create Sesa Sterlite Limited (“Sesa Sterlite” or “SSL”) and a consolidation of various subsidiaries held by Vedanta to effect the consolidation and simplification of Vedanta’s corporate structure through two series of transactions (together the “Re-organization“Re-organization Transactions” consisting of the “Amalgamation andRe-organization Scheme” and the “Cairn India Limited Consolidation”). TheRe-organization transactions were completed during the fiscal year 2014 and the name of the merged entity was changed to Sesa Sterlite Limited with effect from September 18, 2013. Please see “Item 5. Operating and Financial Review and Prospects – Consolidation and re-organization of Sesa Goa, Sterlite, Vedanta Aluminium, Sterlite Energy and MALCO to form Sesa Sterlite and transfer of Vedanta’s shareholding in Cairn India Limited to Sesa Sterlite”. On April 21, 2015 theThe name of Sesa Sterlite Limited was changed to Vedanta Limited.Limited, with effect from April 21, 2015. Cairn India Limited has merged into Vedanta Limited by way of a scheme of arrangement and the Board of Directors of both the companies made the merger operative on April 11, 2017 (the “Cairn India Merger”). See “Item 4 A. History and Development of our Company.
Sterlite Energy was a wholly owned subsidiary of SIIL and SIIL, Vedanta Aluminium, Sesa Goa, MALCO and Cairn India Limited were subsidiaries of Vedanta, the ultimate holding company. Therefore, theRe-organization Transactions (as described elsewhere in this Annual Report)and Cairn India Merger fall within the purview of the common control business combination transactions. The accounting policies described in Notes 1 and 3.D - “Business3.D—“Business Combinations” of the consolidated financial statements included elsewhere in this Annual Report requires that financial statements of the combined entity, Vedanta Limited, be retroactively adjusted, as if the transaction had occurred at the earliest reporting period (or from the date the entity came under common control, where such a date is later). The financial information of Cairn India Limited is included from December 8, 2011, the date of acquisition of Cairn India Limited by Vedanta.
In this Annual Report, references to the “ADS offering” is to the initial public offering of our equity shares in the form of American Depositary Shares (“ADSs”), each currently representing four equity shares, in the United States (or the “US”) completed in June 2007.
Unless otherwise indicated, our accompanying financial information has been prepared in accordance with International Financial Reporting Standards (“IFRS”), as issued by the International Accounting Standards Board, or IASB, for the fiscal years ended March 31 2012, 2013, 2014, 2015, 2016 and 2016.2017. References to a particular “fiscal year”“fiscal” year or “FY” are to our fiscal year ended March 31 of that year. Our fiscal quarters end on June 30, September 30 and December 31. References to a year other than a “fiscal” year are to the calendar year ended December 31.
Our consolidated financial statements are reported in Indian Rupees or “Rs.”. Unless otherwise specified, translation of amounts for the convenience of the reader has been made in this Annual Report (i) from Indian Rupees to US dollars at the rate of Rs. 66.2564.85 per $ 1.00 based on the exchange rate quoted by the Federal Reserve Bank of New York as of March 31, 2016;2017; (ii) from Australian dollars to US dollars at the rate of AUD 0.770.76 per $ 1.00 based on the exchange rate quoted by the Federal Reserve Bank of New York as of March 31, 2016;2017; (iii) from South African Rand to US dollars at the rate of ZAR 14.7113.42 per $ 1.00 based on the exchange rate quoted by the Federal Reserve Bank of New York as of March 31, 20162017 and (iv) from Namibian dollars to US dollars at the rate of NAD 15.0412.97 per $ 1.00 based on the exchange rate quoted by Oanda (data available at www.oanda.com) as of March 31, 2016.2017. As of July 15, 2016,28, 2017, the exchange rate between US dollars and Indian Rupees was $ 1.00 = Rs. 67.0764.11 as quoted by the Federal Reserve Bank of New York.
In this Annual Report, references to “US” or the “United States” are to the United States of America, its territories and its possessions. References to “UK” are to the United Kingdom. References to “India” are to the Republic of India. References to “Namibia” are to the Republic of Namibia. References to “South Africa” are to the Republic of South Africa. References to “Ireland” are to the “RepublicRepublic of Ireland”.Ireland. References to “Sri Lanka” are to the “DemocraticDemocratic Socialist Republic of Sri Lanka”.Lanka. References to “UAE” are to the United Arab Emirates. References to “$”, “dollars” or “US dollars” are to the legal currency of the United States. References to “Rs.”, “Re.”, “Rs”, “Rupees”, “INR” or “Indian Rupees” are to the legal currency of the Republic of India. References to “AUD”, “Australian dollars” are to the legal currency of the Commonwealth of Australia. References to “NAD” or “Namibian dollars” are to the legal currency of Namibia. References to “ZAR” or “RAND” are to the legal currency of the Republic of South Africa. References to “¢” are to US cents. References to “RMB”, “Renminbi”, “CNY” or “Chinese Yuan” are to the legal currency of the Republic of China.
References to “lb” are to the imperial pounds (mass) equivalent to 0.4536 kilograms, references to “mt” or “tons” are to metric tons, references to “mmt” are to million metric tons, references to “tpd” are to tons per day, references to “tpa” are to tons per annum, a unit of mass equivalent to 1,000 kilograms or 2,204.6 lb, references to “mtpa” are to million tons per annum, “mmtpa” are to million metric tons per annum, references to “wmt” are to wet metric tons, references to “dmt” are to dry metric tons, references to “oz” are to ounces, with one kilogram being equivalent to 32.1507 oz and one ton equivalent to 32,151 oz, references to “mm” are to millimeters, references to “ha” are to hectares, references to “kms” are to kilometers, a unit of area equal to 10,000 square meters or 107,639 square feet, references to “GW” are to giga watts, references to “kt” are to kilo tons, references to “bbls” are to barrels, references to “blpd” are to barrels of liquid per day, references to “mmboe” are to million barrels of oil equivalent, references to “bboe” are to billion barrels of oil equivalent, references to “mmbopd” are to million barrels of oil per day, references to “kbopd” are to kilo barrels of oil per day, references to “bopd” are to barrels of oil per day, references to “boepd” are to barrels of oil equivalent per day, references to “tcm” are to trillion cubic meters, references to “mmscmd” are to million metric standard cubic meter per day, references to “mscf” are to thousand standard cubic feet, references to “mmscf” are to million metric standard cubic feet, references to “mmscfd” are to million metric standard cubic feet per day, references to “bcf” are to billion cubic feet, references to “PPA” are to power purchase agreement and references to “TcRc” are to treatment and refining charges. References to net oil and gas production are to the entitlement interest production of Cairn India Limited and its subsidiaries, in which the Ravva royalty is not netted off.
We conduct our businesses both directly and through a consolidated group of companies that we have ownership interests in. See “Item 4. Information on the Company” for more information on these companies and their relationships to us. Unless otherwise stated in this Annual Report or unless the context otherwise requires, references in this Annual Report to “we”, “us”, “our”, “Vedanta Limited”, “Sesa Sterlite Limited (SSL)”, “Sesa Sterlite”, “our Company”, “the Company” or “our consolidated group of companies” mean Vedanta Limited, its consolidated subsidiaries and its predecessors, collectively, including Cairn India Limited and its subsidiaries (“Cairn India”), Monte Cello BV (“Monte Cello”), Copper Mines of Tasmania Proprietary Limited (“CMT”), Thalanga Copper Mines Proprietary Limited, Bharat Aluminium Company Limited (“BALCO”), Hindustan Zinc Limited (“HZL”), Fujairah Gold FZC, Sterlite (USA), Inc., (“Sterlite USA”), Talwandi Sabo Power Limited (“TSPL”), THL Zinc Ventures Limited, THL Zinc Limited, THL Zinc Holding B.V., THL Zinc Namibia Holdings (Proprietary) Limited (“ Skorpion”), Skorpion Zinc (Proprietary) Limited, Skorpion Mining Company (Proprietary) Limited, Namzinc (Proprietary) Limited, Amica Guesthouse (Proprietary) Limited, Rosh Pinah Health Care (Proprietary) Limited, Black Mountain Mining (Proprietary) Limited (“BMM”), Vedanta Lisheen Holdings Limited(“Limited (“Lisheen”), Vedanta Lisheen Mining Limited, Killoran Lisheen Mining Limited, Killoran Lisheen Finance Limited, Lisheen Milling Limited, Vedanta Exploration Ireland Limited, Lisheen Mine Partnership, Sterlite Ports Limited, Sterlite Infraventures Limited, Vizag General Cargo Berth Private Limited, Paradip Multi Cargo Berth Private Limited, Pecvest 17 Proprietary Limited, Lakomasko B.V., MALCO Energy Limited (“MALCO Energy”) (formerly known as Vedanta Aluminium), Sesa Resources Limited, Sesa Mining Corporation Limited, Bloom Fountain Limited (“BFL”), Goa Sea Port Private Limited, Twin Star Energy Holdings Limited (“TEHL”), Twin Star Mauritius Holdings Limited (“TMHL”), Western Cluster Limited (“WCL”), Vedanta Exploration Ireland Limited, Maritime Ventures Private Limited, Sesa Sterlite Mauritius Holdings Limited and Twinstar Energy Holding Limited.
Our consolidated financial information does not include our controlling shareholder Vedanta, its shareholders and various companies owned directly or indirectly by it (other than us and our consolidated group of companies described above), including without limitations, Vedanta Resources Holdings Limited (“VRHL”), Konkola Copper Mines Plc, Konkola Resources Plc, Twin Star Holdings Limited (“Twin Star”), Welter Trading Limited (“Welter Trading”), the Anil Agarwal Discretionary Trust (“Trust”), Conclave PTC Limited (“Conclave”), Sterlite Technologies Limited, Monte Cello Corporation NV, Valliant (Jersey) Limited, Vedanta Resources Jersey II Limited, Vedanta Resources Finance Limited, Vedanta Resources Cyprus Limited, Richter Holding Limited (“Richter”), Westglobe Limited (“Westglobe”), Finsider International Company Limited (“Finsider”), Vedanta Resources Jersey Limited, Vedanta Finance (Jersey) Limited, Vedanta Jersey Investments Limited, Vedanta Finance UK Limited, Sesa Sterlite Mauritius Holdings Limited and Sterlite Grid Limited. References to the “Group” is to Vedanta Limited and its subsidiaries on a consolidated basis and references to the “Vedanta Group” is to Vedanta and its subsidiaries on a consolidated basis.
In this Annual Report, references to The London Metal Exchange Limited (“LME”) price of zinc, copper, aluminium are to the cash seller and settlement price on the LME for copper, zinc or aluminium for the period indicated. References to primary market share in this Annual Report are to the market that includes sales by producers of metal from copper concentrate or alumina, as applicable, and do not include sales by producers of recycled metal or imports.
SPECIAL NOTE REGARDING FORWARD-LOOKING STATEMENTS
This Annual Report contains “forward-looking statements” as defined in the safe harbor provisions of the US Private Securities Litigation Reform Act of 1995. These forward-looking statements are based on our current expectations, assumptions, estimates and projections about our company and our industry. These forward-looking statements are subject to various risks and uncertainties. Generally, these forward-looking statements can be identified by the use of forward-looking terminology such as “anticipate,” “believe,” “estimate,” “expect,” “intend,” “will,” “project,” “seek,” “should” and similar expressions. These forward-looking statements include, among other things, the discussions of our business strategy and expectations concerning our market position, future operations, margins, profitability, liquidity and capital resources. We caution you that reliance on any forward-looking statement involves risks and uncertainties, and that, although we believe that the assumptions on which our forward-looking statements are based are reasonable, any of those assumptions could prove to be inaccurate and, as a result, the forward-looking statements based on those assumptions could be materially incorrect. Factors which could cause these assumptions to be incorrect include, but are not limited to:
These and other factors are more fully discussed in “Item 3. Key Information—D. Risk Factors,” “Item 5. Operating and Financial Review and Prospects” and elsewhere in this Annual Report. In light of these and other uncertainties, you should not conclude that we will necessarily achieve any plans, objectives or projected financial results referred to in any of the forward-looking statements. Except as required by law, we do not undertake to release revisions to any of these forward-looking statements to reflect future events or circumstances.
ITEM 1. IDENTITY OF DIRECTORS, SENIOR MANAGEMENT AND ADVISERS
| ITEM 1. | IDENTITY OF DIRECTORS, SENIOR MANAGEMENT AND ADVISERS |
Not applicable
ITEM 2. OFFER STATISTICS AND EXPECTED TIMETABLE
| ITEM 2. | OFFER STATISTICS AND EXPECTED TIMETABLE |
Not applicable
| ITEM 3. | KEY INFORMATION |
A. Selected Consolidated Financial Data
The selected consolidated financial data presented below as of March 31, 20152016 and 20162017 and for the years ended March 31, 2014, 2015, 2016 and 20162017 has been derived from our consolidated financial statements included herein, which have been prepared in conformity with IFRS as issued by the IASB. TheseThe consolidated financial statements as of March 31, 2017 and for the year ended March 31, 2017 have been audited by S.R. Batliboi & Co. LLP, India, our independent registered public accounting firm, and included elsewhere in this Annual Report. The consolidated financial statements as of March 31, 2016 and 2015 and for the years ended March 31, 2015 and 2016 were audited by Deloitte Haskins & Sells LLP, Mumbai, India, or Deloitte, our former independent registered public accounting firm, and included elsewhere in this Annual Report.firm.
The selected consolidated financial data presented below as of March 31, 2012, 2013, 2014 and 2014,2015, and for the years ended March 31, 20122013 and 20132014 has been derived from our consolidated financial statements, which also have been prepared in conformity with IFRS as issued by the IASB, and which have not been included elsewhere in this Annual Report.
We have also disclosed below, for all periods presented herein, segment revenue and segment profit, based on the segment disclosures in our consolidated financial statements and cost of production by segment. Cost of production per unit is not a recognized measure under IFRS as issued by the IASB. We have included cost of production as it is a key performance indicator used by the management to assess the performance of the operations. We also believe it is a measure used by investors and analysts to evaluate companies in our industry. Our results of operations are, to a significant degree, dependent upon our ability to efficiently run our operations and maintain low costs of production. Efficiencies relating to recovery of metal from the ore, process improvements, by-product management and increasing productivity help drive our costs down. Our computation of cost of production should be considered in addition to, and not as a substitute for other measures of financial performance and liquidity reported in accordance with IFRS as issued by the IASB. Cost of production is a measure intended for monitoring the operating performance of our operations. This measure is presented by other metal companies, though our measure may not be comparable to similarly titled measures reported by other companies in our industry.
Our historical results do not necessarily indicate our expected results for any future period. The translations of Indian Rupee amounts to US dollars presented in the tables below, are solely for the convenience of the reader and are based on the noon buying rate of Rs. 66.2564.85 per $ 1.00 in the City of New York for cable transfers of Indian Rupees, respectively, as certified for customs purposes by the Federal Reserve Bank of New York on March 31, 2016.2017. No representation is made that the Indian Rupee amounts represent US dollar amounts or have been, could have been or could be converted into US dollars at such rates or at any other rates.
You should read the following information in conjunction with “Item 5. Operating and Financial Review and Prospects” and the consolidated financial statements included elsewhere in this Annual Report.
| For the Year Ended March 31, | For the Year Ended March 31, | |||||||||||||||||||||||||||||||||||||||||||||||
| 2012 | 2013 | 2014 | 2015 | 2016 | 2016 | 2013 | 2014 | 2015 | 2016 | 2017 | 2017 | |||||||||||||||||||||||||||||||||||||
| (Rs.) (in millions except shares and per share data) | (Rs.) (in millions except shares and per share data) | (Rs.) (in millions except shares and per share data) | (Rs.) (in millions except shares and per share data) | (Rs.) (in millions except shares and per share data) | (US Dollar) (in millions except shares and per share data) | (Rs.) (in millions except shares and per share data) | (Rs.) (in millions except shares and per share data) | (Rs.) (in millions except shares and per share data) | (Rs.) (in millions except shares and per share data) | (Rs.) (in millions except shares and per share data) | (US Dollar) (in millions except shares and per share data) | |||||||||||||||||||||||||||||||||||||
Revenue | 598,116 | 722,303 | 725,243 | 733,579 | 639,493 | 9,652.7 | 722,303 | 725,243 | 733,579 | 639,493 | 717,207 | 11,059.5 | ||||||||||||||||||||||||||||||||||||
Cost of sales | (435,993) | (556,663) | (557,900) | (995,968) | (875,756) | (13,219.0) | (556,663 | ) | (557,900 | ) | (995,968 | ) | (875,756 | ) | (533,989 | ) | (8,234.2 | ) | ||||||||||||||||||||||||||||||
|
|
|
|
|
|
|
|
|
|
|
| |||||||||||||||||||||||||||||||||||||
Gross profit/(Loss) | 162,123 | 165,640 | 167,343 | (262,389) | (236,263) | (3,566.3) | 165,640 | 167,343 | (262,389 | ) | (236,263 | ) | 183,218 | 2,825.3 | ||||||||||||||||||||||||||||||||||
Other operating income | 2,252 | 3,791 | 4,541 | 4,802 | 4,785 | 72.2 | 3,791 | 4,541 | 4,802 | 4,785 | 5,186 | 79.9 | ||||||||||||||||||||||||||||||||||||
Distribution expenses | (32,151) | (16,430) | (12,127) | (10,078) | (12,070) | (182.2) | (16,430 | ) | (12,127 | ) | (10,078 | ) | (12,070 | ) | (16,361 | ) | (252.3 | ) | ||||||||||||||||||||||||||||||
Administration expenses | (24,699) | (23,490) | (32,229) | (31,550) | (25,274) | (381.4) | (23,490) | (32,229) | (31,550) | (25,274) | (19,299) | (297.6) | ||||||||||||||||||||||||||||||||||||
|
|
|
|
|
|
|
|
|
|
|
| |||||||||||||||||||||||||||||||||||||
Operating profit/(loss) | 107,525 | 129,511 | 127,528 | (299,215) | (268,822) | (4,057.7) | 129,511 | 127,528 | (299,215 | ) | (268,822 | ) | 152,744 | 2,355.3 | ||||||||||||||||||||||||||||||||||
Investment and other income | 23,583 | 34,931 | 42,165 | 51,154 | 43,998 | 664.1 | 34,931 | 42,165 | 51,154 | 43,998 | 45,428 | 700.5 | ||||||||||||||||||||||||||||||||||||
Finance and other costs | (46,323) | (54,716) | (72,821) | (63,398) | (59,584) | (899.4) | (54,716 | ) | (72,821 | ) | (63,398 | ) | (59,584 | ) | (61,600 | ) | (949.8 | ) | ||||||||||||||||||||||||||||||
| Share in consolidated profit of associate | 4,404 | — | — | — | — | — | ||||||||||||||||||||||||||||||||||||||||||
|
|
|
|
|
|
|
|
|
|
|
| |||||||||||||||||||||||||||||||||||||
Profit/(Loss) before tax | 89,189 | 109,726 | 96,872 | (311,459) | (284,408) | (4,293.0) | 109,726 | 96,872 | (311,459 | ) | (284,408 | ) | 136,572 | 2,106.0 | ||||||||||||||||||||||||||||||||||
Income tax expense | (7,710) | 7,502 | (34,646) | 108,320 | 103,060 | 1,555.7 | 7,502 | (34,646 | ) | 108,320 | 103,060 | (38,027 | ) | (586.4 | ) | |||||||||||||||||||||||||||||||||
|
|
|
|
|
|
|
|
|
|
|
| |||||||||||||||||||||||||||||||||||||
Profit/(Loss) for the year | 81,479 | 117,228 | 62,226 | (203,139) | (181,348) | (2,737.3) | 117,228 | 62,226 | (203,139 | ) | (181,348 | ) | 98,545 | 1,519.6 | ||||||||||||||||||||||||||||||||||
| Profit/(Loss) attributable to: | ||||||||||||||||||||||||||||||||||||||||||||||||
Equity holders of the parent | 51,811 | 62,363 | 15,466 | (128,350) | (125,153) | (1,889.1) | 62,363 | 15,466 | (128,350 | ) | (125,153 | ) | 55,033 | 848.6 | ||||||||||||||||||||||||||||||||||
Non-controlling interest | 29,668 | 54,865 | 46,760 | (74,789) | (56,195) | (848.2) | 54,865 | 46,760 | (74,789 | ) | (56,195 | ) | 43,512 | 671.0 | ||||||||||||||||||||||||||||||||||
| Earnings/(Loss) per share (refer to Note 27 to consolidated financial statements) | ||||||||||||||||||||||||||||||||||||||||||||||||
| Earnings/(Loss) per share | ||||||||||||||||||||||||||||||||||||||||||||||||
Basic | 17.47 | 21.03 | 5.22 | (43.29) | (42.21) | (0.6) | 21.03 | 5.22 | (43.29 | ) | (42.21 | ) | 18.57 | 0.3 | ||||||||||||||||||||||||||||||||||
Diluted | 17.47 | 21.03 | 5.22 | (43.29) | (42.21) | (0.6) | 21.03 | 5.22 | (43.29 | ) | (42.21 | ) | 18.56 | 0.3 | ||||||||||||||||||||||||||||||||||
Number of equity shares | ||||||||||||||||||||||||||||||||||||||||||||||||
Period End | 2,965,004,871 | 2,965,004,871 | 2,965,004,871 | 2,965,004,871 | 2,965,004,871 | 2,965,004,871 | ||||||||||||||||||||||||||||||||||||||||||
Weighted Average | 2,965,004,871 | 2,965,004,871 | 2,965,004,871 | 2,965,004,871 | 2,965,004,871 | 2,965,004,871 | ||||||||||||||||||||||||||||||||||||||||||
Diluted | 2,965,004,871 | 2,965,004,871 | 2,965,004,871 | 2,965,004,871 | 2,965,004,871 | 2,965,004,871 | ||||||||||||||||||||||||||||||||||||||||||
| Dividend declared per share(1),(2) | ||||||||||||||||||||||||||||||||||||||||||||||||
| Weighted average number of equity shares used in computing earnings per share | ||||||||||||||||||||||||||||||||||||||||||||||||
Basic Diluted For the Year Ended March 31, 2013 2014 2015 2016 2017 2017 (Rs.) (in millions
except shares
and per share
data) (Rs.) (in millions
except shares
and per share
data) (Rs.) (in millions
except shares
and per share
data) (Rs.) (in millions
except shares
and per share
data) (Rs.) (in millions
except shares
and per share
data) (US Dollar) (in
millions except
shares and per
share data) 2,965,004,871 2,965,004,871 2,965,004,871 2,965,004,871 2,964,333,584 2,964,333,584 2,965,004,871 2,965,004,871 2,965,004,871 2,965,004,871 2,965,560,871 2,965,560,871 Dividend declared per share(1),(2)
Notes:
| (1) |
On October 28, 2016 the board of directors of Vedanta Limited declared an interim dividend of Rs. 1.75 ($0.03) per equity share for the year ended March 31, 2017. The dividend amounting to Rs. 5,189 million ($80.0 million) has been subsequently paid before the due date. On March 30, 2017 the board of directors of Vedanta Limited declared an interim dividend of Rs. 17.70 ($0.3) per equity share for the year ended March 31, 2017. The dividend amounting to Rs. 65,799.8 million ($1,014.6 million) has been subsequently paid.
| (2) | Vedanta Limited declared and paid dividend of Rs. |
| As of March 31, | As of March 31, | |||||||||||||||||||||||||||||||||||||||||||||||
| 2012 | 2013 | 2014 | 2015 | 2016 | 2016 | 2013 | 2014 | 2015 | 2016 | 2017 | 2017 | |||||||||||||||||||||||||||||||||||||
| (Rs. in millions) | (Rs. in millions) | (Rs. in millions) | (Rs. in millions) | (Rs. in millions) | (US dollars in millions) | (Rs. in millions) | (Rs. in millions) | (Rs. in millions) | (Rs. in millions) | (Rs. in millions) | (US dollars in millions) | |||||||||||||||||||||||||||||||||||||
| Consolidated Financial Position Data: | ||||||||||||||||||||||||||||||||||||||||||||||||
Cash and cash equivalents | 65,270 | 15,199 | 12,960 | 8,621 | 20,870 | 315.0 | 15,199 | 12,960 | 8,621 | 20,870 | 97,202 | 1,498.9 | ||||||||||||||||||||||||||||||||||||
Restricted cash and cash equivalents | 154 | 706 | 2,463 | 4,090 | 3,367 | 50.8 | 706 | 2,463 | 4,090 | 3,367 | 11,747 | 181.1 | ||||||||||||||||||||||||||||||||||||
Total assets | 2,209,684 | 2,414,382 | 2,581,939 | 2,161,704 | 1,869,255 | 28,215.1 | 2,414,382 | 2,581,939 | 2,161,704 | 1,869,255 | 1,918,861 | 29,589.2 | ||||||||||||||||||||||||||||||||||||
Net assets | 1,058,786 | 1,183,269 | 1,262,343 | 1,028,608 | 776,258 | 11,717.1 | 1,183,269 | 1,262,343 | 1,028,608 | 776,258 | 713,788 | 11,006.8 | ||||||||||||||||||||||||||||||||||||
Long-term borrowings | 546,704 | 523,038 | 547,375 | 517,852 | 493,784 | 7,453.3 | 523,038 | 547,375 | 517,852 | 493,784 | 332,654 | 5,129.6 | ||||||||||||||||||||||||||||||||||||
Short-term borrowings | 129,928 | 178,413 | 161,728 | 161,233 | 182,328 | 2,752.1 | 178,413 | 161,728 | 161,233 | 182,328 | 413,126 | 6,370.5 | ||||||||||||||||||||||||||||||||||||
| Equity attributable to equity holders of the parent | 620,809 | 680,609 | 699,570 | 561,119 | 411,160 | 6,206.2 | 680,609 | 699,570 | 561,119 | 411,160 | 576,538 | 8,890.4 | ||||||||||||||||||||||||||||||||||||
| For the Year Ended March 31, | ||||||||||||||||||||||||
| 2012 | 2013 | 2014 | 2015 | 2016 | 2016 | |||||||||||||||||||
| (Rs. in millions) | (Rs. in millions) | (Rs. in millions) | (Rs. in millions) | (Rs. in millions) | (US dollars in millions) | |||||||||||||||||||
Cash Flow Data: | ||||||||||||||||||||||||
Net cash provided by (used in): | ||||||||||||||||||||||||
Operating activities | 154,064 | 97,110 | 56,199 | 125,710 | 107,352 | 1,620.4 | ||||||||||||||||||
Investing activities | (484,939) | (153,176) | (52,631) | (43,939) | (42,613) | (643.2) | ||||||||||||||||||
Financing activities | 370,706 | 1,855 | (6,280) | (86,448) | (52,714) | (795.7) | ||||||||||||||||||
Segment Data: | ||||||||||||||||||||||||
Revenue from external customers: | ||||||||||||||||||||||||
Zinc India | 111,319 | 123,241 | 131,980 | 144,127 | 137,945 | 2,082.2 | ||||||||||||||||||
Zinc International | 41,272 | 43,475 | 40,156 | 35,886 | 25,631 | 386.9 | ||||||||||||||||||
Oil & Gas* | 44,944 | 175,518 | 187,103 | 146,945 | 86,559 | 1,306.6 | ||||||||||||||||||
Iron Ore | 88,248 | 26,054 | 16,516 | 19,039 | 22,233 | 335.6 | ||||||||||||||||||
Copper | 201,647 | 217,262 | 205,577 | 225,198 | 209,239 | 3,158.3 | ||||||||||||||||||
Aluminium | 82,195 | 99,073 | 107,790 | 126,900 | 110,781 | 1,672.2 | ||||||||||||||||||
Power | 26,088 | 34,169 | 35,076 | 33,906 | 45,523 | 687.1 | ||||||||||||||||||
Others | 2,403 | 3,511 | 1,045 | 1,578 | 1,582 | 23.8 | ||||||||||||||||||
|
|
|
|
|
|
|
|
|
|
|
| |||||||||||||
Total | 598,116 | 722,303 | 725,243 | 733,579 | 639,493 | 9,652.7 | ||||||||||||||||||
|
|
|
|
|
|
|
|
|
|
|
| |||||||||||||
Operating profit/(loss): | ||||||||||||||||||||||||
Zinc India | 54,060 | 58,341 | 61,696 | 62,267 | 59,412 | 896.8 | ||||||||||||||||||
Zinc International | 6,008 | 5,078 | 2,484 | 4,268 | 831 | 12.5 | ||||||||||||||||||
Oil & Gas* | 16,887 | 50,370 | 53,942 | (395,146) | (342,813) | (5,174.5) | ||||||||||||||||||
Iron Ore | 23,115 | (77) | (5,476) | (3,422) | (15,793) | (238.4) | ||||||||||||||||||
Copper | 7,765 | 8,517 | 8,876 | 14,344 | 19,660 | 296.8 | ||||||||||||||||||
Aluminium | (2,585) | 960 | 4,979 | 13,752 | 1,416 | 21.4 | ||||||||||||||||||
Power | 2,335 | 6,393 | 1,494 | 4,484 | 8,221 | 124.1 | ||||||||||||||||||
Others | (60) | (71) | (467) | 238 | 244 | 3.7 | ||||||||||||||||||
|
|
|
|
|
|
|
|
|
|
|
| |||||||||||||
Total | 107,525 | 129,511 | 127,528 | (299,215) | (268,822) | (4,057.7) | ||||||||||||||||||
|
|
|
|
|
|
|
|
|
|
|
| |||||||||||||
Segment profit/(loss) | ||||||||||||||||||||||||
Zinc India | 59,296 | 64,227 | 68,642 | 70,605 | 66,970 | 1,010.9 | ||||||||||||||||||
Zinc International | 17,367 | 15,712 | 12,829 | 11,059 | 4,561 | 68.8 | ||||||||||||||||||
Oil & Gas* | 33,825 | 128,502 | 139,453 | 88,671 | 34,273 | 517.3 | ||||||||||||||||||
Iron Ore | 34,229 | 4,530 | (2,700) | (891) | 4,367 | 65.9 | ||||||||||||||||||
Copper | 9,938 | 10,868 | 11,429 | 17,385 | 22,205 | 335.2 | ||||||||||||||||||
Aluminium | 7,742 | 11,285 | 16,131 | 22,529 | 8,467 | 127.8 | ||||||||||||||||||
Power | 6,299 | 11,551 | 7,429 | 8,424 | 12,659 | 191.1 | ||||||||||||||||||
Others | (60) | (61) | (257) | 532 | 568 | 8.6 | ||||||||||||||||||
|
|
|
|
|
|
|
|
|
|
|
| |||||||||||||
Total | 168,636 | 246,614 | 252,956 | 218,314 | 154,070 | 2,325.6 | ||||||||||||||||||
|
|
|
|
|
|
|
|
|
|
|
| |||||||||||||
| For the Year Ended March 31, | ||||||||||||||||||||||||
| 2013 | 2014 | 2015 | 2016 | 2017 | 2017 | |||||||||||||||||||
| (Rs. in millions) | (Rs. in millions) | (Rs. in millions) | (Rs. in millions) | (Rs. in millions) | (US dollars in millions) | |||||||||||||||||||
Cash Flow Data: | ||||||||||||||||||||||||
Net cash provided by (used in): | ||||||||||||||||||||||||
Operating activities | 97,110 | 56,199 | 125,710 | 107,352 | 212,105 | 3,270.5 | ||||||||||||||||||
Investing activities | (153,176 | ) | (52,631 | ) | (43,939 | ) | (42,613 | ) | (79,910 | ) | (1,232.1 | ) | ||||||||||||
Financing activities | 1,855 | (6,280 | ) | (86,448 | ) | (52,714 | ) | (49,123 | ) | (757.4 | ) | |||||||||||||
Segment Data: | ||||||||||||||||||||||||
Revenue from external customers: | ||||||||||||||||||||||||
Zinc India | 123,241 | 131,980 | 144,127 | 137,945 | 169,194 | 2,609.0 | ||||||||||||||||||
Zinc International | 43,475 | 40,156 | 35,886 | 25,631 | 22,302 | 343.9 | ||||||||||||||||||
Oil and Gas | 175,518 | 187,103 | 146,945 | 86,559 | 82,041 | 1,265.1 | ||||||||||||||||||
Iron Ore | 26,054 | 16,516 | 19,039 | 22,233 | 40,880 | 630.4 | ||||||||||||||||||
Copper | 217,262 | 205,577 | 225,198 | 209,239 | 210,021 | 3,238.6 | ||||||||||||||||||
Aluminium | 99,073 | 107,790 | 126,900 | 110,781 | 136,667 | 2,107.4 | ||||||||||||||||||
Power | 34,169 | 35,076 | 33,906 | 45,523 | 55,189 | 851.0 | ||||||||||||||||||
Others | 3,511 | 1,045 | 1,578 | 1,582 | 913 | 14.1 | ||||||||||||||||||
|
|
|
|
|
|
|
|
|
|
|
| |||||||||||||
Total | 722,303 | 725,243 | 733,579 | 639,493 | 717,207 | 11,059.5 | ||||||||||||||||||
|
|
|
|
|
|
|
|
|
|
|
| |||||||||||||
Operating profit/(loss): | ||||||||||||||||||||||||
Zinc India | 58,341 | 61,696 | 62,267 | 59,412 | 85,491 | 1,318.3 | ||||||||||||||||||
Zinc International | 5,078 | 2,484 | 4,268 | 831 | 7,336 | 113.1 | ||||||||||||||||||
Oil and Gas | 50,370 | 53,942 | (395,146 | ) | (342,813 | ) | 14,205 | 219.0 | ||||||||||||||||
Iron Ore | (77 | ) | (5,476 | ) | (3,422 | ) | (15,793 | ) | 8,403 | 129.6 | ||||||||||||||
Copper | 8,517 | 8,876 | 14,344 | 19,660 | 15,026 | 231.7 | ||||||||||||||||||
Aluminium | 960 | 4,979 | 13,752 | 1,416 | 11,725 | 180.8 | ||||||||||||||||||
Power | 6,393 | 1,494 | 4,484 | 8,221 | 10,757 | 165.9 | ||||||||||||||||||
Others | (71 | ) | (467 | ) | 238 | 244 | (199 | ) | (3.1 | ) | ||||||||||||||
|
|
|
|
|
|
|
|
|
|
|
| |||||||||||||
Total | 129,511 | 127,528 | (299,215 | ) | (268,822 | ) | 152,744 | 2,355.3 | ||||||||||||||||
|
|
|
|
|
|
|
|
|
|
|
| |||||||||||||
Segment profit/(loss) | ||||||||||||||||||||||||
Zinc India | 64,227 | 68,642 | 70,605 | 66,970 | 95,499 | 1,472.6 | ||||||||||||||||||
Zinc International | 15,712 | 12,829 | 11,059 | 4,561 | 9,181 | 141.6 | ||||||||||||||||||
Oil and Gas | 128,502 | 139,453 | 88,671 | 34,273 | 40,892 | 630.6 | ||||||||||||||||||
Iron Ore | 4,530 | (2,700 | ) | (891 | ) | 4,367 | 13,091 | 201.9 | ||||||||||||||||
Copper | 10,868 | 11,429 | 17,385 | 22,205 | 16,964 | 261.6 | ||||||||||||||||||
Aluminium | 11,285 | 16,131 | 22,529 | 8,467 | 23,200 | 357.7 | ||||||||||||||||||
Power | 11,551 | 7,429 | 8,424 | 12,659 | 16,442 | 253.5 | ||||||||||||||||||
Others | (61 | ) | (257 | ) | 532 | 568 | 114 | 1.7 | ||||||||||||||||
|
|
|
|
|
|
|
|
|
|
|
| |||||||||||||
Total | 246,614 | 252,956 | 218,314 | 154,070 | 215,383 | 3,321.2 | ||||||||||||||||||
|
|
|
|
|
|
|
|
|
|
|
| |||||||||||||
Notes:
| (1) | Segment profit is presented as required by IFRS 8 and is calculated by adjusting operating profit to exclude depreciation, amortization and impairment. Our segment profit may not be comparable to similarly titled measures reported by other companies due to potential inconsistencies in the method of calculation. We have included our segment profit because we believe it is an indicative measure of our operating performance and is used by investors and analysts to evaluate companies in our industry. Our segment profit should be considered in addition to, and not as a substitute for, other measures of financial performance and liquidity reported in accordance with IFRS as issued by the IASB. We believe that the inclusion of supplementary adjustments applied in our presentation of segment profit are appropriate because we believe it is an indicative measure of our baseline performance as it excludes certain charges that our management considers to be outside of our core operating results. In addition, our segment profit is among the primary indicators that our management uses as a basis for planning and forecasting future periods. The following table reconciles operating profit to segment profit for the periods indicated: |
| For the Year Ended March 31, | For the Year Ended March 31, | |||||||||||||||||||||||||||||||||||||||||||||||
| 2012 | 2013 | 2014 | 2015 | 2016 | 2016 | 2013 | 2014 | 2015 | 2016 | 2017 | 2017 | |||||||||||||||||||||||||||||||||||||
| (Rs. in millions) | (Rs. in millions) | (Rs. in millions) | (Rs. in millions) | (Rs. in millions) | (US dollars in millions) | (Rs. in millions) | (Rs. in millions) | (Rs. in millions) | (Rs. in millions) | (Rs. in millions) | (US dollars in millions) | |||||||||||||||||||||||||||||||||||||
Zinc India: | ||||||||||||||||||||||||||||||||||||||||||||||||
Operating profit | 54,060 | 58,341 | 61,696 | 62,267 | 59,412 | 896.8 | 58,341 | 61,696 | 62,267 | 59,412 | 85,491 | 1,318.3 | ||||||||||||||||||||||||||||||||||||
| Plus: Depreciation and amortization | 5,236 | 5,886 | 6,946 | 8,338 | 7,558 | 114.1 | 5,886 | 6,946 | 8,338 | 7,558 | 10,008 | 154.3 | ||||||||||||||||||||||||||||||||||||
|
|
|
|
|
|
|
|
|
|
|
| |||||||||||||||||||||||||||||||||||||
Segment profit | 59,296 | 64,227 | 68,642 | 70,605 | 66,970 | 1,010.9 | 64,227 | 68,642 | 70,605 | 66,970 | 95,499 | 1,472.6 | ||||||||||||||||||||||||||||||||||||
|
|
|
|
|
|
|
|
|
|
|
| |||||||||||||||||||||||||||||||||||||
Zinc International | ||||||||||||||||||||||||||||||||||||||||||||||||
Operating profit | 6,008 | 5,078 | 2,484 | 4,268 | 831 | 12.5 | 5,078 | 2,484 | 4,268 | 831 | 7,336 | 113.1 | ||||||||||||||||||||||||||||||||||||
| Plus: Depreciation and amortization(1) | 11,359 | 10,634 | 10,345 | 6,791 | 3,730 | 56.3 | 10,634 | 10,345 | 6,791 | 3,730 | 1,845 | 28.5 | ||||||||||||||||||||||||||||||||||||
|
|
|
|
|
|
|
|
|
|
|
| |||||||||||||||||||||||||||||||||||||
Segment profit | 17,367 | 15,712 | 12,829 | 11,059 | 4,561 | 68.8 | 15,712 | 12,829 | 11,059 | 4,561 | 9,181 | 141.6 | ||||||||||||||||||||||||||||||||||||
|
|
|
|
|
|
|
|
|
|
|
| |||||||||||||||||||||||||||||||||||||
Oil & Gas | ||||||||||||||||||||||||||||||||||||||||||||||||
Oil and Gas | ||||||||||||||||||||||||||||||||||||||||||||||||
Operating profit/(loss) | 16,887 | 50,370 | 53,942 | (395,146) | (342,813) | (5,174.5) | 50,370 | 53,942 | (395,146 | ) | (342,813 | ) | 14,205 | 219.0 | ||||||||||||||||||||||||||||||||||
| Plus: Depreciation and amortization(2) | 16,938 | 78,132 | 85,511 | 483,817 | 377,086 | 5,691.8 | 78,132 | 85,511 | 483,817 | 377,086 | 26,687 | 411.6 | ||||||||||||||||||||||||||||||||||||
|
|
|
|
|
|
|
|
|
|
|
| |||||||||||||||||||||||||||||||||||||
Segment profit | 33,825 | 128,502 | 139,453 | 88,671 | 34,273 | 517.3 | 128,502 | 139,453 | 88,671 | 34,273 | 40,892 | 630.6 | ||||||||||||||||||||||||||||||||||||
|
|
|
|
|
|
|
|
|
|
|
| |||||||||||||||||||||||||||||||||||||
Iron Ore | ||||||||||||||||||||||||||||||||||||||||||||||||
Operating profit/(loss) | 23,115 | (77) | (5,476) | (3,422) | (15,793) | (238.4) | ||||||||||||||||||||||||||||||||||||||||||
| Plus: Depreciation and amortization(3) | 11,114 | 4,607 | 2,776 | 2,531 | 20,160 | 304.3 | ||||||||||||||||||||||||||||||||||||||||||
|
|
|
|
|
| |||||||||||||||||||||||||||||||||||||||||||
Segment profit/(loss) | 34,229 | 4,530 | (2,700) | (891) | 4,367 | 65.9 | ||||||||||||||||||||||||||||||||||||||||||
|
|
|
|
|
| |||||||||||||||||||||||||||||||||||||||||||
Copper: | ||||||||||||||||||||||||||||||||||||||||||||||||
Operating profit | 7,765 | 8,517 | 8,876 | 14,344 | 19,660 | 296.8 | ||||||||||||||||||||||||||||||||||||||||||
| Plus: Depreciation and amortization(4) | 2,173 | 2,351 | 2,553 | 3,041 | 2,545 | 38.4 | ||||||||||||||||||||||||||||||||||||||||||
|
|
|
|
|
| |||||||||||||||||||||||||||||||||||||||||||
Segment profit | 9,938 | 10,868 | 11,429 | 17,385 | 22,205 | 335.2 | ||||||||||||||||||||||||||||||||||||||||||
|
|
|
|
|
| |||||||||||||||||||||||||||||||||||||||||||
Aluminium: | ||||||||||||||||||||||||||||||||||||||||||||||||
Operating profit/(loss) | (2,585) | 960 | 4,979 | 13,752 | 1,416 | 21.4 | ||||||||||||||||||||||||||||||||||||||||||
| Plus: Depreciation and amortization(5) | 10,327 | 10,325 | 11,152 | 8,777 | 7,051 | 106.4 | ||||||||||||||||||||||||||||||||||||||||||
|
|
|
|
|
| |||||||||||||||||||||||||||||||||||||||||||
Segment profit | 7,742 | 11,285 | 16,131 | 22,529 | 8,467 | 127.8 | ||||||||||||||||||||||||||||||||||||||||||
|
|
|
|
|
| |||||||||||||||||||||||||||||||||||||||||||
| For the Year Ended March 31, | For the Year Ended March 31, | |||||||||||||||||||||||||||||||||||||||||||||||
| 2012 | 2013 | 2014 | 2015 | 2016 | 2016 | 2013 | 2014 | 2015 | 2016 | 2017 | 2017 | |||||||||||||||||||||||||||||||||||||
| (Rs. in millions) | (Rs. in millions) | (Rs. in millions) | (Rs. in millions) | (Rs. in millions) | (US dollars in millions) | |||||||||||||||||||||||||||||||||||||||||||
Iron Ore | ||||||||||||||||||||||||||||||||||||||||||||||||
Operating profit/(loss) | (77 | ) | (5,476 | ) | (3,422 | ) | (15,793 | ) | 8,403 | 129.6 | ||||||||||||||||||||||||||||||||||||||
| Plus: Depreciation and amortization(3) | 4,607 | 2,776 | 2,531 | 20,160 | 4,688 | 72.3 | ||||||||||||||||||||||||||||||||||||||||||
|
|
|
|
|
| |||||||||||||||||||||||||||||||||||||||||||
Segment profit/(loss) | 4,530 | (2,700 | ) | (891 | ) | 4,367 | 13,091 | 201.9 | ||||||||||||||||||||||||||||||||||||||||
|
|
|
|
|
| |||||||||||||||||||||||||||||||||||||||||||
Copper: | ||||||||||||||||||||||||||||||||||||||||||||||||
Operating profit | 8,517 | 8,876 | 14,344 | 19,660 | 15,026 | 231.7 | ||||||||||||||||||||||||||||||||||||||||||
| Plus: Depreciation and amortization(4) | 2,351 | 2,553 | 3,041 | 2,545 | 1,938 | 29.9 | ||||||||||||||||||||||||||||||||||||||||||
|
|
|
|
|
| |||||||||||||||||||||||||||||||||||||||||||
Segment profit | 10,868 | 11,429 | 17,385 | 22,205 | 16,964 | 261.6 | ||||||||||||||||||||||||||||||||||||||||||
|
|
|
|
|
| |||||||||||||||||||||||||||||||||||||||||||
Aluminium: | ||||||||||||||||||||||||||||||||||||||||||||||||
Operating profit/(loss) | 960 | 4,979 | 13,752 | 1,416 | 11,725 | 180.8 | ||||||||||||||||||||||||||||||||||||||||||
| Plus: Depreciation and amortization(5) | 10,325 | 11,152 | 8,777 | 7,051 | 11,475 | 176.9 | ||||||||||||||||||||||||||||||||||||||||||
|
|
|
|
|
| |||||||||||||||||||||||||||||||||||||||||||
Segment profit | 11,285 | 16,131 | 22,529 | 8,467 | 23,200 | 357.7 | ||||||||||||||||||||||||||||||||||||||||||
| (Rs. in millions) | (Rs. in millions) | (Rs. in millions) | (Rs. in millions) | (Rs. in millions) | (US dollars in millions) |
|
|
|
|
|
| |||||||||||||||||||||||||||||||||||||
Power: | ||||||||||||||||||||||||||||||||||||||||||||||||
Operating profit | 2,335 | 6,393 | 1,494 | 4,484 | 8,221 | 124.1 | 6,393 | 1,494 | 4,484 | 8,221 | 10,757 | 165.9 | ||||||||||||||||||||||||||||||||||||
| Plus: Depreciation and amortization | 3,964 | 5,158 | 5,935 | 3,940 | 4,438 | 67.0 | 5,158 | 5,935 | 3,940 | 4,438 | 5,685 | 87.6 | ||||||||||||||||||||||||||||||||||||
|
|
|
|
|
|
|
|
|
|
|
| |||||||||||||||||||||||||||||||||||||
Segment profit | 6,299 | 11,551 | 7,429 | 8,424 | 12,659 | 191.1 | 11,551 | 7,429 | 8,424 | 12,659 | 16,442 | 253.5 | ||||||||||||||||||||||||||||||||||||
|
|
|
|
|
|
|
|
|
|
|
| |||||||||||||||||||||||||||||||||||||
Others: | ||||||||||||||||||||||||||||||||||||||||||||||||
Operating profit/(loss) | (60) | (71) | (467) | 238 | 244 | 3.7 | (71 | ) | (467 | ) | 238 | 244 | (199 | ) | (3.1 | ) | ||||||||||||||||||||||||||||||||
| Plus: Depreciation and amortization | — | 10 | 210 | 294 | 324 | 4.9 | 10 | 210 | 294 | 324 | 313 | 4.8 | ||||||||||||||||||||||||||||||||||||
|
|
|
|
|
|
|
|
|
|
|
| |||||||||||||||||||||||||||||||||||||
Segment profit/(loss) | (60) | (61) | (257) | 532 | 568 | 8.6 | (61 | ) | (257 | ) | 532 | 568 | 114 | 1.7 | ||||||||||||||||||||||||||||||||||
| (1) | Includes impairment charge of Rs. 2,873 million in fiscal year |
| (2) | Includes impairment charge of Rs. 406,144 million in fiscal year 2015, |
| (3) | Includes impairment charge of Rs. 16,054 million |
| (4) | Includes impairment charge of Rs. 497 million |
| (5) | Includes impairment charge of Rs. 668 million in fiscal year 2014, |
Exchange Rates
Substantially all of our revenue is denominated or paid with reference to US dollars and most of our expenses are incurred and paid in Indian Rupees. We report our financial results in Indian Rupees. The exchange rates among the Indian Rupee and the US dollar have changed substantially in recent years and may fluctuate substantially in the future. The results of our operations are affected as the Indian Rupee appreciate or depreciate against the US dollar and, as a result, any such appreciation or depreciation will likely affect the market price of our ADSs in the United States.
The following table sets forth, for the periods indicated, information concerning the exchange rates between Indian Rupees and US dollars based on the rates quoted on Federal Reserve Bank of New York:
| For the Year Ended March 31, | ||||||||||||||
| Unit of Measurement | 2014 | 2015 | 2016 | |||||||||||
| (in US dollars per ton, except as indicated) | ||||||||||||||
TcRc (1) | ¢/lb | 16.6 | 21.4 | 24.1 | ||||||||||
Cost of production before by-product revenue(2) | ||||||||||||||
Zinc India | $ | 1,069 | 1,215 | 1,151 | ||||||||||
Zinc International | $ | 1,300 | 1,533 | 1,548 | ||||||||||
Oil and Gas | $/boe | 20.9 | 22.9 | 21.8 | ||||||||||
Iron ore | $ | 40.9 | 134.9 | 24.6 | ||||||||||
Copper smelting and refining | ¢/lb | 18.8 | 14.0 | 11.3 | ||||||||||
Aluminium | $ | 1,664 | 1,790 | 1,589 | ||||||||||
Power – Jharsuguda 2400 MW plant | Rs./unit | 2.1 | 2.1 | 2.1 | ||||||||||
Cost of production net of by-product revenue(2) | ||||||||||||||
Zinc India | $ | 985 | 1,111 | 1,046 | ||||||||||
Zinc International | $ | 1,167 | 1,393 | 1,432 | ||||||||||
Oil and Gas | $/boe | 20.9 | 22.9 | 21.8 | ||||||||||
Iron ore | $ | 40.9 | 134.9 | 24.6 | ||||||||||
Copper smelting and refining | ¢/lb | 9.7 | 4.2 | 3.2 | ||||||||||
Aluminium | $ | 1,658 | 1,785 | 1,573 | ||||||||||
Power - Jharsuguda 2400 MW plant | Rs./unit | 2.1 | 2.1 | 2.1 | ||||||||||
| Period End(1) | Average(1)(2) | High | Low | |||||||||||||
Fiscal Year: | ||||||||||||||||
2013 | 54.52 | 54.47 | 57.13 | 50.64 | ||||||||||||
2014 | 60.00 | 60.35 | 68.80 | 53.65 | ||||||||||||
2015 | 62.31 | 61.11 | 63.67 | 58.30 | ||||||||||||
2016 | 66.25 | 65.39 | 68.84 | 61.99 | ||||||||||||
2017 | 64.85 | 67.01 | 68.86 | 64.85 | ||||||||||||
Month: | ||||||||||||||||
January 2017 | 67.48 | 68.05 | 68.39 | 67.48 | ||||||||||||
February 2017 | 66.67 | 66.97 | 67.40 | 66.67 | ||||||||||||
March 2017 | 64.85 | 65.80 | 66.83 | 64.85 | ||||||||||||
April 2017 | 64.27 | 64.54 | 65.10 | 64.08 | ||||||||||||
May 2017 | 64.50 | 64.42 | 64.87 | 64.03 | ||||||||||||
June 2017 | 64.62 | 64.45 | 64.66 | 64.23 | ||||||||||||
July 2017 (through July 28, 2017) | 64.11 | 64.44 | 64.84 | 64.11 | ||||||||||||
Notes:
| (1) |
| (2) |
We present below costs of production for our metal products on the following basis:
We explain the cost of production for each metal as set forth below:
Our iron ore operations in Goa recommenced in August 2015, after receiving necessary approvals from the state government. Our iron ore operations had been suspended during fiscal year 2015 due to the continued mining ban in the state of Goa. Our cost of production of iron ore shows a significant decrease as the cost of production of fiscal year 2015 also factors in fixed administrative costs incurred in our Goa operations and Karnataka operations which will be now spread over to larger production compared to last year.
(Rs.in millions, except Production output and Cost of production) (Rs.in millions, except Production output and Cost (Rs.in millions, except Production output and Cost of production) (Rs.in millions, except Production output and Cost (Rs.in millions, except Production output and Cost Zinc—India: Segment revenue Less: Segment profit Less: Cost of tolling including raw material cost Cost of intermediary product sold Cost of lead metal sold Others(c) By-product revenue Total after adjusting for by-product revenues Production output (in tons) Zinc—International: Segment revenue Less: Segment profit Less: TcRc Cost of lead metal sold Others(c) By-product revenue Total after adjusting for by-product revenues Production output (in tons) For the Year Ended March 31, 2012 2013 2014 2015 2016
of production)
of production)
of production) Rs. 111,319 Rs. 123,241 Rs. 132,811 Rs. 144,127 Rs. 137,945 (59,296) (64,227) (68,642) (70,605) (66,970) 52,023 59,014 64,169 73,522 70,975 (3,121) (6,805) — — — (149) (1,806) (3,461) (3,230) (2,348) (5,260) (6,962) (8,115) (8,991) (10,264) (1,451) (2,506) (4,146) (6,773) (1,185) Total before adjusting for by-product revenues Rs. 42,042 Rs. 40,934 Rs. 48,447 Rs. 54,528 Rs. 57,178 (5,315) (4,766) (3,821) (4,692) (5,234) Rs. 36,727 Rs. 36,168 Rs. 44,626 Rs. 49,836 Rs. 51,944 758,716 676,923 749,167 733,805 758,938 Cost of production before by-product revenue (per ton) (a) $ 1,156 $ 1,111 $ 1,069 $ 1,215 $ 1,151 Cost of production net of by- Product revenue (per ton) (a) $ 1,010 $ 981 $ 985 $ 1,111 $ 1,046 Cost of production net of by- Product revenue (per ton) (a) Rs. 48,407 Rs. 53,430 Rs. 59,568 Rs. 67,914 Rs. 68,442 Rs. 42,771 Rs. 43,475 Rs. 40,156 Rs. 35,886 Rs. 25,631 (17,367) (15,712) (12,829) (11,059) (4,561) 25,404 27,763 27,327 24,827 21,070 3,344 3,344 4,191 4,943 3,757 (6,240) (5,336) (4,631) (4,486) (3,859) (2,228) (3,351) (2,900) (894) (2,419) Total before adjusting for by-product revenues Rs. 21,276 Rs. 22,421 Rs. 23,987 Rs. 24,390 Rs. 18,549 (1,621) (1,459) (2,464) (2,230) (1,390) Rs. 19,655 Rs. 20,962 Rs. 21,522 Rs. 22,160 Rs. 17,159 359,730 353,404 304,945 260,106 183,035 Cost of production before by-product revenue (per ton) (a) $ 1,233 $ 1,165 $ 1,300 $ 1,533 $ 1,548
(Rs.in millions, except Production output and Cost of production) (Rs.in millions, except Production output and Cost (Rs.in millions, except Production output and Cost of production) (Rs.in millions, except Production output and Cost (Rs.in millions, except Production output and Cost Oil & Gas Segment revenue Less: Segment profit Less: Unsuccessful Exploration Cost Other income Pre award cost Others(c) By-product revenue Total after adjusting for by-product revenues Net Production (in mmboe) Iron Ore Segment revenue Less: Segment profit Less: Cost of Intermediary product sold Export Duty Others(c) By-product revenue Total after adjusting for by-product revenues Production output (in million dmt) For the Year Ended March 31, 2012 2013 2014 2015 2016
of production)
of production)
of production) Cost of production net of by-product revenue (per ton) (a) $ 1,139 $ 1,089 $ 1,167 $ 1,393 $ 1,432 44,944 175,518 187,103 146,945 86,559 (33,825) (128,502) (139,453) (88,671) (34,273) 11,119 47,016 47,650 58,274 52,286 (709) (2,821) (653) (7,867) (294) 180 1,025 379 103 176 (67) (194) (242) (1) (71) (2,954) (5,217) (5,575) (5,619) (4,606) Total before adjusting for by-product revenues Rs. 7,569 Rs. 39,810 Rs. 41,560 Rs. 44,890 Rs. 47,491 — — — — — Rs. 7,569 Rs. 39,810 Rs. 41,560 Rs. 44,890 Rs. 47,491 8.57 33.00 32.89 32.01 33.33 Cost of production before by-product revenue (per boe)(a) $ 17.4 $ 22.2 $ 20.9 $ 22.9 $ 21.8 Cost of production net of by-product revenue (per boe)(a) $ 17.4 $ 22.2 $ 20.9 $ 22.9 $ 21.8 88,339 26,119 16,558 19,963 22,774 (34,229) (4,530) 2,700 891 (4,367) 54,110 21,589 19,258 20,854 18,407 (8,018) (9,309) (16,340) (15,953) (11,652) (16,233) (4,430) — — (250) (7,665) 500 810 214 1,810 Total before adjusting for by-product revenues 22,194 8,351 3,728 5,115 8,316 — — — — — 22,194 8,351 3,728 5,115 8,316 13.75 3.71 1.51 0.62 5.17 Cost of production before by-product revenue (per dmt) (a) $ 33.7 $ 41.3 $ 40.9 $ 134.9 $ 24.6 Cost of production net of by-product revenue (per dmt) (a) $ 33.7 $ 41.3 $ 40.9 $ 134.9 $ 24.6
(Rs.in millions, except Production output and Cost of production) (Rs.in millions, except Production output and Cost (Rs.in millions, except Production output and Cost of production) (Rs.in millions, except Production output and Cost (Rs.in millions, except Production output and Cost Copper: Segment revenue Less: Segment profit Less: Purchased concentrate/rock Cost for downstream products Others(c): By-product revenues Free Copper net sale Production output (in tons) Aluminium: Segment revenue Less: Segment profit Cost for downstream products Others(c): By-product revenue Total after adjusting for by-product revenues Production output (hot metal) (in tons) For the Year Ended March 31, 2012 2013 2014 2015 2016
of production)
of production)
of production) Rs. 201,647 Rs. 217,374 Rs. 205,879 Rs. 226,298 Rs. 209,262 (9,938) (10,868) (11,429) (17,385) (22,205) 191,709 206,506 194,450 208,913 187,057 (181,766) (193,200) (182,399) (196,428) (177,067) (1,481) (2,163) (3,354) (3,441) (1,533) (1,779) (2,630) (1,295) (2,220) (2,181) Total before adjusting for by-product and free copper revenues Rs. 6,683 Rs. 8,513 Rs. 7,402 Rs. 6,824 Rs. 6,276 (3,976) (2,165) (1,208) (2,215) (2,377) (2,708) (2,647) (2,385) (2,559) (2,138) Total after adjusting for by-product and free copper revenues Rs. (1 ) Rs. 3,701 Rs. 3,809 Rs. 2,050 Rs. 1,761 325,877 353,154 294,434 362,373 384,047 Cost of production before by-product and free copper revenue (a) ¢/lb 19.4 ¢/lb 20.1 ¢/lb 18.8 ¢/lb 14.0 ¢/lb 11.3 Cost of production net of by-product and free copper revenue (a) ¢/lb 0.0 ¢/lb 8.7 ¢/lb 9.7 ¢/lb 4.2 ¢/lb 3.2 82,302 99,633 107,989 127,130 110,910 (7,742) (11,285) (16,131) (22,529) (8,467) 74,560 88,348 91,858 104,601 102,443 (4,122) (5,140) (4,230) (4,611) (3,998) (1,887) (3,613) (7,540) (7,707) (7,707) Total before adjusting for by-product revenues Rs. 68,551 Rs. 79,594 Rs. 80,087 Rs. 92,283 Rs. 90,738 (290) (299) (281) (223) (903) Rs. 68,261 Rs. 79,296 Rs. 79,807 Rs. 92,060 Rs. 89,835 680,461 774,851 795,728 843,219 872,591 Cost of production before by-product revenue (per ton)(a) $ 2,101 $ 1,887 $ 1,664 $ 1,790 $ 1,589 Cost of production net of by-product (per ton) (a) $ 2,091 $ 1,879 $ 1,658 $ 1,785 $ 1,573 Cost of production net of by-product (per ton) (a) Rs. 100,268 Rs. 102,337 Rs. 100,294 Rs. 109,177 Rs. 102,953
(Rs.in millions, except Production output and Cost of production) (Rs.in millions, except Production output and Cost (Rs.in millions, except Production output and Cost of production) (Rs.in millions, except Production output and Cost (Rs.in millions, except Production output and Cost Power Segment revenue Less: Segment profit Less: Others(c): Total Production output (in MU)(b) For the Year Ended March 31, 2012 2013 2014 2015 2016
of production)
of production)
of production) 28,473 36,365 37,638 41,186 49,826 (6,299) (11,551) (7,429) (8,424) (12,659) 22,174 24,814 30,209 32,762 37,167 Cost of power at TSPL, BALCO, HZL and MALCO Energy (8,188) (8,286) (9,456) (13,725) (19,284) (1,828) (2,555) (4,710) (3,589) (2,287) Rs. 12,157 Rs. 13,973 Rs. 16,043 Rs. 15,448 Rs. 15,596 4,637 6,718 7,625 7,216 7,464 Cost of production before by-product revenue (per unit) Rs. 2.6 Rs. 2.1 Rs. 2.1 Rs. 2.1 Rs. 2.1 Cost of production net of by-product revenue (per unit) Rs. 2.6 Rs. 2.1 Rs. 2.1 Rs. 2.1 Rs. 2.1
Notes:
B. Capitalization and Indebtedness
Not applicable
C. Reasons for the Offer and Use of Proceeds
Not applicable
D. Risk Factors
This Annual Report contains forward-looking statements that involve risks and uncertainties. Our actual results could differ materially from those anticipated in these forward-looking statements as a result of a number of factors, including those described in the following risk factors and elsewhere in this Annual Report. If any of the following risks actually occur, our business, financial condition and results of operations could suffer and the trading price of our equity shares and ADSs could decline.
Risks Relating to Our Business
Our operations are subject to governmental, health and safety and environmental regulations, which require us to obtain and comply with the terms of various approvals, licenses and permits. Any failure to obtain, renew or comply with the terms of such approvals, licenses and permits in a timely manner may have a material adverse effect on our business, financial condition and results of operations and financial condition.
Numerous governmental permits, approvals and leaseslicenses are required for our operations as the industries in which we operate and seek to operate are subject to numerous laws and extensive regulation by national, state and local authorities in jurisdictions including India, Sri Lanka,UAE, Australia, Namibia, South Africa, Ireland, Liberia and any other jurisdictions where we may operate in future. Our operations are also subject to laws, regulations and regulationsstandards relating to employment, the protection of health and safety of employees as well as the environment, including conservation and climate change. Evolving regulations, standards and stakeholder expectations could result in increased cost, litigation or threaten the viability of operations in extreme cases. For instance, we are required to obtain various environmental and labor-related approvals in connection with our operations in India, including clearances from the Ministry of Environment and Forests (“MoEF”), Government of India (“GoI”) and from the relevant pollution control boards in various states in India in which we operate in order to establish and operate our facilities. Certain of such approvals are valid for certain specified periods of time and require periodic renewals, such as consents to operate and under the Air (Prevention and Control of Pollution) Act, 1981, as amended, and the Water (Prevention and Control of Pollution) Act, 1981 from the relevant Pollution Control Boards, which are generally granted for a period of one year.
Further, our oil and gas, exploration and mining activities depend on the grant or renewal of various exploration and mining licenses and production sharing contracts and other regulatory approvals that are valid for a specific period of time. In addition, such licenses and contracts contain various obligations and restrictions, including restrictions on assignment or any other form of transfer of a mining lease or on the employment of a person who is not an Indian national. For instance, in connection with our mining operations in India, mining leases are typically granted for a period of 20 to 30 years and stipulate conditions including approved limits on extraction. Similarly, in connection with our oil and gas operations in India, Cairn India is required to enter into a production sharing contract and obtain an exploration license, which typically extends to 7 or 8 years following the award of a block before it can commence exploration activities and if exploration is successful, Cairn India is then required to procure a petroleum mining lease from the relevant government authority which typically extends for 20 years in order to conduct extraction operations for oil and gas.
Our current oil and gas reserves and production are significantly dependent on the Rajasthan block in India. The current production sharing contract for the block is valid until May 2020. If the production sharing contract does not get extended or gets extended on unfavorable terms, for example, if the GoI seeks a higher profit share, or the Oil and Natural Gas Corporation Limited (“ONGC”) seeks higher shareholding in the Rajasthan block, this could result in a substantial loss of value and could have a material and adverse effect on our results of operations and financial condition. On April 7, 2017, the Ministry of Petroleum and Natural Gas issued a policy for the grant of extension to the production sharing contracts signed by the GoI awardingPre-New Exploration Licensing Policy(“Pre-NELP”) Exploration Blocks(“Pre-NELP Extension Policy”). ThePre-NELP Extension Policy defines the framework for granting of extension forPre-NELP blocks including the Rajasthan and Cambay fields. Under thePre-NELP Extension Policy, the Government’s share of profit petroleum during the extended period of contracts would be at higher rates for the applicable fields. Furthermore, under the terms of the production sharing contracts, we are obliged to sell our entitlement to crude oil in the domestic Indian market until such time as the total availability of the crude oil and condensate from all domestic petroleum production activities meets the total national demand and India achieves self-sufficiency. There is currently a mismatch between the demand and the supply for crude oil in India, with the demand outweighing the domestic production of crude oil, and this mismatch is expected to continue in the long term. Further, to the extent our Indian blocks yield crude oil that is not suitable for processing by refineries in India, it may be difficult for us to monetize such domestic crude oil reserves and this could have a material adverse effect on our oil and gas business, financial condition or results of operations.
Government approval is also required, generally, for the continuation of mining as well as oil and gas exploration and production activities in India and other jurisdictions, and such approval can be revoked for a variety of circumstances by the GoI, Indian courts or other authorities. Any general suspension of mining activities by the government of a jurisdiction containing our mining operations could have the effect of closing or limiting production from our operations. For example, our total iron ore production declined from 13.8 mmt in fiscal year 2012 to 0.6 mmt in fiscal year 2015 due to the suspension imposed by the state government of Goa on the mining activities in the state of Goa. In January 2015, the government of Goa revoked the order suspending mining operations in the state of Goa and the MOEFMoEF revoked the suspension of environmental clearances in March 2015. Lease deeds for all working leases have been executed and registered. We have obtained Consent to Operate under the Air (Prevention of Pollution) Act and Water (Prevention of Pollution) Act from the Goa State pollution Control Board and have resumed operations at our major mines. All mining plans have been approved by the Indian Bureau of Mines and the state government of Goa allocations of mining cap is in line with the Supreme Court’s directive. We continue to actively pursue the lifting of mining caps and additional allocation of production from the state government of Goa. See “Item 8. Financial Information— A. Consolidated Statements and Other Financial Information— Legal Proceedings.” for further details.
Further, the state government of Goa appointed an independent firm in August 2014 to undertake an audit of production levels in excess of environment clearances of all mining companies operating in the state of Goa, including our Company for the period from fiscal year 2008 to fiscal year 2013. The independent firm submitted its final report to the state Directorate of Mines and Geology (DMG) on May 5, 2015. Observations raised by the audit with respect to our Company included production levels to be in excess of environmental clearances for the leases of the Company, and whether the royalty can be payable on a dry metric ton (DMT) basis instead of wet metric ton (WMT) basis, and the audit process was based on the formats and procedures specified by DMG and the report was submitted accordingly. The Company has refuted these observations and provided its responses to these observations to the firm based upon a legal opinion of our Indian counsel, and these responses have been filed in the audit report of the Independent firm to the state DMG. In doing so, the Company has reserved its rights without prejudice to its responses and requested an opportunity to furnish further documentation and information as may be appropriate before any further steps in this regard are taken by the state government. We received a show cause notice from DMG on August 5, 2016 to which we filed a reply on November 24, 2016. The Company has not received any further notice or communication in this regard. If the Company is subject to any subsequent action based upon the recommendations of the audit report, we could be subject to significantly higher royalty payments and / or other penalties. Such an outcome or any other adverse outcome could result in a material adverse effect on our financial condition and results of operations.
Furthermore,
Our global presence exposes us to a number of jurisdictions in which regulations or laws have been or are being considered to limit or reduce emissions. The likely effect of these changes will be to increase the cost for fossil fuels, impose levies for emissions in excess of certain permitted levels and increased administrative costs for monitoring and reporting. Increasing regulation of greenhouse gas (GHG) emissions, including the progressive introduction of carbon emissions trading mechanisms and tighter emission reduction targets, is likely to raise costs and reduce demand growth. These regulations in the jurisdictions of our major customers and in relation to international shipping could also have an adverse effect on the demand for our products. Our smelting and mineral processing operations are energy intensive and depend heavily on fossil fuels. Increasing regulation of climate change issues such as greenhouse gas emissions, including the progressive introduction of carbon emissions trading mechanisms and tighter emission reduction targets, may raise energy costs and costs of production over the coming years.
Any failure to comply with applicable laws, regulations or recognized international standards, or to obtain or renew the necessary permits, approvals and leaseslicenses may result in the loss of the right to operate our facilities or continue our operations, the imposition of significant administrative liabilities, or costly compliance procedures, or other enforcement measures that could have the effect of closing or limiting production from our operations. If we were to fail to meet environmental requirements or to have a major accident or disaster, we may also be subject to administrative, civil and criminal proceedings by governmental authorities, as well as civil proceedings by environmental groups and other individuals, which could result in substantial fines, penalties and damages against us, as well as subject to orders that could limit or halt or even cause closure of our operations, any of which could have a material adverse effect on our business, financial condition and results of operations and financial condition.operations.
For example, in March 2013, the Tamil Nadu Pollution Control Board (“TNPCB”) ordered the closure of the copper smelter at Tuticorin due to complaints regarding a noxious gas leak by local residents. We filed a petition in theThe National Green Tribunal challenging the order of the TNPCB. The National Green Tribunalthereafter passed an interim order in May 2013 allowing the copper smelter to recommence operations subject to certain conditions. Weconditions, and we recommenced operations onin June 16, 2013. We have implemented all the recommendations during fiscal year 2013. However, the TNPCB filed a notice of appeal against the orders of the National Green Tribunal. The appeals areTribunal, which is currently pending before the Green bench of the Supreme Court of India. In addition, the expansion of the alumina refinery at Lanjigarh has been on hold since October 2010 because the environmental approval has been withheld by the MoEF. On November 20, 2015, the MOEFMoEF granted environmental clearance for the expansion of the Alumina Refinery up to 4 MTPAmtpa and ECenvironmental clearance up to 6 MTPAmtpa will be received as an amendment to existing EC after the completion of the land acquisition of the balance area of 666.03 HA. Further, Consentconsent to Establishestablish for 6 MTPA4 mtpa and Consentconsent to operate 2 MTPAmtpa has also been obtained. However the environmental clearance for the expansion of Alumina Refinery at Lanjigarh was challenged by an individual Prafulla Samantra before the National Green Tribunal, wherein MoEF, Orissa State Pollution Control Board and Vedanta Limited have been made parties. We filed our response to challenge and the matter is listed for hearing on September 12, 2017. In addition, another individual has filed an interlocutory application to be impleaded in the matter before National Green Tribunal, Kolkata. See “Item 8. Financial Information— A. Consolidated Statements and Other Financial Information— Legal Proceedings.” for further details.
Any prolonged closure of our operations could have a material adverse effect on our businesses, results of operations, financial condition or prospects or may result in the recognition of an impairment of our assets.
We are exposed to the political, economic, legal, regulatory and social risks of the countries in which we operate
We are exposed to the political, economic, legal, regulatory and social risks of the countries in which we operate or intend to operate. These risks potentially include expropriation and nationalization of property, instability in political, economic or financial systems, uncertainty arising from underdeveloped legal and regulatory systems, corruption, civil strife or labor unrest, acts of war, armed conflict, terrorism, outbreaks of infectious diseases, prohibitions, limitations or price controls on hydrocarbon exports and limitations or the imposition of tariffs or duties on imports of certain goods. Countries in which we have operations or intend to have operations have transportation, telecommunications and financial services infrastructures that may present logistical challenges not associated with doing business in more developed locales. Furthermore, we may have difficulty in ascertaining our legal obligations and enforcing any rights that we may have.
For example, under the terms of the shareholders’ agreement between the GoI and us, we were granted two call options to acquire all the shares in HZL held by the GoI at the time of exercise. We exercised the first call option on August 29, 2003. The GoI has disputed and refused to act upon the second call option. Also, GoI has disputed our exercise of the call option to purchase the remaining ownership interest of the GoI in BALCO. See “Item 4. Information on the Company—B. Business Overview—Our Business—Options to Increase Interests in HZL and BALCO.”
Further, during fiscal year 2015, the Audit CommitteeBoard of Directors was made aware that charges have been filed against several persons unconnected with the Group and one employee of Cairn India Limited who was previously arrested and subsequently released, for alleged possession and access to government information. Cairn India Limited has not been named in the charges. Cairn India Limited has in place a comprehensive compliance program and controls,controls. Further, on an annual basis all directors and employees including senior management of Cairn India Limited provide affirmation of compliance of the code of business ethics adopted by the Company. Cairn India Limited also regularly undertakes review of its controls.
Political, legal, economic and commercial instability or community disputes in the countries and territories in which we operate could affect our operations. Some of our current and potential operations are located in or near communities that may regard such operations as having a detrimental effect on their environmental, economic or social circumstances.
The continued success of our existing operations and future projects are in part dependent upon maintaining broad support and a healthy relationship with the respective local communities. Failure to identify and manage local concerns and expectations can give rise to disputes or have a negative impact on relations with local communities, and therefore affect our business and reputation.
Any such disputes or issues could have a material adverse impact on our cost, profitability, and ability to finance our operations. Such events could lead to disputes with national or local governments or with local communities and give rise to negative publicity. If our operations are delayed or shut down as a result of political and community instability, our revenue growth may be constrained and the long-term value of our business could be adversely impacted. Once we establish operations in a particular country, it may be expensive and logistically difficult to discontinue such operations should economic, political, physical or other conditions deteriorate subsequently. All of these factors could have a material adverse effect on our business, results of operations, financial condition or prospects.
Material changes in the regulations that govern our businesses, or the interpretation of recent legislation, could have a material adverse effect on our business, financial condition and result of operations
Mining in India is subject to a complex and comprehensive set of laws and regulatory requirements. See “Business“Item 5. Operating and Financial Review and Prospects — Indian Regulatory Matters — Mining Laws”Laws.” These laws and regulatory requirements are subject to change. If we are affected, directly or indirectly, by the application or interpretation of any such statute, enforcement proceedings initiated under it, it may have a material adverse effect on our business, financial condition and result of operations.
The new Mines and Minerals (Development and Regulations) Amendment Act, 2015 (“MMDRA Amendment Act”), notified towards the end of fiscal year 2015, brings greater transparency in the granting of mineral concessions through ane-auction process. It also removes certain uncertainties relating to automatic renewals of mine leases for future periods. However for existing mining leases, itthe MMDRA Amendment Act notifies an amount not exceeding royalty, to be contributed to the District Mineral Foundation (“DMF”) for the benefit of people affected by mining and an additional 2% of royalties to the National Mineral Exploration Trust. In September 2015, the GoI notified that an amount equal to 30% of royalty fees is required to be deposited incontributed to the DMF contribution for the benefit of the people andin the area affected by mining. It can potentially impact mining of low grade and deep ore bodies which will not be conducive to growth of mining in the country.
In addition, our oil and gas business is also subject to complex and comprehensive regulations in India Sri Lanka and South Africa. For example, upon the expiry of oil and gas licenses in India, contractors are generally required under the terms of relevant licenses or local law to conduct decommissioning or abandonment activities with regard to the equipment, and wells and generally make good production sites. There can be no assurance that we will not in the future incur decommissioning charges in excess of those currently provided for, since local or national governments may require decommissioning to be carried out in circumstances where there is no express obligation to do so, particularly in case of future oil and gas license renewals.
The provisions of Chapter X-A (sections 95 to 102) of the Income Tax Act, 1961, relating to General Anti-Avoidance Rules (“GAAR”) are applicable with effect from assessment year 2019 (fiscal 2018). The GAAR provisions propose to identify any arrangement with the primary purpose or one of the main purposes of such arrangement is to obtain a tax benefit, and satisfies at least one of the following tests (i) creates rights, or obligations, which are not ordinarily created between persons dealing at arm’s length; (ii) results, directly or indirectly, in misuse, or abuse, of the provisions of the Income Tax Act, 1961; (iii) lacks commercial substance or is deemed to lack commercial substance in whole or in part; or (iv) is entered into, or carried out, by means, or in a manner, that is not ordinarily engaged for bona fide purposes. If GAAR provisions are invoked, the tax authorities will have wider powers, including denial of tax benefit or a benefit under a tax treaty. In the absence of any precedents on the subject, the impact of the application of these provisions is uncertain.
The costs, liabilities and requirements associated with complying with existing and future laws and regulations may also be substantial and time-consuming and may delay the commencement or continuation of oil and gas exploration or metal mining and production activities. This and any changes to the regulations could require changes to the manner in which we conduct our business and result in an increase in compliance costs, which could have a material adverse effect on our business, financial condition and results of operation.operations.
We have significant asset concentration risks, and any interruption in the operations at those assets could have a material adverse effect on our business, financial condition and results of operations and financial condition
Our results of operations have been and are expected to continue to be substantially dependent on the reserves, production and the cost of production at certain of our key assets, and any interruption in the operations, exploration and development activities at those assets for any reason could have a material adverse effect on our business, financial condition and results of operations and financial condition.operations. For example, the Rajasthan block produced 93.4%85.1% of our average daily net operated production from our oil and gas business in fiscal year 20162017 and oil and gas from the Rajasthan block constituted 95.7%94.4% of our net aggregate proved oil and gas reserves on a barrel of oil equivalent basis as of March 31, 2016.2017. Our ongoing capital expenditure program has focused on development and exploration activities across all the assets with approximately 94%78.9% of the capital expenditure for fiscal year 20162017 having been invested in the Rajasthan block.
Further, our Rampura Agucha zinc mine produced 73.3%75.1% of the total mined zinc metal in concentrate that we produced in fiscal year 20162017 and constituted 47.7%45.6% of our total proven and probable zinc ore reserves as of March 31, 20162017 in India. Furthermore, the Codli mine in Goa constituted 12.4%10.6% of our proved and probable iron ore reserves in India as of March 31, 2016.2017. Suspension of mining activities in Goa materially affected our operations and any future interruptions in the operations of these mines could have a material adverse effect on our results of operations and financial condition. For example, our total iron ore production declined from 13.8 mmt in fiscal year 2012 to 0.6 mmt in fiscal year 2015 due to the suspension imposed by the state government of Goa on the mining activities in the state of Goa. The ban has now been lifted and mining has commenced in all major mines. Any such suspension of mining operations from these mines could have a material adverse effect on our results of business, financial condition, results of operations and prospects.
Our business requires substantial capital expenditures and the dedication of management and other resources to maintain ongoing operations and to grow our business through projects, expansions and acquisitions, which projects, expansions and acquisitions are subject to additional risks that could adversely affect our business, financial condition and results of operations
Capital requirements.We require capital for, among other purposes, expanding our operations, making acquisitions, managing acquired assets, acquiring new equipment, maintaining the condition of our existing equipment and maintaining compliance with environmental laws and regulations. To the extent that cash generated internally and cash available under our existing credit facilities are not sufficient to fund our capital requirements, we will require additional debt or equity financing, which may not be available on favorable terms, or at all. Future debt financing, if available, may result in increased finance charges, increased financial leverage, and decreased income available to fund further acquisitions and expansions and the imposition of restrictive covenants on our business and operations. In addition, future debt financing may limit our ability to withstand competitive pressures and render us more vulnerable to economic downturns. If we fail to generate or obtain sufficient additional capital in the future, we could be forced to reduce or delay capital expenditures, sell assets or restructure or refinance our indebtedness.
In lightOil and gas exploration activities are capital intensive and inherently uncertain in their outcome. We or the operators of this, our plannedassets in which we have an interest may undertake exploration activities and any proposed future expansions and projects may be materially and adversely affected if we are unable to obtain funding forincur significant costs in so doing with no assurance that such capital expenditures on satisfactory terms, or at all, including as aexpenditure will result in the discovery of any of our existing facilities becoming repayable before its due date. hydrocarbons in commercially viable quantities.
In addition, there can be no assurance that our planned or any proposed future expansions and projects will be completed on time or within budget, which may adversely affect our cash flow.
Demands on management. Our efforts to continue our growth will place significant demands on our management and other resources and we will be required to continue to improve operational, financial and other internal controls, both in India and elsewhere. Our ability to maintain and grow our existing business and integrate new businesses will depend on our ability to maintain the necessary management resources and on our ability to attract, train and retain personnel with skills that enable us to keep pace with growing demands and evolving industry standards.
We are, in particular, dependent to a large degree, on the continued service and performance of our senior management team and other key team members in our business units. These key personnel possess technical and business capabilities that are difficult to replace. The loss or diminution in the services of members of our senior management or other key team members, or our failure to maintain the necessary management and other resources could have a material adverse effect on our results of operations, financial condition and prospects. In addition, as our business develops and expands, we believe that our future success will depend on our ability to attract and retain highly skilled and qualified personnel, which is not guaranteed.
Acquisition risks. As part of our growth strategy, we intend to continue to pursue acquisitions to expand our business. There can be no assurance that we will be able to identify suitable acquisition, strategic investment or joint venture opportunities, obtain the financing necessary to complete and support such acquisitions or investments, integrate such businesses or investments, satisfy regulatory requirements for such acquisitions or that any business acquired will be profitable. If we attempt to acquirenon-Indian companies, we may not be able to satisfy certain Indian regulatory requirements for such acquisitions and may need to obtain the prior approval of the RBI which we may not be able to obtain. The funding of such acquisitions by us may require certain approvals from regulatory authorities in India. In addition, acquisitions and investments involve a number of risks, including possible adverse effects on our operating results, diversion of management’s attention, failure to retain key personnel, risks associated with unanticipated events or liabilities and difficulties in the assimilation of the operations, technologies, systems, services and products of the acquired businesses or investments. Any failure to achieve successful integration of such acquisitions or investments could have a material adverse effect on our business, financial condition and results of operations or financial condition.operations.
If our planned expansions and new projects are delayed, or if we experience cost overruns in our projects, our business, financial condition and results of operation and financial conditionoperations may be materially and adversely affected
We have in recent years initiated significant expansion plans for our existing operations and planned greenfield projects, which involve significant capital expenditure. Although several of these initiatives have been completed, work remains to be completed in some of these projects. The timing, implementation and cost of such expansion are subject to a number of risks, including the failure to obtain necessary leases, licenses, permits, consents and approvals, or funding for the expansion. We do not currently have all of the leases, licenses, permits, consents and approvals that are or will be required for our planned expansion and new projects. There can be no assurance that we will be able to obtain or renew all necessary leases, licenses, permits, consents and approvals in a timely manner.
For example, a writ petition was filed at the High Court of Madras challenging the grant of an environmental clearance for the expansion of our copper smelting unit at Tuticorin.Tuticorin, which was dismissed by the High Court of Madras through its order dated April 28, 2016. Further, the expansion of our alumina refinery at Lanjigarh has been on hold since October 2010 because the environmental approval was renderednon-operational by the MoEF. On November 20, 2015, the MOEFMoEF granted environmental clearance for the expansion of the Alumina Refinery fromfor up to 4 MTPAmtpa and EC up to 6 MTPAmtpa will be received as an amendment to existing EC after the completion of the land acquisition of the balance area of 666.03 HA. Further, Consentconsent to Establishestablish for 6 MTPA4 mtpa and Consentconsent to operate 2 MTPAmtpa has also been obtained. However the environmental clearance for the expansion of the Alumina Refinery at Lanjigarh was challenged by an individual, Prafulla Samantra, before the National Green Tribunal, where the MoEF, the Orissa State Pollution Control Board and Vedanta Limited have been made parties. We filed our response to challenge and the matter is listed for hearing on September 12, 2017. In addition, another individual has filed an interlocutory application to be impleaded in the matter before National Green Tribunal , Kolkata. See “Item 8. Financial Information— A. Consolidated Statements and Other Financial Information— Legal Proceedings.” for further details..details.
Moreover we are currently undertaking exploration programs in our Rajasthan and other oil blocks and any delays in this exploration program or shortfall in achieving the necessary output levels could materially and adversely affect our operationsbusiness, financial condition and financial condition.results of operations.
In fiscal year 2013, we announced an expansion of ourzinc-lead mines capacity to 1.2 MTPAmtpa in a phased manner until fiscal year 2019 in our Zinc India business. This will involve sinking of underground shafts and developing underground mines. Benefits from these growth projects started in fiscal year 2016, even though project activities will continue until fiscal year 2019. Annual capital expenditure towards these projects is expected to be approximately $ 250 million. Any delays in the execution of the expansion plans or any shortfall in achievement of the expansion objectives may adversely affect our business, financial condition and results of operations.
Furthermore, the GoI is contemplating a proposal to demarcate certain forest areas in India, based on the permissibility of using such land for mining purposes. The identification of designated areas where mining activities will, or will not, be permitted will be based on mapping forest and coal reserves as well as field-level studies. While this proposal remains in discussion, the MoEF has denied the grant of environmental and forest diversion clearances applied for in certain areas identified as restricted areas. In the event the proposal is implemented, our current and any future mining activities and related expansion plans and new projects may be affected, which would adversely affect our business prospects and results of operations or otherwise hinder our borrowing capabilities.
Any delay in completing planned expansions, revocation of existing clearances, failure to obtain or renew regulatory approvals,non-compliance with applicable regulations or conditions stipulated in the approvals obtained, suspension of current projects, or cost overruns or operational difficulties once the projects are commissioned may have a material adverse effect on our business, results of operations or financial condition. Further, our decision to undertake or continue any of these projects will be based on assumptions of future demand for our products which may not materialize. As a consequence of project delays, cost overruns, changes in demand for our products and other reasons, we may not achieve the reductions in the cost of production or other economic benefits expected from these projects, which could adversely affect our business, financial condition and results of operations.
If we are unable to secure additional reserves of oil and gas, zinc, copper, iron ore and bauxite that can be extracted at competitive costs or cannot extract existing reserves at competitive costs, our profitability and operating margins could decline
If our existing oil and gas, zinc, copper, iron ore and bauxite reserves cannot be extracted at competitive costs or if we cannot secure additional reserves that can be extracted at competitive costs, we may become more dependent upon third parties for the metal ore, or our production volumes will decline. As our reserves decline as we extract the mineral ore or crude oil, our future profitability and operating margins depend upon our ability to access reserves that have geological characteristics enabling extraction at competitive costs. Replacement reserves may not be available when required or, if available, may not be of a quality capable of being extracted at costs comparable to the existing or exhausted mines and fields.
We may not be able to accurately assess the geological characteristics of any reserves that we acquire, which may adversely affect our profitabilitybusiness, financial condition and financial condition.results of operation. Because the value of reserves is calculated based on that part of our mineral and oil and gas deposits that are economically and legally exploitable at the time of the reserve calculation, a decrease in commodity prices may result in a reduction in the value of any reserves that we obtain as less of the deposits contained therein would be economically exploitable at lower prices. For example, during fiscal year 2016, we recorded impairment charge on oil and gas assets of Rs. 322,998 million ($ 4,875.44, 980.7 million) mainly relating to the Rajasthan block, triggered by the significant fall in crude oil prices. Similarly, with a substantial reduction in iron ore prices we recorded an impairment of Rs. 14,900 million ($224.9229.8 million) in fiscal year 2016 for our Liberia assets.
Exhaustion of reserves at particular mines or oil fields may also have an adverse effect on our operating results that is disproportionate to the percentage of overall production represented by such mines or oil fields. Further, with depletion of reserves we will face higher unit extraction costs.
Our future production depends significantly upon our success in finding or acquiring and developing additional reserves, adopting and using the appropriate technology. If we are unsuccessful, we may not meet our production targets which could adversely affect our business, financial condition and results of operations and financial condition.operations.
Our ability to obtain additional reserves in the future could be limited by restrictions under our existing or future debt agreements, competition from other metal and oil and gas companies, lack of suitable acquisition candidates, government regulatory and licensing restrictions, difficulties in obtaining mining leases and surface rights or the inability to acquire such properties on commercially reasonable terms, or at all. To increase production from our existing mines or oil fields, we must apply for governmental and joint operation partner approvals, which we may not be able to obtain in a timely manner, or at all.
The results of appraising discoveries are uncertain, more so in our oil and gas business, which may result in reductions in projected reserves and production declines and may involve unprofitable efforts, not only from dry wells, but also from wells that are productive but uneconomic to develop. Appraisal and development activities may be subject to delays in obtaining governmental approvals or consents,shut-ins of connected wells, insufficient storage or transportation capacity or exhaustion and depletion of reserves or other geological and mechanical conditions all of which may result in a material increase of our costs of operations or delay anticipated revenues.
Our operations are subject to risks that could result in decreased production, increased cost of production and increased cost of or disruptions in transportation, power generation, mining and oil exploration
We are subject to operating conditions and events beyond our control that could, among other things, increase our mining, transportation or production costs, disrupt or halt operations at our mines and production facilities permanently or for varying lengths of time or interrupt the delivery of our products to our customers. The occurrence of any of these conditions or events could have a material adverse effect on our business, financial condition or results of operations. These conditions and events include:
| • | Disruptions in extraction and production due to equipment failures, unexpected maintenance problems and other interruptions. All of our operations are vulnerable to disruptions. |
Further, our oil processing facility in the northern fields of the Rajasthan block designed to separate oil, gas and water may not function as designed over the life of the fields. This may result in the crude oil not meeting exportsales specifications of pipelines which may mean that any such crude oil either cannot be sold or will be sold at a significant discount to the agreed crude oil sales price, which could have an adverse effect on our business, financial condition or results of operations.price.
| • | Availability of raw materials. Any shortage of or increase in the prices of any of the raw materials needed to satisfy our businesses’ requirements may interrupt our operations or increase our cost of production. We are particularly dependent on coal, which is used in many of our captive power plants. Our aluminium business, which has high energy consumption due to the energy-intensive nature of aluminium smelting, is significantly dependent on receiving allocations from Coal India Limited and its subsidiaries. |
We established our aluminium business in Odisha through an agreement with Orissa Mining Corporation Limited to establish an aluminium smelter and associated captive power plants in the Lanjigarh and Jharsuguda district in Odisha. A memorandum of understanding with the Government of Odisha (through Orissa Mining Corporation Limited) provides that the Government of Odisha would supply us 150 million tons of bauxite ore. During thefiscal year 2016, Orissa Mining Corporation has, by a separate action, terminated the joint venture agreement for which the Company is pursuing the appropriate course of action. The matter is pending with the OMC. However, the delay in obtaining captive bauxite supply as per the terms of memorandum of understanding has resulted in our Orissa aluminium business reporting losses since inception. Any further delays in securing assured bauxite supplies for our Orissa aluminium business could continue to adversely affect our business, financial condition and results of operations and financial condition.operations.
Further, we may not receive the coal block allocations that we expect or may not be allowed to use such allocations for our commercial power generation business. Any coal block allocations that we receive may not be sufficient for our planned operations and we may not be successful in procuring a sufficient supply of coal at economically attractive prices, or at all. Additionally, we are subject to certain restrictive covenants contained in the coal block allocation agreements including specified end use and submission of mining plans within a specified period.
Our oil processing facility in the northern fields of the Rajasthan block require reliable fuel supply for power generation and heating, to ensure the quality of our crude oil production. Currently, the fuel supply for power generation and heating requirements are being met through associated natural gas from the Mangala field, supplemented as required by natural gas from the Raageshwari Deep gas field. While the current gas supply is adequate to ensure a sufficient fuel supply, there is no guarantee that the current estimates of the future fuel requirements can be supplied from the gas associated with existing and future oil production, supplemented by gas supply from the Raageshwari Deep gas field. In such an event, an alternative energy source would need to be obtained, which could have a material adverse effect on our business, financial condition or results of operations.obtained.
| • | Availability of water. The mining operations of our zinc and aluminium businesses, production from our oil fields, smelter operations of copper business and our captive power plants depend upon the supply of a significant amount of water. Availability of water for our operations is dependent upon adequate rainfall in the catchment areas near our operations. There is no assurance that the water required will continue to be available in sufficient quantities or that the cost of water will not increase. For example, BALCO is currently in a dispute with the National Thermal Power Corporation Limited regarding the right of way for a water pipeline that provides one of BALCO’s captive power plants access to a body of water adjacent to the National Thermal Power Corporation Limited’s premises. An unfavorable decision in this dispute may significantly increase BALCO’s costs of obtaining water for our power plant. However, the Company has a water supply agreement valid for 30 years from July 29, 2011 for 13 million cubic meters for 540 MW and on December 22, 2015 the Company entered into a new water contract valid for |
We inject hot water to maintain reservoir pressure and to optimize crude oil recovery at the Mangala, Bhagyam and Aishwariya oil fields. The source water for these fields is, and will continue to be provided from water production wells drilled in the Thumbli saline aquifer in the Barmer Basin. Extraction of saline water also requires the approval of the relevant government authorities. There can be no assurance that the estimated impact of the expected water extraction fromon the flow of groundwater is accurate. A failure to extract the required amount of water during the life of the existing and currently planned developments or an inaccurate prediction of the impact on the flow of groundwater, or delay or cancellation of the approval from the government authorities to extract saline water, may require us to access alternative sources of water. Although the relevant government authority has given its consent for the extraction of saline groundwater from Thumbli, it is possible that we will be perceived to be directly or indirectly responsible for any shortage of fresh water or deterioration in water quality. In such an event, the local authorities may require us to access alternative water sources or holding us responsible for any contamination of the fresh water supply by saline groundwater from the aquifer which would have a material adverse effect on our business, financial condition or results of operations.aquifer.
| • | Disruptions to or increased costs of transport services. We depend upon seaborne freight, inland water transport, rail, trucking, overland conveyor and other systems to transport bauxite, alumina, zinc concentrate, copper concentrate, coal and other supplies to our operations and to deliver our products to customers. |
| • | Inadequate plant operating and maintenance procedures. We have in place operating and maintenance procedures to maintain the integrity of our production facilities. However, there is a risk of unplanned events, inadequate application of these procedures or higher levels of corrosion than expected which could cause disruption to |
| • | Dependence on third parties. We depend on third parties for the construction, delivery and commissioning of the power facilities, supply and testing of equipment and transmission and distribution of electricity that we generate, which is beyond our control. For instance, the external contractors may not be able to complete construction and installation on time, within budget, or to the specifications set forth in our contracts with them, or the contractors may otherwise cause delays in meeting project milestones or achieving commercial operation by the scheduled completion date, which could in turn cause forecast budgets to be exceeded or result in delayed payment by customers, invoke liquidated damages, penalty clauses or performance guarantees or result in termination of contracts. See “Item 8. Financial Information—A. Consolidated Statements and Other Financial Information—Legal Proceedings- Proceedings against TSPL relating to its delay in commissioning various units of the power plant.” In addition, the demand for contractors with specialist design, engineering and project management skills and services has increased, resulting in a shortage of contractors and increasing costs of services. There can be no assurance that such skilled and experienced contractors will continue to be available at reasonable rates and we may be exposed to risks relating to the cost and quality of their services, equipment and supplies. |
| • | Power purchase agreements. The power purchase agreements and other agreements that we have entered into, or may enter into may require us to guarantee certain minimum performance standards, such as plant availability and generation capacity, to the power purchasers. If our facilities do not meet the required performance standards, the power purchasers with whom we have power purchase agreements may not reimburse us for any increased costs arising as a result of our plants’ failure to operate within the agreed |
| • | Power transmission. Lack of strong power transmission infrastructure |
| • | Regulatory compliance. Power generation in India is a regulated industry. In particular, national and state regulatory bodies and other statutory and government mandated authorities may, from time to time, impose minimum performance standards upon us. Failure to meet these requirements could expose us to the risk of penalties, including, in certain instances, plant shut downs. |
| • | Flow assurance concerns of crude oil. The waxy nature of crude oil at the northern fields of the Rajasthan block requires us to use hot water injection as the recovery technique at these fields. Injection of hot water requires that the temperature of the water is maintained at a certain level to ensure that the temperature of the crude oil is not reduced by the water used in the injection process to the point where solidification may occur. If the temperature of the injection water is not maintained at the required level, the required injection rate may not be able to be maintained, therefore the overall field production rate and ultimate recovery may be adversely impacted. Further, the waxy nature of crude oil requires that the temperature of crude oil transported through the 24 inch insulated oil pipeline and connecting spur lines should be kept at a temperature greater than the temperature of crude oil. Maintaining the temperature of the crude oil above this wax appearance temperature has required the installation of a specialized heating system and heating stations at various points along the pipeline. If the specialized heating system does not perform as expected, or there are problems associated with the performance of the heating stations, there are problems supplying fuel to the power generation systems at these heating stations; the temperature of crude oil may not be maintained, which would have an adverse impact on the rate at which oil can be transported through the pipeline. Any reduction in the crude oil production, ultimate recovery, or in the oil transportation may have a material adverse effect on our business, financial condition or results of operations. |
| • | Tailings dam failure. A release of waste material from tailings dams of any of our production facilities may lead to loss of life, injuries, environmental damage, reputational damage, financial costs and production impacts. Tailings dam failure is considered to be a catastrophic risk, which is a very high severity but very low frequency event that must be treated with the highest priority. |
| • | Accidents at mines, oil fields, smelters, refineries, oil processing terminals, cargo terminals and related facilities. Any accidents or explosions causing personal injury, property damage or environmental damage at or to our mines, oil fields, smelters, refineries, oil processing terminals, cargo terminals and related facilities may result in expensive litigation, imposition of penalties and sanctions or suspension or revocation of permits and licenses. Risks associated with ouropen-pit mining operations include flooding of theopen-pit and collapses of theopen-pit wall. Risks associated with our underground mining operations include underground fires and explosions (including those caused by flammable gas),cave-ins or ground falls, discharges of gases or toxic chemicals, flooding, sinkhole formation and ground subsidence. Injuries to and deaths of workers at our mines and facilities have occurred in the past and may occur in the future. For example, the production of Skorpion Zinc was stopped for 23 days in January 2015 due to a fire accident in the cell house. We are required by law to compensate employees for work-related injuries and failure to make adequate provisions for our workers’ compensation liabilities could harm our future operating results. |
Furthermore, oil and gas exploration and production operations by us or operators of assets in which we have an interest will involve risks normally incidental to such activities, including blowouts, oil spills, gas leaks, explosions, fires, equipment damage or failure, natural disasters, geological uncertainties, unusual or unexpected rock formations and abnormal pressures. Offshore operations are also subject to natural disasters as well as to hazards inherent in marine operations and damage to pipelines, platforms, facilities andsub-sea facilities from trawlers, anchors and vessels. Our producing fields are located in areas that can be subject to extreme weather conditions, flooding, fire, theft, earthquake and other natural disasters. Additionally, we or the operators of assets in which we have an interest may face interruptions or delays in the availability of oil field services, equipment or infrastructure, including seismic survey vessels, rigs, pipelines and storage tanks, on which oil and gas exploration and production activities are dependent.
| • | Strikes and industrial actions or disputes. The majority of the total workforce of our consolidated group of companies is unionized. Strikes and industrial actions or disputes have in the past and may in the future lead to business interruptions and halts in production. |
The occurrence of any one or more of these conditions or events could have a material adverse effect on our business, financial condition or results of operations.
We are exposed to competitive pressures in our various business segments in which we operate which could result in lower prices or sales volumes of the products we produce, which may cause our profitability to suffer
The mines and minerals, commercial power generation, and oil and gas industries are highly competitive. We continue to compete with other industry participants in the search for and acquisition of mineral and oil and gas assets and licenses. Competitors include companies with, in many cases, greater financial resources, local contacts, staff and facilities than ours. Competition for exploration and production licenses as well as for other investment or acquisition opportunities may increase in the future. This may lead to increased costs in the carrying out of our activities, reduced available growth opportunities and may have a material adverse effect on our businesses, financial condition, results of operations and prospects.
We depend upon third parties for supply of a portion of our raw material requirements, for the continuance of certain iron ore mining leases, and for execution of our projects and supply of equipment and services, as well as for offtake of our production volumes
We source a majority of our copper concentrate and a portion of alumina requirements from third parties. For example, in fiscal year 2016,2017, we sourced approximately 100%97.5% of our copper concentrate and 47%53.9% of our alumina requirements from third parties. Profitability and operating margins of our copper and aluminium business depends on the ability of the suppliers to ensure timely delivery of the contracted volumes. Also, profitability and operating margins of our aluminium business depends upon our ability to obtain the required alumina at prices that are low relative to the market prices of aluminium products that we sell and our ability to source these raw materials at a reasonable price.
We are operating our Sonshi iron ore mine that is leased by the state of Goa to third parties through an ore raising arrangement. Under the contract, we, as a contractor, are responsible for extracting the ore, which we then purchase back from the relevant third party owners. During fiscal year 2016,2017, approximately 0.21.4 mmt of our crude iron ore production (or approximately 3.915.3% % of our iron ore production) was derived from our operation of third party mines. As part of our contract arrangements, we generally pay such third party owners a purchase price per ton of iron ore, which is linked to the market price of iron ore. This contract expired on March 31, 2015 and was renewed for period of two years. However, there is no assurance that the third party mine owners will further renew our contract on the same or otherwise favorable terms, or at all. There is also no assurance that, where such mine is owned by a third party under a lease, the third party will apply for a renewal of such lease in a timely fashion prior to its expiry, or be successful in obtaining such renewals. Any failure to renew material contracts or significant increases in royalty payments may adversely affect our business, financial condition, results of operations and prospects.
Further, in common with many exploration and production companies, we and the operators of assets often contract or lease services and equipment from third party providers. Such services and equipment can be scarce and may not be readily available at the times and places required. In addition, the costs of third party services and equipment have increased significantly over recent years and may continue to rise. Scarcity of services and equipment and increased prices may in particular result from any significant increase in regional exploration and development activities, which in turn may be the consequence of increased or continued high hydrocarbon or mineral prices. The scarcity of such services and equipment, as well as their potentially high costs, could delay, restrict or lower the profitability and viability of projects which may have a material adverse effect on our businesses, prospects, financial condition or results of operations.
In our oil and gas business, we had infrastructure and oil sales agreements with the GoI nominated public sector refineries and domestic private sector refineries for expected levels of crude oil production from the Rajasthan block until March 2016.2018. Stoppage ofoff-take or supply could result if the buyers fail to take delivery of volumes anticipated by these sales agreements. Additionally, two private sector buyers accounted for approximately 78.2%69.4% of the total sales of Rajasthan block in fiscal year 20162017 and any unforeseen disruption at these buyer’s facilities would affect sales volume and therefore revenue generation. Further, we are subject to the risk of delayed off takes or payment for delivered production volumes or counterparty default. Any of these could have an adverse impact on our crude oil sales and cash flows.
In certain cases, the relevant counterparty, either legally or as a result of geographic, infrastructure or other constraints or factors, is in practice the sole potential purchaser of the relevant production output. This is particularly the case for sales of gas which relies on the availability or construction of transmission and other infrastructure facilities, enabling the supply of gas produced to be supplied to end users. The absence of competitors for the transmission or purchase of gas produced by us may expose us to offtake and production delays, adverse pricing or other contractual terms or may restrict the availability of transmission or other necessary infrastructure.
Such delays or defaults or adverse pricing or other adverse contractual terms or restricted infrastructure availability could have a material adverse effect on our business, financial condition orand results of operations.
Defects in title or loss of any leasehold interests in our properties could limit our ability to conduct operations on such properties or result in significant unanticipated costs
Our ability to mine the land on which we have been granted mining lease rights and to make use of our other industrial and office premises is dependent on the acquisition of surface rights. Surface rights and title to land are required to be negotiated separately with land owners, although there is no guarantee that these rights will be granted. Any delay outside of the ordinary course of business in obtaining or inability to obtain or any challenge to the title or leasehold rights to surface rights could negatively affect our business, financial condition or results of operations.
In addition, there may be certain irregularities in title in relation to some of our owned and leased properties. For example, some of the agreements for such arrangements may not have been duly executed and/or adequately stamped or registered in the land records of the local authorities or the lease deeds may have expired and not yet been renewed. Since registration of land title in India is not centralized and has not been fully computerized, the title to land may be defective as a result of a failure on our part, or on the part of a prior transferee, to obtain the consent of all such persons or duly complete stamping and registration requirements. The uncertainty of title to land may impede the process of acquisition, independent verification and transfer of title, and any disputes in respect of land title that we may become party to may take several years and considerable expense to resolve if they become the subject of Court proceedings. Further, certain of these properties may not have been constructed or developed in accordance with local planning and building laws and other statutory requirements, or it may be alleged that such irregularities exist in the construction and development of our built up properties. For example BALCO has 1,804.67 acres of government land out of which 1,751 acres is situated in forest land which was given on lease by the state government. The lease deed has not been executed as on date as a petition was filed in the Supreme Court against BALCO in relation to the alleged encroachment of land on which our Korba smelter is situated. Any such dispute, proceedings or irregularities may have an impact on our business, financial condition orand results of operations.
Third party interests in our subsidiary companies, restrictions due to stock exchange listings of our subsidiary companies as well as third party interest in assets of our subsidiary companies will restrict our ability to deal freely with our subsidiaries or such assets of our subsidiary companies, which may have a material adverse effect on our results of operations and financial condition
We do not wholly own all of our operating subsidiaries, although we hold the majority of the total outstanding share capital in all of our subsidiaries. Although we have direct or indirect management control of HZL, BALCO and Black Mountain Mining, and Cairn India, each of these companies has other shareholders who, in some cases, hold substantial interests. As a result of thenon-controlling interests in our subsidiaries and affiliates and the Indian stock exchanges listings of HZL, and Cairn India, these subsidiaries may be subject to additional legal or regulatory requirements, or we may be prevented from taking certain courses of action without the prior approval of a particular or a specified percentage of shareholders and/or regulatory bodies (under shareholders’ agreements, relationship agreements or by operation of law). The existence of minority or other interests in, and stock exchange listings of our subsidiaries may limit our ability to increase our equity interests in these subsidiaries, combine similar operations, utilize synergies that may exist between the operations of different subsidiaries, move funds among the different parts of our businesses or reorganize the structure of our business in a tax efficient manner, which may have a material adverse effect on our business, financial condition or results of operations.
ONGC is our joint operation partner with respect to all operating assets of our oil and gas business, and we operate all of our oil and gas assets. Accordingly, any mismanagement of an oil and gas asset by us may give rise to liabilities to our joint operation partners in respect of such asset. There is also a risk that other parties with interests in our assets may elect not to participate in certain activities relating to those assets which require such party’s consent. In such circumstances, it may not be possible for such activities to be undertaken by us alone or in conjunction with other participants at the desired time or at all. In addition, other joint operation partners may default in their obligations to fund capital or other funding obligations in relation to the assets. In certain circumstances, we may be required under the terms of the relevant operating agreement to contribute all or part of any such funding shortfall, which could adversely impact our business, financial condition or results of operations.
Proceedings against the GoI which has disputed our exercise of the call option to purchase its remaining ownership interest in BALCO
There are certain proceedings that are currently ongoing with respect to the exercise of a call option to acquire the remaining shares of BALCO held by the GoI, in accordance with the terms of the shareholders’ agreement between the GoI and us. The amount claimed under this proceeding is presently unquantifiable. The arbitration tribunal formed under the directions of the High Court of Delhi declared an award rejecting our claim regarding the exercise of the option on January 22, 2011. According to the award, certain clauses of the shareholders’ agreement were held to be void, ineffective and inoperative as being in violation of sub section (2) of Section 111A of the Companies Act, 1956. We filed an application before the High Court of Delhi to set aside this award under Section 34 of the Arbitration and Conciliation Act, 1996. Our application is scheduled for hearing on November 4, 2016.October 17, 2017. See “Item 4. Information on the Company—B. Business Overview—Our Business—Options to Increase Interests in HZL and BALCO.” There is no assurance that the outcome of our challenge of the award will be favorable to us. In such an event, we may be unable to purchase the GoI’s remaining 49.0% interest in BALCO or may be required to pay a higher purchase price, should it decide to consummate such purchase, which may have a material adverse effect on our business, financial condition and results of operations and financial condition.operations.
Proceedings against the GoI which has disputed our exercise of the call option to purchase its remaining ownership interest in HZL
We commenced arbitration proceedings against the GoI with respect to exercise of our call option to acquire the remaining shares of HZL held by the GoI, in accordance with the terms of the shareholders’ agreement between the GoI and us. The GoI denied our right to exercise the option on the basis that the shareholders’ agreement contravenes the provisions of Section 111A of the Companies Act, 1956 and is therefore void. The next date of hearing by the arbitral tribunal is on August 20, 2016.April 21, 2018 See “Item 4. Information on the Company—B. Business Overview—Our Business—Options to Increase Interests in HZL and BALCO.” There can be no assurance that the arbitral proceedings will result in a favorable outcome for us. In such an event, we may be delayed in the purchase of, or may be unable to purchase, the GoI’s remaining 29.5% interest in HZL or may be required to pay a purchase price in excess of the market value or fair value of those shares, which may have a material adverse effect on our business, financial condition and results of operations and financial condition.operations.
Future production from our assets may vary from the forecast
We estimate the annual metal production and the mine life through a detailed mine plan for both open pit and underground mines and the oil and gas production rates and field life through the field development plans. These mine plans and field development plans are prepared based on our estimates of future mine and field performance. Future performance is subject to a number of risks including but not limited to geological conditions being more complex than originally predicted, ore grade being different from estimates, future producer or injector well performance, plant operating efficiencies being less than originally forecast,forecasted, inadequate power, water or utility supplies, and other constraints. Our zinc and lead mining operations in Indiaat Rampura Agucha are currently transitioning from open pit mining operations to underground mining operations. Difficulties in managing this transition may result in challenges in achieving stated business milestones. Any material fall in production from the current production level or from the estimates due to some or all of the risks detailed above may adversely impact our business, financial condition or results of operations.
In our oil and gas business plateau production rates from the Rajasthan block may be less than forecast. The estimates of production rates and field life contained in the field development plans for the Mangala, Bhagyam, Aishwariya, Raageshwari and Saraswati fields in the Rajasthan block are based on our estimates of future field performance. Where any estimates of future production rates are in excess of the existing approved field plateau production rates in the case of our oil and gas business, the consent of the joint operation partner, the appropriate regulatory authorities and the GoI will be required before any of our oil fields can produce at these enhanced estimates of future production rates. In the event consent of the joint operation partner is delayed or not obtained, production would be limited to the rate set out in the field development plans, which would have a detrimental impact on our business, financial condition or results of operations.
If we do not continue to invest in new technologies and equipment, our technologies and equipment may become obsolete and our cost of production may increase relative to our competitors, or such implemented technologies might not achieve the objective, which would have a material adverse effect on our results of operations, financial condition and prospects
Our profitability and competitiveness are in large part dependent upon our ability to maintain a low cost of production as we sell commodity products with prices we are unable to influence. Unless we continue to invest in newer technologies and equipment and are successful at integrating such newer technologies and equipment to make our operations more efficient, our cost of production relative to our competitors may increase and we may cease to be profitable or competitive. Newer technologies and equipment are expensive and the necessary investments may be substantial. Moreover, such investments entail additional risks including whether they will reduce our cost of production sufficiently to justify the capital expenditures to obtain them, or whether they will result in achieving the objective of using such technology.
For example, the field development plans for the northern fields of the Rajasthan block assume the use of enhanced oil recovery techniques to extract an additional incremental percentage of the estimated oil in place in the reservoirs. Enhanced oil recovery screening studies of these northern fields have concluded that polymer flooding or alkaline surfactant polymer flooding, two common enhanced oil recovery techniques, are the preferred enhanced oil recovery options. Following a successful enhanced oil recovery polymer flood pilot at Mangala, a field development plan for full field application of polymer flood in the Mangala field is currently under advanced stages of implementation. In terms of scale, the project is one of the largest of its kind across the globe. Risks associated with the project include inadequate processing of produced fluids thereby impacting performance of surface facilities and continuous sourcing of polymer for ongoing operations.
Further, if we fail to maintain the polymer at the correct temperature in the reservoir, it may degrade and not function properly, thereby reducing the incremental amount of crude oil that is expected to be recovered. There is also a risk that the polymer handling facilities at the surface may perform at lower efficiency than designed, which may lead to degradation of the polymer and ultimately its higher consumption. All these factors could have a material and adverse effect on our business, financial condition orand results of operations.
The use of enhanced oil recovery technique may significantly increase the operational expenditure necessary to extract crude oil. The economic viability of such recovery techniques will be determined by the incremental cost of such techniques compared to the then prevailing price of crude oil in the international markets. There can be no assurance that the price of crude oil will allow such techniques to be an economically viable proposition at the time we intend to effect these enhanced recovery techniques. This could have a material adverse effect on our ability to compete, our business, financial condition orand results of operations.
Our iron ore business is largely dependent on export sales of iron ore to China. As a result, any downturn in the rate of economic growth in China or negative changes in international relations between India and China or negative changes in the Chinese regulatory or trade policies relating to the import of iron ore could have a material adverse effect on our results of operations and financial condition
Our iron ore business is largely dependent on export sales of iron ore to China. For instance in fiscal year 2016,2017, 100% of sales to external customers for Goa was from exports to customers in China. As a result, the performance and growth of our iron ore business is necessarily dependent on the Chinese economy, which may be materially and adversely affected by political instability or regional conflicts, economic slowdown elsewhere in the world or otherwise. In addition, any deterioration of international relations between India and China, any negative changes in Chinese regulatory or trade policies relating to the import of iron ore or other limitations or restrictions in our ability to export iron ore to China could have a material adverse effect on our business, financial condition, results of operations and prospects.
We are subject to restrictive covenants for the credit facilities including term loans and working capital facilities provided to us and our subsidiaries
There are restrictive covenants in agreements which we have entered into with certain financial institutions for our borrowings and for borrowings by our subsidiaries. These restrictive covenants among others, require us to maintain certain financial ratios and seek the prior permission of these financial institutions for various activities, including, among others, any change in our capital structure, issue of equity, preferential capital or debentures, raising any loans and deposits from the public, undertaking any new project, effecting any scheme of acquisition, merger, amalgamation or reconstitution, implementing a new scheme of expansion or creation of a subsidiary. If the covenants are not complied with we may be required to repay the amount borrowed from such lenders immediately. Such restrictive covenants may restrict our operations or ability to expand and may adversely affect our business, financial condition or results of operations.
We are involved in a number ofseveral civil and criminal litigation matters, arbitration proceedings both civil and criminal in nature and any final judgment against us could have a material adverse effect on our business, result of operations, financial condition and prospects
We are involved in a number ofseveral legal and arbitration proceedings including matters relating to, alleged violations of environmental, tax, Indian laws and regulations, criminal sanctions, property and labor disputes and other related issues. A final judgment against us or our directors in one or more of these disputes may result in damages that we will be required to pay to the other party, injunctions against us any of which may require us to cease or limit our operations and such decisions or judgments may have a material adverse effect on our business, results of operations, financial condition and prospects.
For a detailed discussion of material litigation matters pending against us, see “Item 8. Financial Information—A. Consolidated Statements and Other Financial Information—Legal Proceedings.”
We may be liable for additional taxes if the tax holidays, exemptions and tax deferral schemes which we currently benefit from expire without renewal, and the benefits of the tax holidays, exemptions and tax deferral schemes are limited by the minimum alternative tax
We currently benefit from significant tax holidays, exemptions and tax deferral schemes. These tax holidays, exemptions and tax deferral schemes are for limited periods. For example, HZL’s captive power plant at Dariba, Chanderiya, and Zawar benefits from tax exemptions on the profits generated from transfers of power to HZL’s other units, which are expected to generate substantial savings. We also have wind mills located in states such as Gujarat, Karnataka, Tamil Nadu, Maharashtra and Rajasthan and melting and casting plants at Pantnagar which are also eligible for tax exemption. We pay royalties and cess in relation to our oil and gas business, to the state governments and the central government in India at rates determined by the respective governments, linked to the volume/value of oil that we produce. Any adverse changes in these fiscal terms may have an adverse effect on our costs, results of operations and financial condition. Cess earlier being levied on volume was adversely affecting the net realization in a declining oil price scenario. In the recent budget of fiscal year 2016, levy of cess was made ad valorem basis which will have an adverse impact on us with increase in prices.
Our copper refinery and copper rod plant at Tuticorin and one of our hydrometallurgical zinc smelters at Chanderiya was awarded the status of export oriented units, under which we were eligible for tax exemptions on raw materials, capital goods procured and finished goods sold until March 31, 2011. New captive power plants will not be eligible for such tax exemptions if the capitalization is effected after March 31, 2017. Captive power plants will continue to have the benefit of any existing tax exemptions after March 31, 2015 until such tax exemptions expire. The expiry or loss of existing tax holidays, exemptions and tax deferral schemes or the failure to obtain new tax holidays, exemptions or tax deferral schemes will likely increase our tax obligations and any increase could have a material adverse effect on our business, financial condition or results of operations.
In addition, we are subject to a Minimum Alternate Tax which sets a minimum amount of tax that must be paid each year based on our book profits. The base Minimum Alternate Tax rate is currently 21.34%. The Minimum Alternate Tax prevents us from taking full advantage of any tax holidays, exemptions or tax deferral schemes that may be available to us.
The GoI may allege a breach of a covenant by us and seek to exercise a put or call right with respect to shares of HZL, which may result in substantial litigation and serious financial harm to our business, results of operations, financial condition and prospects
Under the terms of the shareholders’ agreement between the GoI and erstwhile SIIL, we agreed that we would ensure that HZL would implement a 1 mmtpa greenfield zinc smelter plant at Kapasan in the state of Rajasthan (the “Kapasan Project”), within 5 years from April 11, 2002. The shareholders’ agreement provided that if within one year from this date, we reviewed the feasibility of the Kapasan Project and determined that it was not in the best economic interests of HZL, which determination required the report of an independent expert, and the board of directors of HZL confirmed this determination, then we would not be obliged to ensure that HZL implement the Kapasan Project. In 2003, HZL notified the GoI that the Kapasan Project would not be undertaken and that a report of an independent expert may not be required. While we have not received any notice of breach under the provisions of the shareholders’ agreement between the GoI and us with respect to HZL, the GoI may claim that we have breached the covenant related to the Kapasan Project as mentioned in the shareholders’ agreement triggering an event of default. The GoI, under the terms of the shareholders’ agreement, may become entitled to the right, which is exercisable at any time within 90 days from the day it became aware of such event of default, to either sell any or all of the shares of HZL held by the GoI to us at a price equivalent to 150.0% of the market value of such shares, or purchase any or all of the shares of HZL held by us at a price equivalent to 50.0% of the market value of such shares.
The closing market price of HZL’s shares on the NSE, on July 15, 201628, 2017 was Rs. 196.2277.9 ($ 3.0)4.3) per share. Based solely on this price, if GoI became entitled to sell and exercised this right to sell all of its 1,247,950,590 shares of HZL at a price equivalent to 150.0% of their market value, we would be required to pay Rs. 367,178520,208 million ($ 5,542.38,021.7 million) for those shares. Assuming the same July 15, 201628, 2017 closing market price of HZL’s shares, if GoI became entitled to purchase all of the 2,743,154,310 shares of HZL held by us at a price equivalent to 50.0% of their market value, we would receive Rs. 269,035381,161 million ($ 4,060.95,877.6 million) for those shares.
If the GoI were to assert that an event of default occurred under the shareholders’ agreement and seek to exercise a put or call right with respect to shares of HZL, we may face expensive and time-consuming litigation over the matter, uncertainty as to the future of our zinc business, an inability to enforce our call option to acquire the GoI’s remaining 29.5% ownership interest in HZL and the possibility of serious financial harm if we were unsuccessful in litigation, any of which may have a material adverse effect on our business, results of operations, financial condition and prospects.
Attracting and retaining talent at technical, managerial and leadership level as well as shortage of skilled labor in the natural resources industry could increase our costs and limit our ability to maintain or expand our operations, which could adversely affect our results of operations
Our efforts to execute our business plans will place significant demands on our management and other resources and we will be required to continue to improve operational, financial and other internal controls. Our ability to maintain and grow our business will depend on our ability to attract, train and retain personnel with skills that enable us to keep pace with growing demands and evolving industry standards. We are dependent to a large degree, on the continued service and performance of our senior management team and other key team members in our business units and functions. These key personnel possess technical and business capabilities that are difficult to replace.divisions. The loss or diminution of services of members of our senior management or other key team members, or our failure to retain our key personnel at various managerial positions could have an adverse effect on our results of operations, financial condition and prospects.
Mining, metal refining, metal smelting and fabrication operations and oil and gas extraction, require a skilled and experienced labor force. If we experience a shortage of skilled and experienced labor, our labor productivity could decrease and costs could increase, our operations may be interrupted or we may be unable to maintain our current production or increase our production as otherwise planned, which could have a material adverse effect on our results of operations, financial condition and business prospects.
Our insurance coverage may prove inadequate to satisfy future claims against us
We maintain insurance which we believe is typical in the respective industries in which we operate and in amounts which we believe to be commercially appropriate. Nevertheless, we may become subject to liabilities against which we may not have adequate insurance coverage or at all. Our insurance policies contain certain customary exclusions and limitations on coverage which may result in our claims not being honored to the full extent of the losses or damages we have suffered. The exploration and production of crude oil and natural gas is inherently hazardous. A range of factors incorporating natural andman-made factors may result in oil spills, fires, equipment failure, loss of well control, leakage of hydrocarbons or hydrogen sulfide etc., which can result in death, injury and damage to production facilities and the environment. In addition, our operating entities in India can only seek insurance from domestic insurance companies or foreign insurance companies operating in joint ventures with Indian companies and these insurance policies may not continue to be available at economically acceptable premiums. The occurrence of a significant adverse event, the risks of which are not fully covered or honored by such insurers could have a material adverse effect on our business, financial condition or results of operations.
TheRe-organization Transactions may not result in expected benefits
At the time of announcing theRe-organization Transactions, we estimated cost savings arising from the transaction, due to operational and financial synergies. These synergies may not be realized or may be materially lower than estimated and the extent to which any of the other benefits will actually be achieved, if at all, or the timing of any such benefits, cannot be predicted with certainty. If we are unable to realize the estimated cost savings or the other benefits that we expect to achieve through the consolidation, or if we are prevented from taking advantage of the anticipated tax efficiencies, or if we are unable to offset the incremental costs we incur over time as a result of the consolidation with such savings and benefits, there could be a material adverse effect on our business, financial condition or results of operations. Further, subsequent to the effectiveness of the Amalgamation andRe-organization Scheme, a special leave petition challenging the orders of the High Court of Bombay at Goa was filed before the Supreme Court of India by the Commissioner of Income Tax, Goa and the Ministry of Corporate Affairs in July 2013 and April 2014, respectively. Further, a creditor and a shareholder challenged the Amalgamation andRe-organization Scheme in the High Court of Madras in September 2013. These petitions are pending for hearing and admission.
There is no assurance that the special leave petitions will be determined in our favor, and accordingly, there is no assurance that the Courts will negate the effectiveness of theRe-organization Transactions. In such circumstance, we may not be able to achieve financial, operational, strategic and other potential benefits from the consolidation pursuant to theRe-organization Transactions. See “Item 8. Financial Information— A. Consolidated Statements and Other Financial Information— Legal Proceedings.” for further details.
We may fail to realize the financial flexibility, margin benefits, cost savings and other objectives which we had anticipated from the Cairn India Merger
There is no assurance that the Cairn India Merger will achieve the financial flexibility, cost savings and other objectives we had anticipated. These expected objectives may not develop or may be materially lower than anticipated and other assumptions (including the value of the recoverable assets) upon which we have determined the terms of the Cairn India Merger may prove to be incorrect. As such, the financial flexibility, cost savings and other objectives anticipated by us to result from the Cairn India Merger may not be achieved as expected, or at all, or may be delayed, which could have a material adverse effect on our business, financial condition, operating results and prospects.
We may incur significant costs or loss of reputation in case of leakage of business sensitive information
Any significant breach or failure of our digital infrastructure and/ or cyber security attacks due to negligence or IT security failure or any other reason could seriously disrupt our operations resulting in loss or misuse of data or sensitive information, disruption to our business, damage to our assets, legal or regulatory breaches and potentially legal liability. These could result in significant costs and/ or reputational consequences.
Risks Relating to Our Industry
Commodity prices and the copper TcRc may be volatile, which would affect our revenue, results of operations and financial condition
Historically, the international commodity prices for copper, zinc, oil and gas, iron ore and aluminium and the prevailing market TcRc rate for copper have been volatile and subject to wide fluctuations in response to relatively minor changes in the supply of, and demand for, such commodities, market uncertainties, the overall performance of world or regional economies and the related cyclicality in industries we directly serve and a variety of other factors. For example, between March 31, 20152016 and March 31, 2016,2017, the average LME prices of copper has decreased by 1.1% and the average LME prices of zinc, copper, lead, silver, dated brent and aluminium decreasedincreased by 15.8%29.5%, 20.4%, 12.4%13.4%, 16%16.7%, 44%2.3% and 15.9%6.2% respectively. Historically, international prices for crude oil and natural gas have fluctuated as a result of many macro-economic,geo-political and regional factors. Crude price has declined significantly during the year and substantialSubstantial or extended declines in international crude oil and gas prices could have an adverse effect on the economics of existing/ proposed projects, capex outlay, business, financial condition and results of operations and financial condition.operations. For instance, we purchase copper concentrate at the LME price for copper metal for the relevant quotational period less a treatment charge (“Tc”) and refining charge (“Rc”), or TcRc, that we negotiate with our suppliers, but which is influenced by the prevailing market rate for the TcRc. The TcRc has historically fluctuated independently and significantly from the copper LME price. We attempt to make the LME price a pass through for us as both our copper concentrate purchases and sales of finished copper products are based on LME prices. Nevertheless, we are also exposed to differences in the LME price between the quotational periods for the purchase of copper concentrate and sale of the finished copper products, and any decline in the copper LME price between these periods will adversely affect us. See “Item 5. Operating and Financial Review and Prospects—Factors Affecting Results of Operations—Metal Prices, Copper TcRc and Power Tariff.”
Similarly, for the portion of our alumina requirements sourced internally, our profitability is dependent upon the LME price of aluminium, less the cost of production, which includes the cost of mining bauxite, the refining of bauxite into alumina, transportation of bauxite and alumina and smelting of alumina into aluminium. For the portion of our alumina requirements sourced from third parties, our profitability is dependent upon the LME price of aluminium, less the cost of the sourced alumina and the cost of smelting. During fiscal year 2016, 47%2017, 53.9% of our alumina requirement was sourced from third parties. Further, the units of power generated by our commercial power generation business are also subject to price volatility.
The market price of the alumina that we purchase from third parties and the market price of the aluminium metals that we sell have experienced volatility in the past and any increases in the market price of the raw material relative to the market price of the metal that we sell would adversely affect the profitability and operating margins of our aluminium business, which could have a material and adverse effect on our business, financial condition or results of operations.
Further for our Rajasthan and Cambay blocks, the crude oil is benchmarked to Bonny Light, West African low sulphur crude that is frequently traded in the region, with appropriate adjustments for crude quality. The implied price realization of crude oil generally lies within the stated guidance of 8% - —13% discount to Dated Brent for Rajasthan and 3% - —6% to Dated Brent for Cambay, due to the prevailing oil market conditions. Movements in discount affect our revenue realization and any increase in quality differentials may adversely impact our revenues and profits.
Our reserves estimates are based on a number of assumptions, any changes to which may require us to lower our estimated reserves
There are numerous uncertainties inherent in estimating crude oil and natural gas reserves. Reservoir engineering follows a subjective process of estimating underground accumulations of crude oil and natural gas. It is well understood that these cannot be measured in an exact manner. These risks are gradually mitigated through enhanced understanding of the reservoirs, achieved by undertaking additional work. Reserves estimation involves a high degree of judgment and it is a function of the quality of the available data and the engineering and geological interpretation. Results of drilling, testing and production may substantially change the reserve estimates for a given reservoir over a period of time. For these reasons, actual results may vary substantially. Such variation in results may materially impact our actual production, revenue and expenditures.
Our metal and oil and gas reserves are estimates and represent the quantity of ore that we believed, as of March 31, 2016,2017, could be mined, processed, recovered and sold at prices sufficient to cover the estimated future total costs of production, remaining investment and anticipated additional capital expenditures. These estimates are subject to numerous uncertainties inherent in estimating quantities of reserves and could vary in the future as a result of actual exploration and production results, depletion, new information on geology and fluctuations in production, operating and other costs and economic parameters such as metal prices, smelter treatment charges and exchange rates, many of which are beyond our control. For example, fluctuations in the market price of ore and other commodities reduced recovery rates or increased production costs due to inflation or other factors may render proven and probable ore reserves containing relatively lower grades of mineralization uneconomic to exploit and ultimately result in a restatement of reserves. As a result, you should not place undue reliance on the reserve data contained in this Annual Report. In the event that any of these assumptions turn out to be incorrect, we may need to revise our reserves downwards and this may adversely affect ourlife-of-mine plans and consequently the total value of our mining asset base, which could increase our costs and decrease our profitability.
Oil and gas exploration activities are capital intensive and inherently uncertain in their outcome
Oil and gas exploration activities are capital intensive and inherently uncertain in their outcome. We or the operators of assets in which we have an interest may undertake exploration activities and incur significant costs in so doing with no assurance that such expenditure will result in the discovery of hydrocarbons in commercially viable quantities or not.
Changes in tariffs, royalties, cess, customs duties, export duties and government assistance may reduce our Indian market domestic premium, which would adversely affect our profitability and results of operations
Copper, zinc and aluminium are sold in the Indian market at a premium to the international market prices of these metals due to tariffs payable on the import of such metals. Between March 2003 and February 2011, basic customs duties on imported copper, zinc, lead and aluminium decreased cumulatively from 25.0% to 5.0%, and have remained at 5.0% since February 2011. With effect from March 1, 2016 basic custom duty on imported aluminium increased to 7.5%. The GoI may reduce or abolish customs duties on any of these commodities in the future, although the timing and extent of such reductions cannot be predicted. As we sell the majority of the commodities we produce in India, any reduction in Indian tariffs on imports will decrease the premiums we receive in respect of those sales which would have an adverse effect on our business, financial condition or results of operations.
We pay royalties to the state governments of Chhattisgarh and Rajasthan based on our extraction of bauxite and lead-zinc ore, respectively, and to the state government of Tasmania in Australia based on our extraction of copper ore.respectively. Most significant of these is the royalty that HZL is required to pay to the state government of Rajasthan, where all of HZL’s mines are located, at a rate of 10.0%, with effect from September 1, 2014 (with the rate being 8.4% prior to September 1, 2014, of the zinc LME price payable on the zinc metal contained in the concentrate produced and 14.5% (with the rate being 12.7% prior to September 1, 2014) of the lead LME price payable on the lead metal contained in the concentrate produced. Any upward revision to the royalty rates being charged currently may adversely affect our profitability. Additionally, the Department of Mines and Geology of the State of Rajasthan has raised additional demands for payment through several show cause notices to HZL for mining minerals associated with lead and zinc such as cadmium and silver. Similarly, Cairn India pays royalties and cess to the state governments and the Central government in India at rates determined by the respective governments, linked to the volume or value of oil produced. Any adverse changes in these fiscal terms may adversely affect our profitability. Cess earlier being levied on volume was adversely affecting the net realization in a declining oil price scenario. In the recent budget of fiscal year 2016, levy of cess was made on an ad valorem basis. See “Item 8. Financial Information—A. Consolidated Statements and Other Financial Information—Legal Proceedings—Demands against HZL by Department of Mines and Geology.” We pay royalties to the state government of Tasmania in Australia based on our extraction of copper ore. We also pay royalties to the government from our Zinc International business. In our iron ore business, we pay royalty on iron ore to the state governments of Goa at 15% of the average price declared periodically by the Indian Bureau of Mines and in Karnataka, royalty / Special Purpose Vehicle contribution at 15% is borne by buyer. We used to pay export duty on export of iron ore at the rate of 30% ad valorem on the Free on Board (‘F.O.B”) value of exports with effect from December 30, 2011 (the rate being 20% prior to December 30, 2011) and the GoI had reduced the rate of export duty on iron ore fines of less than 58 grade from 30% to 10% which is effective from June 1, 2015. The duty was further reduced to nil duty effective March 1, 2016, on exports of iron ore less than 58 grade. In April 2014, the Supreme Court of India ordered to create the Iron Ore Goa Permanent Fund, wherein all lease holders have to contribute 10% of sales value to this fund, See “Item 5 — Operating and Financial Review and Prospects — Factors Affecting Results of Operations — Government Policy” for details.
Changes in tax laws could also result in additional taxes payable by us. For example, the GoI raised the export duty on iron ore fines twice during 2011, first to 20% with effect from March 1, 2011 and then to 30% with effect from December 30, 2011. Currently, export duty is applicable on above 58 Fe grade iron ore onlyonly.
Towards end of the fiscal year 2015, the MMDRA is notified which brings greater transparency in granting of mineral concessions through ane-auction process. It also removes certain uncertainties relating to automatic renewals of mine leases for future periods. However for existing mining leases, it notifies an amount not exceeding royalty, to be contributed to District Mineral Foundation (DMF) for the benefit of people affected by mining and an additional amount equivalent to 2% of royalty to National Mineral Exploration Trust. DMF contribution has now beenwas notified at 30% of the base royalty rate in September 2015.
Indian exports of copper, aluminium and zinc receive assistance premiums from the GoI, which have been reduced since 2002. These export assistance premiums have been reduced in recent years and may be further reduced in the future. Any reduction in these premiums will decrease the revenue we receive from export sales and may have a material adverse effect on our business, financial condition or results of operations. See “Item 5. Operating and Financial Review and Prospects—Factors Affecting Results of Operations—Government Policy.”
Further, the GoI has enacted the Goods and Service Tax (“GST”) regime with effect from July 1, 2017, which is a unified, state of art taxation system, intended to integrate the Indian economy into a single unified market. The GST regime replaces the existing indirect tax regime consisting of central excise law and Service Tax law at the central level and respective state value added tax law, entry tax law and luxury tax law at the state level. Pursuant to the GST regime, the central government has enacted and notified in the Official Gazette, the Central Goods and Service Tax Act, 2017, the Integrated Goods and Service Tax Act, 2017, the Goods and Service Tax (Compensation to Sates) Act, 2017 and notifications, clarifications, orders, press releases under the aforementioned laws. Further, the state governments have also enacted and notified the respective state goods and service tax laws including the notifications, clarifications, orders, and press releases under these laws. The enactment of the GST regime and consequent enactments passed by the central and state governments have necessitated changes and alignment in the other laws such as the Legal Metrology Act, foreign trade policies and Tariff rates under Customs Act.
The upstream oil and gas industry is dependent on a limited number of global vendors for key equipment and services
There are a limited number of highly specialized vendors globally catering to the requirements of upstream oil and gas industry for key equipment and services such as rigs and other oilfield equipment and services. Many of these equipment and services involve long lead times to delivery. Inability or delay in sourcing the equipment and services of the required specifications and quality may result in delay of our exploration, development and production projects, and consequently have an adverse effect on our business, financial condition and results of operations and financial condition.operations.
There are particular risks and hazards associated with mining and oil exploration activities
Our mining operations includeopen-pit and underground mining, both of which involve significant hazards and risks. Hazards associated with ouropen-pit mining operations include flooding of the open pit, collapses of theopen-pit wall, accidents related to the operation of largeopen-pit mining and rock transportation equipment, accidents related to the preparation and ignition of large scale open pit blasting operations, production disruptions due to weather and hazards related to the disposal of mineralized waste water, such as groundwater and waterway contamination. Hazards associated with our underground mining operations include underground fires and explosions, including those caused by flammable gas,cave-ins or ground falls, discharges of gases and toxic chemicals, flooding, sinkhole formation and ground subsidence and other accidents and conditions resulting from drilling and removing and processing material from an underground mine. If any of these hazards or accidents result in significant injury to employees and damage to equipment or other property, we may experience unexpected production delays, increased production costs, and increased capital expenditures to repair or replace equipment or property, as well as claims from affected employees and environmental and other authorities for any alleged breaches of applicable laws or regulations.
Disruptions to mining and oil extraction, delays and costs on account of such hazards or accidents could have a material adverse effect on our business, financial condition and results of operations.
We may be affected by competition law in India and any adverse application or interpretation of the Competition Act could adversely affect its business
The Competition Act, 2002, as amended (the “Competition Act”), regulates practices having an appreciable adverse effect on competition in the relevant market in India. Under the Competition Act, any formal or informal arrangement, understanding or action in concert, which causes or is likely to cause an appreciable adverse effect on competition is considered void and results in the imposition of substantial monetary penalties. Further, any agreement among competitors which, directly or indirectly, involves the determination of purchase or sale prices, limits or controls production, supply, markets, technical development, investment or provision of services, shares the market or source of production or provision of services by way of allocation of geographical area, types of goods or services or number of clients in the relevant market or, directly or indirectly, results inbid-rigging or collusive bidding is presumed to have an appreciable adverse effect on competition. The Competition Act also prohibits abuse of a dominant position by any enterprise. The Competition Commission of India (the “CCI”), has extra-territorial powers and can investigate any agreements, abusive conduct or combination occurring outside India if such agreement, conduct or combination has an appreciable adverse effect on competition in India. Our operations in India are currently not subject to any outstanding proceedings under the Competition Act. However, if our operations in India are affected, directly or indirectly, by the application or interpretation of any provision of the Competition Act, or any enforcement proceedings initiated by the CCI, or any adverse publicity that may be generated due to scrutiny or prosecution by the CCI or if any prohibition or substantial penalties are levied under the Competition Act, it would adversely affect our business, cash flows and results of operation.
Risks Relating to Our Relationship with Vedanta
We are controlled by Vedanta and our other shareholders’ ability to influence matters requiring shareholder approval will be extremely limited
We are a majority-owned and controlled subsidiary of Vedanta. Volcan Investments Limited, or Volcan holds 62.47%62.37% of the share capital and 69.70%69.39% of the voting rights of Vedanta as of July 15, 2016.28, 2017. Volcan is a holding company, 100% beneficially owned and controlled by the Trust. Conclave is the trustee of the Trust and the sole registered shareholder of Volcan and consequently controls all voting and investment decisions of the Trust. Vedanta shares beneficially owned by Volcan may be deemed to be beneficially owned by the Trust, of which Mr. Anil Agarwal is the protector and with effect from October 16, 2014, one of the beneficiary.beneficiaries. Vedanta, Volcan, the Trust, Conclave and Mr. Anil Agarwal are parties to a relationship agreement that seeks to facilitate the carrying on of Vedanta’s business independently of Volcan, its direct and indirect shareholders, and their respective associates, or as collectively referred to below, the Volcan Parties. See “Item 7. Major Shareholders and Related Party Transactions—B. Related Party Transactions—Related Parties—Vedanta.” However, we cannot assure you that Vedanta, and in turn we, will be able to operate completely independently of the Volcan Parties, despite the relationship agreement, which lack of independence could have a material adverse effect on the holders of our equity shares and ADSs.
As long as Vedanta, through its subsidiaries, owns a majority of our outstanding equity shares, Vedanta may have the ability to control or influence significant matters requiring board approval and to take shareholder action without the vote of any other shareholder, and the holders of our equity shares and ADSs will not, in such circumstances, be able to affect the outcome of any shareholder vote. Vedanta will have the ability to control all matters affecting us. In the event Vedanta ceases to be our majority shareholder, we will be required to immediately repay some of our outstanding long-term debt.
Vedanta’s voting control may discourage transactions involving a change of control of us, including transactions in which holders of our equity shares and ADSs might otherwise receive a premium over the then current market prices. Vedanta is not prohibited from selling a controlling interest in us to a third party and may do so without the approval of holders of our equity shares and ADSs and without providing for a purchase of our equity shares or ADSs. Accordingly, our equity shares and ADSs may be worth less than they would be if Vedanta did not maintain voting control over us.
Vedanta may decide to allocate business opportunities to other members of the Vedanta Group instead of us, which may have a material adverse effect on our business, results of operations, financial condition and prospects
Vedanta’s control of us means it can determine the allocation of business opportunities among us, itself and its other subsidiaries. For example, as of July 15, 2016,28, 2017, Vedanta owned 79.4% of Konkola Copper Mines Plc, an integrated copper producer in Zambia, apart from the control exercised on us, and our subsidiaries, through us. As Vedanta controls Konkola Copper Mines Plc it determines the allocation of business opportunities among, as well as strategies and actions of, Konkola Copper Mines Plc and us. Vedanta may determine to have Konkola Copper Mines Plc or any other entity instead of us, pursue business opportunities in the zinc, oil and gas, copper, iron ore, aluminium or commercial power generation business, or any other business, or cause such companies or us to undertake corporate strategies, the effect of which is to benefit such companies instead of us and which could be detrimental to our interests. If Vedanta were to take any such actions, our business, results of operations, financial condition and prospects could be materially and adversely affected and the value of our equity shares and the ADSs may decline.
We have issued several guarantees as security for the obligations of certain of our subsidiaries and other companies within the Vedanta Group and we will have liability under these guarantees in the event of any failure by such entities to perform their obligations, which could have a material adverse effect on our results of operations and financial condition
We have issued several guarantees in respect of the obligations of certain of our subsidiaries and other companies within the Vedanta Group, including guarantees issued as security for loan obligations, credit facilities oron the issuance of customs and excise duty bonds, performance bank guarantees while bidding for importsupply contracts or in lieu of capital equipment at concessional ratesadvances received from customers, bank guarantees for securing supplies of duties.materials and services etc. Our outstanding guarantees cover obligations aggregating Rs. 25,755 million and Rs. 22,591 million ($ 388.8348.4 million) as of March 31, 2016 and March 31,2017 respectively the liabilities for which have not been recorded in our consolidated financial statements. We will have aThese are contractual guarantees and are enforceable if the terms and conditions of the contracts are not met and the maximum liability inon these contracts is the event thatamount mentioned above. The Group does not anticipate any ofliability on these entities fails to perform its obligations under the loan agreements, credit facilities or bonds, which could have a material adverse effect on our business, financial condition or results of operations.guarantees. See Note 29 “Commitments, contingencies, and guarantees” on Notes to the consolidated financial statements.
Any disputes that arise between us and Vedanta or other companies in the Vedanta Group could harm our business operations
Disputes may arise between Vedanta or other companies in the Vedanta Group and us in a number of areas, including:
We may not be able to resolve any potential conflicts, and even if we do, the resolution may be less favorable than if we were dealing with an unaffiliated party.
Our agreements with Vedanta and other companies in the Vedanta Group may be amended upon agreement between the parties. As we are controlled by Vedanta, Vedanta may require us to agree to amendments to these agreements that may be less favorable to us than the original terms of the agreements.
Some of our directors and executive officers may have conflicts of interest because of their ownership of Vedanta shares, options to acquire Vedanta shares and positions with Vedanta
Some of our directors and executive officers own Vedanta shares and options to purchase Vedanta shares, including through their continued participation in the Vedanta Long-Term IncentivePerformance Share Plan 2003 and Vedanta Long-Term Incentiveor Deferred Bonus Share Plan 2014, the Vedanta LTIP, PSP or ESOP schemes of Vedanta. In addition, some of our directors and executive officers are directors or executive officers of Vedanta. Ownership of Vedanta shares and options to purchase Vedanta shares and the presence of an executive officerofficers of Vedanta on our Board of directors could create, or appear to create, potential conflicts of interest and other issues with respect to their fiduciary duties to us when our directors and officers are faced with decisions that could have different implications for Vedanta than for us.
Our management, including our senior management, is not solely focused on our business and may be distracted by, or have conflicts as a result of, the demands of Vedanta or other businesses within the Vedanta Group, which may materially and adversely affect our business, financial condition and results of operations and financial condition.operations.
As a foreign private issuer and a “controlled company” within the meaning of the New York Stock Exchange (“NYSE”) rules, we are subject to different NYSE rules thannon-controlled domestic US issuers. Consequently, the corporate governance standards which we are required to adhere to are different than those applicable to such companies, which may limit the information available to, and the shareholder rights of, holders of our ADSs
We qualify as a “controlled company” within the meaning of the NYSE rules as Vedanta has effective control of a majority of our equity shares. This will allow Vedanta to, among other things, control the composition of our Board of directors and direct our management and policies.
As a foreign private issuer and a “controlled company,” we are exempt from complying with certain corporate governance requirements of the NYSE, including the requirement that a majority of our Board of directors consist of independent directors. As the corporate governance standards applicable to us are different than those applicable to domesticnon-controlled US issuers, holders of our equity shares and ADSs may not have the same protections afforded under the NYSE rules as shareholders of companies that do not have such exemptions. It is also possible that the Agarwal family’s significant ownership interest of us as a result of its majority ownership of Vedanta’s majority shareholder, Volcan, could adversely affect investors’ perceptions of our corporate governance. For a summary of the differences between the corporate governance standards applicable to us as a listed company in India and as a foreign private issuer and “controlled company” in the United States and such standards applicable to a domesticnon-controlled US issuer, Seesee “Item 10. Additional Information—B. Memorandum and Articles of Association—Comparison of Corporate Governance Standards.”
Risks Relating to Investments in Indian Companies, Global Economic Conditions and International Operations
A substantial portion of our assets and operations are located in India and we are subject to regulatory, economic, social and political uncertainties in India
We are incorporated in India. Our primary operating subsidiaries, HZL BALCO and Cairn India,BALCO, are also incorporated in India. A substantial portion of our assets and employees are located in India and we intend to continue to develop and expand our facilities in India. Consequently, our financial performance and the market price of our equity shares and ADSs will be affected by changes in exchange rates and controls, interest rates, changes in government policies, including taxation policies, social and civil unrest and other political, social and economic developments in or affecting India.
The GoI has exercised and continues to exercise significant influence over many aspects of the Indian economy. Since 1991, successive Indian governments have pursued policies of economic liberalization, including by significantly relaxing restrictions on the private sector. Nevertheless, the role of the Indian central and state governments in the Indian economy as producers, consumers and regulators has remained significant and we cannot assure you that such liberalization policies will continue. The rate of economic liberalization could change, and specific laws and policies affecting metals and mining companies, foreign investments, currency exchange rates and other matters affecting investment in India could change as well. For instance, recently, the GoI and the RBI has declared that Rs. 500 and Rs. 1,000 denominations of bank notes have ceased to be legal tender. Pursuant to this currency demonetization, these high denomination notes have no value and cannot be used for transactions or exchange purposes with effect from November 9, 2016. These notes have been replaced with a new series of bank notes. The process of demonetization and replacement of these high denomination notes has reduced the liquidity in the Indian economy which has significant reliance on cash. These factors had resulted in reduced purchasing power, and altered consumption patterns in general. While the comprehensive and long-term impact of this currency demonetization measure cannot be ascertained at the moment, there has been a slowdown in the economic activities in India, at least in the short term, given the demonetization impacts a majority quantity of the cash currency in circulation. Such a slowdown can adversely affect the Indian economy, in turn affecting the operations of our business in India. Further, protests against privatizations and government corruption scandals, which have occurred in the past, could slow the pace of liberalization and deregulation. Given the changes in government policy on divestments, there can be no assurance that any of the proposed privatizations which we may be interested in pursuing will be implemented or completed in the near future, or at all. A significant change in India’s policy of economic liberalization and deregulation could adversely affect business and economic conditions in India generally and our business in particular, if new restrictions on the private sector is introduced or if existing restrictions are increased.
As the domestic Indian market constitutes the major source of our revenue, the downturn in the rate of economic growth in India or other countries due to the unprecedented and challenging global market and economic conditions, or any other such downturn for any other reason, will be detrimental to our results of operations
In fiscal year 2016,2017, approximately 69.3%61.6% of our revenue was derived from commodities that we sold to customers in India. The performance and growth of our business are necessarily dependent on the health of the overall Indian economy. Any downturn in the rate of economic growth in India, whether due to political instability or regional conflicts, economic slowdown elsewhere in the world or otherwise, may have a material adverse effect on demand for the commodities we produce. The Indian economy is also largely driven by the performance of the agriculture sector, which depends on the quality of the monsoon, which is difficult to predict. In the past, economic slowdowns have harmed manufacturing industries, including companies engaged in the copper, zinc, aluminium and power sectors, as well as the customers of manufacturing industries. Any future slowdown in the Indian economy could have a material adverse effect on the demand for the commodities we produce and, as a result, on our business, financial condition and results of operations.
In addition, the Indian securities market and the Indian economy are influenced by economic and market conditions in other countries. Although economic conditions are different in each country, investors’ reactions to developments in one country can have adverse effect on the securities of companies in other countries, including India. A loss of investor confidence in the financial systems of other emerging markets may cause volatility in Indian financial markets and, indirectly, in the Indian economy in general. Any worldwide financial instability could also have a negative impact on the Indian economy, including the movement of exchange rates and interest rates in India. Any slowdown in the Indian economy, or future volatility in global commodity prices, could adversely affect the growth of our business in India.
The Indian economy and financial markets are also significantly influenced by worldwide economic, financial and market conditions. Any financial turmoil, especially in the United States, United Kingdom, Europe or China, may have a negative impact on the Indian economy. Although economic conditions differ in each country, investors’ reactions to any significant developments in one country can have adverse effects on the financial and market conditions in other countries. A loss in investor confidence in the financial systems, particularly in other emerging markets, may cause increased volatility in Indian financial markets.
For instance, on June 23, 2016, the United Kingdom held a referendum on its membership of the European Union and voted to leave (Brexit). There is significant uncertainty at this stage as to the impact of Brexit on general economic conditions in the United Kingdom and the European Union and any consequential impact on global financial markets. For example, Brexit could give rise to increased volatility in foreign exchange rate movements and the value of equity and debt investments. A lack of clarity over the process for managing the exit and uncertainties surrounding the economic impact could lead to a further slowdown and instability in financial markets. This and any prolonged financial crisis may have an adverse impact on the Indian economy, thereby resulting in a material adverse effect on our business, financial condition and results of operations
Terrorist attacks and other acts of violence involving India, the MENA region or other neighboring countries could adversely affect our operations directly, or may result in a more general loss of customer confidence and reduced investment in these countries that reduces the demand for our products, which would have a material adverse effect on our business, results of operations, financial condition and cash flowsresults of operations
Terrorist attacks and other acts of violence or war involving India or other neighboring countries may adversely affect the Indian markets and the worldwide financial markets. The occurrence of any of these events may result in a loss of business confidence, which could potentially lead to economic recession and generally have a material adverse effect on our businesses, results of operations,business, financial condition and cash flows. results of operations.
Further, any wars, acts of terrorism and uncertain political or economic prospects or instability in the Middle East and North Africa (“MENA region”) may adversely impact global financial markets and an increase in the price of crude oil. Recent protests in the MENA region may continue and broaden across the region and lead to significant political uncertainties in a number of countries.
In addition, any deterioration in international relations may result in investor concern regarding regional stability which could adversely affect the price of our equity shares and ADSs.
South Asia has also experienced instances of civil unrest, terrorist attacks and hostilities among neighboring countries from time to time, especially between India and Pakistan. Such activity or terrorist attacks in the future could adversely affect the Indian economy by disrupting communications and making travel more difficult and could create the perception that investments in Indian companies involve a high degree of risk. Furthermore, if India were to become engaged in armed hostilities, particularly hostilities that were protracted or involved the threat or use of nuclear weapons, we might not be able to continue our operations.
If natural disasters or environmental conditions in India, including floods and earthquakes, affect our mining and production facilities, our revenue could decline
Our mines and production facilities are spread across India, and our sales force is spread throughout the country. Natural calamities such as floods, rains, heavy downpours (such as heavy downpours in Tuticorin in 2008 which caused the closure of our Tuticorin facilities for two to three days, as well as the rains in Mumbai and other parts of the State of Maharashtra in 2005 and other states in 2006) and earthquakes could disrupt our mining and production activities and distribution chains and damage our storage facilities. Unusually heavy rains during the monsoon season in the years 2006 and 2013 in the states of Rajasthan and Gujarat triggered floods and caused destruction in these states. The area in which the Mangala field is located experienced flooding which directly affected existing well-sites and roads. Other regions in India have also experienced floods, earthquakes, tsunamis and droughts in recent years.
Substantially all of our facilities and employees are located in India and there can be no assurance that we will not be affected by natural disasters in the future. For example, the pipeline to transport crude oil from the northern fields of the Rajasthan block to Salaya, and thereafter to the Bhogat terminal in Gujarat, passes near Bhuj, which was the epicenter of an earthquake measuring 6.9 on the richter scale in 2001 and that resulted in the deaths of approximately 30,000 people as well as damage to the infrastructure in the region. Although our Rajasthan block crude oil production plans assume that the proposed pipeline will withstand damage from fire, earthquakes, floods, storms and similar events, there can be no assurance that the pipeline will withstand damage from such events. In addition, if there were a drought or general water shortage in India or any part of India where our operations are located, the GoI or local, state or other authorities may restrict water supplies to us and other industrial operations in order to maintain water supplies for drinking and other public necessities which would cause us to reduce or close our operations. Our business and operating activities could be disrupted if we do not respond, or are perceived not to respond, in an appropriate manner to any major crisis or if we are not able to restore or replace critical operational capacity.
Currency fluctuations among the Indian Rupee, the US dollar and other currencies could have a material adverse effect on our results of operations
Although substantially all of our revenue is tied to commodity prices that are typically priced by reference to the US dollar, most of our expenses are incurred and paid in Indian Rupees and, to a lesser extent, Australian dollars, Sri Lankan Rupees, Euros, Namibian dollars and South African Rands and Liberian dollars.Rands. In addition, in fiscal year 2016, 30.3%2017, 38.4% of our revenue was derived from commodities that we sold to customers outside India. The exchange rates between the Indian Rupee and the US dollar and between other currencies and the US dollar have changed substantially in recent years and may fluctuate substantially in the future. See “Item 10. Additional Information—D. Exchange Controls”. Our results of operations or financial condition could be adversely affected if the US dollar depreciates against the Indian Rupee or other currencies. We seek to mitigate the impact of short-term movements in currency on our businesses by hedging our short-term exposures progressively based on their maturity. However, large or prolonged movements in exchange rates may have a material adverse effect on our business, financial condition or results of operations.
If India’s inflation, worsens or the prices of oil or other raw materials were to rise, we may not be able to pass the resulting increased costs to our customers and this may adversely affect our profitability or cause us to suffer operating losses
Inflation rates in India have been volatile in recent years, and such volatility may continue in the future. For instance, India has experienced wholesale price inflation in recent yearsthe past compared to historical levels due to higher demand than supply. In addition, international prices of crude oil have recently experienced significant volatility in the past, including a rise to historical highs that increased transportation costs followed more recently by a significant decline as global economic conditions have deteriorated. Inflation, increased transportation costs and an increase in energy prices generally, which may be caused by a rise in the price of oil, or an increase in the price of thermal coking coal in particular, could cause our costs for raw material inputs required for production of our products to increase, which would adversely affect our financial condition and results of operations if we cannot pass these added costs along to customers.
Stringent labor laws in India may adversely affect our profitability
India has stringent labor legislation that protects the interests of workers, including legislation that sets forth detailed procedures for dispute resolution and employee compensation for injury or death sustained in the course of employment, and imposes financial obligations on employers upon employee layoffs. This makes it difficult for us to maintain flexible human resource policies, discharge employees or downsize, which may adversely affect our business, financial condition or results of operations.
Political, economic and social risks associated with investments in countries other than India could have an adverse effect on our business
In addition to operating in India, we currently operate in various other jurisdictions including Sri Lanka,UAE, Australia, Namibia, South Africa, Ireland and Liberia. Certain of these countries are subject to political, economic and social developments that may, individually or in combination, create risks for investors that may be more difficult to predict or measure than would be the case in certain developed economies. Any political instability could have an adverse impact on the economy as a whole. Political disruptions and civil unrest that may occur in any of these countries could potentially have an adverse effect on exports and, consequently, on our business, financial condition or results of operations. For example, the Ebola epidemic in Liberia resulted in stoppage of drilling, exploration work for iron ore during fiscal year 2015. We evacuated staff in Liberia owing to the ebolaEbola risk in 2015. In consideration of the suspension of exploration in Liberia, low iron ore prices,geo-political factors and no plans for any substantive expenditure resulting in continued uncertainty in the project, an impairment charge of US$227.6 million hashad been recognised, in fiscal year 2016.
Global economic conditions have been unprecedented and challenging and have had, and continue to have, an adverse effect on the Indian financial markets and the Indian economy in general, which has had, and may continue to have, a material adverse effect on our business, our financial performance and the prices of our equity shares and ADSs
Global market and economic conditions have been unprecedented and challenging and have resulted in tighter credit conditions and recession in most major economies in the last several years. Continued concerns about the systemic impact of potential long-term and wide-spread recession, energy costs, geopolitical issues, the availability and cost of credit, and the global housing and mortgage markets have contributed to increased market volatility and diminished expectations across various economies. These conditions, combined with volatile oil prices, declining business and consumer confidence and increased unemployment, have contributed to volatility of unprecedented levels.
As a result of these market conditions, the cost and availability of credit has been and may continue to be adversely affected by illiquid credit markets and wider credit spreads. Concern about the stability of the markets generally and of counterparties specifically has led many lenders and institutional investors to reduce, and in some cases, cease to provide credit to businesses and consumers. These factors have led to a decrease in spending by businesses and consumers alike and corresponding decreases in global infrastructure spending and commodity prices. Continued turbulence in the international markets and economies and prolonged declines in business consumer spending may adversely affect our liquidity and financial condition, and the liquidity and financial condition of our customers, including our ability to refinance maturing liabilities and access the capital markets to meet liquidity needs. These global market and economic conditions have had an adverse effect on the Indian financial markets and the Indian economy in general, which has had, and may continue to have, a material adverse effect on our business, our financial performance and the prices of our equity shares and ADSs. For example, in response to global economic conditions and a decline in commodity prices, we had ceased operations at one of our aluminium smelters at the Korba complex in previous years which had an adverse effect on our business, financial condition orand results of operations.operation.
There are certain differences in shareholder rights and protections between the laws of India and the United States and between governance standards for a US public company and a foreign private issuer such as us
We are incorporated in India and investors should be aware that there are certain differences in the shareholder rights and protections between the laws of India and the United States. There are also certain differences in the corporate governance standards for a domestic US issuer and those applicable to a foreign private issuer such as us. See “Item 10. Additional Information—B. Memorandum and Articles of Association—Comparison of Shareholders’ Rights.”
The Securities and Exchange Board of India (“SEBI”) and the various Indian stock exchanges are responsible for improving and setting standards for disclosure and other regulatory standards for the Indian securities markets. SEBI has issued regulations and guidelines on disclosure requirements, insider trading and other matters. Nevertheless, there may be less information made publicly available in respect of Indian companies than is regularly made available by public companies in the United States as a result of differences between the level of regulation and monitoring of the Indian securities markets and of the transparency of the activities of investors and brokers in India compared to the United States. Similarly, our disclosure obligations under the rules of the NSE and BSE Ltd. (“BSE”) on which our equity shares are listed may be less than the disclosure obligations of public companies on the NYSE.
Risks Relating to Our ADSs
Substantial future sales of our equity shares or ADSs in the public market, or the perception of such sales, could cause the market price of our ADSs to fall
If our existing shareholders sell a substantial number of our equity shares in the open market, or if there is a perception that such sale or distribution could occur, the market price of our equity shares and ADSs could be adversely affected. These sales, or the perception that these sales could occur, also might make it more difficult for us to sell securities in the future at a time or at a price that we deem appropriate or pay for acquisitions using our equity securities.
As of March 31, 20162017 we had 2,964,694,2392,965,004,871 equity shares outstanding, including 228,184,620217,019,900 equity shares represented by 57,046,15554,254,975 ADSs. All our 2,964,694,239 outstanding equity shares are freely tradable on the NSE and BSE.BSE, pending allotment and listing of 310,632 equity shares as they are under dispute. Furthermore, Vedanta, through Twin Star and other investment companies, continued to have effective control over 1,863,458,132 of our total outstanding equity shares (including equity shares representing ADSs), which represented 62.85%50.1% of our outstanding share capital as of July 15, 2016.28, 2017.
Fluctuations in the exchange rate between the Indian Rupee and the US dollar could have a material adverse effect on the value of our ADSs, independent of our actual operating results
The price of the ADSs is quoted in US dollars. Our equity shares are quoted in Indian Rupees on the NSE and BSE. Any dividends in respect of our equity shares will be paid in Indian Rupees and subsequently converted into US dollars for distribution to ADS holders.
Currency exchange rate fluctuations will affect the dollar equivalent of the Indian Rupee price of our equity shares on the NSE and BSE and, as a result, the prices of our ADSs, as well as the US dollar value of the proceeds a holder would receive upon the sale in India of any of our equity shares withdrawn from the depositary under the deposit agreement and the US dollar value of any cash dividends we pay on our equity shares. Holders may not be able to convert Indian Rupee proceeds into US dollars or any other currency, and there is no guarantee of the rate at which any such conversion will occur, if at all. Currency exchange rate fluctuations will also affect the value received by ADS holders from any dividends paid by us in respect of our equity shares. Holders of our ADSs will bear all of the risks with respect to a decline in the value of the Indian Rupee as compared to the US dollar, which would adversely affect the price of our ADSs and the US dollar value of any dividends we pay that are received by ADS holders.
Transfers of the underlying shares by persons resident outside India to residents of India are subject to certain pricing norms
Under current Indian regulations, subject to certain conditions, no prior regulatory approval is required for the sale of any equity shares, including any equity shares withdrawn from the ADS facilities, by a person resident outside India to a resident of India. However, certain reporting requirements would need to be complied with by the parties to the sale transaction. Also, the prior approval of the RBI would be required in the event of a sale of the equity shares underlying our ADSs by anon-resident investor to a resident investor if the sale price is greater than the maximum price set by the RBI under Indian foreign exchange laws. Any such approval required from the RBI or any other government agency may not be obtained on terms favorable to anon-resident investor, or at all.
Holders of ADSs may be restricted in their ability to exercise preemptive rights under Indian law and thereby may suffer future dilution of their ownership positions
Under the Indian Companies Act, the holders of equity shares of a company incorporated in India have a preemptive right to subscribe and pay for a proportionate number of shares to maintain their existing ownership percentages prior to the issuance of any new equity shares by the company, unless the preemptive rights have been waived by adopting a special resolution passed by 75% of the shareholders present and voting at a general meeting.
Holders of ADSs may be unable to exercise preemptive rights for the underlying equity shares of the ADSs unless a registration statement under the Securities Act of 1933, as amended, or the Securities Act is effective with respect to such rights or an exemption from the registration requirements of the Securities Act of 1933 is available. We are not obligated to prepare and file such a registration statement and our decision to do so will depend on the costs and potential liabilities associated with any such registration statement, as well as any other factors we consider appropriate at the time. No assurance can be given that we would file a registration statement under these circumstances. If we issue any such securities in the future, such securities may be issued to the depositary, which may sell the securities for the benefit of the holders of the ADSs. The value the depositary would receive from the sale of such securities cannot be predicted. To the extent that holders of ADSs are unable to exercise preemptive rights granted in respect of our equity shares represented by their ADSs, their proportional ownership interests in us would be diluted.
We may be classified as a passive foreign investment company, which could result in adverse United States federal income tax consequences to US Holders
Based on the market prices of our equity shares and ADSs and the composition of our income and assets, including goodwill, although not clear, we do not believe we were a PFIC for United States federal income tax purposes for our taxable year ended March 31, 2016.2017. However, the application of the PFIC rules is subject to uncertainty in several respects and, therefore, the US Internal Revenue Service may assert that, contrary to our belief, we were a PFIC for such taxable year. Moreover, although the asset test (defined below) is required to be calculated based on the fair market value of our assets, we did not do a valuation of our assets and our belief that we were not a PFIC for our taxable year ended March 31, 20162017 is, in part, based on the book value of our assets. Anon-United States corporation will be considered a passive foreign investment company, or PFIC, for any taxable year if either (1) at least 75% of its gross income for such year is passive income or (2) at least 50% of the total value of its assets (based on an average of the quarterly values of the assets during such year) is attributable to assets, including cash, that produce or are held for the production of passive income, or passive assets. In addition, a separate determination must be made after the close of each taxable year as to whether we were a PFIC for that year. Because the aggregate value of our assets for purposes of the PFIC test will generally be determined by reference to the market price of our ADSs and equity shares, fluctuations in the market price of the ADSs and equity shares may cause us to become a PFIC. In addition, changes in the composition of our income or assets may cause us to become a PFIC. Accordingly, we cannot assure you that we will not be a PFIC for the taxable year that will end on March 31, 20162017 or any future taxable year. If we were a PFIC for any taxable year during which a US Holder (as defined under “Item 10. Additional Information—E. Taxation—United States Federal Income Taxation”) holds an ADS or an equity share, certain adverse United States federal income tax consequences could apply to the US Holder. See “Item“Item 10. Additional Information—E. Taxation—United States Federal Income Taxation—Passive Foreign Investment Company.”
| ITEM 4. | INFORMATION ON THE COMPANY |
| A. | History and Development of our Company |
Important Events in the Development of Vedanta Limited
The Company was incorporated in Kolkata, the State of West Bengal, India as Rainbow Investment Limited on September 8, 1975 under the laws of India. Our name was subsequently changed to Sterlite Cables Limited on October 19, 1976 and then to Sterlite Industries (India) Limited on February 28, 1986.
Pursuant to the Re-organization Transactions (as explained below) becoming effective on August 17, 2013, our name changed to Sesa Sterlite Limited. On April 22, 2015, Sesa Sterlite Limited submitted to the SEC regarding the name change to Vedanta Limited following the approval from the Registrar of Companies, Goa on April 21, 2015. Our Company identification number is L13209GA1965PLC000044.L13209MH1965PLC291394. Our registered office is presently situated at Sesa Ghor, 20, EDC Complex, Patto, Panaji,1st Floor, C wing, Unit 103, Corporate Avenue, Atul Projects, Chakala, Andheri (East),Mumbai-400 093, Maharashtra, India. Our registered office was relocated from the state of Goa 403001, India.to the state of Maharashtra, with effect from February 4, 2017. The telephone number of our registered office is (91) 832 246 0600.022 6643 4500. The register of members of the Company is maintained at the registered office.office of the Company and also at the office of the Company’s Registrar and Transfer Agent, Karvy Computershare Private Limited, Hyderabad. Our website address is http://www.vedantalimited.com. Our agent for service of process in the United States is CT Corporation System and are located at 111 Eighth Avenue, New York, New York 10011.
The BoardOur equity shares are listed and traded on the NSE and the BSE. Our American Depositary Receipts (“ADRs”) are quoted on the NYSE (NYSE:VEDL). Our equity shares have been included in BSE Sensex, a diversified index of directors approved30 Indian stocks listed on the relocationBSE since July 28, 2008. Our equity shares continue to remain listed in Sensex after the completion of our registered office fromtheRe-organization Transactions. Sesa Goa was a part of CNX Nifty (“Nifty”) since October 2010 and after the Statecompletion of Goa to Mumbai in the State of Maharashtra. Subsequently, the shareholders of the Company vide postal ballot dated July 7, 2015, approved the relocation of the registered office. The Company has made an application to the GoI for its approval. Until the approval, the registered office of the Company shallRe-organization Transactions, we continue to be located in the State of Goa.
SIIL was acquired by Mr. Anil Agarwal and his family in 1979. In 1988, SIIL completed an initial public offering of shares in India to finance in part its first polythene insulated jelly filled copper telephone cables plant. It discontinued production of polyvinyl chloride power and control cables and enameled copper wires in 1990 and in 1991 commissioned a continuous cast copper rod plant.
In 1997, in order to obtain captive sources of copper for the copper rod plant, it commissioned the first privately developed copper smelter in India at Tuticorin. In 2000, SIIL acquired CMT through Monte Cello, which owns the Mt. Lyell copper mine in Australia. The operation of Mt Lyell mine was suspended in January 2014, following a mud slide incident. Subsequently, the operations at the Mt. Lyell copper mine has been placed under care and maintenance following a rock falling on the ventilation shaft in June 2014.
In July 2000, the telecommunications cables and optical fiber business was spun-off into a new company, Sterlite Technologies Limited. The Agarwal family has substantial interests in Sterlite Technologies Limited. Sterlite Technologies Limited is not a part of Nifty.
Our equity shares are beneficially held by the Twin Star, Finsider, Westglobe and Welter Trading, which are in turn wholly-owned subsidiaries of Vedanta. Twin Star, Finsider, Westglobe and Welter Trading held 43.18%, 13.54%, 1.50%, 1.3%, respectively, of our group companies.share capital as of March 31, 2017.
Sterlite Industries (India) Limited (SIIL) was incorporated in Kolkata, the state of West Bengal, India as Rainbow Investment Limited on September 8, 1975 under the laws of India. SIIL’s name was subsequently changed to Sterlite Cables Limited on October 19, 1976 and then to Sterlite Industries (India) Limited on February 28, 1986.
SIIL acquired the aluminium business through the acquisition of a 51.0% interest in BALCO from the GoI on March 2, 2001. The exercise of our call option to purchase the remaining 49.0% of the shareholding of GoI in BALCO is still under dispute.
On April 11, 2002, SIIL acquired, through Sterlite Opportunities and Ventures Limited (“SOVL”), a 26.0% interest in HZL from the GoI and a further 20.0% interest through an open market offer. On November 12, 2003, SIIL acquired through SOVL, a further 18.9% interest in HZL following the exercise of a call option granted by the GoI, increasing SIIL’s interest in HZL to 64.9%. In addition, SOVL has a call option which became exercisable on April 11, 2007 to acquire the GoI’s remaining ownership interest in HZL. The exercise of this option has been contested by the GoI and is still under dispute. As per the order of the High Court of Madras dated March 29, 2012, SOVL merged into SIIL. The exercise of this option has been contested by the GoI and is still under dispute.
On October 3, 2006, SIIL acquired 100% of Sterlite Energy from Mr. Anil Agarwal and Mr. Dwarka Prasad Agarwal, one of its directors until March 31, 2009, for a total consideration of Rs. 4.9 million ($ 0.1 million). Sterlite Energy was SIIL’s subsidiary through which it had set up a thermal coal-based 2,400 MW power facility in the State of Odisha.
In 2007, Vedanta Resources, through its subsidiaries, acquired 51.0% of Sesa Goa Limited from Mitsui Co. Ltd. which was subsequently increased to 55.13% by fiscal year 2013. Sesa Goa was incorporated as a private company under the laws of India in Panaji, state of Goa, India on June 2007, SIIL completed an initial25, 1965 as Sesa Goa Private Limited. It became a public limited company following a public offering of its shares in the form of ADSs in the US and1981. On December 8, 2011, Sesa Goa along with its ADSs were listed on the NYSE. After this offering, Vedanta’s ownership interest, held through its subsidiaries, decreased to 59.9%.
In July 2008, Sterlite Energy was successful in an international bidding process and was awarded the construction of a 1980 MW coal-based thermal commercial power plant at Talwandi Sabo in the State of Punjab, India. On September 1, 2008, Sterlite Energysubsidiary Sesa Resources Limited, completed the acquisition of TSPL for a purchase price of Rs. 3,868 million ($ 58.4 million).
In July 2009, in connection with SIIL’s follow-on offering of ADS, each representing one equity share of par value Rs. 2, it issued 131,906,011 new equity shares in the form of ADSs, at a price of $ 12.15 per ADS, aggregating approximately $ 1,602.7 million. Out of 131,906,011 equity shares, 41,152,263 equity shares were allotted to its parent company, Twin Star, which is a wholly-owned subsidiary of Vedanta.
In October 2009, SIIL issued $ 500 million aggregate principal amount of convertible senior notes at an interest rate of 4 % per annum. Subject to certain exceptions, these convertible senior notes were convertible, at the option20.1% of the holder, into ADSs at a conversion rate of 42.8688 ADSs per $ 1,000 principal amount of convertible senior notes, which was equal to a conversion price of approximately $ 23.33 per ADS. Upon the effectiveness of the Amalgamation and Re-organization Scheme, the conversion rate has been changed to 25.7213 ADSs per $ 1,000 principal amount of the convertible senior notes which is equal to a conversion price of approximately $ 38.88 per ADS. These convertible senior notes matured on October 30, 2014and were repaid on the maturity date.
On May 10, 2010, SIIL agreed to acquire the zinc business of Anglo American Plc for a total consideration of Rs. 69,083 million ($ 1,513.1 million). The zinc business comprises of the following:
On December 3, 2010, SIIL announced the completion of the acquisition of 100.0% stake in Skorpion by Sterlite Infra Limited, wholly-owned subsidiary of SIIL for a consideration of Rs. 32,098 million ($ 706.7 million). On February 4, 2011, SIIL announced the completion of the acquisition of the 74.0% stake in BMM for a consideration of Rs. 11,529 million ($ 250.9 million), net of refund of $ 9.3 million. On February 15, 2011, SIIL announced the completion of the acquisition of 100.0% stake in Lisheen for a consideration of Rs. 25,020 million ($ 546.2 million). The purchase price for the zinc business was paid in US dollars and has been converted into Indian Rupees based on the exchange rate as on the date of each such acquisition.
On February 3, 2011, the board of SIIL approved the acquisition of 100% ownership of Malco Power Company Limited for a consideration of Rs. 0.5 million and Malco Industries Limited for a consideration of Rs. 1.3 million. The acquisition of Malco Power Company Limited and Malco Industries Limited was completed on February 19, 2011 and March 4, 2011, respectively. Malco Power Company Limited was renamed as Sterlite Ports Limited and it received its new certificate of incorporation on October 5, 2011. Malco Industries Limited was renamed as Sterlite Infraventures Limited and it received its new certificate of incorporation on January 23, 2012. Subsequent to the change in name of Malco Power Company Limited and Malco Industries Limited, the registered offices of both the companies were shifted from Mettur to Tuticorin in the state of Tamil Nadu.
On November 28, 2011, THL Zinc Holding B.V. acquired the entire outstandingequity share capital of Lakomasko BV for a consideration of $ 37.7 million from VRHL, a wholly owned subsidiary of Vedanta. Consequently, Lakomasko BV becameCairn India Limited. Prior to the subsidiary of SIIL.
On June 14, 2015,Cairn India Merger with the Company, announcedVedanta had a proposed merger with Cairn India in a cashless all stock transaction which was approved by the stock exchange. Thereafter on July 22, 2016, the Company and Cairn India Limited announced the revised terms to the merger. As per the revised terms, on completion the non-controlling shareholderstotal ownership interest of Cairn India will receive for each59.89% (including equity shareinterests held one equity share in Vedanta Limited of face value Re. 1 each, and four 7.5% Redeemable Preference Shares in Vedanta Limited with a face value of Rs. 10 each. No shares will be issued to Vedanta Limited or any ofthrough its subsidiaries for their shareholding in Cairn India. The transaction is conditional on Vedanta Limited, Cairn India and Vedanta plc shareholder approvals, as well as the Indian High Court, and other customary approvals. Vedanta Limited will continue to be listed on the BSE and NSE, with ADSs listed on the NYSE.
Consolidation and re-organization of Sesa Goa, SIIL, Vedanta Aluminium, Sterlite Energy and MALCO to form Sesa Sterlite and transfer of Vedanta’s shareholding in Cairn India to Sesa Sterlitesubsidiary, TMHL).
On February 25, 2012, Vedanta announced anall-share merger of Sesa Goa and SIIL to create Sesa Sterlite and to effect the consolidation and simplification of Vedanta’s corporate structure through two series of transactions (together the“Re-organization Transactions” Transactions” consisting of the “Amalgamation“Amalgamation andRe-organization Scheme” Scheme” and the ““Cairn India Consolidation”).
Pursuant to the share purchase agreement dated February 25, 2012 between BFL, a wholly owned subsidiary of Sesa Goa and VRHL, BFL acquired 38.68% shareholding in Cairn India Consolidation”Limited and an associated debt of $ 5,998 million by way of acquisition of TEHL, for a nominal cash consideration of $ 1 (“Cairn India Consolidation”).
On March 2, 2012, Sesa Goa acquired 100% of the equity share capital of Goa Energy Private Limited engaged in the business of power generation from Videocon Industries. The name was subsequently changed to Goa Energy Limited on January 4, 2013
Pursuant to the Amalgamation andRe-organization Scheme effective on August 17, 2013, Re-organization Transactions became effective and theour name of the merged entity was changed to Sesa Sterlite Limited with effect from September 18, 2013.
On August 19, 2013, Sesa Goa furnished to the SECSecurities and Exchange Commission (“SEC”) a notice, as required under Rule12g-3(f) under the Securities Exchange Act of 1934, as amended (“Exchange Act”) which provided that Sesa Goa was the successor issuer to SIIL under the Exchange Act. Further, the notice provided that the equity shares of Sesa Goa with a par value of Re. 1 each, would be traded in the United States in the form of ADSs, where each ADS would represent four equity shares of Sesa Goa and such ADSs would be deemed to be registered under Section 12(b) of the Exchange Act by operation of Rule 12g-3(a) under the Exchange Act. The ADSs of Sesa Goa were registered for trading on the NYSE on September 13, 2013. On September 23, 2013, Sesa Goa submitted to the SEC that the name of Sesa Goa Limited was changed to Sesa Sterlite Limited following the approval from the Registrar of Companies, Goa on September 18, 2013.
Our equity shares are listed and traded on the NSE and the BSE. Our American Depositary Receipts (“ADRs”) are quoted on the NYSE (NYSE:VEDL). Our equity shares have been included in BSE Sensex, a diversified index of 30 Indian stocks listed on the BSE since July 28, 2008. Our equity shares continue to remain listed in Sensex after the completion of the Re-organization Transactions. Sesa Goa was a part of CNX Nifty (“Nifty”) since October 2010 and after the completion of the Re-organization Transactions we continue to be a part of Nifty.
Our equity shares are beneficially held by the Twin Star, Finsider, Westglobe and Welter Trading, which are in turn wholly-owned subsidiaries of Vedanta. Twin Star, Finsider, Westglobe and Welter Trading held 46.5%, 13.5%, 1.5%, 1.3%, respectively, of our share capital as of March 31, 2016.
The Amalgamation and Re-organization Scheme
The Amalgamation and Re-organization Scheme waswere made effective in the month of August 2013. In accordance with the Amalgamation and Re-organization Scheme Transactions:
| i. | SIIL merged with and into Sesa Goa through the issue of Sesa Goa shares to SIIL shareholders (other than MALCO) on a 3 for 5 basis resulting in the issue of 1,944,874,125 Sesa Goa shares to SIIL shareholders. The holders of SIIL ADSs received 3 Sesa Goa ADSs for every 5 existing SIIL ADSs. The outstanding convertible bonds of SIIL have become convertible bonds of Sesa Goa with equivalent rights and obligations; |
| ii. | MALCO’s power business was sold to Vedanta Aluminium for cash consideration of Rs. 1,500 million; |
| iii. | MALCO merged with and into Sesa Goa through the issue of Sesa Goa shares to the shareholders of MALCO on a 7 for 10 basis, resulting in the issue of 78,724,989 Sesa Goa shares to the shareholders of MALCO and therefore MALCO’s holding in SIIL was cancelled; |
| iv. | Sterlite Energy merged with and into Sesa Goa for no consideration; |
| v. | Vedanta Aluminium’s aluminium business merged with and into Sesa Goa for no consideration; and |
| vi. | Through a separate but concurrent amalgamation under Indian and Mauritian law, Ekaterina Limited, a Mauritian company and a wholly owned subsidiary of Vedanta which held Vedanta’s 70.5% ownership interest in Vedanta Aluminium, merged with and into Sesa Goa. SIIL held the remaining 29.5% of the shares of Vedanta Aluminium and upon this concurrent amalgamation scheme becoming effective, Vedanta Aluminium became a wholly-owned subsidiary of Sesa Sterlite. |
Further, the notice provided that the equity shares of Sesa Goa with a par value of Rs. 1 each, would be traded in the United States in the form of ADSs, where each ADS would represent four equity shares of Sesa Goa and such ADSs would be deemed to be registered under Section 12(b) of the Exchange Act by operation of Rule12g-3(a) under the Exchange Act. The ADSs of Sesa Goa were registered for trading on the NYSE on September 13, 2013. On September 23, 2013, Sesa Goa submitted to the SEC that the name of Sesa Goa Limited was changed to Sesa Sterlite Limited following the approval from the Registrar of Companies, state of Goa on September 18, 2013
Subsequent to the effectiveness of the Amalgamation and Re-organization Scheme, Transactions, a special leave petition challenging the orders of the High Court of Bombay at Goa was filed by the Commissioner of Income Tax, Goa and the Ministry of Corporate Affairs at the Supreme Court of India. Further, a creditor and a shareholder have challenged the Amalgamation andRe-organization Scheme in the High Court of Madras. These petitions are pending for hearing and admission.
Cairn India Consolidation
Prior to the Re-organization Transactions, Sesa Goa along with one of its subsidiaries Sesa Resources Limited, held 20.1% of the total outstanding equity share capital of Cairn India. Pursuant to the share purchase agreement dated February 25, 2012 between BFL, a wholly owned subsidiary of Sesa Goa and VRHL, BFL acquired 38.68% shareholding in Cairn India and an associated debt of $ 5,998 million by way of acquisition of TEHL, for a nominal cash consideration of $ 1. With effect from August 26, 2013, TEHL, TMHL and Cairn India Limited (including all of its subsidiaries) have becomebecame subsidiaries of Sesa Goa.Goa pursuant to the Cairn India Consolidation. As a result, Sesa Sterlite held 58.76% of the total shareholding of Cairn India as of August 26, 2013. As of March 31, 2016, Vedanta Limited held 59.88%59.89% of the total shareholding of Cairn India.
Acquisition of Power Assets
Through a slump sale agreement dated August 19, 2013 between Vedanta Aluminium and Sesa Goa, the power business consisting of a 1,215 MW thermal power facility situated at Jharsuguda and a 300 MW co-generation facility (90 MW operational and 210 MW under development) at Lanjigarh, was purchased by the Company at a consideration of Rs. 28,929 million ($ 482.2 million).
Merger of Goa Energy Limited and Sterlite Infra Limited
India Limited. During fiscal year 2015, Goa Energy Limited and Sterlite Infra Limited, wholly owned subsidiaries, merged with the Vedanta Limited. The High Court of Bombay had approved the scheme of amalgamation of the Goa Energy Limited on March 12, 2015 and the High Court of Madras had approved the Scheme of Amalgamation of Sterlite Infra Limited on March 25, 2015.
Brief HistoryOn April 22, 2015, Sesa Sterlite Limited submitted to the SEC regarding the name change to Vedanta Limited following the approval from the Registrar of SesaCompanies, Goa
Sesa Goa was incorporated as a private company under the laws of India in Panaji, state of Goa, India on June 25, 1965 as Sesa Goa Private Limited. It became a public limited company following a public offering of its shares in 1981. In 2007, Vedanta Resources, through its subsidiaries, acquired 51.0% of Sesa Goa Limited from Mitsui Co. Ltd. which was subsequently increased to 55.13% by fiscal year 2013.April 21, 2015.
On June 14, 2015, the Company announced the merger of Cairn India Limited with the Company by way of a Scheme of Arrangement (the “Cairn India Merger”). Thereafter on July 22, 2016, the Company and Cairn India Limited announced the revised terms to the Cairn India Merger. The National Company Law Tribunal, Mumbai Bench approved the Cairn India Merger and their respective shareholders and creditors on March 23, 2017. Thereafter, the board of directors of the Company made the Cairn India Merger operative on April 11, 2009, Sesa Goa entered into2017. As per the revised terms of the Cairn India Merger, the Company issued one equity share of face value Rs. 1 each and four 7.5% Redeemable Preference Shares in the Company with a face value of Rs. 10 each to thenon-controlling shareholders of Cairn India Limited for each equity share purchase agreementheld. No shares were issued to the Company or any of its subsidiaries for their shareholding in Cairn India Limited. The Company continues to be listed on the BSE and NSE, with ADSs listed on the NYSE.
Cairn India Limited shareholders who became the shareholders of V.S. Dempo & Co. PrivateVedanta Limited, (which later changed its name to Sesa Resources Limited) pursuant to which Sesa Goa agreed to purchase the entire issued share capital of Sesa Resources Limited for a total considerationalso received an interim dividend of Rs. 17,500 million ($ 264.1 million) on a debt-free and cash-free basis other than with respect to two loans owed to Mitsui and17.70 per equity share as approved by the Bank of India, New York. The transaction included the purchaseboard of the entire issued share capital of Sesa Resources’ wholly-owned subsidiary, Sesa Mining Corporation Limited, and 50.0% of the share capital held by Sesa Resources Limited in Goa Maritime Private Limited. The assets acquired include mining leases, mining rights and related infrastructure in Goa.
On July 25, 2011, Sesa Goa entered into a share purchase and operation agreement with Elenilto Minerals & Mining LLC, WCL and BFL, pursuant to which BFL agreed to acquire 51.0% of the fully diluted ordinary share capital of WCL for a cash consideration of $ 90 million. Subsequently,Company on December 20, 2012, BFL acquired the remaining 49.0% of the fully diluted ordinary share capital of WCL from Elenilto Minerals & Mining LLC for $ 33.5 million.
On December 8, 2011, Sesa Goa along with its subsidiary Sesa Resources Limited, completed the acquisition of 20.1% of the equity share capital of Cairn India. As of this date, Vedanta had a total ownership interest of 59.88% (including equity interests held through its other subsidiary, TMHL).
On March 2, 2012, Sesa Goa acquired 100% of the equity share capital of Goa Energy Private Limited engaged in the business of power generation from Videocon Industries. The name was subsequently changed to Goa Energy Limited on January 4, 2013.30, 2017.
B. Business Overview
OUR INDUSTRY
Unless otherwise indicated, all data relating to the zinc and copper industries contained in this Annual Report is primarily derived from Wood Mackenzie and other industry sources.Mackenzie. Unless otherwise indicated, all data relating to the aluminiumaluminum industry contained in this Annual Report is primarily derived from CRU International LtdAluminum Market Outlook (“CRU”) and other industry sources.. Unless otherwise indicated, all data relating to the oil and gas industry contained herein is primarily derived from BP Statistical Review of World Energy JuneOutlook, 2016. Unless otherwise indicated, all data relating to the iron ore industry contained herein is primarily derived from the Bureau ofWorld Steel Association, Resources and Energy Economics, Australia (“BREE”)Quarterly, Bloomberg and the United States Geological Survey (“USGS”).India Brand Equity Foundation.
Unless otherwise indicated, all financial and statistical data relating to the power industry in India in the following discussion is derived from the Central Electricity Authorityresearch presentations of India’s General Review (2004-05 to 2013-14),the Monthly Report on Short-term Transactions of Electricity in India by Central Electricity Regulatory Commission and other industry sources.Brand Equity Foundation. The data may have beenre-classified for the purpose of presentation. Unless otherwise indicated, the data presented excludes captive power generation capacity and captive power generation. The term “units” as used herein refers to kilowatt-hours or kWh.
Unless otherwise stated, the years mentioned in this disclosure contained herein are calendar years.
ZincMarket Review
Global Zinc Market
Backgroundeconomy and commodity markets
Despite a series of economic and political events during the year which resulted in volatility in global markets, the commodities index ended fiscal year 2017 25.0% higher as a result of a more positive macroeconomic environment, according to Bloomberg. The principal use for zincglobal economy was boosted by an improvement in the westUS economy and increased infrastructure spending, financial reforms and the introduction of stimulus measures in China. This uplift in global economic activity has increased demand for commodities in particular iron ore, aluminium, copper, oil and gas and has led to higher prices.
In addition, as a result of adverse environment over the past few years and limited investment by mining companies, a lack of new mining projects coming on stream is galvanizing, which involves coating steel with zincleading to guard against corrosion. supply pressures for some commodities, particularly zinc.
We therefore expect to see continued tightening in the commodity markets over the next few years as demand starts to exceed supply.
Outlook
While we anticipate some volatility in the commodity markets, we expect commodity markets to remain robust following the market rally in 2016 and the recovery in the global economy during the fourth quarter of 2016 to continue its momentum, leading to higher levels of employment and rising incomes.
According to Wood Mackenzie, galvanizing (including sheet, tube, wirethe International Monetary Fund’s World Economic Outlook, April 2017, global growth is projected to increase from an estimated 3.1% in 2016 to 3.5% in 2017 and general galvanizing) accounted3.6% in 2018. This is an upward revision of 0.1 percentage point for approximately 60%2017 relative to World Economic Outlook, October 2016.
In advanced economies growth is expected to be largely be driven by the US. Expectations of world’shigher spending on critical infrastructure following the US presidential election in 2016 (with projections of $ 1 trillion infrastructure plans over the next 10 years) and relaxed fiscal policies are fuelling expectations of further growth.
Emerging market and developing economies are also set to experience a rise in activity on the back of the partial recovery in commodity prices which is expected to be a key factor in global growth. According to the International Monetary Fund, emerging and developing economies now account for more than 75% of global growth in output and consumption, almost double the share just two decades ago.
China’s growth trajectory, also plays an important role in the commodity market. Chinese growth forecasts were revised upwards in October 2016 and the Chinese economy is now projected to grow at 6.6% in 2017 and 6.2% in 2018.
This growth is expected to support commodity prices in the short-term. Vedanta Limited’s diversifiedlow-cost portfolio and attractive basket of zinccommodities positions us well to take advantage of the recent increase in economic activity.
Indian economy
India is a key market for Vedanta and one which we believe has huge growth potential. According to the International Monetary Fund’s World Economic Outlook, April 2017, India is expected to grow by 7.2% in fiscal year 2012.The main end-use industries for galvanized steel products are2017 and 7.7% in fiscal 2018.It remains the construction and infrastructure industries, automobile manufacturing, consumer products and industrial machinery manufacturers, and it is these industries on which zinc consumption ultimately depends. The next largest use of zinc is in the production of die-casting alloys (13%), brass semis and castings (11%) and oxides and chemicals (9%). Alloys are principally used in vehicles, toys and hardware etc.
The end-user market is dominated by the construction industry, with 50% of global end-use zinc consumption, followed by the transport sector (21%), infrastructure (16%), industrial machinery (7%) and consumer products (6%), according to Wood Mackenzie.
The zinc industry has three broad categories of producers:
For custom smelters, Tc rates have a significant impact on profitability, as prices for zinc concentrate are equal to the LME price net of Tc, and prices of finished zinc products are equal to the LME price plus a premium. A significant proportion of concentrates is sold under frame contracts and Tcs are negotiated annually. The main conditions of the contract which are subject to negotiation are the Tcs that are expressed in US dollars per dry metric ton of concentrate and price participation (under long-term contracts). The Tc rates are influenced by the supply and demand situation in the concentrate market, prevailing and forecasted LME prices and mining and freight costs.
Global Zinc Reserves
As of December 31, 2015, global zinc reserves were estimated to be 200 million tons, according to preliminary estimates by the USGS. Australia, China, Peru, Mexico and India collectively account for 75.5% of world reserves.
The following table sets forth world zinc reserves:
| ||||
| ||||
| ||||
| ||||
| ||||
| ||||
| ||||
| ||||
| ||||
| ||||
| ||||
| ||||
Source: USGS, Mineral Commodity Summaries, January 2016
Zinc Consumption
Global zinc consumption increased 0.6% in 2015, from a volume of 13.8 million tons in 2014 to 13.9 million tons in 2015 according to Wood Mackenzie.
Asia, Europe and North America together accounted for approximately 91.9% of global zinc consumption in 2015. Turkey, China, the Russian Federation, Thailand, South Korea and Indonesia followed by India, are among the fastest growing substantial zinc marketsfastest-growing major economy in the world withand is now ranked the world’s top investment destination by Ernst & Young’s 2015 India attractiveness survey. Confidence in its growth story is increasing as the GoI continues to drive reforms such as the introduction of Goods and Services Tax (“GST”) that encourage development. In addition, enhanced transparency, accountability, auction based forward-looking framework and liberalization of the Foreign Direct Investment (“FDI”) policy will help unlock India’s economic potential. As a compounded annualresult, India’s medium-term growth rate (“CAGR”)prospects are favorable. Sustained economic growth will lead to development, greater prosperity and an overall increase inper-capita spending.
Positive demographic factors including an increase in the Indian workforce are leading to higher demand for urban development including infrastructure, housing, consumer goods and appliances. It is estimated that India has a significant unmet need for investment in infrastructure, estimated around $ 650 billion over the next five years. Investment in the urban development sector is being further boosted by a range of 11.7%, 7.9%, 7.4%, 6.9%, 6.5%, 5.4%government initiatives including the Smart City Initiative, Digital India Campaign, construction of highways and 4.6% respectively between 2009 and 2014. China and India are expected to lead future growth as well.a high speed rail network.
The following table sets forthmanufacturing sector in India also continues to expand. The Indian automotive sector, one of the regionalmost vibrant in the world, is currently ranked sixth in global vehicle production and continues to show strong growth.
As a result, the Indian economy has enjoyed progressive growth during fiscal 2016 which has led to significant increases in metals demand.
Outlook
Looking ahead, we expect to see continued investment in infrastructure and increasing metals demand and we are anticipating changes in government policies to incentivize home-grown metal and energy production with the objective to reduce import levels. We believe Vedanta Limited is well-placed to leverage India’s growth potential and contribute to its economic development, given our proven track record in India.
Zinc
After the supply-deficit driven rally of 2016, zinc LME kept gathering pace with the January-July (till July 20, 2017) average being $2,700 per ton as against $1,835 per ton during the same period in 2016. Despite being under pressure for some time in 2017, zinc is still trading at $2,750 per ton level currently. This has majorly been due to strong macroeconomic data and drastically falling LME warehouse stocks. The Purchasing Manager Index (“PMI”) for both manufacturing and construction in Europe, US and Japan show that both of these zinc intensive sectors are gaining momentum. WoodMackenzie reports that zinc consumption patternis forecast to grow by 3.0% in 2017 to 14.7MT.
On the supply side, anecdotal reports of refined zinc in 2015:
| Year Ended December 31, 2015 | ||||||||
| Volume | % | |||||||
(thousands of tons, except percentages) | ||||||||
Europe | 2,328 | 16.8% | ||||||
China | 6,616 | 47.5% | ||||||
Rest of Asia(1) | 2,208 | 15.8% | ||||||
North America | 1,416 | 10.1% | ||||||
Latin America | 385 | 2.8% | ||||||
India | 634 | 4.7% | ||||||
Oceania | 143 | 1.4% | ||||||
Africa | 138 | 0.9% | ||||||
|
|
|
| |||||
Total (rounded) | 13,915 | 100.0% | ||||||
|
|
|
| |||||
Notes:
Source: Wood Mackenzie Metals Market Service Report—Long Term Outlook, Q2, 2016
Zinc Supply
According to Wood Mackenzie, the five largest zinc mining countries are China (36.4%), Australia (12.2%), Peru (9.9%), India (6.5%)tight grip of environmental and safety regulation on Chinese mine production have been confirmed with output falling by 1.7% for the United States (6.0%).These countries collectively accounted for 71.1%first half of total zinc mined worldwide in 2015. The five largest zinc mining companies in 2016 were Glencore Xstrata (7.9%), HZL (5.9%), Teck Limited (5.1%), Votorantim (3.0%) and Boliden (2.6%).
The following table sets forth2017. Another development from the regional production pattern of zinc mines in 2015:
| Year Ended December 31, 2015 | ||||||||
Region | Volume | % | ||||||
(thousands of tons, except percentages) | ||||||||
Europe | 899 | 6.8% | ||||||
China | 4,767 | 36.5% | ||||||
Rest of Asia(1) | 903 | 6.9% | ||||||
North America | 1,760 | 13.4% | ||||||
Latin America | 2,013 | 15.4% | ||||||
India | 846 | 6.5% | ||||||
Australia | 1,599 | 12.2% | ||||||
Africa | 302 | 2.3% | ||||||
|
|
|
| |||||
Total | 13,089 | 100.0% | ||||||
|
|
|
| |||||
Source: Wood Mackenzie Metals Market Service Report—Long Term Outlook, Q2, 2016
With a production of 6.1 million tons of refined zinc in 2015, Chinafundamental perspective is the largest single zinc-producing country10.0% year on year decline in the world. The other major zinc producing countries South Korea (6.6%), India (6.1%), Canada (4.9%) and Japan (4.1%) account for approximately 65.9% of total globalChinese refined zinc production. The five largestlatest data from China’s National Bureau of Statistics demonstrate that China’s smelter production growth is being constrained by the availability of economic concentrate. The reported production in May, 2017 totalled 481kt, a year on year decline of 9.9%. For the first four months of 2017, Chinese mine and smelter production has flat-lined with growth of less than 1.0% (+10 kt Zn).
Indian zinc producing companies in 2015 were Korea Zinc Company Limited (8.3%), Nyrstar NV (7.2%), Glencore Xstrata (6.6%), HZL (5.5%), and Votorantim Group (4.0%), which together accounted for about 31.6%industry performance is heavily dependent on the domestic steel market as 70.0% of the totalzinc produced goes into galvanizing sector. The National Steel Policy released in May, 2017 offered a much needed respite for the Indian steel industry which is facing severe lack of confidence from investors. Key government projects like the Smart City Initiative, Smart Railway Stations, Dedicated Freight Corridors and Affordable Housing would provide a continued push to the infrastructure growth in thelong-run.
Products and customers
Vedanta Limited’s zinc production primarily caters to demand in India. Approximately 68 to 75% of the refined zinc produced worldwideis sold in 2015.the Indian market and the remainder is exported.
The following table sets forth the regional production pattern of refined zinc in 2015:
| Year Ended December 31, 2015 | ||||||||
Region | Volume | % | ||||||
(thousands of tons, except percentages) | ||||||||
Europe | 2,224 | 16.0% | ||||||
China | 6,150 | 44.2% | ||||||
Rest of Asia(1) | 2,289 | 16.5% | ||||||
North America | 1,186 | 8.5% | ||||||
India | 850 | 6.1% | ||||||
Latin America | 635 | 4.6% | ||||||
Oceania | 486 | 3.5% | ||||||
Africa | 83 | 0.5% | ||||||
|
|
|
| |||||
Total | 13,903 | 100.0% | ||||||
|
|
|
| |||||
Notes:
Source: Wood Mackenzie Metals Market Service Report—Long Term Outlook, Q2, 2016
Pricing
Zinc is traded on the LME. Although prices are determined by LME price movements, producers normally charge a regional premium that is market driven.
During 2015, zinc prices averaged at $1,914 by year end, which was 11.4% lower than last year.
The following table sets forth the movement in zinc prices from 2006 to 2015:
| Year ended December 31 | ||||||||||||||||||||||||||||||||||||||||
| Zinc Prices | 2006 | 2007 | 2008 | 2009 | 2010 | 2011 | 2012 | 2013 | 2014 | 2015 | ||||||||||||||||||||||||||||||
| ($ per ton, except percentages) | ||||||||||||||||||||||||||||||||||||||||
LME Cash Price | 3,272 | 3,248 | 1,870 | 1,658 | 2,158 | 2,190 | 1,946 | 1,910 | 2,162 | 1,914 | ||||||||||||||||||||||||||||||
% Change | 136.9 | (0.7) | (42.4) | (11.3) | 30.1 | 1.5 | (11.1) | (1.9) | 13.2 | (11.4) | ||||||||||||||||||||||||||||||
Source: Wood Mackenzie Metals Market Service Report—Long Term Outlook, Q2, 2016
The last closing LME zinc cash price was $ 1,785 per ton as of March 31, 2016.
Indian Zinc Market
Background
The USGS estimates India’s zinc reserves to be around 10 million tons, making it the sixth largest country in terms of zinc reserves globally (USGS, Mineral Commodity Summaries, January 2016). The Indian zinc industry has only two domestic producers. The leading producer is our majority-owned subsidiary, HZL. HZL had an estimated 79.1% market share in India in fiscal year 2016, accordingAccording to the IndianIndia Lead and Zinc Development Association. According to ILZDA,Association, Vedanta Limited is the only otherlargest zinc producer in India but not integrated and depends on imports of zinc concentrate, is Binani Zinc Limited, which had awith 72.0% market share of one percent of the Indian market in terms of sales volume in fiscal year 2016. According to ILZDA, imports and secondary sources accounted for the remaining 19.9% market share.
Consumption Pattern
According to Wood Mackenzie,2017. 70.0% of Indian zinc consumption of refined zinc in India reached 634,000 tons during 2015. The principal use of zincis used in the Indian market isgalvanising sector, predominantly in the construction and infrastructure sector, which currently accountssectors. We also produce zinc for an estimated 70.0%use indie-casting alloys, brass and oxides and chemicals. Indian steel companies are our main customers in the domestic market.
Approximatelyone-half of total consumption.the zinc that is produced is used globally in galvanizing iron and steel. Key export destinations include Nepal, Bangladesh, Taiwan, China, New Zealand, Sri Lanka, Korea, south-east Asia and the Middle East.
Zinc Consumption (million tons)
Source: Wood Mackenzie, forecasts Indian refined zinc demand to increase at a CAGR of 6.6% from 634,000 tons in 2015 to 873,000 tons in 2020.Zinc Long-term Outlook Q1 2017
Pricing and Tariff
Indian zinc prices track global prices as the metal is priced on the basis of the landed costs of imported metal.
The following table sets out the customs duties that were applicable on zinc for the periods indicated:Refined Implied Surplus / Deficit (kilo tons)
| ||||
In addition, the Finance Act (2 of 2004) of India levied an additional surcharge of 3.0% on the total customs duty payable.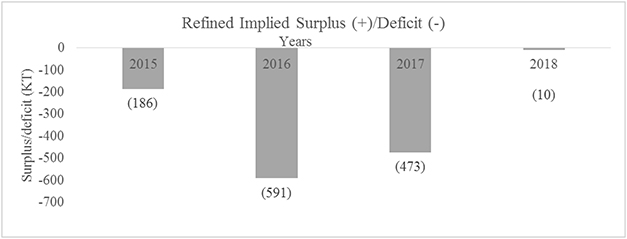
Source: Wood Mackenzie, Zinc Long-term Outlook Q1 2017
Market Outlook
Global zinc outlookdrivers and opportunities
Global zinc demand is forecasted to grow at 3.7% in 2016 as per Wood Mackenzie. Glencore’s decision to cut mine production in 2015 by 100ktUrbanization and a further 500kt in 2016 has transformed the near term fundamentals for zinc.
After three years of abnormal market dynamics with surplusesindustrialization, especially in the concentrate market and deficits in the refined market, the dynamic returned to normal in 2015 with deficits in both the concentrate and refined markets. 2016 is projected to be the fifth year of a global refined market deficit and the year when the sustained draw down of general inventories should begin to manifest itself in the form of lower exchange stocks towards the end of the year.
Refined market tightness is forecast to become acute in 2017 and 2018.
Indian zinc outlook
Indian zinc demand saw a reduction in growth of (2.2%), mainly on the account of subdued demand from the galvanized steel sector, which accounts for approximately 70% of the total zinc demand. Recent mine closures and price-induced shutdowns have resulted in a deficit in the market and fundamentalsdeveloping world, are improving. With the GoI’s impetus to stop the influx of cheap steel imports, the sector is slowly recuperating and demand is picking up. The 2016 demand growth is projected at 7.6%.
Global Oil and Gas Market
Background
The short term outlook of US Energy Information Administration (“EIA”) published in April 2016, pegs global oil demand for 2016 at 94.9 mmbopd vis-à-vis the 2015 demand of 93.7 mmbopd, an increase of 1.3%. Real Gross Domestic Product (“GDP”) (weighted by oil consumption) is expected to increase by 2.3% in 2016. The demand from countries which are not members of the Organization for Economic Cooperation and Development (“OECD”) is expected to grow by 1.0 mmbopd in 2016 as compared to 2015 averages but a slowdown in Chinese growth poses downside risk. OECD demand, is expected to grow by 0.2 mmbopd in 2016. Japanese and European demand is expected to decline. The United States is expected to remain the leaderdriving forces behind global zinc consumption. China which accounts for 47.0% and India which accounts for 4.81% of OECD demand.global demand, are the main markets, due to government efforts in both countries to boost investment in construction and infrastructure.
In India, zinc consumption per capita currently stands at 0.5 kg, significantly below the global average of 1.9 kg. India represents a significant opportunity for zinc sales going forward, as we expect the Indian market to continue to exhibit strong growth towards global levels of consumption, underpinned by the government’s initiatives to boost housing and infrastructure. As a result, we expect India to become the leading consumer of zinc in the future and Vedanta Limited’s market leading position andramp-up in production well places the Company to take advantage of this growth.
Global consumption is also expected to grow steadily, at a rate of approximately 2.0% per annum, and our plans to bring production online at our Gamsberg growth project this year will benefit from the current favorable market conditions.
Oil and gas
According to the BP Statistical ReviewEnergy Information Administration’s (EIA) Short-term Energy Outlook (STEO) of World Energy 2016, the global consumption forJuly 2017, benchmark North Sea Brent crude oil grewspot prices averaged $ 46 per barrel in June 2017. This is a $ 4 per barrel decrease from the May average and the lowest monthly average since November, 2016 when prices averaged $ 45 per barrel. Further, the EIA STEO states that Brent crude oil prices are forecast to average $ 51 per barrel in 2017 and $ 52 per barrel in 2018.
Organization of the Petroleum Exporting Countries (OPEC) andnon-members led by 1.9%Russia agreed on May 25, 2017 to extend their 1.8 million barrels per day supply cut through first quarter of 2018. The goal of OPEC output agreement is to rebalance the oil market.
Products and customers
Our operations produce crude oil which is sold to hydrocarbon refineries and natural gas which is used by the fertilizer sector.
Market drivers and opportunities
Due to sustained low levels of oil prices internationally, approvals of new conventional crude oil projects in 2015 and increased2016 fell to 95,008 kbopd,the lowest level seen since the 1950s and the International Energy Agency (“IEA”) believes that if approvals remains low in 2017, an unprecedented effort will be needed to avoid a rise of 1,899 kbopd over consumption in 2014. The increase in crude oil consumptionsupply and demand gap in the Asia-Pacific and the Middle East regions in 2015 over 2014 was 1,325 kbopd and 217 kbopd respectively.
North America and Europe witnessed an increase of 0.9% and 0.4% in crude oil consumption in 2015 vis-a-vis 2014 with total crude oil consumption in 2015 decreasing by 340 kbopd.
The global consumption for natural gas grew by 1.7% in 2015 and increased to 3,468.6 bcm, a rise of 57.9 bcm over gas consumption in 2014. The increase in natural gas consumption in North America and the Asia-Pacific region in 2015 over 2014 was 16.6 bcm and 3.7 bcm, respectively. Europe and Eurasia witnessed a 2.9 bcm decrease in gas consumption in 2015 vis-a-vis 2014 with total gas consumption in 2015 decreasing to 1,003.5 bcm.
(Source: BP Statistical Review of World Energy 2016)
Global Oil and Gas Reserves
Global oil reserves were estimated to be 1,697.6 billion barrels, as of December 31, 2015 and global gas reserves were estimated at 186.9 tcm. In 2015, Venezuela, Saudi Arabia, Canada, Iran and Iraq had the majority of oil reserves and collectively account for nearly 61.2% of the world’s reserves. On the other hand, Iran, Russian Federation, Qatar, Turkmenistan and the United States have the majority of gas reserves, accounting for nearly 63.5% of the world’s reserves in 2015.
The following table summarizes the current distribution of the world’s oil reserves:
| As of December 31, 2015 | ||||||||
| Oil | ||||||||
Country | Reserves | Share of Total(1) | ||||||
| (In billion barrels) | (in percentage) | |||||||
Venezuela | 300.9 | 17.7% | ||||||
Saudi Arabia | 266.6 | 15.7% | ||||||
Canada | 172.2 | 10.1% | ||||||
Iran | 157.8 | 9.3% | ||||||
Iraq | 143.1 | 8.4% | ||||||
Russian Federation | 102.4 | 6.0% | ||||||
Kuwait | 101.5 | 6.0% | ||||||
UAE | 97.8 | 5.8% | ||||||
United States | 55.0 | 3.2% | ||||||
Libya | 48.4 | 2.8% | ||||||
Nigeria | 37.1 | 2.2% | ||||||
Kazakhstan | 30.0 | 1.8% | ||||||
Other Countries | 185.0 | 10.9% | ||||||
|
|
|
| |||||
World Total | 1,697.9 | 100.0% | ||||||
The following table summarizes the current distribution of the world’s gas reserves:
| As of December 31, 2015 | ||||||||
| Natural Gas | ||||||||
Country | Reserves | Share of Total | ||||||
| (In tcm) | (in percentage) | |||||||
Iran | 34.0 | 18.2% | ||||||
Russian Federation | 32.3 | 17.3% | ||||||
Qatar | 24.5 | 13.1% | ||||||
Turkmenistan | 17.5 | 9.4% | ||||||
United States | 10.4 | 5.6% | ||||||
Saudi Arabia | 8.3 | 4.5% | ||||||
United Arab Emirates | 6.1 | 3.3% | ||||||
Venezuela | 5.6 | 3.0% | ||||||
Nigeria | 5.1 | 2.7% | ||||||
Algeria | 4.5 | 2.4% | ||||||
China | 3.8 | 2.1% | ||||||
Iraq | 3.7 | 2.0% | ||||||
Other Countries | 31.0 | 16.6% | ||||||
|
|
|
| |||||
World Total | 186.9 | 100.0% | ||||||
|
|
|
| |||||
Source: BP Statistical Review of World Energy 2016
Note
Global Oil and Gas consumption and production
In 2015, the global oil consumption grew by 1.90 mmbopd or 1.9% over the 2014 demand. Global oil consumption increased from 93,109 kbopd in 2014 to 95,008 kbopd in 2015, according to the BP Statistical Review of World Energy 2016.
The United States was the largest consumer of oil in 2015, with a global market share of around 19.7%, followed by China at 12.9%, India at 4.5% and Japan at 4.4%.
Natural gas consumption grew by 1.7% rising from 329.9 bcf in 2014 to 335.6 bcf in 2015. The United States is the largest consumer of natural gas, with annual demand of 75.3 bcf, singularly accounting for 22.8% of global demand. Other prominent natural gas consuming countries are Russia and China, accounting for 11.2% and 5.7%, respectively.
The following table sets forth the regional consumption pattern for oil and gas:
| Year Ended December 31, 2015 | ||||||||||||||||
| Oil Volumes | Gas Volumes | |||||||||||||||
| (in kbopd) | %(1) | (in bcf per day) | % | |||||||||||||
North America | 23,644 | 23.9% | 93.2 | 28.1% | ||||||||||||
United States | 19,396 | 19.7% | 75.3 | 22.8% | ||||||||||||
Others | 4,248 | 4.3% | 18.0 | 5.3% | ||||||||||||
South & Central America | 7,083 | 7.5% | 16.9 | 5.0% | ||||||||||||
Argentina | 679 | 0.7% | 4.6 | 1.4% | ||||||||||||
Brazil | 3,157 | 3.2% | 4.0 | 1.2% | ||||||||||||
Others | 3,247 | 3.6% | 8.4 | 2.5% | ||||||||||||
Europe & Eurasia | 18,380 | 19.9% | 97.1 | 28.8% | ||||||||||||
Russia | 3,113 | 3.3% | 37.9 | 11.2% | ||||||||||||
Germany | 2,338 | 2.5% | 7.2 | 2.1% | ||||||||||||
France | 1,606 | 1.8% | 3.8 | 1.1% | ||||||||||||
Others | 11,323 | 12.3% | 48.2 | 14.3% | ||||||||||||
Middle East | 9,570 | 9.8% | 47.4 | 14.1% | ||||||||||||
Saudi Arabia | 3,895 | 3.9% | 10.3 | 3.1% | ||||||||||||
Iran | 1,947 | 2.1% | 18.5 | 5.5% | ||||||||||||
Others | 3,728 | 3.9% | 18.6 | 5.5% | ||||||||||||
Africa | 3,888 | 4.2% | 13.1 | 3.9% | ||||||||||||
Asia Pacific | 32,444 | 34.7% | 67.8 | 20.1% | ||||||||||||
China | 11,968 | 12.9% | 19.1 | 5.7% | ||||||||||||
Japan | 4,150 | 4.4% | 11.0 | 3.3% | ||||||||||||
India | 4,159 | 4.5% | 4.9 | 1.5% | ||||||||||||
Others | 12,167 | 12.9% | 32.9 | 9.8% | ||||||||||||
|
|
|
|
|
|
|
| |||||||||
Global Total | 95,008 | 100.0% | 335.6 | 100.0% | ||||||||||||
|
|
|
|
|
|
|
| |||||||||
Source: BP Statistical Review of World Energy 2016
Note
Global oil production increased by 2.8 mmbopd, or 3.2% in 2015 compared to 2014. Global oil production increased from 88.8 mmbopd in 2015 to 91.6 mmbopd in 2014, according to the BP Statistical Review of World Energy 2016.
The United States was the largest producer of oil in 2015 with a global market share of 13.0% (12,704 kbopd), followed by Saudi Arabia at 13.0% (12,014 kbopd) and Russia at 12.4% (10,980 kbopd).
Global gas production increased from 335.1 bcf per day in 2014 to 342.4 bcf per day in 2015, registering a growth of 2.2%. The United States was the largest producer of natural gas at 74.2 bcf per day with global market share of 22.0% during the year ended December 31, 2015, followed by Russia at 16.1%.
The following table sets forth the regional production pattern for oil and gas:
| Year Ended December 31, 2015 | ||||||||||||||||
| Oil Volume | Gas Volume | |||||||||||||||
| (in kbopd) | %(1) | (in bcf per day) | % | |||||||||||||
North America | 19,676 | 20.9% | 95.2 | 28.1% | ||||||||||||
United States | 12,704 | 13.0% | 74.2 | 22.0% | ||||||||||||
Others | 6,973 | 7.9% | 21.0 | 6.1% | ||||||||||||
South & Central America | 7,712 | 9.1% | 17.3 | 5.0% | ||||||||||||
Venezuela | 2,626 | 3.1% | 3.1 | 0.9% | ||||||||||||
Brazil | 2,527 | 3.0% | 2.2 | 0.6% | ||||||||||||
Others | 2,559 | 3.0% | 11.9 | 3.5% | ||||||||||||
Europe & Eurasia | 17,463 | 19.4% | 95.8 | 27.8% | ||||||||||||
Russia | 10,980 | 12.4% | 55.5 | 16.1% | ||||||||||||
Others | 6,483 | 7.0% | 40.3 | 11.7% | ||||||||||||
Middle East | 30,098 | 32.4% | 59.8 | 17.4% | ||||||||||||
Saudi Arabia | 12,014 | 13.0% | 10.3 | 3.0% | ||||||||||||
Others | 18,084 | 19.4% | 49.5 | 14.4% | ||||||||||||
Africa | 8,375 | 9.1% | 20.5 | 6.0% | ||||||||||||
Nigeria | 2,352 | 2.6% | 4.8 | 1.4% | ||||||||||||
Others | 6,023 | 6.5% | 15.6 | 4.5% | ||||||||||||
Asia Pacific | 8,346 | 9.1% | 53.9 | 15.7% | ||||||||||||
China | 4,309 | 4.9% | 13.3 | 3.9% | ||||||||||||
India | 876 | 0.9% | 2.8 | 0.8% | ||||||||||||
Others | 3,161 | 3.3% | 37.7 | 11.0% | ||||||||||||
|
|
|
|
|
|
|
| |||||||||
Global Total | 91,670 | 100.0% | 342.4 | 100.0% | ||||||||||||
|
|
|
|
|
|
|
| |||||||||
Source: BP Statistical Review of World Energy 2016
Note
Pricing
Prices of various crude oils are based upon the prices of the key physical benchmark crude oils such as Brent, West Texas Intermediate, and Dubai/Oman etc. Crude oil prices move based upon market factors like supply and demand. The regional producers price their crude against benchmark crude prices by placing a premium or a discount over the benchmark based on the quality differentials and competitiveness of the various grades.
In 2015, Europe Brent spot prices averaged around $ 52.3 per barrel, around 47.2% lower as compared to the 2014 average. Europe Brent Spot prices were highly volatile and traded within a range of $ 26-66 per barrel during fiscal year 2016, ending the year at $ 36.8 per barrel according to US Energy Information Administration (Europe Brent Spot Price F.O.B (Dollars per Barrel), Release Date – May 04, 2016.
The movement of annual average oil prices from 2006 to 2015 was as follows:
| Annual Average Prices | ||||||||||||||||||||||||||||||||||||||||
| 2006 | 2007 | 2008 | 2009 | 2010 | 2011 | 2012 | 2013 | 2014 | 2015 | |||||||||||||||||||||||||||||||
| Europe Brent Spot Price, USD/barrel | 65.2 | 72.4 | 96.9 | 61.7 | 79.6 | 111.3 | 111.6 | 108.6 | 99.0 | 52.3 | ||||||||||||||||||||||||||||||
% Change | 19.4% | 11.2% | 33.8% | (36.3%) | 28.9% | 39.8% | 0.3% | (2.7%) | (8.8%) | (47.2%) | ||||||||||||||||||||||||||||||
Source: US Energy Information Administration (Europe Brent Spot Price FOB (Dollars per Barrel), Release Date – May 04, 2016)
As there is no single global market for natural gas, the natural gas market is evolving differently in different geographic regions. Globally, there are three main regional hubs for the pricing of natural gas: the United States (Henry Hub Prices), the United Kingdom (NBP Price), and Japan (imported gas price, mostly linked to crude oil).
Indian Oil and Gas Market
Backgroundfuture.
According to the BP Statistical ReviewPetroleum, Planning and Analysis Cell’s, Snapshot of World Energy 2016, IndiaIndia’s Oil and Gas Data, March 2017, the Indian oil and gas market remains highly dependent on imports as 82.0% of its oil consumption and 44% of its gas consumption is fulfilled by imports. During fiscal 2017, gas imports were at their highest level for four years as domestic production has fallen steadily.
The GoI recognizes the need to increase investments and boost domestic production to achieve greater energy security while lessening India’s dependency on imports. To this end, the government is targeting a refining surplus country,10.0% reduction in India’s imports of oil and gas by 2022 and have introduced a number of reforms and new policies aimed at attracting investment and boosting production.
India’s basins offer significant opportunities as it remains largely underexplored with a total refining capacity of 4,307 kbopd. However, the country is primarily dependent upon crude oil imports to meet its demand which was 3,919 kbopd in 2015. Domestic crude oil only contributes about 876 kbopd (20%)7 of the country’s total refining demand.
According to26 sedimentary basins currently producing oil and gas. As the Ministry of Petroleum and Natural Gas, national oil companies like ONGC and Oil India Limited are the primary producerslargest private sector producer of crude oil in India together accounting for approximately 510 kbopd of domestic production. Cairn India is a major private producer, with a net operating production of 89.1 kbopd for fiscal year 2016.
Indiastrong track record and growth pipeline in exploration and development, Vedanta Limited is a gas deficient country withwell-positioned to benefit from the GoI’s desire to boost domestic production being 29.2 billion cubic meters with total liquefied naturaland to leverage India’s oil and gas imports of 21.7 billion cubic meters during 2015 according to BP Statistical Review ofresource potential.
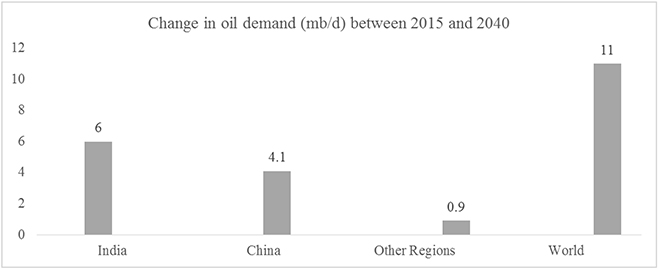
Mb/d- Million barrels per day
Source: IEA, World Energy 2016.Outlook 2016
Nationalized oil companies like ONGC and Oil India Limited are the primary producers of natural gas in India, with Reliance Industries Limited being the dominant private producer. Fertilizer units, gas-based power plants, city-gas distribution entities and industrial consumers are the primary consumers of natural gas produced in India. For fiscal year 2016, Cairn India had a net operating production of 11.8 mmscfd.
Consumption Pattern
According to the BP Statistical Review of World Energy 2016, India was the third largest consumer of oil after the United States and China, consuming 4,159 kbopd (4.5% of global consumption) of oil in 2015. On the other hand, India accounted for daily gas consumption of 4.9 bcf (1.5% of global consumption) in 2015.
Pricing and Tariff
Domestic Indian crude oil is also priced with reference to international benchmark crude, with appropriate adjustments for differences in quality. At present, there is no duty imposed on imported oil, whereas domestic crude oil sales are subject to local levies such as central sales tax or value added tax.
The current applicable tax rates for crude oil are as follows:
| ||||
|
In October 2014, GoI issued the New Domestic Natural Gas Pricing Guidelines, 2014. The gas price determined under these guidelines is applicable to all natural gas produced domestically with certain specified exceptions. The GoI issues the natural gas price based on the New Domestic Natural Gas Pricing Guidelines, 2014 on a half-yearly basis through the Petroleum Planning and Analysis Cell of the Ministry of Petroleum and Natural Gas. Domestic natural gas sales are subject to local levies such as central sales tax or value added tax.
The current applicable tax rates for natural gas sold from Cairn India assets are as follows:
| ||||
|
Iron Ore
Global Iron Ore Market
Background
Iron ore isprices increased in 2016, mainly due to therebounding of the key raw material usedfutures market, which helped push the spot benchmark above $ 90 per dmt for the first time since 2014. The Chinese government announced a deadline to make pig iron and steel. According to the Mineral Information Institute, 98%halt substandard steel production of minedelectric arc furnaces in June 2017 causing iron ore is usedand steel futures to produce steel.rise.
The iron ore itself is usually found in the form of magnetite, hematite, goethite, limonite or siderite. Hematite is also known as natural ore. The name refersBetween 2017 to the early years of mining, when certain hematite ores contained 66% iron and could be fed directly into iron making blast furnaces.
The iron ore industry has two broad categories of producers:
In recent years, steel producers have increasingly secured their iron ore supplies through long-term contracts, strategic investments in iron ore projects, and acquisitions of iron ore producers.
World Iron Ore Reserves
As of December 31, 2015, global crude iron ore reserves were estimated at 190 billion tons according to the preliminary estimates by the USGS as published in January 2016. Australia, Brazil, Russia, China and United States collectively account for approximately 71.8% of world crude iron ore reserves
The following table sets for the world iron ore reserves as of December 31, 2015:
| Crude Ore | Iron Content | |||||||
| (million tons) | ||||||||
Australia | 54,000 | 24,000 | ||||||
Russia | 25,000 | 14,000 | ||||||
Brazil | 23,000 | 12,000 | ||||||
China | 23,000 | 7,200 | ||||||
United States | 11,500 | 3,500 | ||||||
India | 8,100 | 5,200 | ||||||
Ukraine | 6,500 | 2,300 | ||||||
Canada | 6,300 | 2,300 | ||||||
Sweden | 3,500 | 2,200 | ||||||
Iran | 2,700 | 1,500 | ||||||
Kazakhstan | 2,500 | 900 | ||||||
South Africa | 1,000 | 650 | ||||||
Other countries | 18,000 | 9500 | ||||||
|
|
|
| |||||
World total (rounded) | 190,000 | 85,000 | ||||||
|
|
|
| |||||
Source: USGS, Mineral Commodity Summaries, January 2016
World Trade in Iron Ore
Global iron ore demand is projected to remain relatively flat, continued displacement of domestically produced iron ore in China with seaborne iron ore is expected to result in a modest increase in international trade. As a reflection of this, the global iron ore trade is projected to increase by 1.3% a year between 2015 and 2021, to reach 1.6 billion tons.
The following table sets for the world iron ore trade (million tons)
| ||||
| ||||
| ||||
| ||||
| ||||
| ||||
| ||||
| ||||
| ||||
| ||||
| ||||
| ||||
| ||||
Sources: BREE Resources and Energy Quarterly, March Quarter 2016
Iron ore imports
China is projected to remain the largest source of growth in iron ore imports over the medium term because of the expected continued displacement of domestic production, which is relatively high cost and lower quality compared with seaborne iron ore. China’s imports are projected to reach 1.0 billion tons in 2021, up from an estimated 968 million tons in 2015, despite slowing demand from the domestic steel industry. China is expected to import 98% of its iron ore needs by 2021 which is up from 83% in 2015.
This assessment assumes that most of China’s high-cost capacity will be closed. China has significant iron ore reserves which is estimated at 7 billion tons after adjusting for iron content, but the low grades require extra processing to make them suitable for steelmaking, which increases the cost of production. If China’s iron ore production does not continue to slow as projected, growth in the global seaborne trade could be as little as half of that which has been projected, prices would be lower and Australia’s exports would grow less than expected.
India is projected to transition from being a net exporter of iron ore in 2014 to importing 46 million tons of iron ore in 2021. While India has significant reserves of iron ore, estimated at 8.1 billion tons at 64% iron content, the high cost of production coupled with output caps in the key producing regions of Karnataka, Odisha and Goa mean that it is unlikely that India will be able to produce sufficient quantities of iron ore to meet demand from its growing steel industry.
While India is projected to become a significant source of growth in seaborne iron ore demand over the medium term, this may not eventuate if government mining restrictions are lifted or export duties are reduced. In addition, the GoI may introduce policies to ensure that it is self-sufficient in iron ore. Further, there is some uncertainty around the projections for India’s steel production, which determines the level of domestic demand.
The United States is also projected to transition to become a net importer of iron ore, importing 20% of its iron ore needs in 2021. This reflects continued moderate growth in US steel production coupled with expectations for lower iron ore mine capacity over the medium term.
Iron ore exports
Export growth is projected to come almost entirely from Australia and Brazil, an increase projected from 52% and 25% in 2015 to 58% and 31% in 2021, respectively. Import growth is projected to largely come from China and India and, to a lesser extent, the United States and Japan.
The rapid decline in iron ore prices since they peaked in 2011 has contributed to an increase in the number of loss-making operations. With prices expected to stay low over the medium term, many higher cost operations are likely to close. In addition, new low cost capacity is expected to be commissioned by 2021, which is expected to further displace higher cost producers. With most of the low cost production expected from Australia and Brazil, these two countries are projected to increase their share of global iron ore exports from a combined 77% in 2015 to 90% in 2021.
Australia’s iron ore exports are forecast to increase by 10 per cent to 846 million tonnes in 2016, and to continue to increase over the projection period to reach 926 million tonnes in 2021.
Australia’s iron ore exports over the medium term are projected to be supported by an expansion of production from Australia’s largest iron ore miner, Rio Tinto. Rio Tinto is expected to commission its Koodaideri and Turee Syncline projects, both of which are currently undergoing feasibility studies in the next few years, while production at Rio Tinto’s Hamersley mines is expected to increase following capacity expansions.
While Australia’s largest iron ore mines are generally low cost and are anticipated to remain viable till 2021, an extended period of low prices is expected to result in closures at smaller, high cost mines. For example, Pluton Resources’ Cockatoo Island project went into care and maintenance in August 2015 due to financial difficulties. In addition, Gindalbie’s Karara iron ore mine, which mainly produces low value magnetite, has been running at a loss and is at risk of closing following a decision by Chinese partner Ansteel to withdraw funding support.
Brazil’s iron ore exports are forecast to grow by 7% in 2016 and by 5% a year on average until 2021, despite the temporary closure of the BHP Billiton and Vale joint-owned Samarco mine. In November 2015, iron ore production ceased at Samarco due to a severe tailings dam burst. The mine, which has a productive capacity of 32 million tons a year, may take several years to obtain the necessary environmental approvals to recommence operation. The Samarco mine is projected to remain closed over the medium term. If it reopens earlier, Brazil’s iron ore production would increase faster than projected.
The projected growth in iron ore production in Brazil is underpinned by new, low cost capacity being completed. In particular, operations at Vale’s S11D expansion at the Carajás complex are scheduled to begin in 2016. Production at S11D is expected to increase over several years to eventually reach 90 million tons a year. S11D is the world’s largest iron ore mining project and is expected to deliver ore at low cost. However, as is expected in Australia and the rest of the world, new low-cost capacity in conjunction with soft growth in global demand is expected to result in some closures at smaller, high cost Brazilian operations.
Consumption and Supply
Global consumption and supply of iron ore closely reflects the consumption and supply scenario in steel, as about 98% of the global iron ore production is used in steel making.
World steel consumption
World steel consumption is estimated to have fallen by 2.4% in 2015 to 1.61 billion tons, due in large part to a slowdown in investment activity in China. Increased consumption in India, the United States and other emerging economies was insufficient to offset falling demand in China, Brazil and Russia.
China’s steel consumption is estimated to have decreased by 4.8% in 2015, the fastest rate in more than 15 years. Most of the decline in China’s steel consumption in 2015 was attributable to lower steel use in construction, although demand for use in railways, machinery and ship building also contracted. This was partially offset by a moderate increase in steel demand in the production of automobiles and household appliances. Automobiles and household appliances collectively represent around 9% of China’s steel consumption.
China’s steel consumption is projected to continue to decrease each year over the medium term, although the rate of decline is expected to moderate. By 2021, China’s steel consumption is projected to be 640 million tons which is 14% lower than its 2014 peak of 740 million tons. Underpinning China’s declining demand for steel is a slowdown in residential property construction and, more broadly, the Government’s objective of steering the economy away from relatively steel-intensive investment-led growth toward a less steel-intensive consumption-led growth path.
While growth in construction fixed asset investment continued to improve in the first two months of 2016, significant over-investment during the past few years is expected to dampen construction activity over the medium term. In particular, China’s property sector is well-supplied and a drawdown in surplus housing stock will take time. Between 2009 and 2015, China commenced construction of 8,760 million square metres of residential floor space, but only sold 7,072 million square metres.
China is expected to continue to invest in infrastructure over the short to medium term. Notably, the thirteenth Five-Year Plan (2016–2020) included planned expenditure of $ 538 billion on new rail tracks. Increased domestic consumer spending is expected to support higher manufacturing activity. However, growth in steel demand from these sectors is unlikely to outweigh falling demand from the construction sector, which accounts for the majority of China’s steel use.
India’s steel consumption is projected to grow rapidly, underpinned by strong economic growth, urbanisation, investment in infrastructure and the expansion of its manufacturing base.
India’s projected steel demand implies a steel intensity of 97 kilograms per person in 2021. This remains well below that of Organisation for Economic Co-operation & Development (“OECD”) countries, which consumed 414 kilograms of steel per person in 2014. India’s relatively low steel consumption per person reflects its limited urbanisation to date, with increases in steel intensity largely determined by the rate at which a country urbanises and industrialises.
World steel production
In 2016, global steel production is forecast to decline for a second consecutive year because of lower production in China. However, production is projected to increase slowly from 2017, as output in India and large advanced economies expands. Despite the expected return to growth,2022, global steel production is projected to be lowergrow at an annual average rate of 1.2%, a modest rebound from 2015 and 2016, to reach 1.73 billion tons in 2021 than it was in 2014, with lower2022. Declining production in China, which produces half the world’s steel, is projected to be only partly offset by increaseda rapid expansion in India’s steel output, and to a lesser extent, higher production elsewhere.growth in Japan, South Korea, the United States and the European Union.
China’sProducts and customers
Vedanta Limited is India’s largest producer and private sector exporter of iron ore. Approximately 35.0% of our production, which comes primarily from Karnataka is sold in India and 65%, comprising low grade ore from Goa is exported, primarily to China.
Iron ore is a key ingredient in steel production and steel products in India are mainly used in the construction, infrastructure and automotive sectors. Production is estimatedsold domestically to have declined by 2.1% to 806 million tons in 2015, following relatively steady production in 2014. Despite the slowdown in China’s steel production, consumption has declined faster, and for longer. This contributed to lower steel prices in China and a rapid increase in China’s steel exports. China’s net exports of crude steel were an estimated 101 million tons in 2015 which is more than double the volume exported three years earlier and equivalent to 6% of global production.
Partly responsible for the sharp increase in China’s steel exports was the slow response of China’s state-ownedIndian steel producers and exported to lower prices. It is estimated that during 2015, 21% of China’s steel producers (weighted by output) operated at a cash loss compared with 6% and 4% of producers in Japan and India, respectively. China’s steel exports are projected to moderate over the medium term, as the government curbs production at the most inefficientChinese steel mills.
TheMarket drivers and opportunities
In the longer-term, we expect continued demand from both the Indian and Chinese Government has announced that it intendsmarkets due to reduce steel capacity between 100 and 150 million tons by 2021.Achieving this target depends on the central government ensuring local governments implement the necessary policies, which may resultongoing investment in job losses.
On balance, China’s steel production is forecast to decrease by 3.1 % in 2016, with the rate of decline moderating till 2021. This assessment is sensitive to the ability of the government to reduce production as well as domestic demand conditions.
Japan’s steel production declined by 5% to 105 million tons in 2015, because of lower demand both domestically and for Japan’s steel exports. Its steel production is forecast to increase by 2.1% in 2016, reflecting an assumed increase in economic growth. South Korea’s crude steel production declined by 2.6% in 2015 despite improved domestic demand conditions, as steel exports fell by 9%.
The United States’ steel production declined by 10% in 2015, despite strong domestic demand conditions stemming from improved construction and manufacturing activity.The Dodge Index of New Construction Starts averaged 12% higherinfrastructure. In the short-term, the World Steel Association has projected growth in 2015 thanIndian steel demand by 6.1% in 2014,2017 while industrial production in manufacturing increased by 2.0%. A draw down in inventories and lower exportglobally steel demand put downward pressure on US steel production in 2015. Steel product inventories fell by 16% to 8.3 million tons, while exports fell by 17% to 9 million tons.
The United States steel product imports declined by 13% in 2015, suggesting that domestic consumers did not substitute domestic production with imported production. Despite this, in February 2016 the United States Government imposed preliminary duties on imports of cold-rolled steel on seven countries, including a 266% duty on Chinese steelmakers. In addition, the US Government has announced its intention to introduce anti-dumping duties on certain hot-rolled steel products from seven countries, including Australia. Australia exported approximately 313,000 tons of crude steel equivalent to the United States in 2015, equivalent to 6% of Australian steel production.
Steel production in the United States isbeen projected to grow at an average annual rate of 2.5% over the medium term reflecting an expected continuation of the United States economic recovery.
India’s steel production increased by 3.5% to 90 million tons in 2015. This growth was supported by anti-dumping duties and import taxes on certain steel products introduced in late 2015. Prior to the introduction of these measures, low-cost steel imports from China were forcing India’s steelmakers to limit output. However, imports have now begun to fall, declining by 22% in 2015.
Steel production in India is projected to continue to grow at an average rate of 7% a year over the medium term, supported by investment in new production capacity. However, this rate is significantly lower than would be implied by the GoI’s targets. The GoI has announced an ambitious steel production target of 300 million tons a year by 2025, which would require an average annual increase in production of 13%1.3%.
While this rate of growth is not unprecedented, China’s steel production grew at a similar rate over the last decade and India is not projected to reach this target. This is largely because India is a relatively high cost steel producer (higher than Australia and China), and does not have the advantages that China has in terms of transport infrastructure and access to low-cost financing. As a result, producers are subject to tough import competition. The reduced availability of domestic iron ore for steel making because of mining restrictions in key locations may also limit India’s production growth.
In addition, it is uncertain whether there will be sufficient domestic demand to support the level of steel production that has been targeted. Assuming all of India’s steel production under the GoI’s target is consumed domestically, it would result in India’s steel intensity increasing to more than 200 kilograms per person in 2025, from an estimated 70 kilograms in 2015.
The following table sets forth the world steel consumption and production (in million tons):
| ||||
| ||||
| ||||
| ||||
| ||||
| ||||
| ||||
| ||||
| ||||
India, | ||||
| ||||
| ||||
| ||||
| ||||
| ||||
| ||||
| ||||
| ||||
| ||||
| ||||
| ||||
Sources: BREE; World Steel Association.
Pricing
The following table sets forth the movement in annual average of iron ore prices from 2011 to 2015:
| Year Ended December 31, | ||||||||||||||||||||
| 2011 | 2012 | 2013 | 2014 | 2015 | ||||||||||||||||
Iron Ore | ($ per dry metric ton, except percentages) | |||||||||||||||||||
China Imported Iron Ore Fines (62% iron, cost and freight Tianjin Port) | 167.6 | 128.3 | 135.3 | 96.84 | 55.21 | |||||||||||||||
% Change | 14.2 | (23.4) | 5.4 | (28.43) | (43) | |||||||||||||||
Source: Bloomberg- PIORECR Index
Iron ore prices are projected to be higher until 2021, but remain well below levels recorded during the height of the mining boom.
While iron ore prices briefly rebounded to $61 per ton in early 2016, increasing global supply coupled with lower demand from China’s steel sector is forecast to result in prices softening by end of the year to average $45 per ton in 2016.
At current prices, a number of high-cost producers, mostly outside of Australia, are making large losses on each ton of iron ore produced. A sustained period of lower prices till 2021 is expected to result in the closure of high-cost capacity as the financial losses of these companies begin to accumulate.
Although these closures will provide some support to prices, new low cost capacity being developed, particularly in Australia and Brazil, should limit any price increase. If high cost capacity takes longer to be closed than anticipated, or if costs at new or existing mines can be reduced further, prices may stay lower for longer
Indian Iron Ore Market
Background
India has been a traditional exporter of iron ore, with most of the exports going to China, Japan, South Korea and other East Asian countries. Overseas iron ore mining companies are looking to acquire rights to explore, mine and export iron ore from India. Key players include National Mineral Development Corporation, Vedanta Limited, Kudremukh Iron Ore Co., Rungta Mines Ltd, Mineral Sales Private Limited and Essel Mining & Industries Ltd. Apart from these, some of the integrated steel companies like Steel Authority of India and Tata Iron and Steel Companies have their own captive mines. Global steel companies such as Pohang Iron and Steel Company, based in South Korea are in the process of constructing greenfield steel production plants integrated into iron ore mines.
Pricing and tariff
Contract prices are determined by the, National Mineral Development Corporation, a government owned agency, which usually reacts to firm rise in international prices, though with a lag time, by increasing the domestic prices to align with the international prices.
The GoI set an export duty on iron ore fines with less than 62% iron content of Rs. 50 per ton while the export duty on iron ore fines with an iron content of 62% or more and all grades of lumps was Rs. 300 per ton. On June 13, 2008, the GoI changed the export duty on iron ore to 15% ad valorem on the F.O.B value of exports. On February 28, 2011, India raised the duty to 20% from 5% on fines and to 20% from 15% on lumps with effect from March 1, 2011. With effect from December 30, 2011, the GoI raised the rate of export duty on iron ore fines as well as lumps to 30%. The GoI has reduced the rate of export duty on iron ore fines of less than 58 grade from 30% to 10%, which is effective from June 1, 2015. On February 28, 2016 the GoI reduced the export duty on iron ore fines and lumps of less than 58 grade to 0%.
Copper
Global Copper Market
Background
Copper consumption can be divided into three main product groups: copper wire rod, copper products and copper alloy products. According to International Copper Study Group (“ICSG”) Factbook, the predominant use of copper has been the production of copper wire rod, which accounted for an estimated 54% of total global consumption (i.e. including scrap) or approximately 28.3 million tons in 2015. The other uses of copper are tubes, alloys, powder ingots, foils etc. Wire rod is consumed in five main wire and cable markets which include general and industrial cable, utility power cable, telecommunication cable, other insulated wire and winding wire.
For the year 2014, the equipment segment accounted for 31% of total copper consumption, followed by the building construction segment (30%), the infrastructure segment (15%), the transport segment (12%) and the industrial segment (12%) of the global copper consumption market, as reported by ICSG Factbook.
The copper industry has three broad categories of producers:
Global Copper Reserves
Global copper reserves were estimated to be, as of December 31, 2015, 720 million tons, according to preliminary estimates by USGS, Mineral Commodity Summaries, January 2016. Chile, Australia, Peru, Mexico and United States have the majority of copper reserves and collectively account for 64% of world reserves.
| ||||
| ||||
| ||||
| ||||
| ||||
| ||||
| ||||
| ||||
| ||||
| ||||
| ||||
| ||||
Source: U.S. Geological Survey – Mineral Commodity Summaries 2016
Refined Copper Consumption & Production
Global refined copper consumption grew by 1.2% to 21.8 million tons in 2015 as compared to 21.6 million tons in 2014.
China was the largest consumer of refined copper in 2015 with a global market share of 46.4%, raising Asia’s combined market share to 63%, followed by Europe (16.9%), North America (10.9%), Russia and the Caspian (3%) and Latin America, Caribbean and Middle East balancing out the rest.
The following table sets forth the regional consumption pattern of refined copper for 2015:
| Year Ended December 31, 2015 | ||||||||
| Volume | % | |||||||
| (thousands of tons, except percentages) | ||||||||
Africa | 227 | 1.0% | ||||||
China | 10,131 | 46.4% | ||||||
India | 447 | 2.0% | ||||||
Japan | 1,020 | 4.7% | ||||||
Rest of Asia | 2,180 | 10.0% | ||||||
Europe | 3,688 | 16.9% | ||||||
Latin America | 508 | 2.4% | ||||||
North America | 2,378 | 10.9% | ||||||
Rest of the World | 1,252 | 5.7% | ||||||
|
|
|
| |||||
Global Total (rounded) | 21,831 | 100.0% | ||||||
|
|
|
| |||||
Source: Wood Mackenzie— Global Copper Short Term Outlook, April 2016
The following table sets forth the regional production pattern of refined copper for 2015:
| Year Ended December 31, 2015 | ||||||||
| Volume | % | |||||||
| (thousands of tons, except percentages) | ||||||||
Africa | 1,394 | 6.4% | ||||||
China | 6,986 | 31.9% | ||||||
India | 791 | 3.6% | ||||||
Japan | 1,483 | 6.8% | ||||||
Rest of Asia | 1,121 | 5.1% | ||||||
Europe | 2,924 | 13.3% | ||||||
Latin America | 3,276 | 15.0% | ||||||
North America | 1,894 | 8.6% | ||||||
Other | 2,032 | 9.3% | ||||||
|
|
|
| |||||
Total | 21,901 | 100.0% | ||||||
|
|
|
| |||||
Source: Wood Mackenzie— Global Copper Short Term Outlook, April 2016
Pricing
Copper is traded on the LME. Although prices are determined by LME price movements, producers normally charge a regional premium that is market driven. Copper price movements in 2015 defied market fundamentals with world copper stocks (expressed in days of consumption) estimated to have decreased slightly as copper consumption growth again outpaced the rise in production. China remained the main driver of world copper consumption in 2015 despite a slowdown and accounted for 45% of the world’s refined copper consumption. Copper prices declined from $ 7,949 per ton in 2012 to $ 5,494 in 2015. This slippage can be attributed to factors such as the slowdown of the Chinese economy, the decreased usage of the metal as collateral for loans, and low crude oil prices.
The following table sets forth the movement in copper prices from 2006 to 2015:
| Annual Average | ||||||||||||||||||||||||||||||||||||||||
| 2006 | 2007 | 2008 | 2009 | 2010 | 2011 | 2012 | 2013 | 2014 | 2015 | |||||||||||||||||||||||||||||||
| ($ per ton, except percentages) | ||||||||||||||||||||||||||||||||||||||||
LME Cash Price | 6,729 | 7,125 | 6,951 | 5,163 | 7,539 | 8,810 | 7,949 | 7,322 | 6,862 | 5,494 | ||||||||||||||||||||||||||||||
% Change | 82.7 | 5.9 | (2.4) | (25.7) | 46.0 | 16.9 | (9.8) | (7.9) | (6.3) | (19.9) | ||||||||||||||||||||||||||||||
Source: Wood Mackenzie Metals Market Service—Long Term Outlook, March 2016
The closing LME copper cash settlement price on March 31, 2016 was $ 4,952 per ton.
According to the TcRc average rates published by Wood Mackenzie, in 2012, spot quotes averaged $ 0.099 per pound, representing a 37.3% decline on 2011 level. However spot quotes rose to $ 0.196 per pound and increased by 98% in 2013 according to Wood Mackenzie data. The TcRc rate for 2014 over 2013 rose by 24.5% from $ 0.196 to $ 0.244 per pound, while in 2015 it decreased to $ 0.215, a decrease of 11.8%.
The following table sets forth the movement in copper spot (mine to trader) annual average TcRc from 2006 to 2015 in nominal dollars:
| Annual Average | ||||||||||||||||||||||||||||||||||||||||
| 2006 | 2007 | 2008 | 2009 | 2010 | 2011 | 2012 | 2013 | 2014 | 2015 | |||||||||||||||||||||||||||||||
| (US cents per pound, except percentage) | ||||||||||||||||||||||||||||||||||||||||
TcRc (30% Concentrate) | 16.3 | 7.2 | 7.3 | 7.4 | 7.1 | 15.8 | 9.9 | 19.6 | 24.4 | 21.5 | ||||||||||||||||||||||||||||||
% Change | (56.8) | (55.8) | 1.4 | 1.4 | (4.1) | 122.5 | (37.3) | 98.0 | 24.5 | 11.8 | ||||||||||||||||||||||||||||||
Source: Wood Mackenzie
Indian Copper Market
Background
The Indian copper industry consists primarily of custom smelters as there are limited copper deposits in the country. The available deposits are owned by Hindustan Copper Limited, a government-owned company. Hindustan Copper Limited was the only producer in India until 1995 and has greatly changed with our entry and the entry of Birla Copper, now owned by Hindalco Industries Limited. The Indian industry can be classified into two broad categories: manufacturers of refined copper (copper cathodes) and manufacturers of copper products. Of the three manufacturers of refined copper, Hindustan Copper Limited is the only primary producer that mines and refines copper. Both Hindalco Industries Limited and us, primarily process imported copper concentrate to produce end products such as copper bars, rods and wires.
We are one of the two custom copper smelters in India with an estimated primary market share of approximately 36% in fiscal year 2016according to the International Copper Association India.
Consumption Pattern
According to the World Copper Factbook 2015 by the International Copper Study Group, India’s per capita consumption of copper in 2014 (0.3 kg per person) is significantly less than that of China (8.0 kg per person) and other developed nations. India’s consumption of copper is dominated by electrical, telecom, engineering, construction and transport activities. There is an imbalance between India’s smelting/refining capacity and its limited production capacity in copper mining.
Pricing and Tariff
Indian copper prices track global prices as the metal is priced on the basis of landed costs of imported metal. The following table sets out the customs duties that were applicable to copper for the period indicated:
| ||||
| ||||
In addition, Cess and Surcharge are levied as per the Customs Circular released by Govt. of India from time to time. Duties imposed on imports under various free trade agreements (FTAs) are applicable as per the respective FTAs.
Aluminium
Global Aluminium Market
Background
Aluminium is lightweight in relation to its strength, durability and resistance to corrosion. It can be extruded, rolled, formed and painted for a wide variety of uses.
The raw material from which aluminium is produced is bauxite, a very common mineral found primarily in tropical regions. It normally occurs close to the surface and can be mined by open-pit methods. The bauxite is refined into alumina. Typically, the alumina content in bauxite ranges from 35% to 60%. There are several different types of bauxite, and alumina refineries are usually designed to treat a specific type. The majority of alumina refineries are therefore integrated with mines.
The importance of different sectors in aluminium demand varies significantly between developed and developing nations. In mature economies, transport plays a more important role in aluminium demand than construction. As estimated by CRU, in 2015, the four largest sectors of end-uses for aluminium in mature economies like Japan, North America and South Korea were transport (41%), packaging (15%), construction (13%), and machinery and equipment (7%). In comparison, in 2015, the four largest sectors of end-uses for aluminium in China were construction (34%), followed by transportation (19%), electrical (17%), and foil stock (11%).
Aluminium consumption
Based on CRU data, global primary aluminium consumption increased from 47.4 million tons in 2012 to 56.4 million tons in 2015, at a CAGR of 6%. The growth was primarily due to increased demand from China, which accounted for 51.7% of total global consumption in 2015. Between 2012 and 2015, China’s demand for primary aluminium increased at a CAGR of 10.9%, compared to an increase of 1.6% for world demand excluding China. In comparison, the CAGR in demand in each of Europe and North America between 2012 and 2015 was 1.4% and 2.8%, respectively, reflecting the impact of a relatively slower economic growth in these regions.
The following table sets forth the regional consumption of primary aluminium in 2015:
| Year Ended December 31, 2015 | ||||||||
Region | Volume | % | ||||||
| (thousands of tons, except percentages) | ||||||||
China | 29,122 | 51.7% | ||||||
Europe including Russia | 8,467 | 15.0% | ||||||
Rest of Asia(1) | 8,378 | 14.9% | ||||||
North America | 6,389 | 11.3% | ||||||
Central & South America | 1,304 | 2.3% | ||||||
India | 1,811 | 3.2% | ||||||
Africa | 660 | 1.2% | ||||||
Australasia | 239 | 0.4% | ||||||
|
|
|
| |||||
Total | 56,370 | 100.0% | ||||||
|
|
|
| |||||
Source: CRU, Aluminium Market Outlook, January 2016
Aluminium supply
Aluminium production has become increasingly more concentrated in recent years, with the leading ten producers accounting for 50.1% of world primary aluminium production in 2015 as reported by CRU. The five largest primary aluminium producing companies are Hongqiao Group (8.9%), UC Rusal (6.3%), Rio Tinto Alcan (5.9%), Aluminium Corporation of China Ltd (“CHALCO”) (5.1%), and Alcoa Inc. (5.1%), which together accounted for approximately 31.3% of the total primary aluminium produced worldwide in 2015.
Global production of primary aluminium increased from 47.9 million tons in 2012 to 57.5 million tons in 2015, at a CAGR of 6.3%. In 2015, North America, Europe and China together accounted for approximately 75.8%, with China alone accounting for 54.3%, of global primary aluminium production.
The following table sets forth the regional production of primary aluminium in 2015:
| Year Ended December 31, 2015 | ||||||||
Region | Volume | % | ||||||
| (thousands of tons, except percentages) | ||||||||
China | 31,208 | 54.3% | ||||||
Europe including Russia | 7,887 | 13.7% | ||||||
North America | 4,473 | 7.8% | ||||||
Rest of Asia(1) | 6,598 | 11.5% | ||||||
Australasia | 1,987 | 3.5% | ||||||
Central & South America | 1,327 | 2.3% | ||||||
India | 2,337 | 4.1% | ||||||
Africa | 1,697 | 3.0% | ||||||
|
|
|
| |||||
Total | 57,514 | 100.0% | ||||||
|
|
|
| |||||
Source: CRU, Aluminium Market Outlook, January 2016
The aluminium balance in the world was recorded at 1.1 million tons surplus, of which Asia recorded a surplus of 0.8 million tons. China had a surplus of 2.1 million tons while the world (excluding China) recorded a supply deficit of 0.9 million tons. It is expected that the supply-demand gap will remain at the same level for the rest of the next year, given the strong demand growth expected in these markets.
Alumina
Alumina is a key raw material for aluminium production. Generally it takes two tons of alumina to produce one ton of primary aluminium. According to data compiled by CRU, in 2015, the five largest alumina producing companies are Alcoa (13.1%), CHALCO (11.9%), Xinfa (9.0%), Weiqiao (8.0%) and Rio Tinto Alcan (6.8%), which together accounted for approximately 48.8% of the total alumina produced worldwide in 2015.
The following table sets forth the regional production of alumina in 2015:
| Year Ended December 31, 2015 | ||||||||
Region | Volume | % | ||||||
| (thousands of tons, except percentages) | ||||||||
China | 56,787 | 50.6% | ||||||
Oceania | 19,854 | 17.7% | ||||||
Latin America | 12,715 | 11.3% | ||||||
Europe | 8,780 | 7.8% | ||||||
India | 5,207 | 4.6% | ||||||
North America | 5,482 | 4.9% | ||||||
Rest of Asia(1) | 3,510 | 3.1% | ||||||
|
|
|
| |||||
Total | 112,335 | 100.0% | ||||||
|
|
|
| |||||
Source: CRU Bauxite and Alumina Market Outlook, May 2016
The following table sets forth the global demand-supply balance for alumina from 2012 to 2015:
| Year Ended December 31 (quantity in million tons) | ||||||||||||||||
| 2012 | 2013 | 2014 | 2015 | |||||||||||||
Global Alumina Surplus/(Deficit) | 2.1 | 1.8 | 0.1 | 0.1 | ||||||||||||
Source: CRU Bauxite and Alumina Market Outlook, May 2016
Bauxite
Bauxite, the principal raw material used in the production of alumina, is typically open-pit mined in very large-scale operations. Between 2.0 to 3.6 dry tons of bauxite are usually required to make one ton of alumina (depending on ore type, alumina content and variables such as proportion of reactive silica and organic matter). Based on data from the USGS as reported in January 2016, Guinea has the largest bauxite reserves in the world (26.9%), followed by Australia (22.5%), Brazil (9.4%), Vietnam (7.6%), Jamaica (7.3%) and Indonesia (3.6%).
The table below sets forth the world reserves as of December 31, 2015:
| Reserves | ||||||||
| (million tons) | % | |||||||
Guinea | 7,400 | 26.9% | ||||||
Australia | 6,200 | 22.5% | ||||||
Brazil | 2,600 | 9.4% | ||||||
Vietnam | 2,100 | 7.6% | ||||||
Jamaica | 2,000 | 7.3% | ||||||
Indonesia | 1,000 | 3.6% | ||||||
Guyana | 850 | 3.1% | ||||||
China | 830 | 3.0% | ||||||
Greece | 250 | 0.9% | ||||||
Suriname | 580 | 2.1% | ||||||
India | 590 | 2.1% | ||||||
Venezuela | 320 | 1.2% | ||||||
Russia | 200 | 0.7% | ||||||
Kazakhstan | 160 | 0.6% | ||||||
United States | 20 | 0.1% | ||||||
Malaysia | 40 | 0.1% | ||||||
Other countries | 2,400 | 8.7% | ||||||
|
|
|
| |||||
World total | 27,540 | 100.0% | ||||||
|
|
|
| |||||
Source: USGS, Mineral Commodity Summaries, January 2016
According to the USGS, World Resources, bauxite resources are estimated to be 55 to 75 billion tons, in Africa (32%), Oceania (23%), South America and the Caribbean (21%), Asia (18%), and elsewhere (6%).
Pricing
Aluminium is an LME-traded metal. It is either sold directly to consumers or on a terminal market. The price is based on the LME price but producers are also able to charge a regional price premium, which generally reflects the cost of obtaining the metal from an alternative source.
Alumina prices are negotiated on an individual basis between buyers and sellers but are usually determined by reference to the LME price for aluminium. The negotiated agreements generally take the form of long-term contracts, but fixed prices can be negotiated for shorter periods and a relatively small spot market also exists.
The following table sets forth the movement in aluminium and alumina prices from 2006 to 2015:
| Year Ended December 31 | ||||||||||||||||||||||||||||||||||||||||
| 2006 | 2007 | 2008 | 2009 | 2010 | 2011 | 2012 | 2013 | 2014 | 2015 | |||||||||||||||||||||||||||||||
Aluminium | ||||||||||||||||||||||||||||||||||||||||
LME Cash Price | $ | 2,566 | $ | 2,639 | $ | 2,571 | $ | 1,667 | $ | 2,173 | $ | 2,395 | $ | 2,019 | $ | 1,846 | $ | 1,867 | $ | 1,663 | ||||||||||||||||||||
% Change | 35.3 | 2.8 | (2.6) | (35.2) | 30.4 | 10.2 | (15.7) | (8.6) | 1.2 | (10.9) | ||||||||||||||||||||||||||||||
Alumina | ||||||||||||||||||||||||||||||||||||||||
Alumina Price Index | 416.58 | 364.38 | 361.21 | 247.50 | 338.54 | 375.94 | 319.00 | 326.37 | 329.50 | 301.21 | ||||||||||||||||||||||||||||||
| Year-on-year change (%) | (8.86) | (12.53) | (0.87) | (31.48) | 36.78 | 11.05 | (15.14) | 2.31 | 0.96 | (8.59) | ||||||||||||||||||||||||||||||
| Alumina/LME Cash % | 16.23 | 13.81 | 14.05 | 14.85 | 15.58 | 15.70 | 15.81 | 17.69 | 17.65 | 18.11 | ||||||||||||||||||||||||||||||
Source: CRU, Aluminium Market Outlook, January 2016
Aluminium and alumina prices have decreased by 35.1% and 27.7% respectively from 2006 to 2015. Between 2014 and 2015, aluminium and alumina prices have decreased by around 10.9 % and 8.6% respectively as a result of sluggishthe liberalization of industrial policy and initiatives to boost infrastructure investment, existing steel plants are being modernized or expanded and a large number of new steel plants based on cost effective, stateof-the-art technologies have also been set up. The rapid and stable growth in demand has also prompted domestic entrepreneurs to consider greenfield projects in a number of states. The GoI’s target is to increase steel production to 300 million tons by 2025 to match India’s growing infrastructure needs. This growth in steel production represents an opportunity for Vedanta Limited to increase its domestic iron ore sales.
While the focus on environmental issues and productivity in China could create challenges and affect demand for low grade iron ore from Chinese steel producers, increased margin pressure due to falling steel prices and volatile coking coal prices could drive Chinese mills to revert to the use of lower grade iron ore to reduce costs.
Copper
Between 2016 to 2021, global refined demand is expected to continue on a moderate growth path, averaging 1.8% per annum. For the longer term, during the 2016 to 2035 period, refined consumption is expected to grow by 1.2% per annum. Over the final quarter of 2016 copper prices firmed up on the prospects of the US’s infrastructure plans and increased demand in China due to a greater government stimulus impact on the power grid investments and higher end use demand, particularly for appliances and consumer goods. This trend has continued into 2017 due to significant mine supply disruptions. Copper prices also firmed up on the prospects of the US’s infrastructure plans and increased demand in China due to a greater government stimulus impact on the power grid investments and higher end use demand, particularly for appliances and consumer goods. The annual average price for 2017 is expected to be at $5,678 per ton.
In India, the refined copper market experienced 8% growth in the global macrofirst half of fiscal 2016 but experienced a slowdown in the quarter ended December 2016 due to demonetization. Nonetheless, the refined copper market started picking up again in the quarter ended March 2017 and is expected to continue growing on par with growth in the Indian economy.
Indian Aluminium MarketOn the supply side, after the fifth consecutive year of mine supply growth in 2016 (5%), the year 2017 started with production disruptions at some of the largest global copper mines such as Escondida, Grasberg and Cerro Verde which supported copper prices.
Background
India has been producing primary aluminium since 1938, andThe 2017 annual benchmark settlements for concentrate showed a 5.0% reduction over the yearsprevious year, mainly due to disruptions resulting in a decline in concentrate availability.
Products and customers
Refined copper is predominantly used in manufacturing cables, transformers and motors as well as making castings and alloy based products.
Vedanta Limited, with its 400 ktpa custom smelter in southern India is the model that prevailed wasmarket leader in India with a market share for refined copper of fully integrated operationsapproximately 35%, and our major customers in India are cable manufacturers, winding wire units and transformer manufacturers. Our exports are mainly to China and South East Asia and these customers are largely served from India. Exports contributed 41.0% of overall sales for fiscal 2017.
Market drivers and opportunities for Vedanta
Globally, higher end use demand in China, particularly for appliances and consumer goods, is driving demand and we expect this trend to continue as Chinese stimulus measures continue.
In India, growth drivers include a range of infrastructure initiatives including the smart cities project, “Housing for all Indians by 2022” program, industrial corridors, National Highways Development Project and a focus on building renewable energy projects under the National Electricity Policy.
We therefore expect to see demand growth in India and China in the coming years. We see opportunities to take advantage of this growth in demand to further grow our market share in India and potentially to expand our smelter capacity and to increase export sales.
Aluminium
Global aluminium demand excluding China grew by 3.0%year-on-year in 2016 while Chinese demand grew by 7.0% last year driven by stronger primary demand supported by stimulus measures. Global aluminium production grew by 3%year-on-year with accessChinese production continuing to bauxite, alumina and power. As this model consolidated, the corporate structure of the aluminium industry also changed, with smaller regional producers being absorbed or merged to form larger integrated players with international presence.
India possesses considerable bauxite resources, estimated at 3.48 billion tons according to the Indian Minerals Year Book 2014. Odisha and Andhra Pradesh account for more than 90%50.0% of country’s metallurgical grade resource’s. In Odisha, accordingglobal supply. Supply side rationalization themes have emerged from China since the start of 2017, with the announcements related to Indian industry sources, bauxite reserves are estimatedwinter production cuts to be 1.8 billion tonscontrol air pollution. Aluminium LME prices moved up 20.0% compared to 2016 lows and premiums gained further as global aluminium markets fell into a deficit. Going forward, LME is expected to average at $1,943 per mt between 2017 to 2021 and premiums showing positive trends.
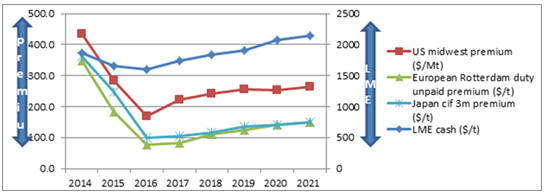
CIF – Cost, insurance and freight
Source: CRU Market Outlook – January 2017
Products and customers
Our aluminium business has the largest integrated aluminium capacity in India (at 2.3 mtpa), and is the second largest producer in the primary market with 38.7% market share. Our aluminium supply is used to produce rods, billets, primary foundry alloys and rolled products for use in products including cables, conductors and in Andhra Pradesh, there are 0.61 billion tons. There are abundant bauxite reserveshouses.
In fiscal 2017 50.0% of our sales were to the Indian market, specifically for use in the country.infrastructure, transportation, packaging, construction and electrical sectors, where there is strong demand as a result of government initiatives.
Overseas demand for our products is strong and our international customer base recorded sales growth of 33.0% over fiscal 2017 to 610 kt with increased footprints in Europe, North and South America and other key Asian markets.
SupplyMarket drivers and demandopportunities
There are currently five refineriesWorld demand for aluminium is expected to increase by 4.0% in 2017. In India, initiatives to develop the country’s infrastructure continue to drive demand and seven smelters operatingwe expect this trend to continue. Additionally, the Power Grid Corporation of India (“PGCIL”) has recently approved investments worth $ 4.5 billion to expand and modernize the national power grid over the next 36 to 48 months which will drive demand in India, owned by four producing companies: National Aluminium Company Limited, Hindalco Industries Limited, Vedanta Limitedthe wire and BALCO.
The aluminium industry in India has traditionally been largely self-sufficient. Until 2012, primary aluminium production has kept pace with demand, with the country being a small net exporter. Growth incable segment. We expect Indian aluminium demand to grow by 7.7% in India has resulted in a supply deficit in primary aluminium since 2012, according2017 and we are ramping up our production at Jharsugada to estimates by CRU. The majoritytake advantage of aluminium produced in India is consumed in the building and construction, transport, electrical appliance and equipment and packaging industries, with limited exportsthese opportunities. We also see significant opportunities to countries including Singapore, Taiwan and the United Arab Emirates. Accordinggrow our international customer base as overseas demand for our products continues to CRU, aluminium consumption in India grewgrow at a CAGR of 0.7% between 2012 and 2015, backed by strong growthfast pace. Consequently, we are aiming to double our sales to international customers in fiscal 2018.
On the electricity, transportation, industrial and infrastructure sectors. CRU forecasts aluminium consumption in Indiasupply side, market views are mixed with respect to grow from 1.8 million tons in 2015China, which is implementing measures to 2.5 million tons in 2020, at a CAGR of 7%.
Pricing and tariff
Domestic aluminium prices track global price trends as producers usually price the metal at a marginal discount to the landed cost of imported metal. Though value-added product prices also track metal price movement, they usually have relatively less volatility and command a premium reflecting the degree of value addition and quality, as indicated by the brand.
The following table sets out the customs duties that were applicable for the periods indicated:
| ||||
The custom duty was 5% from January 3, 2009 to February 29, 2016. In addition, the Finance Act (2 of 2004) of India, which has been in effect since July 8, 2004, levied an additional surcharge at the rate of 2% of the total customs duty payable, which has been further increased to 3% of the total customs duty payable effective March 1, 2007.
Pursuant to a notification dated March 1, 2013, a customs duty of 2.5% was introduced by the GoI on bauxite (natural), in calcined and non-calcined form.
Market Outlook
Global aluminium outlook
control production growth. According to CRU, global primary aluminium production is forecasted to increase by 1.26.2 % in 20162017 to 58.262.5 million tons, with China contributing to 100 % of the increase. Primary aluminium consumption is projected to increase by an average of 3.6% per year in the period from 2015 to 2020.
CRU expects the aluminium market to remain in deficit from 2016 to 2020. During 2017-2020 consumption is projected to exceedtons. Indian production by almost 1.3 million tons, thereby putting pressure on the LME aluminium price and market premiums which CRU forecasts to stay at around $ 1,890 per ton until 2019.
Indian aluminium outlook
Excluding Saudi Arabia, India is the fastest growing aluminium market in Asia. According to CRU, primary aluminium consumption in India is expected to grow atby 18% in 2017 and contribute 72.0% of the production increase globally (excluding China), mainly with the support of our Jharsugada IIramp-up.
Power
Vedanta Limited operates a CAGR9GW diversified power portfolio in India consisting of 7% on average96.0% thermal power and 4% from 2015 to 2020 to reach 2.5 million tons, fuelled by India’srenewable energy sources. India has the fifth largest power generation capacity in the world and demand for housing, retailpower which continues to rise steadily in line with economic growth.
Products and office space. In termscustomers
40.0% of cash costs, Indiaour power portfolio is reasonably well placed globally in primary smelting, lying at the lower endused for commercial power while 60.0% is for captive use. Nearly 95.0% of the second quartile, compared to China, which occupies most of the fourth quartile.power generated for commercial purposes is backed by long-term power purchase agreements with local Indian smelters form part of integrated chains, stretching back to bauxite, alumina and forward into semi-fabricating operations. Indian smelters are also endowed with their own captive power plants and favorable labor costs.
Over the medium term, there will be fewer incentive policies such as those encouraging purchases of new vehicles, but a number of multi-annual government expenditure plans will underpin demand in the coming years. The power sector, for instance, will continue to support aluminium demand as village electrification plans carry on. Infrastructure investment will fuel housing investment over the coming three years.distribution companies.
Commercial Power Generation Business
Organization of the Power IndustryMarket drivers and opportunities

Overview of the Indian Power Sector
A key risk to the continued growth of the Indian economy is inadequate infrastructure. Infrastructure investment in India is on the rise, but growth may be constrained without further improvements. The GoI has identifiedbeen supportive of growth in the power sector assector. It hasde-licensed the electrical machinery industry and allowed 100% (FDI) in this sector. India currently has a key focus areapower deficit and is targeting a total of 88.5GW of additional power capacity by 2017, of which 72.3GW constitutes thermal power, 10.8GW hydro and 5.3GW nuclear. The proportion of power generated by renewable energy sources is also growing. Wind energy is currently the largest source of renewable energy, accounting for an estimated 64.77 per cent of total installed capacity of 24.7GW. There are plans to promote sustained industrial growth.
The current revisedincrease wind power generation capacity to 20GW by 2022. India has also raised its solar power generation capacity target to 100GW, five times the current capacity, by 2022.
The GoI is supportive of growth in the power sector to achieve its vision of “Power for All.” It has already implemented a number of power development schemes for rural and urban areas and a scheme Ujwal Discom Assurance Yojna (“UDAY”) to offer support to the Twelfth Five-Year Plan (i.e. from April 2012 to March 2017) is 88,537 MW. As of March 31, 2016, capacity addition achieved over the 12th Plandistribution companies, which has been 96%well received. Regulatory and policy initiatives to develop energy storage are also being considered to facilitate the expansion of the target addition or 84,991 MW. The total installed powerrenewable energy generation capacity in India was 298,060 MW as of March 31, 2016. According to the CEA Monthly Review published in March 2016, the total provisional energy deficit and peak power deficit for March 2016 was approximately 1.5% and 1.7%, respectively.
Industry Demand-Supply Overview
The Indian power sector has historically been characterized by energy shortages which have been increasing over the years. The following table sets forth the peak and energy shortages of power in India from April 2008 to March 2016:
| Peak | Energy | |||||||||||||||||||||||||||||||
Period | Demand | Supply | Shortage | Demand | Supply | Shortage | ||||||||||||||||||||||||||
| (MW) | (MW) | (MW) | (%) | (MU) | (MU) | (MU) | (%) | |||||||||||||||||||||||||
2008-09 | 109,809 | 96,785 | 13,024 | 11.9 | 777,039 | 691,038 | 86,001 | 11.1 | ||||||||||||||||||||||||
2009-10 | 119,166 | 104,009 | 15,157 | 12.7 | 830,594 | 746,644 | 83,950 | 10.1 | ||||||||||||||||||||||||
2010-11 | 122,287 | 110,256 | 12,031 | 9.8 | 861,591 | 788,355 | 73,236 | 8.5 | ||||||||||||||||||||||||
2011-12 | 130,006 | 116,191 | 13,815 | 10.6 | 937,199 | 857,886 | 79,313 | 8.5 | ||||||||||||||||||||||||
2012-13 | 135,453 | 123,294 | 12,159 | 9.0 | 995,500 | 908,574 | 86,926 | 8.7 | ||||||||||||||||||||||||
2013-14 | 135,918 | 129,815 | 6,103 | 4.5 | 1,002,045 | 959,614 | 42,431 | 4.2 | ||||||||||||||||||||||||
2014-15 | 148,166 | 141,160 | 7,006 | 4.7 | 1,067,085 | 1,028,955 | 38,130 | 3.6 | ||||||||||||||||||||||||
2015-16 | 153,366 | 148,463 | 4,903 | 3.2 | 1,114,235 | 1,090,713 | 23,522 | 2.1 | ||||||||||||||||||||||||
Source: CEA Monthly Review, March 2016
Regional Demand-Supply Overview
The following table displays the provisional peak and normative power shortages in India for the period April 2015 to March 2016 across different regions in India:
Region | Energy Requirement | Deficit | Peak Demand | Deficit | ||||||||||||
| (MU) | (%) | (MW) | (%) | |||||||||||||
Northern | 340,488 | (4.8) | 54,474 | (7.1) | ||||||||||||
Western | 346,650 | (0.2) | 48,640 | (0.9) | ||||||||||||
Southern | 288,004 | (1.6) | 40,445 | (1.4) | ||||||||||||
Eastern | 124,608 | (0.8) | 18,076 | (0.6) | ||||||||||||
North Eastern | 14,487 | (5.2) | 2,573 | (8.0) | ||||||||||||
All India | 1,114,235 | (2.1) | 153,366 | (3.2) | ||||||||||||
Source: CEA Monthly Review, March 2016
Energy deficit varies widely across India, with the Northern region having the highest peak energy shortages followed by the Southern region.
Large Energy Deficit Results in Low Per Capita Consumption of Electricity
Due to inadequate supply and distribution infrastructure, the per capita consumption of energy in India is extremely low in comparison to most other parts of the world. The following chart shows per capita consumption of energy in 2011 in various developed and developing countries.
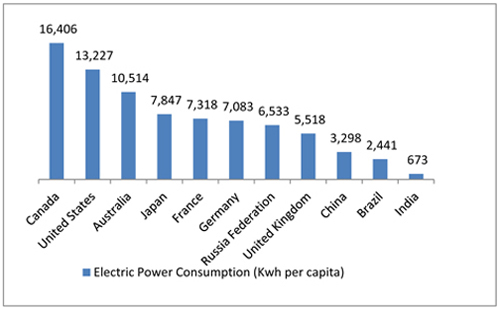
Source: IEA Key World Energy Statistics, 2013
Installed Capacities
As of March 31, 2016, India’s power system had an installed generation capacity of approximately 298,060 MW, with the Central Power Sector Utilities of India accounting for approximately 25.6% of total power generation capacity, while various state entities and private sector companies accounted for approximately 34.1% and 40.3%, respectively.
MW | Central | State | Private | Total | Share of Total | |||||||||||||||
Thermal | 58,945 | 71,735 | 79,996 | 210,676 | 70.7% | |||||||||||||||
Hydro | 11,571 | 28,092 | 3,120 | 42,783 | 14.4% | |||||||||||||||
Nuclear | 5,780 | — | — | 5,780 | 1.9% | |||||||||||||||
Renewable Energy Source | — | 1,934 | 36,887 | 38,821 | 13.0% | |||||||||||||||
Total | 76,296 | 1,01,761 | 1,20,003 | 298,060 | 100.0% | |||||||||||||||
Source: CEA Monthly Review, March 2016
According to the CEA Monthly Review in March 2016, approximately 70.7%part of India’s total power generation capacity consists of thermal sources as of March 31, 2016. The predominance of thermal electricity sources in India can be attributed to the fact that India has large thermal coal resources. According to the Indian Minerals Yearbook 2014, India held approximately 301 billion tons and 43 billion tons in coal and lignite resources respectively, as on April 1, 2014. India was the third largest thermal coal producing country after China and the United States at the end of 2014.energy mix.
Transmission and Distribution
In India, the transmission and distribution systemVedanta Limited is a three-tier structure comprising regional grids, state grids and distribution networks. The five regional grids, structured on a geographical contiguity basis, facilitate transfer of power from a power surplus state to a power deficit state. The regional grids also facilitate the optimal scheduling of maintenance outages and better co-ordination between the power plants. The regional grids shall be gradually integrated to form a national grid, whereby surplus power from a region could be transferred to another region facing power deficits, thereby facilitating a more optimal utilization of the national generating capacity. Most inter-regional and interstate transmission links are owned and operated by the Power Grid Corporation of India Limited (“PGCIL”) though some are jointly owned by the SEBs. PGCIL is the central transmission utility of India and possesses one of the largest transmission networks in the world. Approximately 45% of the total generating capacitypower generators in India is transmitted through PGCIL’s system, accordingand continues to the company’s disclosures.
PGCIL is working towards establishment ofincrease power capacity to capitalize on India’s economic growth and power deficit. Additionally, domestic coal prices have fallen during 2016 while seaborne prices have risen. We expect this trend to continue in 2017, providing domestic producers with an integrated national power grid, in a phased manner, in order to strengthen the regional grids and to support the generation capacity addition program. The existing inter-regional power transfer capacity of 55,350 MW (as of March 2016) is expected to be enhanced to 65,550 MW by 2017. Based on the expected generation capacity addition in the Twelfth Five-Year Plan, an investment of approximately Rs. 1,000 billion, Rs. 550 billion and Rs. 250 billion is envisaged in central, state and private sectors respectively (Source: Report of the Working Group on Power for Twelfth Five-Year Plan (2012-17), January 2012).
State grids and distribution networks are primarily owned and operated by the respective SEBs or state governments (through state electricity departments). State distribution networks are managed at the state level and continue to be affected by high aggregate technical and commercial losses, or (“AT&C”) losses. According to CEA Monthly Review, March 2016, these were estimated to be approximately 25.4% in 2012-13, which implies that 25% of power entering the system is lost during distribution. A direct consequence of the high AT&C losses is the poor financial condition of SEBs, thereby preventing the SEBs from making any meaningful investments in generation and in upgrading the transmission and distribution, or “T&D” network. All T&D losses in India for the same period stood at 23.0% (Source: CEA Monthly Review, March 2016).
With the enactment of the Indian Electricity Act, 2003 and the recently notified guidelines foradditional competitive bidding in transmission projects, private investment was permitted in power transmission which became recognized as an independent activity. Power distribution in the States of Delhi has been privatized and distribution networks are now operated by private utilities companies such as Tata Power, CESC Limited, Reliance Energy Limited, Torrent Power AEC & SEC and Noida Power Company Limited, and a number of other distribution companies.
According to CEA Monthly Review, March 2016, in India, the transmission sector has grown from a capacity of 52,034 circuit kms during the 6th five-year plan (as of March 31, 1985) to 341,551 circuit kms currently (as of March 31, 2016).
Power Trading
Historically, the main suppliers and consumers of bulk power in India have been the various government-controlled generation and distribution companies who typically contracted power on a long-term basis by way of power purchase agreements with regulated tariffs. However, in order to encourage the entry of merchant power plants and private sector investment in the power sector, the Electricity Act recognized power trading as a distinct activity from generation and T&D activities, and has facilitated the development of a trading market for electricity in India by providing for open access to transmission networks at normative charges. Power trading involves the exchange of power from suppliers with surpluses to suppliers with deficits. Seasonal diversity in generation and demand, as well as the concentration of power generation facilities in the resource-rich Eastern region of India, has created ample opportunities for the trading of power. Regulatory developments include the announcement of rules and provisions for open access and licensing related to interstate trading in electricity. Several entities have started trading operations or have applied for trading licenses. With the aid of the reforms, the volume of power traded as well as its traded price has grown rapidly over the last few years. The following graph and table shows the increasing volume of power traded in India for the periods indicated:advantage.
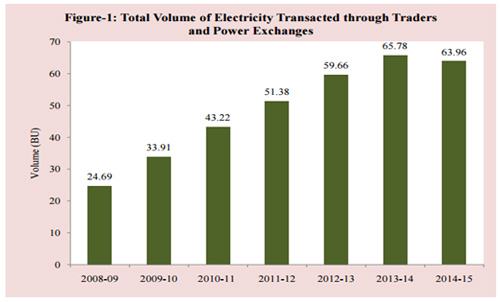
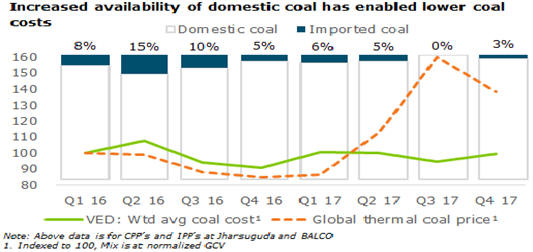
GCV- Gross Calorific Value; Wtdavg- Weighted average cost; CPPs –Captive Power Plants; IPPs –Integrated Power Plants
Source: Central Electricity Regulatory Commission, Monthly Reports on Short-term Power Market in India, March 2015Bloomberg (Thermal Coal Global Price)
Indian Energy Exchange
Indian Energy Exchange is India’s first nation-wide automated and online electricity trading platform. The Indian Energy Exchange seeks to catalyze the modernization of electricity trade in India by allowing trading through a technology-enabled platform. On June 9, 2008, the Indian Energy Exchange received CERC approval to begin operations. The Indian Energy Exchange is a demutualized exchange set up to enable efficient price discovery and price-risk management in the power trading market, offering a broader choice to generators and distribution licensees for sale and purchase of power facilitating trade in smaller quantities, and enabling participants to adjust their portfolio as a function of consumption or generation. According to the CERC Monthly Report on Short-term Transactions of Electricity in India, March 2016, the total volume of electricity traded on the Indian Energy Exchange amounted to 3,059.48 million units in March 2016 which is about 35.47% of the total short-term transactions done through bilateral contracts and power exchanges.
Power Exchange India Limited
Power Exchange India Limited is a fully electronic nation-wide exchange for the trading of electricity. It has been promoted by two of India’s leading exchanges, NSE and National Commodities & Derivatives Exchange Limited. Power Exchange India Limited received regulatory approval to begin operations from the Central Electricity Authority on September 30, 2008, and began its operations on October 22, 2008. According to CERC Monthly Report, March 2016, the total volume of electricity traded on Power Exchange India Limited amounted to 1.85 million units in March 2016 which is about 0.02% of the total short-term transactions.
OUR BUSINESS
Overview
We are one of India’s largesta globally diversified natural resources companies.company with low cost operations. Our business is principally located in India. We have operations in Australia, United Arab Emirates, South Africa, Namibia and Ireland and have over 17,000 employees worldwide. We are primarily engaged in zinc, oil and gas, iron ore, copper, aluminium and commercial power generation businesses and are also developing and operating port operation businesses and infrastructure assets. We have experienced significant growth in recent years through our various expansion projects for our copper, zinc and aluminium businesses and through acquisition of the zinc international and oil and gas businesses. We believe our experience in operating and expanding our businesses in India will allow us to capitalize on attractive growth opportunities arising from India’s large mineral reserves, relatively low cost of operations and large and inexpensive labor and talent pools. We believe we are also well-positioned to take advantage of the significant growth in industrial production and investments in infrastructure in India, China, Southeast Asia and the Middle East, which we expect will continue to generate strong demand for metals, oil and gas and power.
We are the leading and only integrated zinc producer with a 79.0%72.0% market share by sales volume of the Indian zinc market in fiscal year 2016,2017, according to the ILZDA, and one of the four primary producers of aluminium with a 40.0%38.7% primary market share by production volume in India in fiscal year 2016,2017, according to the Aluminium Association of India. Together with our joint operation partners, we account for approximately 27%26.0% of India’s domestic crude oil production according to the Ministry of Petroleum and Natural Gas statistics of March 2016.2017. We are one of the two custom copper smelters in India with a 36% primary market share by sales volume in fiscal year 2016,2017, according to the International Copper Association (India).
Zinc Business
Our fully-integrated zincZinc India business is owned and operated by HZL. In 2016,2017, HZL was one of the top five leadthree mining companies based on production volumes and in the lowest cost decile in terms of all zinc mining operations worldwide, according to Wood Mackenzie. In addition, HZL’s Rampura Agucha mine was the largest zinc mine in the world on a production basis and its Chanderiya hydrometallurgical zinc smelter was the fourthninth largest smelter in the world on a production basis worldwide in 2016,2017, according to Wood Mackenzie. We have a 64.9% ownership interest in HZL, with the remainder owned by the GoI (29.5%) and institutional and public shareholders (5.6%). We have exercised the second call option to acquire the GoI’s remaining ownership interest in HZL although the exercise is currently subject to dispute. HZL’s operations include five lead-zinc mines, one rock phosphate mine, four hydrometallurgical zinc smelters, two lead smelters, one pyrometallurgical lead-zinc smelter, sevensix sulphuric acid plants, six captive power plants in northwest India, processing and refining facilities for zinc at Haridwar and processing and refining facilities for zinc and lead, as well as a silver refinery at Pantnagar, both located in the state of UttarkhandUttarakhand in northern India. HZL’s mines supply almost all of its concentrate requirements and HZL also exports surplus zinc and lead concentrates.
Our Zinc International business comprises of:(i) 100% stake in Skorpion, which owns the Skorpion mine and refinery in Namibia and (ii) 74% stake in Black Mountain Mining, which owns the Black Mountain mine and the Gamsberg project in South Africa.
Oil and Gas Business
Pursuant to the Cairn India Merger which became operative on April 11, 2017, Cairn India Limited was merged with Vedanta Limited. Our oil and gas business is primarilywas previously owned and operated by Cairn India and its subsidiaries.India. We are a significant contributor to India’s domestic crude oil production, contributing approximately 27%26% of the country’s production according to the statistics of the Ministry of Petroleum and Natural Gas statistics as of March 2016.2017. We have a diversified asset base with nineseven production and exploration blocks.
Iron Ore Business
We are engaged in the exploration, mining and processing of iron ore. In India, we owned or had the rights to reserves consisting of 193.6181.7 million tons of iron ore at an average grade of 55.4%, as of March 31, 2016.2017. In addition, we manufacture pig iron and metallurgical coke, and also operate two waste heat recovery plants of 30 MW each in Goa.
Our mining operations are carried out in the states of Goa and Karnataka, both of which became subject to suspension of mining activities due to alleged environmental and other violations by miners, which has adversely impacted our production of iron ore since August 2011. The suspension was imposed by the state government of Goa and this suspension was upheld by the Supreme Court of India on the mining activities in the state of Goa from September 2012 to April 2014 and a suspension imposed by the state government of Karnataka until April 2013. Although we resumed operations in Karnataka after receiving the stage I forest clearance from the state government of Karnataka and a temporary working permission from the Ministry of Environment &and Forests (MoEF)(“MoEF”), the temporary working permission expired on July 31, 2014. Karnataka operations were halted for the period from August 1, 2014 to February 27, 2015. We resumed operations in Karnataka after all statutory clearances were in place from February 28, 2015. Following the Supreme Court of India’s order in April 2014, High Court of Bombay at Goa in August 2014 has pronounced the order to renew mining leases in Goa. The MoEF and the state government have also revoked their suspension orders subject to limits imposed by the Supreme Court, for renewal of the leases and consent to operate from the Government of Goa. In August 2015, our mining operations resumed in our principal mines after completion of necessary statutory formalities and fulfillment of conditions annexed by Supreme Court and the state government of Goa.
We havehad also acquired the WCL iron ore project in Liberia, which is at the exploration stage, comprising Bomi hills, Bea Mountain and Mano river deposits.
Copper Business
Our copper business is principally one of custom smelting. Our assets include a smelter, a refinery, a phosphoric acid plant, a sulphuric acid plant, a copper rod plant and three captive power plants at Tuticorin in Southern India, a refinery and two copper rod plants in Western India, a precious metal refinery that produces gold and silver, a doré anode plant and a copper rod plant at Fujairah in the UAE. According to Wood Mackenzie, our Tuticorin smelter was one of the world’s top ten, in terms of production volumes in 2015.fiscal 2017. We own the Mt. Lyell copper mine in Tasmania, Australia, which provides a small percentage of our copper concentrate requirements.Australia. The operation of Mt Lyell mine was suspended in January 2014, following a mud slide incident. Subsequently, the operations at Mt. Lyell copper mine has been placed under care and maintenance since July 9, 2014 following a rock falling on the ventilation shaft in June 2014.
Aluminium Business
Our aluminium business is based out of Chhattisgarh and Odisha. We operate the business in Chhattisgarh through BALCO, in which we have a 51.0% ownership interest, with the remainder owned by the GoI. BALCO, one of the four primary producers of aluminium in India, had a 20.0%20.7% primary market share by production volume in India in fiscal year 20162017 according to Aluminium Association of India. We have exercised our option to acquire the GoI’s remaining 49.0% ownership interest, although the exercise is currently subject to dispute. BALCO’s operations include two bauxite mines, 11401410 MW power plants and refining, smelting and fabrication facilities in Central India. BALCO’s operations benefit from relatively cost effective access to power, the most significant cost component in aluminium smelting due to the power-intensive nature of the process. This is to a considerable extent due to BALCO being an energy-integrated aluminium producer. BALCO is also setting up a 325,000 tpa aluminium smelter, 84 pots of which commenced commercial production in September 2014. The remaining 252An additional 84 pots will commencecommenced commercial production in fiscal yearon August 1, 2016 and the remaining 168 pots commenced commercial production on May 1, 2017. We received the consent to operate the CPP 600 MW power plant in January 2015, which was commissioned during the fiscal year 2016.
Pursuant tore-auctioning of coal mines as per Coal Mines (Special Provisions), 2014, (now the “Coal Mines (Special Provisions) Act, 2015”) conducted by the Government of India (“GoI’GoI in February 2015, BALCO was successful in securing one coal mine, namely the Chotia coal block (“Chotia”) and was the highest bidder for the Gare Palma IV/1 coal block (“Gare Palma”).block.
Our aluminium operations in Odisha were earlier operated through Vedanta Aluminium, which is now merged with Vedanta Limited pursuant to theRe-organization Transactions. The operations include 1.02.0 million tpa alumina refinery at Lanjigarh with associated 7590 MW coal based captive power plant, 0.5 million tpa aluminium smelter together with an associated 1,215 MW (nineand 1800 MW (three units with a capacity of 135 MW each)600 MW) coal based captive power plantplants at Jharsuguda. The alumina refinery at Lanjigarh was commissioned in March 2010.2010 and second stream was restarted in April 2016 increasing the alumina refinery’s total capacity to 1.4 million tpa. We also capitalized a debottlenecking project for an alumina refinery in March 2017 increasing the refinery’s total capacity to 2 million tpa. The green fieldgreenfield smelter project of 0.5 million tpa at Jharsuguda was implemented in two phases of 250,000 tpa each. Phase 1 was completed on November 30, 2009 and Phase 2 was completed on March 1, 2010. We are currently in the process of ramping up of our 1.25 million tpa smelter facilities in Jharsuguda. 82 pots from the first line of this smelter were commissioned during fiscal year 2015, out of which 80 pots were capitalized on December 1, 2015 and a further ramp up recommenced fromon April 1, 2016. During fiscal year 2017, a total of 424 pots were capitalized.
On March 11, 2010, Vedanta Aluminium acquired 100.0% ownership of Allied Port Services Private Limited, or APSPL. APSPL was merged into Vedanta Aluminium with effect from April 1, 2011 pursuant to the merger approved by the High Court of Madras.
Power Business
We operate multiple power plants across locations in India. Our power business comprises of a 2400600 MW thermal power plant in Odisha, 270 MW and IPP 600 MW thermal power plantplants in Chhattisgarh, 274 MW wind power plants across India, 106.5 MW thermal power plant in Tamil Nadu and a 1980 MW thermal power plant in Punjab (of which a third unit of 660 MW will be commissioned in the second quarter of fiscal year 2017).Punjab.
We operated the 2400 MW (four units of 600 MW each) thermal coal-based commercial power facility at Jharsuguda through Sterlite Energy, which is now merged with Vedanta Limited pursuant to theRe-organization Transactions. In September 2006, Sterlite Energy entered into a power purchase agreement with Grid Corporation of Orissa Limited, a nominee of the state government of Orissa (“GRIDCO”).
In July 2008, Sterlite Energy succeeded in an international bidding process and was awarded the project for the construction of a 1980 MW (comprising three units of 660 MW each) coal-based commercial thermal power plant at Talwandi Sabo in the State of Punjab in India. The power plant iswas being set up through Vedanta Limited’s wholly owned subsidiary TSPL. The first 660 MW and second 660 MW unit of the Talwandi Sabo power plant waswere capitalized in fiscal yearyears 2015 and the second2016 respectively. The third 660 MW unit was capitalized on DecemberSeptember 1, 20152016 after the successful completion of trial runs. The third unit will be commissioned in the second quarter of fiscal year 2017. Our power business also includes 274 MW of wind power plants operated by HZL 270 MW power plant at BALCO’s Korba facility, which was previously for captive use before the shutdown of the 100,000 tpa aluminium smelter at Korba on June 5, 2009, and 106.5 MW power plant at MALCO situated at Mettur Dam in southern India. The MALCO plant has been put under care and maintenance from May 26, 2017.
In addition, BALCO is settinghas set up a thermal coal based power plant with a total capacity of 1200MW,1200 MW, four units of 300 MW each, at Korba. The first two units are identified as independent power plants and are referred to as IPP 600 MW. The first 300 MW unit of the IPP 600 MW was capitalized on August 1, 2015 after the successful completion of trial runs. The second unit has been commissioned and commenced commercial production on May 1, 2016.
Strategy
Our strategic goal is to become one of the top diversified natural resources company in the world, and our strategy is based on the following fourfive key pillars:
Delivering profitable production growth across the portfolio
We view strict cost management and increases in productivity as fundamental aspects of our day to day operations and continuously seek to improve efficiency. We were in the lowest cost decile in terms of cost of production in our zinc mining operations worldwide in fiscal year 2016, according to Wood Mackenzie, and we intend to continue to improve our production processes and methods and increase operational efficiencies to further reduce our costs of production in all our businesses. Our current initiatives include:
Consolidation and simplification of the group structure
We are continuously seeking to increase our direct ownership of our underlying businesses to simplify and derive additional synergies and better align cash flows and debt as an integrated group by consolidating our corporate structure and integrating our operations. For example, during fiscal year 2017, we announced asuccessfully completed our merger ofwith Cairn India Limited into us through a Scheme of Arrangement pursuant to Indian law.Limited.
See “—“ Item 88. Financial Information — B. Significant Changes”.
We own majority ownership interests in BALCO and HZL and have offered to acquire the remaining shares of both BALCO and HZL from the GoI. As on date, these offers have not been accepted by the GoI and therefore there is no certainty that these acquisitions will proceed. See “— Options to Increase Interests in HZL and BALCO.”
Continuing to add reserves and resources for long-term value
Our acquisitions of HZL, BALCO, Sesa Resources Limited, Skorpion, Lisheen, Black Mountain Mining, Sterlite Energy, WCL and Cairn India have contributed substantially to our growth. We continually seek new growth and acquisition opportunities in the metals and mining and related businesses in India and elsewhere, including through government privatization programs, where we can leverage our skills and experience. We continue to closely monitor the resource markets in our existing lines of business as well as seek out opportunities in complementary businesses such as coal mining. We also intend to continue to seek out new exploration opportunities for future growth. By selecting opportunities for growth and acquisition carefully and leveraging our skills and experience, we seek to continue to expand our business while maintaining a strong balance sheet and good credit profile.
Accelerating cash flows and deleveraging
We aim to increase our cash flows from operations and decrease capital expenditures, and the indebtedness required to fund capital expenditures. As of March 31, 2016,2017, our projects had an estimated total capital expenditure cost of $ 12.54 billion,Rs. 788,576 million ($ 12,160.0 million), of which $ 9.22 billionRs. 623,468 million ($ 9,614.0 million) had been incurred as of such date. Net cash from operating activities was Rs. 107,352212,105 million ($ 1,620.43,270.5 million) in fiscal year 2016,2017, a 14.6% decrease97.6% increase from Rs. 125,710107,352 million in fiscal year 2015.2016. We paid interest of Rs. 55,37262,048 million ($ 835.8956.8 million) on our indebtedness in fiscal year 2016,2017, a 34.7% decrease12.1% increase from Rs. 84,81655,372 million in fiscal year 2015.2016.
Protect and preserve license to operate
Health and safety continue to be a high priority for us and we are committed to protect and preserve our licence to operate. Our business strategy is about ensuring that growth is maximized in a way that is both sustainable and responsive. The four core pillars—responsible stewardship, building strong relationships, adding and sharing values and strategic communication are designed to support the long term development, ensuring long lasting relationship and providing superior returns to all our stakeholders.
We are leading a ‘zero harm’ culture across the organization and we will continue to strengthen our strategy of responsible stewardship. We aim to focus on zero fatality and reduction in loss time injuries across the businesses.
Basis of Presentation of ore reserves
The reported metal reserves are defined as being either “ore reserves” if reported in accordance with the Australasian Code for Reporting of Exploration Results, Mineral Resources and ore reserves, 2004 Edition, prepared by the Joint ore reserves Committee of the Australasian Institute of Mining and Metallurgy, Australian Institute of Geoscientists and Minerals Council of Australia (the “JORC Code”) or “mineral reserves” if reported in accordance with the South African Code for Reporting of Exploration Results, Mineral Resources and Mineral Reserves which sets out minimum standards, recommendations and guidelines for public reporting of exploration results, Mineral Resources and Mineral Reserves in South Africa (the “SAMREC Code”). The meanings and definitions are the same. For convenience, we have standardized the term “ore reserves”. The results are reported in compliance with Industry Guide 7 of the US Securities and Exchange Commission, or the SEC.
The reported ore reserves of each mine are derived following a systematic evaluation of geological data and a series of technical and economic studies by our geologists and engineers.
An “ore reserve” is the economically mineable part. It includes diluting materials and allowances for losses which may occur when the material is mined. Appropriate assessments and studies have been carried out, and include consideration of and modification by realistically assumed mining, metallurgical, economic, marketing, legal, environmental, social and governmental factors. These assessments demonstrate that at the time of reporting that extraction could reasonably be justified. Ore reserves aresub-divided in order of increasing confidence into probable ore reserves and proven ore reserves.
In addition to the ore reserves we have identified further mineral deposits as either extensions of or additions to our existing operations that are subject to ongoing exploration and evaluation.
Our Zinc India Business
Overview
Our Zinc India business is owned and operated by HZL. HZL’s fully-integrated zinc operations include five lead-zinc mines, one rock phosphate mine, four hydrometallurgical zinc smelters, two lead smelters, one pyrometallurgical lead-zinc smelter, six sulphuric acid plants and six captive power plants at our Chanderiya, Dariba and Zawar facilities in the state of Rajasthan, processing and refining facilities for zinc at Haridwar and processing and refining facilities for zinc and lead, as well as a silver refinery at Pantnagar, both located in the State of Uttarakhand in northern India. HZL sources almost all of its concentrate requirements from its mines.
We first acquired an interest in HZL in April 2002 and have since then significantly improved its operating performance through expansion and by improving operational efficiencies and reducing unit costs. HZL improved its operating performance further by:
HZL pays royalties to the state government of Rajasthan based on its extraction of lead-zinc ore. With effect from September 2014, the royalty rate increased from 8.4% to 10.0% of the LME zinc metal price payable on the zinc metal contained in the concentrate produced and from 12.7% to 14.5% of the LME lead metal price payable on the lead metal contained in the concentrate produced. For silver, HZL pays royalty at a rate of 7% of the silver London Bullion Market Association price chargeable on silver-metal produced. The royalties we pay are subject to change. Further, the MMDRA Amendment Act, notified towards the end of fiscal year 2015, notifies an amount not exceeding royalty, to be contributed to the DMF for the benefit of people affected by mining and an additional 2% of royalties to the NMET. DMF contribution has now been notified at 30% of base royalty rates. See “Item. 3—Key Information—D. Risk Factors—Risks Relating to Our Industry—Changes in tariffs, royalties, cess, customs duties, export duties and government assistance may reduce our Indian market domestic premium, which would adversely affect our profitability and results of operations”.
We have a 64.9% ownership interest in HZL, with the remainder owned by the GoI (29.5%) and institutional and public shareholders (5.6%). We have exercised the second call option by a letter dated July 21, 2009 to acquire the GoI’s remaining ownership interest in HZL although the exercise is currently subject to dispute. See “—Options to Increase Interests in HZL and BALCO—Call Options over shares in HZL”.
Principal Products
Zinc
We produce and sell zinc ingots in all four international standard grades: Special High Grade (SHG—99.995%), High Grade (HG—99.95%), Continuous Galvanising Grade (CGG —99.5%) and Prime Western (PW—98.0%). We sell most of our zinc ingots to Indian steel producers for galvanizing steel to improve its durability. Some of our zinc is also sold to alloy, dry cell battery, die casting and chemical manufacturers.
Lead
We produce and sell lead ingots of 99.99% purity primarily to battery manufacturers and to a small extent to chemical manufacturers.
By-products
Sulphuric Acid
Sulphuric acid is aby-product of our zinc and lead smelting operations. We sell sulphuric acid to fertilizer and cement manufacturers and other industries.
Silver
Silver occurs naturally in our zinc and lead ore and is aby-product of our lead smelting operations. We produce and sell silver ingots primarily to industrial users and traders of silver.
Lead-Zinc Mines
HZL normally sources all of the lead-zinc ore required for its business from its Rampura Aguchaopen-pit and underground mines at Rampura Agucha, Zawar, Rajpura Dariba, Sindesar Khurd and Kayad in the state of Rajasthan in northwest India. In fiscal year 2016, 3.0% of the lead production was through external mine concentrates. Lead-zinc ore extracted from the mines is conveyed toon-site concentrators and beneficiation plants that process the ore into zinc and lead concentrates. With its good ore mineralogy providing a high metal recovery ratio, the Rampura Agucha mine including its satellite Kayad mine accounted for 73.3%68.6% of HZL’s total mined metal in zinc and lead concentrate produced in fiscal year 2016,2017, with the Zawar, Rajpura Dariba and Sindesar Khurd mines accounting for the remaining 6.5%7.6%, 4.4%4.1% and 15.8%19.7%, respectively. The zinc and lead concentrates are then transported by road to the nearby Chanderiya, Dariba and Debari smelters.
Our current Indian Bureau of Mines, or IBM, approvals for the Rampura Agucha mine, the Zawar mine, Sindesar Khurd mine, the Rajpura Dariba and Kayad mine limit our extraction of lead-zinc ore from the mines to approximately 6.0 million tpa, 1.54.0 million tpa, 2.54.5 million tpa, 0.9 million tpa and 0.81.0 million tpa, respectively, in fiscal year 2016.2017.
Zinc Smelters
HZL has two types of zinc smelters, namely hydrometallurgical and pyrometallurgical. Four of HZL’s smelters are hydrometallurgical and one is pyrometallurgical. The fifth hydrometallurgical smelter located in Vizag has discontinued its operations in fiscal year 2014.
The hydrometallurgical smelting process is a roast, leach and electrowin (“RLE”) process. Zinc concentrate is first oxidized in the roaster and the gases generated are cleaned and sent to the sulphuric acid plant. The primary output from the roaster, called calcine, is sent to the leaching plant to produce a zinc sulphate solution that is then passed through a cold or hotand purification processplant to produce purified zinc sulphate solution.sulphate. The purified zinc solution then goes through an electrolysis process to produce zinc cathodes. Finally, the zinc cathodes are further processed and castcasted into zinc ingots at the processing and refining facilities in the state of Uttarakhand in northern India.
The pyrometallurgical smelter uses the imperial smelting process or ISPTM, in which process starts with sintering, where a mixture consisting of lead and zinc concentrates and fluxes is passed through the sinter machine to remove the sulphur. Thesulphur from concentrate and then the generated gases generated from the sintering process are cleaned and sent to the sulphuric acid plant. The de-sulphurized output of the sinter machine is broken for size reduction before being fed into an imperial smelting furnace (“ISF”), where it is smeltedto smelt with preheated metallurgical coke and air. During the smelting process, molten lead trickles down to theis extracted from bottom of the ISFimperial smelting furnace and zinc rises up as vapor. TheThen the vapor is passed into a condenser where it is then absorbed back into thecondensed in molten lead.lead bath. The molten lead is cooled to separate out the zinc, which is then passed through a refining process of double distillationto remove impurities and condensation through which any remaining lead is removed to produce pure zinc metal which is castcasted into ingots. The lead removed through this process is sent to the pyrometallurgicalrefinery to produce pure lead smeltermetal. In this process, silver is also produced as aby-product which is sent to our facilities in Uttarakhand for refining and casting into silver ingots.
Lead Smelters
HZL has two lead smelters, one in Chanderiya and the other in Dariba. The smelter in Chanderiya uses Ausmelt™ technology and the other smelter in Dariba uses Shuikoushan Smelting Technology or SKS oxygen bottom blowing technology. There is also a lead-zinc smelter at Chanderiya which uses the pyrometallurgical ISF™imperial smelting furnace process.
HZL’s lead smelter located in Dariba is based on SKS oxygen bottom blowing technology, where lead concentrate is smelted directly in the SKS furnace along with fluxes. SKS furnace produces lead bullion and slag. SKS furnace slag is then reduced in blast furnace to produce bullion. Lead bullion produced in these processes is then treated in the lead refinery plant to produce high purity electrolytic grade lead cathodes through electrolysis. The lead cathode are further processed and castcasted into ingots at itsthe processing and refining facilities in the state of Uttarakhand. Slag from blast furnace is fumed to produce zinc oxide dust.Off-gas containing sulphur dioxide gas is cleaned and treated in the sulphuric acid plant.
HZL’s lead smelter located in Chanderiya is based on Top Submerged Lance, or TSL technology where lead concentrate is smelted directly in a vertical furnace along with flux. Lead bullion produced in this process is then treated in the lead refinery plant to produce high purity lead ingots.Off-gas containing sulphur dioxide gas is then cleaned and treated in the sulphuric acid plant.
Finishing and Delivery to Customers
The zinc and lead cathodes are transported from its hydrometallurgical plants in Rajasthan to its facilities in Uttarakhand in northern India where they are further processed into zinc and lead ingots. One of the residues from smelting is anode slime and another is high grade lead material, both of which are also transported to the Uttarakhand facilities and from which silver is processed and castcasted into silver ingots. The facilities in Uttarakhand process and refine zinc, lead and silver and cast them into ingots and distribute the finished products nationwide, making it a centralized finished goods center for our customers. Zinc and lead ingots are also shipped from the facilities in Uttarakhand for exports, although some quantities of zinc and lead ingots are also produced in Rajasthan for both domestic and export customers. The sulphuric acidby-product is soldex-works from its facilities in Rajasthan to customers in India.
Principal Facilities
Overview
The following map shows the locations of HZL’s facilities in the State of Rajasthan:
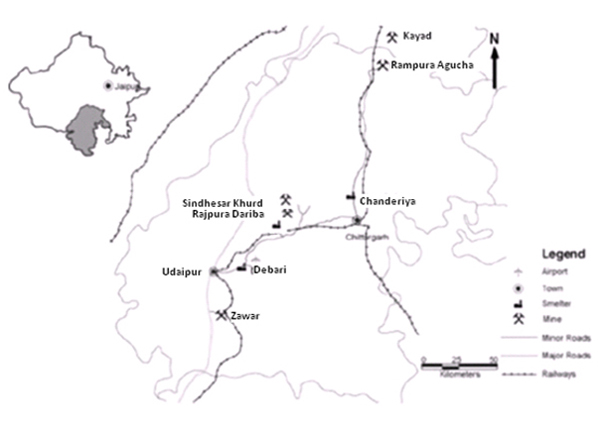
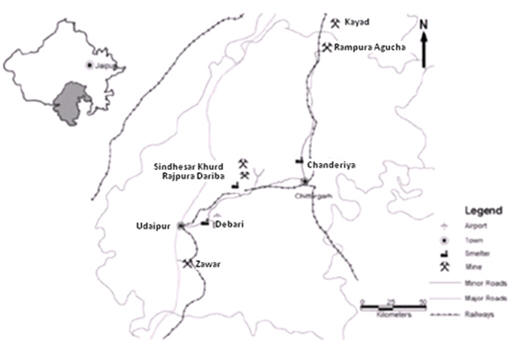
Mines
Rampura Agucha
The Rampura Agucha lead-zinc mine is located near Gulabpura in the north-west State of Rajasthan.
The good ore mineralogy of the mine provides a high metal recovery ratio and a low overall cost of production for zinc concentrate extracted from the mine. The mining and processing facilities are modern and in good condition.
The ore body is mined byopen-pit and underground methods. The capacity of the mine and concentrator was expanded between 2003 and 2010 from 2.4 million tpa to 6.2 million tpa for mine and 6.5 million tpa for mill through the purchase of additional mining equipment, upgrades to the truck fleet, improvements to the operational efficiency of the plant and the installation of a new semi-autogenous or SAG, mill and ball mill circuit.
Open pit mining at Rampura Agucha is a simple drill and blast, load and haul sequence using 221 metric tons trucks and 34 cubic meter excavators. In the underground mines, the ore body is mined by long hole open stoping with pastefill, cemented rock fill or rock fill method and loading hauling sequence by using 60 ton truck and a 17 ton loader. Ore is fed to the primary crusher and waste is dumpeddisposed at the waste dump. The mining equipment is largely owner-operated. The processing facility is a conventional crushing, milling and differential lead-zinc floatation plant. Ore from theopen-pit and underground is crushed in a series of crushing circuits and then milled in four streams, one rod mill-ballstreams. The zinc and three other sag mill-balls in closed circuit. The milled ore is thenlead concentrates produced are sent to the lead flotation circuit which includes roughing, scavengingdifferent smelters of HZL and three stages of cleaning. The lead concentrates are thickened and filtered ahead of storage and transport to the Chanderiya and Dariba lead smelter. The lead flotation tails proceed to zinc flotation which comprises roughing, scavenging and four stages of cleaning. Zinc concentrates are thickened and filtered ahead of storage and transported to different HZL zinc smelters. Zinc flotation tails are thickened ahead of disposaltailing portion goes to the tailings dam.dam after thickening.
Since 2004, exploration at Rampura Agucha has resulted in significant increases in the reserves at the mine. Following an extensive drilling program to convert mineralized material to reserves, better definition of the ore body boundaries, addition of mineralized material and the conduct of open-pit re-optimization,open-pitre-optimization, as well as the commencement of underground mine project work, the reserves were 51.149.7 million tons as of March 31, 20162017 with an average grade of 14.0%13.9% zinc, 1.8%1.9% lead and 5862 ppm silver after depletion. The drill spacing for the definition of proven reserves were approximately 50 meters by 50 meters while for probable reserves was 100 meters by 100 meters. HZL commenced production at the mine in 1991. Since inception, approximately 74.977.4 million tons of ore, with an ore grade of 12.6%12.5% zinc and 1.9%1.8% lead, respectively, have been extracted from theopen-pit mine. HZL is continuing to evaluate the potential of this deeper mineralization. As of March 31, 2016,2017, HZL estimates the remaining mine life at Rampura Agucha to be 1312 years based on (i) reserves; and (ii) planned production which is determined on the basis of alife-of-mine plan. According to JORC reserves and resources statement, the proven and probable reserves for the Rampura Agucha mine as of March 31, 2017 is 49.7 million tons with 13.9% zinc, 1.9% lead and 62 particles per million silver after depletion.
In fiscal year 2016, 4.72017, 3.3 million tons of ore at 12.0%13.3% zinc and 1.8%1.9% lead were mined from the Rampura Agucha open pit, which produced approximately 1.0 million387,966 tons of mined zinc metal in concentrate at 49.9%and 37,586 tons of mined lead metal in concentrate with 91.95% zinc and 88,709 tons of63.28% lead concentrate at 57.6% lead.recovery. Approximately 62.636.9 million tons of waste was removed giving a strip ratio of 14.011.3 tons of waste per ton of ore mined. The expansion of the mine from 5 mmtpa to 6.2 mmtpa was completed in 2010 and has resulted in a significant increase in the strip ratio as there was dimensional change in the pit with the ultimate depth of the mine increasing to 421 meters. During fiscal year 2016, approximately 88.7% of the zinc was recovered to the zinc concentrate, while 60.9% of the lead and 65.5% of the silver was recovered from the metal contained in the ore mined. The strip ratio is expected to increase to about 17.7 tons in fiscal year 2017, considering the anticipated overburden removal of about 56.9 million tons and ore production of 3.2 million tons from the open-pit. Our Rampura Agucha mine is in the midst of transitioning from open pit to underground mine production,production. During fiscal year 2017, the Rampura Agucha underground mine produced 1.4 million tons of ore with the underground project picking up pace after a slower than planned ramp up due to difficult geotech conditions.10.2% zinc and 1.3% lead. It produced 86,383 tons of zinc metal in concentrate and 6,955 tons of lead metal in concentrate with approximately 89.9% zinc and 56.4% lead recovery. The main shaft has reachedcompleted up to a depth of 860950 metres (out of aas planned depth of 950 metres) with completion of the north and south vent work.vent.
The gross book value of the Rampura Agucha mine’s fixed assets and mining equipment (including assets related to the Rampura Agucha’s underground mining operations and the Kayad mine) was Rs. 51,92454,514 million ($ 783.8840.6 million) as of March 31, 2016.2017. The mining lease of Rampura Agucha mine is uptovalid up to March 2030.
Power is mainly supplied from the HZL’s captive thermal power plants with two backup 5 MW generatorson-site.
Rajpura Dariba
Rajpura Dariba is a medium sized underground lead-zinc mine and processing facility located northeast of Udaipur in the Rajsamand district in the state of Rajasthan, northwest India.
Mining at Rajpura Dariba commenced in 1983 and is carried out using the vertical crater retreat method and blasting hole mining method with mined out stopes backfilled with cemented classified mill tailings. In certain areas the ground conditions adversely affect slope stability and dilution. These ground conditions are the result of the weak graphitic nature of the shear zone combined with the dissolution of fractured and sheared dolomites by percolating acidic groundwater derived for overlying adjacent oxidized zones. HZL’s Rajpura Dariba’s mine lease is valid until May 2030. The mine is serviced by two vertical shafts approximately 600 meters deep. The main shaft is 6 meters in diameter and the auxiliary shaft is 4.5 meters in diameter. The main shaft has the capacity to hoist 0.7 million tpa of ore and is equipped with a modern multi-rope koepe winder. All personnel and materials are hoisted in a large counterbalanced cage which is operated by the koepe winder. The surface infrastructure includes ventilation fans, compressors and ore loading facilities. A 2.2 km surface decline was commissioned in September 2013 to increase the ore production.
The ore is crushed underground before being hoisted topiled on the surface. It is then crushed again and milled before undergoing a lead flotation process incorporating roughing, scavenging and includes three stages of cleaning of rougher concentrate to get final lead concentrate. Lead flotation tails are sent to the zinc flotation process which incorporates roughing, scavenging and includes three stages of cleaning of rougher concentrate to get final Zinczinc concentrate. In one flotation the Zinczinc rougher concentrate is being cleaned in column flotation cells. Then Zinczinc flotation tails proceed to a backfill plant where final tailsthese are cycloned with the underflow proceeding to intermediate storage where cement is added in preparation for use as underground fill. The cyclone overflow is thickened to recover water ahead of disposal in the tailings dam. The final lead and zinc concentrates are thickened, filtered and stored before they are sent to HZL’s smelters.
Power for the mine is supplied largely from HZL’s 160 MW captive power plants at Dariba and through a contract with a state-owned entity.
The gross book value of the Rajpura Dariba mine’s fixed assets and mining equipment is approximately Rs. 5,4415,491 million ($ 82.184.7 million) as of March 31, 2016.2017.
As of March 31, 2016,2017, HZL estimates the remaining mine life at Rajpura Dariba to be around 8 years based on (i) reserves; and (ii) planned production which is determined on the basis of alife-of-mine plan. According to JORC reserves and resources statement, the proven and probable reserves for the Rajpura Dariba mine as of March 31, 2017 is 9.0 million tons with 6.3% zinc, 1.5% lead and 63 particles per million silver after depletion. An exploration program is also underway to identify new resources with the potential to be upgraded to reserves and has been and continues to be focused on maintaining the reserve position after annual mining depletion. The drill spacing for proved reserves was approximately 30 meters while for probable reserves was less than 60 meters.
The average grade for each individual stope was defined using standard parameters for internal waste and dilution and a geologicalcut-off grade of 3.0% combined lead and zinc, though the mineralization generally has a sharp natural contact. Thein-situ quantities and qualities were adjusted by applying a mining loss factor of 10.0%, a dilution factor of between 12.0% and 20.0% depending on ground conditions. These parameters are based on a reconciliation of historical production. Stopes with average grades below this economiccut-off grade were excluded from the reserve estimate. The final reserve estimate is the sum of the stopes with an average grade above the economiccut-off limit. As the stopes are all accessed using the existing infrastructure and as there is sufficient capacity on the tailings dam, the capital expenditure was limited to the replacement of mining equipment and was therefore considered not to have a material impact on thecut-off grade.
In fiscal year 2016, 668,7772017, 745,534 tons of ore at a grade of 5.1%5.2% zinc and 1.2% lead ore was mined at Rajpura Dariba mine which produced 59,05464,251 tons of zinc concentrate at 48.2%48.9% zinc, 15,78414,482 tons of lead concentrate at 40.9%41.1% lead and 1,7021,523 grams per ton of silver, with 83.5%83.8% of the zinc being recovered in the zinc concentrate and 70.7%68.7% of the lead and 69.6%52.7% of the silver. The bulk concentrate produced during fiscal year 2016 was 8,941 tons at 37.2% zinc and 9.7%silver in lead with 85.8% of the zinc being recovered and 82.8% of the lead and 81.5% of the silver.concentrate.
Sindesar Khurd
The Sindesar Khurd mine is a large scale underground mine deposit that was explored during 1992 to 1995. Mine production began at the Sindesar Khurd mine in April 2006 and HZL’s mining permit is valid until March 2049.
The Sindesar Khurd mine lies on the same geological belt as the Rajpura Dariba mine. The mine is approachable from Rajpura Dariba mines by road.
The mineralization has been traced over almost 2.5 kilometers along strike and 1.3 kilometer vertical extension. In the mine area, dip is steep westerly, while the dip turns into easterly direction in the lower-southern part of the deposit. The current “mine block” extends over 1,500 meters along strike and up to 420 meters depth extension.
The deposit has been drilled to a depth of approximately 1300 meters below surface and the ore body is traced over approximately 2 kilometers along the strike with an 1100 meters vertical extension. While the deposit is still open in depth in the southern extension of the present mine block, the area below the mine block and towards the north extension only has narrow and low to moderate grade mineralization intersected.
Exploration at the south part of Sindesar Khurd has been continuing since March 2005 with a drilling program aimed at increasing the size of the ore body. A continuous exploration program from underground is also underway with the aim to upgrade the reserve status so that the stopes planned to be mined out shall be extracted with maximum recovery and thereby reducing mining losses. The drill spacing for proven reserves was 12.5-2512.5 to 25 meters while for probable reserves was less than 25-5025 to 50 meters.
According to JORC reserves and resources statement, the proven and probable reserves for the Sindesar Khurd mine as of March 31, 20162017 is 33.235.6 million tons with 4.7%4.2% zinc and 3.2%2.9% lead and 187169 particles per million silver after depletion. Thein-situ quantities are adjusted by applying a mining loss factor of 5.0% and dilution factor of 12%16%.
Access to the mine is through an incline shaft and declines (North and South) from the surface while ore is hauled through the declines by low profile dump trucktrucks or LPDTs.The ore body is accessed via horizontal drives on number of levels. The mine currently utilizes blast holes toping with back filling mining method with stope panels varying from 25 to 50 meters in strike.
Ore produced from the mine is treated at 2.0 mmtpa beneficiation plant commissioned in 2011 at Sindesar Khurd. The benefication plant underwent debottlenecking in January 2015 to increase its capacity from 2 to 2.8 Mtpamtpa at Sindesar Khurd. Lead and zinc concentrates are sent to their respective high rate thickeners installed separately for lead concentrate and zinc concentrate generated from the concentrator. At Sindesar Khurd mine, work for the new 1.5 mtpa capacity mill is at full swing and is expectedbeneficiation plant was commissioned in January 2017 which has increased the mine’s total beneficiation capacity to be commissioned by end of the financial year in-line with the mine production ramp up.4.3 mtpa. Tailing dewatering and disposal section comprises of hydro cyclone, tailing thickener, neutralization tank, pumping of tailing to tailing pond and reclaimed water pumping. Lead and zinc concentrates are thickened, filtered and stored before they are sent to HZL’s smelters.
The gross book value at this mine is approximately Rs. 21,29030,665 million ($ 321.4472.9 million) as of March 31, 2016.2017.
As of March 31, 2016,2017, HZL estimates the remaining mine life at Sindesar Khurd to be around 97 years based on (i) reserves; and (ii) planned production which is determined on the basis of alife-of-mine plan.
Power for the mill and the mine is supplied from HZL’s captive power plant located at Dariba itself.
In fiscal year 2016, 2,969,5872017, 3,664,768 tons of ore at a grade of 3.9% zinc and 2.2%2.0% lead ore was mined at the Sindesar Khurd mine. Due to a mismatch in the mining and beneficiation capacity, the part of the ore produced at Sindesar Khurd mine was treated at Rampura Agucha mine and Rajpura Dariba mine. Out of the total ore produced at Sindesar Khurd mine, 2,567,816 tonnes2,726,597 tons of ore was treated at Sindesar Khurd mine beneficiation plant which produced 176,761189,528 tons of zinc concentrate at a grade of 51.5%51.1% zinc and 92,61192,027 lead concentrate at a grade of 53.2%55.9% lead with 2,6862,904 grams of silver inper ton of lead concentrate. The newly commissioned 1.5 mtpa capacity beneficiation plant at Sindesar Khurd mine treated 156,775 tons ore, which produced 9,342 tons of zinc concentrate at a grade of 46.5% zinc and 3,876 tons of lead concentrate at a grade of 51.4% lead with 2,911 grams of silver per ton of lead concentrate. In addition, 291,568 tonnes346,335 tons of Sindesar Khurd mine ore was treated at Rampura Agucha Mine which produced 20,171 tonnes22,759 tons of zinc concentrate at a grade of 48.7%49.7% zinc and 7,363 tonnes8,414 tons of lead concentrate at a grade of 56.9%56.6% lead with a 2,4562,936 grams of silver per ton of lead concentrate and 100,777 tonnes147,169 tons of Sindesar Khurd mine ore was treated at Rajpura Dariba mine beneficiation plant which produced 6,703 Zinc9,049 tons of zinc concentrate at a grade of 48%49.2% zinc and 3,3774,691 tons of lead concentrate at a grade of 45.9%41.7% lead with 1,9471,540 grams of silver inper ton of lead concentrate.
Zawar
Zawar consists of four mines namely, Mochia, Balaria, Zawar Mala and Baroi. The deposit is located near Udaipur city, in the state of Rajasthan in northwest India. The deposits lie within a 36.2 square kilometers mining lease granted by the state government of Rajasthan which is valid until March 31, 2030.
The mineralization is ranges over 2.5 to 3.0 kilometers each at Mochia, Balaria and Baroi mines each and 0.6 kilometers at Zawarmala mine. The mineralization is ranges below 1 kilometer vertically, while the deposit is still open in depth. An exploration program from the surface and underground is ongoing for lateral and depth extension along with upgrading the resource to reserve.
The mines are accessed through adit, shaft and declines from the surface, while ore is hauled through decline by LPDTs, shaft and locomotives.The ore body is accessed through horizontal drives on a number of levels. The mine currently utilizes asub-level open stoping mining method with stope sizes ranging from 60 to 80 meters in strike.
Ore processingproduced from the mine is carried out intreated at a conventional comminution andbeneficiation plant at Zawar mines for differential or bulk flotation plant having facility for “differential” as well as “bulk flotation” of zinc and lead metals. The benefication plant is undergoing debottlenecking to increase its capacity from 1.5 to 2.7 mtpa. The ore is crushed primarily underground and then hoisted to the surface. Thereafter the ore is crushed to 12 to 15mm15 mm in size before being milled to 74 microns. In the differential flotation process, milled ore is conveyed separatelyTailing dewatering and disposal section comprises of hydro cyclone, tailing thickener, pumping of tailings to two lead flotation circuitstailing pond and undergoes a process incorporating roughing, scavenging and cleaning. Lead flotation tails proceed to two zinc flotation circuits comprising roughing, scavenging and cleaning. Zinc flotation tails are disposed in slurry form in designated tailings disposal area.reclaimed water pumping for reuse. Lead and zinc concentrates are thickened, filtered and then stored before they are sent to HZL’s smelters. In the bulk flotation process, milled ore is conveyed to the flotation circuit and undergoes a process incorporating roughing, scavenging and cleaning. Final bulk concentrate is thickened, filtered and then stored before it is sent to the lead zinc smelter at Chanderiya. Bulk flotation tails are disposed in slurry form in designated tailings disposal areas.
In fiscal year 2016,2017, approximately 1,349,8501,770,000 tons of ore mined and beneficiated. 1,457,179 tons of ore at 2.8% zinc and 2.1% lead was mined which produced 102,987113,015 tons of bulk concentrate at 32.3%32.5% zinc and 24.2%25% lead. The recovery of zinc and lead during fiscal year 20162017 was 90.4%91.0% and 90.4%90.9%, respectively.
The gross book value of the Zawar fixed assets and mining equipment was approximately Rs. 4,6004,815 million ($ 69.474.2 million) as of March 31, 20162017 and of the 80 MW coal-based thermal captive power plant at Zawar was Rs. 3,2203,200 million ($ 48.649.3 million).
Power is supplied through a combination of an 80 MW thermal coal-based captive power plant commissioned in December 2008 and a 6 MW captive power plant.
As of March 31, 2016,2017, HZL estimates the remaining mine life of the Zawar mine to be 53 years based on (i) reserves; and (ii) planned production which is determined on the basis of alife-of-mine plan. The focus of underground mine exploration at Zawar is to replenishenhance the ore reserves that are being depleted through exploration activitiesto expand the mine life by 5 years and to look foridentify new mineralized areas to enhance production capacity. A surface drilling program is underway to locate deeper resources below -100100 meter reduce level up to 500 meter reduce level. Underground exploratory drilling is carried out on a grid of between 25 meters andto 30 meters which is then infilled to 12.5 meters /or 15 meters after completing the development for final delineation of ore bodies. Past exploration has outlined additionalin-mine mineral resources which require further delineation to add to reserves and further extend the mine life.
Kayad Mine
The Kayad lead-zinc mine is located in Ajmer, in the state of Rajasthan.
The Kayad lead-zinc deposit was initially prospected by Airborne Mineral Survey and Exploration wing of Geological Survey of India and drilling commenced in August 1988 and was completed in December 1991. Mineral Exploration Corporation Limited worked on the project on promotional basis, started the exploration and a total of 9,585 meters of drilling was achieved in 42 completed bore holes during 1994-1997. The detailed exploration of Kayad deposit was commenced by HZL in the month of June 1999 and continues as of today with a total of 162178 kilometers in 9191,132 drill holes. According to the reserve report, the proven and probable reserves for Kayad mine as on March 31, 20162017 was 3.95.4 million tons at 13.47.8 % zinc and 1.8%1.1% lead. As of March 31, 2016,2017, HZL estimates the remaining mine life of the Kayad mine to be over 46 years based on (i) reserves; and (ii) planned production which is determined on the basis of alife-of-mine plan.
The ground breaking of the mine commenced on June 11, 2011. The access is through a decline which then divides into two declines at 420 meter reduce level. Development ore production was achieved in the second quarter of fiscal year 2013, and the mine started operations in fiscal year 2014. The mining method practiced in Kayad is long hole open stoping with cemented rock filling /or rock filling in the steeper portions of the deposit; while transverse stoping method at flat portion along with cemented rock filling/cementedfilling or rock filling. About 47 kilometers of development is planned by 2021. The mining is highly mechanized with twin boom jumbo drills used for face drilling, rock bolting machines used for support and 10 T and 17 T diesel load haul dump vehicles coupled with 30 T/T or 50 T low profile dump trucks for loading and hauling. For production drilling Simba Drills are being used. The run of mine is stacked in the surface ore stock pile and transported by trucks to the Rampura Agucha mine for beneficiation.
A mine lease of 480.45480.5 hectares was granted to Kayad mine by the state of Rajasthan and is valid until February 2048, subject to further renewal. We have obtained surface land rights over 49.8 hectares. We have also obtained mine plan approval from the Indian Bureau of Mines and received environmental clearance from the MoEF for an increase in lead zinc ore production capacity from 0.350.4 million tons per annum to 1.0 million tons per annum.mtpa. We have also obtained consents under various environmental laws to operate the mine, including from the State Pollution Control Board.
A 33 KV power line was commissioned on February 2, 2012 to meet the constructional power requirements of the mine. Currently, most of the power is being taken from captive power plant in Zawar and some power is taken from state grid. A one megavolt amperes diesel generator is kept as a backup power supply for emergency operations in the event of power failure. For proper power distribution, a 2 megavolt amperes underground sub stationsub-station is commissioned in Northeach of the north and south section each.sections.
Summary of Mine Reserves
The following table sets out HZL’s proven and probable zinc and lead reserves as of March 31, 2016:2017:
| Proven Reserves | Probable Reserves | Total Proven and Probable Reserves | Vedanta Ownership | Reserve Life | Proven Reserves | Probable Reserves | Total Proven and Probable Reserves | Vedanta Ownership | Reserve Life | |||||||||||||||||||||||||||||||||||||||||||||||||||||||||||||||||||||||||||||||||||||||||||||||||||||
Mine | Quantity | Zinc Grade | Lead Grade | Silver Grade | Quantity | Zinc Grade | Lead Grade | Silver Grade | Quantity | Zinc Grade | Lead Grade | Silver Grade | Quantity | Zinc Grade | Lead Grade | Silver Grade | Quantity | Zinc Grade | Lead Grade | Silver Grade | Quantity | Zinc Grade | Lead Grade | Silver Grade |
|
| ||||||||||||||||||||||||||||||||||||||||||||||||||||||||||||||||||||||||||||||||||||
| (million tons) | (%) | (%) | (g/t) | (million tons) | (%) | (%) | (g/t) | (million tons) | (%) | (%) | (g/t) | % | Years | (million tons) | (%) | (%) | (g/t) | (million tons) | (%) | (%) | (g/t) | (million tons) | (%) | (%) | (g/t) | % | Years | |||||||||||||||||||||||||||||||||||||||||||||||||||||||||||||||||||||||||||||||||||
Rampura Agucha | 4.9 | 13.5 | 2.1 | 59 | 46.2 | 14.0 | 1.8 | 58 | 51.1 | 14.0 | 1.8 | 58 | 13 | 6.3 | 14.0 | 2.1 | 65 | 43.4 | 13.9 | 1.8 | 62 | 49.7 | 13.9 | 1.9 | 62 | 12 | ||||||||||||||||||||||||||||||||||||||||||||||||||||||||||||||||||||||||||||||||||||
Rajpura Dariba | 6.4 | 6.1 | 1.6 | 61 | 2.9 | 6.7 | 1.5 | 61 | 9.3 | 6.3 | 1.6 | 61 | 8 | 5.8 | 6.1 | 1.6 | 64 | 3.1 | 6.6 | 1.5 | 61 | 9.0 | 6.3 | 1.5 | 63 | 8 | ||||||||||||||||||||||||||||||||||||||||||||||||||||||||||||||||||||||||||||||||||||
Sindesar Khurd | 8.5 | 4.3 | 2.5 | 136 | 24.7 | 4.8 | 3.4 | 204 | 33.2 | 4.7 | 3.2 | 187 | 9 | 10.0 | 4.3 | 2.7 | 159 | 25.5 | 4.2 | 2.9 | 172 | 35.6 | 4.2 | 2.9 | 169 | 7 | ||||||||||||||||||||||||||||||||||||||||||||||||||||||||||||||||||||||||||||||||||||
Zawar | 3.4 | 3.5 | 1.8 | 33 | 6.2 | 3.4 | 1.7 | 32 | 9.5 | 3.4 | 1.7 | 32 | 5 | 2.4 | 3.6 | 1.6 | 34 | 7.0 | 3.2 | 1.8 | 35 | 9.5 | 3.3 | 1.8 | 31 | 3 | ||||||||||||||||||||||||||||||||||||||||||||||||||||||||||||||||||||||||||||||||||||
Kayad | 0.7 | 13.8 | 1.8 | 42 | 3.3 | 13.4 | 1.8 | 43 | 3.9 | 13.4 | 1.8 | 43 | 4 | 2.0 | 7.3 | 1.0 | 28 | 3.4 | 8.1 | 1.2 | 33 | 5.4 | 7.8 | 1.1 | 31 | 6 | ||||||||||||||||||||||||||||||||||||||||||||||||||||||||||||||||||||||||||||||||||||
Total | 23.9 | 6.8 | 2.1 | 83 | 83.2 | 10.2 | 2.2 | 100 | 107.1 | 9.5 | 2.2 | 96 | 64.9 | 26.6 | 7.1 | 2.1 | 95 | 82.5 | 9.5 | 2.1 | 93 | 109.1 | 8.9 | 2.1 | 93 | 64.9 | ||||||||||||||||||||||||||||||||||||||||||||||||||||||||||||||||||||||||||||||||||||
References to “g/t” are grams per ton
Additional information:
| (1) | The reserve estimates for each of the mines have been prepared by the mining engineer of the respective operation and the same have been audited by SRK Consulting (UK) Limited. The reserves presented for the HZL mines have been adjusted to incorporate losses for mine dilution and mining recovery according to the JORC code. |
| (2) | The |
| (3) | The metallurgical recovery factor for the following HZL mines is as follows: |
Mine | Metallurgical Recovery Factor | |||
Rampura Agucha | ||||
Zinc | ||||
Lead | ||||
Rajpura Dariba | ||||
Zinc | ||||
Lead | ||||
Sindesar Khurd | ||||
Zinc | ||||
Lead | ||||
Zawar | ||||
Zinc | ||||
Lead | ||||
| (4) | The |
| (5) | The reserve quantities disclosed are for the entire mine and our share in the reserve quantities is 64.9%. |
Smelters
Overview
The following table sets forth the total capacities as of March 31, 20162017 at HZL’s Chanderiya, Debari, Zawar, Dariba and Pantnagar facilities:
| Capacity | ||||||||||||||||||||
Facility | Zinc | Lead | Silver | Sulphuric Acid | Captive Power | |||||||||||||||
| (tpa) | (tpa) | (tpa) | (tpa) | (MW) | ||||||||||||||||
Chanderiya(1) | 525,000 | 85,000 | — | 828,500 | 247.7 | |||||||||||||||
Debari | 88,000 | — | — | 419,000 | 7.4 | |||||||||||||||
Zawar | — | — | — | — | 80.0 | |||||||||||||||
Dariba | 210,000 | 100,000 | — | 710,500 | 174.3 | |||||||||||||||
Pantnagar | — | — | 518 | — | — | |||||||||||||||
Total | 823,000 | 185,000 | 518 | 1,958,000 | 509.4 | |||||||||||||||
|
|
|
|
|
|
|
|
|
| |||||||||||
| (1) | The plant at Haridwar is a finishing facility for zinc ingots from zinc cathodes produced at the Chanderiya and Dariba smelters. The processing plant at Pantnagar is a finishing facility for zinc and lead ingots from zinc and lead cathodes produced at the Chanderiya and Dariba smelters. Therefore their production capacities do not increase the total production capacity of HZL’s facilities. |
Chanderiya
The Chanderiya facility is located approximately 120 kilometers east of Udaipur in the state of Rajasthan. The facility contains 4 smelters, 3 associated captive power plants and 3 sulphuric acid plants:
Concentrate requirements for the facility are supplied by HZL’s mines. The 154 MW, 80 MW and 14.8 MW captive power plants at Chanderiya provide all of the power for the facility. The captive power plants require approximately 100,000 metric tons of coal at 6,000 gross calorific value per month, which is currently met through imports, mostly from Indonesia. The impure silver obtained as aby-product fromzinc-lead smelting at this smelter is refined at the Pantnagar plant.
HZL, in January 2006, as part of a consortium with five other partners, secured the award of a coal block from the Ministry of Coal of the GoI for its Chanderiya plant. HZL’s share of the coal block is approximately 31.5 million tons which, according to the Ministry of Coal of the GoI, are proven reserves with ash content ranging from 28.7% to 47.0% and with gross calorific value ranging from 3,865 Kcal/kg to 5,597 Kcal/kg. On June 16, 2008, the Ministry of Coal of the GoI approved the consortium’s plan for mining the coal block. The coal block is located in the Hasdev Arand coal field in the state of Chhattisgarh, which falls under moderate to dense forest. The environmental clearance and approval for the forest diversion was initially rejected by the MoEF and accordingly, a letter of rejection was issued by the state government on January 23, 2010. In February 2012, the HZL consortium resubmitted its application, which required approval from the state government and the MoEF. However, on February 17, 2014, the Ministry of Coal issued a letter cancelling the coal block allocation stating that the consortium could not obtain forest clearance and adhere to the timeline for the development of the coal block and also the fact that the same was rejected earlier. The Ministry of Coal’s actions were challenged by the consortium in the High Court of Chhattisgarh and a stay order was granted on March 11, 2014. In September 2014, the Supreme Court of India revoked all the allocations of coal blocks post 1992 until 2012, which were awarded by Ministry of Coal through its screening committee. Now, an auction route has evolved for the new allocation of coal blocks. HZL has consequently fully provided for the potential loss of value of its investment.
After being denied access to the Hasdev Arand field, HZL continues to import coal from third-party suppliers. HZL had been awarded 1.2 million tons of coal linkage by the Ministry of Coal of the GoI for its Chanderiya plant, but the same was linked to the development of allocated coal block. The access to coal has been stopped since September 2012 and there is no linkage coal available for Chanderiya plant and its entire requirement are being met from imported coal. Currently, the price of linkage coal is higher than the price of imported coal on a landed basis.
Dariba
The Dariba hydrometallurgical zinc smelter is located in the Rajsamand district of Rajasthan which was commissioned in March 2010 and has a capacity of 210,000 tpa. The Dariba facility also includes a 306,000 tpa sulphuric acid plant. In July 2011, we commissioned a new 100,000 tpa lead smelter, and it also includes a 98,500 tpa sulphuric acid plant. A majority of the power requirements of the facility is sourced from the 160 MW coal-based captive power plant at Dariba. A new roaster was commissioned in April 2013 in the Dariba facility with an associated sulphuric acid plant capacity of 306,000 tpa. Zinc cathodes are sent to its refining facilities at Pantnagar in Uttarakhand state for finishing and casting. The anode slime obtained as a residue from lead smelting at this smelter is refined and casted into silver ingots at the Pantnagar plant.
Debari
The Debari hydrometallurgical zinc smelter is located in the state of Rajasthan. The hydrometallurgical zinc smelter was commissioned in 1968, uses RLE technology and has a capacity of 80,000 tpa which was increased to 88,000 tpa in April 2008, pursuant to improvements made to its operational efficiencies. The Debari facility also includes a 419,000 tpa sulphuric acid plant. A majority of the power requirements of the facility is sourced from the coal-based captive power plant at Chanderiya and the balance is sourced from twoon-site liquid fuel-based captive power plants with a combined capacity of 14.8 MW, commissioned in March 2003.
Haridwar
The zinc ingot refining and casting plant in Haridwar in the state of Uttarakhand was commissioned in July 2008. This plant processes and casts zinc ingots from zinc cathodes produced in the Chanderiya smelter and therefore its production capacity does not increase the total production capacity of HZL’s facilities.
Pantnagar
The Pantnagar plant, which is located in the state of Uttarakhand in northwest India, includes a 518 tpa silver refinery that was commissioned in December, 2011, a zinc ingot and a lead ingot refining and casting plant that was commissioned in February 2012. The Pantnagar plant refine and cast zinc and lead ingots from zinc and lead cathodes that are produced by our Chanderiya and Dariba smelters and also refines the impure silver obtained as aby-product from lead smelting conducted at our Chanderiya and Dariba smelters. Therefore the Pantnagar plant does not increase the total zinc and lead production capacity of HZL’s facilities. Haridwar and Pantnagar facilities are also used for nationwide distribution of finished goods as well as for exports.
Production Volumes
The following table sets out HZL’s total production from its Chanderiya, Debari, Dariba and the Pantnagar facilities for fiscal years ended March 31, 2014, 2015, 2016 and 2016:2017:
| For the Year Ended March 31, | For the Year Ended March 31, | |||||||||||||||||||||||||||||||
Facility | Product | 2014 | 2015 | 2016 | Product | 2015 | 2016 | 2017 | ||||||||||||||||||||||||
| (tons, except for silver which is in kgs) | (tons, except for silver which is in kgs) | |||||||||||||||||||||||||||||||
Chanderiya | ||||||||||||||||||||||||||||||||
—ISPTM pyrometallurgical lead-zinc smelter | Zinc | 78,032 | 91,001 | 86,908 | Zinc | 91,001 | 86,908 | 83,838 | ||||||||||||||||||||||||
| Lead | 15,901 | 26,898 | 21,517 | Lead | 26,898 | 21,517 | 23,121 | |||||||||||||||||||||||||
First hydrometallurgical zinc smelter | Zinc | 194,023 | 182,696 | 193,639 | Zinc | 182,696 | 193,639 | 173,401 | ||||||||||||||||||||||||
Second hydrometallurgical zinc smelter | Zinc | 204,896 | 191,028 | 207,923 | Zinc | 191,028 | 207,923 | 178,424 | ||||||||||||||||||||||||
AusmeltTM lead smelter | Lead | 30,586 | 6,111 | 23,045 | Lead | 6,111 | 23,045 | 23,352 | ||||||||||||||||||||||||
Sulphuric acid plants | Sulphuric acid | 586,919 | 547,165 | 618,426 | Sulphuric acid | 547,165 | 618,426 | 545,563 | ||||||||||||||||||||||||
Dariba | ||||||||||||||||||||||||||||||||
Hydrometallurgical zinc smelter | Zinc | 197,715 | 199,694 | 203,704 | Zinc | 199,694 | 203,704 | 189,882 | ||||||||||||||||||||||||
Lead Smelter | Lead | 76,109 | 94,135 | 100,357 | Lead | 94,135 | 100,357 | 92,535 | ||||||||||||||||||||||||
Sulphuric acid plant | Sulphuric acid | 459,026 | 480,542 | 499,222 | Sulphuric acid | 480,542 | 499,222 | 446,997 | ||||||||||||||||||||||||
Debari | ||||||||||||||||||||||||||||||||
Hydrometallurgical zinc smelter | Zinc | 74,501 | 69,385 | 66,764 | �� | Zinc | 69,385 | 66,764 | 46,442 | |||||||||||||||||||||||
Sulphuric acid plant | Sulphuric acid | 282,565 | 251,408 | 224,675 | Sulphuric acid | 251,408 | 224,675 | 191,636 | ||||||||||||||||||||||||
Pantnagar | ||||||||||||||||||||||||||||||||
Silver Refinery | Silver | 349,620 | 327,508 | 424,578 | Silver | 327,508 | 424,578 | 452,543 | ||||||||||||||||||||||||
Total | Zinc | 749,167 | 733,803 | 758,938 | Zinc | 733,803 | 758,938 | 671,987 | ||||||||||||||||||||||||
| Lead(1) | 122,596 | 127,143 | 144,919 | Lead(1) | 127,143 | 144,919 | 139,008 | |||||||||||||||||||||||||
| Silver | 349,620 | 327,508 | 424,578 | Silver | 327,508 | 424,578 | 452,543 | |||||||||||||||||||||||||
| Sulphuric acid | 1,328,510 | 1,279,115 | 1,342,323 | Sulphuric acid | 1,279,115 | 1,342,323 | 1,184,196 | |||||||||||||||||||||||||
Notes:
| (1) | Excludes lead containing a high content of silver (high silver lead) produced from the pyrometallurgical lead-zinc smelter for captive use, which was |
The following table sets out HZL’s total ore, zinc concentrate, lead concentrate and bulk concentrate production for fiscal years ended March 31, 2014, 2015, 2016 and 2016:2017:
| Year Ended March 31, | Year Ended March 31, | |||||||||||||||||||||||||||
Mine (Type of Mine) | Product | 2014 | 2015 | 2016 | Product | 2015 | 2016 | 2017 | ||||||||||||||||||||
| (tons, except percentages) | (tons, except percentages) | |||||||||||||||||||||||||||
Rampura Agucha (Open-pit) | Ore mined | 5,481,006 | 4,999,476 | 4,481,114 | Ore mined | 4,999,476 | 4,481,114 | 3,321,192 | ||||||||||||||||||||
| Ore grade – Zinc | 12.4% | 12.9% | 12.1% | Ore grade – Zinc | 12.9% | 12.1% | 13.3% | |||||||||||||||||||||
| Lead | 1.7% | 1.7% | 1.9% | Lead | 1.7% | 1.9% | 1.9% | |||||||||||||||||||||
| Recovery – Zinc | 90.7% | 91.7% | 88.1% | Recovery – Zinc | 91.7% | 88.1% | 91.9% | |||||||||||||||||||||
| Lead | 59.0% | 61.4% | 57.7% | Lead | 61.4% | 57.7% | 63.3% | |||||||||||||||||||||
| Zinc concentrate | 1,196,399 | 1,143,090 | 964,879 | Zinc concentrate | 1,143,090 | 964,879 | 769,015 | |||||||||||||||||||||
| Lead concentrate | 89,106 | 88,024 | 85,311 | Lead concentrate | 88,024 | 85,311 | 61,799 | |||||||||||||||||||||
Rampura Agucha (Underground) | Ore mined | 322,846 | 451,844 | 223,521 | Ore mined | 451,844 | 223,521 | 1,379,746 | ||||||||||||||||||||
| Ore grade – Zinc | 12.6% | 13.1% | 10.4% | Ore grade – Zinc | 13.1% | 10.4% | 10.2% | |||||||||||||||||||||
| Lead | 1.7% | 1.8% | 1.4% | Lead | 1.8% | 1.4% | 1.3% | |||||||||||||||||||||
| Recovery – Zinc | 90.7% | 91.7% | 88.1% | Recovery – Zinc | 91.7% | 88.1% | 89.9% | |||||||||||||||||||||
| Lead | 59.0% | 61.4% | 57.7% | Lead | 61.4% | 57.7% | 56.4% | |||||||||||||||||||||
| Zinc concentrate | 71,916 | 106,022 | 42,104 | Zinc concentrate | 106,022 | 42,104 | 191,123 | |||||||||||||||||||||
| Lead concentrate | 5,328 | 8,447 | 3,398 | Lead concentrate | 8,447 | 3,398 | 14,688 | |||||||||||||||||||||
Kayad (Underground) | Ore mined | 149,286 | 372,000 | 760,100 | Ore mined | 372,000 | 760,100 | 1,000,000 | ||||||||||||||||||||
| Ore grade – Zinc | 7.9% | 9.1% | 8.9% | Ore grade – Zinc | 9.1% | 8.9% | 10.0% | |||||||||||||||||||||
| Lead | 1.1% | 1.1% | 1.1% | Lead | 1.1% | 1.1% | 1.4% | |||||||||||||||||||||
| Recovery – Zinc | 90.7% | 91.7% | 93.3% | Recovery – Zinc | 91.7% | 93.3% | 94.8% | |||||||||||||||||||||
| Lead | 59.0% | 61.4% | 74.0% | Lead | 61.4% | 74.0% | 75.0% | |||||||||||||||||||||
| Zinc concentrate | 22,061 | 30,309 | 151,298 | Zinc concentrate | 30,309 | 151,298 | 164,332 | |||||||||||||||||||||
| Lead concentrate | 1,703 | 2,223 | 12,953 | Lead concentrate | 2,223 | 12,953 | 15,597 | |||||||||||||||||||||
Rajpura Dariba (Underground) | Ore mined | 610,242 | 573,284 | 668,777 | Ore mined | 573,284 | 668,777 | 745,534 | ||||||||||||||||||||
| Ore grade – Zinc | 5.3% | 5.3% | 5.1% | Ore grade – Zinc | 5.3% | 5.1% | 5.2% | |||||||||||||||||||||
| Lead | 1.3% | 1.3% | 1.2% | Lead | 1.3% | 1.2% | 1.2% | |||||||||||||||||||||
| Recovery – Zinc | 82.8% | 83.4% | 83.4% | Recovery – Zinc | 83.4% | 83.4% | 83.8% | |||||||||||||||||||||
| Lead | 67.7% | 70.1% | 70.3% | Lead | 70.1% | 70.3% | 68.7% | |||||||||||||||||||||
| Zinc concentrate | 52,212 | 43,359 | 52,351 | Zinc concentrate | 43,359 | 52,351 | 64,251 | |||||||||||||||||||||
| Lead concentrate | 12,241 | 10,647 | 12,407 | Lead concentrate | 10,647 | 12,407 | 14,482 | |||||||||||||||||||||
| Bulk concentrate(1) | — | 9,832 | 8,941 | Bulk concentrate(1) | 9,832 | 8,941 | 0 | |||||||||||||||||||||
Sindesar Khurd (Underground) | Ore mined | 1,723,253 | 1,910,055 | 2,969,587 | Ore mined | 1,910,055 | 2,969,587 | 3,664,768 | ||||||||||||||||||||
| Ore grade – Zinc | 3.5% | 3.6% | 3.9% | Ore grade – Zinc | 3.6% | 3.9% | 3.9% | |||||||||||||||||||||
| Lead | 2.1% | 1.9% | 2.2% | Lead | 1.9% | 2.2% | 2.1% | |||||||||||||||||||||
| Recovery – Zinc | 87.8% | 89.8% | 91.0% | Recovery – Zinc | 89.8% | 91.0% | 90.5% | |||||||||||||||||||||
| Lead | 85.5% | 86.8% | 89.0% | Lead | 86.8% | 89.0% | 87.6% | |||||||||||||||||||||
| Zinc concentrate | 105,562 | 126,952 | 176,761 | Zinc concentrate | 126,952 | 176,761 | 274,413 | |||||||||||||||||||||
| Lead concentrate | 60,128 | 61,630 | 92,611 | Lead concentrate | 61,630 | 92,611 | 133,881 | |||||||||||||||||||||
Zawar (Underground) | Ore mined | 1,003,600 | 1,056,000 | 1,349,850 | Ore mined | 1,056,000 | 1,349,850 | 1,770,000 | ||||||||||||||||||||
| Ore grade – Zinc | 2.8% | 2.8% | 2.8% | Ore grade – Zinc | 2.8% | 2.8% | 2.8% | |||||||||||||||||||||
| Lead | 1.7% | 1.7% | 2.1% | Lead | 1.7% | 2.1% | 2.1% | |||||||||||||||||||||
| Recovery – Zinc | 90.8% | 90.3% | 90.4% | Recovery – Zinc | 90.3% | 90.4% | 91.0% | |||||||||||||||||||||
| Lead | 90.2% | 89.8% | 90.4% | Lead | 89.8% | 90.4% | 90.9% | |||||||||||||||||||||
| Zinc concentrate | — | — | — | Zinc concentrate | — | — | 3,441 | |||||||||||||||||||||
| Lead concentrate | — | — | — | Lead concentrate | — | — | 3,088 | |||||||||||||||||||||
| Bulk concentrate(1) | 68,432 | 74,186 | 102,987 | Bulk concentrate(1) | 74,186 | 102,987 | 113,015 | |||||||||||||||||||||
Total | Ore mined | 9,290,233 | 9,362,659 | 10,452,949 | Ore mined | 9,362,659 | 10,452,949 | 11,881,240 | ||||||||||||||||||||
| Zinc concentrate | 1,448,151 | 1,449,731 | 1,387,393(2) | Zinc concentrate | 1,449,731 | 1,387,393 | 1,463,567(2) | |||||||||||||||||||||
| Lead concentrate | 168,505 | 170,970 | 206,680 | Lead concentrate | 170,970 | 206,680 | 243,678 | |||||||||||||||||||||
| Bulk concentrate(1) | 68,432 | 84,018 | 111,928(2) | Bulk concentrate(1) | 84,018 | 111,928 | 113,015(2) | |||||||||||||||||||||
Note:
| (1) | Bulk concentrate is concentrate that contains both zinc and lead. |
| (2) | The above production excludes Rampura Agucha ore treated at the Sindesar Khurd |
Principal Raw Materials
The principal inputs of HZL’s zinc smelting business are zinc and lead concentrates and power. HZL has in the past been able to secure an adequate supply of the principal inputs for its business.
Zinc and Lead Concentrates
Zinc and lead concentrates are the principal raw material of HZL’s smelters. HZL’s lead-zinc mines have provided nearly all of its requirements for zinc and lead concentrates in the past. However, a marginal portion of the metal is being produced through sourced concentrates. In fiscal year 2016, 3.0% of the lead production was through sourced concentrates.2017. We expect HZL’s mines to continue to provide nearly all of its zinc and lead concentrate requirements for the foreseeable future.
Power
Most of HZL’s operations are powered by the coal-based captive power plants at Chanderiya, Dariba and Zawar. HZL imports the required thermal coal from a number of third party suppliers and part of the requirement is sourced by way of linkage with South Eastern Coalfields Ltd (which is aLimited (a subsidiary of Coal India Limited). HZL was awarded 2.432.4 million tons of coal linkage by Ministry of Coal. However, due to limited coal availability, Coal India Limited has been supplying only 50.0% of the 2.4 million tons linkage quantity. As of April 2013, the coal supplies to Chanderiya have stopped due to pending decision at Ministry of Coal on the linkages for plants which have been allocated coal blocks. In February 2014 the coal block allocated to the Chanderiya lead zinc smelter captive power plant was deallocated by the Ministry of Coal. As of January 2016, the coal supplies to Dariba captive power plant stopped due to the expiry of the existing fuel supply agreement (FSA) and further renewal of the FSAsuch agreement has not yet been sanctioned by South Eastern Coalfields Limited. Linkage coal supplies to HZL’s power plants at Zawar are continuing and the linkage quantity for these plants has been restricted to 50% of 0.4 million tons. The remaining coal requirements are met through the import of coal from various countries which is currently priced lower than linkage coal on a landed basis.
HZL’s remaining operations source their required power from liquid fuel-based captive power plants or from local power companies. The liquid fuel is sourced from third party suppliers on yearly contracts.
Metallurgical Coke
In addition, HZL’s pyrometallurgical smelter at Chanderiya requires metallurgical coke that is used in the smelting process. HZL currently sources its metallurgical coke requirements from third parties under long-term contracts and the open market.
Distribution, Logistics and Transport
Zinc and lead concentrates from HZL’s lead-zinc mines are transported to the Chanderiya and Debari smelters by road. Zinc and lead ingots, silver and sulphuric acidby-products are transported primarily by road to customers in India directly or via HZL’s depots. Zinc and lead cathodes are mostly transported by rail to its processing and refining facilities in Uttarakhand state in northern India. Zinc and lead ingots are transported for exports to ports in India primarily by rail, from where they are loaded on ships. The facilities in Uttarakhand also serve as finished goods center for nationwide distribution of its finished products.
Sales and Marketing
HZL’s 10 largest customers accounted for approximately 41.2%40.5%, 40.5%36.5% and 36.5%34.0% of its revenue in fiscal years 2014, 2015, 2016 and 20162017 respectively. No customer accounted for greater than 10.0% of HZL’s zinc business revenue in fiscal years 2014, 2015, 2016 and 2016.2017.
HZL’s marketing office is located in Mumbai, and it has field sales and marketing offices in most major metropolitan centers in India. In fiscal year 2016,2017, HZL sold approximately 75%71% of the zinc and lead metal it producesproduced in the Indian market and exported approximately 25%29% of our zincZinc India segment revenue.
In fiscal year 2016,2017, HZL soldaccounted for approximately 98.7%99.1% of thedomestic sales of zinc metal in the domestic marketunder annual contracts and exported approximately 56.1%80% of export sales under annual contracts specifying quantity, grade and price, with the remainder sold on the spot market. The contract sales price is linked to prevailing LME price with an additional physical market premium. Thus, the price that HZL receives for its zinc is dependent upon, and subject to fluctuations in the LME price.
Projects and Developments
HZL has been actively conducting exploration, which has resulted in net ore reserves of 107.1109.1 million tons across all mines in fiscal year 2016.2017. Based on long-term evaluation of assets and in consultation with mining experts, we have finalized the next phase of growth, which will involve sinking of underground shafts and developing underground mines. The plan comprises developing a 3.754.5 mmtpa underground mine at Rampura Agucha mine and expanding the Sindesar Khurd mine from 2.0 mmtpa to 3.756.0 mmtpa, Zawar mines from 1.51.2 mmtpa to 4.04.5 mmtpa, Rajpura Dariba mine from 0.6 mmtpa to 1.21.5 mmtpa and Kayad mine from 0.350.4 mmtpa to 1.0 mmtpa. The growth plan will increase mined metal (MIC) production capacity to 1.2 mmtpa. The estimated cost for these projects amounts to Rs. 86,700108,600 million ($ 1,308.71,674.6 million). HZL spent Rs. 10,42013,130 million ($ 157.3202.5 million) on these projects in fiscal year 2016.2017. These projects are financed from internal sources.
Market Share and Competition
HZL is the only integrated zinc producer in India and had a market share by sales volume of the Indian zinc market of 79.1%72.0% in fiscal year 2016,2017, according to ILZDA. The only other zinc producer in India, but not integrated and depends on imports of zinc concentrate, is Binani Zinc Limited, which had a market share of one percent of the Indian market in terms of sales volume in fiscal year 2016, according to ILZDA. Imports and secondary sources accounted for the remaining 19.9%28.0% market share, according to ILZDA. Zinc is a commodity product and HZL competes primarily on the basis of price, time of delivery and location. Zinc metal also faces competition as a result of substitution of materials, including aluminium, stainless steel and other alloys, plastics and other materials being substituted for galvanized steel and epoxies, paints and other chemicals being used to treat steel in place of galvanization in the construction market.
HZL is the only primary lead producer in India, with competition coming from imports which provide a substantial majority of the lead consumed in India. Lead is a commodity product and HZL competes primarily on the basis of price, time of delivery and location.
Our Zinc International Business
Overview
On May 10, 2010, SIIL agreed to acquireOur zinc international business comprises Skorpion, which owns the zinc business of Anglo American Plc for a total consideration of Rs. 69,083 million ($ 1,513.1 million)Skorpion mine and refinery in Namibia and Black Mountain Mining, which comprises:owns the Black Mountain mine and the Gamsberg project in South Africa.
Skorpion
Overview
THL Zinc Namibia Holdings (Proprietary) Limited (“Skorpion”) was incorporated on June 16, 1998 and is headquartered at the Skorpion Zinc mine site, which is situated 25 kilometers north of Rosh Pinah Namibia. Skorpion’s wholly owned subsidiaries are: Skorpion Zinc (Proprietary) Limited, Namzinc (Proprietary) Limited, Amica Guesthouse (Proprietary) Limited and Skorpion Mining Company (Proprietary) Limited. Skorpion Zinc (Proprietary) Limited is an investment holding company, owning the entire share capital in Namzinc (Proprietary) Limited and Skorpion Mining Company (Proprietary) Limited. Namzinc (Proprietary) Limited operates a zinc refinery, which procures oxide zinc ore from Skorpion Mining Company (Proprietary) Limited, which in turn extracts the ore from an open pit zinc deposit. Skorpion Mining Company (Proprietary) Limited is a member of the Chamber of Mines in Namibia.
Principal Products
Skorpion produces SHG zinc ingots of LME grade. Skorpion offers the product to customers primarily throughone-year contracts, covering the sale of all zinc ingots produced at the integrated mine and refinery of Skorpion.
Principal Facilities
The following map shows the location of Skorpion mines in Namibia:
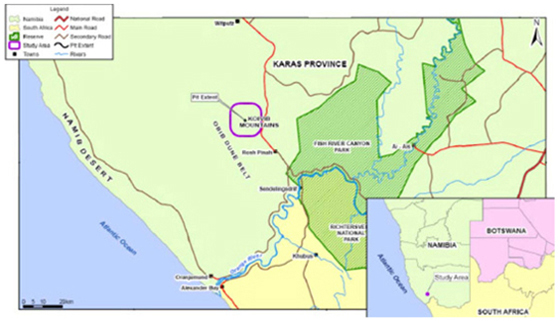
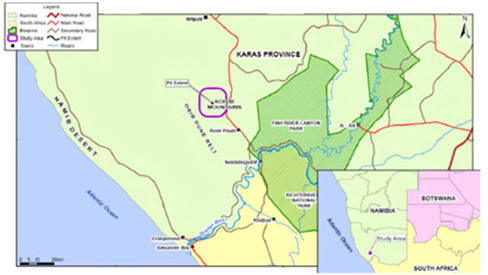
Mines
Skorpion Mines
The Skorpion Zinc Deposit is located in the southern Namib desert of Namibia, approximately 20 kilometers north-west of the small mining town of Rosh Pinah, 75 kilometers from the Atlantic coastline, and about 40 kilometers from the perennial Orange river, which forms the border with South Africa. The deposit lies just inside the “Sperrgebiet” or forbidden area, now known as Diamond Area 1. The extracted ore is sent to the refinery for further processing.
As of March 31, 2016,2017, the remaining mine life of the Skorpion mine is approximately 4.572.9 years based on (i) reserves; and (ii) planned production which is determined on the basis of alife-of-mine plan. The Skorpion mine has an attached electrolytic refinery producing approximately 150,000 tons of SHG zinc ingots annually. Further opportunities to extend the life of the mine are currently being evaluated based on the sulphide ore bodies in the nearby areas. Skorpion is also working for conversion of the refinery from stand-alone oxide ore treatment to sulphide ore treatment also.
Summary of Mine Reserves
The following table sets out the proved and probable zinc reserves as of March 31, 2016:2017:
| Proved Reserve | Probable Reserve | Total Proved and Probable Reserves | Vedanta Limited Interest | Reserve life | Proved Reserve | Probable Reserve | Total Proved and Probable Reserves | Vedanta Limited Interest | Reserve life | |||||||||||||||||||||||||||||||||||||||||||||||||||||||
| Quantity | Zinc Grade | Quantity | Zinc Grade | Quantity | Zinc Grade | Quantity | Zinc Grade | Quantity | Zinc Grade | Quantity | Zinc Grade | |||||||||||||||||||||||||||||||||||||||||||||||||||||
| (million tons) | (%) | (million tons) | (%) | (million tons) | (%) | % | (Years) | (million tons) | (%) | (million tons) | (%) | (million tons) | (%) | % | (Years) | |||||||||||||||||||||||||||||||||||||||||||||||||
Skorpion | 1.15 | 8.00 | 3.23 | 9.9 | 4.38 | 9.4 | 0.46 | 6.6 | 2.87 | 11.1 | 3.33 | 10.5 | ||||||||||||||||||||||||||||||||||||||||||||||||||||
Total | 1.15 | 8.00 | 3.23 | 9.9 | 4.38 | 9.4 | 100 | 4.57 | 0.46 | 6.6 | 2.87 | 11.1 | 3.33 | 10.5 | 100 | 2.9 | ||||||||||||||||||||||||||||||||||||||||||||||||
Additional information:
| (1) | The estimate of ore reserves were reviewed by Axe Valley Mining Consultants Ltd. in accordance with the principles and guidelines of the Australian Code for reporting of mineral resources and ore reserves (JORC code, 2012 edition). |
| (2) | Thecut-off grade used with our reserve estimate is 3.0%. |
| (3) | The metallurgical recovery factor for Skorpion mine |
| (4) | The |
| (5) | The reserve quantities disclosed are for the entire mine. |
Skorpion Facility
The following table sets out the total capacity of the facility at Skorpion as of March 31, 2016:2017:
| Capacity | ||||
Facility | Zinc (tpa) | |||
Skorpion | 150,000 | |||
|
| |||
Total | 150,000 | |||
|
| |||
Production Volumes
The following table sets out the total production from Skorpion zinc refinery for fiscal years ended March 31, 2014, 2015, 2016 and 2016:2017:
Facility | Product | Fiscal Year 2014 | Fiscal Year 2015 | Fiscal Year 2016 | Product | Fiscal Year 2015 | Fiscal Year 2016 | Fiscal Year 2017 | ||||||||||||||||||||||||
| (tons) | (tons) | |||||||||||||||||||||||||||||||
Zinc refinery | Zinc | 124,924 | 102,188 | 81,938 | Zinc | 102,188 | 81,938 | 85,427 | ||||||||||||||||||||||||
The following table sets out the total ore and zinc concentrate production at the Skorpion mine, for fiscal years ended March 31, 2014, 2015, 2016 and 2016:2017:
(tons except percentage) | ||||||||||||||||||||||||||||
Mine (Type of Mine) | Product | Fiscal Year 2014 | Fiscal Year 2015 | Fiscal Year 2016 | Product | Fiscal Year 2015 | Fiscal Year 2016 | Fiscal Year 2017 | ||||||||||||||||||||
| (tons except percentage) | ||||||||||||||||||||||||||||
Skorpion (Open-pit) | Ore mined | 1,252,092 | 1,344,272 | 1,245,198 | Ore mined | 1,344,272 | 1,245,198 | 1,206,176 | ||||||||||||||||||||
| Ore grade - Zinc | 10.2% | 9.0% | 7.53% | Ore grade - Zinc | 9.0% | 7.5% | 8.4% | |||||||||||||||||||||
| Recovery - Zinc | 90.1% | 88.2% | 85.5% | Recovery - Zinc | 88.2% | 85.5% | 83.9% | |||||||||||||||||||||
Principal Raw Materials
The Skorpion mine used 65,41290,819 tons of sulphur in fiscal year 2016,2017, of which 96.0%100% was imported in bulk and shipped to Namibia through the port of Luderitz while the remaining sulphur was brought from South Africa in molten form by road.Luderitz.
Power
The maximum power demand of the Skorpion mine is 85 MW and power is supplied from South Africa and is governed by atri-partite US dollar-denominated contract between Namibia Power Corporation (Proprietary) Limited, Eskom Holdings Limited and Skorpion, that currently links the annual increases in power costs to a US inflationary index.
Distribution, Transport &and Logistics
Zinc at the Skorpion mine is cast into ingots and transported from the refinery to the port of Luderitz, approximately 300 kilometers away by trucks each having a maximum capacity of 35 tons. On the return trip from Luderitz, these trucks carry sulphur transported to site, which is imported by ship. All otherre-agents and consumables are trucked in by one transport contractor.
Sales and Marketing
Skorpion’s 10 largest customers accounted for approximately, 100%99.9%, 99.9%79.9% and 79.9%99.0% of its revenue in fiscal years 2014, 2015, 2016 and 20162017 respectively. Three of Skorpion’s customers accounted for approximately 85%, 85%64% and 64%86% of Skorpion’s revenue in fiscal years 2014, 2015, 2016 and 2016.2017. Skorpion’s marketing office is located in Rosh Pinah.
Most of the zinc metal that Skorpion produced in fiscal year 20162017 was sold under bi-annual/bi-annual or annual contracts. About 30%12% of the metal produced is sold in the Southern African Customs Union market and balance is sold to other regions. The contract sales price is linked to prevailing LME price with an additional market premium. Thus, the price that Skorpion receives for its zinc is dependent upon and is subject to fluctuations in the LME price.
Market Share and Competition
According to Wood Mackenzie, the Skorpion mine has consistently been one of the largest zinc producing mines in the world and in 2016, itis ranked tenthsixteenth in the world in terms of production volume with a cost base in the lower half of the zinc industry cost curve. The Skorpion mine produces only high-grade, high purity SHG zinc ingots that are registered on the LME.
Black Mountain Mining
Overview
BMM consists of the Black Mountain mine and the Gamsberg Project. We own a 74.0% interest in BMM and Exxaro Resources Limited (through its wholly owned subsidiary, Exxaro Base Metals & Industrial Mineral Holdings (Pty) Ltd) holds the remaining 26.0% interest in BMM.
The predominant mining method is ramp in stope cut and fill. The planned production rate is 1.8 mtpa plant feed and the shaft hoisting capacity is approximately 1.441.4 mtpa from Deeps mine and 0.36 mtpa from Swartberg. All production stopes in the Deeps mine are backfilled and waste filled, integrated into the mining sequence.
During fiscal year 2016, 1,579,6332017, 1,590,600 tons of ore at 2.47%2.5% zinc and 2.56%3.2% lead were mined from the Black Mountain mine, which produced approximately 59,00658,005 tons of zinc concentrate and 48,09159,518 tons of lead concentrate, containing 29,27228,708 tons of zinc and 34,11441,770 tons of lead respectively. In addition, the Black Mountain mine also produced 4,7295,016 tons of copper in concentrate and 4148 tons of silver in concentrate.
Principal Products
BMM produces zinc, copper and lead in concentrate and all the zinc and copper concentrate are shipped overseas. A small portion of the lead concentrate is sold locally, with the bulk shipped overseas.
By-products
Silver
Silver is aby-product of our copper and lead concentrate.
Principal Facilities
The following maps shows the specific location of the Black Mountain mine in Northern Cape in South Africa:
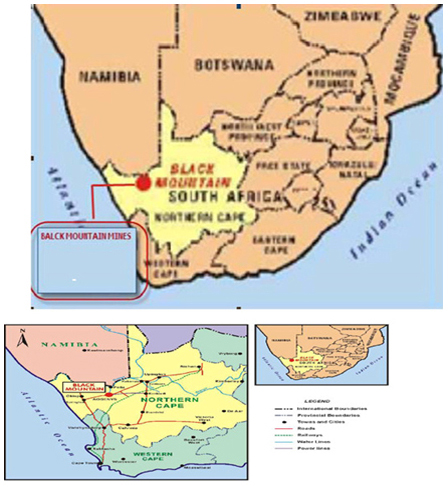
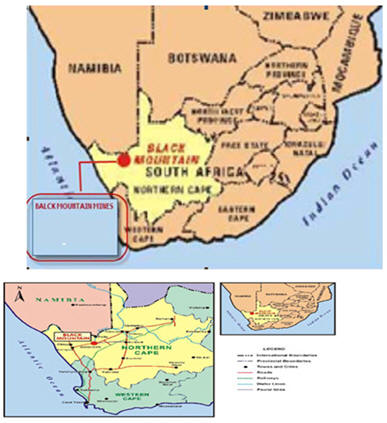
Mines
The zinc mine at Black Mountain is an underground operation, mining a polymetallic ore body, with an attached concentrator producing approximately 29,27228,708 tons of zinc in concentrate and 34,11441,770 tons of lead in concentrate respectively. In addition, the Black Mountain mine also produced 4,7295,016 tons of copper in concentrate and 4148 tons of silver in concentrate annually.
The Black Mountain mine is operated pursuant to mining right 58/2008 MR granted pursuant to the Mineral and Petroleum Resources Development Act, 28 of 2002 of South Africa which entitles us to mine for lead, copper, zinc and associated minerals in, on and under an area in the district of Namaqualand measuring 24,195 hectares for a period of 30 years from 2008 to 2038.
Four major stratiform exhalative sediment hosted base metal deposits are located in a 10 by 30 km area, centered on Aggeneys. The deposits are situated in the supracrustal rocks of themid-Proterozoic age Bushmanland group of the Namaqualand metamorphic complex. The deeps ore body, which is currently being mined, is considered to start at 166 meters above mean sea level, with a down plunge extent of 1.1 km with the deepest position of the ore body being 1,680 meters below the surface. MineralisationMineralization in the deeps is hosted by iron formations, massive sulphide and sulphide quartzite. The massive sulphide rock is either banded, massive or occurs as fine grained mylonite. Banding is expressed as1-5 m thick sulphide bands alternating with quartz rich bands of similar thickness.
Underground drilling of the deeps ore body was started in December 2000 and were completed in 2012. As of March 31, 2016,2017, BMM estimates the remaining mine life of the Black Mountain mine to be 54 years based on (i) reserves; and (ii) planned production which is determined on the basis of alife-of-mine plan.
The predominant mining method is ramp in stope cut and fill and longhole mining. The production rate is 1.8 mtpa plant feed and the shaft hoisting capacity is approximately 150,000 tons per month. All production stopes are backfilled and waste filled, integrated into the mining sequence.
Power at the zinc mine at Black Mountain is supplied from two 40 MVA transformers at the Eskom Aggeneys substation. Water is supplied by the Pelladrift Water Board, which supplies potable water to the mine from the Orange river for both human consumption and industrial water requirements.
Zinc, lead and copper concentrate from the mine are road hauled to a dedicated railway siding along a 170 km gravel road, which is owned by the provincial authorities but maintained by Black Mountain. The concentrate is then transported by train toport of Saldanha on the Sishen-Saldanha railway with delivery terms to export customers on a cost, insurance and freight basis. Since October 2015, there has been a change in strategy to move the concentrate directly to Saldanha by road, with delivery terms to export customers on a cost insurance and freight basis.
Swartberg was mined on a small scale (25,800t/(25,800 ton per month) from 1995 but production was stopped in 2006 in an effort to procure the Deeps mine in full production. Mining at Swartberg wasre-introduced in the year 2012 by a diamond drilling campaign to explore the ore bodies on strike. Down-plunge in depth at this mine was started in the same year. Following positive results from this drilling apre-feasibility study is in progress to investigate the potential of a fully operating mine at Swartberg, which will replace ore from the Deeps mine once it is mined out in the year 2021.
Summary of Mine Reserves
The following table sets out the proved and probable zinc and lead reserves as of March 31, 2016:2017:
| Proved Reserve | Probable Reserve | Total Proved and Probable Reserves | Vedanta Limited ownership | Reserve life | Proved Reserve | Probable Reserve | Total Proved and Probable Reserves | Vedanta Limited ownership | Reserve life | |||||||||||||||||||||||||||||||||||||||||||||||||||||||||||||||||||||||||||||||||||||||||||||||||||||||
| Quantity | Zinc Grade | Lead Grade | Silver | Quantity | Zinc Grade | Lead Grade | Silver | Quantity | Zinc Grade | Lead Grade | Silver | Quantity | Zinc Grade | Lead Grade | Silver | Quantity | Zinc Grade | Lead Grade | Silver | Quantity | Zinc Grade | Lead Grade | Silver | |||||||||||||||||||||||||||||||||||||||||||||||||||||||||||||||||||||||||||||||||||||||||
(million tons) | (%) | (%) | (g/t) | (million tons) | (%) | (%) | (g/t) | (million tons) | (%) | (%) | (g/t) | (%) | (Years) | (million tons) | (%) | (%) | (g/t) | (million tons) | (%) | (%) | (g/t) | (million tons) | (%) | (%) | (g/t) | (%) | (Years) | |||||||||||||||||||||||||||||||||||||||||||||||||||||||||||||||||||||||||||||||||||||
| Black Mountain-Deeps | 1.75 | 3.39 | 4.05 | 42 | 4.76 | 2.09 | 3.29 | 40 | 6.51 | 2.74 | 3.54 | 39 | 1.74 | 2.91 | 3.52 | 43 | 4.32 | 2.83 | 2.08 | 26 | 6.05 | 2.85 | 3.49 | 31 | ||||||||||||||||||||||||||||||||||||||||||||||||||||||||||||||||||||||||||||||||||||||||
|
|
|
|
|
|
|
|
|
|
|
|
|
|
|
|
|
|
|
|
|
|
|
|
|
|
|
| |||||||||||||||||||||||||||||||||||||||||||||||||||||||||||||||||||||||||||||||||||||
Total | 1.75 | 3.39 | 4.05 | 42 | 4.76 | 2.09 | 3.29 | 40 | 6.51 | 2.74 | 3.54 | 39 | 74 | 5 | 1.74 | 2.91 | 3.52 | 43 | 4.32 | 2.83 | 2.08 | 26 | 6.05 | 2.85 | 3.49 | 31 | 74 | 4 | ||||||||||||||||||||||||||||||||||||||||||||||||||||||||||||||||||||||||||||||||||||
|
|
|
|
|
|
|
|
|
|
|
|
|
|
|
|
|
|
|
|
|
|
|
|
|
|
|
| |||||||||||||||||||||||||||||||||||||||||||||||||||||||||||||||||||||||||||||||||||||
| Proved Reserve | Probable Reserve | Total Proved and Probable Reserves | SSL ownership | Reserve life | Proved Reserve | Probable Reserve | Total Proved and Probable Reserves | Vedanta Limited ownership | Reserve life | |||||||||||||||||||||||||||||||||||||||||||||||||||||||||||||||||||||||||||||||||||||||||||||||||||||||
| Quantity | Zinc Grade | Lead Grade | Silver | Quantity | Zinc Grade | Lead Grade | Silver | Quantity | Zinc Grade | Lead Grade | Silver | Quantity | Zinc Grade | Lead Grade | Silver | Quantity | Zinc Grade | Lead Grade | Silver | Quantity | Zinc Grade | Lead Grade | Silver | |||||||||||||||||||||||||||||||||||||||||||||||||||||||||||||||||||||||||||||||||||||||||
(million tons) | (%) | (%) | (g/t) | (million tons) | (%) | (%) | (g/t) | (million tons) | (%) | (%) | (g/t) | (%) | (Years) | (million tons) | (%) | (%) | (g/t) | (million tons) | (%) | (%) | (g/t) | (million tons) | (%) | (%) | (g/t) | (%) | (Years) | |||||||||||||||||||||||||||||||||||||||||||||||||||||||||||||||||||||||||||||||||||||
| Black Mountain-Swartberg | — | — | — | — | 2.44 | 0.6 | 3.23 | 25 | 2.44 | 0.6 | 3.23 | 25 | — | — | — | — | 2.07 | 0.6 | 3.73 | 32 | 2.07 | 0.6 | 3.23 | 32 | ||||||||||||||||||||||||||||||||||||||||||||||||||||||||||||||||||||||||||||||||||||||||
|
|
|
|
|
|
|
|
|
|
|
|
|
|
|
|
|
|
|
|
|
|
|
|
|
|
|
| |||||||||||||||||||||||||||||||||||||||||||||||||||||||||||||||||||||||||||||||||||||
Total | — | — | — | — | 2.44 | 0.6 | 3.23 | 25 | 2.44 | 0.6 | 3.23 | 25 | 74 | 5 | — | — | — | — | 2.07 | 0.6 | 3.73 | 32 | 2.07 | 0.6 | 3.23 | 32 | 74 | 5 | ||||||||||||||||||||||||||||||||||||||||||||||||||||||||||||||||||||||||||||||||||||
|
|
|
|
|
|
|
|
|
|
|
|
|
|
|
|
|
|
|
|
|
|
|
|
|
|
|
| |||||||||||||||||||||||||||||||||||||||||||||||||||||||||||||||||||||||||||||||||||||
| Proved Reserve | Probable Reserve | Total Proved and Probable Reserves | SSL ownership | Reserve life | Proved Reserve | Probable Reserve | Total Proved and Probable Reserves | Vedanta Limited ownership | Reserve life | |||||||||||||||||||||||||||||||||||||||||||||||||||||||||||||||||||||||||||||||||||||||||||||||||||||||
| Quantity | Zinc Grade | Lead Grade | Silver | Quantity | Zinc Grade | Lead Grade | Silver | Quantity | Zinc Grade | Lead Grade | Silver | Quantity | Zinc Grade | Lead Grade | Silver | Quantity | Zinc Grade | Lead Grade | Silver | Quantity | Zinc Grade | Lead Grade | Silver | |||||||||||||||||||||||||||||||||||||||||||||||||||||||||||||||||||||||||||||||||||||||||
(million tons) | (%) | (%) | (g/t) | (million tons) | (%) | (%) | (g/t) | (million tons) | (%) | (%) | (g/t) | (%) | (Years) | (million tons) | (%) | (%) | (g/t) | (million tons) | (%) | (%) | (g/t) | (million tons) | (%) | (%) | (g/t) | (%) | (Years) | |||||||||||||||||||||||||||||||||||||||||||||||||||||||||||||||||||||||||||||||||||||
| Black Mountain-Gamsberg | 44.49 | 6.8 | 0.5 | 8.7 | 5.9 | 0.5 | 53.1 | 6.6 | 0.5 | 44.49 | 6.8 | 0.5 | 8.69 | 5.9 | 0.5 | 53.18 | 6.6 | 0.5 | ||||||||||||||||||||||||||||||||||||||||||||||||||||||||||||||||||||||||||||||||||||||||||||||
|
|
|
|
|
|
|
|
|
|
|
|
|
|
|
|
|
|
|
|
|
|
|
|
|
|
|
| |||||||||||||||||||||||||||||||||||||||||||||||||||||||||||||||||||||||||||||||||||||
Total | 44.49 | 6.8 | 0.5 | 8.7 | 5.9 | 0.5 | 53.1 | 6.6 | 0.5 | 74 | 12 | 44.49 | 6.8 | 0.5 | 8.69 | 5.9 | 0.5 | 53.18 | 6.6 | 0.5 | 74 | 12 | ||||||||||||||||||||||||||||||||||||||||||||||||||||||||||||||||||||||||||||||||||||||||||
|
|
|
|
|
|
|
|
|
|
|
|
|
|
|
|
|
|
|
|
|
|
|
|
|
|
|
| |||||||||||||||||||||||||||||||||||||||||||||||||||||||||||||||||||||||||||||||||||||
References to “g/t” are grams per ton
Additional information:
Deeps and Swartberg
| (1) | The reserve estimates presented incorporate losses for mine dilution and mining recovery according to the JORC code. |
| (2) | Thecut-off rand value used with our reserve estimate is |
| (3) | The metallurgical recovery factor for zinc, lead and copper is 71.4%, 87.4% and 70.1%, respectively. |
| (4) | The commodity prices for zinc, lead and copper considered for evaluation of reserves were $ |
| (5) | The reserve quantities disclosed are for the entire mine and our share in the reserve quantities is 74.0%. |
Gamsberg
| (1) | The reserve estimates, were |
| (2) | The zinccut-off grade used with our reserve estimate is |
| (3) | The commodity price for zinc considered for evaluation of reserves was $ |
| (4) | The reserve quantities disclosed are for the entire mine and our share in the reserve quantities is 74.0%. |
Production Volumes
The following table sets out the total ore, zinc and lead concentrate production at the Black Mountain mine for each of fiscal years ended March 31, 2014, 2015, 2016 and 2016:2017:
Mine (Type of Mine) | Product | Fiscal Year 2014 | Fiscal Year 2015 | Fiscal Year 2016 | Product | Fiscal Year 2015 | Fiscal Year 2016 | Fiscal Year 2017 | ||||||||||||||||||||
| (tons, except percentages) | (tons, except percentages) | |||||||||||||||||||||||||||
Black Mountain (Underground) | Ore mined | 1,395,534 | 1,437,562 | 1,579,633 | Ore mined | 1,437,562 | 1,579,633 | 1,590,600 | ||||||||||||||||||||
| Ore grade –Zinc | 2.7% | 2.5% | 2.5% | Ore grade –Zinc | 2.5% | 2.5% | 2.5% | |||||||||||||||||||||
| -Lead | 3.2% | 2.6% | 2.6% | -Lead | 2.6% | 2.6% | 3.2% | |||||||||||||||||||||
| Recovery - Zinc | 78.0% | 74.2% | 75.2% | Recovery - Zinc | 74.2% | 75.2% | 77.1% | |||||||||||||||||||||
| -Lead | 87.4% | 84.8% | 84.6% | -Lead | 84.8% | 84.6% | 86.3% | |||||||||||||||||||||
| Zinc concentrate | 59,942 | 54,445 | 59,006 | Zinc concentrate | 54,445 | 59,006 | 58,005 | |||||||||||||||||||||
| Lead concentrate | 53,221 | 45,129 | 48,091 | Lead concentrate | 45,129 | 48,091 | 59,518 | |||||||||||||||||||||
Principal Raw Materials
There are no major raw materials used in Black Mountain Mine, except for chemical reagents which are used in the floatation process to produce zinc and lead concentrates.
Distribution, Logistics and Transport
Zinc concentrate, lead concentrate and copper concentrate from the mine is hauled by road to a dedicated railway siding along a 170 kilometers gravel road, which is owned by the provincial authorities but maintained by BMM. The concentrate is then transported by train toport of Saldanha on the Sishen-Saldanha railway with delivery terms to export customers on a cost, insurance and freight basis. Since October 2015, there has been a change in strategy to move the concentrate directly to Saldanha by road, with delivery terms to export customers on a cost insurance and freight basis.
Sales and Marketing
BMM produces zinc, lead and copper concentrates that are sold in local and international markets on a spot basis and through long term contracts.or a frame contract basis. The commercial terms negotiated on an annual basis include taking into account the percentage of payable metals, treatment and refining charges and applicable prices. Some of the customers of Black Mountain mine are Trafigura Beheer B.V., MRI Trading andPTE Limited, Ocean Partners UK Limited.Limited and Louis Dreyfus Company Metals Suisse SA.
Approximately 80% ofAll the zinc and lead metal that BMM produced in fiscal year 20162017 was sold under annualframe or spot contracts specifying quantity, grade and price, with the remainder sold on the spot market.price. The contract sales price is linked to the prevailing LME price with an additional market premium. Thus, the price that BMM receives for its zinc and lead is dependent upon and is subject to fluctuations in the LME price.
Projects and Developments
Gamsberg Project
The Gamsberg ore body is a large undeveloped zinc deposit situated approximately 22 kms from Black Mountain. The Gamsberg Project was officially approved by the Company’s Board in November 2014. In April 2015, the Project Scheduleproject schedule was revised after optimizing the Mining Cost.mining cost. The mining and milling capital costs were reduced primarily due to engineering improvements and negotiations.
During the fiscal year 2016, pre strip mining started from July 20152017,pre-start activities and to March 31, 2016 6.5waste-stripping at the project have progressed well. To date, we have excavated over 22.5 million tons of waste has been mined. A total of $80.6 million of commitmentsrock. All major orders for the integrated process plant, water and power, mining and other prestart activities have been made; withplaced. Major contractors have been mobilized to the total spend being $15.1 million. Other infrastructure jobs such as Residential Housing, Pre start Infrastructuresite. The site activities including civil, power lines and water lines are in full swing. Manufacturing of critical machinery like mills, crusher and transformers is under progress as planned.
In fiscal year 2017, the project activities will cover the ordering of plant and infrastructure packages followed by construction activities. The initial oreprogress. First production is plannedon track with 9 to 12 months for fiscal year 2018 with ramp upramp-up to full production expected in subsequent yearsof 250 ktpa.
Lisheen
Overview
The Lisheen mine is located in County Tipperary, Republic of Ireland and when operational consisted of an underground mine, concentrator and backfill plant, with a related capacity of approximately 131,000 tons of zinc in concentrate annually. The Lisheen mine also included approximately 19,000 tons of lead in concentrate annually. Mining and milling activities at the Lisheen mine ceased in December 2015 and the facility is currently in the process of implementing a mine closure plan in conjunction with the statutory authorities.
During fiscal year 2016, 849,618 tons of ore at 9.5% zinc and 1.5% lead were processed at the Lisheen mine, which produced approximately 135,611 tons of zinc concentrate and 14,371 tons of lead concentrate, containing 71,825 tons and 8,726 tons of zinc and lead, respectively.
The Lisheen zinc deposit is located in the Rathdowney Trend, which comprises sedimentary rocks, mainly limestone, which was formed approximately 320 million years ago. The Lisheen deposit owes its existence to the presence of several faults in the district, which played a major role in the formation, morphology and location of the ore bodies. It is believed that these fractures in the strata acted as conduits for the hydrothermal mineralizing fluids which carried metals upwards from extreme depths.
The mine commenced production in 1999, following a successful development partnership between Minorco (merged with Anglo American in 1999) and Ivernia West. Anglo American subsequently acquired Ivernia’s stake in 2003 to gain 100% ownership. Lisheen mine was subsequently acquired by SIIL (through THL Zinc Holding B.V.) on February 15, 2011. The mine ceased all operations in December 2015.
Principal Products
Lisheen when operational during the year produced zinc and lead in concentrate (whilst operational during fiscal year 2016) and both concentrates were shipped overseas.
Principal Facilities
The following map shows the locations of Lisheen within Europe and within the island of Ireland:
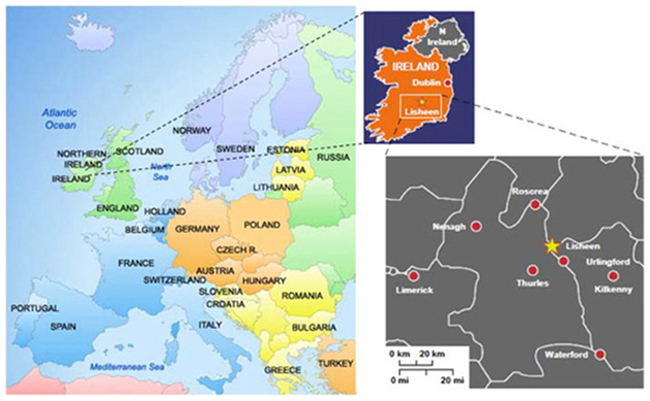
Mines
The Lisheen ore bodies occured at three principal zones, namely the Main Zone, Derryville Zone and Bog Zone and a series of small satellite bodies surrounding these.
When operational, the crushed ore from the Lisheen mine was stored in a surface stockpile from which it is conveyed to a two-stage wet grinding circuit as the first processing set in the concentrator. The slurried product from the grinding mills then passes directly to the two flotation circuits, where the lead concentrate and the zinc concentrates were floated off sequentially. The zinc concentrates are leached with sulphuric acid to remove dolomite to bring the product to smelter requirements. The concentrates were dewatered to shipment requirements by thickening and subsequent pressure filtration. The dewatered concentrates were then trucked to the port of Cork and then shipped onward to international smelters mostly based in Europe.
The Lisheen mine was wholly owned by Anglo American Plc between 2003 and 2011 following a series of mergers and acquisitions of stake holdings. The mine is now owned by us through our subsidiary THL Zinc Holding B.V. Lisheen mine ceased production in December 2015.
Summary of Mine Reserves
Following the cessation of mining activities in December 2015, Lisheen commissioned an independent evaluation of mineral resource and mineral reserve categorization for any remaining stopes, pillars and other materials in the Lisheen mine plan. The evaluation was completed by Golder associates (UK) Ltd and they concluded that the production tail starting on January 2016 through to June 2016 when the final reserves are depleted was not economic to mine and was therefore not a mineral reserve as defined by the JORC code. The remnant mineralization therefore is uneconomic and as such cannot be categorized as mineral reserves and should be removed from the value of the mine.
Production Volumes
The following table sets out the total ore, zinc and lead concentrate production at the Lisheen mine for fiscal years ended March 31, 2014, 2015 and 2016:
Mine (Type of Mine) | Product | Fiscal Year 2014 | Fiscal Year 2015 | Fiscal Year 2016 | ||||||||||
| (tons, except percentages) | ||||||||||||||
Lisheen (underground) | Milled Ore Ton (dmt) | 1,401,741 | 1,375,069 | 849,618 | ||||||||||
| Ore grade Zinc | 11.8% | 10.5% | 9.5% | |||||||||||
| -Lead | 2.2% | 1.9% | 1.5% | |||||||||||
| Recovery Zinc | 91.3% | 90.3% | 89.2% | |||||||||||
| - Lead | 68.5% | 72.5% | 68.5% | |||||||||||
| Zinc concentrate | 282,159 | 244,354 | 135,611 | |||||||||||
| Lead concentrate | 34,409 | 30,956 | 14,371 | |||||||||||
Principal Raw Materials
There were no major raw materials used in the Lisheen Mine, except for chemical reagents which was used in the flotation process to produce Zinc and Lead concentrates
Distribution, Logistics and Transport
With respect to outbound logistics Lisheen when operational transported the zinc concentrates to the port at Cork (135 kilometers from mine site) via on site haulage contracted with a single supplier. A dedicated marketing office in Cork handles shipping and contracts, with a stockyard and ship loading facilities.
Lisheen is within close proximity to international airports (Dublin 157 kilometers; Cork 135 kilometers), the national highway network and nearby towns. The nearest motorway is 10 kilometers from the mine site and provides direct motorway access to the port facility in Cork.
Sales and Marketing
The Lisheen mine, when operational, extracted lead and zinc ore from underground and processed this into zinc and lead concentrates. The resultant concentrate was sold to smelters and trading customers in Europe and Asia. Marketing of the concentrates produced by Lisheen was done centrally from the corporate office located in Aggeneys. There was also a site office to look after the logistics coordination, administrative support and contracting.
Approximately 87% of the combined zinc and lead metal that Lisheen produced in fiscal year 2016 was sold under annual contracts specifying quantity, grade and price and the remainder sold on the spot market. The contract sales price is directly linked to the prevailing LME price and is dependent upon and subject to the fluctuations in the LME price.
Projects and Developments
A detailed mine closure plan was agreed and approved between the relevant statutory bodies and the company and the mine rehabilitation program is currently underway. Management is actively exploring further business opportunities and ways to utilize the existing resources and skills at Lisheen following the cessation of normal mining activities and a task force has been established to facilitate this.closed.
Oil and gas
Overview
Cairn India and its subsidiaries is a significant contributor to India’s domestic crude oil production, contributing approximately 27% along with our joint operation partners to the total production, as per Ministry of Petroleum and Natural Gas statistics of March 2016. We have a diversified asset base with eight blocks: one in Rajasthan, two on the west coast of India, four on the east coast of India, and one in South Africa.
Rajasthan, RJ-ON-90/1 block, Barmer Basin(operator, 70% participating interest)
The Rajasthan RJ-ON-90/1 (“Rajasthan”) block is an onshore block. It is our principal production asset where we own a 70% participating interest pursuant to the production sharing contract that runs until May 2020. Our joint operation partner, ONGC, has a 30% participating interest. The Rajasthan block is spread over 3,111 sq. kms in the west of Barmer district. The block consists of three contiguous development areas: (i) Development Area (“DA”) 1, primarily comprising the Mangala, Aishwariya, Raageshwari and Saraswati (MARS) fields; (ii) DA 2 primarily consisting of the Bhagyam, NI and NE and Shakti fields; and (iii) DA 3, comprising the Kaameshwari West fields.
The Mangala field was discovered in January 2004. This was followed by many other discoveries including the Aishwariya and Bhagyam fields. In the Rajasthan block, 38 discoveries have been established, since inception. Exploration activities and studies indicate that the block has further potential for resources and reserves for future growth opportunities.
We also own and operate significant infrastructure assets to facilitate the processing, transportation, and sale of crude oil produced in the Rajasthan block. For fiscal year 2016, our net average daily production was 85,083 boepd from the Rajasthan block.
Cambay, CB/OS-2 block, Cambay Basin(operator, 40% participating interest)
The Cambay CB/OS-2 (“Cambay”) block is an offshore block which is located in the Cambay Basin of the state of Gujarat in western India. Our operations in the Cambay block are centered on the Lakshmi and Gauri oil and gas fields and the CB-X development area. Based on exploration and development activities undertaken by us, the Cambay block has yielded natural gas discoveries in its offshore Lakshmi and Gauri fields and onshore CB-X field and crude oil discoveries in the former two fields. We commenced gas production from the Lakshmi gas field in 2002 and from the Gauri field in 2004. Production of co-mingled crude oil, which consists of crude oil plus condensate, from the Gauri field commenced in 2005. The Lakshmi and Gauri offshore fields cover areas of 121.1 sq. kms and 50.7 sq. kms, respectively, in the Cambay Basin and lie off the coast of the state of Gujarat in water depths of approximately 20 meters. CB-X is an onshore gas field situated in the Cambay block and covers an area of 33.28 sq. kms. For fiscal year 2016, our net average daily production was 2,546 boepd from the block.
Ravva, PKGM-1 block, Krishna Godavari Basin, Eastern India (operator, 22.5% participating interest)
Our production operations in the Krishna-Godavari Basin are centered on the Ravva PKGM-1(“Ravva”) block, lying off the coast of Andhra Pradesh in Eastern India, in water depths up to 40 meters. Developed in partnership with ONGC, Videocon and Ravva Oil Singapore, we became the operator in 1996. For fiscal year 2016, our net average daily production was 3,448 boepd from the block.
Our Oil and Gas Business
Overview
Our oil and gas business iswas previously owned and operated by Cairn India and its subsidiaries. Cairn India was listed on the Bombay Stock Exchange and the National Stock Exchange on January 9, 2007. Vedanta completed its acquisition of 58.5% of the fully diluted share capital of Cairn India from Cairn Energy Plc as of December 8, 2011. After the Re-organization Transactions, Vedanta’s shareholding in Cairn India was transferred to us. As of March 31, 2016,which our total ownership interest inbefore the merger was 59.9%. Vedanta Limited and Cairn India was 59.9%.Limited announced the Cairn India is primarily engaged in the business of exploration, development and production ofMerger which became operative on April 11, 2017. Cairn India continues to contribute significantly to India’s domestic crude oil gas and related by-products. Accordingproduction, contributing approximately 26% along with the joint operation partners to the total production, as per Ministry of Petroleum and Natural Gas statistics of March 2016, together with our joint operation partners, we account for approximately 27% of India’s domestic crude oil production.
The Company2017. Cairn India has a world-class resource base, with interests in sevensix blocks in India, namely Rajasthan, twoone on the west coast of India, four on the east coast of India and one in South Africa. The blocks are located in the Barmer Basin, Krishna-Godavari Basin, the Palar-Pennar Basin, the Cambay Basin the Mumbai Offshore Basin and Orange Basin.
Asset | Basin | Cairn India’s Interest (%) | Joint Operation partners | Area (in sq. km) | ||||||||||
India | ||||||||||||||
| 1 | Rajasthan | Barmer | 70% | ONGC | 3,111 | |||||||||
| 2 | Cambay | Cambay | 40% | ONGC, Tata Petrodyne, ONGC, Ravva Oil | 207 | |||||||||
| 3 | Ravva | KG Offshore | 22.5% | Videocon | 331 | |||||||||
| 4 | KG-ONN-2003/1 | KG Onshore | 49% | ONGC | 315 | |||||||||
| 5 | KG-OSN-2009/3 | KG Offshore | 100% | — | 1,988 | |||||||||
| 6 | PR-OSN-2004/1 | Palar-Pennar | 35% | ONGC, Tata Petrodyne | 9,417 | |||||||||
International | ||||||||||||||
| 7 | Block 1 | Orange, South Africa | 60% | Petro SA | 19,898 | |||||||||
|
| |||||||||||||
| Total | 35,267 | |||||||||||||
|
| |||||||||||||
Rajasthan,RJ-ON-90/1 block, Barmer Basin(operator, 70% participating interest)
Asset Basin Joint Operation India International Cairn India’s
Interest (%)
partners Area
(in sq. km) 1 Rajasthan Barmer 70% ONGC 3,111 2 Cambay Cambay 40% ONGC, Tata Petrodyne 207 3 Ravva KG Offshore 22.5% ONGC, Ravva Oil, Videocon 331 4 KG-ONN-2003/1 KG Onshore 49% ONGC 315 5 KG-OSN-2009/3 KG Offshore 100% — 1,988 6 MB-DWN-2009/1 Mumbai Offshore 100% — 2,961 7 PR-OSN-2004/1 Palar-Pennar 35% ONGC, Tata Petrodyne 9,417 8 Block 1 Orange, South Africa 60% Petro SA 19,898 Total 38,228
The Mangala field was discovered in January 2004. This was followed by many other discoveries including the Aishwariya and Bhagyam fields. In the Rajasthan block, 38 discoveries have been established, since inception. Exploration activities and studies indicate that the block has further potential for resources and reserves for future growth opportunities.
Cairn India also owns and operates significant infrastructure assets to facilitate the processing, transportation, and sale of crude oil produced in the Rajasthan block. For fiscal year 2017, Cairn India’s net average daily production was 73,655 boepd from the Rajasthan block.
Cambay,CB/OS-2 block, Cambay Basin(operator, 40% participating interest)
The CambayCB/OS-2 (the “Cambay block”) is an offshore block which is located in the Cambay Basin of the state of Gujarat in western India. Cairn India’s operations in the Cambay block are centered on the Lakshmi and Gauri oil and gas fields and theCB-X development area. Based on exploration and development activities undertaken by Cairn India, the Cambay block has yielded natural gas discoveries in its offshore Lakshmi and Gauri fields and onshoreCB-X field and crude oil discoveries in the former two fields. Cairn India commenced its gas production from the Lakshmi gas field in 2002 and from the Gauri field in 2004. Production ofco-mingled crude oil, which consists of crude oil plus condensate, from the Gauri field commenced in 2005. The Lakshmi and Gauri offshore fields cover areas of 121.1 sq. kms and 50.7 sq. kms, respectively, in the Cambay Basin and lie off the coast of the state of Gujarat in water depths of approximately 20 meters.CB-X is an onshore gas field situated in the Cambay block and covers an area of 33.28 sq. kms. Currently, there is no production fromCB-X field. For fiscal year 2017, Cairn India’s net average daily production was 2,308 boepd from the Cambay block.
Ravva,PKGM-1 block, Krishna Godavari Basin, Eastern India (operator, 22.5% participating interest)
Cairn India’s production operations in the Krishna-Godavari Basin are centered on the RavvaPKGM-1 (the “Ravva block”), lying off the coast of Andhra Pradesh in Eastern India, in water depths up to 40 meters. Developed in partnership with ONGC, Videocon and Ravva Oil Singapore, Cairn India became the operator of Ravva block in 1996. For fiscal year 2017, Cairn India’s net average daily production was 2,296 boepd from the Ravva block.
Principal Products
Oil
We produceCairn India produces crude oil of various grades with different degrees and contents across fields. The crude oil in the majority of fields in the Rajasthan block is medium sweet oil with high pour point. Conversely, the crude oil produced from the Ravva block and Cambay blocksblock are light sweet in nature.
Gas
The Rajasthan, Ravva and Cambay blocks produce natural gas, as well as natural gas commingled with crude oil. While we haveCairn India has been historically selling gas from the offshore blocks of Ravva and Cambay, weit commenced gas sales in the Rajasthan block in fiscal year 2014, following the regulatory approval in March 2013.
Production
The table below shows ouroil and gas production results for fiscal years 2014, 2015, 2016 and 2016.2017.
Average Daily Production | Units | 2014 | 2015 | 2016 | % Change (2016 v. 2015) | Units | 2015 | 2016 | 2017 | % Change (2016 v. 2017) | ||||||||||||||||||||||||||
Net operated | Boepd | 90,102 | 87,692 | 91,076 | 4% | Boepd | 87,692 | 91,076 | 78,259 | (14%) | ||||||||||||||||||||||||||
Oil | Bopd | 88,320 | 86,086 | 89,110 | 4% | Bopd | 86,086 | 89,110 | 76,906 | (14%) | ||||||||||||||||||||||||||
Gas | Mmscfd | 11 | 10 | 12 | 20% | Mmscfd | 10 | 12 | 8 | (33%) | ||||||||||||||||||||||||||
Estimate of Reserves
Set forth in the table below is certain data regarding ourthe estimates of net reserves from fields within the Rajasthan block, the Ravva block and the Cambay block as of March 31, 2016.2017. Volumes reported in this table are in millions of barrels of oil equivalent.
Domestic Asset | Basin | Exploration activity | Development activity | Net Proved Reserves | ||||||||||||||||
| Barmer | |||||||||||||||||||
| Cambay | |||||||||||||||||||
Ravva block | KG Offshore | ✓ | ||||||||||||||||||
|
| |||||||||||||||||||
Total | ||||||||||||||||||||
|
| |||||||||||||||||||
Technology
Cairn India continues to pursue innovations and technology in its asset portfolios including enhanced oil recovery mechanism, projects’ concept optimization, hydraulic fracturing and 3D seismic technology which will enable usit to enhance recovery and maintainwhile maintaining low cost operations.
Enhanced oil recovery methods are tertiary recovery methods of producing oil, which is not recovered during the application of primary and/or secondary water-flood recovery methods. We haveCairn India has successfully executed one of the world’s largest polymer flood enhanced oil recovery projects at Mangala which added average volumes of 14,000approximately 52,000 bopd to the production in fiscal year 2016. As a result of2017. Driven by its encouraging results, we intendCairn India also plans to implement the program at Bhagyam and Aishwariya fields in the future.
Though we continueCairn India continues to optimize ourits cost, sustained low oil prices have affected the economic viability of ourits key projects. We are looking at various developmentDevelopment options for Bhagyam and Aishwariya polymer flood have been revisited to improve their viability by reducing operating as well as capital expenditure. Our teams are looking at usingObservations from the experience from theongoing Mangala enhanced oil recovery project and leveraging off its existing facilities.are being leveraged to design an optimum scheme of development in these fields. An improved understanding of the technology and utilizing synergies with the developed infrastructure would help in reducingis helping to reduce the development time and cost, improving the overall economics of suchthese projects.
In addition to the application of polymer flood enhanced oil recovery, Cairn India is evaluating the feasibility of the applying the alkaline-surfactant-polymer flood process in the Mangala field. A closely spaced pilot was successfully tested in the Mangala field which demonstrated the suitability of the enhanced oil recovery process. Further studies are ongoing to optimize the chemical formulation to reduce costs and improve effectiveness. Modeling studies are being undertaken to design the application of the alkaline-surfactant-polymer enhanced oil recovery process at a commercial scale.
Hydraulic fracturing or fraccing or hydro-frac is the process of providing a conductive path for hydrocarbons to flow from the reservoir to the wellbore, in low permeability reservoirs. The application of this technology is helping us in the development of tight gas formation of Raageshwari Deep Gas (“RDG’RDG”) field. During fiscal yearyears 2016 and 2017, Cairn India fracced multiple wells in the RDG field. As a result of the successful application of hydro frac technology and better reservoir characterisation,characterization, the expected ultimate recovery from the RDG field has been upgraded by over 25%. Use of limited entry technique for hydro-fraccing also reduced per frac time and cost by about 50%. We areCairn India is also working onat developing the tight oil formation of Barmer Hills through fraccing technology.
Cairn India has applied an advanced 3D seismic orthorhombic prestack depth imaging technology in the structurally complex Central Basin High areaRDG field. The improved imaging and resolution of the seismic data was helpful in Rajasthan block. Mapping on the newutilizing specialized seismic image provided structural enhancement and detailed reservoir architecturecurvature attributes for the Raageshwari areacharacterization of faults and fractures in these tight gas reservoirs. The 3D seismic imaging and reservoir characterization studies provided better an understanding of the sweet spot zones in the tight gas formations and will be the keycritical for reducing development drilling risks. Improved continuity
A screen-wash method using injection water was put on trial for the first time in the Ravva block in fiscal year 2016. After successful trials, the method was extended to more producer wells in fiscal year 2017. Screen-wash has helped to unclog the screen face from fines (minute particles) and improve productivity substantially.
Shallow oil bearing Late Miocene sands were not completed earlier for a well. The cement packer technique was used to access the Late Miocene sands to add a new resource to the Ravva asset. The job involved placing a cement plug inA-Annulus by pumping through the production tubing, cleaning the tubing internal diameter and perforating Late Miocene sand through tubing, cement, casing and formation. This technology avoided the involvement of events leadinga costlyrig-based workover.
Acid stimulation was envisaged through fluid based diverter ‘oil seeker’ followed by organic clay acid (“OCA”) in oil wells to easier interpretationrestore well productivity where acid is diverted preferentially towards the oil zone. Acid stimulation with this technique ensured the formation in the oil zone to be stimulated more effectively, consequently achieving better penetration with minimum damage and lesser uncertainty has resultedthereby obtaining incremental oil production in an increasethe Ravva block.
CB-X-1 was a standalone onshore gas producing well in volumes. The 3D seismic program helped us identify additional gas reserves and added approximately 356 mmboeCB-X field of Hydrocarbons Initially in Place (“HIIP”)Cambay block which was required to be permanently abandoned during fiscal year 2016.2017. While conducting Permanent Well Abandonment (“PWA”) procedures by utilizing a rig is a regular practice, arig-less PWA operation isnon-routine. A detailed review of well specific details was conducted to ascertain the well’s suitability for arig-less PWA operation. A detailed procedure and risk register was developed, and arig-less PWA was successfully executed by utilizing minimal spread – cementing and wireline units. An innovative approach aimed at limiting the economic impact was adopted, wherein a digital slickline was utilized with combined capabilities of slickline ande-line units.
Principal Facilities
Overview
The following map shows the locations of Cairn India’s blocks in India and South Africa.
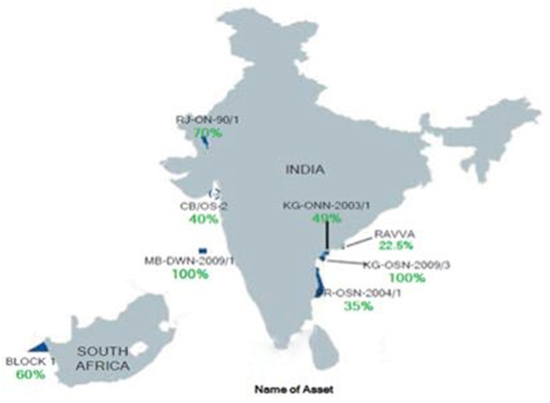
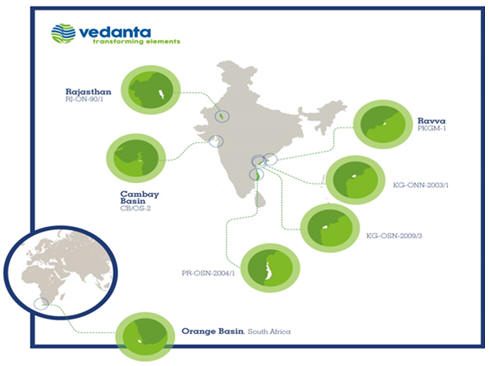
| * | Map not on scale |
Rajasthan
Rajasthan Block Production Sharing Contract
Cairn India is working in partnership with its joint operation partner ONGC in the Rajasthan block. The Rajasthan block production sharing contract (“Rajasthan PSC”) was signed in May 1995 between the GoI and a consortium consisting of ONGC and Shell India Production Development BV.
Cairn India acquired its interest in the Rajasthan PSC in three stages, eventually acquiring a 100.0% beneficial interest in the assets and liabilities as of May 2002 and acquiring legal title to this interest on June 20, 2003. Under the Rajasthan PSC, the GoI has an option to acquire a participating interest of 30.0% in any development area containing a commercial discovery. The GoI exercised their right in all three development areas, specifically, DADevelopment Area 1 in 2005, DADevelopment Area 2 in 2007 and DADevelopment Area 3 in 2009, acting through its nominee ONGC, and acquired a 30.0% participating interest. As of March 31, 2017, along with ONGC (holding 30.0%), Cairn India Limited holds 35.0% participating interest in the Rajasthan block, with the remaining 35.0% interest being held by Cairn Energy Hydrocarbons Limited, a wholly owned subsidiary of Cairn India Limited.
Under the Rajasthan PSC, until such time as India attains self-sufficiency in its crude oil supply, Cairn India is required to sell to the GoI, or its nominee, all of Cairn India’s entitlement to crude oil and condensate extracted from the Rajasthan block in order to assist in satisfying domestic Indian crude oil demand. The GoI has the option but not an obligation to purchase the whole or part of crude oil produced from the Rajasthan block and accordingly the GoI is entitled to appoint a nominee to purchase all of the contractor’s entitlement of the crude oil and condensate produced from the Rajasthan block. However, the GoI has granted permission to Cairn India to sell the remaining quantities of crude oil, over and above those allocated to government nominees to other domestic private refineries and as of March 31, 2016,2017, Cairn India sells the crude oil to both private refineries and the public sector undertakings refineries. As of March 31, 2016,2017, commercial sales arrangements are in place for over 200,000 bopd with public sector undertakings and private refineries. Any additional sales to the public sector undertakings refineries, special economic zone refineries and overseas are subject to approval from the GoI.
The Rajasthan PSC established a management committee for the Rajasthan block which consists of four members, two of whom are nominated by and represent the GoI and the licensee, namely ONGC, taken together, and two of whom are nominated by and represent Cairn India. The management committee must unanimously approve annual work programs, budgets, proposals for the declaration of a discovery as commercial, field development plans, and the delineation of or additions to a development area, while all other matters only require a majority vote.vote, provided that the majority vote includes the vote of the member representing the GoI.
The Rajasthan PSC is currently valid until May 2020, but it may be extended subject to mutual agreement among the parties for up to an additional ten years in the case of commercial production of natural gas or up to five years otherwise. There is also a provision to further extend the production sharing contract by agreement of the parties if production of crude oil or of natural gas is expected to continue after the relevant period. By way of a notification dated April 7, 2017, the Ministry of Petroleum and Natural Gas (“MopNG”) issued a policy for the grant of extension to the production sharing contracts signed by the GoI awardingPre-New Exploration Licensing Policy(“Pre-NELP”) Exploration Blocks(“Pre-NELP Extension Policy”). ThePre-NELP Extension Policy defines the framework for granting extensions forPre-NELP blocks and covers both the Rajasthan and Cambay fields.
The Rajasthan block hashad benefitted from a tax holiday of seven years from fiscal year 2009 (the year of commencement of commercial production from the Rajasthan block) to March 31, 2016. However, during the seven year tax holiday, minimum alternate tax rules were applicable which resulted in a taxation of book profits computed in accordance with the generally accepted accounting principles as used in India. Any minimum alternate tax paid can be carried forward for a total period of tenfifteen years from the year of credit and used to reduce corporate tax to be paid in future years in excess of minimum alternate tax payable in those years.
Under the Rajasthan PSC, all sales are to be valued at a weighted average F.O.B. selling price per barrel of a basket of international crude oils as agreed by all parties which is quoted in Platts, a provider of energy information. For any delivery period in which sales take place, the price will beis set at an average price per barrel determined by calculating the average for such delivery period of the mean of the high and low F.O.B prices of the basket for each day adjusted for differences in quality, delivery time, quantity, payment terms and other contract terms to the extent known. In agreeing to an appropriate basket, the parties shall attempt, so far as is reasonably practicable, to choose a mixture and weighing of crude oils which would produce a quality similar to the quality of crude oil expected to be produced from that development area, and to agree what quality adjustment, if any, to the basket price is appropriate. In determining the quality of crude oil, account is to be taken of all relevant characteristics including gravity, sulphur and metal content, pour point and product yield.
The crude oil produced at the Rajasthan block is benchmarked to Bonny Light, an international low sulphur crude oil published in Platts Crude Oil Marketwire on a daily basis. The pricing formula also adjusts for differences in yield and quality.
In the event that there isof a dispute between the parties to the Rajasthan PSC as to the basis of, or mechanism for, the calculation of the crude oil price, then any party may refer the matter to a sole expert, to be appointed by the parties to the dispute jointly, who is to be an independent and impartial person of international standing with relevant qualifications and experience. Under the provisions of the Rajasthan PSC, the decision of the sole expert is final and binding on the parties and not subject to arbitration.
Operations
The Rajasthan block achieved net production of 31.128.6 mmboe in fiscal year 20162017 and a cumulative total gross production of 343.3402.2 mmboe until the end of fiscal year 20162017. A total of 85 new wells were brought online during fiscal year 2016. In addition, approximately 66 wells were converted into polymer injection for Mangala enhanced oil recovery at the end of fiscal year 2016. This has led to the block achievingThe net average production of 85,083was 73,655 boepd for fiscal year 2016, up 4%2017, down 13% year on year.year, mainly due to a natural decline of Bhagyam and Aishwariya fields and the planned maintenance shutdown at Mangala Processing Terminal in November 2016. However, the decline was partially offset by the successful execution of the polymer enhanced oil recovery project at Mangala, which enhanced production from the Mangala Field. The overall uptime of the facilities in the block stood at 98%over 99% for the year.
Development Area 1, primarily comprising the Mangala, Aishwariya, Saraswati and Raageshwari oil and gas fields, produced a net average 74,98666,392 boepd during fiscal year 2016, up 10%2017, down 11% year on year with the Mangala field being the largest contributor and Aishwariya field adding to the volume growth. Mangala continues to perform above expectations with a ramp up of production due to successfulcontributor. Mangala’s enhanced oil recovery, project execution, which contributed an averageone of 14,000 boepdthe world’s largest polymer flood projects continued to theshow strong performance. The polymer injection was maintained at target levels of 400,000 barrels of liquid per day and resulted in a positive gross production. Aishwariya is also producing steadily becauseproduction impact of systematic implementationapproximately 52,000 barrels of its infill programme.oil per day in fiscal year 2017. During fiscal year 2016, development2017, Development Area 2, primarily comprising Bhagyam, field,NE and NI fields, produced a net average of 10,0977,263 boepd, down 26%28% year on year. Reservoir management programs continued in the Bhagyam field to address the challenges. As of March 31, 2016,2017, Development Area 3 does not have any oil and gas producing fields.
The Rajasthan block received approval from the GoI to begin selling natural gas in March, 2013. The eight inch gas pipeline which runs along the oil pipeline is being used to supply gas to domestic buyers. This is aan efficient application diligent usage of resources in an environmentenvironmentally friendly way. During fiscal year 2016,2017, the average Rajasthan gas production from Raageshwari Deep Gas field was 2726 mmscfd and average sales were 1410 mmscfd. The production was up from 16 mmscfd in comparison to fiscal year 2015and sales of gas were lower due to better than expected performancea technical issue between the transporter and the gas buyers, which resulted in the temporary suspension of sales from the fracced well, optimising the plant operation and stabilising the compressors installed at the Raageshwari and Viramgam terminals.October 2016 tomid-February 2017, which has now been resolved.
The following table sets out the net average oil and gas daily production from the Rajasthan block for the years ended March 31, 2014, 2015, 2016 and 2016:2017:
Average Daily Production | Units | 2014 | 2015 | 2016 | % Change (2016 vs 2015) | Units | 2015 | 2016 | 2017 | % Change (2017 vs 2016) | ||||||||||||||||||||||||||
Net operated | Boepd | 84,355 | 81,769 | 85,083 | 4% | Boepd | 81,769 | 85,083 | 73,655 | (13%) | ||||||||||||||||||||||||||
Oil | Bopd | 83,800 | 81,077 | 83,898 | 3% | Bopd | 81,077 | 83,898 | 72,912 | (13%) | ||||||||||||||||||||||||||
Gas | Mmscfd | 3 | 4 | 7 | 75% | Mmscfd | 4 | 7 | 4 | (43%) | ||||||||||||||||||||||||||
Net Development Area 1 | Boepd | 71,570 | 68,131 | 74,986 | 10% | Boepd | 68,131 | 74,986 | 66,392 | (11%) | ||||||||||||||||||||||||||
Net Development Area 2 | Boepd | 12,785 | 13,638 | 10,097 | (26%) | Boepd | 13,638 | 10,097 | 7,263 | (28%) | ||||||||||||||||||||||||||
Net Development Area 3 | Boepd | — | — | — | — | Boepd | — | — | — | — | ||||||||||||||||||||||||||
Mangala
The Mangala field commenced production in SeptemberAugust 2009 and continues to be the largest contributor to production from the Rajasthan asset. To increase the ultimate oil recovery and aid tosupport for production volumes, we haveCairn India has embarked on an enhanced oil recovery project, which was successfully executed with encouraging results during fiscal year 2016. The first polymer injection at the Mangala field started in October 2014. By the end of fiscal year 2016, polymer injection was ramped up to the target levels of 400,000 blpd and going forward, the plan is to maintainpeak injection at this rate.rate was maintained during fiscal year 2017. Enhanced oil recovery alone led to an increased gross oil recovery averaging about 32,00052,000 boepd in the fourth quarter of fiscal year 2016. The integrated drilling programme was completed for 93 new wells during the year. In October 2015, the central polymer facility became fully operational with five trains preparing polymer solution.2017.
The alkaline surfactant polymer enhanced oil recovery pilot commenced during fiscal year 2015 and has shown positive results with better mobilization of un-sweptunswept oil. Preliminary analysis suggested that the alkali surfactant polymer pilot wells produced approximately10-15% incremental oil of the pilot stock tank of oil in place over polymer flood.
Aishwariya
Aishwariya, the third largest discovery in Rajasthan, commenced production in March 2013. It is the fifth oil producing field from the block. Cairn India is looking at replicating the success of the Mangala enhanced oil recovery program to enhance recovery from the Aishwariya field through the execution of polymer flooding. During fiscal year 2016,2017, Cairn India commenced polymer injectivity testing in three injector wells. The field development plan for the planned infill wells program in Aishwariya was successfully completed. Allpolymer enhanced oil recovery project has been submitted to the 20 infill wells have been brought online and are playing a key role in sustaining the field oil rates.
Raageshwari and Saraswati
The Raageshwari oil field commenced production in March 2012, while the Saraswati field commenced production in May 2011. Availability of the integrated processing and evacuation facility has reduced operating costs and has therefore made these fields economically viable.
Bhagyam
Bhagyam, the second largest field in Rajasthan, forms a part of Development Area 2 and commenced production in January 2012. Performance of the Bhagyam field continues to be challenging with the consistent rise in water cut and natural decline of crude oil. Reservoir management programmesprograms have been used to address these challenges. A multi-well polymer injectivity test for Bhagyam was successfully completed during the year and the results have been encouraging. The planned concept of Bhagyam polymer enhanced oil recoveryrevised field development plan has been optimizedsubmitted to improve economics in light of lower oil prices and may allow us to undertake polymer flood recovery in the near term.joint venture partner.
Facilities
Mangala Processing Terminal
The Mangala processing terminal is spread over an area of 1.6 sq. kms and is a core asset. The Mangala processing terminal processes crude oil produced from various oil fields in the Rajasthan block. FollowingThe Mangala processing terminal is currently operational with three oil processing trains. The overall liquid handling nameplate capacity of the oil processing trains is 680 kblpd. The oil processing train primarily consists of slug catchers, production heaters, a production separator and settling tank for oil water separation and degassing. Stabilized crude oilafter meeting export crude specification is transported to refineries through a 24 inch24-inch diameter continuously heated and insulated pipeline. The Mangala processing terminal’s integrated production facilities support the field development plan approved production, which is in line with Cairn India’s unified Rajasthan block off-takeofftake capability.
During fiscal year 2016, we successfully upgraded our capacity of the injection water system to around 700,000 barrels of water per day. A new water well has been drilled at Thumbli and hooked up with Mangala Processing Terminal (MPT) through a new 30 inches pipeline. An injection water pump was also installed as part of the additional facility, which will augment injection water capacity. This will increase the voidage replacement ratio, thereby maintaining field pressure and enhancing recovery rates from the field. In addition, this would improve the reliability and efficiency of water injection at the Rajasthan Block as well as create spare capacity.
As part of the Mangala polymer flood enhanced oil recovery program implementation, polymer injection ramped up to our target levels of 400,000 blpd and we plan to maintain the injection at this level going forward. Increasing oil production and stabilizing water cut from the Mangala field are pointing towards the desired results of the polymer flood. During the year, the integrated drilling program of 93 wells was completed, and work on completions and surface facilities hookups is progressing as per schedule. Five polymer trains at MPT are now successfully preparing the polymer solution which is being transported to well pads across the field. The skim tanks at MPT to be used for processing the incoming polymerized fluid are in final stages of commissioning.
Raageshwari Gas Processing Facility
We areCairn India is currently in the process of setting up a gas processing terminal in the southern part of the Rajasthan block, which will have the capacity to produce 100 mmscfd of gas from adjoining gas fields, primarily the Raageshwari Deep Gas field. The Management Committee approved the Raageshwari Deep Gas Field Development Plandeep gas field development plan for 100 mmscfd towards the end of fiscal year 2015. We areCairn India is working on a phasedramp-up of gas production. The first phase includes some low cost augmentation of the existing facility and installation of additional gas compressor stations. For the second phase, tendering process for new gas processing terminal and rig services is underway. On the pipeline front, weCairn India signed an agreement with GSPL India Gasnet Limited (“GIGL”) which has agreed to construct the pipeline connecting Raageshwari Gas Terminal to Palanpur via their Mehsana - Mehsana—Bhatinda Pipelinepipeline in accordance with the Petroleum and Natural Gas Regulatory Board (“PNGRB”) approval.
Power facilities
At the Rajasthan block, captive power is generated at the Mangala processing terminal via steam turbine generators and Raageshwari gas terminal via gas turbines.engines. The total power capacity across Mangala processing terminal and Raageshwari gas terminal aggregates to 63.3 MW. The gas used as fuel is the associated gas from ourthe fields at Rajasthan. For power requirements exceeding the power generation capacity, which is based on associated gas availability, we tapCairn India taps into the Rajasthan state grid power or buybuys it through open access from the energy exchanges at lower rates.
Mangala Development Pipeline
The Mangala development pipeline is designed to evacuate the crude oil and transport gas from the Rajasthan block. Beginning at the Mangala processing terminal and Raageshwari terminal respectively, the 24 inch crude oil and 8 inch gas pipeline passes through eight districts across two states, Rajasthan and Gujarat. The pipeline ends at Bhogat near Jamnagar on the western coast of India. There are buffer crude storage terminals at Radhanpur and Viramgam for sales to Indian Oil Corporation andoff-take lines at Salaya for sales to the Reliance India Limited and Essar Oil refineries in Jamnagar.
Since its commissioning, total cumulative crude oil sales of 332390 million barrels have been achieved through the existing pipeline facilities up to March 31, 2016.2017. With the use of drag reducing agents, the proven dispatch capacity of the Mangala development pipeline has been enhanced to around 250,000 bbls per day. Given its length, the Mangala development pipeline incorporates a pipeline intrusion detection system to provide surveillance along its entire length by using fibre optics. OurCairn India’s pipeline operations received the prestigious Oil Industry Safety Directorate award for ‘Best Near-Miss reporting’ and accreditation of both OHSAS: 18001 and ISO: 14001 systems.
In fiscal year 2014, gas sales commenced through the 8 inches gas line. Capacity was further enhanced through installation of higher capacity gas compressors at Raageshwari and Viramgam terminals to nearly double gas sales capability; as well as modification of impellers of the mainline booster pumps at Viramgam. During fiscal year 2016, stabilization of the compressors and optimization of plant operations aided production.
In November 2015, the Salaya-Bhogat pipeline and terminal at Bhogat were commissioned and the first cargo of 500,000 barrels of Rajasthan crude oil was successfully loaded in December 2015 through the Bhogat terminal for Mangalore Refinery and Petrochemicals Limited (“MRPL”). The terminal has provided the access to a larger market for Rajasthan crude. This should enable usCairn India to diversify customer mix and reduce dependence on limited number of customers.
Bhogat Terminal Facilities
The Bhogat terminal in the Jamnagar district, Gujarat, is a 160 hectare site located eight kms from the Arabian Sea coast. The terminal will facilitate the storage and evacuation of crude oil by sea. The terminal consists of tankages with storages capacity of around 2.1 million barrels of Rajasthan crude. It also has associated facilities for the operation of terminal and marine export of crude. The evacuation facility includes two 24 inchsub-sea export pipelines from the Bhogat landfall point to the single point mooring system to enable crude transfer and a single point mooring system andsub-sea pipeline end manifold in deep sea to enable tanker berthing and loading. The terminal was commissioned in November 2015 and the dispatch of Rajasthan crude to MRPL has commenced.
Exploration
During fiscal year 2016, activity continued to be focused upon appraisal of2017, the focus was on identifying new plays, appraising new discoveries, processing and processinginterpreting of the new 3D seismic data over high priority areas, in-line with our re-phased exploration program. Appraisal activities for the RDG field and the key oil discoveries at Diatomite Prospect, NL and Vijaya and Vandana were carried out, with the objective of progressing these discoveries to development.
In fiscal year 2016,areas. Cairn India announced one new discovery, with overall discoverieshas made significant progress in revamping the portfolio of prospects in the block totalling 38. Since exploration in the Rajasthan block resumed in 2013, the Company has announced 13 new discoveries. As at March 31, 2016, Cairn India has discovered 1.7to achieve an overall prospective resource base of more than one billion boebarrels of drilledoil and tested hydrocarbons in place with an additional 0.45 billion boe drilled which are yet to be tested. Since resumption of exploration in Rajasthan block in 2013, Cairn India discovered 2C resources of 200 mmboe in Rajasthan. Additionally, 70gas by fiscal year 2018. New prospects based on bothnew-play concepts and proven-play extensions have added 436 mmboe of prospective 2C resource has been drilled and awaiting testing.resources in fiscal year 2017.
The 3D seismic acquisition programmeprogram continued in Rajasthan, with a total of 432 sq. kms acquired during the fiscal year 2016. As a result, we haveCairn India has covered most of the areas of interest in the block with 3D seismic data. The processing of newly acquired 3D seismic data is in progress with a focus on identifying additional prospects that will act to replenish the exploration inventory.
Ravva
Ravva Block Production Sharing Contract
The production sharing contract for the exploration, development and production of the Ravva block (the “Ravva PSC”) was signed on October 28, 1994 between GoI and a consortium consisting of ONGC, Videocon Industries Limited (formerly Videocon Petroleum Limited), Ravva Oil and Cairn Energy India Pty Limited (formerly known as Command Petroleum (India) Pty Limited) (“Command Petroleum”) with Command Petroleum being designated as the operator. In 1996, Cairn Energy Plc acquired Command Petroleum, including its interest in the Ravva block, and subsequently Cairn India became the operator.
As at March 31, 2017, Cairn India holds a 22.5% working interest in the Ravva block with the remaining interests currently held by ONGC (40%), Videocon Industries Limited (25%) and Ravva Oil (12.5%) (together the “Ravva Joint Operating Partners”). The production sharing contract is currently valid until October 27, 2019, but may be extended by the GoI for up to an additional ten years in the case of commercial production ofnon-associated natural gas or up to five years otherwise. The Ministry of Petroleum and Natural Gas, through itsa notification No.O-19025/10/2005-ONG-D-V (Part II) dated March 28, 2016 issued a policy for the grant of an extension to the production sharing contracts signed by the GoI awarding small, medium sized and discovered fields to private joint ventures (“(the “Ravva Extension Policy”). The Ravva Extension Policy defines the framework for the granting of extension and covers 28 small and marginal fields, including the Ravva field.
Under the Ravva PSC, Cairn India is entitled to recover 100% of exploration, development and costs of production from crude oil and natural gas sales before any profit is allocated among the parties.
Under the Ravva PSC, until such time as India attains self-sufficiency in its crude oil supply, Cairn India is required to sell in the domestic Indian market all of its entitlement to crude oil extracted from the Ravva field to assist in satisfying domestic Indian crude oil demand. All sales to the GoI nominees are to be valued at a F.O.B. selling price per barrel in US dollars, ascertained on Platts, of one or more crude oils of similar characteristics and quality or through the spot market for such crude oil, whichever price is determined by the parties to reflect more truly the current value of the sale.
The Ravva PSC also provides that royalties and cess are payable on production. The royalty rate on crude oil and casing head condensate is set at Rs. 481 per metric ton ($ 1.0 per barrel), regardless of the value of the crude oil. A levy on the production of crude oil under the provisions of the Oil Industry (Development) Act, 1974 of India (the “OIDA Cess”) is set by the Ravva PSC at Rs. 900 per metric ton of crude oil production ($ 1.8 per barrel). A further Rs. 27 per metric ton ($ 0.1 per barrel) (representing a 3% increase in the OIDA Cess) was levied against members of the Ravva joint operation as educational cess and senior and higher secondary educational cess until November 2013. From December 2013, the educational cess and senior and higher secondary educational cess levied was discontinued as per the circular from the Ministry of Finance.
The royalty payable on natural gas is set at 10% of the wellhead value of the natural gas (typically 9% of natural gas revenue). OIDA Cess is not payable on natural gas production. Royalties and OIDA Cess are capped by the Ravva PSC at these levels regardless of the generally prevailing royalty and cess rate. Payment of royalty and OIDA Cess payments are recoverable under the Ravva PSC before any profit is allocated among the parties. As ONGC originally discovered the Ravva block, Cairn India and the other members of the Ravva Joint Operating Partner are obliged to make a series of production payments to ONGC based on cumulative crude oil production. The method of calculating the production payments is set out below.
| Gross Payment Owed to ONGC | Net Payment by Cairn India | |||||||
| ($ million) | ||||||||
For every 25 million barrels produced up to 75 million barrels | 9.0 | 3.4 | ||||||
For every 5 million barrels produced between75-100 million barrels | 1.8 | 0.7 | ||||||
For every 5 million barrels produced between100-225 million barrels | 1.7 | 0.6 | ||||||
For every 5 million barrels produced between225-250 million barrels | 1.4 | 0.5 | ||||||
For every 5 million barrels produced over 250 million barrels | 1.0 | 0.2 | ||||||
From time to time, disputes have arisen between the Ravva Joint Operating Partners over the interpretation of the Ravva PSC which have required arbitration. For example, a dispute arose between the GoI and Ravva Joint Operating Partners on the issue of excess cost recovery made by Ravva joint operation partners against the base development cost as mentioned in the Ravva PSC which has limited the escalation of such costs for cost recovery purposes. The Ravva joint operation partners (excluding ONGC) initiated arbitration proceedings and the arbitral tribunal announced its award on January 18, 2011 broadly allowing companies including Cairn India to recover base development cost spent amounting to $ 278 million and disallowed anover-run of $ 22.3 million spent in respect of base development cost and directed 50.0% legal cost on the GoI. The High Court of Kuala Lumpur, on August 30, 2012, dismissed the GoI’s application for setting aside the award with costs.
The GoI further filed an appeal before the Court of Appeal, Kuala Lumpur, which was dismissed on June 27, 2014. The GoI thereafter filed an application for a leave to appeal against the Court of Appeal’s order before the Federal Court, which was dismissed by the Federal Court on May 17, 2016. The GoI has also issued a show cause notice on this matter to which Cairn India Limited has replied tohad responded and has also filed an application for enforcement of the Awardaward before the Delhi High Court of Delhi as an additional measure of caution. The next hearing is due on September 8, 2016.August 2, 2017. Additionally, on August 14, 2015, the GoI filed a suit and obtained anex-parte ‘stay-order’ stay-order from the Delhi High Court of Delhi against the determination of ‘quantum of costs’ by the arbitral tribunal. Cairn India Limited filed an appeal before the Court against the ‘stay order’.stay-order. The same appeal has allowed by the Court through its order dated May 3, 2016 and the ‘stay-order’aforesaid stay-order obtained by the GoI in this matter has been set aside.aside by the Division Bench of the High Court. The GoI filed a special leave petition against the Division Bench’s order, which will be heard by the Supreme Court at a date which will be made available by the Court. The next hearing before the Court in the GoI’s civil suit is scheduled for OctoberAugust 3, 2016.2017.
Operations
Since inception in calendar year 1994, the Ravva block has produced crude oil and gas more than double the initial resource estimates at the time the Ravva PSC was awarded achievingand is close to achieving 50% recovery.recovery of the current resource estimates.
During fiscal year 2016,2017, the block produced 3,4482,296 boepd, with a plant uptime of 99.7%over 99% and was supported by coil tubing based rig-less well intervention programmes contributing significantlyand stimulation campaign which helped to offset the total field production. Production optimisation efforts such as deeper gas lift valve installation in oil wells and the de-bottlenecking of the water separation unit also assisted in realising higher production, thus arresting the average field decline during the year. Sustained water injection rates through acid stimulation in five water injection wells and deeper gas lift injection have also supported production from oil wells.natural decline.
The following table sets out the net average daily production of oil and gas daily production from the Ravva block for the years ended March 31, 2014, 2015, 2016 and 2016:2017:
Average Daily Production | Units | 2014 | 2015 | 2016 | % Change (2016 v. 2015) | Units | 2015 | 2016 | 2017 | % Change (2016 v. 2017) | ||||||||||||||||||||||||||
Net operated | Boepd | 3,473 | 3,411 | 3,448 | 1% | Boepd | 3,411 | 3,448 | 2,296 | (33%) | ||||||||||||||||||||||||||
Oil | Bopd | 2,704 | 2,962 | 3,015 | 2% | Bopd | 2,962 | 3,015 | 2,047 | (32%) | ||||||||||||||||||||||||||
Gas | Mmscfd | 5 | 3 | 3 | 0% | Mmscfd | 3 | 3 | 1 | (67%) | ||||||||||||||||||||||||||
Facilities
Currently, there are eight unmanned offshore platforms and a 225 acre225-acre onshore processing facility at Surasaniyanam, Andhra Pradesh, for processing the natural gas and crude oil produced from the offshore field. The Ravva onshore terminal operates in internationally recognized environmental standard (ISO 14001) and occupational health and safety standard (OHSAS18001). The onshore facility has the capacity to handle 70,000 bopd of crude oil, 95 mmscfd of natural gas and 110,000 bbls of water injection per day. The terminal also has the capacity to store 1.0 mmbbls of crude oil and captive power generation capacity of 10 MW.
Cambay
Cambay Block Production Sharing Contract
Exploration, development and production of the Cambay block is governed by a production sharing contract between the GoI and a consortium consisting of ONGC, Tata Petrodyne Limited (“Tata”) and Cairn India, (the “Cambay Joint Operating Partners”) which was signed on June 30, 1998 (the “Cambay PSC”) and runs until 2023 and can be extended for a further period of 10 years in case of commercial production ofnon-associated natural gas or for a period not exceeding five years. By way of a notification dated April 7, 2017, the MoPNG issued a policy for the grant of extension to the production sharing contracts signed by the GoI awardingPre-NELP Extension Policy. ThePre-NELP Extension Policy defines the framework for granting extensions forPre-NELP blocks and covers both the Rajasthan and Cambay fields. Cairn India’s participating interest in the Cambay Basin joint operation consists of a 40% interest in the Lakshmi, Gauri andCB-X development areas. The remaining interests in these development areas are held by ONGC (50%) and Tata (10%).
Operations
The Cambay block started production in calendar year 2002. During fiscal year 2016,2017, the block produced 2,5462,308 boepd with an uptime of 99.9%over 99%. Production was supported by effective reservoir management practices offsetting its natural decline. A successful well intervention campaign carried out during the first quarter of fiscal year 2016, which helped improve the deliverability of producer wells. Commissioning of an artificial gas lift system and better reservoir performance also added to the production. Cleaning and intelligent pigging of the 24 inch diameter 36 km long sub-sea pipeline in Cambay was accomplished with minimal downtime during the year.
The following table sets out the net average oil and gas daily production from the Cambay block for the years ended March 31, 2014, 2015, 2016 and 2016:2017:
Average Daily Production | Units | 2014 | 2015 | 2016 | % Change (2016 v. 2015) | Units | 2015 | 2016 | 2017 | % Change (2016 v. 2017) | ||||||||||||||||||||||||||
Net operated | Boepd | 2,274 | 2,512 | 2,546 | 1% | Boepd | 2,512 | 2,546 | 2,308 | (9%) | ||||||||||||||||||||||||||
Oil | Bopd | 1,816 | 2,047 | 2,197 | 7% | Bopd | 2,047 | 2,197 | 1,946 | (11%) | ||||||||||||||||||||||||||
Gas | Mmscfd | 3 | 3 | 2 | (33%) | Mmscfd | 3 | 2 | 2 | — | ||||||||||||||||||||||||||
Facilities
An82-acre onshore processing facility at Suvali, processes natural gas and crude oil from the Lakshmi and Gauri fields. This facility has a capacity to process 150 mmscfd of natural gas and 10,000 bopd of crude oil and includes a three stage separator oil processing train, four storage tanks of combined capacity of 37,700 bbls as well as 4.8 MW captive power generation capacity. As part of the asset’s long term facility augmentation plan, a storage tank to expand the crude storage capacity at Suvali terminal and an offshore gas lift compressor package to provide artificial lift to the wells washave been commissioned during the year.fiscal year 2016. The processing plant and offshore infrastructure are certified to ISO 14001 and OHSAS 18001 standards.
Power Generation facilities
OurCairn India’s current power generation facilities are set up to address the captive power requirements to run ourits routine business operations. The total installed capacity across upstream and midstream operations are 156165 MW. The following table sets forth information relating to ourthe existing power capacity as of March 31, 2016:2017:
Fiscal year commissioned | Capacity (MW) | Location | Fuel used | |||
| 2010 and 2014 | 60.0 | Rajasthan Mangala processing terminal | Steam turbine | |||
| 2010 | 3.3 | Rajasthan Raageshwari gas terminal | Gas based | |||
| 2010 | 14.4 | Gujarat Viramgam terminal | Gas Based | |||
| 2015 | 31.3 | Gujarat Bhogat Terminal | Gas Based | |||
| 2010 | 32.5 | Pipeline Above Ground Installations (AGI’s) | Gas Based | |||
| 2003 | 4.8 | Cambay | Gas based | |||
| 1999 and 2003 | 10.0 | Ravva | Gas based | |||
Fiscal year commissioned Location Fuel used 2010 and 2014 Rajasthan Mangala processing terminal 2010 Rajasthan Raageshwari gas terminal 2010 Gujarat Viramgam terminal 2015 Gujarat Bhogat Terminal 2010 Pipeline Above Ground Installations (AGI’s) 2003 Cambay 1999 and 2003 Ravva Capacity
(MW) 60.0 Steam turbine 3.3 Gas based 14.4 Gas Based 39.0 Gas Based 33.8 Gas Based 4.8 Gas based 10.0 Gas based
Exploration
In addition to the Rajasthan, Ravva and Cambay blocks, exploration activity was carried out in the year across sixfour other blocks in our portfolio. The main basins include the Orange Basin, the Mannar Basin, Mumbai Offshore Basin, the Krishna Godavari Basin, and the Palar Pennar Basin.
KG Onshore
KG-ONN-2003/1, Krishna Godavari Basin(49% participating interest)
The onshore blockKG-ONN-2003/1, located in the Krishna Godavari basin in the state of Andhra Pradesh, was awarded in NELP V round to a joint venture between Cairn India and ONGC. Cairn India and ONGC entered into a production sharing contract on September 23, 2005 (the “KG-ONN-2003/“KG-ONN-2003/1 PSC”). Cairn India has 49% ownership interest in the block.Nagayalanka-1Z was the first discovery in the block. Following this discovery, the joint operation (with ONGC) for the block opted to enterphase-II of the exploration license. The second exploration well,Nagayalanka-SE-1, was drilled which resulted in a light oil discovery in the onshore part of the KG basin.
The Declaration of Commerciality for the two Nagayalanka discoveries (Nagayalanak-1z(Nagayalanak-1z and NagayalankaSE-1) was approved at the Management Committeemanagement committee meeting held in July 2014. Operatorship was then transferred to ONGC as per theKG-ONN-2003/1 PSC. Preparation of the field development plan for theNagayalanka-1z and NagayalankaSE-1 discoveries has been undertaken with the Directorate General of Hydrocarbon’s approval in place for extension of field development plan submission deadline. Cairn India’s joint venture partner and operator ONGC has submitted the Field Development Plan, which has been approved by the management committee.
KG Offshore
KG-OSN-2009/3, Krishna Godavari Basin(operator, 100% participating interest)
The offshore blockKG-OSN-2009/3 covers an area of 1,988 sq. kms and is located in the Krishna Godavari Basin off the coast of the state of Andhra Pradesh. Cairn India is the operator and holds a 100% interest in the block. BlockKG-OSN-2009/3 is a shallow water block with water depths within the block ranging between near shore to 400 meters. The production sharing contract was signed on June 30, 2010 and the Petroleum Exploration Licensepetroleum exploration license was granted in August 2010.
100% of the planned 1,075 sq. km. of 3D seismic data acquisition was completed during fiscal year 2015. During fiscal year 2016, seismic processing and interpretation projects were carried out and a high quality prospect inventory was matured. Site surveys were carried out on five possible drilling areas,During fiscal year 2017, interpretation of the new seismic volumes resulted in the identification of robust drillable prospects and technical studies and preparations for exploration drilling progressed. Clearance to commence safe drilling operations is awaited from the GoI.a number of leads over different play types. Cairn India is currently engaging with the Ministry of Petroleum and Natural Gas (“MoPNG”)MoPNG for an extension of the Initial Exploration Phase for the block, which expired on March 8, March 2016.
Palar-Pennar
Palar-Pennar Basin (operator, 35% participating interest)
The block is located in the Palar Pennar basin, south of the Krishna Godavari basin and north of the Cauvery basin off the east coast of India. Water depths in the block range from a few meters (near shore) to 400 meters at the eastern boundary of the block. The block covers an area of approximately 9,417 sq. kms. We haveCairn India has a 35% ownership interest in the block and are the operator, while the consortium members ONGC and Tata, hold interests of 35% and 30%, respectively.
The block was under force majeure since fiscal year 2010 as the location was falling within the prohibited zone notified by government authorities and permission to carry out exploration and petroleum operations in this area was not considered appropriate by the Department of Space, GoI. However, the application for the shift of the restricted boundary has been accepted by government authorities paving the way for further exploration activity. Approval for a special dispensation period in the block was granted for 30 months effective from January 1, 2015 and date of the expiry ofPhase-1 is expected to be June 30, 2017. The prospect inventory description ofA three-well exploratory drilling campaign in the frontier block has beenstarted in February 2017 and was completed and preparation for drilling of three commitment wells in fiscal year 2018 is in progress. Cairn India has requested the GoI for an extension of the current exploration license period by two years.April 2017.
Mumbai Offshore
Mumbai Offshore Basin (operator, 100% participating interest)
This block was awarded under the NELP VIII licensing round and is located in the Mumbai Offshore Basin. We areCairn India is the operator and holdholds a 100% interest in the block.MB-DWN-2009/1 has water depths of between 1,000 meters to 2,200 meters.
The processing of the acquired 2,128 line km of 2D broadband seismic was completed in fiscal year 2015. During the fiscal year 2016, regional prospectively analysis has been completed, together with interpretation of the newly acquired PSTM processed broadband 2D seismic data. Due to poor prospects and high levels of risk revealed through the analysis, Cairn India hasduring fiscal year 2017, we had applied for the relinquishment of the block. The first exploration phase expired on April 16, 2016 and theall related formalities related to the relinquishment of the block are in progresshave been completed.
Sri Lanka
SL2007-01-001 – Mannar Basin, Sri Lanka (operating through a subsidiary, 100% participating interest)
Cairn Lanka (Private) Limited, a wholly owned subsidiary of Cairn India Limited has established two gas discoveries in the Mannar basin, namely Dorado and Barracuda. Given the current level of gas prices and fiscal terms, the development of hydrocarbons in the said block is not commercially viable. The exploration license for the block expired on October 15, 2015. Cairn India has completed exit formalities with the Sri Lankan government. All inventories have been amalgamated into the Sedawatte Yard for potential future use in drilling in Palar. Arrangement for movement of the inventory to a Special Economic Zonespecial economic zone in India is in progress. Mud disposal is on-going.ongoing. Oil spill response equipment export documents are in completion. Office space reduction has been completed.
South Africa
Block 1 - 1—Orange Basin, South Africa(operating through a subsidiary, 60% participating interest)
Cairn India signed afarm-in agreement with PetroSA, the national oil company of South Africa, for the 19,898 sq. kmsoff-shore block 1 (“Block 1”), located in the Orange Basin in South Africa. A wholly owned subsidiary, Cairn South Africa Pty. Limited, a wholly owned subsidiary of Cairn India Limited holds a 60% participating interest in Block 1 and is the operator.
Followingfarm-in and assignment of participating interest in the block in early calendar year 2013, weCairn India acquired 1,981 sq. km of 3D seismic data in fiscal year 2014. Additionally, acquisition of 3,000 line km of 2D seismic data was concluded in early March, 2014. Both the 3D seismic and 2D seismic surveys were completed without incident and on time.
A robust inventory of exploration prospects has been identified based on fiscal year 2014 3D seismic survey, which covers the outboard portion of Block 1. The outboard region is interpreted asoil-prone, constituting a play fairway that has not been tested by historical exploration drilling. Cairn India awaits a decision on the proposed changes to the Mineral and Petroleum Resources Development Act, 2002 and fiscal regime before considering a decision to progress into the second exploration license phase.
Sales and Marketing
Cairn India’s 10 largest customers accounted for approximately 100% of its revenue in fiscal years 2014, 2015, 2016 and 20162017 respectively. Four of Cairn India’s customers accounted for greater thanapproximately 90.0% of Cairn India’s business revenue in fiscal years 2014, 2015 and 2016.2016 and approximately 87% in fiscal year 2017.
In fiscal year 2016,2017, Cairn India sold 100% of the oil and gas it produces in the Indian market.
100% of the oil and gas that Cairn India produced in fiscal year 20162017 was sold under annual/monthly contracts specifying quantity and price. For Rajasthan and Cambay blocks, crude oil price is benchmarked to Bonny Light, West African low sulphur crude that is frequently traded in the region, with appropriate adjustments for crude quality. Similarly, for Ravva block, crude oil price is benchmarked to Tapis and Minas, South Asian crude. The crude oil price benchmarks are based on crude oil sales agreement.
Projects and Developments
Cairn India intendsplans to spend $100$250 million on working interest capital expenditure split between 20%10% for exploration and 80%90% for development activities in fiscal year 2017.2018. The development activities mainly include gas development, Mangala enhanced oil recovery completion activities, pre-engineering work for Bhagyam enhanced oil recovery and Aishwariya Barmer Hill.Hill, and Mangala infill and surface facility upgrades. All the projects will be financed from internal sources. A numberSome of ourCairn India’s principal projects are set out below.
MBABhagyam and Aishwariya fields - enhanced oil recovery project including drilling campaign and facilities upgrade
During fiscal year 2016, we have successfully upgraded our water injection capacity atMangala enhanced oil recovery, one of the Mangala processing terminal to 700,000 barrels of water per day by addition of Thumbli pipeline and an injection water pump. This will aid in enhancing recovery rates from the field and has also improved the overall integrity of our water injection systems.
Successful execution ofworld’s largest polymer flood has yieldedprojects, continued to show its positive results with an increase in oil production and stabilization of water cut. At the end of fiscal year 2016,performance. The polymer injection ramped up to plannedwas maintained at target levels of 400,000 blpdbarrels of liquid per day and going forward, we planresulted in a positive production impact of approximately 52,000 barrel oils per day in fiscal year 2017. Cairn India looks to maintainleverage the injection at this rate. Enhancedexperience from the performance of Mangala enhanced oil recovery led to an increased oil recovery averaging about 32,000 boepdenhance production from Bhagyam and Aishwariya through polymer injection.
A multi-well polymer injectivity test for Bhagyam was successfully completed during the quarter and the results have been encouraging, and the revised field development plan has been submitted to the joint venture partner. The injectivity test in 4th quarter of fiscal year 2016. FiveAishwariya has started in three polymer trains at MPT are now successfully preparinginjector wells and the injection polymer and skim tanksfield development plan has been submitted to be used for processing the incoming polymerized fluid are in final stages of commissioning. The focus for the next year is to continue to maintain polymer injection in Mangala as per the sub-surface requirements and complete the residual development work in the field.joint venture partner.
Barmer Hill and Satellite field development
The development of Barmer Hill and Satellite Fieldsfields is a key growth driver for Cairn India, with a focus on increasingnon-MBA production through the development of these fields. The Barmer Hill formation can be classified into 2 major development opportunities
During fiscal year 2016,The large hydrocarbons initially in place for an equivalent of 1.4 billion barrels of oil at Barmer Hill appraisal campaign was successfully completed. A total of 15 wells were drilled, a combination of seven vertical and eight horizontal wells, across Mangala andoffers significant growth potential. Development costs for Aishwariya formations in fiscal year 2015. A combination of different completion typesBarmer Hill has been tested in both vertical and horizontal wellsreduced by over 30% to permit optimization. The wells were put on long term testing to ascertain decline rates and deliverability. Valuable data gathered through the programme is now being used towards a full field development plan. A set$ 195 million from an initial estimate of advanced technologies was deployed to delineate key parameters.
Appraisal activities produced significant learning on fraccability and well productivity in Mangala and Aishwariya. Wells at Aishwariya showed greater productivity (800 to 1,000 bopd) and consequently full field development at Aishwariya has been prioritized.$ 300 million, for an estimated recovery of 32 million barrels. Cairn India has achieved sub-surfacecommercial and technical alignment with ONGC, its joint venture partner for stage – 1 and is progressing on technical alignment for the surface facility.
The Satellite Fields produced 1.3 mmboeproduction from appraised wells are scheduled to start in first half of oil during fiscal year 2016. The focus here2018. Execution ofstage-2 is expected to improve productivity, reduce operating expenditure andbegin in fiscal year 2018.
Mangala Infill
Mangala has been identified to bring more wells online. Several optimisation interventions have helped reduce total cost ofbe a prolific field. In order to increase production and enabled the project to withstand current oil price conditions.
In fiscal year 2016,monetize reserves early, Cairn India successfully concluded appraisal workis commencing a15-well infill drilling program in the GudaMangala field. A total of eight wells were testedThe field development plan for this project has been approved and modular quick production facilities were deployed in a number of well pads. Long term testingdrilling of the wells has yielded positive indicationis planned for the second quarter of fiscal year 2018.
Surface facility upgrade at Mangala Processing Terminal
In order to maximize oil production, Cairn India is focusing on creating ullage at the Mangala Processing Terminal and a revised field development plan is being prepared for monetising this field.debottleneck the surface network. A series of measures have been planned to increase the liquid handling and water injection capacities.
Gas development
DuringGas development in the RDG field in Rajasthan continues to be a strategic priority. Capital expenditure in the phased development of the project is progressing well, with the aim of achieving a gradualramp-up in production. In fiscal year 2016, Cairn India achieved progress regarding2018, the pipeline by signing an agreement with GIGL. As per the agreement, GIGL will build the pipeline under PNGRB approval and provide us with the tie-in provision to connect to their grid.
Cairn India is also working oncompletion of a phased ramp-up of gas production. The first phase includes low cost augmentationlow-cost expansion of the existing facility and installationthe enhancement of additional gas compressor stations. Encouraging resultscurrent pipeline capacity are expected to lead to aramp-up of production to 40 to 45 mmscfd. The RDG development team is also working to enhance the recovery estimates from the ongoing hydro-frac campaign for 15 wellsfield by maintaining a technology focused approach and gaining a better understanding of the reservoir, based on geological and geophysical studies carried out in fiscal year 2017. The capital expenditure in the RDG field has resultedproject includes plans for a new well drilling program in higher than expected well productivity that will aid in future growth. Approximately half the planned number of fracs to sustain the growth level has been completed and the campaign is expected to conclude by the end of June 2016. For the second phase, Cairn India is progressing well on its tendering process forfiscal year 2018. A new gas processing terminal and rig services.infrastructure is also progressing well.
As a result of the successful application of hydro frac technology and better reservoir characterisation, the expected ultimate recovery from the RDG field has been upgraded by over 25%. During this hydro frac campaign, Cairn India has successfully placed the largest frac in India in one of the RDG wells.
Reserves and Other Oil and Gas Information
The definitions used for proved, proved developed and proved undeveloped oil and gas reserves are in accordance with the Securities and Exchange Commission Rule4-10 of RegulationS-X. Proved oil and natural gas reserves are those estimated quantities of crude oil, natural gas and natural gas liquids that geological and engineering data demonstrate with reasonable certainty to be economically producible in future years from known reservoirs, under existing economic and operating conditions including a12-month average price prior to the end of the reporting period, unless prices are defined by contract, and cost at the date of estimation.
DeGolyer and MacNaughton performed an independent evaluation of our 100% estimated reserves base as of March 31, 2016.2017. See the reserves appraisal report by DeGolyer and MacNaughton, dated April 29, 2016,May 5, 2017, included as exhibit to this Annual Report.
All the proved reserves presented herein are based on production sharing contracts with the GoI. As such, all net reserves are based on an entitlement calculation which converts Cairn India’s share of cost recovery and profit petroleum under each contract to a volume equivalent of net reserves in accordance with SEC guidance on calculating net reserves subject to these agreements. For further information on our proved reserves, see “Supplementary Information on Oil and Gas Exploration and Production” on page F-106.F-110.
Proved Reserves
Proved reserves estimates are based on the requirement of reasonable certainty with technical and commercial assessments based on conventional industry practices. Only technologies that have been tested in the field and have been demonstrated to provide reasonably certain results with consistency and repeatability in the formation being evaluated or in an analogous formation are applied. To determine a reasonable certainty of commercial recovery, the process involves a general method of reserves assessment that relies on the integration of three types of data:
| 1. | Well data used to assess the local characteristics and conditions of reservoirs and fluids. |
| 2. | Field-scale seismic data to allow the interpolation and extrapolation of these characteristics within and outside the immediate area of the local well control. |
| 3. | Data from relevant analogous fields. The data includes appraisal wells or sidetrack holes, full logging suites, core data, and fluid samples. |
In the fields in which estimates of proved reserves have been prepared, reserves have only been estimated from those quantities of oil or gas in place that are above a penetrated hydrocarbon contact or above a lowest known hydrocarbon elevation. In the estimation of reserves associated with improved recovery operations, reserves are based on existing field performance parameters or from the performance of an analogous reservoir located in an adjacent field producing from the same geologic formation, in the same environment of deposition, with a similar geologic structure, containing the same drive mechanism, and containing in aggregate reservoir properties no more favorable than the reservoir of interest. In the estimation of reserves associated with enhanced oil recovery, estimates of reserves have been prepared on the basis of the performance of a pilot project that has exhibited a positive production response located within the field and reservoir in which the reserves have been attributed.
The table below sets forth our estimated net proved developed and undeveloped reserves of crude oil and natural gas by region as of March 31, 2016,2017, based on average fiscal year 20162017 prices:
| Reserves | Reserves | |||||||||||||||||||||||
| Reserve category | Oil (mmbbls) | Natural Gas (bcf) | Total oil and gas products (mmboe) | Oil (mmbbls) | Natural Gas (bcf) | Total oil and gas products (mmboe) | ||||||||||||||||||
Proved developed | ||||||||||||||||||||||||
India | 76.54 | 4.47 | 77.28 | 57.08 | 4.76 | 57.87 | ||||||||||||||||||
South Africa | — | — | — | — | — | — | ||||||||||||||||||
|
|
|
|
|
| |||||||||||||||||||
Proved undeveloped | ||||||||||||||||||||||||
India | 1.56 | 1.04 | 1.74 | 0.48 | 0.95 | 0.64 | ||||||||||||||||||
South Africa | — | — | — | — | — | — | ||||||||||||||||||
|
|
|
|
|
| |||||||||||||||||||
Total proved reserves | 78.1 | 5.51 | 79.02 | 57.56 | 5.71 | 58.51 | ||||||||||||||||||
|
|
|
|
|
| |||||||||||||||||||
Note: Gas is converted to oil equivalent using a factor of 6,000 cubic feet of gas per 1 barrel of oil equivalent.
The table below summarizes information about the changes in total proved reserves for 2017, 2016 2015 and 2014:2015:
Total Proved Developed and Undeveloped Reserves
| Oil (mmbbls) | Natural gas (bcf) | Total oil and gas products (mmboe) | ||||||||||
| Reserves quantity information for the year ended March 31, 2014 | ||||||||||||
March 31, 2013 | 104.94 | 6.67 | 106.05 | |||||||||
Revisions of previous estimates | 17.20 | 2.96 | 17.70 | |||||||||
Improved recovery | 21.63 | — | 21.63 | |||||||||
Purchases or (sales) of minerals | — | — | — | |||||||||
Extensions and discoveries | — | 1.21 | 0.20 | |||||||||
Production | (32.24) | (3.89) | (32.89) | |||||||||
|
|
|
|
|
| |||||||
March 31, 2014 | 111.53 | 6.95 | 112.69 | |||||||||
| Reserves quantity information for the year ended March 31, 2015 | ||||||||||||
March 31, 2014 | 111.53 | 6.95 | 112.69 | |||||||||
Revisions of previous estimates | 7.70 | 1.29 | 7.92 | |||||||||
Improved recovery | — | — | — | |||||||||
Purchases or (sales) of minerals | — | — | — | |||||||||
Extensions and discoveries | 2.28 | 0.16 | 2.31 | |||||||||
Production | (31.42) | (3.51) | (32.01) | |||||||||
|
|
|
|
|
| |||||||
March 31, 2015 | 90.09 | 4.89 | 90.91 | |||||||||
| Reserves quantity information for the year ended March 31, 2016 | ||||||||||||
March 31, 2015 | 90.09 | 4.89 | 90.91 | |||||||||
Revisions of previous estimates | 20.70 | 4.95 | 21.53 | |||||||||
Improved recovery | — | — | — | |||||||||
Purchases or (sales) of minerals | — | — | — | |||||||||
Extensions and discoveries | — | — | — | |||||||||
Production | (32.69) | (4.33) | (33.41) | |||||||||
|
|
|
|
|
| |||||||
March 31, 2016 | 78.10 | 5.51 | 79.02 | |||||||||
Reserves quantity information for the year ended March 31, 2015 March 31, 2014 Revisions of previous estimates Improved recovery Purchases or (sales) of minerals Extensions and discoveries Production March 31, 2015 Reserves quantity information for the year ended March 31, 2016 March 31, 2015 Revisions of previous estimates Improved recovery Purchases or (sales) of minerals Extensions and discoveries Production March 31, 2016 Reserves quantity information for the year ended March 31, 2017 March 31, 2016 Revisions of previous estimates Improved recovery Purchases or (sales) of minerals Extensions and discoveries Production March 31, 2017 Oil
(mmbbls) Natural gas
(bcf) Total oil and gas
products
(mmboe) 111.53 6.95 112.69 7.70 1.29 7.92 — — — — — — 2.28 0.16 2.31 (31.42 ) (3.51 ) (32.01 ) 90.09 4.89 90.91 90.09 4.89 90.91 20.70 4.95 21.53 — — — — — — — — — (32.69 ) (4.33 ) (33.41 ) 78.10 5.51 79.02 78.10 5.51 79.02 12.06 4.55 12.82 — — — — — — — — — (32.60 ) (4.36 ) (33.33 ) 57.56 5.71 58.51
Proved Undeveloped Reserves
Since March 31, 2015, Cairn India has progressed 36.2 mmboe from proved undeveloped and probable to proved developed reserves. ThisMangala is primarily from Mangala, Aishwariya and Raageshwari Deep Gas fields.the biggest contributor in the Rajasthan block. The major fields within the Rajasthan block represent a large proportion of Cairn India’s total reserves, and the activities associated with the development of reserves in this production sharing contract dominate the progression of reserves movements for the company. Reserves associated with projects or development wells were not categorized as proved until management committee approval was granted. The Mangala, Bhagyam, and Aishwariya fields are the major producing fields in the Rajasthan block.
During fiscal year 2016,2017, focused implementation of the pattern polymer flood process was continued in Mangala field which began in November 2014, was undertaken2014. During fiscal year 2017, 10 new producers and 13 new polymer injectors were brought online along with conversion of six producers and one water injector into polymer injectors. Also, two polymer injectors were converted back to producers. About 400 kbpd polymer solution of 22 centipoise viscosity is being injected in Mangala field. The other two major fields of Rajasthan block, Bhagyam and Aishwariya are still on peripheral water drive. During fiscal yearDevelopment of these two fields is being envisaged under polymer flood to enhance the oil recovery and polymer flood injectivity tests were conducted in these two fields. Bhagyam Polymer injectivity test commenced in October 2016 13 producers were also drilled in the Mangalacentral part of the field (FB1 reservoir) by converting producersB-125,B-131,B-073,B-125 into polymer injectors. The initial injectivity has been in line with expectations and 16 producers were drilledapproximately 7,000 blpd of dilute polymer injection of approximately 20 centipoise is being currently injected in the four injectors. The field is responding well to polymer injection. Aishwariya field. Apart from this, 30polymer injectivity testing commenced in February 2017 through three polymer injectors, were also drillednamelyA-017,A-076 andA-077. The initial injectivity has been in Mangala field. Also, 48 producersline with expectations and 10 water injectors were converted intoapproximately 6,600 blpd of dilute polymer injectorswith approximately 25 to 30 centipoise viscosity is being currently injected. The field is responding well to polymer injection and good pressure support has been observed in this field.several nearby producing wells.
The proved developed reserves as on March 31, 20162017 stand at 77.2857.87 mmboe and proved undeveloped reserves is 1.740.64 mmboe. Since March 31, 2016, Cairn India has progressed 13.90 mmboe (net) from proved undeveloped and probable to proved developed reserves on technical and price reasons, of which 11.97 mmboe are from Rajasthan while contributions from the Cambay and Ravva fields are 0.93 mmboe and 1.00 mmboe, respectively. The proved undeveloped reserves are mainly from Mangala field (Rajasthan block) andnow only in Lakshmi field (CB-OS/(CB-OS/2 block). The development capital expenditure associated with development of the reserves in fiscal year 20162017 is $ 134159 million.
In the period evaluated herein, provedProved undeveloped reserves were added in consideration of approvalapprovals from the Management Committee to drill an additional 14 wells in Mangala (fiscalin fiscal year 2013) of which 14 have been drilled, drill2013, an additional 18 wells in Bhagyam (fiscalin fiscal year 2013) all of which have been drilled, drill, an additional 48 infill wells in preparation for enhanced oil recovery operations of the FM1 sands in the Mangala field (fiscalin fiscal year 2014) of which all wells have been drilled, drill2014, an additional 93 wells in preparation for enhanced oil recovery operations for the remaining sand members in the Mangala field (fiscalin fiscal year 2014) of which all wells have been drilled,2014 and drill an additional 54 infill wells in the Bhagyam field (fiscalin fiscal year 2014) of2014, which all wells have been drilled. Thus, all the additional approved 227 wells have been drilled as of March 31, 2016. The undeveloped reserves in Mangala of 1.23 mmboe are pertainingas on March 31, 2016 have now been progressed to the conversionproved developed on account of about 10 remaining producers earmarked to becomefurther expansion of polymer injectors. These have been classified as proved undeveloped reserves assuming additional rig work, site preparation and flowlines.flood by putting more polymer injectors online during fiscal year 2017.
The capital expenditures associated with the development of reserves are mostly related to the drillingde-commissioning liabilities in Rajasthan and completionpipeline. Part of the wells in the Aishwariya and Mangala fields,expenditure is also related to artificial lift andin-field flow lines and processing equipment, and the construction and installation of the produced fluid handling facilities for all the fields of Rajasthan block including both production and injection equipment.
Outside of the Rajasthan production sharing contract, no development wells were drilled inCB-OS/2 fields during fiscal years 2014, 2015, 2016 and 2016.2017. The undeveloped reserves in fiscal year 20162017 inCB-OS/2 of 0.510.64 mmboe in Lakshmi field areis attributed to undeveloped reserves for gas lift on the LB-5 (T1h, T3w, and T3d – in-situ) and gas lift for theinLB-8 (adding completion in T1i and T6c sands and benefit of using produced gas to aid lifting the T1c in the LB-8fluid column) and LB-9z wells, respectively.LB-5 (using T3d and T3w gas asin-situ gas lift). In the Ravva production sharing contract, a single development well was drilled in fiscal year 2014 and nine development wells were drilled in fiscal year 2015. No2015 and no development wells were drilled in fiscal year 2016.2016 and 2017. No development activities are in progress or planned and hence no undeveloped reserves have been associated with the Ravva production sharing contract.
Internal controls over reserves estimation process
We maintainCairn India maintains an internal staff of petroleum engineers, geoscientists and economists who work closely with our independent reserves engineers to ensure the integrity, accuracy and timeliness of data furnished to our independent reserves engineers in their estimation process and who have knowledge of the specific properties under evaluation. All the activities of reserves estimation are being coordinated by our Reserves Manager and our Chief Reservoir Engineer who are primarily responsible for overseeing the preparation of our reserves estimates and for the internal control over our reserves estimation. He has more than 30 years of industry experience in the exploration and production sectors as a practicing reservoir engineer, with broad experience in reserves assessment, field development and management.
During each fiscal year, our technical team meets with DeGolyer and MacNaughton (D&M) who are provided with full access to complete and accurate information pertaining to the properties to be evaluated and all applicable personnel. In addition, other pertinent data is provided such as seismic information, geologic maps, well logs, production tests, material balance calculations, well performance data, operating procedures and relevant economic information.
Independent reserves estimation
Reserves estimates presented herein for our Indian assets are based on the D&M Reserves Reports, completed on April 29, 2016,May 5, 2017, a copy of which has been filed as an exhibit to this Annual Report.
D&M, a Delaware corporation with offices in Dallas, Houston, Calgary, Moscow and Algiers, has been providing consulting services to the oil and gas industry for more than 75 years. The firm has more than 150 professionals, including engineers, geologists, geophysicists, petro physicists and economists that are engaged in the appraisal of oil and gas properties, the evaluation of hydrocarbon and other mineral prospects, basin evaluations, comprehensive field studies and equity studies related to the domestic and international energy industry. D&M restricts its activities exclusively to consultation and does not accept contingency fees, nor does its own operating interests in any oil, gas or mineral properties, or securities or notes of its clients. The firm subscribes to a code of professional conduct, and its employees actively support their related technical and professional societies. The firm is a Texas Registered Engineering Firm.
Thomas C. Pence, Senior Vice President with D&M was responsible for the preparation of the D&M Reserves Report. Mr. Pence studied at the Texas A&M University and graduated as a Bachelor of Science in Petroleum Engineering in the year 1982. He is a registered professional engineer in the State of Texas and a member of the International Society of Petroleum Engineers. He has more than 3234 years of experience in oil and gas reservoir studies and reserves evaluations.
The D&M Reserves Report covered 100% of our total proved reserves. In connection with the preparation of the D&M Reserves Report, D&M prepared its own estimates of our proved reserves. In the process of the reserves evaluation, D&M did not independently verify the accuracy and completeness of information and data furnished by usCairn India with respect to ownership interests, oil and gas production, well test data, historical costs of operation and development, product prices, or any agreements relating to current and future operations of the fields and sales of production. However, if in the course of the examination something came to the attention of D&M that brought into question the validity or sufficiency of any such information or data, D&M did not rely on such information or data until it had satisfactorily resolved its questions relating thereto or had independently verified such information or data. D&M independently prepared reserves estimates to conform to the guidelines of the SEC, including the criteria of “reasonable certainty,” as it pertains to expectations about the recoverability of reserves in future years, under existing economic and operating conditions, consistent with the definition in Rule4-10(a) of RegulationS-X. D&M issued the D&M Reserves Report based upon its evaluation. D&M’s primary economic assumptions in estimates included oil and gas sales prices determined according to SEC guidelines, future expenditures and other economic assumptions (including interests, royalties and taxes) as provided by us.Cairn India. The assumptions, data, methods and procedures used, including the percentage of our total reserves reviewed in connection with the preparation of the D&M Reserves Report were appropriate for the purpose served by such report, and D&M used all methods and procedures as it considered necessary under the circumstances to prepare such reports.
However, uncertainties are inherent in estimating quantities of reserves, including many factors beyond our and our independent reserves engineers’ control. Reserves engineering is a subjective process of estimating subsurface accumulations of oil and natural gas that cannot be measured in an exact manner, and the accuracy of any reserves estimate is a function of the quality of available data and its interpretation. As a result, estimates by different engineers often vary, sometimes significantly. In addition, physical factors such as the results of drilling, testing and production subsequent to the date of an estimate, economic factors such as changes in product prices or development and production expenses, and regulatory factors, such as royalties, development and environmental permitting and concession terms, may require revision of such estimates. OurCairn India’s operations may also be affected by unanticipated changes in regulations concerning the oil and gas industry in the countries in which we operate,Cairn India operates, which may impact our ability to recover the estimated reserves. Accordingly, oil and natural gas quantities ultimately recovered will vary from reserves estimates.
Oil and gas production, production prices and production costs
The following tables set forth our production of crude oil and natural gas on entitlement interest basis, by geographic area for the years ended March 31, 2017, 2016 2015 and 2014:2015:
Hydrocarbon production by geographic area
| For the year ended March 31, | ||||||||||||||||||||||||||||||||||||
| 2014 | 2015 | 2016 | ||||||||||||||||||||||||||||||||||
| Crude Oil (mmbbls) | Natural Gas (mmscfd) | Total (mmboe) | Crude Oil (mmbbls) | Natural Gas(1) (mmscfd) | Total (mmboe) | Crude Oil (mmbbls) | Natural Gas(1) (mmscfd) | Total (mmboe) | ||||||||||||||||||||||||||||
India(2) | 32.24 | 3.89 | 32.89 | 31.42 | 3.51 | 32.01 | 32.61 | 4.32 | 33.33 | |||||||||||||||||||||||||||
Mangala(3) | 23.89 | — | 23.89 | 19.89 | — | 19.89 | 21.63 | — | 21.63 | |||||||||||||||||||||||||||
Others | 8.35 | 3.89 | 9.00 | 11.53 | 3.51 | 12.12 | 10.98 | 4.32 | 11.70 | |||||||||||||||||||||||||||
Sri Lanka(4) | — | — | — | — | — | — | — | — | — | |||||||||||||||||||||||||||
South Africa(5) | — | — | — | — | — | — | — | — | — | |||||||||||||||||||||||||||
|
|
|
|
|
|
|
|
|
|
|
|
|
|
|
|
|
| |||||||||||||||||||
Total | 32.24 | 3.89 | 32.89 | 31.42 | 3.51 | 32.01 | 32.61 | 4.32 | 33.33 | |||||||||||||||||||||||||||
|
|
|
|
|
|
|
|
|
|
|
|
|
|
|
|
|
| |||||||||||||||||||
India(2) Mangala(3) Others Sri Lanka(4) South Africa(5) Total For the year ended March 31, 2015 2016 2017 Crude Oil
(mmbbls) Natural Gas(1)
(bcf) Total
(mmboe) Crude Oil
(mmbbls) Natural Gas(1)
(bcf) Total
(mmboe) Crude Oil
(mmbbls) Natural Gas(1)
(bcf) Total
(mmboe) 31.42 3.51 32.01 32.61 4.32 33.33 28.07 2.96 28.56 19.89 — 19.89 21.63 — 21.63 20.29 — 20.29 11.53 3.51 12.12 10.98 4.32 11.70 7.78 2.96 8.27 — — — — — — — — — — — — — — — — — — 31.42 3.51 32.01 32.61 4.32 33.33 28.07 2.96 28.56
Notes:
| (1) | Natural gas production figures are the production volumes of natural gas available for sale, excluding flared andre-injected gas and gas consumed in operations. |
| (2) | For the computation of EI production, Ravva royalty fees have not been netted off. |
| (3) | Mangala field is separately included as it contains more than 15% of our total proved reserves. |
| (4) | The Sri Lanka Block |
| (5) |
The following table sets forth our average sales prices by geographic area andby-product type for the last three years:
| India (US $) | ||||
During the year ended March 31, | ||||
Average sale prices | ||||
Oil, (per barrel) | ||||
Natural gas, (per mscf) | ||||
| ||||
| ||||
| ||||
| 6.4 | |||
During the year ended March 31, 2016 | ||||
Average sale prices | ||||
Oil, (barrel) | 40.8 | |||
Natural gas, (mscf) | 7.1 | |||
During the year ended March 31, 2017 | ||||
Average sale prices | ||||
Oil, (barrel) | 43.3 | |||
Natural gas, (mscf) | 7.7 | |||
The following table sets forth our average production costs by geographic area for the last three years:
| For the Year Ended March 31, | For the Year Ended March 31, | |||||||||||||||||||||||||||||||
| Unit of Measurement | 2014 | 2015 | 2016 | Unit of Measurement | 2015 | 2016 | 2017 | |||||||||||||||||||||||||
India | ||||||||||||||||||||||||||||||||
Oil and gas | ($ per boe) | 20.9 | 22.9 | 21.8 | ($ per boe) | 22.9 | 21.8 | 20.4 | ||||||||||||||||||||||||
The cost of production for oil and gas business consists of:
Drilling and other exploratory and development activities
The following table sets forth the number of net productive and dry exploratory and development wells drilled for the last three fiscal years. For more information about ouron-going exploration and production activities, see “Information on the Company –— Business Overview - Overview—Our Business –— Our Oil and Gas Business-Business — Principal Facilities”.
Net Productive and Dry Exploratory and Development Wells
| 2014 | 2015 | 2016 | 2015 | 2016 | 2017 | |||||||||||||||||||
Net productive exploratory wells drilled | ||||||||||||||||||||||||
India | 12.5 | 28.2 | — | 28.2 | — | — | ||||||||||||||||||
Sri Lanka | — | — | — | — | — | — | ||||||||||||||||||
South Africa | — | — | — | — | — | — | ||||||||||||||||||
|
|
|
|
|
| |||||||||||||||||||
Total productive exploratory wells drilled | 12.5 | 28.2 | — | 28.2 | — | — | ||||||||||||||||||
Net dry exploratory wells drilled: | ||||||||||||||||||||||||
India | 3.0 | 6.7 | — | 6.7 | — | 0.4 | ||||||||||||||||||
Sri Lanka | — | — | — | — | — | — | ||||||||||||||||||
South Africa | — | — | — | — | — | — | ||||||||||||||||||
|
|
|
|
|
| |||||||||||||||||||
Total dry exploratory wells drilled | 3.0 | 6.7 | — | 6.7 | — | 0.4 | ||||||||||||||||||
Total number of net wells drilled | 15.5 | 34.9 | — | 34.9 | — | 0.4 | ||||||||||||||||||
Net productive development wells drilled: | ||||||||||||||||||||||||
India | 82.1 | 56.9 | 20.3 | 56.9 | 20.3 | — | ||||||||||||||||||
Sri Lanka | — | — | — | — | — | — | ||||||||||||||||||
South Africa | — | — | — | — | — | — | ||||||||||||||||||
|
|
|
|
|
| |||||||||||||||||||
Total productive development wells drilled | 82.1 | 56.9 | 20.3 | 56.9 | 20.3 | — | ||||||||||||||||||
Net dry development wells drilled: | ||||||||||||||||||||||||
India | — | 0.7 | — | 0.7 | — | — | ||||||||||||||||||
Sri Lanka | — | — | — | — | — | — | ||||||||||||||||||
South Africa | — | — | — | — | — | — | ||||||||||||||||||
Total dry development wells drilled | — | 0.7 | — | 0.7 | — | — | ||||||||||||||||||
|
|
|
|
|
| |||||||||||||||||||
Total number of net wells drilled | 82.1 | 57.6 | 20.3 | 57.6 | 20.3 | — | ||||||||||||||||||
Present activities
The following table summarizes the number of wells in the process of being drilled as of March 31, 2016.2017.
Number of Wells Being Drilled as of March 31, 20162017
| ||||||||
| ||||||||
| ||||||||
| ||||||||
| Gross | Net | |||||||
Wells drilling | ||||||||
India | 2 | 0.7 | ||||||
South Africa | — | — | ||||||
|
|
|
| |||||
Total wells drilling | 2 | 0.7 | ||||||
|
|
|
| |||||
Oil and gas properties, wells, operations and acreage
OurCairn India’s blocks containing proved reserves have leases which currently expire in May 14, 2020 for Rajasthan block, October 27, 2019 for Ravva block and June 29, 2023 for Cambay block.
The following tables show the number of gross and net productive oil and natural gas wells and total gross and net developed and undeveloped oil and natural gas acreage in which Cairn India had interests as of March 31, 2016.2017.
Gross and Net Productive Wells and Gross and Net Developed and Undeveloped Acreage
| As of March 31, 2016 | As of March 31, 2017 | |||||||||||||||||||||||||||||||
| Oil | Natural gas | Oil | Natural gas | |||||||||||||||||||||||||||||
| Gross | Net | Gross | Net | Gross | Net | Gross | Net | |||||||||||||||||||||||||
Gross and net productive wells(1) | ||||||||||||||||||||||||||||||||
India | 406.00 | 272.40 | 29.00 | 19.83 | 429.00 | 297.58 | 46.00 | 32.63 | ||||||||||||||||||||||||
South Africa | — | — | — | — | — | — | — | — | ||||||||||||||||||||||||
|
|
|
|
|
|
|
| |||||||||||||||||||||||||
Total gross and net productive wells | 406.00 | 272.40 | 29.00 | 19.83 | 429.00 | 297.58 | 46.00 | 32.63 | ||||||||||||||||||||||||
|
|
|
|
|
|
|
| |||||||||||||||||||||||||
| As of March 31, 2016 | As of March 31, 2017 | |||||||||||||||
| Gross (acres) | Net (acres) | Gross (acres) | Net (acres) | |||||||||||||
Gross and net developed acreage(2) | ||||||||||||||||
India | 33,051 | 15,152 | 33,051 | 15,152 | ||||||||||||
South Africa | — | — | — | — | ||||||||||||
|
|
|
| |||||||||||||
Total gross and net developed acreage | 33,051 | 15,152 | 33,051 | 15,152 | ||||||||||||
|
|
|
| |||||||||||||
| As of March 31, 2016 | As of March 31, 2017 | |||||||||||||||
| Gross (acres) | Net (acres) | Gross (acres) | Net (acres) | |||||||||||||
Gross and net undeveloped acreage(3) | ||||||||||||||||
India | 4,496,227 | 2,637,352 | 4,496,227 | 2,637,352 | ||||||||||||
South Africa | 4,916,826 | 2,950,096 | 4,916,826 | 2,950,096 | ||||||||||||
|
|
|
| |||||||||||||
Total gross and net undeveloped acreage | 9,413,053 | 5,587,448 | 9,413,053 | 5,587,448 | ||||||||||||
|
|
|
| |||||||||||||
Notes:
| (1) | A gross well or acre is a well or acre in which a working interest is owned, while a net well or acre is deemed to exist when the sum of fractional ownership working interests in gross wells or acres equals one. |
| (2) | Developed acreage is acreage assignable to productive wells; productive wells include producing wells and wells mechanically capable of producing. |
| (3) | Undeveloped acreage encompasses those leased acres on which wells have not been drilled or completed to a point that would permit the production of economic quantities of oil or gas regardless of whether such acreage contains proved reserves. Users of this information should not confuse undeveloped acreage with undrilled acreage held by production under the terms of the lease. |
Cairn India’s lease holdings comprises of sevensix blocks in India of which the largest is the Palar-Pennar block in terms of acreage which accounts for approximately 51% of the total acreage. Rajasthan block, being the second largest block constitutes approximately 17% of the total acreage. WeCairn India also havehas one block in South Africa.
Delivery Commitments
Crude Oil
We sellCairn India sells crude oil from ourits various operating fields under production, under a variety of contractual obligations. Prior to start of every fiscal year under the various production sharing contracts between Cairn India and GoI, GoI nominates volumes that would beup-lifted by its nominee refinery based upon the expected production from the field during the year. We areCairn India is free totie-up with other domestic refineries for the surplus available volume that is not nominated by GoI.
For fiscal year 2017,2018, GoI has nominated approximately 3752 kbopd (participating interest) of crude oil from various producing fields. We haveCairn India has reasonable endeavor crude oil sales agreements and there is no minimum committed quantity thus, resulting in no financial implication.
Natural Gas
For Rajasthan block, GoI has allocated 10.4allocates gas to consumers from time to time. The delivery commitments for Cairn India’s share of gas sales (participating interest) for the month of August 2017 is approximately 5.4 mmscf per day (participating interest) of gas to consumers. The delivery commitments arewhich is based on estimated gas production from ourthe fields.
For Cambay block, as on July 15, 2016, our28, 2017, Cairn India’s share of gas sales commitment (participating interest) is approximately 2.32.9 mmscf per day for the month of July 2016.August 2017. For Ravva block, there is no annual commitment for gas sales for the fiscal year 2017.2018.
We believe ourCairn India believes its domestic proved reserves will be sufficient to deliver the above mentioned contracted volumes. In case the actual delivered gas quantity does not meet allocated/committed gas quantity, then the financial implications are a discount of up to a maximum of 20% on the gas price offered to buyers based on the provisions of the respective gas sales agreement.
Distribution, logisticsLogistics and transportTransport
Rajasthan
The Mangala processing terminal has been designed as a centralized hub facility to handle crude oil production from the fields in the Rajasthan block that have been discovered by us.Cairn India. Once crude oil reaches the Mangala processing terminal, generally via the pipeline, it is processed and transported to public-sector customers or private refineries that have purchased it. See “— Facilities – Mangala Processing Terminal” for more details.
Cambay
The82-acre onshore processing facility at Suvali, processes natural gas and crude oil from the Lakshmi and Gauri fields. It has a capacity to process 150 mmscfd of natural gas and 10 kbopd of crude oil and includes a three stage separator oil processing train, four storage tanks of combined capacity of 37,700 bbls as well as 4.8 MW captive power generation capacity. The processing plant and offshore infrastructure are certified to ISO 14001 and OHSAS 18001 standards.
The crude oil produced from Suvali Onshore Terminal is transported via truck tankers approximately 15 km to Adani Hazira Port Private Limited. Thereafter, the crude cargo is sold to coastal refineries via sea tankers.
The processed natural gas is sold through the Gujarat State Petronet Limited pipeline facility to CLP India Private Limited and Gujarat Gas Corporation Limited.
Ravva
Currently, there are eight unmanned offshore platforms and a 225 acre225-acre onshore processing facility at Surasaniyanam for processing the natural gas and crude oil produced from the offshore field. The Ravva onshore terminal operates as per the internationally recognized environmental standard (ISO 14001) and the occupational health and safety standard (OHSAS18001). Onshore facility has the capacity to handle 70kbopd of crude oil, 95 mmscfd of natural gas and 110,000 bbls of water injection per day. The terminal also has the capacity to store 1.0 mmbbls of crude oil.
The crude produced from the wells in the Ravva block is sent to the onshore processing terminal via subsea pipelines. The oil is processed and stored in the storage tanks at the terminal. Thereafter, the crude oil is transported to local refineries (nominated by GoI) via 20 inch export line (approximately 16 km long) from the terminal to a ship tanker, which is moored to the single point mooring buoy located in the field. The single point mooring buoy and associated equipment are together termed as tanker mooring and loading facility.
Natural gas from the wells after treatment is transported to buyer’s (GAIL) pipeline.
Market share and competitionCompetition
The oil and gas exploration and production industry in India is competitive. In seekingAcreages to obtain desirable explorationexplore and development prospects, we faceexploit hydrocarbon resources are put up for bidding by the MoPNG, for Cairn India faces competition from Indian companies, including ONGC and Reliance Industries Limited, and major integrated and large independent multinational companies. The GoI has launched special bid rounds for small discoveries, thereby further enhancing competition to acquire acreage. The GoI has a major stake in ONGC, which has been awarded the majority of the exploration blocks offered by the GoI in the nine NELP licensing rounds held so far. Many of these competitors have access to financial or other resources substantially in excess of those available to usCairn India and accordingly may be better positioned to acquire and exploit prospects, hire personnel and market production. In addition, many of our competitors may be better able to withstand the effect of external changes in industry conditions such as worldwide crude oil and natural gas prices and levels of supply and the application of government regulations, which affect our business and which are beyond our control.
We are
Cairn India is a significant contributor to India’s domestic crude oil production, operating approximately 27%26% as derived from the Ministry of Petroleum and Natural Gas statistics of March 2016.2017.
Seasonality
Our oil and gas business is not subject to seasonality as demand for oil and gas is consistent throughout the year.
Our Iron Ore Business
Overview
Our iron ore business is carried out in the states of Goa and Karnataka. Our iron ore business includes exploration, mining and processing of iron ore. In fiscal year 2016,2017, we produced approximately 5.210.90 million dmt of saleable iron ore fines and lumps. The sales for fiscal year 20162017 were at 5.310.1 million dmt (including sales of ore purchased through ane-auction of the ore confiscated by the government prior to the suspension) as compared to sales of 1.25.2 million dmt in fiscal year 2015.2016.
We currently operate a metallurgical coke plant with an installed rated capacity of 560,000522,000 tpa and a pig iron plant with a rated capacity of 742,000832,000 tpa. We manufacture pig iron through the blast furnace route. We have a patent for the technology for the manufacture of energy recovery based metallurgical coke.
Ore from our mine at Karnataka was exported mainly through the ports at Goa and Mangalore. However, since the ban on exports imposed by the Government of Karnataka in July 2010, we sellIn August 2011, the iron ore produced at our Karnataka mine only to domestic Indian customers. On August 26, 2011, the Supreme Court of India passed an order temporarily suspending the mining activities relating to iron ore in the Chitradurga and Tumkur districts of Karnataka due to alleged environmental violations by miners. In view of this order, our activities at this mine were stopped with immediate effect. On April 18, 2013, this suspension was liftedtemporarily suspended by the Supreme Court of India due to alleged environmental violations. The suspension was subsequently lifted in April 2013 and operations were resumed onin December 29, 2013 after obtaining the necessary statutory clearances. Although we resumed operations in Karnataka after receiving the stage I forest clearance from the state government of Karnataka and a temporary working permission from the MoEF, the temporary working permission expired on July 31, 2014. Karnataka operations were suspended for the period from August 1, 2014 to February 27, 2015. From February 28, 2015, the operations in Karnataka were resumed after all statutory clearances are in place.
In September 2012 and October 2012, each of the state government of Goa andfiscal year 2016, the Supreme Court of India ordered the suspension of all mining operations and transportation of iron ore of the mines in the State of Goa due to alleged environmental violations by miners. In view of the foregoing, operations at our mines in Goa were suspended. On April 21, 2014, the Supreme Court of India lifted the mining suspension with certain conditions. The Supreme Court also imposed an interim restriction on the maximum annual excavation from the mining leases in the Statestate of Goa to 20 million tons subject to determination of final capacity by an expert committee appointed by the Court. Further, in its order, the Court held that all mining leases in the State of Goa including ours expired in 2007. Consequently,2007, and no mining operations can bewere carried out until the renewal or execution of mining lease deeds by the state government of Goa. Post such order of the Supreme Court of India, in August 2014, when the High Court of Bombay at Goa pronounced an order to renew mining leases in Goa. The MoEF and the state government have also revoked their suspension orders subject to limits imposed by the Supreme Court of India. Registration of mining leases in Goa has beenwas completed and the Goa State Pollution Control Board in their meeting on July 10, 2015 has considered renewal of consent to operate under the Air (Prevention and Control of Pollution) Act, 1981 and Water (Prevention and Control of Pollution) Act. Further, we filed applications for the approval of mining plans.Act, 1974. On August 10, 2015, operations at the Codli mine resumed and operations at the remaining mines are resumed one after another from the second half of fiscal year 2016 after receiving the consent to operate and the approval of our mining plans.
We filed applications for consents to resume mine operations. We have received permission to operate for all our principal mines and for five of the mines certain formalities to resume operations have yet to be completed. Our mining operations resumed in six mines, the first such mine at Codli in August 2015. There are a number of mines where we have received all the required permissions, however operations at these mines are yet to start.plan applications.
On August 22, 2011, we acquired a 51.0% ownership interest in WCL, a Liberian iron ore exploration company which was a wholly-owned subsidiary of Elenilto Minerals & Mining LLC, for a cash consideration of $ 90.0 million. On December 20, 2012, we acquired the remaining 49.0% of the outstanding common shares of WCL from Elenilto Minerals & Mining LLC for a cash consideration of $ 33.5 million. Due to the outbreak of ebola in Liberia, our project was temporarily suspended as our staff had to be evacuated. Since then, iron ore prices have significantly fallen, due to which it was not viable to resume operations. We are in discussions with the government to extend the Mineral Development Agreement (“MDA”) dates to make this project more sustainable.
In consideration of the suspension of exploration in Liberia, low iron ore prices, geo-political factors and no plans for any substantive expenditure has resulted in continued uncertainty in the project, an impairment charge of $ 227.6 million has been recognized.
Further, an impairment charge of Rs 1,153 million ($17.4 million) was recorded in fiscal year 2016, towards unused plant and machinery at Bellary, Karnataka.
On March 1, 2012, Sesa Goa acquired 100% of the total outstanding share capital of Goa Energy Private Limited which is engaged in the business of power generation from Videocon Industries at a consideration of $ 9.5 million. The company was renamed Goa Energy Limited (“GEL”) since September 2012. GEL subsequently merged with Vedanta Limited, on March 24, 2015 with the merger being effective from April, 2014. This merger will help in creating synergies in the operations of power segment. GEL owns a 30 MW waste heat recovery power plant in Goa which generates power from the waste gases of our metallurgical coke plant and blast furnace.
A number of initiatives were earlier undertaken to expand our mining and logistical capacity at our mines at Goa and Karnataka to 36 mmt, but these initiatives have been scaled back and are currently on hold due to regulatory issues and capping of production limits across the state. We have also made substantial progress on our logistics capacity, with a new railway siding already commissioned in Karnataka and progress made on widening of the existing roads and building dedicated road corridors in both Karnataka and Goa. We have also added capacity in river and port logistics, and now have a fleet of 33 barges and 2 transhippers and 1 floating crane station as on date. We are exploring the possibility to build conveyor from our mining site to the nearest Badru Bomahalli (BBH) railway siding (4.5 kms distance) to decongest road transportation.
In October 2015 we proposed to the state government of Jharkhand to set up a 1 mtpa pig iron plant in Jharkhand, for Dhobil mining lease. On May 6, 2016 Stage-I,stage-I, a Memorandum of Understanding (“MOU”) was signed between the state government of Jharkhand and Vedanta Limited to set up a 1 mtpa hot metal plant. The exploration drilling commenced on May 19, 2017. After successfully completing the activities under the stage-I MOU, which included selecting the plant with a facility to produce 0.7 mtpa pig iron and 0.3 mtpa ductile iron pipe plant in Kharswan/Manoharpur. This MOU will support an application to the state government of Jharkhand for the grant of the Dhobil mining lease. The MOU will be valid for one year within which we will have to complete the site, selection for plant, identification of source ofidentifying water, power and raw material sources and preparepreparing a detailed project report, (DPR), so as to proceed to Stage-II MOU signing.
Strategy
We intend to leverage our positionwe are in the iron ore sector onprocess of signing the basis of the following strengths:stage II MOU.
Principal productsProducts
Iron ore
Our iron ore reserves consist of both lump and fine ore. As of March 31, 2016,2017, the percentage of lump ore in the reserves was approximately 12.0% and 18.0% in Goa and Karnataka, respectively. While the ore in Goa contains an average iron content deposit of 50.0% to 55.0%, the mines in Karnataka are of higher grade deposits, ranging between 56.0% to 60.0% iron. We sell lump ore from our mines in Karnataka primarily to domestic pig iron or steel producers. The majority of other iron ore produced by GoarGoan mines is sold internationally, primarily to purchasers in China.
Pig iron
We produce basic, foundry and nodular grade pig iron in various grades for steel mills and foundries.
Metallurgical coke
We also produce metallurgical coke, which is primarily consumed in India.
Principal facilitiesFacilities
Overview
The following map shows details of the locations of our iron ore business in India and around the world:
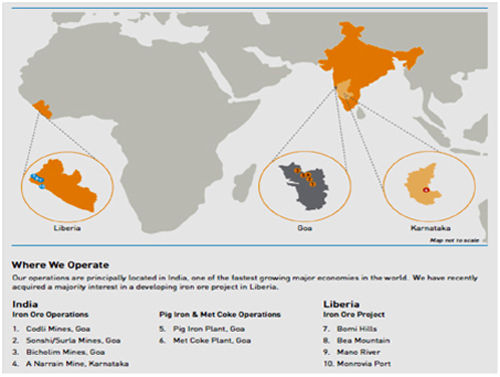
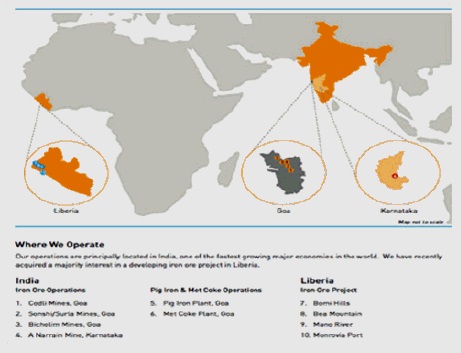
Mines
Goa mines
Our iron ore operations in Goa consist of four major iron ore mines, namely Codli, Sonshi, Bicholim and Surla. In addition, we derive ore production from several satellite mines in North Goa. Our Goa leases were originally granted as mining concessions by the government during the Portuguese regime from 1955 onwards, and in 1987 these concessions were converted to mining leases. Before suspension of operations were suspended in September 2012, we operated a total of twenty one mining leases in Goa representing an area of approximately 1,695 hectares (includes one third-party lease on contract, representing an area of approximately 62 hectares).
We carry out exploration in grid patterns of 100 meters by 100 meters at the initial stage of exploration, followed by grid patterns of 50 meters by 50 meters. Core samples are analyzed and used to interpret the ore body for the preparation of geological cross sections and the classification of the ore as either crude ore,sub-grade ore or sub-grade ore.mineral reject. Drill core sampling is undertaken on entire holes and the drill core material is sampled at the sample preparation facilities.
The gross value of fixed assets for our Goa operations, including capitalworks-in-progress, was Rs. 106,76548,254 million ($1,611.5744.1 million) as of March 31, 2016.2017.
(i) Codli mines:
The Codli group of mines is situated in south of Goa, approximately 600 kmkms south of Mumbai and 50 kmkms east of Panaji, the capital of Goa. It is anopen-pit operation and the nearest railway stations, SanvordemCurchorem and Margao, are approximately 13 km15 kms and 40 km,kms, respectively, from the mine. There is an airport 55 kmkms from the mine at Dabolim. The river loading points at Sanvordem (Capxem) and CapxemCurchorem are approximately 12 kmkms and 14 km,kms, respectively, from the Codli mines while the port is approximately 40 nautical miles from the river loading point.
The Codli mines cover an area of approximately 340 hectares and are operated under the terms and conditions stipulated in four contiguous leases, three of which are owned by us with the remaining lease being owned by a third-party. We own an additional two mining leases to the northwest of the current Codli mine operations where exploration is being undertaken.
Exploration at the Codli mines began in 1966 and the mine first commenced production in 1973. Production at the mine reached 3 mmtpa by 1995. This mine has been granted environmental clearance for a production level of 7 mmtpa.
At the Codli mines, the lower grade iron formation is folded and subsequently eroded into basinal areas amenable toopen-pit mining. Economically mineable material occurs over an area of about 3.1 kmkms by 1.6 kmkms and is located between 84 meters above sea level and 50 meters below sea level. The formations show a general northwest-southeast trend with shallow to moderate dips towards the northeast with local reversals. The footwall is comprised of manganiferous clay and decomposed quartzites and the stratigraphy of the ore body is cross cut by latealtered dolerite dykes and sills which are manifested by pink clayey zones in the mine area.
The Codli mines aremulti-pit, multi-lease fully mechanized mining units. The open-pits have a bench height of 7 meters, haulage roads of 25 meters width and an overall pit slope of 26 degrees. The Codli mines have 14 basins, of which 5 pits have been exhausted. The lateritic overburden is removed either by ripping or dozing, and loaded by excavators and/or wheel loaders into heavy earth moving machinery such as rigid dumpers and articulated dumpers. Hauling within the mine is also done by rigid and articulated dumpers. An ore stockpile is maintained at all times to continuously feed the processing plants.
We have extensive ore processing facilities for upgrading the ore, which include crushing, dry screening, scrubbing, log washing, classifying, hydrocycloning, and magnetic separation with a wet high- intensity magnetic separator. The four Codli processing plants are between 1 and 18 years old and throughput capacity of the four Codli processing plants is 10 mmtpa. The processed ore is transported by road to a riverhead jetty by 10 ton tipper trucks and then further transported by barges to the Goa ports or transhipper for onward shipment. One plant is provided with a dry circuit to process high grade ore, while the remaining four wet plants process low grade ores. The Codli processing plants undergo regular maintenance and annual repairs are conducted during the monsoon season.
As of March 31, 20162017 we have undertaken an exploration and evaluation program at the Codli mines which involved drilling a total of 78,082 meters in depth in 1,156 holes. The Codli mine deposits are extensively sampled in vertical drill hole grids between 8 meters and 127 meters in length.sampled.
Power at the Codli mines is supplied through a government grid supply network with a maximum contracted demand of 5,000 kVA. There are also generator sets with an aggregate of 5,190 kVA available to supply power. The site’s full water requirements are met from the rainwater accumulated in exhausted pits. In fiscal year 2016, 2.92017, 3.82 million wmt of crude ore was produced from the Codli mines since the recommencement of operations at the mines in August 2015 after its temporary suspension of mining activities relating to iron ore imposed by the state government.mines.
The economiccut-off grade at the Codli mines is determined by the requirement to meet various sales contracts. We operate on a 50.0% iron operationalcut-off grade in practice, as compared to the statutorycut-off grade of 45.0% iron. Ore containing 45.045.0% to 50.0% iron is preserved for future use and ore containing 50.050.0% to 54.0% iron is beneficiated in order to make it saleable.
The reserves at the Codli mines in the proved reserve category are defined by drill holes spaced at 50 meter intervals, the probable reserves are generally defined by drill holes spaced at a further 50 meter interval from the proved reserves. Possible reserves are generally defined by drill holes spaced at a further 50 meter to 75 meter interval from the probable reserves. As the area is drilled at approximately 50 meter by 50 meter grids, the physical continuity of the ore is well demonstrated.
We operate the Gauthona Dusrifal mine, the lease of which is held by M/s Timblo Private Limited, as an ore raising contractor since 1989. This mining concession was granted in 1958 to M/s Timblo Private Limited, which owned and operated the mine until 1988. Since 1983, we had a common boundary working agreement with M/s Timblo Private Limited and, in 1989, we acquired control of 40.8 hectares of the leasehold area. This mine is contiguous to the Codli mines. The mining method at the Gauthona Dusrifal mine is the same as that of the Codli mines described above. During the fiscal years 20152016 and 2016,2017, there was no ore production from the Gauthona E Dusrifal mine due to the temporary suspension of mining activities relating to iron ore imposed by the state government.mine.
(ii) Sonshi mine
The Sonshi mine is situated in the north of Goa, approximately 34 kmkms from Panaji and approximately 40 kmkms north of the Codli mines. It comprises anopen-pit mine. The area is well connected by metalled roads and the nearest railway station is at Tivim, approximately 25 kmkms from the Sonshi mine. The river loading point, Amona, is nine km from the site and the port is approximately 35 nautical miles from the river loading point. The airport is approximately 50 kmkms from the Sonshi mine.
The leasehold area of the Sonshi mine is 62 hectares. The leaseholder has submitted timely renewal applications to the state government and no rejections have been notified. The Sonshi mine was operating under deemed consent until the temporary suspension of mining activities relating to iron ore by the state government of Goa. Due to the narrow width of the leasehold area, we have entered into common boundary working agreements with adjoining lessees to facilitate mining operations. The original mining concession was granted in 1953 to Cosme Costa & Sons. We have not acquired the lease, but have been operating the Sonshi mine as an ore raising contractor since 1958. Production at the mine commenced in 1958. The agreements entered into by us with Cosme Costa & Sons for the raising and sale of iron ore expired in March 2014 and washas been renewed until November 2017.March 31, 2018. The Sonshi mine has been granted environmental clearance for a production level of 3.0 mmtpa.
The area surrounding the Sonshi mine is covered with laterite capping underlain by lumpy ore zone. The ore deposit at the Sonshi mine forms the northern limb of the northwest-southeast trending syncline. The formations dip 50 degrees to 60 degrees northeast. The principal deposit of the Sonshi mine comprises three distinct ore bodies that are folded into a syncline. The youngest ore body has a width of 50 meters, while the other ore bodies dip steeply to the northeast and have widths of approximately 20 meters to 25 meters. The intervening parting between the ore bodies comprised 50 meters of manganiferous clay and a 30 meter wide limonitic zone separating one ore body from the footwall phyllite. The depth extent of these bands has been outlined with deep drilling. Hematite is the major economic mineral in each of the bands.
Theopen-pit mining operations at the Sonshi mine are fully mechanized. The hard laterite capping is loosened either by drilling, blasting or ripping/dozing. The softsub-lateritic zone is excavated and transported to respective laterite, clay and ore stacks. The material is then reloaded into smaller10-ton trucks and transported to the plants for processing and beneficiation, which involves crushing, scrubbing, log washing, classifying, double stage cycloning and thickening. The waste is transported to a dump stockpile six to seven km away. Processing operations for the Sonshi mine are similar to those of the Codli mines described above. The processed ore is transported to the Amona jetty, loaded in barges and sent to Mormugao port approximately 35 nautical miles away.
There is no processing planton-site. The extracted ore is transported by a fleet of contractors with10-ton trucks to the processing plants at Amona (approximately nine km9 kms away), the Surla Mine beneficiation plant (approximately 4 kms away) and at Cudnem (approximately six km6 kms away). The combined throughput capacity of the processing plants is 7.98.4 mmtpa. The plants undergo regular maintenance and annual repairs are carried out during the monsoon season.
No exploration activity was carried out in the mine during fiscal year 2015 due to temporary suspension of mining activities relating to iron ore imposed by the state government.2017. The Sonshi mine has been sampled in vertical and inclined drill holes with a total of 66,766 meters being drilled in 644 holes as of March 31, 20162017.
Power at the mine is supplied through a government grid supply network and the maximum contracted demand is 1,000 KVA. A 625 KVA diesel generator is also available to supply power. In fiscal year 2016, 0.22017, 1.42 million wmt of crude ore was produced from the Sonshi mine.
The economiccut-off grade at the Sonshi mine is determined by the requirement to meet various sales contracts and the need to maintain stockpiles to meet the contract. We operate on a 50.0% iron operationalcut-off grade in practice, as compared to the statutorycut-off grade of 45.0% iron. Ore containing 45.045.0% to 50.0% iron is preserved for future use and ore containing 50.0% to 54.0% iron is beneficiated in order to make it saleable.
We acquired an adjoining mining lease for the Mareta Sodo mine in 2004 from Pandurang Timblo Industries. This mining concession was granted in 1955 and was operated intermittently until the mine was transferred to us in November 2004. This mine has been granted environmental clearance by the MoEF for production of 1 mmtpa. As of March 31, 2016,2017, 17,702 meters have been drilled in 112 boreholes on the leased area. The mining method of the Mareta Sodo mine is the same as that of the Sonshi mine described above. Due to allegations of illegal mining in the Statestate of Goa, the state government of Goa banned mining operations within the state in September 2012, and the MoEF also suspended environmental clearances within the state. In January 2015, the state government of Goa revoked the mining suspension order, and in March 2015 MOEFMoEF has likewise revoked the suspension of environmental clearances. Subsequently, the lease deeds were executed and registered as of August 2015 to resume production for all working leases, including the mining lease for the Mareta Sodo mine. In fiscal year 2016, 0.132017, 0.5 million wmt crude ore was produced from this mine.
(iii) Sesa Resources Limited, Bicholim and Surla:
Sesa Resources Limited and its subsidiary Sesa Mining Corporation Private Limited extract iron ore from 11 mining leases spread across a total of approximately 980 hectares in Goa. Sesa Resources Limited’s operations consist of two major iron ore mining areas, one in Bicholim and the other in Surla, both located in North Goa and which together account for approximately 90.0% of Sesa Resources Limited’s total estimated iron ore reserves as of March 31, 2016.2017. The Bicholim mine consists of five contiguous mining leases covering an area of 479.3 hectares in the north of Goa. The Surla mine consists of three contiguous mining leases covering an area of 253.4 hectares in the recognized iron ore belt of Pale-Velguem-Bicholim-Shirgao in the north of Goa. Mining operations started at the Bicholim mine and the Surla mine in 1958. Processed ore from the Bicholim and Surla mines is transported by Sesa Resources Limited to loading jetties at Sarmanas and Surla/Sinori in north of Goa, and then loaded into barges and sent to Mormugao port in Goa, India, where it is then shipped to customers. Sesa Resources Limited’s mining assets include processing plants, barges, jetties, transhippers and loading capacities at the Mormugao port. In fiscal year 2016,2017, the combined production of the Bicholim and Surla mines was 0.611.09 million wmt of crude ore since the recommencement of operations at the mines after temporary suspension of mining activities in August 2015, relating to iron ore imposed by the state government.ore.
(iv) Shipbuilding Division:
We also have a ship building division which commenced operations in 1984 for the construction and repair of inland mini bulk carriers owned by us as its primary activity as well as supporting our core activities including the export of iron ore and the import of coke and coal.
The facilities of the ship building division comprises a slipway, several sheds, cranes, a quayside with water depth of 3 meters, gas manifold system and docking equipment. The ship building division has designed and built various types of vessels such as barges, pusher tugboats, oil recovery vessels and landing crafts. The ship building division was the first to design and build hatch covers for barges in Goa for shipment of fines during the monsoon season. As of March 31, 2016,2017, the ship building division was certified ISO 9001-2000 Quality Management System in 2000, ISO 14001-2004 Environment Management System in 2004 and OHSAS 18001-2007 for Occupational Health Management System. This division has not produced any more ships during fiscal year 2016.2017.
(v) Other leases/mines
In addition to the Codli mines and right to the third-party mining lease at the Sonshi mine, we have 11 additional mining leases, of which 5five arenon-operative leases. The operative mines are the Sanquelim mines with three contiguous leases with an environmental clearance of 0.2 mmtpa, the Orasso Dongor mine of 0.2 mmtpa, the Botvadeacho Dongor mine of 0.5 mmtpa and the Mareta sodo mine of 11.0 mmtpa. Thenon-operative leases are under exploration and we are yet to receive clearances for these mines.
The economiccut-off grade at these other mines is determined by the requirement to meet various sales contracts and the need to maintain stockpiles to meet the contracts. We operate on a 50.0% iron operationalcut-off grade in practice, as compared to the statutorycut-off grade of 45.0% iron. Ore containing 45.0% to 50.0% iron is preserved for future use and ore containing 50.0% to 54.0% iron is beneficiated in order to make it saleable.
Karnataka
Our main operations in Karnataka are at the A. Narrain mine which is located approximately 200 kmkms northwest of Bangalore. Theopen-pit mine is operated by us and is well connected by rail, with the nearest stations, Sasalu and Amruthapura, and M/s Mineral Enterprises server by Chikkajajur (MMEC) railway siding located 16 km,kms, 17 kmkms and 4 kmkms respectively, from the A. Narrain mine. The nearest port at Mangalore is approximately 430 kmkms from the mine and the nearest airport is located at Bangalore, approximately 230 kmkms from the mine.
The leasehold area of the mine is 160.6 hectares, which is classified into two blocks, namely the south block, which is 123.5 hectares, and the north block, which is 37.1 hectares. These two blocks are joined by a narrow stretch of land 40approximately 30 meters in width and 660 meters in length along the eastern side of the leasehold area. We have operated the mine since 1994. The MoEF granted requisite permissionus environmental clearance for enhanced productions to us toproduction of 6.0 mmtpa in 2016.fiscal 2009. However, due to conditions introduced by the Supreme Court, the production capacity of the mine was reduced to 2.29 mmtpa.
We have applied to the Central Empowered Committee through Monitoring Committee for enhancement of itsto enhance production up to the environmental clearance limit.
The geological formation of this region belongs to the Archean-Proterozoic age. The geology of the A. Narrain mine consists of Archean formations locally termed “Dharwars” which contain rich and large iron ore deposits. The leasehold area forms part of the Chitradurga-Tumkur schist belt and part of a regional isoclinal fold. The strike direction of the ore body dips westerly at an angle of about 60 degrees to 70 degrees. Hematite is the principal ore mineral and limonite, goethite and magnetite constitute the associated minor minerals of the mine. The mineralized horizon extends over a length of about two km. The footwall comprised decomposed quartzite and phyllite, and the stratigraphy is cross cut by late dolerite dykes and sills which are manifested by pink clayey zones in the mine area.
Currently, the north and the south block of the A. Narrain mine have mechanized mining operations. Theopen-pit mines have a bench height of seven meters, haulage roads of 12 meters to 15 meters in width and an overall pit slope of less than 30 degrees. The A. Narrain mine is equipped with dry process facilities for processing all grades of ore.
The lateritic overburden is removed either by blasting or ripping/dozing, loaded onto and transported by 30-ton30 ton trucks. The ore mined is processed at the mine’s processing facilities, which involves crushing and dry screening processes. The processed ore is then transported by road to the railway yard, for onward transport to customers in Karnataka, Goa and other places. Ore produced in Karnataka ranges from 56.0% to 60.0% iron content and comprises 82.0% fines and 18.0% lumps.
The two processing plants at the A. Narrain mine have a combined capacity of 1,150 tons per hour.
Since the mine was taken over by us, exploration at the A. Narrain mine involved the drilling of a total of 59,025 meters in 605 boreholes as of March 31, 2016.2017. The A. Narrain deposit is extensively sampled in vertical and inclined drill hole grid intervals in side direction of 50 meters and in cross section average of 25 meters with most of the holes covering a depth of 50 meters to 200 meters. Power at the mine is supplied by a 725 KV and 320 KV generator. All power supplied to the mine and plant is through generators.
The gross value of fixed assets, including capitalworks-in-progress, was Rs. 24,820.513,160 million ($ 374.6202.9 million) as of March 31, 2016.2017.
On August 26, 2011, the Supreme Court of India passed an order suspending mining activities in the Chitradurga and Tumkur districts of Karnataka. In view of this order, our activities at this mine were stopped with immediate effect. On April 18, 2013, this suspension was lifted by the Court and in December 2013, the operations were resumed after getting necessary regulatory clearances. Although we resumed operations in Karnataka based on the stage I forest clearance from the state government of Karnataka and a temporary working permission from the MoEF, the temporary working permission expired on July 31, 2014. Karnataka operations were halted for the period from August 1, 2014 to February 27, 2015. We resumed our operations in Karnataka after all statutory clearances were in place from February 28, 2015. The economiccut-off grade at the A. Narrain mine is determined by the requirement to meet various sales contracts and the need to maintain stockpiles to meet the contract specifications.
The reserves in proved reserve category at the Karnataka mines are estimated based on drilled boreholes spaced at 50 meters along predefined section lines and occasionally off of the section lines, the probable reserves are estimated based on drilled boreholes spaced at 50 meters from the proved reserves and the possible reserves are estimated based on drilled boreholes spaced at 25 meters from the probable reserves. As the area is drilled at approximately 50 meter by 50 meter grids, the physical continuity of the ore is well demonstrated.
WCL
WCL comprises of three concession areas (Bomi Hills, Bea Mountain and Mano River). The ebola epidemic in Liberia resulted in stoppage of drilling and exploration work for iron ore during fiscal year 2015. We evacuated our staff in Liberia as a result of the ebola risk in 2015.
In consideration of the suspension of exploration in Liberia in fiscal year 2015 due to an ebola epidemic, low iron ore prices,geo-political factors and no plans for any substantive expenditure resulting in continued uncertainty in the project, an impairment charge of US$$ 227.6 million was recognized in fiscal year 2016. We are in discussions with the government of Liberia to extend the Mineral Development Agreement (MDA) dates to make this project more sustainable.
The table below sets out proved and probable iron ore reserves as of March 31, 20162017 at mines that we own or have rights to:
| Proved Reserves | Probable Reserves | Total Proved and Probable Reserves | ||||||||||||||||||||||
| Quantity | Iron Grade | Quantity | Iron Grade | Quantity | Iron Grade | |||||||||||||||||||
| (Million tons) | (%) | (Million tons) | (%) | (Million tons) | (%) | |||||||||||||||||||
Goa: | — | — | ||||||||||||||||||||||
Codli Group | 18.1 | 53.3 | 6.0 | 53.7 | 24.1 | 53.9 | ||||||||||||||||||
Sonshi Group | 16.3 | 59.6 | 21.4 | 59.2 | 37.7 | 59.4 | ||||||||||||||||||
Other | 7.7 | 55.3 | 11.7 | 56.4 | 19.4 | 55.9 | ||||||||||||||||||
Karnataka - A. Narrain | 19.1 | 56.1 | 20.3 | 56.2 | 39.4 | 56.1 | ||||||||||||||||||
Sesa Resources Limited | 42.0 | 52.1 | 30.9 | 55.0 | 73.0 | 53.4 | ||||||||||||||||||
(including Sesa Mining Corporation Limited) | ||||||||||||||||||||||||
|
|
|
|
|
|
|
|
|
|
|
| |||||||||||||
Total Iron ore reserves | 103.2 | 54.5 | 90.5 | 56.5 | 193.6 | 55.4 | ||||||||||||||||||
(Million tons) (Million tons) (Million tons) Goa: Codli Group Sonshi Group Other Karnataka - A. Narrain Sesa Resources Limited (including Sesa Mining Corporation Limited) Total iron ore reserves Proved Reserves Probable Reserves Total Proved and
Probable Reserves Quantity Iron
Grade Quantity Iron
Grade Quantity Iron
Grade (%) (%) (%) — — 13.2 52.7 6.0 55.7 19.2 53.7 14.7 59.8 21.4 59.2 36.2 59.5 6.7 55.4 11.4 56.7 18.1 56.1 16.8 55.7 20.3 56.2 37.1 56.0 40.2 51.9 31.0 55.1 71.1 53.1 91.6 54.3 90.1 56.5 181.7 55.4
Additional Information
For India
| (a) | The reserve estimates have been prepared by the Geologists and Mining Engineers in accordance with JORC code. The estimates were independently audited by Roscoe Postle Associates Inc. in 2016. During fiscal year |
| (b) | Ore reserves are estimated at a variablecut-off grade based on ore type; the minimum |
| (c) | The ore bodies are of relatively significant size with good continuity of the mineralized zones and little internal dilution, the contacts are well constrained, free digging and diluting material can also carry grade. The iron ore is soft and there is hardly any loss or dilution while mining. Therefore no allowance for dilution is considered as it does not have material effect on reporting results. |
| (d) | The price used for India is $ |
During the year ended March 31, 2016, the Group recognized an impairment charge in respect of the exploratory assets in West Africa (Western Cluster, Liberia) on account of low iron ore prices,geo-political factors, and also due to the fact that there are no plans for any substantive expenditure given the continued uncertainty in the project. Therefore, the Company did not receive any certification of reserves and resources for the current period.
Amona plant
We commenced operations at the Amona plant in Goa in 1992 and have been engaged in the manufacture and sale of pig iron since then. Our metallurgical coke plant at Amona produces a range of coke fractions from over 70 mm for foundries, 20 mmmms to 60 mmmms for blast furnaces and 6 mmmms to 25 mmmms for the ferrous alloy industry. Approximately 75%80 to 85%90.0% of the total production of metallurgical coke is consumed by us for our pig iron production and the remainder is sold to customers primarily located in India. The cost of the input coal blend is the single most important cost component for the production of coke. Our production consists mainly of low ash coking coal and we import 100.0% of low ash coking coal each year. In order to ensure a stable raw material supply, we have long-term supply contracts for the procurement of such coal. Electric power for us is supplied by our power unit which generates power from the waste heat of our metallurgical coke plant and the blast furnace gas from us.
The following table sets out the total rated capacities as of March 31, 20162017 at our Amona facility:
| Rated capacity | ||||||||||||
| Metallurgical Coke | Pig Iron | Power (mw) | ||||||||||
| (tpa) | ||||||||||||
Amona Plant | 560,000 | 742,000 | 60 | |||||||||
| Rated capacity | ||||||||||||
| Metallurgical Coke | Pig Iron | Power (mw) | ||||||||||
| (tpa) | ||||||||||||
Amona Plant | 522,000 | 832,000 | 60 | |||||||||
Production
The table below sets out our total production of saleable ore for fiscal years 2014, 2015, 2016 and 2016:2017:
| Year Ended March 31 | ||||||||||||||
Mine/Mine Type | Product | 2014 | 2015 | 2016 | ||||||||||
| (Millions Dry Metric tons) | ||||||||||||||
Goa (Open-Pit)(1) | Iron ore | — | — | 2.0 | ||||||||||
Sesa Resources Limited (Open-Pit)(1) | Iron ore | — | — | 0.2 | ||||||||||
A. Narrain (Open-Pit)(2) | Iron ore | 1.5 | 0.6 | 3.0 | ||||||||||
|
|
|
|
|
| |||||||||
Total Iron Ore | Iron ore | 1.5 | 0.6 | 5.2 | ||||||||||
|
|
|
|
|
| |||||||||
Amona Plant | Metallurgical coke | 0.41 | 0.50 | 0.48 | ||||||||||
| Pig iron | 0.51 | 0.61 | 0.66 | |||||||||||
| Year Ended March 31 | ||||||||||||||
Mine/Mine Type | Product | 2015 | 2016 | 2017 | ||||||||||
| (Millions Dry Metric tons) | ||||||||||||||
Goa(open-pit)(1) | Iron ore | — | 2.0 | 7.8 | ||||||||||
Sesa Resources Limited(open-pit)(1) | Iron ore | — | 0.2 | 1.0 | ||||||||||
A. Narrain(open-pit) | Iron ore | 0.6 | 3.0 | 2.1 | ||||||||||
|
|
|
|
|
| |||||||||
Total iron Ore | Iron ore | 0.6 | 5.2 | 10.9 | ||||||||||
|
|
|
|
|
| |||||||||
Amona Plant | Metallurgical coke | 0.50 | 0.48 | 0.48 | ||||||||||
| Pig iron | 0.61 | 0.66 | 0.71 | |||||||||||
Note:
| (1) |
| (2) |
| Our iron ore mines in Liberia are in the exploration stage and therefore there has been no production from these mines in the last three fiscal years. |
Principal raw materialsRaw Materials
Iron ore operations. There are no direct raw materials used in our iron ore mining and processing operations. Indirect raw materials include power, fuel and lubricants. We procure these indirect materials from various vendors. The electricity required for our operations is supplied by the government grid and supplemented by our owned and hired diesel generator sets. The prices of fuel and necessary lubricants are volatile and the price of power is dependent on tariffs imposed by state governments.
Pig iron operations. The principal raw materials for the manufacture of pig iron are iron ore, metallurgical coke, limestone and dolomite.
Iron ore is largely sourced from mines in Karnataka and Goa. The iron ore is transported from Karnataka by truck and railway rakes and from Goa by truck. Iron ore requirements are met through supplies from our own mines, and through purchases from other mines in Karnataka and Goa. Our metallurgical coke requirements are met by supplies from our metallurgical coke division. Limestone and dolomite are purchased from mines in Karnataka and transported to us by trucks.
Metallurgical coke. The principal raw materials for the manufacture of metallurgical coke are hard and semi-hard coking coals. These raw materials are imported from various international suppliers mainly from Australia.
Power.Electricity for our metallurgical coke and pig iron manufacturing operations is supplied by captive power plant, which generates power from the waste gases of our metallurgical coke plant and the blast furnace.
Distribution, logisticsLogistics and transportTransport
Our mining operations are advantageously located in Goa and are complemented by an efficient transportation network. In order to achieve higher volume and loading capacities and vessels with higher drafts, we and Sesa Resources Limited own and operate transfer vessels, which are used formid-stream loading at Goa. We ship our products from ports on the west coast of India and so, the annual monsoon season in Goa impacts our distribution operations from June to September. We maintain a network of rail cars, barges and transhippers that are primarily used to facilitate the export of our ore to foreign customers. Our fleet includes 33 barges with capacities between 1,600 to 2,500 tons per barge. We also have 2two transhippers and a floating crane station with a combined rated capacity of uptoup to 54,000 ton/ton per day.
Sales from our Karnataka mines to Indian domestic customers take place on anex-mine basis, and the transportation is handled by the customer.
Sales and marketingMarketing
Sesa Goa Iron Ore is India’s largest producer and exporter of iron ore in the private sector with operations in the states of Goa and Karnataka in India and a project site in Liberia, West Africa. At present, China is our major buyer in the export market, and high iron ore inventories at Chinese major ports are being looked at as a catalyst that will change the course for fiscal year 2018 and the year next for iron ore prices.
Pig iron. Currently, the majority of the pig iron produced by us is sold within India to foundries and steel mills. The sale of pig iron is generally done on a spot basis with prices valid for a month. The prices of pig iron are fixed on a delivered basis, with material generally being sent on afreight-to-pay basis.
Metallurgical coke. Currently, all of the metallurgical coke produced by us is sold primarily within India to foundries, pig iron producers, ferrous alloys producers and cement plants. Approximately 75%80.0% to 85%90.0% of our total metallurgical coke production during fiscal year 20162017 was used for the production of pig iron. The balance was sold in the domestic Indian market.
The sale of metallurgical coke to other customers is done on a spot basis with prices valid for a month. Contracts with some ferrous alloy producers are on a quarterly orbi-monthly basis, where the quantity, grade and price are fixed.
We have a marketing office at Panaji in Goa with indenting agents to sell our pig iron and metallurgical coke products. Our sales and chartering needs are managed from the office at Goa.
Our ten largest customers accounted for approximately 49.1%40.6%, 40.6%28.5% and 28.5%39.7% of revenue for iron ore business in fiscal years 2014, 2015, 2016 and 2016,2017, respectively. No customer accounted for greater than 10.0% of our revenue in the fiscal year 2017 and 2016. One customer each accounted for greater than 10.0% of our revenue in each fiscal year 2014 and 2015.
Market shareShare and competitionCompetition
The primary export market for Goa iron ore is China. The total sales of iron ore for fiscal year 2017 was 10.1 million dmt. Domestic sales of iron ore for fiscal year 2017 was 3.6 million dmt, and total exports for fiscal year 2017 was 6.5 million dmt. Out of the total sales in fiscal 2017, 26.7% was from Karnataka mines and the remaining 73.3% was from Goa. The limit set by the environmental clearances is 20 MT for Goa and 30 MT for Karnataka.
Our primary competitors in both the public and private sectors in India include National Mineral Development Corporation, Metals and Minerals Trading Corporation of India Limited, Rungta Mines Limited, Mineral Sales Private Limited and Essel Mining and Industries Limited. In addition, our international competitors include Fortescue Metal Group, Sierra Leone, Vale, BHP Billiton Limited, and Rio Tinto.
Since 2003, we have been India’s largest exporter of iron ore in the Indian private sector by volume, prior to the temporary suspension of mining activities relating to iron ore in the states of Goa and Karnataka, according to the Federation of Indian Mineral Industries. In fiscal year 2015, no sales were accounted due to the temporary suspension of mining activities relating to iron ore in the state of Goa. In fiscal year 2016 the totalTotal sales including salesales of confiscated ore purchased throughe-auction, was 5.3 million tons. Our primary competitorsdmt in both the publicfiscal year 2016 and private sectors10.1 million dmt in India include National Mineral Development Corporation, MMTC India Limited, Rungta Mines Ltd., Mineral Sales Private Limited and Essel Mining and Industries Limited. In addition, we compete with a number of international producer-exporters of iron ore worldwide.fiscal year 2017.
Seasonality
Our iron ore mining operations are affected by changes in weather conditions, particularly heavy rains. Goa, where the majority of our iron ore mining operations are located, experiences monsoon seasons, which usually occurs from early June to early October. During the monsoon season, restricted barge movements result in significantly lower exports through the Mormugao port in Goa, where our iron ore is shipped to customers. We attempt to mitigate the effects of the monsoon season by concentrating on mine development and extracting larger quantities of overburden waste during the monsoon season in order to permit speedier extraction of iron ore during the dry season. In addition, during the monsoon season, we typically conduct annual maintenance at our processing plants and our other mining machinery.
Our Copper Business
Overview
Our copper business is principally one of custom smelting and includes a smelter, a refinery, a phosphoric acid plant, a sulphuric acid plant, a copper rod plant and three captive power plants at Tuticorin in southern India, a refinery and two copper rod plants at Silvassa in western India, a precious metal refinery, a doré anode plant and a copper rod plant, at Fujairah in the UAE. In addition, we own the Mt. Lyell copper mine in Tasmania, Australia.
As a custom smelter, we buy copper concentrate atLME-linked prices for copper less a TcRc that is negotiated with suppliers. We sell refined copper atLME-linked prices in the domestic and export markets. We receive a discount from our suppliers, in the form of a TcRc, which is influenced by global copper concentrate demand, supply of copper smelting and refining capacity, LME trends,LME-linked price participation and other factors. We source our copper concentrate from various global suppliers and our mine.
In recent years, we have improved the operating performance of our copper business by improving operational efficiencies and reducing unit costs, including reducing power costs by constructing a captive power plant at Tuticorin. We intend to further improve the operating performance of our copper business by continuing to reduce unit operating costs through improvements in recovery rates, lowering power and transport costs, achieving economies of scale and the achievement of other operational efficiencies.
Principal Products
Copper Cathode
Our copper cathodes are square shaped with purity levels of 99.9% copper. These cathodes meet international quality standards and are registered as LME “A” Grade.grade. The major uses of copper cathodes are in the manufacture of copper rods for the wire and cable industry and copper tubes for consumer durable goods. Copper cathodes are also used for making alloys like brass, bronze and alloy steel, with applications in transportation, electrical appliances and machines, defense and construction.
Copper Rods
Our copper continuous cast rods meet all the requirements of international quality standards. Our copper rods are currently used primarily for power and communication cables, transformers and magnet wires.
Sulphuric Acid
We produce sulphuric acid at our sulphuric acid plant through conversion of sulphur dioxide gas that is generated from the copper smelter. A significant amount of the sulphuric acid produced at the Tuticorin smelter is consumed by our phosphoric acid plant in the production of phosphoric acid, and the remainder is sold to fertilizer manufacturers and other industries.
Phosphoric Acid
We produce phosphoric acid at our phosphoric acid plant by chemical reaction of sulphuric acid and rock phosphate, which we import. Phosphoric acid is sold to fertilizer manufacturers and other industries.
Anode Slime
We produce anode slimes from the copper refining process that contain gold and silver which we currently sell to Fujairah and third parties. We sell the anode slimes to Fujairah Gold FZC as the doré anode plant has been shifted to our precious metal refinery at Fujairah.
OtherBy-products
Gypsum and slag areby-products of our copper smelting operations which we sell to third parties.
Supply of Copper Concentrate
As a custom smelter, we source a significant majority of our copper concentrate from third party suppliers at the LME price less a TcRc. During the fiscal year 2016,2017, no copper concentrate was sourced from our own mine in Tasmania, Australia. All of the copper concentrate used in our operations, whether from our own mine or from third party suppliers, is imported through the port of Tuticorin and transported by road to our smelter at Tuticorin.
Delivery to Customers
The copper cathodes, copper rods, sulphuric acid, phosphoric acid and otherby-products such as gypsum are shipped for export or transported by road to customers in India.
Principal Facilities
Our Copper Mine
The following map shows the location of the Mt. Lyell mine in Tasmania:
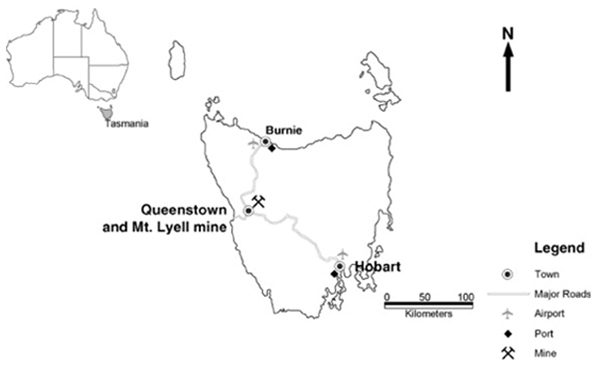
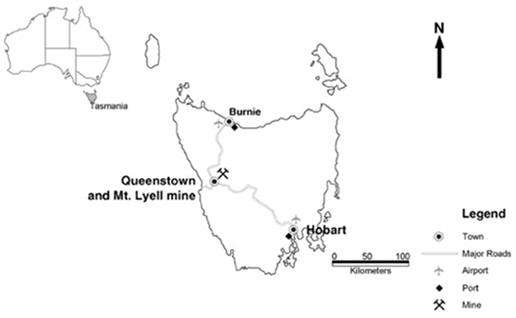
Overview
The Mt. Lyell mine is located at Queenstown, Australia. It comprises of an underground copper mine and a copper processing facility and is owned and operated by CMT. The Mt. Lyell mine is owned and operated under the terms and conditions as stipulated in Mining Leasesmining leases 9M/2013 (earlier(previously 1M95) and 10M/2013 (earlier(previously 5M95) granted by the state government of Tasmania. Mining Leaselease 9M/2013 was granted on January 1, 1995 for a period of 15 years and the mining lease 10M/2013 was granted on February 1, 1995 for a period of 14 years and 11 months. Both leases have been renewed for a period of 18 years and are valid up to December 30, 2027. The mine is also covered by the Copper Mines of Tasmania (Agreement) Act 1999, which, in conjunction with an agreement between the state government of Tasmania and CMT entered into pursuant to that Act, limits CMT’s environmental liabilities to the impact of current operations, thereby insulating CMT from any historical legacy claims. The operation of Mt Lyell mine was suspended in January 2014, following a mud slidemudslide incident.
Monte Cello acquired CMT in 1999 from Mt. Lyell Mining Company Limited or MLMC, when MLMCMt. Lyell Mining Company Limited entered into voluntary administration due to hedging difficulties. Since Monte Cello took over the mine, annual production has increased from 2.2 million tpa in fiscal year 2000 to 2.5 million tpa in fiscal year 2013. We acquired Monte Cello, and CMT, from aTwin Star’s subsidiary of Twin Star in the year 2000.
The principal deposits in the Mt. Lyell region are all of the volcanic disseminated pyrite-chalcopyrite type, which accounts for 86.0% of the known ore in the region. The geology of the Mt. Lyell mine consists of a series of intercalated felsic to mafic-intermediate volcanics. Lithologies are highly altered quartz-sericite-chlorite volcanics with individual units delineated largely by the relative abundance of phyllosilicates. Volcaniclastic and rhyolitic lithologies occur sporadically throughout the sequence, as does pervasive iron mineralization in the form of haematite, magnetite and siderite.
Chalcopyrite is the principal ore mineral and occurs chiefly in higher grade lenses enveloped by lower grade halos. The overall structure of Mt. Lyell is that of a steeply dipping overturned limb of a large anticline. The hanging wall (stratigraphic footwall) of the ore body consists of weakly mineralized chloritic schists with disseminated pyrite. The footwall is sharply defined by the Great Lyell Fault—Owen Conglomerate contact which truncates the ore body at its southern end.
The Mt. Lyell mine is under care and maintenance following a rock falling on the ventilation shaft in June 2014. All mining operations at CMT, when operational were undertaken by contractors while the processing and mill maintenance operations are undertaken by CMT employees. A sub-level caving underground mining method is used at the Prince Lyell ore body. Ore is loaded into trucks and then transported to the underground crusher and skip loading area. Crushed ore is then hauled by the Prince Lyell shaft and unloaded onto a conveyor feeding the ore bin at the Mt. Lyell processing plant. At the processing plant, the ore is crushed and ground prior to processing by flotation to produce copper concentrate which is then filtered to form a cake and trucked to the melba flats railway siding for transport to the port of Burnie. The concentrate is stored at Burnie until it is loaded into ships for transport to the port of Tuticorin from where it is trucked to the smelter. CMT has an active exploration and evaluation program at Mt. Lyell which involves upgrading resources below the Prince Lyell reserves and testing additional exploration targets on the mining lease. The western tharsis deposit lies to the west of the Prince Lyell ore body, but CMT has not yet committed to its development.body. Additional targets include Tasman and Crown, Glen Lyell, Copper Clays and NW Geophysics. The tailings dam is a valley-fill type and excess water is discharged via a spillway. The water quality is sampled before the water is released from the site. The tailings are deposited on beaches around 300 meters from the dam spillway.was raised as CMT’s accepted closure plan is to flood the tailings which will require CMT to raise the tailings dam wall and such plan is currently in progress.tailings.
The processing plant is approximately 30 years old and has been partially refurbished following CMT’s acquisition with the addition of crushers, a float cell and a regrind mill at the surface. While theThe condition of the process plant is ageing maintenancebut is carried out as requiredwell maintained to ensure that the process plantit remains in safe and efficient condition.
Power at the mine is supplied through an electricity supply agreement with Aurora Energy Proprietary Limited and Hydro Tasmania Proprietary Limited to supply approximately 112 giga watts per hour. Aurora Energy Proprietary Limited supplies electricity on a spot price basis and Hydro Tasmania Proprietary Limited is under a fixed arrangement. There is ample supply of mine water and storm water captured on the tailings dam.Limited.
The gross and net value of fixed assets, including capital works-in-progresswork-in-progress was approximately AUD 161.04.5 million ($ 124 million) and AUD 5.7 million ($4.45.9 million) respectively, as of March 31, 2016.
The cut-off grades are based on copper grades with the gold credit deducted from the operating costs. The reserves are derived from stopes which are designed such that the limits of the stope are defined by a cut-off grade of 0.8% copper and have an average grade that exceeds 0.8% copper. The revenue derivation of the cut-off grade includes the gold credit. The break-even cut-off grade of 0.65% copper is the grade that makes enough margin to cover the fixed and variable costs while the actual or operational cut-off grade used is 0.55% copper. CMT operates on a 0.8% copper operational cut-off grade in practice, which prefers to take higher revenue at the expense of a longer mine life.2017.
At the time of finalization of reserve statement as on March 31, 2016,2017, no mineral reserves have been determined due to government statutory restrictions imposed post the mud slide incident in January 2014.
The reserves at CMT in the proven reserve category are defined as the portion that can be economically mined of the measured in-situ resource, which has gold drill coverage (<50 meter) and is on or within the 50 meter zone below the lowest active production level. The probable in-situ reserve is the material which has been defined as the portion that can be economically mined and has good drill coverage but is outside the 50 meter zone from the lowest active production level. The ex-situ probable reserve is the portion of ex-situ indicated resource which can be economically recovered with the mining of the in-situ reserves; this is applied as a modifying factor.
CMT does not use a copper equivalent calculation for the determination of stope limits as the relationship between the copper and gold grades is essentially linear, allowing the gold credits to be deducted from operating costs.
CMT has identified additional mineral deposits in the Mt. Lyell mine and we have engaged in drilling, scoping and feasibility studies on these deposits and has completed pre-feasibility of Prince Lyell North Flank and a scoping study of copper chert prospect.
Our Smelter and Refineries
Overview
The following table sets forth the total capacities as of March 31, 20162017 at our Tuticorin and Silvassa facilities:
| Capacity | Capacity | |||||||||||||||||||||||||||||||||||||||||||||||
Facility | Copper Anode(1) | Copper Cathode(2) | Copper Rods(2) | Sulphuric Acid(3) | Phosphoric Acid(3) | Captive Power | Copper Anode(1) | Copper Cathode(2) | Copper Rods(2) | Sulphuric Acid(3) | Phosphoric Acid(3) | Captive Power | ||||||||||||||||||||||||||||||||||||
| (tpa) | (tpa) | (tpa) | (tpa) | (tpa) | (MW) | (tpa) | (tpa) | (tpa) | (tpa) | (tpa) | (MW) | |||||||||||||||||||||||||||||||||||||
Tuticorin | 405,000 | 205,000 | 96,000 | 1,300,000 | 230,000 | 191.5 | 400,000 | 235,000 | 96,000 | 1,300,000 | 230,000 | 191.5 | ||||||||||||||||||||||||||||||||||||
Silvassa | — | 200,000 | 172,000 | — | — | — | — | 215,000 | 172,000 | — | — | — | ||||||||||||||||||||||||||||||||||||
|
|
|
|
|
|
|
|
|
|
|
| |||||||||||||||||||||||||||||||||||||
Total | 405,000 | 405,000 | 268,000 | 1,300,000 | 230,000 | 191.5 | 400,000 | 450,000 | 268,000 | 1,300,000 | 230,000 | 191.5 | ||||||||||||||||||||||||||||||||||||
|
|
|
|
|
|
|
|
|
|
|
| |||||||||||||||||||||||||||||||||||||
Notes:
| (1) | Copper anode is an intermediate product produced by copper smelters and is not sold to customers. It is used for the production of copper cathode by copper refineries. Approximately one ton of copper anode is required for the production of one ton of copper cathode. |
| (2) | Copper cathode is used as a starting material for copper rods. Approximately one ton of copper cathode is required for the production of one ton of copper rods. |
| (3) | Sulphuric acid is used as a starting material for phosphoric acid. Approximately 2.8 tons of sulphuric acid are required for the production of one ton of phosphoric acid. |
Tuticorin
Our Tuticorin facility, established in 1997, is located in Tamil Nadu in southern India. Our Tuticorin facility currently consists of a 405,000400,000 tpa copper smelter, a 205,000235,000 tpa copper refinery, a 96,000 tpa copper rod plant, a 1,300,000 tpa sulphuric acid plant, a 230,000 tpa phosphoric acid plant and three captive power plants with capacities of 7.5 MW, 24.0 MW and 160160.0 MW. The coal based power plant of 160 MW is primarily used for captive consumption and we have also entered into a power purchase agreement with the Tamil Nadu Electricity Board for selling power in excess power over the captive consumption.
Presently, the captive power plants have a total capacity of 191.5 MW, excluding the 15 MW power generating power plant shifted to HZL for the Pantnagar operations. Further, we also have a 11.25 MW of power generated from a smelter waste heat boiler. Coal for the 160 MW power plant is imported, and our other captive power plants at Tuticorin operate on furnace oil.
The smelter at the Tuticorin facility utilizes IsaSmeltTMfurnace technology. The refinery uses IsaProcessTMtechnology to produce copper cathode and the copper rod plant uses Properzi Continuously Cast and Rolled, copper rod technology from Continuus-Properzi S.p.A., Italy, to produce copper rods.
In March 2013, the TNPCB ordered the closure of the copper smelter at Tuticorin due to complaints regarding a noxious gas leak by local residents. On April 1, 2013 we filed a petition in the National Green Tribunal challenging the order of the TNPCB on the basis that the plant’s emissions were within permissible limits. The National Green Tribunal passed an interim order in May 2013 allowing the copper smelter to recommence operations subject to certain conditions. We recommenced operations on June 16, 2013. The expert committee constituted by the National Green Tribunal submitted a report on the operation of the plant on July 10, 2013 stating that the plant’s emissions were within the prescribed standards and based on this report, the National Green Tribunal ruled on July 15, 2013 that the copper smelter could remain open and reserved its final order. The National Green Tribunal has also directed the company to comply with the recommendations made by the committee to further improve the working of the plant within a time bound schedule. However, the TNPCB filed a civil appeal before the Supreme Court of India against the interim order of the National Green Tribunal. On August 8, 2013, the National Green Tribunal upheld its interim order of May 31, 2013, and allowed our smelter to continue operation subject to implementing all the recommendations and suggestions given by the National Green Tribunal. We have implemented all the recommendations during fiscal year 2013. However, the TNPCB filed a notice of appeal against the orders of the National Green Tribunal. The appeals are pending before the Green bench of the Supreme Court of India.See “Item 8. Financial Information - A. Consolidated Statements and Other Financial Information – Legal Proceedings - Writ petitions filed against us alleging violation of certain air, water and hazardous waste management regulations at our Tuticorin plant” for additional information.
Silvassa
Our Silvassa facility, established in 1997, is located in the union territory of Dadra and Nagar Haveli in western India. Our Silvassa facility currently consists of a 200,000215,000 tpa copper refinery and two copper rod plants with a total installed capacity of 172,000 tpa of copper rods. Its refinery uses IsaProcessTM technology in the production of copper cathode and its copper rod plants use Properzi copper cathode rods technology. Our Silvassa facility draws on the state power grid to satisfy its power requirements.
Fujairah
Fujairah Gold FZC is located in the Fujairah Free Zone 2. Our Fujairah facility is strategically located on the coast of the Arabian Sea. The precious metal refinery was commissioned in March 2009 and began production in April 2009, with a capacity of 20 tons of gold and 105 tons of silver. Outotec oyj, Finland, supplied the technology for the precious metal refinery. Fujairah Gold FZC commissioned a copper rod plant at a project cost of $ 12.98 million, with an annual capacity of 12.5 tons per hour with production having commenced in May 2010 and generated a production of 86,65483,278 metric tons of rod, 8,6226,373 kilograms of gold and 82,41877,514 kilograms of silver in fiscal year 2016.2017. Continuus Properzi S.p.A., Italy, has supplied the rod mill equipment for this project, and the copper cathode required for the copper rod plant is being sourced from the smelters of the Vedanta Group and third parties. The doré anode plant that was shifted from Tuticorin to Fujairah was commissioned in June 2012 for smelting of “anode slime” to “doré anode” which is the raw material for the precious metal refinery.
Production Volumes
The following table sets out our total production from Tuticorin and Silvassa for the fiscal years ended March 31, 2014, 2015, 2016 and 2016:2017:
| For the Year Ended March 31, | For the Year Ended March 31, | |||||||||||||||||||||||||||
Facility | Product | 2014 | 2015 | 2016 | Product | 2015 | 2016 | 2017 | ||||||||||||||||||||
| (tons) | (tons) | |||||||||||||||||||||||||||
Tuticorin | Copper anode(2) | 301,120 | 361,839 | 387,016 | Copper anode(2) | 361,839 | 387,016 | 400,620 | ||||||||||||||||||||
| Sulphuric acid(3) | 835,798 | 1,006,692 | 1,070,786 | Sulphuric acid(3) | 1,006,692 | 1,070,786 | 1,043,802 | |||||||||||||||||||||
| Phosphoric acid(3) | 116,340 | 189,353 | 198,779 | Phosphoric acid(3) | 189,353 | 198,779 | 200,119 | |||||||||||||||||||||
| Copper cathode(4) | 151,592 | 194,019 | 201,864 | Copper cathode(4) | 194,019 | 201,864 | 216,119 | |||||||||||||||||||||
| Copper rods(4) | 22,105 | 53,400 | 68,685 | Copper rods(4) | 53,400 | 68,685 | 71,178 | |||||||||||||||||||||
Silvassa | Copper cathode(4) | 142,842 | 168,353 | 182,183 | Copper cathode(4) | 168,353 | 182,183 | 186,611 | ||||||||||||||||||||
| Copper rods(4) | 100,948 | 116,939 | 142,115 | Copper rods(4) | 116,939 | 142,115 | 136,352 | |||||||||||||||||||||
Total | Copper anode | 301,120 | 361,839 | 387,016 | Copper anode | 361,839 | 387,016 | 400,620 | ||||||||||||||||||||
| Copper cathode | 294,434 | 362,372 | 384,047 | Copper cathode | 362,372 | 384,047 | 402,730 | |||||||||||||||||||||
| Copper rods | 123,053 | 170,339 | 210,799 | Copper rods | 170,339 | 210,799 | 207,530 | |||||||||||||||||||||
| Sulphuric acid | 835,798 | 1,006,692 | 1,070,786 | Sulphuric acid | 1,006,692 | 1,070,786 | 1,043,802 | |||||||||||||||||||||
| Phosphoric acid | 116,340 | 189,353 | 198,779 | Phosphoric acid | 189,353 | 198,779 | 200,119 | |||||||||||||||||||||
Notes:
| (1) |
| (2) | Copper anode is an intermediate product produced by copper smelters and is not sold to customers. It is used for the production of copper cathode by copper refineries. Approximately one ton of copper anode is required for the production of one ton of copper cathode. |
| (3) | Sulphuric acid is used as a starting material for phosphoric acid. Approximately 2.8 tons of sulphuric acid are required for the production of one ton of phosphoric acid. |
| (4) | Copper cathode is used as a starting material for copper rods. Approximately one ton of copper cathode is required for the production of one ton of copper rods. |
TheSince Mt. Lyell mine has been placed under care and maintenance following table sets out CMT’sa rock falling on the ventilation shaft in June 2014, there was no copper extraction from the Mt. Lyell minethese mines for the fiscal years ended March 31, 2014, 2015, 2016 and 2016:2017.
| For the Year Ended March 31, | ||||||||||||||
Mine (Type of Mine) | Product | 2014 | 2015 | 2016 | ||||||||||
| (tons, except for percentages) | ||||||||||||||
Mt. Lyell (Underground) | Ore mined | 1,739,223 | — | — | ||||||||||
| Ore grade | 1.10% | — | — | |||||||||||
| Copper recovery | 92.48% | — | — | |||||||||||
| Copper concentrate | 67,386 | — | — | |||||||||||
| Copper in concentrate | 17,839 | — | — | |||||||||||
Principal Raw Materials
Overview
The principal inputs of our copper business are copper concentrate, rock phosphate, power, fuel and sulphuric acid. Other inputs include coke, lime, reagents and oxide ore. We have in the past been able to secure an adequate supply of the principal inputs for our copper production.
Copper Concentrate
Copper concentrate is the principal raw material of our copper smelter. In fiscal year 2016,2017, we sourced 100%97.49% of our copper concentrateconcenterate requirements from third party suppliers, either through long-term contracts or on spot markets. The remainder of our copper concenterate requirements was fulfilled from Konkola Copper Mines. We purchase copper concentrate at the LME price less a TcRc that we negotiate with our suppliers but which is influenced by the prevailing market rate for the TcRc. We expect the percentage we purchase from third party suppliers to increase in future periods as the Mt. Lyell copper mine has been placed under care and maintenance. We also expect the percentage we purchase from third party suppliers to also increase in future periods to the extent we seek to increase our copper smelting and refining capacity.
In general, our long-term agreements run for a period of three to five years, and are renewable at the end of the period. The quantity of supply for each contract year is fixed at the beginning of the year and terms like TcRc and freight differential are negotiated each year depending upon market conditions. In fiscal year 2016,2017, we sourced approximately 80.5%62.27% of our copper concentrate requirements through long-term agreements.
We also purchase copper concentrate on a spot basis to fill any gaps in our requirements based on production needs for quantity and quality. These deals are struck on the best possible TcRc during the period and are specific for short-term supply. In fiscal year 2016,2017, we sourced approximately 19.5%37.73% of our copper concentrate requirements through spot purchases.
Rock Phosphate
In fiscal year 20162017, the majority of rock phosphate was sourced from Jordan at spot prices.
Power
The electricity requirements of our copper smelter and refinery at Tuticorin are primarily met by theon-site captive power plants. This plant uses coal that is imported from third parties. Our other captive power plants at Tuticorin operate on furnace oil that is procured through long-term contracts with various oil companies. We have outsourced theday-to-day operation operations and maintenance of our captive power plants at Tuticorin. Our Silvassa facility relies on the state power grid for its power requirements.
Distribution, Logistics and Transport
Copper concentrate from the Mt. Lyell processing facility is transported by road to a rail head and then transported by rail to the port of Burnie, Tasmania, from which it is shipped to the port of Tuticorin in India. Copper concentrate sourced from both our Mt. Lyell processing facility and from third parties is received at the port of Tuticorin and then transported by road to the Tuticorin facility.
Once processed at the Tuticorin facility, copper anodes are either refined at Tuticorin or transported by road to Silvassa. Copper cathodes, copper rods, sulphuric acid, phosphoric acid and otherby-products are shipped for export or transported by road to customers in India.
Sales and Marketing
The 10 largest customers of our copper business accounted for approximately 42.6%32.8%, 32.8%30.6% and 30.6%47.8% of our copper business revenue in fiscal years 2014, 2015, 2016 and 2016,2017, respectively. One of our customer accounted for greater than 10% of copper business revenue in fiscal year 2017. None of our customers accounted for greater than 10.0% of copper business revenue in fiscal years 2014, 2015 and 2016.
Our copper sales and marketing head office is located in Mumbai, and we have field sales and marketing offices in most major metropolitan centers in India. We sell our copper rods and cathodes in both the domestic and export markets. In fiscal years 2014, 2015, 2016 and 2016,2017, exports accounted for approximately 48.4%41.8%, 41.8%38.0% and 38.0%55.5% of the revenue of our copper business, respectively. Our export sales were primarily to China, Japan, Indonesia, Malaysia, Vietnam, Europe, Turkey, UAE, Mexico and Taiwan. We also sell phosphoric acid and otherby-products in both the domestic and export markets.
Domestic sales are normally conducted on the basis of a fixed price for a given month that we determine from time to time on the basis of average LME price for the month, as well as domestic supply and demand conditions. The price for copper we sell in India is normally higher than the price we charge in the export markets due to the tariff structure on costs, smaller order sizes that domestic customers place and the packaging, storing and truck loading expenses that we incur when supplying domestic customers.
Our export sales of copper are made on the basis of both long-term sales agreements and spot sales. The sales prices of our copper exports include the LME price plus a producer’s premium. We do not enter into fixed price long-term copper sales agreements with our customers.
Market Share and Competition
We own one of the two custom copper smelters in India and had a 36% primary market share by sales volume in India in fiscal year 2016,2017, according to International Copper Association (India). The other major custom copper smelter in India is owned by Hindalco Industries Limited, with the remainder of the primary copper market in India primarily served by imports and Hindustan Copper Limited.
Copper is a commodity product and we compete primarily on the basis of price and service, with price being the most important consideration when supplies of copper are abundant. Our metal products also compete with other materials, including aluminium and plastics that can be used in similar applications byend-users. Copper is sold directly to consumers or on terminal markets such as the LME. Prices are established based on the LME price, though as a regional producer we are able to charge a premium to the LME price which reflects the cost of obtaining the metal from an alternative source.
Projects and Developments
We have ongoing expansion projects to setup Coppera copper smelter plant at Tuticorin costing Rs. 16,820 million ($ 253.9 million) to increase its total copper capacity to 800,000 tpa. Thetpa, which costs Rs. 16,820 million ($ 259.4 million). However, the expansion of the smelter iswas temporarily put on hold as required approvals from the state government have not yet been received. Specifically, the proposed capacity expansion at Tuticorin had been delayed since December 2009 due to a writ filed before by the Madras High Court, although this writ had not prevented the continued operation of the plant. Further, the High Court of Madras dismissed the petition by way of its order dated April 28, 2016pending environmental clearances. We received environmental clearance from MoEF in May 2015 and rejected the claims of the petitioner.
For additional information on these proceedings, please see Item 3. “–Key Information – D. Risk Factors — We are involved in certain litigation seeking cancellation of permits and environmental approvalconsent to establishment from TNPCB for the alleged violationcopper smelter in November 2016. On the basis of certain air, waterclearances and hazardous waste management regulations at our Tuticorin plant”.consents received, we are in the process of restarting the project activities for the copper smelter plant.
We have incurred Rs. 6,4235,635 million ($ 97.086.9 million) on these projects as of March 31, 2016.2017. We funded these projects primarily from the proceeds of the convertible senior notes issued in fiscal year 2010.
Our Aluminium Business
Our aluminium business is in Chhattisgarh and Odisha. We operate the business in the state of Chhattisgarh through BALCO, in which we have a 51.0% ownership interest, whereas our aluminium operations in Odisha were earlierpreviously operated through Vedanta Aluminium, which was merged into Vedanta Limited pursuant to theRe-organization Transactions.
| (a) | BALCO |
Overview
Our aluminium business is owned and operated by BALCO. BALCO’s partially integrated aluminium operations are comprised of two bauxite mines, 1140the Chotia coal block, 1410 MW power plants, an alumina refinery, the operations of which have been suspended since September 2009, a 245,000 tpa aluminium smelter and a 325,000 tpa aluminium smelter (for which 50% capacity is commissioned as on March 31, 2017) and a fabrication facility, all of which are located in Korba in the State of Chhattisgarh in central India. BALCO’s operations benefit from relatively cost effective access to power, the most significant cost component in aluminium smelting due to the power intensive nature of the process. This is, to a considerable extent, as a result of BALCO being an energy-integrated aluminium producer. BALCO is also in the process of constructing a CPP 600 MW coal-based thermal power facility in the state of Chhattisgarh which had received approval on January 14, 2015 from the regulatory authorities to operate. Both units of 300 MW each were commissioned during fiscal year 2016. BALCO completed the ramp up of the first 84 pots of 325,000 tpa aluminium smelter during fiscal year 2015 and the remaining 252 pots are expected to be ramped up during fiscal year 2017.
During the fourth quarter of fiscal year 2015, BALCO was successful in securing one coal mine in coal block auctions conducted by the GoI, namely the Chotia coal block (“Chotia”) and was the highest bidder for the Gare Palma IV/1 coal block (“Gare Palma”). The total reserves at the Chotia block are 17.5 million tons with the annual production capacity of one million tons. The mining operations were commenced at the Chotia mine in November 2015. Despite a successful bid for Gare Palma IV/1, the GoI has challenged the award and BALCO has appealed regarding the GoI’s rejection of the winning bid for the Gare Palma IV/1. By way of letter dated July 29, 2015, the GoI rejected the representation of BALCO to accept its bid for the Gare Palma IV/1 coal mine. BALCO filed another writ petition before Delhi High Court challenging the rejection of bid and its representation by the GoI. This writ petition was heard on May 3, 2016 and orders have been reserved by the court. The above coal mines cover 90% of BALCO’s coal requirement for captive power generation.
BALCO’s Bodai-Daldali bauxite mines provide a majority of the bauxite required for BALCO’s smelters. The bauxite is transferred to our alumina refinery in Lanjigarh, which converts bauxite to alumina and supplies the alumina back to BALCO, for payment of a conversion price by BALCO to us, which is based on our actual cost of production plus a reasonable margin. The remainder of BALCO’s alumina requirements is sourced from third parties.
BALCO’s other bauxite mine is the Mainpat bauxite mine, which is anopen-pit bauxite mine located in the Surguja district of the state of Chhattisgarh. The Mainpat mine has been in production since 1993. The mining lease of our Mainpat bauxite mine has been renewed and it is valid uptountil July 8, 2042. BALCO has temporarily stopped the mining activity on account of pending approval from the necessary mining authorities.
We own a 51.0% ownership interest in BALCO and have management control of the company. The remainder of BALCO is owned by the GoI, which established BALCO in 1965. We acquired our interest in BALCO from the GoI on March 2, 2001. On March 19, 2004, we exercised an option to acquire the GoI’s remaining ownership interest.interest in BALCO, which is owned by the GoI. The exercise of this option has been contested by the GoI. Further, the GoI retains the right and has expressed an intention to sell 5.0% of BALCO to BALCO employees. See “-Options to Increase Interests in HZL and BALCO” for more information.
Principal Products
Primary Aluminium
Primary aluminium is produced from the smelting of metallurgical grade alumina. BALCO produces primary aluminium in the form of ingots and wire rods for sale. Ingots are used extensively for aluminium castings and fabrication in the construction and transportation industries. Wire rods are used in various electrical applications, especially in the form of electrical conductors and cables.
Rolled Products
Rolled products, namely coils and sheets, are value-added products that BALCO produces from primary aluminium. Rolled products are used for a variety of purposes in different industries, including aluminium foil manufacturing, printing, transportation, consumer durables, building and architecture, electrical and communications, packaging and general engineering industries.
Delivery to Customers
Ingots, wire rods and rolled products are transported by trucks to customers in India and to ports for export.
Principal Facilities
Overview
The following map shows details of the locations of BALCO’s facilities in the State of Chhattisgarh:
Bauxite Mines
Chhattisgarh Mines – Mainpat and Bodai-Daldali
BALCO has two captive bauxite mines, namely the Mainpat bauxite mine and the Bodai-Daldali bauxite mine, in the state of Chhattisgarh in central India. The Mainpat mine is anopen-pit bauxite mine located in the Surguja district of the state of Chhattisgarh. The Mainpat mine has been in production since 1993 and has a leased hold area of 6.39 square kilometers. The bauxite extraction limit for the mine granted by MoEF is 750,000 tpa. The mining lease of Mainpat mine expired onhas been renewed until July 8, 20122042, and was renewed to July 8, 2042. Environmental clearanceenvironmental clearances for the Mainpat mine has been renewed by the MoEF and is valid tountil September 16, 2038. The Temporary Working Permission granted by the MoEF expired on January 7, 2016 and BALCO hashad applied for a renewal of Forest Clearanceforest clearances for the whole revenue forest landco-terminus with the Mining Leasemining lease period, and approval of these applicationswhich is expected to be received during fiscal year 2017.valid until July 8, 2047.
The Bodai-Daldali deposits are located approximately 260 kilometers from Korba in the Kawardha district of the state of Chhattisgarh. Bodai-Daldali was commissioned in 2004 by BALCO with a lease hold area of 6.3 square kilometers renewable mining lease that is valid until March 26, 2017.2047. The bauxite extraction limit for Bodai-Daldali Mines granted by MoEF is 1,250,000 tpa.
The Chhattisgarh bauxite deposits are situated over a plateau with steep scarps on both sides, at an elevation of approximately 1,040 meters above the mean sea level for Mainpat, and approximately 940 meters above the mean sea level for Bodai-Daldali. The bauxite is generally one meter to three meters thick and lies within a laterite sequence overlying thick tertiary basalts of the Deccan traps. The cover of laterite and thin topsoil is up to 5 meters thick, but is generally less than 2 meters. The bauxite outcrops around much of the plateau rims.
A typical profile of the Chhattisgarh deposits comprises topsoil and soft overburden above the laterite. The upper laterite consists of hard, loose or indurated bauxite pebbles and boulders with a clear contact with the underlying hard bauxites. The bauxite occurs in discontinuous lenses up to four meters in thickness with laterite infilling joints and fractures with the bauxite. The contact with the softer lower laterite is usually gradational and irregular.
The bauxite isranges from hard to very hard with a natural moisture content of 5.0% to 10.0%, anin-situ density of 2.3 tons to 2.4 tons per cubic meter. It comprises primarily gibbsite with bohemite and minor diaspore. The reactive silica content is low and iron is present in the form of hematite and aluminous goethite. The average grade of the bauxite is approximately 44.9%43.6% aluminium oxide and silica levels of 4.2%5.1% as of March 31, 2016.2017.
All mining and transportation at both mines are undertaken by contractors. One thin top soil layer is removed by an excavator and is either transported to an adjacent storage point or an area that is being backfilled. The laterite layer is drilled and blasted. The overburden is then removed by backhoe, excavators and15-ton dumpers. Broken ore is hand-sorted, leaving waste material behind. Ore productivity is around 2 to 3 tons per person per day in the dry season which decreases to 1.25 to 1.75 tons per person per day in the wet season.
The current exploration drilling program is based on a50-meter square pattern and is reduced to a25-meter centers for detailed mine planning. Sampling is normally in 0.4 meter lengths and core is currently split and retained for future reference. Bauxite samples are tested for silica and aluminium oxide at laboratories situated on site and at the Korba plant. Selected sample arere-assayed as part of a quality control program.
Since the commencement of operations, the Mainpat mine has produced approximately 7.47.5 million tons of bauxite. During fiscal year 20162017 there was production totaling approximately 45573,710 tons at 47.7%43.6% aluminium oxide. Currently, bauxite production has been temporarily suspended from September 17, 2015 due to pending forest clearance of mining lease area and a restriction on the removal of mined ore from the mining site. Power and water requirements at Mainpat are minimal and can be supplied by smallon-site diesel generators and from boreholes in the mine.
As of March 31, 2016,2017, BALCO estimates reserves at Mainpat to be 4.25.1 million tons and the remaining mine life of the Mainpat mine to be approximately 5-66 to 7 years based on (i) reserves; and (ii) planned production which is determined on the basis of alife-of-mine plan.
Total production at the Bodai-Daldali mine since the commencement of production has been 5.97 million tons of bauxite, with production in fiscal year 20162017 totaling approximately 1,033,3001,065,300 tons at 46.9%46.7% aluminium oxide. Power is supplied byon-site diesel generators and ground water provides the water requirements for the mine.
As of March 31, 2016,2017, BALCO estimates the reserves at Bodai-Daldali to be 1.932.41 million tons and the remaining mine life to be approximately 2 years based on (i) reserves; and (ii) planned production which is determined on the basis of alife-of-mine plan. Thecut-off grade used to define the reserves at BALCO’s mines was 42.0%38.0%.
In fiscal year 2016,2017, all mining and transportation of the bauxite was done by contractors and the total cost for this was Rs. 2,3342,485 ($ 35.2)38.3) per ton of bauxite.
Based on current costs and historical prices, BALCO’s operations are forecasted to remain profitable and therefore the deposits at the Mainpat and Bodai-Daldali mines fulfill the requirements for being classified as reserves. The reserves as of March 31, 20162017 at BALCO’s mines at Mainpat and Bodai-Daldali have been determined by verifying that the integrated operation is economic at an aluminium price of $ 1,7511,723 per ton, which is the average metal price for the 3 fiscal years ending March 31, 2016, 2015 and 2014.ton.
The mining recovery factors applied to determine the reserves for both mines are 65.0%. The grade dilution factor is reconciliation between the actual mined / dispatched grades obtained andin-situ grade values. The grade correction / dilution factors applied for Mainpat and Bodai-Daldali mines are Al2O3 – 96%97%, SiO2 – 114%103% and Al2O3 – 95%97%, SiO2 – 104%103% respectively. The parameters for Mainpat are derived from the reconciliation of actual production against the geological model, while the parameters for Bodai-Daldali are based on estimates.
In fiscal year 2016,2017, there was no stripping ratio at the Mainpat mine as there was no ore extraction during the year, while the stripping ratio at the Bodai-Daldali mine was 1.0:3.89.1:6.37. The stripping ratio for the remaining reserves at Mainpat is 3.842.55 tons of waste per ton of ore, while at the Bodai-Daldali mine, it is 3.851.74 tons of waste per ton of ore. Stripping ratio is the ratio of the volume of waste material required to be handled in order to extract some volume of ore.
Summary of Bauxite Mine Reserves
The following table sets out BALCO’s proven and probable bauxite reserves as of March 31, 2016:2017:
Mines | Proven Reserves | Probable Reserves | Total Proven and Probable Reserves | SSL Interest | Reserve Life | Proven Reserves | Probable Reserves | Total Proven and Probable Reserves | SSL Interest | Reserve Life | ||||||||||||||||||||||||||||||||||||||||||||||||||||||||||||||||||||||||||||||
| Quantity | Alumina | Silica | Quantity | Alumina | Silica | Quantity | Alumina | Silica | % | (years) | Quantity | Alumina | Silica | Quantity | Alumina | Silica | Quantity | Alumina | Silica | % | (years) | |||||||||||||||||||||||||||||||||||||||||||||||||||||||||||||||||||
(in million tons) | (%) | (%) | (in million tons) | (%) | (%) | (in million tons) | (%) | (%) | (in million tons) | (%) | (%) | (in million tons) | (%) | (%) | (in million tons) | (%) | (%) | |||||||||||||||||||||||||||||||||||||||||||||||||||||||||||||||||||||||
Mainpat | 4.22 | 44.48 | 4.43 | — | — | — | 4.22 | 44.48 | 4.43 | — | 5-6 | 5.10 | 43.34 | 4.43 | — | — | — | 5.10 | 43.34 | 4.43 | — | 6-7 | ||||||||||||||||||||||||||||||||||||||||||||||||||||||||||||||||||
Bodai-Daldali | 1.93 | 45.68 | 3.64 | — | — | — | 1.93 | 45.68 | 3.64 | — | 1-2 | 2.41 | 43.61 | 5.16 | — | — | — | 2.41 | 43.61 | 5.16 | — | 1-2 | ||||||||||||||||||||||||||||||||||||||||||||||||||||||||||||||||||
|
|
|
|
|
|
|
|
|
|
|
|
|
|
|
|
|
|
|
|
|
| |||||||||||||||||||||||||||||||||||||||||||||||||||||||||||||||||||
Total | 6.15 | 44.86 | 4.18 | — | — | — | 6.15 | 44.86 | 4.18 | 51 | — | 7.51 | 43.43 | 4.66 | — | — | — | 7.51 | 43.43 | 4.66 | 51 | — | ||||||||||||||||||||||||||||||||||||||||||||||||||||||||||||||||||
|
|
|
|
|
|
|
|
|
|
|
|
|
|
|
|
|
|
|
|
|
| |||||||||||||||||||||||||||||||||||||||||||||||||||||||||||||||||||
Additional information:
| (1) | The estimate of reserves, were audited by Geo Solutions Private Limited, presented incorporate the losses for mine dilution and mining recovery according to the JORC code. |
| (2) | Thecut-off grade used with our reserve estimates for bauxite is |
| (3) | The metallurgical recovery factor for bauxite at both Mainpat and Bodai-Daldali is 65.0%. |
| (4) | The |
| (5) | The reserve quantities disclosed are for the entire mine and our share in the reserve quantities is 51.0%. |
Korba Facility
Overview
BALCO’s Korba facility is located at Korba in the state of Chhattisgarh and consists of a 245,000 tpa aluminium smelter 1140and a 325,000 tpa aluminium smelter (for which 50% capacity is commissioned as on March 31, 2017), 1410 MW power plants, and an alumina and a fabrication facility. During the year, CPP 600 MW was commissioned.commissioned and 270 MW power plant was transferred from power business to aluminum business on April 1, 2016. The following table sets forth the total capacities as of March 31, 20162017 at BALCO’s Korba facility:
| Capacity | Capacity | |||||||||||||||||||||||
Facility | Alumina | Aluminium | Power plant | Alumina | Aluminium | Power plant | ||||||||||||||||||
| (tpa) | (tpa) | (MW) | (tpa) | (tpa) | (MW) | |||||||||||||||||||
Korba | 200,000 | 245,000 | 1,140 | �� | 200,000 | 245,000 | 1,140 | |||||||||||||||||
Korba (under construction) | 81,250(1) | 162,500(1) | ||||||||||||||||||||||
Notes:
| (1) | For the 325,000 tpa smelter, 84 pots were operationalized during fiscal year 2015. |
Refinery
The Korba alumina refinery was commissionedCommissioned in 1973, uses the conventional high pressure Bayer process and has a capacity of 200,000 tpa of alumina. The operations of the refinery have been stopped since September 2009.
Smelters
Earlier,Previously, there were two aluminium smelters. The first smelter was commissioned in 1975, and used the Vertical Stud Soderberg technology to produce aluminium from alumina and had a capacity of 100,000 tpa. In response to global economic conditions and a decline in commodity prices, starting in February 2009, BALCO suspended part of its operations at the 100,000 tpa aluminium smelter at Korba. Operations at this aluminium smelter ceased on June 5, 2009. The second smelter usespre-baked GAMI technology and has a capacity of 245,000 tpa, was commissioned in November 2006. BALCO is in the process of setting up a 325,000 tpa smelter at the Korba facility, for which 84 pots of which commenced commercial production in September 2014. TheAn additional 84 pots were operationalized in August 2016, and the remaining 252168 pots will commencecommenced commercial production from fiscal yearon May 1, 2017.
Fabrication Facility
The fabrication facility at Korba has two parts, a cast house and a sheet rolling shop.
Cast House
The cast house uses continuous rod casters from Continuus-Properzi S.P.A and has a foundry which has twin-roll continuous casters with a SNIF degasser and hydraulically driven semi-continuous ingot casting machine to produce ingots and wire rods.
Sheet Rolling Shop
The sheet rolling shop has three parts: a hot rolling mill with a capacity of 75,000 tpa, an older cold rolling mill with a capacity of 30,000 tpa and a newer cold rolling mill commissioned in 2004 with a capacity of 36,000 tpa. Molten metal is cast into slabs and then eitherhot-rolled and sold ashot-rolled sheets or converted into cold-rolled sheets in the cold rolling mills. Alternatively, molten metal is directly used in strip casting and then fed to the cold rolling mills to convert it into cold-rolled sheets or coils.
Power Plants
Smelting requires a substantial continuous supply of power and interruptions can cause molten metal to solidify and damage or destroy the pots. Power for the Korba facility is for the most part provided by the coal-based 540 MW captive power plant commissioned in March 2006. The surplus generation from the power plant is supplied to the State Electricity Board and other customers. Following the shutdown of the 100,000 tpa aluminium smelter, power from its associated 270 MW power plant is sold in the merchantwas transferred from power market.business to aluminium business on April 1, 2016. BALCO is constructingconstructed a CPP 600 MW coal-based thermal power facility in the state of Chhattisgarh. The power generated from CPP 600 MW units will beis being utilized in the 325,000 tpa smelter being set.smelter.
Thermal coal is a key raw material required for the operation of BALCO’s captive power plants. In fiscal year 2016, 83% of the allocated coal was supplied from Coal India Limited against a FSA for 810MW. BALCO also entered into anothera FSA for 26 lacs mtpa with South Eastern Coalfields Limited (“SECL”) for IPP 600 MW.MW during fiscal year 2016. On October 7, 2016, BALCO entered into another FSA of 3.25 mtpa for 1140 MW captive power plant (comprising of CPP 540 MW and CPP 600 MW) for a term of five years. BALCO realized 81% of contracted coal quantity of IPP 600 MW and CPP 1140 MW each. Further, BALCO was successful in securing the Chotia coal block as part of an auction process conducted by the GoI.
Production Volumes
The following table sets out BALCO’s total production from its Korba facility for fiscal years ended March 31, 2014, 2015, 2016 and 2016:2017:
| For the Year Ended March 31, | For the Year Ended March 31, | |||||||||||||||||||||||||||||||
Facility | Product | 2014(2) | 2015(3) | 2016 | Product | 2015(2) | 2016 | 2017(3) | ||||||||||||||||||||||||
| (tons) | (tons) | |||||||||||||||||||||||||||||||
Korba | Ingots/Busbar/Billets | 104,650 | 93,442 | 202,769 | ||||||||||||||||||||||||||||
| Ingots/Busbar/Billets | 34,714 | 104,650 | 93,442 | Rods | 172,464 | 217,650 | 205,277 | |||||||||||||||||||||||||
| Rods | 166,239 | 172,464 | 217,650 | Rolled products | 46,807 | 20,526 | 19,033 | |||||||||||||||||||||||||
| Rolled products | 51,083 | 46,807 | 20,526 |
|
|
| ||||||||||||||||||||||||||
|
|
| ||||||||||||||||||||||||||||||
Total(1) | 252,035 | 323,921 | 331,618 | 323,921 | 331,618 | 427,079 | ||||||||||||||||||||||||||
|
|
|
|
|
| |||||||||||||||||||||||||||
Notes:
| (1) | Reflects total of ingots, rods and rolled products. |
| (2) | Includes production of |
| (3) | Includes production of |
The following table sets out the total bauxite ore production for each of BALCO’s mines for fiscal years ended March 31, 2014, 2015, 2016 and 2016:2017:
| For the Year Ended March 31, | For the Year Ended March 31, | |||||||||||||||||||||||||||||
Mine (Type of Mine) | Product | 2014 | 2015 | 2016 | Product | 2015 | 2016 | 2017 | ||||||||||||||||||||||
| (tons, except for percentages) | (tons, except for percentages) | |||||||||||||||||||||||||||||
Mainpat (Open-pit) | Bauxite ore mined | — | — | 455 | Bauxite ore mined | — | 455 | 73,170 | ||||||||||||||||||||||
| Ore grade | — | — | 47.7% | Ore grade | — | 47.7% | 43.6% | |||||||||||||||||||||||
Bodai-Daldali (Open-pit) | Bauxite ore mined | 472,155 | 860,710 | 1,033,300 | Bauxite ore mined | 860,710 | 1,033,300 | 1,065,300 | ||||||||||||||||||||||
| Ore grade | 46.9% | 46.8% | 46.9% | Ore grade | 46.8% | 46.9% | 46.7% | |||||||||||||||||||||||
|
|
|
|
|
| |||||||||||||||||||||||||
Total | 472,155 | 860,170 | 1,033,755 | 860,170 | 1,033,755 | 1,138,470 | ||||||||||||||||||||||||
|
|
|
|
|
| |||||||||||||||||||||||||
Principal Raw Materials
The principal inputs of BALCO’s operations are alumina, power, carbon and certain other raw materials. BALCO has in the past been able to secure an adequate supply of the principal inputs for its business.
Alumina
Alumina is the primary raw material used in the production of aluminium. Our Lanjigarh refinery supplies majority of the alumina requirements (after converting the bauxite supplied by BALCO to the Lanjigarh refinery). BALCO currently sources all of its remaining alumina from third-party suppliers in international markets. The alumina sourced externally is metallurgical grade calcined alumina with a minimum alumina content of 98.6% on a dry basis. In fiscal years 2014, 2015, 2016 and 2016,2017, BALCO purchased 355,950 tons, 317,701 tons, 299,375 tons and 299,375447,883 tons of alumina at an average price of $ 397,374, $ 374323 and $ 323314 per ton, respectively, on a cost, insurance and freight or CIF basis at the port of Vizag, Kakinada and Gangavaram, India.
Power
Smelting primary aluminium requires a substantial, continuous supply of electricity. As a result, power is a key input at BALCO’s Korba facility, where it is provided by twothree coal-based captive power plantplants of 270 MW, 540 MW and CPP 600 MW. Our captive power plant has historically been dependent upon coal allocations from Coal India Limited. In November 2007, BALCO received a coal block allocation of 211.0 million tons for use in its captive power plants. These allocated coal blocks are regarded as non-reserve coal deposits. BALCO received the environmental clearance on May 24, 2012 and the second stage forest clearance for the 211.0 million tons coal block on November 14, 2012. The said coal block was deallocated during fiscal year 2015. However, the company received another coal block namelyknown as the Chotia coal block through ane-auction. The total reserves at the e-auction.Chotia block are 17.2 million tons with an annual production capacity of one million tons. BALCO’s total coal requirement at full capacity is approximately 10 million tons. Hence, the Chotia coal block can meet 10% of the total coal requirement.
Power for BALCO’s mines is provided byon-site diesel generators. BALCO is constructinghas constructed a CPP 600 MW coal-based thermal power facility which was commissioned during fiscal year 2016. The power generated from CPP 600 MW will beis utilized in the 325,000 tpa smelter being set up.smelter.
Water
Water is also an important input for BALCO’s captive power plants. BALCO sources its water requirements at Korba from a nearby canal, with the water transported by pipelines. BALCO is currently in a dispute with the National Thermal Power Corporation (“NTPC”) regarding the right of way for its water pipeline that supplies water to its 270 MW captive power plant, which has been built through National Thermal Power Corporation premises. Arbitration proceedings commenced in 2009 and the order was reserved on June 30, 2014. BALCO and National Thermal Power Corporation submitted a joint survey report to the Arbitrator.arbitrator. On the issue of easmentary rights, the Arbitratorarbitrator issued itsan award dated January 11, 2016 in favourfavor of BALCO and rejected all counter claims of the NTPC.National Thermal Power Corporation. The NTPCNational Thermal Power Corporation has challenged the said award by filing an application under section 34 before the Honorable High Court of Delhi which was listed for admission on May 5, 2016 and the court has ordered for issuance of notice. The next hearing will take place on August 19, 2016.29, 2017. BALCO has also filed the application under section 34 before the Honorable High Court of Delhi with respect to claims which were rejected by the Arbitratorarbitrator which is to be listed in due course. During the year,In addition, BALCO received anotherhas a water allocationsupply arrangement of 713 million cubic meters (MCM) p.a.per annum for the 540 MW power plant and 28 million cubic meters per annum for the 1200 MW facility.power plant, of which 21 million cubic meters of water allotment has been received until March 31, 2017. See “Item 3. Key Information-D. Risk Factors—Risks Relating to Our Business- Our operations are subject to risks that could result in decreased production, increased cost of production and increased cost of or disruptions in transportation, which could adversely affect our revenue, results of operations and financial condition.”
Carbon
Carbon is an important raw material to the aluminium smelting process. Carbon is used in the process of electrolysis, in the form of cathodes and anodes, with the latter the biggest component of BALCO’s carbon costs. Anodes are made up of carbonaceous material of high purity. Forpre-baked anodes, green carbon paste made of calcined petroleum coke and coal tar pitch is compacted or pressed into the required form. These anodes are baked before their use in electrolytic cells, or pots.
BALCO hasin-house facilities to manufacture carbon anodes to meet its entire carbon anode requirements. Calcined petroleum coke, coal tar pitch and fuel oil, which are the key ingredients for the manufacture of carbon anodes, are sourced primarily from the Indian market. There is an adequate supply of these raw materials in India, though their prices are generally determined by movements in global prices. At times, based on commercial comparison, orders for import are also placed.
Other Raw Materials
BALCO also uses other raw materials such as fluorides and other chemicals. For these raw materials, there are several sources of supplies in the domestic markets and BALCO does not foresee any difficulty in securing supplies when needed.
Distribution, Logistics and Transport
Bauxite mined from the Mainpat and Bodai-Daldali mines is transported by road to BALCO’s Korba facility. The alumina purchased from third party suppliers is transported to the Korba facility by rail and ships. BALCO’s aluminium products are transported from the Korba facility to domestic customers through a combination of road and rail, and shipped for export.
Sales and Marketing
BALCO’s 10 largest customers accounted for approximately 42.0%47.0%, 47.0%58.4% and 58.4%59.7% of its revenue for aluminium business in fiscal years 2014, 2015, 2016 and 2016,2017, respectively. TwoOne of the BALCO’s customers accounted for greater than 16% of BALCO’s revenue in fiscal year 2017 and two of BALCO’s customers accounted for greater than 23.19% of BALCO’s revenue in fiscal year 2016. No customer accounted for greater than 10.0% of BALCO’s revenue in the fiscal years 2014 andyear 2015.
BALCO’s sales and marketing head office is located in Mumbai, and it has field sales and marketing offices in most major metropolitan centers in India. Currently, BALCO sells its products primarily in the Indian market, with limited focus on exports. However, with the further commissioning of the new 325,000 tpa aluminium smelter, a significant part of the additional production will be sold in the export market. BALCO’s key customers include conductor manufacturers, state road transport corporations, railways, defense contractors, and electrical equipment and machinery manufacturers.
Domestic sales of primary aluminium are based on the London Metal Exchange (“LME”) aluminium cash settlement price and mainmainly Japanese port premiums. The majority of sales is from long term contracts and Memorandum of Understanding with end users. Our objective is to achieve LME of the month of the scheduled shipment average. Customers book the monthly quantity by the first day of the month and we hedge the same on LME. BALCO’s export sales of aluminium are currently on a spot and long term contract basis at a price based on the LME price plus a premium.
Projects and Developments
On October 7, 2006, BALCO entered into a memorandum of understanding with the state government of Chhattisgarh, India, and the Chhattisgarh State Electricity Board, under which, among other things, feasibility studies will be undertaken to build a thermal coal-based 1200 MW power facility, along with an integrated coal mine in the state of Chhattisgarh at an estimated cost of Rs. 46,500 million ($ 701.9717.0 million). The project was disrupted in September 2009 due to the collapse of a chimney under construction during heavy rains and lightning at Korba. There were 40 fatalities in the accident and SEPCO Electric Power Construction Corporation, our contractor and thesub-contractor Gamon Dunkerley and Company Limited, are the subject of an investigation by the Chhattisgarh government. The matter is scheduled to be heard on October 26, 2016.27, 2017. We instituted an enquiry which was conducted by the Indian Institute of Technology Rourkee, an expert in the civil engineering field in India. The project was resumed in January 2010. BALCO has constructed 1200 MW (300 MW x 4) thermal power plant. Three units of 300 MW each were commissioned during fiscal year 2016 and the last unit has beenwas commissioned and commenced commercial production fromon May 1, 2016.
In addition, on August 8, 2007, BALCO entered into a memorandum of understanding with the state government of Chhattisgarh for a potential investment to build an aluminium smelter with a capacity of 650,000 tpa at Chhattisgarh at an estimated cost of Rs. 81,000 million ($ 1,222.61,249.0 million). The first of two phases of this project commenced with the setting up of a 325,000 tpa aluminium smelter at an estimated cost of Rs. 38,000 million ($ 573.6586.0 million), which usespre-baked GAMI technology. BALCO has received environmental clearances for both phases of the project. Construction has commenced and trial production started in February 2014 from the 325,000 tpa aluminium smelter and 84 pots started commercial production from September 2014. During fiscal year 2017, company started commercial production from another 84 pots from August 1, 2016. Balance 168 pots are operationalized from May 1, 2017.
As of March 31, 2016,2017, the estimated cost of building the 325,000 tpa aluminium smelter and 1200 MW power facility is Rs. 106,630107,500 million ($ 1,609.51,657.7 million). As of March 31, 2016,2017, Rs. 93,995100,301 million ($ 1,418.81,546.7 million) was spent.
BALCO received a coal block allocation in fiscal year 2007 of 211 million tons for use in its captive power plants which was subsequently deallocated in fiscal year 2015 pursuant to the orders of the Supreme Court of India. Consequently, in fiscal year 2015, the company made an assessment for the recoverability of the amount incurred thus far, and made a provision for Rs. 294.1 million ($ 4.4 million) in its income statement.
Market Share and Competition
BALCO is among the four primary producers of aluminium in India and together with our aluminium business in Odisha, has a combined primary market share of 40.0%38.7% in fiscal year 2016,2017, according to Aluminium Association of India. BALCO’s key competitors (and their respective primary market shares by volume in India in fiscal year 2016)2017) are Hindalco Industries Limited (42.0%(42.9%) and National Aluminium Company Limited, a GoI enterprise (18.0%(18.4%).
Aluminium ingots, wire rods and rolled products are commodity products and BALCO competes primarily on the basis of price and service, with price being the most important consideration when supplies are abundant. Aluminium competes with other materials, particularly plastic, steel, iron, glass, and paper, among others, for various applications. In the past, customers have demonstrated a willingness to substitute other materials for aluminium.
Coal mining operations
Thermal coal is a key raw material required for the operation of BALCO’s captive power plants. In September 2014, the Supreme Court of India canceled all the coal blocks that had been awarded to companies in India by the Ministry of Coal between 1992 and 2012 to all companies in India.2012. Consequently, in February 2015, the GoI conducted an auction to award mining rights to successful bidders for all such coal blocks. During the fourth quarter of fiscal year 2015, BALCO was successful in securing one coal mine in coal block auctions conducted by the GoI, namelyknown as the Chotia coal block (“Chotia) and wasin the highest bidder for the Gare Palma IV/1GoI coal block (“Gare Palma”).auctions. The Chotia coal block was acquired to support BALCO’s captive power plants. BALCO was also successful in its bid for the Gare Palma IV/1 coal block, but the GoI challenged and rejected the award and BALCO does not intend to file any further petitions to appeal for its bid on the coal block.
The Chotia coal mineblock is located in Korba district in the Statestate of Chhattisgarh. The total reserves at the Chotia block are 17.517.2 million tons with thean annual production capacity of one million tons.
The following tables contain details of our coal mining operations.
| 1. | The Chotia coal mine is divided into twosub-blocks, Chotia I and Chotia II. Both of these blocks are assigned to the existing captive power facilities at our BALCO operations. The estimates provided below are based on the DMT report. |
Blocks | Gross CV range (Min – Max) | Sulphur (%) | ||
| Kcal/kg | ||||
| 0.30-0.60 (Total)* | ||||
| Chotia II | 0.30 (Total)* |
| * | Sulphur data is not available for all seams. Total is based only on available seam data. |
| 2. | This coal, which is thermal grade coal, would be blended with low GCV coal before being fed to the Boiler. |
| 3. | The extractable coal indicated is considering all losses. This number reflects the final tonnage of the mine. There is no plan of putting wash plant either at the mine site or at the plant as the coal is of high GCV. |
Mine Location | Means of Access | Ownership | Operator | Title, leases or Options | History | Mine type mineralization style | Power |
| Facilities, use and condition | |||||||||
Chotia Coal Mine, Tehsil-Podiuprodha District Korba
State Chhattisgarh | Public
Coal transported by road to BALCO
Distance between mines and BALCO | BALCO-100% | MDO-Mode
Dhansar Engineering Company Private Limited | Mining
Mining
Lease executed on
Valid | Mines commenced coal production in 2006 | Open Cast and Underground
Opencast is operational since 2006
No
Thermal
One single | Electricity is available from Rural Feeder of Chhattisgarh State Electricity Board | Site | ||||||||||
|
|
We source coal from the following principal sources:
The total volume of coal consumed annually by our coal-fueled power plants is largely dependent on the amount of generation and ranges between 9 million to 10 million tons.
For the year ended March 31, 2016,2017, Vedanta Limited produced 0.120.18 million tons of coal from our only coal mine which is situated in Korba.
Set forth below is a map depicting the location of our coal properties for our coal mining operations:
Set forth below are maps depicting access to both Chotia and Gare Palma coal blocks:
Location - Gare Palma IV/1
(b) Our Aluminium Business in Odisha
Overview
Our aluminium business in Odisha was earlierpreviously operated by Vedanta Aluminium, which was merged with us pursuant to theRe-organization Transactions. Our Odisha aluminium operations include a 1.02.0 million tpa alumina refinery at Lanjigarh, with an associated 7590 MW captive power plant. In addition, we have a green-fieldgreenfield 500,000 tpa aluminium smelter (“Plant 1”), together with an associated 1,215 MW (nine units with a capacity of 135 MW each) coal-based captive power plant in Jharsuguda. We are also setting up another 1,250,000 tpa aluminium smelter (“Plant 2”) in Jharsuguda. 84 pots from the first line of this smelter have beenwere commissioned during fiscal year 2015 and of which 80 pots were capitalized on December 1, 2015 and a further ramp up recommencedcommenced from April 1, 2016. During fiscal year 2017, a total of 424 pots were capitalized.
The alumina refinery at Lanjigarh was commissioned in March 2010 and produced 970,8931,207,957 tons of alumina in fiscal year 2016.2017. Greenfield smelter project of 500,000 tpa at Jharsuguda was implemented in two phases of 250,000 tpa each. Phase 1 was completed on November 30, 2009 and Phase 2 was completed on March 1, 2010. The metal production for fiscal year 20162017 was 516,096530,198 tons from Plant 1 and 25,166170,388 tons production from Plant 2 and the net generation of the captive power plant was 8,4977,824 million units.units and 6,436 million units from the 1215 MW power plant and 1800 MW power plant respectively.
Principal Products
Primary aluminium is produced from the smelting of metallurgical grade alumina. We produce primary aluminium in the form of ingots, billets and wire rods for sale. Ingots are used extensively for aluminium castings and fabrication in the construction and transportation industries. Billets are used extensively in construction (windows and door frames), transportation, engineering, consumer durables, automotive forgings and many other applications. Wire rods are used in various electrical applications especially in the form of electrical conductors and cables.
Delivery to Customers
Ingots, billets and wire rods are transported by trucks and rake to customers in India and by rakes to ports for export.
Principal Facilities
Overview
The following map shows the details of the locations of the aluminium segment’s facilities in the State of Odisha:

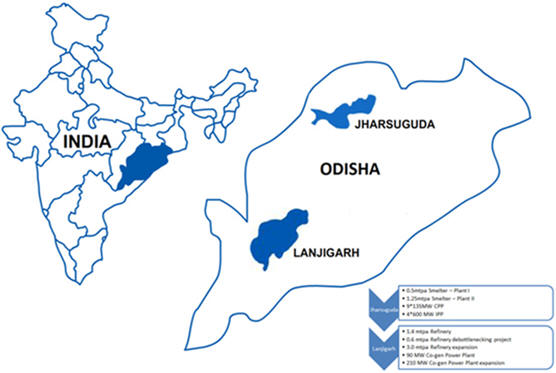
The following table sets forth the capacities as on March 31, 20162017 at our Lanjigarh and Jharsuguda facilities:
| Capacity tpa | ||||
Facility | ||||
Lanjigarh Alumina Refinery | ||||
Jharsuguda Aluminium Smelter | 500,000 | |||
Jharsuguda Aluminium Smelter (under construction) | ||||
Lanjigarh
Alumina refinery and captive power plant
The Lanjigarh alumina refinery is located in the Lanjigarh district in the state of Odisha, which is located approximately 450 km from BALCO’s Korba facility in the state of Chhattisgarh. In March 2007, we began the progressive commissioning of a 1,000,000 tpa Greenfield1 mtpa greenfield alumina refinery, expandable to 1.4 mmtpamtpa of installed capacity and an associated 75 MW captive power plant, expandable to 90 MW. The captive power plant is fully operational and can meet the power requirements of the refinery. The second production stream of the Lanjigarh alumina refinery was commissioned in March 2010. Production of alumina at the refinery at Lanjigarh was temporarily suspended since December 5, 2012, due to inadequate availability of bauxite and the plant recommenced operations on July 12, 2013. We are currently in discussions with government authorities for sourcing adequate supply of bauxite. Production at the alumina refinery does not affect production at the smelters.
We planned to expand our alumina refining capacity at Lanjigarh to 5 mmtpa by increasing the current alumina refinery’s capacity to 2,000,000 tpa by de-bottlenecking and then further expand the refinerymtpa by constructing a second alumina refinery, with a refining capacity of 3 mmtpamtpa along with an associated 210 MW captive power plant. The expansion of the alumina refinery and related mining operations in and around the Niyamgiri was put on hold in October 20, 2010, when the MoEF directed us to hold from further expansion. Nonetheless, environmentalEnvironmental clearance for the Lanjigarh expansion project was received on November 20, 2015 for up to 4 mtpa, and an additional environmental clearance for up to 6 mtpa will be received after the completion of land acquisition of the balance area of 666.03 HA. Further, a Consentconsent to Establishestablish for 64 mtpa and a Consentconsent to Operateoperate for 2 mpta haswas also been obtained. However, construction activities continue to be on hold and the management is evaluating the timing for resuming construction activities in Lanjigarh. As approvals for expansion from 2 mtpa to 4 mtpa of the Lanjigarh refinery to 4 mtpa has been received, second stream operations have commenced at the Aluminaalumina refinery from April 2016 and the debottlenecked capacity has reached 1.7–2.0 million tonnestons per annum (although this is contingent on the bauxite quality). When we have further visibility on bauxite sources, a further ramp-up to 4 million tonnes will be considered. See “Item 8. Financial Information - Information—A. Consolidated Statements and Other Financial Information – Legal Proceedings” for further details.
Jharsuguda
Aluminium smelter and Captive Power Plant
The Jharsuguda aluminium smelter is located in Jharsuguda in the state of Odisha in India. Operations in the Jharsuguda facility were implemented in two phases. The first phase has a production capacity of 250,000 tpa and was completed in November 2009. The second phase was commissioned in June 2010. A total of 9 units of the associated 1,215 MW coal-based thermal captive power plant of 135 MW each have been commissioned. The captive power plant units meet the power requirements of the Jharsuguda smelter and all other power requirements of this facility. We are also setting up ana 1,250,000 tpa aluminium smelter and capitalized 80 pots also during fiscal year 2016. During fiscal year 2017, a total of 424 pots were capitalized. Power to the new smelter will be provided by our 2,4001,800 MW power plant in Jharsuguda.
Production Volumes
The following table sets out our total production from our Lanjigarh and Jharsuguda facilities for fiscal years 2014, 2015, 2016 and 2016:2017:
| For the year ended March 31 | For the year ended March 31 | |||||||||||||||||||||||||||||||
| (tons) | (tons) | |||||||||||||||||||||||||||||||
Facility | Product | 2014 | 2015 | 2016 | Product | 2015 | 2016 | 2017 | ||||||||||||||||||||||||
Lanjigarh | Calcined Alumina | 524,060 | 976,915 | 970,893 | Calcined alumina | 976,915 | 970,893 | 1,207,957 | ||||||||||||||||||||||||
Jharsuguda | Ingots | 301,008 | 303,756 | 333,249 | Ingots | 303,756 | 333,249 | 474,288 | ||||||||||||||||||||||||
| Billets | 121,232 | 115,979 | 110,400 | Billets | 115,979 | 110,400 | 146,023 | |||||||||||||||||||||||||
| Wire rods | 120,013 | 133,603 | 139,184 | Wire rods | 133,603 | 139,184 | 119,471 | |||||||||||||||||||||||||
| Hot metal | — | — | 8,892 | Hot metal | — | 8,892 | 46,541 | |||||||||||||||||||||||||
|
|
|
|
|
| |||||||||||||||||||||||||||
| 542,253 | 553,338 | 591,725 | 553,338 | 591,725 | 786,323 | |||||||||||||||||||||||||||
|
|
|
|
|
| |||||||||||||||||||||||||||
Principal Raw Materials
The principal inputs of the aluminium operations are bauxite, alumina, power, carbon and certain other raw materials.
Bauxite
Currently, we do not have any dedicated mining source and are in the process of identifying bauxite mining sources across India. Currently, bauxite is being sourced mainly through imports (34.1%(45.7%), from the domestic market in the west coast (6.3%(23%), BALCO mines (33.6%(31.3%) and the remaining from Madhya Pradesh, Chhattisgarh, Jharkhand and Andhra Pradesh.
Alumina
Alumina is the primary raw material used in the production of aluminium. We currently source alumina largely from third-party suppliers in international markets. The alumina sourced externally is metallurgical grade calcined alumina with a minimum alumina content of 98.6% on a dry basis. In fiscal years 2014, 2015, 2016 and 2016,2017, we purchased 0.72 million tons, 0.37 million tons, 0.47 million tons and 0.470.77 million tons of alumina at an average price of $ 352357 per mt, $ 357353 per mt and $ 353311 per mt, respectively, on a cost, insurance and freight basis at the port situated in the state of Andhra Pradesh.
Power
Smelting primary aluminium requires a substantial and continuous supply of electricity. As a result, power is a key input at our Jharsuguda facility, where itpower is provided by nine coal-based captive power plantplants of 135 MW each. To meet the additional power requirements of the second Smelter, three thermal power plant units of 600 MW each of Odisha based Thermal Power Plant at Jharsuguda has been converted to captive power plants based on an order issued by the Odisha Electricity Regulatory Commission with effect from April 1, 2015. We have been sourcing coal through coal linkage from Mahanadi coal field, imports,e-auction and from washeries. The linkage coal quantity from Mahanadi coal field is transported through bottom discharge wagons.
The power plant at Jharsugada sources coal from sources such as the GoI’s coal mining companies, long-term coal supply agreements with various state governments under PPA’sPPAs and from imports. In fiscal year 2016,2017, the total coal purchased from these other sources was 7.217.11 million tons.tons for 135 x 9 MW and 4.42 million tons for 600 x 3 MW power plants.
The total volume of coal consumed annually by coal-fueled power plants is largely dependent on the amount of generationgeneration. During fiscal year 2017, total coal consumed by 135 x 9 MW and ranges is 7.14600 x 3 MW power plants was 7.19 and 4.5 million tons.tons respectively.
Water
Water is also an important input for our captive power plants. We source our water requirements at Jharsuguda from Hirakud Dam situated over a distance of 33 km, with the water transported by pipelines. Water from the dam is stored at water reservoir inside the plant, from where the water is purified in a demineralize plant to make it fit for use in the power plant.
Carbon
We have ourin-house facilities to manufacture carbon anodes to meet our entire carbon anode requirements. Calcined petroleum coke, coal tar pitch and fuel oil, which are the key ingredients for the manufacture of carbon anodes, are sourced primarily from the domestic Indian market. There is an adequate supply of these raw materials in India, though their prices are generally determined by movements in global prices. At times, based on commercial comparison, orders for import are also placed.
Other Raw Materials
We also use other raw materials such as fluorides and other chemicals. For these raw materials, there are several sources of supplies in the domestic markets and we do not foresee any difficulty in securing supplies when needed.
Distribution, Logistics and Transport
The alumina purchased from third party suppliers is transported to the Jharsuguda facility by rail and ports. Our aluminium products are transported from the Jharsuguda facility to domestic customers through a combination of road and rail, and shipped for export.
Sales and Marketing
Our 10 largest customers of our Odisha aluminium business accounted for approximately 39.5%46.3%, 46.3%53.4% and 53.4%63.1% of Odisha aluminium business in fiscal years 2014, 2015, 2016 and 20162017 respectively. One of our Odisha aluminium business customers accounted for 12.2% and 10.2% of Odisha aluminium business revenue in fiscal year 2016.2016 and 2017, respectively. None of the customers accounted for greater than 10.0% of our Odisha aluminium business in fiscal years 2014 andyear 2015.
The sales and marketing head office is located in Mumbai and we have field sales and marketing offices in most major metropolitan centers in India. Currently, our aluminium business sells only primary products and has equal focus on both the Indian and the exports market. Our key customers include cables and conductor manufacturers, transport sector and electrical equipment and machinery manufacturers.
Domestic sales are normally conducted on the basis of domestic supply and demand conditions with the pricing methodology as LME based pricing, where the LME on the day of order confirmation by the customer forms the basis for billing. The domestic price for aluminium is normally higher than the price it charged in the export markets due to the tariff structure, smaller order sizes that domestic customers place and the packaging, storing and truck loading expenses incurred when supplied to domestic customers.
Our aluminium export sales are currently on both spot and long term basis at a price based on the LME price plus a premium. Long term contracts range from three months to one year and sales are maximized in focus markets though we are trying to establish our presence in all markets to minimizegeo-political risks.
Projects and Developments
We plan to invest Rs. 106,000 million ($ 1,600.01,634.5 million) to expand our alumina refining capacity at Lanjigarh to 5 mmtpamtpa by (i) increasing the current alumina refinery’s capacity to 2,000,000 tpa by de-bottlenecking; (ii) constructing a second alumina refinery with a capacity of 3 mmtpa;mtpa; and (iii)(ii) constructing an associated 210 MW captive power plant. The expansion of the alumina refinery at Lanjigarh was on hold since October 20, 2010 due to the order passed by the MoEF’s restricting us from any further expansion of this refinery.
Against this order, we filed a writ petition in the High Court of Orissa and the Court dismissed our petition. We subsequently made an application to the MoEF to reconsider the grant of the environmental clearance for our alumina refinery. The MoEF by its letter dated February 2, 2012, issued fresh terms of reference to us for preparation of the Environment Impact Assessment report. We submitted the Environment Impact Assessment report to the Orissa Pollution Control Board and parallelysimultaneously submitted various representations to the MoEF as well as the Project Monitoring Group established under the Cabinet Committee on Investments. The expert appraisal committee of the MoEF reconsidered the project and revalidated the terms of reference for 22 months effective January 2014. Therefore the ban imposed on the expansion of our alumina refinery was lifted and we are pursuing the matter with the state government. The public hearing was held on July 30, 2014 subsequent to which the expert appraisal committee, in its meeting held on January 9, 2015, has recommended the project for environmental clearance and for the further expansion of our Lanjigarh refinery. In respect of the Lanjigarh Expansion project, environmental clearance for the Lanjigarh expansion project was received on November 20, 2015 for up to 4 mtpa, and an additional environmental clearance for up to 6 mtpa will be received after the completion of land acquisition of the balance area of 666.03 HA. Further, a Consentconsent to Establishestablish for 64 mtpa and a Consentconsent to Operateoperate for 2 mpta has also been obtained. However, construction activities continue to be on hold and the management is evaluating the timing for resuming construction activities in Lanjigarh. As approvals for expansion of the Lanjigarh refinery to 4 mtpa has been received, second stream operations have commenced at the Alumina refinery from April 2016, the debottlenecked capacity has reached 1.7–2.0 million tonnestons per annum (although this is contingent on the bauxite quality). When we have further visibility on bauxite sources, a furtherramp-up to 4 million tonnestons will be considered. See “Item 8. Financial Information- A. Consolidated Statements and Other Financial Information – Legal Proceedings” for details. As of March 31, 2016,2017, we spent Rs. 55,38755,576 million ($ 836.0857.0 million) on the Lanjigarh expansion project.
We are also investing an estimated Rs. 145,000 million ($ 2,188.72,235.9 million) to set up a second 1,250,000 tpa aluminium smelter. Power tofor the new smelter will be provided by our 2,4001,800 MW commercial power plant at Jharsuguda. As of March 31, 2016,2017, we spent Rs. 124,760134,120 million ($ 1,883.22,068.2 million) on this project.
Our Commercial Power Generation Business
Overview
We have been building and managing power plants since 1997. As of March 31, 2016,2017, the total power generating capacity of our thermal power plants, wind power plants and gas based plants was 8,040.09,000.0 MW, which includes our thirteenfourteen thermal coal-based captive power plants with a total power generation capacity of 5,840.55,239.6 MW. The following table sets forth information relating to our existing power plants as of March 31, 2016:2017:
Fiscal Year Commissioned | Capacity | Location | Fuel Used | Capacity | Location | Fuel Used | ||||||||||
| (MW) | (MW) | |||||||||||||||
1988(1) | 270.0 | Korba | Thermal Coal | 270.0 | Korba | Thermal Coal | ||||||||||
1997 | 24.0 | Tuticorin | Liquid fuel | 24.0 | Tuticorin | Liquid fuel | ||||||||||
1999 | 75.0 | Mettur Dam | Thermal Coal | 75.0 | Mettur Dam | Thermal Coal | ||||||||||
2003 | 7.4 | Debari | Liquid fuel | 7.4 | Debari | Liquid fuel | ||||||||||
2003 | 6.0 | Zawar | Liquid fuel | 6.0 | Zawar | Liquid fuel | ||||||||||
2003 | 14.8 | Chanderiya (2) | Liquid fuel | 14.8 | Chanderiya(2) | Liquid fuel | ||||||||||
2003 | 4.8 | Cambay | Gas based | 4.8 | Cambay | Gas based | ||||||||||
1999 and 2003 | 10.0 | Ravva | Gas based | 10.0 | Ravva | Gas based | ||||||||||
2005 | 7.5 | Tuticorin | Liquid fuel | 7.5 | Tuticorin | Liquid fuel | ||||||||||
2005 | 15.0 | Pantnagar | Liquid fuel | 15.0 | Pantnagar | Liquid fuel | ||||||||||
2005 | 154.0 | Chanderiya | Thermal coal | 154.0 | Chanderiya | Thermal coal | ||||||||||
2006 | 540.0 | Korba | Thermal coal | 540.0 | Korba | Thermal coal | ||||||||||
2007 | 75.0 | Lanjigarh | Thermal coal | 75.0 | Lanjigarh | Thermal coal | ||||||||||
2007 | 107.2 | Gujarat and Karnataka | Wind(3) | 107.2 | Gujarat and Karnataka | Wind(3) | ||||||||||
2007 | 30.0 | Amona | Gas based | 30.0 | Amona | Gas based | ||||||||||
2008 | 80.0 | Chanderiya | Thermal coal | 80.0 | Chanderiya | Thermal coal | ||||||||||
2009 | 80.0 | Zawar | Thermal coal | 80.0 | Zawar | Thermal coal | ||||||||||
2009 | 16.0 | Gujarat and Karnataka | Wind(3) | 16.0 | Gujarat and Karnataka | Wind(3) | ||||||||||
2009 | 675.0 | Jharsuguda | Thermal coal | 675.0 | Jharsuguda | Thermal coal | ||||||||||
2009 | 25.0 | Mettur Dam | Thermal coal | 25.0 | Mettur Dam | Thermal coal | ||||||||||
Fiscal Year Commissioned | Capacity | Location | Fuel Used | Capacity | Location | Fuel Used | ||||||||||
| (MW) | (MW) | |||||||||||||||
2010 | 540.0 | Jharsuguda | Thermal coal | 540.0 | Jharsuguda | Thermal coal | ||||||||||
2010 | 3.3 | Rajasthan Raageshwari Gas terminal | Gas based | 3.3 | Rajasthan Raageshwari Gas terminal | Gas based | ||||||||||
2010 | 14.4 | Gujrat Viramgam Terminal | Gas based | 14.4 | Gujrat Viramgam Terminal | Gas based | ||||||||||
2010 | 32.5 | Pipeline Above Ground Installations | Gas based | 32.5 | Pipeline Above Ground Installations | Gas based | ||||||||||
2011 | 1200.0 | Jharsuguda | Thermal coal | 1200.0 | Jharsuguda | Thermal coal | ||||||||||
2011 | 48.0 | Rajasthan and Karnataka | Wind | 48.0 | Rajasthan and Karnataka | Wind | ||||||||||
2011 | 174.3 | Dariba | Thermal coal | 174.3 | Dariba | Thermal coal | ||||||||||
2012 | 103.0 | Karnataka, Maharashtra, Rajasthan and Tamil Nadu | Wind(3) | 103.0 | Karnataka, Maharashtra, Rajasthan and Tamil Nadu | Wind(3) | ||||||||||
2012 | 600.0 | Jharsuguda | Thermal coal | 600.0 | Jharsuguda | Thermal coal | ||||||||||
2012 | 30.0 | Amona | Gas based | 30.0 | Amona | Gas based | ||||||||||
2013 | 600.0 | Jharsuguda | Thermal coal | 600.0 | Jharsuguda | Thermal coal | ||||||||||
2013 | 80.0 | Tuticorin | Thermal coal | 80.0 | Tuticorin | Thermal coal | ||||||||||
2013 | 6.5 | Mettur Dam | Thermal coal | 6.5 | Mettur Dam | Thermal coal | ||||||||||
2014 | 80.0 | Tuticorin | Thermal coal | 80.0 | Tuticorin | Thermal coal | ||||||||||
2010 and 2014 | 60.0 | Rajasthan Mangala Processing terminal | Thermal coal | 60.0 | Rajasthan Mangala Processing terminal | Thermal coal | ||||||||||
2015 | 31.3 | Gujrat Bhogat terminal | Thermal coal | 31.3 | Gujrat Bhogat terminal | Thermal coal | ||||||||||
2015 | 660.0 | Mansa- Talwandi Sabo Road, Mansa, Punjab | Thermal coal | 660.0 | Mansa- Talwandi Sabo Road, Mansa, Punjab | Thermal coal | ||||||||||
2016 | 660.0 | Mansa- Talwandi Sabo Road, Mansa, Punjab | Thermal coal | 660.0 | Mansa- Talwandi Sabo Road, Mansa, Punjab | Thermal coal | ||||||||||
2016 | 900.0 | Korba | Thermal coal | 900.0 | Korba | Thermal coal | ||||||||||
2017 | 660.0 | Mansa- Talwandi Sabo Road, Mansa, Punjab | Thermal coal | |||||||||||||
2017 | 300.0 | Korba | Thermal coal | |||||||||||||
|
| |||||||||||||||
| 8,040.0 | 9,000.0 | |||||||||||||||
|
| |||||||||||||||
Notes:
| (1) | Commissioned by BALCO prior to our acquisition of BALCO in |
| (2) | Transferred from Debari to Chanderiya in March 2009. |
| (3) | Our wind power plants are not for captive use. |
We have the following power plants under construction/trial run:
Power salesvolumes
The following table sets out total power salesproduction volumes in MU for the last three fiscal years:
| For the Fiscal Year Ended March 31, | For Fiscal Year Ended March 31, | |||||||||||||||||||||||
Facility | 2014 | 2015 | 2016 | 2015 | 2016 | 2017 | ||||||||||||||||||
BALCO 270 MW | 390 | 89 | 169 | 89 | 169 | 0 | ||||||||||||||||||
BALCO 300 MW | — | 10 | 1,025 | |||||||||||||||||||||
BALCO 600 MW | 10 | 1,025 | 2,609 | |||||||||||||||||||||
Jharsuguda 2400 MW coal based thermal power plant | 7,625 | 7,206 | 7,319 | |||||||||||||||||||||
Jharsuguda 600 MW coal based thermal power plant(1) | 7,206 | 7,319 | 3,328 | |||||||||||||||||||||
HZL - Wind Power Plant | 448 | 444 | 415 | |||||||||||||||||||||
HZL Wind Power Plant | 444 | 415 | 448 | |||||||||||||||||||||
MALCO – 106.5 MW coal based thermal power plant | 911 | 897 | 402 | 897 | 402 | 190 | ||||||||||||||||||
TSPL | — | 1,213 | 2,792 | 1,213 | 2,792 | 6,339 | ||||||||||||||||||
|
|
|
|
|
| |||||||||||||||||||
Total | 9,374 | 9,859 | 12,122 | 9,859 | 12,122 | 12,914 | ||||||||||||||||||
|
|
|
|
|
| |||||||||||||||||||
| (1) | Three Jharsugada 600 MW power plants and BALCO 270 MW power plant were transferred from the power to aluminium business on April 1, 2016. |
Power sale includes production under trial run in fiscal years 2014, 2015, 2016 and 20162017 of nil units, 274 million units, nil units and nil units respectively. Jharsuguda Power sale excludes power transfer of 145 MU and 4,757 MU to its smelting facilities in fiscal year 2016.years 2016 and 2017, respectively.
Commercial power plants
We havepreviously had a 2,4002400 MW coal based thermal power plant facility (comprising of four units of 600 MW each) in Jharsuguda in the state of Odisha. The power plant was earlier operated through Sterlite Energy and is now a part of Vedanta pursuant to theRe-organization Transactions. The plant has been built with an estimated investment of approximately Rs. 82,000 million ($ 1,237.71,264.5 million). The first unit of commercial operation commenced in November 2010. The second unit was operational on March 30, 2011 and the third unit was operational in August 19, 2011. The fourth unit was operational on April 26, 2012. On June 17, 2015, we petitioned to OERC to convert the 2400 MW independent power plant into a captive generating plant to cater to the power needs of the 1.25 mtpa smelter at Jharsuguda and consequently, the OERC issued an order of conversion of three units into captive generating plants with effect from April 1, 2015, while retaining the IPP status of one unit to fulfill the obligations under the PPA with GRIDCO. As a result, three of the four 600 MW units were converted to captive generating plants during fiscal year 2017.
ThisThe coal based thermal power plant facility requires approximately 15 million tpa of coal. We have applied to the Ministry of Coal for allotments of coal blocks and long term coal linkages, which are long term supply contracts for delivery of coal meeting specific contract specifications for captive use. In January 2008, the Ministry of Coal jointly allocated the coal blocks in the Rampia and Dip Side Rampia in the state of Odisha to six companies, including Sterlite Energy. The six companies entered into an agreement to jointly promote a new company called Rampia Coal Mine and Energy Private Limited, or RCMEPL, which was incorporated in February 2008.
The Company invested in M/s Rampia Coal Mines and Energy Private Limited, a joint venture incorporated in India that was set up for the purpose of developing coal blocks. The Company acquired Rs. 24.3 million equity shares of Rs 1 each, representing 17.39% of the total equity shares. However, due to the cancellation of coal blocks by the Supreme Court of India, an impairment loss of Rs 24.3 million was recognized in respect of such investment.
Power plants in Odisha source coal from sources such as the GoI’s coal mining companies, long-term coal supply agreements with various state governments under power purchase agreements (‘PPA’s)PPAs and from imports. In fiscal year 2016,2017, the total coal purchased from these other sources was 5.62.62 million tons.
The total volume of coal consumed annually by Odisha’s coal-fueled power plants is largely dependent on the amount of generation and ranges between 5.51.39 million to 6.43.26 million tons.
On April 16, 2008, RCMEPL submitted an application to the state government of Odisha for the grant of a prospecting license, or a license for exploration, which was pending approval from the regulatory authorities. However, Ministry of Coal issued a letter on January 15, 2014 de-allocating the coal block from us. RCMEPL has approached the High Court of Odisha against the action of the Ministry of Coal. On September 24, 2014, the Supreme Court ordered for the cancellation of coal blocks allotted by the government over past few decades.
Additionally, we have been allotted a coal linkage of 2.6 mmtpa for the Jharsuguda project to meet the coal requirements of one of the units of 600 MW of the 2,400 MW power facility,unit, for which fuel supply agreement was entered into with Mahanadi Coalfields Limited has signed fuel supply agreement forwith an assurance of supplying 80% of the letter of assurancetotal quantity. For the remaining 3 X 600 MW units, we are buying coal primarily through the auction route.
The facility is also designed to include a water reservoir, railway marshalling yard, coal stockpile, ash pond and other required facilities. The power generated from the 2,400 MW power plant is sold to entities including state electricity boards, state-owned utility companies, power trading companies, private entities and would be utilized for our 1,250,000 tpa smelter at Jharsuguda on commissioning of the smelter.
In September 2006, Sterlite Energy entered into a power purchase agreement with Grid Corporation of Orissa Limited, a nominee of the state Government of Orissa (“GRIDCO”),GRIDCO, which was amended in August 2009 and further amended on December 2012, in which GRIDCO was granted the right to purchase up to 25.0% of the installed capacity of the power plant after adjustments for auxiliary consumption by us, for approximately up to 561 MW from this project. Further, GRIDCO shall at all times have the right on behalf of the state government of Odisha to receive from the Jharsuguda power project, 7.0% of the power generated (after adjustments for auxiliary consumption by the power plant), up to approximately 157 MW of power at variable cost, if the coal block is allocated within the state or 5.0% of the power generated (after adjustments for auxiliary consumption by the power plant), up to approximately 112 MW of power at variable cost, if the coal block is allocated outside the state as determined by the Orissa Electricity Regulatory Commission (“OERC”). GRIDCO will have the right to purchase power from us once every five years, for a period of 25 years from the date of commercial operation of the last unit. The tariff for the PPA is revised once every five years. This right is an option to purchase rather than a binding commitment of GRIDCO.
In the event GRIDCO decides not to avail part or whole of the above mentioned right during any five year period, it shall give six months’ notice of the same to us prior to the commencement of such period. Power from the power plant to be purchased by GRIDCO will be evacuated by GRIDCO from the bus bar (which is the discharge point of the power plant) of the project. For the evacuation of the remaining power, we have constructed a 400 KVLoop-In-Loop-Out I and a 400 KVLoop-In-Loop-Out II transmission line to connect to the transmission line being developed by Power Grid Corporation India Limited, or (“PGCIL”) near Jharsuguda. Sterlite Energy entered into an agreement with PGCIL in July 2010 to build the dedicated transmission system required for evacuating power from the power plant to the pooling units of PGCIL.
The tariff for the sale of power by us to GRIDCO will be determined by the OERC as follows:
For the sale of power up to 25.0% of the installed capacity:
| (i) | a fixed capacity charge which shall be determined by the OERC as per the terms and conditions of tariff issued from time to time and will be related to target availability. Recovery of fixed capacity charges below the level of target availability shall be done on a pro rata basis and calculated proportionately to the capacity requisitioned to GRIDCO; and |
| (ii) | a variable energy charge, which shall comprise fuel cost and shall be calculated on the basis of theex-bus energy scheduled to be sent out from the generating station. The energy charges shall be calculated as per the methodology prescribed by the OERC from time to time. |
For the sale of power for 7% or 5% depending on the allocation of coal blocks within the state of Odisha a variable energy charge is applicable, which shall comprise fuel cost and shall be calculated on the basis of theex-bus energy scheduled to be sent out from the generating station. The energy charges shall be calculated as per the methodology prescribed by the appropriate commission, from time to time.
On June 12, 2013, the Orissa Electricity Regulatory Commission ordered thepronounced a decision and working methodology on tariff determination forin relation to the procurement of power by GRIDCO for the period from November 2010 to March 2014. WeAggrieved by the order, the Company filed a review petition withbefore the commission against this tariff order,OERC which was nevertheless disposed subsequentlyby the OERC on September 25, 2013. Aggrieved by this decision,
Subsequently, we filed an appeal against the OERC’s decision with the appellate tribunal for electricity (“APTEL”) on October 28, 2013. The appellate tribunalAPTEL in its interim order ondated March 28, 2014 recognized the fact of transmission line constraints and directed the state load dispatch center to recomputefor there-computation of the plant availability factor (PAF) and also advised to schedule the power procurement of GRIDCO for transmission line constraint considerations in the future considering transmission line constraints. After a series of hearings and submissions of technical arguments by the parties to the appeal, the appellate tribunal on November 29, 2014 passed the order upholding its initial judgment and directed GRIDCO to comply with its interim order dated March 28, 2014 on transmission line constraints.future. Subsequently, GRIDCO filed a stay appeal in the Supreme Court against the order of the appellate tribunal which was dismissed by the Supreme Court on March 16, 2015. In a subsequent hearing,Consequently, APTEL directed GRIDCO to pay Rs 640 million to Vedanta Limited, suchthe amount due of Rs. 1,640 million. In compliance with the order, GRIDCO made the payment was received in two instalmentsfiscal year 2016.
Additionally, GRIDCO filed an appeal against the OERC tariff order dated June 12, 2013 in October and November 2015. The hearingAPTEL on the matter related to October 28, 2013 concluded on March 31, 2016 and orders were issuedtransmission constraint issue. This appeal was dismissed by APTEL on May 10, 2016, whereas it upheld the tribunaldecision on transmission constraints as passed in the original OERC order. Simultaneously, APTEL also dismissed our appeal filed on October 28, 2013, while upholding the Company’sissue of transmission constraints.
In September 2016, we received a notice from GRIDCO for the recovery of Rs. 1,640 million paid consequent to the orders of APTEL and Supreme Court, as our main appeal got dismissed by APTEL. Against GRIDCO’s demand for recovery, we filed an appeal for clarification with APTEL and has only partially granted some ofsame was dismissed for the reliefs. The Companyreason that its previous order was self-explanatory. Aggrieved by this dismissal, we filed a review petitioncivil appeal in Supreme Court, but later withdrew the appeal on May 30, 2016 seeking review of said judgment which was not allowed. March 10, 2017.
The Company is pursuing challenging the judgement.
We had petitioned to OERC to convert the 600 MW X 4 IPP into a captive generating plant (“CGP”) to cater to the power needs of the 1.25 MTPA Smelter at Jharsuguda. After extensive deliberation and inconsideration of the facts, the OERC issued an order of conversion of Unit I, III and IV into CGP with effect from April 1, 2015, while retaining the IPP status of Unit II to fulfill the obligation under PPA with GRIDCO.
Tenten largest customers of our Odisha power business accounted for approximately 95%94%, 94%100% and 100% of Odisha power business in fiscal years 2014, 2015, 2016 and 20162017 respectively. Three of the top customers accounted for 78%81%, 81%68%, and 68%100% of our Odisha power business in fiscal years 2014, 2015, 2016 and 2016.2017.
Talwandi Sabo
In July 2008, Sterlite Energy succeeded in an international bidding process and was awarded the project for the construction of a 1,9801980 MW coal-based thermal commercial power plant at Talwandi Sabo in the state of Punjab in India. The project was bid asCase-2 tariff based competitive bidding, implying that the developer had to quote for Capacitycapacity charges and efficiency (SHR).efficiency. Fuel costcosts subject to quoted efficiency was to be a pass-through. All necessary approvals for the project have been obtained and commissioning of this project will bewas carried out in stages. EstimatedThe estimated cost of the project iswas Rs. 115,460 million ($1,742.81,780.4 million). The boiler light up and synchronization of the first unit was achieved in the third quarter of fiscal year 2014. Coal2014, and coal logistics were established in the fourth quarter of fiscal year 2014.
The first and second 660 MW unitunits of the Talwandi Sabo power plant (TSPL) waswere capitalized in fiscal yearyears 2015 and the second2016 respectively. The third 660 MW unit was capitalizedcapitalised on DecemberSeptember 1, 20152016 after the successful completion of trial runs. The third unit will be commissioned in the second quarter of fiscal year 2017.
In May 2008, Sterlite Energy entered into anon-shore and offshore engineering, procurement and construction contract with SEPCO Electric Power Construction Corporation or SEPCO,(“SEPCO”), for Sterlite Energy’s Talwandi Sabo thermal power project for Rs. 66,560 million ($ 1,004.71,026.4 million). A novation agreement in favor of TSPL was executed in November 2009. The contract was revised upwards by $ 74$74 million on November 15, 2012 to reflect theset-up and commissioning of three units of power at the Talwandi Sabo thermal power plant.
SEPCO’s obligations under the contract include testing and delivery of plant and equipment, system design and engineering of plant and equipment in accordance with technical specifications, supervision of civil, structure and manufacturing work, custom clearance, port clearance, inland transportation of offshore as well as onshore plant and equipment, unloading, storage and preservation for all equipment and material required, ash disposal among others within the period specified in the contracts. The fixed contract price is payable in multiple installments according to a fixed payment schedule. SEPCO has provided performance guarantees with respect to various parameters, for instance, net unit heat rate of 2,222.80 kwph/kcal and net unit electric output of 611.82 MW. On February 3, 2016, TSPL terminated the SEPCO EPC contract, due to delays in setting up the project, and for certain defects and deviations not being resolved in a timely manner. However, on April 16, 2016 the parties reached an agreement for the settlement of the EPC contract issues. The revised value of the contract stands at USD 1,041.8 million for offshore supply and service, and Rs. 21,371 million for onshore supply and service.
As of March 31, 2016,2017, Rs. 108,018111,994 million ($ 1,630.51,727.0 million) was spent on this project. This project is financed by internal sources and through debt financing.
On commencement ofAfter commencing all the units, TSPL will requirerequires around 10 million tpa of coal. TSPL has been allotted the linkages from Mahanadi Coal Fields Limited, Odisha for 7.72 million tpa. According to the fuel supply agreement with Mahanadi Coal Fields, 80% of the letter of assurance quantity is 6.17 million tpa. Outtpa, of this,which 5.01 million tpa is to be supplied through domestic sources and the remaining 1.16 million tpa is supplied through imported sources. The balance coal shall be procured through other sources. The linkage coal quantity will be transported from a distance of approximately 1600 km by rail.
TSPL sources coal from sources such as the GoI’s coal mining companies, long-term coal supply agreements with various state governments under PPA’s and from imports. In fiscal year 2016,2017, the total coal purchased from these sources was 2.295.21 million metric tons.
The total volume of coal consumed annually by our coal-fueled power plants is largely dependent on the amount of generation and ranges between 2.046.99 million to 2.848.16 million metric tons for PLF ranging from 40%60% to 55%70%.
In TSPL, there is only one customer which accounted for entire 100% of TSPL power business in fiscal years 2015, 2016 and 2016.2017.
BALCO
BALCO’s power business includes a 270 MW power plant at BALCO’s Korba facility, whichfacility. The 270 MW power plant was previously for captive use before the shutdown of the 100,000 tpatransferred from power business to aluminium smelter at Korbabusiness on June 5, 2009.April 1, 2016. BALCO is also in the process of constructinghas constructed an IPP 600 MW coal-based thermal power facility in the state of Chhattisgarh which had received approval to operate on January 14, 2015 from the regulatory authorities. One unit of 300 MW was commissioned during fiscal year 2016, and the second unit was commissioned and commenced commercial production on May 1, 2016.
HZL—Wind Power Plants
As of March 31, 2016,2017, wind power plants with a combined power generation capacity of 274 MW have been commissioned in the States of Gujarat, Karnataka, Tamil Nadu, Maharashtra and Rajasthan in India at a total cost of Rs. 14,520 million ($ 219.2223.9 million). The electricity from these wind power plants is sold to State Electricity Boards.
During their meeting on January 21, 2016, the HZL’s Board of Directors approved the sale of the Company’s wind power assets subject to the final approval of the price by the board. HZL is in the process of identifying a buyer.
MALCO Energy Limited – Mettur Power Plant
Mettur power plant is a 106.5 MW coal based thermal power plant operated by MALCO Energy Limited in the state of Tamil Nadu.
The plant has been set up in stages, with the first 75 MW set up in the year 1999 to cater to the requirements of the aluminium smelter operated by MALCO. The aluminium operations were closed since November 2008. An additional 25 MW unit was added in the year 2009. Further, a 6.50 MW steam turbine generator was added in 2013, increasing the year 2013 takingtotal capacity to 106.5 MW.
MALCO entered in tointo an energy purchase agreement with Tamil Nadu Electricity Board in January 2009 for the supply of power until April 2009 and entered into an agreement with Power Trading Corporation Limited for the supply of power to Tamil Nadu Electricity Board from April 2009 until May 2011, which was subsequentlyre-entered with Tamil Nadu Electricity Board from June 2011 until May 31, 2016. MALCO hashad entered into an agreement with NTPC Vidyut Vyapar Nigam Limited for supply of power (66.3 MW) to Telangana State Southern Power Distribution Company Limited (TSSPDCL) from June 2016 to May 2017. The tariff for power supply is as provided in the energy purchase agreement. Currently, MALCO does not have any energy purchase agreement for the supply of power. Due to prevailing business conditions, the MALCO plant has been put under care and maintenance from May 26, 2017.
MALCO sources entire coal through imports (Indonesia,(from various countries including Indonesia, Russia and South Africa etc)Africa). In fiscal year 2016,2017, the total coal purchased from these sources was 0.320.22 million tons.
The total volume of coal consumed annually by our coal-fueled power plants is largely dependent on the amount of generation and ranges between 0.5 million to 0.55 million tons.tons at 100% PLF.
MALCO’s 10 largest customers accounted for approximately 96.2%91.6%, 91.6%78.5% and 78.5%100.0% of revenue for MALCO’s power business in fiscal years 2014, 2015, 2016 and 2016,2017, respectively. One of MALCO’s customercustomers accounted for 82.7%88.4%, 88.4%71.1%, and 71.1%42.7% of MALCO’s revenue in fiscal years 2014, 2015, 2016 and 2016.2017.
Other Opportunities in Power
We also sell any excess power generated from our captive power plants to third parties pursuant to commercial arrangements. For example, Vedanta Aluminium entered into a letter of intent dated November 16, 2011 that was revised on September 14, 2012, with GRIDCO for the sale of excess power from its captive power plant at Jharsuguda. We also have an arrangement for the sale of excess power from our captive power plant at Tuticorin.
Port Business
We have a 99.997%100% interest in Vizag General Cargo Berth Private Limited, which won the bid to mechanize the coal handling facilities and upgrade the general cargo berth for handling coal at the outer harbor of Vishakhapatnam port located on the east coast of India. The capacity of the upgraded berth shall beis 10.2 mmtpa, with flexibility to be upgraded to 12.5 mmtpa.
Vizag General Cargo Berth Private Limited has entered into an agreement on October 8, 2010 with the port authority, Vishakhapatnam Port Trust, to mechanize the coal handling facilities and upgrade the general cargo berth on a build-operate-transfer basis for 30 years commencing on the date of award of concession.Theconcession. The company started its commercial operations effective as of March 15, 2013. Vishakhapatnam Port Trust will receivereceives a royalty of 38.1% of the gross revenue earned fromchargeable by Vizag General Cargo Berth Limited as per Tariff Authority for Major Ports which is based on thepre-determined tariff we receive for cargo handling activities as set out in the concession agreement. The estimated project cost was Rs. 6,640.0 million ($ 100.2 million), of which Rs. 6,304 million ($ 95.2 million) was spent.
Sterlite Ports Limited, a 100% subsidiary of Vedanta Limited has received the ‘letteran award of award’letter dated March 31, 2016, for redevelopment of berths 8, 9, barge berths and mechanical ore handling plant at the Port of Mormugao, Goa on a Develop, Build, Finance, Operate and Transfer (“DBFOT”)design-build-finance-operate-transfer basis for 19 mmtpa capacity multi-cargo port terminal in Mormugao Port, Goa. The redevelpoment of the berth will result in the handling of all types of cargo including iron ore, coal, lime stone, bauxite and general cargo with an expected capacity of 19.2 million tons per annum. The company is in the process of forming aterminal. A special purpose vehicle which will entercompany, “Goa Sea Port Private Limited” was incorporated on July 5, 2016 as a wholly owned subsidiary of Sterlite Ports Limited. Goa Sea Port Private Limited entered into an agreement on September 22, 2016 with the Mormugao Port Trust, to operate the berth on a build-operate-transferbuild-finance-operate-transfer basis for 30 years commencing fromon the date of award of concession. The date for fulfillment of condition precedents for commencement of the concession was awarded.has been set as September 15, 2017.
Exploration and Development Activities
We are engaged in ongoing exploration and development activities to locate additional ore bodies in India, Australia, South Africa, Namibia and Ireland. We spent approximately Rs. 5,97113,501 million ($ 90.1208.2 million) in fiscal year 20162017 on exploration.
The focus of our exploration has been sediment hosted zinc deposits in India and oil and gas exploration in India and South Africa.
Options to Increase Interests in HZL and BALCO
Call Options Over Shares in HZL
On April 11, 2002, we acquired a 26.0% interest in HZL from the GoI through our subsidiary, SOVL (which merged with us with effect from April 1, 2012). At the time of the acquisition, we owned 80.0% and Sterlite Technologies Limited owned the remaining 20.0% in SOVL. In February 2003, Sterlite Technologies Limited transferred its 20.0% interest to us. We subsequently acquired a further 20.0% interest in HZL through an open market offer. The total cash consideration paid by us for the acquisition of the 46.0% interest in HZL was Rs. 7,776.0 million ($ 161.9119.9 million at the time of acquisition). Upon our acquisition of the 26.0% interest in HZL, we and the GoI entered into a shareholders’ agreement to regulate, among other things, the management of HZL and dealings in HZL’s shares.
Under the shareholders’ agreement, the GoI granted us two call options to acquire all the shares in HZL held by the GoI at the time of exercise. We exercised the first call option on August 29, 2003 and acquired an additional 18.9% of HZL’s issued share capital at a cost of Rs. 3,239.0 million ($ 48.9 million) on November 12, 2003, increasing our interest in HZL to 64.9%.
The shareholders’ agreement provides that prior to selling shares in HZL to a third party, either party must first issue a sale notice offering those shares to the other party at the price it intends to sell them to the third party. However, a transfer of shares, representing not more than 5.0% of the equity share capital of HZL, by the GoI to the employees of HZL is not subject to such right of first refusal by us. The GoI has transferred shares representing 1.5% of HZL’s share capital to the employees of HZL. The shareholders’ agreement also provides that if the GoI proposes to make a sale of its shares in HZL by a public offer prior to the exercise of our second call option, then we shall have no right of first refusal.
The second call option provides us a right to acquire the GoI’s remaining 29.5% shareholding in HZL, subject to the right of the GoI to transfer up to 3.5% of the issued share capital of HZL to employees of HZL, in which case the number of shares that we may purchase under the second call option will be reduced accordingly. This call option became exercisable on April 11, 2007 and remains exercisable for as long as the GoI has not sold its remaining interest pursuant to a public offer of its shares. Under the shareholders’ agreement, upon the issuance of a notice of exercise of the second call option by us to the GoI, we shall be under an obligation to complete the purchase of the shares, if any, then held by the GoI, within a period of 60 days from the date of such notice. The exercise price for the second call option will be equal to the fair market value of the shares as determined by an independent appraiser. In determining the fair market value of the shares, the independent appraiser may take into consideration a number of factors including, but not limited to, discounted cash flows, valuation multiples of comparable transactions, trading multiples of comparable companies, SEBI guidelines and principles of valuation, the minority status of the shares, the contractual rights of the shares and the current market price of the shares. Based solely on the market price of HZL’s shares on the NSE on July 15, 201628, 2017 of Rs. 196.2277.9 ($ 3.0)4.3) per share, and not including the other factors that the independent appraiser may consider, one possible estimation of the exercise price to acquire all of the GoI’s 1,247,950,590 shares in HZL would be Rs. 244,848346,805 million ($3,695.8 5,347.8 million).
By a letter dated July 21, 2009, we exercised the second call option. The GoI disputes the validity of the call option and has refused to act upon it. Consequently, we invoked arbitration and filed a statement of claim. The arbitral proceedings are under progress and will be next heard on August 20, 2016.April 21, 2018.
On January 9, 2012, we offered to acquire the GoI’s interests in HZL for Rs. 154,920 million ($ 2,338.4 million). We have, by way of letters dated April 10, 2012 and July 6, 2012, sought to engage with the GoI on the same terms as the offer. This offer was separate from the contested exercise of the call options, and we proposed to withdraw the ongoing litigation in relation to the contested exercise of the options should the offer be accepted. To date, the offer has not been accepted by the GoI and therefore there is no certainty that the acquisition will proceed.
Call Options over shares in BALCO
On March 2, 2001, we acquired a 51.0% interest in BALCO from the GoI for a cash consideration of Rs. 5,533.0 million ($ 83.5 million). On August 28, 2012, we entered into a shareholders’ agreement with the GoI and BALCO to regulate, among other things, the management of BALCO and dealings in BALCO’s shares. The shareholders’ agreement provides that as long as we hold at least 51.0% of the share capital of BALCO, we are entitled to appoint one more director to the board of BALCO than the GoI and are also entitled to appoint the managing director. There are various other matters reserved for approval by both the GoI and us under the shareholders’ agreement, including amendments to BALCO’s articles of association, the commencement of a new business,non-pre-emptive issues of shares or convertible debentures and the provision of loans or guarantees or security to other companies under the same management as BALCO.
Under the shareholders’ agreement, if either we or the GoI wish to sell its shares in BALCO to a third party, the selling party must first offer the shares to the other party at the same price at which it is proposing to sell the shares to the third party. The other party shall then have the right to purchase all, but not less than all, of the shares so offered. If a shareholder does not exercise its right of first refusal, it shall have a tag along right to participate in the sale pro rata and on the same terms as the selling party, except that if the sale is by the GoI by way of a public offer, the tag along right will not apply. However, a transfer of shares representing not more than 5.0% of the equity share capital of BALCO by the GoI to the employees of BALCO is not subject to such right of first refusal by us.
The GoI also granted us an option to acquire the remaining shares in BALCO held by the GoI at the time of exercise. The exercise price is the higher of:
On March 19, 2004, we exercised our option to acquire the remaining 49.0% of BALCO’s issued share capital held by the GoI at that time. Thereafter, the GoI sought several extensions to complete the sale of the shares. On June 7, 2006, the GoI contended that the clauses of the shareholders’ agreement relating to our option violated the provisions of section 111A of the Companies Act, 1956 by restricting the right of the GoI to transfer its shares and that as a result the shareholders’ agreement was null and void. The GoI has also expressed an intention to exercise its right to sell 5.0% of BALCO to BALCO employees.
Subsequently, the dispute was referred to arbitration and the arbitration tribunal rendered award rejecting our claim. We filed an application to the High Court of Delhi to set aside this award and the next date of hearing is on November 4, 2016.October 17, 2017.
Employees
As of March 31, 2016,2017, we had 17,22117,728 employees. The number of employees as of March 31, 2014, 2015, 2016 and 20162017 is as follows:
| Company | Location | Primary Company Function | Total Employees for the year ending March 31, | Location | Primary Company Function | Total employees for the year ending March 31, | ||||||||||||||||||||||||||||||||||||||
| 2014 | 2015 | 2016 | 2015 | 2016 | 2017 | |||||||||||||||||||||||||||||||||||||||
Zinc | ||||||||||||||||||||||||||||||||||||||||||||
| — HZL | India | Zinc and lead production | 5,564 | 5,214 | 4,652 | — HZL | India | Zinc and lead production | 5,214 | 4,652 | 4,421 | |||||||||||||||||||||||||||||||||
Zinc International | ||||||||||||||||||||||||||||||||||||||||||||
| — Black Mountain | | South Africa | | Zinc and lead Mining | 726 | 792 | 791 | — Black Mountain | | South Africa |
| Zinc and lead Mining | 792 | 791 | 789 | |||||||||||||||||||||||||||||
| — Skorpion | Namibia | | Zinc and lead Mining & refining | | 755 | 842 | 782 | — Skorpion | Namibia | | Zinc and lead Mining and refining |
| 842 | 782 | 708 | |||||||||||||||||||||||||||||
| — Lisheen | Ireland | Zinc and lead Mining | 374 | 335 | 33 | — Lisheen | Ireland | Zinc and lead Mining | 335 | 33 | — | |||||||||||||||||||||||||||||||||
Oil and gas | — Cairn India | India | Oil and Gas | 1,643 | 1,585 | 1,478 | — Cairn India | India | Oil and Gas | 1,585 | 1,478 | 1,479 | ||||||||||||||||||||||||||||||||
Iron Ore | — Western Cluster (Liberia) | Liberia | Iron Ore | 12 | 10 | — | — Western Cluster (Liberia) | Liberia | Iron Ore | 10 | — | — | ||||||||||||||||||||||||||||||||
| — Sesa Sterlite | India | Iron Ore | 3,515 | 3,397 | 2,903 | — Vedanta Limited | India | Iron Ore | 3,397 | 2,903 | 2,878 | |||||||||||||||||||||||||||||||||
Copper | ||||||||||||||||||||||||||||||||||||||||||||
| — Sesa Sterlite | India | | Copper smelting and refining | | 1,050 | 1,021 | 1,011 | — Vedanta Limited | India | | Copper smelting and refining |
| 1,021 | 1,011 | 1,022 | |||||||||||||||||||||||||||||
| — CMT | Australia | Copper mining | 112 | 33 | 24 | — CMT | Australia | Copper mining | 33 | 24 | 22 | |||||||||||||||||||||||||||||||||
| — Fujairah Gold FZC | UAE | Precious metal refinery | 81 | 92 | 49 | — Fujairah Gold FZC | UAE | Precious metal refinery | 92 | 49 | 92 | |||||||||||||||||||||||||||||||||
Aluminium | ||||||||||||||||||||||||||||||||||||||||||||
| — BALCO | India | Aluminium production | 3,554 | 3,002 | 2,468 | — BALCO | India | Aluminium production | 3,002 | 2,468 | 2,477 | |||||||||||||||||||||||||||||||||
| — Sesa Sterlite | India | Aluminium production | 2,708 | 2,675 | 2,480 | — Vedanta Limited | India | Aluminium production | 2,675 | 2,480 | 3,291 | |||||||||||||||||||||||||||||||||
Power | ||||||||||||||||||||||||||||||||||||||||||||
| — Sesa Sterlite | India | | Commercial power generation | | 107 | 100 | 109 | — Vedanta Limited | India | | Commercial power generation |
| 100 | 109 | 109 | |||||||||||||||||||||||||||||
| — TSPL | India | | Commercial power generation | | 139 | 221 | 240 | — TSPL | India | | Commercial power generation |
| 221 | 240 | 234 | |||||||||||||||||||||||||||||
| — MALCO Energy Limited | India | | Commercial power generation | | 81 | 80 | 75 | — MALCO Energy Limited | India | | Commercial power generation |
| 80 | 75 | 71 | |||||||||||||||||||||||||||||
Others | 135 | 146 | 126 | 146 | 126 | 135 | ||||||||||||||||||||||||||||||||||||||
|
|
|
|
|
| |||||||||||||||||||||||||||||||||||||||
Total | 20,556 | 19,545 | 17,221 | 19,545 | 17,221 | 17,728 | ||||||||||||||||||||||||||||||||||||||
|
|
|
|
|
| |||||||||||||||||||||||||||||||||||||||
The majority of our workforce is unionized. Employees of HZL and BALCO are members of registered trade unions such as Bharat Aluminium Mazdoor Sangh for BALCO and Hindustan Zinc Workers Federation for HZL, and are affiliated with national trade unions such as the Indian National Trade Union Congress. We believe that relations with our employees and unions are good, though we have in the past and may in the future experience strikes and industrial actions or disputes. See “Item 3. Key Information—D. Risk Factors—Risks Relating to Our Business—Our operations are subject to risks that could result in decreased production, increased cost of production and increased cost of or disruptions in transportation, which could adversely affect our revenue, results of operations and financial condition”
In addition to delivering high-quality assets andlow-cost operations, our Sustainable Development Modelsustainable development model is integral to Vedanta’sVedanta Limited’s core business strategy and helps us conduct our business in line with our values of entrepreneurship, growth, excellence, trust and sustainability.
Our Sustainable Development Modelsustainable development model was made up of three pillars: responsible stewardship, building strong relationship and adding and sharing values. During fiscal year 2015, we added a fourth dimension: strategic communications reflecting our dedication to transparency and to engaging in meaningful dialogue with all stakeholders. We have created a Sustainable Development Frameworksustainable development framework to help each of our businesses put the Sustainable Development Modelsustainable development model into practice. It points to global best practice standards as well as our own policies and guidance notes for the most critical issues. We are committed to ensuring that the Frameworkframework is followed and managed in all our operations and new projects as part of our sustainability journey.
During fiscal year 2016,2017, we have continued to strengthen our Sustainable Development Frameworksustainable development framework with the release of performance standards on safety and environment. We are using the Vedanta Sustainability Assurance Programmesustainability assurance program (“VSAP”) to ensure Frameworkframework compliance, including a programmeprogram of audits.
In a geographically diverse business like ours, where attitudes to health and safety can vary, fostering a culture of zero harm is no easy challenge however we are committed toward this challenge and working to eliminate fatal accidents. During fiscal year 2016,2017, we had ninefive fatal incidents and each is being investigated and reported to Vedanta Limited board which is led by sustainability committee of Vedanta.board. During fiscal year 2016, we had released six key safety standards for Group-wide implementation and this year an audit programmeprogram is being institutionalized to seereview the implementation of those safety standard.standards. We beganhave begun to see tangible outcomes of our safety standards implementation, with far fewer incidents and lost time injuries. The corporate team along with the business units are implementing various capacity building and behavioral based programmesprograms to introducedintroduce campaigns that aim to entrench a culture of safety and risk awareness. During fiscal year 2016, over 684,0002017, we rolled out tailing management standard towards managing the tailing and ash storage related business risk. Further, 968,625 hours of safety training were delivered to employees and contractors.contractors in fiscal year 2017.
We manage our environmental footprint to the most rigorous global standards and have developed specific objectives and targets, particularly with regard to water and energy management. Our goal is to obtainAll our functional operations are now ISO 14001 certification at all sites by end of fiscal year 2017 and as of now 43 out of 47 operations are certified. Systems to reduce water and energy consumption, minimiseminimize land disturbance, and waste production, contain pollution and conduct successful mine closures are in place. We are implementing biodiversity action plans at all of our sites and are also researching into new and innovative ways to recycle waste from our operations including fly ash, red mud, phosphor, gypsum etc.
Insurance
We maintain property insurance which protects against losses relating to our assets arising from fire, business interruption, earthquakes or terrorism and freight insurance which protects against losses relating to the transport of our equipment, product inventory and concentrates. However, our insurance does not cover other potential risks associated with our operations. In particular, we do not have insurance for certain types of environmental hazards, such as pollution or other hazards arising from our disposal of waste products. The occurrence of a significant adverse event, the risks of which are not fully covered by insurance, could have a material adverse effect on our financial condition or results of operations. Moreover, no assurance can be given that we will be able to maintain existing levels of insurance in the future at the same rates. See “Item 3. Key Information-D. Risk Factors—Risks Relating to Our Business- Our insurance coverage may prove inadequate to satisfy future claims against us.”
We and our directors and officers are subject to US securities and other laws. In order to attract and retain qualified board members and executive officers, we have obtained directors’ and officers’ liability insurance. There can be no assurance that we will be able to maintain directors’ and officers’ liability insurance at a reasonable cost, or at all.
Regulatory Matters
Mining Laws
The Mines and Minerals (Development and Regulation) Amendment Act, 2015 (“MMDR Amendment Act”) was promulgated on March 27, 2015 to amend The Mines and Minerals (Development and Regulation) Act, 1957 (“MMDR Act”), the Mineral Concession Rules, 1960, as amended (“MC Rules”), and the Mineral Conservation and Development Rules, 1988, as amended (“MCD Rules”), and it governs mining rights and the operations of mines in India. The MCD Rules outline the procedures for obtaining a prospecting license or the mining lease, the terms and conditions of such licenses and the model form in which they are to be issued. The GoI announced the National Mineral Policy in 1993. The MMDR Amendment Act has brought about significant changes in the legal regime for the mining sector including defining bauxite, iron ore, limestone and manganese ore as notified minerals, creation of a new category of mining license i.e. the prospectinglicense-cum-mining lease, grant of mining lease for a period of 50 years for all minerals other than coal, lignite and atomic minerals, establishment of District Mineral Foundation (“DMF”), auction of notified and other minerals by competitive bidding, includinge-auction etc. The MMDR Act was further amended by the Mines and Minerals (Development and Regulation) Amendment Act, 2016 which permits the transfer of captive mine leases (granted before January 12, 2015) without having to go through an auction processedprocess and also allows the dumping of waste outside of the mining area by including dumping sites within the definition of lease area. The amendment received presidential assent on May 6, 2016.
Grant of a Mining Lease
Only the government of the applicable state may grant a mining lease. The mining lease agreement governs the terms on which the lessee may use the land for the purpose of mining operations. If the land on which the mines are located belongs to private parties, the lessee must acquire the surface rights relating to the land from such private parties. If a private party refuses to grant the required surface rights to the lessee, the lessee is entitled to inform the state government and deposit with the state government compensation for the acquisition of the surface rights. If the state government deems that such amount is fair and reasonable, the state government has the power to order a private party to permit the lessee to enter the land and carry out such operations as may be necessary for the purpose of mining. For determining what constitutes a fair amount of compensation payable to the private party, state governments are guided by the principles of the Right to Fair Compensation and Transparency in Land Acquisition Rehabilitation and Resettlement Act, 2014 or Land Acquisition Act, which generally governs the acquisition of land by governments from private individuals. In case of land owned by the government, the surface right to operate in the lease area is granted by the government upon application as per the norms of that state government. If the mining operations in respect of any mining lease results in the displacement of any persons, the consent of such affected persons, and their resettlement and rehabilitation as well as payment of benefits in accordance with the guidelines of the applicable state government, including payment for the acquired land owned by those displaced persons, needs to be settled or obtained before the commencement of the mining project. The maximum term of a mining lease is 30 years and the minimum term is 20 years. A mining lease may be renewed for further periods of 20 years or less at the option of the lessee. The MC Rules provide that if a lessee uses the minerals for its own industry, then such lessee is generally entitled to a renewal of its mining lease for a period of 20 years, unless it applies for a lesser period. However, with the changes brought in by way of the MMDR Amendment Act, for all minerals other than coal, lignite and atomic minerals, mining leases shall now be granted for a period of 50 years. All mining leases granted for such minerals before the MMDR Amendment Act shall be valid for 50 years. On expiry of the lease, instead of being renewed, the leases shall be put up for auction. The MMDR Amendment Act specifies that any lease granted before the commencement of the MMDR Amendment Act, shall be extended: (i) up to March 31, 2030 for minerals used for captive purposes (specificend-use) and up to March 31, 2020 for minerals used for other than captive purposes, or (ii) until the completion of renewal period, or (iii) for a period of 50 years from the date of grant of such lease, whichever is later. This provision shall not apply to mining leases for which renewal has been rejected, granted, or lapsed.
Protection of the Environment
The MMDR Act also deals with the measures required to be taken by the lessee for the protection and conservation of the environment from the adverse effects of mining. The National Mining Policy emphasizes that no mining lease would be granted to any party without a proper mining plan, including an environmental plan approved and enforced by statutory authorities and which provides for controlling environmental damage, restoration of mined areas and for planting trees according to prescribed norms. The MMDR Amendment Act now also provides for the creation of a DMF and a National Mineral Exploration Trust (“NMET”). The DMF is to be established by the state government for the benefit of persons in districts affected by mining related operations. The NMET was established by the central government for regional and detailed mine exploration through Notification No. G.S.R 633(E) dated August 14, 2015. Licensees and lease holders shall pay the DMF an amount not more thanone-third of the royalty prescribed by the central government, and the NMET two percent of royalty.
Labor Conditions
Working conditions of mine laborers are regulated by the Mines Act, 1952, as amended from time to time. The Act sets forth standards of work, including number of hours of work, leave requirements, medical examination, weekly days of rest, night shift requirements and other requirements to ensure the health and safety of mine workers.
Royalties
Royalties on the minerals extracted or a dead rent component, whichever is higher, are payable to the relevant state government by the lessee in accordance with the MMDR Act. The mineral royalty is payable in respect of an operating mine from which minerals are removed or consumed and is computed in accordance with a prescribed formula. The GoI has been granted broad powers to modify the royalty scheme under the MMDR Act, but may not do so more than once every three years. In addition, the lessee must pay the occupier of the surface land over the mining lease an annual compensation determined by the state government. The amount depends on whether the land is agricultural ornon-agricultural.
Mines Bill
The Mines (Amendment) Bill, 2011 proposes several amendments to the Mines Act, 1952, including significant enhancement to the monetary penalties and terms of imprisonment for violations.
Oil and Gas Laws
Regulation of Exploration and Production
The Ministry of Petroleum &and Natural Gas (MoPNG) is the principal regulator of oil and natural gas exploration and production in India. The MoPNG established the Directorate General of Hydrocarbons in 1993 to promote the sound management of Indian petroleum and natural gas resources with due regard to the environmental, safety, technological and economic aspects of petroleum activities. The Directorate General of Hydrocarbons is responsible for,inter alia, ensuring correct reservoir management practices, reviewing and monitoring exploratory programs, the development plans of oil companies, and monitoring the production and the optimal utilization of gas fields.
The MoPNG oversees the Oil Industry Safety Directorate, which develops standards for safety, fire-fighting, training programs and information dissemination, and conducts periodic safety audits of all petroleum-handling facilities. It also oversees the Oil Industry Development Board, which provides financial and other assistance for the conductive development of the oil industry. The safety standards prescribed by the Oil Industry Safety Directorate, and the safety regulations prescribed by the Directorate General of Mines Safety in respect of onshore petroleum mining installations, must be complied with.
The Oilfields (Regulation and Development) Act, 1948
Oil and natural gas exploration activities are governed by The Oilfields (Regulation and Development) Act, 1948. This legislation provides for the regulations of oilfields and for the development of mineral oil resources, including natural gas and petroleum. The Oilfields (Regulation and Development) Act empowers the GoI to frame rules on the granting of mining leases and petroleum exploration or prospecting licenses, the conservation and development of mineral oils, the production of oil, and the regulation of oilfields.
Petroleum Exploration License and Petroleum Mining Lease under the Petroleum and Natural Gas Rules, 1959
The Petroleum and Natural Gas Rules provide the framework for the granting of petroleum exploration licenses and petroleum mining leases. Rule 4 of the Petroleum and Natural Gas Rules prohibits the prospecting or exploitation of any oil or gas unless a license or lease has been granted under the Petroleum and Natural Gas Rules. A Petroleum Mining Lease entitles the lessee to an exclusive right to extract oil and gas from the relevant contract area. Petroleum Exploration Licenses and Petroleum Mining Leases are granted by the MoPNG for offshore areas and by the relevant state governments, with the prior approval of the Government, for onshore areas. In 2006, the Government amended the Petroleum and Natural Gas Rules so that a licensee or lessee is now under an obligation to provide all data obtained under the license. Such data shall be the property of the Government, provided that the licensee or lessee shall have the right to make use of such data, free of cost, for the purposes of petroleum operations under the license or lease. The Government also has the right to disclose to the public allnon-proprietary data without the consent of the licensee. The Government has the sole authority to determine what is proprietary.
The Territorial Waters, Continental Shelf, Exclusive Economic Zone and other Maritime Zones Act, 1976
The Territorial Waters, Continental Shelf, Exclusive Economic Zone and other Maritime Zones Act, 1976 regulates the exploration and exploitation of resources of the continental shelf and exclusive economic zone.
The Essential Commodities Act, 1955
The Essential Commodities Act, 1955 makes provisions controlling the production, supply and distribution of certain essential commodities, which include petroleum and petroleum products.
The Petroleum Act, 1934 read with the Petroleum Rules, 2002
The Petroleum Act, 1934 provides that no person shall produce, refine, blend, store or transport petroleum except in accordance with the rules framed by the GoI under the Petroleum Act, 1934. The Petroleum Rules, 2002 now regulate these activities.
The Petroleum and Natural Gas Regulatory Board Act, 2006
The Petroleum and Natural Gas Regulatory Board Act, 2006 provides for the establishment of the Petroleum and Natural Gas Regulatory Board. The board regulates the refining, processing, storage, transportation, distribution, marketing and sale of petroleum products and natural gas (excluding production of crude oil and natural gas). It strives to protect the interests of consumers and entities engaged in specific activities relating to petroleum, petroleum products and natural gas and to ensure uninterrupted and adequate supply of petroleum, petroleum products and natural gas in all parts of the country and to promote competitive markets.
The Petroleum and Minerals Pipelines (Acquisition of Right of User in Land) Act, 1962
The Petroleum and Minerals Pipelines (Acquisition of Right of User in Land) Act, 1962 provides the framework governing the acquisition of right of user in land for laying pipelines for the transportation of petroleum and minerals and other matters connected therewith. This law is limited to the acquisition procedure, restrictions on use of land and compensation payable to the persons interested in the land.
Hydrocarbon Exploration &and Licensing Policy
The Ministry of Petroleum &and Natural Gas through its notificationO-32011/4/2013-ONG-I dated March 30, 2016 introduced a new exploration and licensing policy named Hydrocarbon Exploration and Licensing Policy (“HELP”). This is a fundamental change in the Indian oil and gas sector, which introduces a new contractual and fiscal model for the award of hydrocarbon acreages. Four main facets of HELP are: single license, open acreages, revenue sharing model and marketing and pricing freedom.
Marketing including pricing freedom for the gas to be produced from Discoveries in Deepwater, Ultra Deepwater and High Pressure-High Temperature areas
The Ministry of Petroleum and Natural Gas through its notification No.O-22013/27/2012-ONG-D-V(Vol-II) dated March 21, 2016 introduced the policy for marketing including pricing freedom for the gas to be produced from discoveries in deepwater, ultra-deepwater and high pressure temperature areas. This policy is applicable to all discoveries in deep water/ultra-deep water/high temperature-high pressure areas which are yet to commence commercial production as of January 1, 2016 and to all future discoveries in such areas. As per the policy the producers will be allowed marketing freedom including pricing freedom subject to a ceiling price on the basis of landed price of alternative fuels.
Regulations pertaining to our oil and gas blocks located in Sri Lanka and South Africa
Petroleum Resources Act - Sri Lanka
The Petroleum Resources Act provides for the grant of a license for exploration, development and production of petroleum in Sri Lanka. Under the said Act, the Government of Sri Lanka has executed a Petroleum Resources Agreement and a license has been granted to Cairn Lanka (Pvt) Limited to explore and exploit petroleum. Cairn Lanka (Pvt) Limited has exited from the Petroleum Resources Agreement and has relinquished the exploration license on October 15, 2015.
Petroleum Resources Development Act - South Africa
The Mineral and Petroleum Resources Development Act is the law governing exploitation of minerals and petroleum in South Africa. An exploration license has been granted to Cairn South Africa Pty Limited for exploration of petroleum resources in South Africa under the law. Petroleum Agency SA is the nodal agency for all approvals.
Environmental Laws
Our business is subject to environmental laws and regulations. The applicability of these laws and regulations varies from operation to operation and depends on jurisdiction in which we operate. Our operations require environmental and other permits covering, amongst other things, water use and discharges, stream diversions, solid waste disposal and air and other emissions. Major environmental laws applicable to our operations include The Environment (Protection) Act, 1986, Forest (Conservation) Act, 1980, or Forest Act and the Forest Conservation Rules, 2003, Hazardous Wastes (Management and Handling) Rules, 1989, Water (Prevention and Control of Pollution) Act, 1974, Water (Prevention and Control of Pollution) Cess Act, 1977, Air (Prevention and Control of Pollution) Act, 1981, The Coal Mines (Nationalization) Act, 1973, or Coal Nationalization Act, Coking Coal Mines (Nationalization) Act, 1972, Coal Mines (Taking Over of Management) Act, 1973, Coking Coal Mines (Emergency Provision) Act, 1971, Coal Bearing Areas (Acquisition and Development) Act, 1957, Coal Mines (Conservation and Development) Act, 1974 and the New Coal Distribution Policy, 2007.
The Environmental Protection Act, 1986, the Water (Prevention and Control of Pollution) Act, 1974 and the Air (Prevention and Control of Pollution) Act, 1981 provide for the prevention, control and abatement of pollution. Pollution control boards have been set up in states in India to exercise the powers under these statutes to preventfor the purpose of preventing and controlcontrolling pollution. Companies must obtain the clearance of state pollution control boards before emitting or discharging effluents into the environment.
In case the project value exceeds Rs. 1 billion for a All new projectprojects or Rs. 500 million for theactivities and expansion and modernization of existing oil and gas exploration and production project, the project also requires the approval of the MoEF.projects, require an environment clearance.
The Hazardous Waste (Management and Handling) Rules, 1989 define waste oil and oil emulsions as hazardous wastes and impose an obligation on each occupier and operator of any facility generating hazardous waste to dispose of such hazardous wastes properly. It also imposes obligations in respect of the collection, treatment and storage of hazardous wastes. Each occupier and operator of any facility generating hazardous waste is required to obtain an approval from the relevant state Pollution Control Board for collecting, storing and treating the hazardous waste.
In addition, the Merchant Shipping Act, 1958 provides for liability in respect of loss or damage caused outside the ship by contamination resulting from the escape or discharge of oil from the ship, wherever such escape or discharge occurs.
Power Sector
Licensing Requirements
Under the Electricity Act, 2003 (“Electricity Act”), the transmission, distribution of, and trading in electricity require licenses from the appropriate Central or State Electricity Regulatory Commissions (respectively, “CERCs” and “SERCs”, and collectively, “ERCs”), unless exempted, however generation of electricity does not require a license.
Three of our 600 MW units in Jharsuguda, Odisha have been converted into ‘captive generating plant’ from ‘independent power plant’ with effect from April 1, 2015 by virtue of order of Orissa Electricity Regulatory Commission (OERC) passed on January 27, 2016.
Employment and Labor Laws
We are subject to various labor, health and safety laws which govern the terms of employment of our laborers at our mining and manufacturing facilities, their working conditions, the benefits available to them and the general relationship between our management and such laborers. These include the Industrial Disputes Act, 1947, Factories Act, 1948, Contract Labor (Regulation and Abolition) Act, 1970, Employee State Insurance Act, 1948, Payment of Wages Act, 1936, Minimum Wages Act, 1948, Workmen’s Compensation Act, 1923, Payment of Gratuity Act, 1972, Payment of Bonus Act, 1965, and Employees’ Provident Funds and Miscellaneous Provisions Act, 1952.
Other Laws
The Right to Fair Compensation and Transparency in Land Acquisition, Rehabilitation and Resettlement Act, 2013, or Land Acquisition Act.
The Land Acquisition Act was notified with effect from January 1, January 2014. The law replaces the 120 year old legislation the Land Acquisition Act, 1894 and is a unified legislation for acquisition of land and adequate rehabilitation mechanisms for all affected persons. As per the provisions of the Land Acquisition Act, the central government or appropriate state government is empowered to acquire any land from private persons for ‘public purpose’ subject to payment of compensation to the persons from whom the land is so acquired. There is also a mandatory requirement under the Act for Social Impact Assessmentsocial impact assessment accompanying every land acquisition, to consider the social costs and benefits arising of such acquisition and a participative process has been prescribed for such acquisition by imposing the condition of obtaining consent of the requisite majority i.e. prescribed under the Act i.e. consent of up to 80% of people whose land is acquired for private projects and of 70% of the landowners in the case of public-private partnership projects and discussions and objections at every stage of the acquisition proceedings. It also provides for compensation as high as four times more than the existing practice in rural areas and two times in urban areas. In December 2014, an ordinance (The Right to Fair Compensation and Transparency in Land Acquisition, Rehabilitation and Resettlement (Amendment) Ordinance, 2014) was promulgated to amend the Right to Fair Compensation and Transparency in Land Acquisition, Rehabilitation and Resettlement Act, 2013. The ordinance wasre-promulgated in a modified form in April 2015, and again in May 2015. Right to Fair Compensation and Transparency in Land Acquisition, Rehabilitation and Resettlement (Second Amendment) Bill, 2015 was introduced in Lok Sabha on May 11, 2015 to replace the April ordinance and was referred to a joint Parliamentary Committee for detailed examination.
Companies Act, 1956 and Companies Act, 2013
The Companies Act, 2013 to replace the Companies Act, 1956 which currently governs the formation, financing, functioning and winding up of companies, received assent in August 2013 and the 470 section legislation has been partially notified. The Companies Act, 2013 seeks to consolidate and amend the law relating to the companies and intends to improve corporate governance and to further strengthen regulations for corporates. The major features introduced by the 2013 Act include formulation of a corporate social responsibility policy and spending towards such activities, increased responsibility of independent directors and setting up of a National Financial Reporting Authority. Some new concepts such asone-person company, small companies, dormant company, class action suits, and registered valuers have also been included.
C. Organizational Structure
The following diagram summarizes the corporate structure of our consolidated group of companies and our relationship with Vedanta and other key entities as of March 31, 2016:2017:
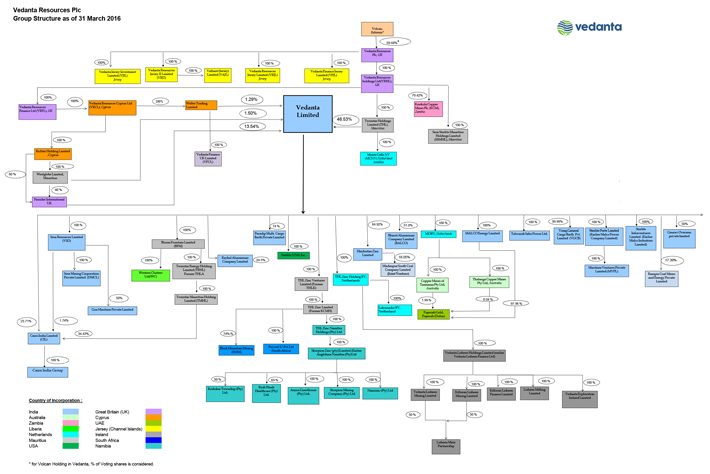
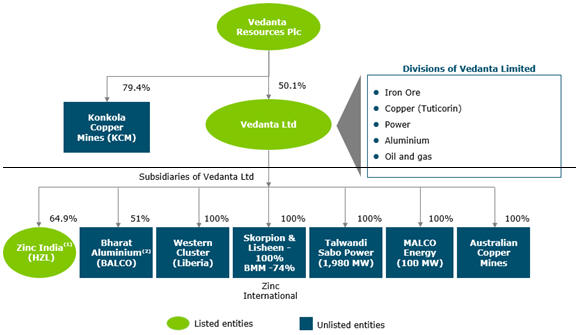
| (1) |
| We have exercised the second call option to acquire the GoI’s remaining ownership interest in HZL on July 21, 2009 although the exercise is currently subject to dispute. See |
| We have exercised our option to acquire the remaining 49.0% of BALCO owned by the GoI on March 19, 2004. The exercise of this option has been contested by the GoI. The GoI has the right and has expressed an intention to sell 5.0% of BALCO to BALCO employees. See “—B. Business |
The principal members of our consolidated group of companies are as follows:
| 1. | Vedanta Limited. The company was originally incorporated in Goa on February 5, 1954 under the Portuguese Commercial Code as a private limited company and on June 25, 1965 under the name “Sesa Goa Private limited” under the Companies Act 1956. It became a public limited company on April 16, 1981 pursuant to fresh certificate of incorporation issued by the Registrar of Companies, Goa, Daman and Diu. Thereafter the name of the company was changed from “Sesa Goa Limited” to “Sesa Sterlite Limited” pursuant to a fresh certificate of incorporation issued by the Registrar of Companies on September 18, 2013 pursuant to theRe-organization Transactions and the name of the Company changed from “Sesa Sterlite Limited” to Vedanta Limited pursuant to a fresh certificate of incorporation issued by the Registrar of Companies on April 21, 2015. Our ADSs are listed on the NYSE. Vedanta, through its subsidiaries, owned 62.8 % of our issued share capital as on March 31, |
| 2. | BALCO.BALCO is incorporated in New Delhi, State of Delhi, India and is headquartered at Korba in the State of Chhattisgarh. We own 51.0% of BALCO’s share capital and have management control of the company. The GoI owns the remaining 49.0%. We exercised an option to acquire the GoI’s remaining ownership interest in BALCO on March 19, 2004, which has been contested by the GoI. Further, the GoI retains the right and has expressed an intention to sell 5.0% of BALCO to BALCO employees. See “—B. Business Overview—Our Business—Options to Increase Interests in HZL and BALCO” for more information. BALCO owns and operates our aluminium business. |
| 3. | HZL. HZL is incorporated in Jaipur, State of Rajasthan, India and is headquartered in Udaipur in Rajasthan. HZL is listed on the NSE and BSE. We own 64.9% of HZL’s share capital through our wholly-owned subsidiary SOVL. SOVL was merged into SIIL with effect from April 1, 2011 pursuant to a merger approved by the |
| 4. |
| Skorpion.Skorpion, previously Anglo Base Namibia Holdings (Proprietary) Limited, previously Ambase Exploration (Namibia) Proprietary Limited was incorporated on June 16, 1998. The company has its headquarters at the Skorpion Zinc mine site, which is situated 25 km north of Rosh Pinah Namibia. The company’s registered office is situated at 24 Orban Street, Klein Windhoek, Namibia. The company holds the entire share capital in the following companies: Skorpion Zinc (Proprietary) Limited, Namzinc Proprietary Limited and Skorpion Zinc (Proprietary) Limited is an investment holding company, holding the entire share capital in Namzinc and Skorpion. Namzinc operates a zinc refinery, who procures oxide zinc ore from Skorpion, who in turn extracts the ore from an open pit zinc deposit. |
| BMM.BMM is an underground mining operation located at Aggeneys in the Northern Cape. It produces zinc, lead and copper concentrates which are predominantly exported to international customers through the |
| Vedanta Lisheen Holdings Limited:Lisheen mine is located in County Tipperary, |
| MALCO Energy Limited: MALCO was incorporated in Mettur, Tamil Nadu. MALCO’s equity shares were listed and traded on the NSE and BSE, and were subsequently delisted on June 19, 2009. Vedanta, through Twin Star and Welter Trading held 94.8% of MALCO’s share capital and controls the management. The remaining 5.4% ownership interest in MALCO was held by public shareholders. Pursuant to theRe-organization Transactions, MALCO merged with and into us through the issue of our shares to the shareholders of MALCO on a 7 for 10 basis. MALCO’s power business was sold to Vedanta Aluminium for a cash consideration of Rs. 1,500 million ($ 25 million), which is now renamed as MALCO Energy Limited. |
| Talwandi Sabo Power Limited:TSPL was incorporated as a special purpose vehicle by Punjab State Power Corporation Limited for development of 1980 MW onbuild-own-operate basis. TSPL has a 1980 MW coal based thermal power plant facility (comprising of three units of 660 MW each) in Mansa in the state of Punjab. The first 660 MW and second 660 MW unit of the Talwandi Sabo power plant |
The key entities that control us are as follows:
Volcan is the majority shareholder of Vedanta, which is the sole shareholder of VRHL, which is the sole shareholder of each of Twinstar and VRFL. VRFL is the sole shareholder of VRCL, which is the sole shareholder of each of Welter Trading and Richter. Richter is the sole shareholder of Westglobe and the majority shareholder of Finsider.
Volcan is wholly beneficially owned by the Trust. Conclave is the trustee of the Trust and the sole registered shareholder of Volcan. Mr. Anil Agarwal, the Executive Chairman of Vedanta and protector of the Trust, may be deemed to have beneficial ownership of securitieskey entity that are deemed beneficially owned by the Trust and with effect from October 16, 2014, Mr. Anil Agarwal is one of the beneficiaries of the Trust. Vedanta, Volcan, the Trust, Conclave and Mr. Anil Agarwal are parties to a relationship agreement that regulates the ongoing relationship among them.controls us. See “Item 7. Major Shareholders and Related Party Transactions—B. Related Party Transactions—Related Parties—Vedanta.”A. Major Shareholders
D. Property, Plants and Equipment
See “- B. Business Overview—Our Business—Our Copper Business—‘Principal Facilities,Facilities’ and ‘Projects and Developments’,” “- B. Business Overview—Our Business—Our Zinc Business—‘Principal Facilities”Facilities’ and ‘Projects and Developments’,” “- B. Business Overview—Our Business—Our Aluminium Business—‘Principal Facilities.Facilities’ and ‘Projects and Developments’,” and “- B. Business Overview—Our Business—Our Zinc International Business—‘Principal Facilities.Facilities’ and ‘Projects and Developments’,”.
| ITEM 4A. | UNRESOLVED STAFF COMMENTS |
Not Applicable
| ITEM 5. | OPERATING AND FINANCIAL REVIEW AND PROSPECTS |
The following discussion of our business, financial condition and results of operations should be read in conjunction with our consolidated financial statements and the related notes included elsewhere in this Annual Report. Some of the statements in the following discussion are forward-looking statements that reflect our current views with respect to future events and financial performance. Our actual results could differ materially from those anticipated in these forward-looking statements as a result of certain factors, such as those set forth under “Item 3. Key Information—D. Risk Factors” and elsewhere in this Annual Report. Our consolidated financial statements and the financial information discussed below have been prepared in accordance with IFRS as issued by the IASB.
Overview
We are a diversified natural resource company engaged in exploring, extracting and processing minerals and oil and gas. We produce zinc, lead, silver, oil and gas, copper, aluminium, iron ore and commercial power and have a presence across Australia, India, Ireland, Liberia, Namibia, South Africa and United Arab Emirates.UAE. We have experienced significant growth in recent years through various expansion projects, acquisition of our zinc and aluminium businesses in 2002 and 2001 respectively, through the GoI’s disinvestment programs, the acquisition of the zinc business of Anglo American Plc in Namibia, South Africa and Ireland in fiscal year 2011 and by successfully growing our acquired businesses. We have further strengthened our presence across commodities through an all share merger with Sesa Goa in August 2013 through theRe-organization Transactions. We believe our experience in operating and expanding our business in India will allow us to capitalize on attractive growth opportunities arising from India’s large mineral reserves, relatively low cost of operations and large and inexpensive labor and talent pools.
Our revenue increaseddecreased from Rs. 725,243 million in fiscal year 2014 to Rs. 733,579 million in fiscal year 2015 representing an increase of 1.1% and decreased to Rs. 639,493 million ($ 9,652.7 million) in fiscal year 2016, representing a decrease of 12.8%. Operating profit decreased from14.7% and increased to Rs. 127,528717,207 million ($ 11,059.5 million) in fiscal year 2014 to operating2017, representing an increase of 12.2%. Operating loss ofdecreased from Rs. 299,215 million in fiscal year 2015 to Rs. 268,822 million in fiscal year 2016, representing a decrease of 334.6%11.3%. Operating lossprofit for fiscal year 20162017 was Rs. 268,822152,744 million ($ 4,057.72,355.3 million), representing a decreasean increase of 10.2% operating loss156.8% as compared to fiscal year 2015.2016.
The following tables are derived from our selected consolidated financial data and set forth:
| For the Year Ended March 31, | ||||||||||||
| 2014 | 2015 | 2016 | ||||||||||
| (in percentages) | ||||||||||||
Revenue: | ||||||||||||
Zinc – India | 18.2 | 19.7 | 21.6 | |||||||||
Zinc – International | 5.5 | 4.9 | 4.0 | |||||||||
Oil & Gas | 25.8 | 20.0 | 13.5 | |||||||||
Iron Ore | 2.3 | 2.6 | 3.5 | |||||||||
Copper | 28.4 | 30.7 | 32.7 | |||||||||
Aluminium | 14.9 | 17.3 | 17.3 | |||||||||
Power | 4.8 | 4.6 | 7.1 | |||||||||
Other | 0.1 | 0.2 | 0.3 | |||||||||
|
|
|
|
|
| |||||||
Total | 100.0 | 100.0 | 100.0 | |||||||||
|
|
|
|
|
| |||||||
Operating Profit / (loss): | ||||||||||||
Zinc – India | 48.4 | 20.8 | 22.1 | |||||||||
Zinc – International | 1.9 | 1.4 | 0.3 | |||||||||
Oil & Gas | 42.3 | (132.1) | (127.5) | |||||||||
Iron Ore | (4.3) | (1.1) | (5.9) | |||||||||
Copper | 7.0 | 4.8 | 7.3 | |||||||||
Aluminium | 3.9 | 4.6 | 0.5 | |||||||||
Power | 1.2 | 1.5 | 3.1 | |||||||||
Other | (0.4) | 0.1 | 0.1 | |||||||||
|
|
|
|
|
| |||||||
Total | 100.0 | 100.0 | 100.0 | |||||||||
| For the Year Ended March 31, | For the Year Ended March 31, | |||||||||||||||||||||||
| 2014 | 2015 | 2016 | 2015 | 2016 | 2017 | |||||||||||||||||||
| (in percentages) | (in percentages) | |||||||||||||||||||||||
Segment Profit /(loss)(1): | ||||||||||||||||||||||||
Revenue: | ||||||||||||||||||||||||
Zinc – India | 27.2 | 32.3 | 43.5 | 19.7 | 21.6 | 23.6 | ||||||||||||||||||
Zinc – International | 5.1 | 5.1 | 3.0 | 4.9 | 4.0 | 3.1 | ||||||||||||||||||
Oil & Gas | 55.1 | 40.6 | 22.2 | |||||||||||||||||||||
Oil and Gas | 20.0 | 13.5 | 11.4 | |||||||||||||||||||||
Iron Ore | (1.1) | (0.4) | 2.8 | 2.6 | 3.5 | 5.7 | ||||||||||||||||||
Copper | 4.5 | 8.0 | 14.4 | 30.7 | 32.7 | 29.3 | ||||||||||||||||||
Aluminium | 6.4 | �� | 10.3 | 5.5 | 17.3 | 17.3 | 19.1 | |||||||||||||||||
Power | 2.9 | 3.9 | 8.2 | 4.6 | 7.1 | 7.7 | ||||||||||||||||||
Other | (0.1) | 0.2 | 0.4 | 0.2 | 0.3 | 0.1 | ||||||||||||||||||
|
|
|
|
|
| |||||||||||||||||||
Total | 100.0 | 100.0 | 100.0 | 100.0 | 100.0 | 100.0 | ||||||||||||||||||
|
|
|
|
|
| |||||||||||||||||||
Operating Profit / (loss): | ||||||||||||||||||||||||
Zinc – India | 20.8 | 22.1 | 56.0 | |||||||||||||||||||||
Zinc – International | 1.4 | 0.3 | 4.8 | |||||||||||||||||||||
Oil and Gas | (132.1 | ) | (127.5 | ) | 9.3 | |||||||||||||||||||
Iron Ore | (1.1 | ) | (5.9 | ) | 5.5 | |||||||||||||||||||
Copper | 4.8 | 7.3 | 9.8 | |||||||||||||||||||||
Aluminium | 4.6 | 0.5 | 7.7 | |||||||||||||||||||||
Power | 1.5 | 3.1 | 7.0 | |||||||||||||||||||||
Other | 0.1 | 0.1 | (0.1 | ) | ||||||||||||||||||||
|
|
| ||||||||||||||||||||||
Total | 100.0 | 100.0 | 100.0 | |||||||||||||||||||||
Segment Profit /(loss)(1): | ||||||||||||||||||||||||
Zinc – India | 32.3 | 43.5 | 44.3 | |||||||||||||||||||||
Zinc – International | 5.1 | 3.0 | 4.3 | |||||||||||||||||||||
Oil and Gas | 40.6 | 22.2 | 19.0 | |||||||||||||||||||||
Iron Ore | (0.4 | ) | 2.8 | 6.1 | ||||||||||||||||||||
Copper | 8.0 | 14.4 | 7.9 | |||||||||||||||||||||
Aluminium | 10.3 | 5.5 | 10.7 | |||||||||||||||||||||
Power | 3.9 | 8.2 | 7.6 | |||||||||||||||||||||
Other | 0.2 | 0.4 | 0.1 | |||||||||||||||||||||
|
|
| ||||||||||||||||||||||
Total | 100.0 | 100.0 | 100.0 | |||||||||||||||||||||
|
|
| ||||||||||||||||||||||
Note:
| (1) | Segment profit is presented as required by IFRS 8 and is calculated by adjusting depreciation, amortization and impairment from operating profit. Our segment profit may not be comparable to similarly titled measures reported by other companies due to potential inconsistencies in the method of calculation. We have included our segment profit because we believe it is an indicative measure of our operating performance and is used by investors and analysts to evaluate companies in our industry. Our segment profit should be considered in addition to, and not as a substitute for, other measures of financial performance and liquidity reported in accordance with IFRS as issued by the IASB. We believe that the inclusion of supplementary adjustments applied in our presentation of segment profit are appropriate because we believe it is an indicative measure of our baseline performance as it excludes certain charges that our management considers to be outside of our core operating results. In addition, our segment profit is among the primary indicators that our management uses as a basis for planning and forecasting of future periods. |
| For the Year Ended March 31, | ||||||||||||||||
| 2014 | 2015 | 2016 | 2016 | |||||||||||||
| (Rs. in millions) | (Rs. in millions) | (Rs. in millions) | (US dollars in millions) | |||||||||||||
Zinc India: | ||||||||||||||||
Operating profit | 61,696 | 62,267 | 59,412 | 896.8 | ||||||||||||
Plus: Depreciation and amortization | 6,946 | 8,338 | 7,558 | 114.1 | ||||||||||||
|
|
|
|
|
|
|
| |||||||||
Segment profit | 68,642 | 70,605 | 66,970 | 1,010.9 | ||||||||||||
|
|
|
|
|
|
|
| |||||||||
Zinc International: | ||||||||||||||||
Operating profit | 2,484 | 4,268 | 831 | 12.5 | ||||||||||||
Plus: Depreciation and amortization(1) | 10,345 | 6,791 | 3,730 | 56.3 | ||||||||||||
|
|
|
|
|
|
|
| |||||||||
Segment profit | 12,829 | 11,059 | 4,561 | 68.8 | ||||||||||||
|
|
|
|
|
|
|
| |||||||||
Oil & Gas: | ||||||||||||||||
Operating profit/(loss) | 53,942 | (395,146) | (342,813) | (5,174.5) | ||||||||||||
Plus: Depreciation, depletion and amortization(2) | 85,511 | 483,817 | 377,086 | 5,691.8 | ||||||||||||
|
|
|
|
|
|
|
| |||||||||
Segment profit/(loss) | 139,453 | 88,671 | 34,273 | 517.3 | ||||||||||||
|
|
|
|
|
|
|
| |||||||||
Iron Ore: | ||||||||||||||||
Operating profit/(loss) | (5,476) | (3,422) | (15,793) | (238.4) | ||||||||||||
Plus: Depreciation and amortization(3) | 2,776 | 2,531 | 20,160 | 304.3 | ||||||||||||
|
|
|
|
|
|
|
| |||||||||
Segment profit/(loss) | (2,700) | (891) | 4,367 | 65.9 | ||||||||||||
|
|
|
|
|
|
|
| |||||||||
Copper: | ||||||||||||||||
Operating profit | 8,876 | 14,344 | 19,660 | 296.8 | ||||||||||||
Plus: Depreciation and amortization(4) | 2,553 | 3,041 | 2,545 | 38.4 | ||||||||||||
|
|
|
|
|
|
|
| |||||||||
Segment profit | 11,429 | 17,385 | 22,205 | 335.2 | ||||||||||||
|
|
|
|
|
|
|
| |||||||||
Aluminium: Operating profit/(loss) Plus: Depreciation and amortization(5) Segment profit Power: Operating profit Plus: Depreciation and amortization Segment profit Others: Operating profit/(loss) Plus: Depreciation and amortization Segment profit/(loss) For the Year Ended March 31, 2014 2015 2016 2016 (Rs. in millions) (Rs. in millions) (Rs. in millions) (US dollars in millions) 4,979 13,752 1,416 21.4 11,152 8,777 7,051 106.4 16,131 22,529 8,467 127.8 1,494 4,484 8,221 124.1 5,935 3,940 4,438 67.0 7,429 8,424 12,659 191.1 (467) 238 244 3.7 210 294 324 4.9 (257) 532 568 8.6
Consolidation and re-organization of Sesa Goa, SIIL, Vedanta Aluminium, Sterlite Energy and MALCO to form Sesa Sterlite and transfer of Vedanta’s shareholding in Cairn India to Sesa Sterlite
On February 25, 2012, Vedanta announced an all-share merger of Sesa Goa and Sterlite to create Sesa Sterlite and to effect the consolidation and simplification of Vedanta’s corporate structure through the “Re-organization Transactions” consisting of the “Amalgamation and Re-organization Scheme” and the “Cairn India Consolidation”. On August 17, 2013, the Re-organization Transactions became effective and the name of the merged entity was changed to Sesa Sterlite Limited with effect from September 18, 2013.
On August 19, 2013, Sesa Goa furnished to the SEC a notice, as required under Rule 12g-3(f) under the Exchange Act which provided that Sesa Goa was the successor issuer to SIIL under the Exchange Act. Further, the equity shares of Sesa Goa with a par value of Re. 1 each, would be traded in the United States in the form of ADSs, where each ADS would represent four equity shares of Sesa Goa and such ADSs would be deemed to be registered under Section 12(b) of the Exchange Act by operation of Rule 12g-3(a) under the Exchange Act. The ADSs of Sesa Goa were registered for trading on the NYSE on September 13, 2013. On September 23, 2013, Sesa Goa submitted to the SEC that the name of Sesa Goa Limited was changed to Sesa Sterlite Limited following approval from the Registrar of Companies, Goa on September 18, 2013. On April 22, 2015, Sesa Sterlite Limited submitted to the SEC regarding the name change to Vedanta Limited following the approval from the Registrar of Companies, Goa on April 21, 2015.
The Amalgamation and Re-organization Scheme
The Amalgamation and Re-organization Scheme was made effective in the month of August 2013. In accordance with the Amalgamation and Re-organization Scheme
Subsequent to the effectiveness of the Amalgamation and Re-organization Scheme, a special leave petition challenging the orders of the High Court of Judicature of Bombay at Goa was filed before the Supreme Court of India by the Commissioner of Income Tax, Goa and the Ministry of Corporate Affairs. Further, a creditor and a shareholder have challenged Amalgamation and Re-organization Scheme in the High Court of Madras in September 2013. The said petitions are pending for hearing and admission.
Cairn India Consolidation
Pursuant to the share purchase agreement, dated February 25, 2012 between BFL, a wholly owned subsidiary of Sesa Goa and VRHL, BFL acquired 38.68% shareholding in Cairn India and an associated debt of $ 5,998 million by way of acquisition of TEHL, for a nominal cash consideration of $ 1. With effect from August 26, 2013, TEHL, TMHL and Cairn India (including all of its subsidiaries) are now subsidiaries of the Sesa Goa. As a result, Sesa Sterlite held 58.76% of the total shareholding of Cairn India as of August 26, 2013. On June 14, 2015, Vedanta Limited and Cairn India Limited announced a merger of both the companies through a Scheme of Arrangement under Indian law. See “Item 8. Financial Information—B. Significant changes”
Acquisition of Power Assets
Through a slump sale agreement dated August 19, 2013 between Vedanta Aluminium and Sesa Goa, the power business consisting of 1,215 MW thermal power facility situated at Jharsuguda and 300 MW co-generation facility (90 MW operational and 210 MW under development) at Lanjigarh, was purchased by the Company at a consideration of Rs. 28,929 million ($ 436.7 million).
Factors Affecting Results of Operations
Our results of operations are primarily affected by commodity prices, realization discount to Brent, our cost of production, our production output, government policy in India and exchange rates.
Metal and Oil Prices, Copper TcRc and Power Tariff
Overview
Our results of operations are significantly affected by the commodity prices of natural resources that we produce, which are based on LME / London Bullion Market Association prices in our zinc and aluminium businesses, other benchmark prices in our oil, gas and iron ore businesses and by the TcRc of copper in our copper business. The TcRc of copper, the commodity prices of the metals that we produce and the benchmark price of oil, gas and iron ore can fluctuate significantly as a result of changes in the supply of and demand for zinc, lead, silver, oil, gas, iron ore, copper and aluminium among others. While natural resources producers are unable to influence the market rate of the TcRc or commodity prices directly, events such as changes in smelting or commodity production capacities, temporary price reductions or other attempts to capture market share by individual natural resources producers including our consolidated group of companies, may have an effect on market prices. Moreover, the prices realized by us can, to some extent, be affected by the particular terms we are able to negotiate for the contractual arrangements we enter into with buyers. Price variations and market cycles, have historically influenced, and are expected to continue to influence our financial performance.
During the year ended March 31, 2016,2017, the declineincrease in commodity prices adverselypositively impacted our revenue and operating profit. During fiscal year 2016,2017, average prices decreasedincreased by 15.9%29.5% for zinc, 15.9%6.2% for aluminium, 20.5% for copper, 12.5%13.4% for lead, 16.0%16.7% for silver, 37.4%30.0% for iron ore and 44.4%2.3% for Brent.Brent while the average price of copper decreased by 1.1%.
Global growth and commodity demand remains volatile and emerging markets continue to be the key drivers of growth. We are well positioned to capitalize on emerging market growth with a significant portion of our assets in India and Africa. With favorable demographics and urbanization driving consumption growth in India, we are well placed to meet the growing demand. For a further discussion of global market and economic conditions and the risks to our business, see “Item 3. Key Information—D. Risk Factors—Risks Relating to Investments in Indian Companies, Global Economic Conditions and International Operations—Global economic conditions have been unprecedented and challenging and have had, and continue to have, an adverse effect on the Indian financial markets and the Indian economy in general, which has had, and may continue to have, a material adverse effect on our business, our financial performance and the prices of our equity shares and ADSs.ADSs.” Despite a series of economic and political events during the year which resulted in volatility in global markets, the commodity index was 25% higher at the end of fiscal year 2017 as a result of improved macroeconomic conditions. The global economy was supported by improvements in the US economy as well as financial reforms and the introduction of stimulus measures in China. As a result of the rise in global economic activity, demand has increased for commodities, in particular the demand for iron ore, aluminium, copper and oil and gas, which lead to higher prices for those commodities. On the other hand, as a result of the prolonged global economic downturn witnessed over the past few years and limited investments made by mining companies, a lack of new mining projects is leading to supply pressures for some commodities, particularly zinc.
Zinc and Aluminium
The revenue of our zinc and aluminium businesses fluctuate based on the volume of our sales and the respective LME prices of zinc, lead and aluminium and the London Bullion Market Association price of silver. Our zinc business is fully integrated and its profitability is dependent upon the difference between the LME price of zinc and lead, London Bullion Market Association price of silver and our cost of production, which includes the costs of mining and smelting. For the portion of our aluminium business where the bauxite is sourced from BALCO’s own bauxite mines, profitability is dependent upon the LME price of aluminium less our cost of production, which includes the costs of bauxite mining, transportation costs, the refining of bauxite into alumina and the smelting of alumina into aluminium. For the portion of our aluminium business where alumina is sourced from third parties, profitability is dependent upon the LME price of aluminium less the cost of the sourced alumina and our cost of production.
During fiscal year 2016, 47.0%2017, 56.1% of BALCO’s alumina requirement and 47.5%48.2% of our Odisha Aluminium business’ alumina requirement were imported from third parties, with the rest supplied by our Lanjigarh alumina refinery. The following table sets forth the daily average zinc and aluminium LME prices for each of the last three fiscal years:
| For the Year Ended March 31, | For the Year Ended March 31, | |||||||||||||||||||||||
| 2014 | 2015 | 2016 | 2015 | 2016 | 2017 | |||||||||||||||||||
| (in US dollars per ton/ounce) | (in US dollars per ton/ounce) | |||||||||||||||||||||||
Zinc LME | 1,909 | 2,177 | 1,829 | 2,177 | 1,829 | 2,368 | ||||||||||||||||||
Aluminium LME | 1,773 | 1,890 | 1,590 | 1,890 | 1,590 | 1,688 | ||||||||||||||||||
Lead LME | 2,092 | 2,021 | 1,768 | 2,021 | 1,768 | 2,005 | ||||||||||||||||||
Silver London Bullion Market Association * | 21.4 | 18.1 | 15.2 | 18.1 | 15.2 | 17.8 | ||||||||||||||||||
| * | silver is denominated in $/ ounce |
Crude oil and natural gas
Movements in the price of crude oil and discounts to oil prices based on quality parameters significantly affect Cairn India’soil and gas business results of operations and declines in crude oil prices may adversely affect our revenues and profits. Historically, international prices for oil have been volatile and have fluctuated widely due to many factors that are beyond our control, including, but not limited to overall economic conditions, supply and demand dynamics for crude oil and natural gas, political developments, the ability of petroleum producing nations to set and maintain production levels and prices, the price and availability of other energy sources and weather conditions. Lower oil prices may also reduce the economic viability of planned projects planned or those in early stages of development. In addition, a fall in the price of oil may result in the impairment of higher cost reserves and other assets which may result in decreased earnings or losses.
The following table sets out the average price of Brent, an international benchmark oil blend, according to the US Energy Information Administration, for theeach of last three fiscal years ended March 31, 2014, 2015 and 2016:years:
| For the Year Ended March 31, | ||||||||||||
| 2014 | 2015 | 2016 | ||||||||||
| (US$ per barrel) | ||||||||||||
European Brent | 107.5 | 85.4 | 47.5 | |||||||||
| For the Year Ended March 31, | ||||||||||||
| 2015 | 2016 | 2017 | ||||||||||
| (US$ per barrel) | ||||||||||||
European Brent | 85.4 | 47.5 | 48.6 | |||||||||
Realization discount to Brent
The prices of various crude oil are based upon the price of the key benchmark crude oil such as Dated Brent, West Texas Intermediate, and Dubai/Oman. The crude oil prices move based upon market factors such as demand and supply. The regional producers price their crude oil on a premium or discount over the benchmark crude oil based upon differences in quality and competitiveness of various grades.
For Rajasthan and Cambay blocks, the crude oil is benchmarked to Bonny Light, a West African low sulphur crude oil that is frequently traded in the region, with appropriate adjustments for crude quality. For fiscal year 2016,2017, the discount to Dated Brent averaged to $7.2/$5.7/bbl for Rajasthan and at $0.6/$0.8/bbl for Cambay, due to the prevailing oil market conditions. Dated Brent reflects the values of North Sea cargo loading within the next 10-25 days, it incorporates the Brent, Forties, Oseberg and Ekofisk crude oil with the most competitive grade setting the price. European Brent spot prices and dated Brent prices are almost similar.
Ravva crude is benchmarked to Tapis and Minas crude grades (South Asian crudes) and discount averaged to $ 1.1/0.1/bbl to Dated Brent in fiscal year 2016.2017. The crude oil price benchmarks are based on crude oil sales agreements. Movements in the discount range affect our revenue realization and any increase in quality differentials may adversely impact our revenues and profits.
Iron Ore
The revenue of the iron ore business fluctuates based on the volume of sales and the market price of iron ore. We sell iron ore under long-term contracts linked to spot index prices and on spot prices. The prices for iron ore are significantly dependent on the global and regional imbalances between the demand and supply of iron ore, worldwide steel-making capacity and transportation costs. The profitability of the iron ore business is dependent on its selling price, grade and cost of production which includes cost of extracting, processing iron ore and royalty.
The following table sets forth the daily average iron ore prices (62% iron) for each of the last three fiscal years:
| For the Year Ended March 31, | ||||||||||||
| 2014 | 2015 | 2016 | ||||||||||
| (in US dollar per dmt) | ||||||||||||
China Imported Iron Ore Fines (62% iron, cost and freight Tianjin Port) | $ | 128.4 | $ | 82.3 | $ | 51.5 | ||||||
| For the Year Ended March 31, | ||||||||||||
| 2015 | 2016 | 2017 | ||||||||||
| (in US dollar per dmt) | ||||||||||||
China imported iron ore fines (62% iron, cost and freight Tianjin Port) | $ | 82.3 | $ | 51.5 | $ | 67.8 | ||||||
Copper
The revenue of our copper business fluctuates based on the volume of our sales and the LME price of copper. However, as our copper business is primarily one of custom smelting and refining, the profitability of our copper business is significantly dependent upon the market rate of the TcRc. We purchase copper concentrate at the LME linked price for the relevant quotational period less a TcRc that we negotiate with our suppliers but which is influenced by the prevailing market rate for the TcRc. The market rate for the TcRc is significantly dependent upon the availability of copper concentrate, worldwide copper smelting capacity and transportation costs. The TcRc that we are able to negotiate is also substantially influenced by the TcRc terms established by certain large Japanese custom smelters. The profitability of our copper business as to the portion of our copper business where we source copper concentrate from third parties, which accounted for almost 100% of our copper concentrate requirements during fiscal year 2016,2017, is thus dependent upon the amount by which the TcRc we are able to negotiate exceeds our smelting and refining costs. The profitability of our copper operations is also affected by the prices we receive upon the sale ofby-products, such as sulphuric acid and gypsum and precious metals, which are generated during the copper smelting and refining process. The prices we receive forby-products can vary significantly, including as a result of changes in supply and demand and local market factors in the location theby-product is produced. The following table sets forth the average TcRc that we have realized for each of the last three fiscal years:
| For the Year Ended March 31, | ||||||||||||
| 2014 | 2015 | 2016 | ||||||||||
| (in US cents per pound) | ||||||||||||
Copper TcRc | 16.6 | 21.4 | 24.1 | |||||||||
| For the Year Ended March 31, | ||||||||||||
| 2015 | 2016 | 2017 | ||||||||||
| (in US cents per pound) | ||||||||||||
Copper TcRc | 21.4 | 24.1 | 22.4 | |||||||||
The LME price of copper affects our profitability as we source copper concentrate substantially from third parties, which accounted for 100 %97.5% of our copper concentrate requirements in fiscal year 2016.2017. We do not expect to source any copper concentrate from our copper mine, Mt. Lyell in the near future, as the mine has been placed under care and maintenance since July 2014 due to a mud slide and an incident of a rock falling on the ventilation shaft. The following table sets forth the daily average copper LME price for each of the last three fiscal years:
| For the Year Ended March 31, | ||||||||||||
| 2014 | 2015 | 2016 | ||||||||||
| �� | (in US dollars per ton) | |||||||||||
Copper LME | 7,103 | 6,558 | 5,211 | |||||||||
Copper LME For the Year Ended March 31, 2015 2016 2017 (in US dollars per ton) 6,558 5,211 5,152
Power
Under the Indian Electricity Act, the Central Electricity Regulatory Commission or the CERC determines tariffs for the supply of electricity by a generating company. In case of shortage of electricity supply, the CERC may fix the minimum and maximum tariff for sale or purchase of electricity, pursuant to an agreement entered into between a generating company and licensees, for up to one year. Under the guidelines issued by the Ministry of Power, the determination of the tariff for a particular project depends on the mode of participation in the project (i) through signing a memorandum of understanding, based on tariff principles prescribed by CERC (cost plus basis, comprising capacity charge, energy charge, unscheduled interchange charge and incentive payments) or (ii) competitive bidding, where the tariff is market based.
Our tariffs are based on the memorandum of understanding route for contracted quantity. TariffThe tariff for supply of power from our Jharsuguda power plant to GRIDCO according to the power purchase agreementPPA is determined on the basis of principles laid down under the tariff regulation notified by the CERC. TariffThe tariff for supply of power from our Mettur power plant to the Tamil Nadu Electricity Board is determined by the energy purchase agreement with the Tamil Nadu Electricity Board. The agreement was entered for the period June 2016 to May 2017. Currently, MALCO does not have any energy purchase agreement for the supply of power. Due to prevailing business conditions, the MALCO plant has been put under care and maintenance from May 26, 2017. In case of our 1980 MW thermal power plant at Talwandi Sabo, the project was set up through a tariff based competitive bidding process and therefore the capacity charges and efficiency have been determined in line with the bidding process and in accordance with guidelines set out in the power purchase agreementPPA with Punjab State Power Corporation Limited (“PSPCL”). Fuel cost subject to quoted efficiency will be a pass-through. Further, surplus power sold to multiple customers is based on the pricing determined by demand and supply of the power markets. The average power realization price (excluding TSPL) for the years ended March 31, 20152016 and 20162017 was Rs. 3.32.9 and Rs.2.9Rs.2.8 per unit respectively duerespectively. In fiscal year 2016, Jharsuguda power unit of 2400 MW was part of power business in which there was an option for sale in open access. Since April 2016, 1800 MW (three units of 600 MW each) has been converted to weakerCPP in aluminium business. Balance IPP 600 MW power market.supply does not include open access therefore there is decrease in power rate realization based on PPA rate under long term contract. The average power realization price for TSPL for the years ended March 31, 2016 and 2017 was Rs. 4.3 and Rs 4.34.7 respectively per unit based on Plant Availability Factor (“PAF”).
India Market Premium
Generally, our products in India are sold at a premium to the LME market price due to a number of factors including the customs duties levied on imports by the GoI, the costs to transport metals to India and regional market conditions. See “Government Policy.” As a result, we endeavor to sell large quantities of our products in India.
Hedging
We engage in hedging strategies to a limited extent to partially mitigate our exposure to fluctuations in commodity prices, as further described in “Item 11. Quantitative and Qualitative Disclosures about Market Risk— Quantitative and Qualitative Analysis—Commodity Price Risk.”Note 23 “Financial Instruments” in the Notes to the consolidated financial statements.
CostCosts of Production
Our results of operations are, to a significant degree, dependent upon our ability to efficiently run our operations and maintain low costs of production. Efficiencies relating to recovery of metal from the ore, oil and gas extraction, process improvements,by-product management and increasing productivity help drive our costs down. Costs associated with mining and metal production include energy costs, ore extraction and processing costs at our captive mines, labor costs and other manufacturing expenses. CostCosts of production also includesinclude cost of alumina for our aluminium business.
The cost of production of our oil and gas business include expenditure incurred towards the production of crude oil and natural gas including statutory levies, such as cess, royalties (excluding the Rajasthan block) and production payments payable pursuant to the production sharing contracts. Cess forms a major component of the cost of production and any increase/decrease in the rate of the cess will impact adversely/positively the result of the operations.
The cost of production of copper for our custom smelting and refining operations consists of cost of converting copper concentrate into copper cathodes, but does not include the cost of copper concentrate. We purchase copper concentrate at the LME price for copper metal for the relevant quotational period less a TcRc that we negotiate with our suppliers, but which is influenced by the prevailing market rate for the TcRc. We attempt to make the LME price a pass through for us as both the copper concentrate purchases and sales of finished copper products are based on LME prices. The profitability of the copper custom smelting and refining business is therefore dependent upon the amount by which the TcRc that we negotiate with our external suppliers exceeds our smelting and refining costs.
Energy cost is the most significant component of the cost of production in our metal production businesses. Most of our power requirements are met by captive power plants, which are primarily coal fueled. Thermal coal, diesel fuel and fuel oil, which are used to operate our power plants, and metallurgical coke, which is used in the zinc smelting process, are currently sourced from a combination of long term and spot contracts. Our iron ore business meets its power requirement partially through its 60 MW captive power plant and partially from the grid run by the electricity department of the government and in the event the requirement of power is not satisfied through the grid, then we use generators. Our aluminium business, which has high energy consumption due to the power intensive nature of aluminium smelting operation, sources approximately 35% of its thermal coal requirement through linkage route from Mahanadi Coalfields Limited and South Eastern Coal Fields Limited, subsidiaries of Coal India Limited. We entered into five-year supply agreements in 2008 for five units of 135 MW each, in 2009 for two additional units of 135 MW each and in 2014 for additional two units of 135 MW each for the Jharsuguda 1,215 MW captive power plant. The remaining coal is sourced through open market purchases and imports. The contract entered in 2008 was further renewed in 2014 until 2018. Shortages of coal at Coal India Limited may require that a greater amount of higher priced imported coal be utilized. During the fourth quarter of fiscal year 2015, BALCO was successful in securing one coal mine in coal block auctions conducted by the GoI, namely the Chotia coal block. The total reserves at the Chotia block are 17.517.2 million tons, with the annual production capacity of one million tons. The production commenced at the Chotia mine during fourth quarter of fiscal year 2016.
HZL, in January 2006, as part of a consortium with five other partners, secured the award of a coal block from the Ministry of Coal of the GoI. HZL’s share of the coal block is approximately 31.5 million tons. On June 16, 2008, the Ministry of Coal of the GoI approved the consortium’s plan for mining the coal block. However, on February 17, 2014, the Ministry of Coal issued a letter cancelling the coal block allocation stating that the consortium could not obtain forest clearance and adhere to time line for development of the coal block and also taking into consideration the fact that the same was rejected earlier. This cancellation by the Ministry of Coal was challenged by the consortium in the High Court of Chhattisgarh and a stay order was granted on March 11, 2014. In September 2014, the Supreme Court revoked all the allocations of coal blocks which were awarded from 1992 to 2012 by the Ministry of Coal’s screening committee. Now, an auction route has evolved for the new allocation of coal blocks.
After being denied access to the coal field, HZL continues to import coal from third party suppliers. HZL’s operations source their back-up power from liquid fuel-based captive power plants or from local power companies. The liquid fuel is sourced from third-party suppliers on yearly contracts.
Further, we had obtained coal block allocations of 112.2 million tons from the Ministry of Coal, GoI to support the 2,400 MW thermal-based commercial power facility in the State of Odisha in Eastern India. However, on September 24, 2014, the Supreme Court ordered for the cancellation of the coal blocks allotted by the GoI over the past few decades. BALCO participated in the e-auction for Gare Palma IV/1 coal mine and was the preferred bidder. Per The Coal Mines (Special Provisions) Act, 2015, post the preferred bidder status, the Coal Ministry was to confirm the status further to the Nominated Authority’s recommendation. The Nominated Authority pursuant to the recommendation of the Coal Ministry issued an order dated March 20, 2015 stating that BALCO is not to be declared as the successful bidder in respect of Gare Palma IV/1 Coal Mine. BALCO has filed a writ petition in the high court See “Item 8. Financial Information – A. Legal Proceedings—Proceedings by BALCO pertaining to direction by GoI not to declare us as the successful bidder in the e-auction of Gare Palma IV/1 coal mine.”
For our zinc and iron ore business and the portions of our copper and aluminium businesses where we source the ore from our own mines, ore extraction and processing costs affect our cost of production. In our iron ore businesses, the ore extraction and processing costs to produce concentrates are generally a small percentage of our overall cost of production of the finished metals. In our aluminium business, the bauxite ore extraction cost is not significant but the refining cost to produce alumina from bauxite ore including transportation costs represents approximatelyone-third of the cost of production of aluminium. In iron ore, logistics represents approximately 25 % to 30 % of the total cost of production in the case of exports. In addition, a significant cost of production in our zinc and iron ore business is the royalty that HZL pays on the lead-zinc ore that is mined, which royalty is a function of the LME prices of zinc and lead and the iron ore pays on extraction of iron ore at the rate declared by the Indian Bureau of Mines. See “Government Policy—Taxes, royalties and cess payments.”
In the commercial power generation business, production costs are mainly coal costs and the coal is largely sourced from the domestic market. Labor costs are principally a function of the number of employees and increases in compensation from time to time. Improvements in labor productivity in recent years have resulted in a decrease in the per unit labor costs. We outsource a majority of BALCO’s mining operations, a substantial portion of HZL’s and iron ore’s mining operations, Cairn India’s oil and gas operations and a limited number of functions at our copper, zinc and aluminium smelting operations to third party contractors. The operations and maintenance activities at the Jharsuguda 2,400 MW power facilities, BALCO’s 1200 MW and two540 MW and TSPL 6601,980 MW power facilities are substantially outsourced to third party contractors.
Other manufacturing expenses include, among other things, additional materials and consumables that are used in the production processes and routine maintenance to sustain ongoing operations. None of these represents a significant portion of our costs of production.
Cost of production as reported for our metal products includes an offset for any amounts we receive upon the sale of theby-products from the refining or smelting processes. We present costs of production for our metal products on the following basis: (i) cost of production beforeby-product revenue, which represents the direct cash costs relating to production and conversion costs of metal (such as energy costs, ore extraction costs and processing costs at our captive mines, labor costs and other manufacturing expenses); excluding depreciation, impairment charges and finance costs, and (ii) cost of production net ofby-product revenues which represents cost of production beforeby-product revenue offset by any amounts we receive upon sale ofby-products from such operations. Offsettingby-product revenues is useful to the management and investors to compare our cost competitiveness with our peers in the industry as it is a common metric used by our peers in the industry. Cost of production beforeby-product revenue and net ofby-product revenue is divided by the daily average exchange rate for the year to calculate US dollar cost of production per lb or per ton of metal as reported.
The following table sets forth our average realized TcRc and cost of production for each of our metals, power, oil and gas for each of the last three fiscal years:
| For the Year Ended March 31, | For the Year Ended March 31, | |||||||||||||||||||||||||||
| Unit of Measurement | 2014 | 2015 | 2016 | Unit of Measurement | 2015 | 2016 | 2017 | |||||||||||||||||||||
| (in US dollars per ton, except as indicated) | (in US dollars per ton, except as indicated) | |||||||||||||||||||||||||||
TcRc(1) | ¢/lb | 16.6 | 21.4 | 24.1 | ¢/lb | 21.4 | 24.1 | 22.4 | ||||||||||||||||||||
Cost of production before by-product revenue(2) | ||||||||||||||||||||||||||||
Zinc India(3) | $ | 1,069 | 1,215 | 1,151 | $ | 1,215 | 1,151 | 1,259 | ||||||||||||||||||||
Zinc International(4) | $ | 1,300 | 1,533 | 1,548 | $ | 1,533 | 1,548 | 1,610 | ||||||||||||||||||||
Oil and Gas(5) | $/boe | 20.9 | 22.9 | 21.8 | $/boe | 22.9 | 21.8 | 20.4 | ||||||||||||||||||||
Iron ore(6) | $ | 40.9 | 134.9 | 24.6 | $ | 134.9 | 24.6 | 18.0 | ||||||||||||||||||||
Copper smelting and refining(7) | ¢/lb | 18.8 | 14.0 | 11.3 | ¢/lb | 14.0 | 11.3 | 11.9 | ||||||||||||||||||||
Aluminium(8) | $ | 1,664 | 1,790 | 1,589 | $ | 1,790 | 1,589 | 1,466 | ||||||||||||||||||||
Power – Jharsuguda 2400 MW plant | Rs./unit | 2.1 | 2.1 | 2.1 | ||||||||||||||||||||||||
Power – Jharsuguda 600 MW plant | Rs./unit | 2.1 | 2.1 | 2.0 | ||||||||||||||||||||||||
Cost of production net of by-product revenue(2) | ||||||||||||||||||||||||||||
Zinc India(3) | $ | 985 | 1,111 | 1,046 | $ | 1,111 | 1,046 | 1,154 | ||||||||||||||||||||
Zinc International(4) | $ | 1,167 | 1,393 | 1,432 | $ | 1,393 | 1,432 | 1,417 | ||||||||||||||||||||
Oil and Gas(5) | $/boe | 20.9 | 22.9 | 21.8 | $/boe | 22.9 | 21.8 | 20.4 | ||||||||||||||||||||
Iron ore(6) | $ | 40.9 | 134.9 | 24.6 | $ | 134.9 | 24.6 | 18.0 | ||||||||||||||||||||
Copper smelting and refining(7) | ¢/lb | 9.7 | 4.2 | 3.2 | ¢/lb | 4.2 | 3.2 | 5.0 | ||||||||||||||||||||
Aluminium(8) | $ | 1,658 | 1,785 | 1,573 | $ | 1,785 | 1,573 | 1,463 | ||||||||||||||||||||
Power - Jharsuguda 2400 MW plant | Rs./unit | 2.1 | 2.1 | 2.1 | ||||||||||||||||||||||||
Power - Jharsuguda 600 MW plant | Rs./unit | 2.1 | 2.1 | 2.0 | ||||||||||||||||||||||||
Notes:
| (1) | Represents our average realized TcRc for the period. |
| (2) | Cost of production per unit is not a recognized measure under IFRS as issued by the IASB. We have included cost of production as it is a key performance indicator used by the management to assess the performance of our operations. We also believe it is a measure used by investors and analysts to evaluate companies in our industry. Our results of operations are, to a significant degree, dependent upon our ability to efficiently run our operations and maintain low costs of production. Efficiencies relating to recovery of metal from the ore, process improvements,by-product management and increasing productivity help drive our costs down. Our computation of cost of production should be considered in addition to, and not as a substitute for other measures of financial performance and liquidity reported in accordance with IFRS as issued by the IASB. Cost of production is a measure intended for monitoring the operating performance of our operations. This measure is presented by other metal companies, though our measure may not be comparable to similarly titled measures reported by other companies. |
| (3) | Cost of production of zinc beforeby-product revenue increased from |
| (4) | Cost of production net ofby-product credit |
| (5) | Cost of production for oil and gas, decreased to $ 20.4 per net boe in fiscal year 2017 from $ 21.8 per net boe in fiscal year 2016, |
| (6) | Cost of production for iron ore, decreased to $ |
| (7) | Cost of production, when compared before offsetting theby-product and free copper revenue |
| (8) | Cost of production before adjustingby-product revenue decreased from |
We present below the cost of production for our metal products on the following basis:
(i) cost of production beforeby-product revenue, which represents the direct cash costs relating to production and conversion costs of metal (such as energy costs, ore extraction costs and processing costs at our captive mines, labor costs and other manufacturing expenses), excluding depreciation, impairment charges and finance costs, and
(ii) cost of production net ofby-product revenues which represents cost of production beforeby-product revenue offset by any amounts we receive upon sale ofby-products from such operations. Offsettingby-product revenues is useful to the management and investors to compare our cost competitiveness with our peers in the industry as it is a common metric used by our peers in the industry.
We explain the cost of production for each metal as set forth below:
Our iron ore operations in Goa were recommenced in August 2015, after receiving necessary approvals from the state government. Our iron ore operations had been suspended during fiscal year 2015 due to the continued mining ban in the state of Goa. Our cost of production of iron ore shows a significant decrease as the cost of production of fiscal year 20152016 also factors in fixed administrative costs incurred in our Goa operations and Karnataka operations which will be now spread over to larger production compared to last year.
Cost of production beforeby-product revenue (per ton) (a) Cost of production net ofby- Product revenue (per ton) (a) Cost of production net ofby- Product revenue (per ton) (a) Cost of production beforeby-product revenue (per ton) (a) Cost of production net ofby-product revenue (per ton) (a)For more information see Note (2) to the table on page 14 of Item 3A: “Key Information – Selected Consolidated Financial Data”. For the Year Ended March 31, 2013 2014 2015 2016 2017 (Rs. in millions, except Production output and Cost of production) Zinc—India: Segment revenue Rs. 123,241 Rs. 132,811 Rs. 144,127 Rs. 137,945 Rs. 169,400 Less: Segment profit (64,227 ) (68,642 ) (70,605 ) (66,970 ) (95,499 ) 59,014 64,169 73,522 70,975 73,901 Less: Cost of tolling including raw material cost (6,805 ) — — — (3,364 ) Cost of intermediary product sold (1,806 ) (3,461 ) (3,230 ) (2,348 ) (1,771 ) Cost of lead metal sold (6,962 ) (8,115 ) (8,991 ) (10,264 ) (10,677 ) Others(c) (2,506 ) (4,146 ) (6,773 ) (1,185 ) (1,347 ) Total before adjusting forby-product revenues Rs. 40,934 Rs. 48,447 Rs. 54,528 Rs. 57,178 Rs. 56,743 By-product revenue (4,766 ) (3,821 ) (4,692 ) (5,234 ) (4,737 ) Total after adjusting forby-product revenues Rs. 36,168 Rs. 44,626 Rs. 49,836 Rs. 51,944 Rs. 52,006 Production output (in tons) 676,923 749,167 733,805 758,938 671,987 $ 1,111 $ 1,069 $ 1,215 $ 1,151 $ 1,259 $ 981 $ 985 $ 1,111 $ 1,046 $ 1,154 Rs. 53,430 Rs. 59,568 Rs. 67,914 Rs. 68,442 Rs. 77,391 Zinc—International: Segment revenue Rs. 43,475 Rs. 40,156 Rs. 35,886 Rs. 25,631 Rs. 22,302 Less: Segment profit (15,712 ) (12,829 ) (11,059 ) (4,561 ) (9,181 ) �� 27,763 27,327 24,827 21,070 13,121 Less: TcRc 3,344 4,191 4,943 3,757 973 Cost of lead metal sold (5,336 ) (4,631 ) (4,486 ) (3,859 ) (4,038 ) Others(c) (3,351 ) (2,900 ) (894 ) (2,419 ) 2,275 Total before adjusting forby-product revenues Rs. 22,421 Rs. 23,987 Rs. 24,390 Rs. 18,549 Rs. 12,331 By-product revenue (1,459 ) (2,464 ) (2,230 ) (1,390 ) (1,479 ) Total after adjusting forby-product revenues Rs. 20,962 Rs. 21,522 Rs. 22,160 Rs. 17,159 Rs. 10,852 Production output (in tons) 353,404 304,945 260,106 183,035 114,135 $ 1,165 $ 1,300 $ 1,533 $ 1,548 $ 1,610 $ 1,089 $ 1,167 $ 1,393 $ 1,432 $ 1,417
Total before adjusting forby-product revenues Cost of production beforeby-product revenue (per boe)(a) Cost of production net ofby-product revenue (per boe)(a) Total before adjusting forby-product revenues Cost of production beforeby-product revenue (per dmt) (a) Cost of production net ofby-product revenue (per dmt) (a) For the Year Ended March 31, 2013 2014 2015 2016 2017 (Rs. in millions, except Production output and Cost of production) Oil and Gas Segment revenue 175,518 187,103 146,945 86,559 82,041 Less: Segment profit (128,502 ) (139,453 ) (88,671 ) (34,273 ) (40,892 ) 47,016 47,650 58,274 52,286 41,149 Less: Unsuccessful Exploration Cost (2,821 ) (653 ) (7,867 ) (294 ) (407 ) Other income 1,025 379 103 176 70 Pre award cost (194 ) (242 ) (1 ) (71 ) — Others(c) (5,217 ) (5,575 ) (5,619 ) (4,606 ) (1,671 ) Rs. 39,810 Rs. 41,560 Rs. 44,890 Rs. 47,491 Rs. 39,141 By-product revenue — — — — — Total after adjusting forby-product revenues Rs. 39,810 Rs. 41,560 Rs. 44,890 Rs. 47,491 Rs. 39,141 Net Production (in mmboe) 33.00 32.89 32.01 33.33 28.55 $ 22.2 $ 20.9 $ 22.9 $ 21.8 $ 20.4 $ 22.2 $ 20.9 $ 22.9 $ 21.8 $ 20.4 Iron Ore Segment revenue 26,119 16,558 19,963 22,774 41,290 Less: Segment profit (4,530 ) 2,700 891 (4,367 ) (13,091 ) 21,589 19,258 20,854 18,407 28,199 Less: Cost of Intermediary product sold (9,309 ) (16,340 ) (15,953 ) (11,652 ) (12,880 ) Export Duty (4,430 ) — — (250 ) (1 ) Others(c) 500 810 214 1,810 (2,097 ) 8,351 3,728 5,115 8,316 13,221 By-product revenue — — — — — Total after adjusting forby-product revenues 8,351 3,728 5,115 8,316 13,221 Production output (in million dmt) 3.71 1.51 0.62 5.17 10.9 $ 41.3 $ 40.9 $ 134.9 $ 24.6 $ 18.0 $ 41.3 $ 40.9 $ 134.9 $ 24.6 $ 18.0
Total before adjusting forby-product and free copper revenues Total after adjusting forby-product and free copper revenues Cost of production beforeby-product and free copper revenue (a) Cost of production net ofby-product and free copper revenue (a) Total before adjusting forby-product revenues Total after adjusting forby-product revenues Production output (hot metal) (in tons) Cost of production beforeby-product revenue (per ton) (a) Cost of production net ofby-product (per ton) (a) Cost of production net ofby-product (per ton) (a) For the Year Ended March 31, 2013 2014 2015 2016 2017 (Rs. in millions, except Production output and Cost of production) Copper: Segment revenue Rs. 217,374 Rs. 205,879 Rs. 226,298 Rs. 209,262 Rs. 210,176 Less: Segment profit (10,868 ) (11,429 ) (17,385 ) (22,205 ) (16,964 ) 206,506 194,450 208,913 187,057 193,212 Less: Purchased concentrate/rock (193,200 ) (182,399 ) (196,428 ) (177,067 ) (179,803 ) Cost for downstream products (2,163 ) (3,354 ) (3,441 ) (1,533 ) (1,931 ) Others(c): (2,630 ) (1,295 ) (2,220 ) (2,181 ) (4,397 ) Rs. 8,513 Rs. 7,402 Rs. 6,824 Rs. 6,276 Rs. 7,081 By-product revenues (2,165 ) (1,208 ) (2,215 ) (2,377 ) (2,020 ) Free Copper net sale (2,647 ) (2,385 ) (2,559 ) (2,138 ) (2,085 ) Rs. 3,701 Rs. 3,809 Rs. 2,050 Rs. 1,761 Rs. 2,976 Production output (in tons) 353,154 294,434 362,373 384,047 402,730 ¢/lb 20.1 ¢/lb 18.8 ¢/lb 14.0 ¢/lb 11.3 ¢/lb 11.9 ¢/lb 8.7 ¢/lb 9.7 ¢/lb 4.2 ¢/lb 3.2 ¢/lb 5.0 Aluminium: Segment revenue 99,633 107,989 127,130 110,910 136,862 Less: Segment profit (11,285 ) (16,131 ) (22,529 ) (8,467 ) (23,200 ) 88,348 91,858 104,601 102,443 113,662 Cost for downstream products (5,140 ) (4,230 ) (4,611 ) (3,998 ) (4,105 ) Others(c): (3,613 ) (7,540 ) (7,707 ) (7,707 ) (3,115 ) Rs. 79,594 Rs. 80,087 Rs. 92,283 Rs. 90,738 Rs. 106,442 By-product revenue (299 ) (281 ) (223 ) (903 ) (252 ) Rs. 79,296 Rs. 79,807 Rs. 92,060 Rs. 89,835 Rs. 106,190 774,851 795,728 843,219 872,591 1,081,955 $ 1,887 $ 1,664 $ 1,790 $ 1,589 $ 1,466 $ 1,879 $ 1,658 $ 1,785 $ 1,573 $ 1,463 Rs. 102,337 Rs. 100,294 Rs. 109,177 Rs. 102,953 Rs. 98,147
Cost of power at TSPL, BALCO, HZL and MALCO Energy Cost of production beforeby-product revenue (per unit) Cost of production net ofby-product revenue (per unit) For the Year Ended March 31, 2013 2014 2015 2016 2017 (Rs. in millions, except Production output and Cost of production) Power Segment revenue 36,365 37,638 41,186 49,826 56,079 Less: Segment profit (11,551 ) (7,429 ) (8,424 ) (12,659 ) (16,442 ) 24,814 30,209 32,762 37,167 39,637 Less: (8,286 ) (9,456 ) (13,725 ) (19,284 ) (33,228 ) Others(c): (2,555 ) (4,710 ) (3,589 ) (2,287 ) 80 Total Rs. 13,973 Rs. 16,043 Rs. 15,448 Rs. 15,596 Rs. 6,490 Production output (in MU)(b) 6,718 7,625 7,216 7,464 3,328 Rs. 2.1 Rs. 2.1 Rs. 2.1 Rs. 2.1 Rs. 2.0 Rs. 2.1 Rs. 2.1 Rs. 2.1 Rs. 2.1 Rs. 2.0
Notes:
| (a) | Exchange rates used in calculating cost of production were based on the daily Reserve Bank of India (“the RBI”), reference rates for the years ended March 31, 2013, 2014, 2015, 2016 and 2017 of Rs. 54.45, Rs. 60.50, Rs. 61.15, Rs. 65.46 and Rs. 67.09 per $ 1.00 respectively. |
| (b) | Production does not include units generated from the TSPL 660 MW, the 274 MW HZL wind power plant, the 270 MW and IPP 600 MW BALCO power plant and MALCO Energy’s 106.5 MW power plant. |
| (c) | “Others” include head office expenses, administration expenses, selling and distribution expenses, and exploration costs that have been expensed, changes in inventory, foreign exchange fluctuations, expenses incurred for large corporate social responsibility initiatives undertaken, such as building hospitals and other operating income. These costs are indirect costs and not related to the direct cash cost of production and hence have been excluded from calculating cost of production. |
Production Volume and Mix
Production volume has a substantial effect on our results of operations. We are generally able to sell all of the products which we produce, so the revenue generally fluctuates as a result of changes in our production volumes. Production volumes depend on our production capacities, which have increased in recent years across all of our businesses. For our mining operations, production volumes also depend upon the quality and consistency of the ore. Per unit production costs are significantly affected by changes in production volumes in that higher volumes of production generally reduce the per unit production costs. Therefore, our production volumes are a key factor in determining our overall cost competitiveness. The following table summarizes our production volumes for our primary products for the last three fiscal years:
| For the Year Ended March 31, | For the Year Ended March 31, | |||||||||||||||||||||||||||
Product | 2014 | 2015 | 2016 | Product | 2015 | 2016 | 2017 | |||||||||||||||||||||
| (tons except where otherwise stated) | (tons except where otherwise stated) | |||||||||||||||||||||||||||
Zinc India | Zinc | 749,167 | 733,803 | 758,938 | Zinc | 733,803 | 758,938 | 671,987 | ||||||||||||||||||||
| Lead | 122,596 | 127,143 | 144,919 | Lead | 127,143 | 144,919 | 139,008 | |||||||||||||||||||||
| Silver (Kilograms) | 349,620 | 327,508 | 424,578 | Silver (kilograms) | 327,508 | 424,578 | 452,543 | |||||||||||||||||||||
Zinc International | ||||||||||||||||||||||||||||
— Skorpion | Zinc | 124,924 | 102,188 | 82,029 | Zinc | 102,188 | 82,029 | 85,427 | ||||||||||||||||||||
— BMM | Copper(1) | 6,880 | 5,678 | 4,729 | Copper(1) | 5,678 | 4,729 | 5,016 | ||||||||||||||||||||
| Zinc(1) | 28,999 | 27,022 | 29,272 | Zinc(1) | 27,022 | 29,272 | 28,708 | |||||||||||||||||||||
| Lead(1) | 37,574 | 32,142 | 34,114 | Lead(1) | 32,142 | 34,114 | 41,769 | |||||||||||||||||||||
— Lisheen | Zinc(1) | 151,022 | 130,897 | 71,825 | Zinc(1) | 130,897 | 71,825 | — | ||||||||||||||||||||
| Lead(1) | 21,048 | 19,265 | 8,726 | Lead(1) | 19,265 | 8,726 | — | |||||||||||||||||||||
Oil & gas (on net basis)(2) | ||||||||||||||||||||||||||||
Oil and gas (on net basis)(2) | ||||||||||||||||||||||||||||
| Crude Oil (mmbbls) | 32.2 | 31.4 | 32.6 | Crude Oil (mmbbls) | 31.4 | 32.6 | 28.0 | |||||||||||||||||||||
| Natural Gas (bcf) | 3.9 | 3.5 | 4.3 | Natural Gas (bcf) | 3.5 | 4.3 | 3.0 | |||||||||||||||||||||
Iron ore | Saleable Ore Production (million dmt) | 1.5 | 0.6 | 5.2 | Saleable Ore Production (million dmt) | 0.6 | 5.2 | 10.9 | ||||||||||||||||||||
Copper | Copper cathode(3) | 294,434 | 362,373 | 384,047 | Copper cathode(3) | 362,373 | 384,047 | 402,730 | ||||||||||||||||||||
| Copper rods | 123,053 | 170,338 | 210,799 | Copper rods | 170,338 | 210,799 | 207,530 | |||||||||||||||||||||
Aluminium(2) | Ingots(4) | 335,722 | 408,406 | 426,691 | Ingots(4) | 408,406 | 426,691 | 671,885 | ||||||||||||||||||||
| Value Added Products(4)(5) | 458,567 | 468,853 | 487,760 | Value Added Products(4)(5) | 468,853 | 487,760 | 494,977 | |||||||||||||||||||||
| Hot Metal | — | — | 8,892 | Hot Metal | — | 8,892 | 46,541 | |||||||||||||||||||||
Power | Power (Million Units) | 9,374 | 9,859 | 12,121 | Power (million units) | 9,859 | 12,121 | 12,914 | ||||||||||||||||||||
Notes:
| (1) | Refers to mined metal content in concentrate. |
| (2) | While computing EI production, Ravva royalty fees have not been netted off. |
| (3) | Copper cathode is used as a starting material for copper rods. Approximately one ton of copper cathode is required for the production of one ton of copper rods. |
| (4) | Includes production capitalized in fiscal years |
| (5) | Value added products of Aluminium include production of billets, rods and rolled products. |
Periodically, our facilities are shut down for planned and unplanned repairs and maintenance which temporarily reduces our production volume. In addition, the mix of products we produce can have a substantial impact on our results of operations as we have different operating margins in each of our businesses, and within each business our operating margins vary between the lower margins of primary metals and the higher margins of value-added products such as copper rods and aluminium rolled products. For example, copper cathodes are converted in our copper rod plant into copper rods, a value-added product which has a higher margin than copper cathodes. As copper rods have higher margins, we endeavor to sell as large a percentage of copper rods as possible. As the production volume of our various products fluctuate primarily based on market demand and our production capacity for such products, the percentage of our revenue from those products will also fluctuate between higher and lower margin products, which will in turn cause our operating profit and operating margins to fluctuate.
Profit Petroleum
The GoI is the owner of the hydrocarbons wherein it has assigned the responsibility to the joint operation (contractor) to explore, develop and produce the hydrocarbons. Contractor is entitled to recover out of petroleum produced, all the costs incurred according to the production sharing contracts in exploring, developing and producing the hydrocarbons, which is known as “Cost Petroleum”“cost petroleum”. Excess of revenue (value of hydrocarbons produced) over and above the cost incurred as above, is called “Profit Petroleum”“profit petroleum”, which is shared between the GoI and contractor parties as per procedure laid down in production sharing contracts.
Profit Petroleumpetroleum sharing between the GoI and the contractor is determined by PTRR Method (Post Tax Ratepost- tax rate of Return)return method in case of Ravva andCB-OS/2 and on the investment multiple method in case of Rajasthan block as defined in their respective production sharing contracts.
The share of Profit Petroleum,profit petroleum, in any year, is calculated for the contract/contract or development area on the basis of thepost-tax rate of return investment multiple actually achieved by the companies at the end of the preceding year for the contract/development area.
The following table summarizes the current government share of profit petroleum for various blocks and development areas:
| Block/Development Area | Government share of profit petroleum as at March 31, | Government share of profit petroleum as at March 31, | ||||||||||||||||||||||
| 2014 | 2015 | 2016 | 2015 | 2016 | 2017 | |||||||||||||||||||
Ravva | 60% | 60% | 60% | 60% | 60% | 60% | ||||||||||||||||||
Cambay – Lakshmi | 45% | 45% | 45% | 45% | 45% | 45% | ||||||||||||||||||
Cambay – Gauri | 55% | 55% | 55% | 55% | 55% | 55% | ||||||||||||||||||
Cambay – CB-X | 60% | 60% | 60% | 60% | 60% | 60% | ||||||||||||||||||
Rajasthan – DA1 | 30% | 40% | 40% | |||||||||||||||||||||
Rajasthan – DA2 | 20% | 30% | 40% | |||||||||||||||||||||
Rajasthan – Development Area1 | 40% | 40% | 40% | |||||||||||||||||||||
Rajasthan – Development Area2 | 30% | 40% | 40% | |||||||||||||||||||||
With the increase in the operations and revenue in each block, the above mentioned percentage is subject to increase, leading to a higher government share of profit petroleum. This will have an adverse impact on our result of operations as it will lead to an increase in our share of profit petroleum expense to be paid to the GoI.
Government Policy
India Customs Duties
We sell our products in India at a premium to the LME price, due in part to the customs duties payable on imported products. Our profitability is affected by the levels of customs duties as we price our products sold in India generally on an import-parity basis. We also pay a premium on certain raw materials that we import or which are sourced locally but which are priced on an import-parity basis as a result of customs duties, with copper concentrate, petroleum products, alumina, carbon and caustic soda being the primary examples. The following table sets forth the customs duties that were applicable for the periods indicated:
| March 1, 2011 to August 12, 2013 | August 13, 2013 to February 29, 2016 | March 1, 2016 to Present | August 13, 2013 to February 29, 2016 | March 1, 2016 to Present | ||||||||||||||||
Copper | 5.0% | 5.0% | 5.0% | 5.0% | 5.0% | |||||||||||||||
Copper concentrate | 2.5% | 2.5% | 2.5% | 2.5% | 2.5% | |||||||||||||||
Zinc | 5.0% | 5.0% | 5.0% | 5.0% | 5.0% | |||||||||||||||
Lead | 5.0% | 5.0% | 5.0% | 5.0% | 5.0% | |||||||||||||||
Silver | 6.0% | 10.0% | 10.0% | 10.0% | 10.0% | |||||||||||||||
Aluminium | 5.0% | 5.0% | 7.5% | 5.0% | 7.5% | |||||||||||||||
In addition, the Finance Act (2 of 2004) of India, which has been in effect since July 8, 2004, levied an additional surcharge at the rate of 2.0% of the total customs duty payable which has been further increased to 3.0% of the total customs duty payable effective March 1, 2007. We are also liable to pay an additional duty of customs, countervailing duty or CVD, of 12.5% (for the period from March 18, 2012 to February 28, 2015, the CVD was 12%) of the assessable value and basic custom duty, which is levied on imports in India. Education cess and secondary and higher education cessIn addition, special additional duty is also levied @ 4% on CVD is reduced to nil from March 17, 2012 (prior to March 17, 2012 it was 3% of CVD).imports in India.
The GoI may reduce or abolish customs duties on copper and aluminium in the future, although the timing and extent of such reductions cannot be predicted. As we sell the majority of the commodities we produce in India, any further reduction in Indian tariffs on imports will decrease the premiums we receive in respect of those sales. Our profitability is dependent to a small extent on the continuation of import duties and any reduction would have an adverse effect on our results of operations and financial condition.
In February 2011, theThe import duty at the rate of 2.5% is levied on copper concentrateconcenterate and rock phosphate was increased fromphosphate. Excise duty at the rate of 2.0% to 2.5%, and a 1% excise duty wasis also imposed on coal. The excise duty on coal was further increased to 2% vide notification dated March 17, 2012 in the event cenvat credit is not availed. However, if cenvat credit is availed, then the excise duty rate on coal becomes 6%.
Goods imported for the purposes of “Petroleum“petroleum operations” are exempt from Customscustoms duty under Notification No 12/2012 - Customs dated17-03-2012, sr. no. 358 and 359, condition no 42 and 43 respectively. Goods which are imported for purposes other than petroleum operations such as software, IT related goods or any other material required for office purposes are liable to customs duty as per the applicable rates in force which may vary from approximately 24%24.0% to 27%27.0% depending upon the classification of goods as mentioned in the customs tariff 2015-16. Pursuant to a notification in March 2013, a customs duty of 2.5% was introduced by the GoI on bauxite (natural), in calcined and non-calcined form.2016-17.
Export Incentives
The GoI provides a variety of export incentives to Indian companies. Exports of copper, aluminium and zinc from India receive assistance premiums from the GoI. Export incentives do not outweigh the Indian market price premiums. Accordingly, notwithstanding the export incentives, we endeavor to sell large quantities of our products domestically.
In fiscal years 20152016 and 2016,2017, exports accounted for 26.9%25.0% and 25.0%29.0% respectively, of our zinc India business’ revenue. The following table sets forth the export assistance premiums, as a percentage of the F.O.B value of exports, on zinc concentrate, zinc ingots and lead concentrate for the periods indicated:
| October 9, 2012 to September 20, 2013 (percentage of F.O.B value of exports) | September 21, 2013 to November 21, 2014 (percentage of F.O.B value of exports) | November 22, 2014 to present (percentage of F.O.B value of exports) | ||||||||||
Zinc concentrate | 1.5% | 1.3% | 1.0% | |||||||||
Zinc ingots | 2.0% | 1.7% | 1.9% | |||||||||
Lead concentrate | 1.5% | 1.3% | 1.0% | |||||||||
In fiscal years 20152016 and 2016,2017, exports accounted for 41.7%38.0% and 38.0%55.5%, respectively, of our copper business revenue. The following table sets forth the export assistance premiums, in the form of Marked Linked Focus Product Scheme as a percentage of the F.O.B value of exports, on copper cathode and copper rods for the period indicated:
| October 1, 2011 to March 31, (percentage of F.O.B value of exports) | ||||
Copper cathode | 2.0% | |||
Copper rods# | 2.0% | |||
| # | Applicable for export to Czech Republic only. |
Further, with effect from April 1, 2015, the New Merchandise Exports from India Scheme was introduced in place of Marked Linked Focus Product Scheme. In the newthis scheme, no export incentive has beenwas notified for copper products.
In fiscal years 20152016 and 2016,2017, exports accounted for 33.7%39.7% and 39.7%47.0% respectively, of our aluminium business’ revenue. The following table sets forth the export assistance premiums, as a percentage of the F.O.B value of exports, on aluminium ingots, aluminium rods and aluminium rolled products for the periods indicated:
| October 1, 2011 to September 12, 2013 | September 13, 2013 to March 31, 2014 | April 1, 2014 to November 21, 2014 | November 22, 2014 to Present | April 1, 2014 to November 21, 2014 | November 22, 2014 to Present | November 15, 2016 to Present | ||||||||||||||||||||||
Aluminium ingots | 2.0% | 1.7% | 1.7% | 1.9% | 1.7% | 1.9% | 1.0% | |||||||||||||||||||||
Aluminium rods | 2.0% | 1.7% | 1.7% | 1.9% | 1.7% | 1.9% | 1.5% | |||||||||||||||||||||
Aluminium billets | 1.9% | 1.9% | 1.0% | |||||||||||||||||||||||||
Aluminium rolled products | 3.0% | 3.0% | 0% | 0% | 0% | 0% | 1.5% | |||||||||||||||||||||
In the case of sales to specified markets (as defined herein), export assistance premiums for these products would extend to 2% of the F.O.B value of exports made to the countries specified under the Merchandise Export from India Scheme (MEIS)(“MEIS”). The MEIS was implemented under the Foreign Trade Policy of India in2015-20. The purpose of this scheme is to provide Indian exporters certain incentives such as tax benefits, and thereby enhance India’s export competitiveness in certain specified markets, including, but not limited to Argentina, Austria, Bulgaria, Cambodia, Chile, and New Zealand (“specified markets”). The GoI may further reduce export incentives in the future, which would adversely affect our results of operations.
In fiscal year 2015, export assistance premiums on aluminium rolled products were eliminated and duty exemption scheme of duty free import authorization was introduced to enable duty free import of inputs required for export production pursuant to Chapter 4 of the foreign trade policyForeign Trade Policy whereby advance authorization for inputs and exports items was given under the Standard Input Output Norm (“SION”) policy scheme.
India export duties
The GoI levies duty on the export from India of certain products mentioned under the second schedule of the Customs Tariff Act 1975, including iron ore and concentrates, at a specified rate (ad valorem on the Freefree on Boardboard value of exports).
Effective from March 1, 2011, the The GoI raisedlevied export duty on iron ore fines and lumps from 5%@ 20% on FOB value and 10% respectivelyfurther increased to an even rate of 20%, ad valorem on the Free on Board value of exports. Effective30% with effect from December 30, 2011, the GoI further raised the rate of export duty on iron ore fines and lumps from 20% to 30%.31, 201. Effective from April 30, 2015, the export duty on iron ore fines with Fe content less than 58%58.0% is 10%10.0% and more than 58.0% Fe, duty rate is 30.0% and for iron ore fines it is 30.0%. With effectEffective from March 1,01, 2016, the export duty on iron ore fines and lumps (below 58%with Fe content) has been reduced from 30% tocontent less than 58.0% is nil and iron ore fines (below 58%more than 58.0% Fe, content) has been reduced from 10% to nil.duty rate is 30.0%.
Taxes, royalties and cess payments
Income tax on Indian companies during fiscal year 20162017 was charged at a statutory rate of 30.0% plus a surcharge of 12.0% on the tax and has an additional charge of 3.0% on the tax including surcharge, which results in an effective statutory tax rate of 34.6%.Non-resident companies waswere charged at a statutory rate of 40.0% plus a surcharge of 5.0% on the tax and has an additional charge of 3.0% on the tax including surcharge, which results in an effective statutory tax rate of 43.3% during fiscal year 2016.2017.
Profits of companies in India are subject to either regular income tax or Minimum Alternate Tax (“MAT”), whichever is greater. The effective MAT rate during fiscal year 20162017 for Indian companies was 21.3%21.34% and fornon-resident companies was 20.0% of the book profit as prepared under generally accepted accounting principles in India, or Indian GAAP. The excess of amounts paid as MAT over the regular income tax amount during the year may be carried forward and applied towards regular income taxes payable in any of the succeeding tenfifteen years (as amended by Finance Act 2017) subject to certain conditions.
The tax rates imposed on us in respect of dividends paid in prior periods have varied. According to the Finance Act, 2014, dividend distribution tax is to be levied on gross distributable surplus amount instead of amount paid net of taxes. This has resulted in an increase in the dividend distribution tax to more than 20% from 16.995% in the earlier year. Further, the Finance Act 2015 has increased the surcharge from 10%10.0% to 12%12.0%, which results in effective tax rate of 20.35% with effect from fiscal year 2016. This tax is payable by the company declaring distributing or paying the dividends. Dividends from our Indian subsidiaries to us are also subject to this tax, though we do not pay income tax upon the receipt of any such dividends. The Income Tax Act provides that if a company receives a dividend from any of its Indian subsidiaries during the year and such subsidiary has paid a tax on its dividends, then the dividend distributed by the parent company to the extent of dividend received from the Indian subsidiary shall not be subject to dividend tax.
ServicePreviously service tax iswas applicable at 14%14.0% with effect from June 1, 2015.2015 until July 1, 2017. Further, an additional ‘Swacch Bharat Cess” at 0.5% with effect from November 14, 2015 and “Krishi Kalyan Cess” at 0.5% with effect from June 1, 2016 on the value of taxable services has been made applicable.were applicable until July 1, 2017. Accordingly, the effective service tax rate isuntil July 1, 2017 was payable at 15%15.0%.
We paypaid service tax as a service provider and service recipient.
Service Provider: we paypaid service tax as a service provider at a rate of 12.36%12.4% to 14.5% under the following categories:
Service Recipient- we paypaid service tax as a service recipient under following categories:
We currently paypaid an excise duty of 12.5% with effect from March 1, 2015 until July 1, 2017 (for the period from March 17, 2012 to February 28, 2015, the excise duty was 12% and an additional charge of 3.0% on the excise duty based on all of our domestic production intended for domestic sale up to February 28, 2015). We chargecharged the excise duty and additional charge to our domestic customers. We paypaid excise duty on metallurgical coke at the rate of 6.0% and on pig iron of 12.5%. HZL payspaid excise duty on silver at the rate of 8.5% effective from March 1, 2016 (8.0% prior to that) and an additional charge of 3.0% on the excise duty has been eliminated with effect from March 1, 2015. Goods procured for the purposes of “Petroleum Operations” and which arewere exempt from customs duty arewere also exempt from excise duty under notification 12 /2012-Central Excise dated March 17, 2012, Sr. No 336 provided conditions as provided have been satisfied, all goods supplied under international competitive bidding and arewere exempt from customs duty.
Goods and Service Tax: Effective from July 1, 2017, the present indirect tax regime envisages levy of multiple federal and state taxes with respect to the operations undertaken by businesses. The transition from the previous regime to goods and service tax (“GST”) regime is a tax reform, which is aimed at addressing the existing anomalies and strengthening the concept of unified market. GST is a supply driven concept and would therefore apply on supply of goods and services. On the whole, most central and state levies (such as excise duty, service tax, CVD and special additional duty, central sales tax and value added tax have been subsumed into GST). Therefore, the existing taxable events have been replaced by a single taxable event of supply of goods and services under GST. Basic customs duty (BCD) and related customs cess continue to be applicable on import of goods.
Taxes under GST apply as follows:
The general rate of GST on our output supplies is 18.0%. However, supply of iron ore attracts GST at the rate of 5.0%, whereas silver attracts GST at 3.0%. Further, crude oil and natural gas attract GST from the date to be notified by GST council and therefore, until the time GST council notifies inclusion of these products in GST, they would continue to attract existing indirect tax levies. Goods procured for the purposes of “petroleum operations” are subject to integrated service tax at 5.0% as per Notification No. 50/2017-Customs, dated June 30, 2017,S.No- 404 conditionno-48. BCD continues to be exempt. A similar exemption notification has also been issued to tax inter-state and intra-state supplies of goods for petroleum operations at an effective rate of 5.0%. Procurement of coal attracts GST compensation cess at Rs. 400 per ton in addition to the GST rate of 5.0%. Effective July 1, 2017, CVD and SAD has been subsumed in integrated goods and service tax which is applicable at the rates as mentioned in below table:
| Integrated Goods and Service Tax rate from July 1, 2017 | ||||
Copper | 18.0% | |||
Copper concentrate | 5.0% | |||
Zinc | 18.0% | |||
Lead | 18.0% | |||
Silver | 3.0% | |||
Aluminium | 18.0% | |||
We are also subject to government royalties. We pay royalties to the state governments of Chhattisgarh, Rajasthan, Goa and Karnataka in India based on extraction of bauxite, lead-zinc and iron ore. The most significant of these is the royalty that HZL is required to pay to the state government of Rajasthan, where all of HZL’s mines are located at a rate of 10% with effect from September 01, 2014 (the rate was 8.4% from August 13, 2009 to August 31, 2014 and 6.6% prior to August 13, 2009)2014), of the zinc LME price payable on the zinc metal contained in the concentrate produced, 14.5% (the rate was 12.7% from August 13, 2009 to August 31, 2014 and 5.0% prior to August 13, 2009)2014) of the lead LME price payable on the lead metal contained in the concentrate produced and at a rate of 7.0% of silver LME price chargeable on silver-metal produced. In addition, a further amount of royalty effective from January 12, 2015, for DMF at 30% of base royalty and NMET at 2% of base royalty, has been notified. The royalties paid by BALCO on the extraction of bauxite are not material to our results of operations. The royalty payable for our iron ore business is at 15% of pit mouth value (PMV) declared by the Indian Bureau of Mines.
Royalty is also payable at Cairn India to the state government of Rajasthan, Andhra Pradesh and Gujarat for the extraction of crude oil and natural gas. We also pay cess to the GoI. Generally in respect of oil and gas operations, royalty and cess payments are made by the joint operation partners in proportion to their participating interest and are cost recoverable.
For the Rajasthan block, entire royalty payments are made by ONGC at the rate of 20%20.0% of well-head value for crude oil and 10% of well-head value for natural gas and are cost recoverable. Until February 2016, cess is paid at the rate of Rs. 4500/MT4,500 per mt for crude oil; pursuant to amendments in the Finance Act 2016, cess is paid at the rate of 20% 20.0%ad-valorem from March 2016 onwards. National Calamity Contingent Duty (NCCD) is paid at the rate of Rs. 50/MT.50 per mt. Sales tax payments are made at the rate of 2%2.0% (central sales tax) on sale of both crude oil and natural gas.
For the Ravva block, royalty is Rs. 481/MT481 per mt and cess is fixed at Rs. 900/MT900 per mt on crude oil. Royalty on natural gas is 10%10.0% of well-head value of gas. Sales tax payments stand at 2%2.0% (central sales tax) or 5%5.0% (value added tax) on crude oil and 14.5% on natural gas.
For the Cambay block, the entire royalty and cess payments are made by ONGC and are not cost recoverable. We only participate in the payment of NCCD at the rate of Rs. 50/MT.50 per mt. Sales tax payments (central sales tax) are made at a rate of 2%2.0% on crude oil and 15%15.0% (value added tax) on natural gas.
For all the above blocks, education surcharge was paid at 3% of applicable cess value, which has been discontinued as per Ministry of Finance circular with effect from December 2013.
Our royalties in Zinc International business are as follows:
ThereTax Incentives
Certain businesses of the Group within India are severaleligible for specified tax incentives available toincentives. Most of such tax exemptions are relevant for the companies operating in India, including the following:India. These are briefly described as under:
The location based exemption
In order to boost industrial and economic development in undeveloped regions, provided certain conditions are met, profits fromof newly established units in special economic zones are entitled to a tax holiday for a specified period;
Sectoral Benefit - Power Plants and Port Operations
To encourage the establishment of infrastructure certain power plants and ports have been offered income tax exemptions of upto 100.0% of profits and gains for any ten consecutive years within the 15 year period following commencement of operations subject to certain conditions. The Group currently has total operational capacity of 8.4 GW of thermal based power generation facilities and wind power capacity of 274 MW and port facilities. However, such undertakings would continue to be subject to MAT provisions. The Group has power plants which benefit from such deductions, at various locations of HZL (where such benefits has been drawn), Talwandi Sabo Power Limited, Vedanta Limited and Bharat Aluminium Company Limited (where no benefit has been drawn) and port facilities at Vizag General Cargo Berth Limited (where no benefit has been drawn).
Sectoral benefit – Oil and gas
Provided certain conditions are met, profits of newly constructed industrial undertakings engaged in production ofthe oil and gas sector may benefit from a deduction of 100% of the profits of the undertaking for a period of seven consecutive years. This deduction is only available to blocks licensed prior to March 31, 2011. However, such businesses would continue to be subject to the MAT provisions. In the Group, Cairn India Limited (now merged with Vedanta Limited) and Cairn Energy Hydrocarbons Limited benefited from such deductions till March 31, 2016.
Special Economic Zone – SEZ
Provided certain conditions are met, profits of newly established undertakings located in SEZ may benefit from a tax holidayexemption. Such a tax exemptions works to 100.0% Income Tax exemption on export income for a specified period;
Investment Allowance under Section 32 AC of the Income Tax Act
Incentive for acquisition and installation of new high value plant or machinery to manufacturing companies by providing an additional deduction of 15.0% of the actual cost of plant or machinery acquired and installed onduring the year. The actual cost of the new plant or beforemachinery should exceed Rs. 250 million to be eligible for this deduction. The deduction under section 32AC is available up to financial year March 31, 20122017.
In addition, the subsidiaries incorporated in Mauritius are eligible for accelerated depreciation at 80%. However, units that have opted for generation based incentive are not eligible fortax credit to the said accelerated depreciation; and
We have benefited from these tax incentives. Such benefits have resulted in lower effective tax rates, both within Vedanta Limited and in some of our operating subsidiaries such as Cairn, BALCO and HZL. HZL also benefits from a tax holiday exemption with respect to its zinc ingot melting and casting plant at Haridwar and silver refinery, zinc and lead melting casting plant at Pantnagar in the state of Uttarakhand in North India. Cairn enjoys tax holiday with respect to its Rajasthan blocks. BALCO and HZL have considerable investments in captive power plants enjoying tax exemptions and HZL has also benefited from establishing wind energy generating projects. In addition, a large part of Vedanta Limited, Cairn and HZL’s investment of surplus cash are in tax exempt instruments. Commercial power business also enjoys a tax exemptionrate on their independent power plants for ten years from the date of commencement of their operations. The Vizag port is also subject to favorable tax treatment.foreign source income.
Exchange Rates
We sell commodities that are typically priced by reference to US dollar prices. However, a majority of our direct costs in our zinc, iron ore, aluminium and power businesses and our smelting and refining costs in our copper business are incurred in Indian Rupees and to a much lesser extent in Australian dollars, South African Rand and Namibian dollar. Also, all costs with respect to imported material for all our businesses are generally incurred in US dollars. As a result, an increase in the value of the US dollar compared to the Indian Rupee, and to a lesser extent the Australian dollar, South African Rand and Namibian dollar, is generally beneficial to our results of operations, except to the extent that the increase results in increased costs of copper concentrate, alumina and other imported materials for our businesses. A decrease in the value of the US dollar relative to the Indian Rupee, Australian dollar, South African Rand and Namibian dollar has the opposite effect on our results of operations. For more information on the fluctuations in the value of the Indian Rupee against the US dollar, the Australian dollar, South African Rand and Namibian dollar, see “Item 10. Additional Information—D. Exchange Controls—3A. Selected Consolidated Financial Data—Exchange Rates.”
Critical Accounting Estimates
The discussion and analysis of our financial condition and results of operations are based upon our consolidated financial statements, which have been prepared in accordance with IFRS as issued by the IASB. In the course of preparing these financial statements, our management has made judgments, estimates and assumptions, that affect the application of accounting policies and the reported amounts of assets, liabilities, income, expenses and disclosures of contingent assets and liabilities at the date of these consolidated financial statements and the reported amounts of revenues and expenses for the years presented. Actual results may differ from these estimates under different assumptions and conditions. For a discussion of our significant accounting policies, see Note 3 to the consolidated financial statements included in this Annual Report. Estimates and underlying assumptions are reviewed on an ongoing basis. Revisions to accounting estimates are recognized in the period in which the estimate is revised and future periods affected.
We believe the critical accounting estimates are those that are both important to reflect our financial condition and results and require difficult, subjective or complex judgments, often as a result of the need to make estimates about the effect of matters that are inherently uncertain.
See “Note 3. T.V. “Critical accounting judgments and estimation uncertainty” of Notes to the Consolidated financial statements” for a detailed discussion on the critical accounting estimates.
Results of Operations
Overview
Consolidated Statement of Profit or Loss
The following table is derived from our selected consolidated financial data and sets forth our historical operating results as a percentage of revenue for the periods indicated:
| For the Year Ended March 31, | For the Year Ended March 31, | |||||||||||||||||||||||
| 2014 | 2015 | 2016 | 2015 | 2016 | 2017 | |||||||||||||||||||
| (in percentages) | (in percentages) | |||||||||||||||||||||||
Consolidated Statement of Profit or Loss: | ||||||||||||||||||||||||
Revenue | 100.0 | 100.0 | 100.0 | 100.0 | 100.0 | 100.0 | ||||||||||||||||||
Cost of sales | (76.9) | (135.8) | (136.9) | (135.8 | ) | (136.9 | ) | (74.5 | ) | |||||||||||||||
|
|
|
|
|
| |||||||||||||||||||
Gross Profit | 23.1 | (35.8) | (36.9) | |||||||||||||||||||||
Gross profit | (35.8 | ) | (36.9 | ) | 25.5 | |||||||||||||||||||
Other operating income | 0.6 | 0.7 | 0.7 | 0.7 | 0.7 | 0.7 | ||||||||||||||||||
Distribution expenses | (1.7) | (1.4) | (1.9) | (1.4 | ) | (1.9 | ) | (2.3 | ) | |||||||||||||||
Administration expenses | (4.4) | (4.3) | (4.0) | (4.3 | ) | (4.0 | ) | (2.6 | ) | |||||||||||||||
|
|
|
|
|
| |||||||||||||||||||
Operating profit | 17.6 | (40.8) | (42.1) | (40.8 | ) | (42.1 | ) | 21.3 | ||||||||||||||||
Investment and other income | 5.8 | 7.0 | 6.9 | 7.0 | 6.9 | 6.3 | ||||||||||||||||||
Finance and other costs | (10.0) | (8.6) | (9.3) | (8.6 | ) | (9.3 | ) | (8.6 | ) | |||||||||||||||
|
|
|
|
|
| |||||||||||||||||||
Profit before taxes | 13.4 | (42.5) | (44.5) | (42.5 | ) | (44.5 | ) | 19.0 | ||||||||||||||||
Income tax expense | (4.8) | 14.8 | 16.1 | 14.8 | 16.1 | (5.3 | ) | |||||||||||||||||
Profit/(loss) for the year | 8.6 | (27.7) | (28.4) | (27.7 | ) | (28.4 | ) | 13.7 | ||||||||||||||||
Profit attributable to: | ||||||||||||||||||||||||
Equity holders of the parent | 2.2 | (17.5) | (19.6) | (17.5 | ) | (19.6 | ) | 7.6 | ||||||||||||||||
Non-controlling interest | 6.4 | (10.2) | (8.8) | (10.2 | ) | (8.8 | ) | 6.1 | ||||||||||||||||
Net revenue by Geographic Location
The primary markets for our products are India and China. Other markets include number of countries mostly in the Asia, Middle East and Europe. We endeavor to sell as large a quantity of our products as possible in India due to the Indian market premium that we receive on sales in India. The following table sets forth our revenue from each of our primary markets and our revenue from each of our primary markets as a percentage of our total revenue for the periods indicated:
| 2014 | 2015 | 2016 | 2015 | 2016 | 2017 | |||||||||||||||||||||||||||||||||||||||||||||||||||
| (Rs. in million) | % of revenue | (Rs. in million) | % of revenue | (Rs. in million) | (US dollars in millions) | % of revenue | (Rs. in million) | % of revenue | (Rs. in million) | % of revenue | (Rs. in million) | (US dollars in millions) | % of revenue | |||||||||||||||||||||||||||||||||||||||||||
India | 499,064 | 68.8 | 481,451 | 65.6 | 443,287 | 6,691.1 | 69.3 | 481,451 | 65.6 | 443,287 | 69.3 | 441,954 | 6,815.0 | 61.6 | ||||||||||||||||||||||||||||||||||||||||||
China | 67,825 | 9.4 | 57,846 | 7.9 | 34,556 | 521.6 | 5.4 | 57,846 | 7.9 | 34,556 | 5.4 | 61,179 | 943.4 | 8.5 | ||||||||||||||||||||||||||||||||||||||||||
UAE | 29,469 | 4.1 | 40,705 | 5.5 | 32,759 | 494.5 | 5.1 | 40,705 | 5.5 | 32,759 | 5.1 | 48,070 | 741.2 | 6.7 | ||||||||||||||||||||||||||||||||||||||||||
Others(1) | 128,885 | 17.7 | 153,577 | 21.0 | 128,891 | 1,945.5 | 20.2 | 153,577 | 21.0 | 128,891 | 20.2 | 166,004 | 2,559.9 | 23.2 | ||||||||||||||||||||||||||||||||||||||||||
|
|
|
|
|
|
|
|
|
|
|
|
|
| |||||||||||||||||||||||||||||||||||||||||||
| 725,243 | 100.0 | 733,579 | 100.0 | 639,493 | 9,652.7 | 100.0 | 733,579 | 100.0 | 639,493 | 100.0 | 717,207 | 11,059.5 | 100.0 | |||||||||||||||||||||||||||||||||||||||||||
|
|
|
|
|
|
|
|
|
|
|
|
|
| |||||||||||||||||||||||||||||||||||||||||||
Notes:
| (1) | Other markets primarily include |
Customer Concentration
The following table sets forth for the periods indicated:
| Year Ended March 31, | Year Ended March 31, | |||||||||||||||||||||||
| 2014 | (%) 2015 | 2016 | 2015 | (%) 2016 | 2017 | |||||||||||||||||||
Consolidated | 34.4 | 31.4 | 25.4 | 31.4 | 25.4 | 30.3 | ||||||||||||||||||
Zinc – India | 41.2 | 40.5 | 37.0 | 40.5 | 37.0 | 37.4 | ||||||||||||||||||
Zinc – International | 97.5 | 95.7 | 87.6 | 95.7 | 87.6 | 95.9 | ||||||||||||||||||
Oil & Gas | 100.0 | 100.0 | 100.0 | |||||||||||||||||||||
Oil and Gas | 100.0 | 100.0 | 100.0 | |||||||||||||||||||||
Iron Ore | 42.4 | 52.2 | 30.3 | 52.2 | 30.3 | 40.1 | ||||||||||||||||||
Copper | 30.4 | 32.8 | 30.6 | 32.8 | 30.6 | 46.0 | ||||||||||||||||||
Aluminium | 29.4 | 35.5 | 40.7 | 35.5 | 40.7 | 45.7 | ||||||||||||||||||
Power | 83.8 | 82.4 | 88.0 | 82.4 | 88.0 | 99.1 | ||||||||||||||||||
No single customer accounted for 10.0% or more of our revenue on a consolidated basis in any of the years.
Comparison of years indicated exceptended March 31, 2016 and March 31, 2017
Revenue and Operating Profit
Consolidated
Revenue increased from Rs. 639,493 million in fiscal year 2016 to Rs. 717,207 million ($ 11,059.5 million) in fiscal year 2017, an increase of Rs. 77,714 million, or 12.2%. Revenue increased in fiscal year 2017 primarily due to the ramp up of capacities at our aluminium and power business, recommencement of iron ore operations and improved commodity prices.
Operating loss of Rs. 268,822 million in fiscal year 2016 turned to an operating profit of Rs. 152,744 million ($ 2,355.3 million) in fiscal year 2017. The operating profit in fiscal year 2017 was primarily due to lower amortization of Rs. 323,861 million ($ 4,994 million) following the impairment of oil and gas assets in fiscal year 2016, lower depreciation charges for our oil and gas business where, a single customer accountedof Rs. 26,556 million ($ 409.5 million) due to lower entitlement interest volumes and an increase in reserves estimates and partially offset by closure of operations at Lisheen mine. These were partially offset by higher amortization of Rs 2,450 million ($ 37.8 million) on account of mining expenses resulting from increased ore excavation volumes at Zinc India and higher depreciation of Rs. 3,623 million ($ 55.9 million) due to capitalization of new capacities at our aluminium and power business. The improvement in operating profit excluding impairment was primarily due to the volume ramp up for 11.3 %our aluminium and power operations, recommencement of iron ore operations, cost efficiencies achieved across our revenue on abusinesses and improved commodity prices.
Contributing factors to our consolidated basisoperating profit were as follows:
Zinc India
Revenue in the Zinc India segment increased from Rs. 137,945 million in fiscal year 2016 to Rs. 169,194 million ($ 2,609.0 million) in fiscal year 2017, an increase of Rs. 31,249 million, or 22.7%. This increase was primarily driven by higher commodity prices of zinc, lead, silver and higher premiums realized. The increase was partially offset by lower integrated metal volumes. Our Rampura Agucha mine was in the midst of transition from open pit to underground mine production. The share of mined metal production from underground mines increased to 52%. Sindesar Khurd outperformed and achieved the target of 3.75 million tons of production in fiscal year 2017 ahead of plan. Consequently, our silver production has also benefitted from higher volumes from this mine and recorded integrated production of 14.55 ounces, with a 7.3% increaseyear-on-year. Specifically:
Operating profit in the Zinc India segment increased from Rs. 59,412 million in fiscal year 2016 to Rs. 85,491 million ($ 1,318.3 million) in fiscal year 2017, an increase of Rs. 26,079 million, or 43.9 %, whereas operating margin also increased from 43.1% in fiscal year 2016 to 50.5% in fiscal year 2017. Operating profit was positively affected by higher zinc, lead and silver prices, higher realized premiums and Indian Rupee depreciation. However, these were marginally offset by lower metal volumes and higher costs of production. The cost of production of zinc (net ofby-product revenue) increased from Rs. 68,443 per ton in fiscal year 2016 to Rs. 77,431 per ton in fiscal year 2017 and cost of production of lead (net ofby-product revenue) from Rs. 67,497 per ton in fiscal year 2016 to Rs. 73,996 per ton in fiscal year 2017. An increase in depreciation by Rs. 10,662 million in fiscal year 2017 as compared to fiscal year 2016 partially offset the impact of operating profit margins.
Zinc International
Revenue from external customers in the Zinc International segment decreased from Rs. 25,631 million in fiscal year 2016 to Rs. 22,302 million ($ 343.9 million) in fiscal year 2017, a decrease of Rs. 3,329 million or 13.0%. The decrease in revenue was primarily due to the closure of the Lisheen mine in Ireland in December 2015 after 17 years in operation, maintenance shutdown and delay in concentrate shipment at Black Mountain Mines. This was partially offset by higher realized prices. Specifically:
Operating profit in the Zinc International segment increased from Rs. 831 million in fiscal year 2016 to Rs. 7,336 million ($ 113.1 million) in fiscal year 2017, an increase of Rs. 6,505 million or 782.8%, largely on account of higher zinc and lead prices, lower TcRc’s, aone-off insurance claim refund at Scorpion zinc and a royalty refund at Black Mountain Mine. These were partially offset by the Lisheen mine closure and the delay of a concentrate shipment at Black Mountain Mine. Operating margin increased from 3.2% in fiscal year 2016 to 33.0%% in fiscal year 2017.
Oil and Gas Business
Revenue from external customers in the oil and gas segment decreased from Rs. 86,559 million in fiscal year 2016 to Rs. 82,041 million ($ 1,265.1 million) in fiscal year 2017, a decrease of Rs. 4,518 million or 5.2%. The decrease in revenue was primarily contributed by the fall in entitlement interest sales volumes, which was partially offset by higher average Brent price realization and higher average exchange rate. Specifically:
Operating loss in the oil and gas segment declined from Rs. 342,813 million in fiscal year 2016 to a profit of Rs. 14,205 million ($ 219.0 million) in fiscal year 2017, an increase of Rs. 357,018 million, or 104.1%. The increase in operating profit was primarily due to cost optimization initiatives taken during the year, better Brent prices, reduced cess onad-valorem basis. In fiscal year 2016, an impairment loss of Rs. 322,998 million was charged to income statement whereas in fiscal year 2017, Rs. 845 million impairment reversal was recognised. Sales decreased by Rs. 4,518 million on account of a drop in entitlement interest sales. Depletion and decommissioning charges were lower by 26,055 million mainly due to reduction in reserves and cost to complete.
Iron Ore
Revenue from external customers increased from Rs. 22,233 million in fiscal year 2016 to Rs. 40,880 million ($ 630.4 million) in fiscal year 2017, an increase of Rs. 18,647 million, or 83.9%. The increase was primarily due to resumption of mining in Goa, higher iron prices and an increase in pig iron production, which was partially offset by a decrease in lower production volumes from Karnataka.
Operating loss in the iron ore segment decreased from Rs. 15,793 million in fiscal year 2016 to operating profit of Rs. 8,403 million ($ 129.6 million) in fiscal year 2017, a decrease of Rs. 24,196 million. The increase in operating profit was primarily due to the production increase from Goa, increase in pig iron volume and higher prices which was partly offset by higher metallurgical coke prices.
Copper
Revenue from external customers increased from Rs. 209,239 million in fiscal year 2016 to Rs. 210,021 million ($ 3,238.6 million) in fiscal year 2017, an increase of Rs. 782.4 million, or 0.4%. This marginal increase was primarily due to higher volume, partially offset by lower prices and TcRc. Specifically:
Operating profit in the copper segment decreased from Rs. 19,660 million in fiscal year 2016 to Rs. 15,026 million ($ 231.7 million) in fiscal year 2017, a decrease of Rs. 4,634 million, or 23.6%. Operating margin also decreased from 9.4% in fiscal year 2016 to 7.2% in fiscal year 2017. The decrease in operating profit was primarily due to lower TcRc, higher petro prices and lowerby-product credit, the clean energy cess on coal consumed in thermal power plants and a one off benefit of the target plus export incentive scheme which was recognized in fiscal year 2016. In particular:
Aluminium
Revenue from external customers in the aluminium segment increased from Rs. 110,781 million in fiscal year 2016 to Rs. 136,667 million ($ 2,107.4 million) in fiscal year 2017, an increase of Rs. 25,886 million, or 23.4%. This increase was primarily due to a ramp up in volume and higher average LME prices of aluminium. Specifically:
Operating profit in the aluminium segment increased from Rs. 1,416 million in fiscal year 2016 to Rs. 11,725 million ($ 180.8 million) in fiscal year 2017, a sharp increase of Rs. 10,309 million. The increase in operating profit was primarily due to higher volume and higher sales realization resulting from an increase in average LME prices of aluminium.
Power
Revenue from external customers in the power segment increased from Rs. 45,523 million in fiscal year 2016 to Rs. 55,189 million ($ 851.0 million) in fiscal year 2017, an increase of Rs. 9,666 million or 21.2%. Power sales increased from 12,121 million units in fiscal year 2016 to 12,915 million units in fiscal year 2017, an increase of 6.5%. This was primarily due to the commencement of additional units at TSPL and BALCO during fiscal year 2017. With these units, our entire 9,000 MW of power capacity became operational as of March 2017. Effective from April 1, 2016, the Jharsuguda 1,800 MW and BALCO 270 MW units have been moved from the power segment to the aluminium segment. Specifically:
Operating profit in the power segment increased from Rs. 8,221 million in fiscal year 2016 to Rs. 10,757 million ($ 165.9 million) in fiscal year 2017, an increase of Rs. 2,536 million or 30.8%, primarily as a result of sales from commissioned additional units at TSPL and BALCO. Operating margin increased from 18.1% in fiscal year 2016 to 19.5% in fiscal year 2017.
Other
Operating profit in our other business segments decreased from operating profit of Rs. 244 million in fiscal year 2016 to operating loss of Rs.199 million ($ 3.1 million) in fiscal year 2017.
Investment and Other income
Investment and other income decreased from Rs. 43,998 million in fiscal year 2016 to Rs. 45,428 million ($ 700.5 million) in fiscal year 2017, an increase of Rs. 1,430 million or 3.3%, primarily due to significantmark-to-market (MTM) gains partially offset by lower investment at Zinc India on account of a special dividend payout.
Finance costs
Finance costs increased from Rs. 59,584 million in fiscal year 2016 to Rs. 61,600 million ($ 949.8 million) by Rs. 2,016 million or 3.4% in fiscal year 2017. This was primarily on account of the increase in the proportion of Indian Rupee borrowings from 52% of total borrowings in fiscal year 2016 to 86% of total borrowings in fiscal year 2017, decrease in the proportion of USD borrowings from 48% of total borrowings in fiscal year 2016 to 12% of total borrowings in fiscal year, partially offset by a reduction in interest rates.
Tax expense
Tax credit changed from Rs. 103,060 million in fiscal year 2016 to tax credit of Rs. 38,027 million ($ 586.4 million) in fiscal year 2017. Our effective income tax rate, calculated as tax credit divided by our loss before taxes, was credit of 36.2% in fiscal year 2016 as compared to credit of 27.8% in fiscal year 2017. The effective tax rate has decreased by 8.4%. The tax charge has increased primarily due to increase in profits; however, the effective tax rate has decreased due to increase in benefit arising on account of investment allowance and increase innon-taxable income which was partially offset by phasing out of tax holiday benefits at Zinc India and Oil and Gas.
Non-controlling interest
On account of above mentioned factors, loss for the year decreased from Rs. 181,348 million in fiscal year 2016 to profit of Rs. 98,545 million ($ 1,519.6 million) in fiscal year 2017, an increase of Rs. 279,893 million or 154.3%.
Loss attributable tonon-controlling interest decreased from loss of Rs. 56,195 million in fiscal year 2016 to profit of Rs. 43,512 million ($ 671.1 million) in fiscal year 2017, an increase of Rs. 99,707 million or 177.4%.Non-controlling interest as a percentage of profit or loss increased from 31.0% in fiscal year 2016 to 44.2% in fiscal year 2017.
Comparison of years ended March 31, 2015 and March 31, 2016
Revenue and Operating Profit
Consolidated
Revenue decreased from Rs. 733,579 million in fiscal year 2015 to Rs. 639,493 million ($ 9,652.7 million) in fiscal year 2016, a decrease of Rs. 94,086 million, or 12.8%. Revenue decreased in fiscal year 2016 primarily due to lower Brent, lower LME prices and premia across the metal businesses.
Operating loss decreased from Rs. 299,215 million in fiscal year 2015 to Rs. 268,822 million ($ 4,057.7 million) in fiscal year 2016. The operating loss was primarily due to impairment chargecharges of Rs. 339,549 million ($ 5,125.3 million) mainly infrom our oil and gas business. Operating profit excluding impairment (which is derived by adding impairment charge to the operating profit solely for comparability purposes)purposes in fiscal year 2016 was at Rs. 70,727 a decrease of Rs. 36,496 million or 34.0%. The reduction in operating profit excluding impairment was primarily due to lower sales realization in our oil and gas business which was impacted by the significant fall in average oil prices and a decrease in the average LME prices of zinc and other metals, which were partially offset by the ramp up of our Iron Oreiron ore business which was ramped up in August 2015 after obtaining all necessary approvals from the state government, strong operational performance at Zinc India andramp-up in power units. In line with itsGroup’s accounting policy, the Group has carried out a review of the useful life of its assets and considering the physical condition of the assets and benchmarking analysis, the Group has revised the useful life. The carrying value of the assets has been depreciated over the revised remaining useful life with effect from October 1, 2014. The depreciation chargeDepreciation charges increased on account of capitalization of power units at TSPL, BALCO and Aluminiumaluminium potramp-ups at Jharsugada and BALCO. The overall impact in the fiscal year 2016 was a reduction by Rs. 27,669 million in depreciation as compared to fiscal year 2015. Operating margin excluding impairment charge decreased from 14.6% in fiscal year 2015 to 11.1% in fiscal year 2016 primarily due to lower Brent and metal prices.
Contributing factors to our consolidated operating loss were as follows:
Zinc India
Revenue in the Zinc India segment decreased from Rs. 144,127 million in fiscal year 2015 to Rs. 137,945 million ($ 2,082.2 million) in fiscal year 2016, a decrease of Rs. 6,182 million, or 4.3%. This decrease was primarily driven by lower LME prices of zinc and premia.premiums. The decrease was partially offset by increased integrated metal volumes and higher silver production. Our Rampura Agucha mine is in the midst of transition from open pit to underground mine production. Sindesar Khurd has outperformed and achieved the target of 3.0 million tonnestons of production in fiscal year 2016 ahead of plan. Consequently, our silver production has also benefitted from higher volumes from this mine and recorded integrated production of 13.56 ounces, with a 58% increaseyear-on-year. Specifically:
Operating profit in the Zinc India segment decreased from Rs. 62,267 million in fiscal year 2015 to Rs. 59,412 million ($ 896.8 million) in fiscal year 2016, a decrease of Rs. 2,855 million, or 4.6 %, whereas, operating margin remains majorlyremained mostly stable from 43.3% in fiscal year 2015 to 43.1% in fiscal year 2016. Operating profit was negatively affected by lower zinc, lead and silver prices, and premiapremiums as well as statutory headwinds in fiscal year 2016. However, these were partially offset by higher volumes, lower cost of production and rupeeIndian Rupee depreciation. The cost of production of zinc increased (net ofby-product revenue) from Rs. 67,914 per ton in fiscal year 2015 to Rs. 68,443 per ton in fiscal year 2016 and cost of production of lead (net ofby-product revenue) from Rs. 65,663 per ton in fiscal year 2015 to Rs. 67,497 per ton in fiscal year 2016. DecreaseA decrease in depreciation by Rs. 780 million in fiscal year 2016 as compared to fiscal year 2015 partially offsettedoffset the impact of lower operating profit.
Zinc International
Revenue from external customers in the Zinc International segment decreased from Rs. 35,886 million in fiscal year 2015 to Rs. 25,631 million ($ 386.9 million) in fiscal year 2016, a decrease of Rs. 10,255 million or 28.6%. The decrease in revenue was primarily due to the closure of the Lisheen mine in Ireland in December 2015 after 17 years in operation, maintenance shutdown and partial industrial action at Skorpion. This was partially offset by higher volumes from Black Mountain Mines production. Specifically:
Operating profit in the Zinc International segment decreased from Rs. 4,268 million in fiscal year 2015 to Rs. 831 million ($ 12.5 million) in fiscal year 2016, a decrease of Rs. 3,437 million or 80.5%, largely on account of lower volumes, planned closure of the Lisheen mine as explained above and lower LME prices. Operating margin decreased from 11.9% in fiscal year 2015 to 3.2% in fiscal year 2016.
Oil and Gas Business
Revenue from external customers in the oil and gas segment decreased from Rs. 146,945 million in fiscal year 2015 to Rs. 86,559.0 million ($ 1,306.6 million) in fiscal year 2016, a decrease of Rs. 60,386.0 million or 41,1%. The decrease in revenue was primarily contributed by the significant fall in average Brent pricesoil price realization partially offset by higher entitlement interest sales volumes and higher average exchange rate.rates. Specifically:
Operating loss in the oil and gas segment declineddecreased from Rs. 395,146 million in fiscal year 2015 to a loss of Rs. 342,813 million ($ 5,174.5 million) in fiscal year 2016, a decrease of Rs. 52,333 million, or 13.2%. Impairment loss and lower sales realizations in fiscal year 2016 contributed to an operating loss of Rs. 342,813 million, which is partially offset by decrease in the depletion chargecharges and lower unsuccessful exploration cost write offoffs in the current year.fiscal year 2016. Due to significant fall in crude oil prices, assets were impaired and an impairment loss of Rs. 322,998 million was charged to income statement. Sales decreased by Rs. 60,386 million on account of significant fall in realization from oil in line with Brent prices. Exploration cost written off was lower by Rs. 7,573 million in the currentfiscal year 2016 as two major wells were declared dry in the previousfiscal year 2015 and the well cost of these two wells were charged off. Depletion charged off wascharges were lower by Rs. 23,386 million mainly due to reductionreductions in depletable poolpools as a result of impairment loss and change in reserves and cost to complete.
Iron Ore
Revenue from external customers increased from Rs. 19,039 million in fiscal year 2015 to Rs. 22,233 million ($ 335.6 million) in fiscal year 2016, an increase of Rs. 3,194 million, or 16.8%. The increase was primarily due to resumption of mining in Goa, higher sales volumes of sales from Karnataka in the comparable period and an increase in pig iron production, which was offset by a decrease in the realization price of pig iron.
Operating loss in the iron ore segment increased from Rs. 3,422 million in fiscal year 2015 to Rs. 15,793 million ($ 238.4 million) in fiscal year 2016, an increase of Rs. 12,371 million. The increase in operating loss is primarily due to the impairment charges booked for Bellary assets of Rs 1,154 million, ($ 17.4 million), Liberia (Western Cluster Limited) assets of Rs 14,900 million ($ 224.9 million) partially offset by improved Iron ore sales volume.
Copper
Revenue from external customers decreased from Rs. 225,198 million in fiscal year 2015 to Rs. 209,239 million ($ 3,158.3 million) in fiscal year 2016, a decrease of Rs. 15,959.0 million, or 7.1%. This decrease was primarily due to lower LME realization for the period, partially offset by increased volume and higher TcRc. Specifically:
Operating profit in the copper segment increased from Rs. 14,344 million in fiscal year 2015 to Rs. 19,660 million ($ 296.8 million) in fiscal year 2016, an increase of Rs. 5,316 million, or 37.1%. Operating margin also increased from 6.4% in fiscal year 2015 to 9.4% in fiscal year 2016. The increase in operating profit was primarily due to an increase in volume in fiscal year 2016 as production in fiscal year 2015 was impacted by lower volumes on account of planned maintenance shutdown, and higher TcRc rates in line with the market conditions. In particular:
Aluminium
Revenue from external customers in the aluminium segment decreased from Rs. 126,900 million in fiscal year 2015 to Rs. 110,781 million ($ 1,672.2 million) in fiscal year 2016, a decrease of Rs. 16,119 million, or 12.7%. This decrease was primarily due to lower average LME prices of aluminium and premium on metal which was partially offset by increased volume. Specifically:
Operating profit in the aluminium segment decreased from Rs. 13,752 million in fiscal year 2015 to Rs. 1,416 million ($ 21.4 million) in fiscal year 2016, a sharp decrease of Rs. 12,336 million. Lower sales realization due to a decrease in average LME prices of aluminium and lower premium were the key reasons for low operating profit.
Power
Revenue from external customers in the power segment increased from Rs. 33,906 million in fiscal year 2015 to Rs. 45,523 million ($ 687.1 million) in fiscal year 2016, an increase of Rs. 11,617 million or 34.3%. Power sales increased from 9,859 million units in fiscal year 2015 to 12,121 million units in fiscal year 2016, an increase of 22.9 %. This was primarily due to the commencement of additional units at TSPL and BALCO during the year. With these units, our entire 9,000 MW of power capacity became operational as of March 2016. Specifically:
Operating profit in the power segment increased from Rs. 4,484 million in fiscal year 2015 to Rs. 8,221 million ($ 124.1 million) in fiscal year 2016, an increase of Rs. 3,737 million or 83.3%, primarily as a result of sales from commissioned additional units at TSPL and BALCO. Operating margin increased from 13.2% in fiscal year 2015 to 18.1% in fiscal year 2016.
Other
Operating profit in our other business segmentsegments increased from operating profit of Rs. 238 million in fiscal year 2015 to operating profit of Rs.244 million ($ 3.7 million) in fiscal year 2016.
Investment and Other income
Investment and other income decreased from Rs. 51,154 million in fiscal year 2015 to Rs. 43,998 million ($ 664.1 million) in fiscal year 2016 a decrease of Rs. 7,156 million or 14.0%, primarily due to significantmark-to-market (MTM) gains accruing in the fiscal year 2015 in athe midst of falling interest rate environmentrates in India.
Finance costs
Finance costs decreased from Rs. 63,398 million in fiscal year 2015 to Rs. 59,584 million ($ 899.4 million) by Rs. 3,814 million or 6.0% in fiscal year 2016. This was primarily due to benefitthe benefits of lower cost refinancing, the previous year impact of unamortized costs written off from fiscal year 2015 and using cash to repay convertible bonds in thefor our copper business during the second half of fiscal year 2015.
Tax expense
Tax credit changeddecreased from Rs. 108,320 million in fiscal year 2015 to tax credit of Rs. 103,060 million ($ 1,555.6 million) in fiscal year 2016. Our effective income tax rate, calculated as tax credit divided by our loss before taxes, was credit of 34.8% in fiscal year 2015 as compared to credit of 36.2% in fiscal year 2016. The effective tax rate has increased by 2.4% due to higher dividend distribution tax paid for HZL’s special interim dividends partially offset by tax holiday and tax efficient investment income. The tax credit in the currentfiscal year 2016 includes deferred tax reversal on impairment charge of Rs. 124,592 Million.million.
Non-controlling interest
On account of the above mentioned factors, loss for the year decreased from Rs. 203,139 million in fiscal year 2015 to a loss of Rs. 181,348 million ($ 2,737.3 million) in fiscal year 2016, a decrease of Rs. 21,791 million or 10.7%.
Loss attributable tonon-controlling interest decreased from loss of Rs. 74,789 million in fiscal year 2015 to loss of Rs. 56,195 million ($ 848.2 million) in fiscal year 2016, a decrease of Rs. 18,594 million or 24.9%.Non-controlling interest as a percentage of profit or loss decreased from 36.8% in fiscal year 2015 to 31.0% in fiscal year 2016.
Comparison of years ended March 31, 2014 and March 31, 2015
Revenue and Operating Profit
Consolidated
Revenue increased from Rs. 725,243 million in fiscal year 2014 to Rs. 733,579 million ($ 11,072.9 million) in fiscal year 2015, an increase of Rs. 8,336 million, or 1.1%. Revenue increased in fiscal year 2015 mainly driven by increased sales volume across our zinc, aluminium, iron ore and copper businesses, increase in daily average LME prices of zinc, increase in production in aluminium business from our new smelter in BALCO, increase in iron ore sales from Karnataka and the increased cathode production in the copper business. However, this benefit was partially offset by a significant fall in average Brent oil prices, combined with lower sales volumes impacting our oil and gas business and reduced sales from our power business.
Operating profit decreased from Rs. 127,528 million in fiscal year 2014 to operating loss of Rs. 299,215 million ($ 4,516.5 million) in fiscal year 2015, a decrease of Rs. 426,743 million, or 334.6%. The decrease in operating profit was primarily due to impairment charge of Rs. 406,438 million ($ 6,134.9 million) mainly in our oil and gas business. Operating profit excluding impairment (which is derived by adding impairment charge to the operating profit solely for comparability purposes) in fiscal year 2015 was at Rs. 107,223 a decrease of Rs. 20,305 million or 15.9 %. The reduction in operating profit excluding impairment was primarily due to lower sales realization in oil and gas business which was impacted by the significant fall in average oil prices. This was partially offset by an increase in the average LME prices of zinc and lower depreciation costs across all businesses. In line with its accounting policy, the Group has carried out a review of the useful life of its assets and considering the physical condition of the assets and benchmarking analysis, the Group has revised the useful life. The carrying value of the assets has been depreciated over the revised remaining useful life with effect from October 1, 2014. The impact in the fiscal year 2015 was a reduction by Rs. 4,337 million in depreciation as compared to fiscal year 2014. Operating margin excluding impairment charge decreased from 17.6% in fiscal year 2014 to 14.6% in fiscal year 2015, as the operating margins decreased in zinc and oil and gas business as a result of lower production in zinc and lower average oil prices in oil and gas business. However, operating margins improved in our copper and aluminium businesses, driven by higher average LME prices of aluminium and in our copper business on account of higher production and TcRc rates.
Contributing factors to our consolidated operating profit were as follows:
Zinc India
Revenue in the Zinc India segment increased from Rs. 131,980 million in fiscal year 2014 to Rs. 144,127 million ($ 2,175.5 million) in fiscal year 2015, an increase of Rs. 12,147 million, or 9.2%. This increase was primarily driven by higher daily average LME prices of zinc and higher lead production, offset by lower production of zinc and silver and lower daily average LME prices of lead and silver.
Specifically:
Operating profit in the zinc India segment increased from Rs. 61,696 million in fiscal year 2014 to Rs. 62,267 million ($ 939.9 million) in fiscal year 2015, an increase of Rs. 571 million, or 0.9 %, whereas, operating margin decreased from 46.7% in fiscal year 2014 to 43.3% in fiscal year 2015. The increase in operating profit in fiscal year 2015 was primarily due to the higher average LME prices of zinc, increase in lead sales volume and Rupee depreciation offset by reduction in zinc and silver sales volume and lower daily average LME prices of lead and lower daily average silver London Bullion Market Association prices. Operating profit was also negatively affected by increase in the cost of production of zinc (net of by-product revenue) from Rs. 59,561 per ton in fiscal year 2014 to Rs. 67,914 per ton in fiscal year 2015 and cost of production of lead (net of by-product revenue) from Rs. 61,274 per ton in fiscal year 2014 to Rs. 63,057 per ton in fiscal year 2015. Increase in depreciation by Rs. 1,392 million in fiscal year 2015 as compared to fiscal year 2014 further impacted the operating profit. The decrease in operating margin was also due to lower daily average LME prices of lead, lower daily average silver London Bullion Market Association prices and higher cost of production in fiscal year 2015.
Zinc International
Revenue from external customers in the Zinc International segment decreased from Rs. 40,156 million in fiscal year 2014 to Rs. 35,886 million ($ 541.7 million) in fiscal year 2015, a decrease of Rs. 4,270 million or 10.6%. The decrease in revenue was primarily due to lower volumes in all the units combined with fall in daily average lead LME prices offset by the increase in daily average zinc LME prices and Rupee depreciation against the US dollar. Specifically:
Operating profit in the Zinc International segment increased from Rs. 2,484 million in fiscal year 2014 to Rs. 4,268 ($ 64.4 million) in fiscal year 2015, an increase of Rs. 1,784 million or 71.8%, largely on account of impairment charge of Rs. 2,873 million in fiscal year 2014. Operating profit excluding impairment charge decreased from Rs. 5,357 million in fiscal year 2014 to Rs. 4,268 million ($ 64.4 million) in fiscal year 2015, a decrease of Rs. 1,089 million or 20.3%, largely on account of the fall in volumes driven by an unplanned shutdown at our mine in Skorpion and reduction in volumes at our mines in Lisheen and BMM and higher cost of production. Operating margin (excluding impairment charge in fiscal year 2014) decreased from 13.3% in fiscal year 2014 to 11.9% in fiscal year 2015.
Oil and Gas Business
Revenue from external customers in the oil and gas segment decreased from Rs. 187,103 million in fiscal year 2014 to Rs. 146,945 million ($ 2,218.0 million) in fiscal year 2015, a decrease of Rs. 40,158 million or 21.5%. The decrease in revenue was primarily contributed to the significant fall in average Brent oil prices combined with lower entitlement interest sales volumes which was partially offset by depreciation of the Rupee against the US dollar. Specifically:
Operating profit in the oil and gas segment decreased from Rs. 53,942 million in fiscal year 2014 to an operating loss of Rs. 395,146 million ($ 5,964.5 million) in fiscal year 2015, a decrease of Rs. 449,088 million or 832.5 %. Impairment loss of Rs. 406,144 million ($ 6,130.5 million), lower sales realizations and higher exploration cost written off in fiscal year 2015 contributed to such operating loss of Rs. 395,146 million, which was partially offset by a decrease in the depletion charge in the same fiscal year. Exploration costs written off were higher in fiscal year 2015 as two major wells were declared dry and the well cost of these two wells were written off.
Iron Ore
Revenue from external customers increased from Rs. 16,516 million in fiscal year 2014 to Rs. 19,039 million ($ 287.4 million) in fiscal year 2015, an increase of Rs. 2,523 million, or 15.3%. The increase was primarily due to higher volumes of sales from Karnataka in the comparable period and increase in pig iron and metallurgical coke production.
Operating loss in the iron ore segment decreased from Rs. 5,476 million in fiscal year 2014 to Rs. 3,422 million ($ 51.7 million) in fiscal year 2015, a decrease of Rs. 2,054 million. The decrease in operating loss is primarily due to the increase in sales from Karnataka through e-auction and higher production of pig iron and metallurgical coke.
Copper
Revenue from external customers increased from Rs. 205,577 million in fiscal year 2014 to Rs. 225,198 million ($ 3,399.2 million) in fiscal year 2015, an increase of Rs. 19,621 million, or 9.5%. This increase was primarily due to the increase in production of cathodes, higher TcRc and higher sales in Fujairah. Specifically:
Operating profit in the copper segment increased from Rs. 8,876 million in fiscal year 2014 to Rs. 14,344 million ($ 216.5 million) in fiscal year 2015, an increase of Rs. 5,468 million, or 61.6%. Operating margin also increased from 4.3% in fiscal year 2014 to 6.4% in fiscal year 2015. The increase in operating profit was primarily due to an increase in volume in fiscal year 2015 as production in fiscal year 2014 was impacted by lower volumes on account of temporary smelter closure and higher costs of production and higher TcRc rates in line with the market conditions. In particular:
Aluminium
Revenue from external customers in the aluminium segment increased from Rs. 107,790 million in fiscal year 2014 to Rs. 126,900 million ($ 1,915.5 million) in fiscal year 2015, an increase of Rs. 19,110 million, or 17.7%. This increase was primarily due to an increase in production from our new smelter in BALCO and an increase in the daily average LME prices of aluminium and premium on metal, offset by higher purchased alumina prices. Specifically:
Operating profit in the aluminium segment increased from Rs. 4,979 million in fiscal year 2014 to Rs. 13,752 million ($ 207.6 million) in fiscal year 2015, an increase of Rs. 8,773 million. Higher sales realization due to an increase in average LME prices of aluminium, higher volumes and premium and depreciation of the Indian Rupee against the US dollar contributed to the increase in operating profit which was partially offset by higher purchased alumina prices and higher e-auction coal prices.
Power
Revenue from external customers in the power segment decreased from Rs. 35,076 million in fiscal year 2014 to Rs. 33,906 million ($ 511.8 million) in fiscal year 2015, a decrease of Rs. 1,170 million or 3.3%.The Jharsuguda 2,400 MW power plant operated at a lower Plant Load Factor (PLF) of 39% during fiscal year 2015 due to lower market demand and transmission constraints for some regions. Specifically:
Operating profit in the power segment increased from Rs. 1,494 million in fiscal year 2014 to Rs. 4,484 million ($ 67.7 million) in fiscal year 2015, an increase of Rs. 2,990 million or 200.1%, primarily as a result of sales from our 660 MW TSPL commercial power plant commissioned during 2015 and lower depreciation on account of revised estimates of useful life. Operating margin increased from 4.3% in fiscal year 2014 to 13.2% in fiscal year 2015.
Other
Operating profit in our other business segment increased from operating loss of Rs. 467 million in fiscal year 2014 to operating profit of Rs.238 million ($ 3.6 million) in fiscal year 2015.
Investment and Other income
Investment and other income increased from Rs. 42,165 million in fiscal year 2014 to Rs. 51,154 million ($ 772.1 million) in fiscal year 2015 an increase of Rs. 8,989 million or 21.3%, primarily due to an increase in fair value gain on financial assets held for trading, primarily on investments held at HZL.
Finance costs
Finance costs decreased from Rs. 72,821 million in fiscal year 2014 to Rs. 63,398 million ($ 957.0 million) by Rs. 9,423 million or 12.9% in fiscal year 2015. This was on account of translation loss on foreign currency borrowings as Rupee depreciation against the US dollar in fiscal year 2015 was at 4.2 % as compared to 10.5 % in fiscal year 2014 and reduced interest on convertible bond which was repaid in October 2014.
Tax expense
Tax expense/credit changed from tax expense of Rs. 34,646 million in fiscal year 2014 to tax credit of Rs. 108,320 million ($ 1,635.0 million) in fiscal year 2015. Our effective income tax rate, calculated as tax expense/credit divided by our profit before taxes, was expense of 35.8% in fiscal year 2014 as compared to expense of 34.8% in fiscal year 2015. The effective tax rate was in line with the previous year. The tax credit in the current year includes deferred tax reversal on impairment charge of Rs. 131,340 million.
Non-controlling interest
On account of above mentioned factors, profit for the year decreased from Rs. 62,226 million in fiscal year 2014 to loss of Rs. 203,139 million ($ 3,066.2 million) in fiscal year 2015, a decrease of Rs. 265,365 million or 426.5%.
Profit attributable to non-controlling interest decreased from profit of Rs. 46,760 million in fiscal year 2014 to loss of Rs. 74,789 million ($ 1,128.9 million) in fiscal year 2015, a decrease of Rs. 121,549 million or 259.9%, driven by the fall in profit during the year. Non-controlling interest as a percentage of profit or loss decreased from 75.1% in fiscal year 2014 to 36.8% in fiscal year 2015.
Liquidity and Capital Resources
The following table is derived from our selected consolidated financial data and sets forth our cash flow for the fiscal years 2012, 2013, 2014, 2015, 2016 and 2016:2017:
| For the Year Ended March 31, | ||||||||||||||||||||||||
| 2012 | 2013 | 2014 | 2015 | 2016 | 2016 | |||||||||||||||||||
| (Rs. In millions) | (US$ in millions) | |||||||||||||||||||||||
Cash Flow Data: | ||||||||||||||||||||||||
Net cash provided by (used in): | ||||||||||||||||||||||||
Operating activities | 154,064 | 97,110 | 56,199 | 125,710 | 107,352 | 1,620.4 | ||||||||||||||||||
Investing activities | (484,939) | (153,176) | (52,631) | (43,939) | (42,613) | (643.2) | ||||||||||||||||||
Financing activities | 370,706 | 1,855 | (6,280) | (86,448) | (52,714) | (795.7) | ||||||||||||||||||
Cash Flow Data: Net cash provided by (used in): Operating activities Investing activities Financing activities For the Year Ended March 31, 2013 2014 2015 2016 2017 2017 (Rs. in millions) (US$ in millions) 97,110 56,199 125,710 107,352 212,105 3,270.5 (153,176) (52,631) (43,939) (42,613) (79,910) (1,232.1) 1,855 (6,280) (86,448) (52,714) (49,123) (757.4)
Liquidity
As of March 31, 2016,2017, we had cash and short term investments (excluding restricted cash and cash equivalents) totaling Rs. 587,062621,887 million ($ 8,861.39,589.6 million), and near-term debt redemption obligations of Rs. 73,61590,690 million ($ 1,111.21,398.5 million), and we had, on a standalone basis, cash and short term investments (excluding restricted cash and cash equivalents) totaling Rs. 13,00821,749 million ($ 196.3335.4 million). We expect that our current cash, short term investments and our cash flows from operations together with refinancing of some of our debt will be our principal sources of cash to satisfy our capital requirements for the next few years.
Capital Requirements
Our principal capital requirements include:
We continue to consider increasing capacities of our existing businesses through greenfield and brownfield projects and through acquisitions as one of our major growth strategies, though we are actively monitoring global market and economic conditions and the outlook for commodity prices, as well as our current and anticipated liquidity positions, as we constantly evaluate our desired rate of growth in pursuing this strategy.
Our business is heavily dependent on plant and machinery for the production of our copper, zinc, oil and gas, iron ore and aluminium products, as well as investments in our mining and exploration operations and our commercial power generation business. Investments to maintain and expand production facilities are, accordingly, an important priority and have a significant effect on our cash flows and future results of operations. Our capital expenditures in fiscal year 2014, 2015, 2016 and 20162017 were Rs. 95,309 million, Rs 103,742 million, and Rs. 60,473 million and Rs. 53,752 ($ 912.8 million)828.8), respectively, largely due to our capacity expansion and new projects across our oil and gas, copper, zinc, aluminium and power businesses.
HZL has expansion projects in the amount of approximately Rs. 86,700108,600 million ($ 1,308.71,674.6 million) to be spent on the expansion of its existing underground mines together with the development of the underground mine at Rampura Agucha, expansion of Sindesar Khurd, Zawar, Rajpura Dariba and Kayad mines. The plan also involves the opening up of a new mine at Bamnia Kalan in the Rajpura Dariba belt. Production from these mines will be gradually enhanced through the continuous development of the mines. As of March 31, 2016,2017, Rs. 43,01055,720 million ($ 649.2859.2 million) has been spent.spent on the expansion projects.
We commenced exploration campaigns in Rajasthan in our oil and gas business to test prospective reserves.To unlock the potential continuedof the prospective reserves, we are carrying out exploration drilling, seismic activities and construction activities studies are being carried out.and studies. The estimated cost of this project is Rs. 36,423.436,329.1 million ($ 549.8560.2 million). The and the capital expenditure spent on this projectthe exploration campaign as of March 31, 2016,2017, is Rs. 33,973.432,430.3 million ($ 512.8500.1 million).
We have ongoing-projectsongoing projects in the amounts of approximately Rs. 249,763.7301,405.1 million ($ 3,770.04,647.7 million) set up on the existing producing fields at Mangala, Bhagyam and Aishwariya. The plan involves ramping up or sustaining the production from all the fields for which additional wells and related surface facilities are being drilled and constructed. Further, thewe continue to focus continues on infrastructure creation and prudent reservoir management in both,for water flood and enhanced oil recovery implementationimplementation. As of March 31, 2016,2017, net Rs. 187,428.0185,211.7 million ($ 2,829.12,856.0 million) was spent.spent on the ongoing projects at Mangala, Bhagyam and Aishwariya.
The Mangala Development pipeline is designed to evacuate the crude oil produced from the Rajasthan assets and provide access to markets. The pipeline ends at the coastal location of Bhogat. The entire length of the pipeline from the Mangala processing terminal to Bhogat is ready to receive crude oil. The estimated gross cost of developing the pipeline is Rs. 84,699.082,790.9 million ($ 1,278.51,276.7 million). As of March 31, 2016,2017, Rs. 68,535.566,737.6 million ($ 1,034.51,029.1 million) has been spent.spent on developing the Mangala Development pipeline.
We planned to invest Rs. 49,683.350,308.3 million ($ 749.9775.8 million) to upgrade the existing Raageshwari gas terminal to provide increased capacity and also to unlock the opportunities in Mangala and Aishwariya Barmer hill development. We are also looking at the options to construct a new gas pipeline to monetize the additional gas potential in the block. As of March 31, 20162017 Rs. 12,848.813,299.5 million ($ 193.9205.1 million) has been spent.
We have Rs. 16,820 million ($ 253.9259.4 million) of ongoing expansion projects to set up a 1200tpd400,000 tpa copper smelter plant, but the expansion of the smelter is on hold as the necessary approvals have not yet been obtained.plant. Specifically, the proposed capacity expansion at Tuticorin had been delayed since December 2009 due to a writ petition filed before the High Court of Madras which has been dismissed by an order dated April 28, 2016. We legitimately expect necessary approvals for setting up the project. We received environmental clearance from MoEF in May 2015 and a consent to establish from TNPCB for the smelter in November 2016 and we are in the process of restarting the project activities for the copper smelter plant. We have incurred Rs. 6,4235,635 million ($ 97.087.0 million) on these projectsongoing expansions as of March 31, 2016.2017.
BALCO is building a 1,200 MW coal-based captive power plant in Chhattisgarh consisting of four units of 300 MW each. Out of the four units, two units meant for captive consumption and one unit for external wheeling started commercial production at various dates in phased manner during fiscal year 2016. The fourth unit has been commissioned and commenced commercial production on May 1, 2016.
BALCO is in the process of setting up a 325,000 tpa aluminium smelter and 1200 MW power facility at an estimated cost of Rs. 106,630107,500 million ($ 1,609.51,657.7 million) which usespre-baked technology from the Guiyang Aluminium Magnesium Design & Research Institute, or GAMI, of China. The first metal tapping from the 325,000 tpa aluminium smelter started in fiscal year 2015, and commercial production has been started during fiscal year 2015. The capital expenditure spent on these projects as of March 31, 20162017 is Rs. 93,995100,301 million ($ 1,418.81,546.7 million).
We planned to invest Rs. 106,000 million ($ 1,600.01,634.5 million) to expand our alumina refining capacity at Lanjigarh to 5 mmtpa by (i) increasing the current alumina refinery’s capacity to 2,000,000 tpa by de-bottlenecking; (ii) constructing a second alumina refinery with a capacity of 3 mmtpa;mmtpa and (iii) constructing an associated 210 MW captive power plant. However, the expansion of the alumina refinery at Lanjigarh has been on hold since October 2010, the date of the MoEF’s direction to us to cease further construction. In the last quarter of fiscal year 2016, environment clearance was received for the Lanjigarh expansion project and environmental clearance up to 6 mtpa will be received as an amendment to existing environmental clearance on the acquisition of required land. Further, a Consentconsent to Establishestablish for 6 mtpa and Consentconsent to Operateoperate for 2 mpta haswas also been obtained. However, construction activity continues to be on hold and the management is evaluating possibilities of resumption of construction activities in Lanjigarh at the earliest. See “Item 8. Financial Information—A. Consolidated Statements and Other Financial Information – Legal Proceedings” for details. As of March 31, 2016,2017, we spent Rs. 55,38755,576 million ($ 836.0857.0 million) we are also investing an estimated Rs. 145,000 million ($ 2,188.72,235.9 million) to set up a second 1,250,000 tpa aluminium smelter. Power to the new smelter will be provided by our 2,400 MW power plant at Jharsuguda.Jharsugada. As of March 31, 2016,2017, we spent Rs. 124,760134,120 million ($ 1883.22,068.2 million) on this project.
The first 660 MW and second 660 MW unit of the Talwandi Sabo power plant waswere capitalized in fiscal year 2015 and the second2016 respectively. The third 660 MW unit was capitalized on DecemberSeptember 1, 20152016 after successful completion ofsuccessfully completing trial runs. The third unit will be commissioned in the second quarter of the fiscal year 2017. The estimated cost of this 1980 MW project is Rs. 115,460 million ($ 1,742.81,780.4 million). As of March 31, 2016,2017, Rs. 108,018111,994 million ($ 1,630.51,727.0 million) was spent on this project.
In fiscal year 20162017 and fiscal years 20172018 to 2018,2019, we have scheduled loan repayment obligations, denominated in a mix of Indian Rupees and US dollars of Rs. 183,112413,436 million ($ 2,764.06,375.3 million) and Rs. 322,655138,760 million ($ 4,870.32,139.7 million), respectively, for various outstanding long-term loans. We plan to finance our capital expenditures and our loan repayment obligations out of our cash flows from operations and financing activities. Our failure to make planned expenditures could adversely affect our ability to maintain or enhance our competitive position and develop higher margin products.
Consistent with our strategy to consolidate our ownership interests in our key subsidiaries, we had exercised the second call option to acquire the GoI’s remaining ownership interest in HZL although the exercise is currently subject to dispute. See “Item 4. Information on the Company—B. Business Overview—Our Business—Options to Increase Interests in HZL and BALCO” for more information. The option value will be the fair market value determined by an independent appraiser, and will entail significant capital requirements. Based solely on the market price of HZL’s shares on the NSE on July 15, 201628, 2017 of Rs.196.2Rs. 277.9 ($ 3.0)4.3) per share, and not including the other factors that the independent appraiser may consider, one possible estimation of the exercise price to acquire all of the GoI’s 1,247,950,590 shares in HZL would be Rs. 244,848346,805 million ($ 3,695.85,347.8 million). If the GoI sells its remaining ownership interest in HZL through a public offer, we may look into alternative means of increasing our ownership interest in HZL.
In addition, we have exercised our option to acquire the GoI’s remaining 49.0% ownership interest in BALCO, although the exercise of this option has been contested by the GoI and the GoI retains the right and has expressed an intention to sell 5.0% of BALCO to BALCO employees. See “Item 4. Information on the Company—B. Business Overview—Our Business—Options to Increase Interests in HZL and BALCO” for more information.
We may in the future make acquisitions of mines, plants or minerals and metals businesses that complement or enhance our existing businesses.
We have consistently paid dividends including tax on dividend amounting to Rs. 27,057 million in fiscal year 2014, Rs. 27,081 million in fiscal year 2015, and Rs. 32,220 million ($ 486.3 million) in fiscal year 2016.2016 and Rs. 96,726 (1,491.5) million in fiscal year 2017.
Capital Resources
We plan to finance our capital requirements through a mix of cash flows from operating and financing activities. We do not depend onoff-balance sheet financing arrangements. We believe that our working capital requirements can be sufficiently funded through our internal accruals and undrawn line of credit.
Comparison of Years Ended March 31, 2016 and March 31, 2017
Net Cash from Operating Activities
Net cash from operating activities was Rs. 212,105 million ($ 3,270.5 million) in fiscal year 2017 compared to net cash from operating activities of Rs. 107,352 million in fiscal year 2016, an increase of Rs. 104,753 million. The net increase in cash from operating activities was mainly due to the following reasons:
We believe our current working capital is sufficient for our present capital requirements.
Net Cash Used in Investing Activities
Net cash used in investing activities was Rs. 79,910 million ($ 1,232.1 million) in fiscal year 2017 and Rs. 42,613 million in fiscal year 2016. The net cash used in investing activities in fiscal year 2017 was higher primarily due to:
Net Cash used in Financing Activities
Net cash used in financing activities was Rs. 49,123 million ($ 757.4 million) in fiscal year 2017 and Rs. 52,714 million in fiscal year 2016, primarily on account of:
Comparison of Years Ended March 31, 2015 and March 31, 2016
Net Cash from Operating Activities
Net cash from operating activities was Rs. 107,352 million ($ 1,620.4 million) in fiscal year 2016 compared to net cash from operating activities of Rs. 125,710 million in fiscal year 2015, a decrease of Rs. 18,358 million. NetThe net decrease in cash generation from operating activities was mainly due to the following reasons:
We believe our current working capital is sufficient for our present capital requirements.
Net Cash Used in Investing Activities
Net cash used in investing activities was Rs. 42,613 million ($ 643.2 million) in fiscal year 2016 and Rs. 43,939 million in fiscal year 2015. The net cash used in investing activities in fiscal year 2016 was lower primarily due to:
Net Cash used in Financing Activities
Net cash used in financing activities was Rs. 52,714 million ($ 795.7 million) in fiscal year 2016 and Rs. 86,448 million in fiscal year 2015, primarily on account of:
Comparison of Years Ended March 31, 2014 and March 31, 2015
Net Cash from Operating Activities
Net cash from operating activities was Rs. 125,710 million ($ 1,897.5 million) in fiscal year 2015 compared to net cash from operating activities of Rs. 56,199 million in fiscal year 2014, an increase of Rs. 69,511 million. Net increase in cash generation from operating activities was mainly due to following reasons:
We believe our current working capital is sufficient for our present capital requirements.
Net Cash used in Investing Activities
Net cash used in investing activities was Rs. 43,939 million ($ 663.2 million) in fiscal year 2015 and Rs. 52,631 million in fiscal year 2014. The net cash used in investing activities in fiscal year 2015 was lower primarily due to:
Net Cash provided by Financing Activities
Net cash used in financing activities was Rs. 86,448 million ($ 1,304.9 million) in fiscal year 2015 and Rs. 6,280 million in fiscal year 2014, primarily on account of:
We tap both the domestic and offshore markets for our long-term funding needs. Since we have sizeable imports and exports, we access both import and export credits, based on cost effectiveness, both in the Indian Rupee and in foreign currencies, to finance our short-term working capital requirements.
We have tapped different segments of borrowing resources, including banks and capital markets, both in India and overseas. We have credit ratings of above investment grade from the local rating agencies such as CRISIL Limited and India Ratings. We therefore have not had, and do not believe that we will have, difficulty in gaining access to short-term and long-term financing sufficient to meet our current requirements.
Outstanding Loans
See Note 17. “Borrowings” of Notes to the Consolidatedconsolidated financial statements.
Export Obligations
See Note 29.a.i.29. “Commitments, contingencies and guarantees - Commitments and contingencies - Export Obligations” of Notes to the Consolidatedconsolidated financial statements.
Guarantees
See Note 29.b.29. “Commitments, contingencies and guarantees - Guarantees” of Notes to the Consolidatedconsolidated financial statements.
Capital Expenditure and Commitments
Our principal financing requirements primarily include:
The following table shows our capital expenditures in fiscal years 2014, 2015, 2016 and 2016:2017:
| For Year Ended March 31, | ||||||||||||||||
| 2014 | 2015 | 2016 | 2016 | |||||||||||||
| (in millions) | (US dollars in millions) | |||||||||||||||
Capital Expenditure | 95,309 | 103,742 | 60,473 | 912.8 | ||||||||||||
| For Year Ended March 31, | ||||||||||||||||
| 2015 | 2016 | 2017 | 2017 | |||||||||||||
| (in millions) | (US dollars in millions) | |||||||||||||||
Capital Expenditure | 103,742 | 60,473 | 53,752 | 828.8 | ||||||||||||
We had significantCapital Commitments
See Note 29. “Commitments, contingencies and guarantees” in the Notes to the consolidated financial statements for disclosures on capital commitments as of March 31, 2015 and March 31, 2016 amounting to Rs. 115,741 million and Rs. 83,344 million ($ 1,258.0 million) respectively, related primarily to capacity expansion projects, including the following commitments:commitments.
Contingencies
See Note 29.a.ii.29. “Commitments, contingencies and guarantees - Commitments and contingencies - Contingencies” ofguarantees” in the Notes to the consolidated financial statements.statements for disclosure on contingent liabilities.
Off-Balance Sheet Arrangements
See “Note 29 of Notes to the Consolidatedconsolidated financial statements”statements.”
Contractual Obligations
The following table sets out our total future commitments to settle contractual obligations as of March 31, 2016:2017:
| Payment Due by Period (in millions) | Payment Due by Period (in millions) | |||||||||||||||||||||||||||||||||||||||||||||||||||||||||||||||||||||||||||||||
| More than | More than | |||||||||||||||||||||||||||||||||||||||||||||||||||||||||||||||||||||||||||||||
| Total | Less than 1 Year | 1-3 Years | 3-5 Years | 5 Years | Total | Less than 1 Year | 1-3 Years | 3-5 Years | 5 Years | |||||||||||||||||||||||||||||||||||||||||||||||||||||||||||||||||||||||
| (Rs.) | (US$) | (Rs.) | (US$) | (Rs.) | (US$) | (Rs.) | (US$) | (Rs.) | (US$) | (Rs.) | (US$) | (Rs.) | (US$) | (Rs.) | (US$) | (Rs.) | (US$) | (Rs.) | (US$) | |||||||||||||||||||||||||||||||||||||||||||||||||||||||||||||
Bank loans and borrowings | 678,741 | 10,245 | 183,112 | 2,764 | 322,655 | 4,870 | 105,248 | 1,589 | 67,725 | 1,022 | 746,787 | 11,516 | 413,436 | 6,375 | 138,760 | 2,140 | 142,903 | 2,204 | 51,687 | 797 | ||||||||||||||||||||||||||||||||||||||||||||||||||||||||||||
Interest commitments | 157,943 | 2,384 | 51,759 | 781 | 61,540 | 929 | 22,905 | 346 | 21,738 | 328 | 115,039 | 1,774 | 40,537 | 625 | 40,621 | 626 | 17,307 | 267 | 16,574 | 256 | ||||||||||||||||||||||||||||||||||||||||||||||||||||||||||||
Other non-current liabilities(1) | 4,630 | 70 | — | — | 1,880 | 28 | 326 | 5 | 2,424 | 37 | ||||||||||||||||||||||||||||||||||||||||||||||||||||||||||||||||||||||
Othernon-current liabilities(2) | 217,993 | 3,362 | 214,871 | 3,313 | 1,153 | 18 | — | — | 1,969 | 30 | ||||||||||||||||||||||||||||||||||||||||||||||||||||||||||||||||||||||
Capital commitments | 83,344 | 1,258 | 40,657 | 614 | 42,616 | 643 | 45 | 1 | 26 | 1 | 90,483 | 1,395 | 64,411 | 993 | 26,043 | 402 | 9 | 0.14 | 20 | 0.34 | ||||||||||||||||||||||||||||||||||||||||||||||||||||||||||||
|
|
|
|
|
|
|
|
|
|
|
|
|
|
|
|
|
|
|
| |||||||||||||||||||||||||||||||||||||||||||||||||||||||||||||
Total | 924,658 | 13,957 | 275,528 | 4,159 | 428,691 | 6,470 | 128,524 | 1,941 | 91,913 | 1,388 | 1,170,302 | 18,047 | 733,255 | 11,306 | 206,577 | 3,186 | 160,219 | 2,471 | 70,250 | 1,083 | ||||||||||||||||||||||||||||||||||||||||||||||||||||||||||||
|
|
|
|
|
|
|
|
|
|
|
|
|
|
|
|
|
|
|
| |||||||||||||||||||||||||||||||||||||||||||||||||||||||||||||
| (1) | Interest payments for long-term fixed rate debts have been calculated based on applicable rates and payment dates. Interest payments on floating rate debt have been calculated based on the payment dates and rates as applicable on March 31, 2017 for each relevant debt instrument. |
| (2) | Othernon-current liabilities consist of security deposits and retentions. |
Our total future commitments to settle contractual obligations as of March 31, 20162017 were Rs. 924,6581,170,302 million ($ 13,957.118,047.0 million), representing a Rs. 53,872245,644 million decreaseincrease as compared to our total future commitments to settle contractual obligations as of March 31, 2015.2016.
We also have commitments to purchase copper concentrate for our copper custom smelting operations. These commitments are based on future copper LME prices which are not ascertainable as of the date of this Annual Report.
Safe Harbor
See “Special note regarding forward-looking statements”
Foreign exchange effects
See Note 23 (b). “Financial instruments - Financial risk - Foreign exchange risk” ofin the Notes to the consolidated financial statements.
Recently issued accounting pronouncements
See Note 3.U.3.V.x. “Recently issued accounting pronouncements” ofin the Notes to the consolidated financial statements.
ITEM 6. DIRECTORS, SENIOR MANAGEMENT AND EMPLOYEES
| ITEM 6. | DIRECTORS, SENIOR MANAGEMENT AND EMPLOYEES |
A. Directors and Senior Management
Our board of directors consists of eightnine directors.
The following table sets forth the name, age and position of each of our directors, executive officers and significant employees as of the date hereof:
| Name | Age | Position | ||||
Anil Agarwal(1) | Chairman Emeritus | |||||
Directors | ||||||
Navin Agarwal(2) | Executive Chairman and Whole Time Director* | |||||
| Non-Executive Director | |||||
| Non-Executive Director | |||||
| Non-Executive Director | |||||
| Non-Executive Director | |||||
| Non-Executive Director | |||||
Tom Albanese(8) | 59 | Chief Executive Officer and Whole Time Director* | ||||
Tarun Jain | Whole Time Director* | |||||
| Chief Financial Officer and Whole Time Director* | |||||
Other Executive Officers | ||||||
Dilip Golani | Director, Group Management Assurance | |||||
Mansoor Siddiqi | Group Director, Projects | |||||
| ||||||
| ||||||
Samir Cairae | Chief Executive Officer - Diversified Metals (India) | |||||
Suresh Bose | Head – Group Human Resources | |||||
Philip Turner | 60 | Group Head - Health, Safety, Environment and Sustainability | ||||
Other Significant Employees | ||||||
| ||||||
| ||||||
Zinc India | ||||||
Sunil Duggal | Chief Executive Officer, HZL | |||||
Amitabh Gupta | Chief Financial Officer, HZL | |||||
Zinc International | ||||||
Deshnee Naidoo | Chief Executive Officer, Zinc International Division | |||||
Oil and Gas | ||||||
Sudhir Mathur | Chief Financial Officer and Acting Chief Executive Officer, | |||||
Iron Ore | ||||||
Rajagopal Kishore Kumar | Chief Executive Officer, Iron Ore Business | |||||
Azad Shaw | 39 | Chief Financial Officer, Iron Ore Business | ||||
Copper | ||||||
P. Ramnath | Chief Executive Officer, Copper Operations at Tuticorin and Silvassa | |||||
Anup Agarwal | Chief Financial Officer, Copper Operations at Tuticorin and Silvassa | |||||
Aluminium and Power | ||||||
Abhijit Pati | Chief Executive Officer, Aluminium | |||||
| Chief Executive Officer, BALCO | |||||
| ||||||
| Chief Executive Officer, | |||||
Bharat Goenka | 40 | Deputy Chief Financial Officer, Aluminium Business | ||||
Notes:
| * | A “Whole Time Director” is a director who is employed full-time in rendering services to our Company with respect to which he is a director. An individual can be a Whole Time Director with respect to only one company, although he or she may accept the position ofNon-Whole Time Director in other companies. |
| (1) | Anil Agarwal was appointed as the Chairman Emeritus of our Company with effect from April 1, 2014. He ceased to be a member of the Board with effect from April 1, 2014. |
| (2) | Navin Agarwal wasre-appointed as Executive Chairman with effect from April 1, 2014. He is a member of the Nomination and Remuneration Committee. |
| (3) |
| Lalita D. Gupte was appointed as aNon-Executive Director with effect from March 29, 2014. Subsequently her appointment as an Independent Director has been fixed for a period of three years effective as of January 29, 2015 to January 28, 2018 which was approved by the shareholders of the Company through postal ballot on March 30, 2015. Lalita D. Gupte is the Chairperson of the Audit Committee, and is |
| Ravi Kant was appointed as aNon-Executive Director with effect from January 28, 2014. Subsequently his appointment as an Independent Director has been fixed for a period of three years effective as of January 29, 2015 to January 28, 2018 which was approved by the shareholders of the Company through postal ballot on March 30, 2015. Ravi Kant is a member of the Audit Committee, Nomination and Remuneration Committee and was appointed as Chairperson of the Corporate Social Responsibility |
| (5) | Krishnamurthi Venkataramanan was appointed as aNon-Executive Director with effect from April 1, 2017. He was appointed as an Additional Director and Independent Director for a term of three years effective as of April 1, 2017 to March 31, 2020 which was approved by the shareholders of the Company at the Annual General Meeting held on July 14, 2017. Krishnamurthi Venkataramanan is a member of the Stakeholders Relationship Committee and Corporate Social Responsibility Committee effective April 1, 2017. |
| (6) | Aman Mehta was appointed as aNon-Executive Director with effect from May 17, 2017. He was appointed as an Independent Director for a term of three years effective as of May 17, 2017 to May 16, 2020 which was approved by the shareholders of the Company at the Annual General Meeting held on July 14, 2017. Aman Mehta is a member of the Audit Committee, Corporate Social Responsibility Committee and Chairperson of the Nomination and Remuneration Committee effective July 12, 2017. |
| (7) | Priya Agarwal was appointed as aNon-Executive Director with effect from May 17, 2017. She was appointed as aNon-Independent Director for a term of three years effective as of May 17, 2017 to May 16, 2020 which was approved by the shareholders of the Company at the Annual General Meeting held on July 14, 2017. Priya Agarwal is a member of the Corporate Social Responsibility Committee effective July 12, 2017. |
| (8) | Tom Albanese was appointed as the Chief Executive Officer and Whole Time Director with effect from April 1, 2014. He has been reappointed from April 1, 2017 to August 31, 2017 which was approved by the shareholders of the Company at the Annual General Meeting held on July 14, 2017. Tom Albanese is a member of the |
| Tarun Jain was appointed as a Whole Time Director with effect from April 1, 2014. Tarun Jain is a member of the Corporate Social Responsibility Committee, |
Chairman Emeritus
Anil Agarwal, who founded the Vedanta group in 1976 was appointed as our Chairman Emeritus with effect from April 1, 2014. Anil Agarwal is based in the United Kingdom. Anil Agarwal is also the Executive Chairmanexecutive chairman of Vedanta and a Directordirector of Sterlite Technologies Limited. Anil Agarwal was previously our Chairman and Managing Director and Chief Executive Officer from 1980 until the expiration of his term in October 2004, and was ourNon-Executive Chairman until March 2014. Anil Agarwal was also the Chief Executive Officer of Vedanta from December 2003 to March 2005. He has over 4042 years of experience as an industrialist and has been instrumental in the growth and development of the Company since its inception. He is the son of Mr. Dwarka Prasad Agarwal and is the brother of Navin Agarwal. The business address of Anil Agarwal is 75 Nehru Road, Vile Parle (East), Mumbai, Maharashtra 400099, India.
Directors
Navin Agarwal was appointed as our Executive Chairman with effect from April 1, 2014. Prior to this he was the Executive Vice Chairmanexecutive vice chairman of SIIL. Navin Agarwal plays a key role in developing strategic thinking and the governance framework of the Group, and provides leadership for long-term planning, business development and capital planning. He has been part of the Group for the last 3435 years since its inception and has extensive experience in the natural resources industry. Navin Agarwal plays a key role in the strategic and governance framework of the Group and provides leadership for its long-term planning, business development and capital planning. He has been instrumental in the growth of the Group, through world-scale organic projects as well as acquisitions. Navin Agarwal is also the Non-Executive Chairman of Cairn India, the Deputy Executive Chairmandeputy executive chairman of Vedanta and a Non-Executive Directornon-executive director of HZL, Sterlite Iron & Steel Company Limited and Hare Krishna Packaging Private Limited and VRHL.Limited. He has over 3031 years of experience in general management and commercial matters. Navin Agarwal has completed the Owner/President Management Programmanagement program at Harvard University and isholds a Bachelor of Commercebachelor’s degree in commerce from Sydenham College, Mumbai, India. Navin Agarwal is the son of Mr. Dwarka Prasad Agarwal and is the brother of Anil Agarwal. The business address of Navin Agarwal is 75 Nehru Road, Vile Parle (East), Mumbai, Maharashtra 400099, India.
Naresh Chandrais one of our independent directors and was appointed to our Board with effect from March 29, 2014. He has served as India’s Ambassador to the United States of America and was the Cabinet Secretary to the GoI. Naresh Chandra is a post graduate, Master of Science in Mathematics from Allahabad University and a retired officer of the Indian Administrative Services. Naresh Chandra has held various senior positions such as the Chairman of the Indian Government Committee on Corporate Governance, Senior Advisor to the Prime Minister, Governor of Gujarat and Chief Secretary to the Government of Rajasthan. He was also the recipient of the Padma Vibhushan award in 2007 by the President of India. Naresh Chandra serves as a director on the boards of several companies including Balrampur Chini Mills Limited, EROS International Media Limited, Electrosteel Castings Limited, Bajaj Auto Limited, Bajaj Finserv Limited, Bajaj Holdings and Investment Limited, Cairn India, Gammon Infrastructure Project Limited, Eros International Films Private Limited, and EROS International Plc. The business address of Naresh Chandra is C-4/4053, Vasant Kunj, New Delhi 110070, India.
Lalita D. Gupte is one of our independent directors and was appointed to our Board with effect from March 29, 2014. She is the former Joint Managing Directorjoint managing director of ICICI Bank and is currentlywas the Chairpersonchairperson of ICICI Venture Funds Management Company Limited.Limited until October 2016. Lalita D. Gupte joined the Boardboard of ICICI Limited in 1994 as the Executive Directorexecutive director and remained on the Boardboard as the Joint Managing Directorjoint managing director until 2002 when it merged with ICICI Bank. She was the Joint Managing Directorjoint managing director of ICICI Bank from 2002 until 2006. She has more than three decades of experience in the financial sector and has held various leadership positions in areas of leasing, planning and resources and corporate banking. She serves as a director on the Boardboard of several companies including Godrej Properties Limited, Bharat Forge Limited, ICICI Venture Funds Management Company Limited, Kirloskar Brothers Limited, ICICI Lombard General Insurance Company Limited and Chairperson of India Infradebt Limited. She holds a Bachelorsbachelor’s degree in Economicseconomics and a Mastersmaster’s degree in Business Management.business management. She completed her advanced management program from INSEAD. The business address of Lalita D. Gupte is ICICI Venture Fund Management Company Limited, ICICI Venture House, Ground Floor, Appasaheb Marathe Marg, Prabhadevi, Mumbai – 400 025,Mhaskar Building, 153 C Matunga, Sir Bhalchandra Road, Mumbai—400019, Maharashtra, India.
Anuradha Dutt is one of our independent directors appointed to our Board with effect from April 27, 2015. She is one of the founding partners of the law firm, M/s DMD Advocates (formerly known as Dutt Menon Dunmorrsett) and has over 33 years of experience in corporate, commercial and tax litigation matters of national and international prominence. Beyond the field of law, Anuradha Dutt has played a vital role in bringing Women’s cricket to national and international prominence and continues to contribute as Vice-Chairman of the Women’s Cricket, Delhi and District Cricket Association. Anuradha Dutt has completed her Masters of Law from Columbia University, New York, USA, Bachelors of Law from Delhi University, India and Bachelor of Arts (Honors) in History from St. Stephens’ College, Delhi University. She serves on the Board of Lexnovum Consultaire Private Limited, Morrisett Litigators Private Limited, D&M Corporate Consultants Private Limited, Advent Corporate Services Private Limited and as a partner at M/s DMD Advocates. The business address of Anuradha Dutt is 78, Golf Links, New Delhi – 110 002, India.
Ravi Kantis one of our independent directors and was appointed to our Board with effect from January 28, 2014. Ravi Kant has approximately five decades of experience in various companies. He was earlierpreviously the Managing Directormanaging director and Vice Chairmanvice chairman of Tata Motors Limited. He joined Tata Motors in 1999 and has been associated with Jaguar &and Land Rover, Tata Daewoo Commercial Vehicles, Korea and Tata Motors, Thailand. Ravi Kant retired as the Vice-Chairmanvice-chairman of Tata Motors Limited with effect from May 31, 2014. Prior to joining Tata Motors Limited, Ravi Kant was the Directordirector of Phillips India Limited, looking afteroverseeing the consumer electronics division. He has also worked with LML Limited, Titan Watches and other consumer and metal companies in senior positions. He is the Chairmanchairman of the Indian Institute of Management, Rohtak and is associated withIndian Institute of Information Technology, Allahabad and a visiting faculty member at China Europe International Business SchoolsSchool in Shanghai, Singapore, Kharagpur and Mumbai.Shanghai. He serves on the Boardboard of Antar India Private Limited, Hawkins Cooker Limited and KONE Corporation.Limited, Helsinki. Ravi Kant studied at Mayo College, Ajmer, the Indian Institute of Technology, Kharagpur and Aston University, Birmingham, United Kingdom, from where he completed his Mastersmaster’s degree in Managementmanagement in Industry.industry. He was conferred with an Honorary D.Sc.honorary doctorate of science by Aston University in Birmingham in July 2008. He is an Honorary Industrial Professor at the University of Warwick, United Kingdom. The business address of Ravi Kant is 114 B, NCPA Apartments, Nariman Point, Mumbai – 400 021, Maharashtra, India.
Krishnamurthi Venkataramananis one of our independent directors and was appointed to our Board with effect from April 1, 2017. He was the chief executive officer and managing director of Larsen & Toubro Limited from April 2012 and also served on the Board of Larsen & Toubro Limited from May 1999 until his retirement in September 2015. During his four decades of experience at Larsen & Toubro Limited, his responsibilities included leading a team of engineers and consultants and overseeing its engineering, procurement and construction value chain. He is a graduate in chemical engineering and also a distinguished alumni awardee from Indian Institute of Technology, Delhi. K. Venkataramanan also serves as a director on the boards of several companies including Kirloskar Pneumatic Company Limited, Nilkamal Limited and Larsen & Toubro Hydrocarbon Engineering Limited. The business address of Krishnamurthi Venkataramanan is 401 Varsha, Janki Kutir, Juhu, Mumbai—400049, Maharashtra, India.
Aman Mehtais one of our independent directors and was appointed to our Board with effect from May 17, 2017. He has over 39 years of experience in various positions with HSBC group from where he retired in January 2004 as chief executive officer, Asia Pacific. Aman Mehta occupies himself primarily with corporate governance, with board and advisory roles in a range of companies and institutions in India as well as overseas. Formerly, he has been a supervisory board member of ING Group NV and a director of Raffles Holdings, Singapore. He is also a member of the governing board of the Indian School of Business, Hyderabad, India and a member of the international advisory board of Prudential of America. He is an economics graduate from Delhi University. Aman Mehta also serves as director on the boards of several companies including Wockhardt Limited, Tata Consultancy Services Limited, Godrej Consumer Products Limited, Max Financial Services Limited, PCCW Limited, Vedanta, and Hong Kong Telecommunications Limited. The business address of Aman Mehta is 115 A, 2nd Floor, Jor Bagh, New Delhi – 110 003, India.
Priya Agarwalis one of ourNon-Executive directors and was appointed to our Board with effect from May 17, 2017. She brings with her experience in public relations with Ogilvy and Mather and in human resources with Korn Ferry International, Vedanta Resources and HDFC Bank and in strategic planning with Rediffusion Dentsu Young & Rubicam Private Limited. She holds a bachelor’s degree in science, psychology and business management from the University of Warwick in the United Kingdom. She is the daughter of Anil Agarwal. The business address of Priya Agarwal is 75 Nehru Road, Vile Parle (East), Mumbai, Maharashtra 400099, India.
Tom Albanese was appointed as our Chief Executive Officer and Whole Time Director with effect from April 1, 2014. He is also the Chief Executive Officerchief executive officer of Vedanta, Resources Plc, Non-Executive Chairmannon-executive chairman of Konkola Copper Mines and Directordirector of Vedanta Resources Holdings Limited.Limited and Franco Nevada Corporation. Prior to this, he was the Chief Executive Officerchief executive officer of Rio Tinto from May 2007 to January 2013. Tom Albanese was previously appointed as the Chief Executivechief executive of the Industrial Minerals group in 2000 after which he was appointed as Directordirector of Group Resourcesgroup resources in July 2006. Tom Albanese is also a member of the Board of Directors of Franco Nevada Corporation and co-Chairperson of the Confederation of Indian Industry National Committee on Mining for fiscal year 2017. In 2009, he joined the board of visitors for the Fuqua School of Business at Duke University in North Carolina. Tom Albanese was conferred with the ‘Mining Foundation of the Southwest’ 2009 American Mining Hall of Fame Award for his dedication, knowledge, leadership and inspiration to his peers in the mining industry. Tom Albanese holds a Bachelorsbachelor’s degree in Mineral Economicsmineral economics and a Mastersmaster’s degree in Mining Engineeringmining engineering from the University of Alaska. The business address of Tom Albanese is DLF Atria, Phase 2, Jacaranda Marg, DLF City, Gurgaon – 122002, Haryana, India.
Tarun Jain was appointed to our Board as a Whole Time Director with effect from April 1, 2014. He was the Directordirector of Financefinance of SIIL. Tarun Jain joined the Group in 1984 and has over 3132 years of experience in the corporate finance, audit and accounting, tax and secretarial practice. He is responsible for our strategic financial matters, including corporate finance, corporate strategy, business development and mergers and acquisitions. Tarun Jain is a graduate of the Institute of Cost and Works Accountants of India and a Fellow Member of the Institute of Chartered Accountants of India and the Institute of Company Secretaries of India. Tarun Jain is also a director of Sterlite USA, BALCO, Cairn India, Vedanta Medical Research Foundation and Rajtaru Charity Foundation. The business address of Tarun Jain is Vedanta 75, Nehru Road, Vile Parle (East), Mumbai – 400 099, India.
Din Dayal JalanGR Arun Kumaris our Chief Financial Officer with effect from October 1, 2016 and was appointed to ouras a member of the Board with effect from April 1, 2014. Din Dayal Jalaneffective November 22, 2016. GR Arun Kumar joined our CompanyVedanta in 2013 as chief financial officer of Vedanta Aluminium in May 2013 and was appointed as deputy chief financial officer of Vedanta in December 2013. In 2014, he moved into the Presidentrole of our Australian operationsexecutive vice president finance and deputy chief financial officer, as part of which he was responsible for enhancing the businesscapability of the finance function in the areas of accounting, risk management, driving value creation, strategic planning,re-financing, board reporting and operationsgovernance and direct taxation. As a chartered accountant, GR Arun Kumar has over 22 years of experience at global companies such as Hindustan Unilever and General Electric. Prior to joining Vedanta Aluminium, he was the chief financial officer—Asia Pacific (Appliances and Lighting) for General Electric, based out of Shanghai. He is also on the board of BFL, BMM, Sesa Community Development Foundation, Skorpion, Skorpion Zinc (Proprietary) Limited, Namzinc (Proprietary) Limited, Skorpion Mining Company (Proprietary) Limited, Lisheen, Vedanta Lisheen Mining Limited, Killoran Lisheen Mining Limited, Lisheen Milling Limited, Vedanta Exploration Ireland Limited, Killoran Lisheen Finance Limited, Sesa Resources Limited, Sesa Mining Corporation Limited, CMT, and Thalanga Copper Mines Proprietary Limited, from January 2001 to February 2002 before becoming Chief Financial Officer (metals) of our Company. Din Dayal Jalan has been the Chief Financial Officer of Vedanta since October 2005. Din Dayal Jalan is also a Non-Executive Director of Vedanta Resources Finance Limited, Vedanta Resources Cyprus Limited, Vedanta Resources Jersey Limited, Vedanta Resources Jersey II Limited, Vedanta Jersey Investment Limited, Sesa Mining Corporation Limited (earlier Dempo Mining Corporation Private Limited), Thalanga Copper Mines Proprietary Limited, CMT, Sterlite Ports Limited, Sterlite InfraventuresMaritime Ventures Private Limited, Paradip Multi Cargo Berth Private Limited, Vizag General Cargo Berth Private Limited Maritime Venturesand Goa Sea Port Private Limited, Twinstar Mauritius Holdings Limited, Twinstar Energy Holdings Limited, THL Zinc Ventures Limited, THL Zinc LimitedLimited. GR Arun Kumar holds a bachelor’s degree in commerce from Loyola University, Chennai and Pecvest 17 (Proprietary) Limited, South Africa, Vedanta Finance UK Limited, Konkola Copper Mines Plc, Malco Energy Limited. Din Dayal Jalan has over 38 years of experience in financial management, corporate negotiations, financial control, business planning, due diligence, business development, treasury, capital raising, business restructuring, investor relations, commercial, taxation, human resources development and strategic planning. Din Dayal Jalan is a Bachelor of Commerce and is afellow member of the Institute of Chartered Accountants of India. The business address of Din Dayal JalanGR Arun Kumar is DLF Atria, Phase 2, Jacaranda Marg, DLF City, Gurgaon – 122002, Haryana, India.
Executive Officers
Dilip Golanicurrently heads the Group’s Management Assurance Services function. He previously headed the sales and marketing division for HZL and group performance management function. Prior to joining the group in April 2000, Dilip Golani was member of the Unilever corporate audit team responsible for auditing Unilever group companies in Central Asia, Middle East and Africa region. Prior to that, he was responsible for managing operations and marketing functions for one of the exports businesses of Unilever India. Dilip Golani has over 2829 years of experience and has previously worked with organizations likesuch as Union Carbide India Limited and Ranbaxy Laboratories Limited. Dilip Golani isholds a Bachelorbachelor’s degree in Mechanical Engineeringmechanical engineering and has completed his post-graduationpost-graduate studies in Industrial Engineeringindustrial engineering and Managementmanagement from National Institute of Industrial Engineering, Mumbai, India. The business address of Dilip Golani is Vedanta House, 75, Nehru Road, Vile Parle (East), Mumbai 400099, India.
Mansoor Siddiqiwas appointed as the Group Directorin-charge of projects in September 2011. Further, he2011 and is the Director of Vizag General Cargo Berth Private Limited, Paradip Multi Cargo Berth Private Limited and TSPL.currently in contracting capacity with Vedanta since February 2017. He was a Directorformerly chief executive officer, Aluminium and led the establishment of Vedanta Aluminium until August 19, 2013 and its Whole Time Director until February 2011. Prior to his role in Vedanta Aluminium, he was the director (projects) for our Group and was managing expansion projects in ourGroup’s large aluminium and power business.projects including BALCO smelters and captive power plants. He also played a key role in setting up the Group’s copper smelter at Tuticorin and copper refinery at Silvassa. Mansoor Siddiqi joined our Group in 1991. Prior to joining our Group, Mansoor Siddiqi workedheld senior positions at Hindustan Copper Limited and has 4041 years of experience in various areas of operations and project management. Mansoor Siddiqi hasholds a Bachelor of Technologybachelor’s degree in technology from the Indian Institute of Technology, Delhi, and a Post Graduate Diplomapost graduate diploma in Managementmanagement from the All India Management Association, Delhi. The business address of Mansoor Siddiqi is Vedanta House, 75, Nehru Road, Vile Parle (East), Mumbai 400099, India.
Roma Balwani was appointed the President – Group Communications, Corporate Social Responsibility and Sustainability in August 2014. Prior to which she was the Executive Vice President – Group Communications and Corporate Social Responsibility since April 2014. Prior to joining us, she was the Chief Group Communications Officer at Mahindra & Mahindra. She carries more than three decades of experience in corporate communications having led corporate communication in companies such as APTECH Limited and Mahindra & Mahindra. She holds a Bachelors degree in Economics from Jai Hind College and a Masters degree in Marketing Management from The University of Mumbai. She has completed leadership programs at Harvard Business School and Michigan Ross Business School. The business address of Roma Balwani is Vedanta House, 75, Nehru Road, Vile Parle (East), Mumbai 400099, India.
G.R. Arun Kumaris the Deputy Chief Financial Officer of Vedanta since December 2013. He joined as the Chief Financial Officer of Vedanta Aluminium in May 2013. He has around 21 years of experience in finance having worked in companies like General Electric and Hindustan Unilever Limited. Prior to joining Vedanta Aluminium, he was the Chief Financial Officer—Asia Pacific (Appliances and Lighting) for General Electric, based out of Shanghai. G.R. Arun Kumar is a Bachelor of Commerce from Loyola University, Chennai and is a fellow member of the Institute of Chartered Accountants of India. The business address of G.R. Arun Kumar is DLF Atria, Phase 2, Jacaranda Marg, DLF City, Gurgaon – 122002, Haryana, India.16 Berkeley Street, London W1J 8DZ, United Kingdom.
Samir Cairaewas appointed as Chief Executive Officer, Diversified Metals (India) in January 2016. He provides operational and strategic leadership for Vedanta Limited’s aluminium, copper, power and iron ore divisions in addition to the commercial and asset optimization functions. Prior to his appointment at Vedanta Limited, Samir Cairae held various senior leadership positions in global operations at the Lafarge group and Schlumberger Limited. He has wide experience in a number of corporate roles in strategy, mergers and acquisitions, industrial operations, in managing both growth and turnaround profit or loss roles in India, China, Philippines, France and has held senior positions in several complex businesses, including listed companies. In his last role before joining Vedanta Limited, he was heading the global industrial function for Lafarge’s 150 cement operations in over 45 countries and was based in Paris. Samir Cairae holds a graduate degree in Electrical Engineeringelectrical engineering from Indian Institute of Technology, Kanpur, and a Mastersmaster’s degree in Managementmanagement from the Hautes Etudes Commercials School of Management, Paris. The business address of Samir Cairae is DLF Atria, Phase 2, Jacaranda Marg, DLF City, Gurgaon – 122002, Haryana, India.
Suresh Bose iswas appointed as the Head of Group Human Resources of the Group with effect from September 2015. Suresh Bose has 2425 years of extensive experience in human resources, of which 1415 years have been with the Vedanta Group where he has worked across different business units (including aluminium, copper and corporate) in human resource specialist roles. Prior to joining Vedanta Limited, Suresh Bose has been associated with HMT Limited, Larsen & Toubro Limited, Ford India Private Limited and Mahindra & Mahindra Limited. He also brings international human resource work experience of four years from Armenia Gold Recovery Company, Armenia. Suresh Bose has a dual Mastersmaster’s degree in Personnel Management & Industrial Relationspersonnel management and industrial relations from Tata Institute of Social Sciences, Mumbai and Institute of Social Studies, Hague, Netherlands. The business address of Suresh Bose is DLF Atria, Phase 2, Jacaranda Marg, DLF City, Gurgaon – 122002, Haryana, India.
Philip Turnerwas appointed as Head of Group Health Safety Environment and Sustainability with effect from July 2017. He joined us as Head of Group Health and Safety in September 2014. He has over 35 years of experience within mining, heavy engineering and manufacturing organizations. He was previously General Manager Risk and Sustainability of JK Tech Pty Limited, Australia. He has also previously held a number of senior corporate and operational roles at Rio Tinto Group, Australia, Canada and United Kingdom including responsibility for health safety and environment and sustainability assurance. He has held senior roles at mining companies, North Limited and at BHP Petroleum’s offshore operations. He has a Master of applied science in risk engineering from Ballarat University, Australia, bachelor’s degree in science from Deakin University, Australia, Graduate Diploma in occupational hygiene from Deakin University, Australia and Graduate Diploma in occupational hazard management from Ballarat C.A.E. The business address of Philip Turner is DLF Atria, Phase 2, Jacaranda Marg, DLF City, Gurgaon – 122002, Haryana, India.
Other Significant Employees
Zinc Global Business
Akhilesh Joshiwas appointed as the President of the Global Zinc Business in October 2015. He has 41 years of experience in the mining industry and joined HZL in 1976 and worked in various capacities at both the underground and opencast mines of HZL. In February 2012, he became the Chief Executive Officer of HZL. Prior to this, he was the Chief Operating Officer and Whole Time Director of HZL since October 2008. He was the recipient of the ‘National Mineral Award’ from the GoI in 2006 for his outstanding contribution in the field of mining technology and received the “Lifetime Achievement Award” from the Indian Mining Engineering Journal in the year 2013. In the same year Akhilesh Joshi received “Mining Engineer of the year” award from Mining Engineers Association of India and “HZL Gold Medal award 2013” from Indian Institute of Metals for his significant contribution to the non-ferrous metal sector in India. He has also been honored with “Business Today Best CEO Award (Core Sector)” by Business Today Group in the year 2013. Akhilesh Joshi also has life membership from institutions including Mining Engineers Association of India and Mining Geological and Metallurgical Institute of India. Moreover he is also a fellow member of the Institution of Engineers India. He is also the Director of Madanpur South Coal Company Limited. Akhilesh Joshi is a Bachelor of Engineering (Mining) from M.B.M. Engineering College, Jodhpur and a Post Graduate Diploma in Economic Evaluation of Mining Projects from School of Mines, Paris. He also has a first class Mine Manager’s Certificate of Competency.
Zinc India Business
Sunil Duggalwas appointed as the Chief Executive Officer and Whole Time Director of HZL in October 2015. He joined HZL in August 2010 as executive director, became chief operating officer in the April 2012 and has been a significant driverwas deputy chief executive officer from April 2014, before becoming chief executive officer and whole time director of the company’s growth over the years. His dedicated efforts on sustainability front have created safety awareness and helped building a robust safety culture.HZL. A result oriented professional with over 32 years of experience of leading high performance teams he has worked in various leadership positions forand more than 2018 years in leadership positions. He is known for his ability to keep a level head at all times, nurture and has extensive experience in project management, operations, human resourcesgrow a business, evaluate opportunities and supply chain. Successfully drivesrisks and successfully drive efficiency and productivity whilst reducing costs and inefficiencies and deliver innovative solutions to challenges. His efforts on sustainability front has helped build a robust safety and sustainability culture. He is currently the Presidentalso serving as vice chairman of International Zinc Association, president of Indian Lead Zinc Development Association, and Vice Chairmanchairman of International Zinc Association. He is the recipientFIMI Non Ferrous Metals Committee andco-chair of the ‘Rajiv Gandhi Award’FICCINon-Ferrous Metals Committee 2017. Recently, he has been appointed as chairman, Skill Council for environmental excellence. He has presented on a series of papers on utilization of waste such as fly ash, jarosite, slag and others, and on environment practices and concrete technology in various national and international forums. He designed and executed the construction of India’s first high volume fly ash concrete road with 60 % fly ash.Mining Sector, India. Sunil Duggal isholds a Bachelor of Engineering (Electrical)bachelor’s degree in electrical engineering from Thapar Institute of Engineering and Technology, Patiala. He has participated in a leadership development and management development program at the International Institute for Management Development, Lausanne, Switzerland and the Indian Institute of Management, Kolkata, India.
Amitabh Gupta was appointed as the Chief Financial Officer of HZL in November 2011 and is responsible for its finance and accounting, legal and secretarial, treasury and investor relations, direct and indirect tax and information technology. Prior to this, he was the Chief Financial Officerchief financial officer of Moser Baer Solar Limited. He has over 29 years of experience in finance and has worked at various companies including Cargill India, TeleTech India (Bharti Group) and Ranbaxy Laboratories Limited. He is a Bachelor ofbachelor’s degree in Commerce from Shriram College of Commerce, New Delhi. He was awarded the Best Chief Financial Officer in the metal sector in India by CNBC-TV18 in 2014. Amitabh Gupta is a member of the Institute of Chartered Accountants of India and the Institute of Cost Accountants of India.
Zinc International Business
Deshnee Naidoowas appointed as the Chief Executive Officer of Zinc International and Copper Mines of Tasmania (CMT) in February 2015. Deshnee Naidoo has over 1718 years of experience in the resources industry including platinum, thermal coal and manganese. Prior to joining the Group, she was with Anglo American as Chief Financial Officerchief financial officer - Thermal Coal in South Africa. She had previously held various technical and commercial positions across Anglo American. She was awarded the JCI/Anglo Platinum bursary in 1994 to study Bachelor of Science (Chemical Engineering)receive a bachelor’s degree in science (chemical engineering) at University of Natal, Durban, South Africa. She joined Anglo American in 1998 as a trainee metallurgist at the Precious Metals Refinery and over a 16 year span she held various roles including Process Engineering (Corporate Office)process engineering (corporate office), Process Control, Strategic Long Term Planning, Corporate Finance, Chief Executive Officer’s Officeprocess control, strategic long-term planning, corporate finance, chief executive officer’s office and Chief Financial Officerchief financial officer - Thermal Coal at Anglo American in which her responsibilities entailed management of two commodity groupings (thermal coal and manganese) across three regions (South Africa, South America and Australia).
Oil &and Gas
Sudhir Mathur was appointed as the Chief Financial officer of Cairn Indiaour oil and gas business in September 2012. On May 20, 2016, Sudhir Mathur was appointed as the acting Chief Executive Officer of Cairn Indiaoil and gas business with effect from June 5, 2016. He has over 3031 years of experience working in various industries such as telecommunications, manufacturing, infrastructure and consulting. In addition to his role in the finance function, Sudhir Mathur is also responsible for commercial, legal, procurement and supply chain management, new business and program office at Cairn India. He began his career with PricewaterhouseCoopers in 1986. He joined Cairn India in 2012 asPrior to joining the Chief Financial Officer, prior to whichGroup, he was the Chief Financial Officer and Head, Netco Business ofchief financial officer, Aircel Cellular Limited.Limited and was responsible for strategy, finance, supply chain management and regulatory affairs. He has substantial expertise, knowledge and experience in several key areas of finance and strategic planning, with a proven track record in deploying significant capital to enable value creation. He has also played a pivotal role in his previous assignments in accelerating business growth. He has previously also held senior executive positions in Delhi International Airport Ltd., Idea Cellular, Ballarpur Industries Limited and Price Waterhouse Coopers India. Sudhir Mathur holds a Mastersbachelor’s degree in Business Administrationeconomics from Cornell University and a Bachelors degree in Economics from SriShri Ram College of Commerce.Commerce and a master’s degree in business administration from Cornell University.
Iron Ore
Rajagopal Kishore Kumarwas appointed as the Chief Executive Officer of our iron ore business with effect from February 2, 2015. Prior to this, he was appointed as the Chief Executive Officer (Base Metals)chief executive officer (base metals) Africa with Konkola Copper Mines Plc, Zinc International business and CMT since August 2013. He was earlier appointed as the Chief Executive Officerchief executive officer of our Zinc International Division with effect from February 2011. Prior to this, Rajagopal Kishore Kumar headed our copper business at Konkola Copper Mines Plc since 2008 and Sterlite Copper India Limited since 2006. He has more than 3129 years of experience in accounting, marketing, supply chain management, merger and acquisitions and business turnaround. Rajagopal Kishore Kumar joined our Company in April 2003 as Vice Presidentvice president of marketing for HZL and became senior Vice Presidentvice president of marketing for our copper division from June 2004 to December 2006, where he was responsible for copper marketing and concentrate procurement. Prior to joining our Company, Rajagopal Kishore Kumar was employed by Hindustan Unilever Limited for 12 years. Rajagopal Kishore Kumar hasholds a Bachelor of Commerce frombachelor’s degree in commerce Kolkata University and is a member of the Institute of Chartered Accountants of India.
Azad Shaw was appointed as the Chief Financial Officer of our iron ore business in October 2016. He has 17 years of post-qualification experience and joined Vedanta group in 2001. He has handled various roles in our Group including leadership positions in finance verticals at BALCO and HZL before moving to our iron ore business. Azad Shaw is a member of the Institute of Chartered Accountants of India.
Copper Business
P. Ramnathwas appointed the Chief Executive Officer of our copper operations in Tuticorin, Silvassa and SilvassaFujairah Gold FZC in September 2011 and has over 3330 years of experience in chemicals, specialty chemicals, manufacturing and paper industries. P. Ramnath joined our Group in September 2011. Prior to joining our Group, he worked at Jubilant Life Sciences, Praxair India, SNF Ion Exchange, Bakelite Hylam Limited and Reliance Industries Limited. He is also a director of Malco Energy Limited. Prior to joining us, he was the Chief Operating Officerchief operating officer of JK Paper Limited. He is also a Director of Malco Energy Limited, Sterlite Infra Limited (formerly known as Sterlite Paper Limited), Sterlite Ports Limited and Sterlite Infraventures Limited. P. Ramnath isholds a Bachelor of Technologybachelor’s degree in technology from Osmania University, Hyderabad and holds a Post Graduate Diplomapost graduate diploma from the Indian Institute of Management, Bengaluru.Bengaluru
Anup Agarwal was appointed as the Chief Financial Officer of our copper operations in Tuticorin and Silvassa in January 2015. Anup Agarwal is a Bachelor of Commerce from S. P. Mahavidyalaya, Bijainagar, Rajasthan, a member of the Institute of Chartered Accountants of India and the Institute of Cost and Works Accountants of India. He has 1920 years of post-qualification experience in the manufacturing industry and joined Vedanta group in 2002. He has handled various roles in our Group including leadership positions in finance verticals at BALCO, Jharsuguda and Talwandi Sabo Power Limited before moving to our copper operations in Tuticorin and Silvassa.
Aluminium and Power Business
Abhijit Pati was appointed as Chief Executive Officer of our aluminium business in March 2015. Prior to this role, he was the Presidentpresident and Chief Operating Officerchief operating officer of our aluminium and power business at Orissa since April 2012. He has over 3029 years of experience in aluminium industry. Prior to joining us, he was the Vice Presidentvice president with Hindalco Industries Limited. He started his career as a budding engineer with Indian Aluminium Company in the year 1989. He was awarded with the ‘Exceptional Contributor Award’ from the Aditya Birla Group Chairman, Mr. Kumar Mangalam Birla for significant contribution to turn around Hirakud Aluminium Smelter in the year 2006 and won the prestigious British Sword of Honor for the Hirakud Smelter in the year 1999. He is a member of the National Energy Commission, GoI. He is a two times gold medalist from Theprestigious institutes like Calcutta University and International Management Institute, New Delhi,Delhi. Abhijit Pati is a first class honors Bachelorhonours bachelor’s degree in Chemical Engineeringchemical engineering from The Calcutta University and Mastersa master’s in Business Administrationbusiness administration from International Management Institute, New Delhi.
Ramesh NairVikas Sharmawas appointed the Chief Executive Officer of BALCO in March 2017. Vikas Sharma has experience of over 28 years in various national and multi-national companies. He has experience of serving HMT Watches Limited,Su-Raj Diamonds India Private Limited, AMP India Private Limited, Praxair India Private Limited, Jindal Praxair Oxygen Company Limited and JSW Steel Limited in various key positions. Vikas Sharma joined as location head of Chanderiya of HZL in 2012 and was gradually elevated to the chief operating officer of smelters division of HZL in June 2014. During his tenure at HZL, he played integral role in the growth of the company and made significant contribution in smelter production. Vikas Sharma holds bachelor’s degree with honors in mechanical engineering from Engineering College Kota, University of Rajasthan and a master’s in business administration in marketing from Sikkim Manipal University, Gangtok, India.
Ajay Kumar Dixit was appointed the Chief Executive Officer of our aluminium operations at BALCO in June 2013. Prior to joining BALCO, he worked at Jindal Stainless Limited as its President and Executive Director. Ramesh Nair has over 26 years of experienceAlumina since February 2017. He is also supporting in the metals industry and has worked withTSPL business. He joined the Group for 13 years in multiple functions. He had earlier joined the Vedanta Group’s copper business in the year 2000 and has varied experience in smelter operations, marketing and commercial. He was appointed as the Chief Operating Officer of our copper units at Tuticorin and Silvassa in the year 2008 with independent charge of the copper business and MALCO as its Director. Prior to joining us, Ramesh Nair worked at Essar Steel Limited. Ramesh Nair is a Bachelor of Technology (Electrical) from the National Institute of Technology, Kurukshetra.
Niranjan Kumar Gupta was appointed the Chief Financial Officer of our aluminium and power business in July 2014. Prior to this, Niranjan Kumar Gupta worked at Unilever, London, where he was the Global Finance Director – Household Care Category and at PricewaterhouseCoopers. He has over 22 years of experience of which 2 years pertains to Vedanta Limited and 20 years in business finance, supply chain, commercial, accounting and procurement in Unilever. Prior to this, he was associated with PricewaterhouseCoopers for 3 years. He is a qualified Chartered Accountant, Cost Accountant and Company Secretary.
Ajay Dixit was appointed the Chief Executive Officerchief executive officer of our power business in May 2015. He has 3536 years of experience in the power industry and joined Vedanta Limited in May 2015. Prior to this, he was the Chief Executive Officer – Energy with Siemens, responsible for the overall operations of South Asia. He has wide experience in the field of entire energy chain comprising of power generation, automation, transmission and distribution. He also has experience in manufacturing and setting up plants in South Asia, Middle East and Africa. Ajay Kumar Dixit isholds a Bachelor of Engineering (Electrical)bachelor’s degree in electrical engineering from Delhi College of Engineering.
Bharat Goenkawas appointed as Deputy Chief Financial Officer of our aluminium business in July 2017 taking care of the overall finance function for the aluminium business. Prior to joining us, Bharat has worked with Hindustan Unilever Limited. He has more than 20 years of experience in various roles across different countries covering the core finance areas of accounting, planning, technology, information technology, controllerships, finance business partnering in areas of supply chain, procurement and customers. Bharat Goenka is a member of the Institute of Chartered Accountants of India.
B. Compensation
Compensation of Directors, Executive Officers and Significant Employees
The aggregate compensation we paid our executive directors, executive officers and significant employees for fiscal year 20162017 was Rs. 1,415.21,488.7 million ($ 21.423.0 million), which includes Rs. 1,223.81,222.4 million ($ 18.518.9 million) paid towards salary, bonuses, allowances and other cash payments, Rs. 135.2191.7 million ($ 2.03.0 million) paid and payable for the fair value of share options granted to our executive directors, executive officers and significant employees, and Rs. 56.374.5 million ($ 0.81.1 million) paid towards benefits such as contributions to the provident fund and superannuation fund. The total compensation paid to our most highly compensated executive director, executive officer or significant employees during fiscal year 20162017 was Rs. 205.2201.1 million ($ 3.1million)3.1 million) of which Rs. 172.3127.6 million ($ 2.62.0 million) comprised salary, bonuses and allowances, Rs. 20.150.7 million ($ 0.30.8 million) comprised fair value of share options granted and Rs. 12.822.9 million ($ 0.20.4 million) comprised benefits such as contribution to the provident fund and superannuation fund.
The following table sets forth the compensation paid to our executive directors, executive officers and significant employees in fiscal year 2016,2017, where the disclosure of compensation is required on an individual basis in India or is otherwise publicly disclosed by us:
| Name | Salary, Bonuses, | Fair Value of Share Options granted | Contribution to | |||||||||
| Allowances and | Provident and | |||||||||||
| Perquisites | Superannuation Funds | |||||||||||
| (Rs. in millions) | ||||||||||||
Navin Agarwal | 172.28 | 20.10 | 12.84 | |||||||||
Tom Albanese | 122.63 | 18.71 | 5.91 | |||||||||
Din Dayal Jalan | 70.51 | 8.89 | — | |||||||||
Tarun Jain | 108.18 | 18.64 | 7.42 | |||||||||
Dilip Golani | 42.54 | 5.52 | 1.58 | |||||||||
Mansoor Siddiqi | 32.61 | 3.78 | — | |||||||||
Rajesh Padmanabhan(1) | 24.78 | 0.38 | 0.74 | |||||||||
Roma Balwani | 21.73 | 1.42 | — | |||||||||
G. R. Arun Kumar | 23.58 | 2.84 | 1.60 | |||||||||
Mukesh Bhavnani(2) | 44.99 | 0.16 | 1.08 | |||||||||
Samir Cairae(3) | 24.64 | — | 1.57 | |||||||||
Suresh Bose | 7.51 | 1.89 | 0.47 | |||||||||
Akhilesh Joshi | 54.01 | 6.13 | — | |||||||||
Amitabh Gupta | 24.41 | 3.35 | 1.29 | |||||||||
Sunil Duggal | 30.04 | 4.71 | 1.71 | |||||||||
Deshnee Naidoo | 22.60 | 2.02 | 2.57 | |||||||||
Mayank Ashar(4)(5) | 158.66 | 4.00 | 7.84 | |||||||||
Sudhir Mathur(5) | 42.00 | 8.70 | 1.10 | |||||||||
Rajagopal Kishore Kumar | 49.33 | 6.78 | 2.98 | |||||||||
Neelesh Talathi(6) | 6.77 | 0.60 | 0.31 | |||||||||
| Name | Salary, Bonuses, | Fair Value of Share Options granted | Contribution to | Salary, Bonuses, | Fair Value of Share Options granted | Contribution to | ||||||||||||||||||
| Allowances and | Provident and | Allowances and | Provident and | |||||||||||||||||||||
| Perquisites | Superannuation Funds | Perquisites | Superannuation Funds | |||||||||||||||||||||
| (Rs. in millions) | (Rs. in millions) | |||||||||||||||||||||||
Navin Agarwal | 126.80 | 48.33 | 15.13 | |||||||||||||||||||||
Tom Albanese | 127.56 | 50.66 | 22.92 | |||||||||||||||||||||
Din Dayal Jalan(1) | 37.38 | 8.29 | — | |||||||||||||||||||||
Tarun Jain | 86.30 | 20.14 | 7.42 | |||||||||||||||||||||
G. R. Arun Kumar | 25.44 | 3.96 | 1.24 | |||||||||||||||||||||
Dilip Golani | 32.97 | 7.21 | 1.58 | |||||||||||||||||||||
Mansoor Siddiqi | 29.93 | 2.19 | — | |||||||||||||||||||||
Roma Balwani | 17.53 | 3.26 | — | |||||||||||||||||||||
Mukesh Bhavnani(2) | 52.61 | — | 0.19 | |||||||||||||||||||||
Samir Cairae | 89.71 | 1.57 | 6.48 | |||||||||||||||||||||
Suresh Bose | 9.46 | 1.98 | 0.58 | |||||||||||||||||||||
Akhilesh Joshi(3) | 32.25 | 3.58 | — | |||||||||||||||||||||
Amitabh Gupta | 27.33 | 3.79 | 1.59 | |||||||||||||||||||||
Sunil Duggal | 36.31 | 5.53 | 1.59 | |||||||||||||||||||||
Deshnee Naidoo | 24.57 | 2.92 | 2.50 | |||||||||||||||||||||
Mayank Ashar(4)(5) | 194.36 | — | 2.30 | |||||||||||||||||||||
Sudhir Mathur(5) | 30.44 | 3.48 | 0.97 | |||||||||||||||||||||
Rajagopal Kishore Kumar | 38.70 | 7.68 | 2.98 | |||||||||||||||||||||
Azad Shaw(6) | 8.93 | 1.65 | 0.50 | |||||||||||||||||||||
P. Ramnath | 24.67 | 4.67 | 1.28 | 23.25 | 4.85 | 2.56 | ||||||||||||||||||
Anup Agarwal | 10.06 | 1.78 | 0.51 | 12.54 | 1.78 | 0.57 | ||||||||||||||||||
Abhijit Pati | 29.17 | 4.58 | 1.41 | 26.63 | 5.02 | 1.41 | ||||||||||||||||||
Ramesh Nair | 18.44 | 2.93 | 1.43 | |||||||||||||||||||||
Niranjan Kumar Gupta | 17.21 | 2.35 | 0.93 | |||||||||||||||||||||
Ajay Dixit | 40.45 | 0.22 | — | |||||||||||||||||||||
Ramesh Nair(7) | 18.70 | — | 0.97 | |||||||||||||||||||||
Vikas Sharma(8) | 1.31 | — | 0.03 | |||||||||||||||||||||
Niranjan Kumar Gupta(9) | 23.09 | — | 1.03 | |||||||||||||||||||||
Ajay Kumar Dixit | 43.70 | 1.97 | — | |||||||||||||||||||||
Philip Turner | 44.63 | 1.88 | — | |||||||||||||||||||||
Notes:
| (1) | Until |
| (2) |
| (3) |
| (4) |
| (5) | Represents fair value of options granted under the Cairn India Performance Option Plan (including the Phantom Cairn India Performance Option Plan) |
| (6) |
| (7) | Until March 21, 2017 |
| (8) | Appointed on March 6, 2017 |
| (9) | Until March 26, 2017 |
The aggregate compensation paid or payable to ournon-executive directors for fiscal year 20162017 was Rs. 24.432.4 million ($ 0.40.5 million), which comprised Rs. 2.42.9 million ($ 0.04 million) in sitting fees and Rs. 21.529.4 million ($ 0.30.5 million) in commissions.
We adopted the Vedanta Long-Term Incentive Plan in February 2004. Under the Vedanta Long-Term Incentive Plan, our directors and executive officers will be granted share awards which will entitle them to acquire the ordinary shares of Vedanta based on the performance of Vedanta’s total shareholder return against a peer group of companies comprising the FTSE Worldwide Mining Index (excluding precious metals) measured over a three-year performance period and Vedanta’s financial performance. Vedanta adopted two new Employee Share Ownership Plan schemes in September 2012 and May 2013. The Employee Share Ownership Plans granted under these two schemes will vest based on the achievement of certain business performance targets. The vesting schedule is staggered over a period of three years. The Vedanta Performance Share Plan was launched in November 2014 and December 2015. Under this scheme, the vesting of options is based on the company’s performance as against its industry competitors and based on total shareholder return, for which the vesting percentage is determined over a three year performance period from the date of grant. During fiscal year 2016, Vedanta introduced the Deferred Share Bonus Plan, under which a portion of the annual bonus is deferred into shares and the awards granted under this scheme are not subject to any performance conditions and the vesting schedule is staggered over a period of two or three years. The Vedanta Performance Share Plan 2016 was launched in November 2016 with the same performance conditions as the Vedanta Performance Share Plans covering only selected executive directors. In December 2016, Vedanta Limited introduced an Employee Stock Option Scheme by awarding Vedanta Limited options to its selected employees. Under this scheme, the vesting of options is based on the company’s performance as against its industry competitors and based on total shareholder return, for which the vesting percentage is determined over a three year performance period from the date of grant. The Vedanta Cash Plan was introduced in March 2017 and is linked to Vedanta’s share price for the selected employees who are not covered under the Vedanta Performance Share Plan and Vedanta Limited’s Employee Stock Option Scheme. The Vedanta Cash plan is based on the same performance conditions as the Vedanta Performance Share Plans and the employees covered under the plan receive cash as per vesting and performance conditions instead of shares for which the vesting percentage is determined over three-year performance period from the date of grant of such units.
Additionally, Cairn India has provided the Cairn India Performance Option Plan for national employees (wherein options are vested post achievement of vesting and performance conditions) and the Phantom Cairn India Performance Option Plan for expatriate employees (a “cash” based plan wherein the expatriate employees get cash post the vesting as per vesting and performance conditions instead of shares). Under the Cairn India Performance Option, Plan (including the Phantom Cairn India Performance Option Plan), the options will vest and become exercisable at the end of the performance period which has been set by the remuneration committee at the time of grant, although such period will not be less than three years. However, the percentage of an option which vests on this date will be determined by the extent to whichpre-determined performance conditions have been satisfied. Phantom options are exercisable proportionatePursuant to the periodCairn India Merger, the Cairn India Performance Option Plan have been converted to Cash Award which are based on the TSR performance and Cairn India share price as of service rendered by the employee, and is subject to completion of a minimum service period of one year.March 27, 2017.
Outstanding Awards or Options
As of March 31, 2016,2017, our directors, executive officers and significant employees as a group held options under the Vedanta Long-Term Incentive Plan, Employee Share Ownership Plan, Performance Share Plan and Deferred Share Bonus Plan to acquire an aggregate of 1,967,5002,204,095 ordinary shares of Vedanta representing approximately 0.65%0.73% of Vedanta’s share capital. The awards are exercisable at the end of the three-year performance period commencing from the date of each grant at an exercise price of $ 0.10 per ordinary share. The awards expire six months after their date of vesting. For more information, see “- Vedanta Long-Term Incentive Plan, Employee Share Ownership Plan, Performance Share Plan and Deferred Share Bonus Plan.”
As of March 31, 2016,2017, our directors, executive officers and significant employees as a group held options under the Vedanta Limited Employee Stock Option Scheme to acquire an aggregate of 964,100 ordinary shares of Vedanta Limited representing approximately 0.03% of Vedanta Limited’s share capital. The awards are exercisable at the end of the three-year performance period commencing from the date of each grant at an exercise price of Rs. 1 per ordinary share. The awards expire six months after their date of vesting. For more information, see “- Vedanta Limited Employee Stock Option Scheme.”
As of March 31, 2017, our executive officers and significant employees as a group held options under the Vedanta Cash Based Plan to acquire an aggregate of 77,440 units converted to cash. The employees shall be eligible for the awards at the end of the three year performance period commencing from the date of each grant. For more information, see “- Vedanta Cash Based Plan”
As of March 31, 2017, a significant employees of Cairn India as a group held options under the Cairn India Performance Option Plan to acquire an aggregate of 100,59252,784 ordinary shares of Cairn India representing approximately 0.01%0.003% of Cairn India’s share capital. The awards are exercisable on the third anniversary from the date of each grant at a price of Rs. 10 per share. The awards expire three months after their vesting date. Phantom CIPOP are not converted into shares and encashed based on vesting and performance conditions. For more information, see “- Cairn India Performance Option Plan (including Phantom Cairn India Performance Option Plan)”.”
Employee Benefit Plans
We maintain employee benefit plans in the form of certain statutory and welfare schemes covering substantially all of our employees. As of March 31, 20152016 and March 31, 2016,2017, the total amount set aside by us to provide pension, retirement or similar benefits was Rs. 2,5081,924 million and Rs. 1,9241,893 million ($ 29.029.2 million), respectively.
Provident Fund
In accordance with Indian law, all of our employees in India are entitled to receive benefits under the provident fund, a defined contribution plan and defined benefit plan (owned trust) to which both wethe Company and the employee contribute monthly at apre-determined rate (currently 12.0% of the employee’s base salary). These contributions are made to the provident fund and we also participate in defined contribution schemes in Australia, Namibia, South Africa and Ireland. We have no further obligation under these schemes apart from our regular contributions.contributions, except in case of funds classified as defined benefit plan. We contributed an aggregate of Rs. 1,0731,106 million and Rs. 1,1061,195 million ($ 16.718.4 million) to all these schemes in fiscal years 20152016 and 2016,2017, respectively.
Gratuity
In accordance with Indian law, we provide for gratuity pursuant to a defined benefit retirement plan covering all of our employees in India. The gratuity plan provides a lump sum payment to vested employees at retirement, disability or termination of employment, in an amount based on the employee’s last drawn salary and the number of years of employment with us. The assets of the plan, to the extent the plan is funded, are held in separate funds managed by the Life Insurance Corporation and a full actuarial valuation of the plan is performed on an annual basis. Our liability for the gratuity plan was Rs. 2,1631,618 million and Rs. 1,6181,280 million ($ 24.419.7 million) as at the end of fiscal years 20152016 and 2017, respectively.
Post-Retirement Medical Benefits
The scheme is framed with a view to provide medical benefits to the regular employees of BALCO and BMM and their spouses subsequent to their retirement on completion of tenure including retirement on medical grounds and voluntary retirement on contributory basis. This scheme is unfunded. Our liability for the post retirement medical benefits was Rs. 306 million and Rs. 613 million ($ 9.5 million) as at the end of fiscal years 2016 respectively.and 2017, respectively (balance as at March 31, 2017 includes an amount of post- retirement medical benefit of Rs. 232 million reclassified from defined benefit obligation relating to gratuity plan).
Superannuation Fund
It is our current policy for all of ournon-unionized employees in a managerial position and above to pay into a superannuation fund a sum equal to 15.0% of their annual base salary which is payable to the employee in a lump sum upon his retirement or termination of employment. We contributed an aggregate of Rs. 340408 million and Rs. 408213 million ($ 6.23.3 million) in fiscal years 20152016 and 2016,2017, respectively.
Compensated Absence
Our liability for compensated absences is determined on an undiscounted basis for short term liabilities and on an actuarial basis for long term liabilities, for the entire unused vacation balance standing to the credit of each employee at each calendaryear-end. Contributions to such liability are charged to income in the year in which they accrue. Liability for the compensated absences was Rs. 2,5011,233 million and Rs. 1,2331,213 million ($ 18.618.7 million) as at the end of fiscal years 20152016 and 2016,2017, respectively.
Vedanta Long-Term Incentive Plan (“Vedanta LTIP”), Employee Share Ownership Plan (“ESOP”), Performance Share Plan (“Vedanta PSP”) and Deferred Share Bonus Plan (“DSBP”)
We are a participating company in the Vedanta LTIP, ESOP, PSP and DSBP which was adopted by Vedanta to grant share options to its employees or employees of its subsidiaries. Awards under the plan may be granted to any employee of Vedanta or any of its subsidiaries who is not within six months of such employee’s normal retirement date. Additionally, the shareholders of the Company by way of postal ballot on March 30, 2015 approved the Vedanta Limited Employees Stock Option Scheme (“ESOS”) and issue of securities to the employees of the Company and its holding or subsidiary companies. No options have been granted to the employees under the scheme until date.
The awards are indexed to and settled by Vedanta shares. The awards provide for a fixed exercise price denominated in Vedanta’s functional currency at 10 US cents per share. Vedanta is obligated to issue the shares upon achieving a satisfactory performance as per the applicable scheme. In accordance with the terms of agreement between Vedanta and us, the grant date fair value of the awards is recovered by Vedanta from us. The amount recovered by Vedanta has been recognized as compensation expense over the requisite service period of three years.
The Vedanta LTIP, ESOP and PSP is consistent with our reward philosophy, which aims to provide superior rewards for outstanding performance, and to provide a high proportion of “at risk” remuneration for executive directors and senior employees. The maximum value of Vedanta ordinary shares which may be conditionally awarded in any financial year to a participant in the Vedanta LTIP, ESOP and PSP who is an executive director is restricted to 150% of that executive director’s annual base salary.
The Vedanta PSP 2014 shall vest three years from the date of the grant based on the Group’s relative TSR performance against the peer group of resource companies and continued employment with the Group. These options will be awarded to employees under the Performance Share Plan with effect from November 17, 2014 for which the vesting condition will be the performance period of 36 months from April 1, 2014 to March 31, 2017. The Vedanta PSP 2015 shall vest three years from the date of the grant based on the Group’s relative TSR performance against the peer group of resource companies and continued employment with the Group. These options will be awarded to employees under the PSP with effect from December 30, 2015 for which the vesting condition will be the performance period of 36 months from December 30, 2015 to December 29, 2018. The Vedanta PSP 2016 shall vest three years from the date of the grant based on the Group’s relative TSR performance against the peer group of resource companies and continued employment with the Group. These options will be awarded to employees under the PSP with effect from November 11, 2016 for which the vesting condition will be the performance period of 36 months from November 11, 2016 to November 10, 2019. The DSBP is not subject to any performance conditions and the vesting schedule is staggered over a period of two or three years.
Vedanta Limited Employee Stock Option Scheme (“Vedanta Limited ESOS”)
The shareholders of the Company by way of postal ballot on March 30, 2015 approved the Vedanta Limited ESOS and issue of securities to the employees of the Company and its holding or subsidiary companies. No options were granted to the employees under such scheme. Thereafter, the shareholders of the Company by way of postal ballot on December 12, 2016 approved a revised scheme, Vedanta Limited ESOS 2016 and issue of securities to the employees of the Company and its holding or subsidiary companies. Awards under the plan may be granted to any employee of Vedanta Limited or any of its holding or subsidiary companies who is not within six months of such employee’s normal retirement date. The awards are indexed to and settled by Vedanta Limited shares. The awards provide for a fixed exercise price denominated in Vedanta Limited’s functional currency at Rs. 1 per share. The Vedanta Limited ESOS 2016 is consistent with the reward philosophy, which aims to provide superior rewards for outstanding performance, targetand to provide a high proportion of “at risk” remuneration for the employees. The Vedanta Limited ESOS 2016 shall vest three years from the date of the grant based on the Group’s relative TSR performance against the peer group of resource companies and continued employment with the Group. These options will be awarded to employees under the ESOS with effect from December 15, 2016 for which appliesthe vesting condition will be the performance period of 36 months from December 15, 2016 to December 14, 2019.
Vedanta Cash Based Plan (“Vedanta CBP”)
The grant under the long term Vedanta CBP is a combination of individual contribution and business performance. The vesting of awardssuch units will be a factor ofpre-determined performance criteria based on Vedanta’s performance relative to the competition and continued employment with the Company. The Vedanta CBP shall vest three years from the date of grant based on Group’s relative TSR performance against the peer group of resource companies and continued employment with the Group. These options will be awarded to employees under the ESOP is our businessVedanta CBP with effect from March 2, 2017 for which the vesting condition will be the performance set against business plan for the financial year comprising operational deliverables, enabler parameters and sustainability performance specificperiod of 36 months from March 2, 2017 to each company.March 1, 2020.
Cairn India Performance Option Plan (including Phantom Cairn India Performance Option Plan) (“CIPOP”)
Cairn India has provided the CIPOP to its eligible employees or eligible employees of its subsidiaries. The CIPOP is consistent with Cairn India’s total compensation philosophy, which aims to attract, motivate and retain world class talent. Rewards are commensurate with share price performance and achievement of key performance metrics and aligning the management’s interests with shareholder returns and long-term performance of the company.
Awards under the CIPOP in July 2013 shall vest on the third anniversary of the grant based on the vesting and performance condition of relative TSR (performance of Cairn India’s ordinary share price against the peer group of oil and gas companies and NSE Nifty index), employee performance rating and continued employment with Cairn India. These options were awarded to employees with effect from July 23, 2013 which will vest on the third anniversary (July 23, 2016). Awards under the CIPOP in July 2014 shall vest on the third anniversary of the grant based on the vesting and performance condition of relative TSR (performance of Cairn India’s ordinary share price against the peer group of oil and gas companies and NSE Nifty index), employee performance rating and continued employment with Cairn India. These options were awarded to employees with effect from July 22, 2014 which will vestvested on the third anniversary (July 22, 2017). Awards underPursuant to the Cairn India Merger, the CIPOP in November 2014 shall vesthave been converted to cash award based on the TSR performance and Cairn India Limited share price as of March 17, 2017. The cash awards will be paid on the third anniversary of the grant based on the vesting and performance condition of relative TSR (performance of Cairn India’s ordinary share price against the peer group of oil and gas companies and NSE Nifty index), employee performance rating and continued employment with Cairn India. These options were awarded to employees with effect from November 17, 2014 which will vest on the third anniversary (November 17, 2017).grant.
ESOP Schemes
Vedanta adopted two ESOP schemes on (i) September 24, 2012 pursuant to which a total of 4,652,550 options can be granted (the “2012 ESOP Scheme”) and (ii) May 16, 2013 pursuant to which a total of 3,973,750 options can be granted (the “2013 ESOP Scheme” and together with the 2012 ESOP Scheme, the “ESOP Schemes”). According to the 2012 ESOP scheme, 50% of the shares vested on September 24, 2013 based on performance conditions from April 1, 2012 to March 31, 2013. The next 30% of the shares vested on September 24, 2014, the second anniversary from the date of grant based on performance conditions from April 1, 2012 to March 31, 2013 and the remaining 20% of the shares vested on the third anniversary from the date of grant on September 24, 2015. According to the 2013 ESOP Scheme, 40% of the shares vested on May 16, 2014 based on performance conditions from April 1, 2013 to March 31, 2014. The next 30% of the shares vested on May 16, 2015 which was the second anniversary from the date of grant and the remaining 30% of the shares will vest on the third anniversary from the date of grant irrespective of business performance. The exercise price is 10 cents for the ESOP Schemes.
As of March 31, 2016,2017, our executive directors, executive officers and significant employees as a group held options under the Vedanta ESOP and PSP Schemes to acquire an aggregate of 1,967,5001,882,000 equity shares of Vedanta representing approximately 0.65%0.62% of Vedanta’s share capital. The following table summarizes, as of March 31, 2016,2017, the options granted to our directors, executive officers and significant employees under the Vedanta ESOP and PSP Schemes:Scheme:
Shares Underlying the Vedanta ESOP and PSP Schemes Grant date | Shares Underlying the Vedanta PSP Schemes Grant date | |||||||||||||||||||||||||||||||
Name | May 16, 2013(1) | November 17, 2014(2) | December 30, 2015(3) | Total | November 17, 2014(1) | December 30, 2015(2) | November 11, 2016(3) | Total | ||||||||||||||||||||||||
Navin Agarwal | 85,000 | 140,000 | 130,000 | 355,000 | 140,000 | 130,000 | 125,000 | 395,000 | ||||||||||||||||||||||||
Tom Albanese | — | 170,000 | 200,000 | 370,000 | 170,000 | 200,000 | 140,000 | 510,000 | ||||||||||||||||||||||||
Tarun Jain | 60,000 | 95,000 | 85,000 | 240,000 | 95,000 | 85,000 | — | 180,000 | ||||||||||||||||||||||||
Din Dayal Jalan | 25,000 | 50,000 | 44,000 | 119,000 | 50,000 | 44,000 | — | 94,000 | ||||||||||||||||||||||||
GR Arun Kumar | 16,500 | 30,000 | — | 46,500 | ||||||||||||||||||||||||||||
Dilip Golani | 18,000 | 27,500 | 30,000 | 75,500 | 27,500 | 30,000 | — | 57,500 | ||||||||||||||||||||||||
Mansoor Siddiqi | 15,000 | 16,500 | — | 31,500 | 16,500 | — | — | 16,500 | ||||||||||||||||||||||||
Rajesh Padmanabhan | — | 20,000 | — | 20,000 | ||||||||||||||||||||||||||||
Roma Balwani | — | 13,000 | 13,000 | 26,000 | 13,000 | 13,000 | — | 26,000 | ||||||||||||||||||||||||
G.R.Arun Kumar | 10,000 | 16,500 | 30,000 | 56,500 | ||||||||||||||||||||||||||||
Mukesh Bhavnani | — | — | 25,000 | 25,000 | ||||||||||||||||||||||||||||
Samir Cairae | — | 32,000 | — | 32,000 | ||||||||||||||||||||||||||||
Suresh Bose | 6,500 | 15,000 | — | 21,500 | ||||||||||||||||||||||||||||
Akhilesh Joshi | 20,000 | 30,000 | 30,000 | 80,000 | 30,000 | 30,000 | — | 60,000 | ||||||||||||||||||||||||
Amitabh Gupta | 12,000 | 16,500 | 25,000 | 53,500 | 16,500 | 25,000 | — | 41,500 | ||||||||||||||||||||||||
Sunil Duggal | 15,000 | 22,000 | 40,000 | 77,000 | 22,000 | 40,000 | — | 62,000 | ||||||||||||||||||||||||
Deshnee Naidoo(4) | — | 14,000 | 25,000 | 39,000 | 14,000 | 25,000 | — | 39,000 | ||||||||||||||||||||||||
Mayank Ashar | — | — | — | — | — | — | — | — | ||||||||||||||||||||||||
Sudhir Mathur | — | — | — | — | — | — | — | — | ||||||||||||||||||||||||
Rajagopal Kishore Kumar | 22,000 | 30,000 | 40,000 | 92,000 | 30,000 | 40,000 | — | 70,000 | ||||||||||||||||||||||||
Azad Shaw | 8,500 | 8,000 | — | 16,500 | ||||||||||||||||||||||||||||
P. Ramnath | 12,000 | 22,000 | 30,000 | 64,000 | 22,000 | 30,000 | — | 52,000 | ||||||||||||||||||||||||
Anup Agarwal | 5,000 | 8,500 | 10,000 | 23,500 | 8,500 | 10,000 | — | 18,500 | ||||||||||||||||||||||||
Abhijit Pati | 15,000 | 22,000 | 35,000 | 72,000 | 22,000 | 35,000 | — | 57,000 | ||||||||||||||||||||||||
Ramesh Nair | 10,000 | 15,000 | 20,000 | 45,000 | ||||||||||||||||||||||||||||
Niranjan Kumar Gupta | — | 16,500 | 25,000 | 41,500 | ||||||||||||||||||||||||||||
Ajay Dixit | — | — | 35,000 | 35,000 | ||||||||||||||||||||||||||||
Suresh Bose | 5,000 | 6,500 | 15,000 | 26,500 | ||||||||||||||||||||||||||||
Vikas Sharma | 12,000 | 17,500 | — | 29,500 | ||||||||||||||||||||||||||||
Ajay Kumar Dixit | — | 35,000 | — | 35,000 | ||||||||||||||||||||||||||||
Philip Turner | 10,000 | 12,000 | — | 22,000 | ||||||||||||||||||||||||||||
Total | 329,000 | 751,500 | 887,000 | 1,967,500 | 730,500 | 886,500 | 265,000 | 1,882,000 | ||||||||||||||||||||||||
Notes:
| (1) |
| The underlying shares shall vest three years from the date of grant i.e. on November 17, 2017, based on the achievement of performance conditions and completion of tenure with the Group. The options shall expire after six months from the date of vesting. |
| The underlying shares shall vest three years from the date of grant i.e. on December 30, 2018, based on the TSR ranking as well as tenure served by employees as per the scheme. The options shall expire after six months from the date of vesting. |
| (3) | The underlying shares shall vest three years from the date of grant i.e. on November 11, 2019, based on the TSR ranking as well as tenure served by employees as per the scheme. The options shall expire after six months from the date of vesting. |
| (4) | Granted the options on January 1, 2015 under the Vedanta PSP 2014. The underlying shares shall vest three years from the date of grant i.e. on January 1, 2018, based on the TSR ranking as well as tenure served by employees as per the scheme. The options shall expire after six months from the date of vesting. |
The following table summarizes, as of March 31, 2016,2017, the options granted to our directors, executive officers and significant employees inunder the oilVedanta Limited ESOS Scheme, Vedanta CBP Scheme and gas business under the CIPOP:
| Grant date | ||||||||||||||||||||||||||||
| CIPOP | Phamtom CIPOP | |||||||||||||||||||||||||||
Name | July 23, 2013(1) | July 22, 2014(2) | November 17, 2014(3) | Total | Shares Underlying the Vedanta Limited ESOS Scheme December 15, 2016(1) | Vedanta CBP Scheme March 2, 2011(2) | CIPOP July 22, 2014(3) | |||||||||||||||||||||
Navin Agarwal | — | — | — | |||||||||||||||||||||||||
Tom Albanese | — | — | — | |||||||||||||||||||||||||
Tarun Jain | 183,000 | — | — | |||||||||||||||||||||||||
Din Dayal Jalan | — | — | — | |||||||||||||||||||||||||
GR Arun Kumar | 75,000 | — | — | |||||||||||||||||||||||||
Dilip Golani | 75,000 | — | — | |||||||||||||||||||||||||
Mansoor Siddiqi | — | 22,290 | — | |||||||||||||||||||||||||
Roma Balwani | 26,500 | — | — | |||||||||||||||||||||||||
Mukesh Bhavnani | — | — | — | |||||||||||||||||||||||||
Samir Cairae | 90,000 | — | — | |||||||||||||||||||||||||
Suresh Bose | 32,200 | — | — | |||||||||||||||||||||||||
Akhilesh Joshi | — | — | — | |||||||||||||||||||||||||
Amitabh Gupta | 70,900 | — | — | |||||||||||||||||||||||||
Sunil Duggal | 100,000 | — | — | |||||||||||||||||||||||||
Deshnee Naidoo | — | 19,490 | — | |||||||||||||||||||||||||
Mayank Ashar | — | — | 61,469 | 61,469 | — | — | — | |||||||||||||||||||||
Sudhir Mathur | 47,808 | 52,784 | — | 100,592 | — | — | 52,784 | |||||||||||||||||||||
Rajagopal Kishore Kumar | 72,000 | — | — | |||||||||||||||||||||||||
Azad Shaw | 23,900 | — | — | |||||||||||||||||||||||||
P. Ramnath | — | 22,290 | — | |||||||||||||||||||||||||
Anup Agarwal | 29,600 | — | — | |||||||||||||||||||||||||
Abhijit Pati | 76,000 | — | — | |||||||||||||||||||||||||
Vikas Sharma | 45,000 | — | — | |||||||||||||||||||||||||
Ajay Kumar Dixit | 65,000 | — | — | |||||||||||||||||||||||||
Philip Turner | — | 13,370 | — | |||||||||||||||||||||||||
Total | 47,808 | 52,784 | 61,469 | 162,061 | 964,100 | 77,440 | 52,784 | |||||||||||||||||||||
Notes:
| (1) | The underlying shares shall vest three years from the date of grant |
| (2) | The underlying |
| (3) | The underlying shares shall vest three years from the date of grant |
Limitations on Liability and Indemnification Matters
The Companies Act, 2013 provides an enabling provision for providing indemnity to directors and officers. The terms of the service contract with the Whole Time Directors provides that the Company shall indemnify and keep the director indemnified from and against all claims, demands, actions, suits and proceedings, penalties and punitive damages, attorney’s fees and such reasonable expenses arising out of any claim / litigation whatsoever that may be brought or made against the Director in relation to performance of duties assigned or arising out of natural course of the business of the Company.
The Companies Act, 2013 also provides that where any insurance is taken by a company on behalf of its Managing Director, Whole Time Director, Manager, Chief Executive Officer, Chief Financial Officer or Company Secretary for indemnifying any of them against any liability in respect of any negligence, default, misfeasance, breach of duty or breach of trust for which they may be guilty in relation to the company, the premium paid on such insurance shall not be treated as part of the remuneration payable to any such personnel; provided that if such person is proved to be guilty, the premium paid on such insurance shall be treated as part of the remuneration.
C. Board Practices
Compensation of the Board
Under the Indian Companies Act, our shareholders must approve the salary, bonus and benefits of all directors at an annual general meeting of the shareholders or through a postal ballot.
Navin Agarwal is entitled to be paid a basicfixed salary inclusive of Base Pay, commission and retirement benefits (Provident Fund, Gratuity and Superannuation) in addition to which he is eligible for performance incentives (based upon the scheme) to be determined by our Board and perquisites including a housing allowance, medical and insurance reimbursement, club membership fees reimbursement and leave travel concessions for himself and his family and also a commission based on our net profits for a particular fiscal year as determined by our Board, subject to a maximum allowable under Indian Law.
Din Dayal Jalan iswas entitled to be paid a basic salary,fixed term fees, in addition to which he was eligible for performance incentives and/or commission based on profits(based upon the scheme) to be determined by our Board and perquisites including a housing allowance, medical and insurance reimbursement and club membership fees reimbursement and leave travel concessions for himself and his family. Din Dayal Jalan is entitled to receive a bonus equal to 20% of his basic salary.reimbursement.
Tom Albanese is entitled to be paid a basic salary, annual bonusBase Pay, Pension Allowance of up20% on Base Pay, in addition to a maximum of 50% of his base paywhich he is eligible for fiscal year 2017 and 2018, annual incentive bonus and/or commission based on profitsperformance incentives (based upon the scheme) to be recommended by the Nomination and Remuneration Committee and determined by our Board of Directors and perquisites including rent free accommodation, club membership, travel trip with spouse, medical and other benefits as per the executed service agreement.
Tarun Jain is entitled to be paid a basicfixed salary inclusive of Base Pay, House Rent Allowance, Personal Allowance, and retirement benefits (Provident Fund, Gratuity and Superannuation), in addition to which he is eligible for performance incentives and/or commission based on profits(based upon the scheme) to be determined by our Board of Directors and perquisites including a housing allowance, medical and insurance reimbursement, club membership fees reimbursement and leave travel concessions for himself and his family. Tarun Jain is entitled to receive a bonus equal to 20% of his respectivebase pay.
GR Arun Kumar is entitled to be paid a basic salary, House Rent Allowance, Personal Allowance, and retirement benefits (Provident Fund, Gratuity and Superannuation), in addition to which he is eligible for performance incentives (based upon the scheme) to be determined by our Board and perquisites including medical and insurance reimbursement, club membership fees reimbursement and leave travel concessions for himself and his family. GR Arun Kumar is entitled to receive a bonus equal to 20% of his basic salary.
Composition of the Board
Our Board currently consists of eightnine directors. Four of our eightnine directors, namely, Ravi Kant, Lalita D. Gupte, Naresh ChandraK.Venkataramanan and Anuradha DuttAman Mehta satisfy the “independence” requirements of the NYSE rules. Naresh Chandra another Independent Director ceased to be member of the Board on his demise effective July 9, 2017.
Navin Agarwal entered into a service contract with us which will expire on July 31, 2018. With effect from April 1, 2014, Tom Albanese, Tarun Jain and Din Dayal Jalan were appointed on our Board. Tom Albanese and Tarun Jain have entered into a service contractscontract with us, which will expireexpired on March 31, 2017. Tom Albanese wasre-appointed from April 1, 2017 to August 31, 2017 and entered into a service contract accordingly. Tarun Jain entered into a service contract with us, which expires on March 31, 2018 respectively.2018. The service contract entered into by Din Dayal Jalan with us expired on September 30, 2014. This service contract2014 and was further extended from October 1, 2014 to September 30, 2016. However, eitherWith effect from October 1, 2016, Din Dayal Jalan ceased to be a member of the Board. Either we or the director may terminate the respective service contract upon 90 days’ notice to the other party or payment in lieu of the notice period. None of theirthe service contracts provide for benefits upon termination of their employment. Naresh Chandra, Ravi Kant and Lalita D. Gupte have been appointed for a fixed term of three years effective as of January 29, 2015 to January 28, 2018 which has been approved by the shareholders through postal ballot on March 30, 2015. Naresh Chandra ceased to be member of the Board on his demise with effect from July 9, 2017. Anuradha Dutt has been appointed for a fixed term of three years effective as of April 27, 2015 to April 26, 2018 which has been approved by the shareholders in the Annual General Meeting on July 11, 2015. She ceased to be a member of Board with effect from March 31, 2017. GR Arun Kumar was appointed on our Board as a Whole Time Director with effect from November 22, 2016 for a period of three years up to November 21, 2019. Krishnamurthi Venkataramanan was appointed as an Additional Director effective April 1, 2017 and asNon-Executive Director for a fixed term of three years with effect from April 1, 2017 to March 31, 2020. Aman Mehta was appointed as an Additional Director effective May 17, 2017 and asNon-Executive Independent Director for a fixed term of three years with effect from May 17, 2017 to May 16, 2020. Priya Agarwal was appointed as an Additional Director effective May 17, 2017 and asNon-Executive Director for a fixed term of three years with effect from May 17, 2017 to May 16, 2020. K. Venkataramanan, Aman Mehta and Priya Agarwal appointment was approved by the shareholders at the Annual General Meeting held on July 14, 2017. They serve as directors on our Board until their resignation or removal from office by a resolution of our shareholders, until they cease to be directors by virtue of the provision of law or they are disqualified by law or under our articles of association from being directors. Ravi Kant, Lalita D. Gupte, Naresh ChandraAnuradha Dutt, K. Venkataramanan, Aman Mehta and Anuradha DuttPriya Agarwal do not have any service contracts with the Company.
Committees of the Board
Our equity shares are currently listed and traded on the NSE and the BSE, and our ADSs are currently listed and traded on the NYSE. In addition to compliance with the NYSE corporate governance rules applicable to us as a foreign private issuer, we maintain our corporate governance arrangements in accordance with the amended Securities and Exchange Board of India (Listing Obligations and Disclosure Requirements) Regulations, 2015 (“SEBI (LODR) Regulations 2015”) with effect from December 1, 2015 and the Indian regulations as per the requirements of Companies Act, 2013. In particular, we have established an Audit Committee, a Nomination and Remuneration Committee, a Corporate Social Responsibility Committee, a Stakeholders Relationship Committee, Risk Management Committee and a Share and Debenture Transfer Committee in accordance with the Indian corporate governance requirements. The composition and general responsibilities of each of these committees are described below.
Audit Committee
During fiscal year 2016,2017, the Audit Committee held 87 meetings.
The Audit Committee currently consists of Lalita D. Gupte as the Chairperson and Ravi Kant and Naresh ChandraAman Mehta as members.
Lalita D. Gupte was appointed the Chairperson of the Audit Committee with effect from March 29, 20142014. Ravi Kant and Naresh Chandra werewas appointed as membersa member of the Audit Committee with effect from March 29, 2014. The Committee has been reconstituted on July 12, 2017 with Lalita D. Gupte continuing to be the Chairperson and Ravi Kant and Aman Mehta as members.
Each of Lalita D. Gupte, Ravi Kant and Naresh ChandraAman Mehta satisfy the “independence” requirements of Rule10A-3 of the Exchange Act and the NYSE rules. Lalita D. Gupte is designated as our “audit committee financial expert”, within the requirements of the rules promulgated by the SEC relating to listed-company audit committees.
The principal duties and responsibilities of our Audit Committee are as follows:
The Audit Committee has the power to investigate any matter brought to its attention within the scope of its duties. It also has the authority to retain counsel and advisors to fulfill its responsibilities and duties.
Nomination and Remuneration Committee
During fiscal year 2016,2017, the Nomination and Remuneration Committee held 27 meetings.
The Nomination and Remuneration Committee comprises of Naresh ChandraAman Mehta as the Chairman and Lalita D. Gupte, Ravi Kant and Navin Agarwal as members. Naresh Chandra was appointed as the Chairman of the Nomination and Remuneration Committee with effect from March 29, 2014. Naresh Chandra ceased as a member of the Committee effective July 9, 2017 on his demise. The Nomination and Remuneration Committee was has beenre-constituted on April 29, 2015July 12, 2017 with Naresh ChandraAman Mehta as Chairman and Lalita D. Gupte, Ravi Kant and Navin Agarwal as members of the Committee.
Section 178 of the Companies Act, 2013 and SEBI (LODR) Regulations 2015, requires a Nomination and Remuneration Committee to consist of three or morenon-executive directors out of which not less than one half of the members shall be Independent Directors, provided the Chairperson of the Company is appointed as a member of the Nomination and Remuneration Committee and shall not chair such Committee. Our Nomination and Remuneration Committee complies with this requirement which comprises of four members of which three members are Independent Directors and one is an Executive Director who is our Executive Chairman. The chairperson of the Committee is a Non ExecutiveNon-Executive Independent Director. The principal duties and responsibilities of the Nomination and Remuneration Committee are as follows:
Under the NYSE listing standards, listed companies must have a remuneration committee composed entirely of independent board members as defined by the NYSE listing standards. However, foreign private issuers such as us, are permitted to follow their respective home country rules in this regard. As a foreign private issuer, we are permitted to follow home country corporate governance practices and since we comply with the Indian regulations in relation to the independence requirements of the remuneration committee, we are not required to follow the NYSE listing standards for an all independent remuneration committee. The broad terms of reference of the Nomination and Remuneration Committee are to appraise the performance of Managing and/or Executive Directors, determine and recommend to the Board, the compensation payable to them. This committee is responsible for recommending the fixation and periodic revision of remunerations (including commissions and/or incentives, etc.) of whole-time directors and executive directors. This is done after taking into account our profits and performance, external competitive environment and our growth plans and the company policy on rewarding achievements and performance. Payment of remuneration to the Executive Chairman, Managing Director and Whole Time Director is governed by the respective agreements executed between them and the Company and are governed by the board and shareholder resolutions. The remuneration structure comprises of salary, commission linked to profits, perquisites and allowances and retirement benefits (pension, superannuation and gratuity).
Share and Debenture Transfer Committee
During fiscal year 2016,2017, the Share and Debenture Transfer Committee held 2018 meetings.
The transfer of equity shares of the Company is approved by the Share and Debenture Transfer Committee, which meets regularly to approve share transfers. The Share and Debenture Transfer Committee members were Din Dayal Jalan, G.R.ArunGR Arun Kumar and Rajiv Choubey. The Committee wasre-constituted in June 2015 with Mukesh Bhavnani, Arun Kumar and Rajiv Choubey as members of the Committee. This Committee was re-constituted in October 2015 with G.R.Arun Kumar, Rajiv Choubey and Pooja Yadava as members. The Committee was further re-constituted on June 29, 2016 with G.R.ArunGR Arun Kumar, Pooja Yadava and Bhumika Sood as members.
Committee for Issue of Duplicate Share Transfer
On April 28, 2016, the Board constituted athe Committee for Issue of Duplicate Share Transfer comprising of Tarun Jain, Tom Albanese and Din Dayal Jalan to periodically approve issuance of duplicate certificates and new certificates issued further to split, consolidation, renewal, demat, remat of shares, debenture, or other securities issued by the Company from time to time. This Committee wasre-constituted in November 2016 with Tarun Jain, Thomas Albanese and GR Arun Kumar as members.
Corporate Social Responsibility Committee
During fiscal year 2016,2017, the Corporate Social Responsibility Committee held 2 meetings.
Section 135 of the Companies Act, 2013 along with Companies (Corporate Social Responsibility Policy) Rules, 2014 mandates companies with revenue, net worth or profitability beyond a prescribed limit to form a corporate social responsibility committee. This committee should comprise of three or more directors with at least one of them being an independent director. OurThe Corporate Social Responsibility Committee was constituted at the Board meeting held on March 29, 2014. Naresh Chandra wasre-constituted effective July 12, 2017 with Ravi Kant as the Chairman of this committee, and Ravi Kant, Tom Albanese andAman Mehta, K. Venkataramanan, Tarun Jain were members of this committee with effect from April 1, 2014. The committee was re-constituted on May 28, 2015 with Naresh Chandra as Chairman and Anuradha Dutt, Ravi Kant, Tom Albanese and Tarun JainPriya Agarwal as members. We comply with this rule as three of the five members of this committee (all of whom are directors on the Board) are independent directors.
The principal duties and responsibilities of our Corporate Social Responsibility Committee are as follows:
Stakeholders Relationship Committee
During fiscal year 2016,2017, the Stakeholders Relationship Committee held 32 meetings.
The Stakeholders Relationship Committee was re-constituted on April 29, 2015 withmembers were previously Lalita D. Gupte, Din Dayal Jalan and Anuradha Dutt as Chairperson until the Committee wasre-constituted on September 30, 2016 by inducting Tarun Jain as a member. The Stakeholders Relationship Committee was furtherre-constituted on April 1, 2017 with Lalita D Gupte as Chairperson and K. Venkataramanan and Tarun Jain as members. This Committee was furtherre-constituted effective July 12, 2017 with Lalita D.D Gupte continuing to be the Chairperson and Din Dayal JalanK. Venkataramanan, Tarun Jain and GR Arun Kumar as members.
Two of the members are Independent Directors and the other member is a Whole Time Director. The principal duties and responsibilities of the Stakeholders Relationship Committee are to oversee the reports received from the registrar and transfer agent and to facilitate the prompt and effective resolution of complaints from our shareholders and investors and carrying out any other function as prescribed under in the SEBI Listing Regulations.
Risk Management Committee
During fiscal year 2016,2017, the Risk Management Committee held 1 meeting.3 meetings.
Pursuant to Clause 49regulation 21 of the Listing Agreement and the Companies Act, 2013,LODR Regulations 2015, the Company has constituted a Risk Management Committee. The Board at its meeting held on November 22, 2016re-constituted the Risk Management Committee. The Risk Management Committee currently consists of Tomfour members, including three Executive Directors and one member from the Senior Management/ Executive Committee namely Thomas Albanese, Tarun Jain, Din Dayal JalanGR Arun Kumar, Dilip Golani and Dilip Golani.Delodatta Padgaonkar (Risk Officer).
The purpose of the Risk Management Committee is to assist the Audit Committee and the Board in fulfilling its corporate governance oversight responsibilities with regard to the identification, evaluation, and mitigation of operational, strategic and external environment risks. The RMC has overall responsibility for monitoring and approving the risk policies and associated practices of the Company.
The principal duties and responsibilities of our Risk Management Committee are as follows:
D. Employees
See “Item 4. Information on the Company—B. Business Overview—Our Business—Employees.”
E. Share Ownership for Directors, Executive Officers and Significant Employees:
The following table sets forth information with respect to the beneficial ownership of our equity shares as of July 15, 201628, 2017 by each of our directors, executive officers and significant employees and all our directors, executive officers and significant employees as a group. As used in this table, beneficial ownership means the sole or shared power to vote or direct the voting or to dispose of or direct the sale of any security. A person is deemed to be the beneficial owner of securities that can be acquired within 60 days upon the exercise of any option, warrant or right. Equity shares subject to options, warrants or rights that are currently exercisable or exercisable within 60 days are deemed outstanding for computing the ownership percentage of the person holding the options, warrants or rights. The amounts and percentages as of July 15, 201628, 2017 are based on an aggregate of 2,964,694,2393,717,194,239 equity shares outstanding as of that date.
| Number of Shares Beneficially Owned | ||||||||
| As of July 15, 2016 | ||||||||
Name of the Beneficial owner | Number | Percent | ||||||
Anil Agarwal(1) | 1,863,458,132 | 62.85% | ||||||
Navin Agarwal | — | — | ||||||
Tom Albanese | — | — | ||||||
Din Dayal Jalan | — | — | ||||||
Ravi Kant | — | — | ||||||
Naresh Chandra | — | — | ||||||
Lalita D. Gupte | — | — | ||||||
Tarun Jain | — | — | ||||||
Anuradha Dutt | — | — | ||||||
| Number of Shares Beneficially Owned | Number of Shares Beneficially Owned | |||||||||||||||
| As of July 15, 2016 | As of July 28, 2017 | |||||||||||||||
Name of the Beneficial owner | Number | Percent | Number | Percent | ||||||||||||
Anil Agarwal(1) | 1,863,458,132 | 50.13 | % | |||||||||||||
Navin Agarwal | — | — | ||||||||||||||
Tom Albanese | — | — | ||||||||||||||
Din Dayal Jalan | — | — | ||||||||||||||
Ravi Kant | — | — | ||||||||||||||
Lalita D. Gupte | — | — | ||||||||||||||
Tarun Jain | — | — | ||||||||||||||
Krishnamurthi Venkataramanan | — | — | ||||||||||||||
Aman Mehta | — | — | ||||||||||||||
Priya Agarwal | — | — | ||||||||||||||
Anuradha Dutt | — | — | ||||||||||||||
Dilip Golani | 600 | * | 600 | * | ||||||||||||
Mansoor Siddiqi | — | — | — | — | ||||||||||||
Rajesh Padmanabhan | — | — | — | — | ||||||||||||
Suresh Bose | 865 | — | 865 | * | ||||||||||||
Samir Cairae | — | — | — | — | ||||||||||||
Roma Balwani | — | — | — | — | ||||||||||||
G.R.Arun Kumar | 1,500 | * | ||||||||||||||
GR Arun Kumar | 8,000 | * | ||||||||||||||
Mukesh Bhavnani | — | — | — | — | ||||||||||||
Akhilesh Joshi | — | — | 200 | * | ||||||||||||
Amitabh Gupta | — | — | — | — | ||||||||||||
Sunil Duggal | — | — | — | — | ||||||||||||
Deshnee Naidoo | — | — | — | — | ||||||||||||
Mayank Ashar | — | — | — | — | ||||||||||||
Sudhir Mathur | — | — | 22,948 | * | ||||||||||||
Rajagopal Kishore Kumar | — | — | — | — | ||||||||||||
Neelesh Talathi | 800 | * | ||||||||||||||
P. Ramnath | 60 | * | 60 | * | ||||||||||||
Anup Agarwal | 235 | * | 475 | * | ||||||||||||
Abhijit Pati | — | — | ||||||||||||||
Ramesh Nair | 1,788 | * | 1,788 | * | ||||||||||||
Niranjan Kumar Gupta | — | — | 3,000 | * | ||||||||||||
Ajay Dixit | 1,000 | * | ||||||||||||||
Abhijit Pati | — | — | ||||||||||||||
Vikas Sharma | — | — | ||||||||||||||
Ajay Kumar Dixit | 1,000 | * | ||||||||||||||
Philip Turner | — | — | ||||||||||||||
| All our directors, executive officers and significant employees as a group | 1,863,464,980 | 62.86% | 1,863,497,068 | 50.13 | % | |||||||||||
Notes:
| * | Represents beneficial ownership of less than 1.0%. |
| (1) | Vedanta is the beneficial owner of 1,863,458,132 equity shares of the |
Volcan holds 62.47% of the share capital and 69.70% of the voting rights of Vedanta, which in turn is the sole shareholder of VRHL, which in turn is the sole shareholder of each of Twin Star and VRFL. VRFL is the sole shareholder of VRCL, which in turn is the sole shareholder of each of Welter Trading and Richter. Richter is the sole shareholder of Westglobe and the majority shareholder of Finsider.
Volcan is wholly beneficially owned by the Trust. Conclave is the trustee of the Trust and the sole registered shareholder of Volcan. Anil Agarwal, the Executive Chairman of Vedanta, as protector of the Trust, may be deemed to have beneficial ownership of securities that are beneficially owned by the Trust and with effect from October 16, 2014, Anil Agarwal is one of the beneficiaries of the Trust. Vedanta, Volcan, the Trust, Conclave and Anil Agarwal are parties to a relationship agreement that is intended to ensure that Volcan, as Vedanta’s controlling shareholder, complies with the independence provisions of the UK Financial Conduct Authority’s listing rules. See “Item 7. Major Shareholders and Related Party Transactions—B. Related Party Transactions—Related Parties—Vedanta.”
| ITEM 7. | MAJOR SHAREHOLDERS AND RELATED PARTY TRANSACTIONS |
A. Major Shareholders
The following table sets forth information regarding beneficial ownership of our equity shares as of July 15, 201628, 2017 held by each person who is known to us to have 5.0% or more beneficial share ownership based on an aggregate of 2,964,694,2393,717,194,239 equity shares outstanding as of that date.
Beneficial ownership is determined in accordance with the SEC rules and includes shares over which the indicated beneficial owner exercises voting and/or investment power or receives the economic benefit of ownership of such securities. Equity shares subject to options currently exercisable or exercisable within 60 days are deemed outstanding for the purposes of computing the percentage ownership of the person holding the options but are not deemed outstanding for the purposes of computing the percentage ownership of any other person.
Name of Beneficial Owner | Number of Shares Beneficially Owned | Percentage Beneficially Owned | Number of Shares Beneficially Owned | Percentage Beneficially Owned | ||||||||||||
Vedanta(1) | 1,863,458,132 | 62.85% | 1,863,458,132 | 50.13 | % | |||||||||||
Note:
| (1) | Vedanta is the beneficial owner of 1,863,458,132 equity shares of the Company, consisting of: |
| (i) | 1,280,084,749 equity shares and 24,823,177 ADSs held by Twin Star representing 99,292,708 underlying equity shares; |
| (ii) | 401,496,480 equity shares held by Finsider; |
| (iii) | 44,343,139 equity shares held by Westglobe; and |
| (iv) | 38,241,056 equity shares held by Welter Trading. |
Volcan is the majority shareholder of Vedanta, which in turn is the sole shareholder of VRHL, which in turn is the sole shareholder of each of Twin Star and VRFL. VRFL is the sole shareholder of VRCL, which in turn is the sole shareholder of each of Welter Trading and Richter. Richter is the sole shareholder of Westglobe and the majority shareholder of Finsider. Volcan is wholly beneficially owned by the Trust. Conclave is the trustee of the Trust and the sole registered shareholder of Volcan. Mr. Anil Agarwal, the Executive Chairman of Vedanta and protector of the Trust, may be deemed to have beneficial ownership of securities that are deemed beneficially owned by the Trust and with effect from October 16, 2014, Mr. Anil Agarwal is one of the beneficiaries of the Trust. Vedanta, Volcan, the Trust, Conclave and Mr. Anil Agarwal are parties to a relationship agreement that is intended to ensure that Volcan, as Vedanta’s controlling shareholder, complies with the independence provisions of the UK Financial Conduct Authority’s listing rules. See “B. Related Party Transactions—Related Parties—Vedanta.Vedanta” for more information on relationship agreement.
Significant Changes in Percentage of Ownership
The following table sets forth the significant changes in the shareholding interests of our Company by our principal shareholders in our equity shares in the last three fiscal years. Except as disclosed below, there were no significant changes in the percentage of ownership in our Company in the last three fiscal years. Percentages set forth below are based on the number of equity shares outstanding as of the dates set forth below.
| As of March 31, | As of July 15, | As of March 31, | As of July 28, | |||||||||||||||||||||||||||||||||||||||||||||||||||||||||||||
Name and Type of Shares | 2014 | 2015 | 2016 | 2016 | 2015 | 2016 | 2017 | 2017 | ||||||||||||||||||||||||||||||||||||||||||||||||||||||||
| Number | Percent | Number | Percent | Number | Percent | Number | Percent | Number | Percent | Number | Percent | Number | Percent | Number | Percent | |||||||||||||||||||||||||||||||||||||||||||||||||
Vedanta | ||||||||||||||||||||||||||||||||||||||||||||||||||||||||||||||||
Equity shares | 1,728,034,417 | 58.29% | 1,863,458,132 | 62.85% | 1,863,458,132 | 62.85% | 1,863,458,132 | 62.85% | 1,863,458,132 | 62.85 | % | 1,863,458,132 | 62.85 | % | 1,863,458,132 | 62.85 | % | 1,863,458,132 | 50.13 | % | ||||||||||||||||||||||||||||||||||||||||||||
As of July 15, 2016,28, 2017 there were approximately 380,492514,663 holders of our equity shares of which 216402 shareholders have registered addresses in the US. As of the same date, 226,544,620228,630,140 equity shares representing 56,636,15557,157,535 of our ADSs, representing 7.64%6.15% of our outstanding equity shares were held by a total of 79 registered holders of record with addresses in and outside of the US. Since certain of these equity shares and ADSs were held by brokers or other nominees, the number of record holders in the US may not be representative of the number of beneficial holders or where the beneficial holders are resident. Each of our equity shares is entitled to one vote on all matters that require a vote of shareholders, and none of our shareholders has any contractual or other special voting rights.
B. Related Party Transactions
The following is a summary of the material transactions we have engaged with our controlling shareholder, Vedanta, and its subsidiaries and other related parties, including those where our management or we have a significant equity interest. In addition, the following contains a discussion of how we intend to handle conflicts of interest and allocations of business opportunities between us and our affiliates, directors and executive officers. For a further discussion of related party transactions, See Note 31 to our consolidated financial statements included elsewhere in this Annual Report.
Related Parties
Volcan and the Agarwal Family
As of July 15, 2016,28, 2017 Volcan holds 62.47%62.37% of the share capital and 69.70%69.39% of the voting rights of Vedanta. Volcan is 100% beneficially owned and controlled by the Trust. Conclave is the trustee of the Trust and sole registered shareholder of Volcan, and consequently controls all voting and investment decisions of the Trust. Mr. Anil Agarwal, the Executive Chairman of Vedanta and our Chairman Emeritus, is the protector of the Trust and with effect from October 16, 2014, is one of the beneficiaries of the Trust. Vedanta, Volcan, the Trust, Conclave and Mr. Anil Agarwal are parties to a relationship agreement that is intended to ensure that Volcan, as Vedanta’s controlling shareholder, complies with the independence provisions of the Financial Conduct Authority’s listing rules in the UK.
Vedanta
As of July 15, 2016, Vedanta is the beneficial owner of 1,863,458,132 equity shares of the Company, consisting of:
Volcan is the majority shareholder of Vedanta, which in turn is the sole shareholder of VRHL, which in turn is the sole shareholder of each of Twin Star and VRFL. VRFL is the sole shareholder of VRCL, which in turn is the sole shareholder of each of Welter Trading and Richter. Richter is the sole shareholder of Westglobe and the majority shareholder of Finsider.
Volcan is wholly beneficially owned by the Trust. Conclave is the trustee of the Trust and the sole registered shareholder of Volcan. Mr. Anil Agarwal, the Executive Chairman of Vedanta and protector of the Trust, may be deemed to have beneficial ownership of securities that are deemed beneficially owned by the Trust and with effect from October 16, 2014, Mr. Anil Agarwal is one of the beneficiaries of the Trust. Vedanta, Volcan, the Trust, Conclave and Mr. Anil Agarwal are parties to a relationship agreement that is intended to ensure that Volcan, as Vedanta’s controlling shareholder, complies with the independence provisions of the Financial Conduct Authority’s listing rules in the UK.
Vedanta, Volcan, the Trust, Conclave and Mr. Anil Agarwal are parties to a relationship agreement. The principal purpose of the relationship agreement is to facilitate the carrying on of Vedanta’s business independently of Volcan and its direct and indirect shareholders, and their respective associates, or the “Volcan Parties” as required by the listing rules of the Financial Conduct Authority of the United Kingdom, and to ensure that transactions between the parties to the agreement are conducted at arm’s length and on a normal commercial basis. Any deviation from the agreement is duly approved by the Independent directors of Vedanta. The relationship agreement will terminate in respect of Volcan at such time as each of the Volcan Parties, acting individually or jointly by agreement, cease to be a controlling shareholder of Vedanta for the purposes of the listing rules of the Financial Conduct Authority or if Vedanta isde-listed from the London Stock Exchange (“LSE”). In addition, the relationship agreement will terminate in respect of Conclave and Mr. Anil Agarwal if either of them individually or acting jointly ceases to be a controlling shareholder of Vedanta or Volcan. Currently, a controlling shareholder of a company for the purposes of the listing rules of the UK Financial Conduct Authority is any person (or persons acting jointly by agreement whether formal or otherwise) who is entitled to exercise, or to control the exercise of 30.0% or more of the rights to vote at general meetings of such company or is able to control the appointment of directors who are able to exercise a majority of the votes at Board meetings of such company.
Under the relationship agreement:
| (a) | no member of the Volcan Group nor any of their associates will take any action that would have the effect of preventing Vedanta from complying with its obligations under the listing rules of the UK Financial Conduct Authority; and |
| (b) | no member of the Volcan Group nor any of their associates will propose or procure the proposal of a shareholder resolution which is intended or appears to be intended to circumvent the proper application of the listing rules of the UK Financial Conduct Authority. |
| (a) | the acquisition or ownership by the Volcan Parties of not more than 5.0% in aggregate of any class of shares, debentures or other securities in issue from time to time of any company which engages in the smelting, refining or mining of base metals or minerals which is for the time being listed on any stock exchange; or |
| (b) | the acquisition or ownership, directly or indirectly, by the Volcan Parties of any interest in, a base metal or mineral property or asset (together with any associated property, plant and equipment), which is not adjacent or geographically proximate to an existing property or operation of Vedanta group so as to give them operational synergies, where the acquisition cost (including assumed indebtedness), including any related capital expenditures committed at the date of acquisition for the following 12 months, is equal to $ 50 million or less, for which purpose any acquisitions of two or more related or adjacent base metal or mineral properties or assets shall be aggregated when calculating the acquisition cost, provided that the relevant interested party (i) is not an officer or director of a Vedanta group company; and (ii) before acquiring such property or asset, first made the opportunity to acquire such property or asset available to the Vedanta group, with a reasonable period for the independent directors of Vedanta to consider the opportunity, on terms no less favorable than those on which they are proposed to be acquired by the interested party and a majority of the independent directors has determined that the Vedanta group should not make the acquisition; and |
Key Management Personnel
See “Note 31. Related Party Transactions of Notes to the consolidated financial statements.”
Related Party Transactions
SIIL entered into a (i) representative office agreement; (ii) consultancy agreement; and (iii) a service agreement with Vedanta on various dates. Pursuant to the effectiveness of theRe-organization Transactions, these agreements have been renewed and are now valid until March 2018. For more information, please see “Item 10. Additional Information – C. Material Contracts.”
Relationship agreement between Cairn India, TMHL Vedanta and Vedantathe Company
Cairn India, TMHL, Vedanta and Cairn Indiathe Company entered into a relationship agreement on December 8, 2011. This relationship agreement requiresrequired each of Vedanta and Cairn India to exercise all of their respective powers and, so far as they are respectively able to do so, procure that the directors of Cairn India exercise their respective powers to ensure that: (i) the business of Cairn India is at all times carried on independently of any other member of Vedanta; (ii) all dealings between Cairn India and the rest of Vedanta are approved by the Cairn India audit committee; and (iii) the business of Cairn India is managed for the benefit of its shareholders as a whole. The parties also agreed to use their reasonable endeavors to ensure that they can comply with their respective obligations under applicable law or under the rules of the stock exchanges on which their securities are traded. This relationship agreement requiresrequired Cairn India to provide Vedanta with such information as it may require in order to comply with its legal, regulatory and reporting obligations for so long as Vedanta’s holding in Cairn India is of a level that requires Vedanta to account for the holding as its subsidiary or associated undertaking under IFRS. Further, until Vedanta holds at least 10% of the issued equity share capital of Cairn India, it is agreed between the parties that, subject to certain limitations and subject to applicable law, Vedanta hashad the right to require Cairn India to take such steps as may be reasonably required by it in connection with a proposedany sale or disposal of Cairn India shares by any member of Vedanta. Cairn India iswas required to comply with such best practices, principles, standards, policies and provisions that Vedanta reasonably requiresrequired and has approved from time to time. As a result of the merger of the Cairn India Merger which became operative on April 11, 2017, the relationship agreement has been terminated.
Vedanta Resources Jersey II Limited and TMHL
During fiscal year 2014, pursuant to executing a deed of assignment between Vedanta and Vedanta Resources Jersey II Limited, all the existing rights of the loan agreements mentioned below from (i) to (iii) were assigned to Vedanta Resources Jersey II Limited and the new lender in the place of Vedanta is Vedanta Resources Jersey II Limited.
| (i) | During fiscal year 2011, TMHL entered into a loan facility agreement with Vedanta of $ 100 million which was extended until November 2012 and further extended until November 2013 with amended facility up to $ 350 million. During fiscal year 2014, the amount under this facility agreement has been extended until November 19, 2017 with an interest rate of LIBOR plus 362 basis points. During fiscal year 2016, the entire loan amount under this facility |
| (ii) | During fiscal year 2012, TMHL entered into two loan facility agreements of $ 750 million each with Vedanta. |
| (iii) | During fiscal year 2012, TMHL entered into a loan facility agreement of $ 1,625 million with Vedanta. The final repayment date is November 28, 2018 or on demand from the lender with 30 days notice. The loan is unsecured. The interest rate on this loan is 8.15% per annum. During fiscal year 2015, TMHL repaid $ 281.06 million to Vedanta Resources Jersey II Limited and the outstanding balance under this facility at March 31, 2016 was $ 424.6 million. |
| (iv) | During fiscal year 2014, TMHL entered into a loan agreement with Vedanta Resources Jersey II Limited for $ 1,200 million and $ 300 million at an interest rate of 7.25% and 8.375% per annum |
| (v) | During fiscal year 2015, TMHL entered into a loan agreement with Vedanta Resources Jersey II Limited for $ 100 million at an interest rate of 3 months LIBOR plus 301 basis points per annum. The final repayment date is August 11, 2016 or on demand from the lender with 5 days notice. The loan is unsecured. During |
Vedanta Resources Jersey Limited and TMHL
| (i) | During fiscal year 2017, TMHL entered into a loan agreement with Vedanta Resources Jersey Limited for $ 200 million at an interest rate of |
AcquisitionFor a further discussion of shareholding in Cairn India
Pursuantrelated party transactions, see “Note 31. Related Party Transactions of Notes to the share purchase agreement, dated February 25, 2012 between BFL, a wholly owned subsidiary of Sesa Goa and VRHL, BFL acquired 38.68% shareholding in consolidated financial statements.”
Cairn India and an associated debt of $ 5,998 million by acquiring TEHL, for a nominal cash consideration of $ 1. Subsequently with effect from August 26, 2013, TEHL, TMHL and Cairn India (including all its subsidiaries) are now the subsidiaries of Vedanta Limited.
CairnIndia’s production sharing contract guarantee to Government
Vedanta has provided parent company financial and performance guarantees to the GoI for Cairn India’s obligation under the production sharing contracts. The guarantee provides for making available financial resources equivalent to Cairn India’s share for its obligation under production sharing contracts, personnel and technical services in accordance with industry practices and any other resources in case Cairn India is unable to fulfill its obligations under production sharing contracts. Following the merger of Cairn with the Company, Vedanta has also provided parent company financial and performance guarantee to GoI for the Company’s obligations under the production sharing contracts.
Conflicts of Interest and Allocations of Business Opportunities
From time to time, conflicts of interest have in the past and will in the future arise between us and our affiliates, including our controlling shareholder, Vedanta, and other companies controlled by Vedanta, our directors and our executive officers. See “Item 3. Key Information—D. Risk Factors—Risks Relating to Our Relationship with Vedanta.” With respect to transactions between us and our affiliates, directors and executive officers that involve conflicts of interests, we have in the past undertaken and will continue in the future to undertake such transactions in compliance with the rules for interested or related party transactions of the London Stock Exchange on which Vedanta is listed, the NYSE on which our ADSs are listed and the NSE and BSE.
The rules applicable to London Stock Exchange companies, which would apply to transactions between us and the controlling shareholders of Vedanta, namely Volcan and the Agarwal family, require that the details of a related party transaction be notified to a regulatory information service and disclosed to the Financial Conduct Authority as soon as possible after the terms of the transaction are agreed upon. There is also a requirement that a circular containing information about the related party transaction must be sent to all shareholders and that their approval of the related party transaction must be obtained either before the transaction is entered into or, if the transaction is conditional on shareholder approval, before the transaction is completed. The related party and its associates must be excluded from voting on the related party transactions. The requirement of shareholder approval does not apply to transactions where the gross assets of the transaction as a percentage of the gross assets of the listed company, the profits attributable to the assets of the transaction as a percentage of the profits of the listed company, the consideration for the transaction as a percentage of the aggregate market value of all the ordinary shares (excluding treasury shares) of the listed company and the gross capital of the company or business being acquired as a percentage of the gross capital of the listed company, does not exceed 5%. However, the listed company must, before entering into the related party transaction, inform the Financial Conduct Authority of the details of the proposed related party transaction, provide the Financial Conduct Authority with a written confirmation from an independent adviser acceptable to the Financial Conduct Authoritya sponsor that the terms of the proposed related party transaction with the related party are fair and reasonable as far as the shareholders of the listed company are concerned and undertake in writing to the Financial Conduct Authority to include details of the related party transaction in the listed company’s next published annual accounts, including, if relevant, the identity of the related party, the value of the consideration for the transaction or arrangement and all other relevant circumstances. Related party transactions where all the above percentage ratios are 0.25% or less have no requirements under the rules applicable to London Stock Exchange companies. Where several separate transactions occur between a company and the same related party during a12-month period, the transactions must be aggregated for the purpose of applying the percentage ratio tests.
As part of our listing with the NYSE, we were required to confirm to the NYSE that we will appropriately review and oversee related party transactions on an ongoing basis. These related party transactions include transactions between us and our controlling shareholder, Vedanta, and its affiliates. The NYSE reviews the public filings of its listed companies as to related party transactions. Under the rules of the NYSE, we are required to have an independent audit committee comprised entirely of independent directors. We have had an independent audit committee comprised entirely of independent directors since our ADS offering in June 2007. One of the functions of the independent audit committee is to review any related party transactions by us or any of our subsidiaries or affiliates. In addition, under the rules of the NYSE, we are required to obtain shareholder approval for any issuance of our equity shares, or securities convertible into or exercisable for our equity shares, to any related party, except that such approval would not be required for sales of our equity shares to our controlling shareholder or its affiliates in an amount not to exceed 5% of the number of our equity shares outstanding prior to such issuance and at a price equal to or greater than the higher of the book or market value of our equity shares.
Under the listing agreementsregulations we have entered into with the NSE and BSE, we are required to ensure that our disclosures in relation to material and significant related party transactions in our Annual Reports are in compliance with Indian GAAP.applicable GAAP in India. Specifically, we are required to place before the audit committee and publish in our Annual Reports a statement in summary form of the related party transactions entered into by us during the previous fiscal year, providing details of whether such transactions were undertaken in the ordinary course of business and details of material individual transactions with related parties or others which were not on an arm’s length basis, together with our management’s justification for such transactions. Under the listing agreements,regulations, our audit committee is required to review and discuss with the management the disclosures of any related party transactions, as defined under Indian GAAP, in our annual financial statements.
Under the Companies Act, 2013, a company needs approval of the Audit Committee on all related party transactions and any amendments. This is irrespective of whether they are in the ordinary course of business and consummated at arm’s length or they do not breach the share capital or transaction value thresholds prescribed in the board rules.
If the transaction is entered into the ordinary course of business, and is also at arm’s length, neither a board approval nor a special resolution of a disinterested shareholder is required. For transactions which are neither in the ordinary course of business nor at arm’s length, the company will need an approval of the board, irrespective of the share capital or transaction value.
The company needs to pass a shareholders’ special resolution at a general meeting, if the criteria below mentioned are satisfied. Members of the company, who are related parties, are not permitted to vote on the special resolution.
| (i) | Related party transactions are neither in the ordinary course of business nor at arm’s length, and |
| (ii) | The Company’spaid-up share capital is not less than the prescribed limit, or transaction(s) amount exceed a specified threshold. |
We also have used and will continue to use independent appraisers in appropriate circumstances to help determine the terms of related party transactions. We have had and will continue to have an audit committee comprised entirely of independent directors which is responsible for reviewing any related-party transaction by us or any of our subsidiaries or affiliates.
We are continually seeking to identify and pursue business opportunities. However, Vedanta, as our controlling shareholder, has the power to determine in its sole discretion what corporate opportunities we may pursue and whether to pursue a corporate opportunity itself or through one of its other subsidiaries, which may benefit such companies instead of us and which could be detrimental to our interests. See “Item 3. Key Information—D. Risk Factors—Risks Relating to Our Relationship with Vedanta—Vedanta may decide to allocate business opportunities to other members of the Vedanta group instead of to us, which may have a material adverse effect on our business, results of operations, financial condition and prospects.” Vedanta has in the past allocated and expects in the future to allocate corporate opportunities among itself and its various subsidiaries based on a number of factors, including the nature of the opportunity, the availability of funds at the relevant subsidiary to pursue the opportunity and which subsidiary it believes can most successfully take advantage of the opportunity.
C. Interest of Experts and Counsel
Not applicable
| ITEM 8. | FINANCIAL INFORMATION |
A. Consolidated Statements and Other Financial Information
Please see Item 18 for a list of the financial statements filed as part of this Annual Report.
Legal Proceedings
Except as described below, there are no governmental, legal or arbitration proceedings (including any such proceedings which are pending, or to our knowledge, threatened) which proceedings we believe could reasonably be expected to have a material adverse effect on our results of operations, cash flows or financial position. See Note 29 to our consolidated financial statements included elsewhere in this Annual Report for more information.
Proceedings against the GoI which has disputed our exercise of the call option to purchase its remaining ownership interest in BALCO
There are certain proceedings that are currently ongoing with respect to the exercise of a call option to acquire the remaining shares of BALCO held by the GoI, in accordance with the terms of the shareholders’ agreement between the GoI and us. The amount claimed under this proceeding is presently unquantifiable. The arbitration tribunal formed under the directions of the High Court of Delhi pronounced an award on January 22, 2011. The award held certain clauses of the shareholders’ agreement to be void, ineffective and inoperative as being in violation of sub section (2) of Section 111A of the Companies Act, 1956. We filed an application before the High Court of Delhi to set aside this award under Section 34 of the Arbitration and Conciliation Act, 1996. Our application is scheduled for hearing on November 4, 2016.October 17, 2017. See “Item 4. Information on the Company—B. Business Overview—Our Business—Options to Increase Interests in HZL and BALCO.”
Proceedings against the GoI which has disputed our exercise of the call option to purchase its remaining ownership interest in HZL
We commenced arbitration proceedings against the GoI with respect to exercise of our call option to acquire the remaining shares of HZL held by the GoI, in accordance with the terms of the shareholders’ agreement between the GoI and us. The GoI denied our right to exercise the option on the basis that the shareholders’ agreement contravenes the provisions of Section 111A of the Companies Act, 1956 and is therefore void. The next date of hearing by the arbitral tribunal is on August 20, 2016.April 21, 2018. In a related proceeding, the Supreme Court on January 19, 2016 ordered the status quo be maintained with respect to the proposed disinvestment of government interest in HZL until further orders are passed by the court.Supreme Court. See “Item 4. Information on the Company—B. Business Overview—Our Business—Options to Increase Interests in HZL and BALCO.”
Legal proceedings related to mining operations in the State of Goa
Pursuant to findings in the Justice M.B. Shah Commission Report dated March 15, 2012 on the allegations of illegal mining in the State of Goa, the state government had banned iron ore mining operations in Goa on September 10, 2012 and the Ministry of Environment and Forest (“MOEF”MoEF”) had suspended environmental clearances of all mining leases within the State of Goa. A writ petition was filed before the Supreme Court of India to initiate action based on the Justice M.B. Shah Commission Report and an interim order was passed by the Supreme Court of India on October 5, 2012 suspending mining operations within Goa.
The Supreme Court of India passed an interim order on November 11, 2013 directing that the Directorate of Mines and Geology (“DMG”) verify the inventory of the excavated mineral ores and the Monitoring Committee be constituted to sell the materials through ane-auction. The Monitoring Committee ise-auctioning the ore and the proceeds from the auction will go to the state government.
On April 21, 2014, the Supreme Court passed judgment in the matter lifting the ban with certain stipulations, including directions on mining by the lessees after November 22, 2007 as being illegal, and dumping outside the leased area as being impermissible. The Supreme Court also ordered that an interim buffer zone be fixed at one kilometer from the boundaries of National Parks and Sanctuaries, set anad-hoc cap on annual excavation at 20 million tons other than from dumps until such time as the final report of Expert Committee is submitted, and also ordered the appropriation of the sale value ofe-auctioned inventorized ores by the state government as per stipulated conditions, and the payment of 10% of the sale proceeds to the Goan Iron Ore Permanent Fund. The Supreme Court has held that all mining leases in the State of Goa, including those of the Company, had expired in 2007 and consequently, no mining operations can be carried out until renewal/execution of mining lease deeds by the state government. The petition filed by us in May 2014 for the review of the aforesaid judgment in the Supreme Court of India on certain limited issues was subsequently withdrawn by us in September 2014.
On August 13, 2014, the High Court of Bombay, Goa Bench passed a common order directing the State of Goa to renew the mining leases for which stamp duty was collected in accordance with the Goa Mineral Policy (2013) and to decide the other applications for which no stamp duty was collected within three months thereof.
In January 2015, the government of Goa revoked the order suspending mining operations in the State of Goa and MOEF has revoked suspension of environmental clearances in March 2015. Subsequently, the lease deeds for all working leases were executed and registered as of August 2015. We obtained the consent to operate under the Air (Prevention of Pollution) Act and Water (Prevention of Pollution) Act from the Goa State Pollution Control Board and mining plan approval from the Indian Bureau of Mines for these leases, and the Company resumed operations of its mines on August 10, 2015.
On September 10, 2014,the Goa Foundation challenged the High Court order directing the renewal of mining by way of a Special Leave Petition (SLP) before the Supreme Court of India, challenging the judgment of the High Court dated August 13, 2014 directing renewal of mining leases. No stay has yet been granted by the Supreme Court. Another set of SLPs on an identical issue were filed by a local activist. Two writ petitions have also been filed before Supreme Court by Goa Foundation and Sudip Tamankar in September 2015 for setting aside the second renewal of iron ore mining leases in Goa made under section 8 (3) of MMDR Act and challenging the revocation of suspension on mining in State of Goa.
The Expert Committee has filed their reports on dump handling and ceiling on annual extractionextractions before the Supreme Court recommending the immediate enhancement of the annual extraction ceiling to 30 million MT, and subsequently to 37 million MT after the development of infrastructure. We have filed an application before the Supreme Court of India, requesting clarification on whether any contributions to the Goa Permanent Iron Ore Fund should be made as per the Supreme Court’s orders, as the Central government has introduced a provision to set up social fund known as District Mineral Foundation in states for similar objectives. The Expert Committee Report is yet to be accepted by the Supreme Court and the next hearing is listed on August 24, 2017, which is to be heard along with the application on contributions to the Goa Permanent Fund.
Certain prosecution proceedings brought by SEBI against us, Mr. Anil Agarwal and Mr. Tarun Jain
In April 2001, SEBI ordered that prosecution proceedings be brought against us, alleging that we have violated the regulations prohibiting fraudulent and unfair trading practices and it also passed an order prohibiting us from accessing the capital markets for a period of two (2) years. This SEBI order was overruled by the SEBI Appellate tribunal on October 22, 2001 on the basis of lack of sufficient material evidence to establish that we had, directly or indirectly, engaged in market manipulation and that SEBI had exercised its jurisdiction incorrectly in prohibiting us from accessing the capital markets. On November 9, 2001, SEBI appealed to the High Court of Bombay. The next date of hearing has not yet been fixed.
In addition to the prosecution proceedings, SEBI also initiated criminal proceedings in 2001 before the Court of the Metropolitan Magistrate, Mumbai, against us, Mr. Anil Agarwal and Mr. Tarun Jain (who was the chief financial officer of MALCO at the time of the alleged price manipulation). When SEBI’s order was overruled on October 22, 2001, we filed a petition before the High Court of Bombay to stay those criminal proceedings on the grounds that the SEBI Appellate tribunal had overruled SEBI’s order on price manipulation. An order was passed by the High Court of Bombay in our favor on December 2, 2005, granting an interim stay of the criminal proceedings.
Investigation by the Serious Fraud Investigation Office of India
In October 2009, the Ministry of Corporate Affairs ordered the Serious Fraud Investigation Office of India to investigate alleged mismanagement, malpractices, financial and other irregularities on the part of Sesa Goa and Sesa Industries Limited, including the alleged siphoning and diversion of funds, primarily in the period prior to our acquisition of Sesa Goa in 2007. The Serious Fraud Investigation Office of India report made certain allegations relating to under-invoicing the export of iron ore, over-invoicing the import of coal, over-invoicing of sale of iron ore from Sesa Goa to Sesa Industries Limited, commission paid to Mitsui and other violations under the Companies Act, 1956 during the period from 2001 to 2007. The report recommended that action be taken against the directors of Sesa Goa during the aforementioned period. The allegations in the Serious Fraud Investigation Office of India report were dropped and subsequently, the GoI through the Ministry of Corporate Affairs filed complaints in Judicial Magistrate, First Class, Panaji (JMFC) against Sesa Goa and certain of its directors and officers, for violation of certain sections of the Companies Act, 1956, including dealing with publication of name outside the premises, form of balance sheet and inducing persons to invest money.The Ministry of Corporate Affairs filed an application in the Court for the separation of trial against the unserved accused. The other directors and offices have been exempted from personal appearance. With respect to violation dealing with publication of name outside the premises, on December 2, 2014, the counsel to the Ministry of Corporate Affairs submitted to Judicial Magistrate, First Class, Panaji that they would be seeking instructions whether the matter can be compounded or withdrawn. The application filed by the Ministry of Corporate Affairs for separation of trial against the unserved accused was dismissed on November 11, 2014 and the Ministry of Corporate Affairs has taken steps to serve the unserved accused. The Ministry of Corporate Affairs has filed application for sending summons to the accused as per the guidelines issued by the Ministry of Home Affairs, to which we submitted our response. Vedanta Limited filed a compounding application with the Registrar of Companies, Goa on September 28, 2015, and a compounding order was passed on February 18, 2016. The proceedings before the Judicial Magistrate, First Class, Panaji were withdrawn and disposed on April 22, 2016.
Criminal proceedings against certain directors and employees of BALCO
Criminal proceedings were initiated by Mr. Ajay Padia before the Court of the Judicial Magistrate First Class, Pune against Mr. Anil Agarwal, Mr. Navin Agarwal, Mr. Tarun Jain and certain of our other former directors and employees in 2002 alleging that an assurance that was given by the above mentioned directors regarding payment of all amounts owed to him for the damaged material supplied by BALCO was not honored. An application under Section 482 of the Indian Criminal Procedure Code was filed in the High Court of Bombay for quashing the proceedings in the Judicial Magistrate First Class and to dispose the matter directing that alternative remedies were available before the Sessions Court, Pune, which was the appropriate Court. The High Court of Bombay stayed the criminal proceedings and the application was listed for disposal. The next date of hearing has not been fixed.
Penalties levied by the Enforcement Directorate on certain of our directors and us
On August 3, 2004, the Enforcement Directorate levied penalties on certain of our directors and us aggregating to Rs.347Rs. 347 million ($ 5.25.4 million). It was alleged that we transferred an amount equivalent to $ 49 million to Twinstar Holdings Limited and invested in Sterlite and MALCO through Twinstar Holdings Limited without the permission of the RBI. We have submitted that Twinstar Holdings Limited obtained the required approvals from the Foreign Investment Promotion Board (“FIPB”) for the investment. We appealed to the appellate tribunal against the Enforcement Directorate’s order for foreign exchange seeking a waiver of thepre-deposit amount which was equal to 100% of the penalty levied, which appeal was allowed by the tribunal. The Enforcement Directorate appealed against this decision of the tribunal to the High Court of Delhi, which referred the matter back to the tribunal to consider the issue afresh. The next date of hearing is scheduled for August 2016.September 12, 2017.
Criminal proceedings against former directors of Sesa Goa and its directorsIndustries Limited
Ms. Krishna Bajaj filed a complaint against the former directors of Sesa Industries Limited (which has since been amalgamated with Sesa Goa) before the Magistrate at Mumbai in 2000, in relation to shares issued on a preferential basis by Sesa Industries Limited in 1993 to Sesa Goa’s shareholders, alleging that the shares of Sesa Industries Limited were not listed within 12 to 18 months of the offer as stated in the offering document. The four directors appeared before the court on June 16, 2009 and pleaded not guilty to the charges. The four directors filed a criminal application in the High Court of Bombay challenging the Magistrate’s order of framing charges before the High Court of Bombay. The High Court of Bombay admitted the criminal application and stayed the proceedings pending before Magistrate at Mumbai.
Ms. Krishna Bajaj also filed a separate complaint against Sesa Industries Limited (which has subsequently been merged with Sesa Goa), Sesa Goa and their directors in 2003 alleging that when Sesa Goa had offered in 2003 to buy back shares issued on a preferential basis by Sesa Industries Limited in 1993 from Sesa Industries Limited’s minority shareholders, Sesa Goa had committed the same offence alleged against the then directors of Sesa Industries Limited described in the preceding paragraph and accordingly, Sesa Industries Limited, Sesa Goa and their directors should also be liable for the failure to list Sesa Industries Limited’s shares. The Chief Judicial Magistrate at Mumbai issued an order for process in October 2006 against Sesa Industries Limited, Sesa Goa and its directors, against which a criminal writ petition was filed by Sesa Industries Limited, Sesa Goa and their former directors before the High Court of Bombay, which stayed further proceedings in August 2007. The High Court of Bombay subsequently passed an order in December 2008 in favor of Sesa Industries Limited, Sesa Goa and their directors, quashing Ms. Bajaj’s complaint. The Supreme Court of India subsequently issued notices to all the parties in the special leave petition of Ms. Krishna Bajaj challenging the order of the High Court of Bombay. Ms. Krishna Bajaj submitted an application to implead the Serious Fraud Investigation Office as a party to the proceedings which was allowed by the Supreme Court of India in November 2011. On August 4, 2015 this separate complaint was withdrawn by Krishna Bajaj.
Writ petitions filed against us alleging violation of certain air, water and hazardous waste management regulations at our Tuticorin plant
Various writ petitions were filed before the High Court of Madras alleging that sulphur dioxide emissions from our copper smelting operations at Tuticorin were causing air and water pollution and hazardous waste and sought a cancellation of our permits and environmental approval to operate our smelter.
A writ petition was filed in December 2009 before the High Court of Madras challenging the grant of environmental clearance for the expansion of our copper smelter at Tuticorin. But no order or direction for injunction was granted. By way of its order dated April 28, 2016, the High Court of Madras dismissed the petition and rejected the claims of the petitioner.
Separately, in March 2013, the TNPCB ordered the closure of the copper smelter at Tuticorin due to complaints regarding a noxious gas leak by local residents. On April 1, 2013 we filed a petition with the National Green Tribunal challenging the order of the TNPCB on the basis that the plant’s emissions were within permissible limits. The National Green Tribunal passed an interim order in May 31, 2013 allowing the smelter to recommence operations subject to certain conditions, and consequently we recommenced operations on June 16, 2013. The expert committee constituted by the National Green Tribunal submitted a report on the operation of the plant on July 10, 2013 stating that the plant’s emissions were within the prescribed standards. Based on this report, the National Green Tribunal ordered on July 15, 2013 that the smelter could recommence its operations. On August 8, 2013, the National Green Tribunal confirmed its May 31, 2013 order and held that there was no health impact owing to the operations with directions to comply with the recommendations made by the committee to further improve the working of the plant within a time bound schedule. We implemented all the recommendations during fiscal year 2013. However, the TNPCB filed a civil appeals in 2013 against the National Green Tribunal’s interim order dated May 31, 2013 and the final order dated August 8, 2013. V Gopalaswamy, the General Secretary of a political party, MDMK, also filed civil appeals in 2013, which are pending before the Supreme Court of India. Meanwhile, TNPCB has renewed the consent to operate for the existing copper smelter, which is valid until March 31, 2017. The appeals are pending before the Green bench of the Supreme Court of India.
The MoEF has rejected the forest clearance granted to the Niyamgiri mining project and our expansion plans of refinery in Lanjigarh are on hold
In 2004, a writ petition was filed by a private individual against us, the Government of Odisha, the Republic of India, the Orissa Mining Corporation (“OMC”), and others before the High Court of Odisha, alleging that the grant of a mining lease by the OMC to us to mine bauxite in the Niyamgiri Hills at Lanjigarh, in the State of Odisha, would violate the provisions of the Forest (Conservation) Act, 1980 of India. The petition alleged that the felling of trees, construction of the alumina refinery by us and the development of the mine was in violation of the Forest (Conservation) Act, 1980 and would have an adverse impact on the environment. The petition sought, among other things, to restrain the grant of the mining lease to mine bauxite, to declare the joint venture agreement entered into between us and the OMC void, a court direction for the immediate cessation of construction of the Lanjigarh alumina refinery and an unspecified amount of compensation from us for damage caused to the environment. This petition was also filed before the Supreme Court of India by certainnon-governmental organizations and individuals. The Supreme Court granted us the clearance to mine in and around the Niyamgiri Mines on terms and conditions as specified in the Court order. Consequent to the order of the Supreme Court, the proceedings before the High Court of Odisha became redundant as the issues were already determined.
Thereafter, the MoEF on August 24, 2010 declined to grant the forest clearance for the Niyamgiri Mines to the OMC, and rendered the environmental clearancenon-operational. On March 8, 2011, the OMC challenged the order of the MoEF by a special leave petition in the Supreme Court of India. On April 1, 2011, the Court admitted the OMC’s plea against the MoEF. The Supreme Court in its order dated April 18, 2013 ordered the Government of Odisha to place any unresolved issues and claims of the local communities under the Forest Rights Act and applicable rules before the Gram Sabha, the council representing the local community. The Gram Sabha was ordered to consider these claims and communicate its decision to the MoEF through the Government of Odisha within three months of the order. The Government of Odisha completed the process of conducting Gram Sabha meetings and submitted its report on the proceedings to the MoEF.
Further the MoEF, based on the report submitted by the Government of Odisha rejected the grant of stage II forest clearance for the Niyamgiri project of OMC on January 8, 2014, which is one of the sources of supply of bauxite to the alumina refinery at Lanjigarh in terms of the joint venture agreement with the government of Odisha (through the OMC). Under the terms of the joint venture agreement, 150 million tons of bauxite was required to be made available to us. We are considering to source bauxite from alternate sources to support the existing and the expanded refinery operations. Assets under construction as at March 31, 2016 was after an impairment charge of Rs. 668 million ($10.1 million) which relates to impairment of mining assets of Jharsuguda Aluminium at Lanjigarh as the MoEF has rejected the Stage II forest clearance for the Niyamgiri mining project. The OMC has issued a show cause notice dated February 20, 2015 on Vedanta to show reason for why the joint venture agreement for the supply of 150 million tons of bauxite will not be cancelled in view of the failure to achieve certain milestones set out in the joint venture agreement. We have replied to the notice substantiating all facts on the project followed by anin-person meeting. We have stated that Vedanta has achieved all its milestones and that the joint venture agreement should not be terminated. During thefiscal year 2016, OMC has terminated the joint venture agreement for which the Company is pursuing the appropriate course of action.
On October 20, 2010, the MoEF ordered us to maintain the status quo on the expansion of our refinery at Lanjigarh. Against this order, we filed a writ petition in the High Court of Odisha and the High Court dismissed our petition. We made an application to the MoEF to reconsider the grant of the environmental clearance for our alumina refinery. By its letter dated February 2, 2012, the MoEF issued fresh terms of reference to us for preparation of the environment impact assessment report. We submitted this report to the Odisha Pollution Control Board and simultaneously submitted various representations to the MoEF as well as the Project Monitoring Group established under the Cabinet Committee on Investments. The Expert Appraisal Committee of the MoEF reconsidered the project and revalidated the terms of reference for 22 months effective January 2014. Thereafter the suspension imposed on the expansion of our alumina refinery was lifted. The public hearing was held on July 30, 2014 and the expansion of our Lanjigarh refinery was considered by the Expert Appraisal Committee in its meeting dated January 9, 2015 for the grant of environmental clearance. On November 20, 2015, the MoEF granted an environmental clearance in line with the Expert Appraisal Committee’s recommendation for the alumina refinery expansion up to 4 MTPAmtpa and environmental clearance of up to 6 MTPA,mtpa, which will be received as an amendment to the existing environmental clearance after the completion of land acquisition of the balance area of 666.03 HA. Further, a Consent to Establishestablish for 6 MTPAmtpa and Consent to Operate for 2 MPTAmtpa has also been granted.
On February 18, 2016, an individual challenged the environmental clearance grantgranted for the alumina refinery expansion at Lanjigarh before the National Green Tribunal, Kolkata, wherein MoEF, Orissa State Pollution Control Board and Vedanta Limited have been made parties. The MoEFWe filed our response and the matter is required to file its reply by Augustlisted on September 12, 2016, after which we will file a response. Further,2017. In the meantime, another individual has filed a similaran interlocutory application to be impleaded in the matter before the National Green Tribunal Delhi, challenging the environmental clearance. The matter was originally listed on June 30, 2016 whereupon we informed the National Green Tribunal, Delhi that a similar matter is pending before National Green Tribunal, Kolkata. Subsequently, on July 22, 2016 the National Green Tribunal, Delhi dismissed the matter, granting the individual the liberty to file the application before National Green Tribunal, Kolkata.
Proceedings against us challenging environmental consents received for our expansion project of pig iron, metallurgical coke, sinter plants and power plant in Goa
On March 6, 2012, the High Court of Bombay dismissed a public interest litigation filed by Mr. Ramachandra Vaman Naik and others for quashing an approval issued by the MoEF and the Goa State Pollution Control Board for the expansion project of a pig iron plant, sinter plant, metallurgical coke plant and power plant in Goa. On July 26, 2012, Mr. Naik challenged this order by filing a special leave petition before the Supreme Court for an interim stay of the order and for a stay on the construction and operation of the plants in Goa. No stay has been granted in these matters and all respondents have filed their counter–affidavits. The Supreme Court, on November 7, 2016, transferred the matter will be heard in due course.to the National Green Tribunal, New Delhi for a de novo hearing and disposal. The Supreme Court also set aside the order passed by the High Court without expressing any opinion on the merits of the case. The matter before the National Green Tribunal, New Delhi has been listed for hearing on August 23, 2017.
Separately, an application was filed by the village panchayat head of Navelim, Goa before the National Green Tribunal against the Goa State Pollution Control Board, MoEF, State of Goa, others and us alleging that (i) Goa State Pollution Control Board had issued its approval in a piecemeal manner to us, even though the environmental clearance order issued by the MoEF and the approval are for all four plants thereby violating the MoEF order, (ii) theno-objection certificate issued in relation to this project in 2007 was forged and fabricated, and (iii) the CN5 bridge at Maina-Navelim junction falls outside the notified industrial area, and crosses a public road belonging to the village panchayat. The application sought cancellation of the approval and the order of the MoEF. On March 1, 2013, the National Green Tribunal gave directions to issue notices to all the parties. We responded on April 11, 2013, denying all contentions and submissions made by the village head and requested that the application be dismissed. Pleadings in the matter have been completed. Subsequently on February 10, 2014 the matter was transferred from the Principal Bench of the National Green Tribunal at New Delhi to the Western Bench of the National Green Tribunal at Pune. On July 31, 2014, the National Green Tribunal held that owing to an identical issue pending before the Supreme Court of India, the proceeding before the National Green Tribunal is adjourned and ordered us to inform the National Green Tribunal of the determination of the Supreme Court of India.
Certain proceedings with respect to renewal of our environmental consents
On December 7, 2012, the Goa State Pollution Control Board (“GSPCB”) informed us that in light of the Supreme Court of India’s order on October 5, 2012 and the GSPCB’s decision given on November 1, 2012, applications filed by us for renewal of consent to operate under the Water Act and the Air Act could not be processed and therefore such applications were returned to us. On December 28, 2012, we applied to the GSPCB for grant of consent to operate under these legislations which was subsequently denied on March 5, 2013. On April 9, 2013, we appealed against the GSPCB’s order before the administrative tribunal at Goa. On April 15, 2015, the tribunal set aside the GSPCB’s March 5, 2013 order and ordered the GSPCB to hear and decide the matter. Thereafter, we filed new applications for the consent to operate under Air Act and Water Act for the year 2015 to 2017, which have been granted by the GSPCB.
Shenzhen Shandong Nuclear Power Construction Co. Limited has commenced arbitration proceedings against us
On February 19, 2012, Shenzhen Shandong Nuclear Power Construction Co. Limited (“SSNP”) filed a petition before the Bombay High Court under section 9 of the Arbitration and Conciliation Act, 1996, allegingnon-payment of their dues towards construction of a 210 MWco-generation power plant for a refinery expansion project at Lanjigarh, and filed a claim of Rs. 16,686 million ($ 251.9257.3 million). This was subsequent to SSNP’s notice for termination of the contract dated February 25, 2011 and legal notice dated February 23, 2012 for recovery of its alleged dues. SSNP also made a request for interim relief. Under the petition, SSNP sought for a restraining order on encashment of the advance bank guarantee, injunction from disposing or creating third party right over plant and machinery at the project site and security for the amount due under the contract. On April 25, 2012, the High Court of Bombay dismissed SSNP’s petition. SSNP appealed against this order and the High Court of Bombay by its order of December 12, 2012 ordered us to deposit a bank guarantee for an amount of Rs. 1,870 million ($ 28.228.8 million) until completion of the arbitration proceedings.
On April 9, 2013, we also filed a counterclaim for delays in operations caused for which we argued that SSNP was responsible. Subsequently, SSNP filed an application for an interim award of Rs. 2,020 million ($ 3031.1 million) before the arbitral tribunal, which was not allowed.granted. The proceedingsfinal arguments in the matter are ongoing and thecompleted. The next hearing date is scheduledon July 30, 2017 for November 2016.clarifications.
Proceedings against TSPL relating to its delay in commissioning various units of the power plant
TSPL entered into a long term power purchase agreement with the Punjab State Power Corporation Limited (“PSPCL”) for supply of power. TSPL has a contractual obligation to complete the commissioning of various units of the power plant according to the scheduled timelines agreed in terms of the agreement. According to the terms of the agreement, there are obligations and performances to be met by both PSPCL and TSPL. PSPCL was obligated to fulfill certain conditions including procuring interconnection and transmission facilities, arranging supply of adequate quantity of fuel for the project etc. However, due to the delay in fulfilment of certain obligations and other force majeure reasons, there were delays in implementing the project as compared to the scheduled timelines under the agreement. TSPL received letter from PSPCL, seeking payment of liquidated damages of Rs.3,176.4Rs. 3,176.4 million ($ 47.949.0 million) for each delay in commissioning of Units I, II and III totaling Rs. 9,529.2 million ($ 143.8146.9 million).
Subsequently, PSPCL invoked the bank guarantee of Rs. 1,500 million ($ 22.623.1 million) towards payment of the liquidated damages on account of delay in completion of the commissioning of Unit I. TSPL filed a petition with the Punjab State Electricity Regulatory Commission (“PSERC”) for quashing of the wrongful claim of liquidated damages and grant of extension of time to complete the commissioning of various units of the power plant. On October 22, 2014, PSERC ordered the matter to be settled through arbitration and allowed the stay on encashment of the bank guarantee until the matter is finally adjudged by Arbitrator.the arbitrator. PSPCL submitted an appeal in Appellate Tribunal for Electricity (APTEL) against the PSERC order and on May 12, 2015, APTEL disposed the appeal by directing that the matter will be adjudicated by an arbitral tribunal. The arbitral proceedings are inhave concluded on February 15, 2017 and the initial stages and dates for examination of witnesses are scheduled in September 2016.order has been reserved.
Proceedings against TSPL relating to mega power project benefits
TSPL submitted its bid for setting up a 1980 MW thermal power plant in the state of Punjab under a tariff based international competitive bidding process under aCase-2 Model bidding mechanism on June 2008, which was ultimately awarded to Sterlite Energy Limited (now Vedanta Limited). A Power Purchase Agreement (the “PPA”)PPA was entered between TSPL and PSEB on September 2008, which is now known as PSPCL. According to the PPA, any increase or decrease in the capital cost of the project on the occurrence of any “Change in Law” (as defined therein) after thecut-off date of June 16, 2008, had to be passed on to PSPCL.PSPCL, if it resulted in change in economic position of TSPL.
Because TSPL intended to sell all of the generated electricity to the state of Punjab, it did not meet one of the requirements for the mega power project atAt the time of bidding, namely thatTSPL was not eligible for the project had to sell electricity to more than one state. However, the said requirement was amended‘mega power project’ status, however towards the end of 2009, the government policy on mega power projects was amended and various conditions were relaxed making TSPL eligible for the grant of mega power project status. Accordingly,benefits. TSPL was giventhen granted the mega power project status in 2010 and thereafterin terms of which TSPL has been receiving theavailed customs and excise exemption.duty exemption for import of capital goods during construction of the power plant. As TSPL had become entitled to the mega power project status after thecut-off date, according to PSPCL, the mega power project benefits received by TSPL had to be passed on to PSPCL pursuant to the PPA’s “Change in Law” clause. TSPL’s position was that as of thecut-off date, similar benefits were available to it under India’s the foreign trade policy as anon-mega power project and accordingly, that its economic position had not altered pursuant to the grant of mega power project status to warrant the passing on of such benefits to PSPCL. TSPL has also produced a number of approval letters issued by various Director General of Foreign Trade offices across India, which extended such benefits tonon-mega power projects including government power projects or other public sector undertakings.
PSERC passed an ordera 2:1 majority judgement dated December 2, 2014, holding against TSPL. TSPL thereafter filed an appeal on January 2015 along with a stay application before the APTEL, challengingAPTEL. The appeal was admitted, however, the order of PSERC. The stay application was rejected by APTEL without considering the submissionsAPTEL. Against this rejection of TSPL. TSPL then filed a stay application, before theTSPL filed an appeal in Supreme Court appealing against APTEL’s order on the stay application, and subsequently on July 28, 2015, the Supreme Court granted stay order against any recovery of mega power project benefits by PSPCL. The stay granted by the Supreme Court was vacated on February 6, 2017, which led to a deduction of Rs. 2,140 million from TSPL’s monthly billing by PSPCL. Upon appeal, Supreme Court directed PSPCL to refund Rs. 500 million from the amount deducted from TSPL’s bill subject to final outcome of appeal before APTEL. Following this order, APTEL also granted a stay against further deductions from the monthly billing against a bank guarantee furnished by TSPL.
APTEL dismissed the appeal filed by TSPL and ordereddisallowed TSPL’s contentions in its final judgement order dated July 4, 2017. TSPL filed an appeal before the Supreme Court against the adverse final judgement of APTEL. This appeal was admitted by Supreme Court on July 10, 2017 and a stay order was granted against PSPCL’s proposed deduction of Rs. 900 million from TSPL’s bills and against the encashment of bank guarantee amounting to continue until given any further orders.Rs. 380 million which was furnished by TSPL to PSPCL under APTEL’s order. The next hearingappeal is scheduled for further hearing in Supreme Court on November 8, 2017.
TSPL is of the firm belief that no benefit has to be passed on to PSPCL on account of grant of mega power project status as the economic position of TSPL has not changed owing to such mega power project status which is the trigger point for applicability of ‘Change in Law’ provision of the PPA.
TSPL dispute related to Coal GCV measurement and coal washing
Upon PSPCL’s refusal to pay energy charges to TSPL as per the provisions of a PPA between PSPCL and TSPL dated September 14, 2016.
PSERC issued the final order on November 23, 2015 denying all the claims made by TSPL. TSPL filed an appeal before APTEL challenging the order of PSERC. On July 3, 2017, APTEL partially allowed the appeal awarding unloading and shunting charges to TSPL although it ruled against TSPL on other claims. TSPL is in the process of challenging the decision in Supreme Court. The claim amount involved is Rs. 5,900 million ($ 91.0 million).
Petitions filed against BALCO in relation to the alleged encroachment of land on which our Korba smelter is located
BALCO has 1,804.67 acres of government land out of which 1,751 acres is forest land which were given on lease by the state government. The lease deed has not been executed till date. The High Court of Chhattisgarh on February 2010 held that BALCO is in legal possession of 1,804.67 acres of government land based on which the cabinet of Chhattisgarh recommended the execution of lease deed in favor of BALCO but after approvals for forest land were sought.
With respect to the approvals for forest land, petitions have been filed in public interest before the Supreme Court of India by various individuals and Sarthak, anon-governmental organization alleging that BALCO is using forest land fornon-forest activities. The Supreme Court of India referred the matter to the Central Empowered Committee, which recommended an ex post-facto diversion of forest land with payment of net present value on land for which forest compensation was not paid prior to the year 1980. Subsequently, it was alleged that BALCO had cut trees in violation of the Court order and the petitioner filed a contempt petition and the matter was again referred to the Central Empowered Committee. The Central Empowered Committee submitted its report on June 30, 2012 to the Court recommending that a detailed survey should be conducted through Forest Survey of India (MoEF) using high quality remote sensing technique to find out whether any tree felling and/ornon-forest use has taken place after February 29, 2008 in the revenue forest land and/or deemed forest in possession of BALCO. In order to expedite the proceedings, BALCO filed an application in the Court seeking direction to pay the net present value on forest land as per the recommendation of the Central Empowered Committee providing anex-post facto diversion of the 1,751 acres forest land held by BALCO. The date of hearing for this matter has not yet been fixed.
Proceedings by BALCO relating to direction by GoI not to declare us as the successful bidder in thee-auction of Gare Palma IV/1 coal mine
BALCO participated in thee-auction for Gare Palma IV/1 coal mine, and as the highest bidder during the auction, it attained preferred bidder status. Per the Coal Mines (Special Provisions) Act, 2015, following the determination of preferred bidder status, the Coal Ministry was to confirm the status based on the Nominated Authority’s recommendation. Based on the Coal Ministry’s recommendation, the Nominated Authority issued an order dated March 20, 2015 stating that BALCO should not be declared the successful bidder in respect of Gare Palma IV/1 Coal Mine since the final price did not reflect fair value. Instead, the Gare Palma IV/1 coal mine was allotted to Coal India Limited on March 23, 2015.
BALCO filed a writ petition before the Delhi High Court challenging the orders dated March 20, 2015 and March 23, 2015, arguing that the price bid by the company was ten times the floor price. The matter was heard on March 27, 2015 from which an interim order was passed stating that any action in respectHowever, BALCO secured a coal linkage of this coal mine will be subject to the outcome3.2 million tons per annum for its 540 MW and 600 MW captive power plant for a term of the Court’s orders and that no equity or vested interest may be claimed by any third party in the mine. In the meantime, Coal India Limited was designated as the custodian of the mine.5 years. On May 25, 2015, the Delhi High Court disposed the petition with a direction to the GoI, and with the GoI’s agreement, to reassess the declaration ofSeptember 30, 2016, BALCO within 4 weeks as unsuccessful bidder even though it was the preferred bidder. By way of a letter dated July 29, 2015, the GoI rejected the representation of BALCO to accepthas withdrawn its bid for the Gare Palma IV/1 coal mine. Thereafter, BALCO filed another writ petition before Delhi High Courtapplication challenging the rejection of the bid and its representation by the GoI, which was heard by the court on May 3, 2016 and orders have been reserved.
Separately, BALCO also filed an impleadment application in another batch of writ petitions filed by the Jindal Steels Private Limited (JSPL) before the Delhi High Court, where JSPL has requested to continue dumping fly ash in its operations of Gare Palma 2n3 block in the coal mine area of Gare Palma IV/1 block. JSPL has a power plant, coal handling plant and washery in the coal block, but its statutory approvals to continue dumping fly ash expired and were not renewed by the GoI. JSPL procured interim orders from the Delhi High Court to continue dumping fly ash in the coal mine area. In its application, BALCO requested to prohibit JSPL from using Gare Palma IV/1 coal block for dumping fly ash as it would interfere in its rights to use the coal mine block in the event that it successfully challenges the rejection of its original bid. This matter is pending before the Delhi High Court and next hearing date is scheduled on August 24, 2016.
Forest development tax levied by the Government of Karnataka
In October 2008, we filed a writ petition in the High Court of Karnataka against the Government of Karnataka and others, challenging the imposition of a forest development tax at a rate of 8.0% (a subsequent demand was made for the payment of tax at the rate of 12.0%) on the value of iron ore sold by us from the mining leases in the forest area, pursuant to the notification by the Government of Karnataka and the memorandum/common order issued by the Deputy Conservator of Forests. In August 2009, the High Court of Karnataka permitted the Government of Karnataka to levy the forest development tax and ordered that the demand be restricted to 50.0% of the forest development tax as an interim arrangement pending disposal of the writ petition.
We filed an application before the High Court of Karnataka, seeking modification of the order in August 2009. However, the application was not taken up for hearing. Subsequently, we filed a special leave petition before the Supreme Court of India against the High Court’s order. In November 2009, the Supreme Court of India ordered the High Court of Karnataka to dispose the application for modification of the order given in August 2009 and ordered us to furnish a bank guarantee towards payment of the forest development tax. In April 2010, we were ordered by the High Court of Karnataka to pay 25.0% of the demand in cash and furnish a bank guarantee for the remaining 25.0%. On January 3, 2016, the High Court of Karnataka passed its final order quashing the forest development tax notification, holding that the rate of forest development tax levied to be 8% and directing a refund of the amounts collected from mining lessees other than state government owned companies. The state government of Karnataka appealed against the order before the Supreme Court of India, and another mining lessee also filed a counter appeal in the matter. The matter is pending before the Supreme Court and next hearing date is scheduled on August 3, 2016. Inin the interim, the Supreme Court has stayed the refund of the forest development tax amount as ordered by the High Court.
Meanwhile, the Government of Karnataka legislated the Forest Development (Amendment) Act, 2016 to validate the earlier law making certain amendments with retroactive effect. The Amendment Act has also changed the nomenclature of “Forest Development Tax” to “Forest Development fee” with retroactive effect, since the court had previously declared that FDT was a tax and not a fee, as claimed by Government of Karnataka. We challenged the validity of the Amendment Act by way of a writ petition before the Karnataka High Court. The Karnataka High Court initially ordered that while the writ petition was pending, no coercive action will be taken fornon-payment of the forest development tax in terms of the Amendment Act. Recently, in a similar matter the Karnataka High Court directed to submit bank guarantees in respect of 25.0% of the demand in relation to future transactions. This order was subsequently modified by the Supreme Court and requiring purchasers to pay 50.0% of the Forest Development fees by cash and the remaining 50% by bank guarantee. The Supreme Court has also directed the Karnataka High Court to hear and dispose the matter within six months from the date of its order dated February 13, 2017.
Demands against HZL by Department of Mines and Geology
The Department of Mines and Geology of the State of Rajasthan issued several show cause notices in August, September and October 2006, aggregating Rs. 3,339 million ($ 50.451.5 million) to HZL, claiming unlawful occupation and unauthorized mining of associated minerals other than zinc and lead at HZL’s Rampura Agucha, Rajpura Dariba and Zawar mines in Rajasthan, during the period from July 1968 to March 2006. In response, HZL filed a writ petition against these show cause notices. In October 2006, the High Court issued an order granting a stay and restrained the Department of Mines and Geology from undertaking any coercive measures to recover the penalty. In January 2007, the High Court issued another order granting the Department of Mines and Geology additional time to file their reply and also ordered the Department of Mines and Geology not to issue any orders canceling the lease. The next date of hearing has not yet been fixed.
Demand against BALCO for electricity duty
In February 2010, weBALCO received a notice from the Chief Electrical Inspector, Government of Chhattisgarh demanding that BALCO to pay Rs. 2,404 million ($ 36.337.1 million) from June 2005 to March 2009, towards electricity duty for the generation of power by BALCO’s 540 MW power plant. The notice alleged that BALCO did not submit the eligibility certificate required for exemption from payment of electricity duty. The said exemption was claimed pursuant to a memorandum of understanding entered with the state government and according to the industrial policy 2001-2006. The state level committee recommended that an eligibility certificate be issued to us that will exempt us from paying duty on electricity. The application was filed before Directorate of Industries for granting us exemption from electricity duty and is currently under review. The amount of duty on electricity payable for the period subsequent to March 31, 2009 until March 31, 20162017 is Rs. 7,5476,241 million ($ 113.996.2 million).
Demand against BALCO for electricity dues for power allocated from Central quota
For the years 1983-84, BALCO as a public sector undertaking was allocated 45 MW of power by the GoI from the Central Quota. Upon disinvestment of BALCO in 2001, the Central Quota of 45 MW power allocated to BALCO was withdrawn on January 12, 2001 as BALCO was no longer a public sector undertaking. Based on representations by BALCO to the GoI, the Ministry of Power on January 13, 2003 passed a specific order restoring Central Quota Power to BALCO on the terms and conditions as existed before withdrawal of power for a period of two years from April 1, 2001 to March 31, 2003. Despite such order, the Chhattisgarh State Power Distribution Company Limited raised an electricity bill for period of September 2002 to November 2002 and unilaterally adjusted an amount of Rs.70.4 million ($ 1.1 million) on December 23, 2010 from the security deposit lying with it.
BALCO challenged this action by filing a writ petition with High Court of Chhattisgarh to declare the order dated December 23, 2010 as illegal and void, since the adjustment has been done without prior notice to the Company notwithstanding that the allotted quota had been restored to BALCO. By way of a letter dated June 19, 2012, the Chhattisgarh State Power Distribution Company Limited demanded Rs.629 million ($ 9.5 million) as outstanding and BALCO was given interim relief of producing solvent security for 50% of the demand. The aforesaid interim order dated July 23, 2012 stands complied. The matter is expected to be listed in due course.
Claim against HZL for environment and health cess by the State of Rajasthan
The Statestate of Rajasthan issued a notification in June 2008 notifying the Rajasthan Environment and Cess Rules, 2008, imposing environment and health cess on major minerals including lead and zinc. HZL and other mine operators resisted this notification and the imposition thereunder before the High Court of Rajasthan on the ground that the imposition of such cess and all matters relating to the environment fall under the competence of the Centralcentral government as opposed to the state government. In October 2011, the High Court of Rajasthan disposed the writ petitions and held the Rajasthan Environment and Cess Rules, 2008 that imposes a levy of cess on mineral as being constitutionally valid. An amount of Rs.150Rs. 150 per metric ton of ore produced would be attracted under the Statutestatute if it is held to be valid. HZL challenged this order by a special leave petition in December 2011 before the Supreme Court of India. The Supreme Court of India issued a notice for stay. Further direction was issued by the Supreme Court on March 23, 2012 not to take any coercive action against HZL for recovery of cess. The matter is still pending and is not yet listed for hearing.
Claims for contributions towards the District Mineral Foundation
The District Mineral Foundation was introduced by the MMDRA Amendment Act, whereby all mining lease holders are required to pay contributions towards the District Mineral Foundation. The contribution amounts were to be percentage of royalties as prescribed by the Central Government and were effective from January 12, 2015. In September 2015, a notification was issued by the Ministry of Mines prescribing the rate for the District Mineral Foundation contribution.
Subsequently, state rules were formulated for Rajasthan with effect from May 2016 and HZL received demand notices for the deposit of contributions to the District Mineral Foundation from January 12, 2015. In its order dated August 8, 2016, the High Court of Rajasthan stayed the demand retroactively for the period under challenge.
On December 16, 2015, the Federation of Indian Mineral Industries also filed a writ petition before the High Court of Delhi, obtaining an order for no coercive action. The writ petition was subsequently transferred to the Supreme Court, wherein the court also allowed individual companies to implead themselves in the matter and HZL also filed an application to implead in the matter. As per the order of the Supreme Court, all matters pending before any of the High Courts will maintain status quo. The next date of hearing in the Supreme Court is August 29, 2017.
In October 2015, another notification was issued by the Ministry of Coal whereby rates were prescribed for certain minerals such as coal and lignite, although an additional provision also required for the application of such rates from the earlier date of the notification or the respective state rules.
Concurrently, Vedanta Limited’s challenges are pending before the High Court of Delhi, whereas BALCO’s challenge is pending before the High Court of Chhattisgarh.
Claim against BALCO for energy development cess
In December 2006, the High Court of Chhattisgarh on a writ filed by BALCO quashed the provisions relating to imposition of energy development cess of Rs. 4,3796,102.9 million ($ 66.194.1 million) on our captive power plants and ordered refund of the cess already collected by the state government. The State of Chhattisgarh filed a special leave petition in the Supreme Court against the order of the High Court. The Supreme Court has issued notice and stayed the refund of the cess already collected pending the disposal of the special leave petition. The matter is expected to be heard in due course.
We received a show cause notice from the Indian tax authorities for not withholding tax on payments made while acquiring a subsidiary
In March 2014, Cairn India Limited received a notice from the Indian Tax Authorities (“Tax Authorities”) alleging failure by Cairn India Limited to withhold tax on the consideration paid to Cairn UK Holdings Limited (“CUHL”) on a transaction which took place in the year2006-07. The said transaction relates to the acquisition of the shares of Cairn India Holdings Limited (“CIHL”), a 100% subsidiary of Cairn India Limited, from CUHL during the financial year 2006-2007 as a part of group reorganization by the then ultimate parent company Cairn Energy Plc. Based upon the retrospective amendment(s) made in the year 2012 by inserting explanation 5 of section 9(1)(i) of the Income Tax Act, 1961, the Tax Authorities videtax authorities by its order dated March 11, 2015, raised a demand of approximately Rs. 204,947.3 million ($ 3,093.53,160.3 million) (comprising tax of approximately Rs.102,473.6Rs. 102,473.6 million ($ 1,546.81,580.2 million) and interest of an equivalent amount) for not withholding tax on the consideration paid to CUHL, for shares of CIHL. The Tax Authoritiestax authorities stated in the said order that a short term capital gain of Rs. 245,035 million ($ 3,698.63,778.5 million) accrued to CUHL on transfer of the shares of CIHL to Cairn India Limited in financial year 2006-2007, on which tax should have been withheld by Cairn India Limited. Cairn India LimitedThe Company understands that a tax demand has also been raised by the Tax Authoritiestax authorities on CUHL with respect to taxability of alleged capital gain earned by CUHL.
In this regard, Vedanta Resources Plc. filed a Noticenotice of Claimclaim against the GoI under theUK-India bilateral investment treaty in order to protect its legal position and shareholder interests. Management was advised that Vedanta Resources Plc. has a good case to defend as per provisions ofUK-India bilateral investment treaty, the benefit of which would ultimately accrue to Cairn India Limited. Further, Cairn India Limited has sought independent advice on this issue and has been advised that there could be no liability on Cairn India Limited for the failure to withhold the taxes in the year2006-07 based on provisions of law prevailing at the time of transaction as the aforesaid retrospective amendment has cast an impossible obligation on Cairn India Limited to deduct tax by having to predict and anticipate that the retrospective amendment will be made by the legislature on a future date. Cairn India Limited has approached the Hon’ble Delhi High Court of Delhi against the said order and also filed an appeal before the Commissioner of Income Tax (Appeals) to defend its position. The next hearing date is scheduled on August 4, 2016.17, 2017.
The Amalgamation andRe-organization Scheme has been challenged by the Indian tax authorities and others
Subsequent to the effectiveness of the Amalgamation andRe-organization Scheme, special leave petitions challenging the orders of the High Court of Bombay at Goa were filed before the Supreme Court of India by the Commissioner of Income Tax, Goa and the Ministry of Corporate Affairs in July 2013 and in April 2014, respectively. Further, a creditor and a shareholder have challenged the Amalgamation andRe-organization Scheme in the High Court of Madras in September 2013. These petitions are pending forNext date of hearing and admission.is scheduled on August 22, 2017.
Arbitration proceedings on issues related to the cost recovery of the Ravva block
We along with other joint operation partners (the “Contractor Parties”) are involved in a dispute against GoI relating to the recovery of contractual costs in terms of calculation of payments that the Contractor Parties were required to make in connection with the Ravva field.
The Ravva production sharing contract obliges the Contractor Parties to pay a proportionate share of ONGC’s exploration, development, production and contract costs in consideration for ONGC’s payment of costs related to construction and other activities it conducted in Ravva prior to the effective date of the Ravva production sharing contract (the‘‘ONGC Carry’’). The question as to how the ONGC Carry was to be recovered and calculated, along with other issues, was submitted to an international arbitration tribunal in August 2002 which rendered a decision on the ONGC Carry in favor of the Contractor Parties whereas four other issues were decided in favor of GoI in October 2004 (the “Partial Award”).
The GoI then proceeded to challenge the ONGC Carry decision before the Malaysian courts, as Kuala Lumpur was the seat of the arbitration. On October 11, 2011, the Federal Court of Malaysia adjudicated the matter and upheld the Partial Award. Per the decision of the arbitral tribunal with regards to Partial Award, the Contractor Parties and the GoI were required to arrive at a quantification of the sums relating to each of the issues under the Partial Award. Also, the arbitral tribunal retained the jurisdiction for determination of any remaining issues in the matter.
Pursuant to the decision of the Federal Court, the Contractor Parties approached the Ministry of Petroleum and Natural Gas (“MoPNG”) to implement the Partial Award while reconciling the statement of accounts as outlined in the Partial Award. GoI failed to implement the Partial Award by way of reconciling accounts as provided in the Partial Award ever since the Federal Court of Malaysia adjudicated in the Contractor Parties’ favor.
However, on July 10, 2014, MoPNG issued a show cause notice alleging that since the Partial Award has not been enforced the profit petroleum share of the GoI has been short-paid. MoPNG threatened to recover that amount from the sale proceeds payable by the oil marketing companies to the Contractor Parties. The Contractor Parties replied to the show cause notice taking various legal contentions. On March 9, 2015, a personal hearing took place between MoPNG and the Contractor Parties whereby the Contractor Parties expressed their concerns against such alleged unilateral recoveries and filed further written submissions on March 12, 2015.
Because the Partial Award did not quantify the sums, the Contractor Parties approached the same arbitral tribunal to pass a final award in the subject matter since the arbitral tribunal had retained the jurisdiction to do so. The arbitral tribunal has beenwas reconstituted and the determination offinal award was passed in Cairn India’s favor in October 2016. Concurrently, on January 20, 2017, the GoI has challenged the final award issub judice before it.in the Malaysian courts. The reconstituted tribunal commenced hearings at the Haguenext hearing is scheduled on February 23, 2015, and the claimants approached the tribunal for interim relief to maintain the status quo against the MoPNG’s show cause notice and alleged unilateral recoveries directly through Ravva crude oil and gas buyers and the tribunal granted the interim-relief on June 26, 2015. The final hearing took place on June 26, 2016, and the parties were ordered to make their submissions, if any with respect to the cost of arbitration proceedings, after which the tribunal will publish the final award.September 15, 2017. While the Company does not believe the GoI will be successful in its challenge, if the arbitral award is reversed and such reversal is binding, we could be liable for approximately US $ 63.9 million (Rs. 4,233.44,143.9 million) plus interest.
Proceedings, notices and enquires initiated by the Central Excise
The Central Excise department of the GoI had issued in July 2010 anex-parte notice for reversal of Cenvat credit of Rs. 3,150 million ($ 47.548.6 million) along with interest of Rs. 88 million ($ 1.31.4 million) for thenon-compliance of Rules 4(5a) and 4(6) of the Cenvat Credit Rules, in respect ofnon-return of job work challans for the period March 1, 2009 to September 30, 2009 within a stipulated time. In addition, it also alleged that we violated the advance license conditions from 2005 to 2009. In 2010, we filed four writ petitions WP No. 8123, 8135, 9744 and 9755 in the High Court of Madras against the Central Excise department. An associated contempt petition was also filed by us. All the above petitions were heard on July 29, 2010 and the High Court of Madras in relation to WP No. 8123 remanded the matter to be heard and determined afresh by a new set of officers of the Central Excise department. The High Court of Madras granted a stay in relation to WP No. 8135 in so far as relates to job work challan matter and until a fresh enquiry was made. Further, the High Court of Madras dismissed WP No. 9744, 9755 and the contempt petition.
The Central Excise department deputed the Assistant Commissioner of Central Excise to conduct an enquiry for the allegednon-compliance of Rules 4(5a) and 4(6) of the Cenvat Credit Rules in respect ofnon-return of job work challans. The Assistant Commissioner of Central Excise served a show cause notice on September 9, 2011. We filed a response before the Assistant Commissioner of Central Excise. After conducting a personal hearing, the Assistant Commissioner passed a favorable order on January 1, 2012 and dropped the entire demand for duty and interest. The department went into appeal before the Commissioner (Appeals) against this order, but the appeal was restricted only to the demand of interest. The Commissioner (Appeals) allowed the appeal on February 25, 2013 on the condition that interest would become applicable only in those cases where goods have not been sent back or cleared from the premises within 180 days from the date of dispatch from the Tuticorin unit. The verification whether any interest is payable or not has been completed and department raised the interest liability of Rs. 2.4 million which we have challenged before Tribunal on April 7, 2015 and the case has yet to be listed for hearing.
We filed two writ appeals no. 704 and 705 of 2011 in the High Court of Madras challenging the orders passed with respect to the writ petitions no. 8135 and 9744 of 2010. The writ petitions were admitted on August 1, 2011 and the Court ordered other party to maintain the status quo. In the meanwhile, the Commissioner of Customs, Tuticorin issued a show cause notice in January, 2015 based on alleged violation of advance license conditions from 2005 to 2009 expressly mentioning that this show cause notice shall be kept pending and not be adjudicated unless and until directions are obtained from the High Court enabling such adjudication. We filed writ petition no. 626 of 2015 against this show cause notice, which was tied up with writ appeals no. 704 and 705 of 2011 and heard together. Thereafter, regular hearings took place in the High Court, and on March 12, 2015 the High Court gave an interim order, allowing one of the prayers in writ in form of injunction to the Directorate General of Foreign Trade actions in pursuit of the show cause notice received from customs department. During the course of the hearings, writ appeal no. 704 was withdrawn as it has become infructuous as it relates to the job work challan matter which has already been concluded. Writ appeal no. 705 of 2011 and writ petition no. 626 of 2015 were heard on March 11, 2016 and we are awaiting forboth were dismissed by the final judgment of the High Court dated August 1, 2016, as the High Court held that it did not find any impediment to customs authorities issuing show cause notice on the basis of materials gathered and input received from excise authorities. The High Court also required the Company to respond to the show cause notice dated January 13, 2015 within two weeks from receipt of the order and directed the Commissioner of Customs to conduct proceedings as expeditiously as possible. We have filed a special leave petition against the High Court’s order before the Supreme Court on August 24, 2016. The stay hearing before the Supreme Court on the special leave petition, took place on April 21, 2017 wherein the Supreme Court held that the commissioner of customs, Tuticorin may pass a final order against the notice but that it had to be kept in sealed cover. To date the matter has reserved orders and yet to be pronounced.listed for final hearing and no order has been passed by the Commissioner of Customs, Tuticorin.
Petitions have been filed in the Rajasthan High Court relating to sales tax
We have filed two writ petitions before the Rajasthan High Court of Rajasthan, seeking to quash the two letters issued by Finance (Tax) department, Jaipur and to set aside the show cause notice issued by the Rajasthan Sales Tax Department, demanding Rajasthan VAT on sales of crude oil alleging that the sales are intra-state sale (as opposed to an inter-state sale). The matter was last heard on May 17, 2016 and the judgement dated July 13, 2016 allowed our petition and held that sale of crude oil should be regarded as interstate sale subject to central states tax and that Rajasthan VAT should not be applicable. Subsequently, the Rajasthan Sales Tax Department has filed an appeal before the division bench of the High Court of Rajasthan on September 9, 2016, challenging the previous order. The matter is scheduled for hearing on August 30, 2017.
Proceedings related to the Imposition of Entry Tax
BALCOVedanta Limited and other group companies challenged the constitutional validity of athe local statutestatutes in Chhattisgarh, Odisha and Rajasthan levying entry tax on the entry of goods brought into the State of Chhattisgarh, IndiaStates from outside and other notifications, as being in violation of certain provisions of the Indian Constitution. BALCO paid the entry tax of Rs. 2,194.7 million ($ 33.133.8 million) under protest to the state government of Chhattisgarh until March 31, 2015. The matter was referred to the Supreme Court of India.
We also challengedWith respect to the challenge against the constitutionality of the Odisha Entry Tax Act. OnAct, on February 18, 2008, the Odisha High Court held that (i) the Odisha entry tax is not compensatory, (ii) there should not be any entry tax on goods coming into Odisha which are not manufactured in Odisha, and (iii) that the Odisha Entry Tax Act is valid. This challenge was with regard to levy of entry tax on indigenous goods. The High Court order was challenged before the Supreme Court of India wherein the court ordered us to pay the entry tax amount towards earlier dues amounting to Rs. 35 million ($ 0.5 million) and amounts accruing from October 2009 on a monthly basis i.e. Rs. 0.8 million per month, until the matter is finally disposed. These amounts have been fully paid under protest.
In a related matter in respect of challenging the levy of entry tax on imported goods, on April 9, 2013 the Supreme Court of India ordered the deposit of 50% of the entry tax amount accrued until September 30, 2012, which amounted to Rs.1,196.2 million ($18.118.4 million). The amounts were paid as per the court order. However, as the entry tax demand was also partially on the SEZ operation, the same was challenged separately before the High Court of Odisha, Cuttack wherein we paid 50 % of the demand under protest as per the court order. The matter is pending adjudication. Meanwhile, the Government of Odisha notified its SEZ Policy 2015 in December 2015, exempting entry tax levy on SEZ operations and we are seeking exemptions relying on the same.
Furthermore, there was a demand of entry tax on March 26, 2012 for Rs. 727 million ($11.2 million) and interest of Rs. 492 million ($7.6 million) for the period from August 2007 to January 2012 on power business of the then SEL. We have paid the amount in accordance with the interim order of Supreme Court of India which was given pursuant to the holding of the Odisha High Court.
We are in compliance with the interim orders passed by the Supreme Court of India on both indigenous and imported goods. The main matter on the issue of levy of entry tax was listed for July 19, 2016 onwards before a nine-judge bench of the Supreme Court of India to take into account the various opinions of the High Courts.
The Supreme Court in its order rejected the compensatory nature of tax as a ground for challenge. The issue pertaining to imported goods is being heard by the regular benches of the Supreme Court. The interim order on domestic goods is to continue for a period of four weeks from the date of order of the respective states and the parties are free to seek relief from the High Courts.
The Supreme Court remanded the issue of discrimination pertaining to indigenous goods, back to the respective High Courts with an order that 50% of the demand be payable. Following the order of the Supreme Court, we filed a writ petition in the High Court of Rajasthan and Odisha. Hindustan Zinc Limited and BALCO have also filed writ petitions in the High Court of Rajasthan and High Court of Chhattisgarh respectively.
Writ petition filed in the Delhi High Court by Cairn India Limited relating to extension of tenure of the Production Sharing Contract for the Rajasthan block
Cairn India Limited filed a writ petition before the High Court of Delhi against the Ministry of Petroleum and Natural Gas (“MoPNG”), the Directorate General of Hydrocarbons (“DGH”) and Oil and Natural Gas Corporation Limited (“ONGC”) regarding the extension of the tenure for the Production Sharing Contract (“PSC”) for theRJ-ON-90/1 Block (“RJ Block”).
The RJ Block PSC is valid until May 14, 2020. Consistent with the terms of the PSC, given that the RJ Block is also producing natural gas, Cairn India Limited has been requesting an extension of the tenure of the RJ Block PSC for a period of up to 10 years, i.e., until May 14, 2030. ONGC, Cairn India Limited’s joint venture partner in the RJ Block, is technically aligned on the recoverable resources potential of the RJ Block beyond the PSC period, until the proposed extension period up to 2030. Cairn India Limited has been making regular requests to the MoPNG for extension of the tenure of the RJ Block PSC since the past few years. However, apart from seeking further technical and financial details, the MoPNG has not yet made a final decision in the matter.
With regards to the MoPNG’s delay, a writ petition was filed by Cairn India Limited on December 11, 2015, seeking relief from the High Court of Delhi. During the Court hearing held on December 14, 2015, the MoPNG and DGH contended that no decision had been taken in the matter as the requisite data had not been provided by Cairn India Limited and ONGC. ONGC further contended that it had sought certain commercial particulars from Cairn India Limited which had not been furnished by Cairn India Limited. Through its order dated December 14, 2015, the High Court of Delhi ordered all parties to exchange the requisite information and documents to enable the GoI to make a decision in the matter. The High Court of Delhi imposed timelines on the parties for the exchange of information, namely the GoI, DGH and ONGC to seek data and information within four weeks, Cairn India Limited to provide the requisite information within two weeks thereafter, ONGC to review and revert with commercial alignment on the projects within six weeks thereon and the GoI to take a decision within three months from the date of consensus between Cairn India Limited and ONGC. Following the December 14, 2015 court order, information has been exchanged between Cairn India Limited and ONCG for obtaining ONGC’s commercial alignment.
Notwithstanding the above, MoPNG’s and ONGC’s stance so far has been that due to insufficient data provided by Cairn India Limited, ONGC has not been able to conclude its commercial assessment. In view of this, the High Court of Delhi through its order dated April 5, 2016, ordered ONGC to give a final opportunity to Cairn India Limited to furnish the requisite documents within 2two weeks from the date of the aforesaid order and thereafter to make a final decision on commercial alignment within an additional 2two weeks, in order to enable the GoI to take its decision in the matter as per the timeline stated in the High Court of Delhi’s order dated December 14, 2015. Pursuant to the High Court of Delhi order, Cairn India Limited and ONGC have continued the information exchange for the purposes of ONGC’s review. On July 28, 2016,March 22, 2017, the Delhi High Court took ONGC’s consentCabinet Committee on Economic Affairs approved a new policy for the granting extensions topre-NELP (New Exploration Licensing Policy) PSCs, including the RJ block PSC. By way of its letter dated April 12, 2017, the Directorate General of Hydrocarbons gave notice of thePre-NELP PSC Extension Policy and specified that Cairn India Limited should apply for an extension on record and directedpursuant to thePre-NELP PSC Extension Policy. The GoI has also filed an affidavit communicating the new extension policy. Cairn India Limited has filed an affidavit challenging applicability of the extension policy. The GoI has sought to file its response by five weeks.a reply to the same. The next date ofmatter is now listed for hearing is scheduled on September 9, 2016.21, 2017.
Writ petition filed in the Delhi High Court by Cairn India Limited relating to export of crude oil from RJ Block
Cairn India Limited has filed a writ petition before the High Court of Delhi against the Directorate General of Foreign Trade (“DGFT”), the Ministry of Petroleum and Natural Gas (“MoPNG”), and Indian Oil Corporation Limited (“IOCL”) for the export of crude oil from the RJ Block.
Due to its nature and composition, RJ Block crude has the potential to be valued higher by refineries in other markets, beyond the prices being received from the GoI nominated buyers, namely IOCL and private refiners Reliance Industries Limited and Essar Oil Limited. Since 2009, Cairn India Limited has been receiving bids from international buyers and refiners offering prices that are an additionalUS$3-4 per bbl more than the domestic sale prices for RJ Block crude.
In accordance with the provisions of the RJ Block PSC and the applicable GoI policies for crude oil export, Cairn India Limited repeatedly requested IOCL and MoPNG to allow it to export RJ Block crude oil, to which there has been no firm response. Cairn India Limited also made written requests to the DGFT to intervene in the matter, which again proved unsuccessful.
In view of the aforesaid, Cairn India Limited filed a writ petition in the High Court of Delhi on December 11, 2015 to obtain relief in the form of orders to the DGFT, MoPNG and IOCL for approvals and authorizations to permit and facilitate the export of RJ Block crude oil, to the extent GoI nominated buyers are unable to cover the entire production. Through its order dated December 14, 2015, the High Court ordered the MoPNG, DGFT and IOCL to obtain necessary instructions on whether the GoI was willing to pick up the entire crude oil production from the RJ Block, or in the alternative was ready to grant permission to Cairn India Limited to directly export the crude oil not covered by the GoI nominees.
The GoI’s stance thus far has been to deny Cairn India Limited’s request for export, although it has yet to present its complete arguments to the High Court of Delhi justifying such denial. Relying on the lack of consent from the GoI, DGFT also rejected Cairn’sCairn India Limited’s request for export permission on February 16, 2016. During the course of arguments, the High Court of Delhi disagreed with GOI’sGoI’s observations on the construct of Article 18 and observed that there was no embargo on export in the PSC nor in the policy. TheOn October 18, 2016, the High Court set aside the writ petition on the grounds of it being without merits. Cairn India Limited has filed an appeal against the High Court order and the matter been scheduled for conclusion of arguments and is expected to be listed on August 10, 2016.
Suit filed against Cairn India Limited and Vedanta Limited before the High Court of Bombay by a minority shareholder
On December 1, 2015, Mr. Rajotavo Dasgupta, a minority shareholder of Cairn India Limited, filed a suit in the High Court of Bombay against Cairn India Limited, its directors, Vedanta, its various subsidiaries along with their respective directors and other senior officers. In the suit, Mr. Dasgupta has questioned the legality and validity of an inter-corporate loan provided by Cairn India Holdings Limited (“CIHL”), a Jersey based wholly owned subsidiary of Cairn, to THL Zinc Limited (“TZL”), a Mauritius based subsidiary company of Vedanta Limited.
Mr. Dasgupta alleged that Cairn India Limited, its directors and promoters by way of an elaborate scheme diverted Cairn India Limited’s assets, amounting to US$ 1.3 billion to repay a loan taken by Twin Star Mauritius Holdings Limited, a subsidiary company of Vedanta, to purchase the shares of Cairn India Limited in 2011. It was therefore alleged that Cairn India Limited, by providing the inter-corporate loan, effectively extended financial assistance for the purpose of purchasing its own shares in violation of Section 67 of the Indian Companies Act, 2013.
Pursuant to the filing of the suit and the notice of motion to restrain Cairn India Limited and Vedanta Limited from (as part of the interim relief sought) : (i) pursuing the scheme of the proposed merger between Cairn India Limited and Vedanta Limited; (ii) change of the terms of the inter-corporate loan given by CIHL to TZL; (iii) recovery of the inter-corporate loan along with interest from Vedanta Limited and its subsidiaries; and (iv) repayment of the Cairn India Limited acquisition debt by Vedanta Limited and its subsidiaries to the creditors. Cairn India Limited and the other defendants in the matter have filed their replies through affidavits. No final order has been passed by the High Court of Bombay on the matter as of date. On July 20, 2016, the shareholder sought leave to withdraw the suit and the notice of motion which was allowed by the High Court of Bombay on July 21, 2016. The matter stands withdrawn.22, 2017.
Legal actions by Indian Income tax Authorities for additional income tax
Income tax returns submitted by companies are subject to a comprehensive review and challenge by the tax authorities. There are appellate procedures available to both the tax authorities and taxpayers and it is not uncommon for significant or complex matters in dispute to remain outstanding for several years before they are finally resolved by the High Court or the Supreme Court of India. There are certain income tax legal proceedings which are pending against us. Potential liabilities, if any have been adequately provided for and we do not currently estimate any material incremental tax liability in respect of these matters. The Company and certain of its operating subsidiaries have been issued demands by the income tax authorities, principally in respect of tax holidays and disallowances of expenditures relating to exempt income, amounting to Rs. 31,61737,405 million and Rs. 37,40563,348 million ($ 564.6976.7 million) as at March 31, 20152016 and March 31, 2016,2017, respectively.
Legal actions by third parties, Indian sales tax, excise and related tax authorities for additional sales tax, excise and indirect duties
CertainThe Group is subject to various claims and exposures which arise in the ordinary course of our operating subsidiaries have been named as parties to legal actions by third party claimants,conducting and byfinancing its business from the Indian sales tax, excise, and relatedindirect tax authorities for additional sales tax, electricity cess, excise and indirect duties.others. These claims primarilyand exposures mostly relate either to the assessable values of sales and purchases or to incomplete documentation supporting the subsidiaries’ tax returns. Ascompanies’ returns or other claims.
The approximate total value of March 31, 2015 and 2016,claims against the total claim related to these liabilitiesGroup companies is Rs. 21,661₹ 70,889 million and Rs. 24,216₹ 83,339 million ($ 365.51,285.1 million) respectively. We have evaluated these contingencies and estimated that some of these claims are probable of resulting in a loss and hence has recorded Rs. 283 million and Rs. 173 million ($ 2.6 million) as current liabilities as of March 31, 2015 and 2016 respectively.
The claims by third party claimants amounted to Rs. 46,694 million and Rs. 46,673 million ($ 704.5 million) as of March 31, 2015 and 2016 respectively. The Group has evaluated these contingencies and estimated that some of these claims are probable of resulting in a loss and hence has recorded Rs. 7,441 million and Rs. 2,519 million ($ 38.0 million) as current liabilities as at March 31, 20152016 and 2016March 31, 2017 respectively.
Dividend Policy
Under Indian law, a company declares dividends (including interim dividends) upon a recommendation by its board of directors and approval by a majority of the shareholders at the annual general meeting of shareholders held within six months of the end of each fiscal year. However, while final dividends can be paid out by a company only after such dividends have been recommended by the board of directors and approved by shareholders, interim dividends can be paid out with only a recommendation by the board of directors, though such action is subject to subsequent sanction by the shareholders at the annual general meeting held within six months from the end of the fiscal year. The shareholders have the right to decrease but not to increase the dividend amount recommended by the board of directors.
Under the Companies Act 2013, dividends in respect of a fiscal year may be paid out of the profits of a company in that fiscal year or out of the undistributed profits of previous fiscal years or both, after providing for depreciation in the manner provided for in the Companies Act, 2013. The Companies Act, 2013 and the Companies (Declaration and Payment of Dividend) Rules, 2015 provide that in the event of adequacy or absence of profits in any year, a company may declare dividends out of its free reserves subject to the following conditions:
If profits for that year are insufficient to declare dividends (including interim dividends), the dividends for that year may be declared and paid out from accumulated profits on the following conditions:
The Company may, before the declaration of any dividend in any financial year, transfer such percentage of its profits for that financial year as it may consider appropriate to the reserves of the Company.
Dividends (including interim dividends) must be paid within 30 days from the date of the declaration and any dividend which remains unpaid or unclaimed after that period must be transferred within seven days from the date of expiry of the said period of thirty (30) days to a special unpaid dividend account held at a scheduled bank. We must transfer any money which remains unpaid or unclaimed for seven years from the date of such transfer to the Investor Education and Protection Fund established by the GoI.
The tax rates imposed on us in respect of dividends paid in prior periods have varied. According to the Finance Act, 2014, dividend distribution tax is to be levied on gross distributable surplus amount instead of amount paid net of taxes. This resulted in an increase in the dividend distribution tax to more than 20% from 16.995% from October 2014. The Finance Act 2015 increased the surcharge from 10% to 12%, and the applicable tax rate for fiscal year 2016 was 20.358%. Further, the Finance Act 2016 provided that any income earned by an individual, Hindu Undivided Family (HUF) or a firm, who is a resident in India, by way of dividend declared, distributed or paid by any domestic company in excess of Rs.1,000,000 in aggregate shall be chargeable to tax at the rate of 10% on a gross basis on such amount exceeding Rs.1,000,000. Under Section 115 O (1A) of the Finance Act, 2009, effective April 1, 2009, an Indian company, subject to certain conditions, can set off the dividend income received from its subsidiaries against the amount of dividend income declared by it to its shareholders, thereby reducing the dividend distribution tax to the extent of suchset-off.
Future dividends will depend on our revenue, cash flows, financial condition (including capital position) and other factors. ADS holders will be entitled to receive dividends payable in respect of the equity shares represented by the ADSs. Cash dividends in respect of the equity shares represented by the ADSs will be paid to the depositary in Indian Rupees and, except as otherwise described under the deposit agreement governing the issuance of our ADSs, will be converted by the depositary into US dollars. The depositary will distribute these proceeds to ADS holders. The equity shares represented by the ADSs will rank equally with all other equity shares in respect of dividends. ADS holders will bear all of the currency exchange rate risk of the conversion of any dividends from Indian Rupees to US dollars, and a decline in the value of the Indian Rupee as compared to the US dollar would reduce the US dollar value of any dividends we pay that are received by ADS holders.
The Company’s Board of Directors approved the Dividend Distribution Policy for the Company at its meeting held on May 15, 2017. The Board of Directors shall recommend dividends in compliance with this policy, the provisions of the Companies Act, 2013 and Rules made thereunder and other applicable legal provisions.
1. Dividend Payout
In every financial year, the Company aims to distribute to its equity shareholders:
| i. | The entire dividend income (net of taxes) it receives from its subsidiary, Hindustan Zinc Limited. (this does not apply to anyone-time special dividends received from Hindustan Zinc Ltd. which will be at the discretion of the Board); and |
| ii. | Minimum 30% (including taxes, cess, and levies, if any relating to the dividend) of attributable profit after tax (before exceptional items) of the Company excluding its share of profits in Hindustan Zinc Limited for the year. Such profits will be net of dividend payout to preference shareholders, if any. |
2. While considering a dividend, the following financial parameters, and internal and external factors shall also be evaluated by the Board:
While considering a dividend, the following financial parameters, and internal and external factors shall also be evaluated by the Board:
3. Circumstances under which the shareholders of the Company may or may not expect dividends:
Generally, it would be the Company’s policy to pay dividends in the manner specified above. However, the Board may not approve a dividend in certain situations such as:
4. How retained earnings shall be utilized:
The retained earnings may be utilized either for business purposes mentioned in its Memorandum and Articles of Association or shall be distributed to the equity shareholders.
5. Adoption of parameters for dividend payouts with respect to various classes of shares:
6. Review of Policy
This policy will be reviewed periodically by the Board and if revised, the Company will announce such changes. This Policy will come into effect from fiscal 2018.
B. Significant Changes
Merger with Cairn India Limited
On June 14, 2015, Vedanta Limited and Cairn India Limited announced a merger through a Scheme of Arrangement under the Indian law. On completion, minority shareholders of Cairn India Limited willwere to receive for each equity share held one equity share in Vedanta Limited of face value Re.Rs. 1 each and one 7.5% Redeemable Preference Share in Vedanta Limited with a face value of Rs. 10 each. No shares willwere to be issued to Vedanta Limited or any of its subsidiaries for their shareholding in Cairn India Limited.
On September 10, 2015, BSE Limited and the National Stock Exchange of India Limited issued the ‘No adverse observation’ letter to the Scheme of arrangement.Cairn India Merger. Thereafter on July 22, 2016, Vedanta Limited and Cairn India Limited announced the revised terms to the recommended merger between Vedanta Limited and Cairn India Limited. As per the revised terms, on completion, non-controlling shareholders of
The Cairn India will receive for each equity share held one equity share in Vedanta Limited of face value Re. 1 each and four 7.5% Redeemable Preference Shares in Vedanta Limited with a face value of Rs. 10 each. No shares will be issued to Vedanta Limited or any of its subsidiaries for their shareholding in Cairn India. The transaction is conditionalMerger was made operative on Vedanta Limited, Cairn India and Vedanta plc shareholder approvals, as well as Indian High Court, and other customary approvals. Vedanta Limited will continue to be listed on the BSE and NSE, with ADSs listed on the NYSE. The merger remains strategically important for simplificationApril 11, 2017. Significant effects of the group structure.merger were as follows:
| i. | Public shareholders of Cairn India Limited received for each equity share held by them in Cairn India Limited on the record date of April 27, 2017, one equity share of face value of Rs. 1 each and four 7.5%Non-ConvertibleNon-Cumulative Redeemable Preference Shares in the Company of Rs.10 each. |
| ii. | Further, the Cairn India Limited shareholders, who became shareholders of the Company, also received the second interim dividend of Rs. 17.70 per equity share. |
| iii. | The equity listed capital of the Company increased from Rs. 2,964,694,239 (2,964,694,239 shares of Rs. 1 each) to Rs. 3,717,194,239 (3,717,194,239 shares of Rs, 1 each). |
| iv. | The Promoters of Company remained unchanged, but the overall stake of the Promoters in the Company decreased from 62.86% to 50.13%. |
| v. | The preference share capital has increased from NIL to Rs. 30,100,000,000 (3,010,000,000 shares of Rs. 10 each). |
| vi. | The Company’s authorized share capital including equity and preference shares, increased from 51,620,100,000 to 74,120,100,000. |
| ITEM 9. | THE OFFER AND LISTING |
A. Offer and Listing Details
The ADSs of SIIL evidenced by American Depositary Receipts, or ADRs, commenced trading on the NYSE on June 20, 2007 at an initial offering price of $13.44 per ADS. The ADRs evidencing ADSs were issued by our Depositary, Citibank, N.A., pursuant to a deposit agreement. Our ADSs evidenced by ADRs, commenced trading on the NYSE, on September 9, 2013 at a price of $ 10.25 per ADS, after theRe-organization Transactions became effective on August 17, 2013.
In July 2009, in connection with the offering of ADSs, each representing one equity share of par value Rs.2, SIIL issued 131,906,011 new equity shares in the form of ADSs, at a price of $ 12.15 per ADS, aggregating approximately $ 1,602.7 million. Out of 131,906,011 equity shares, 41,152,263 equity shares were issued to Twin Star, which is a wholly-owned subsidiary of Vedanta.
As of March 31, 2016, 2,964,694,2392017, 2,965,004,871 of our equity shares were outstanding (including the 228,184,620217,019,900 equity shares underlying our 57,046,155ADSs54,254,975 ADSs outstanding as of such date) after giving effect to the bonus issue and share split.split which includes 310,632 equity shares pending allotment as they are under dispute. All our equity shares are registered shares.
We have entered into listing agreements with the NSENational Stock Exchange (NSE) and the BSEBombay Stock Exchange (BSE) (which were effective until November 30, 2015) and a Uniform Listing Agreement with the NSE and the BSE pursuant to the Securities and Exchange Board of India (Listing Obligations and Disclosure Requirements) Regulations, 2015 effective December 1, 2015, pursuant to which we are required to comply with certain regulations in addition to the requirements under the Companies Act 2013. Our outstanding equity shares are currently listed and traded on the NSE and BSE. The equity shares of SIIL were previously listed on the Calcutta Stock Exchange Association Limited and were voluntarily delisted on May 9, 2008. For information regarding conditions in the Indian securities markets, see “Item 3. Key Information – D. Risk Factors – Risks Relating to Investments in Indian Companies, Global Economic Conditions and International Operations.”
The following table shows:
| NYSE Price Per ADS | Average NYSE Daily ADS Share Trading | NSE Price Per Equity | Average NSE Daily Equity Share Trading | BSE Price Per Equity | Average BSE Daily Equity Share Trading | NYSE Price Per ADS | Average NYSE Daily ADS Share Trading | NSE Price Per Equity Share | Average NSE Daily Equity Share Trading | BSE Price Per Equity Share | Average BSE Daily Equity Share Trading | |||||||||||||||||||||||||||||||||||||||||||||||||||||||||||||
Fiscal Year | High ($) | Low ($) | Volume | High ($) | Low ($) | Volume | High ($) | Low ($) | Volume | High ($) | Low ($) | Volume | High ($) | Low ($) | Volume | High ($) | Low ($) | Volume | ||||||||||||||||||||||||||||||||||||||||||||||||||||||
2012 | 16.60 | 6.64 | 1,161,246 | 4.28 | 1.64 | 6,479,436 | 4.27 | 1.63 | 994,973 | |||||||||||||||||||||||||||||||||||||||||||||||||||||||||||||||
2013 | 9.06 | 6.42 | 642,788 | 2.26 | 1.59 | 6,169,332 | 2.26 | 1.63 | 664,307 | 9.06 | 6.42 | 642,788 | 2.26 | 1.59 | 6,169,332 | 2.26 | 1.63 | 664,307 | ||||||||||||||||||||||||||||||||||||||||||||||||||||||
2014(1) | 13.59 | 4.76 | 537,824 | 3.56 | 1.17 | 6,757,850 | 3.55 | 1.17 | 947,611 | |||||||||||||||||||||||||||||||||||||||||||||||||||||||||||||||
2014(1) | 13.59 | 4.76 | 537,824 | 3.56 | 1.17 | 6,757,850 | 3.55 | 1.17 | 947,611 | |||||||||||||||||||||||||||||||||||||||||||||||||||||||||||||||
2015 | 21.36 | 11.43 | 197,421 | 5.11 | 2.86 | 6,112,054 | 5.11 | 2.86 | 778,407 | 21.36 | 11.43 | 197,421 | 5.11 | 2.86 | 6,112,054 | 5.11 | 2.86 | 778,407 | ||||||||||||||||||||||||||||||||||||||||||||||||||||||
2016 | 14.43 | 3.52 | 226,508 | 3.52 | 0.88 | 12,085,613 | 3.52 | 0.88 | 1,483,779 | 14.43 | 3.52 | 226,508 | 3.52 | 0.88 | 12,085,613 | 3.52 | 0.88 | 1,483,779 | ||||||||||||||||||||||||||||||||||||||||||||||||||||||
2015 | ||||||||||||||||||||||||||||||||||||||||||||||||||||||||||||||||||||||||
1st Quarter | 21.36 | 11.71 | 285,556 | 5.30 | 2.96 | 9,494,590 | 5.30 | 2.96 | 1,422,298 | |||||||||||||||||||||||||||||||||||||||||||||||||||||||||||||||
2nd Quarter | 20.86 | 17.21 | 162,256 | 5.11 | 4.30 | 5,728,458 | 5.09 | 4.30 | 655,298 | |||||||||||||||||||||||||||||||||||||||||||||||||||||||||||||||
3rd Quarter | 17.46 | 11.43 | 192,198 | 4.38 | 3.02 | 4,793,720 | 4.39 | 3.03 | 488,441 | |||||||||||||||||||||||||||||||||||||||||||||||||||||||||||||||
4th Quarter | 14.38 | 11.79 | 149,562 | 3.62 | 2.95 | 4,461,696 | 3.61 | 2.95 | 547,922 | |||||||||||||||||||||||||||||||||||||||||||||||||||||||||||||||
2017 | 17.34 | 5.00 | 255,136 | 4.29 | 1.31 | 13,400,496 | 4.29 | 1.31 | 1,289,988 | |||||||||||||||||||||||||||||||||||||||||||||||||||||||||||||||
2016 | ||||||||||||||||||||||||||||||||||||||||||||||||||||||||||||||||||||||||
1st Quarter | 14.43 | 10.63 | 180,191 | 3.67 | 2.67 | 4,932,104 | 3.67 | 2.67 | 479,437 | |||||||||||||||||||||||||||||||||||||||||||||||||||||||||||||||
2nd Quarter | 11.01 | 4.59 | 219,576 | 2.71 | 1.17 | 8,293,535 | 2.71 | 1.17 | 930,878 | |||||||||||||||||||||||||||||||||||||||||||||||||||||||||||||||
3rd Quarter | 7.06 | 4.77 | 260,412 | 1.80 | 1.23 | 12,925,332 | 1.75 | 1.23 | 1,599,676 | |||||||||||||||||||||||||||||||||||||||||||||||||||||||||||||||
4th Quarter | 5.72 | 3.52 | 245,436 | 1.48 | 0.88 | 22,377,976 | 1.48 | 0.88 | 2,952,316 | |||||||||||||||||||||||||||||||||||||||||||||||||||||||||||||||
2017 | ||||||||||||||||||||||||||||||||||||||||||||||||||||||||||||||||||||||||
1st Quarter | 7.88 | 5.00 | 181,096 | 1.97 | 1.26 | 16,364,315 | 1.97 | 1.26 | 1,723,696 | |||||||||||||||||||||||||||||||||||||||||||||||||||||||||||||||
1st Quarter | 7.88 | 5.00 | 181,096 | 1.97 | 1.26 | 16,364,315 | 1.97 | 1.26 | 1,723,696 | |||||||||||||||||||||||||||||||||||||||||||||||||||||||||||||||
2nd Quarter | 10.59 | 7.78 | 198,747 | 2.72 | 1.99 | 13,760,158 | 2.71 | 1.98 | 1,424,610 | |||||||||||||||||||||||||||||||||||||||||||||||||||||||||||||||
3rd Quarter | 14.40 | 10.57 | 319,657 | 3.66 | 2.55 | 12,999,902 | 3.66 | 2.55 | 1,142,668 | |||||||||||||||||||||||||||||||||||||||||||||||||||||||||||||||
4th Quarter | 17.34 | 12.60 | 325,404 | 4.29 | 3.31 | 10,477,609 | 4.29 | 3.31 | 871,354 | |||||||||||||||||||||||||||||||||||||||||||||||||||||||||||||||
2018 | ||||||||||||||||||||||||||||||||||||||||||||||||||||||||||||||||||||||||
1st Quarter | 17.19 | 13.78 | 511,800 | 4.29 | 3.37 | 12,887,198 | 4.30 | 3.37 | 1,147,010 | |||||||||||||||||||||||||||||||||||||||||||||||||||||||||||||||
Last Six Months | ||||||||||||||||||||||||||||||||||||||||||||||||||||||||||||||||||||||||
January 2016 | 5.70 | 3.65 | 276,309 | 1.38 | 0.91 | 20,587,808 | 1.38 | 0.92 | 2,853,345 | |||||||||||||||||||||||||||||||||||||||||||||||||||||||||||||||
February 2016 | 4.40 | 3.52 | 245,403 | 1.14 | 0.85 | 22,597,023 | 1.14 | 0.85 | 3,158,491 | |||||||||||||||||||||||||||||||||||||||||||||||||||||||||||||||
March 2016 | 5.72 | 4.34 | 217,278 | 1.48 | 1.07 | 23,938,143 | 1.48 | 1.07 | 2,834,805 | |||||||||||||||||||||||||||||||||||||||||||||||||||||||||||||||
April 2016 | 6.56 | 5.00 | 136,021 | 1.64 | 1.28 | 18,440,615 | 1.64 | 1.28 | 1,940,663 | |||||||||||||||||||||||||||||||||||||||||||||||||||||||||||||||
May 2016 | 6.87 | 5.47 | 172,359 | 1.70 | 1.40 | 16,326,897 | 1.70 | 1.40 | 1,639,738 | |||||||||||||||||||||||||||||||||||||||||||||||||||||||||||||||
June 2016 | 7.88 | 6.08 | 232,859 | 1.97 | 1.53 | 14,702,941 | 1.97 | 1.53 | 1,630,135 | |||||||||||||||||||||||||||||||||||||||||||||||||||||||||||||||
July 2016 (through July 15, 2016) | 9.92 | 7.78 | 283,998 | 2.61 | 1.97 | 20,629,602 | 2.60 | 1.97 | 2,338,486 | |||||||||||||||||||||||||||||||||||||||||||||||||||||||||||||||
January 2017 | 15.17 | 12.60 | 231,606 | 3.88 | 3.18 | 9,424,273 | 3.88 | 3.18 | 770,776 | |||||||||||||||||||||||||||||||||||||||||||||||||||||||||||||||
February 2017 | 15.89 | 14.62 | 286,482 | 4.12 | 3.64 | 10,447,974 | 4.12 | 3.65 | 854,762 | |||||||||||||||||||||||||||||||||||||||||||||||||||||||||||||||
March 2017 | 17.34 | 14.59 | 439,120 | 4.29 | 3.81 | 11,563,707 | 4.29 | 3.82 | 981,691 | |||||||||||||||||||||||||||||||||||||||||||||||||||||||||||||||
April 2017 | 17.19 | 14.22 | 386,890 | 4.32 | 3.52 | 12,575,843 | 4.33 | 3.53 | 1,155,646 | |||||||||||||||||||||||||||||||||||||||||||||||||||||||||||||||
May 2017 | 15.78 | 13.78 | 672,153 | 3.85 | 3.38 | 14,703,964 | 3.85 | 3.38 | 1,325,242 | |||||||||||||||||||||||||||||||||||||||||||||||||||||||||||||||
June 2017 | 15.60 | 14.24 | 459,325 | 3.91 | 3.51 | 11,250,795 | 3.91 | 3.51 | 952,889 | |||||||||||||||||||||||||||||||||||||||||||||||||||||||||||||||
July 2017 (through July 28, 2017) | 17.72 | 15.60 | 394,166 | 4.43 | 3.91 | 9,292,589 | 4.42 | 3.90 | 789,816 | |||||||||||||||||||||||||||||||||||||||||||||||||||||||||||||||
Notes:
| (1) | The first trading day on the NYSE was September 9, 2013 and on the BSE and the NSE was August 27, 2013 since theRe-organization Transactions became effective. Since this date, the information relating to the high and low market prices and the average daily trading volumes of the ADSs and the shares are of Vedanta Limited. |
B. Plan of Distribution
Not applicable
C. Markets
Our ADSs are listed on the NYSE under the symbol VEDL. Our equity shares are listed on the NSE with stock code VEDL and on the BSE with stock code 500295. Prior to the change of name to Vedanta Limited, the ADSs were listed on the NYSE under the symbol “SSLT” and equity shares were listed on the NSE with stock code SSLT/EQ and on the BSE with stock code 500295.
D. Selling Shareholders
Not applicable
E. Dilution
Not applicable
F. Expenses of the Issue
Not applicable
| ITEM 10. | ADDITIONAL INFORMATION |
A. Share Capital
Not applicable
B. Memorandum and Articles of Association
General
Our Company identification number is L13209GA1965PLC000044.L13209MH1965PLC291394. Our registered office is presently situated at Sesa Ghor, 20, EDC Complex, Patto, Panaji, Goa 403001,1st Floor, C Wing, Unit 103, Corporate Avenue, Atul Projects, Chakala, Andheri (East), Mumbai 400093, Maharashtra, India. The register of members is maintained at the registered office of the Company, office of the registrar and share transfer agent, Karvy Computer Share Private Limited in Hyderabad.
The legal framework governing companies in India is now subject to the Companies Act, 2013, which replaces some of the provisions of the Companies Act, 1956. The sections of the Companies Act, 2013 are being notified in a phased manner. While some provisions of the Companies Act, 2013 have been notified as law, other provisions of the Companies Act, 2013 are yet to be notified as effective by the GoI. Pending notification of the Companies Act, 2013 in its entirety, certain provisions of the Companies Act, 1956, which have not ceased to be effective by enactment of the corresponding provisions of the Companies Act, 2013 continue to be effective, along with the notified provisions of the Companies Act, 2013. Accordingly, the legal framework governing us is the Companies Act, 1956 read with the notified sections of the Companies Act, 2013, as amended (the “Indian Companies Act”).
Our activities are regulated by our Memorandum and Articles of Association. Our current Memorandum and Articles of Association were amended following the enactment of Companies Act, 2013. In addition to our Memorandum and Articles of Association, our activities are regulated by certain legislation, including the Indian Companies Act, the Securities Contract Regulation Act and the Securities Contracts (Regulation) Rules, 1957, as amended.
Our Memorandum of Association permits us to engage in a wide variety of activities, including all of the activities that we are currently engaged in or intend to be engaged in, as well as other activities that we currently have no intention of engaging in. Our objects are set out at clause 3 of our Memorandum of Association. Pursuant to the National Company Law Tribunal, Mumbai bench order dated March 23, 2017, the main objects clause of our Memorandum of Association has been amended to include the objects as required for the purpose of carrying on the business activities of Cairn India. Below listed are the amended clauses:
Share Capital
OurPrior to the Cairn India Merger, our authorized share capital iswas Rs.51,270 million divided into 51,270 million equity shares of par value Re.Rs. 1 per equity share. After giving effect to the Cairn India Merger, our authorized share capital changed to Rs. 44,020 million divided into 44,020 million equity shares of par value Rs. 1 per equity share. As of March 31, 20162017 our issued share capital was Rs. 2,965.0 million, divided into 2,965,004,871 equity shares of par value Re.Rs. 1 per equity share. 310,632 equity shares of our total issued capital has not bebeen issued and allotted by us as they are under dispute. In April 2017, pursuant to the Cairn India Merger, equity shares totaling Rs. 752.5 million were issued to thenon-controlling shareholders of Cairn India Limited. After issuance of equity shares to thenon-controlling shareholders of Cairn India Limited, our issued share capital changed to Rs. 3,717.5 million, divided into 3,717,194,239 equity shares of par value Rs. 1 per equity share which does not include 310,632 equity shares of our total issued capital pending allotment by us as they are under dispute.
As of March 31, 2016, 2,964,694,2392017, 2,965,004,871 equity shares, par value Re.Rs. 1 per equity share, were issued and outstanding (including 310,632 equity shares which have been issued but pending allotment), of which 228,184,620217,019,900 equity shares were held in the form of 57,046,15554,254,975 ADSs. Each ADS represents four equity shares.
Changes in Capital or our Memorandum of Association and Articles of Association
Subject to the Indian Companies Act and our Articles of Association, we may, by passing an ordinary resolution or a special resolution, as applicable, at a general meeting or through postal ballot:
Under our Articles of Association and pursuant to the applicable provisions of the Indian Companies Act, the shares (including any shares forming part of any increased share capital of the company) shall be under the control of the Board of directors of the company, who may allot or otherwise dispose of the same to such persons in such proportion, on such terms and conditions and at such times as the directors think fit and subject to the sanctions of the shareholder in general meeting with full power, to give any person the option to call for or be allotted shares of any class of the company either (subject to the provisions of Section 52 and 53 of the Companies Act, 2013) at a premium or at a par such option being exercisable for such time and for such consideration as the directors thinks fit.
Directors
Under our Articles of Association there is no provision for a director to hold any qualification shares. According to the Indian Companies Act, the age limit for retirement of whole time directors is 70 years. There is no age limit requirement for the retirement ofnon-executive directors.
Any director who is directly or indirectly interested in a contract or arrangement or proposed contract or arrangement entered into or to be entered into by us or on our behalf is required to disclose the nature of his interest at a meeting of the Board and such interested director shall not participate in any discussion of, or vote on, any contract, arrangement or proposal in which he is interested. In addition, we are prohibited from making loans, directly or indirectly, or providing any guarantee or security, directly or indirectly, in connection with any loans made by a third party, to our directors.directors or any other concern where directors are interested. A director is required to disclose his personal interest to the board of directors on an annual basis and at the first meeting of the board of directors after the interest arises.
Alteration of Shareholder Rights
Pursuant to Section 48 of the Companies Act, 2013, and subject to the provisions of the articles of association of a company and the relevant rules as issued by the Ministry of Corporate Affairs, where the share capital of a company is divided into different classes of shares, the rights of any class of shareholders can only be altered or varied with the consent in writing of the holders of not less than three-fourths of the issued shares of that class or by a special resolution passed at a separate meeting of the holders of the issued shares of that class, or pursuant to a judicial order sanctioning a compromise or arrangement between the company and such class of shareholders.
General Meetings of Shareholders
There are two types of general meetings of shareholders, an annual general meeting and an extraordinary general meeting. We must convene our annual general meeting within 9 months from the date of closing of the first financial year of the Company and in any other case within a period of 6 months from the date of closing of the financial year and must ensure that the intervening period between two annual general meetings does not exceed 15 months. The Registrar of Companies may extend this period in special circumstances at our request. Extraordinary general meetings may be convened at any time by our directors at their discretion or at the request of our shareholders holding in the aggregate not less than 10.0% of ourpaid-up capital as on that date which carries voting rights. A notice in writing or through electronic mode to convene a general meeting must set out the date, time, place and agenda of the meeting and must be provided to shareholders at least 21 days prior to the date of the proposed meeting. The requirement of the 21 days’ notice in writing may be waived if consent to shorter notice in writing or electronic mode is received from not less than 95.0% of the members entitled to vote at such meeting. Under the Indian Companies Act, general meetings are to be held either at the registered office or at another place within the city, town or village in which the registered office is situated. Business may be transacted at a general meeting only when a quorum of shareholders is present. Thirty members personally present, entitled to attend and to vote on the business to be transacted, will constitute a quorum.
The annual general meetings deal with and dispose of all matters prescribed by our Articles of Association and by the Indian Companies Act, including the following ordinary business matters:
Division of Shares
The Indian Companies Act provides that a company maysub-divide its share capital if its Articles of Association authorize the company to do so by adopting an ordinary resolution in its general meeting.
Our Articles of Association allow us in a general meeting to alter our Memorandum of Association and subdivide all or any of our equity shares into a larger number of shares with a smaller par value than originally fixed by the Memorandum of Association.
Dividends
Under the Indian Companies Act, unless the board of directors recommends the payment of a dividend, the shareholders at a general meeting have no power to declare any dividend. The board of directors may also declare interim dividends that do not need to be approved by the shareholders. A company pays dividends recommended by the board of directors and approved by a majority of the shareholders at the annual general meeting of shareholders held within 6 months of the end of each fiscal year. The shareholders have the right to decrease but not increase the dividend amount recommended by the board of directors. Listed companies are required to declare and disclose the dividends paid on a per share basis only. The dividend recommended by the board of directors and approved by the shareholders at a general meeting is distributed and paid to shareholders in proportion to the paid up value of their equity shares. The Indian Companies Act provides that shares of a company of the same class must receive equal dividend treatment. Dividends can be paid in cash or by cheque or in any electronic mode to the registered shareholder at a record date fixed on or prior to the annual general meeting or to his order or his banker’s order. No shareholder is entitled to a dividend while any lien in respect of unpaid calls on any of such shareholder’s shares is outstanding.
These distributions and payments are required to be paid to shareholders within 30 days of the annual general meeting where the resolution for declaration of dividends is approved. The dividend so declared is required to be deposited in a separate bank account within a period of 5 days from the date of declaration of such dividend. All dividends unpaid or unclaimed within a period of 30 days from the date of declaration of such dividend must be transferred within seven days of the end of such period to a special unpaid dividend account held at a scheduled bank. The company shall, within a period of 90 days of making any transfer of an amount to the unpaid dividend account, prepare a statement containing the names, their last known addresses and the unpaid dividend to be paid to each person and place it on the website of the company and also on any other website approved by the Central Government for this purpose. Any dividend which remains unpaid or unclaimed for a period of seven years from the date of the transfer to an unpaid dividend account must be transferred along with interest accrued to the Investor Education and Protection Fund along with a statement containing such details. Also, all shares in respect of which unpaid or unclaimed dividends have been transferred shall also be transferred by the company in the name of this fund along with a statement containing such details as may be prescribed.
Under the Companies Act 2013, dividends in respect of a fiscal year may be paid out of the profits of a company in that fiscal year or out of the undistributed profits of previous fiscal years or both, after providing for depreciation in a manner provided for in the Companies Act, 2013. The Companies Act, 2013 and the Companies (Declaration and Payment of Dividend) Rules, 2015 provide that in an event of adequacy or absence of profits in any year, a company may declare dividend out of its reserves subject to the fulfillment of the following conditions, such as:
| (i) | If profits for that year are insufficient to declare dividends (including interim dividends), the dividends for that year may be declared and paid out from reserves on the following conditions: |
| (ii) | No company shall declare dividend unless carried over previous losses and depreciation not provided in previous year or years are set off against profit of the company for the current year. |
The Company may, before the declaration of any dividend in any financial year, transfer such percentage of its profits for that financial year as it may consider appropriate to the reserves of the Company.
Voting Rights
Subject to any special terms as to voting on which any shares may have been issued, every shareholder entitled to vote who is present in person (including any corporation present by its duly authorized representative) shall on a show of hands have one vote and every shareholder present in person or by proxy shall on a poll have one vote for each share of which he is the holder. In the case of joint holders, only one of them may vote and in the absence of election as to who is to vote, the vote of the senior of the joint holders who tenders a vote, whether in person or by proxy, shall be accepted to the exclusion of the votes of the other joint holders. Seniority is determined by the order in which the names appear in the register of members.
According to the Companies Act, 2013 and the Securities and Exchange Board of India (Listing Obligation and Disclosure Requirements) Regulations, 2015 (“SEBI (LODR) Regulations, 2015”) effective December 1, 2015, for listed companies, voting at general meetings has to be done by electronic voting(“e-voting”). For those shareholders who are unable to vote through this facility, the facility of physical voting through ballot papers is provided at the meeting. Upon a poll, the voting rights of each shareholder entitled to vote and present in person or by proxy shall be proportionate to the capitalpaid-up on each share against our totalpaid-up capital. In the case of a tie vote, the chairman of the meeting, who is generally the chairman of our Board of directors, has the right to cast atie-breaking vote.
A shareholder may appoint any person (whether or not a shareholder) to act as his proxy to vote on polls conducted at any meeting of shareholders (or of any class of shareholders) in respect of all or a particular number of the shares held by him. A shareholder may appoint more than one person to act as his proxy and each such person shall act as proxy for the shareholder for the number of shares specified in the instrument appointing the person a proxy. Any person appointed as proxy shall act on behalf of a shareholder not exceeding fifty members and holding not more than 10.0% of the aggregate share capital carrying voting rights. The shareholder holding more than 10.0% of the total share capital of the Company carrying voting rights may appoint a single person as proxy and in that case, the person appointed as proxy for such shareholder cannot act as proxy for any other person or shareholder. The instrument appointing a proxy must be delivered to our registered office at least 48 hours prior to the meeting or in case of a poll, not less than 24 hours before the time appointed for taking the poll. If a shareholder appoints more than one person to act as his proxy, each instrument appointing a proxy shall specify the number of shares held by the shareholder for which the relevant person is appointed as his proxy. A proxy does not have a right to speak at meetings and not entitled to vote except on poll. A corporate shareholder is also entitled to nominate a representative to attend and vote on its behalf at general meetings. Such a representative is not considered a proxy and he has the same rights as the shareholder by whom he was appointed to speak at a meeting and vote at a meeting in respect of the number of shares held by the shareholder, including on a show of hands and a poll.
Subject to the Articles of Association, the Companies (Share Capital and Debentures) Rules, 2014, and the Indian Companies Act, the Company is allowed to issue equity shares with different rights subject to compliance with the provisions of the abovementioned rules and the Indian Companies Act.
Quorum
Our Articles of Association provide that a quorum for a general meeting is at least thirty shareholders personally present, if the number of members as on the date of the meeting is exceeding five thousand to vote, in accordance with the Companies Act, 2013.
Shareholder Resolutions
An ordinary resolution requires the affirmative vote of a majority of our shareholders entitled to vote in person or electronically or by proxy or by a poll at a general meeting.
A resolution shall be a special resolution when, the intention to propose the resolution as a special resolution has been duly specified in the notice calling the general meeting or other intimation given to the members of the resolution. A special resolution requires the affirmative vote of not less than three times the number of the votes, if any cast against the resolution by members so entitled and voting in person or electronically or by proxy at a general meeting and casting a vote. The Indian Companies Act provides that to amend the Articles of Association, a special resolution approving such an amendment must be passed in a general meeting. Certain amendments, including a change in the name of the company, to approve reduction of share capital, to approve variation of rights of special classes of shares, to issue further shares withoutpre-emptive rights tonon-members or to convert loans or debentures into shares, to commence any new line of business and dissolution of the company require a special resolution.
Further, the Companies (Management and Administration) Rules, 2014 requires certain resolutions such as those listed below to be voted on only by a postal ballot:
In addition to the above, the Company may at its discretion transact by means of a postal ballot in respect of any item of business, other than ordinary business and any business in respect of which directors or auditors have a right to be heard at any meeting.
Dividends
Under the Indian Companies Act, unless the board of directors recommends the payment of a dividend, the shareholders at a general meeting have no power to declare any dividend. The board of directors may also declare interim dividends that do not need to be approved by the shareholders. A company pays dividends recommended by the board of directors and approved by a majority of the shareholders at the annual general meeting of shareholders held within 6 months of the end of each fiscal year. The shareholders have the right to decrease but not increase the dividend amount recommended by the board of directors. Listed companies are required to declare and disclose the dividends paid on a per share basis only. The dividend recommended by the board of directors and approved by the shareholders at a general meeting is distributed and paid to shareholders in proportion to the paid up value of their equity shares. The Indian Companies Act provides that shares of a company of the same class must receive equal dividend treatment. Dividends can be paid in cash or by cheque or in any electronic mode to the registered shareholder at a record date fixed on or prior to the annual general meeting or to his order or his banker’s order. No shareholder is entitled to a dividend while any lien in respect of unpaid calls on any of such shareholder’s shares is outstanding.
These distributions and payments are required to be paid to shareholders within 30 days of the annual general meeting where the resolution for declaration of dividends is approved. The dividend so declared is required to be deposited in a separate bank account within a period of 5 days from the date of declaration of such dividend. All dividends unpaid or unclaimed within a period of 30 days from the date of declaration of such dividend must be transferred within seven days of the end of such period to a special unpaid dividend account held at a scheduled bank. The company shall, within a period of 90 days of making any transfer of an amount to the unpaid dividend account, prepare a statement containing the names, their last known addresses and the unpaid dividend to be paid to each person and place it on the website of the company and also on any other website approved by the Central Government for this purpose. Any dividend which remains unpaid or unclaimed for a period of seven years from the date of the transfer to an unpaid dividend account must be transferred along with interest accrued to the Investor Education and Protection Fund along with a statement containing such details. Also, all shares in respect of which unpaid or unclaimed dividend has been transferred, shall also be transferred by the company in the name of this fund along with a statement containing such details as may be prescribed.
Under the Companies Act 2013, dividends in respect of a fiscal year may be paid out of the profits of a company in that fiscal year or out of the undistributed profits of previous fiscal years or both, after providing for depreciation in a manner provided for in the Companies Act, 2013. The Companies Act, 2013 and the Companies (Declaration and Payment of Dividend) Rules, 2015 provide that in an event of adequacy or absence of profits in any year, a company may declare dividend out of its reserves subject to the fulfillment of the following conditions, such as:
The Company may, before the declaration of any dividend in any financial year, transfer such percentage of its profits for that financial year as it may consider appropriate to the reserves of the Company.
Distribution of Assets on aWinding-up
In accordance with the Indian Companies Act, all surplus assets remaining after payments are made to employees, statutory creditors, tax and revenue authorities, secured and unsecured creditors and the holders of any preference shares (though not in that order), shall be distributed among our equity shareholders in proportion to the amount paid up or credited aspaid-up on such shares at the commencement of thewinding-up.
Transfer of Shares
Under the Indian Companies Act, the shares of a public company are freely transferable, unless such a transfer contravenes applicable law or the regulations issued by the SEBI or the Sick Industrial Companies (Special Provisions) Act, 1985, as amended, or the SICA.SEBI. The transferor is deemed to remain the holder until the transferee’s name is entered in the register of members.
In the case of shares held in physical form, we will register any transfer of equity shares in the register of members upon lodgment of the duly completed share transfer form, the relevant share certificate, or if there is no certificate, the letter of allotment, in respect of shares to be transferred together with duly stamped share transfer forms. In respect of electronic transfers, the depositary transfers shares by entering the name of the purchaser in its register as the beneficial owner of the shares. In turn, we then enter the name of the depositary in our records as the registered owner of the shares. The beneficial owner is entitled to all the rights and benefits and is subject to the liabilities attached to the shares held by the depositary on his or her or its behalf.
Equity shares held through depositaries are transferred in the form of book entries or in electronic form in accordance with the regulations laid down by SEBI. These regulations provide the regime for the functioning of the depositaries and the participants and set out the manner in which the records are to be kept and maintained and the safeguards to be followed in this system.
SEBI requires that our equity shares for trading and settlement purposes be in book-entry form for all investors, except for transactions that are not made on a stock exchange and transactions that are not required to be reported to the stock exchange. Transfers of equity shares in book-entry form require both the seller and the purchaser of the equity shares to establish accounts with depositary participants appointed by depositaries established under the Depositories Act, 1996. Charges for opening an account with a depositary participant, transaction charges for each trade and custodian charges for securities held in each account vary depending upon the practice of each depositary participant.
The depositary transfers equity shares by entering the name of the purchaser in its books as the beneficial owner of the equity shares. In turn, we will enter the name of the depositary in our records as the registered owner of the equity shares. The beneficial owner is entitled to all the rights and benefits as well as the liabilities with respect to the equity shares that are held by the depositary. The register and index of beneficial owners maintained by our depositary is deemed to be a register and index of our members and debenture holders under the Depositories Act, 1996. Transfers of beneficial ownership held through a depositary are exempt from stamp duty. For this purpose, we have entered into an agreement for depositary services with the National Securities Depositary Limited and the Central Depositary Services India Limited.
The requirement to hold the equity shares in book-entry form will apply to the ADS holders when the equity shares are withdrawn from the depositary facility upon surrender of the ADSs. In order to trade the equity shares in the Indian market, the withdrawing ADS holder will be required to comply with the procedures described above.
Our Articles of Association provide for certain restrictions on the transfer of equity shares, including granting power to the board in certain circumstances, to refuse to register or acknowledge a transfer of equity shares or other securities issued by us. Under the listing agreement and SEBI (LODR) Regulations, 2015 pertaining to NSE and BSE on which our equity shares are listed, in the event we have not effected the transfer of shares within 15 days or where we have failed to communicate to the transferee any valid objection to the transfer within the stipulated time period of 15 days, we are required to compensate the aggrieved party for the opportunity loss caused during the period of delay.
The NCLT was constituted with effect from June 1, 2016 and by virtue of Section 466 of the Companies Act, 2013, the Company Law Board was dissolved.
If a company without sufficient cause refuses to register a transfer of equity shares within 2 monthsa period of 30 days from the date on which the instrument of transfer or the intimation of transmission, as the case may be, is delivered to the company,Company, the transferee may within a period of 60 days of such refusal or where no intimation has been received from the Company, within 90 days of the delivery of the instrument of transfer or intimation of transmission, may appeal to the Company Law Board, or the CLB, seeking to register the transfer of equity shares.NCLT. The CLBNCLT may, in its discretion, issue an interim order suspending the voting rights attached to the relevant equity shares before completing its investigation of the alleged contravention. If there is any default in complying with the order of the CLBNCLT under Section 5958 of the Companies Act, 2013, the company shall be punishable with fine which shall not be less than Rs. 100,000 but which may extend to Rs. 500,000 and every officer of the company who is in default shall be punishable with imprisonment for a term which may extend to one yearthree years or with fine which shall not be less than Rs. 100,000 but which may extend to Rs. 300,000, or with both.
In addition, the Indian Companies Act provides that the CLBNCLT may direct a rectification of the register of members for a transfer of equity shares which is in contravention of SEBI regulations or the SICA or any similar law, upon an application by the company, a participant, a depositary incorporated in India, an investor or SEBI.
The National Company Law Tribunal has been constituted with effect from June 1, 2016 and by virtue of Section 466 of the Companies Act, 2013, the Company Law Board stands dissolved.
Disclosure of Ownership Interest
Section 89 of the Companies Act, 2013 requires that beneficial owners of shares of companies who are not registered as holders of those shares must make a declaration to the company specifying the nature of his or her or its interest, particulars of the registered holder of such shares and such other particulars as may be prescribed. Failure by a person to comply with Section 89 will not affect the company’s obligation to register a transfer of shares or to pay any dividends to the registered holder of any shares in respect of which the declaration has not been made.
Any investor, who fails to comply with these requirements without any reasonable cause, shall be punishable with fine which may extend to Rs. 50,000 and if such failure continues, a further fine ofbe extended up to Rs. 1,000 may be levied for each day after the first day during which the failure continues. While it is unclear whether Section 89 applies to holders of ADSs of the Company, investors who exchange ADSs for the underlying equity shares of the Company will be subject to the restrictions under Section 89. The ADS holders in addition is required to comply with the notifications and disclosures as per the deposit agreement between ADS holders, the Company and the depository.
On receipt of the declaration, the Company is required to file a return of such declaration in the prescribed form with the Registrar. If the Company fails to comply with the provisions of Section 89, then the Company and every defaulting officer may be punishable with fine which shall not be less than Rs. 500 but which may extend to Rs.1,000Rs. 1,000 and if such failure continues, a further fine of Rs. 1000 may be levied for each day after the first day during which the failure continues.
Alteration of Shareholder Rights
Pursuant to Section 48 of the Companies Act, 2013, and subject to the provisions of the articles of association of a company and the relevant rules as issued by the Ministry of Corporate Affairs, where the share capital of a company is divided into different classes of shares, the rights of any class of shareholders can only be altered or varied with the consent in writing of the holders of not less than three-fourths of the issued shares of that class, by a special resolution passed at a separate meeting of the holders of the issued shares of that class, or pursuant to a judicial order sanctioning a compromise or arrangement between the company and such class of shareholders.
Share Register and Record Dates
We maintain our register of members in both electronic and physical modes at our registered office and all transfers of shares should be notified to us at such address. Our register of members is open to inspection during business hours by shareholders without charge and by other persons upon payment of a fee as prescribed under the applicable law.
The register and index of beneficial owners maintained by a depositary under the Depositories Act, 1996 is deemed to be an index of members and register and index of debenture holders. We recognize as shareholders only those persons who appear on our register of members and we do not recognize any person holding any equity share or part thereof on trust, whether express, implied or constructive.
To determine which shareholders are entitled to specified shareholder rights, we may close the register of members. For the purpose of determining who our shareholders are, our register of members may be closed for periods not exceeding 30 days at any one time and we are required to ensure that there is a gap of at least 30 days between the two record dates. In order to determine our shareholders’ entitlement to dividends, it is our general practice to close the register of members for approximately 10 to 20 days before the annual general meeting. The date on which this period begins is the record date. Under the SEBI (LODR) Regulations, 2015 pertaining to NSE and BSE on which our equity shares are listed, we may, upon giving at least seven working days’ advance notice to the stock exchange, set a record date and/or close the register of members. The trading of our equity shares and the delivery of shares certificates may continue while the register of members is closed.
Annual Report
At least 21 clear days before an annual general meeting, we must circulate our annual report, which comprises of either a detailed or abridged version of our audited financial accounts, our directors’ report, our corporate governance report, and our auditor’s report, to the shareholders along with a notice convening the annual general meeting. In addition, we must furnish to the exchanges quarterly unaudited or audited results within 45 days after the end of each accounting quarter. We are required to furnish to the exchanges audited financial results for the entire financial year within 60 days of the end of the financial year. We are also required to send copies of our annual report to the NSE and BSE and to publish our financial results in at least one English language daily newspaper circulating in the whole or substantially the whole of India and also in a daily newspaper published in the language of the region where our registered office is situated. We are also required under the Indian Companies Act to make available upon the request of any shareholder our complete balance sheet and statement of profit and loss along with all the subsidiaries.
Under the Indian Companies Act, we must file with the Registrar of Companies our balance sheet and statement of profit and loss within 30 days of the date on which the balance sheet and statement of profit and loss were adopted at the annual general meeting and our annual return within 60 days of the conclusion of that meeting.
Related Party Transactions
As per the Companies Act, 2013, all related party transactions shall require prior approval of the Audit Committee. The Audit Committee may grant omnibus approval for related party transactions proposed to be entered into by the Company subject to certain conditions. The Audit Committee shall review, at least on a quarterly basis, the details of related party transactions entered into by the Company pursuant to each of the omnibus approvals accorded by the Audit Committee. The Audit Committee shall lay down the criteria for granting omnibus approvals in line with the policy on related party transactions of the Company and such approval shall be applicable to transactions which are similar in nature. Prior approval of the shareholders by way of a resolution is required for all the related party transactions which are not in the ordinary course of business and which are not at arm’s length basis. Further, such prior approvals do not apply to transactions between a holding company and its wholly owned subsidiary whose accounts are consolidated with such holding company and placed before the shareholders at the general meeting. Disclosure of material related party transactions and transactions which are not at an arm’s length basis is required to be included in the annual report along with the justification for entering in to such contracts and arrangements.
Borrowing Powers
Our directors may raise, borrow or secure the payment of any sums of money for our purposes as they deem appropriate without the consent of shareholders in a general meeting, by way of special resolution, provided that, the aggregate of the monies to be borrowed and the principal amount outstanding in respect of monies raised, borrowed or secured by us does not exceed the aggregate of our paid up share capital plus free reserves. Under the Indian Companies Act, the payment and repayment of moneys borrowed may be secured in such manner and upon such terms and conditions in all respect as the Board may think fit, by resolution passed at a meeting of the Board and in particular, by the issue of bonds, debentures, debenture stock of the company either unsecured or secured by a mortgage or charge over all or any part of the property of the company (both present and future) including its uncalled capital for the time being, and debentures, debenture stock, bonds and other securities may be made assignable free from any equities between the company and the person to whom the same may be issued.
Corporate Social Responsibility
The Companies Act, 2013, read with the Rules made thereunder, requires companies which meet the requirements of certain thresholds of net worth, turnover or net profits to constitute a Corporate Social Responsibility (“CSR”) Committee and to spend at least 2% of average profits before taxes for the previous three fiscal years on areas of CSR. This requirement is effective as of April 1, 2014. In the event we are unable to spend the required amount, we will be required to disclose details of amounts spent and, in case of any shortfall in such spending, also state the reasons for the shortfall.
Issue of equity shares andPre-emptive Rights
Subject to the provisions of the Indian Companies Act and our Articles of Association and to any special rights attaching to any of our equity shares, we may increase our share capital by the allotment or issue of new equity shares with preferred, deferred or other special rights or restrictions regarding dividends, voting, return of capital or other matters as we may from time to time determine by special resolution. We may issue preference shares that are redeemable or are liable to be redeemed at our option or the option of the holder in accordance with our Articles of Association.
Under the Indian Companies Act, new equity shares shall first be offered to existing shareholders in proportion to the amount they have paid up on their equity shares on the record date. The offer shall be made by written notice specifying:
If the offer is not accepted, it is deemed to be declined, and thereafter, our Board is permitted to distribute equity shares not accepted by existing shareholders in the manner it deems beneficial for us in accordance with our Articles of Association. Holders of ADSs may not be able to participate in any such offer.
However, under the provisions of the Indian Companies Act, new equity shares may be offered tonon-shareholders, if this has been approved by a special resolution and has complied with the applicable rules.
Capitalization of Profits and Reserves
Our Articles of Association allow our directors, with the approval of our shareholders by an ordinary resolution, to capitalize any part of the amount standing to the credit of our reserve accounts or to the credit of our statement of profit and loss or otherwise available for distribution. Any sum which is capitalized shall be appropriated among our shareholders in the same proportion as if such sum had been distributed by way of dividend. This sum shall not be paid out in cash and shall be applied in the following manner:
Any issue of bonus equity shares would be subject to section 63 of the Companies Act, 2013 and the SEBI (Disclosure and Investor Protection) Guidelines, 2000, as amended, which provide that:
Purchase of own equity shares
A company may, in accordance with the Companies Act, 2013, the Rules made thereunder and the regulations issued by SEBI maybuy-back its own shares out of its free reserves or securities premium account or the proceeds of any shares or other specified securities (other than proceeds of an earlier issue of the same kind of shares or same kind of other specified securities) subject to certain conditions, including:
The first two conditionssecond condition mentioned above would not be applicable if the number of equity shares proposed to be bought back is 10.0%10% or less of ourthe total paid up equity capital and free reserves and if suchbuy-back is authorized by the board of directors, provided that no buy-back shall be made within 365 days from the date of any previous buy-back. If such buy-back constitutes more than 10.0% of the total paid-up equity capital and free reserves of the company, it must be authorized by a special resolution of the company in general meeting. Our Articles of Association permit us to buy-back our equity shares.directors.
Any equity shares which have been bought back by us must be extinguished within 7 days of the last date of completion of buy back. Further, we will not make a further issue of the same kind of shares or other specified securities including an allotment of new shares within a period of 6 months except by way of a bonus issue or in discharge of our existing obligations such as conversion of warrants, stock option schemes, sweat equity or conversion of preference shares or debentures into equity. A company is also prohibited from purchasing its own shares or specified securities through any subsidiary company including its own subsidiary companies or through any investment company or group of investment companies or in the event ofnon-compliance with certain other provisions of the Companies Act, 2013.
SEBI in its board meeting dated June 25, 2013, has introduced following amendments to SEBI (Buy Back of Securities) Regulations, 1998 governing (‘SEBI Buyback Regulations’) governs thebuy-back through open market purchase:purchase through the following methods:
| 1) | Tender offer: Tender offer means offer by a company tobuy-back its shares or other specified securities through a letter of offer from the holders of the shares or other specified securities of the company. A company maybuy-back its shares or other specified securities from its existing security-holders on a proportionate basis in accordance with the provisions of Chapter III of the SEBI Buyback Regulations. However, 15% of the number of securities which the company proposes to buy back or number of securities entitled as per their shareholding, whichever is higher, shall be reserved for small shareholders. The promoter intending to offer their shares or other specified securities forbuy-back shall be required to make specific disclosures such as quantum of shares proposed to be tendered, details of specified transactions as per the regulations etc. Other conditions in relation to filing of the offer document, adhering to the offer procedure, maintaining an escrow account, etc. shall also have to be complied with as per Chapter III of the SEBI Buyback Regulations. |
| 2) | Open market: The buyback of shares or other specified securities from the open market may be in one of the following methods: |
Specific conditions to be mandatorily requiredcomplied with, in relation to purchase at least 50.0%buyback through each of the offer size as against existing requirement of 25.0%. In caseabove modes have been prescribed under the Chapter IV of the failure to purchase the minimum prescribed 50.0% of the offer size, the entire amount in the Escrow account will be forfeited, subject to maximum of 2.5% of the amount earmarked for the share buy-back;
The SEBI Buyback Regulations were amended on March 6, 2017 through the SEBI (Payment of Fees and Mode of Payment) (Amendment) Regulations, 2017, Chapter IV in relation to schedule of fees i.e. the fee structure and the stock exchange on a daily basis;
The reporting and disclosures requirement are proposed to be rationalized.SEBI.
ADS holders will be eligible to participate in a sharebuy-back in certain cases. An ADS holder may acquire equity shares by withdrawing them from the depositary facility and then selling those equity shares back to us in accordance with the provisions of applicable law as discussed above. ADS holders should note that equity shares withdrawn from the depositary facility may only bere-deposited into the depositary facility under certain limited circumstances as specified under the guidelines issued by the GoI and the RBI relating to a sponsored ADS facility and fungibililty of ADSs. See “- D. Exchange Controls.”
There can be no assurance that the equity shares offered by an ADS investor in anybuy-back of equity shares by us will be accepted by us. The position regarding regulatory approvals required for ADS holders to participate in abuy-back is not clear. ADS investors are advised to consult their Indian legal advisers prior to participating in anybuy-back by us, including in relation to any regulatory approvals and tax issues relating to the sharebuy-back.
Rights of Minority Shareholders
The Indian Companies Act, 2013 provides mechanisms for the protection of the rights of the minority shareholder. Where the share capital of a company is divided into different classes of shares and there has been variation in the rights attached to the shares of any class, the holders of not less than 10.0%10% of the issued shares of that class, who did not vote in favor of a resolution for the variation, have the right to apply to the CLBNCLT to have the variation cancelled and such variation shall not have any effect unless confirmed by the CLB.NCLT.
Further, under the Indian Companies Act, 2013, the shareholders holding not less than 10.0%10% of the issued share capital or shareholders representing not less than 10.0%10% of the total number of members or 100 members, whichever is lesser, provided that they have paid all calls and other sums due on their shares, have the right to apply to the CLBNCLT for an order to bring an end to the matter complained of, on the following grounds of oppression or mismanagement:
Provisions on Squeeze Out of Minority Shareholders
UnderIn the Companies Act, 1956 (and the corresponding Section 236event of an acquirer, or a person acting in concert with such acquirer, becoming registered holder of 90% or more of the Companies Act, 2013 which is not notified), where an arrangement or contract involving a transfer of shares or any class of sharesissued equity share capital of a company, or in the event of any person or group of persons becoming 90% majority or holding 90% of the issued equity share capital of a company by virtue of an amalgamation, share exchange, conversion of securities or for any other reason, such acquirer, person or group of persons, as the case may be, shall notify the Company of their intention to another company has been approved by holders holding not less than 90.0% in value of such class of shares,buy the transferee company has the right to give notice to any dissenting shareholder, within a specified time and in a prescribed manner, that it desires to acquire itsremaining equity shares.
UnlessThe acquirer, person or group of persons as mentioned above shall offer to the CLB, upon an application made by a dissenting shareholder within a monthminority shareholders of the aforementioned notice, orders otherwise,company for buying the transferee company has the right to acquire the shares of the dissenting shareholder on the same terms as those offered to the other shares to be transferred under the arrangement or contract.
Where, in pursuance of any such arrangement or contract, shares in a company are transferred to another company, and those shares, together with any otherequity shares held by the transferee company (or its nominee or subsidiary company) in the transferor company, constitute not less than 90.0% in value of the shares, the transferee company is required to give notice of such fact to any remaining shareholders withinat a month of such transfer. Any such remaining shareholder may within 3 months of the notice from the transferee company, require the transferee company to acquire its shares. Where such notice is given by such remaining shareholder, the transferee company is bound to acquire those sharesprice determined on the same terms as provided for under the arrangement or contract for the transferbasis of the other shares of the transferor company or onvaluation by a registered valuer in accordance with such termsrules as may be agreed or on terms thatprescribed.
Without prejudice to the CLB (upon an applicationaforesaid provisions, the minority shareholders of either the transferee company ormay offer to the shareholder) thinks fitmajority shareholders to order.purchase the minority equity shareholding of the company at the price determined in accordance with such rules as may be prescribed.
Book-Entry Shares and Liquidity
Our equity shares are compulsorily traded in book-entry form and are available for trading under both depositary systems in India, namely, the National Securities Depository Limited and Central Depository Services (India) Limited. The International Securities Identification Number (ISIN) for our equity shares is INE 205A01025.
Liquidation Rights
According to the Indian Companies Act, certain payments have preference over payments to be made to equity shareholders. These payments having preference include payments to be made by the company to its employees, taxes, payments to secured and unsecured lenders and payments to holders of any shares entitled by their terms to preferential repayment over the equity shares. In the event of ourwinding-up, the holders of the equity shares are entitled to be repaid the amounts of paid up capital or credited as paid upon those equity shares after payments have been made by the company as set out above. Subject to such payments having been made by the company, any surplus assets are paid to holders of equity shares in proportion to their shareholdings.
Takeover Code and Listing AgreementsSEBI Regulations
In September 2011, SEBI notifiedUnder the SEBI (Substantial Acquisition of Shares and Takeovers) Regulations, 2011 (“Takeover Code”) which replaceslast amended on March 6, 2017, the SEBI (Substantial Acquisition of Shares and Takeovers) Regulations, 1997. Under the Takeover Code, upon acquisition of shares or voting rights or control which entitles the acquirer to exercise 25% or more of the voting rights in or control over the target company triggers a publicly listed Indianrequirement for the acquirer to make an open offer at an offer price determined as per the provisions of the Takeover Code. The acquirer is required to make a public announcement for an open offer on the date on which it is has agreed to acquire such shares or voting rights or control. Such open offer shall only be for such number of shares as is required to adhere to the maximum permittednon-public shareholding.
Upon acquisition of shares or voting rights or control in the target company such that the aggregate share-holding of the acquirer (meaning a person who directly or indirectly, acquires or agrees to acquire shares or voting rights or control in a target company either by himself or together with persons acting in concert) is 5.0%5% or more of the shares or voting rights or control of the target company, the acquirer is required to, within two working days of such acquisition of shares or voting rights or receipt of intimation of allotment of shares, disclose their aggregate shareholding and voting rights in the target company to the target company and to the stock exchanges in which the shares of the target company are listed.
Further, an acquirer, who, together with persons acting in concert with him, holds shares or voting rights entitling them to 5.0%5% or more of the shares or voting rights in a target company must disclose every sale or acquisition of shares representing 2.0%2% or more of the shares or voting rights of the target company to the target company and to the stock exchanges in which the shares of the target company are listed within two2 (two) working days of such acquisition or sale or receipt of intimation of allotment of such shares. This disclosure is required, in case of a sale, even if such sale results in the shareholding of the acquirer falling below 5.0%5%. Every person, who together with persons acting in concert with him, holds shares or voting rights entitling him to exercise 25.0%25% or more of the voting rights in a target company, has to disclose to the company and to stock exchanges, their aggregate shareholding and voting rights as of March 31, in such target company within seven7 (seven) working days from the end of the financial year of that target company.
The acquisition of shares or voting rights which entitles the acquirer to exercise 25.0% or more of the voting rights in or control over the target company triggers a requirement for the acquirer to make an open offer to acquire at least 26.0% of the total shares of the target company at an offer price determined as per the provisions of the Takeover Code. The acquirer is required to make a public announcement for an open offer on the date on which it is agreed to acquire such shares or voting rights. Such open offer shall only be for such number of shares as is required to adhere to the maximum permittednon-public shareholding.
Where the public shareholding in the target company is reduced to a level below the limit specified in rule 19(2)(b) and / or rule 19A of the listing regulations read withSecurities Contract (Regulation) Rules, 1957, the target company is required to adopt any of the methods prescribed in the SEBI circular CIR/CFD/CMD/14/2015 dated November 30, 2015 on account of shares being acquired pursuantso as to an open offer, the acquirer is required to take necessary steps to facilitate compliancecomply with the minimum public shareholding threshold within the time prescribedrequirements in the Securities Contract (Regulation) Rules, 1957.manner specified by SEBI. Further, to an amendment to the Takeover Code dated March 24, 2015,also provides that an acquirer can make an offer for delisting the Company if such acquirer declares his intention to do so at the time of making the public announcement of an open offer. In other instances, the acquirer will not be eligible to make voluntary delisting offer under the SEBI (Delisting of Equity Shares) Regulations 2009, unless 12 months have elapsed from the date of the completion of offer period.
Since we are a listed company in India, the provisions of the Takeover Code will apply to us and to any person acquiring our equity shares or voting rights in our Company. The ADSs entitle ADS holders to exercise voting rights in respect of the Deposited Equity Shares (as described in the section titled “Voting Rights of Deposited Equity Shares Represented by ADSs”). Accordingly, the requirement to make an open offer of at least 26.0%26% of the shares of a company to the existing shareholders of the company would be triggered by an ADS holder where the shares that underlie the holder’s ADSs represent 25.0%25% or more of the shares or voting rights of the company. We entered into uniform listing agreements with BSE and NSE which were superseded by SEBI (LODR) Regulation 2015, pursuant to which we must report to the stock exchanges any disclosures made to the company pursuant to the Takeover Code.
The SEBI (Substantial Acquisition of Shares and Takeovers) Regulations, 2011 (“Takeover Code”) last amended on March 6, 2017 by SEBI (Payment of Fees and Mode of Payment) (Amendment) Regulations, 2017 in the fee structure and the mode of payment in the event of filing the necessary disclosure by the acquirer under the Regulation 10sub-regulation 7.
Voting Rights of Deposited Equity Shares Represented by ADSs
Under Indian law, voting in relation to the equity shares is by show of hands unless a poll is demanded by a member or members present in person or by proxy holding at least 10.0%10% of the total shares entitled to vote on the resolution or by those holding shares with an aggregate paid up capital of at least Rs.500,000. A proxy (other than a body corporate represented by an authorized representative) may not vote except on a poll. As soon as practicable after receipt of notice of any general meetings or solicitation of consents or proxies of holders of shares or other deposited securities, our Depositary shall fix a record date for determining the holders entitled to give instructions for the exercise of voting rights. The Depositary shall then mail to the holders of ADSs a notice stating (i) such information as is contained in such notice of meeting and any solicitation materials, (ii) that each holder on the record date set by the Depositary will be entitled to instruct the Depositary as to the exercise of the voting rights, if any pertaining to the deposited securities represented by the ADSs evidenced by such holder’s ADRs, and (iii) the manner in which such instruction may be given, including instructions to give discretionary proxy to a person designated by us.
On receipt of the aforesaid notice from the Depositary, our ADS holders may instruct the Depositary on how to exercise the voting rights for the shares that underlie their ADSs. For such instructions to be valid, the Depositary must receive them on or before a specified date. The Depositary will try, as far as is practical, and subject to the provisions of Indian law and our Memorandum of Association and our Articles of Association, to vote or to have its agents vote in relation to the shares or other deposited securities as per our ADS holders’ instructions. The Depositary will only vote or attempt to vote as per an ADS holder’s instructions. The Depositary will not itself exercise any voting discretion. Neither the Depositary nor its agents are responsible for any failure to carry out any voting instructions, for the manner in which any vote is cast, or for the effect of any vote. There is no guarantee that our shareholders will receive voting materials in time to instruct the Depositary to vote and it is possible that ADS holders, or persons who hold their ADSs through brokers, dealers or other third parties, will not have the opportunity to exercise a right to vote.
Insider Trading Regulations
The SEBI (Prohibition of Insider Trading) Regulations, 2015 were announced on January 15, 2015 (the “SEBI Insider Trading Regulations”) and become effective on May 15, 2015. The SEBI Regulations replacereplaced the erstwhileprevious SEBI (Prohibition of Insider Trading) Regulations, 1992.Regulations. Key changes pursuant tofeatures of the SEBI Insider Trading Regulations include:inter alia are as follows:
“Insider” means a person who is a connected person or in possession of or having access to unpublished price sensitive information;
“Connected Person” is an exhaustive definition of “Insider” to include “connected person” such asand includes any person who has a contractual, fiduciary or employment relationship or family relatives that allows such person directly or indirectly access to unpublished price sensitive information;
“Immediate Relatives” means a spouse of a person, and includes parent, sibling, and child of such person or of the spouse, any of whom is either dependent financially on such person, or consults such person in taking decisions relating to trading in securities;
“unpublished price sensitive information (“UPSI”);” means any information, relating to a company or its securities, directly or indirectly, that is not generally available which upon becoming generally available, is likely to materially affect the price of the securities and shall, ordinarily including but not restricted to, information relating to financial results, dividend, changes in capital structure;
Under the SEBI Insider Trading Regulations, the Companya listed company is required to formulate a stated framework and policy for the fair disclosure of events and occurrences that could impact the price of its securities. This policy shallis required to be framed on principles such as the equality of access to information, publication of policies such as those on dividends, inorganic growth pursuits, calls on meetings with analysts and the publication of transcripts of such calls and meetings.
Comparison of Shareholders’ Rights
We are incorporated under the laws of India. The following discussion summarizes certain material differences between the rights of holders of our equity shares and the rights of holders of the common stock of a typical corporation incorporated under the laws of the State of Delaware which result from differences in governing documents and the laws of India and Delaware. The rights of holders of our ADSs differ in certain respects from those of holders of our equity shares.
This discussion does not purport to be a complete statement of the rights of holders of our equity shares under applicable law in India and our amended and restated Memorandum and Articles of Association or the rights of holders of the common stock of a typical corporation under applicable Delaware law and a typical certificate of incorporation and bylaws.
Delaware Law | Indian Law | |
| Annual and Special Meetings of Shareholders | ||
| Shareholders of a Delaware corporation generally do not have the right to call meetings of shareholders unless that right is granted in the certificate of incorporation orby-laws. However, if a corporation fails to hold its annual meeting within a period of 30 days after the date designated for the annual meeting, or if no date has been designated for the annual meeting, or if no date has been designated for a period of 13 months after its last annual meeting, the Delaware Court of Chancery may order a meeting to be held upon the application of a shareholder. | While shareholders of a company do not have any right to call for an annual general meeting, shareholders holdingone-tenth of thepaid-up share capital of the company have a right to request an extraordinary general meeting. However, in the event the company defaults in holding an annual general meeting within 15 months from the date of its last annual general meeting or within 6 months from the end of financial year, whichever is higher, the GoI may order a meeting to be held upon the application of any shareholder. | |
| Quorum Requirements for Meetings of Shareholders | ||
| A Delaware corporation’s certificate of incorporation or bylaws can specify the number of shares which constitute the quorum required to conduct business at a meeting, provided that in no event shall a quorum consist of less thanone-third of the shares entitled to vote at a | Our Articles of Association specify that the quorum for the general meeting shall be as provided in the Companies Act, 2013. According to the Indian Companies Act, quorum for a general meeting is at least 30 shareholders personally present if number of members as on date of meeting is exceeding 5,000 to vote and in such instances, the Indian Companies Act supersedes the Articles of Association. | |
| Board of Directors | ||
| A typical certificate of incorporation and bylaws would provide that the number of directors on the board of directors will be fixed from time to time by a vote of the majority of the authorized directors. Under Delaware law, a board of directors can be divided into classes and cumulative voting in the election of directors is only permitted if expressly authorized in a corporation’s certificate of incorporation. | Our Articles of Association provide that unless otherwise determined by the shareholders at a general meeting, the number of directors shall not be less than three or more than 15. The Company may appoint more than 15 directors by seeking the approval of its members by way of a special resolution. Under Indian law, the appointment and removal of directors (other than additional directors) is required to be approved by the shareholders. There is no concept under Indian law as to division of the board of directors into different classes or cumulative voting. | |
| Removal of Directors | ||
| Under the Delaware General Corporation Law, a director of a corporation may be removed with the approval of a majority of the outstanding shares then entitled to vote at an election of directors, unless the certificate of incorporation provides otherwise. | Under Indian law, a director of a company, other than a director appointed by the GoI, may be removed by an approval of the members by way of an ordinary resolution, provided that a special notice of the resolution to remove the director is given in accordance with the provisions of the Indian Companies Act. Under our Articles of Association, any director who has been appointed by any persons pursuant to the provisions of an agreement with us may be removed at any time by such person. | |
Delaware Law | Indian Law | |
| Filling Vacancies on the Board of Directors | ||
| A typical certificate of incorporation and bylaws provide that, subject to the rights of the holders of any preferred stock, any vacancy, whether arising through death, resignation, retirement, disqualification, removal, an increase in the number of directors or any other reason, may be filled by a majority vote of the remaining directors, even if such directors remaining in office constitute less than a quorum, or by the sole remaining director. Any newly elected director usually holds office for the remainder of the full term expiring at the annual meeting of stockholders at which the term of the class of directors to which the newly elected director has been elected expires. | The board of directors has the power to fill a vacancy on the board and any director so appointed shall hold office only so long as the vacating director would have held such office if no vacancy had occurred. | |
| Interested Director Transactions | ||
Interested director transactions are not voidable if (i) the material facts as to the interested director’s relationship or interests are disclosed or are known to the board of directors and the board in good faith authorizes the transaction by the affirmative vote of a majority of the disinterested directors, (ii) the material facts are disclosed or are known to the shareholders entitled to vote on such transaction and the transaction is specifically approved in good faith by vote of the majority of shares entitled to vote on the matter or (iii) the transaction is fair as to the corporation as of the time it is authorized, approved or ratified by the board of directors, a committee or the shareholders. | Under Indian law, contracts or arrangements in which one or more directors of an Indian company has an interest are not void or voidable because of such interest, provided that certain conditions, such as obtaining the required approval of the board of directors and disclosing the nature of the interest to the board of directors, are satisfied. Subject to a few exceptions, for an interested director transaction not to be voided, (a) the interested director is required to disclose the nature of his concern or interest at a meeting of the board of directors, whether directly or indirectly, is concerned or interested including the Director who a Promoter, Manager, Chief Executive Officer of anybody corporate; (b) the board of directors is required to grant its consent to the contract or arrangement; (c) the interested director is not permitted to take part in the discussion of, or vote on, the contract or arrangement; and (d) the approval of the members is required by way of resolution. An interested director is not to be counted for the purposes of quorum at the time of any such discussion or vote and if the interested director does vote, the vote shall be void. The contravention of relevant provisions is punishable with fine. | |
| Cumulative Voting | ||
| Delaware law does not require that a Delaware corporation provide for cumulative voting. However, the certificate of incorporation of a Delaware corporation may provide that shareholders of any class or classes or of any series may vote cumulatively either at all elections or at elections under specified circumstances. | There is no concept of cumulative voting under Indian law. | |
| Shareholder Action Without a Meeting | ||
| Unless otherwise specified in a Delaware corporation’s certificate of incorporation, any action required or permitted to be taken by shareholders at an annual or special meeting may be taken by shareholders without a meeting, without prior notice and without a vote, if consents, in writing, setting forth the action, are signed by shareholders with not less than the minimum number of votes that would be necessary to authorize the action at a meeting. All consents must be dated. No consent is effective unless, within 60 days of the earliest dated consent delivered to the corporation, written consents signed by a sufficient number of holders to take the action are delivered to the corporation. | There is no concept of shareholder action without a meeting under Indian law. | |
Delaware Law | Indian Law | |
| Business Combinations | ||
| With certain exceptions, a merger, consolidation or sale of all or substantially all the assets of a Delaware corporation must be approved by the board of directors and a majority of the outstanding shares entitled to vote thereon. | The sale, lease or disposal of all or substantially all of the assets of an Indian company must be approved by the board of directors and shareholders holding a majority of the voting share capital of the company. | |
| Under the Indian Companies Act, the merger of two companies is required to be approved by a Court or NCLT of competent jurisdiction and by a three-fourths majority of each class of shareholders and creditors of the company present and voting at the meetings held to approve the merger. | ||
| Interested Stockholders | ||
| The Delaware General Corporation Law contains a business combination statute applicable to Delaware public corporations whereby, unless the corporation has specifically elected not to be governed by such statute by amendment to its certificate of incorporation, it is prohibited from engaging in certain business combinations with an “interested shareholder” for three years following the date on which such person becomes an interested shareholder. An interested shareholder generally is one which owns or owned 15.0% or more of the target’s outstanding voting shares within the past three years. This has the effect of limiting the ability of a potential acquirer to make atwo-tiered bid for the target in which all shareholders would not be treated equally. The statute does not apply if, among other things, prior to the date on which such shareholder becomes an interested shareholder, the board of directors approves either the business combination or the transaction that resulted in the person becoming an interested shareholder. This encourages any potential acquirer of a Delaware public corporation to negotiate the terms of any acquisition transaction with the target’s board of directors. | Indian law does not prohibit corporate transactions but does require disclosure of related party transactions in the financial statements of the company. Under applicable accounting standards in India, during the time that a related party transaction exists, a company is required to disclose the name of the related parties, describe the relationship between the parties, describe the nature of the transactions and disclose the volume of the transactions either as an amount or as an appropriate proportion, the amounts or appropriate proportions of outstanding items pertaining to related parties at the balance sheet date and provisions for doubtful debts due from such parties at that date and the amounts written off or written back in the period in respect of debts due from or to related parties. | |
| Transactions undertaken between a company and a person having a substantial interest in the company would qualify as a related party transaction and would be required to be disclosed under applicable accounting standards in India. Under such accounting standards, a party is considered to have a substantial interest in a company if that party owns, directly or indirectly, 20.0% or more of the voting power in the company. | ||
Delaware Law | Indian Law | |
| Limitations on Personal Liability of Directors | ||
| A Delaware corporation may include in its certificate of incorporation provisions limiting the personal liability of its directors to the corporation or its shareholders for monetary damages for many types of breach of fiduciary duty. However, these provisions may not limit liability for any breach of the director’s duty of loyalty, acts or omissions not in good faith or that involve intentional misconduct or a knowing violation of law, the authorization of unlawful dividends, or unlawful share purchase or redemption, or any transaction from which a director derived an improper personal benefit. Moreover, these provisions would not be likely to bar claims arising under US federal securities laws. | Generally, Indian law provides that directors are not personally liable in respect of contracts of the company. However, where a director acts without the approval or ratification of the company, such director may be personally liable. Directors are also personally liable for breach of trust or misfeasance, both civilly and in some cases criminally. The Indian Companies Act contains certain provisions making directors personally liable to discharge certain monetary obligations in their capacity as directors, such as thenon-refund of share application monies or excess application monies within the time limit stipulated by the Indian Companies Act. Similarly, the Indian Companies Act provides for civil liability of directors for misstatements in a prospectus issued by the company that has been signed by the directors, including the obligation to pay compensation to any persons subscribing to the shares of the company on the faith of statements made in the prospectus. Directors’ and officers’ liability insurance policies are available in India. However, the permissible coverage under such policies is subject to the same limitations as on the ability of the company to indemnify its directors as described under “-Indemnification of Directors and Officers.” | |
|
| |
| Indemnification of Directors and Officers | ||
| A Delaware corporation may indemnify a director or officer of the corporation against expenses (including attorneys’ fees), judgments, fines and amounts paid in settlement actually and reasonably incurred in defense of an action, suit or proceeding by reason of his or her position if (i) the director or officer acted in good faith and in a manner he or she reasonably believed to be in or not opposed to the best interests of the corporation and (ii) with respect to any criminal action or proceeding, the director or officer had no reasonable cause to believe his or her conduct was unlawful. | Under Indian law, subject to specified exceptions, any provision, whether contained in the Articles of Association of a company or in any agreement, exempting or indemnifying any director, officer or auditor of the company against any liability in respect of any negligence, default, breach of duty or breach of trust which would by law otherwise attach to such director, officer or auditor, shall be void. However, pursuant to the exceptions permitted under Indian law, our Articles of Association provide for indemnification of any officer or agent against any liability incurred by such person in successfully defending any proceeding, whether civil or criminal, in which such person is acquitted in whole or in part on the grounds that such person had acted honestly and reasonably, or in connection with an application made by an officer or agent to the High Court of the relevant state for relief for reason that he or she has a reason to apprehend that any proceeding may be brought against him in respect of any negligence, default, breach of duty, misfeasance or breach of trust in which relief has been granted by such High Court. | |
| Appraisal Rights | ||
| A shareholder of a Delaware corporation participating in certain major corporate transactions may, under certain circumstances, be entitled to appraisal rights pursuant to which the shareholder may receive cash in the amount of the fair value of the shares held by that shareholder (as determined by a Court) in lieu of the consideration the shareholder would otherwise receive in the transaction. | There is no concept of appraisal rights under Indian law. | |
| Shareholder Suits | ||
| Class actions and derivative actions generally are available to the shareholders of a Delaware corporation for, among other things, breach of fiduciary duty, corporate waste and actions not taken in accordance with applicable law. In such actions, the court has discretion to permit the winning party to recover attorneys’ fees incurred in connection with such action. | Under the Indian Companies Act, shareholders holding not less than one tenth of the issued share capital, shareholders representing not less than one tenth of the total number of members or one hundred members, provided that they have paid all calls and other sums due on their shares, have the right to request the | |
Delaware Law | Indian Law | |
| Inspection of Books and Records | ||
| All shareholders of a Delaware corporation have the right, upon written demand under oath stating the purpose thereof, to inspect or obtain copies of the corporation’s shares ledger and its other books and records for any proper purpose. | Pursuant to our Articles of Association, our Board of directors has the authority to determine whether and to what extent and at what times and places and under what conditions or regulations our books are open to the inspection of the shareholders. Further, no shareholder of the company has the right to inspect any record of the company except as conferred under law or authorized by the board of directors or by the shareholders in a general meeting. The books containing the minutes of the proceedings of any general meetings of the shareholders are required to be kept at the registered office of the company and such materials are to be opened for inspection by any shareholder, without charge, subject to reasonable restrictions which may be imposed by a company’s articles or the general meeting of the shareholders. If an inspection is refused, the company and every officer of the company in default will be punishable with a fine. Under Indian law, the audited financial statements for the relevant financial year, the directors’ report and the auditors’ report are required to be provided to the shareholders before the annual general meeting. | |
| Amendment | ||
| Amendments to the certificate of incorporation of a Delaware corporation require the affirmative vote of the holders of a majority of the outstanding shares entitled to vote thereon or such greater vote as is provided for in the certificate of incorporation; a provision in the certificate of incorporation requiring the vote of a greater number or proportion of the directors or of the holders of any class of shares than is required by Delaware corporate law may not be amended, altered or repealed except by such greater vote. | Under Indian Law, subject to certain specified amendments that require the additional approval of the central government, a company may make amendments to its articles with the approval of shareholders holding not less than 75.0% of the shares of the company. | |
| Distributions and Dividends; Repurchases and Redemptions | ||
| Delaware law permits a corporation to declare and pay dividends out of statutory surplus or, if there is no surplus, out of net profits for | Under Indian law, if the profits for a year are insufficient, the dividend for that year may be declared out of the accumulated profits earned in previous years and transferred to reserves, subject to the following conditions:
(i) the rate of dividend declared shall not exceed the average of the rates at which dividend was declared by it in the 3 years immediately preceding that year. | |
| Under Delaware law, any corporation may purchase or redeem its own shares, except that generally it may not purchase or redeem those shares if the capital of the corporation is impaired at the time or would become impaired as a result of the redemption. A corporation may, however, purchase or redeem capital shares that are entitled upon any distribution of its assets to a preference over another class or series of its shares if the shares | (ii) the total amount to be drawn from the accumulated profits from previous years and transferred to the reserves may not exceed an amount equivalent to one tenth of thepaid-up capital and free reserves
(iii) the amount so drawn shall first be utilized to set off the losses incurred in the financial year in which dividend is declared before any dividend in respect of the equity shares is declared.
(iv) the balance of reserves after such withdrawal shall not fall below fifteen percent of its paid up share capital as appears in the latest audited financial statement.
| |
Delaware Law | Indian Law | |
| Shareholders have a right to claim a dividend, after such dividend has been declared by the company at a general meeting. Shareholders also have a right to claim the interim dividends, which may be declared only pursuant to a resolution of the company’s board of directors provided that in the event the company has incurred loss during the current financial year up to the end of the quarter immediately preceding the date of declaration of an interim dividend, then such interim dividend shall not be declared at a rate higher than the average dividends declared by the company during the immediately preceding 3 financial years. Dividends may be paid in cash or by cheque or warrant or in any electronic mode to the shareholder. Where a dividend has been declared by a company but has not been paid within 30 days from the date of declaration to any shareholder entitled to the payment of such dividend, a penalty can be imposed on a director who is knowingly a party to such default. | ||
| According to the Indian Companies Act, a company is empowered to purchase its own shares or other specified securities out of its free reserves, or the securities premium account or the proceeds of any shares or other specified securities (other than the kind of shares or other specified securities proposed to be bought back), subject to certain conditions including: (a) thebuy-back must be authorized by the articles of association of the company; (b) a resolution must be passed by shareholders holding not less than 75.0% of the outstanding shares in the general meeting of the company authorizing thebuy-back; (c) thebuy-back is limited to 25.0% of the total paid up capital and free reserves; (d) the ratio of debt owed by the company must not be more than twice the capital and free reserves after suchbuy-back; and (e) thebuy-back must be in accordance with the SEBI | ||
| Conditions (a) and (b) mentioned above would not be applicable if thebuy-back is for less than 10.0% of the totalpaid-up equity capital and free reserves of the company and suchbuy-back has been authorized by the Board of directors of the company. Further, a company buying back its securities is not permitted tobuy-back any additional securities for a period of 1 year after the buyback or to issue any securities of the same kind for a period of 6 months. | ||
| A company is also prohibited from purchasing its own shares or specified securities directly or indirectly. | ||
Comparison of Corporate Governance Standards
The listing of our ADSs on the NYSE and our equity shares on the NSE and BSE cause us to be subject to NYSE listing standards and Indian corporate governance requirements set out in the listing agreements that we have entered into with the NSE and BSE which is superseded by SEBI (LODR) Regulations, 2015 effective December 1, 2015.
The NYSE listing standards applicable to us, as a foreign private issuer, are considerably different from those applicable to companies incorporated in the United States. Under the NYSE rules, we need only (i) establish an independent audit committee that has specified responsibilities as described in the following table; (ii) provide prompt certification by our chief executive officer of any materialnon-compliance with any corporate governance rules of the NYSE; (iii) provide periodic (annual and interim) written affirmations to the NYSE with respect to our corporate governance practices; and (iv) provide a brief description of significant differences between our corporate governance practices and those followed by US companies.
The corporate governance requirements which apply to us as a listed company on the NSE and BSE are contained in Clause 49Regulation 10 to 27 of the listing agreementsSEBI (LODR) Regulations, 2015 that we have entered into with the NSE and BSE. Clause 49 has been amended from time to time.
The SEBI (LODR) Regulations, 2015 was notified on September 2, 2015 and are effective from December 1, 2015.
The following table summarizes certain material differences in the corporate governance standards applicable to us under the listing agreements with the NSE and BSE which is superseded SEBI (LODR) Regulations, 2015 and the corporate governance standards for a NYSE-listed company, both to a typical US domestic issuer and the requirements that would be different for us as a foreign private issuer.
Standard for NYSE-Listed Companies | Requirements
December 1, 2015 | |
| Director Independence | ||
A majority of the board must consist of independent directors. Independence is defined by various criteria including the absence of a material relationship between the director and the listed company. For example, directors who are employees, are immediate family of an executive officer of the company or receive over $ 120,000 per year in direct compensation from the listed company are not independent. Directors who are employees of or otherwise affiliated through immediate family with the listed company’s independent auditor are also not independent. Determinations of independence were made by the board.
Thenon-management directors must meet at regularly scheduled executive sessions without management.
(The NYSE requirements for a board consisting of independent directors andnon-management directors meeting at regularly scheduled executive sessions do not apply to us as a foreign private issuer.) | Regulation 17(1)
Regulation 16(1)(b) define an ‘independent director’ to mean anon-executive, other than a nominee director of a listed entity
(i) who, in the opinion of the board, is a person of integrity and possesses relevant expertise and experience;
(ii) who is or was not a promoter of the company or its holding, subsidiary or associate company;
(iii) who is not related to promoters or directors in the company, its holding, subsidiary or associate company; | |
Standard for NYSE-Listed Companies | Requirements
December 1, 2015 | |
(iv) who, apart from receiving director’s remuneration, has or had no material pecuniary relationship with the company, its holding, subsidiary or associate company, or their promoters, or directors, during the two immediately preceding financial years or during the current financial year;
(v) none of whose relatives has or had pecuniary relationship or transaction with the company, its holding, subsidiary or associate company, or their promoters, or directors, amounting to 2% or more of its gross turnover or total income or Rs. 5,000,000 or such higher amount as may be prescribed, whichever is lower, during the two immediately preceding financial years or during the current financial year;
(vi) who, neither himself nor any of his relatives (A) holds or has held the position of a key managerial personnel or is or has been employee of the company or its holding, subsidiary or associate company in any of the three financial years immediately preceding the financial year in which he is proposed to be appointed;
(B) is or has been an employee or proprietor or a partner, in any of the three financial years immediately preceding the financial year in which he is proposed to be appointed, of —(1) a firm of auditors or company secretaries in practice or cost auditors of the company or its holding, subsidiary or associate company; or (2) any legal or a consulting firm that has or had any transaction with the company, its holding, subsidiary or associate company amounting to ten per cent or more of the gross turnover of such firm.
(C) holds together with his relatives 2% or more of the total voting power of the company; or | ||
(D) is a Chief Executive or director, by whatever name called, of anynon-profit organization that receives 25% or more of its receipts or corpus from the company, any of its promoters, directors or its holding, subsidiary or associate company or that holds 2% or more of the total voting power of the company;
(E) is a material supplier, service provider or customer or a lessor or lessee of the company;
(vii) who is not less than 21 years of age. | ||
|
| |
| Audit Committee | ||
| The audit committee must (i) be comprised entirely of independent directors; (ii) be directly responsible for the appointment, compensation, retention and oversight of any registered public accounting firm engaged (including resolution of disagreements between management and the auditor regarding financial reporting) for the purpose of preparing or issuing an audit report or performing other audit, review or attest services for the listed issuer, and each such registered public accounting firm must report directly to the audit committee; (iii) establish procedures for the receipt, retention and treatment of complaints with respect to accounting and auditing issues; (iv) establish procedures for the confidential, anonymous submission by employees of the listed issuer of concerns regarding questionable accounting or auditing matters; (v) be authorized to engage independent counsel and other advisers it deems necessary to perform its duties; and (vi) be given sufficient funding by the Board of directors to compensate the independent auditors and other advisors as well as for the payment of ordinary administrative expenses incurred by the committee that are necessary or appropriate in carrying out its duties. | Regulation 18(3) of SEBI (LODR) Regulations, 2015 read with Part C of Schedule II require that the role of the audit committee should include the following:
• oversight the company’s financial reporting process and the disclosure of its financial information to ensure that the financial statement is correct, sufficient and credible.
• recommendation for appointment, remuneration and terms of appointment of the auditors and approval of payment to statutory auditors for any other services rendered by the statutory auditors.
• review with management the annual financial statements and auditor’s report thereon, before submission to the board of directors for approval, focusing primarily on matters required to be included in the Director’s Responsibility Statement in terms of clause (c) of
• Review with the management, the quarterly financial statements before submission to the board for approval | |
Standard for NYSE-Listed Companies | Requirements by the SEBI (LODR) Regulations, 2015 effective December 1, 2015 | |
• To review with management the statement of uses or application of funds raised through an issue (public issue, rights issue, preferential issue, etc.), the statement of funds utilized for purposes other than those stated in the offer document / prospectus / notice and the report submitted by the monitoring agency monitoring the utilization of proceeds of a public or rights issue, and making appropriate recommendations to the board to take up steps in this matter
• reviewing and monitoring the auditor‘s independence and performance, and effectiveness of audit process;
• approval or any subsequent modification of transactions of the listed entity with related parties;
• scrutiny of inter-corporate loans and investments;
• valuation of undertakings or assets of the listed entity, wherever it is necessary;
• evaluation of internal financial controls and risk management systems
• review with management the performance of statutory and internal auditors, and the adequacy of internal control systems. | ||
|
| |
• review the adequacy of the internal audit function, including the structure of the internal audit department, staffing and seniority of the official heading the department, reporting structure coverage and frequency of internal audit. | ||
• To discuss with internal auditors any significant findings andfollow-up thereon. | ||
• To review the findings of any internal investigations by the internal auditors into matters where there is suspected fraud or irregularity or a failure of internal control systems of a material nature and report the matter to the board. | ||
• To discuss with statutory auditors before the audit commences, the nature and scope of the audit as well as to conduct post-audit discussions to ascertain any area of concern. | ||
• To examine the reasons for substantial defaults in payment to depositors, debenture holders, shareholders (in case ofnon-payment of declared dividends) and creditors. | ||
• To review the functioning of whistle blower mechanism. | ||
• Approval of appointment of the Chief Financial Officer (that is, the whole-time finance director or any other person heading the finance function or discharging that function) after assessing the qualifications, experience and background, etc. of the candidate. | ||
• To review the management’s discussion and analysis of financial condition and results of operation. | ||
Standard for NYSE-Listed Companies | Requirements by the SEBI (LODR) Regulations, 2015 effective December 1, 2015 | |
• To review the statement of significant related party transactions submitted by the management. | ||
• To review the management letters/letters of internal control weaknesses issued by the statutory auditors. | ||
• To review the internal audit reports relating to internal control weaknesses. | ||
• To review the appointment, removal and terms of remuneration of the chief internal auditor.
• Reference to audit committee charter functions
• Statement of deviations:
(a) Quarterly statement of deviation(s) including report of monitoring agency, if applicable, submitted to stock exchange(s) as per the specified regulation
(b) Annual statement of funds utilized for purposes other than those stated in the offer document / prospectus / notice in terms of the requirement of the specified regulations | ||
|
| |
| The audit committee must consist of at least three members, and each member must be independent within the meaning established by the NYSE and Rule10A-3 under the Exchange Act. The audit committee members must be financially literate or become financially literate within a reasonable period of their appointment to the audit committee. | Regulation 18(1)(a)(b) of | |
| Each listed company must have disclosed whether its Board of directors has identified an audit committee financial expert (as defined under applicable rules of the SEC) and if not, the reasons why the Board has not done so. | Regulation 18(1)(c) of SEBI (LODR) Regulations, 2015 also require that all members of the audit committee should be financially literate and at least one member should have financial management and accounting expertise. | |
The audit committee must have a written charter that addresses the committee’s purpose and responsibilities.
At a minimum, the committee’s purpose must be to assist the Board in the oversight of the integrity of the company’s financial statements, the company’s compliance with legal and regulatory requirements, the independent auditor’s qualifications and independence and the performance of the company’s internal audit function and independent auditors.
The duties and responsibilities of the audit committee include conducting a review of the independent auditing firm’s annual report describing the firm’s internal quality control procedures, any material issues raised by the most recent internal quality control review or peer review of the firm and any steps taken to address such issues. | ||
| The audit committee is also to assess the auditor’s independence by reviewing all relationships between the company and its auditor. It must establish the company’s hiring guidelines for employees and former employees of the independent auditor. | ||
Standard for NYSE-Listed Companies | Requirements by the SEBI (LODR) Regulations, 2015 effective December 1, 2015 | |
| The committee must also discuss the company’s annual audited financial statements and quarterly financial statements with management and the independent auditors, the company’s earnings press releases, as well as financial information and earnings guidance provided to analysts and rating agencies, and policies with respect to risk assessment and risk management. | ||
| Each listed company must have an internal audit function. | ||
| The committee must also meet separately, periodically, with management, with internal auditors (or other personnel responsible for the internal audit function) and with independent auditors and review with the independent auditor any audit problems or difficulties and management’s response. | ||
| The committee must report regularly to the Board. | ||
| (The NYSE audit committee requirements apply to us as foreign private issuers and we are not exempt from this requirement.) | ||
| Compensation Committee | ||
Listed companies must have a compensation committee composed entirely of independent board members as defined by the NYSE listing standards.
The committee must have a written charter that addresses its purpose and responsibilities. | Regulation 19 of and SEBI (LODR) Regulations, 2015 states that, the company shall set up a nomination and remuneration committee which shall comprise at least three directors, all of whom shall benon-executive directors and at least half shall be independent. Chairman of the committee shall be an independent director. | |
These responsibilities include (i) reviewing and approving corporate goals and objectives relevant to CEO compensation; (ii) evaluating CEO performance and compensation in light of such goals and objectives for the CEO; (iii) based on such evaluation, reviewing and approving CEO compensation levels; (iv) recommending to the boardnon-CEO compensation, incentive compensation plans and equity-based plans; and (v) producing a report on executive compensation as required by the SEC to be included in the company’s annual proxy statement or annual report. The committee must also conduct an annual performance self-evaluation.
(The NYSE compensation committee requirements allow us, as a foreign private issuer, to follow our home country rules in this regard. We comply with our home country rules applicable to the Compensation Committee.) | Regulation 19 of SEBI (LODR) Regulations, 2015 read with Part D of Schedule II, the role of the committee shall include the following:
(1) formulation of the criteria for determining qualifications, positive attributes and independence of a director and recommend to the board a policy, relating to the remuneration of the directors, key managerial personnel and other employees;
(2) formulation of criteria for evaluation of Independent Directors and the board;
(3) devising a policy on board diversity;
(4) identifying persons who are qualified to become directors and who may be appointed in senior management in accordance with the criteria laid down, and recommend to the board their appointment and removal. The company shall disclose the remuneration policy and the evaluation criteria in its annual report.
(5) whether to extend or continue the term of appointment of the independent director, on the basis of the report of performance evaluation of independent directors. | ||
| Nominating/Corporate Governance Committee | |||
| Listed companies must have a nominating/corporate governance committee composed entirely of independent board members. | Companies Act, 2013 requires that every listed company shall constitute a nomination and remuneration committee, comprising of three or morenon-executive directors, out of which not less thanone-half shall be independent directors. This Committee is also required pursuant to the SEBI (LODR) Regulations, 2015. | ||
Standard for NYSE-Listed Companies | Requirements by the SEBI (LODR) Regulations, 2015 effective December 1, 2015 | |
The committee must have a written charter that addresses its purpose and responsibilities, which include (i) identifying individuals qualified to become board members; (ii) selecting, or recommending that the board select, the director nominees for the next annual meeting of shareholders; (iii) developing and recommending to the board a set of corporate governance principles applicable to the company; (iv) overseeing the evaluation of the board and management; and (v) conducting an annual performance evaluation of the committee.
(The NYSE nominating/corporate governance committee requirements do not apply to us as a foreign private issuer.) | Regulation 19 of SEBI (LODR) Regulations, 2015 read with Part D of Schedule II, the role of the committee shall include the following:
(1) Formulation of the criteria for determining qualifications, positive attributes and independence of a director and recommend to the board a policy, relating to the remuneration of the directors, key managerial personnel and other employees;
(2) Formulation of criteria for evaluation of Independent Directors and the board;
(3) Devising a policy on board diversity;
(4) Identifying persons who are qualified to become directors and who may be appointed in senior management in accordance with the criteria laid down, and recommend to the board their appointment and removal. The company shall disclose the remuneration policy and the evaluation criteria in its Annual Report.
(5) whether to extend or continue the term of appointment of the independent director, on the basis of the report of performance evaluation of independent directors. | |
| Corporate Governance Guidelines | ||
Listed companies must adopt and disclose corporate governance guidelines.
(The NYSE requirement that corporate governance guidelines be adopted does not apply to us as a foreign private issuer. However, we must disclose differences between the corporate governance standards to which we are subject and those of the NYSE.) | Corporate governance requirements for listed companies in India are included in Regulation 17 to 27 of SEBI (LODR) Regulations, 2015. | |
| Code of Business Conduct and Ethics | ||
All listed companies, United States and foreign, must adopt and disclose a code of business conduct and ethics for directors, officers and employees, and promptly disclose any waivers of the code for directors or executive officers.
(The NYSE requirement for a code of business conduct and ethics does not apply to us as a foreign private issuer.) | Regulation 17 (5) | |
| Regulation 17(5)(b) and Regulation 25(5) of SEBI (LODR) Regulations, 2015, | ||
• The Code of Conduct shall suitably incorporate the duties of independent directors as laid down in the Companies Act, 2013. | ||
• An independent director shall be held liable, only in respect of such acts of omission or commission by a company which had occurred with his knowledge, attributable through board processes, and with his consent or connivance or where he had not acted diligently with respect of the provisions contained in the | ||
C. Material Contracts
The following is a summary of each of our material contracts, other than contracts entered into in the ordinary course of business, to which we are a party, for the 2 years immediately preceding the date of this Annual Report.
Representative Office Agreement with Vedanta
SIIL entered into a representative office agreement with Vedanta on March 29, 2005 under which Vedanta agreed to provide technical and commercial materials to us to enable us to promote our business or raise funds overseas, and to be ournon-exclusive overseas representative, for which we agreed to pay an amount of $ 2.0 million per year to Vedanta. This agreement expired on March 31, 2013.
Since the effectiveness of theRe-organization Transactions, we renewed this agreement on similar terms with Vedanta on May 20, 2014 for a period of 5 years. Under this renewed agreement, we have agreed to pay an amount of $ 2.0 million to Vedanta. This agreement is valid until March 2018.
Consultancy Agreement with Vedanta
SIIL entered into a consultancy agreement with Vedanta on March 29, 2005 under which Vedanta agreed to provide strategic planning and consultancy services to us and our subsidiaries in various areas of business such that we are able to finalize and implement our plans for growth and are able to raise the necessary finances. The terms of this agreement were negotiated by us and Vedanta and we believe them to be fair and reasonable. Under this agreement, Vedanta agreed to make certain of its employees available to us. The anticipated fee used for reference in the agreement, which was based on a relevant proportion of the expected annual budgeted costs for fiscal year 2005 plus themark-up of 40.0%, was $ 3.0 million per year. This agreement expired on March 31, 2013.
Since the effectiveness of theRe-organization Transactions, we have renewed this agreement with Vedanta on May 20, 2014 for a period of 5 years on similar terms. This agreement is valid until March 2018. Under this agreement, Vedanta has agreed to make certain of its employees available to us and we have agreed to pay a service fee to Vedanta on the basis of, among other things, the amount of time spent in providing the services and associated costs for which we have agreed to pay an amount of $ 3.0 million per year.
Outsourcing Services Agreement with Vedanta
SIIL entered into a service agreement with Vedanta on April 1, 2010, under which we agreed to provide accounting, treasury and related services at the request of Vedanta from time to time. In consideration of above, Vedanta agreed to pay us service charges aggregating to an amount of $ 0.2 million per year.
Since the effectiveness of theRe-organization Transactions, we renewed this agreement with Vedanta on May 20, 2014 for a period of 5 years. This agreement is valid until March 2018 and Vedanta has agreed to pay us service charges aggregating to an amount of $ 0.35 million per year with an annual increase of 10.0%.
Outstanding loans
See Note 17 “Borrowings” in Notes to Consolidated Financial Statements for more details.
D. Exchange Controls
General
Ownership of Indian companies by foreignersnon-residents is regulated by the GoI and Reserve Bank of India (‘RBI’) under the provisions of Foreign Exchange Management Act of 1999 (“FEMA”(‘FEMA’), as amended, read with the rules, regulations and notifications issued under FEMA (‘Foreign Exchange Control Regulations’). Foreign investment in securities issued by Indian companies is generally regulated by the Foreign Exchange Control Regulations. A person resident outside India can transfer any security of an Indian company or any other security to an Indian resident only in accordance with the terms and conditions specified under Foreign Exchange Control Regulations made thereunder or as permitted by the RBI.
Foreign Direct Investment
The GoI had, pursuant to its liberalization policy, set up the FIPB,Foreign Investment Promotion Board (‘FIPB’), to regulate all foreign direct investment. Foreign direct investment (“FDI”), means investment bynon- resident entity or a person resident outside India in the capital of the Indian Company under Schedule 1 of Foreign Exchange Management (Transfer or Issue of Security by a Person Resident Outside India) Regulations 2000. FDI in India can be either through the automatic route or through the government approval route. Over a period of time, the GoI has relaxed the restrictions on foreign investment.
A person resident outside India or an entity incorporated outside India, can invest in India, subject to the FDI policyFDI. Recently, as a part of the Union Budget, the Finance Minister proposed to abolish the FIPB in a phased out manner in fiscal year 2018. On June 5, 2017, the GoI issued the Office Memorandum- F.No. 01/01/FC12017–FIPB, providing details regarding the specified sectoral regulatory bodies who would grant approval for foreign investment under the extant FDI Policy and transition with respect to applications pending before FIPB. As per the said memorandum, eleven notified sectors/activities requiring government approval would now approach the concerned administrative ministry or department. For instance, FDI proposals relating to mining sector would be approved by Ministry of Mines. FDI proposals requiring government approval for other termsresiduary sectors (except core investment companies) not covered under the specified sector list would be approved by Department of Industrial Policy and conditions as applicable. Promotion (‘DIPP’).
A person who is a citizen of Bangladesh or an entity incorporated in Bangladesh can invest in India under the FDI Scheme,Policy, with the prior approval of the GoI.DIPP and/ or the respective sectoral administrative ministries or departments. Further, a citizen of Pakistan or an entity incorporated in Pakistan can invest, only under the approval route, in sectors/activities other than defense,defence, space and atomic energy and sectors/activities prohibited for foreign investment.
Subject to certain conditions, under current regulations, FDI in most industry sectors does not require prior approval of the FIPBare under automatic route if the percentage of equity holding by all foreign investors does not exceed specified industry-specific thresholds. These conditions include certain minimum pricing requirements, compliance with the SEBI (Substantial Acquisition of Shares and Takeovers) Regulations, 2011, as amended, (“(‘the Takeover Code”Code’), exit and ownership restrictions based on the nature of the foreign investor. FDI is prohibited in certain sectors such as the lottery business, atomic energy, trading in transferable development rights, railways (other than permitted activities), real estate business or construction of farm houses (other than development of townships, construction of residential and commercial premises, roads or bridges and real estate investment trusts registered and regulated under the SEBI (REITs) Regulations 2014 and manufacturing of cigars.
Also, certain investments require the prior approval of the FIPB, including:
FDI policy had laidlays down guidelines for calculation of direct and indirect foreign investment in an Indian company.
A person residing outside India (other than a citizen of Pakistan or Bangladesh) or any entity incorporated outside India (other than an entity incorporated in Pakistan or Bangladesh and an overseas corporate body as defined in FEMA) has general permission to purchase equity shares (including partly paid up shares), convertible debentures or convertible preference shares of an Indian company (mandatorily required to be fully paid up and compulsorily convertible), subject to certain terms and conditions.
Currently, subject to certain exceptions, FDI and investment byNon-Resident Indians (“NRIs”(‘NRIs’) (as defined under FEMForeign Exchange Management (Deposit) Regulations, 2000), in Indian companies onnon-repatriation basis do not require the prior approval of the FIPB or the RBI subject to prohibition of investment in chit fund or a nidhi company or isinvestment in Indian companies engaged in agricultural/ plantation activities or real estate business or construction of farm houses (other than development of townships, construction of residential and commercial premises, roads or bridges and real investment trusts registered and regulated under the SEBI (REITs) Regulations 2014) or dealing in Transfer of Development Rights The GoI has indicated that in all cases where FDI is allowed on an automatic basis without FIPB approval,route , the RBI would continue to be the primary agency for the purposes of monitoring and regulating foreign investment.
As per the FDI Policy, downstream investment means indirect foreign investment (an investment by an Indian company/ Limited Liability Partnership (‘LLP’) which in turn, has foreign investment), into another Indian company/LLP, by way of subscription or acquisition. Downstream investment by an Indian company/LLP, which is owned and/or controlled bynon-resident entities, into another Indian company/LLP, must be in accordance with the relevant sectoral conditions and caps with regard to the sectors in which the latter Indian company/LLP is operating.
Downstream investments by Indian companies/LLP will be subject to the following conditions:
We are majorly controlled by anon-resident entity and hence all downstream investments made by us are subject to the above conditions.
Under the current regulations, following the Cairn India Merger sanctioned by the NCLT, Mumbai Bench, Vedanta Limited is engaged in the case of miningfollowing businesses:
Portfolio Investment byNon-Resident Indians
A variety of methods for investing in shares of Indian companies are available to NRIs. Under the portfolio investment scheme, each NRI can purchase (on repatriation as well asnon-repatriation basis) up to 5.0% of thepaid-up value of the share issued by an Indian company, subject to the condition that the aggregatepaid-up value of shares purchased by all NRIs does not exceed 10% of the paid up capital of the Company. The aggregate ceiling limit of 10.0% limit may be raised to 24.0% if a special resolution is passed in a general meeting of the shareholders of the company. In addition to portfolio investments in Indian companies, NRIs may also make foreign direct investments in Indian companies under the FDI route discussed above. These methods allow NRIs to make portfolio investments in shares and other securities of Indian companies on a basis not generally available to other foreign investors.
Overseas corporate bodies controlled by NRIs, were previously permitted to invest on more favorable terms under the portfolio investment scheme. The RBI no longer recognizes overseas corporate bodies as an eligible class of investment vehicle under various routes and schemes under the foreign exchange regulations.
Investment by Foreign Portfolio Investors
The SEBI (Foreign Portfolio Investors) Regulations, 2014 (“(‘FPI Regulations”Regulations’) came into effect, where the SEBI clarified on March 28, 2014 that the new regime would commence on June 1, 2014. All the existing foreign institutional investors (“(‘FIIs”), sub accounts and qualified foreign investors (“QFIs”(‘QFIs’) have been classified together into a new class of investors known as the foreign portfolio investors (“FPIs”(‘FPIs’). FPIs are required to be registered with the designated depositary participant on behalf of the SEBI subject to compliance, with ‘Know Your Customer’ norms. FPIs are permitted to invest only in the following securities:
A single foreign portfolio investor or an investor group is permitted to purchase equity shares of a company only below 10.0% of the total issued capital of the company. Subject to compliance with all applicable Indian laws, rules, regulations, guidelines and approvals in terms of the FPI Regulations, an FPI, other than a Category III foreign portfolio investor and unregulated broad based funds, which are classified as Category II foreign portfolio investors by virtue of their investment manager being regulated, may issue or otherwise deal in offshore derivative instruments (as defined under the FPI Regulations) directly or indirectly, only in the event (i) such offshore derivative instruments are issued only to persons who are regulated by an appropriate regulatory authority; and (ii) such offshore derivative instruments are issued after compliance with ‘Know Your Customer’Client’ norms. An FPI is also required to ensure that no further issue or transfer of any offshore derivative instrument is made by or on behalf of it to any persons that are not regulated by an appropriate foreign regulatory authority.
Any FII or QFI who holds a valid certificate of registration will be deemed to be a FPI until the expiry of the block of 3 years for which fees has been paid as provided by the SEBI (Foreign Institutional Investors) Regulations, 1995. All existing FIIs and sub accounts, subject to payment of conversion fees specified in the FPI Regulations, may continue to buy, sell or otherwise deal in securities subject to the provisions of the FPI Regulations, until the earlier of (i) expiry of its registration as a FII orsub-account, or (ii) obtaining a certificate of registration as an FPI. All QFIs may continue to buy, sell or otherwise deal in securities until the earlier of (i) up to a period of a one year from the date of commencement of the FPI Regulations or; (ii) obtaining a certificate of registration as an FPI. In furtherance of the FPI Regulations, the RBI amended relevant provisions of Foreign Exchange Management (Transfer or Issue of Security by a Person Resident outside India) Regulations, 2000 on March 13, 2014. The portfolio investor registered in accordance with the FPI Regulations would be called ‘Registered Foreign Portfolio Investor (“RFPI”(‘RFPI’)’. Accordingly, an RFPI may purchase and sell shares and convertible debentures of an Indian company through a registered broker as well as purchase shares and convertible debentures offered to the public under the FPI Regulations. Further, RFPI may sell shares or convertible debentures so acquired (i) in an open offer in accordance with the Takeover Code or (ii) in an open offer in accordance with the SEBI (Delisting of Equity Shares) Regulations, 2009; or (iii) through buyback of shares by a listed Indian company in accordance with the SEBI (Buy-back(Buy-back of Securities) Regulations, 1998. An RFPI may also acquire shares or convertible debentures (i) in any bid for, or acquisition of securities in response to an offer for disinvestment of shares made by the Central Government or any state government; or (ii) in any transaction in securities pursuant to an agreement entered into with merchant banker in the process of market making or subscribing to unsubscribed portion of the issue in accordance with Chapter XB of the SEBI (ICDR) Regulations, 2009.
The individual and aggregate investment limits for the RFPIs should be below 10.0% and up to 24.0% respectively of the totalpaid-up equity capital or 10.0% and 24.0% respectively of thepaid-up value of each series of convertible debentures issued by an Indian company and such investment should be within the overall sectoral caps prescribed under the FDI policy. The aggregate ceiling limit of 24.0% limit may be raised to up to the sectoral cap/ statutory ceiling, as applicable if a special resolution is passed in a general meeting of the shareholders of the company. An RFPI may invest in government securities and corporate debt subject to limits specified by the RBI and SEBI from time to time and to trade in all exchange traded derivative contracts on the stock exchanges in India subject to the position limits as specified by SEBI from time to time.
ADSs
Issue of ADSs
Issue of securities through the depository receipt mechanism by Indian companies is governed by the Companies Act, 2013 (Companies Act), the Companies (Issue of Global Depository Receipts) Rules, 2014 (Depository(“Depository Receipts Rules)Rules”) and the Depository Receipts Scheme, 2014 (the “DR Scheme”).
The GoI approved the DR Scheme on October 21, 2014, which came into force on December 15, 2014. Consequently, the Issue of Foreign Currency Convertible Bonds and Ordinary Shares (Through(through Depository Receipt Mechanism) Scheme, 1993 (the(“the 1993 Scheme”) has been repealed except to the extent relating to foreign currency convertible bonds. The DR Scheme is in addition to the other policies or facilities described above, relating to investments in Indian companies by foreign investors.
Under the DR Scheme, an Indian company, whether listed or unlisted, private or public, is permitted to issue securities, including equity shares, through the depository receipt mechanism if such company has not been specifically prohibited from accessing capital markets or dealing in securities.
In terms of the DR Scheme, securities can be issued through the depository receipt mechanism up to a limit so that the aggregate underlying securities issued to foreign depositories for issuance of depository receipts along with securities already held by persons resident outside India does not exceed the applicable foreign investment limits prescribed by regulations framed under the Foreign Exchange Management Act, 1999. The depository receipts and the underlying securities may be converted into each other subject to the applicable foreign investment limit.
The DR Scheme provides that underlying securities shall not be issued to a foreign depository for issuance of depository receipts at a price which is less than the price applicable to a corresponding mode of issuance to domestic investors.
In terms of the DR Scheme, the foreign depository is entitled to exercise voting rights, if any, associated with the underlying securities whether pursuant to voting instructions from the holder of depository receipts or otherwise. Further, a holder of depository receipts issued against underlying equity shares shall have the same obligations as if it were the holder of the equity shares if it has the right to issue voting instruction.
Restrictions on Redemption of ADSs, Sale of the Equity Shares Underlying the ADSs and the Repatriation of Sale Proceeds
Anon-resident holder of the ADSs may transfer such ADSs, or request that the overseas depositary bank redeem such ADSs. Anon-resident holder of ADS can transfer or redeem the ADS into underlying equity shares of the company subject to the procedures specified under the DR Scheme. In the case of redemption, the overseas depositary bank will request the domestic custodian bank to release the corresponding underlying shares in favor of thenon-resident investor for being sold directly on behalf of thenon- resident investor, or being transferred in the books of account of the company in the name of thenon-resident.
Foreign investors holding ADS or equity shares equal to or more than 25.0% of the company’s total equity capital/ voting rights may be required to make a public announcement of offer to the remaining shareholders of the company under the Takeover Code, whenon any acquisition of sharesequity capital/voting rights or ADS aboveequal to or more than 25.0% by the foreign investor exceeds the limits specified under the Takeover Code.investor.
Investors who seek to sell any equity shares in India withdrawn from the depositary facility and to convert the Rupee proceeds from the sale into foreign currency and repatriate the foreign currency from India will also be subject to certain exchange control restrictions on the conversion of Rupees into dollars. In June 2015, the RBI revised the restrictions on capital account transactions by resident Indians who are now permitted to remit up to $ 250,000 per financial year (April-March) for any permissible capital account transaction or a combination of capital account and current account transaction other than remittances made directly or indirectly to countries identified by the Financial Action Task Force as “non co-operative countries and territories.”
Fungibility of ADSs
As per the directions issued by the Ministry of Finance in coordination with RBI on thetwo-way fungibility of ADSs, an ADS holder who has redeemed the ADS into underlying equity shares and has sold it in the Indian Market is permitted to purchase to that extent, through a registered stock broker in India, shares of an Indian company for the purposes of converting the same into ADSs, subject, inter alia, to the following conditions:
Further, the amendment to the regulations permit an issuer in India to sponsor the issue of ADSs through an overseas depositary against underlying equity shares accepted from holders of its equity shares in India for offering outside of India. The sponsored issue of ADSs is possible only if the following conditions are satisfied:
The issuer is also required to furnish a report to the RBI specifying the details of the offering, including the amount raised through the offering, the number of ADSs issued, the underlying shares offered and the percentage of equity in the issuer represented by the ADSs.
Corporate Actions
The ADS holders are entitled to receive the benefits of corporate actions such as bonus, split and dividend in proportion to the number of equity shares represented by the ADS. The benefits are subject to the terms and conditions of the FEMA regulations and the offer documents of ADS issue.
Buyback of ADS
Shares issued under the ADR Scheme represented by the ADS, are eligible for participation in a buyback scheme, if any, announced by us. In the event that we decide to implement the buyback scheme for ADS holders, the option form for the buyback scheme will be distributed to the ADS custodian who will submit the same to the overseas depository. ADS holders who wish to participate in the buyback scheme may exercise the buyback option by converting the ADS into ordinary equity shares and surrendering those shares to the company under the buyback scheme.
FCCBs
Eligibility
Foreign Currency Convertible Bonds, or FCCBs, are convertible bonds issued by an Indian company expressed in foreign currency (such as US dollar), the principal and interest in respect of which is payable in foreign currency. FCCBs are required to be issued in accordance with the Issue of Foreign Currency Convertible Bonds and Ordinary Shares (Through Depository Receipt Mechanism) Scheme, 1993 (“the FCCB Scheme”) and subscribed by a non-resident in foreign currency and are convertible into equity shares of the issuing Indian company. The GoI approved the Depository Receipts Scheme (“DR Scheme”) on October 21, 2014, which came into force on December 15, 2014. Consequently, the FCCB Scheme in relation to depository receipts has been repealed; however, the FCCB Scheme continues to govern the FCCBs. The External Commercial Borrowing Guidelines, or ECB Guidelines, apply to FCCBs. The provisions of the Foreign Exchange Management (Transfer or Issue of any Foreign Security) Regulations 2004, as amended, are also applicable to FCCBs and the issue of FCCBs must adhere to such provisions.
Automatic Route
Under the terms of the FCCB Schemes and the Foreign Exchange Management (Transfer or Issue of any Foreign Security) Regulations 2004, as amended, read together with the ECB Guidelines, Indian companies are permitted to issue FCCBs under the automatic route in the manner set forth therein, subject to certain conditions specified therein, including:
The FCCBs issued by us were convertible into ADS subject to the terms and conditions of FEMA guidelines and the offering circular or issue prospectus of the FCCB. However, these convertible notes were due for maturity during fiscal year 2015 and have been repaid on the maturity date.
Pricing of FCCB Issue
Pursuant to a circular dated November 27, 2008 issued by the Ministry of Finance, the pricing guidelines set forth in the ADS and FCCB Schemes have been amended. Pursuant to the circular, the issue price of FCCB and ADS should be not less than the average of the weekly high and low of the closing prices of the related shares quoted on the stock exchange during the two weeks preceding the “relevant date”, where the “relevant date” means the date of the meeting on which our Board of Directors or the Committee of Directors duly authorized by the Board of Directors decides to issue the FCCB or ADS.
Regulatory Filings
We are required to make the following filings in connection with the issuance of FCCBs and upon conversion of the FCCBs into equity shares:
Buy Back of FCCBs
The RBI permitted buy back of FCCBs by Indian companies prior to the maturity date of such FCCB, after satisfying certain conditions under the approval route until March 31, 2013. On June 25, 2013, the RBI extended the scheme of buy-back of FCCBs under the approval route until December 31, 2013, after which the scheme is discontinued.
Restrictions on equity shares underlying the ADSs issued arising on conversion of FCCB’s and the repatriation of Sale Proceeds
FCCB holders who have converted the FCCBs into ADS in accordance with the provisions of the offering circular are entitled to the same rights and subject to the same conditions as normal ADS holders and may withdraw the equity shares underlying ADS from the depositary at any time. A person resident outside India may transfer the ADSs held in Indian companies to another person resident outside India without any permission. An ADS holder is permitted to surrender the ADSs held by him in an Indian company and to receive the underlying equity shares under the terms of the Deposit Agreement. Under Indian regulations, the re-deposit of these equity shares with the depositary to ADSs may not be permitted. In the case of redemption of FCCBs, the overseas depositary bank will request for the domestic custodian bank to release the corresponding underlying shares in favor of the non-resident investor, for being sold directly on behalf of the non- resident investor, or for being transferred in the books of account of the company in the name of the non-resident.
Foreign investors who elect to convert FCCB into ADS would be required to make a public announcement of offer to remaining shareholders of the company under the Takeover Code if the conversion results in their direct or indirect holding in the company equivalent to or in excess of 25.0% of the company’s total equity capital or voting rights.
Transfer of Shares
The RBI has now granted general permission to persons resident outside India to transfer shares and convertible debentures held by them to an Indian resident, subject to compliance with certain terms and conditions (including pricing norms) and reporting requirements. A resident who wishes to purchase shares from anon-resident must, pursuant to the relevant notice requirements, file a declaration with an authorized dealer in the prescribed FormFC-TRS within 60 days from the date of receipt of the amount of consideration, together with the relevant documents and file an acknowledgment thereof with the Indian company to effect transfer of the shares.
Anon-resident may also transfer any security to a person resident in India by way of gift. The transfer of shares from an Indian resident to anon-resident does not require the prior approval of the GoI or the RBI if the activities of the investee company are under the automatic route pursuant to the FDI Policy and are not under the specified financial services sector, thenon-resident shareholding is within sector limits under the FDI policy and the pricing is in accordance with the guidelines prescribed by SEBI and the RBI.
Anon-resident of India is generally permitted to sell equity shares underlying the ADSs held by him to any othernon-resident of India without the prior approval of the RBI. The RBI has granted general permission for the transfer of shares by a person resident outside India to a person resident in India, subject to compliance with certain pricing norms and reporting requirements.
Other than mutual funds that may purchase ADSs subject to terms and conditions specified by the RBI and employees in connection with stock options, a person resident in India is not permitted to hold ADSs of an Indian company. An ADS holder is permitted to surrender the ADSs held by him in an Indian company and to receive the underlying equity shares under the terms of the deposit agreement.
Exchange Rates
Substantially all of our revenue is denominated or paid with reference to US dollars and most of our expenses are incurred and paid in Indian Rupees or Australian dollars. We report our financial results in Indian Rupees. The exchange rates among the Indian Rupee, the Australian dollar and the US dollar have changed substantially in recent years and may fluctuate substantially in the future. The results of our operations are affected as the Indian Rupee and the Australian dollar appreciate or depreciate against the dollar and, as a result, any such appreciation or depreciation will likely affect the market price of our ADSs in the United States.
The following table sets forth, for the periods indicated, information concerning the exchange rates between Indian Rupees and US dollars based on the rates quoted on Federal Reserve Bank of New York:
| Period End(1) | Average(1)(2) | High | Low | |||||||||||||
Fiscal Year: | ||||||||||||||||
2012 | 50.89 | 48.01 | 53.71 | 44.00 | ||||||||||||
2013 | 54.52 | 54.47 | 57.13 | 50.64 | ||||||||||||
2014 | 60.00 | 60.35 | 68.80 | 53.65 | ||||||||||||
2015 | 62.31 | 61.11 | 63.67 | 58.30 | ||||||||||||
2016 | 66.25 | 65.39 | 68.84 | 61.99 | ||||||||||||
Month: | ||||||||||||||||
January 2016 | 67.87 | 67.33 | 68.08 | 66.49 | ||||||||||||
February 2016 | 68.21 | 68.24 | 68.84 | 67.57 | ||||||||||||
March 2016 | 66.25 | 66.89 | 67.75 | 66.25 | ||||||||||||
April 2016 | 66.39 | 66.42 | 66.70 | 66.05 | ||||||||||||
May 2016 | 67.12 | 66.89 | 67.59 | 66.36 | ||||||||||||
June 2016 | 67.51 | 67.27 | 67.92 | 66.51 | ||||||||||||
July 2016 (through July 15, 2016) | 67.07 | 67.17 | 67.49 | 66.81 | ||||||||||||
Notes:
The following table sets forth, for the periods indicated, information concerning the exchange rates between the Australian dollars and US dollars based on the Federal Reserve Bank of New York:
| Period End(1) | Average(1)(2) | High | Low | |||||||||||||
Fiscal Year: | ||||||||||||||||
2012 | 0.96 | 0.95 | 1.06 | 0.91 | ||||||||||||
2013 | 0.96 | 0.97 | 1.03 | 0.94 | ||||||||||||
2014 | 1.08 | 1.07 | 1.15 | 0.95 | ||||||||||||
2015 | 1.31 | 1.15 | 1.32 | 1.05 | ||||||||||||
2016 | 1.30 | 1.36 | 1.46 | 1.23 | ||||||||||||
Month: | ||||||||||||||||
January 2016 | 1.41 | 1.43 | 1.46 | 1.40 | ||||||||||||
February 2016 | 1.40 | 1.40 | 1.42 | 1.38 | ||||||||||||
March 2016 | 1.30 | 1.33 | 1.39 | 1.30 | ||||||||||||
April 2016 | 1.31 | 1.30 | 1.33 | 1.28 | ||||||||||||
May 2016 | 1.38 | 1.37 | 1.39 | 1.31 | ||||||||||||
June 2016 | 1.35 | 1.35 | 1.38 | 1.32 | ||||||||||||
July 2016 (through July 15, 2016) | 1.32 | 1.32 | 1.34 | 1.31 | ||||||||||||
Notes:
The following table sets forth, for the periods indicated, information concerning the exchange rates between the South African Rands and US dollars based on the Federal Reserve Bank of New York:
| Period End(1) | Average(1)(2) | High | Low | |||||||||||||
Fiscal Year: | ||||||||||||||||
2012 | 7.66 | 7.41 | 8.55 | 6.57 | ||||||||||||
2013 | 9.18 | 8.55 | 9.32 | 7.63 | ||||||||||||
2014 | 10.53 | 10.11 | 11.25 | 8.90 | ||||||||||||
2015 | 12.14 | 11.06 | 12.47 | 10.30 | ||||||||||||
2016 | 14.71 | 13.75 | 16.88 | 11.72 | ||||||||||||
Month: | ||||||||||||||||
January 2016 | 15.95 | 16.32 | 16.88 | 15.62 | ||||||||||||
February 2016 | 15.75 | 15.76 | 16.18 | 15.18 | ||||||||||||
March 2016 | 14.71 | 15.38 | 16.14 | 14.71 | ||||||||||||
April 2016 | 14.24 | 14.59 | 15.15 | 14.22 | ||||||||||||
May 2016 | 15.72 | 15.33 | 15.88 | 14.33 | ||||||||||||
June 2016 | 14.78 | 15.05 | 15.60 | 14.43 | ||||||||||||
July 2016 (through July 15, 2016) | 14.35 | 14.52 | 14.79 | 14.23 | ||||||||||||
Notes:
The following table sets forth, for the periods indicated, information concerning the exchange rates between the Namibian dollars and US dollars based on Oanda.com:
| Period End(1) | Average(1)(2) | High | Low | |||||||||||||
Fiscal Year: | ||||||||||||||||
2012 | 7.73 | 7.46 | 8.58 | 6.59 | ||||||||||||
2013 | 9.24 | 8.55 | 9.32 | 7.66 | ||||||||||||
2014 | 10.58 | 10.11 | 11.26 | 8.90 | ||||||||||||
2015 | 12.08 | 11.05 | 12.47 | 10.28 | ||||||||||||
2016 | 14.82 | 13.77 | 16.81 | 11.76 | ||||||||||||
Month: | ||||||||||||||||
January 2016 | 15.85 | 16.25 | 16.81 | 15.45 | ||||||||||||
February 2016 | 16.03 | 15.79 | 16.20 | 15.19 | ||||||||||||
March 2016 | 14.82 | 15.37 | 15.97 | 14.82 | ||||||||||||
April 2016 | 14.21 | 14.60 | 15.14 | 14.21 | ||||||||||||
May 2016 | 15.76 | 15.30 | 15.86 | 14.21 | ||||||||||||
June 2016 | 14.77 | 15.08 | 15.66 | 14.50 | ||||||||||||
July 2016 (through July 15, 2016) | 14.30 | 14.53 | 14.80 | 14.30 | ||||||||||||
Notes:
Although we have translated selected Indian Rupee, Australian dollar amounts, South African Rand and Namibian dollars in this Annual Report into US dollars for convenience, this does not mean, and no representation is made, that the Indian Rupee, Australian dollar, South African Rand and Namibian dollars amounts referred to represent US dollar amounts or have been, could have been or could be converted to US dollars at any particular rate, the rates stated above, or at all. Unless otherwise stated herein, all translations in this Annual Report from Indian Rupees to US dollars are based on the exchange rate quoted by the Federal Reserve Bank of New York on March 31, 2016, which was Rs. 66.25 per $ 1.00, all translations from Australian dollars to US dollars are based on the exchange rate quoted by the Federal Reserve Bank of New York on March 31, 2016, which was AUD 1.30 per $ 1.00, all translations from South African Rand to US dollars are based on the exchange rate quoted by the Federal Reserve Bank of New York on March 31, 2016, which was ZAR 14.71 per $ 1.00 and all translations from Namibian dollars to US dollars are based on the exchange rate quoted by Oanda (data available at www.oanda.com) on March 31, 2016, which was NAD 14.82 per $ 1.00. As of July 15, 2016, the exchange rate between US dollars and Indian Rupees was $ 1.00 = Rs. 67.07 as quoted by the Federal Reserve Bank of New York.
E. Taxation
India Taxation
The following is a summary of the material Indian income tax, wealth tax, stamp duty and estate duty consequences of the purchase, ownership and disposal of the ADSs and the equity shares underlying the ADSs fornon-resident investors of the ADSs. The summary only addresses the tax consequences fornon-resident investors who hold the ADSs or the equity shares underlying the ADSs as capital assets and does not address the tax consequences which may be relevant to other classes ofnon-resident investors, including dealers. The summary proceeds on the basis that the investor continues to remain anon-resident when the income by way of dividends and capital gains are earned. The summary is based on Indian tax laws and relevant interpretations thereof as are in force as of the date of this Annual Report, including the Income Tax Act and the special tax regimes under Sections 115AC of the Income Tax Act read with the Issue of Foreign Currency Convertible Bonds and Ordinary Shares (Through Depository Receipt Mechanism) Scheme, 1993, as amended, which provides for the taxation of persons resident in India on their global income and persons not resident in India on income received, accruing or arising in India or deemed to have been received, accrued or arisen in India, and is subject to change.
The Finance Act 2013 has included General Anti Avoidance Rule (“GAAR”), wherein the tax authority may declare an arrangement as an impermissible avoidance arrangement if an arrangement is not entered at arm’s length, results in misuse/ abuse of provisions of Income Tax Act, 1961, lacks commercial substance or the purpose of arrangement is obtaining a tax benefit. If any of our transactions are found to be ‘impermissible avoidance arrangements’ under GAAR, our business may be affected.
The GAAR was originally proposed to become effective from April 1, 2013. Thereafter, a panel was formed to study the proposed GAAR, and make suitable recommendations. In September 2013, the GoI notified rules regarding the applicability of GAAR provisions. In the Finance Act 2015 it is proposed that the implementation of GAAR be deferred by two years and GAAR provisions be made applicable to the income of the fiscal year 2018 and subsequent years by an amendment of the Income Tax Act. Further, investments made up to March 31, 2017 are protected from the applicability of the GAAR amendment in the relevant rules in this regard.
This summary is not intended to constitute a complete analysis of all the tax consequences for anon-resident investor under Indian law in relation to the acquisition, ownership and disposal of the ADSs or the equity shares underlying the ADSs and does not deal with all possible tax consequences relating to an investment in the equity shares and ADSs, such as the tax consequences under state, local and other (for example,non-Indian) tax laws.
Residence
For the purpose of the Income Tax Act, an individual is considered to be a resident of India during fiscal year if he is in India for at least 182 days in a particular year or at least 60 days in a particular year and for a period or periods aggregating at least 365 days in the preceding 4 years. However, the 60 days period shall be read as 182 days in the case of (i) a citizen of India who leaves India in the previous year for employment outside India, or (ii) a citizen of India or a person of Indian origin living abroad who visits India. Previously, a company was considered to be resident in India if it was incorporated in India or the control and management of its affairs is situated wholly in India during the relevant fiscal year. However, the Finance Act 2015 changed the criteria for deciding the residential status of a company in India by stating that the place of effective management of a company would be the critical factor for such determination. Individuals and companies who are not residents of India based on the above mentioned criteria are treated asnon-residents. In the Finance Act 2016, place of effective management compliance has been deferred by one year. The new requirements have been made applicable from assessment year2017-18. The Indian Income Tax department has further clarified that guidelines regarding the place of effective management shall not be applicable to companies having turnover of Rs.500 million or less in a financial year.
Taxation of Sale of the ADSs
It is unclear whether capital gains derived from the sale by anon-resident investor of rights in respect of ADSs will be subject to tax liability in India. This will depend on the view taken by Indian tax authorities on the position with respect to the situs of the rights being transferred in respect of the ADSs. The Finance Act, 2012 retrospectively amended the term “property” so as to include any rights in or in relation to an Indian company. Therefore, situs of right in respect of ADSs may be considered as situated in India. Nevertheless, under the ADR Scheme and as per section 47(viia) of theIncome-tax Act, the transfer of ADSs outside India by anon-resident holder to anothernon-resident does not give rise to any capital gain tax in India. Under the ADR Scheme, conversion of ADSs into equity shares shall not give rise to any capital gain tax in India.
ADSs are considered as long-term capital assets if they are held for a period of more than 36 months otherwise they are considered as short-term capital assets. Section 115AC of the Income Tax Act provides that income by way of long-term capital gains arising from the transfer of ADSs by thenon-resident holder is taxed at the rate of 10.0% plus applicable surcharge and education cess; short term capital gains on such a transfer is taxed at the rate of 30.0% (40.0% in case of a foreign company) plus applicable surcharge and education cess. Because there are significant intricacies relating to application of rules on indirect transfers, it is not clear, whether or to what extent, a buyer of ADS of the company should be held liable for not withholding tax on the acquisition of shares or be subject to Indian tax on gains realized on disposition of ADS. However thenon-resident investor may examine exemption, if any available to him, from such taxation under the relevant Double Taxation Agreement between India and country of his residence.
The incidence of capital gains and the period of holding, in the event ADSs are converted into shares and the shares are sold within a period of 36 months, may be checked with the tax counsels.
Taxation of Dividends
Dividends paid tonon-resident holders of ADSs are not presently subject to tax in the hands of the recipient. However, the company that is distributing the dividend was liable to pay a “dividend distribution tax” at the rate of 15.0% (on a gross basis) plus a surcharge of 10.0% and an education cess at the rate of 3.0%. According to the Finance (No. 2) Act, 2014, dividend distribution tax is to be levied on gross distributable surplus amount instead of amount paid net of taxes. This resulted in an increase in the dividend distribution tax to more than 20%, from 16.995% in the earlier years which was applicable to the dividends declared, distributed or paid on or after October 1, 2014. According to the Finance Act 2015, the surcharge on dividend tax has increased from 10% to 12%, and the effective dividend distribution tax rate is 20.358%20.35% with effect from April 1, 2016. Under Section 115O(1A) of the Income Tax Act 1961, an Indian company, subject to certain conditions, can set off the dividend income received from its subsidiaries against the amount of dividend declared and distributed by it to its shareholders, therefore reducing the dividend distribution tax to the extent of suchset-off.
Any distribution of additional ADS or equity shares to resident ornon-resident shareholders will not be subject to any Indian tax.
Further the Finance Act 2016 has provided that any income earned by an individual, Hindu Undivided Family (HUF) or a firm, who is a resident in India, by way of dividend declared, distributed or paid by any domestic company in excess of Rs.1, 000,000 in aggregate shall be chargeable to tax at the rate of 10%10.0% on gross basis on such amount exceeding Rs.1, 000,000Rs.1,000,000
Taxation of Sale of the Equity Shares
Sale of equity shares by any holder may occasion certain incidence of tax in India, as discussed below. Under applicable law, the sale of equity shares may be subject to a transaction tax and/or tax on income by way of capital gains. Capital gains accruing to anon-resident investor on the sale of the equity shares, whether to an Indian resident or to a person resident outside India and whether in India or outside India, may be subject to Indian capital gains tax in certain instances as described below.
Sale of the Equity Shares on a Recognized Stock Exchange
Shares listed on recognized stock exchange in India issued on conversion of the ADSs held by thenon-resident investor for a period of more than 12 months is treated as long term capital assets, otherwise they are considered as short term capital asset. Unlisted shares are treated as long-term capital assets, if they are held for more than 3624 months, otherwise they are treated as short-term capital assets.
Subject to the following, long-term capital gains realized by anon-resident upon the sale of equity shares obtained on conversion of ADSs are subject to tax at a rate of 10.0% along with the applicable surcharge and education cess; and short-term capital gains on such a transfer will be taxed at the rate of tax applicable to the seller;
In accordance with applicable Indian tax laws, any income arising from a sale of the equity shares of an Indian company through a recognized stock exchange in India is subject to a securities transaction tax. Such tax is payable by a person irrespective of residential status and is collected by the recognized stock exchange in India on which the sale of the equity shares is effected.
Withholding tax on capital gains on sale of shares tonon-resident is required to be deducted under Section 195 of the Income Tax Act at the prescribed rates.
For the purpose of computing capital gains on the sale of equity shares, the sale consideration received or accruing on such sale shall be reduced by the cost of acquisition of such equity shares and any expenditure incurred wholly and exclusively in connection with such sale. Under the Issue of Foreign Currency Convertible Bonds and Ordinary Shares (Through Depository Receipt Mechanism) Scheme, 1993, or Scheme, the purchase price of equity shares in India listed company received in exchange for ADSs will be the market price of the underlying shares on the date that the depositary gives notice to the custodian of the delivery of equity shares in exchange for such corresponding ADSs. The market price is the price of the equity shares prevailing in the BSE or the NSE as applicable. There is no corresponding provision under the Income Tax Act providing for the use of market price as the basis for determination of the purchase price of the equity shares. In the event that the tax department denies the use of market price as the basis for determination of the purchase price of the equity shares, the original purchase price of the ADSs shall be considered as the purchase price of the equity shares for computing the capital gains tax.
According to the Scheme, anon-resident’s holding period for the purpose of determining the applicable capital gains tax rate relating to equity shares received in exchange for ADSs commences on the date of notice of redemption by the depositary to the custodian.
Securities Transaction Tax
Since October 1, 2004, with respect to a sale and purchase of equity shares entered into on a recognized stock exchange, (i) both the buyer and seller are required to pay a Securities Transaction Tax (STT) at the rate of 0.1% of the transaction value of the securities, if the transaction is a delivery based transaction, i.e. the transaction involves actual delivery or transfer of shares; the rate of 0.1% has been substituted for 0.125% by the Finance Act, 2012 with effect from July 1, 2012. (ii) the seller of the shares is required to pay a STT at the rate of 0.025% of the transaction value of the securities if the transaction is anon-delivery based transaction, i.e. a transaction settled without taking delivery of the shares. STT is levied with respect to a sale and purchase of a derivative and the rates of STT as amended by Finance Act, 2013 with effect from June 1, 2013 is as follows: (i) in case of sale of an option in securities, the seller is required to pay an STT at the rate of 0.017% of the option premium; (ii) in case of a sale of an option in securities, where the option is exercised, the buyer is required to pay a STT at the rate of 0.125% of the settlement price; and (iii) in case of sale of futures in securities, the seller is required to pay STT at 0.017% on transaction value. This rate of 0.017% changed to 0.01% under the Finance Act, 2013.
Capital Losses
The losses arising from a transfer of a capital asset in India can only be set off against capital gains and not against any other income in accordance with the Income Tax Act. A long-term capital loss may be set off only against a long-term capital gain. To the extent the losses are not absorbed in the year of transfer, they may be carried forward for a period of 8 years immediately succeeding the year for which the loss was first computed and may be set off against the capital gains assessable for such subsequent years. In order to get the benefit ofset-off of the capital losses in this manner, thenon-resident investor must file appropriate and timely tax returns in India.
Tax Treaties
The above mentioned tax rates and the consequent taxation are subject to any benefits available to anon-resident investor under the provisions of any agreement for the avoidance of double taxation entered into by the GoI with the country of tax residence of suchnon-resident investor. The investors are advised to consult their tax advisors the residential status for the purpose of treaty benefits in the event the investments are made through special purpose vehicle in an overseas jurisdiction.
Withholding Tax on Capital Gains
Any taxable gain realized by anon-resident from the sale of ADSs shall be subject to withholding tax of 10.0% at source and withheld by the buyer. However, no withholding tax is required to be withheld under Section 196D-(2) of the Income Tax Act from any income accruing to a FII as defined in Section 115AD of the Income Tax Act on the transfer of securities. The FII is required to pay the tax on its own behalf.
Buy-Back of Securities
Indian companies are not subject to tax on thebuy-back of their equity shares which are listed on a stock exchange. However, such shareholders will be taxed on the resulting gains from the sharebuy-back. We would be required to withhold tax at source in proportion to the capital gains tax liability of our shareholders.
Stamp Duty
Upon the issuance of the equity shares underlying the ADSs, we are required to pay a stamp duty for each equity share equal to 0.1% of the issue price. Under Indian stamp law, no stamp duty is payable on the acquisition or transfer of equity shares in book-entry form. However, a sale of equity shares by anon-resident holder will be subject to Indian stamp duty at the rate of 0.25% on the market value of equity shares on the trade date, although such duty is customarily borne by the transferee. A transfer of ADSs is not subject to Indian stamp duty.
Wealth Tax, Gift Tax and Inheritance Tax
The holding of ADSs bynon-resident investors and the holding of the equity underlying shares by the depositary in a fiduciary capacity is exempt from payment of wealth tax. Further, there is no tax on gifts and inheritances which applies to the ADSs, or the equity shares underlying the ADSs. The Finance Act 2015 has abolished the levy of wealth tax under theWealth-tax Act, 1957 with effect from April 1, 2015.
Service Tax
BrokeragePrior to July 1, 2017, brokerage or commission fees paid to stockbrokers in connection with the sale or purchase of equity shares arewere subject to an Indian service tax at the effective tax rate of 12.36% (including cess of 3.0%) collected by the stockbroker (from February 24, 2009 to March 31, 2012 service tax was 10.3%). Further, pursuant to Section 65(101) of the Finance Act (2 of the 2004) asub-broker is was also subject to this service tax. The Finance Act 2015 increased the service tax rate from 12.36% to 14% effective from June 1, 2015. The ‘Education Cess’ and ‘Secondary and Higher Education Cess’ shall bewere subsumed in the revised rate of service tax of 14%14.0%. In addition to service tax, the GoI has further levied Swachh Bharat Cess at the rate of 0.50% on the value of taxable services effective from November 15, 2015 The2015.The Finance Act 2016 has further levied Krishi kalyan cessKalyan Cess at the rate of 0.50% on the value of taxable services effective from June 1, 20162016.
Goods and Service Tax (GST)
With effect from July 1, 2017, service tax was subsumed under GST. Therefore, brokerage or commission fees paid to stockbrokers in connection with the sale or purchase of equity shares became subject to GST at the rate of 18.0% andsub-brokers also became subject to GST at the same rate. Further, as a result of the Taxation Law Amendment Act, 2017- “Education Cess”, “Secondary Higher Education Cess”, “Swatch Bharat Cess” and “Krishi Kalyan Cess” has been abolished.
Minimum Alternate Tax
The Income Tax Act imposes a Minimum Alternate Tax on companies wherein the income tax payable on the total income is less than 18.5% of its book profit. The Minimum Alternate Tax is payable at the rate of 18.5% plus applicable surcharge and cess. The Finance Act 2013 increased the surcharge on income of domestic companies having taxable income above Rs. 100 million ($ 1.5 million) from 5.0% to 10.0% which resulted in the increase in the effective Minimum Alternate Tax rate for such companies from 20.01% to 20.96%. The Finance Act, 2015 has increased the surcharge to 12% which resulted in an increase in the effective Minimum Alternate Tax rate for such companies to 21.342%21.34%. Amounts paid as Minimum Alternate Tax may be applied towards regular income taxes payable in any of the succeeding 1015 years (as amended by the Finance Act 2017) subject to certain conditions. The manner of computing the Minimum Alternate Tax which can be claimed as a credit is specified in the Income Tax Act. The Finance Act, 2007, included income eligible for deductions under section 10A and 10B of the Act in the computation of book profits for the levy of Minimum Alternate Tax, and determined that Minimum Alternate Tax is payable on income which falls within the ambit of section 10A and 10B of the Act.
Tax Credit
Anon-resident investor may be entitled to a tax credit with respect to any withholding tax paid by us or any other person for suchnon-resident investor’s account in accordance with the applicable laws of the applicable jurisdiction.
United States Federal Income Taxation
The following discussion describes certain material United States federal income tax consequences to US Holders (defined below) under present law of an investment in the ADSs or equity shares. This summary applies only to investors that hold the ADSs or equity shares as capital assets (generally, property held for investment) and that have the US dollar as their functional currency. This discussion is based on the United States Internal Revenue Code of 1986, as amended, as in effect on the date of this Annual Report and on United States Treasury regulations in effect or, in some cases, proposed, as of the date of this Annual Report, as well as judicial and administrative interpretations thereof available on or before such date. All of the foregoing authorities are subject to change, which change could apply retroactively and could affect the tax consequences described below. The summary below does not discuss certain United States federal tax consequences that may be relevant to a particular US Holder’s particular circumstances, such as Medicare contribution tax on net investment income.
The following discussion neither deals with the tax consequences to any particular investor nor describes all of the tax consequences applicable to persons in special tax situations such as:
INVESTORS SHOULD CONSULT THEIR TAX ADVISORS ABOUT THE APPLICATION OF THE UNITED STATES FEDERAL TAX RULES TO THEIR PARTICULAR CIRCUMSTANCES AS WELL AS THE STATE AND LOCAL, FOREIGN AND OTHER TAX CONSEQUENCES TO THEM OF THE OWNERSHIP AND DISPOSITION OF ADSs OR EQUITY SHARES.
The discussion below of the United States federal income tax consequences to “US Holders” will apply to you if you are a beneficial owner of ADSs or equity shares and you are, for United States federal income tax purposes,
If an entity or arrangement treated as a partnership for United States federal income tax purposes holds ADSs or equity shares, the tax treatment of a partner will generally depend upon the status and the activities of the partnership. A US Holder that is a partner in a partnership holding ADSs or equity shares is urged to consult its tax advisor.
The discussion below assumes that the representations contained in the deposit agreement are true and that the obligations in the deposit agreement and any related agreement will be complied with in accordance with their terms. If you hold ADSs, you should be treated as the holder of the underlying equity shares represented by those ADSs for United States federal income tax purposes.
The United States Treasury has expressed concerns that parties to whom ADSs arepre-released may be taking actions that are inconsistent with the claiming, by US Holders of ADSs, of foreign tax credits for United States federal income tax purposes. Such actions would also be inconsistent with the claiming of the reduced rate of tax applicable to dividends received by certainnon-corporate US Holders, as described below. Accordingly, the availability of foreign tax credits or the reduced tax rate for dividends received by certainnon-corporate US Holders could be affected by future actions that may be taken by the United States Treasury or parties to whom ADSs arepre-released.
Taxation of Dividends and Other Distributions on the ADSs or Equity Shares
Subject to the PFIC rules discussed below, the gross amount of any distributions we make to you with respect to the ADSs or equity shares generally will be includible in your gross income as foreign source dividend income on the date of receipt by the depository, in the case of ADSs, or by you, in the case of equity shares, but only to the extent that the distribution is paid out of our current or accumulated earnings and profits (as determined under United States federal income tax principles). Any such dividends will not be eligible for the dividends received deduction allowed to corporations in respect of dividends received from other United States corporations. To the extent that the amount of the distribution exceeds our current and accumulated earnings and profits (as determined under United States federal income tax principles), such excess amount will be treated first as atax-free return of your tax basis in your ADSs or equity shares, and then, to the extent such excess amount exceeds your tax basis in your ADSs or equity shares, as capital gain. However, we currently do not, and we do not intend to calculate our earnings and profits under United States federal income tax principles. Therefore, a US Holder should expect that any distribution will generally be reported as a dividend even if that distribution would otherwise be treated as anon-taxable return of capital or as capital gain under the rules described above.
With respect to certainnon-corporate US Holders, including individual US Holders, dividends may be taxed at the lower applicable capital gains rate applicable to “qualified dividend income”, provided that (1) the ADSs or equity shares, as applicable, are readily tradable on an established securities market in the United States or we are eligible for the benefits of the United States-India income tax treaty, (2) we are neither a PFIC nor treated as such with respect to you (as discussed below) for the taxable year in which the dividend is paid or the preceding taxable year, and (3) the equity shares are held for a holding period of more than 60 days during the 121 – day period beginning 60 days before theex-dividend date. Under US Internal Revenue Service authority, equity shares or ADSs representing such shares, are considered for the purpose of clause (1) above to be readily tradable on an established securities market in the United States if they are listed on the NYSE, as our ADSs currently are. You should consult your tax advisors regarding the availability of the lower capital gains rate applicable to qualified dividend income for any dividends paid with respect to our ADSs or equity shares.
Any dividends will constitute foreign source income for foreign tax credit limitation purposes. If the dividends are taxed as qualified dividend income (as discussed above), the amount of the dividend taken into account for purposes of calculating the foreign tax credit limitation will in general be limited to the gross amount of the dividend, multiplied by the reduced tax rate applicable to qualified dividend income and divided by the highest tax rate normally applicable to dividends. The limitation on foreign taxes eligible for credit is calculated separately with respect to specific classes of income. For this purpose, any dividends distributed by us with respect to ADSs or equity shares will generally constitute “passive category income” but could, in the case of certain US Holders, constitute “general category income.” A US Holder may not be able to claim a foreign tax credit for any Indian taxes imposed with respect to dividend distribution taxes on ADSs or equity shares (as discussed under “- India Taxation—Taxation of Dividends”). The rules relating to the determination of the foreign tax credit are complex and US Holders should consult their tax advisors to determine whether and to what extent a credit would be available in their particular circumstances, including the effects of any applicable income tax treaties.
Taxation of a Disposition of ADSs or Equity Shares
Subject to the PFIC rules discussed below, upon a sale or other disposition of ADSs or equity shares, a US Holder will generally recognize a capital gain or loss for United States federal income tax purposes in an amount equal to the difference between the amount realized for the ADS or equity share and such US Holder’s tax basis in such ADSs and equity shares. Any such gain or loss will be treated as long-term capital gain or loss if the US Holder’s holding period in the ADSs and equity shares at the time of the disposition exceeds one year. Long-term capital gain of individual US Holders generally will be subject to United States federal income tax at reduced tax rates. The deductibility of capital losses is subject to limitations. Any such gain or loss that you recognize generally will be treated as United States source income or loss for foreign tax credit limitation purposes.
Because gains generally will be treated as United States source gain, as a result of the United States foreign tax credit limitation, any Indian income tax imposed upon capital gains in respect of ADSs or equity shares (as discussed under “— India Taxation — Taxation of Sale of the ADSs,” “—India Taxation—Taxation of Sale of the Equity Shares,” “—India Taxation—Sale of the Equity Shares on a Recognized Stock Exchange,” “—India Taxation—Sale of the Equity Shares otherwise than on a Recognized Stock Exchange” and “—IndiaTaxation—Buy-Back of Securities”) may not be currently creditable unless a US Holder has other foreign source income for the year in the appropriate United States foreign tax credit limitation basket. US Holders should consult their tax advisors regarding the application of Indian taxes to a disposition of an ADS or equity share and their ability to credit an Indian tax against their United States federal income tax liability.
Passive Foreign Investment Company
Based on the market prices of our equity shares and ADSs and the composition of our income and assets, including goodwill, although not clear, we do not believe we were a PFIC for United States federal income tax purposes for our taxable year ended March 31, 2016.2017. However, the application of the PFIC rules is subject to uncertainty in several respects and, therefore, the US Internal Revenue Service may assert that, contrary to our belief, we were a PFIC for such taxable year. Moreover, although the asset test (defined below) is required to be calculated based on the fair market value of our assets, we did not do a valuation of our assets and our belief that we were not a PFIC for our taxable year ended March 31, 20162017 is, in part, based on the book value of our assets. In addition, we must make a separate determination each taxable year as to whether we are a PFIC (after the close of each taxable year). A decrease in the market value of our equity shares and ADSs and/or an increase in cash or other passive assets would increase the relative percentage of our passive assets. Accordingly, we cannot assure you we will not be a PFIC for the taxable year ending on March 31, 20162017 or any future taxable year.
Anon-United States corporation will be a PFIC for United States federal income tax purposes for any taxable year if, applying certain look-through rules either:
For this purpose, we will be treated as owning our proportionate share of the assets and earning our proportionate share of the income of any other corporation in which we own, directly or indirectly, 25.0% (by value) of the stock. A separate determination must be made after the close of each taxable year as to whether we were a PFIC for that year. Because the value of our assets for purposes of the PFIC test will generally be determined by reference to the market price of our equity shares and ADSs, fluctuations in the market price of our equity shares and ADSs may cause us to become a PFIC. In addition, changes in the composition of our income or assets may cause us to become a PFIC. Our market capitalization was volatile during the year ended March 31, 2016,2017, in particular at the beginning, which added greater uncertainty and increased the risk of becoming a PFIC. While we still believe we were not a PFIC, there is no guarantee that the U.S. Internal Revenue service would agree such on position.
If we are a PFIC for any taxable year during which you hold ADSs or equity shares, we generally will continue to be treated as a PFIC with respect to you for all succeeding years during which you hold our equity shares or ADSs, unless we cease to be a PFIC and you make a “deemed sale” election with respect to the equity shares or ADSs. If such election is timely made, you will be deemed to have sold the ADSs and equity shares you hold at their fair market value on the last day of the last taxable year in which we qualified as a PFIC and any gain from such deemed sale would be subject to the consequences described in the following two paragraphs. In addition, a new holding period would be deemed to begin for the equity shares and ADSs for purposes of the PFIC rules. After the deemed sale election, your equity shares or ADSs with respect to which the deemed sale election was made will not be treated as shares in a PFIC unless we subsequently become a PFIC.
For each taxable year that we are treated as a PFIC with respect to you, you will be subject to special tax rules with respect to any “excess distribution” that you receive and any gain you recognize from a sale or other disposition (including a deemed sale discussed in the precedent paragraph and a pledge) of the ADSs or equity shares, unless you make a “mark-to-market”“mark-to-market” election as discussed below. Distributions you receive in a taxable year that are greater than 125.0% of the average annual distributions you received during the shorter of the three preceding taxable years or your holding period for the ADSs or equity shares will be treated as an excess distribution. Under these special tax rules:
In addition,non-corporate US Holders will not be eligible for reduced rates of taxation on any dividends received from us (as described above under “—Taxation of Dividends and Other Distributions on the ADSs or Equity Shares”) if we are a PFIC in the taxable year in which such dividends are paid or in the preceding taxable year.
The tax liability for amounts allocated to taxable years prior to the year of disposition or “excess distribution” cannot be offset by any net operating losses for such years, and gains (but not losses) realized on the sale or other disposition of the ADSs or equity shares cannot be treated as capital, even if you hold the ADSs or equity shares as capital assets.
If we are treated as PFIC with respect to you for any taxable year, to the extent any of our subsidiaries are also PFICs or we make direct or indirect equity investments in other entities that are PFICs, you may be deemed to own shares in such lower-tier PFICs that are directly or indirectly owned by us in that proportion which the value of the ADSs and equity shares you own bears to the value of all of the ADSs and equity shares, and you may be subject to the adverse tax consequences described in the preceding two paragraphs with respect to the shares of such lower-tier PFICs that you would be deemed to own. You should consult your tax advisor regarding the applicability of the PFIC rules to any of our PFIC subsidiaries
A US Holder of “marketable stock” (as defined below) in a PFIC may make amark-to-market election for such stock to elect out of the PFIC rules described above regarding excess distributions and recognized gains. If you make a validmark-to-market election for the ADSs or equity shares, you will include in income for each year that we are a PFIC an amount equal to the excess, if any, of the fair market value of the ADSs or equity shares as of the close of your taxable year over your adjusted basis in such ADSs or equity shares. You will be allowed a deduction for the excess, if any, of the adjusted basis of the ADSs or equity shares over their fair market value as of the close of the taxable year. However, deductions are allowable only to the extent of any netmark-to-market gains on the ADSs or equity shares included in your income for prior taxable years. Amounts included in your income under amark-to-market election, as well as gain on the actual sale or other disposition of the ADSs or equity shares will be treated as ordinary income. Ordinary loss treatment will also apply to the deductible portion of anymark-to-market loss on the ADSs or equity shares, as well as to any loss realized on the actual sale or other disposition of the ADSs or equity shares, to the extent that the amount of such loss does not exceed the netmark-to-market gains previously included for such ADSs or equity shares. Your basis in the ADSs or equity shares will be adjusted to reflect any such income or loss amounts. If you make amark-to-market election, any distributions that we make would generally be subject to the tax rules discussed above under “ – Taxation of Dividends and Other Distributions on the ADSs or Equity Shares,” except that the lower rate applicable to qualified dividend income (discussed above) would not apply.
Themark-to-market election is available only for “marketable stock,” which is stock that is traded in other thande minimisquantities on at least 15 days during each calendar quarter (“regularly traded”) on a qualified exchange or other market, as defined in the applicable United States Treasury regulations. The NYSE is a qualified exchange. Our ADSs are listed on the NYSE and, consequently, if you are a holder of ADSs and the ADSs are regularly traded, themark-to-market election would be available to you if we become a PFIC. Because amark-to-market election cannot be made for equity interests in any lower-tier PFICs we own, a US Holder may continue to be subject to the PFIC rules with respect to its indirect interest in any investments held by us that are treated as an equity interest in a PFIC for United States federal income tax purposes. You should consult your tax advisors as to the availability and desirability of amark-to-market election, as well as the impact of such election on interests in any lower-tier PFICs.
Alternatively, if anon-United States corporation is a PFIC, a holder of shares in that corporation may avoid taxation under the PFIC rules described above regarding excess distributions and recognized gains by making a “qualified electing fund” election to include in income its share of the corporation’s income on a current basis. However, you may make a qualified electing fund election with respect to our ADSs or equity shares only if we agree to furnish you annually with certain tax information, and we currently do not intend to prepare or provide such information.
Unless otherwise provided by the United States Treasury, each US Holder of a PFIC is required to file an annual report containing such information as the United States Treasury may require. If we are or become a PFIC, you should consult your tax advisor regarding any reporting requirements that may apply to you.
You should consult your tax advisor regarding the application of the PFIC rules to your investment in ADSs or equity shares.
Information Reporting and Backup Withholding
Any dividend payments with respect to ADSs or equity shares and proceeds from the sale, exchange, redemption or other disposition of ADSs or equity shares may be subject to information reporting to the US Internal Revenue Service and possible United States backup withholding. Backup withholding will not apply, however, to a US Holder who furnishes a correct taxpayer identification number and makes any other required certification or who is otherwise exempt from backup withholding. US Holders who are required to establish their exempt status generally must provide such certification on Internal Revenue Service FormW-9. US Holders should consult their tax advisors regarding the application of the United States information reporting and backup withholding rules.
Backup withholding is not an additional tax. Amounts withheld as backup withholding may be credited against your United States federal income tax liability, and you may obtain a refund of any excess amounts withheld under the backup withholding rules by timely filing the appropriate claim for refund with the US Internal Revenue Service and furnishing any required information.
Additional Reporting Requirements
Certain US Holders who are individuals (and certain entities) are required to report information relating to an interest in our ADSs or equity shares, subject to certain exceptions (including an exception for ADSs and equity shares held in accounts maintained by certain financial institutions). US Holders should consult their tax advisors regarding the effect, if any, of these rules on the ownership and disposition of our ADSs or equity shares.
F. Dividends and Paying Agents
Not applicable
G. Statements by Experts
Not applicable
H. Documents on Display
Publicly filed documents concerning our Company which are referred to in this Annual Report may be inspected and copied at the public reference facilities maintained by the SEC at 100 F Street, N.E., Washington, D.C. 20549. Copies of these materials can also be obtained from the Public Reference Room at the SEC’s principal office, 100 F Street, N.E., Washington D.C. 20549, after payment of fees at prescribed rates.
The SEC maintains a website atwww.sec.gov that contains reports, proxy and information statements and other information regarding registrants that make electronic filings through its Electronic Data Gathering, Analysis, and Retrieval or EDGAR, system. We have made all our filings with SEC using the EDGAR system.
I. Subsidiary Information
Not applicable
ITEM 11. QUANTITATIVE AND QUALITATIVE DISCLOSURES ABOUT MARKET RISK
| ITEM 11. | QUANTITATIVE AND QUALITATIVE DISCLOSURES ABOUT MARKET RISK |
Quantitative and Qualitative Analysis
The Company’s businesses are subject to several risks and uncertainties including commodity price risk and financial risks such as liquidity, currency, interest rate and credit risk. See Note 23 “Financial Instruments” in the Notes to the consolidated financial statements for more details.
Currency Risk
The results of our operations may be affected by fluctuations in the exchange rates between the Indian Rupee, Namibian Dollar, South African Randdisclosures on market risk and Australian Dollar against the US Dollar. This table illustrates the effect of 10% depreciation in these currencies as compared to US dollars on our operating profit for fiscal year 2016.
| 10% movement in currency | For Rs./ $ | For AUD/ $ | For NAD / $ | For ZAR/ $ | ||||||||||||||||||||||||||||
| (in millions) | ||||||||||||||||||||||||||||||||
| Rs. | $ | Rs. | $ | Rs. | $ | Rs. | $ | |||||||||||||||||||||||||
Zinc – India | 11,023 | 168.4 | — | — | — | — | — | — | ||||||||||||||||||||||||
Zinc – International | — | — | — | — | 997 | 15.2 | 747 | 11.4 | ||||||||||||||||||||||||
Oil and Gas | 1,467 | 22.4 | — | — | — | — | — | — | ||||||||||||||||||||||||
Iron Ore | 192 | 2.9 | — | — | — | — | — | — | ||||||||||||||||||||||||
Copper | 1,481 | 22.6 | 78 | 1.2 | — | — | 137 | 2.1 | ||||||||||||||||||||||||
Aluminium | 6,547 | 100.0 | — | — | — | — | — | — | ||||||||||||||||||||||||
Power | (314) | (4.8) | — | — | — | — | — | — | ||||||||||||||||||||||||
|
|
|
|
|
|
|
|
|
|
|
|
|
|
|
| |||||||||||||||||
Total | 20,396 | 311.5 | 78 | 1.2 | 997 | 15.2 | 884 | 13.5 | ||||||||||||||||||||||||
|
|
|
|
|
|
|
|
|
|
|
|
|
|
|
| |||||||||||||||||
We seek to mitigate the impact of short-term movements in currency on our businesses by hedging our short-term exposures based on their maturity. However, large or prolonged movements in exchange rates may have a material effect on our business, operating results, financial condition and/or prospects. We use hedging instruments to manage the currency risk associated with the fluctuations in the Indian Rupee and Australian dollar against the US dollar in line with our risk management policy. All short term net exposures are hedged progressively based on their maturities. Longer exposures beyond one year for trade and other current account transactions are reviewed and hedges are taken accordingly. However, all new exposures on account of long-term borrowing are being hedged. In our Australian and Zinc international operations, apart from funds to meet local expenses which are denominated in the respective local currencies, we strive to retain our surplus funds in US dollar terms. These exposures are reviewed by appropriate levels of management on a monthly basis.instruments.
Hedging activities in India are governed by the RBI with whose policies we must comply. The policies under which the RBI regulates these hedging activities can change from time to time and these policies affect the effectiveness with which we manage currency risk.
We enter into instruments such as options, swaps and other derivative instruments for purposes of mitigating our exposure to currency risk. We have also partly hedged our foreign exchange risk in net investment in foreign operations. We do not enter into hedging instruments for speculative purposes.
Interest Rate Risk
We are exposed to interest rate risk on short-term and long-term floating rate instruments and on the refinancing of fixed rate debt. Our borrowings are principally denominated in Indian Rupees and US dollars with a mix of fixed and floating rates of interest. The US dollar debt is divided between fixed and floating rates (linked to US dollar LIBOR). The costs of floating rate borrowings may be affected by the fluctuations in the interest rates. We have selectively used interest rate swaps, options and other derivative instruments to manage our exposure to interest rate movements. These exposures are reviewed by appropriate levels of management on a monthly basis.
Borrowing and interest rate hedging activities in India are governed by the RBI and we have to comply with its regulations. The policies under which the RBI regulates these borrowing and interest rate hedging activities can change from time to time and can impact the effectiveness with which we manage our interest rate risk.
We have in the past held or issued instruments such as swaps, options and other derivative instruments for purposes of mitigating our exposure to interest rate risk. We do not enter into hedging instruments for speculative purposes. This table illustrates the impact of a 0.5% to 2.0% movement in interest rates on interest expense on loans and borrowings for fiscal year 2016.
Movement in interest rates | Impact of US dollar interest rates | |||||
| Rs. Million | $ Million | |||||
0.5% | 1,619 | 24.4 | ||||
1.0% | 3,238 | 48.9 | ||||
2.0% | 6,476 | 97.8 | ||||
Commodity Price Risk
We are exposed to the movement of base metal commodity prices on the London Metal Exchange. Any decline in the prices of the base metals that we produce and sell will have an immediate and direct impact on the profitability of our businesses. We use commodity hedging instruments such as forwards, swaps, options and other derivative instruments to manage our commodity price risk in our copper, aluminium and zinc businesses. Currently, we use commodity forward contracts to partially hedge against changes in the LME prices of copper and zinc. We enter into these hedging instruments for the purpose of reducing the variability of our cash flows on account of volatility in commodity prices. These hedging instruments are typically of a maturity of less than one year.
The price of gas produced in some of our fields is fixed while in others it is linked to liquid fuels with a floor and ceiling mechanism and therefore has minimal exposure to market movements.
Hedging activities in India are governed by the RBI and we have to comply with its regulations. The policies under which the RBI regulates these hedging activities can change from time to time and can impact the effectiveness with which we manage commodity price risk.
We have in the past held or issued derivative instruments such forwards, options and other derivative instruments for purposes of mitigating our exposure to commodity price risk. We do not enter into hedging instruments for speculative purposes.
This table illustrates the impact of a 10% movement in London Metal Exchange/ London Bullion Market Association, oil and iron ore prices based on fiscal year 2016 volumes, costs and exchange rates and provides the estimated impact on operating profit assuming all other variables remain constant.
10% movement in price | Change in Operating Profit | |||||||
| Rs. Million | $ Million | |||||||
Zinc India | 11,016 | 166.3 | ||||||
Zinc International | 2,609 | 39.4 | ||||||
Oil | 6,298 | 95.1 | ||||||
Iron ore | 534 | 8.1 | ||||||
Copper | 430 | 6.5 | ||||||
Aluminium | 7,806 | 117.8 | ||||||
|
|
|
| |||||
Total | 28,693 | 433.2 | ||||||
|
|
|
| |||||
The fair values of our open derivative positions recorded under derivative financial assets and derivative financial liabilities are as follows:
| As of March 31, | ||||||||||||||||||||||||
| 2015 | 2016 | 2016 | ||||||||||||||||||||||
| Asset | Liability | Asset | Liability | Asset | Liability | |||||||||||||||||||
| (Rs. in millions) | (Rs. in millions) | (US dollars in millions) | ||||||||||||||||||||||
Current | ||||||||||||||||||||||||
Cash flow hedges: | ||||||||||||||||||||||||
— Commodity contracts | 158 | — | 13 | 43 | 0.2 | 0.6 | ||||||||||||||||||
— Forward foreign currency contracts | — | — | 1 | 549 | — | 8.3 | ||||||||||||||||||
Fair value hedges: | ||||||||||||||||||||||||
— Commodity contracts | 235 | 1 | 8 | — | 0.1 | — | ||||||||||||||||||
— Forward foreign currency contracts | 94 | 1,255 | 116 | 2,484 | 1.8 | 37.5 | ||||||||||||||||||
Net investment in foreign operation | 497 | — | 343 | — | 5.2 | — | ||||||||||||||||||
Non-qualifying hedges: | ||||||||||||||||||||||||
— Commodity contracts | 49 | 95 | 195 | 83 | 2.9 | 1.3 | ||||||||||||||||||
— Forward foreign currency contracts | 2 | 701 | 550 | 1,306 | 8.3 | 19.7 | ||||||||||||||||||
— Interest rate swap | — | 511 | — | — | — | — | ||||||||||||||||||
— Currency swap | — | 11 | 2 | 9 | — | 0.1 | ||||||||||||||||||
Non-current | ||||||||||||||||||||||||
Fair value hedges: | ||||||||||||||||||||||||
— Forward foreign currency contracts | 12 | 9 | 53 | 78 | 0.8 | 1.2 | ||||||||||||||||||
|
|
|
|
|
|
|
|
|
|
|
| |||||||||||||
Total | 1,047 | 2,583 | 1,281 | 4,552 | 19.3 | 68.7 | ||||||||||||||||||
|
|
|
|
|
|
|
|
|
|
|
| |||||||||||||
| ITEM 12. | DESCRIPTION OF SECURITIES OTHER THAN EQUITY SECURITIES |
A. Debt Securities
Not Applicable.
B. Warrants and Rights
Not Applicable.
C. Other Securities
Not Applicable.
D. American Depositary Shares
Our ADR facility is maintained with Citibank, N.A., or the Depositary, pursuant to a deposit agreement, dated as of September 6, 2013 and renewed until August 31, 2018, among us, our Depositary and the holders and beneficial owners of our ADSs. We use the term “holder” in this discussion to refer to the person in whose name an ADR is registered on the books of the Depositary. In accordance with the deposit agreement, the Depositary may charge fees up to the amounts described below:
Type of Service | Fees | Payer | ||||
| 1. | Issuance of ADSs upon the deposit of ordinary shares (excluding issuances as a result of distributions described in paragraph 4 below). | Up to $5.00 per 100 ADSs (or any portion thereof) issued. | Person depositing ordinary shares or person receiving ADSs. | |||
| 2. | Delivery of Deposited Securities (as defined under the Deposit Agreement) against surrender of ADSs. | Up to $5.00 per 100 ADSs (or any portion thereof) surrendered. | Person surrendering ADSs for purpose of withdrawal of Deposited Securities or person to whom Deposited Securities are delivered. | |||
| 3. | Distribution of cash dividends or other cash distributions (i.e. sale of rights and other entitlements). | Up to $2.00 per 100 ADSs (or any portion thereof) held. | Person to whom distribution is made. | |||
| 4. | Distribution of ADSs pursuant to (i) stock dividends or other free stock distributions, or (ii) exercise of rights to purchase additional ADSs. | Up to $5.00 per 100 ADSs (or any portion thereof) held. | Person to whom distribution is made. | |||
| 5. | Distribution of securities other than ADSs or rights to purchase additional ADSs (i.e.spin-off shares). | Up to $5.00 per 100 ADSs (or any portion thereof) held. | Person to whom distribution is made. | |||
| 6. | Depositary services. | Up to $2.00 per 100 ADSs (or any portion thereof) held. | Person holding ADSs on applicable record date(s) established by the Depositary. | |||
| 7. | Transfer of ADRs. | Up to $1.50 per certificate presented for transfer. | Person presenting certificate for transfer. | |||
In addition, holders or beneficial owners of our ADSs, persons depositing ordinary shares for deposit and persons surrendering ADSs for cancellation and withdrawal of deposited securities will be required to pay the following charges:
In the case of cash distributions, the applicable fees, charges, expenses and taxes will be deducted from the cash being distributed. In the case of distributions other than cash, such as share dividends, the distribution generally will be subject to appropriate adjustments for the deduction of the applicable fees, charges, expenses and taxes.
In certain circumstances, the Depositary may dispose of all or a portion of such distribution and distribute the net proceeds of such sale to the holders of ADS, after deduction of applicable fees, charges, expenses and taxes. If the Depositary determines that any distribution in property is subject to any tax or other governmental charge which the Depositary is obligated to withhold, the Depositary may withhold the amount required to be withheld and may dispose of all or a portion of such property in such amounts and in such manner as the Depositary deems necessary and appropriate to pay such taxes or charges and the Depositary will distribute the net proceeds of any such sale after deduction of such taxes or charges to the holders of ADSs entitled to the distribution.
During fiscal year 2016,2017, the Depositary has reimbursed to us an amount of $ 1,835,519.83916,669.80 (after deduction of applicable withholding taxes amounting to $ 786,437.06)392,108.49) with respect to investor relations expenses.
ITEM 13: DEFAULTS, DIVIDEND ARREARAGES AND DELINQUENCIES
| ITEM 13. | DEFAULTS, DIVIDEND ARREARAGES AND DELINQUENCIES |
None
ITEM 14. MATERIAL MODIFICATIONS TO THE RIGHTS OF SECURITY HOLDERS AND USE OF PROCEEDS
| ITEM 14. | MATERIAL MODIFICATIONS TO THE RIGHTS OF SECURITY HOLDERS AND USE OF PROCEEDS |
ADS offering in 2009
On July 16, 2009, we completed the ADS offering on the NYSE. We sold an aggregate of 131,906,011 ADSs representing 131,906,011 equity shares. The price per ADS was $ 12.15. The joint book runners of the ADS offering were J.P. Morgan Securities Inc. and Morgan Stanley & Co. International plc. The joint book runners exercised their over-allotment option to acquire an additional 8,449,221 ADSs at $ 12.15 per ADS. The aggregate price of the offering amount, including the over-allotment option, registered and sold was $ 1,602.7 million.
The registration statement on FormF-3 (FileNo. 333-160580) filed by us in connection with the ADS offering was automatically effective on July 15, 2009. The net proceeds from the offering to us, after deducting underwriting discounts and commissions and offering expenses ($ 13.8 million), amounted to $ 1,588.9 million. As of March 31, 2014, we have used the entire proceeds for the purpose mentioned in the offer document.
Pursuant to theRe-organization Transactions, each holder of the SIIL ADSs, received three Vedanta Limited ADSs for every five existing SIIL ADSs. The total outstanding Vedanta Limited ADSs as of March 31, 20162017 were 57,046,155.
ITEM 15. CONTROLS AND PROCEDURES
| ITEM 15. | CONTROLS AND PROCEDURES |
(a) Disclosure Controls and Procedures
As required by Rules13a-15 and15d-15 under the Exchange Act, management, including our Chief Executive Officer and our Chief Financial Officer, has evaluated the effectiveness of our disclosure controls and procedures as of the end of the period covered by this report. Disclosure controls and procedures refer to controls and other procedures designed to ensure that information required to be disclosed in the reports we file or submit under the Exchange Act is recorded, processed, summarized and reported, within the time periods specified in the rules and forms of the SEC. Disclosure controls and procedures include, without limitation, controls and procedures designed to ensure that information required to be disclosed by us in our reports that we file or submit under the Exchange Act is accumulated and communicated to management, including our principal executive and principal financial officers, or persons performing similar functions, as appropriate to allow timely decisions regarding our required disclosure.
Based on the foregoing, our Chief Executive Officer and our Chief Financial Officer have concluded that, as of March 31, 2016,2017, our disclosure controls and procedures were effective.
(b) Management’s Annual Report on Internal Control over Financial Reporting
Our management is responsible for establishing and maintaining adequate internal controls over financial reporting, as such term is defined in Rule13a-15(f) of the Exchange Act.
Internal controls over financial reporting refers to a process designed by, or under the supervision of, our Chief Executive Officer and Chief Financial Officer and effected by our board of directors, management and other personnel, to provide reasonable assurance regarding the reliability of financial reporting and the preparation of financial statements for external reporting purposes in accordance with IFRS as issued by the IASB.
Our internal control over financial reporting includes those policies and procedures that, (1) pertain to the maintenance of records that, in reasonable detail, accurately and fairly reflect the transactions and dispositions of our assets; (2) provide reasonable assurance that transactions are recorded as necessary to permit preparation of our financial statements in accordance with generally accepted accounting principles, and that our receipts and expenditures are being made only in accordance with authorizations of our management and directors; and (3) provide reasonable assurance regarding prevention or timely detection of unauthorized acquisition, use or disposition of our assets that could have a material effect on our consolidated financial statements.
Our management assessed the effectiveness of internal control over financial reporting as of March 31, 20162017 based on the criteria established in Internal Control—Integrated Framework (2013) issued by the Committee of Sponsoring Organizations of the Treadway Commission. As a result of this assessment, management concluded that, as of March 31, 2016,2017, our internal control over financial reporting was effective in providing reasonable assurance regarding the reliability of financial reporting and the preparation of financial statements for external purposes in accordance with generally accepted accounting principles. The scope of our management’s assessment of the effectiveness of internal control over financial reporting includes all of our company’s consolidated operations.
Our management recognizes that there are inherent limitations in the effectiveness of any system of internal control over financial reporting, including the possibility of human error and the circumvention or override of internal control. Accordingly, even effective internal control over financial reporting can provide only reasonable assurance with respect to financial statement preparation, and may not prevent or detect all misstatements and can only provide reasonable assurance with respect to the preparation and presentation of our financial statements.
The effectiveness of our internal control over financial reporting as at March 31, 20162017 has been audited by Deloitte HaskinsS.R. Batliboi & SellsCo. LLP, or Deloitte,India, our independent registered public accounting firm, as stated in their report which is reproduced in its entirety in Item 15(c) below:
(c) Attestation Report of the Registered Public Accounting Firm
REPORT OF INDEPENDENT REGISTERED PUBLIC ACCOUNTING FIRM
To theThe Board of Directors and Shareholders of
Vedanta Limited
Panaji, Goa, India
We have audited theVedanta Limited and subsidiaries’ internal control over financial reporting of Vedanta Limited and subsidiaries (the “Company”) as of March 31, 2016,2017, based on criteria established in Internal Control — Control—Integrated Framework (2013) issued by the Committee of Sponsoring Organizations of the Treadway Commission.
The Company‘sCommission (2013 framework) (the COSO criteria). Vedanta Limited and subsidiaries’ management is responsible for maintaining effective internal control over financial reporting, and for its assessment of the effectiveness of internal control over financial reporting included in the accompanying Management‘sManagement’s Annual Report on Internal Control Overover Financial Reporting. Our responsibility is to express an opinion on the Company‘scompany’s internal control over financial reporting based on our audit.
We conducted our audit in accordance with the standards of the Public Company Accounting Oversight Board (United States). Those standards require that we plan and perform the audit to obtain reasonable assurance about whether effective internal control over financial reporting was maintained in all material respects. Our audit included obtaining an understanding of internal control over financial reporting, assessing the risk that a material weakness exists, testing and evaluating the design and operating effectiveness of internal control based on the assessed risk, and performing such other procedures as we considered necessary in the circumstances. We believe that our audit provides a reasonable basis for our opinion.
A company’s internal control over financial reporting is a process designed by, or under the supervision of, the company’s principal executive and principal financial officers, or persons performing similar functions, and effected by the company’s board of directors, management, and other personnel to provide reasonable assurance regarding the reliability of financial reporting and the preparation of financial statements for external purposes in accordance with generally accepted accounting principles. A company’s internal control over financial reporting includes those policies and procedures that (1) pertain to the maintenance of records that, in reasonable detail, accurately and fairly reflect the transactions and dispositions of the assets of the company; (2) provide reasonable assurance that transactions are recorded as necessary to permit preparation of financial statements in accordance with generally accepted accounting principles, and that receipts and expenditures of the company are being made only in accordance with authorizations of management and directors of the company; and (3) provide reasonable assurance regarding prevention or timely detection of unauthorized acquisition, use, or disposition of the company’s assets that could have a material effect on the financial statements.
Because of theits inherent limitations, of internal control over financial reporting including the possibility of collusion or improper management override of controls, material misstatements due to error or fraud may not be preventedprevent or detected on a timely basis.detect misstatements. Also, projections of any evaluation of the effectiveness of the internal control over financial reporting to future periods are subject to the risk that the controls may become inadequate because of changes in conditions, or that the degree of compliance with the policies or procedures may deteriorate.
In our opinion, the CompanyVedanta Limited and subsidiaries maintained, in all material respects, effective internal control over financial reporting as of March 31, 2016,2017, based on the criteria established in Internal Control — Integrated Framework (2013) issued by the Committee of Sponsoring Organizations of the Treadway Commission.COSO criteria.
We also have also audited, in accordance with the standards of the Public Company Accounting Oversight Board (United States), the consolidated statement of financial statementsposition of Vedanta Limited and subsidiaries as of March 31, 2017 and the related consolidated statements of profit or loss, comprehensive income, changes in equity, and cash flows for the year ended March 31, 2016 of the Company2017 and our report dated August 1, 201615, 2017 expressed an unqualified opinion on those financial statements and included an explanatory paragraph relating to the convenience translation of the Indian Rupee into United States dollar amounts.thereon.
/s/ Deloitte HaskinsS. R. Batliboi & Sells LLP
Deloitte Haskins & SellsCo. LLP
Gurgaon, India
August 1, 201615, 2017
(d) Changes in Internal Control over Financial Reporting
Management has evaluated, with the participation of our Chief Executive Officer and our Chief Financial Officer, whether any changes in our internal control over financial reporting that occurred during our last fiscal year have materially affected, or are reasonably likely to materially affect, our internal control over financial reporting. Based on the evaluation we conducted, management has concluded that no such changes have occurred in fiscal year 2016.2017.
ITEM 16A. AUDIT COMMITTEE FINANCIAL EXPERT
| ITEM 16A. | AUDIT COMMITTEE FINANCIAL EXPERT |
The Chairperson of our Audit Committee is Lalita D. Gupte. Ravi Kant and Naresh ChandraAman Mehta are the other members of the Audit Committee. Mr. Mehta was appointed as a member to the audit committee on July 12, 2017, replacing Mr. Naresh Chandra who passed away on July 9, 2017.
Each of Messrs. Kant, ChandraMehta and Ms. Gupte satisfy the “independence” requirements pursuant to the rules of the SEC and Rule10A-3 of the Exchange Act.See “Item 6. Directors, Senior Management and Employees—A. Directors and Senior Management” for the experience and qualifications of the members of the Audit Committee.
Our Board has determined that Ms. Gupte qualifies as an “audit committee financial expert” within the requirements of the rules promulgated by the SEC relating to audit committees.
| ITEM 16B. | CODE OF ETHICS |
We have adopted a written Code of Business Conduct and Ethics that is applicable to all of our directors, senior management, executive officers and employees. We amended our Code of Business Conduct and Ethics in October 2014. We added certain provisions including applicable provisions relating to the U.K Bribery Act, 2010, particularly on the meaning, scope and application of the terms bribery, corruption, fraud, gifts, entertainment and political contributions to the Company and our employees. As an issuer of securities in the United States, we are subject to the US Foreign Corrupt Practices Act (FCPA). Our businesses in other countries shall comply with their respective anti-corruption laws. Additionally, in accordance with the Companies Act, 2013 and the amendment in the listing agreement of stock exchanges in India, the Code of Business Conduct and Ethics was amended to incorporate the duties of the Independent Directors. The Code of Business Conduct and Ethics was amended in April 2015, elaborating on competition law and fair dealing. In addition to this amendment, the Code of Business Conduct and Ethics was further amended at the board meeting held in July 2015, to refresh the core purposes and values of the Company. Further, a corporate communications is established by the Company that will align with the Code of Business Conduct and Ethics and the aim is to guide employees on sharing any material information relating to the Company or the group and ensure that it is accurately communicated to interested parties. During fiscal year 2017, the Health, Safety and Environment section in the Company’s Code of Business Conduct and Ethics was amended to reflect applicable provisions relating to the U.K. Modern Slavery Act, 2015, particularly by including a Slavery and Trafficking Statement including the steps taken that slavery and human trafficking is not taking place, either in their business or across any of their supply chains.
We have posted the code on our website at http://-www.vedantalimited.com/media/85907/coc_final_2015.07.29.pdf. 85863/vedanta_limited_code_of_conduct_and_business_ethics.pdf
Information contained in our website does not constitute a part of this Annual Report. We will also make available a copy of the Code of Business Conduct and Ethics to any person, without charge, if a written request is made to us at our registered office at Sesa Ghor, 20 EDC Complex, Patto, Panaji, State of Goa, 403001,1st Floor, C wing, Unit 103, Corporate Avenue, Atul Projects, Chakala, Andheri (East),Mumbai-400 093, Maharashtra, India.
ITEM 16C. PRINCIPAL ACCOUNTANT FEES AND SERVICES
| ITEM 16C. | PRINCIPAL ACCOUNTANT FEES AND SERVICES |
Our financial statements are prepared in accordance with IFRS as issued by the IASB and are audited by Deloitte HaskinsM/s S.R. Batliboi & SellsCo. LLP, Chartered Accountants (“SRB”), a firm registered with the Public Company Accounting Oversight Board in the United States and an Indian firm of Chartered Accountants registered with the Institute of Chartered Accountants of India.
Deloitte Haskins & Sells LLP has(“Deloitte”) served as our independent registered public accountant for each of the yearsyear ended March 31, 20152016 and SRB have been appointed as independent registered public accountant for the year ended March 31, 20162017 for which audited statements appear in this Annual Report. The following table shows the aggregate fees for the professional services and other services rendered by Deloitte Haskins & Sells LLP and the various member firms of Deloitte to us, including our subsidiaries, in fiscal years 2015year 2016, and 2016.the professional services and other services rendered by SRB and the various member firms of SRB to us, including our subsidiaries, in fiscal year 2017.
| Fiscal year | ||||||||
| 2015 | 2016 | |||||||
| ($ in thousands) | ||||||||
Audit fees (audit and review of financial statements) | 3,263.1 | 2,973.0 | ||||||
Audit-related fees (including other miscellaneous audit related certifications) | 72.7 | 110.7 | ||||||
Tax fees (tax audit, other certifications and tax advisory services) | 304.4 | 241.1 | ||||||
All other fees (certification on corporate governance and advisory services) | 10.4 | — | ||||||
|
|
|
| |||||
Total | 3,650.6 | 3,324.8 | ||||||
|
|
|
| |||||
Audit fees (audit and review of financial statements) Audit-related fees (including other miscellaneous audit related certifications) Tax fees (tax audit, other certifications and tax advisory services) All other fees (certification on corporate governance and advisory services) Total Fiscal year 2016 2017 ($ in thousands) 2,973.0 3,364.3 110.7 58.2 241.1 107.4 — 285.1 3,324.8 3,815.0
Audit CommitteePre-approval Process
Our Audit Committee reviews andpre-approves the scope and the cost of audit services related to us and permissiblenon-audit services performed by the independent auditors, other than those forde minimis services which are approved by the Audit Committee prior to the completion of the audit. All of the services related to our Company provided by Deloitte Haskins & Sells LLPSRB during the last fiscal year have been approved by the Audit Committee.
ITEM 16D. EXEMPTIONS FROM THE LISTING STANDARDS FOR AUDIT COMMITTEES
| ITEM 16D. | EXEMPTIONS FROM THE LISTING STANDARDS FOR AUDIT COMMITTEES |
Not applicable
| ITEM 16E. | PURCHASES OF EQUITY SECURITIES BY THE ISSUER AND AFFILIATED PURCHASERS |
Period | Total number of shares (and units) purchased | Average price paid per share (or units) | Total number of shares (or units) purchased as part of publically announced plans or programs(1) | Maximum number of shares (or | ||||||||||
January 27, 2017 to January 30, 2017 | 3,984,256 | 259.58 | 3,984,256 | 5% within one financial year of the paid up capital;
5% within the scheme tenure of the paid up capital | ||||||||||
| (1) | The shareholders of the Company by way of postal ballot on December 12, 2016 approved the Vedanta Limited ESOS 2016 and issue of securities to the employees of the Company and its holding or subsidiary companies. These options were awarded to employees under the Vedanta Limited ESOS 2016 with effect from December 15, 2016 for which the vesting condition will be the performance period of 36 months from December 15, 2016 to December 14, 2019. The options shall expire after six months from the date of vesting. |
On December 12, 2016, the shareholders authorized the Company for the acquisition of up to 148,250,244 Equity Shares (which represents five percent of the paid up equity capital as on March 31, 2016, in different tranches from the secondary market by Vedanta Employee Stock Option Scheme trust (“ESOS Trust”) for the purpose of allotment to the employees of the Company and its subsidiary, post vesting of the options alloted. The secondary acquisition in a fiscal year by the ESOS Trust shall not exceed five percent of the paid up equity capital of the Company or such other limit as may be prescribed under the SEBI (Share Based Employee Benefits) Regulations, 2014 from time to time as at the end of the previous fiscal year.
There
| ITEM 16F. | CHANGE IN REGISTRANT’S CERTIFYING ACCOUNTANT |
a) Former independent registered public accounting firm
(i) On June 29, 2016, the Company in its Annual General meeting appointed SRB as the statutory auditor of the Company for its Indian reporting for a term of five (5) years from the financial year ending March 31, 2017 to the financial year ending March 31, 2021 subject to ratification of their appointment by the members at every Annual General Meeting, as may be required under the applicable provisions of the Companies Act, 2013. SRB replaced Deloitte who was the Company’s statutory auditor until the Annual General Meeting held on June 29, 2016. In order to align the change in auditors for the US reporting, based on the recommendation of the Audit Committee of the Company, the Board of Directors of the Company, on October 28, 2016 approved the appointment of SRB as the Company’s independent registered public accounting firm for U.S. reporting purposes for a term of five (5) years from the financial year2016-17 to financial year2020-21. SRB accepted the engagement on October 28, 2016.
(ii) Simultaneously with the engagement of SRB, the Company terminated Deloitte as its independent registered public accounting firm.
(iii) The report of Deloitte on the Company’s consolidated financial statements for the financial years ended March 31, 2016 and 2015 did not contain an adverse opinion or a disclaimer of opinion, and were not qualified or modified as to uncertainty, audit scope or accounting principles.
(iv) During the financial years ended March 31, 2016 and 2015, and through October 28, 2016, there were no repurchases(a) disagreements with Deloitte on any matter of accounting principles or practices, financial statement disclosure, or auditing scope or procedure, which disagreements, if not resolved to Deloitte’s satisfaction, would have caused Deloitte to make reference to the subject matter thereof in connection with its reports for such years; or (b) reportable events that would be required to be described under Item 16 F(a)(1)(v) of Form20-F in connection with the Company’s annual report on Form20-F.
(v) The Company provided Deloitte with a copy of the equity sharesabove disclosure and submitted a letter from Deloitte agreeing with such disclosure as Exhibit 99.1 toForm 6-K submitted to the Securities and Exchange Commission on October 28, 2016.
b) New independent registered public accounting firm
The Company engaged SRB as its new independent accountants as of Vedanta Limited madeOctober 28, 2016. During the two most recent financial years ended March 31, 2016 and 2015 and through October 28, 2016, the Company has not consulted SRB regarding either (i) the application of accounting principles to a specified transaction, either completed or proposed; or the type of audit opinion that might be rendered on the Company’s financial statements, and neither a written report was provided to the Company or oral advice was provided that SRB concluded was an important factor considered by the Company in reaching a decision as to the accounting, auditing or on behalffinancial reporting issue; or (ii) any matter that was either the subject of Vedanta Limited or any “affiliated purchaser” (asa disagreement, as that term is defined in Rule 10b-18(a)(3)Item 16F(a)(1)(iv) of 20F and the Exchange Act)related instructions to this item, or a reportable event as that term is described in fiscal year 2016.Item 16F(a)(1)(v) of 20F.
ITEM 16F. CHANGE IN REGISTRANT’S CERTIFYING ACCOUNTANT
Not applicable
ITEM 16G. CORPORATE GOVERNANCE
| ITEM 16G. | CORPORATE GOVERNANCE |
As our ADSs are listed on the NYSE, we are subject to the NYSE listing standards. The NYSE listing standards applicable to us, as a foreign private issuer, are considerably different from those applicable to US companies. Under the NYSE rules, we need only (i) establish an independent Audit Committee; (ii) provide prompt certification by our Chief Executive Officer of any materialnon-compliance with any corporate governance rules of the NYSE; (iii) provide periodic (annual and interim) written affirmations to the NYSE with respect to our corporate governance practices; and (iv) provide a brief description of significant differences between our corporate governance practices and those followed by US companies. Our Audit Committee consists of three directors: Lalita D. Gupte, who is our Chairperson, Ravi Kant and Naresh Chandra.Aman Mehta. Each of Messrs. Kant, ChandraMehta and Ms. Gupte satisfy the “independence” requirements ofRule 10A-3 of the Exchange Act. A brief description of the significant differences between our corporate governance practices and those followed by US companies can be found in “Item 10. Additional Information—B. Memorandum and Articles of Association—Comparison of Corporate Governance Standards.”
As a foreign private issuer, we are exempt from the NYSE rules applicable to a US company requiring (i) a board of directors consisting of a majority of independent directors, (ii) a compensation committee and a nominating/corporate governance committee, (iii) shareholder approval of equity-compensation plans, (iv) the adoption and disclosure of corporate governance guidelines, and (v) the adoption and disclosure of a code of business conduct and ethics for directors, officer and employees, and the prompt disclosure of any waivers thereof for directors or executive officers.
In addition, we are deemed to be a “controlled company” under the NYSE rules. As a result, we are exempt from the NYSE rules applicable to a US company that is not a “controlled company” requiring (i) a board of directors consisting of a majority of independent directors and (ii) a compensation committee and a nominating/corporate governance committee.
ITEM 16H. MINE SAFETY DISCLOSURE
| ITEM 16H. | MINE SAFETY DISCLOSURE |
Not applicable
| ITEM 17. | FINANCIAL STATEMENTS |
See Item 18 for a list of the financial statements filed as part of this Annual Report.
| ITEM 18. | FINANCIAL STATEMENTS |
The following financial statements are filed as part of this Annual Report, together with the report of the independent registered public accounting firms:
| ITEM 19. | EXHIBITS |
| 1.1 | Certificate of Incorporation pursuant to change of name to Vedanta Limited—incorporated by reference to Exhibit 99.1 to theForm 6-K (FileNo. 001-33175) of Vedanta Limited, as filed with the SEC on May 29, 2015. | |
| | Memorandum and Articles of Association of Vedanta | |
| 2.1 | Form of Deposit Agreement among Sterlite Industries (India) Limited, Citibank, N.A., as Depositary, and owners and holders from time to time of American Depositary Shares evidenced by American Depositary Receipts issued thereunder amended (including the Form of ADR)—incorporated by reference to Exhibit (a) of Amendment No. 2 to the Registration Statement onForm F-6 (FileNo. 333-139102), as filed with the SEC on June 15, 2007 as amended by Form of ADR incorporated by reference to Form 424B3 (FileNo. 333-139102), as filed with the SEC on June 28, 2010. | |
| 2.2 | Form of Deposit Agreement among Sesa Goa Limited and Citibank, N.A., as Depositary and the holders and beneficial owners of American Depositary Shares issued thereunder—incorporated by reference to Exhibit 99.1 to theForm 6-K (FileNo. 001-33175), as filed with the SEC on September 11, 2013. | |
| | Form of Deposit Agreement among Vedanta Limited and Citibank, N.A., for continued appointment of Citibank as the exclusive Depositary of American Depositary Receipts issued thereunder | |
| 2.4 | Specimen share certificate—incorporated by reference to Exhibit 99.2 to theForm 6-K (FileNo. 001-33175) of Vedanta Limited, as filed with the SEC on May 29, 2015. | |
| 4.1 | Vedanta Resources plc Long-Term Incentive Plan—incorporated by reference to Exhibit 10.1 to the Registration Statement onForm F-1 (FileNo. 333-138739), as filed with the SEC on November 15, 2006. | |
| 4.2 | Vedanta Resources plc Employee Share Ownership Plan (“ESOP”) 2013—incorporated by reference to Exhibit 4.2 of the annual report onForm-20F for fiscal 2014 (FileNo. 001-33175) of Sesa Sterlite Limited, as filed with the SEC on August 15, 2014. | |
| 4.3 | Vedanta Resources plc ESOP Scheme 2012—incorporated by reference to Exhibit 4.3 of the annual report onForm-20F for fiscal 2014 (FileNo. 001-33175) of Sesa Sterlite Limited, as filed with the SEC on August 15, 2014. | |
| | Vedanta Resources plc Performance Share Plan | |
| 4.5 | Cairn India Performance Option Plan—incorporated by reference to Exhibit | |
| 4.6** | ||
| | Vedanta Limited Share Plan: Employee Stock Option Scheme (ESOS) 2016. | |
| 4.8 | Relationship Agreement dated December 5, 2003 among Vedanta, Volcan Investments Limited, Dwarka Prasad Agarwal, Agnivesh Agarwal and Anil Agarwal—incorporated by reference to Exhibit 10.2 to the Registration Statement onForm F-1 (FileNo. 333-138739), as filed with the SEC on November 15, 2006. | |
| | Deed of Adherence dated December 11, 2007 among Vedanta Resources plc, Volcan Investments Limited, Onclave PTC Limited and Anil Agarwal-incorporated by reference to Exhibit 4.3 of the annual report onForm-20F for fiscal 2008 | |
| | Shared Services Agreement dated December 5, 2003 among Vedanta, Sterlite Optical Technologies Limited, Sterlite Gold Limited and Sterlite Industries (India) Limited, including the letter agreement dated April 13, 2006 amending the Shared Services Agreement—incorporated by reference to Exhibit 10.3 to the Registration Statement onForm F-1 (FileNo.333-138739), as filed with the SEC on November 15, 2006. | |
| | Consultancy Agreement dated March 29, 2005 between Vedanta and Sterlite Industries (India) Limited—incorporated by reference to Exhibit 10.4 to the Registration Statement onForm F-1 (FileNo. 333-138739), as filed with the SEC on November 15, 2006. | |
| | Management Services Agreement dated May 20, 2014 between Vedanta and Sesa Sterlite Limited—incorporated by reference to Exhibit 4.8 of the annual report onForm-20F for fiscal 2014 (FileNo. 001-33175) of Sesa Sterlite Limited, as filed with the SEC on August 15, 2014. | |
| | Representative Office Agreement dated March 29, 2005 between Vedanta and Sterlite Industries (India) Limited—incorporated by reference to Exhibit 10.5 to the Registration Statement onForm F-1 (FileNo. 333-138739), as filed with the SEC on November 15, 2006. | |
| | Representative Office Agreement dated May 20, 2014 between Vedanta and Sesa Sterlite Limited—incorporated by reference to Exhibit 4.10 of the annual report onForm-20F for fiscal 2014 (FileNo. 001-33175) of Sesa Sterlite Limited, as filed with the SEC on August 15, 2014. | |
| | Shareholders’ Agreement between the President of India and Sterlite Opportunities and Ventures Limited dated April 4, 2002—incorporated by reference to Exhibit 10.6 to the Registration Statement onForm F-1 (FileNo. 333-138739), as filed with the SEC on November 15, 2006. | |
| | Shareholders’ Agreement between Sterlite Industries (India) Limited, GoI and BALCO dated March 2, 2001—incorporated by reference to Exhibit 10.7 to the Registration Statement on FormF-1( | |
| | Guarantee Agreement between the President of India, Sterlite Industries (India) Limited, Sterlite Optical Technologies Limited and Sterlite Opportunities and Ventures Limited dated April 4, 2002—incorporated by reference to Exhibit 10.8 to the Registration Statement onForm F-1 (FileNo. 333-138739), as filed with the SEC on November 15, 2006. | |
| | Agreement between Vedanta Aluminium Limited and Orissa Mining Corporation Limited dated October 5, 2004—incorporated by reference to Exhibit 10.9 to the Registration Statement onForm F-1 (FileNo. 333-138739), as filed with the SEC on November 15, 2006. | |
| | Mining lease between the Government of Rajasthan and HZL dated March 13, 1980 renewed on September 15, 2000 pursuant to an order of the Government of Rajasthan dated May 1, 2000 and an indenture dated September 15, 2000—incorporated by reference to Exhibit 10.10 to the Registration Statement onForm F-1 (FileNo. 333-138739), as filed with the SEC on November 15, 2006. | |
| | $ 92.6 million Term Facility Agreement between Sterlite Industries (India) Limited as borrower and CALYON, Standard Chartered Bank and ICICI Bank Limited as lenders dated March 22, 2006—incorporated by reference to Exhibit 10.11 to the Registration Statement onForm F-1 (FileNo. 333-138739), as filed with the SEC on November 15, 2006. | |
| | Japanese Yen 3,570 million and $ 19.65 million Term Loan Facilities Agreement between Sterlite Industries (India) Limited as borrower and ICICI Bank Limited, Sumitomo Mitsui Banking Corporation and DBS Bank Limited as lenders dated September 19, 2005—incorporated by reference to Exhibit 10.12 to the Registration Statement onForm F-1 (FileNo.333-138739), as filed with the SEC on November 15, 2006. | |
| | $ 125 million Term Facility Agreement between HZL as borrower and ABN AMRO Bank N.V., CALYON, Standard Chartered Bank, DBS Bank Limited, Mizuho Corporate Bank, Limited., Sumitomo Mitsui Banking Corporation, The Sumitomo Trust and Banking Co., Limited., Cathay United Bank, Hua Nan Commercial Bank, National Bank of Kuwait S.A.K., Bank of Taiwan, The Export-Import Bank of the Republic of China, Chang Hwa Commercial Bank Limited., Chiao Tung Bank Co., Limited., The International Commercial Bank of China, Co. Limited., Mascareignes International Bank Ltd., Syndicate Bank, Canara Bank and The Shanghai Commercial and Savings Bank, Limited. as lenders dated July 29, 2005—incorporated by reference to Exhibit 10.13 to the Registration Statement onForm F-1 (FileNo. 333-138739), as filed with the SEC on November 15, 2006. | |
| | $ 50 million Facility Agreement between BALCO as borrower and ICICI Bank Limited, Singapore Branch, ICICI Bank Limited, Bahrain Branch and ICICI Bank Limited, Offshore Banking Unit as lenders dated November 8, 2004—incorporated by reference to Exhibit 10.15 to the Registration Statement onForm F-1 (FileNo. 333-138739), as filed with the SEC on November 15, 2006. | |
| | $ 50 million Facility Agreement between BALCO as borrower and ICICI Bank Limited, ICICI Bank Limited, Bahrain Branch and ICICI Bank Limited, Offshore Banking Unit as lenders dated November 10, 2004—incorporated by reference to Exhibit 10.16 to the Registration Statement onForm F-1 (FileNo. 333-138739), as filed with the SEC on November 15, 2006. | |
| | Rs. 10,000 million Facility Agreement between BALCO as borrower and Oriental Bank of Commerce, Syndicate Bank, The Jammu & Kashmir Bank Limited, Corporation Bank, Housing Development Finance Corporation Limited, State Bank of Bikaner & Jaipur, State Bank of Hyderabad, State Bank of Indore, State Bank of Mysore, State Bank of Patiala, State Bank of Saurashtra, The Federal Bank Limited, The Karnataka Bank Limited, The Karur Vysya Bank Limited, UCO Bank, Vijaya Bank, ABN AMRO Bank N.V., The Laxmi Vilas Bank Limited as lenders dated September 16, 2003—incorporated by reference to Exhibit 10.17 to the Registration Statement onForm F-1 (FileNo. 333-138739), as filed with the SEC on November 15, 2006. | |
| | Information Memorandum dated May 30, 2013 relating to the issue of 5000 rated taxable secured listed redeemablenon-convertible debentures of face value of Rs. 10 Lakhs each, aggregating up to Rs. 500 Crore to be issued on a private placement basis in the financial year2013-14 by BALCO—incorporated by reference to Exhibit 4.23 of the annual report onForm-20F for fiscal 2014 (FileNo. 001-33175) | |
| 4.27 | Disclosure document dated July 3, 2013 for | |
| 4.28 | Disclosure document dated July 3, 2013 for Private Placement of Secured, RedeemableNon-Convertible Debentures of Rs. 1,000,000 each aggregating up to Rs. 450 Crores—incorporated by reference to Exhibit 4.25 of the annual report onForm-20F for fiscal 2014 (FileNo. 001-33175) of Sesa Sterlite Limited, as filed with the SEC on August 15, 2014. | |
| 4.29 | Disclosure document dated July 3, 2013, for Private Placement of Secured, RedeemableNon-Convertible Debenture of Rs. 100,000 each aggregating up to Rs. 750 Crores—incorporated by reference to Exhibit 4.26 of the annual report onForm-20F for fiscal 2014 (FileNo. 001-33175) of Sesa Sterlite Limited, as filed with the SEC on August 15, 2014. | |
| | Common Rupee Loan Agreement dated December 27, 2013 among Sesa Sterlite Limited as Borrower, the Banks and Financial Institutions set forth in Part A Schedule I, as Rupee Lenders, Axis Bank Limited, as Lenders’ Agent and Axis Trustee Services Limited as Security Trustee—incorporated by reference to Exhibit 4.27 of the annual report onForm-20F for fiscal 2014 (FileNo. 001-33175) of Sesa Sterlite Limited, as filed with the SEC on August 15, 2014. | |
| | Term Loan Agreement dated November 28, 2013 between Sesa Sterlite and Canara Bank—incorporated by reference to Exhibit 4.28 of the annual report onForm-20F for fiscal 2014 (FileNo. 001-33175) of Sesa Sterlite Limited, as filed with the SEC on August 15, 2014. | |
| | US$100,000,000 Facility Agreement dated June 20, 2008 between Vedanta Aluminium Limited as Borrower, ICICI Bank Limited as Arranger, The Banks and Financial Institutions (listed in Schedule 1) as Original Lenders and ICICI Bank Limited as Agent—incorporated by reference to Exhibit 4.29 of the annual report onForm-20F for fiscal 2014 (FileNo. 001-33175) of Sesa Sterlite Limited, as filed with the SEC on August 15, 2014. | |
| | Facility Agreement dated April 5, 2011 between Vedanta Aluminium Limited as Borrower, The Banks and Financial Institutions Set Forth in Schedule I as the Rupee Lenders and State Bank of India as the Issuing Bank and Facility Agent—incorporated by reference to Exhibit 4.30 of the annual report onForm-20F for fiscal 2014 (FileNo. 001-33175) of Sesa Sterlite Limited, as filed with the SEC on August 15, 2014. | |
| | Amendment and Restatement Agreement dated June 27, 2011 relating to the $500,000,000 Intercompany Loan Facility Agreement dated July 6, 2009 between Vedanta Aluminium as the borrower and Welter Trading Limited as the original lender and Axis Bank Limited, Hong Kong Branch as agent and Security Trustee under the Amended and Restated Facility Agreement—incorporated by reference to Exhibit 4.31 of the annual report onForm-20F for fiscal 2014 (FileNo.001-33175) of Sesa Sterlite Limited, as filed with the SEC on August 15, 2014. | |
| | $50,000,000 Facility Agreement dated January 8, 2013 among Vedanta Aluminium as the original borrower, Sterlite Industries (India) Limited as guarantor, AXIS Bank Limited, Hong Kong Branch as arranger, as original lender and as agent and AXIS Bank Limited as security trustee—incorporated by reference to Exhibit 4.32 of the annual report onForm-20F for fiscal 2014 (FileNo. 001-33175) of Sesa Sterlite Limited, as filed with the SEC on August 15, 2014. | |
| | $1,200,000,000 Facility Agreement dated May 15, 2013 for Vedanta with Twin Star Mauritius Holdings Limited as borrower arranged by Bank of America, N.A., Barclays Banl Plc, Citigroup Global Markets Asia Limited, J.P. Morgan Chase Bank N.A., Singapore Branch, The Royal Bank of Scotland Plc and Standard Chartered Bank and Standard Chartered Bank (Mauritius) Limited acting as account bank and Standard Chartered Bank acting as agent and security agent—incorporated by reference to Exhibit 4.33 of the annual report onForm-20F for fiscal 2014 (FileNo. 001-33175) of Sesa Sterlite Limited, as filed with the SEC on August 15, 2014. | |
| | Rs. 50,000 million Facility Agreement dated July 21, 2014 among Sesa Sterlite Limited as borrower, State Bank of India as lender and SBICAP Trustee Company Limited as security trustee—incorporated by reference to Exhibit 4.35 of the annual report onForm-20F for fiscal 2015 (FileNo. 001-33175) of Vedanta Limited, as filed with the SEC on August 14, 2015. | |
| | Rs. 10,000 million Facility Agreement dated April 15, 2014 among Sesa Sterlite Limited as borrower and Union Bank of India as lender—incorporated by reference to Exhibit 4.36 of the annual report onForm-20F for fiscal 2015 (FileNo.001-33175) of Vedanta Limited, as filed with the SEC on August 14, 2015. | |
| | Rs. 20,000 million Facility Agreement dated April 15, 2014 among Sesa Sterlite Limited as borrower, Bank of India as lender and SBICAP Trustee Company Limited as security trustee—incorporated by reference to Exhibit 4.37 of the annual report onForm-20F for fiscal 2015 (FileNo. 001-33175) of Vedanta Limited, as filed with the SEC on August 14, 2015. | |
| | Rs. 10,250 million Facility Agreement dated April 15, 2014 among Sesa Sterlite Limited as borrower and Syndicate Bank as lender—incorporated by reference to Exhibit 4.38 of the annual report onForm-20F for fiscal 2015 (FileNo. 001-33175) of Vedanta Limited, as filed with the SEC on August 14, 2015. | |
| | Rs. 20,000 million Facility Agreement dated April 15, 2014 among Sesa Sterlite Limited as borrower and Bank of Baroda as lender—incorporated by reference to Exhibit 4.39 of the annual report onForm-20F for fiscal 2015 (FileNo. 001-33175) of Vedanta Limited, as filed with the SEC on August 14, 2015. | |
| | Debenture trust deed dated December 23, 2014 for 9.36% rated, secured, listed, redeemablenon-convertible debentures between Sesa Sterlite Limited as the Issuer and Axis Trustee Services Limited as the Debenture Trustee—incorporated by reference to Exhibit 4.40 of the annual report onForm-20F for fiscal 2015 (FileNo. 001-33175) of Vedanta Limited, as filed with the SEC on August 14, 2015. | |
| | $ 250 million conventional facility (with a greenshoe option to increase the facility amount by $ 125 million) and $ 250 million Islamic facility (with a greenshoe option to increase the facility amount by $ 125 million) for Vedanta Resources Plc with Twin Star Mauritius Holdings Ltd arranged by First Gulf Bank PJSC and Standard Chartered Bank as Conventional Facility Arrangers and Islamic Facility Arrangers, and Standard Chartered Bank (Mauritius) Limited acting as Account Bank and Standard Chartered Bank acting as Global Facility Agent—incorporated by reference to Exhibit 4.41 of the annual report onForm-20F for fiscal 2015 (FileNo. 001-33175) of Vedanta Limited, as filed with the SEC on August 14, 2015. | |
| | $ 100 million Facility Agreement dated August 20, 2014 among Twin Star Mauritius Holdings Ltd as borrower and Vedanta Resources Jersey II Limited as lender—incorporated by reference to Exhibit 4.42 of the annual report onForm-20F for fiscal 2015 (FileNo. 001-33175) of Vedanta Limited, as filed with the SEC on August 14, 2015. | |
| | Subscription Agreement between Sterlite Industries (India) Limited and the Life Insurance Corporation of India dated April 9, 2003—incorporated by reference to Exhibit 10.18 to the Registration Statement on FormF-1( | |
| | Option Agreement between Sterlite Industries (India) Limited, India Foils Limited and ICICI Bank Limited dated February 18, 2005—incorporated by reference to Exhibit 10.19 to the Registration Statement on FormF-1 (FileNo.333-138739), as filed with the SEC on November 15, 2006. | |
| | Corporate Guarantee by Sterlite Industries (India) Limited to ICICI Bank Limited on behalf of India Foils Limited dated February 8, 2005—incorporated by reference to Exhibit 10.20 to the Registration Statement on FormF-1( | |
| | Corporate Guarantee by Sterlite Industries (India) Limited to ICICI Bank Limited on behalf of Vedanta Aluminium Limited dated December 4, 2004—incorporated by reference to Exhibit 10.21 to the Registration Statement on FormF-1 (FileNo.333-138739), as filed with the SEC on November 15, 2006. | |
| | Frame Contract between Sterlite Industries (India) Limited and the CMT dated July 1, 2004, as amended on July 1, 2004—incorporated by reference to Exhibit 10.22 to the Registration Statement on FormF-1 (FileNo. 333-138739), as filed with the SEC on November 15, 2006. | |
| | Copper Concentrate Purchase Contract between Sterlite Industries (India) Limited and the CMT dated July 1, 2005—incorporated by reference to Exhibit 10.23 to the Registration Statement on FormF-1 (FileNo. 333-138739), as filed with the SEC on November 15, 2006. | |
| | Agreement for Sale and Purchase of the Power Transmission Line Division between Sterlite Industries (India) Limited and Sterlite Optical Technologies Limited dated August 30, 2006—incorporated by reference to Exhibit 10.24 to the Registration Statement on FormF-1 (FileNo. 333-138739), as filed with the SEC on November 15, 2006. | |
| | Agreement between Sterlite Industries (India) Limited and Navin Agarwal dated October 8, 2003—incorporated by reference to Exhibit 10.25 to the Registration Statement on FormF-1 (FileNo. 333-138739), as filed with the SEC on November 15, 2006. | |
| | Agreement between Sesa Goa Limited and Navin Agarwal dated August 17, 2013—incorporated by reference to Exhibit 4.42 of the annual report onForm-20F for fiscal 2014 (FileNo. 001-33175) of Sesa Sterlite Limited, as filed with the SEC on August 15, 2014. | |
| | Agreement between Sterlite Industries (India) Limited and Kuldip Kumar Kaura dated September 12, 2006—incorporated by reference to Exhibit 10.26 to the Registration Statement on FormF-1 (FileNo. 333-138739), as filed with the SEC on November 15, 2006. | |
| | Letter issued by Sterlite Industries (India) Limited to Kuldip Kumar Kaura dated March 27, 2008—incorporated by reference to Exhibit 4.28 of the annual report onForm-20F for fiscal 2008 (FileNo. 001-33175) of Sterlite Industries (India) Limited, as filed with the SEC on June 30, 2008. | |
| | Share Purchase Agreement between Sterlite Industries (India) Limited and Anil Agarwal dated October 3, 2006 relating to the sale of Sterlite Energy Limited—incorporated by reference to Exhibit 10.29 of Amendment No. 1 to the Registration Statement on FormF-1 (FileNo. 333-138739), as filed with the SEC on November 22, 2006. | |
| | Share Purchase Agreement between Sterlite Industries (India) Limited and Dwarka Prasad Agarwal dated October 3, 2006 relating to the sale of Sterlite Energy Limited—incorporated by reference to Exhibit 10.30 of Amendment No. 1 to the Registration Statement on FormF-1 (FileNo. 333-138739), as filed with the SEC on November 22, 2006. | |
| | Share Purchase Agreement between Sterlite Industries (India) Limited and Twin Star Infrastructure Limited dated October 3, 2006 relating to the sale of Sterlite Energy Limited—incorporated by reference to Exhibit 10.31 of Amendment No. 1 to the Registration Statement on FormF-1 (FileNo. 333-138739), as filed with the SEC on November 22, 2006. | |
| | Specialty Deed between CMT, Mt Lyell Mining Company Limited, Citibank Limited and Citibank, N.A. dated April 1, 1999—incorporated by reference to Exhibit 10.36 of Amendment No. 2 to the Registration Statement on FormF-1 (FileNo. 333-138739), as filed with the SEC on February 8, 2007. | |
| | Subordination Deed Poll between Monte Cello Corporation N.V., Citibank Limited and Citibank, N.A. dated April 1, 1999—incorporated by reference to Exhibit 10.37 of Amendment No. 2 to the Registration Statement on FormF-1( | |
| | Deed of Assignment of Debt between Monte Cello Corporation N.V. and Mt Lyell Mining Company Limited dated April 1, 1999—incorporated by reference to Exhibit 10.38 of Amendment No. 2 to the Registration Statement onForm F-1 (FileNo. 333-138739), as filed with the SEC on February 8, 2007. | |
| | Deed of Assignment of Debt between Monte Cello Corporation N.V., Citibank Limited and Citibank, N.A. dated April 1, 1999—incorporated by reference to Exhibit 10.39 of Amendment No. 2 to the Registration Statement on FormF-1 (FileNo. 333-138739), as filed with the SEC on February 8, 2007. | |
| | Memorandum of Understanding between Sterlite Industries (India) Limited and Vedanta Aluminium Limited dated August 29, 2007 relating to the subscription of the Zero Percent Optionally Fully Convertible Debentures-incorporated by reference to Exhibit 4.38 of the annual report onForm-20F for fiscal 2008 (FileNo. 001-33175) of Sterlite Industries (India) Limited, as filed with the SEC on June 30, 2008. | |
| | Addendum dated March 17, 2008 to the Memorandum of Understanding between Sterlite Industries (India) Limited and Vedanta Aluminium Limited dated August 29, 2007 relating to the subscription of the Zero Percent Optionally Fully Convertible Debentures-incorporated by reference to Exhibit 4.39 of the annual report onForm-20F for fiscal 2008 (FileNo. 001-33175) of Sterlite Industries (India) Limited, as filed with the SEC on June 30, 2008. | |
| | Memorandum of Understanding between Sterlite Industries (India) Limited and Vedanta Aluminium Limited dated December 23, 2007 relating to the subscription of the Zero Percent Optionally Fully Convertible Debentures-incorporated by reference to Exhibit 4.40 of the annual report onForm-20F for fiscal 2008 (FileNo. 001-33175) of Sterlite Industries (India) Limited, as filed with the SEC on June 30, 2008. | |
| | Addendum dated March 17, 2008 to the Memorandum of Understanding between Sterlite Industries (India) Limited and Vedanta Aluminium Limited dated December 23, 2007 relating to the subscription of the Zero Percent Optionally Fully Convertible Debentures-incorporated by reference to Exhibit 4.41 of the annual report onForm-20F for fiscal 2008 (FileNo. 001-33175) of Sterlite Industries (India) Limited, as filed with the SEC on June 30, 2008. | |
| | Purchase and Sale Agreement dated May 30, 2008 among Asarco LLC, AR Silver Bell, Inc., Copper Basin Railway, Inc., Asarco Santa Cruz, Inc., Sterlite (U.S.A), Inc. and Sterlite Industries (India) Limited—incorporated by reference to Exhibit 4.42 of the annual report onForm-20F for fiscal 2008 (FileNo. 001-33175) of Sterlite Industries (India) Limited, as filed with the SEC on June 30, 2008. | |
| | Amendment No. 1 dated April 15, 2009 to the Settlement and Sale and Purchase Agreement dated March 6, 2009 among Asarco LLC, AR Silver Bell, Inc., Copper Basin Railway, Inc., Asarco Santa Cruz, Inc., Sterlite (U.S.A), Inc., and Sterlite Industries (India) Limited—incorporated by reference to Exhibit 4.43 of the annual report onForm-20F for fiscal 2009 (FileNo. 001-33175) of Sterlite Industries (India) Limited, as filed with the SEC on July 10, 2009. | |
| | Amendment No. 2 effective as of April 22, 2009 to the Settlement and Sale and Purchase Agreement dated March 6, 2009, as amended on April 15, 2009, among Asarco LLC, AR Silver Bell, Inc., Copper Basin Railway, Inc., Asarco Santa Cruz, Inc., Sterlite (U.S.A), Inc., and Sterlite Industries (India) Limited—incorporated by reference to Exhibit 4.44 of the annual report onForm-20F for fiscal 2009 (FileNo. 001-33175) of Sterlite Industries (India) Limited, as filed with the SEC on July 10, 2009. | |
| | Amendment No. 3 effective as of June 12, 2009 to the Settlement and Sale and Purchase Agreement dated March 6, 2009, as amended on April 15, 2009 and April 22, 2009, among Asarco LLC, AR Silver Bell, Inc., Copper Basin Railway, Inc., Asarco Santa Cruz, Inc., Sterlite (U.S.A), Inc., and Sterlite Industries (India) Limited—incorporated by reference to Exhibit 4.45 of the annual report onForm-20F for fiscal 2009 (FileNo. 001-33175) of Sterlite Industries (India) Limited, as filed with the SEC on July 10, 2009. | |
| | Sterlite Plan Agreement in Principle Term Sheet dated June 12, 2009 among Asarco LLC, the subsidiary debtors, Sterlite (U.S.A), Inc., Robert C. Pate, in his capacity as the Future Claims Representative, and the Official Committee of Asbestos Claimants—incorporated by reference to Exhibit 4.46 of the annual report onForm-20F for fiscal 2009 (FileNo.001-33175) of Sterlite Industries (India) Limited, as filed with the SEC on July 10, 2009. | |
| | Credit Agreement Letter dated February 7, 2005 between India Foils Limited and ICICI Bank Limited-incorporated by reference to Exhibit 4.47 of the annual report onForm-20F for fiscal 2009 (FileNo. 001-33175) of Sterlite Industries (India) Limited, as filed with the SEC on July 10, 2009. | |
| | Novation Agreement dated November 15, 2008 among Sterlite Industries (India) Limited, India Foils Limited and ICICI Bank Limited in respect of Rs. 772.5 million term loan facility—incorporated by reference to Exhibit 4.48 of the annual report onForm-20F for fiscal 2009 (FileNo. 001-33175) of Sterlite Industries (India) Limited, as filed with the SEC on July 10, 2009. | |
| | Credit Agreement Letter dated August 4, 2005 between India Foils Limited and ICICI Bank Limited-incorporated by reference to Exhibit 4.49 of the annual report onForm-20F for fiscal 2009 (FileNo. 001-33175) of Sterlite Industries (India) Limited, as filed with the SEC on July 10, 2009. | |
| | Novation Agreement dated November 15, 2008 among Sterlite Industries (India) Limited, India Foils Limited and ICICI Bank Limited in respect of the Rs. 250 million term loan facility—incorporated by reference to Exhibit 4.50 of the annual report onForm-20F for fiscal 2009 (FileNo. 001-33175) of Sterlite Industries (India) Limited, as filed with the SEC on July 10, 2009. | |
| | Agreement dated February 18, 2009 between the Orissa Mining Corporation Limited and Sterlite Industries (India) Limited—incorporated by reference to Exhibit 4.55 of the annual report onForm-20F for fiscal 2009 (FileNo. 001-33175) of Sterlite Industries (India) Limited, as filed with the SEC on July 10, 2009. | |
| | Term Sheet dated May 22, 2009 between Sterlite Industries (India) Limited and Vedanta Aluminium Limited relating to the subscription of 9.75%Non-Convertible Debentures-incorporated by reference to Exhibit 4.54 of the annual report onForm-20F for fiscal 2009 (FileNo. 001-33175) of Sterlite Industries (India) Limited, as filed with the SEC on July 10, 2009. | |
| | Indenture and Supplemental Indenture, both dated October 29, 2009, between Sterlite Industries (India) Limited and Wilmington Trust Company as trustee and Citibank, N.A., as securities administrator—incorporated by reference to Exhibits 4.1 and 4.2 to theForm-6K (FileNo. 001-33175) of Sterlite Industries (India) Limited, as filed with the SEC on November 3, 2009. | |
| | Second Supplemental Indenture dated October 29, 2009, between Sesa Goa Limited and Wilmington Trust Company as trustee and Citibank N.A., as securities administrator—incorporated by reference to Exhibit 99.2 to the Form6-K (File001-33175) of Sesa Sterlite Limited, as filed with the SEC on September 11, 2013. | |
| | Trust Deed dated October 30, 2009 between Sesa Goa Limited and Citicorp International Limited for the $500,000,000 5.0% Convertible Bonds due 2014 convertible into Shares of Sesa Goa Limited—incorporated by reference to Exhibit 4.73 of the annual report onForm-20F for fiscal 2014 (FileNo. 001-33175) of Sesa Sterlite Limited, as filed with the SEC on August 15, 2014. | |
| | Amendment dated March 29, 2009 to the Consultancy and Representative Office Agreement between Vedanta and Sterlite Industries (India) Limited both dated March 29, 2005—incorporated by reference to Exhibit 4.56 of the annual report on Form20-F for fiscal 2011 (FileNo. 001-33175) of Sterlite Industries (India) Limited, as filed with the SEC on September 30, 2011. | |
| | Outsourcing Services Agreement dated April 1, 2010 between Vedanta and Sterlite Industries (India) Limited—incorporated by reference to Exhibit 4.57 of the annual report on Form20-F for fiscal 2011 (FileNo. 001-33175) of Sterlite Industries (India) Limited, as filed with the SEC on September 30, 2011. | |
| | Outsourcing Services Agreement dated May 20, 2014 between Vedanta and Sesa Sterlite Limited—incorporated by reference to Exhibit 4.76 of the annual report onForm-20F for fiscal 2014 (FileNo. 001-33175) of Sesa Sterlite Limited, as filed with the SEC on August 15, 2014. | |
| | Share Purchase Agreement dated May 9, 2010 between Anglo Operations Limited, Taurus International S.A., Anglo South Africa Capital (Pty) Limited, Anglo American Services (UK) Limited, Welter Trading Limited and Vedanta—incorporated by reference to Exhibit 4.58 of the annual report on Form20-F for fiscal 2011 (FileNo. 001-33175) of Sterlite Industries (India) Limited, as filed with the SEC on September 30, 2011. | |
| | Buyer’s Credit Import Advance facility dated December 8, 2009 and Demand Promissory Note accepted on May 18, 2010 obtained by BALCO from DBS Bank Limited for $ 50 million—incorporated by reference to Exhibit 4.59 of the annual report on Form20-F for fiscal 2011 (FileNo. 001-33175) of Sterlite Industries (India) Limited, as filed with the SEC on September 30, 2011. | |
| | Letter of Credit Facility Agreement dated August 30, 2010 obtained by TSPL from ICICI Bank for Rs. 10,000 million—incorporated by reference to Exhibit 4.60 of the annual report on Form20-F for fiscal 2011 (FileNo. 001-33175) of Sterlite Industries (India) Limited, as filed with the SEC on September 30, 2011. | |
| | Share Purchase and Shareholders’ Agreement dated September 17, 2010 between Sterlite Industries (India) Limited, Leighton Contractors (India) Private Limited and Vizag General Cargo Berth Private Limited—incorporated by reference to Exhibit 4.61 of the annual report on Form20-F for fiscal 2011 (FileNo. 001-33175) of Sterlite Industries (India) Limited, as filed with the SEC on September 30, 2011. | |
| | Corporate Guarantee dated December 8, 2010 given by Sterlite Industries (India) Limited to IL&FS Trust Company Limited on behalf of TSPL—incorporated by reference to Exhibit 4.62 of the annual report on Form20-F for fiscal 2011 (FileNo. 001-33175) of Sterlite Industries (India) Limited, as filed with the SEC on September 30, 2011. | |
| | Second Deed of Amendment dated December 16, 2010 between Anglo Operations Limited, Taurus International S.A., Anglo South Africa Capital (Pty) Limited, Anglo American Services (UK) Limited, Welter Trading Limited, THL Zinc Limited, Labaume B.V., Pecvest 17 (Proprietary) Limited and Vedanta as an amendment to the Share Purchase Agreement dated May 9, 2010—incorporated by reference to Exhibit 4.63 of the annual report on Form20-F for fiscal 2011 (FileNo. 001-33175) of Sterlite Industries (India) Limited, as filed with the SEC on September 30, 2011. | |
| | Letter of Credit Facility Agreement dated December 18, 2010 obtained by BALCO from ICICI Bank for Rs. 2.50 billion—incorporated by reference to Exhibit 4.64 of the annual report on Form20-F for fiscal 2011 (FileNo.001-33175) of Sterlite Industries (India) Limited, as filed with the SEC on September 30, 2011. | |
| | Service Contract dated January 25, 2011 between Sterlite Industries (India) Limited and Mr. Din Dayal Jalan—incorporated by reference to Exhibit 4.65 of the annual report on Form20-F for fiscal 2011 (FileNo. 001-33175) of Sterlite Industries (India) Limited, as filed with the SEC on September 30, 2011. | |
| | Service Contract dated January 29, 2013 between Sterlite Industries (India) Limited and Mr. Din Dayal Jalan—incorporated by reference to Exhibit 4.66 of the annual report onForm-20F for fiscal 2013 (FileNo. 001-33175) of Sterlite Industries (India) Limited, as filed with the SEC on July 30, 2013. | |
| | Service Agreement dated April 1, 2014 between Sesa Sterlite Limited and Mr. Din Dayal Jalan—incorporated by reference to Exhibit 4.86 of the annual report onForm-20F for fiscal 2014 (FileNo. 001-33175) of Sesa Sterlite Limited, as filed with the SEC on August 15, 2014. | |
| | Addendum to the Service Agreement (dated April 1, 2014) between Sesa Sterlite Limited and Mr. Din Dayal Jalan—incorporated by reference to Exhibit 4.96 of the annual report onForm-20F for fiscal 2015 (FileNo. 001-33175) of Vedanta Limited, as filed with the SEC on August 14, 2015. | |
| 8.1** | List of subsidiaries of Vedanta Limited | |
| 11.1 | Sterlite Industries (India) Limited—Code of Business Conduct and Ethics as amended till November 2011—incorporated by reference to Exhibit 11.1 of the annual report on Form20-F for fiscal 2012 (FileNo. 001-33175) of Sterlite Industries (India) Limited, as filed with the SEC on May 25, 2012. | |
| 11.2 | Sesa Sterlite Limited—Code of Business Conduct and Ethics as revised and approved by the board on January 28, 2014—incorporated by reference to Exhibit 11.2 of the annual report onForm-20F for fiscal 2014 (FileNo. 001-33175) of Sesa Sterlite Limited, as filed with the SEC on August 15, 2014. | |
| 11.3 | Sesa Sterlite Limited—Code of Business Conduct and Ethics as revised and approved by the board on October 29, 2014—incorporated by reference to Exhibit 11.3 of the annual report onForm-20F for fiscal 2015 (FileNo. 001-33175) of Vedanta Limited, as filed with the SEC on August 14, 2015. | |
| 11.4 | Vedanta Limited—Code of Business Conduct and Ethics as revised and approved by the board on April 29, 2015 and July 29, 2015—incorporated by reference to Exhibit 11.4 of the annual report onForm-20F for fiscal 2015 (FileNo.001-33175) of Vedanta Limited, as filed with the SEC on August 14, 2015. | |
| 11.5 | Vedanta Limited—Antitrust Guidance Notes—incorporated by reference to Exhibit 11.5 of the annual report onForm-20F for fiscal 2015 (FileNo. 001-33175) of Vedanta Limited, as filed with the SEC on August 14, 2015. | |
| 11.6** | Vedanta Limited—Code of Business Conduct and Ethics as revised and approved by the board on October 28, 2016. | |
| 12.1** | Certification by the Chief Executive Officer pursuant to 17 CFR 240.15d-14(a), as adopted pursuant to Section 302 of the Sarbanes-Oxley Act of 2002. | |
| 12.2** | Certification by the Chief Financial Officer pursuant to 17 CFR 240.15d-14(a), as adopted pursuant to Section 302 of the Sarbanes-Oxley Act of 2002. | |
| 13.1** | Certification by the Chief Executive Officer pursuant to 18 U.S.C. Section 1350, as adopted pursuant to Section 906 of the Sarbanes-Oxley Act of 2002. | |
| 13.2** | Certification by the Chief Financial Officer pursuant to 18 U.S.C. Section 1350, as adopted pursuant to Section 906 of the Sarbanes-Oxley Act of 2002. | |
| 15.1 | Reserves evaluation report dated June 12, 2014 by DeGolyer and MacNaughton—incorporated by reference to Exhibit 15.2 of the annual report onForm-20F for fiscal 2014 (FileNo. 001-33175) of Sesa Sterlite Limited, as filed with the SEC on August 15, 2014. | |
| 15.2 | Appraisal Report by DeGolyer and MacNaughton as of March 31, 2014 on the Proved Reserves of certain Fields in India owned by Cairn India Limited for Sesa Sterlite Limited—incorporated by reference to Exhibit 15.3 of the annual report onForm-20F for fiscal 2014 (FileNo. 001-33175) of Sesa Sterlite Limited, as filed with the SEC on August 15, 2014. | |
| 15.3 | Appraisal Report by DeGolyer and MacNaughton as of March 31, 2013 on the Proved Reserves of certain Fields in India owned by Cairn India Limited for Sesa Sterlite Limited—incorporated by reference to Exhibit 15.4 of the annual report onForm-20F for fiscal 2014 (FileNo. 001-33175) of Sesa Sterlite Limited, as filed with the SEC on August 15, 2014. | |
| 15.4 | Appraisal Report by DeGolyer and MacNaughton as of March 31, 2012 on the Proved Reserves of certain Fields in India owned by Cairn India Limited for Sesa Sterlite Limited—incorporated by reference to Exhibit 15.5 of the annual report onForm-20F for fiscal 2014 (FileNo. 001-33175) of Sesa Sterlite Limited, as filed with the SEC on August 15, 2014. | |
| 15.5 | Appraisal Report by DeGolyer and MacNaughton as of March 31, 2011 on the Proved Reserves of certain Fields in India owned by Cairn India Limited for Sesa Sterlite Limited—incorporated by reference to Exhibit 15.6 of the annual report onForm-20F for fiscal 2014 (FileNo. 001-33175) of Sesa Sterlite Limited, as filed with the SEC on August 15, 2014. | |
| 15.6 | Appraisal Report by DeGolyer and MacNaughton as of March 31, 2015 on the Proved Reserves of certain Fields in India owned by Cairn India Limited for Vedanta Limited—incorporated by reference to Exhibit 15.6 of the annual report onForm-20F for fiscal 2015 (FileNo. 001-33175) of Vedanta Limited, as filed with the SEC on August 14, | |
| Appraisal Report by DeGolyer and MacNaughton as of March 31, 2016 on the Proved Reserves of certain Fields in India owned by Cairn India Limited for Vedanta Limited—incorporated by reference to Exhibit 15.7 of the annual report onForm 20-F for fiscal 2016 (FileNo. 001-33175) of Vedanta Limited, as filed with the SEC on August 1, 2016. | ||
| 15.8** | Appraisal Report by DeGolyer and MacNaughton as of March 31, 2017 on the Proved Reserves of certain Fields in India owned by Cairn India Limited for Vedanta Limited. | |
** Filed herewith
Notes:
The Company has not included as exhibits certain instruments with respect to its long-term debt, the amount of debt authorized under each of which does not exceed 10% of its total assets, and it agrees to furnish a copy of any such instrument to the Securities and Exchange Commission upon request.
The registrant hereby certifies that it meets all of the requirements for filing on Form20-F and that it has duly caused and authorized the undersigned to sign this Annual Report on its behalf.
| VEDANTA LIMITED | ||
| By: | /s/ | |
| Name: | ||
| Title: | Chief Financial Officer | |
Date: August 1, 201615, 2017
Index to Consolidated Financial Statements
| Page(s) | ||||
| F-2 | ||||
Consolidated Statements of Financial Position as at March 31, | ||||
Consolidated Statements of Cash Flows for the years ended March 31, | ||||
| F-11 | ||||
REPORT OF INDEPENDENT REGISTERED PUBLIC ACCOUNTING FIRM
The Board of Directors and Shareholders of Vedanta Limited
We have audited the accompanying consolidated statement of financial position of Vedanta Limited and subsidiaries as of March 31, 2017 and the related consolidated statements of profit or loss, comprehensive income, changes in equity and cash flows for the year ended March 31, 2017. These financial statements are the responsibility of Company’s management. Our responsibility is to express an opinion on these financial statements based on our audits.
We conducted our audits in accordance with the standards of the Public Company Accounting Oversight Board (United States). Those standards require that we plan and perform the audit to obtain reasonable assurance about whether the financial statements are free of material misstatement. An audit includes examining, on a test basis, evidence supporting the amounts and disclosures in the financial statements. An audit also includes assessing the accounting principles used and significant estimates made by management, as well as evaluating the overall financial statement presentation. We believe that our audit provides a reasonable basis for our opinion.
In our opinion, the financial statements referred to above present fairly, in all material respects, the consolidated financial position of Vedanta Limited and subsidiaries at March 31, 2017 and the consolidated results of their operations and their cash flows for the year ended March 31, 2017, in conformity with International Financial Reporting Standards as issued by the International Accounting Standards Board.
We also have audited, in accordance with the standards of the Public Company Accounting Oversight Board (United States), Vedanta Limited’s internal control over financial reporting as of March 31, 2017, based on criteria established in Internal Control-Integrated Framework issued by the Committee of Sponsoring Organizations of the Treadway Commission (2013 Framework) and our report dated August 15, 2017 expressed an unqualified opinion thereon.
/s/ S. R. Batliboi & Co. LLP
Gurgaon, India
August 15, 2017
REPORT OF INDEPENDENT REGISTERED PUBLIC ACCOUNTING FIRM
To the Board of Directors and Shareholders of
Vedanta Limited
Panaji, Goa,Mumbai, Maharashtra, India
We have audited the accompanying consolidated statements of financial position of Vedanta Limited and subsidiaries (the “Company”) as of March 31, 2016, and 2015, and the related consolidated statements of profit or loss, comprehensive income, changes in equity, and cash flows for each of the threetwo years in the period ended March 31, 2016, all expressed in Indian Rupees. These consolidated financial statements are the responsibility of the Company’s management. Our responsibility is to express an opinion on the consolidated financial statements based on our audits.
We conducted our audits in accordance with the standards of the Public Company Accounting Oversight Board (United States). Those standards require that we plan and perform the audit to obtain reasonable assurance about whether the financial statements are free of material misstatement. An audit includes examining, on a test basis, evidence supporting the amounts and disclosures in the financial statements. An audit also includes assessing the accounting principles used and significant estimates made by management, as well as evaluating the overall financial statement presentation. We believe that our audits provide a reasonable basis for our opinion.
In our opinion, such consolidated financial statements present fairly, in all material respects, the financial position of Vedanta Limited and subsidiaries as of March 31, 2016, and 2015, and the results of their operations and their cash flows for each of the threetwo years in the period ended March 31, 2016, in conformity with International Financial Reporting Standards as issued by the International Accounting Standards Board.
We have also audited, in accordance with the standards of the Public Company Accounting Oversight Board (United States), the Company’s internal control over financial reporting as of March 31, 2016, based on the criteria established in Internal Control — Integrated Framework (2013) issued by the Committee of Sponsoring Organizations of the Treadway Commission and our report dated August 1, 2016 expressed an unqualified opinion on the Company’s internal control over financial reporting.
Our audit for the year ended and as of March 31, 2016, also comprehended the translation of Indian Rupees amounts into United States dollar amounts and, in our opinion, such translation has been made in conformity with the basis stated in Note 2. The translation of the consolidated financial statements amounts into United States dollars have been made solely for the convenience of the readers.
/s/ Deloitte Haskins & Sells LLP
Deloitte Haskins & Sells LLP
Gurgaon, India
August 1, 2016 (August 15, 2017 as to the effects of the adjustments discussed in Note 34)
VEDANTA LIMITED AND SUBSIDIARIES
CONSOLIDATED STATEMENTS OF PROFIT OR LOSS
(In millions except share or per share amounts unless otherwise stated)
| For the year ended March 31, | 2014 | 2015 | 2016 | 2016 | 2015 | 2016 | 2017 | 2017 | ||||||||||||||||||||||||||||||
| Notes | (Rs. in million) | (Rs. in million) | (Rs. in million) | (US dollars in million) (Note 2) | Notes | (Rs. in million) | (Rs. in million) | (Rs. in million) | (US dollars in million) (Note 2) | |||||||||||||||||||||||||||||
Revenue | 4 | 725,243 | 733,579 | 639,493 | 9,652.7 | 4 | 733,579 | 639,493 | 717,207 | 11,059.5 | ||||||||||||||||||||||||||||
Cost of sales* | (557,900) | (995,968) | (875,756) | (13,219.0) | (995,968) | (875,756) | (533,989) | (8,234.2) | ||||||||||||||||||||||||||||||
|
|
|
|
|
|
|
| |||||||||||||||||||||||||||||||
Gross profit / (loss) | 167,343 | (262,389) | (236,263) | (3,566.3) | (262,389) | (236,263) | 183,218 | 2,825.3 | ||||||||||||||||||||||||||||||
Other operating income | 4,541 | 4,802 | 4,785 | 72.2 | 4,802 | 4,785 | 5,186 | 79.9 | ||||||||||||||||||||||||||||||
Distribution expenses | (12,127) | (10,078) | (12,070) | (182.2) | (10,078) | (12,070) | (16,361) | (252.3) | ||||||||||||||||||||||||||||||
Administration expenses | (32,229) | (31,550) | (25,274) | (381.4) | (31,550) | (25,274) | (19,299) | (297.6) | ||||||||||||||||||||||||||||||
|
|
|
|
|
|
|
| |||||||||||||||||||||||||||||||
Operating profit / (loss) | 127,528 | (299,215) | (268,822) | (4,057.7) | (299,215) | (268,822) | 152,744 | 2,355.3 | ||||||||||||||||||||||||||||||
Investment and other income | 5 | 42,165 | 51,154 | 43,998 | 664.1 | 5 | 51,154 | 43,998 | 45,428 | 700.5 | ||||||||||||||||||||||||||||
Finance and other costs | 6 | (72,821) | (63,398) | (59,584) | (899.4) | 6 | (63,398) | (59,584) | (61,600) | (949.8) | ||||||||||||||||||||||||||||
|
|
|
|
|
|
|
| |||||||||||||||||||||||||||||||
Profit / (loss) before tax | 96,872 | (311,459) | (284,408) | (4,293.0) | (311,459) | (284,408) | 136,572 | 2,106.0 | ||||||||||||||||||||||||||||||
Income tax (expense) / benefit | 7 | (34,646) | 108,320 | 103,060 | 1,555.7 | 7 | 108,320 | 103,060 | (38,027) | (586.4) | ||||||||||||||||||||||||||||
|
|
|
|
|
|
|
| |||||||||||||||||||||||||||||||
Profit / (loss) for the year | 62,226 | (203,139) | (181,348) | (2,737.3) | (203,139) | (181,348) | 98,545 | 1,519.6 | ||||||||||||||||||||||||||||||
Profit / (loss) attributable to: | ||||||||||||||||||||||||||||||||||||||
Equity holders of the parent | 15,466 | (128,350) | (125,153) | (1,889.1) | (128,350) | (125,153) | 55,033 | 848.6 | ||||||||||||||||||||||||||||||
Non-controlling interests | 46,760 | (74,789) | (56,195) | (848.2) | (74,789) | (56,195) | 43,512 | 671.0 | ||||||||||||||||||||||||||||||
|
|
|
|
|
|
|
| |||||||||||||||||||||||||||||||
Profit / (loss) for the year | 62,226 | (203,139) | (181,348) | (2,737.3) | (203,139) | (181,348) | 98,545 | 1,519.6 | ||||||||||||||||||||||||||||||
|
|
|
|
|
|
|
| |||||||||||||||||||||||||||||||
Earnings / (loss) per share | 27 | 27 | ||||||||||||||||||||||||||||||||||||
Basic | 5.22 | (43.29) | (42.21) | (0.6) | (43.29) | (42.21) | 18.57 | 0.3 | ||||||||||||||||||||||||||||||
Diluted | 5.22 | (43.29) | (42.21) | (0.6) | (43.29) | (42.21) | 18.56 | 0.3 | ||||||||||||||||||||||||||||||
| Weighted average number of equity shares used in computing earnings per share | ||||||||||||||||||||||||||||||||||||||
Basic | 2,965,004,871 | 2,965,004,871 | 2,965,004,871 | 2,965,004,871 | 2,965,004,871 | 2,965,004,871 | 2,964,333,584 | 2,964,333,584 | ||||||||||||||||||||||||||||||
Diluted | 2,965,004,871 | 2,965,004,871 | 2,965,004,871 | 2,965,004,871 | 2,965,004,871 | 2,965,004,871 | 2,965,560,871 | 2,965,560,871 | ||||||||||||||||||||||||||||||
The accompanying notes are an integral part of these consolidated financial statements.
| * | Cost of sales for the year ended March 31, 2015, March 31, 2016 and March 31, |
The Group’s (Refer note1- Group overview) consolidated statements of profit or loss are presented disclosing expenses by function. The consolidated statements of profit or loss disclosing expenses presented by nature are in Note 32 (c).
VEDANTA LIMITED AND SUBSIDIARIES
CONSOLIDATED STATEMENTS OF COMPREHENSIVE INCOME
(In millions except share or per share amounts unless otherwise stated)
| For the year ended March 31, | 2014 | 2015 | 2016 | 2016 | 2015 | 2016 | 2017 | 2017 | ||||||||||||||||||||||||
| (Rs. in million) | (Rs. in million) | (Rs. in million) | (US dollars in million) (Note 2) | (Rs. in million) | (Rs. in million) | (Rs. in million) | (US dollars in million) (Note 2) | |||||||||||||||||||||||||
| Profit / (loss) for the year | 62,226 | (203,139) | (181,348) | (2,737.3) | (203,139) | (181,348) | 98,545 | 1,519.6 | ||||||||||||||||||||||||
| Other comprehensive income, net of income tax: | ||||||||||||||||||||||||||||||||
| Items that will not be reclassified subsequently to profit or loss | ||||||||||||||||||||||||||||||||
| Re-measurement of defined benefit obligation* | (98) | (457) | (93) | (1.4) | (457) | (93) | (14) | (0.2) | ||||||||||||||||||||||||
| Items that will be reclassified subsequently to profit or loss | ||||||||||||||||||||||||||||||||
| Exchange differences on translation of foreign operations | 44,250 | 8,620 | 3,227 | 48.7 | ||||||||||||||||||||||||||||
Exchange differences on translation of foreign operations* | 8,620 | 3,227 | (3,466) | (53.6) | ||||||||||||||||||||||||||||
| (Loss) / gain on available-for-sale financial investments | (1) | 151 | 170 | 2.5 | 151 | 170 | 263 | 4.1 | ||||||||||||||||||||||||
| Cash flow hedges*# | 41 | (758) | 163 | 2.5 | (758) | 163 | (16) | (0.2) | ||||||||||||||||||||||||
| Reclassification of gain on available-for-sale financial investment to consolidated statements of profit / (loss) | (116) | — | — | — | ||||||||||||||||||||||||||||
|
|
|
|
|
|
|
| |||||||||||||||||||||||||
| Total other comprehensive income for the year, net of income tax | 44,076 | 7,556 | 3,467 | 52.3 | 7,556 | 3,467 | (3,233) | (49.9) | ||||||||||||||||||||||||
|
|
|
|
|
|
|
| |||||||||||||||||||||||||
| Total Comprehensive Income / (loss) for the year | 106,302 | (195,583) | (177,881) | (2,685.0) | (195,583) | (177,881) | 95,312 | 1,469.7 | ||||||||||||||||||||||||
|
|
|
|
|
|
|
| |||||||||||||||||||||||||
| Total Comprehensive Income / (loss) attributable to: | ||||||||||||||||||||||||||||||||
| Equity holders of the parent | 27,582 | (131,122) | (132,708) | (2,003.1) | (131,122) | (132,708) | 54,292 | 837.2 | ||||||||||||||||||||||||
| Non-controlling interests | 78,720 | (64,461) | (45,173) | (681.9) | (64,461) | (45,173) | 41,020 | 632.5 | ||||||||||||||||||||||||
|
|
|
|
|
|
|
| |||||||||||||||||||||||||
| 106,302 | (195,583) | (177,881) | (2,685.0) | (195,583) | (177,881) | 95,312 | 1,469.7 | |||||||||||||||||||||||||
|
|
|
|
|
|
|
| |||||||||||||||||||||||||
| * | Refer to Note 7 for tax related to each component of other comprehensive income / (loss) |
| # | Refer to Note 32(a) for amounts reclassified into consolidated statements of profit / (loss) for the year out of other comprehensive income / (loss) |
The accompanying notes are an integral part of these consolidated financial statements.
VEDANTA LIMITED AND SUBSIDIARIES
CONSOLIDATED STATEMENTS OF FINANCIAL POSITION
(In millions except share or per share amounts unless otherwise stated)
| As at | March 31, 2015 | March 31, 2016 | March 31, 2016 | March 31, 2016 | March 31, 2017 | March 31, 2017 | ||||||||||||||||||||||||||
| Notes | (Rs. in million) | (Rs. in million) | (US dollars in million) (Note 2) | Notes | (Rs. in million) | (Rs. in million) | (US dollars in million) (Note 2) | |||||||||||||||||||||||||
ASSETS | ||||||||||||||||||||||||||||||||
Non-current assets | ||||||||||||||||||||||||||||||||
Property, plant and equipment | 8a | 992,677 | 874,575 | 13,201.1 | 8a | 874,575 | 877,127 | 13,525.5 | ||||||||||||||||||||||||
Exploration and evaluation assets | 8b | 341,831 | 105,899 | 1,598.5 | 8b | 105,899 | 98,852 | 1,524.3 | ||||||||||||||||||||||||
Other intangible assets | 8c | 6,593 | 6,301 | 95.1 | 8c | 6,301 | 6,378 | 98.3 | ||||||||||||||||||||||||
Leasehold land prepayments | 3,767 | 3,545 | 53.5 | |||||||||||||||||||||||||||||
Leasehold land | 3,545 | 3,594 | 55.4 | |||||||||||||||||||||||||||||
Deferred tax assets | 7 | 76,487 | 82,481 | 1,245.0 | 7 | 82,481 | 77,582 | 1,196.3 | ||||||||||||||||||||||||
Financial assets investments | 10 | 262 | 432 | 6.5 | 10 | 432 | 695 | 10.7 | ||||||||||||||||||||||||
Derivative financial assets | 23 | 12 | 53 | 0.8 | 23 | 53 | 38 | 0.6 | ||||||||||||||||||||||||
Current tax asset- non-current | 26,562 | 23,996 | 362.2 | |||||||||||||||||||||||||||||
Current tax asset | 23,996 | 28,176 | 434.5 | |||||||||||||||||||||||||||||
Other non-current assets | 11 | 11,563 | 16,992 | 256.5 | 11 | 16,992 | 35,016 | 540.0 | ||||||||||||||||||||||||
|
|
|
|
|
| |||||||||||||||||||||||||||
Total non-current assets | 1,459,754 | 1,114,274 | 16,819.2 | 1,114,274 | 1,127,458 | 17,385.6 | ||||||||||||||||||||||||||
|
|
|
|
|
| |||||||||||||||||||||||||||
Current assets | ||||||||||||||||||||||||||||||||
Inventories | 12 | 87,715 | 81,261 | 1,226.6 | 12 | 81,261 | 97,266 | 1,499.9 | ||||||||||||||||||||||||
Current tax asset | 230 | 2,768 | 41.8 | 2,768 | 136 | 2.1 | ||||||||||||||||||||||||||
Trade and other receivables | 13 | 103,777 | 79,295 | 1,196.9 | 13 | 79,295 | 60,276 | 929.5 | ||||||||||||||||||||||||
Short-term investments | 14 | 496,482 | 566,192 | 8,546.3 | 14 | 566,192 | 524,685 | 8,090.7 | ||||||||||||||||||||||||
Derivative financial assets | 23 | 1,035 | 1,228 | 18.5 | 23 | 1,228 | 91 | 1.4 | ||||||||||||||||||||||||
Restricted cash and cash equivalents | 15 | 4,090 | 3,367 | 50.8 | 15 | 3,367 | 11,747 | 181.1 | ||||||||||||||||||||||||
Cash and cash equivalents | 16 | 8,621 | 20,870 | 315.0 | 16 | 20,870 | 97,202 | 1,498.9 | ||||||||||||||||||||||||
|
|
|
|
|
| |||||||||||||||||||||||||||
Total current assets | 701,950 | 754,981 | 11,395.9 | 754,981 | 791,403 | 12,203.6 | ||||||||||||||||||||||||||
|
|
|
|
|
| |||||||||||||||||||||||||||
Total assets | 2,161,704 | 1,869,255 | 28,215.1 | 1,869,255 | 1,918,861 | 29,589.2 | ||||||||||||||||||||||||||
|
|
|
|
|
| |||||||||||||||||||||||||||
LIABILITIES | ||||||||||||||||||||||||||||||||
Current liabilities | �� | |||||||||||||||||||||||||||||||
Short-term borrowings | 17 | 161,233 | 182,328 | 2,752.1 | 17 | 182,328 | 413,126 | 6,370.5 | ||||||||||||||||||||||||
Acceptances | 18 | 94,660 | 99,500 | 1,501.9 | 18 | 99,500 | 113,304 | 1,747.2 | ||||||||||||||||||||||||
Trade and other payables | 19 | 165,993 | 252,706 | 3,814.4 | 19 | 252,706 | 285,794 | 4,406.9 | ||||||||||||||||||||||||
Derivative financial liabilities | 23 | 2,574 | 4,474 | 67.5 | 23 | 4,474 | 8,216 | 126.7 | ||||||||||||||||||||||||
Retirement benefits | 22 | 349 | 340 | 5.1 | 22 | 340 | 503 | 7.8 | ||||||||||||||||||||||||
Provisions | 20 | 4,870 | 1,693 | 25.6 | 20 | 1,693 | 1,131 | 17.4 | ||||||||||||||||||||||||
Current tax liabilities | 3,842 | 703 | 10.6 | 703 | 2,028 | 31.3 | ||||||||||||||||||||||||||
|
|
|
|
|
| |||||||||||||||||||||||||||
Total current liabilities | 433,521 | 541,744 | 8,177.2 | 541,744 | 824,102 | 12,707.8 | ||||||||||||||||||||||||||
|
|
|
|
|
| |||||||||||||||||||||||||||
Net current assets | 268,429 | 213,237 | 3,218.7 | |||||||||||||||||||||||||||||
Net current assets / (liabilities) | 213,237 | (32,699) | (504.2) | |||||||||||||||||||||||||||||
|
|
|
|
|
| |||||||||||||||||||||||||||
Non-current liabilities | ||||||||||||||||||||||||||||||||
Long-term borrowings | 17 | 517,852 | 493,784 | 7,453.3 | 17 | 493,784 | 332,654 | 5,129.6 | ||||||||||||||||||||||||
Deferred tax liabilities | 7 | 155,812 | 30,212 | 456.0 | 7 | 30,212 | 24,015 | 370.3 | ||||||||||||||||||||||||
Retirement benefits | 22 | 2,159 | 1,584 | 23.9 | 22 | 1,584 | 1,390 | 21.4 | ||||||||||||||||||||||||
Provisions | 20 | 11,166 | 10,732 | 162.0 | 20 | 10,732 | 19,233 | 296.6 | ||||||||||||||||||||||||
Derivative financial liabilities | 23 | 9 | 78 | 1.2 | 23 | 78 | 557 | 8.6 | ||||||||||||||||||||||||
Other non-current liabilities | 21 | 12,577 | 14,863 | 224.4 | 21 | 14,863 | 3,122 | 48.1 | ||||||||||||||||||||||||
|
|
|
|
|
| |||||||||||||||||||||||||||
Total non-current liabilities | 699,575 | 551,253 | 8,320.8 | 551,253 | 380,971 | 5,874.6 | ||||||||||||||||||||||||||
|
|
|
|
|
| |||||||||||||||||||||||||||
Total liabilities | 1,133,096 | 1,092,997 | 16,498.0 | 1,092,997 | 1,205,073 | 18,582.4 | ||||||||||||||||||||||||||
|
|
|
|
|
| |||||||||||||||||||||||||||
Net assets | 1,028,608 | 776,258 | 11,717.1 | 776,258 | 713,788 | 11,006.8 | ||||||||||||||||||||||||||
|
|
|
|
|
| |||||||||||||||||||||||||||
EQUITY | ||||||||||||||||||||||||||||||||
Share capital | 25 | 2,965 | 2,965 | 44.8 | 25 | 2,965 | 3,718 | 57.3 | ||||||||||||||||||||||||
Securities premium | 200,010 | 200,010 | 3,019.0 | 200,010 | 190,452 | 2,936.8 | ||||||||||||||||||||||||||
Treasury shares | — | (1,034) | (15.9) | |||||||||||||||||||||||||||||
Share based payment reserve | — | 1,548 | 23.9 | |||||||||||||||||||||||||||||
Other components of equity | 20,693 | 13,203 | 199.3 | 13,203 | 12,464 | 192.2 | ||||||||||||||||||||||||||
Retained earnings | 337,451 | 194,982 | 2,943.1 | 194,982 | 369,390 | 5,696.1 | ||||||||||||||||||||||||||
|
|
|
|
|
| |||||||||||||||||||||||||||
Equity attributable to equity holders of the parent | 561,119 | 411,160 | 6,206.2 | 411,160 | 576,538 | 8,890.4 | ||||||||||||||||||||||||||
Non-controlling interests | 467,489 | 365,098 | 5,510.9 | 365,098 | 137,250 | 2,116.4 | ||||||||||||||||||||||||||
|
|
|
|
|
| |||||||||||||||||||||||||||
Total Equity | 1,028,608 | 776,258 | 11,717.1 | 776,258 | 713,788 | 11,006.8 | ||||||||||||||||||||||||||
|
|
| ||||||||||||||||||||||||||||||
The accompanying notes are an integral part of these consolidated financial statements.
VEDANTA LIMITED AND SUBSIDIARIES
CONSOLIDATED STATEMENTS OF CASH FLOWS
(In millions except share or per share amounts unless otherwise stated)
| For the year ended March 31, | 2014 | 2015 | 2016 | 2016 | 2015 | 2016 | 2017 | 2017 | ||||||||||||||||||||||||
| (Rs. in million) | (Rs. in million) | (Rs. in million) | (US dollars in million) (Note 2) | (Rs. in million) | (Rs. in million) | (Rs. in million) | (US dollars in million) (Note 2) | |||||||||||||||||||||||||
Cash flows from operating activities | ||||||||||||||||||||||||||||||||
Profit / (loss) for the year | 62,226 | (203,139) | (181,348) | (2,737.3) | (203,139) | (181,348) | 98,545 | 1,519.6 | ||||||||||||||||||||||||
| Adjustments to reconcile profit to net cash provided by operating activities: | ||||||||||||||||||||||||||||||||
Income tax (benefit) / expense recognised in profit or loss | 34,646 | (108,320) | (103,060) | (1,555.7) | (108,320) | (103,060) | 38,027 | 586.4 | ||||||||||||||||||||||||
Depreciation and amortization | 121,887 | 111,091 | 83,343 | 1,258.0 | 111,091 | 83,343 | 61,477 | 948.0 | ||||||||||||||||||||||||
| Impairment of property, plant and equipment and exploration and evaluation assets | 3,541 | 406,438 | 339,549 | 5,125.3 | 406,438 | 339,549 | 1,162 | 17.9 | ||||||||||||||||||||||||
Provision for doubtful debts/advances | 2,494 | 3,222 | 2,368 | 35.8 | 3,222 | 2,368 | 345 | 5.3 | ||||||||||||||||||||||||
Unsuccessful exploration costs written off | 653 | 7,867 | 294 | 4.4 | 7,867 | 294 | 407 | 6.3 | ||||||||||||||||||||||||
Fair value gain on financial assets held for trading | (24,647) | (37,406) | (31,244) | (471.4) | (37,406) | (31,244) | (32,630) | (503.2) | ||||||||||||||||||||||||
Gain on sale of financial asset investments | (116) | — | — | — | ||||||||||||||||||||||||||||
Share based payment expense | — | — | 66 | 1.0 | ||||||||||||||||||||||||||||
Loss on sale of property, plant and equipment, net | 327 | 153 | 63 | 1.0 | 153 | 63 | 451 | 7.0 | ||||||||||||||||||||||||
Exchange loss, net | 19,512 | 3,785 | 6,124 | 92.4 | 3,785 | 6,124 | 2,371 | 36.5 | ||||||||||||||||||||||||
Gain on fair valuation of conversion option | (61) | — | — | — | ||||||||||||||||||||||||||||
Inventory Written off | — | 2,226 | — | — | 2,226 | — | 120 | 1.9 | ||||||||||||||||||||||||
Interest and dividend income | (17,402) | (12,998) | (12,754) | (192.5) | (12,998) | (12,754) | (12,982) | (200.1) | ||||||||||||||||||||||||
Interest expense | 60,462 | 58,054 | 55,915 | 844.0 | 58,054 | 55,915 | 59,413 | 916.1 | ||||||||||||||||||||||||
Changes in assets and liabilities: | ||||||||||||||||||||||||||||||||
(Increase) / decrease in trade and other receivables | (8,841) | (2,143) | 22,910 | 345.7 | (2,143) | 22,910 | 18,176 | 280.3 | ||||||||||||||||||||||||
Decrease/ (Increase) in inventories | 3,402 | (1,746) | 6,476 | 97.8 | (1,746) | 6,476 | (16,161) | (249.2) | ||||||||||||||||||||||||
Decrease / (Increase) in other current and non-current assets | 9,710 | 5,418 | (1,645) | (24.8) | 5,418 | (1,645) | (14,181) | (218.7) | ||||||||||||||||||||||||
(Decrease)/increase in trade and other payable | (2,694) | 7,653 | 40,072 | 604.9 | 7,653 | 40,072 | 23,384 | 360.3 | ||||||||||||||||||||||||
(Decrease) in other current and non-current liabilities | (8,655) | (5,408) | (2,168) | (32.7) | (5,408) | (2,168) | (8,854) | (136.5) | ||||||||||||||||||||||||
Proceeds from short-term investments | 1,174,250 | 1,145,596 | 1,019,940 | 15,395.1 | 1,145,596 | 1,019,940 | 1,032,613 | 15,923.1 | ||||||||||||||||||||||||
Purchases of short-term investments | (1,294,912) | (1,150,465) | (1,070,637) | (16,160.6) | (1,150,465) | (1,070,637) | (935,851) | (14,431.0) | ||||||||||||||||||||||||
|
|
|
|
|
|
|
| |||||||||||||||||||||||||
Cash generated from operations | 135,782 | 229,878 | 174,198 | 2,629.4 | 229,878 | 174,198 | 315,898 | 4,871.0 | ||||||||||||||||||||||||
Interest paid | (49,625) | (84,816) | (55,372) | (835.8) | (84,816) | (55,372) | (62,048) | (956.8) | ||||||||||||||||||||||||
Interest received | 16,678 | 18,453 | 13,061 | 197.1 | 18,453 | 13,061 | 11,315 | 174.5 | ||||||||||||||||||||||||
Dividends received | 67 | 1 | 4 | 0.1 | 1 | 4 | 7 | 0.1 | ||||||||||||||||||||||||
Income tax paid | (46,703) | (37,806) | (24,539) | (370.4) | (37,806) | (24,539) | (53,067) | (818.3) | ||||||||||||||||||||||||
|
|
|
|
|
|
|
| |||||||||||||||||||||||||
Net cash from operating activities | 56,199 | 125,710 | 107,352 | 1,620.4 | 125,710 | 107,352 | 212,105 | 3,270.5 | ||||||||||||||||||||||||
|
|
|
|
|
|
|
| |||||||||||||||||||||||||
Cash flows from investing activities | ||||||||||||||||||||||||||||||||
Purchases of property, plant and equipment and intangible assets | (80,053) | (82,304) | (54,642) | (824.8) | (82,304) | (54,642) | (52,517) | (809.8) | ||||||||||||||||||||||||
Proceeds from sale of property, plant and equipment | 3,864 | 392 | 629 | 9.5 | 392 | 629 | 1,012 | 15.6 | ||||||||||||||||||||||||
Exploration and evaluation assets | (15,256) | (21,438) | (5,831) | (88.0) | (21,438) | (5,831) | (1,234) | (19.0) | ||||||||||||||||||||||||
Loans repaid by related parties | 1,512 | 14 | 25 | 0.4 | 14 | 25 | — | — | ||||||||||||||||||||||||
Loans to related parties | (4,985) | (1) | (656) | (9.9) | (1) | (656) | 0 | 0.0 | ||||||||||||||||||||||||
Proceeds from short-term deposits | 696,833 | 155,515 | 48,844 | 737.3 | 155,515 | 48,844 | 11,231 | 173.2 | ||||||||||||||||||||||||
Purchases of short-term deposits | (653,889) | (94,490) | (31,705) | (478.6) | (94,490) | (31,705) | (36,349) | (560.5) | ||||||||||||||||||||||||
Proceed from sale of available for sale financial assets | 1,100 | — | — | — | ||||||||||||||||||||||||||||
Acquisition of additional interests in subsidiaries | — | — | (40) | (0.6) | ||||||||||||||||||||||||||||
Net changes in restricted cash and cash equivalents | (1,757) | (1,627) | 723 | 10.9 | (1,627) | 723 | (2,013) | (31.0) | ||||||||||||||||||||||||
|
|
|
|
|
|
|
| |||||||||||||||||||||||||
Net cash used in investing activities | (52,631) | (43,939) | (42,613) | (643.2) | (43,939) | (42,613) | (79,910) | (1,232.1) | ||||||||||||||||||||||||
|
|
|
|
|
|
|
| |||||||||||||||||||||||||
Cash flows from financing activities | ||||||||||||||||||||||||||||||||
(Repayment of) / proceeds from working capital loan, net | (8,275) | 1,641 | 2,130 | 32.2 | 1,641 | 2,130 | 6,123 | 94.4 | ||||||||||||||||||||||||
Proceeds from acceptances | 207,344 | 174,029 | 162,739 | 2,456.4 | 174,029 | 162,739 | 175,698 | 2,709.3 | ||||||||||||||||||||||||
Repayment of acceptances | (197,000) | (171,118) | (160,982) | (2,429.9) | (171,118) | (160,982) | (163,134) | (2,515.6) | ||||||||||||||||||||||||
Proceeds from other short-term borrowings | 266,446 | 459,659 | 415,541 | 6,272.3 | 459,659 | 415,541 | 720,647 | 11,112.5 | ||||||||||||||||||||||||
Repayment of other short-term borrowings | (513,716) | (468,658) | (582,196) | (8,977.6) | ||||||||||||||||||||||||||||
Proceeds from long-term borrowings | 180,428 | 115,657 | 88,466 | 1,364.2 | ||||||||||||||||||||||||||||
Repayment of long-term borrowings | (99,486) | (39,595) | (71,743) | (1,106.3) | ||||||||||||||||||||||||||||
| For the year ended March 31, | 2014 | 2015 | 2016 | 2016 | 2015 | 2016 | 2017 | 2017 | ||||||||||||||||||||||||
| (Rs. in million) | (Rs. in million) | (Rs. in million) | (US dollars in million) (Note 2) | (Rs. in million) | (Rs. in million) | (Rs. in million) | (US dollars in million) (Note 2) | |||||||||||||||||||||||||
| Repayment of other short-term borrowings | (332,337) | (513,716) | (468,658) | (7,074.1) | ||||||||||||||||||||||||||||
| Proceeds from long-term borrowings | 153,323 | 180,428 | 115,657 | 1,745.8 | ||||||||||||||||||||||||||||
| Repayment of long-term borrowings | (152,264) | (99,486) | (39,595) | (597.7) | ||||||||||||||||||||||||||||
| Loan from related parties | 90,087 | 730 | 3,856 | 58.2 | 730 | 3,856 | 2,846 | 43.9 | ||||||||||||||||||||||||
| Loan repaid to related parties | (5,628) | (80,463) | (51,182) | (772.6) | (80,463) | (51,182) | (128,094) | (1,975.2) | ||||||||||||||||||||||||
| Payment of dividends to equity holders of the parent, including dividend distribution tax | (8,785) | (10,378) | (17,358) | (262.0) | (10,378) | (17,358) | (5,189) | (80.0) | ||||||||||||||||||||||||
| Payment of dividends to non-controlling interests, including dividend distribution tax | (18,271) | (16,703) | (14,862) | (224.3) | (16,703) | (14,862) | (91,537) | (1,411.5) | ||||||||||||||||||||||||
| Proceeds from issue of shares at a subsidiary | 145 | 147 | — | — | 147 | — | — | — | ||||||||||||||||||||||||
Purchase of Treasury Shares | — | — | (1,034) | (15.9) | ||||||||||||||||||||||||||||
Proceeds from erstwhile Cairn Stock Options | — | — | 24 | 0.4 | ||||||||||||||||||||||||||||
| Payment for buyback of shares at subsidiary (including buyback expenses) | (1,065) | (11,218) | — | — | (11,218) | — | — | — | ||||||||||||||||||||||||
|
|
|
|
|
|
|
| |||||||||||||||||||||||||
| Net cash used in financing activities | (6,280) | (86,448) | (52,714) | (795.7) | (86,448) | (52,714) | (49,123) | (757.4) | ||||||||||||||||||||||||
|
|
|
|
|
|
|
| |||||||||||||||||||||||||
| Effect of exchange rate changes on cash and cash equivalents | 473 | 338 | 224 | 3.4 | 338 | 224 | (299) | (4.6) | ||||||||||||||||||||||||
| Net (decrease) / increase in cash and cash equivalents | (2,239) | (4,339) | 12,249 | 184.9 | (4,339) | 12,249 | 82,773 | 1,276.4 | ||||||||||||||||||||||||
| Cash and cash equivalents at the beginning of the year | 15,199 | 12,960 | 8,621 | 130.1 | 12,960 | 8,621 | 20,870 | 321.8 | ||||||||||||||||||||||||
| Cash and cash equivalents at the end of the year1 | 12,960 | 8,621 | 20,870 | 315.0 | 8,621 | 20,870 | 103,643 | 1,598.2 | ||||||||||||||||||||||||
| Supplementary disclosure of non-cash investing activities: | ||||||||||||||||||||||||||||||||
|
|
|
|
|
|
|
| |||||||||||||||||||||||||
| Payables for purchase of property, plant and equipment including exploration and evaluation assets | 88,678 | 86,009 | 66,711 | 1,007.0 | 86,009 | 66,711 | 40,535 | 625.1 | ||||||||||||||||||||||||
|
|
|
|
|
|
|
| |||||||||||||||||||||||||
The accompanying notes are an integral part of these consolidated financial statements.
| 1. | For composition refer Note |
VEDANTA LIMITED AND SUBSIDIARIES
CONSOLIDATED STATEMENTS OF CHANGES IN EQUITY
(In millions except share or per share amounts unless otherwise stated)
| Attributable to equity holders of the parent | ||||||||||||||||||||||||||||||||||||
| Share capital | Securities premium | Translation of foreign operations | Available for sale financial investments | Cash flow hedges | Retained earnings | Total | Non- controlling interests | Total | ||||||||||||||||||||||||||||
Balance as at April 1, 2013 | 2,965 | 200,010 | 10,426 | 124 | 428 | 466,656 | 680,609 | 502,660 | 1,183,269 | |||||||||||||||||||||||||||
Profit for the year | — | — | — | — | — | 15,466 | 15,466 | 46,760 | 62,226 | |||||||||||||||||||||||||||
| Exchange differences on translation of foreign operations | — | — | 12,101 | — | — | — | 12,101 | 32,149 | 44,250 | |||||||||||||||||||||||||||
| Movement in available for sale financial investments | — | — | — | (1) | — | — | (1) | — | (1) | |||||||||||||||||||||||||||
| Reclassified to consolidated statement of profit or loss | — | — | — | (75) | — | — | (75) | (41) | (116) | |||||||||||||||||||||||||||
| Re-measurement of defined benefit obligation, net of tax* | — | — | — | — | — | (70) | (70) | (28) | (98) | |||||||||||||||||||||||||||
| Net movement in fair value of cash flow hedges, net of tax*# | — | — | — | — | 161 | — | 161 | (120) | 41 | |||||||||||||||||||||||||||
|
|
|
|
|
|
|
|
|
|
|
|
|
|
|
|
|
| |||||||||||||||||||
| Total comprehensive income / (loss) for the year | — | — | 12,101 | (76) | 161 | 15,396 | 27,582 | 78,720 | 106,302 | |||||||||||||||||||||||||||
|
|
|
|
|
|
|
|
|
|
|
|
|
|
|
|
|
| |||||||||||||||||||
| Change in Non-controlling interests | — | — | — | — | — | 164 | 164 | (336) | (172) | |||||||||||||||||||||||||||
| Dividend paid including tax on dividend | — | — | — | — | — | (8,785) | (8,785) | (18,271) | (27,056) | |||||||||||||||||||||||||||
|
|
|
|
|
|
|
|
|
|
|
|
|
|
|
|
|
| |||||||||||||||||||
Balance as at March 31, 2014 | 2,965 | 200,010 | 22,527 | 48 | 589 | 473,431 | 699,570 | 562,773 | 1,262,343 | |||||||||||||||||||||||||||
|
|
|
|
|
|
|
|
|
|
|
|
|
|
|
|
|
| |||||||||||||||||||
| Attributable to equity holders of the parent | ||||||||||||||||||||||||||||||||||||
| Share capital | Securities premium | Translation of foreign operations | Available for sale financial investments | Cash flow hedges | Retained earnings | Total | Non controlling interests | Total | ||||||||||||||||||||||||||||
Balance as at April 1, 2014 | 2,965 | 200,010 | 22,527 | 48 | 589 | 473,431 | 699,570 | 562,773 | 1,262,343 | |||||||||||||||||||||||||||
| Loss for the year | — | — | — | — | — | (128,350) | (128,350) | (74,789) | (203,139) | |||||||||||||||||||||||||||
| Exchange differences on translation of foreign operations | — | — | (1,844) | — | — | — | (1,844) | 10,464 | 8,620 | |||||||||||||||||||||||||||
| Movement in available for sale financial investments | — | — | — | 151 | — | — | 151 | — | 151 | |||||||||||||||||||||||||||
| Re-measurement of defined benefit obligation, net of tax | — | — | — | — | — | (301) | (301) | (156) | (457) | |||||||||||||||||||||||||||
| Net movement in fair value of cash flow hedges, net of tax | — | — | — | — | (778) | — | (778) | 20 | (758) | |||||||||||||||||||||||||||
|
|
|
|
|
|
|
|
|
|
|
|
|
|
|
|
|
| |||||||||||||||||||
| Total comprehensive income / (loss) for the year | — | — | (1,844) | 151 | (778) | (128,651) | (131,122) | (64,461) | (195,583) | |||||||||||||||||||||||||||
|
|
|
|
|
|
|
|
|
|
|
|
|
|
|
|
|
| |||||||||||||||||||
| Change in Non controlling interests | — | — | — | — | — | 3,049 | 3,049 | (14,120) | (11,071) | |||||||||||||||||||||||||||
| Dividend including tax on dividend | — | — | — | — | — | (10,378) | (10,378) | (16,703) | (27,081) | |||||||||||||||||||||||||||
|
|
|
|
|
|
|
|
|
|
|
|
|
|
|
|
|
| |||||||||||||||||||
| Balance as at March 31, 2015 | 2,965 | 200,010 | 20,683 | 199 | (189) | 337,451 | 561,119 | 467,489 | 1,028,608 | |||||||||||||||||||||||||||
|
|
|
|
|
|
|
|
|
|
|
|
|
|
|
|
|
| |||||||||||||||||||
| Attributable to equity holders of the parent | ||||||||||||||||||||||||||||||||||||
| Share capital | Securities premium | Translation of foreign operations | Available for sale financial investments | Cash flow hedges | Retained earnings | Total | Non controlling interests | Total | ||||||||||||||||||||||||||||
Balance as at April 1, 2015 | 2,965 | 200,010 | 20,683 | 199 | (189) | 337,451 | 561,119 | 467,489 | 1,028,608 | |||||||||||||||||||||||||||
| Loss for the year | — | — | — | — | — | (125,153) | (125,153) | (56,195) | (181,348) | |||||||||||||||||||||||||||
| Exchange differences on translation of foreign operations | — | — | (7,813) | — | — | — | (7,813) | 11,040 | 3,227 | |||||||||||||||||||||||||||
| Movement in available for sale financial investments | — | — | — | 170 | — | — | 170 | — | 170 | |||||||||||||||||||||||||||
| Re-measurement of defined benefit obligation, net of tax | — | — | — | — | — | (65) | (65) | (28) | (93) | |||||||||||||||||||||||||||
| Net movement in fair value of cash flow hedges, net of tax | — | — | — | — | 153 | — | 153 | 10 | 163 | |||||||||||||||||||||||||||
|
|
|
|
|
|
|
|
|
|
|
|
|
|
|
|
|
| |||||||||||||||||||
| Total comprehensive income / (loss) for the year | — | — | (7,813) | 170 | 153 | (125,218) | (132,708) | (45,173) | (177,881) | |||||||||||||||||||||||||||
|
|
|
|
|
|
|
|
|
|
|
|
|
|
|
|
|
| |||||||||||||||||||
| Change in Non controlling interests | — | — | — | — | — | — | — | 356 | 356 | |||||||||||||||||||||||||||
| Dividend including tax on dividend | — | — | — | — | — | (17,358) | (17,358) | (57,676) | (75,034) | |||||||||||||||||||||||||||
| Others | — | 107 | 107 | 102 | 209 | |||||||||||||||||||||||||||||||
|
|
|
|
|
|
|
|
|
|
|
|
|
|
|
|
|
| |||||||||||||||||||
| Balance as at March 31, 2016 | 2,965 | 200,010 | 12,870 | 369 | (36) | 194,982 | 411,160 | 365,098 | 776,258 | |||||||||||||||||||||||||||
|
|
|
|
|
|
|
|
|
|
|
|
|
|
|
|
|
| |||||||||||||||||||
Attributable to equity holders of the parent Share
capital Securities
premium Translation of
foreign
operations Available for
sale financial
investments Cash
flow
hedges Retained earnings Total Non
controlling
interests Total Balance as at April 1, 2014 2,965 200,010 22,527 48 589 473,431 699,570 562,773 1,262,343 Loss for the year — — — — — (128,350) (128,350) (74,789) (203,139) Exchange differences on translation of foreign operations — — (1,844) — — — (1,844) 10,464 8,620 Movement in available for sale financial investments — — — 151 — — 151 — 151 Re-measurement of defined benefit obligation, net of tax* — — — — — (301) (301) (156) (457) Net movement in fair value of cash flow hedges, net of tax *# — — — — (778) — (778) 20 (758) Total comprehensive income / (loss) for the year — — (1,844) 151 (778) (128,651) (131,122) (64,461) (195,583) Change in Non controlling interests — — — — — 3,049 3,049 (14,120) (11,071) Dividend paid including tax on dividend — — — — — (10,378) (10,378) (16,703) (27,081) Balance as at March 31, 2015 2,965 200,010 20,683 199 (189) 337,451 561,119 467,489 1,028,608
Balance as at April 1, 2015 Loss for the year Attributable to equity holders of the parent Share
capital Securities
premium Translation of
foreign
operations Available
for sale
financial
investments Cash
flow
hedges Retained
earnings Total Non controlling
interests Total 2,965 200,010 20,683 199 (189) 337,451 561,119 467,489 1,028,608 — — — — — (125,153) (125,153) (56,195) (181,348) Exchange differences on translation of foreign operations — — (7,813) — — — (7,813) 11,040 3,227 Movement in available for sale financial investments — — — 170 — — 170 — 170 Re-measurement of defined benefit obligation, net of tax* — — — — — (65) (65) (28) (93) Net movement in fair value of cash flow hedges, net of tax *# — — — — 153 — 153 10 163 Total comprehensive income / (loss) for the year — — (7,813) 170 153 (125,218) (132,708) (45,173) (177,881) Change in Non controlling interests — — — — — — — 356 356 Dividend paid including tax on dividend — — — — — (17,358) (17,358) (57,676) (75,034) Others — 107 107 102 209 Balance as at March 31, 2016 2,965 200,010 12,870 369 (36) 194,982 411,160 365,098 776,258 Balance as at March 31, 2016 (in US dollars in million) 44.8 3,019.0 194.3 5.5 (0.5) 2,943.1 6,206.2 5,510.9 11,717.1 Attributable to equity holders of the parent Share
capital Securities
premium Treasury
shares# Share
based
payment
reserve Translation of
foreign
operations Available for
sale financial
investments Cash
flow
hedges Retained
earnings* Total Non
controlling
interests Total Balance as at April 1, 2016 2,965 200,010 — — 12,870 369 (36) 194,982 411,160 365,098 776,258 Profit for the year — — — — — — — 55,033 55,033 43,512 98,545 Exchange differences on translation of foreign operations, net of tax1 — — — — (1,081) — — — (1,081) (2,385) (3,466) Movement in available for sale financial investments — — — — — 263 — — 263 — 263 Re-measurement of defined benefit obligation, net of tax1 — — — — — — — (2) (2) (12) (14) Net movement in fair value of cash flow hedges, net of tax1,2 — — — — — — 79 — 79 (95) (16) Total comprehensive income / (loss) for the year — — — — (1,081) 263 79 55,031 54,292 41,020 95,312 Transferred to capital reserve pursuant to merger (Refer note 1) — (9,558) — — — — — 9,558 — — — Purchase of treasury shares — — (1,034) — — — — — (1,034) — (1,034) Recognition of share based payment — — — 66 — — — — 66 — 66 Purchase ofnon-controlling interests—Cairn India Limited — — — — — — — (15) (15) (188) (203) Dividend including tax on dividend — — — — — — — (70,918) (70,918) (55,165) (126,083) Change in Non controlling interests (Refer note 1) 753 — — 1,482 — — — 180,752 182,987 (213,515) (30,528) Balance as at March 31, 2017 3,718 190,452 (1,034) 1,548 11,789 632 43 369,390 576,538 137,250 713,788 Balance as at March 31, 2017 (in US dollars in million) 57.3 2,936.8 (15.9) 23.9 181.8 9.7 0.7 5,696.1 8,890.4 2,116.4 11,006.8
| * | Retained earnings mainly includes general reserve, debenture redemption reserve, preference share redemption reserve and capital reserve (Refer Note 25) |
| # | Treasury share represents 3,984,256 equity shares (face value of Re 1 each) of the Company purchased by Vedanta Limited ESOP Trust pursuant to the Company’s stock option scheme as detailed in note 26. |
| 1 | Refer to Note 7 for tax related to each component of other comprehensive income / (loss) |
| Refer to Note 32(a) for amounts reclassified into consolidated statements of profit / |
VEDANTA LIMITED AND SUBSIDIARIES
NOTES TO THE CONSOLIDATED FINANCIAL STATEMENTS
1. Group overview -
Vedanta Limited (“the Company”) and its consolidated subsidiaries (collectively, the “Group” or “Vedanta Limited”) are principally engaged in business of iron ore mining,non-ferrous metals and mining (copper, aluminium and zinc), commercial power generation, port operations and exploration & production of oil & gas in India, Australia, Namibia, South Africa, Liberia, UAE and Ireland. Vedanta Limited are also in the business of commercial power generation and port operations in India. Vedanta Limited was incorporated on September 8, 1975 under the laws of the Republic of India and had its registered office at Tuticorin, Tamilnadu. The registered office of the Company has been changed to 1st Floor, ‘C’ wing, Unit 103, Corporate Avenue, Atul Projects, Chakala, Andheri (East), Mumbai-400092, Maharashtra. Vedanta Limited’s shares are listed on National Stock Exchange and Bombay Stock Exchange in India. In June 2007, Vedanta Limited completed its initial public offering of American Depositary Shares, or ADS, each representing four equity shares, and listed its ADSs on the New York Stock Exchange. In July 2009, Vedanta Limited completed itsfollow-on offering of an additional 131,906,011 ADSs, each currently representing four equity shares, which are listed on the New York Stock Exchange.
Consolidation and Re-organisation of Sesa Goa Limited (“Sesa Goa”), Sterlite Industries (India) Limited (SIIL), Vedanta Aluminium Limited (“Vedanta Aluminium”), Sterlite Energy Limited (“Sterlite Energy”) and The Madras Aluminium Company Limited (“MALCO”) to form Sesa Sterlite Limited (‘SSL’ or ‘the Company’), and transfer of Vedanta’s shareholding in Cairn India Limited to SSL.
On February 25, 2012, Vedanta Resources Plc (“Vedanta”), the ultimate parent company of SIIL, Sesa Goa, Vedanta Aluminium, Sterlite Energy, and MALCO announced an all-share merger of Vedanta’s majority owned subsidiaries Sesa Goa and Sterlite to create merged entity SSL and a consolidation of various subsidiaries held within Vedanta to effect the consolidation and simplification of Vedanta’s corporate structure through two series of transactions (together the “Re-organisation Transactions” consisting of the “Amalgamation and Re-organisation Scheme” and the “Cairn India Limited Consolidation”). The Re-organisation Transactions were executed during the year ended March 31, 2014 and the name of the merged entity was changed to Sesa Sterlite Limited with effect from September 18, 2013.
In August 2013, Sesa Goa had furnished to the Securities and Exchange Commission (“SEC”) a notice as required by Rule 12g-3(f) under the Securities Exchange Act of 1934, as amended (“Exchange Act”), which stated that Sesa Goa is the successor issuer to Sterlite under the Exchange Act and that the equity shares of Sesa Goa with a par value of Re. 1 each (“Sesa Goa Shares”) will be traded in the United States in the form of American Depositary Shares (“ADSs”), each ADSs representing four Sesa Goa Shares (the “Sesa Goa ADSs”) and such ADSs are deemed to be registered under Section 12(b) of the Exchange Act by operation of Rule 12g-3(a) under the Exchange Act.
The Amalgamation and Re-organisation Scheme
The Amalgamation and Re-organisation Scheme has been sanctioned by the Honorable High Court of Madras vide its order dated July 25, 2013 and the High Court of Judicature of Bombay at Goa vide its order dated April 3, 2013. The Amalgamation and Re-organisation Scheme was made effective in the month of August 2013.
In accordance with the Amalgamation and Re-organisation Scheme
The name of the merged entity was changed to Sesa Sterlite Limited with effect from September 18, 2013. SSL has its registered office at Panjim in State of Goa in India.
On April 22, 2015, the Company (formerly known as Sesa Sterlite Limited) submitted to the SEC that its name has been changed to Vedanta Limited following the approval from the Registrar of Companies, Goa on April 21, 2015.
Vedanta Limited’s shares are listed in India on the Bombay Stock Exchange and the National Stock Exchange. In connection with the merger of SIIL into Sesa Goa to form SSL, SSL (now “Vedanta Limited”) has established an ADS facility and its ADSs are now listed on the New York Stock Exchange.
Cairn India Limited ConsolidationMerger
Pursuant to the share purchase agreement, dated February 25, 2012 between Bloom Fountain Limited (“BFL”), a wholly owned subsidiary of the Sesa Goa (now “Vedanta Limited”)The Group’s oil and Vedanta Resources Holdings Limited (“VRHL”), BFL acquired 38.68% shareholding ingas business was held by Cairn India Limited and an associated debtits subsidiaries. During the current year, pursuant to the merger of $ 5,998 million by wayCairn India Limited with the Company (refer below), interests have been transferred to Vedanta Limited and its subsidiaries.
Merger of acquisition of Twinstar Energy HoldingCairn India Limited (‘TEHL’), for a nominal cash consideration of $ 1 on a closing date which was to be mutually agreed by purchaser and seller. Closing date was determined as August 26, 2013. Consequently, TEHL, Twin Star Mauritius Holdingswith Vedanta Limited
Vedanta Limited and Cairn India Limited, (including all its subsidiaries)had initially announced a scheme of merger between the two companies on June 14, 2015, terms whereof were amended on July 22, 2016 (“Cairn”Scheme”). As per the terms of the Scheme, Cairn India Limited was to merge into Vedanta Limited and upon the merger becoming effective:
| a. | Non-controlling shareholders of Cairn India Limited were to receive one equity share in Vedanta Limited of face value Re. 1 each and four 7.5% Redeemable Preference Shares (redeemable after 18 months from issuance) in Vedanta Limited with a face value of Rs. 10 each for each equity share held in Cairn India Limited. |
| b. | No shares were to be issued to Vedanta Limited or any of its subsidiaries for their shareholding in Cairn India Limited. This included shares held by Sesa Resources Limited in Cairn India Limited with a carrying value of Rs. 9,558 Million, the effects of cancellation of which was to be recorded in securities premium account. |
| c. | The employees of Cairn India Limited who were holding stock options in Cairn India Limited were to be compensated either in cash or through issuance of stock options of Vedanta Limited. |
| d. | The authorised share capital of Cairn India Limited aggregating to Rs. 22,500 million was to be assumed by the Company, resulting in an increase in its authorised share capital from Rs. 51,620 Million (divided into 51,270 million equity shares of Re. 1 each and 35 million preference shares of Rs. 10 each) to Rs. 74,120 million (divided into 44,020 million equity shares of Re. 1 each and 3,010 million preference shares of Rs. 10 each). |
All substantive approvals for effecting the merger of Cairn India Limited with Vedanta Limited were received by March 27, 2017 and therefore the same has been accounted for in the current financial year ending March 31, 2017. The Board of Directors of both the companies made the merger operative on April 11, 2017, whereafter Cairn India Limited ceased to exist.
Sincenon-controlling shareholders of Cairn India Limited have become subsidiariesthe shareholders of Vedanta Limited
Acquisition of power assets
Through a slump sale agreement dated August 19, 2013 between Vedanta Aluminium and SSL (now “Vedanta Limited”) , the power business consisting of 1,215 MW thermal power facility situated at Jharsuguda and 300 MW co-generation facility (90 MW operational and 210 MW under development) at Lanjigarh, has been purchased by Vedanta Limited at a considerationCompany,non-controlling interest of Rs. 28,929 million.
Accounting for the Re-organisation Transaction
SIIL (now “Vedanta Limited”)213,515 Million ($ 3,292.4 million) attributable to Cairn India Limited stands extinguished. Correspondingly, there is (a) an increase in equity share capital of Rs. 753 Million ($ 11.6 million) (representing par value of 752.5 million equity shares), its wholly owned subsidiary Sterlite Energy, Vedanta Aluminium, Sesa Goa, MALCOborrowings of Rs. 30,100 Million ($ 464.1 million) (representing par value of redeemable preferences shares) and Cairn were all subsidiaries of Vedanta, the ultimate holding company. Accordingly, the entire Re-organisation Transactions fell within the purview of the common control business combination transactions. The accounting policies described in Note 3(D) required that financial statements of the combined entity Sesa SterliteRs. 428 Million ($ 6.6 million) (representing cash compensation payable to be presented on a combined basis retrospectively as if the transaction had occurred at the earliest reporting period (or from the date the entity came under common control where such a date is later) and accordingly the financial information for the fiscal years ended March 31, 2012 and 2013 were recast to give effect to the Re-organisation Transactions while presenting financial statements for the year ended March 31, 2014. The financial statementsstock option holders of Cairn are consolidated from December 8, 2011, the dateIndia Limited), share based payment reserve of its acquisitionRs. 1,482 million ($ 22.9 million) (representing employee stock options issued to stock option holders of Cairn India Limited) and other equity of Rs. 190,310 million ($ 2,934.6 million) and (b) a decrease in securities premium account by Vedanta.Rs. 9,558 million ($ 147.4 million).
Goa Energy Limited and Sterlite Infra Limited Merger
During fiscal year 2015, Goa Energy Limited and Sterlite Infra Limited, wholly owned subsidiaries, merged with Vedanta Limited. The High Court of Bombay had approved the scheme of amalgamation of the Goa Energy Limited on March 12, 2015 and the High Court of Madras had approved the Scheme of Amalgamation of Sterlite Infra Limited on March 25, 2015.
Business Overview -
Vedanta Limited and its consolidated subsidiaries is a diversified natural resource company engaged in exploring, extracting and processing minerals and oil and gas. The Group engages in the exploration, production and sale of zinc, lead, silver, copper, aluminium, iron ore and oil and gas and have a presence across India, South Africa, Namibia, Ireland, Australia, Liberia and UAE. The Group is also in the business of commercial power generation and port operations in India.
Vedanta Limited is majority owned by Twin Star Holdings Limited (“Twin Star”), Finsider International Company Limited (“Finsider”), West Globe Limited (“West Globe”) and Welter Trading Limited (“Welter”) which are in turn wholly-owned subsidiaries of Vedanta, a public limited company incorporated in the United Kingdom and listed on the London Stock Exchange. Twin Star, Finsider, West Globe and Welter held 46.5%, 13.5%, 1.5% and 1.3% respectively of Vedanta Limited equity as at March 31, 2016.2017.
The Group’s zinc India business is owned and operated by Hindustan Zinc Limited (“HZL”) in which it has a 64.9% interest as at March 31, 2016.2017. HZL’s operations include five lead-zinc mines, one rock phosphate mine, four hydrometallurgical zinc smelters, two lead smelters, one pyro metallurgical lead-zinc smelter, sevensix sulphuric acid plants, a silver refinery and six captive power plants in the State of Rajasthan in Northwest India and one zinc ingot melting and casting plant at Haridwar and one silver refinery, one zinc ingot melting and casting plant and one lead ingot melting and casting plant at Pantnagar in the State of Uttarakhand in North India. Operations at the Visakhapatnam facility in the State of Andhra Pradesh consisting of a zinc smelter and a sulphuric acid plant which were suspended since the last quarter of fiscal 2012, has been discontinued in fiscal 2014.
The Group’s zinc international business is comprised of Skorpion mine and refinery in Namibia operated through THL Zinc Namibia Holdings (Proprietary) Limited (“Skorpion”), Lisheen mine in Ireland operated through Vedanta Lisheen Holdings Limited (“Lisheen”) and Black Mountain Mining (Proprietary) Limited (“BMM”), whose assets include the operational Black Mountain mine and the Gamsberg mine project which is in exploration stage, located in South Africa. The Group has 100% interest in Skorpion, 74% interest in BMM and 100% interest in Lisheen (which owns the Lisheen mine in Ireland that ceased operations in December 2015) as at March 31, 2016.2017.
The Group’s oil and gas business is owned and operated by Vedanta Limited (prior to merger this was owned and operated by erstwhile Cairn India Limited) and engaged in business of explorationits subsidiaries Cairn Energy Hydrocarbons Limited and development and production of oil and gas, in which theCairn South Africa Proprietary Limited. The Group has 59.9 % interest as at March 31, 2016. Cairn has a diversified asset base with nineseven blocks, one in state of Rajasthan in India, twoone on the west coast of India, four on the east coast of India one in Sri Lanka and one in South Africa. On 15 October 2015, at the expiry of second phase extension, the Group has relinquished the block in Sri Lanka and is in the process of closing down the Sri Lankan operations.
The Group’s iron ore business is owned by Vedanta Limited and by two wholly owned subsidiaries, Sesa Resources Limited and Sesa Mining Corporation Private Limited, and consists of exploration, mining and processing of iron ore, pig iron and metallurgical coke and generation of power. The mining operations are carried out at Codli group, Bicholim mine, Surla mine and the Sonshi group of mines in state of Goa and Narrain mines situated at state of Karnataka in India. The business also has a Metallurgical Coke and Pig Iron plant in state of Goa in India. Iron ore business also has a power plant in state of Goa in India for captive use. The Group’s iron ore business includes Western Cluster Limited (“WCL”) in Liberia which has iron ore assets and is a wholly owned subsidiary of the Group. WCL’s assets include development rights to western cluster and a network of iron ore deposits in West Africa.
The Group’s copper business is owned and operated by Vedanta Limited, Copper Mines of Tasmania Pty Ltd (“CMT”) and Fujairah Gold FZC and is principally one of custom smelting and includes a copper smelter, a refinery, a phosphoric acid plant, a sulphuric acid plant, a copper rod plant and three captive power plants at Tuticorin in Southern India, and a refinery and two copper rod plants at Silvassa in Western India. In addition, the Group owns and operates the Mt. Lyell copper mine in Tasmania, Australia through its subsidiary, CMT and a precious metal refinery and copper rod plant in Fujairah through its subsidiary Fujairah Gold FZC in the UAE. The operations of Mt Lyell copper mine was suspended in January 2014 following a mud slide incident and the operations at Mt Lyell copper mine have been put into care and maintenance since July 9, 2014 following a rock fall incident in June 2014.
The Group’s aluminium business is owned and operated by Vedanta Limited and by Bharat Aluminium Company Limited (“BALCO”) in which it has a 51% interest as at March 31, 2016.2017. The aluminium operations include a refinery and a 75 MW captive power plant at Lanjigarh and a smelter and a 1215 MW captive power plant at Jharsuguda both situated in the State of Orissa in India. Vedanta Limited is currentlyThe pots are in the processstage of ramping up ofcommissioning in the 1.25 million tonnesmtpaJharsuguda-II Aluminium smelter facilities at Jharsuguda. 82with 530 pots from the first line of this smelter werehaving been commissioned during fiscal year 2015, out of which 80 pots were capitalized on December 1, 2015 and further ramp up recommenced from April 1, 2016.by March 31, 2017. Refinery expansion project being set up at Lanjigarh was on hold since October 20, 2010, as the MoEF had directed the Company to hold from further expansion. However, environment clearance (EC) for the Lanjigarh expansion project has been received in the quarter ending December 31, 2015. BALCO’s partially integrated aluminium operations are comprised of two bauxite mines, 11401410 MW power plant, smelting and fabrication facilities in central India.India.The BALCO-II smelter was commissioned, with all 336 pots operational in August 2016.
The Group’s power business is owned and operated by Vedanta Limited, BALCO, HZL, MEL and Talwandi Sabo Power Limited (“TSPL”), wholly owned subsidiaries of Vedanta Limited which are engaged in the power generation business in India. Vedanta Limited power operations include 2,400 MW (four units of 600 MW each) thermal coal-based commercial power facility at Jharsuguda in the State of Orissa in Eastern India and all four units of 600 MW are currently operational .operational. In 2015, the Company had petitioned to OERC to convert the 600 MW X 4 IPP into Captive power plant (CPP) to cater the power needs of the 1.25 MTPA Smelter at Jharsuguda. After many deliberations & considerations of facts, OERC issued an order of conversion of Unit 1, 3 & 4 into CPP with effect from April 1, April 2015, however retained the IPP status of Unit 2 to fulfill the obligation under PPA with GRIDCO. BALCO is setting uphas thermal coal based power plant with total capacity of 600MW, two units of 300 MW each, at Korba and are referred to as IPP 600 MW. The first 300 MW unit of the IPP 600 MW was capitalized on August 1, 2015 after the successful completion of trial runs. The second unit has been commissioned and started commercial production from May 1, 2016. TSPL had signed a power purchase agreement with the Punjab State Power Corporation Limited (“PSPCL”) for the establishment of 1,980 MW (three units of 660 MW each) thermal coal-based commercial power facilities and the first 660 MW unit of the Talwandi Sabo power plant (TSPL) was capitalized in financial year 2015, and second 660 MW unit was capitalized on December 1, 2015 after the successful completion of trial runs.runs and the third 660MW unit at TSPL was capitalized on September 1, 2016. The Power business also includes the 274 MW of wind power plants commissioned by HZL 270 MW power plant at BALCO’s Korba facility which was previously for captive use before the shutdown of the 100,000 tpa aluminum smelter at Korba and 106.5 MW power plant at MALCO Energy Limited (“MEL”) situated near Mettur Dam in the State of Tamil Nadu in southern India.(presently under care and maintenance).
The Group’s other activities include Vizag General Cargo Berth Private Limited (“VGCB”) and Maritime Ventures Private Limited (”MVPL”) in which the Group owns a 99.9 %100% interest. Vizag port project includes the mechanisation of coal handling facilities and upgradation of general cargo berth for handling coal at the outer harbourharbor of VishakhapatnamVisakhapatnam port on the east coast of India. MVPL is engaged in the business of rendering logistics and other allied services inter alia rendering stevedoring, and other allied services in Ports and other allied sectors. VGCB commenced operations in the fourth quarter of fiscal 2013.
These consolidated financial statements of the Group were authorized for issuance by Vedanta Limited’s board of directors on July 29, 2016.August 13, 2017.
2. Basis of preparation of financial statements
Basis of preparation
These consolidated financial statements have been prepared in accordance with International Financial Reporting Standards (“IFRS”), as issued by International Accounting Standards Board (“IASB”).
These consolidated financial statements have been prepared in accordance with the accounting policies, set out below and were consistently applied to all periods presented unless otherwise stated.
Basis of measurement
The consolidated financial statements have been prepared on the historical cost convention and on an accrual basis, except for derivative financial instruments, short-term investments andavailable-for-sale financial investments which are remeasured at fair values at the end of each reporting period as explained in the accounting policies below.
Application of new and revised standards:
The Group has adopted with effect from 1 April 1, 2015,2016, the following new amendment and revised standards and interpretations.pronouncements. Their adoption has not had any significant impact on the amounts reported in the financial statements.
Amendments to IAS 19(Revised 2011) – Defined Benefit Plans: Employee Contributions
Amendments to IAS 19(Revised 2011)– Defined Benefit Plans: Employee Contributions clarify the requirements that relate to contributions to be attributed to the period of service whereby contributions from employees or third parties are linked to service. In addition, it permits a practical expedient if the amount of the contributions is independent of the number of years of service, in those contributions, can, but are not required, to be recognised as a reduction in the service cost in the period in which the related service is rendered. This amendment is effective for annual periods beginning on or after July 1, 2014.
Annual Improvements to IFRSs 2010-2012 and 2011-2013 Cycle -
2010-2012 Cycle and Annual Improvements to IFRSs: 2011-2013 Cycle, are part of annual process of revising and improving existing standards. These are effective for annual periods beginning on or after July 1, 2014.
| ☐ | Amendments to IAS 1: Disclosure Initiative |
| ☐ | Amendments to IAS 16 and IAS 38: Clarification of Acceptable Methods of Depreciation and Amortisation |
| ☐ | Amendments to IFRS 11: Accounting for Acquisitions of Interests in Joint Operations |
| ☐ | Amendment to IFRS 10, IFRS 12 and IAS 28: Sale or Contribution of Assets between an Investor and its |
Associate or Joint Venture.
| ☐ | Amendments to IFRS 10, IFRS 12 and IAS 28: Investment entities: Applying the Consolidation Exemption |
The Group has not early adopted any other amendments, standards or interpretations that have been issued but are not yet effective.
Going concern
The consolidated financial statements have been prepared in accordance with the going concern basis of accounting.
Convenience translation
The consolidated financial statements are presented in Indian Rupee, the functional and presentation currency of the Company.Company (Also refer note 3.S). Solely for the convenience of readers, the consolidated financial statements as at and for the year ended March 31, 20162017 have been translated into US dollars (“$”) at the noon buying rate of $ 1.00 = Rs. 66.2564.85 in the City of New York for cable transfers of Indian Rupee as certified for customs purposes by the Federal Reserve Bank of New York on March 31, 2016.2017. No representation is made that the Indian Rupee amounts represent US dollar amounts or have been, could have been or could be converted into US dollars at such a rate or any other rate.
3. Significant accounting policies –
A. Basis of consolidation
Subsidiary:
The consolidated financial statements incorporate the results of Vedanta Limited and all its subsidiaries, being the entities that it controls. Control is evidenced where the Group has power over the investee or is exposed, or has rights, to variable returns from its involvement with the investee and has the ability to affect those returns through its power over the investee. Power is demonstrated through existing rights that give the ability to direct relevant activities, which significantly affect the entity returns.
The financial statements of subsidiaries are prepared for the same reporting year as the parent company. Where necessary, adjustments are made to the financial statements of subsidiaries to align the accounting policies in line with accounting policies of the Group.
Fornon-wholly owned subsidiaries, a share of the profit / loss for the financial year and net assets is attributed to thenon-controlling interests as shown in the consolidated statements of profit or loss, consolidated statements of comprehensive income and consolidated statements of financial position.
For acquisitions of additional interests in subsidiaries, where there is no change in control, the Group recognises a reduction to thenon-controlling interest of the respective subsidiary with the difference between this figure and the cash paid, inclusive of transaction fees, being recognised in equity. In addition, upon dilution of controlling interests the difference between the cash received from sale or listing of the subsidiary shares and the increase tonon-controlling interest is also recognised in equity. The results of subsidiaries acquired or disposed off during the year are included in the consolidated statements of profit or loss from the effective date of acquisition or up to the effective date of disposal, as appropriate.
Intra-group balances and transactions, and any unrealized income and expenses arising from intra-group transactions have beenare eliminated in preparing the consolidated financial statements. Unrealized losses are eliminated unless costs cannot be recovered.
Joint arrangements
A Joint arrangement is an arrangement of which two or more parties have joint control. Joint control is considered when there is contractually agreed sharing of control of an arrangement, which exists only when decisions about the relevant activities require the unanimous consent of the parties sharing control. Investments in joint arrangements are classified as either joint operations or joint venture. The classification depends on the contractual rights and obligations of each investor, rather than the legal structure of the joint arrangement. A joint operation is a joint arrangement whereby the parties that have joint control of the arrangement have rights to the assets, and obligations for the liabilities, relating to the arrangement. A joint venture is a joint arrangement whereby the parties that have joint control of the arrangement have rights to the net assets of the arrangement.
The Group has joint operations within its Oiloil and gas segment and participates in several unincorporated joint operations which involve the joint control of assets used in oil and gas exploration and producing activities. The Group accounts for its share of assets, liabilities, income and expenditure of joint ventures in which the Group holds an interest, classified in the appropriate balance sheetstatement of financial position and statement of profit or loss headings.
B. Investments in associates
Investments in associates are accounted for using the equity method. An associate is an entity over which the Group is in a position to exercise significant influence over operating and financial policies. Goodwill arising on the acquisition of associates is included in the carrying value of investments in associate. Investment in associates is initially recorded at the cost to the Group and then, in subsequent periods, the carrying value is adjusted to reflect the Group’s share of the associate’s consolidated profits or losses, other changes to the associate’s net assets and is further adjusted for impairment losses, if any. The consolidated statements of profit or loss and consolidated statements of comprehensive income include the Group’s share of associate’s results, except where the associate is generating losses, share of such losses in excess of the Group’s interest in that associate are not recognized. Losses recognised under the equity method in excess of the Group’s investment in ordinary shares are applied to the other components of the Group’s interest that forms part of Group’s net investment in the associate in the reverse order of their seniority (i.e. priority in liquidation).
Additional losses are provided for, only to the extent that the Group has incurred legal or constructive obligations or made payments on behalf of the associate.
Unrealised gains arising from transactions with associates are eliminated against the investment to the extent of the Group’s interest in the associate. Unrealised losses are eliminated in the same way as unrealized gains, but only to the extent that there is no evidence of impairment of the asset transferred.
C. Revenue recognition
Revenues are measured at the fair value of the consideration received or receivable, net of discounts, volume rebates, outgoing sales taxes, excise duty and other indirect taxes. Revenues from sales are recognised when all significant risks and rewards of ownership of the commodity sold are transferred to the customer andwhich usually is on delivery of the commodity has been deliveredgoods to the shipping agent. Revenues from sale ofby-products are included in revenue.
Certain of the Group’s sales contracts provide for provisional pricing based on the price on The London Metal Exchange (“LME”), as specified in the contract, when shipped. Final settlement of the price is based on the applicable price for a specified future period. The Group’s provisionally priced sales are marked to market using the relevant forward prices for the future period specified in the contract and is adjusted in revenue.
Revenue from oil, gas and condensate sales represent the Group’s share of oil, gas and condensate production, recognised on a direct entitlement basis, when significant risks and tolling income receivedrewards of ownership are transferred to the buyers. Government’s share of profit petroleum is accounted for third party usewhen the obligation (legal or constructive), in respect of operating facilities and pipelines in accordance with agreements.the same arises.
Revenue from sale of power is recognised when delivered and measured based on rates as per bilateral contractual agreements with buyers and at rate arrived at based on the principles laid down under the relevant Tariff Regulations as notified by the regulatory bodies, as applicable.
Where the Group acts as a port operator, revenues and costs relating to each construction contract of service concession arrangements are recognised over the period of each arrangement only to the extent of costs incurred that are probable of recovery. Revenues and costs relating to operating phase of the port contract are measured at the fair value of the consideration received or receivable for the services provided.
Revenue from rendering of services is recognised on the basis of work performed.
Dividend income is recognised when the right to receive payment is established. Interest income is recognised using the effective interest rate method.
D. Business combinations
Acquisitions are accounted for under the purchase method. The acquirer’s identifiable assets, liabilities and contingent liabilities that meet the conditions for recognition under IFRS 3, are recognised at their fair value at the acquisition date.
Excess of purchase consideration and the acquisition datenon-controlling interest over the acquisition date fair value of identifiable assets acquired and liabilities assumed is recognised as goodwill. Goodwill arising on acquisitions is reviewed for impairment annually. Where the fair values of the identifiable assets and liabilities exceed the cost of acquisition, the Groupre-assesses whether it has correctly identified all of the assets acquired and all of the liabilities assumed and reviews the procedures used to measure the amounts to be recognized at the acquisition date. If the reassessment still results in an excess of the fair value of net assets acquired over the aggregate consideration transferred, then the surplus is credited to the consolidated statements of profit or loss in the period of acquisition. Where it is not possible to complete the determination of fair values by the date on which the first post-acquisition financial statements are approved, a provisional assessment of fair value is made and any adjustments required to those provisional fair values are finalised within 12 months of the acquisition date.
The Group makes adjustments to the provisional fair value amounts recognised at the date of acquisition to reflect new information obtained about facts and circumstances that existed as of the acquisition date that, if known, would have affected the measurement of the amounts recognised as of that date. The Group applies the measurement period adjustments retrospectively to the consolidated financial statements to reflect the measurement period adjustments as retrospectively recorded on the date of the acquisition as if measurement period adjustments had been recorded initially at the date of acquisition.
Anynon-controlling interest in an acquiree is measured at fair value or as thenon-controlling interest’s proportionate share of the acquiree’s net identifiable assets. This accounting choice is made on a transaction by transaction basis.
Acquisition expenses are charged to consolidated statements of profit or loss in line with IFRS 3.
Common Control transactions
A business combination involving entities or businesses under common control is a business combination in which all of the combining entities or businesses are ultimately controlled by the same party or parties both before and after the business combination and the control is not transitory. The transactions between entities under common control are scoped out of IFRS 3 and there is no authoritative literature for these transactions under IFRS. As a result, the Group adopted accounting principles similar to thepooling-of-interest method based on the predecessor values. The assets and liabilities of the acquired entity are recognised at the book values recorded in the ultimate parent entity’s consolidated financial statements with the exception of certain income tax and deferred tax benefits arising on account of the common control transaction but relating to previous years, which are recognised retrospectively. The components of equity of the acquired companies are added to the same components within Group equity except that any share capital and investments in the books of the acquiring entity is cancelled and the differences, if any, is adjusted in the opening retained earnings. The Company’s shares issued in consideration for the acquired companies are recognized from the moment the acquired companies are included in these financial statements and the financial statements of the commonly controlled entities would be combined, retrospectively, as if the transaction had occurred at the beginning of the earliest reporting period presented. However, the prior years’ comparative information is only adjusted for periods during which the entities were under common control.
E (a) Property, plant and equipment
(i) Mining Properties and leases - The costs of mining properties, which include the costs of acquiring and developing mining properties and mineral rights, are capitalised as property, plant and equipment under the heading “Mining properties” in the year in which they are incurred.
When a decision is taken that a mining property is viable for commercial production (i.e. when the Group determines that the mining property will provide sufficient and sustainable return relative to the risks and the Group decided to proceed with the mine development), all furtherpre-production primary development expenditure other than land, buildings, plant and equipment is capitalised as part of the cost of the mining property until the mining property is capable of commercial production. From that point, capitalised mining properties are amortised on a unit-of-production basis over the total estimated remaining commercial reserves of each property or group of properties and are subject to impairment review.
Exploration and evaluation assets are recognized as assets at their cost of acquisition, subject to meeting the commercial production criteria as above and are subject to impairment review on annual basis, or more frequently if indicators of impairment exist.
The stripping cost incurred during the production phase of a surface mine is deferred to the extent the current period stripping cost exceeds the average period stripping cost over the life of mine and recognised as an asset if such cost provides a benefit in terms of improved access to ore in future periods and certain criteria are met. When the benefit from the stripping costs are realised in the current period, the stripping costs are accounted for as the cost of inventory. If the costs of inventory produced and the stripping activity asset are not separately identifiable, a relevant production measure is used to allocate the production stripping costs between the inventory produced and the stripping activity asset. The Company uses the expected volume of waste compared with the actual volume of waste extracted for a given value of ore production for the purpose of determining the cost of the stripping activity asset.
Deferred stripping cost are included in mining properties within property, plant and equipment and disclosed as a part of mining properties. After initial recognition, the stripping activity asset is depreciated on a unit of production method over the expected useful life of the identified component of the ore body.
In circumstance, where a property is abandoned, the cumulative capitalized costs relating to the property are written off in the same period.
Commercial reserves are proved and probable reserves. Changes in the commercial reserves affecting unit of production calculations are dealt with prospectively over the revised remaining reserves.
(ii) Oil and gas assets- (developing/producing assets)
For oil and gas assets a successful efforts based accounting policy is followed. Costs incurred prior to obtaining the legal rights to explore an area are expensed immediately to the consolidated statements of profit or loss.
All costs incurred after the technical feasibility and commercial viability of producing hydrocarbons has been demonstrated are capitalised within property, plant and equipment - equipment—development/producing assets on afield-by-field basis. Subsequent expenditure is capitalised only where it either enhances the economic benefits of the development/producing asset or replaces part of the existing development/producing asset. Any remaining costs associated with the part replaced are expensed.
Net proceeds from any disposal of development/producing assets are credited against the previously capitalised cost. A gain or loss on disposal of a development/producing asset is recognised in the consolidated statements of profit or loss to the extent that the net proceeds exceed or are less than the appropriate portion of the net capitalised costs of the asset.
(iii) Other property, plant and equipment
The initial cost of property, plant and equipment comprises its purchase price, including import duties andnon-refundable purchase taxes, and any directly attributable costs of bringing an asset to working condition and location for its intended use. It also includes the initial estimate of the costs of dismantling and removing the item and restoring the site on which it is located. If significant parts of an item of property, plant and equipment have different useful lives, then they are accounted for as separate items (major components) of property, plant and equipment. Expenditure incurred after the property, plant and equipment have been put into operation, such as repairs and maintenance, are normally charged to the consolidated statements of profit or loss in the period in which the costs are incurred. Major inspection and overhaul expenditure is capitalised.capitalized, if the recognition criteria are met.
(iv) Assets in the course of construction
Assets in the course of construction are capitalised in the assets under construction account. At the point when an asset is capable of operating in the manner intended by management, the cost of construction is transferred to the appropriate category of property, plant and equipment. Costs associated with the commissioning of an asset are capitalised until the period of commissioning has been completed and the asset is ready for its intended use.
(v) Depreciation
Mining properties and other assets in the course of development or construction and freehold land are not depreciated.
CapitalisedThe capitalised mining properties costs are amortised onceon aunit-of-production basis over the total estimated remaining commercial production commences, as described in “Property, plantreserves of each property or Group of properties and equipment - mining properties”.are subject to impairment review.
All expenditures carried within each field are amortised from the commencement of production on a unit of production basis, which is the ratio of oil and gas production in the period to the estimated quantities of commercial reserves at the end of the period plus the production in the period, generally on afield-by-field basis or group of fields which are reliant on common infrastructure.
Commercial reserves are proven and probable oil and gas reserves, which are defined as the estimated quantities of crude oil, natural gas and natural gas liquids which geological, geophysical and engineering data demonstrate with a specified degree of certainty to be recoverable in future years from known reservoirs and which are considered commercially producible.
Costs used in the unit of production calculation comprise the net book value of capitalised costs plus the estimated future field development costs required to access commercial reserves. Changes in the estimates of commercial reserves or future field development costs are dealt with prospectively.
Other buildings, plant and equipment, office equipment and fixtures, and motor vehicles are stated at cost less accumulated depreciation and any provision for impairment. Depreciation commences when the assets are ready for their intended use. Depreciation is provided at rates calculated to write off the cost, less estimated residual value, of each asset on a straight-line basis over its expected useful life, as follows:
Buildings: | ||||
— Operations and administration | ||||
Plant and equipment | 15-40 years | |||
Office equipment and fixtures | ||||
Motor vehicles | 8-10 years |
Major inspection and overhaul costs are depreciated over the estimated life of the economic benefit derived from such costs. The carrying amount of the remaining previous overhaul cost is charged to the consolidated statements of profit or loss if the next overhaul is undertaken earlier than the previously estimated life of the economic benefit.
The Group reviews the residual value and useful life of an asset at least at each financialyear-end and, if expectations differ from previous estimates, the change(s) is accounted for as a change in accounting estimate.
(b) Exploration and evaluation assets
Exploration and evaluation expenditure incurred after obtaining the mining right or the legal right to explore are capitalised as Exploration and evaluation assets (intangible assets) and stated at cost less impairment. Exploration and evaluation assets are transferred to property, plant and equipment when the technical feasibility and commercial viability has been determined. Exploration and evaluation assets are assessed for impairment and losses, if any, is recognised prior to reclassification. Exploration and evaluation expenditure incurred prior to obtaining the mining right or the legal right to explore are expensed as incurred.
Exploration expenditure includes all direct and allocated indirect expenditure associated with finding specific mineral resources which includes depreciation and applicable operating costs of related support equipment and facilities and other costs of exploration activities:
a. Acquisition costs - costs associated with acquisition of licenses and rights to explore, including related professional fees.
b. General exploration costs - costs of surveys and studies, rights of access to properties to conduct those studies (e.g., costs incurred for environment clearance, defense clearance, etc.), and salaries and other expenses of geologists, geophysical crews and other personnel conducting those studies.
c. Costs of exploration drilling and equipping exploration and appraisal wells.
Expenditure incurred on the acquisition of a license interest is initially capitalised on alicense-by-license basis. Costs are held,un-depleted, within exploration and evaluation assets until such time as the exploration phase on the license area is complete or commercial reserves have been discovered.
Exploration expenditure incurred in the process of determining oil and gas exploration targets is capitalised within “Exploration and evaluation assets” (intangible assets) and subsequently allocated to drilling activities. Exploration drilling costs are initially capitalised on awell-by-well basis until the success or otherwise of the well has been established. The success or failure of each exploration effort is judged on awell-by-well basis.
Following appraisal of successful exploration wells, if commercial reserves are established and technical feasibility for extraction demonstrated, then the related capitalised exploration costs are transferred into a single field cost center within property, plant and equipment - equipment—development/producing assets after testing for impairment. Where results of exploration drilling indicate the presence of hydrocarbons which are ultimately not considered commercially viable, all related costs are written off to the consolidated statements of profit or loss.
Net proceeds from any disposal of an exploration asset are initially credited against the previously capitalised costs. Any surplus proceeds are creditedsurplus/ deficit is taken to the consolidated statements of profit or loss.
(c) Other intangible assets
Intangible assets acquired separately are measured on initial recognition at cost. Following initial recognition, intangible assets are carried at cost less accumulated amortization and accumulated impairment losses, if any.
Intangible assets arising out of service concession arrangements are accounted for as intangible assets where the Group has a contractual right to charge users of services when the projects are completed and is measured at the cost determined as the fair value of the consideration received or receivable of such construction services completed.services. Such assets are amortisedamortized on straight line basis overbased on the lower of their useful lives or the balance of license period.period (presently 30 years).
Software is amortized over the estimated useful life of five years. Amounts paid for securing mining rights are amortized over the period of16-25 years.
F.Non-current assets held for sale
Non-current assets and disposal groups are classified as held for sale if their carrying amount will be recovered through a sale transaction rather than through continuing use. This condition is regarded as met only when the sale is highly probable and the asset (or disposal group) is available for immediate sale in its present condition. Management must be committed to the sale which should be expected to qualify for recognition as a completed sale within one year from the date of classification.
Non-current assets and disposal groups classified as held for sale are not depreciated and are measured at the lower of carrying amount and fair value less costs to sell. Such assets and disposal groups are presented separately on the face of the consolidated statements of financial position.
G. Financial instruments
(i). Non-derivative financial assets
The Group initially recognises loans and receivables and deposits at fair value plus transaction cost on the date that they are originated. All other financial assets are recognised initially on the trade date at which the Group becomes a party to the contractual provisions of the instrument.
The Group derecognises a financial asset when the contractual rights to the cash flows from the asset expire, or it transfers the rights to receive the contractual cash flows on the financial asset in a transaction in which substantially all the risks and rewards of ownership of the financial asset are transferred.
Financial assets and liabilities are offset and the net amount presented in the consolidated statements of financial position when, and only when, the Group has a legal right to offset the amounts and intends either to settle on a net basis or to realise the asset and settle the liability simultaneously.
The Group has the followingnon-derivative financial assets: financial asset investments, short-term investments, cash and cash equivalents, loans and receivables.
(a) Financial asset investments
Financial asset investments that are neither classified as held for trading nor designated as fair value through profit or loss are classified asavailable-for-sale and are recorded at its fair value plus transaction costs that are directly attributable to the acquisition of financial asset investments and then remeasured at subsequent reporting dates to fair value. Unrealized gains and losses on financial asset investments are recognised directly in the consolidated statements of comprehensive income. Upon disposal or impairment of the investments, the gains and losses in other comprehensive income are reclassified into the consolidated statements of profit or loss.
Investments in unquoted equity instruments that do not have a market price and whose fair value cannot be reliably measured are measured at cost. Equity investments are recorded innon-current assets unless they are expected to be sold within one year.
(b) Short-term investments
Short-term investments represent short-term marketable securities and other bank deposits with an original maturity of more than three months. These are highly liquid investments that are readily convertible into cash which are subject to insignificant risk of changes in value and held for the purpose of meeting short-term cash commitments.
Short-term marketable securities are categorized as held for trading and are initially recognised at fair value with any gains or losses arising on remeasurementre-measurement recognised in the consolidated statements of profit or loss.
Other bank deposits are subsequently measured at amortised cost using the effective interest method.
(c) Cash and cash equivalents and restricted cash and cash equivalents
Cash and cash equivalents in the consolidated statements of financial position and cash flow statement comprise cash at bank and in hand, and short-term deposits which have a maturity of three months or less from the date of acquisition, and are unrestricted as to withdrawal and usage. Additionally, cash and cash equivalents for the purposes of cash flow statements includes restricted cash balance kept in a specified bank account towards unpaid dividend to be utilized solely for the purposes of payment of dividends.
Restricted cash and cash equivalents in the consolidated statements of financial position comprise cash at bank and in hand, and short-term deposits which have a maturity of three months or less from the date of acquisition, and are unrestrictedrestricted as to withdrawal and usage.
(d) Loans and receivables
Trade receivables, loans, and other receivables that have fixed or determinable payments that are not quoted in an active market are classified as ‘loans and receivables’. Trade receivables are stated at their transaction value as reduced by appropriate allowances for estimated irrecoverable amounts.
Loans and other receivables are subsequently measured at amortised cost using the effective interest method, less any impairment. Interest income is recognised by applying the effective interest rate (EIR) method.
(ii)Non-derivative financial liabilities
The Group initially recognises debt securities issued on the date that they are originated. All other financial liabilities are recognised initially on the trade date at which the Group becomes a party to the contractual provisions of the instrument.
The Group derecognises a financial liability when its contractual obligations are discharged or cancelled or expire. The difference between the carrying amount of the financial liabilities derecognised and consideration paid and payable is recognised in the consolidated statement of profit or loss.
Financial assets and liabilities are offset and the net amount presented in the consolidated statements of financial position when, and only when, the Group has a legal right to offset the amounts and intends either to settle on a net basis or to realise the asset and settle the liability simultaneously.
The Group has the followingnon-derivative financial liabilities: Borrowings, Foreign currency convertible notes, trade and other payables.
(a) Borrowings
Interest bearing loans and borrowings are initially recorded at the fair value.value, net of directly attributable transaction costs. After initial recognition, interest bearing loans and borrowings are subsequently measured at amortised cost using the EIR method.
Amortised cost is calculated by taking into account the finance charges, including premiums payable on settlement or redemption and direct issue costs that are an integral part of the EIR. The EIR amortisation is included in finance costs in the consolidated statements of profit or loss. The unamortised portion is classified with the carrying amount of debt.
(b) Foreign currency convertible notes
Convertible notes issued in foreign currency are convertible at the option of the holder into ordinary shares of the Group according to the terms of the issue. The conversion option which is not settled by exchanging a fixed amount of cash for a fixed number of shares is accounted for separately from the liability component as derivative and initially accounted for at fair value. The liability component is recognized initially at the difference between the fair value of the note and the fair value of the conversion option. Directly attributable notes issue costs are allocated to the liability component and the conversion option (expensed off immediately) in proportion to their initial carrying amounts.
Subsequent to initial recognition, the liability component is measured at amortised cost using the EIR method. The conversion option is subsequently measured at fair value at each reporting date, with changes in fair value recognized in consolidated statements of profit or loss. The conversion option is presented together with the related liability.
(c) Trade and other payables
Trade and other payables are recognised at their transaction cost, which is its fair value, and subsequently measured at amortised cost.
(iii) Derivative financial instruments
In order to hedge its exposure to foreign exchange, interest rate, and commodity price risks, the Group enters into forward, option, swap contracts and other derivative financial instruments. The Group does not hold derivative financial instruments for speculative purposes.
Derivative financial instruments are initially recorded at their fair value on the date of the derivative transaction and arere-measured at their fair value at subsequent financial position dates.
At the inception of the hedge relationship, the entity documents the relationship between the hedging instrument and the hedged item, along with its risk management objectives and its strategy for undertaking various hedge transactions. Furthermore, at the inception of the hedge and on an ongoing basis, the Group documents whether the hedging instrument is highly effective in offsetting changes in fair values or cash flows of the hedged item attributable to the hedged risk.
Fair Value Hedges –
Changes in the fair value of derivatives that are designated and qualify as fair value hedges are recognised in profit or loss immediately, together with any changes in the fair value of the hedged asset or liability that are attributable to the hedged risk. Hedge accounting is discontinued when the Group revokes the hedge relationship, the hedging instrument or hedged item expires or is sold, terminated, or exercised or no longer meets the criteria for hedge accounting.
Cash flow Hedges -Hedges—
The effective portion of changes in the fair value of derivatives that are designated and qualify as cash flow hedges are recorded in the consolidated statements of comprehensive income. The gain or loss relating to the ineffective portion is recognized immediately in the consolidated statements of profit or loss. The cumulative gainAmounts recognized as other comprehensive income are transferred to the statement of profit or loss previouslywhen the hedged transaction affects profit or loss, such as when the hedged financial income or financial expense is recognized in the consolidated statements of comprehensive income remains there until theor when a forecast transaction occurs. When the hedged item is anon-financial asset, the amount recognized in the consolidated statements of comprehensive income is transferred to the carrying amount of the asset when it is recognized. In other cases the amount recognized in the consolidated statements of comprehensive income is transferred to consolidated statements of profit or loss in the same period that the hedged item affects profit or loss. Hedge accounting is discontinued when the hedging instrument expires or is sold, terminated or exercised, or no longer qualifies for hedge accounting. If a hedged transaction is no longer expected to occur, the net cumulative gain or loss recognized in the consolidated statements of comprehensive income is transferred to consolidated statements of profit or loss.
Hedge of net investment in foreign operation-
For derivative instruments that are designated and qualify as a hedge of a net investment in a foreign currency,operation, the gain or loss is reported in the consolidated statements of comprehensive income as part of the exchange difference on translation of foreign operations to the extent it is effective. Any ineffective portions of net investment hedges are recognized in other income/expense in the consolidated statement of profit or loss immediately. Under a hedge of a net investment, the cumulative gain or loss remains in the consolidated statements of comprehensive income when the hedging instrument expires or is sold, terminated or exercised, or when the hedge no longer qualifies for hedge accounting or the Group revokes designation of the hedge relationship. The cumulative gain or loss is recognised in the consolidated statements of profit or loss as part of the gain / loss on disposal when the net investment in the foreign operation is disposed.
Derivative financial instruments that do not qualify for hedge accounting are marked to market at the financial position date and gains or losses are recognized in the consolidated statements of profit or loss immediately.
Derivatives embedded in other financial instruments or other host contracts are treated as separate derivatives when their risks and characteristics are not closely related to those of host contracts and the host contracts are not carried at fair value with unrealised gains or losses reported in the consolidated statements of profit or loss.
H. Equity instruments
An equity instrument is any contract that evidences a residual interest in the assets of an entity after deducting all of its liabilities. Equity instruments issued by the Group are recognised at the proceeds received, net of direct issue costs.
I. Borrowing costs
Borrowing cost includes interest expense as per effective interest rate (EIR) and exchange differences arising from foreign currency borrowings to the extent they are regarded as an adjustment to the interest cost.
Borrowing costs directly relating to the acquisition, construction or production of a qualifying capital project under construction are capitalised and added to the project cost during construction until such time that the assets are substantially ready for their intended use i.e. when they are capable of commercial production. Borrowing costs relating to the construction phase of a service concession arrangement is capitalised as part of the cost of the intangible asset. Where funds are borrowed specifically to finance a project, the amount capitalised represents the actual borrowing costs incurred. Where surplus funds are available out of money borrowed specifically to finance a project, the income generated from such short-term investments is deducted from the total capitalised borrowing cost. Where the funds used to finance a project form part of general borrowings, the amount capitalised is calculated using a weighted average of rates applicable to relevant general borrowings of the Group during the year. Capitalisation of borrowing costs is suspended and charged to the Statement of Profit and Loss during the extended periods when active development on the qualifying assets is interrupted.
All other borrowing costs are recognized in the consolidated statements of profit or loss in the year in which they are incurred.
J. Impairment
Financial assets
A financial asset is assessed at each reporting date to determine whether there is any objective evidence that it is impaired. A financial asset is considered to be impaired if objective evidence indicates that one or more events have had a negative effect on the estimated future cash flows of that asset.
An impairment loss in respect of a financial asset measured at amortised cost is calculated as the difference between its carrying amount, and the present value of the estimated future cash flows discounted at the original effective interest rate. An impairment loss in respect of anavailable-for-sale financial asset is calculated by reference to its fair value.
Significant financial assets are tested for impairment on an individual basis. The remaining financial assets are assessed collectively in groups that share similar credit risk characteristics. All impairment losses are recognized in the consolidated statements of profit or loss. Any cumulative loss in respect of anavailable-for-sale financial asset recognized previously in the consolidated statements of comprehensive income is transferred to the consolidated statements of profit or loss on recognition of impairment. An impairment loss is reversed if the reversal can be related objectively to an event occurring after the impairment loss was recognized. For financial assets measured at amortised cost andavailable-for-sale financial assets that are debt securities, the reversal is recognized in the consolidated statements of profit or loss. Foravailable-for-sale financial assets that are equity securities, reversal is recognized directly in the consolidated statements of comprehensive income.
The allowance accounts in respect of trade and other receivables are used to record impairment losses unless the Group is satisfied that no recovery of the amount owing is possible; at that point the amounts are considered irrecoverable and are written off against the financial asset directly.
Non-financial assets
Impairment charges and reversals are assessed at an individual asset or at the level of cash-generating units. A cash-generating unit (CGU) is the smallest identifiable group of assets that generate cash inflows that are largely independent of the cash inflows from other assets or group of assets.
Impairment tests are carried out annually for all assets when there is an indication of impairment. The Group conducts an internal review of asset values annually, which is used as a source of information to assess for any indications of impairment or reversal of previously recognised impairment losses. External factors, such as changes in expected future prices, costs and other market factors are also monitored to assess for indications of impairment or reversal of previously recognised impairment losses.
If any such indication exists then an impairment review is undertaken, the recoverable amount is calculated, as the higher of fair value less costs of disposal and the asset’s value in use.
Fair value less costs of disposal is the price that would be received to sell the asset in an orderly transaction between market participants and does not reflect the effects of factors that may be specific to the entity and not applicable to entities in general. Fair value for mineral and oil and gas assets is generally determined as the present value of the estimated future cash flows expected to arise from the continued use of the asset, including any expansion prospects, and its eventual disposal, using assumptions that an independent market participant may take into account. These cash flows are discounted at an appropriate post tax discount rate to arrive at the net present value.
Value in use is determined as the present value of the estimated future cash flows expected to arise from the continued use of the asset in its present form and its eventual disposal. The cash flows are discounted using apre-tax discount rate that reflects current market assessments of the time value of money and the risks specific to the asset for which estimates of future cash flows have not been adjusted. Value in use is determined by applying assumptions specific to the Group’s continued use and cannot take into account future development. These assumptions are different to those used in calculating fair value and consequently the value in use calculation is likely to give a different result to a fair value calculation.
The carrying amount of the CGU is determined on a basis consistent with the way the recoverable amount of the CGU is determined.
If the recoverable amount of an asset or CGU is estimated to be less than its carrying amount, the carrying amount of the asset or CGU is reduced to its recoverable amount. An impairment loss is recognised in the income statement.
Any reversal of the previously recognised impairment loss is limited to the extent that the asset’s carrying amount does not exceed the carrying amount that would have been determined if no impairment loss had previously been recognised.
Exploration and evaluation assets:
In assessing whether there is any indication that an exploration and evaluation asset may be impaired, the company considers, as a minimum, the following indications:
When a potential impairment is identified, an assessment is performed for each area of interest in conjunction with the group of operating assets (representing a cash-generating unit) to which the exploration and evaluation assets is attributed. Exploration areas in which reserves have been discovered but require major capital expenditure before production can begin, are continually evaluated to ensure that commercial quantities of reserves exist or to ensure that additional exploration work is under way or planned. To the extent that capitalised expenditure is no longer expected to be recovered, it is charged to the income statement.statement of profit or loss.
K. Leases
Determining whether an arrangement contains lease
At inception of an arrangement, the Group determines whether the arrangement is or contains a lease. The arrangement is, or contains, a lease if fulfillment of the arrangement is dependent on the use of a specific asset or assets and the arrangement conveys a right to use the asset or assets, even if that right is not explicitly specified in an arrangement.
At inception or on reassessment of an arrangement that contains lease, the Group separates payments and other consideration required by the arrangement into those for the lease and those for other elements on the basis of their relative fair values. If the Group concludes for a finance lease that it is impracticable to separate the payments reliably, then an asset and a liability are recognised at an amount equal to the fair value of the underlying asset; subsequently the liability is reduced as payments are made and an imputed finance cost on the liability is recognised using the Group’s incremental borrowing rate.
Group as a lessee
A lease is classified at the inception date as a finance lease or an operating lease. A lease that transfers substantially all the risks and rewards incidental to ownership to the Group is classified as a finance lease.
Finance leases are capitalised at the commencement of the lease at the inception date fair value of the leased property or, if lower, at the present value of the minimum lease payments. Lease payments are apportioned between finance charges and reduction of the lease liability so as to achieve a constant rate of interest on the remaining balance of the liability. Finance charges are recognised in finance costs in the statement of profit and loss, unless they are directly attributable to qualifying assets, in which case they are capitalized in accordance with the Group’s general policy on the borrowing costs. Contingent rentals are recognised as expenses in the periods in which they are incurred.
A leased asset is depreciated over the useful life of the asset. However, if there is no reasonable certainty that the Group will obtain ownership by the end of the lease term, the asset is depreciated over the shorter of the estimated useful life of the asset and the lease term.
Operating lease payments are recognised as an expense in the statement of profit and loss on a straight-line basis over the lease term.
Group as a lessor
Leases in which the Company does not transfer substantially all the risks and rewards of ownership of an asset are classified as operating leases. Rental income from operating lease is recognised on a straight-line basis over the term of the relevant lease. Initial direct costs incurred in negotiating and arranging an operating lease are added to the carrying amount of the leased asset and recognised over the lease term on the same basis as rental income. Contingent rents are recognised as revenue in the period in which they are earned.
Leases are classified as finance leases when substantially all of the risks and rewards of ownership transfer from the Company to the lessee. Amounts due from lessees under finance leases are recorded as receivables at the Company’s net investment in the leases. Finance lease income is allocated to accounting periods so as to reflect a constant periodic rate of return on the net investment outstanding in respect of the lease.
L. Government grants
Government grants are not recognised until there is a reasonable assurance that the Group will comply with the conditions attaching to them and that the grants will be received. Government grants relating to tangible fixed assets are treated as deferred incomededucted in calculating the carrying amount of the assets and released torecognised in the consolidated statements of profit or loss over the expected useful lives of the assets concerned.concerned as a reduced depreciation expense. Other grants (including grants related to revenue) are credited to the consolidated statements of profit or loss on a systematic basis as and when the related expenditure is incurred.
L.
M. Inventories
Inventories (other than immaterialby-products and scrap) includingwork-in-progress are stated at the lower of cost and net realisable value, less any provision for obsolescence. Cost is determined on the following bases:
Immaterialby-products and scrap are valued at net realisable value.
Net realisable value is determined based on estimated selling price, less further costs expected to be incurred to completion and disposal.
M.N. Taxation
Tax expense represents the sum of current tax and deferred tax.
Current tax is provided at amounts expected to be paid (or recovered) using the tax rates and laws that have been enacted or substantively enacted by the reporting date and includes any adjustment to tax payable in respect of previous years.
Subject to exceptions below, deferred tax is provided, using the balance sheet method, on all temporary differences at the reporting date between the tax bases of assets and liabilities and their carrying amounts for financial reporting purposes:
Deferred tax assets and liabilities are measured at the tax rates that are expected to apply to the year when the asset is realized or the liability is settled, based on tax rates (and tax laws) that have been enacted or substantively enacted at the reporting date. Tax relating to items recognized directly in other comprehensive income is recognised in the consolidated statements of comprehensive income and not in the consolidated statements of profit or loss.
The carrying amount of deferred tax assets is reviewed at each reporting date and is adjusted to the extent that it is no longer probable that sufficient taxable profit will be available to allow all or part of the asset to be recovered.
Deferred tax assets and liabilities are offset when they relate to income taxes levied by the same taxation authority and the relevant entity intends to settle its current tax assets and liabilities on a net basis.
N.O. Retirement benefit schemes
The Group operates or participates in a number of defined benefits and defined contribution pension schemes, the assets of which (where funded) are held in separately administered funds. For defined benefit pension schemes, the cost of providing benefits under the plans is determined by actuarial valuation separately each year for each plan using the projected unit credit method by independent qualified actuaries as at the year end.
ActuarialRemeasurement gains and losses arising in the year are recognised in full in other comprehensive income and are not recycled to the profit or loss. For defined contribution schemes, the amount charged to the consolidated statements of profit or loss in respect of pension costs and other post-retirement benefits is the contributions payable in the year.
Net interest is calculated by applying a discount rate to the net defined benefit liability or asset at the beginning of the period. Defined benefit costs are split into current service cost, past service cost, net interest cost or income and remeasurement and gains and losses on curtailments and settlements. Current service cost and past service cost net interest/income is recognised within cost of sales, administrative expenses and distribution expenses. Net interest expense or income is recognized with finance costs.
O.P. Share based payments
Certain employees (including executive directors) of the Company receive part of their remuneration in the form of share-based payment transactions, whereby employees render services in exchange for shares or rights over shares (‘equity-settled transactions’).
The Company does not have any outstandingcost of equity-settled transactions with employees is measured at fair value at the date at which they are granted. The fair value of share awards with market-related vesting conditions are determined with the assistance of an external valuer and the fair value at the grant date is expensed on a proportionate basis over the vesting period based on the Group’s estimate of shares that will eventually vest. The estimate of the number of awards likely to vest is reviewed at each balance sheet date up to the vesting date at which point the estimate is adjusted to reflect the current expectations.
The resultant increase in equity is recorded in share based payments.payment reserve.
In case of cash-settled transactions, a liability is recognised for the fair value of cash-settled transactions. The fair value is measured initially and at each reporting date up to and including the settlement date, with changes in fair value recognised in employee benefits expense. The fair value is expensed over the period until the vesting date with recognition of a corresponding liability. The fair value is determined with the assistance of an external valuer.
Additionally, VRPLC offers certain share based incentives under the Long-Term Incentive Plan (“LTIP”) to employees and directors of the Company and its subsidiaries. VRPLC recovers the proportionate cost (calculated based on the grant date fair value of the options granted) from the respective group companies, which is charged to the consolidated statements of profit or loss.
Certain employees of Cairn receive part of their remuneration in the form of share based transactions, whereby employees render services in exchange for shares or rights over shares (‘equity settled transactions’). The cost of equity-settled transactions with employees is measured at fair value at the date of grant and recognized over vesting period.
P.Q. Provisions, forcontingent liabilities and chargescontingent assets
Provisions represent liabilities to the Group for which the amount or timing is uncertain. Provisions are recognized when the Group has a present obligation (legal or constructive), as a result of past events, and it is probable that an outflow of resources, that can be reliably estimated, will be required to settle such an obligation. If the effect of the time value of money is material, provisions are determined by discounting the expected future cash flows to net present value using an appropriatepre-tax discount rate that reflects current market assessments of the time value of money and, where appropriate, the risks specific to the liability. Unwinding of the discount is recognized in the consolidated statements of profit or loss as a finance cost. Provisions are reviewed at each reporting date and are adjusted to reflect the current best estimate.
Q.A contingent liability is a possible obligation that arises from past events whose existence will be confirmed by the occurrence ornon-occurrence of one or more uncertain future events beyond the control of Group or a present obligation that is not recognized because it is not probable that an outflow of resources will be required to settle the obligation. A contingent liability also arises in extremely rare cases where there is a liability that cannot be recognized because it cannot be measured reliably. The Group does not recognize a contingent liability but discloses its existence in the consolidated financial statements.
Contingent assets are not recognized but disclosed in the financial statements when an inflow of economic benefit is probable.
R. Restoration, rehabilitation and environmental costs
An obligation to incur restoration, rehabilitation and environmental costs arises when environmental disturbance is caused by the development or ongoing production of a mine or oil fields. Such costs, discounted to net present value, are provided for and a corresponding amount is capitalised at the start of each project, as soon as the obligation to incur such costs arises. These costs are charged to the statement of profit or loss over the life of the operation through the depreciation of the asset and the unwinding of the discount on the provision. The cost estimates are reviewed periodically and are adjusted to reflect known developments which may have an impact on the cost estimates or life of operations. The cost of the related asset is adjusted for changes in the provision due to factors such as updated cost estimates, changes to lives of operations, new disturbance and revisions to discount rates. The adjusted cost of the asset is depreciated prospectively over the lives of the assets to which they relate. The unwinding of the discount is shown as finance and other cost in the consolidated statements of profit or loss.
Costs for the restoration of subsequent site damage, which is caused on an ongoing basis during production, are charged to the consolidated statements of profit or loss as extraction progresses. Where the costs of site restoration are not anticipated to be material, they are expensed as incurred.
R.S. Foreign currency translation
The functional currency for each entity in the Group is determined as the currency of the primary economic environment in which it operates. For all principal operating subsidiaries, the functional currency is normally the local currency of the country in which it operates with the exception of Cairnoil and gas business which has a US dollar functional currency as that is the currency of the primary economic environment in which it operates.
In the financial statements of individual group companies, transactions in currencies other than the functional currency are translated into the functional currency at the exchange rates ruling at the date of the transaction. Monetary assets and liabilities denominated in other currencies are translated into the functional currency at exchange rates prevailing on the reporting date.Non-monetary assets and liabilities denominated in other currencies and measured at historical cost or fair value are translated at the exchange rates prevailing on the dates on which such values were determined. All exchange differences on monetary items are included in the consolidated statements of profit or loss except any exchange differences on monetary items designated as an effective hedging instrument of the currency risk of designated forecasted sales, which are recognized in the consolidated statements of comprehensive income.
For the purposes of the consolidated financial statements, items in the consolidated statements of profit or loss of those entitiesbusinesses for which the Indian Rupees (functional currency of the Company)Rupee is not the functional currency are translated into Indian Rupees at the average rates of exchange during the year.year/ exchange rates as on the date of transaction. The related consolidated statements of financial position are translated at the rates as at the reporting date. Exchange differences arising on translation are recognised in the consolidated statements of comprehensive income. On disposal of such entities the deferred cumulative exchange differences recognised in equity relating to that particular foreign operation are recognised in the consolidated statements of profit or loss.
S.T. Earnings per share
The Group presents basic and diluted earnings per share (“EPS”) data for its equity shares. Basic EPS is calculated by dividing the profit or loss attributable to equity shareholders of the Company by the weighted average number of equity shares outstanding during the period. Diluted EPS is determined by adjusting the profit or loss attributable to equity shareholders and the weighted average number of equity shares outstanding for the effects of all dilutive potential equity shares.
T.U. Treasury Shares
The Group has created an Employee Benefit Trust (EBT) for providing share-based payment to its employees. The Group uses EBT as a vehicle for distributing shares to employees under the employee remuneration schemes. The EBT buys shares of the company from the market, for giving shares to employees. The shares held by EBT are treated as treasury shares.
Own equity instruments that are reacquired (treasury shares) are recognised at cost and deducted from equity. No gain or loss is recognised in profit or loss on the purchase, sale, issue or cancellation of the Group’s own equity instruments. Any difference between the carrying amount and the consideration, if reissued, is recognised in capital reserve. Share options whenever exercised, would be satisfied with treasury shares.
V. Critical accounting judgments and estimation uncertainty
The preparation of financial statements in conformity with IFRS requires management to make judgments, estimates and assumptions, that affect the application of accounting policies and the reported amounts of assets, liabilities, income, expenses and disclosures of contingent assets and liabilities at the date of these consolidated financial statements and the reported amounts of revenues and expenses for the years presented. Actual results may differ from these estimates under different assumptions and conditions.
Estimates and underlying assumptions are reviewed on an ongoing basis. Revisions to accounting estimates are recognised in the period in which the estimate is revised and future periods affected.
In particular, information about significant areas of estimation uncertainty and critical judgments in applying accounting policies that have the most significant effect on the amounts recognized in the financial statements are included in the following accounting policies and/or notes:
Significant estimates
| i. |
Oil and gas reserves are estimated on a proved and probable entitlement interest basis. Proven and probable reserves are estimated using standard recognised evaluation techniques. The estimate is reviewed at each financial year end. Future development costs are estimated taking into account the level of development required to produce the reserves by reference to operators, where applicable, and internal engineers. Net entitlement reserves estimates are subsequently calculated using the Group’s current oil price and cost recovery assumptions, in line with the relevant agreements. Changes in reserves as a result of factors such as production cost, recovery rates, grade of reserves or commodity prices could impact the depreciation rates, carrying value of assets and environmental and restoration provisions.
Details of impairment and depreciation are disclosed in note 8.
| ii. | Useful economic lives and impairment of assets |
The carrying value ofProperty, plant and equipment other than mining propertyproperties, oil and gas properties, and leases is arrivedare depreciated over their useful economic lives. Management reviews the useful economic lives at by depreciatingleast once a year and any changes could affect the assets overdepreciation rates prospectively and hence the life of the mine using the unit of production method based on provedasset carrying values. The Group also reviews its property, plant and probable reserves. The estimate of reserves is subject to assumptions relating to life of the mine and may change when new information becomes available. Changes in reserves as a result of factors such as production cost, recovery rates, grade of reserves or commodity prices could thus impact the carrying values ofequipment, including mining properties and leases, and environmental and restoration provisions.
Detailsfor possible impairment if there are events or changes in circumstances that indicate that carrying values of impairment charge are disclosed in note 8(a).the assets may not be recoverable.
In assessing the property, plant and equipment for impairment, factors leading to significant reduction in profits such as changes in commodity prices, the Group’s business plans and changes in regulatory environment are taken into consideration. The carrying value of the assets of a cash generating unit (CGU) is compared with the recoverable amount of those assets, that is, the higher of fair value less costs of disposal and value in use. Recoverable value is based on the management estimates of commodity prices, market demand and supply, economic and regulatory climates, long-term plan, discount rates and other factors. Any subsequent changes to cash flow due to changes in the abovementioned factors could impact the carrying value of the assets.
| iii. | Carrying value of exploration and evaluation fixed assets: |
Where a project is sufficiently advanced the recoverability of IFRS 6 Exploration assets are assessed by comparing the carrying value to higher of fair value less cost of disposal or value in use. Exploration assets are inherently judgemental to value and further details on the accounting policy are included in accounting notepolicy above. The amounts for exploration and evaluation assets represent active exploration projects. These amounts are written off to the consolidated statement of profit or loss as exploration costs unless commercial reserves are established or the determination process is not completed and there are no indicators of impairment. The outcome of ongoing exploration, and therefore whether the carrying value of exploration and evaluation assets will ultimately be recovered, is inherently uncertain.
Details of impairment charge and the assumptions used are disclosed in note 8(a).8.
| iv. | Carrying value of developing / producing oil and gas assets: |
Management perform impairment tests on the Group’s developing / producing oil and gas assets where indicators of impairment are identified in accordance with IAS 36.
The impairment assessments are based on a range of estimates and assumptions, including:
Estimates/assumptions | Basis | |
| Future production | proved and probable reserves, resource estimates and, in certain cases, expansion projects | |
| Commodity prices | management’s best estimate benchmarked with external sources of information, to ensure they are within the range of available analyst forecast | |
| Discount to price | management’s best estimate based on historic prevailing discount | |
| Discount rates | cost of capital risk-adjusted for the risk specific to the asset/ CGU | |
| Extension of PSC | assumed that PSC (“Production Sharing Contract”) for Rajasthan block would be extended until 2030 on the |
Other key assumptions in the impairment models based on management expectations are that government approval will be received for new projects and projects will be successfully implemented as planned.
Any subsequent changes to cash flows due to changes in the above mentioned factors could impact the carrying value of the assets.
Details of impairment charge and the assumptions used are disclosed in note 8(a).8.
| v. | Mining properties and leases |
The carrying value of mining property and leases is arrived at by depreciating the assets over the life of the mine using the unit of production method based on proved and probable reserves. The estimate of reserves is subject to assumptions relating to life of the mine and may change when new information becomes available. Changes in reserves as a result of factors such as production cost, recovery rates, grade of reserves or commodity prices could thus impact the carrying values of mining properties and leases and environmental and restoration provisions.
Management performs impairment tests when there is an indication of impairment. The impairment assessments are based on a range of estimates and assumptions, including:
Estimates/assumptions | Basis | |
| Future production | proved and probable reserves, resource estimates (with an appropriate conversion factor) considering the expected permitted mining volumes and, in certain cases, expansion projects | |
| Commodity prices | management’s best estimate benchmarked with external sources of information, to ensure they are within the range of available analyst forecast | |
| Exchange rates | management best estimate benchmarked with external sources of information | |
| Discount rates | cost of capital risk-adjusted for the risk specific to the asset/ CGU |
Details of impairment charge are disclosed in note 8(a).8.
| vi. | Assessment of impairment at Lanjigarh refinery: |
During the year, theThe Group has received the necessary approvals for expansion of the Lanjigarh refinery to 4 million tonnes per annum (MTPA). in FY 2016. Approval for expansion from 4 MTPA to 6 MTPA is dependent upon certain conditions.
Accordingly, second stream operation has commenced in Alumina refinery from April 2016, thus taking it to the debottlenecked capacity of 1.7 - 2.0 MTPA (contingent on bauxite quality). Further ramp up to 4 MTPA will be considered after tying up the local bauxite sources. The Group has considered the delay in tying up local bauxite sources as an indication of impairment. Hence, the Group has reviewed the carrying value of its property, plant and equipments at Lanjigarh as at balance sheet date, estimated the recoverable amounts of these assets and concluded that there was no impairment because the recoverable amount (estimated based on fair value less cost of disposal) exceeded the carrying amounts.
The key assumptions and estimates used in determining the fair value less cost of disposal of these assets were:
Management expects that the mining approvals for various local bauxite mines will be received. Additionally the Group carries out impairment assessment for carrying value of these assets, every half year and challenges these assumptions.
The Group has carried out a sensitivity analysis on the key variables including delay in obtaining bauxite mining approval, appreciationdepreciation of rupee against US dollar, discount rate and London Metal Exchange aluminium prices. The most significant variable is the estimated timeframe for obtaining regulatory approval for the mining and/or gaining access to local bauxite. The sensitivity analysis indicates that even if regulatory approvals for mines /access to local bauxite are delayed by a year, the recoverable amount is still expected to exceed the carrying value and costs.
The carrying amounts of property plant and equipment related to alumina refinery operations at Lanjigarh and related mining assets as at March 31, 2016 is Rs. 69,150 million ($ 1,043.8 million) and March 31, 20152017 is Rs. 70,615 million.69,277 million ($ 1,068.3 million).
| vii. | Assessment of impairment of Karnataka and Goa Iron ore mines: |
Karnataka mining
The mining ban in Karnataka was lifted on April 17, 2013 and the mining operations resumed with effect from December 28, 2013 but had to again suspend operations from July 31, 2014 due to the expiry of temporary working permission. Subsequent thereto, on execution of Mining Lease Deed and Mining Lease Renewal Agreement, the Company resumed mining operations in Karnataka on February 28, 2015. Currently the permissible extraction capacity is fixed at 2.29 MTPA which is based on lowest of Reserves and Resources (R & R) capacity, Dumping capacity and Road capacity as assessed by Indian Council of Forestry Research and Education. Subsequently, based on reassessment of R & R and other factors, the modified mining plan has been submitted to Indian Bureau of Mines in March 2016.2016 for enhancement of production to 6 MTPA. Management has estimated the recoverable amounts of these assets considering the increase in the extraction capacity in FY 2017.2018.
A delay of one year in increase in the allocated capacity would result in reduction in the recoverable amount by approximately 1%, however the recoverable amount would continue to be sufficiently in excess of the carrying value.
The carrying value of assets as at March 31, 2016 is Rs. 9,656 million ($ 145.8 million) and March 31, 20152017 is Rs. 10,521 million.9,090 million ($ 140.2 million).
Goa mining
In the year2014-15, the Ministry of Environment and Forest had withdrawn its earlier order which had kept the environment clearances for iron ore mines in Goa in abeyance. Also the State Government of Goa issued a mining leases policy and had revoked the order of temporary suspension on Iron ore mining in Goa. The Group had been allocated an interim annual mining capacity of 6.9 million tonnes per annum (MTPA) (out of the total interim mining cap of 20 MTPA for FY 2016)2017) of saleable ore.
During the year, theThe Expert Committee, constituted by the Supreme Court of India for conducting the Macro-Environmental Impact Assessment study on the ceiling of annual extraction of iron ore mining in Goa has recommended an enhancement of mining cap to 30 MTPA. Further, the Expert Committee has also recommended that after reviewing the macro Environment Impact Assessment of the enhanced extraction rate by the State and augmenting the carrying capacity, the same may be further enhanced to 37 MTPA. The report of the Expert Committee is pending for consideration of Supreme Court. Post the Supreme Court clearance, the State Government will allocate the limits. It has been assumed that the allocation will be made based on the proportionate share of the current EC limits. Also during the year, the State Government of Goa allocated to the Group, an additional share of mining limit of 3.50 MTPA (adhoc limit and valid upto March 31, 2016) from non-operative mining limits.
The mining operations resumed in October, 2015. Management has estimated the recoverable amounts of these assets considering the mining cap in FY 20172018 of 30 MTPA and 37 MTPA from FY 20182019 and onwards.
A delay of one year in increase in the mining cap to 30 MTPA and 37 MTPA would result in a reduction in the recoverable amount by approximately 4%, however the recoverable amount would continue to be sufficiently in excess of the carrying value. The carrying value of assets as at March 31, 2016 is Rs. 41,968 million ($ 633.5 million) and March 31, 20152017 is Rs. 45,029 million.41,185 million ($ 635.1 million).
Management has reviewed the carrying value of Karnataka and Goa mining assets as at the balance sheet date, estimated the recoverable amounts of these assets and concluded that there was no impairment as the recoverable amount (estimated based on higher of value in use and fair value less costs of disposal) exceeded the carrying amounts.
The Group has carried out a sensitivity analysis on key variables including delay in increase in the mining cap, movement in iron ore prices, discount rate and appreciation of rupee against US dollar. Based on the sensitivity analysis, the recoverable amount is still expected to exceed the carrying value.
| viii. |
The Project in Liberia is at exploratory stage and considering the low iron ore prices and volatility, geo- political factors and no immediate plans for any substantive expenditure, the Group has impaired these assets fully. Details of impairment charge are disclosed in note 8(a).
Provision is made for costs associated with restoration and rehabilitation of mining sites as soon as the obligation to incur such costs arises. Such restoration and closure costs are typical of extractive industries and they are normally incurred at the end of the life of the mine or oil fields. The costs are estimated on the basis of mine closure plans and the estimated discounted costs of dismantling and removing these facilities and the costs of restoration are capitalised when incurred reflecting the Group’s obligations at that time.
The provision for decommissioning oil and gas assets is based on the current estimate of the costs for removing and decommissioning producing facilities, the forecast timing of settlement of decommissioning liabilities and the appropriate discount rate.
A corresponding provision is created on the liability side. The capitalisedcapitalized asset is charged to the consolidated statements of profit or loss over the life of the operation through the depreciation of the asset and the provision is increased each period via unwinding the discount on the provision. Management estimates are based on local legislation and/or other agreements. The actual costs and cash outflows may differ from estimates because of changes in laws and regulations, changes in prices, analysis of site conditions and changes in restoration technology. Details of such provisions are set out in Note 20.
The Group had exercised its call option to acquire the remaining 49% interest in BALCO and 29.5% interest in HZL. The Government of India has significant capital commitmentshowever, contested the validity of the options and disputed their valuation performed in relation to various capital projectsterms of the relevant agreements the details of which are not recognizedset out in note 28. In view of the lack of resolution on the consolidated statementsoptions, thenon-response to the exercise and valuation request from the Government of India, the resultant uncertainty surrounding the potential transaction and the valuation of the consideration payable, the Group considers the strike price of the options to be at fair value, accordingly, the value of the option would be nil, and hence, the call options have not been recognized in the financial position. statements.
Significant judgments
| a | Revenue recognition and receivable recovery in relation to the power division |
In certain cases, the Group’s power customers are disputing various contractual provisions of Power Purchase Agreements (PPA). Significant judgment is required in both assessing the tariff to be charged under the PPA in accordance with IAS 18 and to assess the recoverability of revenues is probable.
In assessing this critical judgment management considered favorable external legal opinions and the strengths of its arguments in each of the matters. In addition the fact that the contracts are with government owned companies implies the credit risk is low. (Refer note 11 for details).
| b | Contingencies: |
In the normal course of business, contingent liabilities may arise from litigation, taxation and other claims against the Group. GuaranteesA tax provision is recognised when the group has a present obligation as a result of a past event, it is probable that the group will be required to settle that obligation. Where it is management’s assessment that the outcome is uncertain, the claims are also provided in the normal course of business. There are certain obligations which management has concluded, based on all available facts and circumstances, are not probable of payment or are very difficult to quantify reliably, and such obligations are treateddisclosed as contingent liabilities andunless the likelihood of an adverse outcome is remote. Such liabilities are disclosed in the notes but are not reflected as liabilitiesprovided for in the financial statements. A contingent liability also arises in extremely rare cases where there is liability that cannot be recognized because it cannot be measured reliably the Group does not recognize the contingent liability but discloses its existence in the consolidated financial statements.
When considering the classification of a legal or tax cases are probable, possible or remote there is judgement involved. This pertains to the application of the legislation, which in certain cases is based upon management’s interpretation of country specific tax law, in particular India, and the likelihood of settlement. Management usesin-house and external legal professionals to make informed decision.
Although there can be no assurance regarding the final outcome of the legal proceedings, in which the Group is involved, it isdoes not expected that such contingencies willexpect them to have a material effectmateriality adverse impact on itsthe Group’s financial position or profitability. The liabilities which are assessed as possible and hence are not recognised in these financial statements as disclosed in note 29.
In preparing consolidated financial statements,The Group has ascertained that the Group recognises income taxes in eachPower Purchase Agreement (PPA) entered into between one of the jurisdictionsSubsidiaries and a State Grid qualifies to be an operating lease under IAS 17 “Leases”. Accordingly, the consideration receivable under the PPA relating to recovery of capacity charges towards capital cost have been recognised as operating lease rentals and in which it operates. There are many transactionsrespect of variable cost that includes fuel costs, operations and calculations for whichmaintenance etc. is considered as revenue from sale of products/services.
Significant judgement is required in segregating the ultimate tax determination is uncertain.capacity charges due from State Grid, between fixed and contingent payments. The Group recognises liabilities for anticipated tax issueshas determined that since the capacity charges under the PPA are based on estimatesthe number of whether additional taxes willunits of electricity made available by its Subsidiary which would be due. The uncertain tax positionssubject to variation on account of various factors like availability of coal and water for the plant, there are measured atno fixed minimum payments under the amount expectedPPA, which requires it to be paid to taxation authorities when the group determines that the probable outflow of economic resources will occur. Where the final tax outcome of these matters is different from the amounts that were initially recorded, such differences will impact the current and deferred income tax assets and liabilitiesaccounted for on a straight line basis. The contingent rents recognized are disclosed in the period in which such determination is made.note 29 C (ii).
U.X. Recently issued accounting pronouncements:
AtThe following Standards have been issued but are not yet effective up to the date of authorisation of these financial statements, the following Standards and Interpretations which have not been applied in thesestatements:
Amendments resulting from Annual Improvements 2014-2016 Cycle: The amendments are effective for annual periods beginning on or after 1 January 2018, although entities are permitted to apply them earlier.
IAS 7 Statement of Cash Flows: Narrow-scope amendments: The amendments introduce an additional disclosure that will enable users of financial statements wereto evaluate changes in issue butliabilities arising from financing activities. The Group will be required to provide information on movements in gross liabilities arising from financing activities in addition to the net debt reconciliation currently provided. The amendments are effective for annual periods beginning on or after 1 January 2017, although entities are permitted to apply them earlier.
Amendments to IAS 12: Recognition of Deferred Tax Assets for Unrealised Losses.These amendments on the recognition of deferred tax assets for unrealised losses clarify how to account for deferred tax assets related to debt instruments measured at fair value. The amendments are effective for annual periods beginning on or after 1 January 2017, although entities are permitted to apply them earlier.
IFRIC 22: Foreign Currency Transactions and Advance Consideration: The Interpretation, which was issued on 8 December 2016, addresses how to determine the date of a transaction for the purpose of determining the exchange rate to use on initial recognition of an asset, expense or income (or part of it) when a relatednon-monetary asset ornon-monetary liability arising from the payment or receipt of advance consideration in a foreign currency is derecognised. The amendments are effective for annual periods beginning on or after 1 January 2018, although entities are permitted to apply them earlier.
IAS 40 Investment Property: Paragraph 57 has been amended to state that an entity shall transfer a property to, or from, investment property when, and only when, there is evidence of a change in use. A change of use occurs if property meets, or ceases to meet, the definition of investment property. A change in management’s intentions for the use of a property by itself does not yet effective:constitute evidence of a change in use. The list of evidence in paragraph 57(a) – (d) was designated asnon-exhaustive list of examples instead of the previous exhaustive list. The amendments are effective for periods beginning on or after 1 January 2018. Earlier application is permitted.
IFRS 2 Share-based Payment: Few amendments to clarify the classification and measurement of share-based payment transactions have been issued. The amendments are effective for annual periods beginning on or after 1 January 2018. Earlier application is permitted. The amendments are to be applied prospectively. However, retrospective application is allowed if this is possible without the use of hindsight.
IFRS 4 Insurance Contracts: Amendments regarding the interaction of IFRS 4 and IFRS 9 -has been issued. An entity choosing to apply the overlay approach retrospectively to qualifying financial assets does so when it first applies IFRS 9. An entity choosing to apply the deferral approach does so for annual periods beginning on or after 1 January 2018.
IFRS 9 – Financial Instruments
In July 2014, the International Accounting Standards Board issued the final version of IFRS 9, Financial Instruments. The standard reduces the complexity of the current rules on financial instruments as mandated in IAS 39. IFRS 9 has fewer classification and measurement categories as compared to IAS 39 and has eliminated the categories of held to maturity, available for sale and loans and receivables. Further it39. It eliminates the rule based requirement of segregating embedded derivatives from financial assets and tainting rules pertaining to held to maturity investments. For financial assets which are debt instruments, IFRS 9 establishes a principle based approach for classification based on cash flow characteristics of the asset and the business model in which an asset is held. For an investment in an equity instrument which is not held for trading, IFRS 9 permits an irrevocable election, on initial recognition, on an individualshare-by- share basis,to present all fair value changes from the investment in other comprehensive income.Noincome. No amount recognized in other comprehensive income on such equity investment would ever be reclassified to profit or loss. It requires the entity, which chooses to measuredesignate a liability as at fair value through profit or loss, to present the portion of the fair value change attributable to the entity’s own credit risk in the other comprehensive income. IFRS 9 replaces the ‘incurred loss model’ in IAS 39 with an ‘expected credit loss’model.loss’ model. The measurement uses a dual measurement approach, under which the loss allowance is measured as either 12 month expected credit losses or lifetime expected credit losses. The standard also introduces new presentation and disclosure requirements. The effective date for the adoption of IFRS 9 is annual periods beginning on or after 1 January 2018,though early adoption is permitted. Except for hedge accounting, retrospective application is required but providing comparative information is not compulsory. For hedge accounting, the requirements are generally applied prospectively, with some limited exceptions.
The Group has substantially completed its assessment of the effects of transition to IFRS 9. The impacts that have been identified on adopting IFRS 9 on the Group are detailed below. The Group does not expect any additional material effects being identified later in the implementation process.
IFRS 15 – Revenue from Contracts with Customers
IFRS 15 – Revenue from contracts with Customers outlines a single comprehensive model for entities to use in accounting for revenue arising from contracts with customers. The standard replaces most current revenue recognition guidance, including industry-specific guidance. The core principle of the new standard is for companies to recognize revenue to depict the transfer of goods or services to customers in amounts that reflect the consideration to which the company expects to be entitled in exchange for those goods or services. The new standard also will result in enhanced disclosures about revenue, provide guidance for transactions that were not previously addressed comprehensively including service revenues and contract modifications and improve guidance for multiple-element arrangements. The new Standard will come into effect for the annual reporting periods beginning on or after 1 January 2018 with early application permitted. The Group plans to adopt the new standard on the required effective date.
The Group has done a preliminary assessment of IFRS 15, and a more detailed analysis is required before the effects of the same on the Group’s financial statements can be assessed. The Group is in the process of laying out a detailed assessment and implementation plan for the roll out of IFRS 15. Basis our preliminary assessments the following has been noted:
IFRS 16 – Leases
IFRS 16 –16- Leases, specifies recognition, measurement and disclosure criteria for leases. The standard provides a single lessee accounting model, requiring lessees to recognise assets and liabilities for all leases unless the lease term is 12 months or less or the underlying asset has a low value. Lessors continue to classify leases as operating or finance, with IFRS 16’s approach to lessor accounting substantially unchanged from its predecessor, IAS 17. The new Standard will come into effect for the annual reporting periods beginning on or after 1 January 2019. Earlier application is permitted if IFRS 15 Revenue from Contracts with Customers has also been applied.
IFRS 14 – Regulatory Deferral Accounts
IFRS 14 – Regulatory deferral accounts was issued by IASB in January 2014 and is effective from January 1,2016. This IFRS allows an entity, whose activities are subject to rate-regulation, to continue applying most of its existing accounting policies for regulatory deferral account balances upon its first time adoption of IFRS. Existing IFRS preparers are prohibited from applying this standard. Also, an entity whose current GAAP does not allow the recognition of rate-regulated assets and liabilities, or that has not adapted such policy under its current GAAP, would not be allowed to recognize them on first time application of IFRS.
Amendments to IFRS 11: Accounting for Acquisitions of Interests in Joint Operations
Amendments to IFRS 11 – Acquisition of an interest in a joint operation requires that when an entity acquires an interest in a joint operation in which the activity of the joint operation constitutes a business, as defined in IFRS 3, it shall apply, to the extent of its share in accordance with the guidance in this standard, all of the principles on business combinations accounting in IFRS 3, and all other IFRSs in relation to business combinations. The amendments are effective for annual periods beginning on or after January 1, 2016. Earlier application is permitted but corresponding disclosures are required. The amendments apply prospectively.
Amendments to IAS 16 – Property, Plant and Equipment and IAS 38 – Intangible assets
IASB has issued Amendment to IAS 16 and IAS 38 to clarify that the use of methods based on revenue to calculate the depreciation is not appropriate. This is because such methodsreflects a pattern of generation of economic benefits that arise from the operation of the business of which an asset is part, rather than the pattern of consumption of an asset’s expected future economic benefits revenue is presumed to be inappropriate basis for measuring the consumption of the economic benefits embodied in an intangible asset. This presumption, however, can be rebutted in certain limited circumstancecs. The new standard has come into effect on January 1, 2016.
Following other standard, improvements and amendments to the standards have been issued upto the date of authorisation of these financial statements.
The Group is evaluatingcurrently in the requirementsprocess of these standards, improvements and amendments and has not yet determineddetermining the potential impact onof adopting the consolidated financial statements.above standard.
4. Revenue
| For the year ended March 31, | 2014 | 2015 | 2016 | 2016 | ||||||||||||
| (Rs. in million) | (Rs. in million) | (Rs. in million) | (US dollars in million) | |||||||||||||
Revenue, gross of excise duty | 757,915 | 769,483 | 676,801 | 10,215.9 | ||||||||||||
Less: excise duty | (32,672) | (35,904) | (37,308) | (563.2) | ||||||||||||
|
|
|
|
|
|
|
| |||||||||
Revenue, net of excise duty | 725,243 | 733,579 | 639,493 | 9,652.7 | ||||||||||||
|
|
|
|
|
|
|
| |||||||||
Sale of products, gross of excise duty Less: excise duty Sale of products, net of excise duty Sale of services Export incentives Total revenue Below table summarises revenue of the Group from its primary products for the year ended March 31, 2014, 2015 and 2016:For the year ended March 31, 2015 2016 2017 2017 (Rs. in
million) (Rs. in
million) (Rs. in
million) (US dollars
in million) 760,995 666,567 749,314 11,554.6 (35,904) (37,308) (39,462) (608.5) 725,091 629,259 709,852 10,946.1 5,012 6,731 4,792 73.9 3,476 3,503 2,563 39.5 733,579 639,493 717,207 11,059.5
| For the year ended March 31, | 2014 | 2015 | 2016 | 2016 | ||||||||||||
| (Rs. in million) | (Rs. in million) | (Rs. in million) | (US dollars in million) | |||||||||||||
Copper Cathode | 77,049 | 79,546 | 61,904 | 934.4 | ||||||||||||
Copper rods | 103,407 | 92,670 | 117,990 | 1,781.0 | ||||||||||||
Iron Ore | 56 | 2,183 | 7,431 | 112.2 | ||||||||||||
Metallurgical coke | 1,792 | 1,410 | 720 | 10.9 | ||||||||||||
Pig Iron | 14,562 | 16,068 | 14,720 | 222.2 | ||||||||||||
Zinc Metal | 122,931 | 134,228 | 121,424 | 1,832.8 | ||||||||||||
Lead Metal | 19,460 | 19,767 | 20,712 | 312.6 | ||||||||||||
Silver Metal | 16,000 | 12,867 | 15,014 | 226.6 | ||||||||||||
Zinc and Lead mined metal | 24,397 | 21,657 | 12,881 | 194.4 | ||||||||||||
Aluminium - Ingot | 44,714 | 55,320 | 46,915 | 708.2 | ||||||||||||
Aluminium - rods | 42,678 | 49,016 | 49,725 | 750.6 | ||||||||||||
Aluminium - billets | 16,856 | 17,792 | 14,160 | 213.7 | ||||||||||||
Aluminium - rolled products | 8,310 | 7,533 | 2,852 | 43.0 | ||||||||||||
Oil Gas Gold Bars Silver Bars Power Others (including export incentives) Revenue-gross of Excise Duty Less: Excise Duty Revenue-net of Excise Duty For the year ended March 31, 2014 2015 2016 2016 (Rs. in
million) (Rs. in
million) (Rs. in
million) (US dollars
in million) 185,809 145,465 84,341 1,273.1 1,295 1,480 2,218 33.5 14,502 23,183 21,271 321.1 2,685 3,263 2,660 40.2 38,395 36,863 48,901 738.1 23,017 49,172 30,962 467.3 757,915 769,483 676,801 10,215.9 (32,672) (35,904) (37,308) (563.2) 725,243 733,579 639,493 9,652.7
5. Investment and other income
| For the year ended March 31, | 2014 | 2015 | 2016 | 2016 | 2015 | 2016 | 2017 | 2017 | ||||||||||||||||||||||||
| (Rs. in million) | (Rs. in million) | (Rs. in million) | (US dollars in million) | (Rs. in million) | (Rs. in million) | (Rs. in million) | (US dollars in million) | |||||||||||||||||||||||||
Fair value gain on financial assets held for trading | 24,647 | 37,406 | 31,244 | 471.6 | 37,406 | 31,244 | 32,630 | 503.2 | ||||||||||||||||||||||||
Interest income: | ||||||||||||||||||||||||||||||||
Interest income on financial assets held for trading | 3,051 | 5,091 | 4,648 | 70.1 | 5,091 | 4,648 | 8,070 | 124.4 | ||||||||||||||||||||||||
Interest income on bank deposits | 9,783 | 3,163 | 3,199 | 48.2 | ||||||||||||||||||||||||||||
Interest income on loans and receivables | 4,241 | 4,760 | 4,465 | 67.4 | ||||||||||||||||||||||||||||
Interest income on bank deposits at amortized cost | 3,163 | 3,199 | 1,712 | 26.4 | ||||||||||||||||||||||||||||
Interest income on loans and receivables at amortized cost | 4,760 | 4,465 | 3,193 | 49.2 | ||||||||||||||||||||||||||||
Dividend income: | ||||||||||||||||||||||||||||||||
Dividend income on available for sale investments | 1 | 1 | 4 | 0.1 | 1 | 4 | 7 | 0.1 | ||||||||||||||||||||||||
Dividend income on financial assets held for trading | 54 | — | — | — | ||||||||||||||||||||||||||||
Gain on sale of financial asset investments(1) | 116 | — | — | — | ||||||||||||||||||||||||||||
Foreign exchange gain net | 285 | 750 | 461 | 7.0 | ||||||||||||||||||||||||||||
Foreign exchange gain/ (loss) net | 750 | 461 | (184) | (2.8) | ||||||||||||||||||||||||||||
Capitalisation of interest income | (13) | (17) | (23) | (0.3) | (17) | (23) | — | — | ||||||||||||||||||||||||
|
|
|
|
|
|
|
| |||||||||||||||||||||||||
| 42,165 | 51,154 | 43,998 | 664.1 | 51,154 | 43,998 | 45,428 | 700.5 | |||||||||||||||||||||||||
|
|
|
|
|
|
|
| |||||||||||||||||||||||||
Notes:
| (1) |
| Capitalisation of interest income relates to the income from temporary surplus funds, specifically borrowed to acquire/ construct qualifying assets. |
6. Finance and other costs
| For the year ended March 31, | 2014 | 2015 | 2016 | 2016 | ||||||||||||
| (Rs. in million) | (Rs. in million) | (Rs. in million) | (US dollars in million) | |||||||||||||
Interest on borrowings other than convertible notes(1) | 57,054 | 56,990 | 53,848 | 812.8 | ||||||||||||
Interest on convertible notes(1) | 5,750 | 3,605 | — | — | ||||||||||||
Unwinding of discount on provisions | 952 | 1,062 | 779 | 11.8 | ||||||||||||
Gain on fair valuation of conversion option | (61) | — | — | — | ||||||||||||
Net foreign exchange loss on foreign currency borrowings | 16,141 | 8,404 | 4,708 | 71.1 | ||||||||||||
Bank charges | 1,424 | 1,746 | 1,126 | 17.0 | ||||||||||||
Other | 1,081 | 1,496 | 5,051 | 76.2 | ||||||||||||
Capitalisation of finance costs(2) | (9,520) | (9,905) | (5,928) | (89.5) | ||||||||||||
|
|
|
|
|
|
|
| |||||||||
| 72,821 | 63,398 | 59,584 | 899.4 | |||||||||||||
|
|
|
|
|
|
|
| |||||||||
Interest cost: Interest on borrowings other than convertible notes(1) Interest on convertible notes(1) Unwinding of discount on provisions Net foreign exchange loss on foreign currency borrowings Bank charges Others Capitalisation of finance costs(2) For the year ended March 31, 2015 2016 2017 2017 (Rs. in
million) (Rs. in
million) (Rs. in
million) (US dollars
in million) 56,990 53,848 55,100 849.7 3,605 — — — 1,062 779 844 13.0 8,404 4,708 2,321 35.8 1,746 1,126 700 10.8 1,496 5,051 9,325 143.7 (9,905) (5,928) (6,690) (103.2) 63,398 59,584 61,600 949.8
Notes:
| (1) |
| (2) | Capitalisation of borrowing costs relates to funds borrowed both specifically and generally to acquire/ construct qualifying assets. The capitalisation rate relating to general borrowings was approximately |
7. Income tax expense
Overview of the Indian direct tax regime
Indian companies are subject to Indian income tax on a standalone basis. Each entity is assessed for tax on taxable profits determined for each fiscal year beginning on April 1 and ending on March 31. For each fiscal year, the respective entities’ profit or loss is subject to the higher of the regular income tax payable or the minimum alternative tax (“MAT”).
Statutory income taxes are assessed based on book profits prepared under generally accepted accounting principles in India (“Indian GAAP”) adjusted in accordance with the provisions of the (Indian) Income tax Act, 1961. Such adjustments generally relate to depreciation of fixed assets, disallowances of certain provisions and accruals, deduction for tax holidays and similar exemptions, the use of tax losses carried forward and retirement benefit costs. Statutory income tax is charged at 30% plus a surcharge and education cess. The combined Indian statutory tax rate for the fiscal year 2013-142014-15 was 33.99%, for the fiscal year 2014-152015-16 was 33.99%34.61%, for the fiscal year 2015-162016-17 was 34.61% and for the fiscal year 2016-172017-18 will be 34.61%.
MAT is assessed on book profits adjusted for certain limited items as compared to the adjustments allowed for assessing regular income tax under normal provisions. MAT for the fiscal year 2014-152015-16 and 2015-162016-17 was chargeable at 18.50% plus a surcharge and education cess. The combined Indian statutory tax rate of MAT for the fiscal year 2014-152015-16 and 2015-162016-17 was 20.96% and 21.34% and for the fiscal year 2016-172017-18 will be 21.34%. MAT paid in excess of regular income tax during a year can be set off against regular income taxes within a period of tenfifteen years succeeding the assessment year in which MAT credit arises subject to the limits prescribed.
Business losses in India can be carried forward for a maximum period of eight assessment years immediately succeeding the assessment year to which the loss pertains. Unabsorbed depreciation can be carried forward for an indefinite period.
Losses arising out of transfer of capital assets in India can be carried forward for a maximum period of eight assessment years immediately succeeding the assessment year to which the loss pertains. The carried forward long term capital losses can beset-off only against long term capital gains. Short term capital losses can be set off only against capital gains (which can be either long term or short term capital gain).
Income tax returns submitted by companies are regularly subjected to a comprehensive review and challenge by the tax authorities. There are appellate procedures available to both the tax authorities and taxpayers and it is not uncommon for significant or complex matters in dispute to remain outstanding for several years before they are finally resolved by the High Court or the Supreme Court.
There are various tax exemptions or tax holidays available to companies in India. The most important to the Companies in the Group are:
The location based exemption
Profits of newly constructed industrial entities located in designated areas at India can benefit from a tax holiday. Such a tax holiday works to exempt 100% of the profits for the first five years from the commencement of the tax holiday, and 30% of profits for the subsequent five years. This deduction is available only for units established up to 31 March 2012. However, such entity would continue to be subject to the Minimum Alternative tax (‘MAT’).
The Group has such types of undertakings at Haridwar and Pantnagar, which are part of Hindustan Zinc Limited (Zinc India). In the current year, Haridwar and Pantnagar units are eligible for deduction at 30% and 100% of taxable profits respectively. For the next financial year, both would be eligible for deduction at 30% of taxable profits.
Sectoral Benefit - Power Plants and Port Operations
Profits on newly constructed power plants and port operations are eligible for a tax holiday, provided certain conditions are met, tax incentives exist to exempt 100% of profits and gains for any ten consecutive years within the 15 year period following commencement of the power plant’s operation.
The Group currently has total operational capacity of 8.49.0 Giga Watt of power generation facilities including wind power capacity of 274 MW. However, such entities generating power would continue to be subject to the MAT provisions.
The Group has power plants which benefit from such deductions, at various locations of Hindustan Zinc Limited (where such benefits has been drawn), Talwandi Sabo Power Limited, Vedanta Limited and Bharat Aluminium Company Limited (where no benefit has been drawn) and port facilities at Vizag General Cargo Berth Limited (where no benefits has been drawn).
Sectoral Benefit-OilBenefit- Oil & Gas
Provided certain conditions are met, profits of newly constructed industrial undertakings engaged in the oil and gas sector may benefit from a deduction of 100% of the profits of the undertaking for a period of seven consecutive years. This deduction is only available to blocks licensed prior to 31 March 2011. However, such entities would continue to be subject to the MAT provisions.
In the Group, erstwhile Cairn India Limited (now merged with Vedanta Limited) and Cairn energy Hydrocarbons Limited benefits from such deductions. CurrentPrevious year iswas the last year for claiming such benefit.
The total effect of such tax holidays were Rs. 13,793 million (impact on basic EPS Rs. 4.65), Rs. 20,176 million (impact on basic EPS Rs. 6.80), and Rs. 14,755 million ($ 227.5 million) (impact on basic EPS Rs. 4.98) ($ 0.08) for the years ended March 31, 2015, 2016 and 2017 respectively.
Investment Allowance u/s.32 AC of the Income Tax Act - Incentive for acquisition and installation of new high value Plant or Machinery to manufacturing companies by providing an additional deduction of 15% of the actual cost of Plant or Machinery acquired and installed between April 1, 2013 and March 31, 2015.during the year. The actual cost of the new Plant or Machinery should exceed Rs.1,000Rs 250 million to be eligible for this deduction. The Finance (No. 2) Act 2014, has extended this allowance till March 2017, while reducing the threshold cost of Plant or Machinery for claiming deduction under section 32 AC is available up to Rs. 250 million.
The total effect of such tax holidays were Rs.39,816 million (impact on basic EPS Rs. 13.43), Rs. 13,793 million (impact on basic EPS Rs. 4.65), and Rs. 20,176 million ($ 304.5 million) (impact on basic EPS Rs. 6.80) ($ 0.10) for the years endedfinancial year March 31, 2014, 2015 and 2016 respectively.
Business losses in India can be carried forward for a maximum period of eight assessment years immediately succeeding the assessment year to which the loss pertains. Unabsorbed depreciation can be carried forward for an indefinite period.
Losses arising out of transfer of capital assets in India can be carried forward for a maximum period of eight assessment years immediately succeeding the assessment year to which the loss pertains. The carried forward long term capital losses can be set-off only against long term capital gains. Short term capital losses can be set off only against capital gains (which can be either long term or short term capital gain).2017.
The major components of income tax expense for the year ended March 31, 2014, 2015, 2016 and 20162017 are indicated below:
(a) Consolidated statements of profit or loss
| For the year ended March 31, | 2014 | 2015 | 2016 | 2016 | ||||||||||||
| (Rs. in million) | (Rs. in million) | (Rs. in million) | (US dollars in million) | |||||||||||||
Current tax: | ||||||||||||||||
Current tax on profit for the year | 35,327 | 35,896 | 36,681 | 553.7 | ||||||||||||
Charge / (credit) in respect of current tax for earlier years | 12,404 | 29 | (1,660) | (25.1) | ||||||||||||
|
|
|
|
|
|
|
| |||||||||
Total current tax | 47,731 | 35,925 | 35,021 | 528.6 | ||||||||||||
|
|
|
|
|
|
|
| |||||||||
Deferred tax: | ||||||||||||||||
Origination and reversal of temporary differences | (2,179) | (145,333) | (139,104) | (2,099.8) | ||||||||||||
Charge in respect of Deferred tax for earlier years | — | 1,088 | 19 | 0.3 | ||||||||||||
Increase in tax rate | (10,906) | — | 1,004 | 15.2 | ||||||||||||
|
|
|
|
|
|
|
| |||||||||
Total deferred tax | (13,085) | (144,245) | (138,081) | (2,084.3) | ||||||||||||
|
|
|
|
|
|
|
| |||||||||
Tax expense / (benefit) for the year | 34,646 | (108,320) | (103,060) | (1,555.7) | ||||||||||||
Effective income tax rate (%) | 35.8% | 34.8% | 36.2% | 36.2% | ||||||||||||
Current tax: Current tax on profit for the year Charge / (credit) in respect of current tax for earlier years Total current tax Deferred tax: Origination and reversal of temporary differences Charge in respect of Deferred tax for earlier years Increase in tax rate Total deferred tax Total Income Tax (Benefit) / expense for the year Effective income tax rate (%)For the year ended March 31, 2015 2016 2017 2017 (Rs. in
million) (Rs. in
million) (Rs. in
million) (US dollars
in million) 35,896 36,681 39,520 609.4 29 (1,660) (87) (1.3) 35,925 35,021 39,433 608.1 (145,333) (139,104) (690) (10.6) 1,088 19 (716) (11.1) — 1,004 — — (144,245) (138,081) (1,406) (21.7) (108,320) (103,060) 38,027 586.4 34.8% 36.2% 27.8% 27.8%
(b) Consolidated statements of comprehensive income
| For the year ended March 31, | 2014 | 2015 | 2016 | 2016 | 2015 | 2016 | 2017 | 2017 | ||||||||||||||||||||||||
| (Rs. in million) | (Rs. in million) | (Rs. in million) | (US dollars in million) | (Rs. in million) | (Rs. in million) | (Rs. in million) | (US dollars in million) | |||||||||||||||||||||||||
Deferred tax (credit) / charge on: | ||||||||||||||||||||||||||||||||
- cash flow hedges | 332 | (59) | 185 | 2.8 | (59) | 185 | 383 | 5.9 | ||||||||||||||||||||||||
- reclassification adjustments on cash flow hedges | (110) | (332) | (101) | (1.5) | (332) | (101) | (284) | (4.4) | ||||||||||||||||||||||||
- remeasurement of defined benefit obligation | — | (260) | (47) | (0.7) | (260) | (47) | (40) | (0.6) | ||||||||||||||||||||||||
- Exchange differences on translation of foreign operations | — | — | (61) | (0.9) | ||||||||||||||||||||||||||||
|
|
|
|
|
|
|
| |||||||||||||||||||||||||
| 222 | (651) | 37 | 0.6 | (651) | 37 | (2) | 0.0 | |||||||||||||||||||||||||
|
|
|
|
|
|
|
| |||||||||||||||||||||||||
A reconciliation of income tax expense applicable to accounting profit / (loss) before tax at the statutory income tax rate to recognised income tax expense for the year indicated are as follows:
| For the year ended March 31, | 2014 | 2015 | 2016 | 2016 | 2015 | 2016 | 2017 | 2017 | ||||||||||||||||||||||||
| (Rs. in million) | (Rs. in million) | (Rs. in million) | (US dollars in million) | (Rs. in million) | (Rs. in million) | (Rs. in million) | (US dollars in million) | |||||||||||||||||||||||||
Accounting profit / (loss) before tax | 96,872 | (311,459) | (284,408) | (4,293.0) | (311,459) | (284,408) | 136,572 | 2,106.0 | ||||||||||||||||||||||||
Statutory income tax rate | 33.99% | 33.99% | 34.61% | 34.61% | ||||||||||||||||||||||||||||
Indian Statutory income tax rate | 33.99% | 34.61% | 34.61% | 34.61% | ||||||||||||||||||||||||||||
Tax at Indian statutory income tax rate | 32,927 | (105,865) | (98,428) | (1,485.7) | (105,865) | (98,428) | 47,265 | 728.8 | ||||||||||||||||||||||||
Disallowable expenses | 221 | 711 | 970 | 14.6 | 711 | 970 | 1,198 | 18.5 | ||||||||||||||||||||||||
Non-taxable income | (3,662) | (5,024) | (12,249) | (184.9) | (5,024) | (12,249) | (10,344) | (159.5) | ||||||||||||||||||||||||
Tax holidays and similar exemptions | (39,816) | (13,793) | (20,176) | (304.5) | (13,793) | (20,176) | (14,755) | (227.5) | ||||||||||||||||||||||||
| Change in deferred tax balances due to the change in Indian income tax rates from 32.45% to 33.99% for 2014 and 33.99% to 34.61% for 2016 | 10,906 | — | 1,004 | 15.2 | ||||||||||||||||||||||||||||
Impact of changes in tax rate | — | 1,004 | — | — | ||||||||||||||||||||||||||||
| Effect of tax rates differences of subsidiaries operating in other jurisdictions | 6,875 | 7,682 | 4,951 | 74.7 | 7,682 | 4,951 | (2,515) | (38.8) | ||||||||||||||||||||||||
Dividend distribution tax | 4,222 | 4,133 | 16,235 | 245.1 | 4,133 | 16,235 | 16,418 | 253.2 | ||||||||||||||||||||||||
Unrecognised MAT credit | 36 | — | — | — | ||||||||||||||||||||||||||||
Charge/(credit) in respect of previous years | 12,404 | 1,117 | (1,641) | (24.8) | 1,117 | (1,641) | (803) | (12.4) | ||||||||||||||||||||||||
Utilisation of tax losses | (4,777) | (3,913) | (152) | (2.3) | ||||||||||||||||||||||||||||
| Loss in respect of which deferred tax assets not recognized due to uncertainty | 16,437 | 5,292 | 7,570 | 114.3 | ||||||||||||||||||||||||||||
Utilisation of Tax Losses | (3,913) | (152) | (1,441) | (22.2) | ||||||||||||||||||||||||||||
Unrecognised Tax Losses | 5,292 | 7,570 | 5,933 | 91.5 | ||||||||||||||||||||||||||||
Capital Loss lapsed on account of Merger (Refer note 1) | — | — | 3,411 | 52.6 | ||||||||||||||||||||||||||||
Others | (1,127) | 1,340 | (1,144) | (17.4) | 1,340 | (1,144) | (6,340) | (97.8) | ||||||||||||||||||||||||
|
|
|
|
|
|
|
| |||||||||||||||||||||||||
| 34,646 | (108,320) | (103,060) | (1,555.7) | (108,320) | (103,060) | 38,027 | 586.4 | |||||||||||||||||||||||||
|
|
|
|
|
|
|
| |||||||||||||||||||||||||
There are certainincome-tax related legal proceedings which are pending against the Group. Potential liabilities, if any have been adequately provided for, and the Group does not currently estimate any probable material incremental tax liabilities in respect of these matters.
Deferred tax assets/liabilities
The Group has recognised significant amounts of deferred tax. The majority of the deferred tax liabilities represent accelerated tax relief for the depreciation of property plant and equipment and the depreciation on mining reserves. Significant components of deferred tax assets/liabilities recognized in the consolidated statements of financial position are as follows:
| For the year ended March 31, 2014: | ||||||||||||||||||||||||||||||||||||||||||||
| For the year ended March 31, 2015: | ||||||||||||||||||||||||||||||||||||||||||||
| Opening balance as at April 1, 2013 | Charged/ (credited) to Statement of profit or loss | Charged/ (credited) to equity | Exchange difference transferred to translation of foreign operation | Total as at March 31, 2014 | Opening balance as at April 1, 2014 | Charged/ (credited) to Statement of profit or loss | Charged/ (credited) to OCI | Charged/ (credited) to equity | Exchange difference transferred to translation of foreign operation | Total as at March 31, 2015 | ||||||||||||||||||||||||||||||||||
Significant components of deferred tax liabilities/(assets) | (Rs. in million) | (Rs. in million) | (Rs. in million) | (Rs. in million) | (Rs. in million) | (Rs. in million) | (Rs. in million) | (Rs. in million) | (Rs. in million) | (Rs. in million) | (Rs. in million) | |||||||||||||||||||||||||||||||||
| Property, plant and equipment, Exploration and Evaluation and other intangible assets | 291,737 | 23,286 | — | 23,187 | 338,210 | 338,210 | (123,455) | — | — | 7,361 | 222,116 | |||||||||||||||||||||||||||||||||
Unabsorbed depreciation/business loss | (26,113) | (4,576) | — | 160 | (30,529) | (30,529) | 855 | — | — | 6 | (29,668) | |||||||||||||||||||||||||||||||||
Voluntary retirement scheme | (380) | (65) | 11 | 7 | (427) | (427) | (267) | — | — | — | (694) | |||||||||||||||||||||||||||||||||
Employee benefits | (578) | 89 | — | 3 | (486) | (486) | 291 | (260) | — | 11 | (444) | |||||||||||||||||||||||||||||||||
Fair value of derivative assets/ liabilities | 868 | (194) | 211 | — | 885 | 885 | (1,018) | (391) | — | — | (524) | |||||||||||||||||||||||||||||||||
Fair valuation of other assets/liabilities | 1,564 | 2,118 | — | — | 3,682 | 3,682 | 5,955 | — | — | 25 | 9,662 | |||||||||||||||||||||||||||||||||
MAT credits entitlement | (61,054) | (33,502) | — | (212) | (94,768) | (94,768) | (24,065) | — | — | — | (118,833) | |||||||||||||||||||||||||||||||||
Other temporary differences | 415 | (241) | — | 46 | 220 | 220 | (2,541) | — | — | 31 | (2,290) | |||||||||||||||||||||||||||||||||
|
|
|
|
|
|
|
|
|
|
| ||||||||||||||||||||||||||||||||||
Total | 206,459 | (13,085) | 222 | 23,191 | 216,787 | 216,787 | (144,245) | (651) | — | 7,434 | 79,325 | |||||||||||||||||||||||||||||||||
Significant components of deferred tax liabilities/(assets) Unabsorbed depreciation/business loss Voluntary retirement scheme Employee benefits Fair value of derivative assets/ liabilities Fair valuation of other assets/liabilities MAT credits entitlement Other temporary differences TotalFor the year ended March 31, 2016: Opening
balance as
at April 1,
2015 Charged/
(credited) to
Statement
of profit or
loss Charged/
(credited) to
OCI Charged/
(credited) to
equity Exchange
difference
transferred to
translation of
foreign
operation Total as at
March 31,
2016 (Rs. in
million) (Rs. in
million) (Rs. in
million) (Rs. in
million) (Rs. in
million) (Rs. in
million) Property, plant and equipment, Exploration and Evaluation and other intangible assets 222,116 (117,353) — — 6,370 111,133 (29,668) (8,011) — — — (37,679) (694) (197) — — — (891) (444) 125 (47) — 22 (344) (524) 320 84 — — (120) 9,662 (168) — — 48 9,542 (118,833) (11,673) — — — (130,506) (2,290) (1,124) — — 10 (3,404) 79,325 (138,081) 37 — 6,450 (52,269)
| For the year ended March 31, 2015: | ||||||||||||||||||||
| Opening balance as at April 1, 2014 | Charged/ (credited) to Statement of profit or loss | Charged/ (credited) to equity | Exchange difference transferred to translation of foreign operation | Total as at March 31, 2015 | ||||||||||||||||
Significant components of deferred tax liabilities/(assets) | (Rs. in million) | (Rs. in million) | (Rs. in million) | (Rs. in million) | (Rs. in million) | |||||||||||||||
| Property, plant and equipment, Exploration and Evaluation and other intangible assets | 338,210 | (123,455) | — | 7,361 | 222,116 | |||||||||||||||
Unabsorbed depreciation/business loss | (30,529) | 855 | — | 6 | (29,668) | |||||||||||||||
Voluntary retirement scheme | (427) | (267) | — | — | (694) | |||||||||||||||
Employee benefits | (486) | 291 | (260) | 11 | (444) | |||||||||||||||
Fair value of derivative assets/ liabilities | 885 | (1,018) | (391) | — | (524) | |||||||||||||||
Fair valuation of other assets/liabilities | 3,682 | 5,955 | — | 25 | 9,662 | |||||||||||||||
MAT credits entitlement | (94,768) | (24,065) | — | — | (118,833) | |||||||||||||||
Other temporary differences | 220 | (2,541) | — | 31 | (2,290) | |||||||||||||||
|
|
|
|
|
|
|
|
|
| |||||||||||
Total | 216,787 | (144,245) | (651) | 7,434 | 79,325 | |||||||||||||||
| For the year ended March 31, 2016: | ||||||||||||||||||||||||||||||||||||||||||||||||||||
| For the year ended March 31, 2017: | ||||||||||||||||||||||||||||||||||||||||||||||||||||
| Opening balance as at April 1, 2015 | Charged/ (credited) to Statement of profit or loss | Charged/ (credited) to equity | Exchange difference transferred to translation of foreign operation | Total as at March 31, 2016 | Total as at March 31, 2016 | Opening balance as at April 1, 2016 | Charged/ (credited) to Statement of profit or loss | Charged/ (credited) to OCI | Charged/ (credited) to equity | Exchange difference transferred to translation of foreign operation | Total as at March 31, 2017 | Total as at March 31, 2017 | ||||||||||||||||||||||||||||||||||||||||
Significant components of deferred tax liabilities/(assets) | (Rs. in million) | (Rs. in million) | (Rs. in million) | (Rs. in million) | (Rs. in million) | (US dollars in million) | (Rs. in million) | (Rs. in million) | (Rs. in million) | (Rs. in million) | (Rs. in million) | (Rs. in million) | (US dollars in million) | |||||||||||||||||||||||||||||||||||||||
| Property, plant and equipment, Exploration and Evaluation and other intangible assets | 222,116 | (117,353) | — | 6,370 | 111,133 | 1,677.5 | 111,133 | (651) | — | — | (258) | 110,224 | 1,699.7 | |||||||||||||||||||||||||||||||||||||||
Unabsorbed depreciation/business loss | (29,668) | (8,011) | — | — | (37,679) | (568.7) | (37,679) | (3,975) | — | — | — | (41,654) | (642.3) | |||||||||||||||||||||||||||||||||||||||
Voluntary retirement scheme | (694) | (197) | — | — | (891) | (13.5) | (891) | 112 | — | — | — | (779) | (12.0) | |||||||||||||||||||||||||||||||||||||||
Employee benefits | (444) | 125 | (47) | 22 | (344) | (5.2) | (344) | (58) | (40) | — | — | (442) | (6.8) | |||||||||||||||||||||||||||||||||||||||
Fair value of derivative assets/ liabilities | (524) | 320 | 84 | — | (120) | (1.8) | (120) | (317) | 99 | — | — | (338) | (5.2) | |||||||||||||||||||||||||||||||||||||||
Fair valuation of other assets/liabilities | 9,662 | (168) | — | 48 | 9,542 | 144.0 | 9,542 | (625) | — | — | 14 | 8,931 | 137.7 | |||||||||||||||||||||||||||||||||||||||
MAT credits entitlement | (118,833) | (11,673) | — | — | (130,506) | (1,970.0) | (130,506) | 6,933 | (278) | — | — | (123,851) | (1,909.8) | |||||||||||||||||||||||||||||||||||||||
Other temporary differences | (2,290) | (1,124) | — | 10 | (3,404) | (51.3) | (3,404) | (2,825) | 217 | 43 | 311 | (5,658) | (87.3) | |||||||||||||||||||||||||||||||||||||||
|
|
|
|
|
|
|
|
|
|
|
|
| ||||||||||||||||||||||||||||||||||||||||
Total | 79,325 | (138,081) | 37 | 6,450 | (52,269) | (789.0) | (52,269) | (1,406) | (2) | 43 | 67 | (53,567) | (826.0) | |||||||||||||||||||||||||||||||||||||||
Deferred tax assets and liabilities have been offset where they arise in the same legal entity and taxing jurisdiction but not otherwise.
Deferred tax assets on carry forward unused tax losses have been recognised to the extent of deferred tax liabilities on taxable temporary differences available. It is expected that any reversals of the deferred tax liability would be offset against the reversal of the deferred tax asset at respective entities. MAT credit entitlements represent taxes paid which are available for offset against future tax liabilities in the respective entities. The Group has analysed the business plans and profit projections for each of the entities where there are MAT credit entitlements and has recognized them as assets only to the extent it expects to utilize the same within the stipulated fifteen year period from origination.
Unused tax losses/ unused tax credit for which no deferred tax asset is recognized amount to Rs. 94,335143,917 million and Rs. 143,91798,831 million ($ 2,172.21,524.0 million) as at March 31, 20152016 and March 31, 20162017 respectively.
The unused tax losses as at March 31, 20162017 expire, if unutilized, based on the year of origination as follows:
Nature of unutilised tax losses/ unused tax credit | Financial year of expiry | 2016 | 2016 | |||||||
| (Rs. in million) | (US dollar in million) | |||||||||
Business losses | ||||||||||
- Skorpion | No Limit | 5,686 | 85.8 | |||||||
- VGCB | FY 2018-19 to FY 2020-21 | 88 | 1.3 | |||||||
- CMT | No Limit | 3,551 | 53.6 | |||||||
- TSPL | FY 2018-19 to FY 2021-22 | 71 | 1.1 | |||||||
- SMCL | FY 2020-21 to FY 2023-24 | 1,839 | 27.8 | |||||||
- BALCO | FY 2023-24 | 248 | 3.7 | |||||||
- TMHL | FY 2016-17 to FY 2020-21 | 65,429 | 987.6 | |||||||
- SRL | FY 2021-22 to FY 2022-23 | 1,389 | 21.0 | |||||||
- PMCB | FY 2019-20 | 8 | 0.1 | |||||||
- WCL | FY 2020-21 | 45 | 0.7 | |||||||
Depreciation losses | ||||||||||
- VGCB | No limit | 1,880 | 28.4 | |||||||
- MEL | No limit | 19,739 | 297.9 | |||||||
- TSPL | No limit | 16,562 | 250.0 | |||||||
- SMCL | No limit | 339 | 5.1 | |||||||
Long term capital losses | ||||||||||
- Vedanta Limited | FY 2018-19 to FY 2019-20 | 2,697 | 40.7 | |||||||
- HZL | FY 2018-19 to FY 2022-23 | 9,350 | 141.1 | |||||||
- Cairn | FY 2019-20 to 2023-24 | 14,907 | 225.0 | |||||||
|
|
|
| |||||||
| 143,828 | 2170.9 | |||||||||
Unused tax credit | ||||||||||
- CMT | No Limit | 89 | 1.3 | |||||||
|
|
|
| |||||||
| 143,917 | 2172.2 | |||||||||
|
|
|
| |||||||
Particulars Unutilized business losses Unabsorbed depreciation Unused R&D Tax Credit Total Within
one year
(Rs. in
million) Greater than
one year, less
than five
years
(Rs. in
million) Greater than
five years
(Rs. in
million) No expiry
date
(Rs. in
million) Total
(Rs. in
million) Total
(US Dollars
in million) 17,450 49,351 138 11,830 78,769 1,214.7 — — — 19,975 19,975 308.0 87 87 1.3 17,450 49,351 138 31,892 98,831 1,524.0
The Group had unused MAT credit amounting to Rs. 4,1933,995 million and Rs. 3,9952,960 million ($ 60.345.6 million) as at March 31, 20152016 and 20162017 respectively. Such tax credits have not been recognised on the basis that recovery is not probable in the foreseeable future. Unrecognised MAT credit expires, if unutilized, based on the year of origination as follows:
Financial year ending March 31, | (Rs. in million) | (US dollar in million) | ||||||
2017 | 1,036 | 15.6 | ||||||
2018 | 137 | 2.1 | ||||||
2019 | 520 | 7.9 | ||||||
2020 | 517 | 7.8 | ||||||
2021 | 1,035 | 15.6 | ||||||
2022 | 633 | 9.6 | ||||||
2023 | 81 | 1.2 | ||||||
2024 | 36 | 0.5 | ||||||
|
|
|
| |||||
| 3,995 | 60.3 | |||||||
Financial year ending March 31, | (Rs. in million) | (US dollar in million) | ||||||
2023 | 137 | 2.1 | ||||||
2024 | 521 | 8.0 | ||||||
2025 | 517 | 8.0 | ||||||
2026 | 1,035 | 15.9 | ||||||
2027 | 633 | 9.7 | ||||||
2028 | 81 | 1.3 | ||||||
2029 | 36 | 0.6 | ||||||
|
|
|
| |||||
| 2,960 | 45.6 | |||||||
As at March 31, 20152016 and 2016,2017, the Group has not recognised any deferred tax liabilities for taxes that would be payable on the Group’s share in unremitted earnings of certain of its subsidiaries because the Group controls when the liability will be incurred and it is probable that the liability will not be incurred in the foreseeable future. The amount of unremitted earnings was Rs. 517,814530,842 million and Rs. 530,842328,798 million ($ 8,012.75,070.1 million) as at March 31, 20152016 and 20162017 respectively.
8 (a). Property, plant and equipment –
| Mining property | Land and buildings | Plant and equipment | Motor vehicles | Office equipment and fixtures | Oil and Gas Properties | Total | Total | Mining property | Land and buildings | Plant and equipment | Motor vehicles | Office equipment and fixtures | Oil and Gas Properties | Total | Total | |||||||||||||||||||||||||||||||||||||||||||||||||
| Rs. in million | Rs. in million | Rs. in million | Rs. in million | Rs. in million | Rs. in million | Rs. in million | US dollars in million | Rs. in million | Rs. in million | Rs. in million | Rs. in million | Rs. in million | Rs. in million | Rs. in million | US dollars in million | |||||||||||||||||||||||||||||||||||||||||||||||||
| Cost | ||||||||||||||||||||||||||||||||||||||||||||||||||||||||||||||||
| April 01, 2014 | 160,001 | 70,844 | 445,872 | 2,270 | 6,777 | 495,066 | 1,180,830 | |||||||||||||||||||||||||||||||||||||||||||||||||||||||||
| Additions | 1,929 | 11,145 | 70,035 | 406 | 1,195 | 43,911 | 128,621 | |||||||||||||||||||||||||||||||||||||||||||||||||||||||||
| Transfer during the year from exploration and evaluation assets | — | — | — | — | — | 32,646 | 32,646 | |||||||||||||||||||||||||||||||||||||||||||||||||||||||||
| Disposals | (121) | (18) | (1,817) | (257) | (62) | — | (2,275) | |||||||||||||||||||||||||||||||||||||||||||||||||||||||||
| Foreign exchange | (1,552) | (386) | (2,547) | 35 | 24 | 22,325 | 17,899 | |||||||||||||||||||||||||||||||||||||||||||||||||||||||||
|
|
|
|
|
|
|
| |||||||||||||||||||||||||||||||||||||||||||||||||||||||||
| March 31, 2015 | 160,257 | 81,585 | 511,543 | 2,454 | 7,934 | 593,948 | 1,357,721 | 20,493.9 | ||||||||||||||||||||||||||||||||||||||||||||||||||||||||
|
|
|
|
|
|
|
| |||||||||||||||||||||||||||||||||||||||||||||||||||||||||
April 01, 2015 | 160,257 | 81,585 | 511,543 | 2,454 | 7,934 | 593,948 | 1,357,721 | |||||||||||||||||||||||||||||||||||||||||||||||||||||||||
| Additions | 8,630 | 23,265 | 93,414 | 163 | 445 | 8,934 | 134,851 | 2,035.5 | 8,630 | 23,265 | 93,414 | 163 | 445 | 8,934 | 134,851 | |||||||||||||||||||||||||||||||||||||||||||||||||
| Disposals | (16,424) | (7) | (3,240) | (680) | (499) | — | (20,850) | (314.7) | (16,424) | (7) | (3,240) | (680) | (499) | — | (20,850) | |||||||||||||||||||||||||||||||||||||||||||||||||
| Foreign exchange | (459) | (559) | (2,554) | 43 | 68 | 35,626 | 32,165 | 485.5 | (459) | (559) | (2,554) | 43 | 68 | 35,626 | 32,165 | |||||||||||||||||||||||||||||||||||||||||||||||||
|
|
|
|
|
|
|
|
|
|
|
|
|
|
|
| |||||||||||||||||||||||||||||||||||||||||||||||||
| March 31, 2016 | 152,004 | 104,284 | 599,163 | 1,980 | 7,948 | 638,508 | 1,503,887 | 22,700.2 | 152,004 | 104,284 | 599,163 | 1,980 | 7,948 | 638,508 | 1,503,887 | 23,190.2 | ||||||||||||||||||||||||||||||||||||||||||||||||
|
|
|
|
|
|
|
|
|
|
|
|
|
|
|
| |||||||||||||||||||||||||||||||||||||||||||||||||
Additions | 9,441 | 2,356 | 114,533 | 327 | 535 | 8,863 | 136,055 | 2,098.0 | ||||||||||||||||||||||||||||||||||||||||||||||||||||||||
Transfer during the year from exploration and evaluation assets | 9,508 | — | — | — | — | 1,103 | 10,611 | 163.6 | ||||||||||||||||||||||||||||||||||||||||||||||||||||||||
Disposals/ adjustments | (2,302) | (562) | (2,078) | (701) | (37) | — | (5,680) | (87.6) | ||||||||||||||||||||||||||||||||||||||||||||||||||||||||
Foreign exchange | 1,814 | 464 | 1,980 | 40 | 40 | (14,717) | (10,379) | (160.0) | ||||||||||||||||||||||||||||||||||||||||||||||||||||||||
|
|
|
|
|
|
|
| |||||||||||||||||||||||||||||||||||||||||||||||||||||||||
March 31, 2017 | 170,465 | 106,542 | 713,598 | 1,646 | 8,486 | 633,757 | 1,634,494 | 25,204.2 | ||||||||||||||||||||||||||||||||||||||||||||||||||||||||
|
|
|
|
|
|
|
| |||||||||||||||||||||||||||||||||||||||||||||||||||||||||
| Accumulated depreciation and impairment | ||||||||||||||||||||||||||||||||||||||||||||||||||||||||||||||||
| April 01, 2014 | 85,102 | 12,533 | 147,745 | 1,214 | 3,409 | 189,714 | 439,717 | |||||||||||||||||||||||||||||||||||||||||||||||||||||||||
April 01, 2015 | 88,480 | 14,838 | 169,446 | 1,492 | 4,608 | 411,653 | 690,517 | |||||||||||||||||||||||||||||||||||||||||||||||||||||||||
| Charge for the year | 4,753 | 2,566 | 24,367 | 422 | 1,235 | 76,929 | 110,272 | 5,787 | 2,695 | 19,601 | 311 | 779 | 53,542 | 82,715 | ||||||||||||||||||||||||||||||||||||||||||||||||||
| Disposals | (121) | (10) | (1,277) | (168) | (37) | — | (1,613) | (16,424) | (2) | (2,623) | (629) | (480) | — | (20,158) | ||||||||||||||||||||||||||||||||||||||||||||||||||
| Foreign exchange | (1,254) | (251) | (1,389) | 24 | 1 | 12,799 | 9,930 | (122) | (372) | (1,307) | 39 | 22 | 26,319 | 24,579 | ||||||||||||||||||||||||||||||||||||||||||||||||||
| Impairment(1) | — | — | — | — | — | 132,211 | 132,211 | — | 186 | 617 | 26 | 12 | 74,854 | 75,695 | ||||||||||||||||||||||||||||||||||||||||||||||||||
|
|
|
|
|
|
|
|
|
|
|
|
|
|
|
| |||||||||||||||||||||||||||||||||||||||||||||||||
| March 31, 2015 | 88,480 | 14,838 | 169,446 | 1,492 | 4,608 | 411,653 | 690,517 | 10,422.9 | ||||||||||||||||||||||||||||||||||||||||||||||||||||||||
|
|
|
|
|
|
|
| |||||||||||||||||||||||||||||||||||||||||||||||||||||||||
| Charge for the year | 5,787 | 2,695 | 19,601 | 311 | 779 | 53,542 | 82,715 | 1,248.5 | ||||||||||||||||||||||||||||||||||||||||||||||||||||||||
| Disposals | (16,424) | (2) | (2,623) | (629) | (480) | — | (20,158) | (304.3) | ||||||||||||||||||||||||||||||||||||||||||||||||||||||||
| Foreign exchange | (122) | (372) | (1,307) | 39 | 22 | 26,319 | 24,579 | 371.0 | ||||||||||||||||||||||||||||||||||||||||||||||||||||||||
| Impairment1 | — | 186 | 617 | 26 | 12 | 74,854 | 75,695 | 1,142.6 | ||||||||||||||||||||||||||||||||||||||||||||||||||||||||
|
|
|
|
|
|
|
| |||||||||||||||||||||||||||||||||||||||||||||||||||||||||
| March 31, 2016 | 77,721 | 17,345 | 185,734 | 1,239 | 4,941 | 566,368 | 853,348 | 12,880.7 | 77,721 | 17,345 | 185,734 | 1,239 | 4,941 | 566,368 | 853,348 | 13,158.8 | ||||||||||||||||||||||||||||||||||||||||||||||||
|
|
|
|
|
|
|
|
|
|
|
|
|
|
|
| |||||||||||||||||||||||||||||||||||||||||||||||||
| Net book value / Carrying amount | ||||||||||||||||||||||||||||||||||||||||||||||||||||||||||||||||
| March 31, 2015 | 71,777 | 66,747 | 342,097 | 962 | 3,326 | 182,295 | 667,204 | |||||||||||||||||||||||||||||||||||||||||||||||||||||||||
| Asset under construction (Including capital advances) | 325,473 | |||||||||||||||||||||||||||||||||||||||||||||||||||||||||||||||
| Total | 992,677 | |||||||||||||||||||||||||||||||||||||||||||||||||||||||||||||||
| March 31, 2016 | 74,283 | 86,939 | 413,429 | 741 | 3,007 | 72,140 | 650,539 | 9,819.5 | ||||||||||||||||||||||||||||||||||||||||||||||||||||||||
| Asset under construction (Including capital advances) | 224,036 | 3,381.6 | ||||||||||||||||||||||||||||||||||||||||||||||||||||||||||||||
| Total | 874,575 | 13,201.1 | ||||||||||||||||||||||||||||||||||||||||||||||||||||||||||||||
| March 31, 2016 (US dollars in million) | 1,121.3 | 1,312.3 | 6,240.4 | 11.2 | 45.4 | 1,088.9 | ||||||||||||||||||||||||||||||||||||||||||||||||||||||||||
Charge for the year Disposals/adjustments Foreign exchange Impairment1 March 31, 2017 Net book value / Carrying amount March 31, 2016 Asset under construction (Including capital advances) Total March 31, 2017 Asset under construction (Including capital advances) Total March 31, 2017 (US dollars in million) 7,631 4,087 21,299 159 474 27,487 61,137 942.7 (1,397) (708) (640) (583) (61) — (3,389) (52.4) 650 353 1,430 34 31 (13,822) (11,324) (174.5) — — — — — 4,225 4,225 65.2 84,605 21,077 207,823 849 5,385 584,258 903,997 13,939.8 74,283 86,939 413,429 741 3,007 72,140 650,539 224,036 874,575 85,860 85,465 505,775 797 3,101 49,499 730,497 11,264.4 146,630 2,261.1 877,127 13,525.5 1,395.0 1,316.8 7,770.5 12.9 5.9 763.3
| 1. | (a) During the year ended 31 March |
For oil and gas properties, CGUs identified are on the basis of a PSC (‘Production Sharing Contract’) level as it is the smallest group of assets that generates cash inflows that are largely independent of the cash inflows from other assets or group of assets.
The recoverable amount of the Rajasthan CGU, Rs. 146,197130,131 million ($ 2,206.72,006.6 million) was determined based on the fair value less costs of disposal approach, alevel-3 valuation technique in the fair value hierarchy. This is based on the cash flows expected to be generated by the projected oil or natural gas production profiles up to the expected dates of cessation of production sharing contract (PSC)/cessation of production from each producing field based on current estimates. Reserves assumptions for fair value less costs of disposal discounted cash flow tests consider all reserves that a market participant would consider when valuing the asset, which are usually broader in scope than the reserves used in avalue-in-use test. Discounted cash flow analysis used to calculate fair value less costs of disposal uses assumption for short term oil price of US$ 4154 per barrel for FY 2017next one year (March 2015:31, 2016: US$ 7041 per barrel) and the long term nominal price of US$70 68 per barrel over the next 3 year thereafter (March 2015 :31, 2016: US$8470 per barrel) derived from a consensus of various analyst recommendations. Thereafter, these have been escalated at a rate of 2.5% per annum. The cash flows are discounted using thepost-tax nominal discount rate of 11.0010.2 % (March 2015: 10.322016: 11.00 %) derived from thepost-tax weighted average cost of capital. Also refer note 3 (T)(V) (iv) for other key assumptions.
During the year ended 31 March 2016, the Group had recognised impairment charge on oil and gas assets of Rs. 322,998 million mainly relating to Rajasthan block, triggered by the significant fall in the crude oil prices. Of this charge, Rs. 74,854 million had been recorded against oil and gas properties and Rs. 248,144 million against exploratory and evaluation assets.
During the year ended 31 March 2015, the Group had recognised impairment charge on oil and gas assets of Rs. 406,144 million mainly relating to Rajasthan block and Sri Lanka block, triggered by the significant fall in the crude oil prices. Of this charge, Rs. 132,211 million had been recorded against oil and gas properties and Rs. 273,933 million against exploratory and evaluation assets. The impairment charge of Rs. 273,933 million also included Rs. 48,192 million impairment charge relating to exploratory wells in Sri Lanka, as the development of hydrocarbons in the said block was not commercially viable at the current prices.
(b) During the year ended 31 March 2017, Group has madenon-cash provision for impairment of Rs. 2,007 million ($ 30.9 million) relating to certain old items of asset under construction at the Alumina refinery operations.
(c) During the year ended 31 March 2016, the Group has recognized Rs. 14,900 million ($ 224.9 million) impairment charge in respect of the exploratory assets in West Africa (Western Cluster, Liberia) on account of low iron ore prices,geo-political factors and no plans for any substantive expenditure resulting in continued uncertainty in the project. Of this charge, Rs 8,555 million ($ 129.1 million) has been recorded against Exploratory and Evaluation assets (refer note 8(b)), Rs 344 million ($ 5.2 million) in property, plant and equipment and Rs 6,001 million ($ 90.6 million) has been recorded against assets under construction (refer note 8(a) above).
(c)
(d) During the year ended 31 March 2016, the Group has recognized Rs. 1,154 million ($ 17.4 million) impairment charge in the carrying amount of idle assets grouped under assets under construction at Bellary, Karnataka in India.
(d)(e) During the year ended 31 March 2016, the Group has recognised Rs. 497 million ($ 7.5 million) impairment charge in property, plant and equipment relating to its operation in the Copper Mines of Tasmania Pty Ltd, Australia on account of extended care and maintenance, lower copper prices and continued uncertainty instart-up of operations.
| 2. | Additions includes net deferred stripping cost |
| 3. | Certain property, plant and equipment are pledged as collateral against borrowings, the details related to which have been described in Note 17 on “Borrowings”. Interest (net) capitalised as part of property, plant and equipment was Rs. |
| 4. | Depreciation charge for the year includes Rs. |
| 5. | During the year ended March 31, 2015, in line with its accounting policy, the Group had carried out a review of the useful life of its assets. Considering the physical condition of the assets and benchmarking analysis, the Group had revised the useful life. The carrying value of the assets had been depreciated over the revised remaining useful life with effect from October 1, 2014. |
As a result the net depreciation charge for the year ended March 31, 2015 was lower by Rs. 4,337 million and loss after tax was lower by Rs. 2,863 million (net of deferred tax impact of Rs. 1,474 million). The changes made to the useful economic lives is expected to have an impact on the depreciation charge going forward, although the quantum per asset class will vary depending on whether the useful life has increased or decreased.
Impairment charge for the year ended March 31, 2014 of Rs. 2,873 million relates to mining property and land assets at Lisheen mines. This was as a result of fall in LME price of zinc and lead. The recoverable amount had been determined based on its value of use. The discount rate of 5.3% was used in determining the value in use.
| 6. | An impairment charge of Rs. 294 million had been recognized in administration expenses during the year ended March 31, 2015 in respect of expenditure incurred on coal blocks allotted to the BALCO (Aluminium Segment), due to cancellation of coal blocks by the Supreme Court of India. |
| 7. | Assets under construction as at March 31, |
| 8. | During the year ended March 31, 2016, subsequent to end of life of mines in Lisheen, Rs 13,356 million |
| 9. | The Division Bench of the Hon’ble High Court of Chhattisgarh has vide its order dated February 25, 2010, upheld that the BALCO is in legal possession of 1,804.67 acres of Government land. Subsequent to the said order, the State Government has decided to issue the lease deed in favour of the BALCO after the issue of forest land is decided by the Hon’ble Supreme Court. In the proceedings before the Hon’ble Supreme Court, pursuant to public interest litigations filed, it has been alleged that land in possession of the BALCO is being used in contravention of the Forest Conservation Act, 1980 even though the said land has been in its possession prior to the promulgation of the Forest Conservation Act, 1980 on which its Aluminium complex, allied facilities and township were constructed between1971-76. The Central Empowered Committee of the Supreme Court has already recommendedex- post facto diversion of the forest land in possession of the BALCO. The matter is presentlysub-judice before the Hon’ble Supreme Court. |
Plant and equipment includes refineries, smelters, power plants and related facilities, data processing equipment and electrical fittings.
8 (b) Exploration and evaluation assets
| Gambsberg Mine Project | Oil and Gas | Western Cluster Project | Total | Total | Gambsberg Mine Project | Oil and Gas | Western Cluster Project | Total | Total | |||||||||||||||||||||||||||||||
| Rs. in million | Rs. in million | Rs. in million | Rs. in million | US dollars in million | Rs. in million | Rs. in million | Rs. in million | Rs. in million | US dollars in million | |||||||||||||||||||||||||||||||
Cost | ||||||||||||||||||||||||||||||||||||||||
April 01, 2014 | 10,815 | 599,333 | 7,422 | 617,570 | ||||||||||||||||||||||||||||||||||||
April 01, 2015 | 9,852 | 323,799 | 8,180 | 341,831 | ||||||||||||||||||||||||||||||||||||
Additions | 1,060 | 4,912 | — | 5,972 | ||||||||||||||||||||||||||||||||||||
Unsuccessful Exploration Cost | — | (294) | — | (294) | ||||||||||||||||||||||||||||||||||||
Foreign exchange | (1,404) | 16,118 | 375 | 15,089 | ||||||||||||||||||||||||||||||||||||
Impairment(charge)/reversal* | — | (248,144) | (8,555) | (256,699) | ||||||||||||||||||||||||||||||||||||
|
|
|
|
| ||||||||||||||||||||||||||||||||||||
March 31, 2016 | 9,508 | 96,391 | — | 105,899 | 1,633.0 | |||||||||||||||||||||||||||||||||||
|
|
|
|
| ||||||||||||||||||||||||||||||||||||
Additions | — | 20,999 | 439 | 21,438 | — | 1,234 | — | 1,234 | 19.0 | |||||||||||||||||||||||||||||||
| Transfer during the year to property plant and equipment | — | (32,646) | — | (32,646) | (9,508) | (1,103) | — | (10,611) | (163.6) | |||||||||||||||||||||||||||||||
Unsuccessful Exploration Cost | — | (7,867) | — | (7,867) | — | (407) | — | (407) | (6.3) | |||||||||||||||||||||||||||||||
Foreign exchange | (963) | 17,913 | 319 | 17,269 | — | (2,333) | — | (2,333) | (36.0) | |||||||||||||||||||||||||||||||
Impairment* | — | (273,933) | — | (273,933) | ||||||||||||||||||||||||||||||||||||
Impairment(charge)/reversal* | — | 5,070 | — | 5,070 | 78.2 | |||||||||||||||||||||||||||||||||||
|
|
|
|
|
|
|
|
|
| |||||||||||||||||||||||||||||||
March 31, 2015 | 9,852 | 323,799 | 8,180 | 341,831 | 5,159.7 | |||||||||||||||||||||||||||||||||||
|
|
|
|
| ||||||||||||||||||||||||||||||||||||
Additions | 1,060 | 4,912 | — | 5,972 | 90.2 | |||||||||||||||||||||||||||||||||||
Unsuccessful Exploration Cost | — | (294) | — | (294) | (4.4) | |||||||||||||||||||||||||||||||||||
Foreign exchange | (1,404) | 16,118 | 375 | 15,089 | 227.7 | |||||||||||||||||||||||||||||||||||
Impairment* | — | (248,144) | (8,555) | (256,699) | (3,874.7) | |||||||||||||||||||||||||||||||||||
|
|
|
|
| ||||||||||||||||||||||||||||||||||||
March 31, 2016 | 9,508 | 96,391 | — | 105,899 | 1,598.5 | |||||||||||||||||||||||||||||||||||
March 31, 2017 | — | 98,852 | — | 98,852 | 1,524.3 | |||||||||||||||||||||||||||||||||||
|
|
|
|
|
|
|
|
|
| |||||||||||||||||||||||||||||||
Exploration and Evaluation Assets as at: | ||||||||||||||||||||||||||||||||||||||||
March 31, 2016 (US dollars in million) | 143.5 | 1,455.0 | — | 1,598.5 | ||||||||||||||||||||||||||||||||||||
March 31, 2017 (US dollars in million) | — | 1,524.3 | — | 1,524.3 | ||||||||||||||||||||||||||||||||||||
| * | Refer foot note 1 to note 8 (a) |
8 (c) Other Intangible assets
| Port Concession Rights | Software License | Others | Total | Total | ||||||||||||||||
| Rs. in million | Rs. in million | Rs. in million | Rs. in million | US dollars in million | ||||||||||||||||
Cost | ||||||||||||||||||||
April 01, 2014 | 5,964 | 1,911 | 504 | 8,379 | ||||||||||||||||
Additions | 50 | 269 | 37 | 356 | ||||||||||||||||
Foreign exchange difference | — | 43 | — | 43 | ||||||||||||||||
|
|
|
|
|
|
|
|
|
| |||||||||||
March 31, 2015 | 6,014 | 2,223 | 541 | 8,778 | 132.5 | |||||||||||||||
|
|
|
|
|
|
|
|
|
| |||||||||||
Additions | 3 | 145 | 116 | 264 | 4.0 | |||||||||||||||
Deletions | — | (70) | — | (70) | (1.0) | |||||||||||||||
Foreign exchange difference | — | 70 | — | 70 | 1.0 | |||||||||||||||
|
|
|
|
|
|
|
|
|
| |||||||||||
March 31, 2016 | 6,017 | 2,368 | 657 | 9,042 | 136.5 | |||||||||||||||
|
|
|
|
|
|
|
|
|
| |||||||||||
Accumulated depreciation and impairment | ||||||||||||||||||||
April 01, 2014 Charge for the year Foreign exchange difference March 31, 2015 Charge for the year Deletions Foreign exchange difference March 31, 2016 Other Intangibles as at: March 31, 2015 March 31, 2016 March 31, 2016 (US dollars in million) Cost April 01, 2015 Additions Deletions Foreign exchange difference March 31, 2016 Additions Deletions Foreign exchange difference March 31, 2017 Accumulated amortisation and impairment Port
Concession
Rights Software
License Others Total Total Rs. in million Rs. in million Rs. in million Rs. in million US dollars
in million 222 1,170 3 1,395 220 481 52 753 — 37 — 37 442 1,688 55 2,185 33.0 247 330 25 602 9.1 — (70) — (70) (1.1) — 25 — 25 0.4 689 1,973 80 2,742 41.4 5,572 535 486 6,593 5,328 395 578 6,301 95.1 80.4 6.0 8.7 Port
Concession
Rights Software
License Others Total Total Rs. in million Rs. in million Rs. in million Rs. in million US dollars
in million 6,014 2,223 541 8,778 3 145 116 264 — (70) — (70) — 70 — 70 6,017 2,368 657 9,042 139.4 29 496 56 581 9.0 (70) (39) — (109) (1.7) — (25) — (25) (0.4) 5,976 2,800 713 9,489 146.3
April 01, 2015 Charge for the year Deletions Foreign exchange difference March 31, 2016 Charge for the year Deletions Foreign exchange difference March 31, 2017 Other Intangibles as at: March 31, 2016 March 31, 2017 March 31, 2017 (US dollars in million) Port
Concession
Rights Software
License Others Total Total Rs. in million Rs. in million Rs. in million Rs. in million US dollars
in million 442 1,688 55 2,185 247 330 25 602 — (70) — (70) — 25 — 25 689 1,973 80 2,742 42.3 231 184 28 443 6.8 (10) (37) — (47) (0.7) — (27) — (27) (0.4) 910 2,093 108 3,111 48.0 5,328 395 578 6,301 5,066 707 605 6,378 98.3 78.1 10.9 9.3
| (1) | Vizag General Cargo Berth Private Limited (VGCB), a special purpose vehicle, was incorporated for the coal berth mechanization and |
9.Non-controlling Interests (‘NCI’) and joint operations
Details of subsidiaries that have materialnon-controlling interests
The Group consists of a parent company, Vedanta Limited, incorporated in India and a number of subsidiaries held directly and indirectly by the Group which operate and are incorporated around the world. Note 31 to the financial statements lists the details of share holdings in the subsidiaries.
TheNon-controlling interests that are material to the Group relate to Hindustan Zinc Limited (HZL) and Cairn India Limited (Cairn).as at March 31, 2017.
As onat March 31, 2016,2017, NCIs hold an economic interest by virtue of their shareholding of 35.08% , 49.00% and 40.12% respectively26.00% in HZL, BALCO and Cairn.BMM, respectively. The respective NCI holdings in previous yearas at March 31, 2016 were 35.08%, 40.12% , 49.00%, 26.00%, 0.01% and 40.12%26.00% in HZL, Cairn, BALCO, BMM, VGCB and PMCB respectively.
The principal place of business of HZL, erstwhile Cairn and CairnBALCO is in India.India, and that of BMM is in South Africa.
The table below shows summarized financial information of subsidiaries of the Group that have materialnon-controlling interests. The summarized financial information below represents amounts are presented before inter-company eliminations.
| As at March 31, 2015 | As at March 31, 2016 | As at March 31, 2016 | ||||||||||||||||||||||
| HZL | Cairn | HZL | Cairn | HZL | Cairn | |||||||||||||||||||
| (Rs. in million) | (Rs. in million) | (US dollars in million) | ||||||||||||||||||||||
Current assets | 332,099 | 235,241 | 370,918 | 340,186 | 5,598.8 | 5,134.9 | ||||||||||||||||||
Non-current assets | 137,397 | 653,669 | 155,667 | 233,285 | 2,349.7 | 3,521.3 | ||||||||||||||||||
Current liabilities | 18,646 | 59,922 | 150,356 | 49,497 | 2,269.5 | 747.1 | ||||||||||||||||||
Non-current liabilities | 1,829 | 134,466 | 1,428 | 18,043 | 21.6 | 272.3 | ||||||||||||||||||
Equity attributable to owners of the Group | 292,141 | 412,051 | 243,959 | 298,652 | 3,682.4 | 4,508.0 | ||||||||||||||||||
Non-controlling interests | 156,880 | 282,471 | 130,843 | 207,278 | 1,975.0 | 3,128.7 | ||||||||||||||||||
Revenue Expenses Profit / (loss) for the year Profit / (loss) attributable to owners of the Group Profit / (loss) attributable to non-controlling interests Profit / (loss) for the year Other comprehensive income / (loss) during the year Total comprehensive income / (loss) during the year Net cash inflow from operating activities Net cash (outflow) / inflow from investing activities Net cash (outflow) from financing activities Net cash inflow / (outflow) For the year ended March 31, 2015 March 31, 2016 March 31, 2016 HZL Cairn HZL Cairn HZL Cairn (Rs. in million) (Rs. in million) (US dollars in million) 145,887 146,945 139,589 86,559 2,107.0 1,306.6 (64,424) (403,356) (59,708) (294,705) (901.3) (4,448.4) 81,463 (256,411) 79,881 (208,146) 1,205.7 (3,141.8) 52,887 (153,343) 51,860 (124,644) 782.7 (1,881.4) 28,576 (103,068) 28,021 (83,502) 423.0 (1,260.4) 81,463 (256,411) 79,881 (208,146) 1,205.7 (3,141.8) Other comprehensive income / (loss) attributable to the owners of the Group (144) 14,660 (7) 16,668 (0.1) 251.6 Other comprehensive income / (loss) attributable to non-controlling interests (78) 10,849 (3) 11,574 (0.1) 174.7 (222) 25,509 (10) 28,242 (0.2) 426.3 Total comprehensive income / (loss) attributable to the owners of the Group 52,743 (138,683) 51,853 (107,977) 782.6 (1,629.8) Total comprehensive income / (loss) attributable to non-controlling interests 28,498 (92,219) 28,018 (71,927) 422.9 (1,085.7) 81,241 (230,902) 79,871 (179,904) 1,205.5 (2,715.5) Dividends paid / payable to non-controlling interests, including dividend tax 6,590 10,114 54,055 3,621 815.9 54.7 39,896 127,046 13,042 61,051 196.9 921.5 (22,894) (91,465) 19,006 (40,434) 286.9 (610.3) (18,785) (36,290) (32,039) (9,026) (483.6) (136.2) (1,783) (709) 9 11,591 0.2 175.0
The effect of changes in ownership interests in subsidiaries that did not result in a loss of control is as follows:
| As at March 31, 2016 | ||||||||
| (Rs. in million) | ||||||||
| HZL | Cairn | |||||||
Current assets | 370,918 | 340,186 | ||||||
Non-current assets | 155,667 | 233,285 | ||||||
Current liabilities | 150,356 | 49,497 | ||||||
Non-current liabilities | 1,428 | 18,043 | ||||||
Equity attributable to equity holders of the Parent | 243,959 | 298,652 | ||||||
Non-controlling interests | 130,843 | 207,278 | ||||||
| Year ended March 31, 2016 | Year ended March 31, 2016 | |||||||||||||||
| HZL | Cairn | HZL | Cairn | |||||||||||||
| (Rs. in million) | (US dollars in million) | |||||||||||||||
Changes in NCI(1) | — | 356 | — | 5.4 | ||||||||||||
| As at March 31, 2017 | ||||||||||||||||
| (Rs. in million) | ||||||||||||||||
| HZL | BALCO | BMM | Total | |||||||||||||
Current assets | 346,079 | 11,400 | 6,185 | 363,664 | ||||||||||||
Non-current assets | 169,958 | 121,735 | 21,483 | 313,176 | ||||||||||||
Current liabilities | 201,159 | 56,254 | 4,947 | 262,360 | ||||||||||||
Non-current liabilities | 2,043 | 29,341 | 6,496 | 37,880 | ||||||||||||
Equity attributable to equity holders of the Parent | 203,098 | 24,245 | 12,007 | 239,350 | ||||||||||||
Non-controlling interests | 109,737 | 23,295 | 4,218 | 137,250 | ||||||||||||
| As at March 31, 2017 | ||||||||||||||||
| (US Dollars In Million) | ||||||||||||||||
| HZL | BALCO | BMM | Total | |||||||||||||
Current assets | 5,336.6 | 175.8 | 95.4 | 5,607.8 | ||||||||||||
Non-current assets | 2,620.8 | 1,877.2 | 331.3 | 4,829.3 | ||||||||||||
Current liabilities | 3,101.9 | 867.4 | 76.3 | 4,045.6 | ||||||||||||
Non-current liabilities | 31.5 | 452.4 | 100.2 | 584.1 | ||||||||||||
Equity attributable to equity holders of the Parent | 3,131.8 | 374.0 | 185.2 | 3,691.0 | ||||||||||||
Non-controlling interests | 1,692.2 | 359.2 | 65.0 | 2,116.4 | ||||||||||||
Revenue Expenses Profit / (loss) for the year Profit / (loss) attributable to equity holders of the Parent Profit / (loss) attributable tonon-controlling interests For the Year Ended March 31, 2016 (Rs. In Million) HZL Cairn 139,589 86,559 (59,708) (294,705) 79,881 (208,146) 51,860 (124,644) 28,021 (83,502) Profit / (loss) for the year 79,881 (208,146) Other comprehensive income / (loss) attributable to the equity holders of the Parent (7) 16,668 Other comprehensive income / (loss) attributable tonon-controlling interests (3) 11,574 Other comprehensive income / (loss) during the year (10) 28,242 Total comprehensive income / (loss) attributable to the equity holders of the Parent 51,853 (107,977) Total comprehensive income / (loss) attributable tonon-controlling interests 28,018 (71,927) Total comprehensive income / (loss) during the year 79,871 (179,904) Dividends paid / payable tonon-controlling interests, including dividend tax 54,055 3,621 Net cash inflow from operating activities 13,042 61,051 Net cash (outflow) / inflow from investing
activities 19,006 (40,434) Net cash (outflow) from financing activities (32,039) (9,026) Net cash inflow / (outflow) 9 11,591
For the Year Ended March 31, 2017 (Rs. In Million) HZL Cairn BALCO BMM Total Revenue 171,163 82,041 57,210 8,281 318,695 Expenses 83,584 51,138 57,293 6,657 198,672 Profit / (loss) for the year 87,579 30,903 (83) 1,624 120,023 Profit / (loss) attributable to equity holders of the Parent 56,858 18,495 (42) 1,200 76,511 Profit / (loss) attributable tonon-controlling interests 30,721 12,408 (41) 424 43,512 Profit / (loss) for the year 87,579 30,903 (83) 1,624 120,023 Other comprehensive income / (loss) attributable to the equity holders of the Parent (19) (3,963) (119) 830 (3,271) Other comprehensive income / (loss) attributable tonon-controlling interests (10) (2,658) (114) 290 (2,492) Other comprehensive income / (loss) during the year (29) (6,621) (233) 1,120 (5,763) Total comprehensive income / (loss) attributable to the equity holders of the Parent 56,839 14,532 (161) 2,030 73,240 Total comprehensive income / (loss) attributable tonon-controlling interests 30,711 9,750 (155) 714 41,020 Total comprehensive income / (loss) during the year 87,550 22,282 (316) 2,744 114,260 Dividends paid / payable tonon-controlling interests, including dividend tax 52,447 2,718 — — 55,165 Net cash inflow from operating activities 75,772 54,464 7,857 5,677 143,770 Net cash (outflow) / inflow from investing activities 38,161 (54,981) (6,120) (3,966) (26,906) Net cash (outflow) from financing activities (112,550) (5,997) (1,748) — (120,295) Net cash inflow / (outflow) 1,383 (6,514) (11) 1,711 (3,431)
Revenue Expenses Profit / (loss) for the year Profit / (loss) attributable to equity holders of the Parent Profit / (loss) attributable tonon-controlling interests Profit / (loss) for the year Other comprehensive income / (loss) attributable to the equity holders of the Parent Other comprehensive income / (loss) attributable tonon-controlling interests Other comprehensive income / (loss) during the year Total comprehensive income / (loss) attributable to the equity holders of the Parent Total comprehensive income / (loss) attributable tonon-controlling interests Total comprehensive income / (loss) during the year Dividends paid / payable tonon-controlling interests, including dividend tax Net cash inflow from operating activities Net cash (outflow) / inflow from investing activities Net cash (outflow) from financing activities Net cash inflow / (outflow) For the Year Ended March 31, 2017 (US dollars In Million) HZL Cairn BALCO BMM Total 2,639.4 1,265.1 882.2 127.7 4,914.4 1,288.9 788.6 883.5 102.6 3,063.6 1,350.5 476.5 (1.3) 25.1 1,850.8 876.8 285.2 (0.7) 18.5 1,179.8 473.7 191.3 (0.6) 6.6 671.0 1,350.5 476.5 (1.3) 25.1 1,850.8 (0.3) (61.1) (1.8) 12.8 (50.4) (0.2) (41.0) (1.8) 4.5 (38.5) (0.5) (102.1) (3.6) 17.3 (88.9) 876.5 224.1 (2.5) 31.3 1,129.4 473.5 150.3 (2.4) 11.1 632.5 1,350.0 374.4 (4.9) 42.4 1,761.9 808.7 41.9 — — 850.6 1,168.4 839.8 121.2 87.5 2,216.9 588.5 (847.8) (94.4) (61.2) (414.9) (1,735.5) (92.5) (27.0) — (1,855.0) 21.4 (100.5) (0.2) 26.3 (53.0)
The effect of changes in ownership interests in subsidiaries that did not result in a loss of control is as follows: |
| For the Year Ended March 31, 2016 | ||||||||
| (Rs. In Million) | ||||||||
| HZL | Cairn | |||||||
Changes in | — | 356 | ||||||
| For the Year Ended March 31, 2017 | ||||||||||||||||||||
| (Rs. In Million) | ||||||||||||||||||||
| HZL | Cairn | BALCO | BMM | Total | ||||||||||||||||
Purchase of NCI# | — | (188) | — | — | (188) | |||||||||||||||
|
|
|
|
|
|
|
|
|
| |||||||||||
Changes in NCI# | — | (213,515) | — | — | (213,515) | |||||||||||||||
|
|
|
|
|
|
|
|
|
| |||||||||||
| For the Year Ended March 31, 2017 | ||||||||||||||||||||
| (US dollars In Million) | ||||||||||||||||||||
| HZL | Cairn | BALCO | BMM | Total | ||||||||||||||||
Purchase of NCI# | — | (2.9) | — | — | (2.9) | |||||||||||||||
|
|
|
|
|
|
|
|
|
| |||||||||||
Changes in NCI# | — | (3,292.4) | — | — | (3,292.4) | |||||||||||||||
|
|
|
|
|
|
|
|
|
| |||||||||||
| # | Refer Consolidated Statement of Changes in Equity |
Joint Operations
The Group participates in several unincorporated joint operations which involve the joint control of assets used in oil and gas exploration and producing activities which are as follows:
| Operating Blocks | Participating Interest (%) | |||||
India: | ||||||
Ravva block – Exploration and production | Krishna Godavari | 22.50 | ||||
CB-OS/2 – Exploration | Cambay Offshore | 60.00 | ||||
CB-OS/2 | Cambay Offshore | 40.00 | ||||
RJ-ON-90/1 – Exploration | Rajasthan Onshore | 100.00 | ||||
RJ-ON-90/1 – Development & production | Rajasthan Onshore | 70.00 | ||||
PR-OSN-2004/1 – Exploration | Palar Basin Offshore | 35.00 | ||||
KG-OSN-2009/3 – Exploration | Krishna Godavari Offshore | |||||
| 100.00 | |||||
South Africa Block1 – Exploration | Orange Basin South Africa Offshore | 60.00 | ||||
Relinquished block | ||||||
SL2007-01-001(2) – Exploration | North West Sri Lanka Offshore | |||||
MB-DWN-2009/1(1) – Exploration | Mumbai Deep Water | — | ||||
Non Operating Blocks | ||||||
India: | ||||||
KG-ONN-2003/1(3) Exploration and appraisal | 49.00 | |||||
| (1) | Relinquished on April |
| (2) | Relinquished on October 15, 2015 |
| (3) | Operatorship has been transferred to Oil and Natural Gas Corporation (ONGC) w.e.f. July 7, 2014 |
10. Financial asset investments
Financial asset investments represent investments classified and accounted for asavailable-for-sale investments
| Movements for the year ended March 31, | 2015 | 2016 | 2016 | 2016 | 2017 | 2017 | ||||||||||||||||||
| (Rs. in million) | (Rs. in million) | (US dollars in million) | (Rs. in million) | (Rs. in million) | (US dollars in million) | |||||||||||||||||||
As at April 01, | 111 | 262 | 4.0 | 262 | 432 | 6.6 | ||||||||||||||||||
Changes in fair value | 151 | 170 | 2.5 | 170 | 263 | 4.1 | ||||||||||||||||||
|
|
|
|
|
| |||||||||||||||||||
As at March 31, | 262 | 432 | 6.5 | 432 | 695 | 10.7 | ||||||||||||||||||
|
|
|
|
|
| |||||||||||||||||||
All available for sale financial assets are quoted and non current. QuotedThese investments represent investments in equity securities that present the Group with opportunities for return through dividend income and gains in value. The fair values of suchquoted securities are determined by reference to published price quotations in active markets. The fair values of unquoted securities are determined by reference to discounted cash flows model.
During the year ended March 31, 2017 pursuant to demerger of “Sterlite Technologies Limited” into “Sterlite Technologies Limited” and “Sterlite Power Transmission Limited”, 952,859 shares of “Sterlite Power Transmission Limited” have been allotted to the Company.
11. Othernon-current assets
| As at March 31, | As at March 31, | |||||||||||||||||||||||
| 2015 | 2016 | 2016 | 2016 | 2017 | 2017 | |||||||||||||||||||
| (Rs. in million) | (Rs. in million) | (US dollars in million) | (Rs. in million) | (Rs. in million) | (US dollars in million) | |||||||||||||||||||
Deposits in respect of closure cost and future redundancy payments1 | 1,710 | 1,212 | 18.3 | |||||||||||||||||||||
Financial | ||||||||||||||||||||||||
Bank Deposits1 | 1,212 | 91 | 1.4 | |||||||||||||||||||||
Site restoration assets2 | 2,279 | 3,091 | 46.7 | 3,091 | 3,859 | 59.5 | ||||||||||||||||||
Claims receivable | — | 71 | 1.1 | |||||||||||||||||||||
Trade receivables3 | 341 | 13,540 | 208.8 | |||||||||||||||||||||
Others | 1,291 | 1,739 | 26.8 | |||||||||||||||||||||
Total - Financial | 5,935 | 19,300 | 297.6 | |||||||||||||||||||||
Non Financial | ||||||||||||||||||||||||
Deposits with Government Authorities | 3,588 | 6,680 | 100.8 | 6,413 | 3,726 | 57.5 | ||||||||||||||||||
Claims receivable | 1,978 | 4,546 | 68.6 | |||||||||||||||||||||
Other non-current assets | 2,008 | 1,463 | 22.1 | |||||||||||||||||||||
Claims and other receivable | 4,644 | 11,990 | 184.9 | |||||||||||||||||||||
Total - Non Financial | 11,057 | 15,716 | 242.4 | |||||||||||||||||||||
|
|
|
|
|
| |||||||||||||||||||
| 11,563 | 16,992 | 256.5 | 16,992 | 35,016 | 540.0 | |||||||||||||||||||
|
|
|
|
|
| |||||||||||||||||||
| 1 | includes held as collateral in respect of closure cost and future redundancy payments payable to employees of Lisheen on termination of their employment on or before the mine |
| 2 | includes deposit in Site Restoration Fund of |
| 3 | In July 2017, the Appellate Tribunal for Electricity dismissed the appeal(s) filed by one of the Company’s subsidiaries, Talwandi Sabo Power Limited (TSPL), engaged in power generation, in respect of certain disputes with its customer relating to (a) the interpretation of how calorific value of coal and costs associated with it should be determined; and (b) whether there has been a change in law post execution of the Power Purchase Agreement. Both these matters effect the computation of tariff to be charged by TSPL to its customer and TSPL has decided to file appeal(s) before the Honorable Supreme Court to seek relief. The outstanding trade receivables on account of these disputes as at March 31, 2017 were Rs. 7,493 million ($ 115.5 million). The Company, basis external legal opinions and its own assessment of the merits of the case, remains confident that it is highly probable that the Supreme Court would uphold TSPL’s appeal and has thus continued to treat these balances as recoverable. |
Additionally, Rs. 5,510 million ($ 85.0 million) as at March 31, 2017 were outstanding on account of certain disputes with another customer relating to computation of tariffs and differential revenues recognised with respect to tariffs pending finalization by the state regulatory commission.
In lieu of the ongoing disputes the management does not expect the collection of these receivables within twelve months and hence have classified them asnon-current during the year.
12. Inventories
Inventories consist of the following:
| As at March 31, | As at March 31, | |||||||||||||||||||||||
| 2015 | 2016 | 2016 | 2016 | 2017 | 2017 | |||||||||||||||||||
| (Rs. in million) | (Rs. in million) | (US dollars in million) | (Rs. in million) | (Rs. in million) | (US dollars in million) | |||||||||||||||||||
Raw materials and consumables | 53,145 | 51,862 | 782.8 | 51,862 | 55,643 | 858.0 | ||||||||||||||||||
Work-in-progress | 28,487 | 22,523 | 340.0 | 22,523 | 33,171 | 511.6 | ||||||||||||||||||
Finished goods | 6,083 | 6,876 | 103.8 | 6,876 | 8,452 | 130.3 | ||||||||||||||||||
|
|
|
|
|
| |||||||||||||||||||
| 87,715 | 81,261 | 1,226.6 | 81,261 | 97,266 | 1,499.9 | |||||||||||||||||||
|
|
|
|
|
| |||||||||||||||||||
Inventories with a carrying amount of Rs. 57,75955,659 million and Rs. 55,65951,249 million ($ 840.1790.3 million) have been pledged as security against certain bank borrowings of the Group as at March 31, 20152016 and 2016,2017, respectively. (Refer note 17)
Inventory held at net realizable value amounted to Rs.673Rs. 1,876 million and Rs. 1,876449 million ($28.36.9 million) as at March 31, 20152016 and March 31, 20162017, respectively. The write down on this inventory amounted to Rs.192Rs. 330 million and Rs. 330120 million ($5.0 1.9 million) for the year ended March 31, 20152016 and March 31, 2016.2017, respectively.
13. Trade and other receivables
Trade and other receivables (net of allowances) consist of the following:
| As at March 31, | As at March 31, | |||||||||||||||||||||||
| 2015 | 2016 | 2016 | 2016 | 2017 | 2017 | |||||||||||||||||||
| (Rs. in million) | (Rs. in million) | (US dollars in million) | (Rs. in million) | (Rs. in million) | (US dollars in million) | |||||||||||||||||||
Financial | ||||||||||||||||||||||||
Trade receivables | 38,867 | 25,559 | 385.8 | 25,559 | 20,328 | 313.4 | ||||||||||||||||||
Trade receivables from related parties | 470 | 736 | 11.1 | 404 | 562 | 8.7 | ||||||||||||||||||
Loans to related parties | 160 | 805 | 12.2 | 805 | 692 | 10.7 | ||||||||||||||||||
Cash call / receivables from joint Operations | 26,844 | 8,449 | 130.3 | |||||||||||||||||||||
Other receivables * | 3,696 | 3,191 | 49.2 | |||||||||||||||||||||
Total - Financial | 57,308 | 33,222 | 512.3 | |||||||||||||||||||||
Non Financial | ||||||||||||||||||||||||
Balance with Government authorities | 8,495 | 7,982 | 120.5 | 7,620 | 6,832 | 105.3 | ||||||||||||||||||
Prepayments | 4,116 | 2,047 | 30.9 | 2,047 | 1,774 | 27.4 | ||||||||||||||||||
Claims/refunds receivable | 5,862 | 4,924 | 74.3 | |||||||||||||||||||||
Advances for supplies | 8,512 | 7,382 | 111.4 | 7,382 | �� | 11,640 | 179.5 | |||||||||||||||||
Cash call / receivables from joint operations | 29,576 | 26,844 | 405.2 | |||||||||||||||||||||
Deposits in respect of closure cost and future redundancy payments* | 2,290 | 1,132 | 17.1 | |||||||||||||||||||||
Advance for supplies to related party | 332 | 1,390 | 21.6 | |||||||||||||||||||||
Other receivables | 5,429 | 1,884 | 28.4 | 4,606 | 5,418 | 83.4 | ||||||||||||||||||
Total - Non Financial | 21,987 | 27,054 | 417.2 | |||||||||||||||||||||
|
|
|
|
|
| |||||||||||||||||||
| 103,777 | 79,295 | 1,196.9 | 79,295 | 60,276 | 929.5 | |||||||||||||||||||
|
|
|
|
|
| |||||||||||||||||||
| * | includes deposit held as collateral in respect of closure cost and future redundancy payments payable to employees of Lisheen on termination of their employment on or before the mine |
The credit period given to customers ranges from zero to 90 days. Other receivables primarily include deposits and interest receivable. For terms and conditions of loans to related parties, refer Note 31 on related party disclosures.
Trade receivables with a carrying value of Rs. 21,12738,384 million and Rs. 38,38419,172 million ($ 579.4295.6 million) have been given as collateral towards borrowings as at March 31, 20152016 and 20162017 respectively. (Refer note 17)
Allowances for trade and other receivables
The change in the allowance for trade and other receivables (current andnon-current)is as follows:
| 2015 | 2016 | 2016 | 2016 | 2017 | 2017 | |||||||||||||||||||
| (Rs. in million) | (Rs. in million) | (US dollars in million) | (Rs. in million) | (Rs. in million) | (US dollars in million) | |||||||||||||||||||
As at April 01, | 8,682 | 14,740 | 222.5 | 14,740 | 17,657 | 272.3 | ||||||||||||||||||
Allowance made during the year | 5,936 | 2,384 | 36.0 | 2,384 | 2,425 | 37.4 | ||||||||||||||||||
Reversals during the year | — | (16) | (0.2) | (16 | ) | (304 | ) | (4.7 | ) | |||||||||||||||
Written off | (173) | — | — | — | — | — | ||||||||||||||||||
Foreign Exchange difference | 295 | 549 | 8.2 | 549 | (335 | ) | (5.2 | ) | ||||||||||||||||
|
|
|
|
|
| |||||||||||||||||||
As at March 31, | 14,740 | 17,657 | 266.5 | 17,657 | 19,443 | 299.8 | ||||||||||||||||||
|
|
|
|
|
| |||||||||||||||||||
14. Short-term investments
Short-term investments consist of the following:
| As at March 31, | ||||||||||||
| 2015 | 2016 | 2016 | ||||||||||
| (Rs. in million) | (Rs. in million) | (US dollars in million) | ||||||||||
Bank deposits | 50,310 | 32,815 | 495.3 | |||||||||
Other investments1 | 446,172 | 533,377 | 8,051.0 | |||||||||
|
|
|
|
|
| |||||||
| 496,482 | 566,192 | 8,546.3 | ||||||||||
|
|
|
|
|
| |||||||
| As at March 31, | ||||||||||||
| 2016 | 2017 | 2017 | ||||||||||
| (Rs. in million) | (Rs. in million) | (US dollars in million) | ||||||||||
Bank deposits1 | 32,815 | 55,790 | 860.3 | |||||||||
Other investments2 | 533,377 | 468,895 | 7,230.4 | |||||||||
|
|
|
|
|
| |||||||
| 566,192 | 524,685 | 8,090.7 | ||||||||||
|
|
|
|
|
| |||||||
Other investments include mutual fund investments and bonds and are fair valued through the consolidated statements of profit or loss. Bank deposits are made for the periods of more than three months depending on the cash requirements of the respective companies and earn interest at the respective deposit rates.
The Group has pledged short-term investments of Rs. 2,252 million and
| 1. | Includes Rs. 2,361
15. Restricted cash and cash equivalents Restricted cash and cash equivalents consist of the following:
16. Cash and cash equivalents Cash and cash equivalents consist of the following:
Short-term deposits are made for periods of between one day and three months, depending on the immediate cash requirements of the respective companies, and earn interest at the respective short-term deposit rates.
17. Borrowings Short-term borrowings represent borrowings with an original maturity of less than one year and current portion of long-term borrowings. Long-term borrowings represent borrowings with an original maturity of greater than one year. Maturity distribution is based on contractual maturities. Interest rates on floating-rate debt are linked to benchmark rates. Short-term borrowings consist of:
Long-term borrowings consist of:
Bank loans availed by the Group are subject to certain covenants relating to interest service coverage, current ratio, debt service coverage ratio, total outside liabilities to total net worth, fixed assets coverage ratio, ratio of total term liabilities to net worth, debt to EBITDA ratio and return on fixed assets. The Group has complied with the covenants as per the terms of the loan agreement. The Company has discounted trade receivables on recourse basis Rs. 1,656 million ($ 25.5 million) as at March 31, 2017. Accordingly, the monies received on this account are shown as borrowings as the trade receivables do not meetde-recognition criteria. Details ofNon-convertible debentures issued by the Group have been provided below-
Security Details The Group has taken borrowings in various countries towards funding of its acquisitions, capital expenditure and working capital requirements. The borrowings comprise of funding arrangements from various banks and financial institutions taken by the parent and subsidiaries. Out of the total borrowings of Rs. 676,112 million and Rs. 745,780 million ($ 11,500.1 million) shown above, total secured borrowings are Rs. 436,376 million and Rs. 453,336 million ($ 6,990.5 million) and unsecured borrowings are Rs. 239,736 million and Rs. 292,444 million ($ 4,509.5 million) as at March 31, 2016 and March 31, 2017 respectively. The details of security provided by the Group in various countries, to various banks on the assets of Parent and subsidiaries are as follows:
Secured by first pari passu charge over property, plant and equipments of BALCO with Minimum Security cover of 1.25 times except for assets acquired under buyer’s credit where there is a second charge. Secured by first pari passu charges on Project assets related to 1200 MW Power Plant and 3.25 LTPA Smelter both present and future along with secured lenders except for assets acquired under buyer’s credit where there is a second charge in BALCO. Secured by first pari passu charges on all the property, plant and equipments (excluding land) of the 3.25 LTPA Aluminium Smelter along with a Thermal Power Plant of 1200 MW at BALCO except for assets acquired under buyer’s credit where there is a second charge, both present and future along with secured lenders Secured by a first pari passu charge over property, plant and equipment of BALCO with minimum security cover of 1.10 times except for assets acquired under buyer’s credit where there is a second charge. Secured by first pari passu charge over property, plant and equipments ( excluding leasehold properties) of BALCO with Minimum Security cover of 1.25 times except for assets acquired under buyer’s credit where there is a second charge. Secured by security cover of 1.25 times on the face value of outstanding debentures by way of first pari passu charge on the assets of Vedanta Limited’s power division and/or assets of 2400 MW Thermal Power at Jharsuguda, Orissa at all times during the tenure of the debenture. Secured by first pari passu charge over the property, plant and equipments of Vedanta Limited’s Lanjigarh Expansion and Lanjigarh 2 MTPA Assets with a minimum security cover of 1 time of the outstanding amount of the debenture Secured 1.1 times of the face value of outstanding debentures, by way of charge on the property, plant and equipment of the VGCB Secured by first pari passu charge on all the property, plant and equipments of TSPL both present and future, with a minimum asset cover of 1.1 times during the tenure of the NCDs (including debt service reserve account). Secured by first pari passu charge by way of hypothecation on the entire movable property, plant and equipments (including WIP) of the Aluminium and Power Project, both present and future except for assets acquired under buyer’s credit where there is a second charge; and mortgage by deposit of documents of title of the land pertaining to the property, plant and equipments. Aluminium and Power project shall mean the manufacturing facilities comprising of (i) alumina refinery having output of 1 MTPA along withco-generation captive power plant with an aggregate capacity of 75 MW at Lanjigarh, Orissa. (ii) aluminium smelter having an output of 1.6 MTPA along with a 1215 (9x135) MW CPP at Jharsuguda, Orissa. Secured by a first pari passu charge on movable & immovable property, plant and equipments of Vedanta Limited’s Refinery expansion Project (beyond 2 MTPA & upto 6 MTPA) Secured by creating first pari-passu charge by way of hypothecation of the movable property, plant and equipments except for assets acquired under buyer’s credit where there is a second charge, and mortgage on all the immovable property, plant and equipments of the Aluminium Division of Vedanta Limited, both present and future, including leasehold land.
18. Acceptances Acceptances consist of:
Acceptances comprise of credit availed from banks and financial institutions for payment to suppliers for raw materials purchased by the Group. The arrangements are interest-bearing and are payable within one year. The fair value of acceptances is not materially different from the carrying values presented. 19. Trade and other payables Trade and other payables consist of:
The fair value of trade and other payables is not materially different from the carrying values presented.
20. Provisions
(a) Restoration, rehabilitation and environmental The provision for restoration, rehabilitation An obligation to incur restoration, rehabilitation and environment costs arises when environmental disturbances are caused by the In the current year, the Group revised the discount rate applied to the decommissioning liability in relation to the Group’s oil and gas (b) Other Other provisions 21. Othernon-current liabilities Non-current liabilities consist of:
22. Employee benefits The Group participates in defined contribution and benefit schemes, the assets of which are held (where funded) in separately administered funds. For defined contribution schemes the amount charged to the consolidated statements of profit or loss is the total amount of contributions payable in the year. For defined benefit Defined contribution schemes The Group contributed a total of Rs. Central provident fund and family pension fund In accordance with the Indian Provident Fund Act, employees are entitled to receive benefits under the Provident Fund. Both the employee and the employer make monthly contributions to the plan at a predetermined rate (12% for Superannuation Superannuation, another pension scheme applicable in India, is applicable only to senior executives. Vedanta Limited and each relevant Indian subsidiary holds a policy with Life Insurance Corporation of India (“LIC”), to which each of these entities contributes a fixed amount relating to superannuation and the pension annuity is met by LIC as required, taking into consideration the contributions made. The Group has no further obligations under the scheme beyond its monthly contributions which are charged to the consolidated statements of profit or loss in the period they are incurred. Australian pension scheme The Group also participates in defined contribution superannuation schemes in Australia. The contribution of a proportion of an employee’s salary in a superannuation fund is a legal requirement in Australia. The employer contributes, into the employee’s fund of choice, 9.50% of an employee’s gross remuneration where the employee is covered by an industrial agreement and 12.50% of the basic remuneration for all other employees. All employees have the option to make additional voluntary contributions. The Group has no further obligations under the scheme beyond its monthly contributions which are charged to the consolidated statements of profit or loss in the period they are incurred. Skorpion Zinc Provident Fund, Namibia The Skorpion Zinc Provident Fund is a defined contribution fund and is compulsory to all full time employees under the age of 60. The Group contribution to the fund is a fixed percentage of 9% per month of pensionable salary, whilst the employee contributes 7% with the option of making additional contributions, over and above the normal contribution, up to a maximum of 12%. The Fund provides disability cover which is equal to the member’s fund credit and a death cover of 2 times annual salary in the event of death before retirement. Black Mountain (Pty) Limited, South Africa Pension and Provident Funds BMM has two retirement funds, both administered by Alexander Forbes, a registered financial service provider. Both funds form part of the Alexander Forbes umbrella fund and are defined contribution funds. The purpose of the funds is to provide retirement and death benefits to all eligible employees. Both the fund plans are defined contribution schemes for its employees and amount of contribution paid or payable during the year is charged to profit or loss. Group contributes at a fixed percentage of 10.5% for up to supervisor grade and 15% for others. Lisheen Mine, Ireland Pension Funds Lisheen participates in a defined contribution pension scheme for all employees. The plan requires Lisheen to contribute 5% of annual basic salary of the employee and the employee is required to also contribute 5% of their annual basic salary. Under the terms of the executive scheme a contribution of 15% each is made by Lisheen and by the individual. Employees may also make additional voluntary contributions subject to certain limits. The Lisheen’s contribution will continue until an employee terminates employment or reaches the retirement age of 65, whichever happens first. Defined benefit plans Contribution to provident fund trust (the “trusts”) of Iron ore division, BALCO, HZL, SRL and SMCL The provident funds of Iron ore division, BALCO, HZL, SRL and SMCL are exempted under section 17 of The Employees Provident Fund and Miscellaneous Provisions Act, 1952. Conditions for grant of exemption stipulates that the employer shall make good deficiency, if any, between the return guaranteed by the statute and actual earning of the Fund. Based on actuarial valuation in accordance with IAS 19 and Guidance note issued by Institute of Actuaries of India for interest rate guarantee of exempted provident fund liability of employees, there is no interest shortfall that is required to be met by Iron ore division, BALCO, HZL, SRL and SMCL as of March 31, 2017 and March 31, 2016. Having regard to the assets of the fund and the return in the investments, the Group does not expect any deficiency in the foreseeable future. The Group contributed a total of Rs. 666 million , Rs. 642 million , Rs. 536 million ($ 8.3 million) for the years ended March 31, 2015, 2016 and 2017 respectively in relation to the independently managed and approved funds. The present value of obligation and the fair value of plan assets of the trust are summarized below.
% allocation of Plan assets of the trust
Post-Retirement Medical Benefits: The Group has a scheme of post-retirement medical benefits for employees at Gratuity plan In accordance with the Payment of Gratuity Act of 1972, Vedanta Limited and its Indian subsidiaries contribute to a defined benefit plan (the “Gratuity Plan”) covering certain categories of employees. The Gratuity Plan provides a lump sum payment to vested employees at retirement, disability or termination of employment being an amount based on the respective employee’s last drawn salary and the number of years of employment with the Group. Based on actuarial valuations conducted as at year end, a provision is recognised in full for the benefit obligation over and above the funds held in the Gratuity Plan. The iron ore division of the Company, HZL and erstwhile Cairn India Limited have constituted a trust recognized by Indian Income Tax Authorities for gratuity to employees, contributions to the trust are funded with Life Insurance Corporation of India (LIC), ICICI Prudential Life Insurance Company Limited and HDFC Standard life insurance. Principal actuarial assumptions Principal actuarial assumptions used to determine the present value of the defined benefit obligation are as follows:
In India, the mortality tables used, assume that a person aged 60 at the end of the balance sheet date has a future life expectancy of 19 years. Assumptions regarding mortality for Indian entities are based on mortality tables of ‘Indian Assured Lives Mortality (2006-2008)’ published by the Institute of Actuaries of India. Amount recognised in the consolidated statements of financial position consists of:
Amounts recognised in consolidated statement of profit or loss in respect of defined benefit
Amounts recognised in the consolidated statement of comprehensive income in respect of defined benefit
The movement
The movement
The actual return on plan assets was Rs.
The group expects to contribute Rs. The Weighted average duration of the defined benefit obligation is 12.5 years and 12.7 years as at March 31, 2016 and March 31, 2017 respectively. Sensitivity analysis Below is the sensitivity analysis determined for significant actuarial assumptions for the determination of defined benefit obligations and based on reasonably possible changes of the respective assumptions occurring at the end of the reporting period while holding all other assumptions constant.
The above sensitivity analysis may not be representative of the actual benefit obligation as it is unlikely that the change in assumptions would occur in isolation of one another as some of the assumptions may be correlated. In presenting the above sensitivity analysis, the present value of defined benefit obligation has been calculated using the projected unit credit method at the end of reporting period, which is the same as that applied in calculating the defined obligation liability recognized in the statement of consolidated financial Risk analysis Group is exposed to a number of risks in the defined benefit plans. Most significant risks pertaining to defined benefits plans and management estimation of the impact of these risks are as follows: Investment risk Most of the Indian defined benefit plans are funded with Life Insurance Corporation of India (LIC), ICICI Prudential Life (ICICI) and HDFC Standard Life. Group does not have any liberty to manage the fund provided to LIC, ICICI and HDFC Standard Life. The present value of the defined benefit plan liability is calculated using a discount rate determined by reference to Government of India bonds for Group’s Indian operations. If the return on plan asset is below this rate, it will create a plan deficit. Interest risk A decrease in the interest rate on plan assets will increase the plan liability. Longevity risk/ Life expectancy The present value of the defined benefit plan liability is calculated by reference to the best estimate of the mortality of plan participants both during and at the end of the employment. An increase in the life expectancy of the plan participants will increase the plan liability. Salary growth risk The present value of the defined benefit plan liability is calculated by reference to the future salaries of plan participants. An increase in the salary of the plan participants will increase the plan liability. 23. Financial instruments This section gives an overview of the significance of financial instruments for the Group and provides additional information on the consolidated statements of financial position. Details of significant accounting policies, including the criteria for recognition, the basis of measurement and the basis on which income and expenses are recognised, in respect of each class of financial asset, financial liability and equity instrument are disclosed in Note 2 and Note 3. Financial assets and liabilities: The following tables present the carrying value and fair value of each category of financial assets and liabilities as at March 31,
Financial assets — at fair value Other non—current assets Trade and other receivable —Bank deposits —Other investments Derivative financial assets Cash and cash equivalents Total
Financial liabilities Borrowings —Short term —Long term Acceptances Trade and other payables Othernon-current liabilities Derivative financial liabilities Total Fair value hierarchy The Group uses the following hierarchy for determining and disclosing the fair value of financial instruments by valuation technique: Level 1: quoted prices (unadjusted) in active markets for identical assets or liabilities Level 2: inputs other than quoted prices included within Level 1 that are observable for the asset or liability, either directly (i.e. as prices) or indirectly (i.e. derived from prices) Level 3: inputs for the asset or liability that are not based on observable market data (unobservable inputs) The below tables
The below tables
The fair value of the financial assets and liabilities are
Trade and other receivables (excluding non financial assets), cash and cash equivalents (including restricted cash and cash equivalents), bank deposits, trade and other payables (excluding non financial liabilities) and short-term borrowings: Approximate their carrying amounts largely due to the short-term maturities of these instruments.
Long-term fixed-rate and variable-rate borrowings: Fair value has been determined by the Group based on parameters such as interest rates, specific country risk factors, and the risk characteristics of the
Quotedavailable-for-sale financial assets investments: Fair value is derived from quoted market prices in active markets. Derivative The changes in counterparty credit risk had no material effect on the hedge effectiveness assessment for derivatives designated in hedge relationship and the value of other financial instruments recognised at fair value. The estimated fair value amounts as at March 31, There were no transfers between Level 1 and Level 2 during the year. Risk management framework The Group’s businesses are subject to several risks and uncertainties including financial risks. The Group’s documented risk management polices act as an effective tool in mitigating the various financial risks to which the The risk management process is coordinated by the Management Assurance function and is regularly reviewed by the The risk management framework aims to:
improve financial risk awareness and risk transparency
identify, control and monitor key risks
identify risk accumulations
provide management with reliable information on the Group’s risk situation
improve financial returns Treasury management
Treasury management focuses on liability management, capital protection, liquidity maintenance and yield maximization. The treasury policies are approved by the The investment portfolio at the Group The Group uses derivative instruments Commodity price risk The Group is exposed to the movement of base metal commodity prices on the London Metal Exchange. Any decline in the prices of the base metals that the Group produces and sells will have an immediate and direct impact on the profitability of the businesses. As a general policy, the Group aims to sell the products at prevailing market prices. The commodity price risk in import of Whilst the Group aims to achieve average LME prices for a month or a year, average realised prices may not necessarily reflect the LME price movements because of a variety of reasons such as uneven sales during the year and timing of shipments. The Group is also exposed to the movement of international crude oil price and the discount in the price of Rajasthan crude oil to Brent price. Financial instruments with commodity price risk are entered into in relation to following activities:
economic hedging of prices realised on commodity contracts
cash flow hedging of revenues, forecasted highly probable transactions Aluminum The requirement of the primary raw material, alumina, is partly met from own sources and the rest is purchased primarily on negotiated price terms. Sales prices are linked to the LME prices. At present the Group on selective basis hedges the aluminium content in outsourced alumina to protect its margins. The Group also enters into hedging arrangements for its aluminium sales to realise average month of sale LME prices. Copper The Group’s custom smelting copper operations at Tuticorin TcRc is a major source of income for the Indian copper smelting operations. Zinc The sales prices Zinc International Raw material for zinc and lead is mined in Namibia, South Africa and Ireland with sales prices linked to the LME prices. Iron ore The Group Oil and gas The prices of various crude oils are based upon the price of the key physical benchmark crude oil such as Dated Brent, West Texas Intermediate, and Dubai/Oman etc. The crude oil prices move based upon market factors like supply and demand. The regional producers price their crude basis these benchmark crude with a premium or discount over the benchmark based upon quality differential and competitiveness of various grades. Natural gas markets are evolving differently in important geographical markets. There is no single global market for natural gas. This could be owing to difficulties in large-scale transportation over long distances as compared to crude oil. Globally, there are three main regional hubs for pricing of natural gas, which are USA (Henry Hub Prices), UK (NBP Price) and Japan (imported gas price, mostly linked to crude oil).
The value of net financial liabilities linked to commodities (excluding derivatives) accounted for on provisional prices was Rs. 29,630 million and Rs. 25,654 million (US$ 395.6 million) as at March 31, 2016 and March 31, 2017 respectively. These instruments are subject to price movements at the time of final settlement and the final price of these instruments will be determined in the financial year beginning April 1, 2017. Set out below is the impact of
The above sensitivities are based on volumes, costs,
The impact of a
Financial risk The Group’s Board approved financial risk policies comprise liquidity, currency, interest rate and counterparty risk. The Group does not engage in speculative treasury activity but seeks to manage risk and optimize interest and commodity pricing through proven financial instruments. (a) Liquidity The Group requires funds both for short-term operational needs as well as for long-term investment programmes mainly in growth projects. The Group generates sufficient cash flows from the current operations which together with the available cash and cash equivalents and short-term investments provide liquidity both in the short-term as well as in the long-term. The CRISIL upgraded the
The Group remains committed to maintaining a healthy liquidity, gearing ratio, deleveraging and strengthening
Collateral The Group has pledged a part of its trade receivables, short-term investments and cash and cash equivalents in order to fulfill the collateral requirements for the financial facilities in place. The counterparties have an obligation to return the securities to the Group. There are no other significant terms and conditions associated with the use of collateral. The details related to the fair value of collateral have been stated in Note 13, 14 and 15. (b) Foreign exchange risk Fluctuations in foreign currency exchange rates may have an impact on the consolidated statements of profit or loss, the consolidated statements of change in equity, where any transaction references more than one currency or where assets/liabilities are denominated in a currency other than the functional currency of the respective consolidated entities. Considering the countries and economic environment in which the Group operates, its operations are subject to risks arising from the fluctuations primarily in the US dollar, Australian dollar, Namibian dollar, AED, ZAR, GBP, INR and Euro against the functional currencies of Vedanta Limited and its subsidiaries. Exposures on foreign currency loans are managed through the Group wide hedging policy, which is reviewed periodically to ensure that the results from fluctuating currency exchange rates are appropriately managed. The Group strives to achieve asset liability offset of foreign currency exposures and only the net position is hedged. The Group uses forward exchange contracts, currency swaps and other derivatives to hedge the effects of movements in exchange rates on foreign currency denominated assets and liabilities. The sources of foreign exchange risk are outstanding amounts payable for imported raw materials, capital goods and other supplies as well as financing transactions and loans denominated in foreign currencies. The Group is also exposed to
The Group’s exposure to foreign currency arises where a group entity holds monetary assets and liabilities denominated in a currency different to the functional currency of The results of Group’s operations may be affected largely by fluctuations in the exchange rates between the Indian Rupee, Australian dollar, Namibia dollar and ZAR against the US dollar. The foreign exchange rate sensitivity is calculated by the aggregation of the net foreign exchange rate exposure with a simultaneous parallel foreign exchange rates shift in the currencies by 10% against the functional currency of the respective entities. Set out below is the impact of a 10% strengthening in the functional currencies of respective entities onpre-tax profit/(loss) andpre-tax equity arising as a result of the revaluation of the Group’s foreign currency financial assets/ liabilities :
A 10% (c) Interest rate risk The Group is exposed to interest rate risk on short-term and long-term floating rate instruments and on the refinancing of fixed rate debt. The Group’s policy is to maintain a balance of fixed and floating interest rate borrowings and the proportion of fixed and floating rate debt is determined by current market interest rates. The borrowings of the Group are principally denominated in Indian Rupees and US dollars with mix of fixed and floating rates of interest. The US dollar debt The Group invests cash and liquid investments in short-term deposits and debt mutual funds, some of which generate atax-free return, to achieve the Group’s goal of maintaining liquidity, carrying manageable risk and achieving satisfactory returns. Floating rate financial assets are largely mutual fund investments which have debt securities as underlying assets. The returns from these financial assets are linked to market interest rate movements; however the counterparty invests in the agreed securities with known maturity tenure and return and hence has manageable risk. Additionally, the investments portfolio is independently reviewed by CRISIL Limited, and The exposure of the Group’s financial assets as at March 31,
The exposure of the Group’s financial liabilities as at March 31, 2016 to interest rate risk is as follows:
The weighted average interest rate on the fixed rate financial liabilities is 7.1% p.a. and the weighted average period for which the rate is fixed is 1.4 years. The exposure of the Group’s financial assets as at March 31, 2017 to interest rate risk is as follows:
The exposure of the Group’s financial liabilities as at March 31, 2017 to interest rate risk is as follows:
The weighted average interest rate on the fixed rate financial liabilities is 7.0% p.a. and the weighted average period for which the rate is fixed is 1.4 years. The table below illustrates the impact of a 0.5% to 2.0% movement in interest rates on interest
(d) Counterparty and concentration of credit risk Credit risk refers to the risk that counterparty will default on its contractual obligations resulting in financial loss to the Group. The Group has adopted a policy of only dealing with creditworthy counterparties and obtaining sufficient collateral, where appropriate, as a means of mitigating the risk of financial loss from defaults. The Group is exposed to credit risk for receivables, Credit risk on receivables is limited as almost all credit sales are against letters of credit and guarantees of banks of national standing. Moreover, given the diverse nature of the Group’s businesses trade receivables are spread over a number of customers with no significant concentration of credit risk. No single customer accounted for 10.0% or more of revenue on a consolidated basis in any of the years For short-term investments, counterparty limits are in place to limit the amount of credit exposure to any one counterparty. This, therefore, results in diversification of credit risk for our mutual fund and bond investments. For derivative and financial instruments, the Group attempts to limit the credit risk by only dealing with reputable banks and financial The carrying value of the financial assets other than cash represents the maximum credit exposure. The Group’s maximum exposure to credit risk as at March 31, The maximum credit exposure on financial guarantees given by the Group for various financial facilities is described in Note 29 on “Commitments, contingencies, and guarantees”. None of the Group’s cash equivalents, including time deposits with banks, are past due or impaired. Regarding trade and other receivables, and othernon-current assets, there were no indications as at March 31,
Receivables are deemed to be past due or impaired with reference to the Group’s normal terms and conditions of business. These terms and conditions are determined on a case to case basis with reference to the customer’s credit quality and prevailing market conditions. Receivables that are classified as ‘past due’ in the above The credit quality of the Group’s customers is monitored on an ongoing basis and assessed for impairment where indicators of such impairment exist. The solvency of the debtor and their ability to repay the receivable is considered in assessing receivables for Derivative financial instruments The Group uses derivative instruments as part of its management of exposure to fluctuations in foreign currency exchange rates, interest rates and commodity prices. The Group does not acquire or issue derivative financial instruments for trading or speculative purposes. The Group does not enter into complex derivative transactions to manage the treasury and commodity risks. Both treasury and commodities derivative transactions are normally in the form of forward contracts and these are subject to the Group guidelines and policies.
The fair values of all derivatives are separately recorded in the consolidated statements of financial position within current andnon-current assets and liabilities. Derivatives that are designated as hedges are classified as current ornon-current depending on the maturity of the derivative.
Embedded derivatives Derivatives embedded in
Cash flow hedges The Group The Group uses foreign exchange contracts from time to time to optimize currency risk exposure on its foreign currency transactions. The Group hedged part of its foreign currency exposure on capital commitments during fiscal The majority of cash flow hedges taken out by the Group during the year comprisenon-derivative hedging instruments for hedging the foreign exchange rate of highly probable forecast transactions and commodity price contracts for hedging the commodity price risk of highly probable forecast transactions. The cash flows related to above are expected to occur during the year ended March 31, Fair value hedge The fair value hedges relate to forward covers taken to hedge currency exposure and commodity price risks. The Group’s sales are on a quotational period basis, generally one month to three months after the date of delivery at a customer’s facility. The Group enters into forward contracts for the respective quotational period to hedge its commodity price risk based on average LME prices. Gains and losses on these hedge transactions are substantially offset by the amount of gains or losses on the underlying sales. The Group uses foreign exchange contracts from time to time to optimize currency risk exposure on its foreign currency transactions. Fair value changes on such forward contracts are recognized in the consolidated statements of profit or loss. Non-qualifying/economic hedge The Group enters into derivative contracts which are not designated as hedges for accounting purposes, but provide an economic hedge of a particular transaction risk or a risk component of a transaction. Hedging instruments include copper, aluminium and zinc future contracts on the LME and certain other derivative instruments. Fair value changes on such derivative instruments are recognized in the consolidated statements of profit or loss. Net investment in foreign operations The Group has partly hedged its foreign exchange risk in net investment in foreign operations. Exchange differences arising from the translation of the net investment in foreign operations are recognised directly in equity. Gains and losses on those hedging instruments on forward exchange contracts designated as hedges of the net investments in foreign operations are recognised in equity to the extent that the hedging relationship is effective. These amounts are included in exchange differences on translation of foreign operations as stated in the consolidated statements of comprehensive income. Gains and losses relating to hedge ineffectiveness are recognised immediately in the consolidated statements of profit or loss for the period. Gains and losses accumulated in the translation reserve are included in the consolidated statements of profit or loss when the foreign operation is disposed off. The fair value of the Group’s derivative positions recorded under derivative financial assets and derivative financial liabilities are as follows:
Net investment in foreign operation*** Non-qualifying hedges — Commodity contracts — Forward foreign currency contracts — Cross currency swap Non Current Fair value hedges** — Forward Foreign Currency Contracts Total
24. Capital management The Group’s objectives when managing capital is to safeguard continuity, maintain a strong credit rating and healthy capital ratios in order to support its business and provide adequate return to shareholders through continuing growth. The Group’s overall strategy remains unchanged from previous year. The Group sets the amount of capital required on the basis of annual business and long-term operating plans which include capital and other strategic investments. The funding requirements are met through a mixture of equity, internal fund generation, convertible debt securities, and other long term borrowings. The Group’s policy is to use short-term and long-term borrowings to meet anticipated funding requirements. The Group monitors capital on the basis of the net gearing ratio which is Net debt Net debt are long term and short term debts as reduced by cash and cash equivalents (including restricted cash and cash equivalents) and short-term investments. Equity comprises all components excluding other components of equity (which comprises the cash flow hedges, translation of foreign operations andavailable-for-sale financial investments). The following table summarizes the capital of the Group:
25. Shareholders’ equity Authorised Share Capital: As at March 31, During the current year, the authorized equity share capital of the Company has changed pursuant to the scheme of Merger (Refer note 1). The Company has one class of equity shares having a par value of Re 1 per share. Each shareholder is eligible for one vote per share held and dividend as and when declared by the Company. Issued, subscribed and fully paid up share capital: Vedanta Limited’s issued equity share capital was Rs. 2,965 million and Rs. 3,718 million ($ Equity share capital of Rs. 3,718 million ($ 57.3 million) as at March 31, 2017 also includes 752.5 million shares to be issued pursuant to the scheme of Merger (Refer note 1). Retained earnings includes amongst others, general reserve, debenture redemption reserve, capital reserve and preference share redemption reserve. General reserves Under the erstwhile Indian Companies Act 1956, a general reserve was created through an annual transfer of net income at a specified percentage in accordance with applicable regulations. The purpose of these transfers was to ensure that if a dividend distribution in a given year is more than 10.0% of thepaid-up capital of the Company for that year, then the total dividend distribution is less than the total distributable results for that year. Consequent to introduction of Companies Act 2013, the requirement to mandatory transfer a specified percentage of the net profit to general reserve has been withdrawn. The balances in Debenture redemption reserve The Indian Companies Act requires companies that issue debentures to create a debenture redemption reserve from annual profits until such debentures are redeemed. Companies are required to maintain 25% as a reserve of outstanding redeemable debentures. The amounts credited to the debenture redemption reserve may not be Preference share redemption reserve The Indian Companies Act provides that companies that issue preference shares may redeem those shares from profits of the Company which otherwise would be available for dividends, or from proceeds of a new issue of shares made for the purpose of redemption of the preference shares. If there is a premium payable on redemption, the premium must be provided, If profits are used to redeem preference shares, the value of the nominal amount of shares redeemed should be transferred from profits (retained earnings) to the preference share redemption reserve account. This amount should then be utilised for the purpose of redemption of redeemable preference shares. This reserve can be used to issue fullypaid-up bonus shares to the shareholders of Vedanta Limited. Retained earnings Capital reserve The balance in capital reserve as of March 31, 2017 is Rs. 190,186 million ($ 2,932.7 million). The said balance has mainly arisen pursuant to extinguishment of non-controlling interests of erstwhile Cairn India Limited in the current year pursuant to merger as described in note 1. Dividends Each equity share holder is entitled to dividends as and when Vedanta Limited declares and pays dividends after obtaining shareholder approval / board approval in case of an interim dividend. Dividends are paid in Indian Rupees. Remittance of dividends outside India is governed by Indian law on foreign exchange and is subject to applicable taxes. On April 29, 2014 the board of directors of Vedanta Limited recommended a final dividend of Rs. 1.75 per equity share for the year ended March 31, 2014, which was approved by the shareholders’ at the annual general meeting, held on July 11, 2014. The dividend amounting to Rs. 5,188 million has been subsequently paid before the due date. On October 29, 2014 the board of directors of Vedanta Limited declared an interim On April 29, 2015 the board of directors of Vedanta Limited recommended a final dividend of Rs. 2.35 On October 27, 2015 the board of directors of Vedanta Limited declared an interim dividend of Rs. 3.5 On October 28, 2016 the board of directors of Vedanta Limited declared an interim dividend of Rs. 1.75 ($ On March 30, 2017 the board of directors of Vedanta Limited declared an interim dividend of Rs. 17.70 ($0.27) per equity share for the year ended March 31, 2017. The dividend amounting to Rs. 65,800 million ($1,014.6 million) has been subsequently paid. If profits for a year are insufficient to declare dividends, dividends for that year may be declared and paid out from accumulated profits on the following conditions:
The rate of dividend declared shall not exceed the average of the rates at which dividend was declared by the company in the three years immediately preceding that year;
The total amount to be drawn from such accumulated profits shall not exceedone-tenth of the sum of the company’spaid-up share capital and free reserves as appearing in the latest audited financial statement;
The amount so drawn shall first be utilised to set off the losses incurred in the financial year in which dividend is declared before any dividend in respect of equity shares is declared; and
The balance of reserves after such withdrawal shall not fall below fifteen per cent of the company’s paid up share capital as appearing in the latest audited financial 26. Share-Based Compensation Plans The The Vedanta Limited Employee Stock Option Scheme (ESOS) 2016 During the year, the The performance condition is measured by taking Vedanta Limited’s TSR at the start and end of the performance period (without averaging), and comparing its performance with that of the comparator group or groups. The information to enable this calculation to be carried out on behalf of the Nomination and Remuneration Committee (the Committee) is provided by the Company’s advisers. The Committee considers that this performance condition, which requires that the Company’s total return has outperformed a group of industry peers, provides a reasonable alignment of the interests of participants with those of the shareholders. Initial awards under the
The fair value of all awards The fair values were
The Company recognized total expense of Rs. Employee Erstwhile Cairn India Limited has provided various share based payment schemes to its
CIPOP plan (including phantom options) Options will vest (i.e., become exercisable) at the end of a “performance period” which has been set by the CIESOP plan (including phantom options) There are no specific vesting conditions under CIESOP plan other than completion of the minimum service period. Phantom options are exercisable proportionate to the period of service rendered by the employee subject to completion of one year. Details of activities under employees stock option plans
Weighted average share price at the date of exercise of stock options is Rs. 144.82 and Rs. 195.72 ($ 3.0 million) as at March 31, 2016 and March 31, 2017 respectively:
Weighted average share price at the date of exercise of stock options is Rs. 227.41 ($3.5 million) as at March 31, 2017 (March 31, 2016: NA).
Weighted average share price at the date of exercise of stock options is NA (March 31, 2016: NA)
Effect of the above employee share-based payment plans on the statement of profit and loss and on its financial position:
The equity settled employee stock options outstanding as at March 31, 2017 was Rs. 1,482 million ($ 22.9 million). Volatility is the measure of the amount by which the price has fluctuated or is expected to fluctuate during the period. The measure of volatility used in Black-Scholes option- pricing model is the annualized standard deviation of the continuously compounded rates of return on the stock over a period of time. Time to maturity /expected life of options is the period for which the Company expects the options to be live. Time to maturity has been calculated as an average of the minimum and maximum life of the options. Modification in terms of Employee stock option plans Pursuant to the merger of Cairn India Limited with the Company as referred to in note 1, the stock option plans of Cairn India Limited stands modified as follows:
The Employee share option plan of Vedanta Resources Plc The Amount recovered by the Parent and recognized by the Company in The 27. Earnings per share (“EPS”) The following reflects the income and share data used in the basic and diluted earnings per share computations: Computation of weighted average number of shares
Computation of basic and diluted earnings per share Basic earnings per share:
Profit / (loss) for the year attributable to equity holders of the parent Weighted average number of ordinary shares for basic earnings per share* Earnings / (loss) per share Diluted earnings per share:
The Group has excluded the following shares underlying the convertible note from the calculations of dilutive earnings per share because their inclusion would have been anti-dilutive.
28. Options to acquire subsidiary’s a. Call option — HZL Pursuant to the Government of India’s policy of b. Call option — BALCO Pursuant to the Government of India’s policy of divestment, the On January 9, The Group continues to include the shareholding in the two companies HZL and BALCO, in respect of which the Group has a call option asnon-controlling interest. In view of the lack of resolution on the options, thenon-response to the exercise and valuation request from the Government of India, the resultant uncertainty surrounding the potential transaction and the valuation of the consideration payable, the Group considers the strike price of the options to be at fair value, which is effectively nil, and hence the call options have not been recognised in the financial statements. 29. Commitments, contingencies, and guarantees In the normal course of business, the Group enters into certain capital commitments and also gives certain financial guarantees. The aggregate amount of indemnities and other guarantees on which the Group does not expect any material losses, was Rs.
Capital commitments The Group had significant capital commitments as at March 31,
The Group Guarantees on the issuance of customs and excise duty bonds amounting to Rs. A bank guarantee amounting to AUD 6.1 million (Rs. 302 million or $ 4.7 million) as at March 31, Bank indemnity guarantees amounting to AUD 4.7 million (Rs. 232 million or $ 3.6 million) as at March 31, 2017 (Previous year AUD 4.7 million or Rs. 238 million), in favor of the State Government of Queensland, Tasmania, Australia, as security against rehabilitation liabilities on behalf of Thalanga Copper Mines Proprietary Limited (“TCM”). The same guarantees are backed up by the issuance of a corporate guarantee of AUD 4.7 million (Rs.232 million or $ 3.6 million). The environmental liability has been fully recognized in the Group’s consolidated financial statements. Bank indemnity guarantees amounting to ZAR 21 million (Rs. 99 million or $ 1.5 million) as at March 31, 2017 (Previous year ZAR 21 million or Rs. 92 million), in favor of the Department of Mineral Resources, South Africa as a security against rehabilitation liabilities on behalf of BMM. The environmental liability has been fully recognized in the Group’s consolidated financial statements. The Group does not anticipate any additional liability on these guarantees. Performance bank guarantees amounting to Rs. 7,757 million and Rs. 4,355 million ($67.1 million) as at March 31, 2016 and 2017 respectively. These guarantees are issued in the normal course of business while bidding for supply contracts or in lieu of advances received from customers. These are contractual guarantees and are enforceable if the terms and conditions of the contracts are not met and the maximum liability on these contracts is the amount mentioned above. The Group does not anticipate any liability on these guarantees. Included in above performance guarantees for committed cumulative mandated work program of Rs. 872 million and Rs.1,349 million ($20.8 million) as at March 31, 2016 and March 31, 2017 respectively and for obligations arising out of various statutes while carrying out Petroleum Operations to the GOI, Ministry of Petroleum and Natural Gas and The Director General of Customs, Sri Lanka against its performance in respect ofMB-DWN-2009/1,KG-OSN-2009/3,SL-2007-01-001andPR-OSN-2004/1 blocks as required under the respective production sharing contracts /Production Resource Agreements. These guarantees are issued in the normal course of business and are valid till the time obligations under the each production sharing contracts/ production resource agreements are met. These guarantees are enforceable if the terms and conditions of the respective production sharing contracts/ production resource agreements are not met and potential liability shall be both, performance and obligations. Bank guarantees for securing supplies of materials and services in the normal course of business. The value of these guarantees as at March 31, 2016 and 2017 was Rs. 7,586 million and Rs. 5,444 million ($ 83.9 million) respectively. The Group has also given bank guarantees in the normal course of business for an aggregate value of Rs. 1,964 million and Rs. 2,103 million ($ 32.4 million) for litigation, against provisional valuation of custom duty and for other liabilities as at March 31, 2016 and 2017 respectively. The Group does not anticipate any liability on these guarantees. Included in above, bank guarantee of Rs. 1,150 million ($ 17.7 million) has been provided by the Group on behalf of Volcan Investments Limited to Income tax department, India as a collateral in respect of certain tax disputes. The Group’s outstanding guarantees cover obligations aggregating Rs. 25,755 million and Rs. 22,591 million ($ 348.4 million) as at March 31, 2016 and 2017 respectively, the liabilities for which have not been recorded in its consolidated financial statements. Export obligations The Indian entities of the Group have export obligations of Rs. 141,728 million and Rs. 155,834 million ($ 2,403.0 million) as at March 31, 2016 and March 31, 2017 respectively on account of concessional rates of import In the
The HZL: Department of The Department of Mines and Geology of the State of Rajasthan issued several show cause notices in August, September and October 2006 to Erstwhile Cairn India Limited: Income tax In March 2014, erstwhile Cairn India received a show cause notice from the Indian Tax Authorities (“Tax Authorities”) for not deducting withholding tax on the payments made to Cairn UK Holdings Limited (“CUHL”) UK, for acquiring shares of Cairn India Holdings Limited (“CIHL”), as part of their internal reorganisation. Tax Authorities have stated in the said notice that a short-term capital gain has accrued to CUHL on transfer of the shares of CIHL to Cairn India, in financial year 2006-2007, on which tax should have been withheld by the Company. Pursuant to this various replies were filed with the tax authorities. After hearings, the Income Tax Authority, during March 2015, have issued an order by holding Cairn India as ‘assessee in default’ and asked to pay such demand totalling Rs. 204,947 million ($3,160.3 million) (including interest of Rs. 102,474 million ($1,580.2 million)) as at March 31, 2016
Vedanta Limited: Contractor claim Shenzhen Shandong Nuclear Power Construction Co. Limited (‘SSNP’) subsequent to terminating the EPC contract invoked arbitration as per the contract allegingnon-payment of their dues towards construction of a 210 MWco-generation power plant for 6 MTPA expansion project, and filed a claim of Rs. Ravva Joint Venture arbitration proceedings: ONGC Carry Erstwhile Cairn India (now merged into Vedanta Limited) is involved in a The Ravva Production Sharing Contract “PSC” obliges the contractor parties to pay proportionate share of ONGC’s exploration, development, production and The GOI then proceeded to challenge the ONGC Carry decision before the Malaysian courts, as Kuala Lumpur was the seat of the arbitration. The Federal Court of Malaysia which adjudicated the matter on October 11, 2011, upheld the Partial Award. Per the decision of the Arbitral Tribunal , the contractor parties and GOI were required to arrive at a quantification of the sums relatable to each of the issues under the Partial Award. Pursuant to the decision of the Federal Court, the contractor parties approached Ministry of Petroleum and Natural Gas (“MoPNG”) to implement the Partial Award while reconciling the statement of accounts as outlined in Partial Award. However, MoPNG on July 10, 2014 proceeded to issue a Show Cause Notice alleging that since the partial award has As Partial Award did not quantify the sums, therefore, contractor parties approached the same Arbitral Tribunal to pass a Final Award in the subject matter since it had retained the jurisdiction to do so. The Arbitral Tribunal was reconstituted and the Final Award was passed in October 2016 in Cairn India’s favour. GOI has challenged the Final Award in the Malaysian courts. Further, Company has also filed for enforcement of the Partial Award and Final Award with Delhi High Court. While the Cairn India does not believe the GOI will be successful in its challenge, if the Arbitral Award is reversed and such reversal is binding, Cairn India could be liable for approximately USD 63.90 million (approximately Rs. Proceedings related to the Imposition of Sales Tax and Entry Tax Sales tax and Entry tax demands relating to tax on freight, tax rate differences, stock transfers matters, etc. is Rs.10,096 million and Rs.11,274 million ($173.8 million) as at March 31, 2016 and March 31, 2017 respectively. The Post the order of the nine judge bench, the regular bench of the Supreme Court proceeded with hearing the maters. The regular bench remanded the entry tax matters relating to the issue of discrimination against domestic goods from other States to the respective High Courts for final determination but retained the issue of jurisdiction on levy on imported goods, for determination by Supreme Court. The argument pertaining to imported goods are currently pending before a regular bench of the SC. The issue of discrimination has been remanded back to the High Courts for final adjudication. Vedanta has filed a writ petitions before the Odisha High Courts as well as the Rajasthan and Chhattisgarh High Courts. Whereas, the issue pertaining to levy of entry tax on movement of goods into a Special Economic Zone (SEZ) remains pending before the Odisha High Court. The Company has challenged the levy of entry tax on any movement of goods into an SEZ basis the definition of local area under the Odisha Entry Tax Act which is very clear and does not include an SEZ. In addition, the Govt of Odisha further through its SEZ Policy 2015 and the operational guidelines for administration of this policy dated 22.08.2016, exempted entry tax levy on SEZ operations. TSPL: Proceedings related to claim for Liquidated Damages TSPL had entered into a long term PPA with PSPCL for supply of power. Due to delay in fulfilment of certain obligations by PSPCL as per the PPA and force majeure events, there was a delay in completion of the project as per the PPA timelines. TSPL has received notices of claims from PSPCL seeking payment of Liquidated damages (LD) of Rs. 3,176 million (maximum) each for delay in commissioning of Unit I, II and III totalling to Rs. 9,529 million ($146.9 million) as at March 31, 2016 and March 31, 2017. During the financial year2014-15, PSPCL had invoked the Performance Bank Guarantee (PBG) of Rs. 1,500 million to recover the LD on account of delay in Commercial Operation Date (COD). Against the PBG invocation stay was granted by PSERC and this was later upheld by APTEL as well. The matter is referred to Arbitration by a panel of three Arbitrators. Pleadings, witnessing and arguments are over in the matter. Note for Written Submissions have been filed on 16th March, 2017. Arbitral award is awaited at the current stage. On the basis of facts backed by legal opinion, no provision is considered necessary at this stage. BALCO: Challenge against imposition of Energy Development Cess Balco challenged the imposition of Energy Development Cess levied on generators and distributors of electrical energy @ 10 paise per unit on the electrical energy sold or supplied before the High Court on the grounds that the The State of Chhattisgarh moved an SLP in the Supreme Court and whilst issuing notice has stayed the refund of the Cess already deposited. The matter is to be heard by a larger bench of the Supreme Court and will be listed in due course for final hearing. In case the Supreme Court overturns the decision of the High Court, Balco would be liable to pay an additional amount of Rs. 5,378 million and Rs. 5,758 million ($88.8 million) as at March 31, 2016 and March 31, 2017 respectively and the Company may have to bear a charge of Rs. 5,723 million and Rs. 6,103 million ($94.1 million) as at March 31, 2016 and March 31, 2017 respectively. South Africa Carry cost As part of thefarm-in agreement for Block 1, the Group Ravva Joint Venture arbitration proceedings: Base Development Cost: In case of Cairn, Ravva joint venture had received a claim from the Ministry of Petroleum and Natural Gas, Government of
Erstwhile Cairn India Limited: Tax Holiday In case of Cairn, Section 80-IB (9) of the Income Tax Act, 1961 allows the deduction of 100% of profits from the commercial production or refining of mineral oil. The term ‘mineral oil’ is not defined but has always been understood to refer to both oil and gas, either separately or collectively. The 2008 Indian Finance Bill appeared to remove this deduction by stating [without amending section 80-IB (9)] that “for the purpose of section 80-IB (9), the term ‘mineral oil’ does not include petroleum and natural gas, unlike in other sections of the Act”. Subsequent announcements by the Finance Minister and the Ministry of Petroleum and Natural Gas have confirmed that tax holiday would be available on production of crude oil but have continued to exclude gas. Cairn filed a writ petition to the Gujarat High Court in December 2008 challenging the restriction of section 80-IB to the production of oil. Gujarat High Court did not admit the writ petition on the ground that the matter needs to be first decided by lower tax authorities. A Special Leave Petition has been filed before Supreme Court against the decision of Gujarat High court. However in a similar case, the Gujarat High Court has held that tax holiday benefit would extend to production of gas. In the event this challenge is unsuccessful, the potential liability for tax and related interest on tax holiday claimed on gas is approximately Rs. Scheme of Amalgamation The Scheme of Amalgamation and Arrangement amongst Sterlite Energy Limited (‘SEL’), Sterlite Industries (India) Limited (‘Sterlite’), Vedanta Aluminium Limited (‘VAL’), Ekaterina Limited (‘Ekaterina’), Madras Aluminium Company Limited (‘Malco’) and the Company (the “Scheme”) had been sanctioned by the Honourable High Court of Madras and the Honourable High Court of Judicature of Bombay at Goa and was given effect to in the year ended March 31, 2014. Subsequently the above orders of the TNPCB In an appeal filed by the Group
The Group Miscellaneous disputes – Vedanta Limited, HZL, MEL, BALCO and other subsidiaries The The approximate value of claims against the Group The Group considers that it can take steps such that all the above risks can be mitigated and that there are no significant unprovided liabilities arising. C. Operating Lease commitments
Lease payments recognized as expenses onnon-cancellable lease during the year
30. Segment information The Group is a diversified natural resource group engaged in exploring, extracting and processing minerals and oil and gas. The Group produces zinc, lead, silver, copper, aluminium, iron ore, oil and gas and commercial power and
Copper The Group’s copper business is owned and operated by Vedanta Limited, Copper Mines of Tasmania Pty Ltd (“CMT”) and Fujairah Gold FZC and principally one of custom smelting and includes a copper smelter, a refinery, a phosphoric acid plant, a sulphuric acid plant, a copper rod plant and three captive power plants at Tuticorin in Southern India, and a refinery and two copper rod plants at Silvassa in Western India. In addition, the Group owns and operates the Mt. Lyell copper mine in Tasmania, Australia through its subsidiary, CMT, which provides a small percentage of the copper concentrate requirements (presently under care and maintenance), and a precious metal refinery and copper rod plant in Fujairah through its subsidiary Fujairah Gold FZC in the UAE. Zinc India The Group’s zinc India business is owned and operated by Hindustan Zinc Limited (“HZL”) in which it has a 64.92% interest as at March 31, 2017, March 31, 2016 and March 31, 2015. HZL’s operations include five lead-zinc mines, one rock phosphate mine, four hydrometallurgical zinc smelters, two lead smelters, one pyro metallurgical lead-zinc smelter, six sulphuric acid plants, a silver refinery and six captive power plants in State of Rajasthan in Northwest India and one zinc ingot melting and casting plant at Haridwar and one silver refinery, one zinc ingot melting and casting plant and one lead ingot melting and casting plant at Pantnagar in the State of Uttarakhand in North India. Zinc International The Group’s zinc international business comprises Skorpion mine and refinery in Namibia operated through THL Zinc Namibia Holdings (Proprietary) Limited (“Skorpion”), Lisheen mine in Ireland operated through Vedanta Lisheen Holdings Limited (“Lisheen”) and Black Mountain Mining (Proprietary) Limited (“BMM”), whose assets include the Black Mountain mine and the Gamsberg mine project which is in exploration stage, located in South Africa. The Group has 100% interest in Skorpion, 74.00% interest in BMM and 100% interest in Lisheen (which owns the Lisheen mine in Ireland which has ceased operations in December 2015). Aluminum The Group’s aluminium business is owned and operated by Vedanta Limited and Bharat Aluminium Company Limited (“BALCO”) in which it has a 51% interest as at March 31, Power The Group’s power business is owned and operated by Vedanta Limited, BALCO and Talwandi Sabo Power Limited (“TSPL”), a wholly owned subsidiary of the Vedanta Limited which are engaged in the power generation business in India. Vedanta Limited’s power operations include Iron ore The Group’s iron ore business is owned by Vedanta Limited and by two wholly owned subsidiaries, Sesa Resources Limited and Sesa Mining Corporation Limited and consists of exploration, mining and processing of iron ore, pig iron and metallurgical coke. The mining operations are carried out at Codli group, Bicholim mine, Surla mine and the Sonshi group of mines in state of Goa and Narrain mine, situated at state of Karnataka in India, a Metallurgical Coke and Pig Iron plant in state of Goa in India and also has a power plant in state of Goa in India for captive use. Group’s iron ore business also comprises Western Cluster Limited (“WCL”) in Liberia which has iron ore assets and is wholly owned subsidiary of the Group. WCL’s assets include development rights to western cluster and a network of iron ore deposits in West Africa. WCL’s assets were fully impaired in the year ended March 31, 2016. Oil and gas The Group’s oil and gas business is owned and operated by the Company and its subsidiary Cairn Energy Hydrocarbon Limited and engaged in business of exploration and development and production of oil and gas. The Group has a diversified asset base with seven blocks, one in state of Rajasthan in India, one on the west coast of India, four on the east coast of India and one in South Africa. Other The Group’s other activities include Vizag General Cargo Berth Private Limited (“VGCB”) and Maritime Ventures Private Limited (“MVPL) in which the Group owns a Segment Revenue, Result, Assets and Liabilities include the respective amounts identifiable to each of the segments and amount allocated on a reasonable basis. Unallocated expenditure consists of common expenditure incurred for all the segments and expenses incurred at corporate level. The assets and liabilities that cannot be allocated between the segments are shown as unallocated assets and unallocated liabilities respectively. The accounting policies of the reportable segments are the same as the Group’s accounting policies described in Note 3. The operating segments reported are the segments of the Group for which separate financial information is available. The following table presents revenue and profit information and certain assets information regarding the Group’s business segments as at and for the year ended March 31, a. For the year ended March 31,
b. For the year ended March 31,
c. For the year ended March 31, 2017
Geographical Segment Analysis The Group’s operations are primarily located in India. The following table provides an analysis of the Group’s sales by geographical market irrespective of the origin of the goods:
The following is an analysis of the carrying amount ofnon-current assets, being property, plant and equipment, exploration and evaluation assets and other intangible assets and leasehold land
All other non-current assets (non-financial) are situated in India. No single customer has accounted for 31. Related party transactions – The Group’s subsidiaries as at March 31,
The Company owns directly or indirectly through subsidiaries, more than half of the voting power of all of its subsidiaries as mentioned in the list above, and the Group is able to govern its subsidiaries’ financial and operating policies so as to benefit from their activities. Ultimate controlling party As at March 31, List of related parties and relationships – The Group enters into transactions in the normal course of business with its related parties, including its parent Vedanta, and the companies over which it has significant influence. A summary of significant related party transactions for the year ended March 31,
Volcan Investments Limited (‘Volcan’) Intermediate Holding Companies
Vedanta Resources Plc. (‘Vedanta’)
Vedanta Resources Holdings Limited (‘VRHL’)
Twin Star Holdings Limited (‘TSHL’)
Finsider International Company Limited (‘Finsider’)
Westglobe Limited (‘Westglobe’)
Welter Trading Limited (‘Welter’)
Richter Holdings Limited (‘Richter’)
Vedanta Resources Finance Limited
Vedanta Resources Cyprus Limited
Konkola Copper Mines (‘KCM’)
Vedanta Resources Jersey II Limited (‘VRJ2’)
Vedanta Resources Jersey Limited (‘VRJL’) Vedanta Jersey Investments Limited (‘VJIL’)
Sterlite Technologies Limited (‘STL’)
Sterlite Power Transmission Limited (‘SPTL’) Sterlite Iron and Steel Company Limited (‘SISCOL’)
Sesa Community Development Foundation Vedanta Medical Research Foundation (‘VMRF’)
Vedanta Foundation
Balco Employees Provident Fund Trust
Hindustan Zinc Ltd Employees Contributory Provident Fund Trust
Sesa Group Employees Provident Fund Trust
Sesa Mining Corporation Limited Employees Provident Fund Trust
Sesa Resources Limited Employees Provident Fund Trust goods and loans and investments. All inter-company transactions and balances are eliminated on consolidation. The significant transactions with related parties for the year ended March 31,
The significant receivables from and payables to related parties as at March 31,
Guarantees outstanding given / (taken) Vedanta# Volcan* Total Investment in Equity Shares – Quoted STL Total Investment in Equity Shares – Unquoted SPTL Total Investment in Vedanta Bonds Total
Cairn PSC guarantee to Government Vedanta Resources PLC as a parent company has provided Cairn Investment in Vedanta Bonds Cairn Loans to holding companies During the year ended March 31, 2016, Lisheen Milling Limited entered into a loan agreement with Twin Star Holding Limited for Rs. 667 million ($10.0 million) at an interest rate of 2.1%. The loan is unsecured and the outstanding balance under the facility at March 31, 2016 and March 31, 2017 is Rs. 663 million and Rs 648 million ($10.0 million) respectively. The loan was due in March 2017. The loan has been renewed for a further period of 12 months and is now due in March 2018. Loans to fellow subsidiaries During the year ended March 31, 2017 Group had renewed loan provided to SISCOL to finance project in earlier years. The loan balance as at March 31, 2017 was Rs. 44 million ($0.7 million). The loan is unsecured in nature and carries an interest rate of 8.50% per annum. The loan was due in March 2017. The loan has been renewed for a further period of 12 months in March 2017 and is due in March 2018. Loan from holding company During the year the Group has repaid Rs. 125,248 million ($ 1,931.3 million) to VRJ2. The loan balance as at March 31, 2017 was NIL. Sale of Subsidiary During the year ended March 31, 2017, the Group sold one of its subsidiary - Sterlite Infraventures Limited (SIVL) to a fellow subsidiary - Sterlite Power Transmission Limited for a net consideration of Rs. 2 million ($ 0.03 million). Purchase of Subsidiary During the year ended March 31, 2017, the Group purchased 100% of the shareholders in - Sesa Sterlite Mauritius Holdings Limited from VRHL at $1. Terms and conditions of transactions with related parties
Remuneration of key management personnel The remuneration of the key management personnel of the Group are set out below in aggregate for each of the categories specified in IAS 24 Related party disclosures.
Commission/ Sitting fees paid to Independent directors during the year ended March 31, 2017 is Rs. 33 million ($0.5 million) Relative of Key Management Personnel -
Details of transactions during the year with post retirement trusts:
PF Trust Balco Employees Provident Fund Trust Hindustan Zinc Ltd Employees Contributory Provident Fund Trust Sesa Resources Limited Employees Provident Fund Trust Sesa Mining Corporation Limited Employees Provident Fund Trust Sesa Group Employees Provident Fund Trust Total 32. Other notes (a) Components of other comprehensive income –cash flow hedges
(b) Exchange gain/ (loss) recognised in the consolidated statements of profit or loss:
CONSOLIDATED STATEMENTS OF PROFIT OR LOSS
(d). Employee costs
33. Subsequent Events –
34. The Group has made the
Additionally, certain balances for Supplementary Information on Oil and Gas Exploration and Production (Unaudited)
In accordance with Codification Topic 932 - Extractive Activities - Oil and gas, this section provides supplemental information on oil and gas exploration and producing activities of the Company for the years ended March 31, 2017, 2016 Method of accounting for costs incurred in oil and gas producing activities and manner of disposing of capitalized costs relating to those activities We follow a successful efforts based accounting policy for oil and gas assets. Costs incurred prior to obtaining the legal rights to explore an area are expensed immediately to the Income Statement. Expenditure incurred on the acquisition of a licence interest is initially capitalised on a licence by licence basis. Costs are held,un-depleted, within intangible exploration/appraisal assets until such time as the exploration phase on the licence area is complete or commercial reserves have been discovered. Exploration expenditure incurred in the process of determining oil and gas exploration targets is capitalised initially within intangible exploration/appraisal assets and subsequently allocated to drilling activities. Exploration/appraisal drilling costs are initially capitalised on awell–by-well basis until the success or otherwise of the well has been established. The success or failure of each exploration/appraisal effort is judged on awell-by-well basis. Drilling costs are written off on completion of a well unless the results indicate that hydrocarbon reserves exist and there is a reasonable prospect that these reserves are commercial. Following appraisal of successful exploration wells, if commercial reserves are established and technical feasibility for extraction demonstrated, then the related capitalised intangible exploration/appraisal costs are transferred into a single field cost center within property, plant and equipment - development/producing assets after testing for impairment. Where results of exploration drilling indicate the presence of hydrocarbons which are ultimately not considered commercially viable, all related costs are written off to the Income Statement. All costs incurred after the technical feasibility and commercial viability of producing hydrocarbons has been demonstrated are capitalised within property, plant and equipment - development/producing assets on afield-by-field basis. Subsequent expenditure is capitalised only where it either enhances the economic benefits of the development/producing asset or replaces part of the existing development/producing asset. Any remaining costs associated with the part replaced are expensed. Net proceeds from any disposal of an intangible exploration/appraisal asset are initially credited against the previously capitalised costs. Any surplus proceeds are credited to the Income Statement. Net proceeds from any disposal of development/producing assets are credited against the previously capitalised cost. A gain or loss on disposal of a development/producing asset is recognised in the Income Statement to the extent that the net proceeds exceed or are less than the appropriate portion of the net capitalised costs of the asset. Supplementary Information on Oil and Gas Exploration and Production (Unaudited)
The following table summarizes capitalized costs for oil and gas exploration and production activities with the related accumulated depreciation, depletion and amortization, and asset retirement obligation assets:
Supplementary Information on Oil and Gas Exploration and Production (Unaudited)
Costs incurred are summarized below and include both amounts expensed and capitalized:
* Figures in brackets ( ) represents reversal. Supplementary Information on Oil and Gas Exploration and Production (Unaudited)
The Company’s results of operations from oil and gas producing activities for the years ended March 31, 2017, 2016 Production costs are lifting costs incurred to operate and maintain productive wells and related equipment and facilities, including operating employees’ compensation, materials, supplies, fuel consumed in operations and operating costs related to natural gas processing plants. Exploration expenses include the costs of geological and geophysical activities andnon-productive exploratory wells. Depreciation and amortization expenses relate to assets employed in exploration and development activities. In accordance with Codification Topic 932 – Extractive Activities – Oil and gas, income taxes are based on statutory tax rates, reflecting allowable deductions. We have an effective tax rate lower than the statutory rate, benefiting from tax holiday in Rajasthan block under section80-IB (9) of the Income Tax Act, 1961. Interest income and expense are excluded from the results reported in this table.
Supplementary Information on Oil and Gas Exploration and Production (Unaudited)
Supplementary Information on Oil and Gas Exploration and Production (Unaudited)
The following tables represent estimates for oil and gas reserves by geographic area as of March 31, 2017, 2016 The definitions used for proved, proved developed and proved undeveloped oil and gas reserves are in accordance with United States Securities and Exchange Commission (SEC) Rule4-10 of RegulationS-X. Proved oil and natural gas reserves are those estimated quantities of crude oil, natural gas and natural gas liquids that geological and engineering data demonstrate with reasonable certainty to be economically producible in future years from known reservoirs, under existing economic and operating conditions including a12-month average price prior to the end of the reporting period, unless prices are defined by contract, and cost at the date of estimation. All the proved reserves presented herein are based on PSCs with the A summary of the annual changes in the proved reserves ofoil is as follows (in mmbbls):
Supplementary Information on Oil and Gas Exploration and Production (Unaudited)
A summary of the annual changes in the proved reserves of natural gas is as follows (in bcf):
Supplementary Information on Oil and Gas Exploration and Production (Unaudited)
Supplementary Information on Oil and Gas Exploration and Production (Unaudited)
The table below shows the standardized measure of future net cash flows relating to proved reserves. The analysis is computed in accordance with Topic 932 – Extractive Activities – Oil and gas, by applying average prices during the12-month period prior to the ending date of the period covered by the report, determined as anun-weighted arithmetic average of thefirst-day-of-the-month price for each month within such period, unless prices are defined by contractual arrangements, excluding escalations based upon future conditions, as defined by the SEC, fiscalyear-end costs, fiscalyear-end statutory tax rates and a discount factor of 10% to fiscalyear-end quantities of net proved reserves. The standardized measure of discounted future net cash flows is a forward-looking statement. Future price changes are limited to those provided by existing contractual arrangements at the end of each reporting year. Future development and production costs are those estimated future expenditures necessary to develop and produce fiscalyear-end estimated proved reserves based on fiscalyear-end costs, assuming continuation of fiscalyear-end economic conditions.Pre-tax future net cash flow is net of decommissioning and removal costs. Estimated future income taxes are calculated by applying the appropriateyear-end statutory tax rates. These rates reflect allowable deductions and tax credits and are applied to estimated future pretax net cash flows, less the tax basis of related assets. We have an effective tax rate lower than the statutory rate, benefiting from tax holiday in Rajasthan block under section80-IB (9) of the Income Tax Act, 1961. Discounted future net cash flows are calculated using a discount rate of 10% per year. Discounting requires ayear-by-year estimate of when future expenditures will be incurred and when reserves will be produced. The standardized measure of discounted future net cash flows prescribed under Topic 932 requires assumptions as to the timing and amount of future development and production costs and income from the production of proved reserves. The information does not represent management’s estimate or our expected future cash flows or the value of its proved reserves and therefore should not be relied upon as an indication of our future cash flow or value of its proved reserves. Supplementary Information on Oil and Gas Exploration and Production (Unaudited)
Supplementary Information on Oil and Gas Exploration and Production (Unaudited)
Supplementary Information on Oil and Gas Exploration and Production (Unaudited)
| ||||||||||||||||||||||||||||||||||||||||||||||||||||||||||||||||||||||||||||||||||||||||||||||||||||||||||||||||||||||||||||||||||||||||||||||||||||||||||||||||||||||||||||||||||||||||||||||||||||||||||||||||||||||||||||||||||||||||||||||||||||||||||||||||||||||||||||||||||||||||||||||||||||||||||||||||||||||||||||||||||||||||||||||||||||||||||||||||||||||||||||||||||||||||||||||||||||||||||||||||||||||||||||||||||||||||||||||||||||||||||||||||||||||||||||||||||||||||||||||||||||||||||||||||||||||||||||||||||||||||||||||||||||||||||||||||||||||||||||||||||||||||||||||||||||||||||||||||||||||||||||||||||||||||||||||||||||||||||||||||||||||||||||||||||||||||||||||||||||||||||||||||||||||||||||||||||||||||||||||||||||||||||||||||||||||||||||||||||||||||||||||||||||||||||||||||||||||||||||||||||||||||||||||||||||||||||||||||||||||||||||||||||||||||||||||||||||||||||||||||||||||||||||||||||||||||||||||||||||||||||||||||||||||||||||||||||||||||||||||||||||||||||||||||||||||||||||||||||||||