UNITED STATES
SECURITIES AND EXCHANGE COMMISSION
WASHINGTON, D.C. 20549
FORM 20-F
(Mark One)
| ☐ | Registration statement pursuant to section 12(b) or 12(g) of the Securities Exchange Act of 1934 |
or
| ☐ | Transition report pursuant to section 13 or 15(d) of the Securities Exchange Act of 1934 |
For the transition period fromto
or
| ☒ | Annual report pursuant to section 13 or 15(d) of the Securities Exchange Act of 1934 |
For the fiscal year ended March 31, 20172023
or
| ☐ | Shell company report pursuant to section 13 or 15(d) of the Securities Exchange Act of 1934 |
Date of event requiring this shell company report
Commission file number 001-37909

Azure Power Global Limited
(Exact name of Registrant as specified in its charter)
Mauritius
(Jurisdiction of Incorporation or Organization)
8 Local Shopping Complexth Floor, Tower A, DLF Infinity, Cyber City, Phase II, Gurugram-122002, Haryana, India
Pushp Vihar, Madangir, New Delhi 110062, India
Telephone: (91-11) 49409800+91-124 4155755
(Address and Telephone Number of Principal Executive Offices)
Inderpreet Singh Wadhwa
Sunil Gupta, Chief Executive Officer
8 Local Shopping Complexth Floor, Tower A, DLF Infinity, Cyber City, Phase II, Gurugram-122002, Haryana, India
Pushp Vihar, Madangir, New Delhi 110062, India
Telephone: (91-11) 49409800+91-124 4155755, e-mail: sunil.gupta@azurepower.com
Sugata Sircar, Chief Financial Officer
8th Floor, Tower A, DLF Infinity, Cyber City, Phase II, Gurugram-122002, Haryana, India
Telephone: +91-124 4155755, e-mail: sugata.sircar@azurepower.com
(Name, Telephone, E-mailemail and/or Facsimile Number and Address of Company Contact Person)
Securities registered or to be registered pursuant to Section 12(b) of the Act:
| Title of each class | | Trading symbol(s) | | Name of each exchange on which registered |
Equity Shares, par value US$0.000625
per share | | AZRE(1) | | New York Stock Exchange |
(Title of Class) | | (Name of Exchange On Which Registered)(1) |
Securities registered or to be registered pursuant to Section 12(g) of the Act.
None
(Title of Class)
Securities for which there is a reporting obligation pursuant to Section 15(d) of the Act.
None
(Title of Class)
Indicate the number of outstanding shares of each of the issuer’s classes of capital or common stock as of the close of the period covered by the annual report.
As of March 31, 2017, 25,915,9562023, 64,166,360 equity shares, par value US$0.000625 per share, were issued and outstanding.
Indicate by check mark if the registrant is a well-known seasoned issuer, as defined in Rule 405 of the Securities Act. Yes ☐ No ☒
If this annual report is an annual or transition report, indicate by check mark if the registrant is not required to file reports pursuant to Section 13 or 15(d) of the Securities Exchange Act of 1934. Yes ☐ No ☒(1)
Indicate by check mark whether the registrant has filed a report on and attestation to its management’s assessment of the effectiveness of its internal control over financial reporting under Section 404(b) of the Sarbanes-Oxley Act (15 U.S.C. 7262(b)) by the registered public accounting firm that prepared or issued its audit report. ☒
If securities are registered pursuant to Section 12(b) of the Act, indicate by check mark whether the financial statements of the registrant included in the filing reflect the correction of an error to previously issued financial statements. ☐
Indicate by check mark whether any of those error corrections are restatements that are required a recovery analysis of incentive-based compensation received by any of the registrant’s executive officers during the relevant recovery period pursuant to §240.10D-1(b). ☐
Indicate by check mark whether the registrant (1) has filed all reports required to be filed by Section 13 or 15(d) of the Securities Exchange Act of 1934 during the preceding 12 months (or for such shorter period that the registrant was required to file such reports), and (2) has been subject to such filing requirements for the past 90 days. Yes ☒☐ No ☐☒
Indicate by check mark whether the registrant has submitted electronically and posted on its corporate Web site, if any, every Interactive Data File required to be submitted and posted pursuant to Rule 405 of Regulation S-T (§232.405 of this chapter) during the preceding 12 months (or for such shorter period that the registrant was required to submit and post such files). Yes ☒☐ No ☐☒
Indicate by check mark whether the registrant is a large, accelerated filer, an accelerated filer or an emerging growth company. See the definitions of “large, accelerated filer”, “accelerated filer” and “emerging growth company” in Rule 12b-2 of the Exchange Act. (Check one):
| | | | | | | | |
| Large, accelerated filer ☐ | | Accelerated filer ☐☒ | | Non-accelerated filer ☒ | ☐ | | Emerging Growth Company | ☒ ☐ |
If an emerging growth company that prepares its financial statements in accordance with U.S. GAAP, indicate by check mark if the registrant has elected not to use the extended transition period for complying with any new or revised financial accounting standards provided pursuant to Section 13(a) of the Exchange Act. ☐
Indicate by check mark which basis of accounting the registrant has used to prepare the financial statements included in this filing:
| | | | |
U.S. GAAP ☒ | | International Financial Reporting Standards as issued
by the International Accounting Standards Board ☐ | | Other ☐ |
If “Other” has been checked in the previous question, indicate by check mark which financial statement item the registrant has elected to follow. Item 17 ☐ Item 18 ☐
If this is an annual report, indicate by check mark whether the registrant is a shell company (as defined in Rule 12b-2 of the Securities Exchange Act of 1934). Yes ☐ No ☒
(APPLICABLE ONLY TO ISSUERS INVOLVED IN BANKRUPTCY PROCEEDINGS DURING THE PAST FIVE YEARS)
Indicate by check mark whether the registrant has filed all documents and reports required to be filed by Sections 12, 13 or 15(d) of the Securities Exchange Act of 1934 subsequent to the distribution of securities under a plan confirmed by a court: Yes ☐ No ☐
| (1) | During the fiscal year ended March 31, 2023 to which this annual report relates, Azure Power Global Limited had its equity shares registered under Section 12(b) of the Securities Exchange Act of 1934. As of the date of filing, due to the delisting of its equity shares from the New York Stock Exchange, Azure Power Global Limited no longer has securities registered under Section 12(b) of the Securities Exchange Act of 1934 and instead is required to file reports pursuant to Section 15(d) of the Securities Exchange Act of 1934. |
Table of Contents
FORM 20-F CROSS-REFERENCE GUIDE
| Item # | Form 20-F caption | Location in this Report | Page |
| Conventions used in the Annual report | Conventions used in this Annual Report | v, vi |
| Special note regarding FORWARD-LOOKING INFORMATION | Forward-Looking Statements | vii |
| 1 | Identity of directors, senior management and advisers | Not applicable | - |
| 2 | Offer statistics and expected timetable | Not applicable | - |
| 3 | Key information | | |
49 | 3A. [Reserved] | | - |
| 3B. Capitalization and Indebtedness | Not applicable | - |
| 3C. Reasons for the Offer and Use of Proceeds | Not applicable | - |
| 3D. Risk Factors | Risk Factors | 65 |
| 4 | Information on the Company | | |
| 4A. History and Development of the Company | Business Overview, Company Overview | 1, 6 |
ITEM 6. DIRECTORS, SENIOR MANAGEMENT AND EMPLOYEES
| 4B. Business Overview | Business Overview, Company Overview, Industry Overview | 1, 6, 9 |
| 4C. Organizational Structure | Company Overview | 6 |
| 4D. Property, Plants and Equipment | Overview | 21 |
| 4A | Unresolved staff comments | Unresolved SEC Staff comments | 101 |
| 5 | Operating and financial review and prospects | | |
80 | 5A. Operating Results | Results of Operations | 38 |
| 5B. Liquidity and Capital Resources | Liquidity and Capital Resources | 43 |
| 5C. Research and Development, Patents and Licenses, etc. | Not applicable | - |
| 5D. Trend Information | Trend Information | 42 |
| 5E. Critical Accounting Estimates | Critical Accounting Policies and Estimates | 50 |
| 6 | Directors, senior management and employees | | |
| 6A. Directors and Senior Management | Management | 52 |
ITEM 7. MAJOR SHAREHOLDERS AND RELATED PARTY TRANSACTIONS
| 6B. Compensation | Management Compensation | 58 |
| 6C. Board Practices | Board Practices, Board Committees | 57, 60 |
| 6D. Employees | Employees | 63 |
| 6E. Share Ownership | Major Shareholders | 51 |
| 7 | Major shareholders and related party transactions | | |
92 | 7A. Major Shareholders | Major Shareholders | 51 |
| 7B. Related Party Transactions | Related Party Transactions | 51 |
| 7C. Interest of Experts and Counsel | Not applicable | - |
| 8 | Financial information | | |
| 8A. Consolidated Statements and Other Financial Information | Financial statements, Legal Proceedings, Distribution | F-1, 52, 91 |
ITEM 8. FINANCIAL INFORMATION
| 8B. Significant Changes | Significant Changes | 52 |
| 9 | The offer and listing | | |
94 | 9A. Offer and Listing Details | Trading Markets | 52 |
| 9B. Plan of Distribution | Not applicable | - |
| 9C. Markets | Trading Markets | 52 |
| 9D. Selling Shareholders | Not applicable | - |
| 9E. Dilution | Not applicable | - |
| 9F. Expenses of the Issue | Not applicable | - |
| 10 | Additional information | | |
| 10A. Share Capital | Bylaws | 94 |
ITEM 9. THE OFFER AND LISTING
| 10B. Memorandum and Articles of Association | Bylaws | 94 |
| 10C. Material Contracts | Material Contracts | 94 |
| 10D. Exchange Controls | Exchange Controls and Other Limitations Affecting Security Holders | 95 |
| 10E. Taxation | Taxation | 95 |
| 10F. Dividends and Paying Agents | Not applicable | - |
| 10G. Statements by Experts | Not applicable | - |
| 10H. Documents on Display | Information Filed with Securities Regulators | 101 |
| 10I. Subsidiary Information | Not applicable | - |
| 11 | Quantitative and qualitative disclosures about market risk | | | 95 | |
| |
ITEM 10. ADDITIONAL INFORMATION
| | 11a. Quantitative information about market risk | 96Quantitative and Qualitative information about market risk | |
| |
ITEM 11. QUANTITATIVE AND QUALITATIVE DISCLOSURES ABOUT MARKET RISK
| | | 104 | |
| |
ITEM 12. DESCRIPTION OF SECURITIES OTHER THAN EQUITY SECURITIES
| | | 105 | |
| |
ITEM 13. DEFAULTS, DIVIDEND ARREARAGES AND DELINQUENCIES
| | | 106 | |
| |
ITEM 14. MATERIAL MODIFICATIONS TO THE RIGHTS OF SECURITY HOLDERS AND USE OF PROCEEDS
| | | 106 | |
| |
ITEM 15. CONTROLS AND PROCEDURES
| | | 106 | |
| |
ITEM 16A. AUDIT COMMITTEE FINANCIAL EXPERT
| | | 107 | |
| |
ITEM 16B. CODE OF ETHICS
| | | 107 | |
| |
ITEM 16C. PRINCIPAL ACCOUNTANT FEES AND SERVICES
| | | 107 | |
| |
ITEM 16D. EXEMPTIONS FROM THE LISTING STANDARDS FOR AUDIT COMMITTEES
| | | 107 | |
| |
ITEM 16E. PURCHASES OF EQUITY SECURITIES BY THE ISSUER AND AFFILIATED PURCHASERS
| | | 107 | |
| |
ITEM 16F. CHANGE IN REGISTRANT’S CERTIFYING ACCOUNTANT
| | | 107 | |
| |
ITEM 16G. CORPORATE GOVERNANCE
| | | 108 | |
| |
ITEM 16H. MINE SAFETY DISCLOSURE
| | | 108 | |
| |
ITEM 17. FINANCIAL STATEMENTS
| | | 109 | |
| |
ITEM 18. FINANCIAL STATEMENTS
| | | 109 | |
| |
ITEM 19. EXHIBITS
| | | 109 | 98 |
| Item # | Form 20-F caption | Location in this Report | Page |
| | 11b. Qualitative information about market risk | Quantitative and Qualitative information about market risk | 98 |
| | 11c. Interim Period | Not applicable | - |
| 12 | Description of securities other than equity securities | | |
| | 12A. Debt Securities | Not applicable | - |
| | 12B. Warrants and Rights | Not applicable | - |
| | 12C. Other Securities | Not applicable | - |
| | 12D. American Depositary Shares | Not applicable | - |
| 13 | Defaults, dividend arrearages and delinquencies | Liquidity and Capital Resources | 43 |
| 14 | Material modifications to the right of security holders and use of proceeds | Material Modifications to the Rights of Security Holders and Use of Proceeds | 52 |
| 15 | Control and procedures | | |
| | 15a. Disclosure Controls and Procedures | Controls and Procedures | 99 |
| | 15b. Management’s Report on Internal Control over Financial Reporting | Controls and Procedures | 99 |
| | 15c. Attestation Report of the Registered Public Accounting Firm | Controls and Procedures | 99 |
| | 15d. Changes in Internal Control over Financial Reporting | Controls and Procedures | 99 |
| 16 | [Reserved] | | |
| 16A | Audit committee financial expert | Board Committees | 60 |
| 16B | Code of ethics | Whistle-Blower Policy | 100 |
| 16C | Principal accountant fees and services | Principal accountant fees and services | 101 |
| 16D | Exemptions from the listing standards for audit committees | Board Committees; Corporate Governance | 60, 100 |
| 16E | Purchase of equity securities by the issuer and affiliated purchasers | Not applicable | - |
| 16F | Change in registrant’s certifying accountant | Principal Accountant Fees and Services | 101 |
| 16G | Corporate Governance | Corporate Governance | 100 |
| 16H | Mine safety disclosure | Not applicable | - |
| 16I | Disclosures Regarding Foreign Jurisdictions that Prevent Inspections | Not applicable | - |
| 17 | Financial statements | Not applicable | - |
| 18 | Financial statements | Financial statements | F-1 |
| 19 | Exhibits | Exhibits | 102 |
CONVENTIONS USED IN THIS ANNUAL REPORT
Except where the context requires otherwise and for purposes of this annual report only:
“We,” “us,” the “Company,” the “group,” “Azure” or “our” refers to Azure Power Global Limited, together with its subsidiaries (including Azure Power India Private Limited, or AZI, its predecessor and current subsidiary).
“Our holding company” refers to Azure Power Global Limited on a standalone basis.
| “Our Company”, “the Company”, “APGL”, or “Azure Power” refers to Azure Power Global Limited on a standalone basis |
| “We”, “us”, “the Group”, “Azure” or “our” refers to Azure Power Global Limited, a company organized under the laws of Mauritius, together with its subsidiaries (including Azure Power Rooftop Private Limited (“AZR”), and Azure Power India Private Limited, or APIPL, its predecessor and current subsidiaries) |
| “APERC” refers to Andhra Pradesh Electricity Regulatory Commission |
| “APTEL” refers to Appellate Tribunal for Electricity |
| “Awarded” refers to the capacity won and for which LoA has been received |
| “APIPL” a company organized under the laws of India, refers to Azure Power India Private Limited |
| “CAGR” refers to compounded annual growth rate |
| “CDPQ” refers to Caisse de dépôt et placement du Québec |
| “CDPQ Infrastructures” refers to CDPQ Infrastructures Asia Pte Ltd. |
| “CEA” refers to Central Electricity Authority |
| “CEO” refers to Chief Executive Officer |
| “CERC” refers to the Central Electricity Regulatory Commission of India, the state level counterparts of which are referred to as “State Electricity Regulatory Commission”, or “SERC” |
| “CFO” refers to Chief Financial Officer |
| “Contracted” refers to capacity won and for which a PPA has been signed with off taker |
| “COO” refers to Chief Operating Officer |
| “COVID-19” refers to novel coronavirus disease of 2019 |
| “CPSU” refers to Central Public Sector Undertaking |
| “CSR” refers to Corporate Social Responsibility |
| “CTU” refers to Central Transmission Utility |
| “Discom” refers to Distribution Company |
| “EPC” refers to Engineering, Procurement and Construction |
| “ERM” refers to Enterprise Risk Management |
| “ESG” refers to Environmental, Social and Governance |
| “FDI” refers to Foreign Direct Investment |
| “GBC” refers to Global Business Company |
| “GDP” refers to Gross Domestic Product |
| “GH/GA” refers to Green Hydrogen/ Green Ammonia |
| “GIB” refers to Great Indian Bustard |
| “GoI” refers to Government of India |
| “GST” refers to Goods and Service Tax |
| “GW” refers to Gigawatt |
| “INR”, “rupees”, or “Indian rupees” refers to the legal currency of India |
| “ISTS” refers to Inter State Transmission System |
| “KERC” refers to Karnataka Electricity Regulatory Commission |
| “LoA” refers to Letter of Award |
| “MNRE” refers to Ministry of New and Renewable Energy, Government of India. |
| “MoP” refers to Ministry of Power, Government of India |
| “MSEDCL” refers to Maharashtra State Electricity Distribution Co. Limited |
| “MMT” refers to million metric tonnes |
| “MW” refers to Megawatt |
| “NAPCC” refers to National Action Plan on Climate Change |
| “NSM” refers to the Jawaharlal Nehru National Solar Mission. |
| “NYSE” refers to New York Stock Exchange |
| “O&M” refers to Operation and Maintenance |
| “OMERS” refers to OMERS Infrastructure Asia Holdings Pte. Ltd. |
| “PFIC” refers to Passive Foreign Investment Company |
| “PIL” refers to Public Interest Litigation |
| “PLI” refers to Production Linked Incentive |
| “PPA” refers to Power Purchase Agreement |
| “PV” refers to Photovoltaic |
| “Radiance” refers to Radiance Renewables Private Limited |
| “RBI” refers to Reserve Bank of India |
| “RPO” refers to Renewable Purchase Obligation |
| “SEC” refers to the U.S. Securities and Exchange Commission |
| “SECI” refers to Solar Energy Corporation of India |
| “U.S. GAAP” refers to the Generally Accepted Accounting Principles in the United States |
| “US$”, “$” or “U.S. dollars” refers to the legal currency of the United States |
| “VGF” refers to Viability Gap Funding |
“U.S. GAAP” refers to the Generally Accepted Accounting Principles in the United States.
“US$” or “U.S. dollars” refers to the legal currency of the United States.
“INR,” “rupees,” or “Indian rupees” refers to the legal currency of India.
In this annual report, references to “U.S.” or the “United States” are to the United States of America, its territories and its possessions.possessions, any State of the United States and the District of Columbia. References to “India” are to the Republic of India.India, its territories and its possessions. References to “Mauritius” are to the Republic of Mauritius.
Unless otherwise indicated, the consolidated financial statements and related notes included in this annual report have been presented in Indian rupees and prepared in accordance with U.S. GAAP. References to a particular “Fiscal”, “fiscal” year, “fiscal year” or “FY” are to our fiscal year ended March 31 of that year, which is typical in our industry and in the jurisdictions in which we operate.
This annual report contains translations of certain Indian rupee amounts into U.S. dollars at specified rates solely for the convenience of the reader. Unless otherwise stated, the translation of Indian rupees into U.S. dollars has been made at INR 64.8582.19 to US$1.00, which is the noon buying rate in New York City for cable transfer in non-U.S. currencies as certified for customs purposes by the Federal Reserve Bank of New York on March 31, 2017, which is the date of our last reported financial statements.2023. We make no representation that the Indian rupee or U.S. dollar amounts referred to in this annual report could have been converted into U.S. dollars or Indian rupees, as the case may be, at any particular rate or at all.
As used in this annual report, all references to watts (e.g., megawatts, gigawatts, kilowatt hour, terawatt hour, MW, GW, kWh, etc.) refer to measurements of power generated.
The information in this annual report gives effect to a 16-for-1 stock split of our equity shares that was effective on October 6, 2016.
SPECIAL NOTE REGARDING FORWARD-LOOKING STATEMENTS
Forward-Looking Statements
This annual report contains forward looking statements about our current expectations and views of future events. All statements, other than statements of historical facts, contained in this annual report, including statements about our strategy, future operations, future financial position, future revenues, projected costs, prospects, plans and future megawatt goals of management, are forward looking statements. These statements relate to events that involve known and unknown risks, uncertainties and other factors, including those listed under “Item 3. Key Information — D. Risk“Risk Factors,” which may cause our actual results, performance or achievements to be materially different from any future results, performance or achievements expressed or implied by the forward lookingforward-looking statements. In some cases, these forward lookingforward-looking statements can be identified by words or phrases such as “may,” “will,” “expect,” “anticipate,” “aim,” “estimate,” “intend,” “plan,” “believe,” “potential,” “continue,” “is/are likely to” or other similar expressions.
These forward lookingforward-looking statements are subject to risks, uncertainties and assumptions, some of which are beyond our control. In addition, these forward lookingforward-looking statements reflect our current views about future events and are not a guarantee of future performance. Actual outcomes may differ materially from the information contained in the forward lookingforward-looking statements because of a number of factors, including, without limitation, the risk factors set forth in “Item 3. Key Information — D. Risk“Risk Factors” and the following:
the pace of government sponsored auctions;
changes in auction rules;
| ● | the pace of government sponsored auctions and changes in auction rules; |
the government’s willingness to enforce Renewable Purchase Obligations, or RPOs;
| ● | availability of land for projects and transmission capacity installed for evacuation of power generated; |
permitting, development and construction of our project pipeline according to schedule;
| ● | permitting, development and construction of our project pipeline according to schedule; |
solar radiation
| ● | solar irradiation and wind availability in the regions in which we operate; |
| ● | adverse change in laws and regulations related to environmental, health and safety; |
| ● | developments in, or changes to, laws, regulations, governmental policies, incentives, and taxation affecting our operations; |
| ● | our ability to successfully implement any of our business strategies, including acquiring other companies and sale of our assets; |
| ● | our ability to enter into Power Purchase Agreements (“PPAs”), on acceptable terms, the occurrence of any event that may expose us to certain risks under our PPAs and the willingness and ability of counterparties to our PPAs to fulfil their obligations; |
| ● | solar power curtailments by state electricity authorities; |
| ● | material changes in the costs and availability of solar panels, raw materials, capital equipment’s and other equipment and manpower required for our operations; |
| ● | the impact of the recent delisting of our Company’s shares from the NYSE; |
| ● | the impact of fraud or other misconduct (including bribery) by our directors, officers and employees and former directors, officers and employees; and |
| ● | other risks and uncertainties, including those listed under the caption “Risk Factors.” |
We caution you that forward-looking statements are not guarantees of future performance and involve risks and uncertainties. Actual results may differ materially from those in forward-looking statements as a result of various factors. These risks and uncertainties include factors relating to (i) economic, political and social issues in the country in which we operate;
developments in, or changes to, laws, regulations, governmental policies, incentives and taxation affecting our operations;
adverse changes or developments inoperate, (ii) the industry in which we operate;
our ability to maintain and enhance our market position;
our ability to successfully implement any of our business strategies, including acquiring other companies;
our ability to enter into power purchasing agreements, or PPAs, on acceptable terms, the occurrence of any event that may expose us to certain risks under our PPAs and the willingness and ability of counterparties to our PPAs to fulfill their obligations;
our ability to borrow additional funds and access capital markets,domestic as well as
our substantial indebtednessglobal economy, (iii) financial and
capital markets, (iv) Indian government policies and regulation on renewable energy, (v) tax related laws in the
possibility that we may incur additional indebtedness going forward;US, Mauritius and India, and (vi) degree of competition in the renewable energy market in India.
For additional information on risk factors that could cause our abilityactual results to establish and operate new solar projects;
our ability to compete against traditional and renewable energy companies;
the loss of one or more members of our senior management or key employees;
political and economic conditionsdiffer from expectations reflected in India;
material changes in the costs of solar panels and other equipment required for our operations;
fluctuations in inflation, interest rates and exchange rates;
other risks and uncertainties, including those listed under the caption “Item 3. Key Information — D. Risk Factors.”
The forwardforward- looking statements, made in this annual report relatesee “Risk Factors”. Forward-looking statements speak only to events or information as of the date on which the statementsthey are made, in this annual report. Except as required by law,and we do not undertake noany obligation to update or revise publicly any forward looking statements, whether as a resultthem in light of new information or future eventsdevelopments. All forward-looking statements attributed to us or otherwise, after the datea person acting on which the statementsour behalf are made or to reflect the occurrence of unanticipated events.expressly qualified in their entirety by this cautionary statement, and you should not place undue reliance on any forward-looking statement. You should read this annual report, the exhibits hereto and theother documents that we reference in this annual report and have filed as exhibits with the SEC of which this annual report is a part, completely and with the understanding that our actual future results or performance may be materially different from what we expect.
I. BUSINESS, COMPANY & INDUSTRY OVERVIEW
A. Business Overview
Azure is one of India’s leading utility scale renewable energy project developers and operators. We build, own, and operate large grid-scale renewable energy projects across India that supply clean energy to India’s power grid. We developed India’s first utility-scale solar power project in 2009 and have since then grown to achieve substantial scale in the Indian renewable industry. Our Operational, Contracted and Awarded capacity now stands at 4,278 MW (excluding 3,033 MW for which we will not continue with construction, see “– Project Pipeline”) including 86.5 MW of rooftop capacity and Contracted and Awarded capacity of 1,237 MW. We have a total operating capacity of 3,041 MW including rooftop capacity. Our operational power plants are spread over 12 Indian states. Out of total operational capacity, 90% of our plants are in high irradiation zones like Rajasthan, Gujarat, Maharashtra and Andhra Pradesh. Below are outlines of our utility scale operational portfolio.

We sell renewable power under long term PPAs, typically 25 years in duration, at a fixed tariff. The strength of our off take customers is fundamental to our business and more than 62% of our PPAs (operational capacity) are signed with top rated central government owned intermediaries such as SECI and NTPC, providing predictable and consistent revenues and cash flows. Further, according to a report published by MoP in April 2023, among the state government owned Discoms that we have large capacities contracted with, Gujarat is rated A+, Punjab & Assam are A rated, while the three Discoms of Karnataka (CESCOM, GESCOM and HESCOM) are B rated, and Maharashtra Discom is rated B-. Our counterparty exposure for the commissioned capacity is set out below:

During FY 2023, we generated 5,854 million units of clean and green electricity for the Indian power grid. Our goal is to remain a leader in the renewable energy market in India. All our operating assets are currently solar. We intend to explore adding wind, hybrid and storage assets over time, to complement our solar generation capacity.
Our Competitive Advantage
We believe that Azure has developed durable competitive advantages from a range of factors, including:
| (i) | Pioneer: Being a leader in renewable energy industry is fundamental to Azure. We have been early adopters of proven technologies, such as bi-facial modules, trackers, and robotic dry cleaning. Our track record in project financing and refinancing includes the issue of Green Bonds at the lowest rates in India’s renewable industry. |
| (ii) | Strong customer portfolio: More than 62% of our signed PPAs (operational capacity) are with central government owned intermediaries like SECI and NTPC. This means that our off take profile is strong with an industry leading portfolio receivable cycle and the least possible disruptions to revenue collections. |
| (iii) | Focus on efficiency and productivity: All our plants are connected to a Centralized Monitoring System which record and monitor our plant performance on real time basis and maintenance data on a daily, weekly and monthly basis. Being an early mover in the Indian solar industry we have inhouse expertise to manage substations from small to large voltage of up to 400kV, which is the second highest voltage level available in India. |
| (iv) | Access to capital: Capital is one of the most important resources in our business, and we believe that strong backing from our large shareholders is a critical advantage. This strong sponsorship and our solid track record supports us in the credit markets, demonstrated by the access to project and corporate debt in general and specifically in the refinancing of our first Green Bond in FY 2022. Refer to “Risk Factors ̶ Any downgrade of our credit rating may result in increase in interest cost or may trigger covenant defaults under our loan agreements” and “Certain Factors affecting our Results” for further discussion of rating updates. |
| (v) | Focus on ESG standards: At Azure, our efforts are focused on integrating sustainability with our business strategy and day to day operation of the company. A framework has been developed to link the executive compensation to its ESG performance by developing an organizational level scorecard. ESG risks have been integrated into our enterprise risk management (“ERM”) framework and we are a signatory to the United Nations Global Compact’s Ten Principles. As a pivotal partner in India’s transition to clean journey, we are taking measures to monitor and improve our environmental performance rolling out initiatives like deployment of robotic cleaning to reduce our dependence on ground water, planting trees across sites to enhance our natural capital and tracking and reducing our greenhouse gas emissions. We have institutionalized an EV Policy to replace our fossil-based vehicles to EVs in an effort to reduce its dependence on fossil fuel. We have committed to enhance natural capital by planting 50 trees per MW for projects that we install in future. We are ISO 140001 (Env.) and 45001 (Safety) certified. We are strictly governed by key policies including our anti-bribery and corruption policy, whistle blower policy, code of business conduct and ethics and corporate social responsibility. In October 2022, we won the prestigious Golden Peacock Award for Sustainability for 2022. |
| (vi) | Innovation: We have adopted world class technology and systems to deliver sustainable value in our business. To study new technologies and the interplay between various elements of renewable power generation, we setup a test laboratory in the state of Rajasthan in 2021. This facility is aimed at improving construction processes and testing new technologies before they are mainstreamed in our projects. We have developed design and execution technologies for module mounting structure and electrical connections to suit projects located even in challenging environments. Technologies recently deployed at scale include automated robotic cleaning at different sites, use of drone for predictive and rapid maintenance identification and improving revenue by reducing electrical mismatch and import energy. |
Our Business Strategy
India is our focus market which has emerged as the third largest producer and consumer of electricity in the world. It is a global pacesetter in terms of renewable energy capacity additions and is on track to become one of the world’s largest markets for clean energy technologies. In 2023 alone, various central and state government agencies and distribution companies in India auctioned 22.9 GW of renewable energy capacity. India has set ambitious climate change and energy transition targets, including Net-Zero carbon emissions by 2070, growth of non-fossil fuel energy capacity to 500 GW by 2030 and to achieve energy independence by 2047. The Government of India’s (“GoI”) support for the sector, macro factors such as increased electrification and rapid urbanization are expected to result in India representing a significant share in the global renewable energy market across technologies like solar and wind. For more information, see “– Industry Overview”.
We believe we are well positioned to benefit from the expanding renewable energy market in India. We expect to continue to invest in the capabilities that we believe give us an edge in an increasingly competitive market. These include:
| ● | in-house expertise in competitive bidding, design, construction, and operation of renewable energy assets to world class standards of quality and cost; |
| ● | deep engagement in the evolving Indian renewable energy ecosystem with policy makers, regulators and customers at central and state levels; |
| ● | leadership in raising and deploying both equity and debt capital, including project and climate financing; |
| ● | insight into and early deployment of evolving technologies, including construction techniques, and digital and automated optimization and grid interface; and |
| ● | strong and effective governance including corporate responsibility and community engagement. |
Our strategic priorities are:
| ● | to execute our pipeline while managing risk and delivering targeted investment returns; |
| ● | to bid for and win renewable energy auctions in India focused on solar, wind, storage, and their hybrid solutions with a bidding strategy that conforms to our risk-return profile; |
| ● | to maintain world class standards of safety, reliability and efficiency at our plants using leading digital and automated tools; |
| ● | to build capabilities to address a more demanding utility grid environment led by higher renewable energy penetration. in addition to existing solar capabilities, we plan to increase our non-solar generation, especially wind and storage; and |
| ● | to develop business beyond the core utility business by partnering with large energy users for their requirements by providing reliable renewable energy. |
To execute our pipeline of projects
Delivering on our pipeline in a timely and efficient manner – within acceptable risk and return parameters – is one of our key strategic priorities. We have signed PPAs for approximately 270 MW of our pipeline not including 3,033 MW for which we will not continue with construction, see “– Project Pipeline” and have signed Letters of Awards (“LoAs”) for another 967 MW. Whilst most of the pipeline is in solar, we have started early-stage development on wind projects and wind solar hybrid projects. We continue to identify project sites with good renewable energy resource potential, connectivity to the grid, and favourable on-ground working ecosystem.
Bid for and win renewable energy auctions in India in line with our risk and return profile
The ambitious targets set by the GoI, combined with climate change commitments being announced by Indian corporates, are expected to substantially increase the demand for clean energy. India offers tremendous potential in solar and wind power, which should be the fastest growing sources of energy in the next decade and beyond. We will continue to bid in a disciplined manner to win projects at an acceptable rate of return and include PPAs with high grade off take. The PPAs signed by us are typically for 25 years duration and considering the long tenor of these contracts, it’s important to ensure that the counterparties to such agreements are organizations with robust business model and strong operational cashflows to service their PPA obligations. Based on the above, Azure only selects bidding opportunities that it believes minimize the risks, ensure bankability of our projects, and have a high probability of generating the expected cash-flows.
Maintain world class standards of safety, reliability and efficiency at our plants including using digital and automated tools
We are a fully integrated renewable energy company undertaking development, construction, ownership, operation and maintenance of renewable energy plants. New technologies, including digital and automation, will help optimize output and reduce cost, while better serving the grid requirement for firmer and more predictable power. We have rolled out multiple initiatives aimed at enhancing safety, efficiency and process improvements which include advanced automated robotic cleaning technologies for photovoltaic modules, drones for monitoring, centralized digital platform for asset performance monitoring, predictive analytics etc. We will continue to deploy technologies and innovations that help us deliver world class operating performance and simultaneously optimize the asset life.
Build capabilities in non-solar generation especially in wind, and in storage, to address a more demanding utility grid environment
As the share of renewable energy increases in the energy mix, the challenges to integrate Renewable Energy in the grid will increase due to their variable nature of generation. We expect that there will be an increasing focus to improve power system flexibility and reduce the intermittency associated with renewable power. The Indian wind energy profile complements India’s solar generation profile. Thus, we expect that wind energy, solar-wind hybrids and energy storage solutions will be increasingly deployed for a predictable and flatter renewable energy generation profile and grid stability. On similar lines, we expect that utility customers will increase their share of renewable energy consumption but will increasingly demand more predictable and continuous power. This annual reportwill require integration of solar, wind and storage technologies. In line with the evolving requirements of the market, we will continue to strengthen our capability to deliver firm and dispatchable renewable power to our customers by leveraging solar, wind and storage technologies.
Develop business beyond the core utility business by partnering with large energy users for their requirements for reliable green energy
With an increasing focus on decarbonization and sustainability, there is a significant and growing demand for renewable energy from commercial and industrial customers. We aim to partner with large energy consumers across segments to meet their requirements for reliable and affordable green energy. We will look for opportunities to replace their brown energy consumption with green power through various techno-commercial offerings tailored to specific customer needs. Such displacement would target not only the power requirements of our partners but also contains statistical datathe grey fuel usage for various heating, cooling and estimates,other process driven energy requirements.
We will continue to evaluate new technologies such as Green Hydrogen which present an opportunity to implement large scale renewable energy projects in a sustainable manner. We intend to identify such opportunities which integrate with our business strategy, add value to our existing portfolio and would leverage our core strength of building efficient renewable energy projects.
Project Pipeline
A major part of our project pipeline consisted of 4,000 MW allocated by SECI under their manufacturing linked tender, that we won in December 2019 and upsized in July 2020 to reflect the green-shoe. We had executed PPAs with SECI for aggregate capacity of 3,033 MW under the manufacturing linked tender, and PPAs for the balance capacity of 967 MW can be signed only after SECI has the power supply agreements for these remaining MW in place.
We are conducting an ongoing review of our projects under contract to consider their commercial and economic viability. In addition, a Special Committee of the Board (the “Special Committee”) was convened in August 2022 to review certain material projects and contracts over a three-year period for anti-corruption and related compliance issues. See “Risk Factors - We have conducted investigations into whistle-blower claims and other allegations against persons who served as our directors, officers and employees. We reported the allegations and our findings to the SEC and the U.S. Department of Justice and continue to cooperate with these authorities.”
Pursuant to the manufacturing linked tender award of 4,000 MW, the Group executed PPAs for a capacity of 2,333 MW with SECI, for which SECI executed a Power Sale Agreement (“PSA”) with the state of Andhra Pradesh during Fiscal 2022. In respect of these 2,333 MW projects, two PILs were filed in the High Court of Andhra Pradesh in Fiscal 2022, challenging various aspects of the manufacturing linked tender and seeking to quash the Andhra Pradesh Regulator’s approval for procurement of capacity tied up by Andhra Pradesh Discoms with SECI pursuant to the tender. The tariff adoption for the capacities by the CERC is subject to the outcome of the PILs. We are not a party to the PILs, and the PILs currently are pending adjudication. Currently, we cannot predict the outcome of these two PILs.
Based on the economics and uncertainties associated with the PILs and ongoing Special Committee review, the Group concluded that it should seek to terminate the PPAs in respect of these 2,333 MW projects and filed a petition at the Andhra Pradesh High Court seeking a declaration that the Group should be discharged from performance of the obligations under the Andhra Pradesh PPAs for a capacity of 2,333 MW as a result of the absence of the unconditional tariff adoption order from the regulatory commission. Since there was a threat by SECI to revoke the Bank Guarantee of US$14.2 million, the High Court in its order dated October 16, 2023, directed SECI not to take coercive steps against the Group until the next date of hearing. This matter is pending.
On March 18, 2024, we received two letters from SECI. In its first letter, SECI stated that it had terminated the PPAs with the Group in respect of the 2,333 MW projects and reserved its rights to take action against the Group including thoseforfeiture of the performance bank guarantees and success charges and fees in respect of the PPAs and other documentation associated with the 2,333 MW projects. In its second letter, SECI informed the Group that it was awarding the 2,333 MW projects and associated PPAs to a third-party. Further, SECI informed the Group that it had reduced Azure’s capacity allocation under the manufacturing Letter of Award by 2,333MW and its corresponding manufacturing capacity of solar cells and solar modules by 583 MW. Accordingly, the Group has taken a write-off of INR 254 million (US$ 3.1 million) towards irrecoverable costs and a provision of INR 1,223 million (US$14.9 million) towards Bank Guarantees in its consolidated financial statements for Fiscal 2023.
In light of the ongoing Special Committee review as well as economic and execution challenges, the Group also has decided to withdraw from the 700 MW projects which is part of the 4,000 MW manufacturing linked tender awarded by SECI in Fiscal 2020. The Group intends to commence discussions with SECI to ensure an orderly withdrawal from the 700 MW projects and from the obligations of the Group and its subsidiaries under the PPA, Performance Bank Guarantees and other guarantees relating to the solar industry and our competition from market research, analyst reports and other publicly available sources. These publications include forward looking statements being made byprojects. Accordingly, the authorsGroup has recognized a provision of such reports. These forward looking statements are subject to a number of risks, uncertainties and assumptions. Actual results could differ materially and adversely from those anticipated or impliedINR 1,053 million (US$ 12.8 million) in the forward looking statements.
PART I
ITEM 1. IDENTITY OF DIRECTORS, SENIOR MANAGEMENT AND ADVISERS
Not applicable
ITEM 2. OFFER STATISTICS AND EXPECTED TIMETABLE
Not applicable
ITEM 3. KEY INFORMATION
A. Selected Financial Data
The following selected consolidated statement of operations data for the fiscal years ended March 31, 2015, 2016 and 2017 and the selected consolidated balance sheet data as of March 31, 2016 and 2017, have been derived from our auditedits consolidated financial statements included elsewherefor Fiscal 2023 towards irrecoverable costs and Bank Guarantee in relation to the 700 MW projects.
In FY 2023, we also executed PPAs with SECI for our first 150 MW solar-wind hybrid project, and for our first wind project of 120 MW. The presently estimated scheduled commissioning timelines for these projects are May 2025 (for the 120 MW wind project), and November 2025 (for the 150 MW solar-wind hybrid project). These timelines are estimated based on anticipated dates of regulatory approvals (in case of the 120 MW wind project), and anticipated completion dates of the requisite elements of the grid’s transmission/evacuation system (in case of the 150 MW hybrid project).
In case of the 120 MW Wind Project, the tariff has only recently been adopted by CERC (in March 2024), after a delay of more than 16 months. The approval for power procurement by one of the buying state’s (procuring 45 MW out of the 120 MW contracted capacity) regulatory commission – is still awaited. Because of the inordinate delay in getting these regulatory approvals (which is a Condition Precedent to be fulfilled by SECI and/ or the buying utility under the PPA), this annual report. Selected consolidated balance sheet datatariff is no longer market competitive. Owing to this delay, and a few deviations in the PPA (from the standard bidding guidelines), we have written to SECI to withdraw their tariff adoption petition filed at CERC, and made a submission to the same effect at CERC as of March 31, 2015well. Now that the said tariff has been derived fromadopted at CERC, we are in the process of evaluating the same, and deciding further course of action.
Project Implementation
We have inhouse design, engineering, project execution, operations and maintenance capabilities. We remain one of the pioneers in executing and delivering renewable projects in India, demonstrated by our audited consolidated financial statements not includedearly adoption of proven technologies like bi-facial modules, trackers, and robotic dry cleaning. We aim to operate our plants to world-class standards of safety, reliability and efficiency using leading digital and automated tools with predictive and rapid response abilities.
Many of our projects are in this annual report. Our consolidated financial statements are prepared and presented in accordancezones with US GAAP. Our historical results do not necessarily indicatehigh irradiation and/or strong winds. We position our results expectedpower plants to optimize generating efficiency, proximity to customers. The typical timeline available under a PPA for any future period.
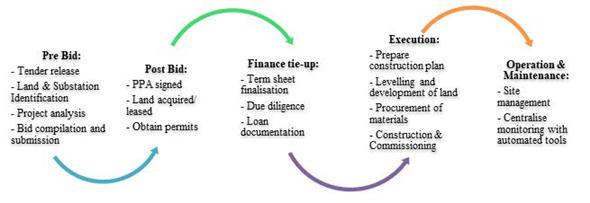
commissioning a power project is approximately 18-24 months. The following information shoulddiagram illustrates the key activities under life cycle of a typical project.
We procure major components such as solar modules and inverters directly from multiple manufacturers with industry standard warranty and guarantee terms. Our supply chain team are developing strategic relationships with a range of key suppliers of critical equipment and components both in India and globally. We select our suppliers based on quality, technology provided, expected cost, reliability, warranty coverage, ease of installation and other ancillary costs.
The price of components for our solar power plants have declined over the longer time horizon as manufacturers lower their cost of production via technological improvement and economies of scale. However, in the second half of FY 2022, we experienced challenges in receipt and pricing of material from suppliers, primarily due to price increases of raw materials and disruptions to trade flows due to COVID-19 shutdowns in source markets and the imposition of customs duties. We then responded to these supply headwinds by deepening our strategic partnerships with key suppliers like for modules we entered into an agreement with Premier Energies Group (“Premier Group”) and First Solar, Inc. in the second half of 2022. We agreed to invest INR 1,000 million (US$12.2 million) in Premier Group, one of India’s leading manufacturers of solar PV cells, of which an investment of INR 455 million (~US$ 5.5 million) has been made for the subscription of equity shares & compulsorily convertible debentures issued by Premier Energies Investment Private Limited (“PEIPL”), towards subscription of 26% shareholding in PEIPL and modules and also signed a Module Supply Agreement (“MSA”) for supply of modules up to 600 MW capacity per annum over next four years. Under the MSA, we have a right to procure modules of up to 600 MW per annum, with a minimum commitment given to off take 300 MW per annum, subject to agreed exemptions. The start date for the MSA with Premier Group has been deferred to April 1, 2026. With First Solar, we entered into an agreement for 600 MW (DC) of high-performance, advanced thin film photovoltaic (“PV”) solar modules. We continue to track market price movements and have multiple options for procurement as and when required. On February 13, 2024, FS India Solar Ventures Private Limited (“First Solar”) sent us a notice that First Solar was terminating the Master Supply Agreement, dated August 22, 2022 (“First Solar MSA”), between First Solar and APIPL. The notice claims that a termination payment of US$29.242 million is due to be readpaid by APIPL to First Solar under the First Solar MSA. APIPL disputes that such a termination payment is due and intends to engage in conjunctioncommercial discussions with First Solar to resolve the matter.
We also signed a Master Supply Agreement with Siemens Gamesa Renewable Power Private Limited (“Siemens Gamesa”) to supply 96 units of onshore wind turbines that will cater to an overall capacity of approximately 346 MW of wind projects. On March 05, 2024, Siemens Gamesa sent us a notice which claims a default and damages of INR 1,934 million (US$23.5 million) in connection with a supply agreement between Siemens Gamesa and APIPL in respect of our 345.6 MW wind power project in the state of Karnataka. APIPL disputes such claim of default and damages and intends to engage in mutual discussions with Simens Gamesa to resolve the matter.
Once a project is qualified in its entirety by referenceconstructed and grid-connected, it produces recurring revenue. Our project operating expenses are relatively lower than conventional power plants, with most cash flow servicing the capital costs of the project or contributing to “Item 5. our growth capital requirements including corporate overhead. Because plant operating margins are relatively stable, our growth and financial success depend on effective management of our expenses and the development of new projects. Also refer to “Operating and Financial Review and Prospects” and the audited consolidated financial statements and the notes thereto included elsewhere in this annual report.Prospects” for further details.
| | | | | | | | | | | | | | | | |
| | | Fiscal Year Ended March 31, | |
| | | 2015(1) | | | 2016(1) | | | 2017 | | | 2017(2) | |
Consolidated Statement of Operations data: | | (INR) | | | (INR) | | | (INR) | | | (US$) | |
| | | (In thousands) | |
Operating revenues: | | | | | | | | | | | | | | | | |
Sale of power | | | 1,124,138 | | | | 2,626,148 | | | | 4,182,985 | | | | 64,502 | |
| | | | |
Operating costs and expenses: | | | | | | | | | | | | | | | | |
Cost of operations (exclusive of depreciation and amortization shown separately below) | | | 79,816 | | | | 190,648 | | | | 375,787 | | | | 5,795 | |
General and administrative | | | 425,952 | | | | 672,841 | | | | 797,161 | | | | 12,292 | |
Depreciation and amortization | | | 322,430 | | | | 687,781 | | | | 1,046,565 | | | | 16,138 | |
| | | | | | | | | | | | | | | | |
Total operating costs and expenses: | | | 828,198 | | | | 1,551,270 | | | | 2,219,513 | | | | 34,225 | |
| | | | | | | | | | | | | | | | |
Operating income | | | 295,940 | | | | 1,074,878 | | | | 1,963,472 | | | | 30,277 | |
| | | | |
Other expense: | | | | | | | | | | | | | | | | |
Interest expense, net | | | 831,790 | | | | 2,058,836 | | | | 2,371,836 | | | | 36,574 | |
Loss (gain) on foreign currency exchange, net | | | 299,628 | | �� | | 343,137 | | | | (109,128 | ) | | | (1,683 | ) |
| | | | | | | | | | | | | | | | |
Total other expenses | | | 1,131,418 | | | | 2,401,973 | | | | 2,262,708 | | | | 34,891 | |
| | | | | | | | | | | | | | | | |
Loss before income tax | | | (835,478 | ) | | | (1,327,095 | ) | | | (299,236 | ) | | | (4,614 | ) |
Income tax expense | | | (253,112 | ) | | | (327,745 | ) | | | (892,333 | ) | | | (13,760 | ) |
| | | | | | | | | | | | | | | | |
Net loss | | | (1,088,590 | ) | | | (1,654,840 | ) | | | (1,191,569 | ) | | | (18,374 | ) |
| | | | | | | | | | | | | | | | |
Less: Net loss attributable to non-controlling interest | | | (5,595 | ) | | | (4,651 | ) | | | (18,924 | ) | | | (292 | ) |
Net loss attributable to APGL | | | (1,082,995 | ) | | | (1,650,189 | ) | | | (1,172,645 | ) | | | (18,082 | ) |
Accretion to Mezzanine CCPS | | | (755,207 | ) | | | (1,347,923 | ) | | | (235,853 | ) | | | (3,637 | ) |
Accretion to redeemable non-controlling interest | | | — | | | | (29,825 | ) | | | (44,073 | ) | | | (680 | ) |
| | | | | | | | | | | | | | | | |
Net loss attributable to APGL equity shareholders | | | (1,838,202 | ) | | | (3,027,937 | ) | | | (1,452,571 | ) | | | (22,399 | ) |
| | | | | | | | | | | | | | | | |
Net loss per share attributable to APGL equity stockholders | | | | | | | | | | | | | | | | |
Basic and diluted | | | (1,046 | ) | | | (1,722 | ) | | | (111 | ) | | | (1.72 | ) |
Shares used in computing basic and diluted per share amounts: | | | | | | | | | | | | | | | | |
Weighted average shares | | | 1,758,080 | | | | 1,758,080 | | | | 13,040,618 | | | | — | |
The following table sets forth a summary of our consolidated statement of financial position as of March 31, 2015, 2016, and 2017:B. Company Overview
| | | | | | | | | | | | | | | | |
| | | As of March 31, | |
Balance Sheet data: | | 2015(1) | | | 2016(1) | | | 2017 | | | 2017(2) | |
| | | (INR) | | | (INR) | | | (INR) | | | (US$) | |
| | | (in thousands) | |
Cash, cash equivalents, and current investments available for sale | | | 2,044,290 | | | | 3,090,386 | | | | 8,757,467 | | | | 135,042 | |
Property, plant and equipment, net | | | 15,145,674 | | | | 24,381,429 | | | | 40,942,608 | | | | 631,343 | |
Total assets | | | 19,923,708 | | | | 30,890,840 | | | | 57,493,965 | | | | 886,568 | |
Compulsorily convertible debentures and Series E & Series G compulsorily convertible preferred shares(3) | | | 2,461,200 | | | | 3,600,700 | | | | — | | | | — | |
Project level and other debt(4) | | | 15,271,653 | | | | 20,487,951 | | | | 35,157,808 | | | | 542,140 | |
Mezzanine CCPS shares(5) | | | 4,689,942 | | | | 9,733,272 | | | | — | | | | — | |
Total APGL shareholders’ (deficit)/equity | | | (4,447,154 | ) | | | (7,437,447 | ) | | | 13,222,130 | | | | 203,889 | |
Total shareholders’ (deficit)/equity and liabilities | | | 19,923,708 | | | | 30,890,840 | | | | 57,493,965 | | | | 886,568 | |
Notes:
(1) | Includes consolidated financial data of AZI prior to July 2015, since, the Company was incorporated in 2015, and AZI is considered as the predecessor of the Company. |
(2) | Translation of balances in the consolidated balance sheets and the consolidated statements of operations, comprehensive loss, shareholders’ (deficit)/equity and cash flows from INR into US$, as of and for the fiscal year ended March 31, 2017 are solely for the convenience of the readers and were calculated at the rate of US$1.00 = INR 64.85, the noon buying rate in New York City for cable transfers in non U.S. currencies, as certified for customs purposes by the Federal Reserve Bank of New York on March 31, 2017. No representation is made that the INR amounts could have been, or could be, converted, realized or settled into US$ at that rate on March 31, 2017, or at any other rate. |
(3) | The Series E and Series G compulsorily convertible preferred shares were classified as a current liability in the consolidated balance sheet because the preference shareholders had a right to convert their shares into variable number of equity shares to give them their required returns. |
(4) | This balance represents the short term and long-term portion of project level secured term loans and other secured bank loans. It is net of ancillary cost of borrowing of INR 909,131 (US$ 14,019) as on March 31, 2017 and INR 438,172 million as on March 31, 2016. |
(5) | Compulsorily convertible preferred shares include the Mezzanine CCPS and are classified as temporary equity in the consolidated balance sheet. |
Note: There may be differences due to rounding
EXCHANGE RATE INFORMATION
The consolidated financial statements and other financial data included in this annual report are presented in Indian rupees. Azure Power Global Limited’s functional currencyLimited is the U.S. dollara limited liability company incorporated in Mauritius We are a renewable energy developer and reporting currency is the Indian rupee. Further, AZI’s functional currency is Indian rupees. The functional currencies of AZI’s subsidiaries are their respective local country currencies. The translation from the applicable foreign currencies of AZI’s subsidiaries into Indian rupees is performed for balance sheet accounts using the exchange rate in effect as of the balance sheet date except for shareholders’ equity, preferred shares and certain debt, which are translated at the historical rates in effect at the dates of the underlying transactions. Revenue, expense and cash flow items are translated using average exchange rates for the respective period.
U.S. dollar balances have been translated from Indian rupee amounts solely for the convenience of the readers. The following table sets forth, for each of the periods indicated, the low, average, high and period-end noon buying rates in The City of New York for cable transfers, in Indian rupees per U.S. dollar, as certified for customs purposes by the Federal Reserve Bank of New York. These rates are provided solely for your
convenience and are not necessarily the exchange rates that we used in preparation of our consolidated financial statements or elsewhere in this annual report or will use in the preparation of our periodic reports or any other information to be provided to you. We make no representation that any Indian rupee or U.S. dollar amounts referred to in this annual report could have been or could be converted into U.S. dollars or Indian rupees, as the case may be, at any particular rate or at all.
The following table sets forth information concerning exchange rates between INR and the US$ for the periods indicated:
| | | | | | | | | | | | | | | | |
| | | INR per US$
Noon Buying Rate | |
Period | | Period End | | | Average(1) | | | Low | | | High | |
2011 | | | 53.01 | | | | 46.86 | | | | 44.00 | | | | 53.71 | |
2012 | | | 54.86 | | | | 53.41 | | | | 48.65 | | | | 57.13 | |
2013 | | | 61.92 | | | | 58.91 | | | | 52.99 | | | | 68.80 | |
2014 | | | 63.04 | | | | 61.21 | | | | 58.30 | | | | 63.67 | |
2015 | | | 66.15 | | | | 64.15 | | | | 61.41 | | | | 67.10 | |
2016 | | | 67.92 | | | | 67.16 | | | | 66.05 | | | | 68.86 | |
December | | | 67.92 | | | | 67.81 | | | | 67.38 | | | | 68.29 | |
2017: | | | | | | | | | | | | | | | | |
January | | | 67.48 | | | | 68.05 | | | | 67.48 | | | | 68.39 | |
February | | | 66.67 | | | | 66.97 | | | | 66.67 | | | | 67.40 | |
March | | | 64.85 | | | | 65.80 | | | | 64.85 | | | | 66.83 | |
April | | | 64.27 | | | | 64.54 | | | | 64.08 | | | | 65.10 | |
May | | | 64.50 | | | | 64.42 | | | | 64.03 | | | | 64.87 | |
June (through June 9) | | | 64.24 | | | | 64.35 | | | | 64.24 | | | | 64.42 | |
(1) | Averages for a period other than one month are calculated by using the average of the noon buying rate at the end of each month during the period. Monthly averages are calculated by using the average of the daily noon buying rates during the relevant month. |
Source: Federal Reserve Statistical Release
B. Capitalization and Indebtedness
Not applicable
C. Reasons for the Offer and Use of Proceeds
Not applicable
D. Risk Factors
If any of the following risks actually occur, our business, financial condition, results of operations and cash flows could be materially and adversely affected. In that event, the trading price of our equity shares could decline, and you may lose part or all of your investment. This annual report also contains forward-looking information that involves risks and uncertainties. Our actual results could differ materially from those anticipated in these forward-looking statements as a result of many factors, including the risks described below and elsewhere in this annual report.
Risks Related to Us and Our Industry
We have never been profitable, and believe we may continue to incur net losses for the foreseeable future.
We have incurred losses since our inception, including a net loss of US$18.4 million for fiscal year 2017. We believe that we may continue to incur net losses as we expect to make continued significant investment in
our solar projects. As of March 31, 2017, we operated 32 utility scale projects and several commercial rooftop projects with a combined rated capacity of 651 MW. As of March 31, 2017, we were also constructing eight projects with a combined rated capacity of 354 MW and had an additional 64 MW of projects committed, bringing our total portfolio capacity to 1,069 MW. A significant number ofindependent renewable power projects are presently committed and under construction, and we can only monetize them, if at all, after each project is completed, which is subject to several factors, including receiving regulatory approvals, obtaining project funding, entering into transmission arrangements with the central or state transmission utilities, and acquiring land for projects. In addition, even after a project is operational, the monetization process may be quite long term with contracts running up to 25 years. Moreover, we may not succeed in addressing certain risks, including our ability to successfully develop or supervise the commissioning, operations and maintenance of our projects or maintain adequate control of our costs and expenses. Also, we may find that our growth plans are costlier than we anticipate and that they do not ultimately result in commensurate increases in revenue, which would further increase our losses. Additionally, we have not, and likely will not in the foreseeable future, generate sufficient cash flow required for our growth plans. We expect we may continue to experience losses, some of which could be significant. Results of operations will depend upon numerous factors, some of which are beyond our control, including the availability of preferential feed-in tariffs for solar power and other subsidies, global liquidity and competition.
The reduction, modification or elimination of central and state government subsidies and economic incentives in India may reduce the economic benefits of our existing solar projectsproducer, and our opportunities to develop or acquire suitable new solar projects.
The developmententire operations are currently in India. Our Green Bonds are listed on the Singapore Exchange (SGX) and profitability of renewable energy projects in the locations in which we operate are dependent on policy and regulatory frameworks that support such developments. The cost of generating electricity from solar energy in India currently exceeds, and very likely will continue to exceed for the foreseeable future, the cost of generating electricity from conventional energy sources such as domestic coal. These subsidies and incentives have been primarily in the form of preferential tariffs, project cost subsidies, tax incentives, tax holidays, and other incentives to end users, distributors, system integrators and manufacturers of solar energy products. For instance, the National Tariff Policy 2006 requires State Electricity Regulatory Commissions, or SERCs, to set Renewable Purchase Obligations, or RPOs, on their distribution companies of solar energy, and provides that procurement of electricity by such distribution companies must be done at preferential tariffs, which is determined by the relevant SERC from time to time. Further, the Indian Ministry of New and Renewable Energy, or the MNRE, has introduced the generation based incentive scheme to support small grid solar projects, pursuant to which the MNRE will pay incentives to the state utilities when they directly purchase solar power from project developers. Also, MNRE has introduced providing customs and excise duty exemptions to all rooftops Solar PV Power Projects for a minimum capacity of 100 kw. Further, India’s Income Tax Act, 1961 as amended, provides for certain tax benefits, including 100% tax deductions of the profits derived from generation of power for any 10 consecutive years, out ofinclude the first 15 years, beginningsolar Green Bond from the year in which project is completed. However, the exemption was only available to the projects completed on or before March 31, 2017. In addition, certain state policies also provide subsidies and economic incentives. For instance, the state policy in Punjab provides certain tax exemptions, including in relation to supply of capital goods used for setting up projects.
The availability and size of such subsidies and incentives depend, to a large extent, on political and policy developments relating to environmental concerns in India and are typically available only for a specified time. Generally, the amount of government subsidy for solar projects has been decreasing as the cost of producing energy has approached grid parity. Changes in central and state policies could lead to a significant reduction in or a discontinuation of the support for renewable energies. Reductions in government subsidies and economic incentives that apply to future solar projects could diminish the availability of our opportunities to continue to develop or acquire suitable newly developed solar projects. Such reductions may also apply retroactively to existing solar projects, which could significantly reduce the economic benefits we receive from our existing solar projects. Moreover, some of the solar program subsidies and incentives expire or decline over time, are limited in
total funding, require renewal from regulatory authorities or require us to meet certain investment or performance criteria. In addition, although various SERCs have specified RPOs for their distribution companies, the implementation of RPO schemes has not been uniform across Indian states. Although states are beginning to enforce RPOs under the guidance from the central government, RPOs have historically been breached without consequences.
Additionally, we may not continue to qualify for such subsidies and incentives. We may choose to implement other solar power projects, such as rooftop projects, that are outside the scope of such subsidies and incentives.
Further, increased emphasis on reducing greenhouse gas emissions and the possibility of trading carbon dioxide emission quotas has led to extra duties being levied on sources of energy, primarily fossil fuels, which cause carbon dioxide pollution. The imposition of these duties has indirectly supported the expansion of power generated from renewable energy and, in turn, solar projects in general. If such direct and indirect government support for renewable energy were terminated or reduced, it would make producing electricity from solar projects less competitive and reduce demand for new solar projects.
A significant reduction in the scope or discontinuation of government incentive programs in our markets could have a material adverse effect on our business, financial condition, results of operations, cash flows and prospects.
Our long term growth depends in part on the Indian government’s ability to meet its announced targeted capacity.
The Indian government increased its 2022 target for solar capacity from 20 GW to 100 GW. However, new capacity additions have historically been lower than the government’s announced targeted capacity. For example, actual capacity additions represented only 70% of the targeted capacity of 78.7GW in the Eleventh Five-Year Plan. This shortfall in capacity additions was due to issues in timely commissioning of conventional power plants, which included delays in land acquisition, obtaining regulatory permits and difficulties in securing reliable and cost efficient fuel supplies. Under the prior Five Year Plans before the Eleventh Five-Year Plan, solar capacity targets were not included.India. As such there is a short track record of meeting solar capacity targets. As for reaching target capacity for other renewable energy sources, in certain Five Year Plans those targets were met while others have fallen short. Any failure to meet the government’s targeted solar capacity may result in a slowdown in our growth opportunities and adversely affect our ability to achieve our long term business objectives, targets and goals.
Our operations are subject to extensive governmental, health, safety and environmental regulations, which require us to obtain and comply with the terms of various approvals, licenses and permits. Any failure to obtain, renew or comply with the terms of such approvals, licenses and permits in a timely manner or at all may have a material adverse effect on our results of operations, cash flows and financial condition.
The power generation business in India is subject to a broad range of environmental, health, safety and other laws and regulations. These laws and regulations require us to obtain and maintain a number of approvals, licenses, registrations and permits for developing and operating power projects. Additionally, we may need to apply for more approvals in the future, including renewal of approvals that may expire from time to time. For example, we require various approvals during construction of our solar projects and prior to the commissioning certificate is issued, including capacity allocation and capacity transfer approvals, approvals from the local pollution control boards, evacuation and grid connectivity approvals and approval from the chief electrical inspector for installation and energization of electrical installations at the solar project sites. In addition, we are required to comply with state-specific requirements. Certain approvals may not be obtained in a timely manner. Certain approvals may also be granted on a provisional basis or for a limited duration and require renewal. If the conditions specified therein are not satisfied at a later date, we may not be able to evacuate power from these projects.
In addition, we could be affected by the adoption or implementation of new safety, health and environmental laws and regulations, new interpretations of existing laws, increased governmental enforcement of
environmental laws or other similar developments in the future. For instance, we currently fall under an exemption granted to solar photovoltaic projects that exempts us from complying with the Environment Impact Assessment Notification, 2006, issued under the Environment (Protection) Act, 1986. While we are required to obtain consents to establish and operate in certain Indian states under the Water (Prevention and Control of Pollution) Act, 1974, Air (Prevention and Control of Pollution) Act, 1981, and the Hazardous Waste (Management, Handling and Transboundary Movement) Rules, 2008, certain state policies in relation to solar projects exempt us from obtaining such consents or have reduced or simplified procedural requirements for obtaining such consents. However, there can be no assurance that we will not be subject to any such consent requirements in the future, and that we will be able to obtain and maintain such consents or clearances in a timely manner, or at all, or that we will not become subject to any regulatory action on account of not having obtained or renewed such clearances in any past periods. Furthermore, our government approvals and licenses are subject to numerous conditions, some of which are onerous and require us to make substantial expenditure. We may incur substantial costs, including clean up or remediation costs, fines and civil or criminal sanctions, and third-party property damage or personal injury claims, as a result of any violations of or liabilities under environmental or health and safety laws or noncompliance with permits and approvals, which, as a result, may have an adverse effect on our business and financial condition.
We cannot assure you that we will be able to apply for or renew any approvals, licenses, registrations or permits in a timely manner, or at all, and that the relevant authorities will issue any of such approvals, licenses, registrations or permits in the time frames anticipated by us. Further, we cannot assure you that the approvals, licenses, registrations and permits issued to us would not be subject to suspension or revocation for non-compliance or alleged non-compliance with any terms or conditions thereof, or pursuant to any regulatory action. Any failure to apply for, renew and obtain the required approvals, licenses, registrations or permits, or any suspension or revocation of any of the approvals, licenses, registrations and permits that have been or may be issued to us, or any onerous conditions made applicable to us in terms of such approvals, licenses, registrations or permits may impede the successful commissioning and operations of our power projects, which may adversely affect our business, results of operations and cash flows.
Our limited operating history, especially with large-scale solar projects, may not serve as an adequate basis to judge our future prospects, results of operations and cash flows.
We began our business in 2008 and have a limited operating history. We established our first utility scale solar plant in India in 2009. As of March 31, 2017, we operated 32 utility scale projects and several commercial rooftop projects with a combined rated capacity of 651 MW. As of March 31, 2017, we were also constructing eight projects with a combined rated capacity of 354 MW and had an additional 64 MW of projects committed, bringing our total portfolio capacity to 1,069 MW. Accordingly, our relatively limited operating history may not be an adequate basis for evaluating our business prospects and financial performance, and makes it difficult to predict the future results of our operations. Period-to-period comparisons of our operating results and our results of operations for any period should not be relied upon as an indication of our performance for any future period. In particular, our results of operations, financial condition, cash flows and future success depend, to a significant extent, on our ability to continue to identify suitable sites, acquire land for solar projects, obtain required regulatory approvals, arrange financing from various sources, construct solar projects in a cost-effective and timely manner, expand our project pipeline and manage and operate solar projects that we develop. If we cannot do so, we may not be able to expand our business at a profit or at all, maintain our competitive position, satisfy our contractual obligations, or sustain growth and profitability.
Our operating results may fluctuate from quarter to quarter, which could make our future performance difficult to predict and could cause our operating results for a particular period to fall below expectations, resulting in a severe decline in the price of our equity shares.
Our quarterly operating results are difficult to predict and may fluctuate significantly in the future. We have experienced seasonal and quarterly fluctuations in the past, especially in the winter months. However, given that we are an early-stage company operating in a rapidly growing industry, those fluctuations may be masked by our
recent growth rates and thus may not be readily apparent from our historical operating results. As such, our past quarterly operating results may not be good indicators of future performance.
In addition to the other risks described in this “Risk Factors” section, the following factors could cause our operating results to fluctuate:
the expiration or initiation of any central or state subsidies or incentives;
our ability to complete installations in a timely manner due to market conditions or due to unavailable financing;
our ability to continue to expand our operations, and the amount and timing of expenditures related to such expansions;
announcements by us or our competitors of significant acquisitions, strategic partnerships, joint ventures or capital-raising activities or commitments;
changes in auction rules;
changes in feed-in tariff rates for solar power, viability gap funding, or VGF, our pricing policies or terms or those of our competitors;
actual or anticipated developments in our competitors’ businesses or the competitive landscape;
an occurrence of low global horizontal irradiation that affects our generation of solar power.
For these or other reasons, the results of any prior quarterly or annual periods should not be relied upon as indications of our future performance. In addition, our actual revenue, key operating and financial metrics and other operating results in future quarters may fall short of the expectations of investors and financial analysts, which could have a severe adverse effect on the trading price of our equity shares.
Our substantial indebtedness could adversely affect our business, financial condition, results of operations and cash flows.
As of March 31, 2017, we had US$71.0 million in current liabilities, excluding the current portion of long-term debt and short-term debt, and US$542.1 million in outstanding long-term borrowings, including the current portion of long-term debt and short-term debt. Generally, these borrowings relate to the financing for our projects and are secured by project assets.
Our debt could have significant consequences on our operations, including:
reducing the availability of our cash flow to fund working capital, capital expenditures, acquisitions and other general corporate purposes as a result of our debt service obligations;
limiting our ability to obtain additional financing;
limiting our flexibility in planning for, or reacting to, changes in our business, the industry in which we operate and the general economy;
potentially increasing the cost of any additional financing; and
limiting the ability of our project operating subsidiaries to pay dividends to us for working capital or return on our investment.
In addition, our borrowings under certain project-specific financing arrangement have floating rates of interest. Therefore, an increase or decrease in interest rates will increase or decrease our interest expense associated with such borrowing. A significant increase in interest expense could have an adverse effect on our business, financial condition, results of operations and cash flows impacting our ability to meet our payment obligations under our debt.
Any of these factors and other consequences that may result from our substantial indebtedness could have an adverse effect on our business, financial condition, results of operations and cash flows impacting our ability to meet our payment obligations under our debt. Our ability to meet our payment obligations under our outstanding debt depends on our ability to generate significant cash flow in the future. This, to some extent, is subject to general economic, financial, competitive, legislative and regulatory factors as well as other factors that are beyond our control.
Our growth prospects and future profitability depend to a significant extent on global liquidity and the availability of additional funding options with acceptable terms.
We require a significant amount of cash to fund the installation and construction of our projects and other aspects of our operations, and expect to incur additional borrowings in the future, as our business and operations grow. We may also require additional cash due to changing business conditions or other future developments, including any investments or acquisitions we may decide to pursue in order to remain competitive.
Historically, we have used loans, equity contributions, and government subsidies to fund our project development. We expect to expand our business with proceeds from third-party financing options, including any bank loans, equity partners, financial leases and securitization. However, we cannot guarantee that we will be successful in locating additional suitable sources of financing in the time periods required or at all, or on terms or at costs that we find attractive or acceptable, which may render it impossible for us to fully execute our growth plan. In addition, rising interest rates could adversely impact our ability to secure financing on favorable terms.
Installing and constructing solar projects requires significant upfront capital expenditure and there may be a significant delay before we can recoup our investments through the long-term recurring revenue of our solar projects. Our ability to obtain external financing is subject to a number of uncertainties, including:
our future financial condition, results of operations and cash flows;
the general condition of global equity and debt capital markets;
our credit ratings and past credit history;
decline of the Indian rupee compared to U.S. dollar;
regulatory and government support in the form of tax incentives, preferential tariffs, project cost subsidies and other incentives;
the continued confidence of banks and other financial institutions in our company and the solar power industry;
economic, political and other conditions in the jurisdictions where we operate; and
our ability to comply with any financial covenants under our debt financing.
Any additional equity financing may be dilutive to our shareholders and any debt financing may contain restrictive covenants that limit our flexibility going forward. Furthermore, our credit ratings may be downgraded, which would adversely affect our ability to refinance debt and increase our cost of borrowing. Failure to manage discretionary spending and raise additional capital or debt financing as required may adversely impact our ability to achieve our intended business objectives.
If we fail to comply with financial and other covenants under our loan agreements, our financial condition, results of operations, cash flows and business prospects may be materially and adversely affected.
We expect to continue to finance a significant portion of our project development and construction costs with project financing. The agreements with respect to our existing project-level indebtedness contain financial and other covenants that require us to maintain certain financial ratios or impose certain restrictions on disposition of our assets or the conduct of our business. In addition, we typically pledge our solar project assets
or account or trade receivables, and in certain cases, shares of the special purpose vehicles, to raise debt financing, and we are restricted from creating additional security over our assets. Such account or trade receivables will include all income generated from the sale of electricity in the solar projects.
Our financing agreements also include certain restrictive covenants whereby we may be required to obtain approval from our lenders to, among other things, incur additional debt, undertake guarantee obligations, enter into any scheme of merger, amalgamation, compromise, demerger or reconstruction, change our capital structure and controlling interest, dispose of or sell assets, transfer shares held by major shareholders to third parties, invest by way of share capital, lend and advance funds, declare dividends in the event of any default in repayment of debts or failure to maintain financial ratios, place deposits and change our management structure. Most of our lenders also impose significant restrictions in relation to our solar projects, under the terms of the relevant project loans taken by our respective subsidiaries. For example, we are required to obtain lenders’ consent to make any changes to, or terminate, project documents, waive any material claims or defaults under the project documents, make any changes to financing plans relating to our projects, and replace suppliers or other material project participants. There can be no assurance that such consent will be granted in a timely manner, or at all. In the event that such lender consents are granted, they may impose certain additional conditions on us, which may limit our operational flexibility or subject us to increased scrutiny by the relevant lenders. The time required to secure consents may hinder us from taking advantage of a dynamic market environment. These agreements also grant certain lenders the right to appoint nominee directors on the Board of Directors of AZI or its subsidiaries and require us to maintain certain ratings or other levels of credit worthiness. If we breach any financial or other covenants contained in any of our financing arrangements, we may be required to immediately repay our borrowings either in whole or in part, together with any related costs.
Our failure to comply with financial or restrictive covenants or periodic reporting requirements or to obtain our lenders’ consent to take restricted actions in a timely manner or at all may result in the declaration of an event of default by one or more of our lenders, which may accelerate repayment of the relevant loans or trigger cross defaults under other financing agreements. We cannot assure you that, in the event of any such acceleration, we will have sufficient resources to repay these borrowings. Failure to meet our obligations under the debt financing agreements could have an adverse effect on our cash flows, business and results of operations. Furthermore, a breach of those financial and other covenants or a failure to meet certain financial ratios under these financing agreements will also restrict our ability to pay dividends.
Any default or failure by us to repay our loans in a timely manner or at all could impact the ability of two of our directors who have personally guaranteed a portion of our loans to further guarantee their indebtedness and cause an adverse effect on our business and results of operation.
Mr. Inderpreet Singh Wadhwa and Mr. Harkanwal Singh Wadhwa have personally guaranteed one of AZI’s loan in connection with the working capital facility provided by the Central Bank of India, for a total of INR 1,980.0 million, in favor of the lender.
Mr. Inderpreet Singh Wadhwa and Mr. Harkanwal Singh Wadhwa have also provided personal guarantees in favor of the Central Bank of India for the repayment for loans of three of our project subsidiaries in the amounts of INR 217 million, INR 586 million and INR 1,201 million in addition to the payment of any interest and other monies payable to the lender.
Any default or failure by any of the three project subsidiaries to repay these loans in a timely manner, or at all, could trigger repayment obligations on the part of Mr. Inderpreet Singh Wadhwa and Mr. Harkanwal Singh Wadhwa. This could impact their ability to provide guarantee for our business.
The delay between making significant upfront investments in our solar projects and receiving revenue could materially and adversely affect our liquidity, business, results of operations and cash flows.
There are generally several months between our initial bid in renewable energy auctions to build solar projects and the date on which we begin to recognize revenue from the sale of electricity generated by such solar
projects. Our initial investments include, without limitation, legal, accounting and other third-party fees, costs associated with project analysis and feasibility study, payments for land rights, payments for interconnection and grid connectivity arrangements, government permits, engineering and procurement of solar panels, balance of system costs or other payments, which may be non-refundable. As such, projects may not be fully monetized for 25 years given the average length of our PPAs, but we bear the costs of our initial investment upfront. Furthermore, we have historically relied on our own equity contribution and bank loans to pay for costs and expenses incurred during project development. Solar projects typically generate revenue only after becoming commercially operational and starting to sell electricity to the power grid through offtakers. There may be long delays from the initial bid to projects becoming shovel-ready, due to the timing of auctions, permitting and grid connectivity process. Between our initial investment in the development of permits for solar projects and their connection to the transmission grid, there may be adverse developments, such as unfavorable environmental or geological conditions, labor strikes, panel shortages or monsoon weather. Furthermore, we may not be able to obtain all of the permits as anticipated, permits that were obtained may expire or become ineffective and we may not be able to obtain project level debt financing as anticipated. In addition, the timing gap between our upfront investments and actual generation of revenue, or any added delay in between due to unforeseen events, could put strains on our liquidity and resources, and materially and adversely affect our profitability, results of operations and cash flows.
Solar project development is challenging and our growth strategy may ultimately not be successful, which can have a material adverse effect on our business, financial condition, results of operations and cash flows.
The development and construction of solar projects involve numerous risks and uncertainties and require extensive research, planning and due diligence. We may be required to incur significant capital expenditures for land and interconnection rights, regulatory approvals, preliminary engineering, permits, and legal and other expenses before we can determine whether a solar project is economically, technologically or otherwise feasible.
We intend to expand our business significantly with a number of new projects in both new and existing jurisdictions in the future. As we grow, we expect to encounter additional challenges to our internal processes, external construction management, capital commitment process, project funding infrastructure and financing capabilities. Our existing operations, personnel, systems and internal control may not be adequate to support our growth and expansion and may require us to make additional unanticipated investments in our infrastructure. To manage the future growth of our operations, we will be required to improve our administrative, operational and financial systems, procedures and controls, and maintain, expand, train and manage our growing employee base. We will need to hire and train project development personnel to expand and manage our project development efforts. If we are unable to manage our growth effectively, we may not be able to take advantage of market opportunities, execute our business strategies successfully or respond to competitive pressures. As a result, our business, prospects, financial condition, results of operations and cash flows could be materially and adversely affected.
Success in executing our growth strategy is contingent upon, among others:
accurately prioritizing geographic markets for entry, including estimates on addressable market demand;
managing local operational, capital investment or components sourcing in compliance with regulatory requirements;
negotiating favorable payment terms with suppliers;
collecting economic incentives as expected; and
signing PPAs or other arrangements that are commercially acceptable, including adequate financing.
We may not be able to find suitable sites for the development of solar projects.
Solar projects require solar and geological conditions that are not available in all areas. Further, large, utility scale solar projects must be interconnected to the power grid in order to deliver electricity, which requires us to
find suitable sites with capacity on the power grid available. We may encounter difficulties registering certain leasehold interest in such sites. Even when we have identified a desirable site for a solar project, our ability to obtain site control with respect to the site is subject to our ability to finance the transaction and growing competition from other solar power producers that may have better access to local government support or financial or other resources. If we are unable to find or obtain site control for suitable sites on commercially acceptable terms, our ability to develop new solar projects on a timely basis or at all might be harmed, which could have a material adverse effect on our business, financial condition and results of operations. Moreover, our land leases for projects are typically for 30 to 35 years, but our PPAs are generally for a term of 25 years. If we are not able to sell the power produced by our systems after the initial PPA has expired, our liquidity and financial condition may be harmed.
We face uncertainties in our ability to acquire the rights to develop and generate power from new solar projects due to highly competitive PPA auctions and possible changes in the auction process.
We acquire the rights to develop and generate power from new solar projects through a competitive bidding process, in which we compete for project awards based on, among other things, pricing, technical and engineering expertise, financial conditions, including specified minimum net worth criteria, availability of land, financing capabilities and track record. The bidding and selection process is also affected by a number of factors, including factors which may be beyond our control, such as market conditions or government incentive programs. If we misjudge our competitiveness when submitting our bids or if we fail to lower our costs to submit competitive bids, we may not acquire the rights on new solar projects. Furthermore, we have expected prices for system components to decline as part of our bidding process, and if that does not occur, our project economics may be harmed and we may need greater subsidies to remain economically viable.
In addition, rules of the auction process may change. Each state in India has its own regulatory framework and several states have their own renewable energy policy. The rules governing the various regional power markets may change from time to time, in some cases, in a way that is contrary to our interests and adverse to our financial returns. For example, most national auctions currently use the reverse auction structure, in which several winners take part in the same project. There can be no assurance that the central and state governments will continue to allow us to utilize such bidding structures and any shift away from the current structures, such as to a Dutch auction, could increase the competition and adversely affect our business, results of operations and cash flows.
We face significant competition from traditional and renewable energy companies.
We face significant competition in the markets in which we operate. Our primary competitors are local and international developers and operators of solar projects and other renewable energy sources. We also compete with utilities generating power from conventional fossil fuels. Recent deregulation of the Indian power sector and increased private sector investment have intensified the competition we face. The Electricity Act, 2003, or the Electricity Act, removed certain licensing requirements for power generation companies, provided for open access to transmission and distribution networks and also facilitated additional capacity generation through captive power projects. These reforms provide opportunities for increased private sector participation in power generation. Specifically, the open access reform enables private power generators to sell power directly to distribution companies and, ultimately, to the end consumers, enhancing the financial viability of private investment in power generation. Competitive bidding for power procurement further increases competition among power generators and recently there have been bids that were less than INR 3.00 per kilowatt hour. Furthermore, the data released by the Central Electricity Authority in June 2016 provided that India is likely to experience surplus power for the year 2016-17. This could lead to greater pricing pressures for energy producers in the future. We cannot assure you that we will be able to compete effectively, and our failure to do so could result in an adverse effect on our business, results of operations and cash flows.
Furthermore, our competitors may have greater operational, financial, technical, management or other resources than we do and may be able to achieve better economies of scale and lower cost of capital, allowing
them to bid in the same auction at more competitive rates. Our competitors may also have a more effective or established localized business presence or a greater willingness or ability to operate with little or no operating margins for sustained periods of time. Our market position depends on our financing, development and operation capabilities, reputation and track record. Any increase in competition during the bidding process or reduction in our competitive capabilities could have a significant adverse impact on our market share and on the margins we generate from our solar projects.
Our competitors may also enter into strategic alliances or form affiliates with other competitors to our detriment. As our competitors grow in scale, they may establish in-house engineering, procurement and construction, or EPC, and operations and maintenance, or O&M, capabilities, which may offset a current advantage we may have over them. Moreover, suppliers or contractors may merge with our competitors which may limit our choices of suppliers or contractors and hence the flexibility of our overall project execution capabilities. For example, some of our competitors may have their own internal solar panel manufacturing capabilities. As the solar energy industry grows and evolves, we will also face new competitors who are not currently in the market. There can be no assurance that our current or potential competitors will not win bids for solar projects or offer services comparable or superior to those that we offer at the same or lower prices or adapt to market demand more quickly than we do. Increased competition may result in price reductions, reduced profit margins and loss of market share.
In addition, we face competition from developers of other renewable energy facilities, including wind, biomass, nuclear and hydropower. If these non-solar renewable sources become more financially viable, our business, financial condition and results of operations could be adversely affected. Competition from such producers may increase if the technology used to generate electricity from these other renewable energy sources becomes more sophisticated, or if the Indian government elects to further strengthen its support of such renewable energy sources relative to solar energy. As we also compete with utilities generating power from conventional fossil fuels, a reduction in the price of coal or diesel would make the development of solar energy less economically attractive and we would be at a competitive disadvantage.
Any constraints in the availability of the electricity grid, including our inability to obtain access to transmission lines in a timely and cost-efficient manner could adversely affect our business, results of operations and cash flows.
Distributing power to a purchaser is our responsibility. We generally rely on transmission lines and other transmission and distribution facilities that are owned and operated by the respective state governments or public entities. Where we do not have access to available transmission and distribution networks, we may engage contractors to build transmission lines and other related infrastructure. In such a case, we will be exposed to additional costs and risks associated with developing transmission lines and other related infrastructure, such as the ability to obtain right of way from land owners for the construction of our transmission lines, which may delay and increase the costs of our projects. We may not be able to secure access to the available transmission and distribution networks at reasonable prices, in a timely manner or at all.
Further, some of our projects may have limited access to transmission and distribution networks. India’s physical infrastructure, including its electricity grid, is less developed than that of many developed countries. As a result of grid constraints, such as grid congestion and restrictions on transmission capacity of the grid, the transmission and dispatch of the full output of our projects may be curtailed, particularly because we are required to distribute power to customers across long distances from our project sites. We may have to stop producing electricity during the period when electricity cannot be transmitted. Such events could reduce the net power generation of our projects. If construction of renewable energy projects outpaces transmission capacity of electricity grids, we may be dependent on the construction and upgrade of grid infrastructure by the government or public entities. We cannot assure you that the relevant government or public entities will do so in a timely manner, or at all. The curtailment of our power projects’ output levels will reduce our electricity output and limit operational efficiencies, which in turn could have an adverse effect on our business, results of operations and cash flows.
There are a limited number of purchasers of utility scale quantities of electricity which exposes us and our utility scale projects to risk.
In fiscal year 2016 and 2017, we derived 88.2% and 82.6%, respectively, of our revenue from our top five customers, respectively. Since the transmission and distribution of electricity are either monopolized or highly concentrated in most jurisdictions, there are a limited number of possible purchasers for utility scale quantities of electricity in a given geographic location, including transmission grid operators and central and state run utilities. For instance, for projects established pursuant to the Jawaharlal Nehru National Solar Mission, or NSM, solar project developers are required to enter into PPAs with specified implementation agencies. As a result, there is a concentrated pool of potential buyers for electricity generated by our plants and projects, which may restrict our ability to negotiate favorable terms under new PPAs and could impact our ability to find new customers for the electricity generated by our generation facilities should this become necessary.
Furthermore, if the financial condition of these utilities and/or power purchasers deteriorate or the NSM or other solar policy to which they are currently subject and that compel them to source renewable energy supplies change, demand for electricity produced by our plants could be negatively impacted.
Counterparties to our PPAs may not fulfill their obligations which could result in a material adverse impact on our business, financial condition, results of operations and cash flows.
We generate electricity income primarily pursuant to PPAs entered into with central and state government-run utilities. Some of the customers may become subject to insolvency or liquidation proceedings during the term of the relevant contracts, and the credit support received from such customers may not be sufficient to cover our losses in the event of a failure to perform. There may also be delays associated with collection of receivables from government owned or controlled entities on account of the financial condition of these entities that deteriorated significantly in the past. Where we are selling power to non-governmental entities, we take into account the credit ratings assigned by rating agencies and our ability in the past to collect when assessing the counterparties’ creditworthiness. Governmental entities to which we sell power do not have credit ratings, so there are no credit ratings to consider. For illustrative purposes, Moody’s Investor Services Inc. and Standard and Poor’s Financial Services LLC have rated the Government of India Baa3 and BBB-, respectively. As a result, many of the state governments in India, if rated, would likely rate lower than the Government of India. Although the central and state governments in India have taken steps to improve the liquidity, financial condition and viability of state electricity distribution utility companies, there can be no assurance that the utility companies that are currently our customers will have the resources to pay on time or at all.
In addition, our PPA customers may, for any reason, become unable or unwilling to fulfill their related contractual obligations, refuse to accept delivery of power delivered thereunder or otherwise terminate such agreements prior to the expiration thereof. If such events occur, our assets, liabilities, business, financial condition, results of operations and cash flows could be materially and adversely affected. For instance, Gujarat Urja Vikas Nigam Limited had filed a petition with the Gujarat Electricity Regulatory Commission, seeking recalculation on the basis of actual cash flow required for development of solar projects and consequent revision of the tariff payable by it, in relation to certain solar power projects including our 10 MW Gujarat 1 project. While the Gujarat Electricity Regulatory Commission and the Appellate Tribunal for Electricity dismissed the claims made by Gujarat Urja Vikas Nigam Limited, an appeal is pending with the Supreme Court of India.
Furthermore, to the extent any of our customers are, or are controlled by, governmental entities, bringing actions against them to enforce their contractual obligations is often difficult. Also, our facilities may be subject to legislative or other political action that may impair their contractual performance.
Our PPAs may expose us to certain risks that may affect our future results of operations and cash flows.
Our profitability is largely a function of our ability to manage our costs during the terms of our PPAs and operate our power projects at optimal levels. If we are unable to manage our costs effectively or operate our
power projects at optimal levels, our business and results of operations may be adversely affected. In the event we default in fulfilling our obligations under the PPAs, such as supplying the minimum amount of power specified in some of the PPAs or failing to obtain regulatory approvals, licenses and clearances with respect to our solar projects, we may be liable for penalties and in certain specified events, customers may also terminate such PPAs. Further, any failure to supply power from the scheduled commercial operation date my result in levy of liquidated damages and encashment of bank guarantees provided by us under the terms of certain PPAs. The termination of any of our projects by our customers would adversely affect our reputation, business, results of operations and cash flows.
Under a long-term PPA, we typically sell power generated from a power plant to state distribution companies at pre-determined tariffs. Our PPAs are generally not subject to downward revisions unless we elect to utilize accelerated rate of depreciation or if there is a delay in commissioning our projects, although we have entered into contracts that provide for downward adjustments in the past and may do so in the future. Accordingly, if there is an industry-wide increase in tariffs or if we are seeking an extension of the term of the PPA, we will not be able to renegotiate the terms of the PPA to take advantage of the increased tariffs. In addition, in the event of increased operational costs, we will not have the ability to reflect a corresponding increase in our tariffs. Further, any delay in commissioning projects or supplying electricity during the term of the PPA may result in reduction in tariffs, based on the terms of the PPA. Therefore, the prices at which we supply power may have little or no relationship with the costs incurred in generating power, which may lead to fluctuations in our margins. The above factors all limit our business flexibility, expose us to an increased risk of unforeseen business and industry changes and could have an adverse effect on our business, results of operations and cash flows.
The term of some of our PPAs are also less than the life of the power projects they are tied to. We will need to enter into other offtake agreements, or seek renewals or extensions of the existing PPAs, for the balance of the life of those power projects. Moreover, there are often other restrictions on our ability to, among other things, sell power to third parties and undertake expansion initiatives with other consumers. Failure to enter into or renew offtake arrangements in a timely manner and on terms that are acceptable to us could adversely affect our business, results of operations and cash flows. There could also be negative accounting consequences if we are unable to extend or replace expiring PPAs, including writing down the carrying value of assets at such power project sites.
Additionally, under the PPAs, our remedies in case of delays in payment by our customers may also be limited. For example, certain PPAs only permit us to terminate the PPA on account of non-payment of dues upon 90 days of our inability to recover such dues. Such risks limit our business flexibility, expose us to an increased risk of unforeseen business and industry changes and could have an adverse effect on our business, results of operations and cash flows.
In addition, most of the government agencies we enter into PPAs with under the NSM or the relevant state policies require us to agree to their standard form contracts and we cannot negotiate for commercial terms or other terms of funding that are more favorable to us.
Land title in India can be uncertain and we may not be able to identify or correct defects or irregularities in title to the land which we own, lease or intend to acquire in connection with the development or acquisition of our power projects. Additionally, certain land on which our power projects are located may be subject to onerous conditions which may adversely affect its use.
There is no central title registry for real property in India and the documentation of land records in India has not been fully computerized. Property records in India are generally maintained at the state and district level and in local languages, and are updated manually through physical records. Therefore, property records may not be available online for inspection or updated in a timely manner, may be illegible, untraceable, incomplete or inaccurate in certain respects, or may have been kept in poor condition, which may impede title investigations or
our ability to rely on such property records. In addition, there may be a discrepancy between the duration of the principal lease under different orders issued by state governments in respect of a particular parcel of revenue land. Furthermore, title to land in India is often fragmented, and in many cases, land may have multiple owners. Title may also suffer from irregularities, such as non-execution or non-registration of conveyance deeds and inadequate stamping, and may be subjected to encumbrances that we are unaware of. Any defects in, or irregularities of, title may result in a loss of development or operating rights over the land, which may prejudice the success of our power projects and require us to write off substantial expenditures in respect of our power projects.
Further, improperly executed, unregistered or insufficiently stamped conveyance instruments in a property’s chain of title, unregistered encumbrances in favor of third parties, rights of adverse possessors, ownership claims of family members of prior owners or third parties, or other defects that a purchaser may not be aware of can affect title to a property. As a result, potential disputes or claims over title to the land on which our power projects are or will be constructed may arise. However, an adverse decision from a court or the absence of an agreement with such third parties may result in additional costs and delays in the construction and operating phases of any solar projects situated on such land. Also, such disputes, whether resolved in our favor or not, may divert management’s attention, harm our reputation or otherwise disrupt our business.
In addition, some properties used for our solar projects are subject to other third-party rights such as right of passage and right to place cables and other equipment on the properties, which may result in certain interferences with our use of the properties. Our rights to the properties used for our solar projects may be challenged by property owners and other third parties for various other reasons as well. For example, we do not always have the exclusive right to use a given site. Any such challenge, if successful, could impair the development or operations of our solar projects on such properties.
Additionally, the power projects that we may develop or acquire in the future may be located on land that may be subject to onerous conditions under the lease agreements through which we acquire rights to use such land and rights of way. Furthermore, the government may exercise its rights of eminent domain, or compulsory acquisition in respect of land on which our projects are or will be located. Any of this may adversely affect our business, results of operations and cash flows in the future.
A certain portion of the land on which our solar projects are or will be located, are not owned by us. In the event we are unable to purchase the land, or enter into or renew lease agreements, our business, results of operations, cash flows and financial condition could be adversely affected.
Some of our solar projects are located, or will be located, on revenue land that is owned by the state governments or on land acquired or to be acquired from private parties. The timeline for transfer of title in the land is dependent on the type of land on which the power projects are, or will be, located, and the policies of the relevant state government in which such land is located. In the case of land acquired from private parties, which is agricultural land, the transfer of such land from agriculturalists to non-agriculturalists such as us and the use of such land for non-agricultural purposes may require an order from the relevant state land or revenue authority allowing such transfer or use. For revenue land, we obtain a lease from the relevant government authority.
We cannot assure you that the outstanding approvals would be received, or that lease or sub-lease deeds would be executed in a timely manner, such that the operation of our solar projects will continue unaffected. In certain cases, any delay in the construction or commissioning of a solar project may result in termination of the lease. Further, the terms of lease and sub-lease agreements may also not be co-terminus with the lifetime of the power projects, taken together with the period of time required for construction and commissioning of the project. Accordingly, we will have to obtain extensions of the terms of such leases and sub-leases for the remainder of the terms of the corresponding PPAs. In the event that the relevant state authorities do not wish to renew the lease or sub-lease agreements, we may be forced to remove our equipment at the end of the lease and our business, results of operations, cash flows and financial condition could be adversely affected.
If sufficient demand for solar projects does not develop or takes longer to develop than we anticipate, our business, financial condition, results of operations, cash flows and prospects could be materially and adversely affected.
The solar power market is at a relatively early stage of development in many of the markets that we have entered or intend to enter. This is especially true in the rooftop and micro-grid solar markets. The solar energy industry continues to experience improved efficiency and higher electricity output. However, trends in the solar energy industry are based only on limited data and may not be reliable. Many factors may affect the demand for solar projects in India, including:
fluctuations in economic and market conditions that affect the viability of conventional and non-solar renewable energy sources;
the cost and reliability of solar projects compared to conventional and other renewable energy sources;
the availability of grid capacity to dispatch power generated from solar projects;
public perceptions of the direct and indirect benefits of adopting renewable energy technology; and
regulations and policies governing the electric utility industry that may present technical, regulatory and economic barriers to the purchase and use of solar energy.
If market demand for solar projects fails to develop sufficiently, our business, financial condition, results of operations, cash flows and prospects could be materially and adversely affected.
If we are unsuccessful in our efforts to establish and/or maintain our compliance with the local content requirements in certain states, our financial results could be adversely affected.
In some cases, we are required by the central government in national auctions to procure solar panels solely from Indian manufacturers. Certain states or others may, in the future, require us to procure a defined portion of our solar system components from their designated geographical locales. Such requirements are commonly referred to as “local content requirements.” In order to satisfy these local content requirements, we may need to undertake localization initiatives in such geographical locale. Some of our competitors with more significant capital resources may implement or expedite their own localization efforts in these geographical locale, and those efforts may result in competitive advantages for them. We may be faced with shortages or quality issues if projects we bid on impose local content requirements. Our costs may also be higher as a result of these requirements. Our failure to successfully implement appropriate localization initiatives, or otherwise acquire and maintain the capability to satisfy applicable local content requirements, could result in our losing business to our competitors and/or our breaching the terms of agreements, potentially resulting in damages, including monetary penalties. Depending on the value to us of lost business or the amounts of any contractual penalties, these consequences could have a material adverse effect on our results of operations and cash flows.
We may incur unexpected expenses if the suppliers of components in our solar projects default in their warranty obligations.
The solar panels, inverters, modules and other system components utilized in our solar projects are generally covered by manufacturers’ warranties, which are typically for 5 to 25 years. In the event any such components fail to operate as required, we may be able to make a claim against the applicable warranty to cover all or a portion of the expense or losses associated with the faulty component. However, the warranties may not be sufficient to cover all of our expense and losses. In addition, these suppliers could cease operations and no longer honor the warranties, which would leave us to cover the expense and losses associated with the faulty component. Our business, financial condition, results of operations and cash flows could be materially and adversely affected if we cannot recover the expense and losses associated with the faulty component from these warranty providers.
Our construction activities may be subject to cost overruns or delays.
Construction of our solar projects may be adversely affected by circumstances outside of our control, including inclement weather, adverse geological and environmental conditions, a failure to receive regulatory approvals on schedule or third-party delays in providing supplies and other materials. Changes in project plans or designs, or defective or late execution may increase our costs from our initial estimates and cause delays. Increases in the prices of our materials may increase procurement costs. Labor shortages, work stoppages or labor disputes could significantly delay a project, increase our costs or cause us to breach our performance guarantees under our PPAs, particularly because strikes are not considered a force majeure event under many of our PPAs. Moreover, local political changes and delays, for instance, caused by state and local elections, as well as demonstrations or protests by local communities and special interest groups could result in, or contribute to, project time and cost overruns for us.
In addition, we sometimes utilize and rely on third-party sub-contractors to construct and install portions of our solar projects. If our sub-contractors do not satisfy their obligations or do not perform work that meets our quality standards or if there is a shortage of third-party sub-contractors or if there are labor strikes that interfere with the ability of our employees or contractors to complete their work on time or within budget, we could experience significant delays or cost overruns.
We may not be able to recover any of these losses in connection with construction cost overruns or delays. Certain PPAs require that we connect to the transmission grid by a certain date. If the solar project is significantly delayed, such PPAs may be terminated. In addition, if we are unable to meet our performance guarantees, most of our PPAs require us to pay liquidated damages to the offtaker in proportion to the amount of power not supplied, and also grant the offtaker a right to draw on bank guarantees posted by us, including up to 100% of certain bank guarantees. Also, certain PPAs provide that we are liable for government fines and penalties if we fail to deliver electricity required by the offtakers to meet their RPO requirements. Furthermore, in the case of projects with VGF, which is paid out typically over two to five years, if the project fails to generate power for a long period of time, the government agency can suspend the VGF and demand repayment of previously paid sums.
Any of the contingencies discussed above could lead us to fail to generate our expected return from our solar projects and result in unanticipated and significant revenue and earnings losses.
Operation of power generation facilities involves significant risks and hazards that could have a material adverse effect on our business, financial condition, results of operations and cash flows. We may not have adequate insurance to cover these risks and hazards.
Power generation involves hazardous activities, including delivering electricity to transmission and distribution systems. In addition to natural risks such as earthquake, flood, lightning, hurricane and wind, other hazards, such as fire, structural collapse and machinery failure are inherent risks in our operations. These and other hazards can cause significant personal injury or loss of life, severe damage to and destruction of property, plant and equipment and contamination of, or damage to, the environment and suspension of operations. The occurrence of any one of these events may result in our being named as a defendant in lawsuits asserting claims for substantial damages, including for environmental cleanup costs, personal injury and property damage and fines and/or penalties. We maintain an amount of insurance protection that we consider adequate but we cannot provide any assurance that our insurance will be sufficient or effective under all circumstances and against all hazards or liabilities to which we may be subject. Furthermore, our insurance coverage is subject to deductibles, caps, exclusions and other limitations. A loss for which we are not fully insured could have a material adverse effect on our business, financial condition, results of operations or cash flows. Further, due to rising insurance costs and changes in the insurance markets, we cannot provide any assurance that our insurance coverage will continue to be available at all or at rates or on terms similar to those presently available. Any losses not covered by insurance could have a material adverse effect on our business, financial condition, results of operations and cash flows.
Maintenance and expansion of power generation facilities involve significant risks that could result in reduced power generation and financial results.
Our facilities may require periodic upgrading and improvement. Any unexpected operational or mechanical failure, including failure associated with breakdowns and forced outages, and any decreased operational or management performance, could reduce our facilities’ generating capacity below expected levels and reduce our revenues as a result of generating and selling less power. Degradation of the performance of our solar facilities above levels provided for in the related PPAs may also reduce our revenues. Unanticipated capital expenditures associated with maintaining, upgrading or repairing our facilities may also reduce profitability, especially because our costs are fixed in the PPAs and we may not pass through any unexpected costs in relation to the projects to our customers. Furthermore, we are not able to mitigate such project risks by shifting some or all of the risk to a third-party EPC or O&M contractor since we provide these services in-house.
Changes in technology may require us to make additional capital expenditures to upgrade our facilities. The development and implementation of such technology entails technical and business risks and significant costs of employee implementation.
The loss of one or more members of our senior management or key employees may adversely affect our ability to implement our strategy.
Our future success depends on the continued services and performances of the members of our management in our business for project implementations, management and running of our daily operations and the planning and execution of our business strategy. We depend on our experienced management team, and the loss of one or more key executives could have a negative impact on our business. We also depend on our ability to retain and motivate key employees and attract qualified new employees. Neither our executive officers nor our key employees are bound by employment agreements for any specific term, and we may be unable to replace key members of our management team and key employees in the event we lose their services. There is intense competition for experienced management personnel with technical and industry expertise in the renewable energy business and if we lose the services of any of these individuals and are unable to find suitable replacements in a timely manner, our ability to realize our strategic objectives could be impaired. Integrating new employees into our management team could prove disruptive to our operations, require substantial resources and management attention and ultimately prove unsuccessful. An inability to attract and retain sufficient managerial personnel who have critical industry experience and relationships could limit or delay our strategic efforts, which could have a material adverse effect on our business, financial condition, results of operations and cash flows.
The generation of electricity from solar sources depends heavily on suitable meteorological conditions. If solar conditions are unfavorable, our electricity generation, and therefore revenue from our solar projects, may be substantially below our expectations.
The electricity produced and revenues generated by our solar projects are highly dependent on suitable solar conditions and associated weather conditions, which are beyond our control. Furthermore, components of our systems, such as solar panels and inverters, could be damaged by severe weather, such as hailstorms, tornadoes or lightning strikes. We generally will be obligated to bear the expense of repairing the damaged solar energy systems that we own, and replacement and spare parts for key components may be difficult or costly to acquire or may be unavailable. Unfavorable weather and atmospheric conditions could impair the effectiveness of our assets or reduce their output beneath their rated capacity or require shutdown of key equipment, impeding operation of our solar assets and our ability to achieve certain performance guarantees pursuant to our PPAs, forecasted revenues and cash flows. Sustained unfavorable weather could also unexpectedly delay the installation of solar energy systems, which could result in a delay in us acquiring new projects or increase the cost of such projects. We guarantee the performance of our solar power plants and could suffer monetary consequences if our plants do not produce to our contracted levels.
We base our investment decisions with respect to each solar project on the findings of related solar studies conducted on-site prior to construction. However, actual climatic conditions at a project site may not conform to
the findings of these studies and therefore, our facilities may not meet anticipated production levels or the rated capacity of our generation assets, which could adversely affect our business, financial condition, results of operations and cash flows.
Fluctuations in foreign currency exchange rates may negatively affect our revenue, cost of sales and gross margins and could result in exchange losses.
As the functional currency of our Indian subsidiaries is the Indian rupee, our operating expenses are denominated primarily in Indian rupees. However, some of our capital expenditures, and particularly those for equipment imported from international suppliers, such as solar panels, are denominated in foreign currencies. To the extent that we are unable to match revenue received in our functional currency with costs paid in foreign currencies, exchange rate fluctuations in any such currency could have an adverse effect on our profitability. Substantially all of our cash flows are generated in Indian rupees and, therefore, significant changes in the value of the Indian rupee relative to the other foreign currencies could have a material adverse effect on our financial condition and our ability to meet interest and principal payments on debts. In addition to currency translation risks, we incur currency transaction risks whenever we or one of our projects enter into a purchase or sales transaction using a currency other than the Indian rupee. We expect our future capital expenditures in connection with our proposed expansion plans to include significant expenditures in foreign currencies for imported equipment and machinery.
A significant fluctuation in the Indian rupee and U.S. dollar and other foreign currency exchange rates could therefore have a significant impact on our other results of operations. The exchange rate between the Indian rupee and these currencies, primarily the U.S. dollar, has fluctuated in the past and any appreciation or depreciation of the Indian rupee against these currencies can impact our profitability and results of operations. Our results of operations have been impacted by such fluctuations in the past and may be impacted by such fluctuations in the future. For example, the Indian rupee has depreciated against the U.S. dollar in four of the last five years, which may impact our results of operations in future periods. Such depreciation impacts the value of your investment. Furthermore, we have borrowings denominated in U.S. dollars and, as such, an annual decline in the rupee against the U.S. dollar effectively adds to the functional interest rate of our borrowings. Any amounts we spend in order to hedge the risks to our business due to fluctuations in currencies may not adequately hedge against any losses we incur due to such fluctuations.
The accounting treatment for many aspects of our solar projects is complex and any changes to the accounting interpretations or accounting rules governing our solar projects could have a material adverse effect on our U.S. GAAP reported results of operations and financial condition.
The accounting treatment for many aspects of our solar projects is complex, and our future results could be adversely affected by changes in the accounting treatment applicable to our solar projects. In particular, any changes to the accounting rules regarding the following matters may require us to change the manner in which we operate and finance our solar projects:
foreign loans accounting;
derivative contracts;
asset retirement obligations;
share based compensation;
revenue recognition and related timing;
accounting for convertible debt and equity instruments;
income taxes;
foreign holding company tax treatment;
regulated operations; and
government grants.
Our international corporate structure and operations require us to comply with anti-corruption laws and regulations of the United States government and various non-U.S. jurisdictions. If we are not in compliance with applicable legal requirements, we may be subject to civil or criminal penalties and other remedial measures.
We are subject to the U.S. Foreign Corrupt Practices Act, or the FCPA, which prohibits, in relevant part, U.S. nationals, companies that have securities registered in the U.S. and any officer, director, employee, or agent of such issuer or any shareholder thereof acting on behalf of such issuer from bribing foreign officials for the purpose of obtaining or keeping business or otherwise obtaining favorable treatment and imposes obligations to keep accurate books and records and maintain appropriate internal controls. We have been and will continue to be subject to anti-corruption, anti-bribery and anti-facilitation payment legislation in other jurisdictions, which in certain circumstances go beyond the scope of the FCPA rules and regulations, including in India.
The current and future jurisdictions in which we operate our business may have experienced governmental corruption to some degree, and, in certain circumstances, strict compliance with anti-bribery and anti-facilitation payment laws may conflict with local customs and practices, which is likely to negatively impact our results of operations. We have developed and implemented formal controls and procedures to ensure that we are in compliance with the FCPA as well as anti-corruption, anti-bribery and anti-facilitation payment laws. However, compliance with these new controls and procedures could make it more difficult for us to obtain timely permits or otherwise complete our projects on schedule in jurisdictions where strict compliance with anti-corruption and anti-bribery laws may conflict with local customs and practices.
Any historic or future violations of these laws, regulations and procedures by our employees, independent contractors, subcontractors and agents could be costly and time-consuming to investigate and expose us to administrative, civil or criminal penalties or fines (including under U.S. and Indian laws and regulations as well as foreign laws). If we were to be investigated for, charged with, or convicted of, violating these laws and regulations, our reputation could be harmed and it could cause some of our investors to sell their interests in our company to be consistent with their internal investment policies or to avoid reputational damage, and some investors might forego the purchase of our equity shares, all of which may negatively impact the trading prices of our equity shares. In addition, any administrative, civil or criminal penalties or fines could have a material adverse effect on our business results of operations and cash flows.
We may become involved in costly and time-consuming litigation and other regulatory proceedings, which require significant attention from our management.
We are not involved in any material litigation, administrative or arbitral proceedings. However, we may, in the ordinary course of our business, become involved in such proceedings. For example, we are, and may become subject to additional demands from Indian governmental or tax authorities, including, but not limited to, on account of differing interpretations of central and state tax statutes in India, which are extensive and subject to change from time to time. Changes in regulations or tax policies, or adoption of differing interpretations of existing provisions, and enforcement thereof by governmental, taxation or judicial authorities in India may become the subject of legal proceedings involving us from time to time.
Additionally, claims may be brought against or by us from time to time regarding, for example, defective or incomplete work, defective products, personal injuries or deaths, damage to or destruction of property, breach of warranty, late completion of work, delayed payments, intellectual property rights or regulatory compliance, and may subject us to litigation, arbitration and other legal proceedings, which may be expensive, lengthy, disruptive to normal business operations and require significant attention from our management.
If we were found to be liable on any of the claims against us, we would incur a charge against earnings to the extent a reserve had not been established for coverage. If amounts ultimately realized from the claims by us
were materially lower than the balances included in our financial statements, we would incur a charge against earnings to the extent profit had already been accrued. Charges and write-downs associated with such legal proceedings could have a material adverse effect on our financial condition, results of operations and cash flow. Moreover, legal proceedings, particularly those resulting in judgments or findings against us, may harm our reputation and competitiveness in the market.
Employee shortages and rising employee costs may harm our business and increase our operation costs.
As of March 31, 2017, we employed 401 persons to perform a variety of functions in our daily operations. The low cost workforce in India provides us with a cost advantage. However, we have observed an overall tightening of the employee market and an emerging trend of shortage of skilled labor. Failure to obtain stable and dedicated employee support may cause disruption to our business that harms our operations. Furthermore, employee costs have increased in India in recent years and may continue to increase in the near future. To remain competitive, we may need to increase the salaries of our employees to attract and retain them. Our employee payroll and related costs amounted to US$5.1 million, and US$7.8 million in fiscal years 2016 and 2017, respectively. Any increase in employee costs may harm our operating results, cash flows and financial condition.
The results of the United Kingdom’s referendum on withdrawal from the European Union may have a negative effect on global economic conditions, financial markets and our business.
In June 2016, a majority of voters in the United Kingdom elected to withdraw from the European Union in a national referendum. The referendum was advisory, and the terms of any withdrawal are subject to a negotiation period that could last at least two years after the government of the United Kingdom formally initiates a withdrawal process. Nevertheless, the referendum has created significant uncertainty about the future relationship between the United Kingdom and the European Union, including with respect to the laws and regulations that will apply as the United Kingdom determines which European Union laws to replace or replicate in the event of a withdrawal. The referendum has also given rise to calls for the governments of other European Union member states to consider withdrawal. These developments, or the perception that any of them could occur, have had and may continue to have a material adverse effect on global economic conditions and the stability of global financial markets, and may significantly reduce global market liquidity and restrict the ability of key market participants to operate in certain financial markets. Any of these factors could depress economic activity and restrict our access to capital, which could have a material adverse effect on our business, financial condition and results of operations and reduce the price of our equity shares.
Risks Related to Operations in India
Substantially all of our business and operations are located in India and we are subject to regulatory, economic, socialregulation in four jurisdictions: the United States, where Azure Power shares is a reporting company with the SEC; Mauritius, where Azure Power is incorporated; Singapore, where our Green Bonds are traded; and political uncertainties in India.
Substantially all ofIndia, where we operate. On November 13, 2023 our business and employees are located in India, and we intendshares were delisted from NYSE. On January 29, 2024, the Company’s shares ceased to continuebe registered with the SEC pursuant to develop and expand our business in India. Consequently, our financial performance and the market price of our equity shares will be affected by changes in exchange rates and controls, interest rates, changes in government policies, including taxation policies, social and civil unrest and other political, social and economic developments in or affecting India.
An election or a new administration could result in uncertainty in the solar market, which could harm our operations. For example, we saw a slowdown in the solar market in fiscal year 2014 as a result of it leading up to an election year with uncertainty about the level of government support for solar initiatives going forward.
The Indian government has exercised and continues to exercise significant influence over many aspectsSection 12(b) of the Indian economy. Since 1991, successive Indian governments have generally pursued policies of economic liberalization and financial sector reforms, including by significantly relaxing restrictions on the private sector. Nevertheless, the role of the Indian central and state governments in the Indian economy as producers, consumers
and regulators has remained significant and we cannot assure you that such liberalization policies will continue. The rate of economic liberalization could change, and specific laws and policies affecting solar power producers, foreign investments, currency exchange rates and other matters affecting investments in India could change as well, including exposure to possible expropriation, nationalization or other governmental actions.
Further, protests against privatizations and government corruption scandals, which have occurred in the past, could slow the pace of liberalization and deregulation. A significant change in India’s policy of economic liberalization and deregulation or any social or political uncertainties could significantly harm business and economic conditions in India generally and our business and prospects.
The extent and reliability of Indian infrastructure could significantly harm our results of operations, cash flows and financial conditions.
India’s physical infrastructure is less developed than that of many developed nations. Any congestion or disruption with respect to communication systems or any public facility, including transportation infrastructure, could disrupt our normal business activity. Any deterioration of India’s physical infrastructure would harm the national economy, disrupt the transportation of people, goods and supplies, and add costs to doing business in India. These disruptions could interrupt our business operations and significantly harm our results of operations, cash flows and financial condition. For the risk of congestion or disruption with respect to India’s electricity grid and transmission lines, see “Item 3. Key Information — D. Risk Factors — Risks Related to Us and Our Industry — Any constraints in the availability of the electricity grid, including our inability to obtain access to transmission lines in a timely and cost-efficient manner, could adversely affect our business, results of operations and cash flows.”
A slowdown in economic growth in India could cause our business to suffer.
Since inception, all of our revenue has been derived directly from sales by AZI and its various other subsidiaries in India. In addition, the CIA World Factbook estimates that consumer inflation in India was approximately 5.6% in 2016. The performance and growth of our business are necessarily dependent on economic conditions prevalent in India, which may be significantly harmed by political instability or regional conflicts, a general rise in interest rates, inflation and economic slowdown elsewhere in the world or otherwise. The Indian economy also remains largely driven by the performance of the agriculture sector which depends on the quality of monsoon, which is difficult to predict. Although the Indian economy has continued to grow in the past few years, any future slowdown in the Indian economy or a further increase in inflation could have a material adverse effect on the demand for power and, as a result, on our financial condition, results of operations and cash flows.
India’s trade relationships with other countries and its trade deficit may significantly harm Indian economic conditions. If trade deficits increase or are no longer manageable because of an unexpected rise in global crude oil prices or otherwise, the Indian economy, and therefore our business, our financial performance and the price of our equity shares could be significantly harmed.
India also faces major challenges in sustaining its growth, which include the need for substantial infrastructure development and improving access to healthcare and education. If India’s economic growth cannot be sustained or otherwise slows down significantly, our business and prospects could be significantly harmed.
Stringent labor laws may harm our ability to have flexible human resource policies and labor union problems could negatively affect our processing capacity, construction schedules, cash flows and overall profitability.
India has stringent labor legislation that protects the interests of workers, including legislation that sets forth detailed procedures for dispute resolution and employee removal, imposes financial obligations on employers upon employee layoffs and regulates contract labor. These laws may restrict our ability to have human resource policies that would allow us to react swiftly to the needs of our business, discharge employees or downsize. We
may also experience labor unrest in the future, which may delay our construction schedules or disrupt our operations. If such delays or disruptions occur or continue for a prolonged period of time, our processing capacity and overall profitability could be negatively affected. We also depend on third party contract labor. It is possible under Indian law that we may be held responsible for wage payments to these laborers if their contractors default on payment. We may be held liable for any non-payment by contractors and any such order or direction from a court or any other regulatory authority may harm our business, results of our operations and cash flows.
Foreign investment laws in India include certain restrictions, which may affect our future acquisitions or investments in India.
India regulates ownership of Indian companies by non-residents, although some restrictions on foreign investment have been relaxed in recent years. Under current Indian regulations, transfers of shares between non-residents and residents are permitted (subject to certain exceptions) if they comply with, among other things, the guidelines specified by the Reserve Bank of India in relation to pricing and valuation of such shares and certain reporting requirements for such transactions specified by the Reserve Bank of India. If the transfer of shares is not in compliance with such pricing guidelines or reporting requirements, or falls under any of the exceptions specified by the Reserve Bank of India, the prior approval of the Reserve Bank of India will be required before any such transfer may be consummated. We may not be able to obtain any required approval from the Reserve Bank of India or any other Indian regulatory authority on any particular terms or at all.
For example, under its consolidated foreign direct investment policy, the Indian government has set out additional requirements for foreign investments in India, including requirements with respect to downstream investments by Indian companies owned or controlled by non-resident entities and the transfer of ownership or control, from resident Indian persons or entities to non-residents, of Indian companies in sectors with limits on foreign investment. As substantially all of AZI’s equity shares are directly held by Azure Power Global Limited, it would be considered an entity owned and controlled by non-residents under applicable Indian laws. Accordingly, any downstream investment by Azure Power Global Limited into another Indian company will have to be in compliance with conditions applicable to such Indian entity, in accordance with the consolidated foreign direct investment policy. There are guidelines in relation to pricing and valuation of shares and restrictions on sources of funding for such investments. While these guidelines currently do not materially limit our planned investments in our Indian subsidiaries, to the extent they become more restrictive, they may restrict our ability to make further equity investments in India, including through Azure Power Global Limited.
Further, India’s Foreign Exchange Management Act, 1999, as amended, and the rules and regulations promulgated thereunder prohibit us from borrowing from our Indian subsidiaries. We are permitted to lend to our Indian subsidiaries subject to compliance with India’s policy on external commercial borrowings as notified by the Reserve Bank of India from time to time, which specifies certain conditions, including in relation to eligible lenders and borrowers, permitted end use and limits on the all-in-cost.
Changing laws, rules and regulations and legal uncertainties, including adverse application of corporate and tax laws, may adversely affect our business, financial condition, results of operations, cash flows and prospects.
The regulatory and policy environment in which we operate is evolving and subject to change. Such changes, including the instances mentioned below, may adversely affect our business, financial condition, results of operations, cash flows and prospects, to the extent that we are unable to suitably respond to and comply with any such changes in applicable law and policy.
The General Anti Avoidance Rules have come into effectAct. Further, on April 1, 2017. The intent2024, we expect that our SEC reporting obligations under Section 15(d) of this legislation isthe Exchange Act will be suspended and the Company will no longer have an obligation to prevent business arrangements set upfile periodic reports (annual reports on Form 20-F and Form 6-K reports) with the intent to avoid tax incidence under the IT Act. In the absence of any precedents on the subject, the application of these provisions is uncertain.
The Government of India has issued revised Income Computation and Disclosure Standards (“ICDS”) that will be applied in computing taxable income and payment of income taxes thereon, applicable with
| effect from the assessment period for the Fiscal Year 2017. ICDS shall apply to all taxpayers following an accrual system of accounting for the purpose of computation of income under the heads of “profits and gains of business or profession” and “income from other sources”. Such specific standards for computation of income taxes in India are relatively new, and the impact of the ICDS on our results of operations and financial condition is uncertain.
|
The Indian Parliament has recently approved the adoption of a comprehensive national goods and services tax (“GST”)SEC. For more information, regime that will combine taxes and levies by the central and state governments into a unified rate structure. It is not clear, however, how the GST will be applied and implemented, and there can be no assurance that the GST will not result in significant additional taxes being payable, which in turn, may harm our results of operations and financial condition.
The Government of India has also amended its rules which determine the ‘tax residency’ of a company in India with effect from April 1, 2017. Previously, a foreign company could be a tax resident of India only if its control and management was situated wholly in India. Under the amended rules, a company will be treated as tax resident of India if (i) it is an Indian company; or (ii) its place of effective management (“POEM”) is in India. POEM is defined in the Income Tax Act, 1961, to mean a place where key management and commercial decisions that are necessary for the conduct of the business of an entity as a whole are, in substance, made. The Government of India has also issued the final guidelines for determining the POEM of a company on January 24, 2017. The applicability of the amended rules and the treatment of our subsidiaries under such rules is uncertain.
We have not determined the impact of these recent and proposed legislations on our business. Uncertainty in the applicability, interpretation or implementation of any amendment to, or change in, governing law, regulation or policy in the jurisdictions in which we operate, including by reason of an absence, or a limited body, of administrative or judicial precedent may be time consuming as well as costly for us to resolve and may impact the viability of our current business or restrict our ability to grow our business in the future.
see “Natural calamities could have a negative impact on the Indian economy and adversely affect our business and project operations.
India has experienced natural calamities such as earthquakes, tsunamis, floods and drought in the past few years. In December 2004, Southeast Asia, including both the eastern and western coasts of India, experienced a massive tsunami, and in October 2005, the State of Jammu and Kashmir experienced an earthquake, both of which events caused significant loss of life and property damage. In June 2013, the state of Uttarakhand in northern India experienced widespread floods and landslides. Similarly, in December 2016, Cyclonic storm, Vardah resulted in heavy rains over Chennai and adjoining areas. As a result of which, many parts of Tamil Nadu and Andhra Pradesh witnessed massive damage. The extent and severity of these natural disasters determines their impact on the Indian economy. If climatic conditions or natural disasters occur in areas where our solar projects and project teams are located, project development, connectivity to the power grid and the provision of O&M services may be adversely affected. In particular, materials may not be delivered as scheduled and labor may not be available. Substantially all of our operations and employees are located in India and there can be no assurance that we will not be adversely affected by natural disasters in the future.
In recent years, certain regions of the world, including India, have experienced outbreaks of swine flu caused by the H1N1 virus. Any future outbreak of swine flu or other health epidemics, such as the outbreak of the Ebola virus, may restrict the level of business activity in affected areas which could adversely affect our business.
Terrorist acts and other acts of violence involving India or other neighboring countries could significantly harm our operations directly, or may result in a more general loss of customer confidence and reduced investment in these countries that causes significant harm to our business, results of operations, cash flows and financial condition.
Terrorist attacks and other acts of violence or war involving India or other neighboring countries may significantly harm the Indian markets and the worldwide financial markets. The occurrence of any of these events may result in a loss of business confidence, which could potentially lead to economic recession and generally cause significant harm to our business, results of operations, cash flows and financial condition. In addition, any deterioration in international relations may result in investor concern regarding regional stability, which could decrease the price of our equity shares.
South Asia has also experienced instances of civil unrest and hostilities among neighboring countries from time to time. There have also been incidents in and near India such as terrorist attacks in Mumbai, Delhi and on the Indian Parliament, troop mobilizations along the India and Pakistan border and an aggravated geopolitical situation in the region. Such military activity or terrorist attacks in the future could significantly harm the Indian economy by disrupting communications and making travel more difficult. Resulting political tensions could create a greater perception that investments in Indian companies involve a high degree of risk. Furthermore, if India were to become engaged in armed hostilities, particularly hostilities that were protracted or involved the threat or use of nuclear weapons, we might not be able to continue our operations. Our insurance policies for a certain part of our business do not cover terrorist attacks or business interruptions from terrorist attacks or for other reasons.
Risks Related to Investments in Mauritian Companies
As our shareholder, you may have greater difficulties in protecting your interests than as a shareholder of a United States corporation.
We are incorporated under the laws of Mauritius. The laws generally applicable to United States corporations and their shareholders may provide shareholders of United States corporations with rights and protection for which there may be no corresponding or similar provisions under the Companies Act 2001 of Mauritius, as amended, or the Mauritius Companies Act. As such, being shareholder of our equity shares, you may or may not be accorded the same level of shareholder rights and protection that a shareholder of a United States corporation may be accorded under the laws generally applicable to United States corporations and their shareholders. Taken together with the provisions of our constitution, which we adopted with effect upon completion of our public offering in October 2016, or Constitution, some of these differences may result in your having greater difficulties in protecting your interests as our shareholder than you would have as a shareholder of a United States corporation. This affects, among other things, the circumstances under which transactions involving an interested director are voidable, whether an interested director can be held accountable for any benefit realized in a transaction with us, what rights you may have as a shareholder to enforce specified provisions of the Mauritius Companies Act or our Constitution, and the circumstances under which we may indemnify our directors and officers.
We may become subject to unanticipated tax liabilities that may have a material adverse effect on our results of operations.
We are a Mauritius Category 1 Global Business Company, or GBC1, and are tax resident in Mauritius. The Income Tax Act 1995 of Mauritius imposes a tax in Mauritius on the chargeable income of our company at the rate of 15%. However, under the Income Tax (Foreign Tax Credit) Regulations 1996 of Mauritius, subject to the Income Tax Act 1995 and the regulations under the Income Tax (Foreign Tax Credit) Regulations 1996, credit is allowed for foreign tax on the foreign source income of a resident of Mauritius against Mauritius tax computed by reference to the same income, and where credit is allowed against Mauritius tax chargeable in respect of any income, the amount of Mauritius tax so chargeable shall be reduced by the amount of the credit. Under the
Income Tax (Foreign Tax Credit) Regulations 1996, “foreign source income” means income which is not derived from Mauritius and includes in the case of a corporation holding a GBC1 license, under the Financial Services Act 2007 of Mauritius, income derived in the course of a global business. Subject to the provisions of the Income Tax (Foreign Tax Credit) Regulations 1996, no credit is allowed in respect of foreign tax unless written evidence is presented to the Mauritius Revenue Authority showing the amount of foreign tax which has been charged and for this purpose, “written evidence” includes a receipt of the relevant authorities of the foreign country for the foreign tax or any other evidence that the foreign tax has been deducted or paid to the relevant authorities of that country. However, pursuant to Regulation 8 of the Income Tax (Foreign Tax Credit) Regulations 1996, if written evidence is not presented to the Mauritius Revenue Authority showing the amount of foreign tax charged on our company’s foreign source income, the amount of foreign tax shall nevertheless be conclusively presumed to be equal to 80% of the Mauritius tax chargeable with respect to that income and in such circumstance, the effective tax rate in Mauritius on our company’s chargeable income would be 3%.
Following amendments to the Financial Services Act 2007 of Mauritius pursuant to the Finance (Miscellaneous Provisions) Act 2010 in December 2010, Mauritius companies holding a GBC1 issued by the Financial Services Commission in Mauritius are permitted to conduct business both in and outside Mauritius (instead of outside Mauritius only). The operations of a GBC1 company in Mauritius will be subject to tax on chargeable income at the rate of 15% in Mauritius.
We hold tax residence certificates issued by the Mauritius Revenue Authority. We believe that a significant portion of the income derived from our operations will not be subject to tax in countries in which we conduct activities or in which our customers are located, other than Mauritius and India. However, this belief is based on the anticipated nature and conduct of our business, which may change. It is also based on our understanding of our position under the tax laws of the countries in which we have assets or conduct activities. This position is subject to review and possible challenge by taxing authorities and to possible changes in law that may have retroactive effect. Our results of operations and cash flows could be materially and adversely affected if we become subject to a significant amount of unanticipated tax liabilities.
Anti-takeover provisions in our constitutional documents and under Mauritius law could make an acquisition of us, which may be beneficial to our shareholders, more difficult and may prevent attempts by our shareholders to replace or remove our current management and limit the market price of our equity shares.
Provisions in our Constitution may have the effect of delaying or preventing a change in control or changes in our management. Our Constitution includes the following provisions which may be regarded as defensive measures:
a staggered Board of Directors;
the ability to issue additional equity shares (including “blank check” preferred stock);
granting directors, the absolute discretion to decline to register a transfer of any shares;
requiring that amendments to our Constitution be approved by a special resolution of the shareholders of our company; and
limiting the liability of, and providing indemnification to, our directors and officers.
These provisions may restrict or prevent any attempts by our shareholders to replace or remove our current management by making it more difficult for shareholders to replace members of our Board of Directors, which is responsible for appointing the members of our management team. The provisions could also deprive our shareholders of the opportunity to sell their shares at a premium over the prevailing market price by discouraging third parties from seeking to obtain control of our company in a tender offer or similar transactions.
Risks Related to Our Equity Shares
An Active or Liquid Trading Market for Our Equity Shares May Not Be Maintained.
An active, liquid trading market for our equity shares may not be maintained in the long term and we cannot be certain that any trading market for our equity shares will be sustained or that the present price will correspond to the future price at which our equity shares will trade. Loss of liquidity could increase the price volatility of our equity shares.
Any additional issuance of equity shares or other equity-related securities would dilute the positions of existing investors in the equity shares and could adversely affect the market price of our equity shares. We cannot assure you that our equity shares will not decline below their prevailing market price. You may be unable to sell your equity shares at a price that is attractive to you.
The market price of our equity shares has been and may continue to be volatile, and you could lose all or part of your investment.
The trading price of our equity shares has been volatile since our initial public offering, and is likely to continue to be volatile.Risk Factors that could cause fluctuations in the market price of our equity shares include —trading volume, prices of other securities, market trends, growth of other comparable companies, changes in operating performance, sale of additional shares in the market by us or by other investors, coverage by security analysts, changes in financial estimates, failure to meet analyst or market expectations, press releases by us or our competitors, market speculations, changes in tax and other incentives, regulatory and policy changes, litigations, business acquisitions, changes in accounting standards and economic conditions.
Further, in recent years the stock markets have experienced extreme price and volume fluctuations that have affected and continue to affect the market prices of equity securities of many companies. These fluctuations often have been unrelated or disproportionate to the operating performance of those companies. In addition, the stock prices of many renewable energy companies have experienced wide fluctuations that have often been unrelated to the operating performance of those companies. These broad market and industry fluctuations, as well as general economic, political and market conditions such as recessions, government shutdowns, interest rate changes, or international currency fluctuations, may cause the market price of our equity shares to decline.
Sales of a substantial number of our equity shares in the public market, including by our existing stockholders, could cause our stock price to fall.
Sales of a substantial number of our equity shares in the public market, or the perception that the sales might occur, could depress the market price of our equity shares and could impair our ability to raise capital through the sale of additional equity securities. We are unable to predict the effect that these sales and others may have on the prevailing market price of our equity shares.
In addition, certain of our stockholders can require us to register shares of our capital stock owned by them for public sale in the United States. We have also filed a registration statement to register our equity shares reserved for future issuance under our equity compensation plans. Subject to the satisfaction of applicable exercise periods and applicable volume and restrictions that apply to affiliates, our equity shares issued upon exercise of outstanding options will become available for immediate resale in the public market upon issuance.
Future sales of our equity shares may make it more difficult for us to sell equity securities in the future at a time and at a price that we deem appropriate. These sales also could cause the market price of our equity shares to decline and make it more difficult for you to sell our equity shares.
You may have difficulty enforcing judgments against us, our directors and management.
We are incorporated under the laws of Mauritius. Further, we conduct substantially all of our operations in India through our key operating subsidiary in India.̶ The majority of our directors and officers reside outside the United States, and a majority of our assets and some or all of the assets of such persons are located outside the United States. As a result, it may be difficult or impossible to effect service of process within the United States upon us or those persons, or to recover against us or them on judgments of United States courts, including judgments predicated upon the civil liability provisions of the United States federal securities laws. An award of punitive damages under a United States court judgment based upon United States federal securities laws is likely to be construed by Mauritian and Indian courts to be penal in nature and therefore unenforceable in both Mauritius and India. Further, no claim may be brought in Mauritius or India against us or our directors and officers in the first instance for violation of United States federal securities laws because these laws have no extraterritorial application under Mauritian or Indian law and do not have force of law in Mauritius or India. However, a Mauritian or Indian court may impose civil liability, including the possibility of monetary damages, on us or our directors and officers if the facts alleged in a complaint constitute or give rise to a cause of action under Mauritian or Indian law. Moreover, it is unlikely that a court in Mauritius or India would award damages on the same basis as a foreign court if an action were brought in Mauritius or India or that a Mauritian or Indian court would enforce foreign judgments if it viewed the amount of damages as excessive or inconsistent with Mauritius or Indian practice or public policy.
The courts of Mauritius or India would not automatically enforce judgments of United States courts obtained in actions against us or our directors and officers, predicated upon the civil liability provisions of the United States federal securities laws, or entertain actions brought in Mauritius or India against us or such persons predicated solely upon United States federal securities laws. Further, there is no treaty in effect between the United States and Mauritius providing for the enforcement of judgments of United States courts in civil and commercial matters and the United States has not been declared by the Indian government to be a reciprocating territory for the purposes of enforcement of foreign judgments, and there are grounds upon which Mauritian or Indian courts may decline to enforce the judgments of United States courts. Some remedies available under the laws of United States jurisdictions, including remedies available under the United States federal securities laws, may not be allowed in Mauritian or Indian courts if contrary to public policy in Mauritius or India. Because judgments of United States courts are not automatically enforceable in Mauritius or India, it may be difficult for you to recover against us or our directors and officers based upon such judgments. In India, prior approval of the Reserve Bank of India is required in order to repatriate any amount recovered pursuant to such judgments.
We do not expect to pay any cash dividends on our equity shares.
We have not paid dividends on any of our equity shares to date and we currently intend to retain our future earnings, if any, to fund the development and growth of our business. As a result, capital appreciation, if any, of our equity shares are likely to be your sole source of gain for the foreseeable future. Consequently, you will likely only experience a gain from your investment in our equity shares if the price of our equity shares increases.
In addition, our ability and decisions whether to pay dividends in the future will depend on our earnings, financial condition and capital requirements. Dividends to U.S. holders may be negatively affected by foreign currency fluctuations. We may not generate sufficient income to cover our operating expenses and pay dividends to our shareholders, or at all. Our ability to pay dividends also could be restricted under financing arrangements that we may enter into in the future and we may be required to obtain the approval of lenders in the event we are in default of our repayment obligations. We may be unable to pay dividends in the near or medium term, and our future dividend policy will depend on our capital requirements, financing arrangements, results of operations and financial condition. Dividends distributed by us will attract dividend distribution tax at rates applicable from time to time.
Our holding company will have to rely principally on dividends and other distributions on equity paid by our operating subsidiaries and limitations on their ability to pay dividends to us could adversely impact your ability to receive dividends on our equity shares.
Since we cannot borrow from our Indian subsidiaries, dividends and other distributions on equity paid by our operating subsidiaries will be our principal source for cash in order for us to fund our operations including corporate expenses. Accordingly, we may need to issue additional equity or borrow funds, either of which may be unavailable on attractive terms, if at all.
If our operating subsidiaries incur debt on their own behalf in the future, the instruments governing the debt may restrict their ability to pay dividends or make other distributions to our holding company. As our key operating subsidiary is established in India, it is also subject to certain limitations with respect to dividend payments. As of the date of this annual report, AZI has not paid any cash dividends on its equity shares and does not intend to pay dividends to its equity shareholders, including Azure Power Global Limited, in the foreseeable future. Moreover, as we do not own 100% of AZI, any dividend payment made by AZI to us will also involve a payment to the other shareholders of AZI, including the Founders.
As a foreign private issuer, we are permitted to, and we will, follow certain home country corporate governance practices in lieu of certain requirements applicable to U.S. issuers. This may afford less protection to holders of our equity shares.
As a foreign private issuer listed on the New York Stock Exchange or NYSE, we are permitted(NYSE) has delisted our Company’s shares, due to follow certain home country corporate governance practices in lieu of certain NYSE requirements. A foreign private issuer must disclose in its annualour failure to file timely reports filed with the SEC each NYSE requirement with which it does not comply followed by a description of its applicable home country practice. As a company incorporated in Mauritius” and which is listed on the NYSE,also, “Risk Factors - On April 1, 2024, we may followexpect that our home country practice with respect to the composition of our Board of Directors and executive sessions. Unlike the requirements of the NYSE, the corporate governance practice and requirements in Mauritius do not require us as a GBC1 to have the majority of our Board of Directors be independent or to hold regular executive sessions where only independent directors shall be present. Such Mauritian home country practices may afford less protection to holders of our equity shares than would be available to the shareholders of a U.S. corporation.
If we cease to qualify as a foreign private issuer, we would be required to comply fully with theSEC reporting requirementsobligations under Section 15(d) of the Exchange Act applicable to U.S. domestic issuers,will be suspended and we would incur significant additional legal, accounting and other expenses that we would not incur as a foreign private issuer.
As a foreign private issuer, we are exempt from a number of rules and regulations under the Securities Exchange Act of 1934, or the Exchange Act, applicable to U.S. domestic issuers, including the furnishing and content of proxy statements, compliance with the reporting and short-swing profit recovery provisions contained in Section 16 of the Exchange Act applicable to executive officers, directors and principal shareholders. We are required under the Exchange ActCompany will no longer have an obligation to file periodic reports (annual reports on Form 20-F and financial statementsForm 6-K reports) with the SEC as frequently or as promptly as U.S. domestic issuers, and we are not required to disclose in our periodic reports all of the information that U.S. domestic issuers are required to disclose. If we do not qualify as a foreign private issuer, we will be required to comply fully with the reporting requirements of the Exchange Act applicable to U.S. domestic issuers, and we will incur significant additional legal, accounting and other expenses that we would not incur as a foreign private issuer.
For as long as we are an “emerging growth company,.” we will not be required to comply with certain reporting requirements that apply to other public companies.
We are an “emerging growth company,” as defined in the JOBS Act, enacted on April 5, 2012. For as long as we continue to be an emerging growth company, we may choose to take advantage of certain exemptions from
reporting requirements applicable to other public companies that are not emerging growth companies. These include: (1) not being required to comply with the auditor attestation requirements of Section 404 of the Sarbanes-Oxley Act, (2) not being required to comply with any new requirements adopted by the Public Company Accounting Oversight Board, or the PCAOB, requiring mandatory audit firm rotation or a supplement to the auditor’s report in which the auditor would be required to provide additional information about the audit and the financial statements of the issuer, (3) not being required to comply with any new audit rules adopted by the PCAOB after April 5, 2012 unless the SEC determines otherwise, and (4) not being required to provide certain disclosure regarding executive compensation required of larger public companies. We could be an emerging growth company for up to five years from the end of fiscal year 2017, although, if the market value of our equity shares that is held by non-affiliates exceeds US$700 million as of any September 30 before the end of that five-year period, we would cease to be an emerging growth company as of the following April 1. We cannot predict if investors will find our equity shares less attractive if we choose to rely on these exemptions. If some investors find our equity shares less attractive as a result of any choices to reduce future disclosure, there may be a less active trading market for our equity shares and our share price may be more volatile. Further, as a result of these scaled regulatory requirements, our disclosure may be more limited than that of other public companies and you may not have the same protections afforded to shareholders of such companies.
You may be subject to Indian taxes on income arising through the sale of our equity shares.
Pursuant to recent amendments to the Indian Income Tax Act, 1961, as amended, income arising directly or indirectly through the sale of a capital asset, including any share or interest in a company or entity registered or incorporated outside of India, will be liable to tax in India, if such share or interest derives, directly or indirectly, its value substantially from assets (whether tangible or intangible) located in India and whether or not the seller of such share or interest has a residence, place of business, business connection, or any other presence in India. The share or interest of the company or entity registered or incorporated outside of India is deemed to derive its value substantially from the assets located in India if the value of such Indian assets exceeds INR 100 million and represents at least 50% of the value of all the assets owned by the company or entity registered or incorporated outside of India. Substantially all of our assets are located in India.
However, if the transferor of share or interest in a company or entity registered or incorporated outside of India (along with its associated enterprises), neither holds the right of management or control in the company or entity registered or incorporated outside of India nor holds voting power or share capital or interest exceeding 5% of the total voting power or total share capital or interest in the company or entity registered or incorporated outside of India, at any time during the twelve months preceding the date of transfer, such small shareholders are exempt from the indirect transfer provisions mentioned above. The amendments also do not deal with the interplay between the amendments to the Indian Income Tax Act, 1961, as amended, and the existing Double Taxation Avoidance Agreements that India has entered into with countries such as the United States in case of an indirect transfer. Accordingly, the implications of the recent amendments are presently unclear. If it is determined that these amendments apply to a holder of our equity shares, such holder could be liable to pay taxes in India on such income.
If securities or industry analysts do not publish or cease publishing research or reports about us, our business or our market, or if they change their recommendations regarding our equity shares adversely, our stock price and trading volume could decline.
The trading market for our equity shares is influenced by the research and reports that industry or securities analysts publish about us, our business, our market or our competitors. If any of the analysts who cover us or may cover us in the future change their recommendation regarding our stock adversely, or provide more favorable relative recommendations about our competitors, our stock price would likely decline. If any analyst who covers us or may cover us in the future were to cease coverage of our company or fail to regularly publish reports on us, we could lose visibility in the financial markets, which in turn could cause our stock price or trading volume to decline.
Future issuances of any equity securities may cause a dilution in your shareholding, decrease the trading price of our equity shares, and restrictions agreed to as part of debt financing arrangements may place restrictions on our operations.
Any issuance of equity securities after our initial offering could dilute the interests of our shareholders and could substantially decrease the trading price of our equity shares. We may issue equity or equity-linked securities in the future for a number of reasons, including to finance our operations and business strategy (including in connection with acquisitions and other transactions), to adjust our ratio of debt to equity, to satisfy our obligations upon the exercise of then-outstanding options or other equity-linked securities, if any, or for other reasons. Issuance of such additional securities may significantly dilute the equity interests of investors, since initial offering who will not have pre-emptive rights with respect to such an issuance, subordinate the rights of holders of equity shares if preferred shares are issued with rights senior to those afforded to our equity shares, or harm prevailing market prices for our equity shares.
We may not be able to successfully complete acquisitions or enhance post-acquisition performances.
In addition to our organic growth, we intend to continue to accelerate our business growth through strategic acquisitions when suitable opportunities arise. However, our ability to consummate acquisitions is subject to various risks and uncertainties, including:
failure to identify suitable acquisition targets and reach agreement on commercially reasonable terms;
failure to obtain sufficient financing on acceptable terms to fund the proposed acquisitions;
failure to obtain regulatory approvals and third-party consents necessary to consummate the proposed acquisitions; and
other companies, many of which may have greater financial, marketing and sales resources, may compete with us for the right to acquire such product candidates, products or businesses.
Even if we are able to consummate acquisitions, our ability to grow our business through such acquisitions remains subject to further risks and uncertainties which could materially and adversely affect our business, financial condition and results of operations, including that:
we are unable to integrate the acquired businesses with our existing business and operations;
the acquired businesses do not provide us with the resources we had anticipated;
the acquired businesses are subject to unforeseen or hidden liabilities;
we are unable to effectively manage our enlarged business operations or manage the acquired businesses that may operate in new markets or geographic regions; and
the acquired businesses do not generate the revenue and profitability we had anticipated.
Furthermore, the process of pursuing and consummating acquisitions and integrating and managing acquired businesses, whether or not successful, could divert our resources and management attention from our existing business and disrupt our operations.
We may be classified as a passive foreign investment company, which could result in adverse U.S. federal income tax consequences to certain U.S. investors of our equity shares.
A non-U.S. corporation will be a passive foreign investment company, or PFIC, for any taxable year if either (1) at least 75% of its gross income for such year is passive income or (2) at least 50% of the value of its assets (based on an average of the quarterly values of the assets) during such year is attributable to assets that produce passive income or are held for the production of passive income. We do not expect to be a PFIC for U.S. federal income tax purposes for our current taxable year or future taxable years. However, our PFIC status is a
factual determination made after the close of each taxable year that will depend, in part, on the composition of our income and assets, and thus, there can be no assurance that we will not be treated as a PFIC in our current taxable year or future taxable years. See “Item 10. Additional Information — E. Taxation — U.S. Federal Income Taxation — Passive Foreign Investment Company.”
ITEM 4. INFORMATION ON THE COMPANY
A. History and Development of the Company
Our legal and commercial name is Azure Power Global Limited. We are a public company limited by shares incorporated in Mauritius on January 30, 2015. OurCompany’s registered office is located at c/o AAA Global Services Ltd., 1stLtd, 4th Floor, The Exchange 18 Cybercity,Iconebene, Rue De L’institut, Ebene, Mauritius. Our80817, Mauritius with principal executive offices are located atat: 8 Local Shopping Complex, Pushp Vihar, Madangir, New Delhi 110062, India, and ourth Floor, Tower A, DLF Infinity, Cyber City, Phase II, Gurugram-122002, Haryana, India. Our telephone number at thisour principal executive office’s location is(91-11) 49409800. Our +0124-4155755 and our principal website address is www.azurepower.com. Unless expressly indicated, the information contained on our website is not incorporated by reference in this annual report. Reports, information statements and other information that we filed with or submit to the SEC is available on its website at www.sec.gov. Our Company’s agent for service of process in the United States is CT Corporation System, located at 111 Eighth Avenue, 13th Floor,28 Liberty Street, New York, NY 10011.10005.
Founded by Inderpreet Wadhwa in 2008,
Organizational Structure
The following diagram illustrates our corporate structure:

* In April 2021, we developed India’s first utility scale solar project in 2009. Asentered into a sales contract with Radiance Renewables Private Limited (“Radiance”) to sell certain subsidiaries having an operating capacity of 153 MW for INR 5,350 million (US$70.5 million), subject to certain purchase price adjustments. Out of the identified rooftop portfolio of 153 MW, we have already transferred 17.3 MW to Radiance, 33.2 MW will be transferred to Radiance after refinancing of the RG-II bonds and 16 MW will be transferred to Radiance post March 31, 2017,2024. Hence, we operated 32 utility scale projectshave not considered these rooftop portfolios of 66.5 MW for reporting under its total portfolio as at year end. Further, the Group and several commercial rooftop projectsRadiance mutually agreed to terminate the transfer in shareholding of the remaining un-transferred 86.5 MW portfolio to Radiance, Hence, portfolio of 86.5 MW have been considered for reporting under total portfolio as at year end.
Our Sustainability Initiatives and ESG Focus
Sustainability is at the core of our business. We are focused on integrating sustainability across business, building a culture focused on sustainability, sustainability reporting and ESG ratings. Our leadership is evident in the ratings received by us. We have rated as a “low risk” company with a combined rated capacityscore of 65115.8 by Morningstar Sustainalytics; MSCI has given us a rating of “AA” indicating Azure’s resilience to long term ESG risks.
As a socially and environmentally conscious company, we are committed to protecting our environment and creating a safe and health workplace. To meet these objectives, we have implemented our Environmental and Social Management framework (“ESMF”). The framework acts as a guideline through which we plan and undertake activities to meet our HSE commitments and helps us to assess our environmental and social performance against established international guidelines such as the International Finance Corporation (“IFC”) Performance Standards and World Bank Equator Principles and governance standards. We continue to operate our plants to the highest standards of safety. We have defined targets for monitoring the continual improvement in our safety performance. Any incident at any of our sites is thoroughly investigated and remedial actions taken.
We estimate that Azure’s renewable power generation helped to avoid the production of approximately 5 million tons of CO2e in FY 2023 and 19.5 million tons -equivalent since inception. We strongly believe that commitment to high standards of corporate responsibility is both the right way to do business but also an enabler of our business.
During Fiscal 2022, we rolled out various initiatives to address United Nations Sustainable Development Goals (SDG). As one of country’s pivotal clean energy partner, we at Azure are helping India’s to achieve its Net Zero target, thereby contributing to achieving the goals of SDG 13 (Climate Action). As part of our community development initiatives, we are actively working towards improving the quality of infrastructure in schools around our sites, thereby contributing towards achieving the goals of SDG 4 (Quality Education), development of village infrastructure, thereby contributing towards advancement of SDG 1 (No Poverty) and SDG 6 (Clean Water and Sanitation).
ESG Updates
Environmental
As a pure play renewable energy company, we are working towards clean energy transition and contributing to India met its Net zero target.
Climate change: We estimate that Azure’s renewable power generation helped to avoid the production of approximately 5 million tons of CO2e in FY 2023 and 19.5 million tons -equivalent since inception. We have been validated to be carbon neutral for fifth consecutive year for our scope 1 and scope 2 emissions. Our actions to reduce Scope 1 emissions include implementation of an Electric Vehicle policy that will phase out all fossil fuel-based vehicles by 2030.
Water Security: We reduced our water consumption per MWh from 122 L/ MWh in FY 2018 to 15 L/ MWh in FY 2023. We recognize that the water required for cleaning our solar modules may result in adverse environmental impact. We are installing robotic dry-cleaning systems at all our project sites to eliminate the requirement for water which has helped to save approximately 1 million kilo liters of water.
Natural capital enhancement: We are committed to planting 50 tree saplings per MW installed at or around all our future project sites. In FY 2023, we planted 30,000 trees around our sites.
Social
Community engagement: Through our community engagement initiatives, Azure is committed to improving the quality of life by making a positive economic and social contribution to the communities living in and around its sites. In Fiscal 2022, we won the prestigious Apex India CSR Excellence award 2021. In FY 2023, we commissioned an Impact Evaluation of our CSR activities carried out during FY 2022.
Occupational Health and Safety: Our foremost priority is the health and safety of our staff and contractors at project sites as well as our corporate office. Our target is zero harm for everyone from our operations. We continue to promote safety awareness and best practices among all employees and contractors. We obtained ISO 45001 (Occupational Health and Safety) certification, won the Greentech Effective Safety Culture Award 2021 and Grow Care India Occupational Health and Safety award 2021. We undertook a safety culture survey in September 2022 which represents a compound annual growth rate, or CAGR,saw voluntary participation of 107%, since March 2012. As50% of such date we were also constructingour employees. The survey concluded that the company is performing better than its peers in matter of safety. The internal validation corroborates external validation in form of multiple safety awards as received by the company.
Labor and working condition: We look to monitor the social and compliance performance of our key contractors and suppliers. We have obtained Social Accountability 8000 certification to assure appropriate labor and working conditions associated with our projects.
Governance
We are committed to the high standards of corporate governance and continue to improve our processes and practices.
Board Membership: Our Board currently consists of eight projects with a combined rated capacitymembers, two of 354 MWwhom are women. All Board members are Non-Executive; five are Independent Non-Executives and had an additional 64 MW committed, bringing our total portfolio capacity to 1,069 MW. Megawatts committed representsthree are Non-Executive nominees of shareholders (two of CDPQ and one of OMERS).
There have been changes in the aggregate megawatt rated capacity of solar power plants pursuant to customer power purchase agreements, or PPAs, signed or allotted but not yet commissioned and operational asmembership of the reporting date.
Board in FY 2023 and thereafter. In March 2022, Ms. Christine McNamara joined the Board and became the Chair of the Audit and Risk Committee. She stepped down from her position on June 26, 2023, for personal reasons. The initial offeringCompany appointed Mr. Richard Payette as a new independent non-executive director on July 1, 2023, and he was also appointed as the Chair of the Audit and Risk Committee. Mr. Payette brings four decades of experience in the management of global companies and in accounting, audit and governance areas.
In April 2022, our previous Managing Director and CEO, Mr. Ranjit Gupta, resigned.
In May 2022, Ms. Delphine Voeltzel joined the Board as a director and Nominee of OMERS. At the end of May 2022, Arno Harris left the Board after more than six years of service. In October 2022, Mr. Sugata Sircar joined the Board as an Independent Director and member of the Audit and Risk committee. Mr. Sugata is a chartered accountant with 32 years of experience in energy and automation, chemicals, textiles, tires, fast moving consumer goods and city gas distribution. Mr. Sircar stepped down from his role as independent director of the Company on April 30, 2023 to become our CFO.
In February 2023, Mr. Jean-François Boisvenu joined the Board as an Independent Non-executive Director and member of the Audit and Risk committee. Mr. Boisvenu has more than 25 years of experience in corporate and commercial law matters, with expertise in international banking transactions, lending and debt capital markets transactions and financial institutions regulation. In March 2023, Mrs. Yung Oy Pin Lun Leung left the Board after more than three years of service. She was replaced by Mr. Gowtamsingh Dabee. Mr. Dabee has over 25 years of experience as a professional accountant in public practice and industry in Mauritius, Africa, and the Middle East.
On October 11, 2023, Mr. Alan Rosling resigned as Chairman of the Board and as a director of the Company and APIPL. On October 12, 2023, the Company announced that Mr. M.S. Unnikrishnan, who has been a director of the Company since August 19, 2020, became the Chairman of the Board of the Company.
Mr. Deepak Malhotra and Mr. Cyril Sebastien Dominique Cabanes resigned as directors of the Company on October 29, 2023 and October 30, 2023 respectively. On October 31, 2023, Mr. Jaime Garcia Nieto and Mr. Philippe Pierre Wind were appointed as directors of the Company. Both directors are non-executive nominees of the majority shareholder, CDPQ.
On March 13, 2024, Mr. M.S. Unnikrishnan resigned as Chairman of the Board and as a director of the Company and APIPL.
For further information, see “Management and Employees – Management”.
Board Committees: In recent months, the Board has completed a review of the Terms of Reference, Charters and membership of its Committees. The Audit Committee is now the Audit and Risk Committee, taking responsibility for our new ERM system. The CSR Committee is now the Sustainability and CSR Committee and has a broader mandate to ensure our ESG and CSR performance is world class and supports our goals, ethos, and operating strategy. The Nomination and Governance Committee has been merged with Compensation Committee and now it is referred as Compensation, Nomination and Governance Committee. The existing Capital Committee is now renamed as Investment & Capital Committee.
For further information, see “Management and Employees – Board Committees”.
Executive Committees: The Company has formed an Executive Risk Committee to develop, implement and monitor the Enterprise Risk Management framework. CEO, CFO and Chief Compliance & Ethics Officer (“CC&EO”) are the members of this committee.
For further information, see “Management and Employees – Board Committees”.
Management: On April 26, 2022, we announced that the Board had accepted the resignations of our previous CEO and Managing Director, Mr. Ranjit Gupta, and COO, Mr. Murali Subramanian. Mr. Harsh Shah joined the Company as CEO on July 1, 2022, but subsequently resigned on August 29, 2022. Thereafter, Mr. Rupesh Agarwal became Acting CEO of the Company on Mr. Shah’s resignation. In November 2022, Mr. R. Narasimhan Iyer joined as Chief Operating Officer of the Company. On April 30, 2023, Mr. Sugata Sircar resigned from his position as non-executive Independent Director and member of the Company’s Audit and Risk Committee and Capital Committee and on May 1, 2023, joined as CFO for the Company and the private placement resulted in aggregate gross proceeds before expense of US$115.4 millionGroup and incurred an underwriters commission and other expenses of US$14.4 million. Our equity shares are listed on the New York Stock Exchange under the symbol “AZRE.”
B. Business Overview
Our mission is to be the lowest-cost power producer in the world. We sell solar power in India on long-term fixed price contracts to our customers, at prices which in many cases are at or below prevailing alternatives for these customers. We are also developing micro-grid applications for the highly fragmented and underserved electricity market in India. Since inception, we have achieved an 83% reduction in total solar project cost, which includes a significant decrease in balance of systems costs due in part to our value engineering, design and procurement efforts.
Indian solar capacity installed reached 12.2 GW at the end of March 2017 with a target to achieve 100GW of installed solar capacity by 2022. Solar power is a cleaner, faster-to-build and cost-effective alternative energy solution to coal and diesel based power, the economic and climate costs of which continue to increase every year.
We developed India’s first utility scale solar project in 2009. As of March 31, 2017, we operated 32 utility scale projects and several commercial rooftop projects with a combined rated capacity of 651 MW which represents a compound annual growth rate, or CAGR, of 107%, since March 2012. As of such date we were also constructing eight projects with a combined rated capacity of 354 MW and had an additional 64 MW committed, bringing our total portfolio capacity to 1,069 MW. Megawatts committed represents the aggregate megawatt rated capacity of solar power plants pursuant to customer power purchase agreements, or PPAs, signed or allotted but not yet commissioned and operational asExecutive Director, Finance of the reporting date.
Our longer term goals are to achieve 5GW by December 31, 2020. Our ability to achieve these goals will depend on, among other things,Company’s subsidiary, APIPL. In July 2023, Mr. Sunil Gupta was appointed as the CEO of the group and as Managing Director of the Company’s subsidiary, APIPL. For more information, see “Risk Factors – The loss of our senior management or key employees may adversely affect our ability to acquireconduct our business”.
For further information, see “Management and Employees – Management”.
C. Industry Overview
Renewable energy represents a significant and growing industry in India. At the required landtwenty-sixth meeting of Conference of the Parties climate summit in Glasgow, the Prime Minister of India set the country’s renewable energy target of 500 GWs by 2030. Beyond that, the Prime Minister committed for India to achieve Net Zero by 2070. India’s Nationally Determined Commitments were further tightened at twenty-seventh meeting of Conference of the new capacity (on lease or direct purchase,) raising adequate project financingParties in Egypt.
An efficient, resilient, and working capital,financially robust power sector is essential for the growth of the Indian economy. Renewable sources of power marketare cleaner, faster to build and more cost-effective than most traditional sources of power. India’s rapidly growing economy requires significant investment in line with currentadditional power capacity. India is already one of the largest renewable energy markets globally.
Renewable energy has strong government targets, our abilitysupport, and the government has designed policies, programs, and a liberal environment to maintain our market shareattract domestic and foreign investment to the sector. Initially, the National Solar Mission (“NSM”) was launched in 2010 as a part of India’s National Action Plan on Climate Change (“NAPCC”) with a view to deploy 20 GWs of solar capacity by FY 2022. In 2015, the targets were revised to 175 GWs by 2022. India has now committed to achieve about 50 percent cumulative electric power installed capacity as competition increases, the need to further strengthen our operations team to execute the increased capacity, and
the need to further strengthen our systems and processes to manage the ensuing growth opportunities, as well as the other risks and challenges discussed under the caption “Item. 3 Key Information — D. Risk Factors.”
Utility scale solar projects are typically awarded through government auctions. We believe the strong demand for our solar power is a result of the following:
from non-fossil fuel-based energy resources by 2030.
Low levelized cost of energy. Our in-house engineering, procurement and construction, or EPC, expertise, purely solar focus, advanced in-house operations and maintenance, or O&M, capability and efficient financial strategy allow us to offer low-cost solar power solutions.
Strong value proposition for our customers. We manage the entire development and operation process, providing customers with long term fixed price PPAs in addition to high levels of availability and service. This helps us win repeat business.
Our integrated profile supports growth. Our integrated profile affords us greater control over project development, construction and operation, which provides us with greater insight and certainty on our construction costs and timeline.
Strong community partnerships. Our ability to build long term community relationships allows us to improve our time of completion, further reducing project development risk.
We take a leading role in policy initiatives. We provided input to the government to help it design an auction process supporting multiple winners at differentiated price points and implementing a transparent bidding process open to all participants. For example, we suggested that the government include compulsorily convertible debentures in the calculation of a bidder’s net worth for the purposes of tender qualification, which was ultimately adopted by the government.
We generate revenue from a mix of leading government utilities and commercial entities. Because we have our own EPC and O&M capabilities, we retain the profit margins associated with those services that other project developers may need to pay to third-party providers.
Market Opportunity
India’s economic growth is intrinsically linked to the increasing consumption of energy and natural resources. Energy demand has outpaced capacity additions in recent years, which has resulted in persistent peak power deficits in the country. In addition, the Indian government has made it a priority to provide electricity to the estimated 304 million people who are without this service.
Solar is an attractive option to help address this energy gap driven by regional fundamentals and regulatory support by the Indian government. The Indian government increased its 2022 target for solar capacity from 20GW to 100GW, ratified Paris climate change agreement and committed to 40% renewables by 2030 up from 15%. During fiscal year 2017, 49% of total renewable installations were solar and solar has clearly outpaced all other renewables sources. The Central Government, in collaboration with the state governments,energy sector is planning to facilitate the development of 50 solar power parks of 500 MW and above to boost the solar capacity in high solar irradiation states and 20GW of new projects are to be auctioned by 2018. As per MNRE, India installed 12,289 MW of solar through March 2017. The state governments will identify land for the proposed solar parks, provide permits and related infrastructure such as grid interconnect systems while a government sponsored entity will commit to buy power produced from these parks.
The following trends have made solar a large, rapidly growingamong most attractive renewable energy market opportunity:
Peak power deficits and rising power prices. Despite adding 112 GW of power in the past five years, India continues to be plagued by a persistent demand/supply mismatch with a six-year average energy deficit of approximately 5% according to the Ministry of Power. As the country has outstripped its domestic supply of conventional fuels, India has also suffered from upward pressure in power prices.
Strong regulatory support. In order to reduce dependence on energy imports and curtail the current trade deficit and resulting impact on the rupee, the Indian government has taken a number of steps to
| incentivize the use of renewable sources of energy. These include establishing state-level renewable power purchase obligations, 10-year tax holiday, accelerated depreciation, exemptions from other taxes and import tariffs, as well as providing viability gap funding, or VGF, to solar project developers to make solar tariffs competitive in the country. To provide further impetus to solar growth, the Indian government launched the Jawaharlal Nehru National Solar Mission, or NSM, in 2010.
|
Solar positioned to win among alternatives. India ranks among the highest irradiation receiving countries in the world, with more than 300 daystotal installed capacity of sunshine per year in muchrenewable power of the country. Solar power generation is viable across most of India, unlike wind and hydro resources which are concentrated in specific regions. In addition, as solar plants can be built near the point of consumption, power produced generally does not incur expensive transmission charges or require large infrastructure or transmission investments. Further, unlike nuclear and hydropower, solar power has fewer legal liabilities and environmental constraints. The estimated potential for solar power in India is 749GW.
Solar energy approaching parity with conventional fossil fuels. State utilities have seen power costs rise as domestic coal shortages have caused thermal generators to increasingly rely on more expensive imported coal. An analysis of current tariffs in India indicates that solar power is now competitive with wind, new thermal capacity fueled by imported coal and grid power tariffs for commercial users. Further, diesel power, the most common replacement power source for commercial and off-grid users in the country, is far more expensive than solar power. Additionally, solar panel prices are expected to fall further, which in turn is expected to drive further reductions in solar tariffs.
Transparent solar auction process. Indian solar auctions are conducted in a transparent manner that ensures bids meet minimum technical and financial criteria. Bidders must meet requirements on project development and execution history in India or the regional market, including bidder experience in the development of similar utility scale power projects. Auctions are not winner-take-all; instead, they are constructed to ensure multiple high-quality developers are allotted portions of the total capacity block.
These factors have increased the solar installation to approximately 12.2 GW135 GWs as of March 2017. Approximately 20GW of additional tenders have been announced under various solar policies. In addition, MNRE enhanced the capacity of solar parks and ultra-mega solar parks from 20GW to 40GW.
Our Approach
We sell energy to government utilities and independent industrial and commercial customers at predictable fixed prices. Since our energy generation does not rely on fossil fuels, our electricity prices are insulated from the volatility of commodity pricing. We also guarantee the electricity production of our solar power plants to our customers.
The typical project plan timeline for our projects is approximately thirteen months. The major stages of project sourcing, development and operation are bidding, land acquisition, financing, material delivery and installation, as well as monitoring and maintenance. Once a bid is won, a letter of intent is issued and all of our departments initiate their activities. After that, the PPA is signed, which reflects the commercial operation date before which a plant should be commissioned. Generally, once the letter of intent is received, we obtain the relevant land permits depending on whether the land is government-owned or private. We generally finance our projects with a 75:25 debt-to-equity ratio. Once land is obtained, our EPC team works very closely to construct and deliver the plant in the most efficient manner. Once commissioned, our O&M team monitors performance of all the projects near real time.
We utilize our integrated project development, EPC, financing and O&M services without involving multiple third-party services. This approachJanuary 2024 (excluding large hydro). India has allowed us to generate efficiencies of scale that further drive down system costs. A low cost structure allows us to bid for auctions strategically, which supports our high auction win rate and helps preserve our market leading position, which further reduces costs.
As the first developer and operator of utility scale solar assets in India, we believe that we are a well-established brand that has grown alongside the burgeoning Indian solar market since 2009. We have proven to be
a reliable developer that successfully and expediently executes on our development pipeline and wins repeat business. Our reputation and track record give us an advantage in the auction evaluation process, improving our win rate. As a result, we believe we have becomewitnessed one of the largest pure solar operatorsfastest growth rates in the space, which affords us greater negotiating powerrenewable energy capacity among all large economies, with original equipment manufacturers and project finance lenders. Thisrenewable energy capacity growing from 35.5 GWs in turn improves our cost and capital structure, which benefits our bid win rate.
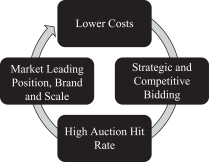
We lower the levelized costMarch 2014 to 135 GWs in January 2024 (excluding large hydro), a 280% increase. India’s total electricity installed capacity stood at 429 GWs as of energy through our three-pronged approach February 2024.
Total Installed Capacity (as follows:
of January 31, 2024)
Value engineering. Our in-house EPC allows us to enhance our system design expertise with each successive project, be flexible with our choice of technology and source from top-tier suppliers that optimizes both the system cost and power yield of the total solar block.
Operational performance monitoring. We operate a National Operating Control Center, or NOCC, that allows us to monitor project performance in real-time and allows us to respond rapidly to potential generation anomalies. Feedback from our operating projects also serves to further enhance our project designs, resulting in enhancements for current and new plants.
| Category | | Installed Generation Capacity
(in MW) | | | % Share in Total | |
| Coal | | | 208,190 | | | | 48.42 | |
| Lignite | | | 6,620 | | | | 1.54 | |
| Gas | | | 25,038 | | | | 5.82 | |
| Diesel | | | 589 | | | | 0.14 | |
| Total Fossil Fuel | | | 240,437 | | | | 55.92 | |
| Hydro | | | 46,928 | | | | 10.91 | |
| Wind | | | 44,969 | | | | 10.46 | |
| Solar | | | 74,307 | | | | 17.28 | |
| Bio Mass Power/Cogen | | | 10,262 | | | | 2.39 | |
| Waste to Energy | | | 584 | | | | 0.14 | |
| Small Hydro Power | | | 4,995 | | | | 1.16 | |
| Nuclear | | | 7,480 | | | | 1.74 | |
| Total Non-Fossil Fuel | | | 189,525 | | | | 44.08 | |
| Total Installed Capacity | | | 429,962 | | | | 100.00 | |
Financial strategy. We are able to offset project equity requirements through economic benefits generated by our EPC and O&M businesses. Coupled with our asset financing strategy, we are able to optimize the overall cost of capital leading to enhanced economics for our customers and shareholders.
Our Competitive StrengthsPower Consumption
We believe we differentiate ourselves fromthat there is huge potential for power demand to grow in India. The country is among the competitionfastest growing large economies, already ranked fifth globally in a numberterms of key ways.
Market leadership We have a first mover advantage fromtotal GDP. Over the construction of India’s first private utility scale solar photovoltaic power plant in 2009 as well as the implementation of the first megawatt scale rooftop smart city initiative in 2013. Additionally, our strong track record in policyten year period up to January 2024, electricity consumption and project development across utility scale and commercial rooftop projects has helped us gain a leading market sharepeak demand in India with an 9% share in federal tenders we participated in between 2014grew at a CAGR of 3.8% and 2017 and a market leading auction win rate of 74% for bids we participated in from 2010 to 2017.
Scale and brand-name recognition. We have proven to be a reliable developer with successful and expedient execution of our development pipeline, which has helped us win repeat business. Our reputation and track record provide us an advantage in the auction evaluation process, thereby improving our win rate. As a result, we believe we have become one of the largest solar developers and operators in India.
In-house EPC and O&M expertise enable cost efficiencies. Our in-house EPC capabilities enhance our ability to be flexible with our choice of technology, which allows us to choose high quality equipment while optimizing the combination of total solar project cost and yield. Our in-house O&M capabilities maximize project yield and performance through proprietary system monitoring and adjustments. We have demonstrated an 83% decrease in total solar project cost since inception in part through continual innovation in our EPC and O&M capabilities.
Superior technical and execution capabilities. We have developed proprietary systems that significantly reduce the time it takes to design, finance, commission, operate and maintain projects. Our lean and efficient execution expertise facilitates completion of our plants ahead of contracted completion dates, enables us to easily scale our operations without significant increases to headcount, and allows us to construct several projects in parallel without compromising on efficiency.
Long term, stable cash generation. We typically enter into 25-year, fixed price PPAs with government agencies and independent commercial businesses. As a result of generally reliable solar irradiation5.2%, respectively. Annual per capita power consumption in India our energy production under these PPAs has historically had little volatility, which, coupled with our low operating expenses, makes for predictable cash flowsalso grown significantly from these agreements.
Long term community support. We hire from local communities and generally lease land that has few alternative uses, providing local communities with a stream of discretionary cash flow without displacing alternative businesses. As a result we are able0.9 MWh in FY 2014 to build long term community relationships, which allows us to improve our time of completion, further reducing project development risk.
Strong management. Our senior leadership team and Board of Directors include widely recognized experts1.3 MWh in solar energy, energy finance and public policy, with track records of building successful businesses. Our Board of Directors also includes Robert Kelly, Arno Harris, Barney Rush and Cyril Cabanes, who are well-respected global authorities in energy finance and public policy.
Our Business Strategy
Key elements of our business strategy include the following.
Rapidly grow our project portfolio to achieve scale benefits. We intend to rapidly grow our project portfolio, which will enable us to achieve further economies of scale. We plan to significantly expand our presence in commercial and micro-grid applications. In order to continue this growth, we plan to reinvest our operating cash flow into new project development and construction.
Maintain position as a top Indian solar company. We are the longest tenured solar power producer in India and we believe we have the largest portfolio of operating projects under the NSM and one of the largest portfolios of operating projects in India. We have developed critical operational expertise and regional knowledge that improves project performance and expedites project execution, all of which should help us preserve our market leading position.
Continue to drive project cost reductions. We will continue to reduce costs by leveraging our in-house EPC and O&M capabilities and by improving our negotiating power with technology providers and project lenders. We expect to further reduce our cost of financing to reduce the cost of energy for our customers and achieve grid parity with local alternatives in the utility market in the next few years.
Leverage track record and management relationships to shape policy. We have petitioned governments at the local, state and central levels for substantial changes to solar policy that are essential to the advancement of the solar industry. We plan to leverage our track record, together with our management’s long-running relationships with policy-makers, to influence policy at all governmental levels.
Expand into new locations. As of March 31, 2017, we had a presence in 18 of 36 states and union territories in India. Given the strength of the solar resource through India and our distribution model, we intend to operate in every state that has structural power needs. We participate in both national and state level renewable energy auctions. We intend to continue to expand our presence into other states in India and other emerging markets with underserved electricity markets.
Seasonality
The energy output performance of our plants2022-23, although it is dependent in part on the amount of sunlight. As a result, our revenue in the past has been impacted by shorter daylight hours in winters. Typically, our revenue isstill among the lowest in the third quarterworld. According to the International Energy Agency, the annual per capita electricity consumption of India is around 21.7% that of China, which had per capita electricity consumption of 5.98 MWh, and highestaround 9.9% of the United States, which had per capita electricity consumption of 13.07 MWh.
Solar Energy Potential
The National Institute of Solar Energy (“NISE”), an autonomous research and development institution under the Ministry of New and Renewable Energy (“MNRE”), assesses the country’s solar potential at approximately 748 GWs, assuming 3% of the waste land area could be covered by Solar PV modules. Solar energy has taken a central place in India’s NAPCC with the National Solar Mission (“NSM”) as one of the key missions. The GoI have launched various schemes under the NSM to boost generation of solar power in the first quartercountry, most importantly procurement of any given fiscal year, which for us ends on March 31.
Please refer to – “Item 5. Operating and Financial Review and Prospects — Power Purchase Agreements” for summary of our projects.
Competition
We believe our primary competitors are other solar developerspower by SECI, but also including initiatives such as Tata Power Solar Systems Limited, Adani Power LimitedPark Scheme, Viability Gap Funding (“VGF”) Schemes, CPSU Scheme, Defence Scheme, Canal bank & Canal top Scheme, Bundling Scheme and ACME Cleantech Solutions Private Limited. CompetitionGrid Connected Solar Rooftop Scheme.
In addition, policies to acquire new projects occurs atpromote and enable renewable energy have included a Renewable Purchase Obligation (“RPO”) on certain industries, the development stage as we bidwaiver of ISTS charges and losses for long term PPAs in centralinter-state sale of solar and statewind power, “must run” status, guidelines for procurement of solar power auctions. We compete with other solar developersthough tariff based on a number of factors, including the sourcingcompetitive bidding process, standards for deployment of solar photovoltaic systems and devices, provision of roof top solar and guidelines for development of smart cities, amendments in building by-laws for mandatory provision of roof top solar for new construction or higher floor area ratio, infrastructure status for solar projects, reputationtax free solar bonds, and track record, relationshipproviding long tenor loans from multi-lateral agencies.
Solar power capacity in India increased from 2.6 GWs in March 2014 to 74.3 GWs as of January 2024. The following diagram shows solar installed capacity as of January 2024 for states with government authorities, access to capitalhighest irradiation:
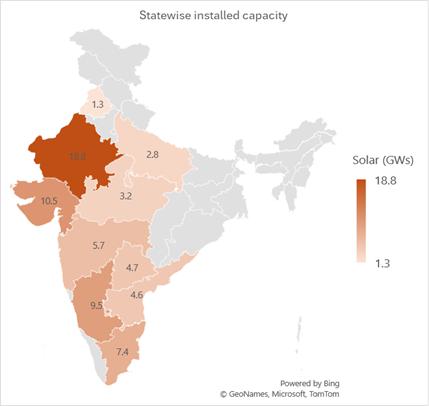
Wind Energy Potential
In recent years wind power generation capacity in India has increased significantly. Through the National Institute of Wind Energy, the GoI installed over 800 wind-monitoring stations across the country and control over quality, access to project land, efficiencyissued wind potential maps at 50 meters, 80 meters, 100 meters and reliability in project development. Based on these factors, we believe that we compete favorably with our competitors120 meters above ground level. The recent assessment indicates a gross wind power potential of 302 GWs in the regions we service.country at 100 meters and 695.50 GWs at 120 meters above ground level. Most of this potential exists in seven states: Gujarat, Telangana, Maharashtra, Tamil Nadu, Madhya Pradesh, Karnataka and Andhra Pradesh.
We also compete with utilities generating power from conventional fossil fuels. Utilities generating conventional energy face rising costs as
D. Regulatory Matters
Due to the constraints on domestic fuel supply continueindustry and these energy sources do not benefit from various governmental incentives available to renewable energy producers. As we reduce our levelized cost and achieve parity with conventional energy suppliers, we expect to compete favorably with these suppliers on the basis of cost and reliability.
However, we cannot guarantee that some of our competitors do not or will not have advantages over us in terms of larger size, internal access to solar panels and greater operational, financial, technical, management, lower cost of capital or other resources.
Project Development
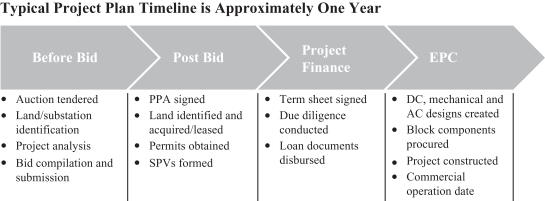
We participate in central- and state-level renewable energy auctions to build our utility scale portfolio. Our track record and size ensure we are able to participate in all auctions. Our in-house EPC and O&M capabilities and our pan-India presence provide us with greater visibility into competitive metrics, which allows us to bid strategically to maintain a high win rate while preserving good project economics.
The major stages of project sourcing, development and operation:
Bidding. We have a well-organized process to effectively track all the policies and bid updates in the market. Once a tender is tracked, relevant information sourced from the request for proposal document is discussed with the finance and technical teams and approved by the relevant committees before a strategic decision is made to participate in the bid. We also have an in-house project development information database which help us predict and bid the most effective tariff in the market. Once the bid is won, a letter of intent is issued and all the departments initiate their activities. Afterwards, the PPA is signed, which reflects the commercial operation date before which a plant should be commissioned.
Land acquisition. Generally, once the letter of intent is received, we obtain the relevant land permits depending on whether the land is government-owned or private. When the land is privately owned, we identify the appropriate parcels of land and due diligence is conducted by a local legal counsel. We also undertake certain compliance measures, including technical diligence, soil testing, local advertisement, stakeholder consultation and land registration after which acquisition is complete. When the land is government-owned, we identify the suitable parcels of land from the responsible agency and obtain approval from the relevant authority.
Financing. The projects are generally financed with 75:25 debt-to-equity ratio. To enable rapid operationgeographic diversity of our projects, we use short term credit facilities thatour operations are refinanced with long term project finance facilities. We invest equity from internal accrualssubject to a variety of rules and new financings to help growth and lower financing costs.
Material Delivery and Installation. Our procurement and construction teams work very closely to construct and deliver the plant in the most efficient manner. A detailed project planregulations. Set forth below is made and the progress tracker on the delivery and construction is reviewed very closely. Accordingly, we have consistently commissioned our projects before the commercial operation date.
Monitoring and Maintenance. Our operations team monitors performance of all the projects near real time from the NOCC, which allow us to respond rapidly to potential generation anomalies. They also perform scheduled preventive maintenance tasks on daily, weekly, monthly, and annual intervals to ensure our plants run smoothly and at high efficiency.
Suppliers and Service Providers
We purchase major components such as solar panels and inverters directly from multiple manufacturers. There are several suppliers in the market and we select our suppliers based on expected cost, reliability, warranty coverage, ease of installation and other ancillary costs. Asa brief overview of the date of this annual report, our primary solar panel suppliers were First Solar FE Holdings PTE Ltd., Waaree Energies Pvt. Ltd.,principal laws and Canadian Solar Inc., and our primary inverter suppliers were SMA Solar Technology AG, Schneider Electric India Pvt. Ltd., ABB India Limited, Hanwha Q CELLS Co., Ltd and Bonfiglioli Renewable Power Conversion India Pvt Ltd. We also source copper cables from General Cable Corporation and solar mounting structures from Unirac, Inc. We also engageregulations currently governing the engineering services of Lahmeyer Group, Black & Veatch and Fichtner Consulting Engineers. We typically enter into master contractual arrangements with our major suppliers that define the general terms and conditionsbusinesses of our purchases, including warranties, product specifications, indemnities, deliveryIndian subsidiaries. The laws and other customary terms. We normally purchase solar panelsregulations set out below are not exhaustive and are only intended to provide general information to the balance of system components on an as-needed basis from our suppliers at then-prevailing prices pursuantinvestors and are neither designed nor intended to purchase orders issued under our master contractual arrangements. We generally do not have any supplier arrangements that contain long-term pricing or volume commitments, although at times in the past we have made limited purchase commitments to ensure sufficient supply of components. The prices of componentsbe a substitute for our solar power plants have declined over time as the manufacturers have lowered their cost of production, although the pace of this decline has been slowing recently.professional legal advice.
In addition, in April 2010, we entered into an agreement with SunEdison Energy India Private Limited, or SunEdison, whereby upon the satisfaction of certain conditions, SunEdison would provide monitoring technologies
Central Government – Policies and hardware at cost to 25 MW of our utility scale projects in India. The Company has entered into a strategic agreements in which Hanwha Q Cells Korea Corporation has invested in the Andhra Pradesh 1 project and the Punjab 4 Project. We have entered into a master supply agreement with First Solar FE Holdings Pte. Limited for 190 MW offering preferential payments terms and supply credit for up to two years from supply date. Furthermore, we source lender technical due diligence and supplier third party certification from Lahmeyer International (India) Private Limited.Regulations:
Government Regulations
The Electricity Act, 2003
The Electricity Act, 2003, or Electricity Act, regulates and governsas amended (the “Electricity Act”) is the central legislation which covers, among others, generation, transmission, distribution, trading and use of electricity in India. UnderIt governs the Electricity Act, the transmission, distributionestablishment, operation and trademaintenance of any electricity are regulated activities that require licenses from the relevant electricity regulatory commission (Central Electricity Regulatory Commission), State Electricity Regulatory Commissions, or SERCs, or the joint commission (constituted by an agreement entered into by two or more state governments or the central governmentgenerating company and prescribes technical standards in relation to one or more state governments, as the case may be).
In termsconnectivity of generating companies with the grid. As per provisions of the Electricity Act, any generating company may establish, operate and maintain generating stations without obtaining a license if it complies with prescribed technical standards relating to grid connectivity. The generating company iscompanies are required to establish, operate and maintain generating stations, tie-lines, sub-stations and dedicated transmission lines.
Further, the generating companycompanies may supply electricity to any licensee or even directly to consumers, subject to availingobtaining open access to the transmission and distribution systems and payment of transmission charges, including wheeling charges and any other open access charges, as may be determined by the relevantconcerned electricity regulatory commission. In terms of the Electricity Act, open access means the non-discriminatory provision for the use of transmission lines or distribution system or associated facilities with such lines or system, by any licensee or consumer or a person engaged in generation in accordance with the regulations specified by the relevant electricity regulatory commission.
The relevant electricity regulatory commission is empowered to, among other things, determine or adopt
In accordance with Section 7 of the tariff for supply of electricity from the generating company to a distribution licensee (such as the distribution utility companies), for transmission of electricity, wheeling of electricity and retail sale of electricity. However, the relevant electricity regulatory commission may, in case of shortage of supply of electricity, fix the minimum and maximum tariffs for sale or purchase of electricity under agreements betweenElectricity Act, a generating company may establish, operate and maintain a licensee or between licensees, forgenerating station without obtaining a period not exceeding one year,license under the Electricity Act if it complies with the technical standards relating to ensure reasonable pricesconnectivity with the grid prescribed under clause (b) of electricity. While determiningSection 73 of the tariff, commissionsElectricity Act.
Under the Electricity Act, the State Electricity Regulatory Commissions, (“SERCs”) are required to be guided by, among others, the promotion ofpromote co-generation and generation of electricity from renewable sources of energy.
Underenergy and sale of electricity to any person from sources other than the incumbent distribution licensee under the provisions of open access. The Electricity Act certain offences includingfurther requires the theftSERCs to specify, for the purchase of electricity electric lines and materials, interference with meters or worksfrom renewable sources, as a percentage of the total consumption of electricity within the area of a distribution licensee, which has been implemented in the negligent wasteform of electricity and non-compliance of orders or directions attract monetary penalties ranging from INR 0.01 million to INR 0.1 million and imprisonment for periods ranging from three months to three years. renewable purchase obligations (“RPOs”).
Additionally, non-compliance with orders of the Regional Load Dispatch Centre and State Load Dispatch Centre may result in penalties of up to INR 15 million.
Further, the Electricity Rules, 2005, or the as amended (“Electricity Rules,Rules”) also prescribe a regulatory framework for developing captive generating plants. Pursuant to the Electricity Rules, a power plant shall qualify as a captive power plant only if not less than 26% of the ownership is held by captive users and not less than 51% of the aggregate electricity generated in such plant, determined on an annual basis, is consumed for captive use. Further, in case
Tariff Determination
Under the Electricity Act, the appropriate commission is empowered to determine the tariff for the supply of association of persons, the captive users are required to hold not less than 26% of the ownership of the plant in aggregate and consume not less than 51% of the electricity generated, determined on an annual basis, in proportion to their share ownership in the power plant within a variation not exceeding 10%.
In case ofby a generating station ownedcompany to a distribution licensee. The appropriate electricity regulatory commission is guided by a company formed as a special purpose vehicle,certain principles while determining the electricity requiredtariff applicable to be consumed by captive users is to be determined with reference to such unit or units identified for captive usepower generating companies which include, among other things, principles and not with reference to the generating station as a whole and equity shares to be heldmethodologies specified by the captive users must not be less than 26% of the proportionate equityCERC for tariff determination, safeguarding consumer interest of the company related to the generating unit or units identified as the captive generating plant.
The Electricity (Amendment) Bill, 2014 was introducedand other multiyear tariff principles established in the lower house of the Indian Parliament to amend certain provisions of the Electricity Act. Among others, the amendment empowers the Indian government to establish and review a national renewable energy policy, tariff policy and electricity policy. Further, the Indian government may, in consultation with the state governments, notify policies and adopt measures for promotion of renewable energy generation including through tax rebates, generation linked incentive, creation of national renewable energy fund, development of renewable industry and for effective implementation and enforcement of such measures.
The generating company is also required to ensure compliance with certain other regulations, including the Central Electricity Authority (Safety Requirements for Construction, Operation and Maintenance of Electrical Plants and Electric Lines) Regulations, 2011.
The National Electricity Policy, 2005
The Indian government approved the National Electricity Policy on February 12,(“NEP”) in 2005, the Tariff Policy 2006 (as defined below) and the National Tariff Policy of India, 2016 (“NTP 2016”). Tariffs may also be determined through the transparent process of bidding in accordance with guidelines issued by the GoI.
Guidelines for Tariff Based Competitive Bidding Process for Procurement of Power from Grid Connected Solar PV Power Projects
The MoP has issued revised guidelines for tariff based competitive bidding process for procurement of power from grid connected solar PV power projects. These guidelines are issued under the provisions of Section 63 of the Electricity Act, 2003 for long term procurement of Solar power by the Procurers, from solar PV power projects, with or without energy storage, through competitive bidding.
The projects already awarded/ under implementation/ commissioned under the erstwhile bidding guidelines, will continue to be governed by those guidelines and will not be covered under these guidelines.
The objectives of these guidelines are to promote competitive procurement of electricity from solar PV power plants, by distribution licensees and to facilitate Solar PV capacity addition and fulfilment of Renewable Purchase Obligation (RPO)/ Energy Storage Obligations (ESO) requirement of DISCOMs.
Guidelines for Tariff Based Competitive Bidding Process for Procurement Power from Grid Connected Wind Power Projects
The MoP has also issued revised guidelines for tariff based competitive bidding process for procurement power from grid connected wind power projects. These guidelines too are issued under the provisions of Section 63 of the Electricity Act, 2003 for procurement of electricity by the Procurer(s), from grid-connected wind power projects having (a) bid capacity of 10 MW and above for projects connected to intra-state transmission system; and (b) bid capacity of 50 MW and above for projects connected to inter-state transmission system.
The objectives of these guidelines are to facilitate renewable capacity addition and fulfilment of Renewable Purchase Obligation (RPO) requirement of distribution licensees and to provide a transparent, fair, standardized procurement framework based on open competitive bidding with appropriate risk-sharing between various stakeholders to enable procurement of power at competitive prices in consumer interest, improve bankability of projects and ensure reasonable returns to the investors.
Guidelines for Tariff Based Competitive Bidding Process for Procurement of Power from Grid Connected Wind Solar Hybrid Projects.
The MoP has issued revised guidelines for tariff based competitive bidding process for procurement of power from grid connected wind solar hybrid projects. These Guidelines are issued under the provisions of Section 63 of the Electricity Act, 2003 for long term procurement of electricity through competitive bidding process, by procurer, from hybrid power projects having (a) bid capacity of 10 MW and above for projects connected to intra-state transmission system and (b) bid capacity of 50 MW and above for projects connected to inter-state transmission system, subject to the condition that the rated power capacity of one resource (wind or solar) shall be at least 33% of the total contracted capacity.
Storage may be added to the hybrid power project to ensure availability of firm power for a particular period, reduce the variability of output power from wind solar hybrid project and providing higher energy output for a given capacity at delivery point, by installing additional capacity of wind and solar power in a wind solar hybrid project. The power procured from the project may be used for fulfilment of RPO in the proportion of rated capacity of solar and wind power in the plant respectively.
The projects already awarded/ under implementation/ commissioned under the erstwhile bidding guidelines, will continue to be governed by those guidelines and will not be covered under these guidelines.
The objectives of these guidelines are to promote competitive procurement of electricity from grid connected wind solar hybrid power projects, by distribution licensees, to protect consumer interests and to facilitate renewable capacity addition and fulfilment of Renewable Purchase Obligation (RPO) requirement of DISCOMs;
Guidelines for Tariff Based Competitive Bidding Process for Procurement of Firm and Dispatchable Power from Grid Connected Renewable Energy Power Projects with Energy Storage Systems
The MoP has issued new guidelines for tariff based competitive bidding process for procurement of firm and dispatchable power from grid connected renewable energy power projects with energy storage systems. These guidelines too are issued under the provisions of Section 63 of the Electricity Act, 2003 for long term procurement of firm and dispatchable power by the procurers, from RE Projects, through competitive bidding.
The objectives of these guidelines are to provide firm and dispatchable power to the DISCOMs from renewable energy sources, facilitate renewable capacity addition and fulfilment of Renewable Purchase Obligation (RPO)/ Storage Power obligations (SPO) requirement of DISCOMs. These guidelines also provide a transparent, fair, standardized procurement framework based on open competitive bidding with appropriate risk-sharing between various stakeholders to enable procurement of power at competitive prices in consumer interest, improve bankability of projects and ensure reasonable returns to the investors. This will also provide a framework for the inter-state/ intra-state, long-term, sale-purchase of power as a further measure to derisk the sector.
National Electricity Policy, 2005
The GoI promulgated the NEP in 2005, under Section 3 of the Electricity Act. The National Electricity Policy, 2005 has material effects on our business since it provideskey objectives of the policy framework to the central and state Electricity Regulatory Commission in developingNEP, amongst other things are, stipulating guidelines for accelerated development of the power sector, supplyingproviding supply of electricity to all areas and protecting interests of consumers and other stakeholders, while keeping in view the availability of energy resources, technology available to exploit suchthese resources, economics of generation using different resources and energy security issues. The National Electricity Policy
Further, NEP emphasizes the need to promote generation of electricity based on non-conventional sources of energy.
The National Electricity PolicyNEP provides that the SERCs should specify appropriate tariffs in order to promote renewable energy until(until renewable energy power producersprojects relying on non-conventional technologies can compete with conventional sources of energy. The SERCs are required to ensure progressive increase inwithin the share of generation of electricity from renewable energy sources and provide suitable measures for connectivity with grid and sale of electricity to any person. Further, thecompetitive bidding system). SERCs are required to specify for the purchase of electricity from renewable energy sources, a percentagepercentages of the total consumption of electricity in the area of a distribution licensee.licensee that progressively increase the share of electricity generated from renewable sources. Furthermore, the National Electricity PolicyNEP provides that such purchase of electricity by distribution companies should be through a competitive bidding process. bidding.
The GoI has released draft of National Electricity Policy, permits2021 and sought comments from the SERCs to determine appropriate differential pricesstakeholders. Once implemented, the draft National Electricity Policy aims at achieving the following objectives, among others: (a) promotion of clean and sustainable generation of electricity; (b) development of adequate and efficient transmission systems; (c) revitalization of DISCOMs; (d) development of efficient markets for electricity; (e) supply of reliable and quality power in line with specified standards in an efficient manner; (f) move towards light- touch regulation; and (g) promotion of manufacturing goods and services in India in the purchase of electricity from renewable energy power producers, in order to promote renewable sources of energy.
The National Tariff Policy, 2016
The Indian Government notified the revised National Tariff Policy effective from January 28, 2016. Among others, the National Tariff Policy seeks to ensure availability of electricity to consumers at reasonablegeneration, transmission and competitive rates, financial viabilitydistribution segments of the power sector and attract investments and promote generation of electricity from renewable sources.
The National Tariff Policy mandates that state electricity regulatory commissions must reserve a minimum percentage for purchase of solar energy equivalent to 8% of total consumption of energy by March 2022. In order to further encourage renewable sources of energy,under the National Tariff Policy mandates that no inter-state transmission charges and losses shall be levied till such period as may be notified on transmission of the electricity generated from solar power plants through the inter-state transmission system for sale.
Central Electricity Regulatory Commission (Terms and Conditions for Tariff Determination from Renewable Energy Sources) Regulations, 2012
The Central Electricity Regulatory Commission has announced the Central Electricity Regulatory Commission (Terms and Conditions for Tariff Determination from Renewable Energy Sources) Regulations, 2012, or Tariff Regulations, which prescribes the criteria that may be taken into consideration by the SERCs
while determining the tariff for the sale of electricity generated from renewable energy sources which include, among others, return on equity, interest on loan capital and depreciation. Accordingly, such tariff cannot be determined independently by renewable energy power producers such as our company. Pursuant to the National Tariff Policy, the Central Electricity Regulatory Commission is required to determine the rate of return on equity which may be adopted by the SERCs to determine the generic tariff, keeping in view the overall risk and prevalent cost of capital, which factors are also to be taken into consideration by SERCs while determining the tariff rate. The Tariff Regulations prescribe that the normative return on equity shall be 20% per annum for the first 10 years and 24% per annum from the 11th year onwards.
The Tariff Regulations also provide the mechanism for sharing of carbon credits from approved clean development mechanism projects between renewable energy power producers and the concerned beneficiaries. Under the Tariff Regulations, the project developer is entitled to retain 100% of the gross proceeds on account of clean development mechanism project benefit in the first year after the date of commercial operation of the generating station. Subsequently, in the second year, the share of the beneficiaries is increased to 10% and then progressively increased by 10% every year until it reaches 50% after which the clean development mechanism project proceeds are to be shared equally between the generating company and the beneficiaries.
Jawaharlal Nehru National Solar Mission
The NSM was approved by the Indian government on November 19, 2009 and launched on January 11, 2010. The NSM has set a target of 100,000 MW of solar powerMake in India by 2022initiative and seeks to implement and achieve the target in three phases (Phase I from 2012 to 2013, Phase II from 2013 to 2017 and Phase III from 2017 to 2022)Atmanirbhar Bharat Abhiyan (self-reliance scheme). NSM aims at creating conditions for rapid scale up of capacity and technological innovation to drive down costs towards grid parity.
Renewable Purchase Obligations
The Electricity Act promotes the development of renewable sources of energy by requiring the SERCs to ensure grid connectivity and the sale of electricity generated from renewable sources. In addition, it requiresthe Electricity Act and the Tariff Policy require the SERCs to specify, for the purchase of electricity from renewable sources, a percentage of the total consumption of electricity within the area of a distribution licensee, which are known as RPOs. Pursuant to this mandate, most of the SERCs have specified solar and non-solar RPOs in their respective states. In terms of the RPO regulations, RPOs are required to be met by obligated entities (that is, distribution(distribution licensees, captive power plants and open access consumers) by purchasing renewable energy, either by entering into PPAs with renewable energy power producers or by purchasing renewable energy certificates. The RPO regulations require the obligated entities to purchase power from renewable energy power producers such as our company.the Group, or by purchasing renewable energy certificates (“RECs”). In the event of default by an obligated entity in any fiscal year, the SERCsSERC may direct the obligated entity to pay a penalty or to deposit an amount determined by the relevant SERC, into a fund to be utilized for, among others, the purchase of RECs.
Further, the Energy Conservation Act, 2001, as amended by Energy Conservation (Amendment) Act, 2022, delegates powers to the Central Government to specify minimum share of consumption of non-fossil resources by designated consumers as energy or feed stock and specify different shares of consumption for different types of non-fossil resources for different designated consumers. The distribution licensees have also been notified as designated consumers under the Energy Conservation Act, 2001.
Additionally, in terms of the amended Energy Conservation Act, 2001, the Ministry of Power through notification dated 20.10.2023, has specified a minimum share of consumption of renewable energy certificates.by the electricity distribution licensees as a percentage of total share of energy consumption, with certain conditions.
The above notification is to come into force on 1st April 2024 and therefore the distribution licensees will have to comply with the specified renewable energy consumption norms w.e.f. FY 2024-25.
Central Electricity Regulatory Commission (Connectivity and General Network Access to the inter-State Transmission System) Regulations, 2022 (“GNA Regulations”)
The CERC issued the GNA Regulations on June 7, 2022, which were fully enforced from October 1, 2023, and have replaced CERC Connectivity & Open Access regulations, 2009. These regulations aim to streamline and enhance the country’s power transmission and connectivity infrastructure. The GNA Regulations provide electricity generators with general network access, allowing them to connect to and distribute power through the inter-state transmission system without designating the location of the off taker.
CERC issues first Amendment to CERC (Connectivity and GNA to the ISTS) Regulations, 2023
On April 1, 2023, CERC introduced significant amendments to the GNA Regulations, aiming to streamline and enhance the functioning of the electricity grid. Among these amendments, one notable change is the provision allowing generating stations and energy storage systems (ESS) to expand their capacity within the approved connectivity limits. However, this expansion is subject to the condition that the net injection does not surpass the connectivity quantum, ensuring grid stability.
The amendment introduces specific eligibility criteria for renewable energy entities to avail ISTS Connectivity under the General Network Access (GNA) regulations, and specifies the required documents for different types of renewable applicants, such as Renewable Power Park Developers and Renewable Energy Generating Stations.
Also, the amendments address the reduction of GNA quantum for host states where regional generating stations are located, particularly those connected solely to the State Transmission Utility (STU) system or both STU and ISTS. This adjustment aims to balance the distribution of grid resources among states. Additionally, the amendments delineate eligibility criteria for Discoms and Bulk Consumers directly connected to ISTS and STU-connected drawee entities to apply for GNA-related benefits. It also outline procedures for power exchange transactions, specifically concerning ISTS charges, bilateral, and collective transactions undertaken through Power Exchanges. These procedures aim to ensure transparent and efficient settlement of transmission charges. Moreover, the amendments extend the period of GNA utilization between entities from one year to three years, providing flexibility and enabling longer-term planning and resource allocation. The notice period for relinquishing GNA has also been extended to one year from the previous 30 days, accompanied by a fee of Rs. 50 lakhs, which aims to streamline administrative processes.
Lastly, the amendments waive one-time GNA charges for capacity declared commercial on the effective date of the Regulations, promoting the development and commercialization of electricity generation projects without additional financial burden. These amendments collectively contribute to the optimization and efficiency of the electricity grid infrastructure in India.
Central Electricity Regulatory Commission (Sharing of Inter-State Transmission Charges and Losses) Regulations, 2020 (“CERC Transmission Charges Regulations 2020”) and its First Amendment, 2023
The CERC Transmission Charges Regulations 2020, as amended on February 7, 2023 (via its First Amendment), provides a framework for sharing of charges among the entities for using the ISTS network. The CERC Transmission Charges Regulations 2020 came into force from November 1, 2020 and superseded the CERC Transmission Charges Regulations 2010.
This regulation came into effect from October 1, 2023. The First Amendment aims to modify the CERC (Sharing of Interstate Transmission Charges and Losses) Regulations, 2020, aligning them with the CERC (Connectivity and General Network Access to the Inter-State Transmission System) Regulations, 2022. Key provisions introduced through this amendment include clarifications on definitions such as ‘Associated Transmission System’ and ‘Drawee DIC’, along with updated terminology consistent with Connectivity Regulations. The amendment also outlines procedures for billing and settlement of transmission charges among Drawee DICs and generating stations or sellers, ensuring transparency and equitable distribution of costs. Additionally, methodologies for computing transmission deviation, rates, and exemptions have been detailed to maintain grid stability and incentivize investment in renewable energy projects and energy storage systems. These amendments aim to streamline operations, promote renewable energy adoption, and facilitate reliable electricity supply across the nation.
As per the CERC Transmission Charges Regulations 2020, and its first amendment, ISTS transmission charges waiver to wind and solar projects is as follows:
| ● | Renewable Energy projects based on wind or solar sources which have declared commercial operation up to June 30, 2025 shall be considered for waiver of transmission charges, for a period of 25 years from date of COD; |
| ● | Battery ESS charged with REGS based on wind or solar sources which have declared commercial operation up to June 30, 2025 shall also be considered for waiver of transmission charges for a period of 12 years from date of COD; and |
| ● | Solar PV generating stations set-up under SECI’s manufacturing linked scheme for sale to entities having RPO, shall be considered for waiver of transmission charges for a period of 25 years from date of COD, irrespective of date of COD of such generating station. ISTS charges shall start to get levied in a phased manner for other solar or wind projects commissioned post June 30, 2025, with annual increments of 25%, so that solar or wind projects commissioned post June 30, 2028 shall have to bear 100% of the applicable ISTS charges. |
Central Electricity Regulatory Commission (Indian Electricity Grid Code) Regulations, 2023 (“Grid Code”)
The Indian Electricity Grid Code (IEGC) Regulations, 2023, as notified by CERC, came into force on October 1, 2023, marking an important moment in the governance of India’s electricity grid. IEGC aims to ensure reliability, stability, and efficiency of grid operations. It establishes technical and design criteria for connectivity, outlining procedures and requirements for the physical integration of grid elements. Additionally, the protection protocol section delineates settings and audit plans for electrical systems, ensuring the safety and integrity of grid infrastructure.
Furthermore, IEGC address aspects related to commissioning and commercial operation, covering processes for drawl or injection of startup power, trial run operations, and documentation requirements before the declaration of Commercial Operation Date (COD). Operational guidelines are detailed to ensure the integrity, stability, and resilience of the grid, aiming to achieve economy and efficiency in power system operations.
IEGC provide a framework for scheduling and dispatch procedures, facilitating the injection and drawl of power by regional entities while ensuring effective information exchange, including for intra-state and cross-border transactions. Cybersecurity measures are mandated for all grid users in accordance with relevant regulations and guidelines.
IEGC include provisions for monitoring compliance and specify that they shall not be treated as ‘Change in law’ in any agreements. Notably, the Scheduling and Dispatch Code introduces key provisions such as Regional Load Dispatch Centers (RLDCs) being provided with details before power scheduling, and the facilitation of scheduling through Qualified Coordinating Agencies (QCAs). The Security Constrained Unit Commitment (SCUC) mechanism is introduced to maximize reserves without altering buyer schedules, further enhancing grid security. The regulations also outline procedures for Unit Shut Down (USD) and scheduling from alternate sources.
Grid India issues procedure for determination of Uniform RE Tariff (URET) for implementation of the Central RE Pool Scheme approved by MoP in the Electricity (Amendment) Rules
Pursuant to the Electricity (Amendment) Rules 2022 (Amendment Rules), which inter-alia provide for implementation of uniform renewable energy tariff (URET), the MoP on October 25, 2023 issued the procedure for implementation of URET through Grid India, as the implementing agency (IA) for standardizing the tariff across various categories of central pool such as solar, wind etc., at which the intermediary procurer (IP) will sell power generated from renewable sources from such central pool to all the end procurers.
Some notable features of URET implementation procedure include:
| ● | Categorisation of central pools for the following renewable energy sources, including: (a) solar; (b) wind; (c) hydro; (d) solar-wind hybrid; (e) round-the-clock power (solar-wind hybrid and storage); (f) peaking power (solar-wind hybrid and storage); (g) firm and dispatchable renewable energy power; and (h) any other new pool as specified by the Central Government. |
| ● | The Central Government shall notify the start date for each category of central pool, which shall be for a duration of 3 years. All the capacity for which power supply agreements (PSAs) are signed within this period will be part of the central pool (provided other eligibility conditions are fulfilled), which will remain part of the pool till expiry of the respective PSAs. No new capacity will be added upon the lapse of the 3-year period from the start date of the pool. |
| ● | Applicability of URET is only on power procured by the end-procurer, which will not have any impact on the renewable energy tariff discovered under the respective tariff based competitive bidding process and payable to renewable energy generators by the IP as per the power purchase agreement (PPA). |
| ● | Contractual obligations between generators and IPs, and IPs and end-procurers shall be governed by the respective bidding documents including PPAs and PSAs and will have no bearing on URET. |
| | |
| ● | Role of the IA (i.e. Grid India) includes: |
| 1. | computing monthly URET based on information submitted by the IPs. |
| 2. | issuing monthly account statements for adjustment of any surplus/ deficit tariff among the IPs, based on information submitted by the IPs. |
| 3. | publishing relevant details including the monthly accounts statements on its website. |
| ● | Calculation of URET based on scheduled energy to end procurer from the pool by the IPs and actual amount payable for such supply of power. |
Further, the MoP vide office memorandum dated February 14, 2024, has notified the start date of the Solar Power Central Pool and Solar-Wind Hybrid Central Pool as February 15, 2024, for all solar and solar-wind hybrid projects bid for after the aforesaid start-date. The principle of operation of a pool shall be based on a first in first out (FIFO) approach, i.e. solar and solar-wind hybrid projects whose letter of award has been placed first, would be placed in their respective pools first, and also sold first by the IA.
The following Renewable Energy Implementing Agencies (REIA) of MNRE, all central govt. agencies, shall act as IP for the URET procedure – SECI Ltd., NTPC Ltd., NHPC Ltd. and SJVN Ltd.
Central Electricity Regulatory Commission (Deviation Settlement Mechanism and related matters) Regulations, 2022 (“F&S Regulations”)
The CERC in these regulations, as amended from time to time, has laid down rules guidelines and standards for maintaining grid discipline and grid security as envisaged under the Grid Code through the commercial mechanism for Deviation Settlement through withdrawal and injection of electricity by the users of the grid including wind and solar based plants connected to an interstate transmission network. The wind and solar generators connected to interstate transmission networks are required to provide a daily 15 minutes’ time block wise generation schedule. The schedule may be revised by giving advance notice to the relevant Regional Load Despatch Centre. Any deviations between actual generation with respect to the schedule generation in the 15-minute time block is liable to attract commercial charges as per the formula prescribed in the F&S Regulations.
Electricity (Timely Recovery of Costs due to Change in Law) Rules, 2021 (“Change in Law Rules”)
The Change in Law Rules, provide the mechanism for adjustment and recovery of monthly tariff or charges upon the occurrence of a change in law (such as change in any domestic tax including duty, levy, cess, or charges as specified under the Change in Law Rules), for the compensation of the affected party to restore such affected party to the same economic position as if such change in law had not occurred. Change in law, as per the Change in Law Rules, unless otherwise defined in the relevant agreement means, any enactment or amendment or repeal of any law, made after the determination of tariff under the Electricity Act, leading to corresponding changes in the cost requiring change in tariff. Where the relevant agreement does not lay down a formula for calculation of the amount of the impact of a change in law to be adjusted and recovered, such impact shall be calculated in accordance with the formula provided in the Change in Law Rules, which is based on, among other things, the estimated monthly electricity generation, contracted capacity of the power plant as per the agreement, normative plant load factor (“PLF”) and capacity utilization factor. The generating company or transmission licensee shall, within thirty days of the coming into effect of the recovery of impact of change in law, furnish all relevant documents along with the details of calculation for adjustment of the amount of the impact in the monthly tariff or charges to the appropriate commission, which shall verify the calculation and adjust the amount of impact within 60 days from the date of receipt of the relevant documents. After such adjustment, the generating company or transmission licensee, as the case may be, shall adjust the monthly tariff or charges annually based on actual amount recovered, to ensure that the payment to the affected party is not more than the yearly annuity amount. The MoP, pursuant to its circular dated February 21, 2022, clarified that this Change in Law Rules will be applicable on the events occurred on or after the date of notification of this Change in Law Rules.
Electricity (Promotion of Generation of Electricity from Must-Run Power Plant) Rules, 2021 (“Must-Run Rules”)
Under the Must-Run Rules, a wind, solar, wind-solar hybrid or hydro power plant (in cases where water levels could lead to flooding risk) or a power plant from any other sources, as may be established from time to time by the relevant governmental authority, that has entered into an agreement to sell electricity to any person is a ‘must-run power plant’. A must-run power plant is not subject to reduction or regulation of generation or supply of electricity on account of merit order dispatch or any other commercial consideration, except in the event of technical constraint in the electricity grid or for reasons of security of the electricity grid. In the event of reduced demand by a procurer from a must-run power plant, compensation is payable by the procurer to the must -run power plant at the rates specified in the agreement for purchase or supply of electricity. In the event of any technical constraint in the electricity grid or for reasons of security of the electricity grid, where the procurer notifies the must-run power plant in advance of a reduction, the must-run power plant will sell the electricity not utilized by the procurer on the open market. The amount realized by such must-run power plant from such sale of electricity on the open market, after deducting actual expenses paid for the sale on the open market, if any, shall reduce the compensation payable by the procurer. Amounts owed pursuant to the foregoing will be paid by the procurer on a monthly basis with any offset payment paid by the must-run power plant to the procurer within one month of the close of the fiscal year.
Electricity (Late Payment Surcharge) Rules, 2022 (“LPS Rules 2022”)
The LPS Rules 2022 were promulgated by the MoP on June 3, 2022. The LPS Rules 2022 are applicable for payments to be made in pursuance of power purchase agreements, power supply agreements and transmission service agreements, where tariff is determined under the Electricity Act, including such agreements which become effective before the LPS Rules 2022 came into force. The LPS Rules 2022 provide that late payment surcharge, that is, the charges payable by a defaulting obligated entity maydistribution company to a generating company or electricity trader for power procured from it, or by a user of a transmission system to a transmission licensee on account of delay in payment of monthly charges beyond the due date, shall be payable on the payment outstanding after the due date at the base rate of late payment surcharge applicable for the period for the first month of default. The rate of late payment surcharge for the successive months of default shall increase by 0.5% for every month of delay provided that the late payment surcharge shall not be more than three percent higher than the base rate at any time and shall not be higher than the rate specified in the agreement for purchase or transmission of power. All payments by a distribution licensee to a generating company or a trading licensee for power procured from it or by a user of a transmission system to a transmission licensee shall be first adjusted towards late payment surcharge and thereafter, towards monthly charges, starting from the longest overdue bill. LPS Rules 2022 also provides for regulation of access to power in case of non-payment of dues within the specified time period. The over-dues of the prior period, i.e., up to June 3, 2022, shall be liableliquidated through equated monthly instalments as per the provision of the LPS Rules 2022.
Ministry of Power Issues Draft Electricity (Late Payment Surcharge and Related Matters) Amendment Rules, 2023
MoP has also issued new draft Electricity (Late Payment Surcharge and Related Matters) Amendment Rules, 2023, on December 13, 2023. The draft proposes the incorporation of Temporary General Network Access (T-GNA) or General Network Access (GNA) within the regulations, expanding the scope of mechanisms to pay penaltyregulate access to beneficiaries in cases of delayed payment by distribution licensees or other users of the transmission system. Furthermore, the draft introduces amendments, requiring generating stations to offer un-requisitioned surplus power and power available against declared capacity in power exchanges. It outlines specific provisions for offering such power in market segments, including the Day-Ahead Market (DAM) and the Real-Time Market (RTM), while capping the price at 120% of the energy charge as determined by the SERCs.
In May 2015,Appropriate Commission. Moreover, it outlines consequences for failure to offer surplus power, ensuring that unutilized capacity does not factor into fixed charge computations. Additionally, the Supreme Courtdraft sets forth a mechanism for the distribution of India upheldgains from surplus power sales, stipulating that generators receive up to six paise per unit, with the remaining balance shared equally between distribution licensees and generating companies.
This comprehensive approach aims to streamline electricity transactions, encourage efficient surplus power utilization, and foster equitable distribution of gains within the electricity ecosystem, ultimately contributing to the stability and sustainability of India’s power sector.
Electricity (Promoting Renewable Energy Through Green Energy Open Access) Rules, 2022 (“Green Energy Open Access Rules 2022”)
The MoP promulgated the Green Energy Open Access Rules 2022 on June 6, 2022 with the objective of ensuring access to affordable, reliable, sustainable and green energy. The reduction of the open access transaction limit from 1 MW to 100 kW and appropriate provisions for cross-subsidy surcharge, additional surcharge, and standby charge is expected to incentivize consumer access to green energy at reasonable rates.
Ministry of Environment - E-Waste (Management) Rules, 2022
These rules apply to every manufacturer, producer refurbishes dismantler and recycler involved in manufacture, sale, transfer, purchase, refurbishing, dismantling, recycling and processing of e-waste or electrical and electronic equipment, including Solar panels/cells, solar Photovoltaic panels/cells/modules under Consumer Electrical and Electronics and Photovoltaic.
This rule requires every manufacturer and producer of solar photo-voltaic modules or panels or cells to also:
| ● | store solar photo-voltaic modules or panels or cells waste generated up to the year 2034 - 2035 as per the guidelines laid down by the CPCB in this regard; |
| ● | ensure that the processing of the waste other than solar photo-voltaic modules or panels or cells; |
| ● | ensure that the inventory of solar photo-voltaic modules or panels or cells shall be put in place distinctly on portal; and |
| ● | comply with standard operating procedure and guidelines laid down by CPCB. |
Renewable Energy Certificates (“RECs”)
The CERC promulgated the Central Electricity Regulatory Commission (Terms and Conditions for Recognition and Issuance of Renewable Energy Certificate for Renewable Energy Generation) Regulations, 2010 (“REC Regulations”) in 2010. The REC Regulations aim at the development of markets for power from non-conventional energy sources by issuance of transferable and saleable credit certificates. The REC Regulations facilitate fungibility and inter-state transaction of renewable energy with least cost and technicality involved. The CERC has nominated the National Load Dispatch Centre as the central agency to perform certain functions, including, inter alia, registration of eligible entities, issuance of certificates, maintaining and settling accounts in respect of certificates, acting as repository of transactions in certificates and such other functions incidental to the implementation of REC mechanism as may be assigned by the CERC. The REC mechanism provides a regulation that made it compulsorymarket-based instrument which can be traded freely and provides means for fulfilment of RPOs by the distribution utilities/consumers.
Central Electricity Regulatory Commission (Terms and Conditions for Renewable Energy Certificates for Renewable Energy Generation) Regulations, 2022
According to these regulations, renewable energy generating stations, captive power plantsgenerating stations based on renewable energy sources, distribution licensees, and open access consumers are now eligible to purchase electricityissue RECs.
The national load dispatch center has been designated the agency to fulfill their RPOs. This landmark judgment is expected to boostimplement these regulations. REC Regulations stipulated the demanddetails of Grant of accreditation, Issuance, Exchange, Redemption, Denomination, Pricing and Validity for certificates. CERC has also introduced certificate multiplier for renewable energy by captive playersgenerating station, Hydro, municipal solid waste, non- fossil fuel-based cogeneration and also improve the marketability ofbiomass and biofuel. Certificate once assigned to a renewable energy certificatesgenerating station, the certificate multiplier will remain valid for 15 years.
Approved Models and Manufacturers of Solar Photovoltaic Modules (Requirements for Compulsory Registration) (“ALMM”) order 2019
The GoI has introduced a list of approved module suppliers who will be eligible to supply modules to project developers selected to develop solar projects in India.government projects, government assisted projects, projects under government schemes and programs, open access, net-metering projects, installed in the country, including specified projects set up for sale of electricity to the government. MNRE, vide its order dated March 10, 2023, had held its ALMM order in abeyance for FY 2023-24, so the projects commissioned by March 31, 2024 will be exempted from the requirement of procuring solar photovoltaic modules from the list of approved module suppliers.
SafetyMinistry of Power issues Draft Notification on Renewable Generation Obligation (“RGO”)
MoP issued a draft notification, on October 6, 2023, on Renewable Generation Obligation 2023, superseding the earlier notification dated February 27, 2023. This notification proposes to mandate Coal and Environmental LawsLignite based generating stations to supply a minimum share of electricity generated by using non-fossil fuel sources e.g., renewable sources, to mandate reduction in consumption of fossil sources or increase the share of non-fossil sources. This notification proposes to enforce an obligation on Designated Consumer (DC), which is a coal or lignite-based generating station, to supplement its conventional generation with a minimum supply of RE to fulfil its RGO. DC has the option of either establishing RE capacity or procuring and supplying RE energy in the requisite quantum. DC will be at liberty to supply RE on commercial principles, independent of its existing PPA of its coal or lignite-based generating station.
We
A captive coal or lignite-based generating station is exempted from RGO subject to its fulfilment of RE Consumption Obligation as notified by the Central Government. Further, a generating company with more than one coal or lignite-based generating station are governed by certain safety and environmental legislations, including the Water (Prevention and Control of Pollution) Act, 1974, the Air (Prevention and Control of Pollution) Act, 1981, and the Hazardous Waste (Management, Handling and Transboundary Movement) Rules, 2016.
Under the Water (Prevention and Control of Pollution) Act, 1974 and the Air (Prevention and Control of Pollution) Act, 1981, failureallowed to comply with the ordersRGO on an aggregate basis. Also, obligation fulfilled by any DC under the “Scheme for Flexibility in Generation and restrictions passedScheduling of Thermal and Hydro Power Stations through Bundling with Renewable Energy and Storage Power, 2022, dated April 12, 2022 (RE Bundling) scheme)”, shall be considered as part of its RGO.
Guidelines for Procurement and Utilization of Battery Energy Storage Systems as part of Generation, Transmission and Distribution Assets, along with Ancillary Services
The GoI promulgated these guidelines in March 2022, and their objective is to facilitate the procurement of battery storage systems to be utilized either in combination with renewable energy or as a standalone asset. These guidelines will also play a critical role in achieving the nation’s renewable energy and decarbonization goals. Business opportunities identified by the StateMoP in this space include BESS coupled with RE and with transmission infrastructure and storage for distribution and ancillary services.
Revised Scheme for Flexibility in Generation of Thermal/Hydro Power Stations through Bundling with Renewable Energy and Storage Power
The GoI promulgated a revised scheme in April 2022. The revisions provide flexibility in generation and scheduling of power from thermal/hydro plants through bundling with renewable energy. This reduces the cost of power and helps distribution companies to meet renewable purchase obligations for distribution licensees to meet a certain minimum quantity of their power requirement from renewable sources.
Green Energy Corridor Phase-II
The Ministry of New and Renewable Energy (MNRE) has approved the implementation of the “Green Energy Corridor Phase-II - Inter-State Transmission System for 13 GW Renewable Energy Project in Ladakh (ISTS GEC-II)” on February 15, 2024. The project involves installing 713 km (or 1268 circuit kilometers) of transmission lines and two 5 GW High Voltage Direct Current (HVDC) terminals in Pang (Ladakh) and Kaithal (Haryana). It aims to facilitate power evacuation from a 13 GW renewable energy project, alongside a 12 GWh Battery Energy Storage System (BESS) in Ladakh. Power Grid Corporation of India Limited (POWERGRID) will execute the project in a single phase, scheduled for completion by the financial year 2029-30, with an estimated cost of INR 20,773.70 Crores. MNRE will coordinate with the Ministry of Power to ensure systematic planning and execution of RE generation and transmission projects. The project’s progress will be closely monitored by the Central Electricity Authority (CEA) and Central Transmission Utility of India Limited (CTUIL).
CERC notifies draft CERC (Procedure, Terms and Conditions for grant of Transmission Licence and other related matters) Regulations, 2023
The Central Electricity Regulatory Commission (CERC) has notified draft CERC (Procedure, Terms and Conditions for grant of Transmission Licence and other related matters) Regulations, 2023. As per the draft, no person shall be eligible for a grant of licence unless it is selected through the process under the competitive bidding guidelines; or an entity selected by the central government or its authorised agency to implement a project under the regulated tariff mechanism; or a bulk consumer, with a load of 50 MW and above, who intends to draw electricity for the purpose of self-consumption by constructing a connecting transmission line from the interstate transmission system sub-station to its premises. Additionally, a bulk consumer shall also be eligible to get its connecting transmission line constructed, maintained and operated by a transmission licensee instead of seeking the transmission licence itself by amendment of the transmission licence of such licensee.
CERC passes suo moto in the matter of removal of difficulties with respect to GNA regulations
The Central Electricity Regulatory Commission (CERC) issued a suo moto order addressing challenges in implementing certain provisions of the Central Electricity Regulatory Commission (Connectivity and General Network Access to the inter-State Transmission System) Regulations, 2022. Notable directives include allowing processing of power scheduling activities under the 2009 Connectivity Regulations until October 1, 2023, alongside the GNA Regulations. Entities are required to adjust bank guarantees submitted under the 2009 Regulations according to Regulation 37 of the GNA Regulations. The commission emphasized adherence to higher bank guarantee requirements between the two regulations until October 1, 2023.
Furthermore, considering the issues highlighted by RE Developers, the commission directed that change in the location of the land parcel - without any change in (a) the point of connectivity with ISTS and (b) the start date of connectivity - shall be allowed, and shall not lead to cancellation of the connectivity.
CERC issues staff paper on market coupling
The Central Electricity Regulatory Commission (CERC) has issued a staff paper on market coupling. The staff paper states that considering the fact that collective transactions account for more than 70 per cent of the electricity transacted through power exchanges, and the share of only one exchange has been increasing, the power exchanges with lower liquidity have been advocating for market coupling. The Commission provided enabling provisions in Power Market Regulations 2021 to introduce market coupling among the power exchanges to enable uniform price discovery. These provisions related to market coupling are yet to be brought into effect and form the basis for discussion in this paper. The paper, in the subsequent sections, discusses the regulatory provisions for market coupling, international experience, the objectives of market coupling in India, the issues and challenges in the implementation of market coupling, and the key points for discussion.
Environmental Laws
The Central Pollution Control Boards may resultBoard of India (“CPCB”) a statutory organization established in imprisonment1974 under the Ministry of a minimum termEnvironment, Forest and Climate Change (“MoEF&CC”) is responsible for setting the standards for maintenance of oneclean air and a half years. Additionally, certain acts including the destruction of property of the State Pollution Control Boards, failure to intimate the emission of pollutants or failure to furnish informationwater and providing technical services to the State Pollution Control Boards may attract monetary penaltiesMoEF&CC.
CPCB has classified industrial sectors under the red, orange, green and white categories. The newly introduced white category pertains to those industrial sectors which are practically non-polluting, including solar power generation through photovoltaic cells, wind power projects of upall capacities and mini hydroelectric power. In relation to INR 0.01 million and imprisonmentthe white category of upindustries, only intimation to three months.
The failure to comply with the Hazardous Waste (Management, Handling and Transboundary Movement) Rules, 2016 may attract monetary penalties as levied by therelevant State Pollution Control Board is required, and there is no requirement to obtain a liability for any damageconsent to operate within this category. However, to the environment or third parties.
Labor Laws
Weextent they are requiredapplicable to comply with certain labor and industrial laws, which includes the Factories Act, 1948, the Industrial Disputes Act, 1947, the Employees State Insurance Act, 1948, the Employees’ Provident Funds and Miscellaneous Provisions Act, 1952, the Minimum Wages Act, 1948, the Payment of Bonus Act, 1965, the Workmen Compensation Act, 1923, the Payment of Gratuity Act, 1972, the Contract Labour (Regulation and Abolition) Act, 1970 and the Payment of Wages Act, 1936.
Each of these legislations carry a penalty provision for non-compliance, which prescribe monetary penalties ranging from INR 0.001 million to INR 0.005 million and imprisonment for periods ranging from one month to three years.
State Regulations
Various states in India have from time to time, announced administrative policies and regulations in relation to solar power projects and related matters. These state-specific policies and regulations have material effects on our business because PPAs between project developers and state offtakers are entered into in accordance withentities prescribed under the relevant state policies and regulations. Accordingly, these PPAs are standard form contracts and the project developers have no flexibility in negotiating the terms of the PPAs. The majority of our solar power plant generation occurs in Rajasthan, Punjab, Andhra Pradesh and Karnataka.
For instance, for our projects in the states of Rajasthan, Punjab and Karnataka, our projects are subject to certain state policies as discussed below.
Rajasthan
The Rajasthan Renewable Energy Corporation Limited is the agency responsible for promoting and developing renewable energy in the state of Rajasthan. The government of Rajasthan has formulated the Rajasthan Solar Energy Policy, 2014, or Rajasthan Policy, which has come into effect on October 8, 2014 and will remain in force until superseded or modified by another policy. The Rajasthan Policy aims to create an enabling environment for installation of 25,000 MW of solar power. Generation of electricity from solar power plants under the Rajasthan Policy will be treated as an eligible industry under the scheme administered by the Industries Department, Government of Rajasthan and incentives available to industrial units under the Rajasthan Investment Promotion Scheme will be available to solar power projects. In accordance with the Rajasthan Policy, a solar power project with a capacity of 500 MW or more, established by a single developer at a single location with single or multiple metering requirements but having a common pooling sub-station will be considered as a mega solar power project. Mega solar power projects are entitled to an expedited project approval process.
Punjab
The Punjab Energy Development Agency is the agency responsible for promotion and development of renewable energy development projects and energy conservation schemes in the state of Punjab. The government
of Punjab has formulated the New and Renewable Sources of Energy Policy-2012, or Punjab Policy, on December 26, 2012. The Punjab Policy aims to harness 1000 MW of solar power generation capacity by 2022. All solar power projects developed under the Punjab Policy are treated as an industry in terms of industrial policy of Punjab and all the industrial incentives available to new industrial units will be applicable to solar power plants subject to the approval of Department of Industries and Commerce, Government of Punjab. Additionally, solar power projects are exempt from obtaining any consent in accordance withlegislation, the pollution control laws fromin India must be adhered to.
Energy Conservation (Amendment) Bill, 2022
The Energy Conservation (Amendment) Bill, 2022 was passed in December 2022, with the Punjab Pollution Control Board. The Punjab State Power Corporation Limited reservesintention of encouraging the rightuse of first refusal on the power generated frombiofuels, green hydrogen and other renewable energy certificate based solar power projects and in casesources, as well as promoting the trading of refusal,carbon credits.
The bill includes the developer is permitted to sell the power under open access.
Karnataka
The Karnataka Renewable Energy Development Limited is the agency responsible for promoting and developing renewable energy in the state of Karnataka. The government of Karnataka has formulated the Karnataka Solar Policy 2014-2021, or Karnataka Policy, which will remain in effect until 2021 or until modified by another policy. The Karnataka Policy aims to harness a minimum of 6,000 MW by 2021 in multiple phases. Generation of solar power under the Karnataka Policy is attractive to project developers because the policy provides incentives such as tax concessions under the Karnataka Industrial Policy and central excise duty and customs duty exemptions. Solar projects are further exempt from obtaining consent from the Karnataka Pollution Control Board as required under the pollution control laws.
C. Organizational Structure
The following diagram illustrates our corporate structure as of the date of this annual report.key provisions:
| 1. | Mandating minimum use of non-fossil fuel sources for industries (mining, steel, cement, textile, chemicals and petrochemicals) and commercial buildings. |
| 2. | Enabling government authorities to specify a system for trading carbon credits and for carbon markets. |
| 3. | Enhancing the scope and coverage of the Energy Conservation Building Code |
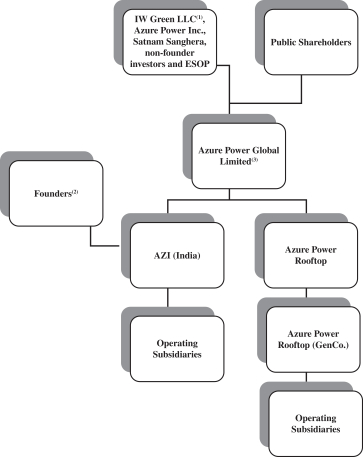
Notes:
(1) | The sole member of IW Green LLC is Mr. Inderpreet S. Wadhwa. |
(2) | Refers to Mr. Inderpreet S. Wadhwa and Mr. Harkanwal Singh Wadhwa. |
(3) | Azure Power Global Limited has an option to purchase the equity shares, in Azure Power India Private Limited, from the Founders. |
The following table sets out our significant subsidiaries on the basis of revenue generated during the fiscal year ended March 31, 2017:
| | | | | | |
Name
| | Country of
Incorporation | | Percentage of
Ownership | |
Azure Power India Private Limited
| | India | | | 96.3% | |
Azure Solar Private Limited (Rajasthan 2.1, 2,2)
| | India | | | 100% | |
Azure Power Infrastructure Private Ltd (Andhra Pradesh 1)
| | India | | | 71.42% | |
D. Property, Plants and Equipment
Our principal executive offices are located at 8, 17, 18, 19 and 20 Local Shopping Complex, Pushp Vihar, Madangir, New Delhi 110062, India, which occupies approximately 20,410 square feet of space. Our power projects are located primarily on land leased from the state governments and third parties and freehold land
purchased by us from private individuals and entities. The following table sets forth the details of our tangible fixed assets associated with our utility scale power projects as of March 31, 2017.
| | | | | | | | | | |
PROJECTS
| | Productive
Capacity
(MW) | | | Ownership(1) | | Location | |
Punjab 1
| | | 2 | | | Leasehold | | | Punjab 1 | |
Gujarat 1
| | | 10 | | | Freehold | | | Gujarat 1 | |
Rajasthan 1
| | | 5 | | | Leasehold | | | Rajasthan 1 | |
Rajasthan 2
| | | 35 | | | Leasehold | | | Rajasthan 2 | |
Punjab 2
| | | 34 | | | Leasehold | | | Punjab 2 | |
Uttar Pradesh 1
| | | 10 | | | Freehold | | | Uttar Pradesh 1 | |
Karnataka 1
| | | 10 | | | Freehold | | | Karnataka 1 | |
Rajasthan 3
| | | 100 | | | Leasehold | | | Rajasthan 3 | |
Chhattisgarh 1
| | | 30 | | | Freehold | | | Chhattisgarh 1 | |
Karnataka 2
| | | 10 | | | Freehold | | | Karnataka 2 | |
Punjab 3
| | | 28 | | | Leasehold | | | Punjab 3 | |
Rajasthan 4
| | | 5 | | | Leasehold | | | Rajasthan 4 | |
Karnataka 3
| | | 130 | | | Freehold | | | Karnataka 3 | |
Andhra Pradesh 1
| | | 50 | | | Freehold | | | Andhra Pradesh 1 | |
Bihar 1
| | | 10 | | | Freehold | | | Bihar 1 | |
Delhi 1
| | | 3 | | | Right to Use | | | Delhi 1 | |
Maharashtra 1
| | | 7 | | | Right to Use | | | Maharashtra 1 | |
Punjab 4
| | | 150 | | | Leasehold | | | Punjab 4 | |
Andhra Pradesh 2
| | | 100 | | | Leasehold | | | Andhra Pradesh 2 | |
Uttar Pradesh 2
| | | 50 | | | Freehold | | | Uttar Pradesh 2 | |
Telangana 1
| | | 100 | | | Freehold | | | Telangana 1 | |
Andhra Pradesh 3
| | | 50 | | | Leasehold | | | Andhra Pradesh 3 | |
Uttar Pradesh 3
| | | 40 | | | Right to Use | | | Uttar Pradesh 3 | |
(1) | Our leasehold land is typically leased for 25 to 35 years, but our PPAs are generally for a term of 25 years. We believe that our facilities are in good condition and generally suitable and adequate for our needs in the foreseeable future. However, we will continue to seek additional space as needed to satisfy our growth. |
ITEM 4A. UNRESOLVED STAFF COMMENTSNone
ITEM 5.II. OPERATING AND FINANCIAL REVIEW AND PROSPECTS
TheYou should read the following discussion of our business, financial condition and results of operations should be read in conjunction with “Item 3. Key Information — A. Selected Consolidated Financial Data” and our consolidated financial statements and the related notes included elsewhere in this annual report. This discussion contains forward-looking statements and involves numerous risks and uncertainties, including, but not limited to, those described in “Item 3. Key Information — D. Risk“Risk Factors” and elsewhere in this annual report. Actual results could differ materially from those contained in any forward-looking statements.
A. Overview
Our mission is
We are committed to be the lowest-cost power producerremain a leader and pioneer in the world.renewable energy market in India. We sell solarrenewable power to our customers in India on long term fixed price contracts, to our customers, at prices which in many cases areat prices at or below prevailing alternatives for our customers. We are also developing micro-grid applications for the highly fragmented and underserved electricity market in India.
We generate revenue from a mix of leading government entities such as NTPC Vidyut Vyapar Nigam Limited, a subsidiary of NTPC Limited, Delhi Metro Rail Corporation, Indian Railways and the Solar Energy
Corporation of India as well as commercial entities such as Torrent Power Limited, DLF Limited, and Oberoi Hotels. We typically enter into 25 year power purchase agreements, or PPAs with these customers who pay a fixed rate for electricity generated by our solar power plants. Our financial strategy is to build our solarrenewable energy assets with the most efficient cost of capital available to us. BecauseSince we have our own engineering, procurement and construction or EPC, as well as operations and maintenance, or O&M capabilities in-house, we retain the profit margins associated with those services that other project developers normally pay to third party providers.value creation at all stages of development and operation. Through value engineering, operational performance monitoring and efficient financial strategy, we are able to deliver cost-effective energy to our customers.
We recognize revenue monthly, from solarrenewable energy sold to our customers on a per kilowatt hour basis based onfor the energy actuallyelectricity supplied by our solarrenewable power plant. The procurement of solar power by the utilities in the market is primarily driven by theplants. We sell renewable energy purchase obligation imposedbased on them by the Indian government. Most Indian state and central government electricity regulators establish the rate that utilities pay to buy powerterms in their respective jurisdictions, which we call the benchmark tariff. As a result, the price a customer pays to buy solar energy from us varies depending on the jurisdiction in which the customer is located. The price at which we sell solar energy also depends on our bidding strategy, as most auctions award bids starting from the lowest bidder until the total capacity is awarded. For our commercial PPAs, we sell solar energy at mutually negotiated rates that are lower than the commercial electricity rates charged by the utilities in the markets we serve, which is consistent with our strategy to price our energy lower than the commercial rates. As a result, the price that a commercial customer pays to buy solar energy from us depends on the state in which such customer is located and the prevailing local commercial tariff.PPAs.
We recognize revenue on a monthly basis from the solar energy kilowatt hours sold to our customers post the installation of the system and approval of the energy grid interconnect connections.
The energy output performance of our plants is dependent in part on the amountquantum of sunlight.solar irradiation at plant locations. As a result, our revenue in the past has beenis impacted by seasonal patterns such as shorter daylight hours in winters.winters as well as daily and annual fluctuation in insolation. Typically, our revenuePLF, from operational solar power plants is lowest in the third quarter and highest in the first quarter of any given fiscal year which(which ends on March 31.31).
A significant portion of the cost of our solar power plants consists of solar photovoltaic panels (or solar modules as they are called generally), inverters and other plant equipment. Other less significant costs include the cost of our solar power plants include land or leasehold land costs, financing costs, and installation costs. Our cost of operations primarily consists of expenses pertaining to operations, maintenance and maintenanceinsurance of our solar power plants. These expenses include payroll and related costs for plant maintenance staff, plant maintenance, insurance and, if applicable, lease costs. The cost of financing is a significant element in the overall cost of development and operations.
Under U.S. GAAP, we depreciate the capital cost of solar power plants over the estimated useful life of 2525-35 years.
We typically fund our projects through a mix of project finance and sponsor equity. We generally raise long term debt financing of approximately 75% of project costs. The remaining 25% of project costs required is met through a mix of cash flow generated from our business and equity proceeds. Our project financing agreements typically restrict the ability of our project subsidiaries to distribute funds to us unless specific financial thresholds are met on specified dates. Some of our project finance borrowings are denominated in U.S. dollars, and thereforewhile we seek to hedge, fluctuations in the U.S. dollar exchange rate, any unhedged foreign currency exchange rate fluctuationsexposure can adversely impact our profitability. SomeWe seek to finance longer term and at fixed rates, but some of our borrowings have variable interest rates and changes in such rates may lead to an adverse effect on our overall cost of capital.
From
We use certain financial and non-financial non-U.S. GAAP measures to provide a comparison of our performance. The non-financial metrics include electricity generation, PLF, MW operating, MW Contracted & Awarded and MW Operating, Contracted & Awarded. We also use certain non-U.S. GAAP financial metrics such as Cost per MW operating, Adjusted EBITDA and Cash Flow to Equity to provide a comparison of our financial results. We use non-financial metrics that are commonly used in the industry to help users compare us with our peers and better demonstrate growth in terms of our current capacity, as well as our future capacity. We understand that non-U.S. GAAP measures helps investors compare our performance period over period and assess how we have improved productivity in reducing the cost of building a plant through cost per megawatt as well as measure the output of the plants through PLFs. The non-financial metrics are used by analysts and investors in arriving at a fair valuation of us by projecting our future revenue as well as predicting our results.
We classify a financial measure as being a non-U.S. GAAP financial measure if that financial measure excludes or includes amounts, or is subject to adjustments that have the effect of excluding or including amounts, that are not included or excluded in the most directly comparable measure calculated and presented in accordance with U.S. GAAP as in effect from time to time in the United States in our statements of operations, balance sheets or statements of cash flows. The non-U.S. GAAP financial measures are supplemental measures that are not required by, or are not presented in accordance with, U.S. GAAP. Non-U.S. GAAP financial measures do not include operating, other statistical measures or ratios calculated using exclusively financial measures calculated in accordance with U.S. GAAP. Moreover, the way we have raised funds through issuancecalculate the non-U.S. GAAP financial measures may differ from that of compulsorily convertible debentures and Series A through I compulsorily convertible preferred shares. We classified our previously outstanding compulsorily convertible debentures and Series E and Series G compulsorily convertible preferred sharesother companies reporting measures with similar names, which may limit these measures’ usefulness as a liabilitycomparative measure.
Certain Factors affecting our Results
Cashflow and Liquidity Position:
Our expansion plans, if consummated, may require additional financing. We expect to incur substantial capital expenditure as well as operating and financial expenses, and, if so, our cash reserves and cash flow from operations may be insufficient to meet our planned obligations. Further, our cash flow may also be adversely impacted by any liabilities which may arise as a result of the review of certain material projects and contracts over a three-year period for anti-corruption and related compliance issues by the Special Committee and our Audit and Risk Committee and our ongoing reporting of these issues to the SEC and the Department of Justice. For more information, see “— We have conducted investigations into whistle-blower claims and other allegations against persons who served as our directors, officers and employees. We reported the allegations and our findings to the SEC and the U.S. Department of Justice and continue to cooperate with these authorities.”
Our ability to obtain additional financing on favorable terms, if at all, will depend on several factors, including our future results of operations, financial condition and cash flows, the amount and terms of existing indebtedness, general market conditions and market conditions for financing activities and the economic, political and other conditions in the markets where we operate. Our ability to raise financing on acceptable terms also depends on our credit ratings and may also be affected by the failure to deliver audited consolidated balance sheet. Series Afinancial statements and the financial statements of subsidiaries and restricted borrowing groups in accordance with financing documents. We can make no assurances that we will be able to D, Series F, Series Hraise additional financing on acceptable terms in a timely manner or at all. Failure to obtain additional financing on acceptable terms and Series I compulsorily convertible preferred shares were classified as temporary equityin a timely manner could adversely affect our business, results of operations, financial condition and cash flows. See “Risk Factors – Our cash reserves and cash flows may be insufficient to meet our working capital requirements and expansion plans absent further financing. Accordingly, our failure to obtain additional financing on acceptable terms and in a timely manner could materially and adversely affect our financial condition.” In addition, our ability to obtain additional financing may be dependent on the consolidated balance sheet tillcompliance review of our lenders and creditors in light of the review of certain material projects and contracts over a three-year period for anti-corruption and related compliance issues by the Special Committee and our Audit and Risk Committee and our ongoing reporting of these issues to the SEC and the Department of Justice and to Indian regulatory authorities. For more information, see “— We have conducted investigations into whistle-blower claims and other allegations against persons who served as our directors, officers and employees. We reported the allegations and our findings to the SEC and the U.S. Department of Justice and continue to cooperate with these authorities.”
Defaults under our Loan Agreements:
Timely submission of financial statements of the Group, our subsidiaries and/or our subsidiary restricted groups is a key covenant in most of our financing agreements. Due to our inability to meet these covenants to date in respect of Fiscal 2023 (and interim periods therein), we secured extensions from our lenders in respect of these covenants until December 31, 2023. We have further secured time extensions until March 31, 2016. Concurrent2024/April 30, 2024, for the Group and until April 30, 2024 for the subsidiaries to submit its financial statements for Fiscal 2023.
In addition, due to our inability to meet these information covenants to date, some of our lenders have started charging us penalty interest rates. In addition, in some of our borrowing facilities, the lenders have also revised the rates of interest upward due to delay in Fiscal 2022 and Fiscal 2023 audited financial statements and our downgrade in credit ratings. These penal rates of interest and higher rates of interest have increased our finance costs for the projects to which these loans relate. While the penal interest may cease to be charged upon finalization and submission of the delayed financial statements, the rates of interest which have been revised upwards may not revert to previous levels, and, therefore, may result in continued higher cost of funds for our debt borrowings for these projects.
In addition, any fines, penalties, ongoing obligations or other measures or relief imposed against us by regulatory authorities (including by the SEC, the U.S. Department of Justice and applicable Indian regulatory authorities) in connection with whistle-blower claims and Special Committee investigations could adversely impact our ability to maintain compliance with the covenants under our credit facilities or result in an event of default thereunder. For more information, see “— We have conducted investigations into whistle-blower claims and other allegations against persons who served as our directors, officers and employees. We reported the allegations and our findings to the closingSEC and the U.S. Department of our initial public offeringJustice and continue to cooperate with these authorities.”
Green Bond Consent Solicitation:
We issued U.S. dollar denominated 3.575% Solar Green Bonds in October 2016,August 2021 and 5.65% Solar Green Bonds in September, 2019 (together the compulsorily convertible debentures“Green Bonds”), listed on the Singapore Exchange Limited. On December 14, 2023, Azure Power Solar Energy Private Limited (“APSEPL”) and compulsorily convertible preferred sharesAzure Power Energy Ltd (“APEL”) completed a consent solicitation (the “Consent Solicitation”) in respect of the 5.65% Senior Notes due 2024 issued by APSEPL (the “2024 Notes”) and the 3.575% Senior Notes due 2026 (the “2026 Notes”). APSEPL and APEL sought the consent of the Noteholders of each of the 2024 Notes and 2026 Notes to amend certain terms of (A) the indenture dated as of September 24, 2019 (the “2024 Indenture”) and (B) the indenture dated as of August 19, 2021 (the “2026 Indenture” and together with the 2024 Indenture, the “Indentures”). The purpose of the consent solicitation was to: (i) undertake to make tender offers (a) to purchase an outstanding principal amount of U.S.$40,000,000 of the 2024 Notes by March 25, 2024, (b) to purchase an outstanding principal amount of U.S.$12,000,000 of the 2026 Notes by March 25, 2024 and an outstanding principal amount of U.S.$8,000,000 of the 2026 Notes by August 26, 2024; (ii) make certain amendments and provide certain confirmations with respect to the reporting covenant of each of the Indentures; and (iii) make certain amendments to the restricted payments and limitations on amendments of onshore debt covenants in the 2024 Indenture to allow for the implementation of a cash-neutral intercompany transaction (the “proposed amendments”).
The consent solicitation was announced on November 28, 2023. The deadline to submit consent instructions expired at 5:00 pm New York time on December 7, 2023. Over 99% consent instructions were converted into equity shares.
received in relation to both the 2024 Notes and the 2026 Notes. On December 8, 2023, each of APSEPL and APEL executed a supplemental indenture with Azure Power Purchase AgreementGlobal Limited (as Parent), the trustee and the collateral agents to implement the proposed amendments. On December 14, 2023, the consent fee was paid and the proposed amendments became operative.
The material
Pursuant to the terms of the PPAsamended Indentures, APSEPL and APEL launched tender offers for the 2024 Notes and the 2026 Notes on February 16, 2024. The early deadline of the tender offers was on March 1, 2024 and APSEPL and APEL purchased US$40,000,000 of the 2024 Notes and US$14,477,000 of the 2026 Notes respectively on March 11, 2024.
Credit Rating Downgrades:
Most of our external borrowings are required to be rated by accredited credit rating agencies. In Fiscal 2023 and Fiscal 2024, the rating agencies Fitch Ratings, Moody’s Investor Service, CRISIL and Care Ratings have each downgraded or announced a review of credit ratings with negative implications of the credit ratings of one or more of our subsidiaries. Downgrades in our credit ratings and other factors have led to interest rate increases in respect of some of our certain of our borrowings which has increased our financing costs and other similar interest rate increases are possible.
Our rated borrowing as set forth in the table below, remain on negative credit outlook by each of the respective credit rating agencies during the period, other than Fitch which removed the Rating Watch Negative.
The table below sets forth our ratings and downgrades in Fiscal 2023 and Fiscal 2024 with respect to various borrowings.
| Borrower or Borrower Group | Borrowing | Rating Agency | Downgrade Action |
| Azure Power India Private Limited | Long term & Short term | CRISIL | On December 23, 2022, long term downgraded to A+ (from AA-) and short term downgraded to A1 (from A1+) |
| Azure Power India Private Limited | Long term & Short term | CARE | On May 29, 2023 long term downgraded to A (from A+) |
| On July 11, 2023, long term downgraded to BBB+ (from A) and short term downgraded to A2 (from A1). |
| On December 27, 2022, long-term to A+ (from AA-) |
| Azure Power Maple Private Limited | Long Term | CRISIL | On May 15, 2023, long-term downgraded to A (from A+) and short term downgraded to A1 (from A1+) |
| On July 15, 2023, long-term downgraded to BBB+ (from A) and short term downgraded to A2 (from A1). |
| On December 23, 2022, long term downgraded to A (from A+) |
| Azure Power Forty Three Private Limited | Long Term | CRISIL | On May 29, 2023 long term downgraded to A- (from A) |
| On July 11, 2023, long term downgraded to BBB+ (from A-) |
| On December 23, 2022, long term downgraded to A+ (from AA-) |
| Azure Power Forty Private Limited | Long Term | CRISIL | On May 29, 2023 long term downgraded to A (from A+) |
| On July 11, 2023, long term downgraded to BBB+ (from A) |
| On December 23, 2022, long term downgraded to A (from A+) |
| Azure Power Forty Private Limited | Long Term | CARE | On May 29, 2023 long term downgraded to A- (from A) |
| On July 11, 2023, long term downgraded to BBB+ (from A-) |
| On Feb 13, 2023 long term downgraded to A- (from A) |
| Azure Solar Private Limited | Long Term | CARE | On July 18, 2023, long term downgraded to BBB (from A-) |
| On July 18, 2022, long term downgraded to A (from AA-) |
| Azure Power (Rajasthan) Private Limited | Long Term | CARE | On July 18, 2022, long term downgraded to A (from AA-) |
| Azure Power Jupiter Private Limited | Long Term | CARE | On July 18, 2022, long term downgraded to A (from AA-) |
| Restricted Group – II | Long Term | Fitch | On January 16, 2023, long term downgraded to BB- (from BB) |
| On June 26, 2023, long term downgraded to B (from BB-) |
| Restricted Group – II | Long Term | Moody’s | On January 16, 2023, long term downgraded to Ba2 (from Ba1) |
| On May 29, 2023, long term downgraded to Ba3 (from Ba2) |
| On July 14, 2023, long term downgraded to B1 (from Ba3) and withdrawn |
| Restricted Group – III | Long Term | Fitch | On January 16, 2023, long term downgraded to BB (from BB+) |
| Restricted Group – III | Long Term | Moody’s | On June 26, 2023, long term downgraded to B (from BB) |
| On January 16, 2023, long term downgraded to Ba3 (from Ba2) |
| On May 29, 2023, long term downgraded to B1 (from Ba3) |
| On July 14, 2023, long term downgraded to B2 (from B1) and withdrawn |
See “Risk Factors - Any downgrade of our credit rating may result in increase in interest cost or may trigger covenant defaults under our loan agreements.”
General and administrative expenses (excluding Stock Appreciation Right (SAR) expenses):
The consolidated general and administrative expenses (excluding SAR expenses) in Fiscal 2023 were higher than our consolidated general and administrative expenses (excluding SAR expenses) in Fiscal 2022 primarily due to higher legal and accounting costs related to whistle-blower and other investigations and legal costs related to defending various litigation matters.
Rooftop Portfolio and Radiance:
In April 2021, we have entered into and bids we have won asan agreement with Radiance to sell certain subsidiaries (the “Rooftop Subsidiaries”) with an operating capacity of 153 MW (the “Rooftop Portfolio”) for INR 5,350 million, subject to certain purchase price adjustments (the “Rooftop Sale Agreement”). Pursuant to the Rooftop Sale Agreement, Radiance was to acquire 100% of the equity ownership of the Rooftop Subsidiaries owned by the Group. We had recognized an impairment loss in relation to the Rooftop Subsidiaries aggregating to INR 3,255 million during the year ended March 31, 2017 are summarized2021.
As on current date, we received aggregate sale proceeds of INR 1,412 million (excluding working capital support reimbursed by Radiance), and we transferred 66.5 MWs out of the total portfolio of 153 MWs. Out of this 66.5 MW, 33.2 MWs were from RG-II entities, for which we transferred a 48.6% shareholding to Radiance pursuant to the terms of the Green Bond Indentures, and the remaining 51.4% will be transferred to Radiance only after refinancing of the RG-II bonds. In August 2021, post refinancing of 5.5% Senior Notes and repayment of loan relating to one rooftop project of 10 MW, the restriction on transfer of shareholding was released. For another 16 MWs, which is the Delhi Jal Board rooftop project, a 49% shareholding was transferred to Radiance and the remaining 51% will be transferred in 2024 after compliance with equity lock-in conditions under the applicable PPA. The transfer of ownership of these portfolios is not anticipated to occur within 12 months due to these restrictions.
Further, during the current year in June 2022, we transferred 100% shareholding in relation to 2.5 MW operating capacity.
We and Radiance have mutually agreed to terminate the transfer in shareholding of the remaining un-transferred 86.5 MW portfolio to Radiance, and accordingly, the Purchaser will not purchase from the Sellers and the Sellers will not sell to the Purchaser the AZR Sale Shares (including any Seller Group Loans) as was agreed in the following table.Previous MSPA and further amended under the Amended MSPA. The remaining un-transferred portfolio is being managed by Group.
| | | | | | | | | | | | | | |
| Operational |
| Project Names | | Commercial
Operation
Date(1) | | Capacity (MW)(10) | | | Tariff
(INR/kWh) | | | Offtaker | | Duration
of PPA in
Years |
Punjab 1 | | Q4 2009 | | | 2 | | | | 17.91 | | | NTPC Vidyut Vyapar Nigam | | 25 |
Punjab 2.1 | | Q3 2014 | | | 15 | | | | 7.67 | | | Punjab State Power Corporation Limited | | 25 |
Punjab 2.2 | | Q4 2014 | | | 15 | | | | 7.97 | | | Punjab State Power Corporation Limited | | 25 |
Punjab 2.3 | | Q4 2014 | | | 4 | | | | 8.28 | | | Punjab State Power Corporation Limited | | 25 |
Punjab 3.1 | | Q1 2016 | | | 24 | | | | 7.19 | | | Punjab State Power Corporation Limited | | 25 |
Punjab 3.2 | | Q1 2016 | | | 4 | | | | 7.33 | | | Punjab State Power Corporation Limited | | 25 |
Punjab 4.1(5) | | Q4 2016 | | | 50 | | | | 5.62 | | | Punjab State Power Corporation Limited | | 25 |
Punjab 4.2(5) | | Q4 2016 | | | 50 | | | | 5.63 | | | Punjab State Power Corporation Limited | | 25 |
Punjab 4.3(5) | | Q4 2016 | | | 50 | | | | 5.64 | | | Punjab State Power Corporation Limited | | 25 |
Gujarat 1.1 | | Q2 2011 | | | 5 | | | | 15.00 | (2) | | Gujarat Urja Vikas Nigam Limited | | 25 |
Gujarat 1.2 | | Q4 2011 | | | 5 | | | | 15.00 | (2) | | Gujarat Urja Vikas Nigam Limited | | 25 |
Rajasthan 1 | | Q4 2011 | | | 5 | | | | 11.94 | | | NTPC Vidyut Vyapar Nigam Limited | | 25 |
Rajasthan 2.1 | | Q1 2013 | | | 20 | | | | 8.21 | | | NTPC Vidyut Vyapar Nigam Limited | | 25 |
Rajasthan 2.2 | | Q1 2013 | | | 15 | | | | 8.21 | | | NTPC Vidyut Vyapar Nigam Limited | | 25 |
Rajasthan 3.1 | | Q2 2015 | | | 20 | | | | 5.45 | (3) | | Solar Energy Corporation of India | | 25 |
Rajasthan 3.2 | | Q2 2015 | | | 40 | | | | 5.45 | (3) | | Solar Energy Corporation of India | | 25 |
Rajasthan 3.3 | | Q2 2015 | | | 40 | | | | 5.45 | (3) | | Solar Energy Corporation of India | | 25 |
Rajasthan 4 | | Q4 2015 | | | 5 | | | | 5.45 | (3) | | Solar Energy Corporation of India | | 25 |
Chhattisgarh 1.1 | | Q2 2015 | | | 10 | | | | 6.44 | | | Chhattisgarh State Power Distribution Company Limited | | 25 |
Chhattisgarh 1.2 | | Q2 2015 | | | 10 | | | | 6.45 | | | Chhattisgarh State Power Distribution Company Limited | | 25 |
Chhattisgarh 1.3 | | Q3 2015 | | | 10 | | | | 6.46 | | | Chhattisgarh State Power Distribution Company Limited | | 25 |
Delhi 1.1 | | Q4 2015 | | | 1 | | | | 5.43 | (3) | | Solar Energy Corporation of India | | 25 |
Andhra Pradesh 1(4) | | Q1 2016 | | | 50 | | | | 5.89 | (2) | | Southern Power Distribution Company of Andhra Pradesh Limited | | 25 |
Uttar Pradesh 1 | | Q1 2015 | | | 10 | | | | 8.99 | | | Uttar Pradesh Power Corporation Limited | | 12 |
Bihar | | Q3 2016 | | | 10 | | | | 8.39 | | | North Bihar Power Distribution Company Limited and South Bihar Power Distribution Company Limited | | 25 |
Karnataka 1 | | Q1 2015 | | | 10 | | | | 7.47 | | | Bangalore Electricity Supply Company Limited | | 25 |
Karnataka 2 | | Q1 2016 | | | 10 | | | | 6.66 | | | Bangalore Electricity Supply Company Limited | | 25 |
Karnataka 3.1 | | Q1 2017 | | | 50 | | | | 6.51 | | | Chamundeshwari Electricity Supply Corporation Limited | | 25 |
Karnataka 3.2 | | Q1 2017 | | | 40 | | | | 6.51 | | | Hubli Electricity Supply Company Limited | | 25 |
Karnataka 3.3 | | Q1 2017 | | | 40 | | | | 6.51 | | | Gulbarga Electricity Supply Company Limited | | 25 |
Maharashtra 1.1 | | Q1 2017 | | | 2 | | | | 5.50 | (3) | | Ordinance Factory Bhandara | | 25 |
Maharashtra 1.2 | | Q1 2017 | | | 5 | | | | 5.31 | | | Ordinance Factory Ambajhari | | 25 |
| | | | | | | | | | | | | | |
Total Capacity | | | | | 627 | | | | | | | | | |
| | | | | | | | | | | | | | |
| | | | | | | | | | | | | | |
| Project Names | | Commercial
Operation
Date(1) | | Capacity (MW)(10) | | | Tariff (INR/kWh) | | | Offtaker | | Duration
of PPA in
Years |
| Under Construction |
Delhi 1.2 | | Q2 2017 | | | 2 | | | | 5.43 | (3) | | Solar Energy Corporation of India | | 25 |
Andhra Pradesh 2 | | Q2 2017 | | | 100 | | | | 5.12 | | | NTPC Limited | | 25 |
Andhra Pradesh 3 | | Q4 2017 | | | 50 | | | | 4.43 | (3) | | Solar Energy Corporation of India | | 25 |
Uttar Pradesh 2(5) | | Q2 2017 | | | 50 | | | | 4.78 | | | NTPC Limited | | 25 |
Uttar Pradesh 3 | | Q4 2017 | | | 40 | | | | 4.43 | (3) | | Solar Energy Corporation of India | | 25 |
Telangana 1 | | Q3 2017 | | | 100 | | | | 4.67 | | | NTPC Limited | | 25 |
| | | | | | | | | | | | | | |
Total Capacity | | | | | 342 | | | | | | | | | |
| | | | | | | | | | | | | | |
| | | | | | | | | | |
Commercial and Industrial(8) |
| Project Names | | Commercial
Operation
Date(1) | | Capacity (MW)(10) | | | Offtaker | | Duration
of PPA in
Years |
| Commissioned |
Gujarat Rooftop | | 2013 | | | 2.5 | | | Torrent Power Limited | | 25 |
DLF (total) | | 2013-2016 | | | 1.898 | | | DLF Limited | | 25 |
Uttar Pradesh Rooftop 1 | | Q1 2015 | | | 0.555 | | | Indosolar Limited | | 25 |
Delhi Rooftop 1 | | Q2 2015 | | | 0.056 | | | Delhi Gymkhana Club Limited | | 25 |
Delhi Rooftop 2 | | Q2 2015 | | | 0.178 | | | Taj Sats Air Catering Limited | | 20 |
Punjab Rooftop 1 | | Q3 2015 | | | 1 | | | JCBL Limited | | 25 |
Delhi Rooftop 3 | | Q2 2016 | | | 0.918 | (7) | | Indraprastha Power Generation Co. Limited | | 25 |
Punjab Rooftop 2 | | Q2 2016 | | | 10 | | | Punjab State Power Corporation Limited | | 25 |
Oberoi (total) | | Q3 2016 | | | 0.839 | | | Oberoi Resorts/EIH Limited | | 15 |
Delhi Rooftop 4 | | Q1 2017 | | | 6.005 | (7) | | Delhi Metro Rail Corporation | | 25 |
| | | | | | | | | | |
Total Capacity | | | | | 23.946 | | | | | |
| | | | | | | | | | |
| Project Names | | Commercial
Operation
Date(1) | | Capacity (MW)(11) | | | Offtaker | | Duration
of PPA in
Years |
| Under Construction |
Odisha Rooftop 1 | | Q2 2017 | | | 4 | (7) | | Green Energy Development Corporation of Odisha Limited | | 25 |
Delhi Rooftop 4 | | Q3 2017 | | | 7.996 | (8) | | Delhi Metro Rail Corporation | | 25 |
| | | | | | | | | | |
Total Capacity | | | | | 11.996 | | | | | |
| Committed |
Tamil Nadu Rooftop 1 | | | | | 1.200 | | | Pennar Industries Limited | | 25 |
Oberoi 2 | | Q4 2017 | | | 0.764 | | | Oberoi Resorts/EIH Limited | | 15 |
Punjab Rooftop 3 | | Q1 2018 | | | 0.476 | | | Desh Bhagat University | | 25 |
Delhi Rooftop 5 | | Q2 2018 | | | 16 | (7) | | Delhi Jal Board | | 25 |
Indian Railways Rooftop(6) | | Q4 2017 | | | 46 | (9) | | Indian Railways | | 25 |
| | | | | | | | | | |
Total Capacity | | | | | 64.44 | | | | | |
| | | | | | | | | | |
Total Capacity (all projects) | | | | | 1,069 | | | | | |
Notes:
(1) | Refers to the applicable quarter of the calendar year. There can be no assurance that our projects under construction and our committed projects will be completed on time or at all. |
(2) | Current tariff, subject to change — see paragraph below — “tariff structure”. |
(3) | Projects are supported by VGF in addition to the tariff — see paragraph below — “VGF for projects”. |
(4) | Hanwha Q CELLS Korea holds a non-controlling interest against its investment of INR 216.9 million. |
(5) | Hanwha Energy Corporation Singapore Pte. Ltd. holds a non-controlling interest. |
(6) | Out of 46 MW awarded; PPAs signed for 23MW. |
(7) | Projects are supported by subsidy in addition to the tariff. |
(8) | The levellized tariff for the Commercial and Industrial projects is between INR 5.80 to INR 10.62. |
(9) | Projects are supported by capital incentive in addition to tariff. |
(10) | Capacity as defined by the PPA contract. |
Our PPAs typically require certain conditions are met including, among others, that we have obtained all necessary consents and permits, financing arrangements have been made and an agreement has been entered into to provide for the transmission of power. Furthermore, the PPAs contain customary termination provisions and negative and affirmative covenants, including the provision of performance bank guarantees and minimum guarantees of power to be sold and restrictions on changing the controlling shareholder of the project subsidiaries.
Tariff structure
The tariff for Gujrat 1.1 and Gujrat 1.2 is INR 15.0 per kilowatt hour for the first 12 years and INR 5.0 per kilowatt hour for remainder of the contract term. The tariff for Andhra Pradesh 1 is INR 5.89 per kilowatt hour for one year, increasing by 3% each year from the second year to the tenth year and thereafter with the same tariff as that in year ten for the remainder of the 25-year term.
VGF for projects
The VGF for Rajasthan 3.1 project is INR 23.0 million per MW, for Rajasthan 3.2 it is INR 22,0 million per MW, for Rajasthan 3.3 it is INR 13.0 million per MW and Rajasthan 4 it is INR 12.9 million per MW. The VGF for Andhra Pradesh 3 project is INR 7.5 million per MW. The VGF for Maharashtra 1 project is INR 0.9 million per MW. The VGF for Uttar Pradesh 3 is INR 10.0 million per MW. The VGF for Delhi 1 is INR 4.6 million per MW.
Key Operating and Financial Metrics
We regularly review a number of specific metrics, including the following key operating and financial metrics, to evaluate our business performance, identify trends affecting our business and make strategic decisions.
| | | | | | | | | | |
Key metrics | | Unit of Measurement | | FY 2016 | | | FY 2017 | |
Electricity generation(1) | | kWh in millions | | | 364.8 | | | | 617.5 | |
Plant load factor | | % | | | 18.1 | | | | 18.4 | |
Revenue(2) | | INR in millions | | | 2,626.1 | | | | 4,183.0 | |
Cost per MW operating | | INR in millions | | | 59.6 | | | | 49.3 | |
MW operating | | MW | | | 336.0 | | | | 651.0 | |
MW committed | | MW | | | 479.0 | | | | 418.0 | |
MW operating and committed | | MW | | | 815.0 | | | | 1,069.0 | |
(1) | Electricity generation represents the actual amount of power generated by our solar power plants over the reporting period and is the product of plant load factor during the reporting period and the average megawatts operating. |
(2) | Revenue consists of revenue from the sale of power. |
Factors that most significantly directly or indirectly affect our overall growth and results of operations, or that cause our historical financial information not to be indicative of future operating results or financial condition, include, but are not limited to, the Indian government’s targets for solar capacity addition and the more gradual decline in solar module prices. The Indian government recently increased its target for solar capacity from 20GW by 2022 to 100GW by 2022. While this trend may lead to us winning more megawatts per year than in prior years, it will also require us to raise additional funding sources if we are to grow in line with these trends.
As for the cost of our system components, we witnessed a steep decline of solar module prices of approximately 82% from 2010 to 2017. Although the pace of this decline has been slowing recently, we expect a general trend of declining solar module prices to continue through fiscal year 2018.
Operating Metrics
Megawatts Operating and Megawatts CommittedContracted & Awarded
We measure the rated capacity of our plants in megawatts. Rated capacity is the expected maximum output that a solar power plant can produce without exceeding its design limits. We believe that tracking the growth in aggregate megawatt rated capacity is a measure of the growth rate of our business.
Megawatts Operating represents the aggregate cumulative megawatt rated capacity of solar power plants that are commissioned and operational as of the reporting date.
Megawatts CommittedContracted & Awarded represents the aggregate megawatt rated capacity of solarrenewable power plants pursuant to customerwhich include (i) PPAs signed orwith customers, and (ii) capacity won and allotted in auctions and where LoAs have been received, but does not include the commissioned and operational capacity as of the reporting date.
The following table represents the megawatts operatingOperating and megawatts committedContracted & Awarded, which together are also called our total Portfolio, as of the end of the respective periods presented:
| | | As of March 31, | |
| | | 2021* | | | 2022**# | | | 2023**#^ | |
| Megawatts Operating | | | 1,990 | | | | 2,752 | | | | 3,041 | |
| Megawatts Contracted & Awarded | | | 4,965 | | | | 4,759 | | | | 1,237 | ## |
| Megawatts Operating, Contracted & Awarded | | | 6,955 | | | | 7,511 | | | | 4,278 | ## |
| * | In Fiscal Year 2021, we identified certain subsidiaries to sell off on a going concern basis, which currently form part of our Rooftop business. Out of this identified portfolio, during the current year in April 2021, we executed a contract with Radiance to sell certain subsidiaries having an operating capacity of 153 MW. Hence, we have not considered this rooftop portfolio capacity for reporting under total portfolio as at year end. |
| ** | Out of the identified rooftop portfolio of 153 MW, we already transferred 17.3 MW to Radiance, 33.2 MW will be transferred to Radiance after refinancing of the RG-II bonds and 16 MW will be transferred to Radiance post March 31, 2024. Hence, we have not considered these rooftop portfolios of 66.5 MW for reporting under its total portfolio as at year end. We and Radiance have mutually agreed to terminate the transfer in shareholding of the remaining un-transferred 86.5 MW portfolio to Radiance. Hence, portfolio of 86.5 MW have been considered for reporting under total portfolio as at year end. |
| | | | | | | | |
| | | As of March 31, | |
| | | 2016 | | | 2017 | |
Megawatts Operating | | | 336.0 | | | | 651.0 | |
Megawatts Committed | | | 479.0 | | | | 418.0 | |
| | | | | | | | |
Megawatts Operating and Committed | | | 815.0 | | | | 1,069.0 | |
| | | | | | | | |
| # | Adjusted for inconsistencies in MWs reported as identified by the Group through its review of 2022 whistle-blower allegations. See “Whistle-blower Allegations and Special Committee Investigation” section for details. |
| ## | Adjusted as we will not continue with construction of 3,033 MWs manufacturing linked projects. See “Business, Company & Industry Overview, A. Business Overview, Project Pipeline” on page 4. |
| ^ | Excluding 200 MW wind–solar hybrid project earlier won by the Group with Maharashtra State Electricity Distribution Co. Limited. This project was cancelled on March 10, 2023, pursuant to withdrawal of the Group’s appeal before the Appellate Tribunal for Electricity. Appeal was filed to challenge Maharashtra Electricity Regulatory Commission’s order, that rejected the adoption of the auction discovered tariff of INR 2.62 per unit and instead gave the Group an option to reduce the tariff to INR 2.49 per unit. |
We are targeting having 1,000
As of March 31, 2023, we had operating capacity of 3,041 MW, and we do not expect commissioning of any further projects during Fiscal Year 2023-24. Therefore, we expect to 1,200have megawatts operating of 3,041 MW operating by March 31, 2018. Our ability to achieve these goals will depend on, among other things, our ability to acquire the required land for the new capacity (on lease or direct purchase), raising adequate project financing and working capital, the growth of the Indian power market in line with current government targets, our ability to maintain our market share of India’s installed capacity as competition increases, the need to further strengthen our operations team to execute the increased capacity, and the need to further strengthen our systems and processes to manage the ensuing growth opportunities, as well as the other risks and challenges discussed under the caption “Item 3. Key Information — D. Risk Factors.”2024.
Plant Load Factor
The plant
Plant load factor, or PLF, is the ratio of the actual output of all our solar power plants, including rooftop portfolio, over the reporting period to their potential output if it were possible for them to operate indefinitely at full rated capacity. The plant load factorPLF is not the same as the availability factor. Our solar power plants have high availability, that is, when the sun is shining our plants are almost always able to produce electricity. The variability in our plant load factorPLF is a result of seasonality, cloud covers, the dailyweather, air pollution, rotation of the earth, equipment efficiency losses, breakdown of our transmission system and grid availability.unavailability. We compute PLF on the basis of PPA capacity in AC or alternate current, which is generally lower than the actual installed capacity in DC, or direct current.
We track plant load factorPLF as a measure of the performance of our power plants. It indicates effective utilization of resources and also validates our value engineering and operationoperations research. Higher plant load factorPLF at a plant indicates increased electricity generation. Monitoring plant load factorPLF on real time allows us to respond rapidly to potential generation anomalies. Generally, under the terms of our PPAs, we guarantee a plant load factor of 12%. Plant load factorPLF in AC was 18.4%21.6% for fiscal year 2017Fiscal Year 2023 compared with 18.1%21.6% for fiscal year 2016, primarily due to improved solar radiation and O&M techniques.FY 2022.
| | | | | | | | |
| | | Fiscal Year Ended
March 31, | |
| | | 2016 | | | 2017 | |
Plant Load Factor (%) | | | 18.1 | | | | 18.4 | |
| | | Fiscal Year Ended March 31, | |
| | | 2021 | | | 2022 | | | 2023 | |
| Plant Load Factor (AC) (%) | | | 20.9 | | | | 21.6 | | | | 21.6 | |
Electricity Generation
Electricity generation represents the actual amount of power generated by our solar power plants including rooftop portfolio over the reporting period and is the product of reporting period plant load factor and the average megawatts operating.period. This is a measure of the periodic performance of our solar power plants.
| | | Fiscal Year Ended March 31, | |
| | | 2021 | | | 2022 | | | 2023 | |
| Electricity Generation (kWh in millions) | | | 3,495 | | | | 4,551 | | | | 5,854 | |
Summary of Operating Metrics
| Key metrics | | Unit of Measurement | | Fiscal 2021 | | | Fiscal 2022 | | | Fiscal 2023 | |
| Electricity generation | | kWh in millions | | | 3,495 | | | | 4,551 | | | | 5,854 | |
| Plant load factor | | % | | | 20.9 | | | | 21.6 | | | | 21.6 | |
| MW Operating | | MW | | | 1,990 | | | | 2,752 | | | | 3,041 | |
| MW Contracted & Awarded | | MW | | | 4,965 | | | | 4,759 | | | | 1,237 | # |
| MW Operating, Contracted & Awarded | | MW | | | 6,955 | | | | 7,511 | | | | 4,278 | #^ |
| # | Adjusted as we will not continue with construction of 3,033 MWs manufacturing linked projects. See “Business, Company & Industry Overview, A. Business Overview, Project Pipeline” on page 4. |
| | | | | | | | |
| | | Fiscal Year Ended
March 31, | |
| | | 2016 | | | 2017 | |
Electricity Generation (kilowatt hours in millions) | | | 365 | | | | 618 | |
| ^ | Excluding 200 MW wind–solar hybrid project earlier won by the Group with Maharashtra State Electricity Distribution Co. Limited. This project was cancelled on March 10, 2023, pursuant to withdrawal of the Group’s appeal before the Appellate Tribunal for Electricity. Appeal was filed to challenge Maharashtra Electricity Regulatory Commission’s order, that rejected the adoption of the auction discovered tariff of INR 2.62 per unit and instead gave the Group an option to reduce the tariff to INR 2.49 per unit. |
Key Financial Metrics
Adjusted EBITDA
Adjusted EBITDA is not a non-GAAPU.S. GAAP financial measure. We present Adjusted EBITDA as a supplemental measure of our performance. This measurement is not recognized in accordance with U.S. GAAP and should not be viewed as an alternative to U.S. GAAP measures of performance. The presentation of Adjusted EBITDA should not be construed as an inference that our future results will be unaffected by unusual or non-recurring items.
We define Adjusted EBITDA as net lossloss/(income) plus (a) income tax expense,expense/(benefit), (b) interest expense, net, (c) depreciation and amortization and (d) loss (income)loss/(gain) on foreign currency exchange.exchange (net), (e) other expense/(income) and (f) Impairment loss. We believe Adjusted EBITDA is useful to investors in evaluatingassessing our operating performance because:
securities analysts and other interested parties use such calculations as a measure ofongoing financial performance and
debt service capabilities;provides improved comparability between periods through the exclusion of certain items that management believes are not indicative of our operational profitability and
that may obscure underlying business results and trends.
itAdjusted EBITDA is also used by our management for internal reportingsecurities analysts, lenders and planning purposes, including aspectsothers in their evaluation of our consolidated operating budgetdifferent companies because it excludes certain items that can vary widely across different industries or among companies within the same industry. For example, interest expense can be highly dependent on a company’s capital structure, debt levels and capital expenditures.credit ratings. Therefore, the impact of interest expense on earnings can vary significantly among companies. In addition, the tax positions of companies can vary because of their differing abilities to take advantage of tax benefits and because of the tax policies of the various jurisdictions in which they operate. As a result, effective tax rates and tax expense can vary considerably among companies.
Adjusted EBITDA has limitations as an analytical tool, and youone should not consider it in isolation or as a substitute for analysis of our results as reported under U.S. GAAP. Some of these limitations include:
| ● | it does not reflect cash expenditures or future requirements for capital expenditures or contractual commitments or foreign exchange gain/loss; |
it does not reflect our cash expenditures or future requirements for capital expenditures or contractual commitments or foreign exchange gain/loss;
| ● | it does not reflect changes in, or cash requirements for, working capital; |
| ● | it does not reflect significant interest expense or the cash requirements necessary to service interest or principal payments on our outstanding debt; |
| ● | it does not reflect payments made or future requirements for income taxes; and |
| ● | although depreciation, amortization and impairment are non-cash charges, the assets being depreciated and amortized will often have to be replaced or paid in the future and Adjusted EBITDA does not reflect cash requirements for such replacements or payments. |
it does not reflect significant interest expense or the cash requirements necessary to service interest or principal payments on our outstanding debt; it does not reflect payments made or future requirements for income taxes; and
although depreciation and amortization are non-cash charges, the assets being depreciated and amortized will often have to be replaced or paid in the future and Adjusted EBITDA does not reflect cash requirements for such replacements or payments.
Investors are encouraged to evaluate each adjustment and the reasons we consider it appropriate for supplemental analysis.
The following table presents a reconciliation of net loss(loss)/profit to Adjusted EBITDA:
| | | Fiscal Year Ended March 31, | |
| | | 2021 | | | 2022 | | | 2023 | |
| | | INR | | | INR | | | INR | | | US$ | |
| | | (in millions) | |
| Net profit/ (loss) | | | (4,201 | ) | | | (2,126 | ) | | | (2,322 | ) | | | (28.3 | ) |
| Income tax expense | | | 296 | | | | 1,316 | | | | 2,663 | | | | 32.4 | |
| Interest expense, net | | | 8,410 | | | | 11,930 | | | | 8,375 | | | | 101.9 | |
| Other (income)/expense, net | | | 18 | | | | 3 | | | | (30 | ) | | | (0.4 | ) |
| Depreciation and amortization | | | 3,202 | | | | 3,667 | | | | 4,024 | | | | 49.0 | |
| Impairment loss/(reversal) | | | 3,255 | | | | (80 | ) | | | 1,279 | | | | 15.6 | |
| Loss/(gain) on foreign currency exchange (net) | | | 7 | | | | (33 | ) | | | 157 | | | | 1.9 | |
| Adjusted EBITDA | | | 10,987 | | | | 14,677 | | | | 14,146 | | | | 172.1 | |
| % of Sale of power | | | 72.1 | % | | | 80.0 | % | | | 68.2 | % | | | 68.2 | % |
| | | | | | | | | | | | |
| | | Fiscal Year Ended March 31, | |
| | | 2016 | | | 2017 | |
| | | INR | | | INR | | | US$ | |
| | | (In thousands) | |
Net loss | | | (1,654,840 | ) | | | (1,191,569 | ) | | | (18,374 | ) |
Income tax expense | | | 327,745 | | | | 892,333 | | | | 13,760 | |
Interest expense, net | | | 2,058,836 | | | | 2,371,836 | | | | 36,574 | |
Depreciation and amortization | | | 687,781 | | | | 1,046,565 | | | | 16,138 | |
Loss/(gain) on foreign currency exchange | | | 343,137 | | | | (109,128 | ) | | | (1,683 | ) |
| | | | | | | | | | | | |
Adjusted EBITDA | | | 1,762,659 | | | | 3,010,037 | | | | 46,415 | |
| | | | | | | | | | | | |
| (1) | Translation of balances in the financial information table above from INR into US$, as of and for Fiscal Year 2023, are solely for the convenience of the readers and were calculated at the rate of US$1.00 = INR 82.19, the noon buying rate in New York City for cable transfers in non-U.S. currencies, as certified for customs purposes by the Federal Reserve Bank of New York on March 31, 2023. No representation is made that the INR amounts could have been, or could be, converted, realized or settled into US$ at that rate on March 31, 2023, or at any other rate. |
Project Cost per Megawatt Operating
Project cost per megawatt operating consists of the total project cost including solar photovoltaic panels, inverters, balance of plant equipment, freehold land or leasehold land, capitalizable financing costs, and installation costs incurred for operatinginstalling one megawatt of new solar power plantDC capacity during the reporting period. It is an indicator of our strong engineering, procurement and construction capabilities, market cost of material and our ability to procure such material at competitive prices. A reduction in project cost per megawatt helps reduce the cost of power and thereby improves our ability to win new projects. The project cost
| | | Fiscal Year Ended March 31, | |
| | | 2022 | | | 2023 | |
| | | INR | | | INR | | | US$ | |
| | | (in millions) | |
| Including Safeguard Duty: | | | | | | | | | |
| Cost per MW (AC) | | | 43.1 | | | | 43.0 | | | | 0.5 | |
| Cost per MW (DC) | | | 33.5 | | | | 37.4 | | | | 0.5 | |
| Excluding Safeguard Duty: | | | | | | | | | | | | |
| Cost per MW (AC) | | | 42.4 | | | | 43.0 | | | | 0.5 | |
| Cost per MW (DC) | | | 32.9 | | | | 37.4 | | | | 0.5 | |
Cost per megawatt operating for the fiscal years ended March 31, 2016 and 2017 was INR 59.6 million and INR 49.3 million (US$0.8 million), respectively. The project cost per megawattMW has declinedincreased in current year as compared to previous year primarily on account of increase in module prices.
Cash Flow to Equity
Cash Flow to Equity (or “Cfe”) is not a U.S. GAAP financial measure. We present Cfe as a result of decreasing solar module prices and balance of system costs. We expect project costs to decline during fiscal year 2018.
Nominal Contracted Payments
Our PPAs create long-term recurring customer payments. Nominal contracted payments equal the sum of the estimated payments that the customer is likely to make, subject to discounts or rebates, over the remaining term of the PPAs. When calculating nominal contracted payments, we include those PPAs for projects that are operating or committed. To calculate the nominal contracted payments, we multiply the contract price per
kilowatt hour as per the respective PPA by the estimated annual energy output for the remaining life of the PPA period. In estimating the nominal contracted payments, we multiply the PPA contract price per kilowatt hour by the estimated annual energy output for all solar projects committed and operating as of the reporting date. The estimated annual energy outputsupplemental measure of our solar projectsperformance. This measurement is calculated using power generation simulation softwarenot recognized under U.S. GAAP and validatedshould not be viewed as an alternative to U.S. GAAP measures of performance. The presentation of Cfe should not be construed as an inference that our future results will be unaffected by independent engineering firms. The main assumption used in the calculation is the project location, which enables the software to derive the estimated annual energy outputunusual or non-recurring items.
We believe U.S. GAAP metrics, such as net income (loss) and cash from certain metrological data, including the temperature, wind speed and solar radiation based on the project location. Our power generation simulation software calculates the estimated annual energy output by using the following formula:
E = A * r * H * PR
E = Energy (kWh)
A = Total solar panel Area (m²)
r = Solar panel efficiency (%)
H = Annual global radiation at collector plane
PR = Performance ratio, coefficient for losses (range between 0.50 and 0.95)
Performance ratio is a quantity which represents the ratio of the effectively produced (used) energy to the energy which would be produced by a “perfect” system continuously operating at standard test condition underactivities, do not provide the same radiation, takinglevel of visibility into account losses such as array losses (shadings, incident angle modifier, photovoltaic conversion, module quality, mismatchthe performance and wiring) and system losses (inverter efficiency, transformer efficiency and transmission losses).
The calculation of the estimated annual energy output also takes into account the total rated capacity of all the solar panels to be installed for the remaining life of the PPA, net of the annual estimated decrease in rated capacity based on technology installed. The decrease in rated capacity includes various losses caused by soiling, temperature changes, inverter and transformer inefficiency, incidence angle, wire, shading and mismatch losses. The technology used for each project is assessed based on geographical conditions of the project, cost economics and the availability of such technology for construction. We assume an annual decrease in rated capacity ranging from 0.5% to 0.7% depending on the technology used, which is based on the specifications given by the manufacturer of the solar panels.
To calculate nominal contracted payments for committed projects, we assume a 50% probability of achieving the generation numbers projected by the power generation software, which is net of the annual estimated decrease in rated capacity based on the technology installed. For operating projects, instead of the formula described above, we use the actual full year energy generated net of the annual estimated decrease in rated capacity based on the technology installed. We have used this method of calculation since the inception of all projects, including scheduled price changes where applicable.
If we were to receive government grants under any PPA, such grants would be included as nominal contracted payments in the period when received. We account for VGF as an income-type government grant. The proceeds received from VGF grants upon fulfilment of certain conditions are initially recorded as deferred revenue. This deferred VGF revenue is recognized as sale of power in proportion to (x) the actual sale of solar energy kilowatts during the period to (y) the total estimated sale of solar energy kilowatts during the tenure of the applicable PPA (as described in Note 2(r) to our consolidated financial statements) pursuant to our revenue recognition policy.
Nominal contracted payments is a forward-looking number and we use judgment in developing the assumptions used to calculate it. Those assumptions may not prove to be accurate over time. Underperformance of the solar power plants, payment defaults by our customers or other factors described under the heading “Item 3. Key Information — D. Risk Factors” could cause our actual results to differ materially from our calculation of nominal contracted payments.
The following table sets forth, with respect to our PPAs, the aggregate nominal contracted payments and total estimated energy output as of the reporting dates. These nominal contracted payments have not been discounted to arrive at the present value.
| | | | | | | | | | | | |
| | | As of March 31, | |
| | | 2016 | | | 2017 | |
| | | INR | | | INR | | | US$ | |
Nominal contracted payments (in thousands) | | | 207,576,237 | | | | 255,474,775 | | | | 3,939,472 | |
| |
| | | As of March 31, | |
| | | 2016 | | | 2017 | |
Total estimated energy output (kilowatt hours in millions) | | | 34,671 | | | | 44,677 | |
Nominal contracted payments increased from March 31, 2016 to March 31, 2017 as a result of entering into additional PPAs. Over time, we have seen a trend towards a decline in the Central Electricity Regulatory Commission benchmark tariff for solar power procurement. For fiscal year 2011, the Central Electricity Regulatory Commission benchmark tariff for solar power procurement was INR 17.91 per kilowatt hour. It was reduced to INR 10.39 per kilowatt hour for fiscal year 2013, which was further reduced to INR 7.72 per kilowatt hour for fiscal year 2015 and INR 5.68 per kilowatt hour for fiscal year 2016. The overall trend of solar power tariffs is that the tariffs are declining in line with the solar module prices.
Portfolio Run-Rate
Portfolio run-rate equals our annualized payments from customers extrapolated based on the operating and committed capacity as of the reporting date. In estimating the portfolio run-rate, we multiply the PPA contract price per kilowatt hour by the estimated annual energy output for all operating and committed solar projects as of the reporting date. The estimated annual energy outputprospects of our solar projects is calculated using power generation simulation software and validated by independent engineering firms. The main assumption used in the calculation is the project location, which enables the software to derive the estimated annual energy output from certain metrological data, including the temperature, wind speed and solar radiation based on the project location. Our power generation simulation software calculates the estimated annual energy output by using the formula described above.
The calculation of the estimated annual energy output also takes into account the total rated capacity of all the solar panels to be installed for the remaining life of the PPA, net of the annual estimated decrease in rated capacity based on technology installed. The decrease in rated capacity includes various losses caused by soiling, temperature changes, inverter and transformer inefficiency, incidence angle, wire, shading and mismatch losses.
To calculate portfolio run-rate for committed projects, we assume a 50% probability of achieving the generation numbers projected by the power generation software, which is net of the annual estimated decrease in rated capacity based on the technology installed. For operating projects, instead of the formula described above, we use the actual full year energy generated net of the annual estimated decrease in rated capacity based on the technology installed. We have used this method of calculation since the inception of all projects, including scheduled price changes where applicable.
Portfolio run-rate is a forward-looking number, and we use judgment in developing the assumptions used to calculate it. Those assumptions may not prove to be accurate over time. Underperformance of the solar power plants or other factors described under the heading “Item 3. Key Information — D. Risk Factors” could cause our actual results to differ materially from our calculation of portfolio run-rate.
The following table sets forth, with respect to our PPAs, the aggregate portfolio run-rate and estimated annual energy output as of the reporting dates. The portfolio run-rate has not been discounted to arrive at the present value.
| | | | | | | | | | | | |
| | | As of March 31, | |
| | | 2016 | | | 2017 | |
| | | INR | | | INR | | | US$ | |
Portfolio Revenue run-rate (in thousands) | | | 9,289,641 | | | | 11,005,761 | | | | 169,711 | |
| |
| | | As of March 31, | |
| | | 2016 | | | 2017 | |
Estimated annual energy output (kilowatt hours in millions) | | | 1,514 | | | | 1,921 | |
Portfolio run-rate increased from March 31, 2016 to March 31, 2017business as a result of the increase long-term capital-intensive nature of our businesses, non-cash depreciation and amortization cash used for debt servicing as well as investments and costs related to the growth of our business.
Our business owns high-value, long-lived assets capable of generating substantial Cash Flow to Equity over time. We define Cfe as profit before tax (the most comparable U.S. GAAP metric), adjusted for net cash provided for used/in operationaloperating activities, other than changes in operating assets and committed capacityliabilities, income and deferred taxes and amortization of hedging costs; less: cash paid for income taxes, debt amortization and maintenance capital expenditure.
We believe that changes in operating assets and liabilities is cyclical for cash flow generation of our assets, due to high growth environment. Furthermore, to reflect the actual cash outflows for income tax, we deduct income and deferred taxes computed under U.S. GAAP presented in our consolidated financial statements and instead include the actual cash tax outflow during the period, are considered as part of tax expense.
We believe that external consumers of our financial statements, including investors and research analysts, use Cfe both to assess Azure’s performance and as an indicator of its success in generating an attractive risk-adjusted total return, assess the value of the business and the platform. This has been a widely used metric by analysts to value our business, and hence we believe this will help potential investors in analyzing the cash generation from our operating assets.
We have disclosed Cfe for our operational assets on a consolidated basis, which is not the cash from operations on a consolidated basis. We believe Cfe supplements U.S. GAAP results to provide a more complete understanding of the financial and operating performance of our businesses than would not otherwise be achieved using U.S. GAAP results alone. Cfe should be used as a supplemental measure and not in lieu of our financial results reported under U.S. GAAP.
We have categorized the Cfe into “Operational Assets” and “Others”, as defined below, so that users of our financial statements are able to understand the Cash generation from our operational assets.
We define our “Operational Assets”, as the projects which had commenced operations on or before March 31, 2023. –The operational assets represent the MW operating as on the date.
We define “Others” as (i) the project SPV’s which are under construction, or under development – as provided in the Power Purchase Agreement table in this Form 20-F, (ii) “corporate” which includes our three Mauritius entities, (iii) other projects not covered under operational assets, and (iv) other entities under the group which are newly incorporated.
We define “debt amortization” as the current portion of long-term debt which has been repaid during the period as part of debt repayment obligations, excluding the debt which has been repaid before maturity or refinanced. It does not include the amortization of debt financing costs or interest paid during the period.
Other items from the Statement of Cash Flows include most of the items that reconcile “Net (loss) gain” and “Changes in operating assets and liabilities” from the Statement of Cash Flows, other than deferred taxes, non-cash employee benefit and amortization of hedging costs.
Following is the Cfe statement for the periods March 2022 and 2023:
| | | For the twelve months ended March 31, 2022 | | | For the twelve months ended March 31, 2023 | |
| | | Unaudited | | | Unaudited | |
| | | (in millions) | | | (in millions) | |
| | | Total | | | Other | | | Operating | | | Total | | | Other | | | Operating | | | Operating | |
| | | INR | | | INR | | | INR | | | INR | | | INR | | | INR | | | US$ | |
| Revenue from customers | | | 18,341 | | | | - | | | | 18,341 | | | | 20,748 | | | | - | | | | 20,748 | | | | 252.4 | |
| Cost of operations | | | 1,597 | | | | - | | | | 1,597 | | | | 1,825 | | | | - | | | | 1,825 | | | | 22.2 | |
| General and administrative | | | 2,067 | | | | 1,288 | | | | 779 | | | | 4,777 | | | | 3,453 | | | | 1,324 | | | | 16.1 | |
| Depreciation and amortization | | | 3,667 | | | | 28 | | | | 3,639 | | | | 4,024 | | | | 2 | | | | 4,022 | | | | 48.9 | |
| Impairment loss/(reversal) | | | (80 | ) | | | - | | | | (80 | ) | | | 1,279 | | | | - | | | | 1,279 | | | | 15.6 | |
| Operating income/(loss) | | | 11,090 | | | | (1,316 | ) | | | 12,406 | | | | 8,844 | | | | (3,455 | ) | | | 12,298 | | | | 149.6 | |
| Interest expense, net | | | 11,930 | | | | 6,498 | | | | 5,432 | | | | 8,375 | | | | 4,506 | | | | 3,869 | | | | 47.1 | |
| Other expense, net | | | 3 | | | | 1 | | | | 2 | | | | (30 | ) | | | (13 | ) | | | (17 | ) | | | (0.2 | ) |
| Loss/(gain) on foreign currency exchange, net | | | (33 | ) | | | 17 | | | | (50 | ) | | | 157 | | | | 28 | | | | 129 | | | | 1.6 | |
| Profit/(Loss) before income tax | | | (810 | ) | | | (7,832 | ) | | | 7,022 | | | | 341 | | | | (7,976 | ) | | | 8,317 | | | | 101.1 | |
| Add: Depreciation and amortization | | | 3,667 | | | | 28 | | | | 3,639 | | | | 4,024 | | | | 2 | | | | 4,022 | | | | 48.9 | |
| Add: Impairment loss | | | (80 | ) | | | - | | | | (80 | ) | | | 1,279 | | | | - | | | | 1,279 | | | | 15.6 | |
| Add: Loss/(gain) on foreign currency exchange, net | | | (33 | ) | | | 17 | | | | (50 | ) | | | 157 | | | | 28 | | | | 129 | | | | 1.6 | |
| Add: Amortization of debt financing costs | | | 1,107 | | | | 140 | | | | 967 | | | | 336 | | | | 5 | | | | 331 | | | | 4.0 | |
| Add: Other items from Statement of Cash Flows(1) | | | 1,796 | | | | 10 | | | | 1,786 | | | | 365 | | | | (907 | ) | | | 1,272 | | | | 15.5 | |
| Less: Cash paid for income taxes | | | (644 | ) | | | (516 | ) | | | (128 | ) | | | (514 | ) | | | (153 | ) | | | (361 | ) | | | (4.4 | ) |
| Less: Debt amortization(2) | | | (1,591 | ) | | | - | | | | (1,591 | ) | | | (4,853 | ) | | | - | | | | (4,853 | ) | | | (59.0 | ) |
| Cfe | | | 3,412 | | | | (8,153 | ) | | | 11,565 | | | | 1,135 | | | | (9,000 | ) | | | 10,136 | | | | 123.3 | |
| (1) | Other items from the Statement of Cash Flows: For the year ended March 31, 2022 and March 31, 2023 respectively, Other items include: loss on disposal of property plant and equipment of INR 167 million and INR 242 million (US$2.9 million), reversal of share based compensation of INR 295 million and reversal of INR 629 million (US$7.7 million), non-cash rent expense of INR 354 million and INR 121 million (US$1.5 million), reversal of allowance for doubtful debts of INR 97 million and INR 551 million (US$6.7 million), loan repayment charges of INR 1,608 million and INR Nil million and Assets Retirement Obligation (ARO) accretion of INR 46 million and INR 83 million (US$1.0 million). |
| (2) | Debt Amortization: Repayments of term and other loans during the year ended March 31, 2023, were INR 7,222 million (US$87.9 million) (refer to the Statement of Cash Flows) which includes INR 2,369 million (US$ 28.8 million) related to refinancing of loans, extinguishment, repayment of debt and payments for hedge and have been excluded to determine debt amortization of INR 4,853 million (US$59.0 million). Repayments of term and other loans during the year ended March 31, 2022, were INR 90,022 million (refer to the Statement of Cash Flows) which includes INR 88,431 million related to refinancing of loans or early repayment of debt before maturity and have been excluded to determine debt amortization of INR 1,591 million. |
| (3) | Classification of Maintenance capital expenditures and Growth capital expenditures: We consider all our capital expenditures Growth Capital Expenditures. In broad terms, we expense all expenditures in the current period that would primarily maintain our businesses at current levels of operations, capability, profitability or cash flow in operations and maintenance and therefore there are no Maintenance Capital Expenditures. Growth capital expenditures primarily provide new or enhanced levels of operations, capability, profitability or cash flows. |
| (4) | Reconciliation of total Cfe to U.S. GAAP cash from Operating Activities: |
| | | For the year ended March 31, 2022 | | | For the year ended March 31, 2023 | |
| | | INR | | | INR | |
| | | (in millions) | | | (in millions) | |
| Cfe (Non-U.S. GAAP) | | | 3,412 | | | | 1,135 | |
| Items included in U.S. GAAP Cash from Operating Activities but not considered in Cfe: | | | | | | | | |
| Change in current assets and liabilities as per statement of cash flows | | | (1,455 | ) | | | 955 | |
| Current income taxes | | | (859 | ) | | | (1,049 | ) |
| Interest income on investment | | | - | | | | (41 | ) |
| Prepaid lease payments and employee benefits | | | (312 | ) | | | (136 | ) |
| Amortization of hedging costs | | | 1,576 | | | | 1,726 | |
| Items included in Cfe but not considered in U.S. GAAP Cash Flow from Operating Activities: | | | | | | | | |
| Debt amortization | | | 1,591 | | | | 4,853 | |
| Cash taxes paid | | | 644 | | | | 514 | |
| Cash from Operating Activities (U.S. GAAP) | | | 4,597 | | | | 7,957 | |
Summary of key financial metrices
The following are the key metrics used to evaluate our business performance:
| Key metrics | | Unit of Measurement | | Fiscal 2021 | | | Fiscal 2022 | | | Fiscal 2023 | |
| Revenue (1) | | INR in millions | | | 15,236 | | | | 18,341 | | | | 20,748 | |
| Revenue (2) | | US$ in millions | | | 208.3 | | | | 241.7 | | | | 252.4 | |
| Cost per MW Operating (3) | | INR in millions | | | 28.8 | | | | 33.5 | | | | 37.4 | |
| Adjusted EBITDA | | INR in millions | | | 10,987 | | | | 14,677 | | | | 14,146 | |
| Cfe | | INR in millions | | | 3,582 | | | | 3,412 | | | | 1,135 | |
| (1) | Revenue consists of revenue from the sale of power, including other revenue items related to generation from renewable power. |
| (2) | Translation of balances from INR into US$, as of and for Fiscal Year 2023 are solely for the convenience of the readers and were calculated at the rate of US$1.00 = INR 82.19, the noon buying rate in New York City for cable transfers in non-U.S. currencies, as certified for customs purposes by the Federal Reserve Bank of New York on March 31, 2023. No representation is made that the INR amounts could have been, or could be, converted, realized or settled into US$ at that rate on March 31, 2023, or at any other rate. |
| (3) | Installation per MW of DC capacity and includes safe-guard duties which we expect to recover. |
Critical Accounting Policies and Estimates
Our consolidated financial statements are prepared in accordance with U.S. GAAP. We have identified certain accounting policies that we believe are the most critical to the presentation of our consolidated financial information over a period of time. These accounting policies may require our management to take decisions on subjective and/or complex matters relating to reported amounts of assets, liabilities, revenue, costs, expenses and related disclosures. These would further lead us to estimate the effect of matters that may inherently be uncertain.
The judgment on such estimates and underlying assumptions is based on our experience, historical trends, understanding of the business, industry and various other factors that we believe are reasonable under the circumstances. These form the basis of our judgment on matters that may not be apparent from other available sources of information. In many instances changes in the accounting estimates are likely to occur from period-to-period. Actual results may differ from the estimates. The future financial statement presentation, financial condition, results of operations and cash flows may be affected to the extent that the actual results differ materially from our estimates.
Our significant accounting policies are summarized in Note 2—Summary of Significant Accounting Policies in our consolidated financial statements included in this annual report.
Components of Results of Operations
Operating Revenue
Operating revenue consists of solar energy sold to customers under long term PPAs, which generally have a term of 25 years. We have one customer for each solar power plant. Our customers are power distribution companies and, to a lesser extent, commercial and industrial enterprises.
We recognize revenue on a monthly basisPPAs when the power plant generates power, and it is supplied to the customer in accordance with the respective PPA. Revenue is recognized in each period based on the solarvolume of electricity supplied to the customer at the price stated in the PPA, once the energy kilowatts actuallyare supplied to our customers multiplied by the rate per kilowatt hour agreed to in the respective PPA.and collectability is reasonably assured. The solar energy kilowatts hourswe supplied during a month are validated by the customer prior to our billing and recognition of revenue.
Where PPAs include scheduled price changes, revenue is recognized by applying the average rate to the energy output estimated over the term of the PPA. We estimate the total kilowatt hour units expected to be generated annually during the tenure of PPA using budgeted plant load factors,PLFs, rated capacity of the project and annual estimated decrease in rated capability of solar panels. The contractual rates are applied to this annual estimate to determine the total estimated revenue over the term of the PPA. We then use the total estimated revenue and the total estimated kilowatt hours to compute the average rate used to record revenue on the actual energy output supplied. We compare the actual energy supplied to the estimate of the energy expected to be generated over the remaining term of the PPA on a periodic basis, but at least annually. Based on this evaluation, we reassess the energy output estimated over the remaining term of the PPA and adjust the revenue recognized and deferred to date. Through March 31, 2017,2023, the adjustments have not been significant. Thesignificant, and the difference between the actual billing and revenue recognized is recorded as deferred revenue.
We recognize revenue when persuasive evidence of an arrangement exists, the fee is fixed or determinable, the electricity is delivered and collectability is reasonably assured. Revenue from sale of power is recorded net of discounts which, to date, have not been significant.
Cost of Operations (Exclusive of Depreciation and Amortization)
Our cost
Cost of operations primarily consists of expenses pertaining to operations and maintenance of our solar power plants. These expenses include payroll and related costs for maintenance staff, plant maintenance, insurance, and, if applicable, lease costs.
General and Administrative Expenses
Our general and administrative expenses include payroll and related costs for corporate, finance and other support staff, including bonus and share based compensation expense, professional fees and other corporate expenses.
expenses. We anticipate that we will incur additional general and administrative costs, including headcount and expansion related costs, to support the growth in our business as well as additional costs of being a public reporting company.
Depreciation and Amortization
Depreciation and amortization expense isAmortization expenses are recognized using the straight-line method over the estimated useful life of our solar power plants and other assets. Leasehold improvements related to solar power plants are amortized over the shorter of the lease term or the underlying period of the PPA for that particular solar power plant. Leasehold improvements related to office facilities are amortized over the shorter of the lease period or the estimated useful life. Freehold land is not depreciated. Construction in progress is not depreciated until such projects are commissioned.
Impairment loss/(reversal)
Impairment loss/(reversal) relates to fair valuation impact of our non-core solar rooftop portfolio, for which we entered into an agreement for sale during April 2021 and impairment in relation to 3,033 MW projects (part of manufacturing linked tender).
Interest Expense, Net
Interest expense, net consists of interest incurred on term loans for projects under our fixed and variable rate financing arrangements and for the period prior to our initial public offering, interest on compulsorily convertible debentures. It also included the deemedincluding interest expense which was payable in the formand cost of a guaranteed returnhedging foreign currency risk on the compulsorily convertible debenturesGreen Bonds, and interest expense on non-convertible debentures. Interest cost also includes the Series Ecost of swaps and Series G compulsorily convertible preferred shares which were classifiedoption contracts entered to mitigate the foreign exchange risk for solar green bond transactions. We have designated the swaps and option contracts as a liabilitycash flow hedge and were converted to shares simultaneous to our initial public offering.are tested for effectiveness on a quarterly basis or as determined at the time of designation of hedge. Interest expense also includesinclude bank fees and other borrowing costs, which are typically amortized over the life of the loan using the effective interest rate method. Interest expense is presented net of capitalized financing costs and interest income earned from bank deposits.
Interest incurred in connection with a project that has been commissioned is expensed while interest incurred prior to commissioning is capitalized.
Other expense/(income)
Other expense/(income) primarily consists of mutual fund income net of certain expense.
Gain/Loss on Foreign Currency Exchange (Net)
We are exposed to movements in currency exchange rates, particularly to changes in exchange rates between U.S. dollars and Indian rupees. While our functional currency is the U.S. dollar, the functional currency of AZIAPIPL is Indian rupees and a portion of AZI’sAPIPL’s borrowings from financial institutions are denominated in U.S. dollars. Foreign exchange gain/loss includes the unrealized and realized gain/loss from foreign currency fluctuations on our non-functional currency denominated borrowings.
We also enter into foreign currency option contracts to mitigate and manage the risk of changes in foreign exchange rates on our borrowings denominated in currencies other than our functional currency. TheseSome of these hedges do not qualify as cash flow hedges under Accounting Standards Codification, or ASC,“ASC”, Topic 815, “Derivatives and Hedging.” Changes in the fair value of these option contracts are recognized in the consolidated statements of operations and are included in loss on foreign currency exchange.
Income Tax ExpenseExpense/(Income)
Our income tax expenseexpense/ (income) consists of current and deferred income tax as per applicable jurisdictions in Mauritius, India and the United States. Income tax for our current and prior periods is measured at the amount expected to be recovered from or paid to taxation authorities based on our taxable income or loss for that period.
Deferred income taxes and changes in related valuation allowance, if any, reflect the net tax effects of temporary differences between the carrying amounts of assets and liabilities for financial reporting purposes and the amounts used for income tax purposes.
Internal Control over Financial Reporting
As a company with less than US$1.07 billion in revenue for our last fiscal year, we qualify as an emerging growth company pursuant to the Jumpstart Our Business Startups Act of 2012, or the JOBS Act. An emerging
growth company may take advantage of specified reduced reporting and other requirements that are otherwise applicable generally to public companies. These provisions include exemption from the auditor attestation requirement under Section 404 of the Sarbanes-Oxley Act of 2002 in the assessment of the emerging growth company’s internal control over financial reporting. The JOBS Act also provides that an emerging growth company does not need to comply with any new or revised financial accounting standards until such date that a private company is otherwise required to comply with such new or revised accounting standards. We may adopt new or revised accounting standards on the relevant dates on which adoption of such standard is required.
Critical Accounting Policies and Estimates
Our consolidated financial statements are prepared in accordance with U.S. GAAP. We have identified certain accounting policies that we believe are the most critical to the presentation of our consolidated financial information over a period of time. These accounting policies may require our management to take decisions on subjective and/or complex matters relating to reported amounts of assets, liabilities, revenue, costs, expenses and related disclosures. These would further lead us to estimate the effect of matters that may inherently be uncertain.
The judgment on such estimates and underlying assumptions is based on our experience, historical trends, understanding of the business, industry and various other factors that we believe are reasonable under the circumstances. These form the basis of our judgment on matters that may not be apparent from other available sources of information. In many instances changes in the accounting estimates are likely to occur from period-to-period. Actual results may differ from the estimates. The future financial statement presentation, financial condition, results of operations and cash flows may be affected to the extent that the actual results differ materially from our estimates.
Our significant accounting policies are summarized in Note 2 — Summary of Significant Accounting Policies to our consolidated financial statements included in this annual report. Our various critical accounting policies and estimates are discussed in the following paragraphs.
Income Taxes
Income tax expense consists of (i) current income tax expense arising from income from operations (ii) deferred income tax expense/(benefit) arising from temporary differences and (iii) income tax expense/(benefits) as a result of certain intercompany transactions.
We use the asset and liability method in accounting for income taxes. Under this method, deferred income tax assets and liabilities are determined based on the difference between financial reporting and tax bases of assets and liabilities and are measured using the enacted tax rates and laws that will be in effect when the differences are expected to reverse.
The tax rates on reversal of temporary differences might be different from the tax rates used for creation of the respective deferred tax assets/liabilities.
As of March 31, 20162022, and 2017,2023, we had net deferred tax assets of INR 34.71,920 million and INR 31.41,137 million (US$0.513.8 million), respectively, and net deferred tax liabilities of INR 470.01,936 million and INR 1,078.33,338 million (US$16.640.6 million), respectively.
We apply a two-step approach to recognize and measure uncertainty in income taxes in accordance with the Financial Accounting Standards Board, or FASB, Interpretation No. 48 (“FIN 48”),Accounting for Uncertainty in Income Taxes — an interpretation of ASC Topic 740. The first step is to evaluate the tax position for recognition by determining if the weight of available evidence indicates that it is more likely than not that the position will be sustained on audit, including resolution of related appeals or litigation processes, if any. The second step is to measure the tax benefit as the largest amount, which is more than 50% likely of being realized
upon ultimate settlement. We re-evaluate these uncertain tax positions on an annual basis. This evaluation is based on factors including changes in facts or circumstances, changes in tax law and effectively settled issues under tax-audit. Such a change in recognition or measurement could result in the recognition of a tax benefit or an additional charge to the tax provision in the relevant period. As of March 31, 20162022, and 2017,2023, we did not have any material uncertain tax positions.
We establish valuation allowances against our deferred tax assets when it is more likely than not that all or a portion of a deferred tax asset will not be realized. The valuation allowance as on March 31, 2022 and 2023 were INR 2,281 million and INR 2,455 million (US$29.9 million), respectively.
A portion of our Indian operations qualifies for tax holiday related to their operating income attributable to undertakings, as defined, in operating solar power plants under section 80-IA of the Indian Income Tax Act, 1961. This holiday is available for a period of ten consecutive years out of fifteen years beginning from the year in which the undertaking first generates power (referred to as the Tax Holiday period), however, the exemption is available only to thefor projects completed on or before March 31, 2017. We assess the election of the Tax Holiday period on an annual basis for each of our undertakings. We believe these undertakings will generate higher taxable profits due to lower interest cost as debt balances are paid down in the later years of operations and therefore, we plan to defer the Tax Holiday election to later years in order to maximize the benefits. As of March 31, 2017,2023, we are claiming tax holiday benefits for threefourteen of our subsidiaries. Deferred tax assets are recognized to the extent probable of realization outside the anticipated Tax Holiday period. For example, if we choose years six through 15 as the tax holiday period, we recognize deferred tax assets only to the extent that they will be realized either in years one through five or from year 16 onwards. As a result, all temporary differences do not result in creation of a deferred tax asset or liability.
AZI
Under certain of our subsidiaries, which are not eligible for deduction under section 80IA of the Income Tax Act, we had opted for the reduced corporate tax rate of 22% as per the provision of the Taxation Laws (Amendment) Act, 2019.
APIPL and a subsidiaryAZR provide EPCengineering, procurement and construction (“EPC”) and related support services to other group subsidiaries and as a result incur income taxes on profits from the services provided. The services provided to the group subsidiaries are in the nature of capitalizable costs and are therefore capitalized as part of property, plant and equipment in the standalone financial statements of such subsidiaries. However, these capitalized costs are eliminated for the purposes of the consolidated financial statements. The costs capitalized in the standalone financial statements are however eligible for income tax deductions in the tax records of the respective group subsidiaries. We recognize a portionstarted recording Deferred Tax Asset on the intra-entity transfer of income taxes incurred by AZI and the subsidiary providing such services as prepaid income taxesassets pursuant to the extent we will be able to realize the benefit derivedASU 2016-16, from tax deductions availed by the other subsidiaries.April 1, 2017. We assess that the probability of realizing the benefit on an annual basis and its recognition is limited to the extent probable of realization outside of the anticipated Tax Holiday period. Our estimate is that such benefit is limited to approximately 30% to 55% of the tax expense incurred by AZIAPIPL and the subsidiary. Prepaid income taxes are expensed in the statement of operations in the period the benefit is actually realized by the other group subsidiaries. As a result, while all the profits on inter-company transactions are eliminated during consolidation, it does not result in a complete reversal of tax expense on such inter-company transactions. Accordingly, while we have never beenmay not be profitable, we report income tax expensesexpense / benefit that may fluctuate overfrom period to period. Further, EPC services by APIPL to other group subsidiaries were provided up-till financial year ended March 31, 2020 only. Now all subsidiaries are managing these EPC services by themselves with dedicated team of field-service engineers, technicians and other employees.
Contracts Designated as Cashflow Hedges for Solar Green Bonds
We issued U.S. dollar denominated 3.575% Solar Green Bonds in August 2021 and 5.65% Solar Green Bonds in September, 2019 (together the period.
Share Based Compensation
In connection“Green Bonds”), listed on the Singapore Exchange Limited. We used the net proceeds from the Green Bonds to repay project level debt of certain projects in India, in the form of intercompany Non-Convertible Debentures (“NCD”) and External Commercial Borrowings (“ECBs”) denominated in INR. We hedged the exchange rate risk on the proceeds invested from the Green Bonds through cross currency swap for payment of coupons and through call spread option contracts for repayment of principal (collectively, “option contracts”). We have designated these option contracts as a cashflow hedge. We expect that these option contracts mitigate the exchange rate risk associated with our initial offering, the stock options granted toforecasted transaction for semi-annual repayment of coupon and principal and also for repayment of the employees have been cancelledprincipal balance at the AZI level and reissued atend of five years.
The cashflow from the Azure Power Global Limited level. For cancellationunderlying agreement match the terms of a hedge such as—notional amount, maturity of the AZI plan,option contracts, mitigation of exchange rate risk, and there are no additional considerations were paid or received from employees. There was no changesignificant changes in the Azure Power Global Limited plan of the employees in the number of options granted to the employees or the exercise price. The options under the Azure Power Global Limited plan were consideredcounter party risk, hence they are designated as immediate vesting, except for four of the employees.
We account for share options granted to our employeesa cashflow hedge in accordance with ASC Topic 718 —Stock Compensation. Under815— Derivatives and Hedging. Fair value of the hedge at the time of inception of the contract was nil and the cost of the hedge is recorded as an expense over the period of the contract on a straight-line basis. Changes in fair value recognition provision of such guidance, compensation for share options granted is measured at the grant date,option contracts designated as cash flow hedge are recorded in Other Comprehensive Income/(Loss), net of tax, until the hedge transactions occur.
We used the derivatives option pricing model based on the principles of the Black-Scholes model to determine the fair value of the options, and is recognized as expense over the vesting period of the option.
Share based compensation expense is recorded net of estimated forfeitures in our consolidated statement of operations under general and administrative expenses and is recorded for only those share options that we expect to vest. These share options have been granted to the employees who are in the corporate or finance department and to other support staff.foreign exchange option contracts. We estimate the forfeiture rate based on historical forfeitures of share options and adjust the rate to reflect changes in facts and circumstances. We revise our estimated forfeiture rate if actual forfeitures differ from our initial estimates.
Determiningclassify the fair value of share options requires significant judgment. We estimatedthese foreign exchange option contracts as Level 2 because the fair value of our share options usinginputs used in the Black-Scholes valuation model for awards with service vesting conditions andare observable in active markets over the Lattice valuation model for awards vesting based on achievementterm of market conditions. These models require inputs such as the fair value of our equity shares, risk-free interest rate, expected dividend yield, expected term and expected volatility and we have applied these inputs in determining the fairrespective contracts. Fair value of the share options as follows:
Fair value of our equity shares — we have valued our business on the date of each option grant for the grants issued prior to our initial public offering. Grants issued subsequent to our initial public offering are valuedhypothetical derivative is computed based on the
closing equity share priceabove inputs from Bloomberg or other reputed banks.
| | | As of March 31, 2022 (in millions) | |
| | | Notional Amount | | | Current Liabilities (Fair value) | | | Other Assets (Fair value) | | | Other Assets (Fair value) | |
| | | (US$) | | | (INR) | | | (INR) | | | (US$) | |
| Foreign currency option contracts | | | 753.9 | | | | (1,735 | ) | | | 2,647 | | | | 34.9 | |
| | | As of March 31, 2023 (in millions) | |
| | | Notional Amount | | | Current Liabilities (Fair value) | | | Other Assets (Fair value) | | | Other Assets (Fair value) | |
| | | (US$) | | | (INR) | | | (INR) | | | (US$) | |
| Foreign currency option contracts | | | 721.6 | | | | (1,431 | ) | | | 5,447 | | | | 66.3 | |
Property, Plants and Equipment
Our Company’s principal executive offices are located at 8th Floor, Tower A, DLF Infinity, Cyber City, Phase II, Gurugram 122002, India and occupy approximately 29,000 square feet of space. Our power projects are located primarily on land leased from the datestate governments and third parties and freehold land purchased from private individuals and entities. Further, we source the land required for construction of grant.
Risk free interest rate —plants under the risk-free interest rate is based onland lease arrangement or procure at the yield on Indian treasury bonds priorrequired locations of the plant. Our land lease arrangements range typically from 2 to IPO and US treasury bond post IPO, the date of grant with the tenor matching the remaining35 years, but our PPAs are generally for a term of the share options.
Expected dividend yield — we have never declared or paid any cash dividends on25 years. We believe that our
equity sharesfacilities are in good condition and
do not presently plan to pay cash dividendsgenerally suitable and adequate for our needs in the foreseeable future.
Consequently,However, we
used an expected dividend yieldwill continue to seek additional space as needed to satisfy our growth.
Power Purchase Agreements
The material terms of zero.the PPAs we have entered into and bids we have won as of the date of this annual report for our utility scale projects are summarized in the following table.
Expected term — the expected term was estimated based on the average between the vesting period and the plan term.
Project Names | | Commercial Operation Date (1) | | PPA Capacity (MW) | | | DC Capacity (MW) | | | Tariff (INR / kWh) | | (6) | | Off taker | | Duration of PPA in Years | |
| Utility | |
| Operational | |
| Gujarat 1.1 | | Q2 2011 | | | 5 | | | | 5 | | | | 15.00 | (2) | | | Gujarat Urja Vikas Nigam Limited | | | 25 | |
| Gujarat 1.2 | | Q4 2011 | | | 5 | | | | 5 | | | | 15.00 | (2) | | | Gujarat Urja Vikas Nigam Limited | | | 25 | |
| Punjab 1 | | Q4 2009 | | | 2 | | | | 2 | | | | 17.91 | | | | NTPC Vidyut Vyapar Nigam Limited | | | 25 | |
| Rajasthan 1 | | Q4 2011 | | | 5 | | | | 5 | | | | 11.94 | | | | NTPC Vidyut Vyapar Nigam Limited | | | 25 | |
| Rajasthan 2.1 | | Q1 2013 | | | 20 | | | | 22 | | | | 8.21 | | | | NTPC Vidyut Vyapar Nigam Limited | | | 25 | |
| Rajasthan 2.2 | | Q1 2013 | | | 15 | | | | 18 | | | | 8.21 | | | | NTPC Vidyut Vyapar Nigam Limited | | | 25 | |
| Punjab 2.1 | | Q3 2014 | | | 15 | | | | 15 | | | | 7.67 | | | | Punjab State Power Corporation Limited | | | 25 | |
| Punjab 2.2 | | Q4 2014 | | | 15 | | | | 15 | | | | 7.97 | | | | Punjab State Power Corporation Limited | | | 25 | |
| Punjab 2.3 | | Q4 2014 | | | 4 | | | | 4 | | | | 8.28 | | | | Punjab State Power Corporation Limited | | | 25 | |
| Karnataka 1 | | Q1 2015 | | | 10 | | | | 10 | | | | 7.47 | | | | Bangalore Electricity Supply Company Limited | | | 25 | |
| Uttar Pradesh 1 | | Q1 2015 | | | 10 | | | | 12 | | | | 8.99 | | | | Uttar Pradesh Power Corporation Limited | | | 12 | |
| Rajasthan 3.1 | | Q2 2015 | | | 20 | | | | 23 | | | | 5.45 | (3) | | | Solar Energy Corporation of India Limited | | | 25 | |
| Rajasthan 3.2 | | Q2 2015 | | | 40 | | | | 43 | | | | 5.45 | (3) | | | Solar Energy Corporation of India Limited | | | 25 | |
| Rajasthan 3.3 | | Q2 2015 | | | 40 | | | | 41 | | | | 5.45 | (3) | | | Solar Energy Corporation of India Limited | | | 25 | |
| Chhattisgarh 1.1 | | Q2 2015 | | | 10 | | | | 10 | | | | 6.44 | | | | Chhattisgarh State Power Distribution Company Limited | | | 25 | |
| Chhattisgarh 1.2 | | Q2 2015 | | | 10 | | | | 10 | | | | 6.45 | | | | Chhattisgarh State Power Distribution Company Limited | | | 25 | |
| Chhattisgarh 1.3 | | Q3 2015 | | | 10 | | | | 10 | | | | 6.46 | | | | Chhattisgarh State Power Distribution Company Limited | | | 25 | |
| Rajasthan 4 | | Q4 2015 | | | 5 | | | | 6 | | | | 5.45 | (3) | | | Solar Energy Corporation of India Limited | | | 25 | |
| Delhi 1.1 | | Q4 2015 | | | 2 | | | | 2 | | | | 5.43 | (3) | | | Solar Energy Corporation of India Limited | | | 25 | |
| Karnataka 2 | | Q1 2016 | | | 10 | | | | 12 | | | | 6.66 | | | | Bangalore Electricity Supply Company Limited | | | 25 | |
| Andhra Pradesh 1 (4) | | Q1 2016 | | | 50 | | | | 54 | | | | 6.63 | (2) | | | Southern Power Distribution Company of Andhra Pradesh Limited | | | 25 | |
| Punjab 3.1 | | Q1 2016 | | | 24 | | | | 25 | | | | 7.19 | | | | Punjab State Power Corporation Limited | | | 25 | |
| Punjab 3.2 | | Q1 2016 | | | 4 | | | | 4 | | | | 7.33 | | | | Punjab State Power Corporation Limited | | | 25 | |
| Bihar 1 | | Q3 2016 | | | 10 | | | | 12 | | | | 8.39 | | | | North & South Bihar Power Distribution Company Limited | | | 25 | |
| Punjab 4.1 | | Q4 2016 | | | 50 | | | | 52 | | | | 5.62 | | | | Punjab State Power Corporation Limited | | | 25 | |
| Punjab 4.2 | | Q4 2016 | | | 50 | | | | 52 | | | | 5.63 | | | | Punjab State Power Corporation Limited | | | 25 | |
| Punjab 4.3 | | Q4 2016 | | | 50 | | | | 52 | | | | 5.64 | | | | Punjab State Power Corporation Limited | | | 25 | |
| Karnataka 3.1 | | Q1 2017 | | | 50 | | | | 54 | | | | 6.51 | | | | Chamundeshwari Electricity Supply Company Limited | | | 25 | |
| Karnataka 3.2 | | Q1 2017 | | | 40 | | | | 42 | | | | 6.51 | | | | Hubli Electricity Supply Company Limited | | | 25 | |
| Karnataka 3.3 | | Q1 2017 | | | 40 | | | | 42 | | | | 6.51 | | | | Gulbarga Electricity Supply Company Limited | | | 25 | |
| Maharashtra 1.1 | | Q1 2017 | | | 2 | | | | 2 | | | | 5.50 | (3) | | | Ordinance Factory, Bhandara | | | 25 | |
| Maharashtra 1.2 | | Q1 2017 | | | 5 | | | | 6 | | | | 5.31 | | | | Ordinance Factory, Ambajhari | | | 25 | |
| Andhra Pradesh 2 (5) | | Q2 2017 | | | 100 | | | | 130 | | | | 5.12 | | | | NTPC Limited | | | 25 | |
| Uttar Pradesh 2 | | Q2-Q3 2017 | | | 50 | | | | 59 | | | | 4.78 | | | | NTPC Limited | | | 25 | |
| Telangana 1 | | Q1 2018 | | | 100 | | | | 128 | | | | 4.67 | | | | NTPC Limited | | | 25 | |
| Uttar Pradesh 3 | | Q2 2018 | | | 40 | | | | 51 | | | | 4.43 | (3) | | | Solar Energy Corporation of India Limited | | | 25 | |
| Andhra Pradesh 3 | | Q2 2018 | | | 50 | | | | 64 | | | | 4.43 | (3) | | | Solar Energy Corporation of India Limited | | | 25 | |
| Gujarat 2 | | Q4 2018 – Q1 2019 | | | 260 | | | | 363 | | | | 2.67 | | | | Gujarat Urja Vikas Nigam Limited | | | 25 | |
| Karnataka 4.1 | | Q1 2019 | | | 50 | | | | 75 | | | | 2.93 | | | | Bangalore Electricity Supply Company | | | 25 | |
| Karnataka 4.2 | | Q1 2019 | | | 50 | | | | 75 | | | | 2.93 | | | | Hubli Electricity Supply Company Limited | | | 25 | |
| Rajasthan 5 | | Q2-Q3 2019 | | | 200 | | | | 262 | | | | 2.48 | | | | Solar Energy Corporation of India Limited | | | 25 | |
| Maharashtra 3 | | Q3 2019 | | | 130 | | | | 195 | | | | 2.72 | | | | Maharashtra State Electricity Distribution Company Limited | | | 25 | |
| Assam 1 | | Q3 2020-Q1 2022 | | | 90 | | | | 124 | | | | 3.34 | | | | Assam Power Distribution Company | | | 25 | |
| Rajasthan 6 | | Q4 2020- Q1 2022 | | | 600 | | | | 891 | | | | 2.53 | | | | Solar Energy Corporation of India Limited | | | 25 | |
| Rajasthan 8 | | Q4 2021- Q1 2022 | | | 300 | | | | 417 | | | | 2.58 | | | | Solar Energy Corporation of India Limited | | | 25 | |
| Rajasthan 9 | | Q1-Q3 2022 | | | 300 | | | | 360 | | | | 2.54 | | | | Solar Energy Corporation of India Limited | | | 25 | |
| Others (8) | | Q1 2018-Q4 2019 | | | 7 | | | | 10 | | | | 3.36 | (4) | | | Various | | | 25 | |
| Operational Capacity Rooftop | | 2013- Q1 2020 | | | 86 | | | | 86 | | | | Various | | | | Various | | | 25 | |
| Total Operational Capacity | | | | | 3,041 | | | | 3,957 | | | | | | | | | | | | |
| Under Construction / Contracted/ Awarded | | | | | | | | | | | | | | | | | | | |
| Manufacturing Linked Project 1 | | | | | 300 | | (7) | | | | | | 2.54 | | | | Solar Energy Corporation of India Limited | | | 25 | |
| Manufacturing Linked Project 1 | | | | | 667 | | (7) | | | | | | 2.42 | | | | Solar Energy Corporation of India Limited | | | 25 | |
| SECI Hybrid | | | | | 150 | | (9) | | | | | | 2.35 | | | | Solar Energy Corporation of India Limited | | | 25 | |
| SECI WIND | | | | | 120 | | (9) | | | | | | 2.70 | | | | Solar Energy Corporation of India Limited | | | 25 | |
| Total Contracted & Awarded Capacity – Utility | | | 1,237 | | | | | | | | | | | | | | | | |
| Total Portfolio* | | | | | 4,278 | | ## | | | | | | | | | | | | | | |
Expected volatility —
Notes:
| (1) | Refers to the applicable quarter of the calendar year in which commercial operations commenced or are scheduled to commence based on AC capacity. |
| (2) | Current tariff, subject to escalation. Please also see “—Tariff Structure” |
| (3) | Projects are supported by VGF, in addition to the tariff. Please also see “—VGF for projects” |
| (4) | Levelized tariff; includes capital incentive. |
| (5) | Projects under accelerated depreciation per the Indian Income tax regulation. |
| (6) | In the case of projects with more than one PPA, tariff is calculated as the weighted average of the PPAs for such project. |
| (7) | LoA received. PPA for 967 MW yet to be signed. For more information, see “Operating And Financial Review And Prospects – Projects under execution” |
| (8) | Others include projects with Hindustan Aeronautics Limited, Decathlon and other off takers. |
| (9) | PPA for 150 MW solar-wind hybrid signed on July 15, 2022 and PPA for 120 MW for wind project signed on August 31, 2022 (119 MW) and November 28, 2022 (1 MW). |
| * | In FY 2021, we entered into a sales contract with Radiance Renewables Private Limited (“Radiance”) to sell certain subsidiaries having an operating capacity of 153 MW for INR 5,350 million (US$70.5 million), subject to certain purchase price adjustments. Out of the identified rooftop portfolio of 153 MW, we already transferred 17.3 MW to Radiance, 33.2 MW will be transferred to Radiance after refinancing of the RG-II bonds and 16 MW will be transferred to Radiance post March 31, 2024. Hence, we have not considered these rooftop portfolios of 66.5 MW for reporting under its total portfolio as at year end. We and Radiance have mutually agreed to terminate the transfer in shareholding of the remaining un-transferred 86.5 MW portfolio to Radiance, and accordingly, the Purchaser will not purchase from the Sellers and the Sellers will not sell to the Purchaser the AZR Sale Shares (including any Seller Group Loans) as was agreed in the Previous MSPA and further amended under the Amended MSPA. Hence, portfolio of 86.5 MW have been considered for reporting under total portfolio as at year end. |
| ## | Adjusted as we will not continue with construction of 3,033 MWs manufacturing linked projects. See “Business, Company & Industry Overview, A. Business Overview, Project Pipeline” on page 4. |
Our PPAs typically require that certain conditions be met including, among others, that we have obtained all necessary consents and permits, financing arrangements have been made and an agreement has been entered into to provide for the transmission of power. Furthermore, the PPAs contain customary termination provisions and negative and affirmative covenants, including the provision of performance bank guarantees and minimum guarantees of power to be sold and restrictions on changing the controlling shareholder of the project subsidiaries.
Megawatts Allotted or Won at Auction
During Fiscal 2020, we won a limited trading historybid for 2,000 MW manufacturing linked project with SECI and also elected to exercise a greenshoe option for an additional 2,000 MW as per auction guidelines. During Fiscal 2020, we received a LoA for the 2,000 MW project and also received a LoA for the greenshoe option for 2,000 MW during Fiscal 2021.
During Fiscal 2022, we signed PPAs with SECI for 650 MW at a fixed tariff of INR 2.54 per kWh and for 2,333 MW at a fixed tariff of INR 2.42 per kWh respectively for supply power for 25 years, as a part of the 4,000 MW manufacturing linked projects. During Fiscal 2023, we signed a PPA with SECI for 50MW as part of the 4,000 MW manufacturing linked projects. We, however, will not continue with construction of 3,033 MWs manufacturing linked projects. For details see “Business, Company & Industry Overview, A. Business Overview, Project Pipeline” on page 4. PPAs for the balance capacity of 967 MW under the manufacturing linked projects can be signed only after SECI has the power supply agreements for these remaining MW in place and discussions with SECI are continuing in respect of such 967MW.
We executed a PPA with SECI for our equity shares, the expected volatility150 MW solar-wind hybrid project on July 15, 2022, PPA with SECI for our equity shares120 MW wind project on August 31, 2022 (for 119 MW) and on November 28, 2022 (for 1 MW). We also received a LoA on December 14, 2021 for 200 MW solar-wind hybrid project from MSEDCL, however, this project was estimatedcancelled on March 10, 2023, pursuant to withdrawal of the Group’s appeal before the Appellate Tribunal for Electricity. Appeal was filed to challenge Maharashtra Electricity Regulatory Commission’s order, that rejected the adoption of the auction discovered tariff of INR 2.62 per unit and instead gave the Group an option to reduce the tariff to INR 2.49 per unit.
For further information, see “Legal Proceedings” and “Operating and Financial Review And Prospects – Projects under execution”.
Tariff structure
The tariff for Gujarat 1.1 and Gujarat 1.2 is INR 15.0 per kWh for the first 12 years and INR 5.0 per kWh for remainder of the contract term. The tariff for Andhra Pradesh 1 is INR 5.89 per kWh for first year, increasing by taking3% each year from the average historical price volatility for companies with similar lines of business based on the price fluctuations of their shares over a period equivalentsecond year to the expected termtenth year and thereafter with the same tariff as that in year ten for the remainder of the share options granted. Companies with similar lines25-year term. All other projects have a fixed rate structure.
Viability Gap Funding (VGF) for projects
We won and implemented few projects under the erstwhile VGF scheme by MNRE. The VGF for Rajasthan 3.1 project is INR 23.0 million per MW, for Rajasthan 3.2 it is INR 22.0 million per MW, for Rajasthan 3.3 it is INR 13.0 million per MW and Rajasthan 4 it is INR 12.9 million per MW. The VGF for Andhra Pradesh 3 project is INR 7.4 million per MW. The VGF for Maharashtra 1 project is INR 0.9 million per MW. The VGF for Uttar Pradesh 3 is INR 8.0 million per MW. The VGF for Delhi 1 is INR 4.6 million per MW.
B. Results of business consist of several public companies similar in size, which are engaged in similar business sectors in India and worldwide. We have considered a three-year average to be a reasonable estimate of volatility for the purpose of valuation. The volatility is unlevered and then re-levered to adjust for our capital structure. We intend to continue to consistently apply this process using the same or similar public companies until a sufficient amount of historical information regarding the volatility of our own equity share price becomes available, or unless circumstances change such that the identified companies are no longer similar to us, in which case, more suitable companies whose share prices are publicly available would be utilized in the calculation.Operations
The following table presents the assumptions used to estimate the fair valuesection illustrates our results of options granted during the periods presented:
| | | | |
| | | Fiscal Year Ended
March 31, |
| | | 2016 | | 2017 |
Dividend yield | | 0.0% | | 0.0% |
Expected term (in years) | | 5.0-6.8 | | 4.5-7.2 |
Expected volatility | | 37.2%-41.6% | | 31.0%-41.7% |
Risk-free interest rate | | 7.60%-8.08% | | 2.15%-7.61% |
Share based compensation included in general and administrative expenses totaled INR 51.7 million and INR 12.1 million (US$0.2 million),operations for the fiscal years ended March 31, 20162021, 2022 and 2017. As of March 31, 2017, we had INR 9.0 million (US$0.1 million) of unrecognized compensation expense which will be recognized over the remaining weighted average vesting period of one year.
A. Results of Operations
Azure Power Global Limited’s functional currency is the U.S. dollar2023 and reporting currency is the Indian rupee. Solely for the convenience of the reader, we have translated the financial information for the fiscal year ended March 31, 2017. The rate used for this translation is INR 64.85 to US$1.00, which is the noon buying rate in New York City for cable transfer innon-U.S. dollar currencies as certified for customs purposes by the Federal Reserve Bank of New York as of March 31, 2017, which is the dateincludes a discussion and analysis of our last reportedperformance, financial statements. No representation is made that the Indian rupee amounts could have been, or could be, converted, realized or settled into U.S. dollars at that rate.condition and results of operations.
| | | 2021 | | | 2022 | | | 2023 | | | 2023 | |
| Consolidated Statement of Operations data: | | (INR) | | | (INR) | | | (INR) | | | (US$) (a) | |
| | | | |
| Operating revenues: | | | | | | | | | | | | |
| Revenue from customers (1) | | | 15,236 | | | | 18,341 | | | | 20,748 | | | | 252.4 | |
| Operating costs and expenses: | | | | | | | | | | | | | | | | |
| Cost of operations (exclusive of depreciation and amortization shown separately below) (2) | | | 1,261 | | | | 1,597 | | | | 1,825 | | | | 22.2 | |
| General and administrative (3) | | | 2,988 | | | | 2,067 | | | | 4,777 | | | | 58.1 | |
| Depreciation and amortization (4) | | | 3,202 | | | | 3,667 | | | | 4,024 | | | | 49.0 | |
| Impairment loss/(reversal)(5) | | | 3,255 | | | | (80 | ) | | | 1,279 | | | | 15.6 | |
| Total operating costs and expenses: | | | 10,706 | | | | 7,251 | | | | 11,905 | | | | 144.9 | |
| Operating income | | | 4,530 | | | | 11,090 | | | | 8,843 | | | | 107.5 | |
| Other expense, net: | | | | | | | | | | | | | | | | |
| Interest expense, net (6) | | | 8,410 | | | | 11,930 | | | | 8,375 | | | | 101.9 | |
| Other (income)/expenses (7) | | | 18 | | | | 3 | | | | (30 | ) | | | (0.4 | ) |
| Loss/(gain) on foreign currency exchange, net (8) | | | 7 | | | | (33 | ) | | | 157 | | | | 1.9 | |
| Total other expenses, net | | | 8,435 | | | | 11,900 | | | | 8,502 | | | | 103.4 | |
| Profit/ (Loss) before income tax | | | (3,905 | ) | | | (810 | ) | | | 341 | | | | 4.1 | |
| Income tax expense (9) | | | (296 | ) | | | (1,316 | ) | | | (2,663 | ) | | | (32.4 | ) |
| Net loss | | | (4,201 | ) | | | (2,126 | ) | | | (2,322 | ) | | | (28.3 | ) |
| Less: Net profit/ (loss) attributable to non-controlling interest | | | 5 | | | | (22 | ) | | | (37 | ) | | | (0.5 | ) |
| Net profit / (loss) attributable to APGL equity shareholders | | | (4,206 | ) | | | (2,104 | ) | | | (2,285 | ) | | | (27.8 | ) |
| Net profit / (loss) per share attributable to APGL equity stockholders | | | | | | | | | | | | | | | | |
| Basic | | | (87.66 | ) | | | (41.36 | ) | | | (35.61 | ) | | | (0.43 | ) |
| Diluted | | | (87.66 | ) | | | (41.36 | ) | | | (35.61 | ) | | | (0.43 | ) |
| Shares used in computing basic and diluted per share amounts: | | | | | | | | | | | | | | | | |
| Weighted average shares | | | | | | | | | | | | | | | | |
| Basic | | | 47,979,581 | | | | 50,876,360 | | | | 64,166,360 | | | | 64,166,360 | |
| Diluted | | | 47,979,581 | | | | 50,876,360 | | | | 64,166,360 | | | | 64,166,360 | |
| | | | | | | | | | | | | | | | |
| | | Fiscal Year Ended March 31, | |
| | | 2015 | | | 2016 | | | 2017 | | | 2017 | |
| Consolidated Statement of Operations data: | | (INR) | | | (INR) | | | (INR) | | | (US$) | |
| | | (in thousands) | |
Operating revenues: | | | | | | | | | | | | | | | | |
Sale of power | | | 1,124,138 | | | | 2,626,148 | | | | 4,182,985 | | | | 64,502 | |
| | | | |
Operating costs and expenses: | | | | | | | | | | | | | | | | |
Cost of operations (exclusive of depreciation and amortization shown separately below) | | | 79,816 | | | | 190,648 | | | | 375,787 | | | | 5,795 | |
General and administrative | | | 425,952 | | | | 672,841 | | | | 797,161 | | | | 12,292 | |
Depreciation and amortization | | | 322,430 | | | | 687,781 | | | | 1,046,565 | | | | 16,138 | |
| | | | | | | | | | | | | | | | |
Total operating costs and expenses: | | | 828,198 | | | | 1,551,270 | | | | 2,219,513 | | | | 34,225 | |
| | | | | | | | | | | | | | | | |
Operating income | | | 295,940 | | | | 1,074,878 | | | | 1,963,472 | | | | 30,277 | |
Other expense: | | | | | | | | | | | | | | | | |
Interest expense, net | | | 831,790 | | | | 2,058,836 | | | | 2,371,836 | | | | 36,574 | |
Loss (gain) on foreign currency exchange, net | | | 299,628 | | | | 343,137 | | | | (109,128 | ) | | | (1,683 | ) |
| | | | | | | | | | | | | | | | |
Total other expenses | | | 1,131,418 | | | | 2,401,973 | | | | 2,262,708 | | | | 34,891 | |
| | | | | | | | | | | | | | | | |
Loss before income tax | | | (835,478 | ) | | | (1,327,095 | ) | | | (299,236 | ) | | | (4,614 | ) |
Income tax expense | | | (253,112 | ) | | | (327,745 | ) | | | (892,333 | ) | | | (13,760 | ) |
| | | | | | | | | | | | | | | | |
Net loss | | | (1,088,590 | ) | | | (1,654,840 | ) | | | (1,191,569 | ) | | | (18,374 | ) |
| | | | | | | | | | | | | | | | |
Less: Net loss attributable to non-controlling interest | | | (5,595 | ) | | | (4,651 | ) | | | (18,924 | ) | | | (292 | ) |
| | | | | | | | | | | | | | | | |
Net loss attributable to APGL | | | (1,082,995 | ) | | | (1,650,189 | ) | | | (1,172,645 | ) | | | (18,082 | ) |
Accretion to Mezzanine CCPS | | | (755,207 | ) | | | (1,347,923 | ) | | | (235,853 | ) | | | (3,637 | ) |
Accretion to redeemable non-controlling interest | | | — | | | | (29,825 | ) | | | (44,073 | ) | | | (680 | ) |
| | | | | | | | | | | | | | | | |
Net loss attributable to APGL equity shareholders | | | (1,838,202 | ) | | | (3,027,937 | ) | | | (1,452,571 | ) | | | (22,399 | ) |
| | | | | | | | | | | | | | | | |
| | | | |
Net loss per share attributable to APGL equity stockholders | | | | | | | | | | | | | | | | |
Basic and diluted | | | (1,046 | ) | | | (1,722 | ) | | | (111 | ) | | | (1.72 | ) |
Shares used in computing basic and diluted per share amounts: | | | | | | | | | | | | | | | | |
Weighted average shares | | | 1,758,080 | | | | 1,758,080 | | | | 13,040,618 | | | | — | |
| (a) | Azure Power Global Limited’s functional currency is the U.S. dollar and reporting currency is the Indian rupee. Solely for the convenience of the reader, we have translated the financial information for Fiscal Year 2023. The rate used for this translation is INR 82.19 to US$1.00, which is the noon buying rate in New York City for cable transfer in non-U.S. dollar currencies as certified for customs purposes by the Federal Reserve Bank of New York as of March 31, 2023, which is the last available rate in the period of reported financial statements. No representation is made that the Indian rupee amounts could have been, or could be, converted, realized or settled into U.S. dollars at that rate. |
Fiscal Year Ended March 31, 20172023 Compared to Fiscal Year Ended March 31, 20162022
(1) Operating Revenue
Operating revenues during the fiscal year ended March 31, 2017Fiscal Year 2023 increased by INR 1,556.82,407 million, or 59%13.1%, to INR 4,183.020,748 million (US$64.5252.4 million) compared to fiscal year ended March 31, 2016.Fiscal Year 2022. The principal reasons for the increase in revenue during the fiscal year ended March 31, 2017Fiscal Year 2023 was the incremental revenue from projects that commenced operations at various dates during fiscal year 2016.Fiscal Year 2022 and Fiscal Year 2023. These include Andhra PradeshRajasthan 6, Assam 1, Punjab 3Rajasthan 8 and Karnataka 2Rajasthan 9 solar power projects, part of which commenced operationsoperation during the fourth quarter of fiscal year 2016FY 2022 and contributed incremental operating revenue of INR 480.31,048 million, 148 million, INR 250.71,366 million and
INR 112.1634 million, respectively. Rajasthan 4 project, which commenced operationsrespectively, in the third quarterFiscal
Year 2023. Further, above increase in revenue has been offset by INR 716 million on account of fiscal year 2016 and contributed incremental operating revenuedecrease in sale of INR 35.8 million, the Rajasthan 3 and Chhattisgarh 1 solar power projects, which commenced operations in the first quarter of fiscal year 2016, and contributed incremental operating revenue of INR 189.6 million and 95.2 million, respectively. In addition, incremental revenue from projects that commenced operations in fiscal year 2017 include, Punjab Rooftop 2 project which commenced operations in the first quarter of fiscal year 2017 and contributed incremental operating revenue of INR 68.8 million, Bihar 1 project which commenced operations in the second quarter of fiscal year 2017 and contributed incremental operating revenue of INR 68.5 million and the Punjab 4 project which commenced operations in the third quarter of fiscal year 2017 and contributed incremental operating revenue of INR 262.4 million.carbon credits as compared to previous year.
(2) Cost of Operations (Exclusive of Depreciation and Amortization)
Cost of operations during the fiscal year ended March 31, 2017Fiscal Year 2023 increased by INR 185.1228 million, or 97%14.3%, to INR 375.81,825 million (US$5.822.2 million), compared to Fiscal Year 2022, and remained consistent at 8% - 9% of revenue recognized during the fiscal year ended March 31, 2016. respective periods in both years.
The net increase was primarily due to an increase in plant maintenance cost related to newly operational projects by INR 141.9 million and an increase in leasehold rent of INR 36.8 million primarily resulting from increased leased land in connection with ourpartial commissioned projects during the fiscal year ended March 31, 2017.Fiscal Year 2022.
(3) General and Administrative Expenses
General and administrative expenses during the fiscal year ended March 31, 2017Fiscal Year 2023, increased by INR 124.32,710 million, or 18%131.1%, to INR 797.24,777 million (US$12.358.1 million) compared to the fiscal year ended March 31, 2016. ThisFiscal Year 2022. The increase was primarily due to increased travelhigher legal and business development expenses for new solar power projects ofprofessional cost primarily related to Whistle blower investigations by INR 23.6582 million payroll cost of INR 52.7 million, resulting from new hiring and an(US$7.1 million), increase of INR 48.01,768 million primarily resulting from office rent(US$21.5 million) in relation to provision for bank guarantees of projects having portfolio of 3,033 MWs, higher insurance expense by INR 161 million (US$2.0 million) for insurance policies taken for directors and officers, increase of INR 611 million (US$7.4 million) under routine expenses of SPVs related infrastructure coststo manufacturing linked projects and projects fully operationalised in current year. Above increase has been offset by INR 273 million (US$3.3 million) on account of reversal of SAR expense on account of management transition, decrease by INR 548 million due to liquidation charges incurred during previous year on account of termination of joint venture agreement with M/s Waaree Energies Limited and decrease by INR 253 million for adjustment (decapitalisation) made in books of account during previous year as the scaleimpact of our business has expanded.Whistle blower based on certain benchmarking reports.
(4) Depreciation and Amortization
Depreciation and amortization expenses during the fiscal year ended March 31, 2017Fiscal Year 2023 increased by INR 358.8357 million, or 52%9.7%, to INR 1,046.64,024 million (US$16.149.0 million) compared to the fiscal year ended March 31, 2016.Fiscal Year 2022. The principal reason for the increase in depreciation was the full year effect of projects that commenced operations on various datescommissioned during fiscal year 2016. These projects include Punjab 3, Karnataka 2 and Andhra Pradesh 1 solar power projects, which commenced operation in the fourth quarter of fiscal year 2016 and resulted in additional depreciationFiscal Year 2022, primarily Rajasthan 8 project.
(5) Impairment loss/(reversal)
We recognized an impairment loss of INR 48.31,279 million INR 23.7 million and INR 117.5 million, respectively, Rajasthan 4 solar power project, which commenced operation in(US$15.6 million) during the third quarter of fiscal year 2016 and resulted in additional depreciationended March 31, 2023, primarily due to impairment expense of INR 7.7533 million Chhattisgarh 1 solar power project, which commenced operation in phases in the first(US$6.5 million) on account of fair valuation of 86.5 MW rooftop portfolio and second quarters of fiscal year 2016 and resulted in additional depreciationimpairment expense of INR 18.0695 million and Rajasthan 3 solar power project, which commenced operation in the first quarter(US$8.5 million) related to SPVs having portfolio of fiscal year 2016 and resulted in additional depreciation of INR 19.7 million.3,033 MWs (related to manufacturing linked tender).
In addition, we recorded depreciation and amortization expenses for projects that commenced operations during fiscal year end 2017. The projects include Punjab rooftop 2 solar power project, which commenced operation in the first quarter of fiscal year 2017 and resulted in additional depreciation of INR 20.6 million, Bihar 1 solar power project, which commenced operation in the second quarter of fiscal year 2017 and resulted in additional depreciation of INR 16.7 million and Punjab 4 solar power project, which commenced operation in the third quarter of fiscal year 2017 and resulted in additional depreciation of INR 67.0 million.
(6) Interest Expense, Net
Net interest expense during the fiscal year ended March 31, 2017 increasedFiscal Year 2023 decreased by INR 313.03,555 million, or 15%29.8%, to INR 2,371.88,375 million (US$36.6101.9 million) compared to Fiscal Year 2022. The decrease of INR 1,192 million (US$14.5 million) is primarily due to non-recurring charges for refinancing of 5.5% Solar Green bonds and other project loans during previous year, decrease of INR 1,169 million is on account of loss on cancellation of hedged instruments booked in previous year, decrease by INR 407 million (US$5.0 million) primarily due to increase in interest income on term deposit during the current fiscal year ended March 31, 2016.
Interest expenseand INR 730 million (US$ 8.9 million) decrease due to loans repaid during the previous year. Above increase has been offset by INR 196 million (US$2.4 million) for penalty interest incurred during the current fiscal year ended March 31, 2017 increased by INR 438.2 million, or 19%,and balance amount due to INR 2,764.0 million (US$42.6 million). Interest expense increased primarily as a result of interest expenses of INR 891.7 million on borrowings for the Punjab 3, Andhra Pradesh 1, Karnataka 2, Punjab rooftop 2, Bihar 1 and Punjab 4 solar power projects operating during the fiscal year ended March 31, 2017. This was offset by a reductionincrease in interest expense on compulsorily convertible instrumentsunder projects commissioned during the Fiscal year 2022 and 2023.
(7) Other Expense/ (income)
Other income during Fiscal Year 2023 Increased by INR 33 million to income of INR 507.630 million which converted to shares simultaneous to our initial public offering.
Interest income during the fiscal year ended March 31, 2017 increased by INR 125.2 million or 47%, to INR 392.2 million (US$6.00.4 million) as compared to the fiscal year ended March 31, 2016 primarily as a result of an increase in income on term deposits placed during the periodother expense of INR 98.33 million and increase in gain on sale of short term investments by INR 26.7 million.during Fiscal Year 2022.
Loss (Gain)
(8) Gain/(loss) on Foreign Currency Exchange
Foreign
The foreign exchange loss during the fiscal year ended March 31, 2017 improvedFiscal Year 2023 increased by INR 452.3190 million to a gain of INR 109.1157 million (US$1.71.9 million) as compared to the fiscal year ended March 31, 2016. The closing exchange rate of Indian rupees appreciated against the U.S. dollar from INR 66.25 to US$1.00 as of March 31, 2016 to INR 64.85 to US$1.00 as of March 31, 2017. This appreciation of the Indian rupee resulted in an improvement in unrealized and realized foreign exchange gains of INR 465.2 million and INR 25.8 million, on our foreign currency denominated debt and a decrease in unrealized and realized foreign exchange gain of INR 50.8 million and INR 49.5 million, on our derivative instruments, for the fiscal years ended March 31, 2016 and 2017, respectively. There was an additional gain on foreignforex currency exchange of INR 61.533 million during the fiscal year ended March 31, 2017 on account of a reinstatement of amount payable to vendors.Fiscal Year 2022.
(9) Income Tax Expense
Income tax expense increased during the fiscal year ended March 31, 2017Fiscal Year 2023 by INR 564.61,347 million to an income tax expense of INR 892.32,663 million (US$13.832.4 million), compared to Fiscal Year 2022, the fiscal year ended March 31, 2016.
For the fiscal year ended March 31, 2017, the statutory income tax rate as per the Income Tax Act, 1961 is 34.61%. The current income tax liability for the fiscal year ended March 31, 2017 was INR 509.0 million from INR 28.7 million for the fiscal year ended March 31, 2016. The increase in the effective income tax in the fiscal year ended March 31, 2017 was a resultdetails of higher taxable profits generated by AZI in the current period. which are summarized below.
| | | Year ended March 31, (in millions) | |
| | | 2021 | | | 2022 | | | 2023 | | | 2023 | |
| | | INR | | | INR | | | INR | | | US$ | |
| Current tax expense | | | 242 | | | | 485 | | | | 707 | | | | 8.6 | * |
| Withholding Tax on interest on restricted group debt | | | 384 | | | | 367 | | | | 342 | | | | 4.2 | |
| Deferred income tax (benefit)/expense | | | (330 | ) | | | 464 | | | | 1,614 | | | | 19.6 | |
| Total | | | 296 | | | | 1,316 | | | | 2,663 | | | | 32.4 | |
| * | Current tax on profit before tax. Current tax includes reversal of INR 78 million (US$1.0 million) for tax adjustment relating to earlier years. |
We pay taxes on taxable profits at the individual entity level, in accordance with the tax rates in the relevant jurisdictions. While at the consolidated level, we have never been profitable, AZI andremain unprofitable, certain Indian andnon-Indian subsidiaries at the individual entity level have previously generated taxable profits. These taxable profits result from services provided by these entities to other subsidiaries and are taxed at the applicable tax rates in the jurisdiction of the entity providing the services. These inter-company transactions and profits are eliminated during consolidation, while the related income tax expense is not eliminated. We started recording deferred tax asset on the intra-entity transfer of assets pursuant to ASU 2016-16, from April 1, 2017. Subsequent thereto, there was a decrease in tax expense, which is primarily attributable to adoption of a new accounting standard on “intra-entity transfer of assets”, resulting in recognition of deferred tax asset on the income taxes paid on the intra entity transfer of assets to the extent these are expected to be realized by the subsidiary outside of the tax holiday period. Furthermore, a portion of our Indian operations qualifies for a tax holiday related to their operating income attributable to undertakings, as defined, in operating solar power plants undersection 80-IA of the Indian Income Tax Act, 1961. This holiday is available for a period of ten consecutive years out of 15 years beginning from the year in which the undertaking first generates power (referred to as the tax holiday period),; however, the exemption is available only to the projects completed on or before March 31, 2017. We anticipate that we will claim the aforesaid deduction in the last ten years out of 15 years beginning with the year in which we generate power and when we have taxable income. Accordingly, our current operations are taxable at the normally applicable tax rates. Due to the tax holiday period, a substantial portion of the temporary differences between the book and tax basis of our assets and liabilities do not have any tax consequences as they are expected to reverse within the tax holiday period.
The increase in ourtotal income tax expense for Fiscal Year 2023 was largely attributableINR 2,663 million, which increased by INR 1,347 million compared to Fiscal Year 2022.
The current tax expense (other than impact of tax adjustment relating to earlier years) for Fiscal Year 2023 increased by INR 343 million compared to Fiscal Year 2022 primarily on account of (i) increase in the taxable income of the entities that are outside Tax holiday period; (ii) increase in the book profits generatedunder various SPVs resulting increase in Minimum Alternate Tax; and (iii) increase in the Other Income (primarily interest income) of entities utilizing the 80-IA exemption, as the benefit of the tax holiday period is not available for such other income items.
The withholding tax on interest on restricted group debt relates to the tax on intercompany interest on Solar Green Bond entities for which the tax credit is not available under Mauritius tax laws. The withholding tax amount for Fiscal Year 2023, has decreased by AZI. DuringINR 25 million compared to Fiscal Year 2022 primarily due to refinancing the fiscal5.5% Solar Green bonds during the year ended March 31, 2017,2022.
During Fiscal Year 2023, we recorded a Indian deferred tax expense of INR 383.21,614 million whereas for the fiscal year ended March 31, 2016, we recorded a Indian(after considering valuation allowance primarily relating to unabsorbed depreciation and business losses of entities availing 80-IA exemption), as against deferred tax expense of INR 299.1 million. The
primary reason464 million for the change in the level of domestic deferred tax asset was due to higher temporary differences reversing in the tax holiday period.Fiscal Year 2022.
Our tax expenses are further described in Note 11 — 13—Income Taxes to our consolidated financial statements included in this annual report.
Fiscal Year Ended March 31, 20162022 Compared to Fiscal Year Ended March 31, 20152021
Operating Revenue
Operating revenues during the year ended March 31, 2016Fiscal Year 2022 increased by INR 1,502.03,105 million, or 134%20.4%, to INR 2,626.118,341 million (US$40.5241.7 million) compared to the same period in 2015.Fiscal Year 2021. The principal reasons for the increase in revenue during the year ended March 31, 2016Fiscal Year 2022 was the operation of the Uttar Pradesh 1, Punjab 2incremental revenue from projects that commenced operations at various dates during Fiscal Year 2021 and KarnatakaFiscal Year 2022. These include Rajasthan 6 and Assam 1 solar power projects, part of which commenced operations in the fourth quarter of fiscal year 2015operation during FY 2021 and contributed incremental operating revenue of INR 103.4 million, INR 223.12,223 million, and INR 87.6207 million, respectively, the operation of thein Fiscal Year 2022. In addition, Rajasthan 3.1, 3.2,8 and 3.3 solar powerRajasthan 9 projects and Chhattisgarh 1 project, which commenced their operations in the first quarter of fiscal year 2016,during FY 2022 and contributed incremental operating revenue of INR 158.8 million, INR 325.9296 million and INR 337.1 million and 200.153 million respectively. In addition, Rajasthan 4 project commenced operations in the third quarter of fiscal year 2016 and contributed incremental operatingFurther, there was an additional revenue of INR 14.9617 million from sale of carbon credits, which is partially offset by decrease in revenue from existing projects, due to lower insolation and the Punjab 3 project commenced operations in the fourth quarter of fiscal year 2016 and contributed incremental operating revenue of INR 59.7 million.other matters.
Cost of Operations (Exclusive of Depreciation and Amortization)
Cost of operations during the year ended March 31, 2016Fiscal Year 2022 increased by INR 110.8336 million, or 139%26.6%, to INR 190.61,597 million (US$2.921.0 million), compared to Fiscal Year 2021, and remained consistent at 8% - 9% of revenue recognized during the same periodrespective periods in 2015. both years.
The net increase was primarily due to an increase in plant maintenance cost related to newly operational projects by INR 92.4 million and an increase in leasehold rent of INR 18.4 million primarily resulting from increased leased land in connection with ourpartial commissioned projects during the year ended March 31, 2016.Fiscal Year 2021.
General and Administrative Expenses
General and administrative expenses during theFiscal Year 2022, decreased by INR 921 million, or 30.8%, to INR 2,067 million (US$27.2 million) compared to Fiscal Year 2021. The decrease was primarily due to reversal of SAR expense of INR 373 million (US$4.9 million) on account of management transition compared to an expense of INR 1,319 million in year ended March 31, 2016 increased2021, partially offset by INR 246.9 million, or 58%, to INR 672.8 million (US$10.4 million) compared to the same periodincrease in 2015. This was primarilyexpense due to increased professional expensesliquidation charges of INR 86.8548 million which related(US$7.2 million) on account of termination of joint venture agreement with M/s Waaree Energies Limited (also refer to professional fees paidNote 10 “Investment” in our consolidated financial statements for raising capital, travel and business development expenses for new solar power projectsdetails). Further, an adjustment (decapitalisation) aggregating INR 253 million (US$3.3 million) has been made in books of INR 22.3 million, payroll costaccount as impact of INR 91.7 million, which primarily resulted from new hiring and modification of the stock option plan, increased overheads of INR 13.4 million which primarily resulted from office rent and related infrastructure costs as the scale of our business has expanded and an incremental provision for doubtful debt of INR 32.7 million created in this period.Whistle blower based on certain benchmarking reports.
Depreciation and Amortization
Depreciation and amortization expenses during the year ended March 31, 2016Fiscal Year 2022 increased by INR 365.4465 million, or 113%14.5%, to INR 687.83,667 million (US$10.648.3 million) compared to the same period in 2015.Fiscal Year 2021. The principal reason for the increase in depreciation was the capitalizationfull year effect of projects commissioned during Fiscal Year 2021, primarily the Punjab 2.1, 2.2 and 2.3 projects, which commenced operation in phases from September 2014 through October 2014 and accounted for additionalRajasthan 6 project contributing an incremental depreciation expense of INR 38.6441 million Uttar Pradesh 1in current year. Further, there was incremental depreciation on projects commissioned during Fiscal Year 2022, which included Rajasthan 8 and Karnataka 1 projects, which commenced operation in January 2015Rajasthan 9, amounting to INR 87 million and accounted for additional depreciationINR 11 million respectively.
Impairment loss
We recognized a reversal of impairment loss of INR 37.080 million Rajasthan 3.1, 3.2 and 3.3 solar power projects, which commenced operation in phases from April 2015 through May 2015 and resulted in additional depreciation of INR 224.6 million, Chhattisgarh (US$1.1 1.2 and 1.3 solar power projects, which commenced operation in phases from May 2015 through August 2015 and resulted in additional depreciation of
INR 47.1 million, Rajasthan 4 solar power project, which commenced operation in November 2015 and resulted in additional depreciation of INR 4.6 million and Punjab 3 solar power project, which commenced operation in the fourth quarter of fiscal year 2016 and resulted in additional depreciation of INR 11.5 million.
Interest Expense, Net
Net interest expensemillion) during the year ended March 31, 20162022, primarily due to 86.5 MW rooftop portfolio re-classified from asset held for sale to respective balance sheet captions in the consolidated balance sheet as at March 31, 2022.
Interest Expense, Net
Net interest expense during Fiscal Year 2022 increased by INR 1,227.03,520 million, or 148%41.9%, to INR 2,058.811,930 million (US$31.7157.2 million) compared to Fiscal Year 2021. The increase of INR 1,192 million (US$15.7 million) is primarily due to non-recurring charges for refinancing of the same period in 2015. Interest expense during the5.5% Solar Green bonds and other project loans and increase of INR 1,206 million (US$15.9 million) is on borrowings related to projects commissioned after year ended March 31, 2016 increased2021. Further, increase of INR 1,169 million (US$15.4 million) is on account of loss on cancellation of hedged instruments.
Other Expenses/(Income)
Other expenses during Fiscal Year 2022 decreased by INR 1,326.115 million or 133%, to INR 2,325.83 million (US$35.90.0 million). Interest expense increased primarily as a result of interest expenses of INR 938.2 million on borrowings for the Punjab 2, Uttar Pradesh 1 and Karnataka 1 solar power projects operating during the year ended March 31, 2016 and Rajasthan 3 and Chhattisgarh 1 solar power project operating in phases starting from April 2015 and INR 326.5 million due to the change in the fair value of our compulsorily convertible instruments and our Series E and G compulsorily convertible preferred shares being classified as liability.
Interest income during the year ended March 31, 2016 increased by INR 99.1 million or 59%, to INR 266.9 million (US$4.1 million) compared to the same period in 2015 primarily as a result of an increase in income on term deposits placed during the period of INR 69.7 million and increase in gain on sale of short term investments by INR 31.4 million.Fiscal Year 2021.
Loss on Foreign Currency Exchange
Foreign
The foreign exchange lossgain during the year ended March 31, 2016Fiscal Year 2022 increased by INR 43.540 million to INR 343.133 million (US$5.30.4 million) compared to the same period in 2015.FY 2021.
The closing exchange rate of Indian rupees depreciated against the U.S. dollar from INR 62.31 to US$1.00 as of March 31, 2015 to INR 66.25 to US$1.00 as of March 31, 2016. This depreciation of the Indian rupee resulted in an increase in unrealized foreign exchange losses of INR 97.6 million on our foreign currency denominated debt and an increase in unrealized foreign exchange loss of INR 3.7 million on our derivative instruments. These foreign exchange losses were partially offset by an increase in realized gains of INR 38.3 million on our foreign currency denominated debt and an increase in realized gains of INR 19.6 million on our foreign currency option contracts.
Income Tax ExpenseExpense/(Benefit)
Income tax expense increased during Fiscal Year 2022 by INR 1,020 million to an income tax expense of INR 1,316 million (US$17.3 million) compared to Fiscal Year 2021, the details of which are summarized below.
| | | Year ended March 31, (in millions) | |
| | | 2020 | | | 2021 | | | 2022 | | | 2022 | |
| | | INR | | | INR | | | INR | | | US$ | |
| Current tax expense | | | 120 | | | | 242 | | | | 485 | | | | 6.4 | * |
| Withholding Tax on interest on restricted group debt | | | 258 | | | | 384 | | | | 367 | | | | 4.8 | |
| Deferred income tax (benefit)/expense | | | 111 | | | | (330 | ) | | | 464 | | | | 6.1 | |
| Total | | | 489 | | | | 296 | | | | 1,316 | | | | 17.3 | |
| * | Current tax on profit before tax. |
Current tax includes INR 42 million (US$0.6 million) for tax adjustment relating to earlier years.
The current tax expense (other than impact of tax adjustment relating to earlier years) for Fiscal Year 2022 increased by INR 201 million compared to Fiscal Year 2021 primarily on account of (i) increase in the taxable income of the entities that are outside Tax holiday period; (ii) increase in the book profits under various SPVs resulting increase in Minimum Alternate Tax; and (iii) increase in the Other Income (primarily interest income) of entities utilizing the 80-IA exemption, as the benefit of the tax holiday period is not available for such other income items.
The withholding tax on interest on restricted group debt relates to the tax on intercompany interest on Solar Green Bond entities for which the tax credit is not available under Mauritius tax laws. The withholding tax amount for FY 2022, has decreased by INR 17 million compared to Fiscal Year 2021 primarily due to refinancing of 5.5% Solar Green bonds during the previous year ended March 31, 2016 by INR 74.6 million to INR 327.7 million (US$5.1 million), compared to the same period in 2015.2022.
Our effective income tax rate for the year ended March 31, 2016 was 24.7% as compared to 30.3% for the same period in 2015. The decrease in the effective income tax rate in the year ended March 31, 2016 was a result of lower taxable profits generated by AZI in the current period which provides certain engineering, procurement and construction services to its Indian subsidiaries.
The change in our income tax expense was largely attributable to an increase in our deferred tax expense. During the year ended March 31, 2016,Fiscal Year 2022, we recorded a Indian deferred tax expense of INR 299.1464 million (after considering valuation allowance primarily relating to unabsorbed depreciation and business losses of entities availing 80-IA exemption), whereas for the year ended March 31, 2015,Fiscal Year 2021, we recorded a Indian deferred tax expensebenefit of INR 61.1330 million. The primary reason for
Our tax expenses are further described in Note 13—Income Taxes to our consolidated financial statements included in this annual report.
Trend Information
Other than as disclosed elsewhere in this annual report, we are not aware of any trends, uncertainties, demands, commitments or events since March 31, 2023, that are reasonably likely to have a material adverse effect on our net revenues, income, profitability, liquidity or capital resources, or that caused the change in the leveldisclosed financial information to be not necessarily indicative of domestic deferred tax asset was due to higher temporary differences reversing in the tax holiday period.future operating results or financial conditions.
B.
C. Liquidity and Capital Resources
Our holding company does
We currently do not generate adequate cash from operations in order to fund its expenses.corporate expenses and to finance our growth. Our subsidiaries provide various support services to other group subsidiaries and charge amounts in the form of management fees for the services provided. Restrictions on the ability of our subsidiaries to pay us cash dividends as a result of certain regulatory and contractual restrictions
may make it impracticable to use such dividends as a means of funding the expenses of Azure Power Global Limited. For a further discussion onof our ability to issue and receive dividends, see “Item 8. “Financial Information — A. Consolidated Statements and Other Financial Information””.
Our principal liquidity requirements are to finance current operations, service our debt and support our growth in India. We willplan to continue to use capital in the future to finance the construction of solarrenewable power plants. Historically, our operations largely relied on equity and project-level long term borrowings, proceeds from issuance of compulsorily convertible preferred shares and compulsorily convertible debentures, and internally generated cash flows to meet capital expenditure requirements. As a normal part of our business and depending on market conditions, we will from time to time consider opportunities to repay, redeem, repurchase or refinance our indebtedness. Changes in our operating plans, lower than anticipated electricity sales, increased expenses or other events may cause us to seek additional debt or financing in future periods. There can be no guarantee that financing will be available on acceptable terms or at all. Debt financing, if available, could impose additional cash payment obligations, additional covenants and operating restrictions. Future financings could result in the dilution of our existing shareholding. In addition, any of the items discussed in detail under “Risk Factors” elsewhere in this annual report may also significantly impact our liquidity.
Liquidity Position
As of March 31, 2017,2023, our liquid assets totaledtotalled INR 8,757.512,724 million (US$135.0154.7 million), which was comprised of cash and current investments availablecash equivalents. In addition, we have INR 7,764 million (US$94.5 million) of short-term restricted cash as of March 31, 2023 that generally gets utilized for sale securities.capital expenditures. As of March 31, 2017,2023, we carried cash and short term investmentscash equivalent of INR 8,508.712,479 million (US$131.2151.8 million) held by our foreign subsidiaries, which are not readily available to Azure Power Global Limited.
We also have commitments from financial institutions that we can draw upon in the future upon the achievement of specific funding criteria. As of March 31, 2017,2023, we have such undrawn commitments excluding rooftop projects amounting to INR 16,227.93,820 million (US$250.246.5 million) under project-level financing arrangements, all which have a floating interest rate:arrangements.
We have a term loan from IDBI Bank for the Bihar 1 project for an aggregate principal amount of INR 514.5 million (US$7.9 million) of which INR 51.5 million (US$0.8 million) was undrawn as of March 31, 2017. This loan bears interest at 12.00% and is secured by movable and immovable assets of the project. The term of this loan is 15 years. Cash distribution from the project can be made after meeting the project expenses and debt service requirements.
We have a term loan from Indian Renewable Energy Development Agency Ltd. for the Punjab Rooftop 2 project for an aggregate principal amount of INR 449.5 million (US$6.9 million), of which INR 74.5 million (US$1.1 million) was undrawn as of March 31, 2017. This loan bears interest at 10.75% and is secured by movable and immovable assets of the project. The term of this loan is 10 years. Cash distribution from the project can be made after meeting the project expenses and debt service requirements.
We have a term loan from Infrastructure Leasing & Financial Services (IL&FS) for the Andhra Pradesh 2 project for an aggregate principal amount of INR 3,730.0 million (US$57.5 million) of which INR 2,230.0 million (US$34.4 million) was undrawn as of March 31, 2017. This loan bears interest at 12.00% and is secured by movable and immovable assets of the project. The term of this loan is 14 years. Cash distribution from the project can be made after meeting the project expenses and debt service requirements.
We have a term loan from IDBI Bank for the Andhra Pradesh 2 project for an aggregate principal amount of INR 2,000.0 million (US$30.8 million) of which INR 1,200.0 million (US$18.5 million) was undrawn as of March 31, 2017. This loan bears interest at 10.75% and is secured by movable and immovable assets of the project. The term of this loan is 19 years. Cash distribution from the project can be made after meeting the project expenses and debt service requirements.
We have a term loan from Indian Renewable Energy Development Agency Ltd. for the Rajasthan 4 project for an aggregate principal amount of INR 256.6 million (US$4.0 million), of which INR 6.6 million (US$0.1 million) was undrawn as of March 31, 2017. This loan bears interest at 11.40% and is secured by movable and immovable assets of the project. The term of this loan is 13.5 years. Cash distribution from the project can be made after meeting the project expenses and debt service requirements.
We have a term loan from International Finance Corporation for the Karnataka 3 project for an aggregate principal amount of INR 1,993.0 million (US$30.7 million), of which INR 1,133.4 million (US$17.5 million) was undrawn as of March 31, 2017. This loan bears interest at 11.42% and is secured by movable and immovable assets of the project. The term of this loan is 15 years. Cash distribution from the project can be made after meeting the project expenses and debt service requirements.
We have a term loan from Rural Electrification Corporation for the Karnataka 3 projects for an aggregate principal amount of INR 1,993.0 million (US$30.7 million), of which INR 1,222.6 million (US$18.9 million) was undrawn as of March 31, 2017. This loan bears interest at 10.35% and is secured by movable and immovable assets of the project. The term of this loan is 15 years. Cash distribution from the projects can be made after meeting the project expenses and debt service requirements.
We have a term loan from India Infrastructure Finance Company Limited for the Karnataka 3 projects for an aggregate principal amount of INR 1,540.0 million (US$23.7 million), of which INR 946.8 million (US$14.6 million) was undrawn as of March 31, 2017. This loan bears interest at 10.35% and is secured by movable and immovable assets of the project. The term of this loan is 15 years. Cash distribution from the projects can be made after meeting the project expenses and debt service requirements.
We have a term loan from PTC India Financial Services Limited for the Karnataka 3 projects for an aggregate principal amount of INR 1,000.0 million (US$15.4 million), of which INR 614.4 million (US$9.5 million) was undrawn as of March 31, 2017. This loan bears interest at 11.75% and is secured by movable and immovable assets of the project. The term of this loan is 17 years. Cash distribution from the projects can be made after meeting the project expenses and debt service requirements.
We have a term loan from PTC India Financial Services Limited for the Uttar Pradesh 2 project for an aggregate principal amount of INR 2,300.0 million (US$35.5 million), of which INR 1,475.0 million (US$22.7 million) was undrawn as of March 31, 2017. This loan bears interest at 11.00% and is secured by movable and immovable assets of the project. The term of this loan is 18 years. Cash distribution from the projects can be made after meeting the project expenses and debt service requirements.
We have a term loan from PTC India Financial Services Limited for the Andhra Pradesh 3 project for an aggregate principal amount of INR 2,100.0 million (US$32.4 million), which was undrawn as of March 31, 2017. This loan bears interest at 11.25% and is secured by movable and immovable assets of the project. The term of this loan is 18 years. Cash distribution from the projects can be made after meeting the project expenses and debt service requirements.
We have a term loan from IndusInd Bank for the Telangana 1 project for an aggregate principal amount of INR 4,610.0 million (US$71.1 million), of which INR 3,610.0 million (US$55.7 million) was undrawn as of March 31, 2017. This loan bears interest at 10.90% and is secured by movable and immovable assets of the project. The term of this loan is 20 years. Cash distribution from the projects can be made after meeting the project expenses and debt service requirements.
We have a term loan from IndusInd Bank for the Delhi Rooftop 4 project for an aggregate principal amount of INR 558.0 million (US$8.6 million), of which INR 296.6 million (US$4.6 million) was undrawn as of March 31, 2017. This loan bears interest at 11.20% and is secured by movable and immovable assets of the project. The term of this loan is 15 years. Cash distribution from the projects can be made after meeting the project expenses and debt service requirements.
We have a term loan from PTC India Financial Services Limited for the Maharashtra 1 project for an aggregate principal amount of INR 375.0 million (US$5.8 million), of which INR 18.8 million (US$0.3 million) was undrawn as of March 31, 2017. This loan bears interest at 11.25% and is secured by movable and immovable assets of the project. The term of this loan is 16 years. Cash distribution from the projects can be made after meeting the project expenses and debt service requirements.
We have a term loan from Overseas Private Investment Corporation for rooftop projects for an aggregate principal amount of INR 1,296.8 million (US$20.0 million), of which INR 1,247.7 million (US$19.2 million) was undrawn as of March 31, 2017. This loan bears interest at 4.42% and is secured by movable and immovable assets of the project. The term of this loan is 15 years. Cash distribution from the projects can be made after meeting the project expenses and debt service requirements.
Generally, under the terms of the loan agreements entered into by our project subsidiaries, the project subsidiaries are restricted from paying dividends to AZI if they default in payment of their principal, interest and other amounts due to the lenders under their respective loan agreements. Certain of AZI’s project subsidiaries also may not pay dividends to AZI out of restricted cash.
We are subject to business and operational risks that could adversely affect our cash flows. A material decrease in our cash flows would likely produce a corresponding adverse effect on our borrowing capacity.
Sources of Liquidity
Our ability to meet our debt service obligations and other capital requirements will depend on our future operating performance which, in turn, will be subject to general economic, financial, business, competitive, legislative, regulatory and other conditions, many of which are beyond our control. Our financing arrangements as of March 31, 2017 consist2023 consisted of projectproject- level financing arrangements and other borrowings.
Compulsorily Convertible Preferred Shares
Through December 31, 2016, we had raised funds totalling INR 9,381.3 million (US$144.7 million), net of related costs, through the issuance of Series A to Series I compulsorily convertible preferred shares. Series A to Series D, Series F, Series H and Series I compulsorily convertible preferred shares had been classified in temporary equity in our consolidated balance sheet because these preference shareholders had a right to convert their shares into a fixed number of equity shares. Series E and Series G compulsorily convertible preferred shares had been classified as a liability because Series E and Series G preference shareholders have a right to convert their shares into a variable number of equity shares to give them their required returns.
All series of the compulsorily convertible preferred shares were convertible into equity shares either on the respective maturity date or on the occurrence of specific events based on the terms of respective agreements. In addition, the Series A to D, Series F, Series H and Series I compulsorily convertible preference shareholders had a right to convert into equity shares at any point from the date of the respective issuance. Pursuant to the initial public offering, Series A to D, Series F, Series H and Series I compulsorily convertible preference shareholders were converted into equity shares and were issued 14,635,882 equity shares and the Series E and Series G compulsorily convertible preference shareholders were issued 1,286,598 equity shares. The Compulsorily Convertible Preferred Shares were classified as Mezzanine CCPS in accordance with ASC Topic 480 and ASC Topic 815.
The Mezzanine CCPS were accreted to their buyback value through February 26, 2016, so that the carrying amount will equal the mandatory redemption at each date. Subsequently, we entered into an agreement to extend the buyback date to December 31, 2016, without increasing the buyback value for the Mezzanine CCPS. For Series H and Series I compulsorily convertible preferred shares, redemption value increased by 8% per annum and accretion has been undertaken until October 12, 2016.
The Series E and Series G compulsorily convertible preferred shares were classified as a current liability, as of March 31, 2016, of INR 1,542.0 million (US$23.8 million), as these instruments had a redemption date of December 31, 2016.
Compulsorily Convertible Debentures
The Company had raised funds through the issuance of compulsorily convertible debentures at coupon rates ranging from 0% to 10% and maturing on various dates from December 2030 to June 2034. Until the date of the initial public offering in October 2016, the Company had raised funds totalling INR 1,182.0 million (US$18.2 million), Pursuant to our initial offering, the debenture-holders were issued 1,826,305 such number of equity shares so as to provide them a required return 18.4% per annum to 20.0% per annum.
Project-level Financing Arrangements
Our borrowings include project-specific financing arrangements collateralized by the underlying solar power plants. At March 31, 2017, these borrowings had annual interest rates ranging from 4.07% to 6.43% for foreign currency loans and from 10.50% to 12.50% for Indian rupee term loans and 13.00% for short term loans. The table below summarizes certain terms of our project-level financing arrangements as of March 31, 2017:2023:
| | | | | | | | | | | | | | | | | | |
| | | Outstanding Principal
Amount | | | Type of
Interest | | Currency | | | Maturity
Date(1) | |
Name of Project | | INR | | | US$ | | | | | | | | | |
| | | (In thousands) | | | | | | | | | |
Punjab 1 | | | 202,671 | | | | 3,125 | | | Fixed | | | US$ | | | | 2024 | |
Punjab 2 | | | 1,696,500 | | | | 26,160 | | | Floating | | | INR | | | | 2030 | |
Gujarat 1 | | | 1,122,926 | | | | 17,316 | | | Fixed | | | US$ | | | | 2025 | |
Gujarat rooftop | | | 114,417 | | | | 1,764 | | | Floating | | | INR | | | | 2028 | |
Rajasthan 1 | | | 783,162 | | | | 12,077 | | | Fixed | | | US$ | | | | 2028 | |
Rajasthan 2 | | | 3,339,329 | | | | 51,493 | | | Fixed | | | US$ | | | | 2031 | |
Uttar Pradesh 1 | | | 495,550 | | | | 7,641 | | | Floating | | | INR | | | | 2026 | |
Rooftop Projects(2) | | | 217,064 | | | | 3,347 | | | Floating | | | INR | | | | 2028 | |
Karnataka 1 | | | 543,114 | | | | 8,375 | | | Floating | | | INR | | | | 2030 | |
Rajasthan 3.1 | | | 902,132 | | | | 13,911 | | | Floating | | | INR | | | | 2028 | |
Rajasthan 3.2 | | | 1,712,099 | | | | 26,401 | | | Floating | | | INR | | | | 2030 | |
Rajasthan 3.3 | | | 1,845,640 | | | | 28,460 | | | Floating | | | INR | | | | 2028 | |
Punjab 3.1 and 3.2 | | | 1,544,800 | | | | 23,821 | | | Floating | | | INR | | | | 2030 | |
Rajasthan 4 | | | 236,252 | | | | 3,643 | | | Floating | | | INR | | | | 2028 | |
Chhattisgarh 1.1,1.2 & 1.3 | | | 1,505,260 | | | | 23,211 | | | Floating | | | INR | | | | 2029 | |
Bihar 1 | | | 448,350 | | | | 6,914 | | | Floating | | | INR | | | | 2031 | |
Karnataka 2 | | | 538,100 | | | | 8,298 | | | Floating | | | INR | | | | 2031 | |
Andhra Pradesh 1 | | | 2,562,300 | | | | 39,511 | | | Floating | | | INR | | | | 2034 | |
Punjab Rooftop 2 | | | 375,000 | | | | 5,783 | | | Floating | | | INR | | | | 2026 | |
Karnataka 3.2 | | | 1,293,472 | | | | 19,946 | | | Floating | | | INR | | | | 2031 | |
Karnataka 3.3 | | | 1,315,371 | | | | 20,283 | | | Floating | | | INR | | | | 2031 | |
Punjab 4 | | | 5,981,800 | | | | 92,241 | | | Floating | | | INR | | | | 2034 | |
Delhi Rooftop 4 | | | 261,400 | | | | 4,031 | | | Floating | | | INR | | | | 2031 | |
Maharashtra 1.1 & 1.2 | | | 356,250 | | | | 5,493 | | | Floating | | | INR | | | | 2032 | |
Uttar Pradesh 2 | | | 825,000 | | | | 12,722 | | | Floating | | | INR | | | | 2034 | |
Telangana 1 | | | 1,000,000 | | | | 15,420 | | | Floating | | | INR | | | | 2036 | |
Andhra Pradesh 2 | | | 2,300,000 | | | | 35,466 | | | Floating | | | INR | | | | 2036 | |
Andhra Pradesh 2 (Bridge Loan) | | | 2,500,000 | | | | 38,551 | | | Floating | | | INR | | | | 2018 | |
Oberoi Rooftop | | | 49,077 | | | | 757 | | | Floating | | | INR | | | | 2030 | |
| | | | | | | | | | | | | | | | | | |
Total | | | 36,067,036 | (3) | | | 556,161 | | | | |
| | | | | | | | | | | | | | | | | | |
| | | Outstanding principal
Amount (in millions) | | | Type of | | | | Maturity | |
| Name of project | | INR | | | US$ | | | Interest | | Currency | | Date (1) | |
| Andhra Pradesh 1 | | | 2,414 | | | | 29.4 | | | Fixed | | INR | | | 2026 | |
| Bihar 1 | | | 422 | | | | 5.1 | | | Fixed | | INR | | | 2026 | |
| Gujarat 1 | | | 893 | | | | 10.9 | | | Fixed | | INR | | | 2026 | |
| Karnataka 1 | | | 720 | | | | 8.8 | | | Fixed | | INR | | | 2026 | |
| Karnataka 3.1 | | | 2,115 | | | | 25.7 | | | Fixed | | INR | | | 2026 | |
| Karnataka 3.2 | | | 1,723 | | | | 21.0 | | | Fixed | | INR | | | 2026 | |
| Karnataka 3.3 | | | 2,704 | | | | 32.9 | | | Fixed | | INR | | | 2026 | |
| Punjab 1 | | | 312 | | | | 3.8 | | | Fixed | | INR | | | 2026 | |
| Punjab 2 | | | 1,866 | | | | 22.7 | | | Fixed | | INR | | | 2026 | |
| Punjab 4 | | | 5,332 | | | | 64.9 | | | Fixed | | INR | | | 2026 | |
| Rajasthan 3.1 | | | 1,142 | | | | 13.9 | | | Fixed | | INR | | | 2026 | |
| Rajasthan 3.2 | | | 1,263 | | | | 15.4 | | | Fixed | | INR | | | 2026 | |
| Rajasthan 3.3 | | | 2,237 | | | | 27.2 | | | Fixed | | INR | | | 2026 | |
| Rajasthan 4 | | | 227 | | | | 2.8 | | | Fixed | | INR | | | 2026 | |
| Telangana 1 | | | 4,841 | | | | 58.9 | | | Fixed | | INR | | | 2026 | |
| Uttar Pradesh 1 | | | 340 | | | | 4.1 | | | Fixed | | INR | | | 2026 | |
| Gujarat 2 | | | 9,188 | | | | 111.8 | | | Fixed | | INR | | | 2024 | |
| Maharashtra 3 | | | 5,238 | | | | 63.7 | | | Fixed | | INR | | | 2024 | |
| Karnataka 4 | | | 3,934 | | | | 47.9 | | | Fixed | | INR | | | 2024 | |
| Maharashtra 1.1 & 1.2 | | | 325 | | | | 4.0 | | | Fixed | | INR | | | 2024 | |
| Uttar Pradesh 3 | | | 1,778 | | | | 21.6 | | | Fixed | | INR | | | 2024 | |
| Andhra Pradesh 3 | | | 2,179 | | | | 26.5 | | | Fixed | | INR | | | 2024 | |
| Punjab 3.1 and 3.2 | | | 1,219 | | | | 14.8 | | | Fixed | | INR | | | 2024 | |
| Chhattisgarh 1.1,1.2 & 1.3 | | | 1,418 | | | | 17.3 | | | Floating | | INR | | | 2036 | |
| Rajasthan 1 | | | 367 | | | | 4.5 | | | Fixed | | INR | | | 2031 | |
| Rajasthan 2 | | | 2,233 | | | | 27.2 | | | Fixed | | INR | | | 2033 | |
| Karnataka 2 | | | 336 | | | | 4.1 | | | Floating | | INR | | | 2034 | |
| Andhra Pradesh 2 | | | 4,815 | | | | 58.6 | | | Floating | | INR | | | 2036 | |
| Uttar Pradesh 2 | | | 2,012 | | | | 24.5 | | | Floating | | INR | | | 2037 | |
| Rajasthan 5 | | | 5,345 | | | | 65.0 | | | Mixed | | INR | | | 2039 | |
| Rajasthan 8 | | | 12,863 | | | | 156.5 | | | Floating | | US$ | | | 2026 | |
| Rajasthan 9 | | | 9,466 | | | | 115.2 | | | Mixed | | INR/US$ | | | 2022-2041 | |
| Assam 1 | | | 3,432 | | | | 41.8 | | | Floating | | INR | | | 2042 | |
| Rajasthan 6 | | | 22,263 | | | | 270.9 | | | Floating | | INR | | | 2042 | |
| Rooftop Projects (4) | | | 2,881 | | | | 35.1 | | | Mixed | | INR/US$ | | | 2022-2032 | |
| Total Amount | | | 1,19,843 | (2), (3) | | | 1,458.5 | | | | | | | | | |
| (1) | This represents the last repayment period. These loans are repayable on a quarterly or semi-annual or on bullet payment basis. For repayment by period of the above-mentioned loans, refer to contractual obligation and commercial commitments. |
| (2) | Rooftop Projects includes DLF (total), Uttar Pradesh Rooftop 1, Delhi Rooftop 1, Delhi Rooftop 2 and Delhi Rooftop 3. |
(3) | ExcludesThis amount is presented in the financials as, net of ancillary cost of borrowing of INR 909.31,010 million (US$14.012.3 million), presented. |
| (3) | Further, non-project level debt of INR 12,621 million (US$153.6 million) are excluded from the above table. The non-project level debt balance includes INR 6,599 million (US$80.3 million) of foreign exchange impact on project debt against which the company has taken a hedge and also include INR 1,161 million (US$14.1 million) loan taken from minority shareholder in rooftop entities which forms part of the financials on net basis.group. |
| (4) | Rooftop Projects includes Delhi Rooftop 4, Gujarat rooftop, Punjab Rooftop 2, Railway 1 and SECI 50. |
Our outstanding project-level borrowings have been secured by certain movable and immovable properties, including property, plant and equipment, and in three cases is also supported by personal guarantees issued by Mr. Inderpreet Singh Wadhwa (our chairman of the board of directors and chief executive officer) and Mr. Harkanwal Singh Wadhwa (our director and chief operating officer), as well as a pledge of the shares of the project-level SPVs.
The financing agreements governing our project-level borrowings contain financial and other restrictive covenants that limit our project subsidiaries’ ability to make distributions to us unless certain specific conditions are met, including the satisfaction of certain financial ratios. Certain rooftop project entities of the Group, which are held for the sale, were not in compliance with the financial covenants related to this borrowing and had obtained suitable waivers for the non-compliance prior to the issuance of these financial statements. See Note 12 to the consolidated financial statements.
Uses of Liquidity
Our principal requirements for liquidity and capital resources can be categorized into investment for developing solar power plants and debt service obligations. Generally, once operational, our solar power generation assets do not require significant capital expenditures to maintain their operating performance.performance, and our working capital is sufficient to meet the operations. For principal and interest payments on our debt outstanding as of March 31, 2017,2023, refer to Contractual Obligations and Commercial Commitments included elsewhere in this annual report.“Contractual Obligations”.
Capital Expenditures
As of March 31, 2017,2023, we operated 3247 utility scale projects and several commercial rooftop projects with a combined rated capacity of 6513,041 MW. As
All our capital expenditures are considered Growth Capital Expenditures. In broad terms, we expense all expenditures in the current period that would primarily maintain our businesses at current levels of such date, we were also constructing eight projects with a combined rated capacityoperations, capability, profitability or cash flow in operations and maintenance and therefore there are no Maintenance Capital Expenditures. Growth capital expenditures primarily provide new or enhanced levels of 354 MW and had an additional 64 MW of projects committed.operations, capability, profitability or cash flows.
Our capital expenditure requirements consist of:
| | (i) | Expansion capital expenditures for new projects; and |
| | (ii) | Working capital spent for building a pipeline of projects for the coming year(s).; and |
| (iii) | Replacement capex for running plant. |
Expansion capital expenditures also include interest expense associated with borrowings used to fund expansion during the construction phase of the projects.
Our capital expenditure amounted to INR 15,421.518,909 million, INR 40,869 million and INR 5,953 million (US$237.872.4 million) for FY 2021, FY 2022 and FY 2023 respectively. Our capital expenditure during the fiscalcurrent year ended March 31, 2017,was primarily for the Punjab 4, Karnataka 3, Biharconstruction of Assam 1, Maharashtra 1, Delhi 3Rajasthan 6, Rajasthan 8 and 4 rooftop, Oberoi rooftop and Punjab rooftop 2 projects.Rajasthan 9.
Cash Flow Discussion
We also use traditional measures of cash flow, including net cash provided by operating activities, net cash used in investing activities and net cash provided by financing activities, as well as cash available for distribution to evaluate our periodic cash flow results.
Cash and cash equivalents include cash on hand, demand deposits with banks, term deposits and all other highly liquid investments purchased with an original maturity of three months or less at the date of acquisition and that are readily convertible to cash. It does not include restricted cash which consists of cash balances restricted as to withdrawal or usage and relate to cash used to collateralize bank letters of credit supporting the purchase of equipment for solar power plants, bank guarantees issued in relation to the construction of the solar power plants within the timelines stipulated in PPAs and for certain debt service reserves required under our loan agreements.
Fiscal Year Ended March 31, 20172023 Compared to Fiscal Year Ended March 31, 20162022
The following table reflects the changes in cash flows for the comparative periods:
| | | | | | | | | | | | | | | | |
| | | For fiscal year ended
March 31, | | | | |
| | | 2016 | | | 2017 | | | Change | |
| | | INR | | | INR | | | US$ | | | INR | |
| | | (In thousands) | |
Cash flow data | | | | | | | | |
Net cash provided by (used in) operating activities | | | 733,868 | | | | (27,190 | ) | | | (421 | ) | | | (761,058 | ) |
Net cash used in investing activities | | | (9,159,046 | ) | | | (21,944,262 | ) | | | (338,385 | ) | | | (12,785,216 | ) |
Net cash provided by financing activities | | | 9,465,659 | | | | 24,331,507 | | | | 375,196 | | | | 14,865,848 | |
| | | 2022 | | | 2023 | | | 2023 | | | Change | |
| | | INR | | | INR | | | US$ | | | INR | |
| | | (in millions) | |
| Cash flow data | | | | | | | | | | | | |
| Net cash provided by operating activities | | | 4,597 | | | | 7,957 | | | | 96.7 | | | | 3,360 | |
| Net cash used in investing activities | | | (39,427 | ) | | | (6,258 | ) | | | (76.1 | ) | | | 33,169 | |
| Net cash provided by financing activities | | | 41,940 | | | | (4,118 | ) | | | (50.1 | ) | | | (46,058 | ) |
Operating Activities
During the fiscal year ended March 31, 2017,Fiscal Year 2023, we utilizedgenerated INR 27.27,957 million (US$0.496.7 million) of cash infrom operating activities. This cash outflowgenerated from operating activities primarily resulted fromis a result of net loss during the fiscal year ended March 31, 2017 of INR 1,191.62,322 million reduced byduring FY 2023 added with non-cash items including a depreciation and amortization of INR 4,024 million, Impairment loss of INR 1,279 million, deferred income taxes of INR 383.31,614 million, amortization of debt financing cost of INR 336 million, change in fair valueoperating lease liabilities INR 213 million, allowances of compulsorily convertible debentures, Series E and Series G compulsorily convertible preferred shares ofdoubtful accounts INR 164.2 million, amortization of deferred finance costs of INR 114.1551 million and depreciation and amortization ofcurrent year foreign exchange loss INR 1,046.6157 million, offset by realized and unrealized foreign exchange gain, netreversal of share based compensation of INR 109.1629 million, resulting from appreciationderivative instrument of the rupee,INR 1,726 million and Changes in operating lease right to use assets INR 349 million. In addition to this there is impact of working capital changes, in operating assets and liabilities including a INR 333.9760 million due to increase in other liabilities, a INR 193.3 million increase in deferred revenue aof INR 63.21,349 million, decrease in accounts payable of INR 994 million, offset by increase in interest payable aof INR 18.9108 million, INR 916 million increase in accounts payable, offsettrade receivables, decrease in prepaid assets by a INR 581.9388 million increase in accounts receivable, a INR 344.6 million increaseand decrease in other assets primarily in connection with prepaid taxes, land use rights and interest receivable, and aby INR 122.9 million increase in prepaid expenses and other current assets primarily resulting from options premiums paid in connection with our hedging activities, prepaid income taxes and debt financing cost and interest receivable on term deposits.273 million.
During the fiscal year ended March 31, 2016,Fiscal Year 2022, we generated INR 733.94,597 million (US$11.360.6 million) of cash infrom operating activities. This cash inflowgenerated from operating activities primarily resulted fromis a result of net loss during the fiscal year ended March 31, 2016 of INR 1,654.82,126 million reduced byduring FY 2022 added with non-cash items including deferred income taxesa derivative instrument of INR 299.1 million, change in fair value of compulsorily convertible debentures, Series E and Series G compulsorily convertible preferred shares of INR 671.81,576 million, depreciation and amortization of INR 687.83,667 million, reversal of Impairment loss of INR 80 million, deferred income taxes of INR 457 million, amortization of debt financing cost of INR 1,107 million and realized and unrealized foreign exchange loss, netprepayment penalty on refinancing of loans of INR 343.11,608 million, resulting from depreciationoffset by reversal of the rupee, inshare based compensation of INR 295 million. In addition to this there is impact of working capital changes, including INR 1,018 million due to increase in operating assets andother liabilities, including aincrease in deferred revenue of INR 126.83,184 million, increase in accounts payable aof INR 952.6347 million, offset by decrease in interest payable of INR 520 million, INR 1,057 million increase in deferred revenuetrade receivables and a INR 70.2 million increase in interest payable offset by a INR 353.2 million increase in accounts receivable, a INR 325.4 million increase in other assets primarily in connection with advances paid to suppliers and contractors and a INR 119.2 million increase in prepaid expenses and other current assets primarily resulting from options premiums paid in connection with our hedging activities, prepaid income taxes and debt financing cost and interest receivable on term deposits.by INR 4,427 million.
Investing Activities
During the fiscal year ended March 31, 2017,FY 2023, we utilized INR 21,944.36,258 million (US$338.476.1 million) in our investing activities. This cash outflow was primarily due to INR 15,421.55,953 million (US$72.4 million) incurred to purchase property, plant and equipment primarily related to the construction of our Punjab 4.1, 4.2Rajasthan 6, Rajasthan 8, Rajasthan 9 and 4.3 solar powerAssam 1 projects Karnataka 3.1, 3.2 and 3.3 solar power projects, Bihar 1 solar power project and Punjab rooftop 2 solar power project in additionInvestment amounting to a net purchaseINR 362 million (US$4.4 million). This cash outflow has been offset by proceeds from disposal of subsidiaries for INR 3,192.754 million of available-for-sale non-current investments and a net addition of INR 3,318.9 million to restricted cash, in the form of term deposit.(US$ 0.7 million).
During the fiscal year ended March 31, 2016,FY 2022, we utilized INR 9,159.039,427 million (US$141.2519.7 million) in our investing activities. This cash outflow was primarily due to INR 9,097.040,869 million (US$538.7 million) incurred to purchase property,
plant and equipment primarily related to the construction of our Rajasthan 3.1, 3.26, Rajasthan 8, Rajasthan 9 and 3.3 solar power projects, Chhattisgarh 1.1 and 1.2 solar power projects, Punjab 3.1 and 3.2 solar power projects, KarnatakaAssam 1 solar power projects and Andhra Pradesh 1 solar power projects offset by a net sale of INR 50.7 million of available-for-sale non-current investments. In addition, we raised cashInvestment amounting to INR 316.994 million (US$1.2 million). This cash outflow has been offset by proceeds from the saledisposal of redeemable non-controlling interests.subsidiaries for INR 1,557 million (US$20.5 million).
Financing Activities
During the fiscal year ended March 31, 2017,FY 2023, we used INR 4,118 million (US$50.1 million) from financing activities. This cash inflow was primarily due to net loan payment of INR 4,118 million (US$50.1 million) for our Rajasthan 6, Rajasthan 8, Rajasthan 9 and Green Bonds.
During FY 2022, we generated INR 24,331.541,940 million (US$375.2552.8 million) from financing activities. This cash inflow was primarily due to net proceeds of INR 18,622 million (US$245.4 million) from issuance of equity share under right issues, net loan proceeds of INR 31,710 million (US$418.0 million) for our Rajasthan 6, Rajasthan 8, Rajasthan 9 and additional loans on refinancing of existing projects, offset by lower loan draw down on account of refinancing of Green Bonds amounting to INR 6,784 million (US$89.4 million) and INR 1,608 million (US$21.2 million) on account of prepayment charges paid on refinancing of loans.
Fiscal Year 2022 Compared to Fiscal Year 2021
The following table reflects the changes in cash flows for the comparative periods:
| | | For fiscal year ended March 31, | |
| | | 2021 | | | 2022 | | | 2022 | | | Change | |
| | | INR | | | INR | | | US$ | | | INR | |
| | | (In millions) | |
| Cash flow data | | | | | | | | | | | | |
| Net cash provided by operating activities | | | 4,977 | | | | 4,597 | | | | 60.6 | | | | (380 | ) |
| Net cash used in investing activities | | | (18,919 | ) | | | (39,427 | ) | | | (519.7 | ) | | | (20.508 | ) |
| Net cash provided by financing activities | | | 15,092 | | | | 41,940 | | | | 552.8 | | | | 26,848 | |
Operating Activities
During Fiscal Year 2022, we generated INR 4,597 million (US$60.6 million) of cash from operating activities. This cash generated from operating activities primarily is a result of net loss of INR 2,126 million during Fiscal Year 2022 added with non-cash items including a derivative instrument of INR 1,576 million, depreciation and amortization of INR 3,667 million, reversal of Impairment loss of INR 80 million, deferred income taxes of INR 457 million, amortization of debt financing cost of INR 1,107 million and prepayment penalty on refinancing of loans of INR 1,608 million, offset by reversal of share based compensation of INR 295 million. In addition to this there is impact of working capital changes, including INR 1,018 million due to increase in other liabilities, increase in deferred revenue of INR 3,184 million, increase in accounts payable of INR 347 million, offset by decrease in interest payable of INR 520 million, INR 1,057 million increase in trade receivables and increase in prepaid and other assets by INR 4,427 million.
During Fiscal Year 2021, we generated INR 4,977 million (US$68.3 million) of cash from operating activities. This cash generated from operating activities primarily resulted from a net loss during Fiscal Year 2021 of INR 4,201 million increased by non-cash items including a derivative instrument of INR 1,918 million, depreciation and amortization of INR 3,202 million, Impairment loss of INR 3,255 million, allowance for doubtful accounts of INR 294 million and share based compensation of INR 1,001 million, offset by deferred income taxes of INR 329 million, in addition to changes in working capital including, a INR 61 million decrease in other liabilities, an INR 224 million increase in deferred revenue, a INR 20 million decrease in prepaid expenses and other current assets, a INR 112 million decrease in other assets primarily resulting from prepaid income taxes and interest receivable on term deposits and INR 83 million decrease in interest payable offset by an INR 874 million increase in accounts receivable.
Investing Activities
During FY 2022, we utilized INR 39,427 million (US$519.7 million) in our investing activities. This cash outflow was primarily due to INR 40,869 million (US$538.7 million) incurred to purchase property, plant and equipment primarily related to the construction of our Rajasthan 6, Rajasthan 8, Rajasthan 9 and Assam 1 projects and Investment amounting to INR 94 million (US$1.2 million). This cash outflow has been offset by proceeds from disposal of subsidiaries for INR 1,557 million (US$20.5 million).
During FY 2021, we utilized INR 18,919 million (US$258.9 million) in our investing activities. This cash outflow was primarily due to INR 18,909 million (US$258.8 million) incurred to purchase property, plant and equipment primarily related to the construction of our following projects Rajasthan 6 and Assam 1.
Financing Activities
During FY 2022, we generated INR 41,940 million (US$552.8 million) from financing activities. This cash inflow was primarily due to net proceeds of INR 18,622 million (US$245.4 million) from issuance of equity share under right issues, net loan proceeds of INR 31,710 million (US$418.0 million) for our Rajasthan 6, Rajasthan 8, Rajasthan 9 and additional loans on refinancing of existing projects, offset by lower loan draw down on account of refinancing of Green Bonds amounting to INR 6,784 million (US$89.4 million) and INR 1,608 million (US$21.2 million) on account of prepayment charges paid on refinancing of loans.
During FY 2021, we generated INR 15,092 million (US$206.2 million) from financing activities. This cash inflow was primarily due to new loan proceeds of INR 20,993.725,510 million in the form of term loans from banks(US$348.7 million) for our Punjab 4,Assam 1, Rajasthan 6, Rajasthan 2, Rajasthan 5 and Karnataka 3, Andhra Pradesh 2 Uttar Pradesh 2, Telangana 1, Bihar1projects and Punjabcertain rooftop 2 solar power plants, INR 1,338.0 million from the contributionoffset by non-controlling interest holders and INR 9,315.6 million proceeds from Series I compulsorily convertible preferred shares, initial public offering and concurrent private placement. These inflows were offset in part by INR 6,373.2 million in repayment of loans,term loan amounting to INR 10,563 million (US$144.5 million), which includes INR 2,279 million (US$31.2 million) paid towards hedging costs for Green Bonds and INR 942.8 million incurred for the public issue.
During the fiscal year ended March 31, 2016, we generated INR 9,465.7 million (US$146.0 million) from financing activities. This cash inflow was primarily due to new loan proceedsimport of INR 8,727.9 million in the form of term loans from banks for our Rajasthan 3, Chhattisgarh 1, Punjab 3, Andhra Pradesh 1 and Rajasthan 4 solar power plants and INR 4,237.4 million proceeds from Series G and Series H compulsorily convertible preferred shares. These inflows were offset in part by INR 3,490.8 million in repayment of loans.
Year Ended March 31, 2016 Compared to Year Ended March 31, 2015
The following table reflects the changes in cash flows for the comparative periods:
| | | | | | | | | | | | | | | | |
| | | For the Year Ended
March 31, | | | | |
| | | 2015 | | | 2016 | | | Change | |
| | | INR | | | INR | | | US$ | | | INR | |
| | | (In thousands) | |
Cash flow data | | | | | | | | |
Net cash provided (used in) by operating activities | | | (176,680 | ) | | | 733,868 | | | | 11,316 | | | | 910,548 | |
Net cash (used in) investing activities | | | (9,050,994 | ) | | | (9,159,046 | ) | | | (141,234 | ) | | | (108,052 | ) |
Net cash provided by financing activities | | | 9,672,089 | | | | 9,465,659 | | | | 145,962 | | | | (206,430 | ) |
Operating Activities
During the fiscal year ended March 31, 2016, we generated INR 733.9 million (US$11.3 million) of cash in operating activities. This cash inflow primarily resulted from a net loss during the year ended March 31, 2016 of INR 1,654.8 million reduced by non-cash items including deferred income taxes of INR 299.1 million, change in fair value of compulsorily convertible debentures, Series E and Series G compulsorily convertible preferred shares of INR 671.8 million, depreciation and amortization of INR 687.8 million and realized and unrealized foreign exchange loss, net of INR 343.1 million resulting from depreciation of the rupee, in addition to changes in operating assets and liabilities including a INR 126.8 million increase in accounts payable, a INR 952.6 million increase in deferred revenuegoods and a INR 70.2257 million increase in interest payable offset by a INR 353.2 million increase in accounts receivable, a INR 325.4 million increase in other assets primarily in connection with advances paid to suppliers and contractors and a INR 119.2 million increase in prepaid expenses and other current assets primarily resulting from options premiums paid in connection with our hedging activities, prepaid income taxes and debt financing cost and interest receivable on term deposits.
During the fiscal year ended March 31, 2015, we utilized INR 176.7 million (US$2.73.5 million) of cash in operating activities. This cash outflow primarily resulted from a net loss during the year ended March 31, 2015
of INR 1,088.6 million reduced by non-cash items including change in fair value of compulsorily convertible debentures and Series E compulsorily convertible preferred shares of INR 286.3 million, depreciation and amortization of INR 322.4 million and realized and unrealized foreign exchange loss, net of INR 299.6 million resulting from depreciation of the rupee, in addition to changes in operating assets and liabilities including a INR 334.5 million increase in other liabilities primarily in connection with obligations to suppliers and contractors, a INR 241.1 million increase in other assets primarily in connection with advances paid to suppliers and contractors, and a INR 118.3 million increase in prepaid expenses and other current assets primarily resulting from options premiums paid in connection with our hedging activities, prepaid income taxes and debt financing cost and interest receivable on term deposits.
Investing Activities
During the fiscal year ended March 31, 2016, we utilized INR 9,159.0 million (US$141.2 million) in our investing activities. This cash outflow was primarilydecrease due to INR 9,097.0 million incurred to purchase property, plant and equipment primarily related to the construction of our Rajasthan 3.1, 3.2 and 3.3 solar power projects, Chhattisgarh 1.1 and 1.2 solar power projects, Punjab 3.1 and 3.2 solar power projects, Karnataka 1 solar power projects and Andhra Pradesh 1 solar power projects offset by a net sale of INR 45.4 million of available-for-sale non-current investments. In addition, we raised cash amounting to INR 316.9 million from the sale of redeemable non-controlling interests.
During the year ended March 31, 2015, we utilized INR 9,051.0 million (US$139.6 million) in investing activities. This cash outflow was primarily due to INR 8,426.0 million incurred to purchase property, plant and equipment primarily related to the construction of our Punjab 2.1, 2.2 and 2.3, Uttar Pradesh 1 and Karnataka 1 solar power projects and the purchase of term deposits for INR 624.5 million, offset in part by a net sale of INR 13.9 million of available-for-sale non-current investments.
Financing Activities
During the year ended March 31, 2016, we generated INR 9,465.7 million (US$146.0 million) from financing activities. This cash inflow was primarily due to new loan proceeds of INR 8,727.9 million in the form of term loans from banks for our Rajasthan 3, Chhattisgarh 1, Punjab 3, Andhra Pradesh 1 and Rajasthan 4 solar power plants and INR 4,237.4 million proceeds from Series G and Series H compulsorily convertible preferred shares. These inflows were offset in part by INR 3,490.8 million in repayment of loans.prepayment charges.
During the fiscal year ended March 31, 2015, we generated INR 9,672.1 million (US$149.1 million) of cash from our financing activities. This cash inflow was primarily due to new loans with proceeds of INR 8,399.0 million in the form of term loans from banks for our Punjab 2, Uttar Pradesh 1 and Karnataka 1 solar power projects, proceeds of INR 1,549.0 million through the issue of 138,333 shares of Series F compulsorily convertible preferred shares and INR 180.0 million from the issuance of compulsorily convertible debentures. These inflows were offset in part by INR 452.9 million in repayment of loans during the year and INR 3.0 million of expenses incurred in connection with this offering.
C. Research and Development
Our intellectual property is an essential element of our business, and our success depends, at least in part, on our ability to protect our core technology and intellectual property. To accomplish this, we rely on a combination of patent, trade secret, trademark and other intellectual property laws, confidentiality agreements and license agreements to establish and protect our intellectual property rights. As of March 31, 2017, we had four patent applications under process. The patent applications include our real time and pre-paid solar power module, which enables automated services such as solar energy generation and provisioning, maintenance and billing and our manual solar tracking system, which allows us to remotely control our solar panels to follow the movement of the sun. Other two patent applications include a thin film photovoltaic mounting assembly and a network operation and control center that allows us to monitor project performance in real time.
D. Trend information
Other than as disclosed elsewhere in this annual report, we are not aware of any trends, uncertainties, demands, commitments or events since March 31, 2017 that are reasonably likely to have a material adverse effect on our net revenues, income, profitability, liquidity or capital resources, or that caused the disclosed financial information to be not necessarily indicative of future operating results or financial conditions.
E. Off-Balance Sheet Arrangements
The terms of our PPAs provide for the annual delivery of a minimum amount of electricity at fixed prices. Under the terms of the PPAs, we have issued irrevocable performance bank guarantees totalingguarantees. These in total amount to INR 1,534.75,179 and INR 2,409 million (US$23.729.3 million) as of March 31, 2017. 2022 and 2023, respectively.
As of March 31, 2022 and 2023, the Company has irrevocable performance bank guarantees aggregating to INR 2,320 million and INR 904 million (US$11.0 million) respectively, in relation to under construction projects. Further, bank guarantees of INR 1,517 million and INR 1,154 million (US$14.0 million) as of March 31, 2022 and 2023 respectively are in relation to commissioned projects as per respective PPAs and other project requirements.
Bank guarantees amounting to INR 458 million and INR 78 million (US$0.9 million) as of March 31, 2022 and 2023, respectively, have been issued to meet Debt-Service Reserve Account requirements for outstanding loans.
We have also givenobtained guarantees from financial institutions as a part of the bidding process for setting up ofestablishing solar power plantsprojects amounting to INR 1,092.0873 million and INR 267 million (US$16.83.2 million) as of March 31, 2017.2022 and 2023 respectively. We have given term deposits as collateral for those guarantees which are not party to anyclassified as restricted cash on the consolidated balance sheet.
Further, INR 11 million and INR 5 million (US$0.1 million) bank guarantee as of March 31, 2022 and 2023 respectively, are towards other off-balance sheet arrangements.commitments. The funds released from maturity/settlement of existing bank guarantees can be used for future operational activities.
F. Tabular Disclosure of
E. Contractual Obligations
We have contractual obligations and other commercial commitments that represent prospective cash requirements. The following table summarizes our outstanding contractual obligations and commercial commitments as of March 31, 2017.2023.
| | | | | | | | | | | | | | | | | | | | |
| | | Payment due by Period | |
| | | Under 1
year | | | 1-3
Years | | | 3-5
Years | | | Over 5
years | | | Total | |
| | | (in thousands) | |
Contractual cash obligations | | | | | | | | | | | | | | | | | | | | |
Long-term debt (principal)(1) | | | 1,622,519 | | | | 4,274,640 | | | | 5,236,824 | | | | 22,433,053 | | | | 33,567,036 | |
Long-term debt (interest)(2) | | | 2,612,822 | | | | 5,048,157 | | | | 4,424,842 | | | | 11,451,754 | | | | 23,537,575 | |
Operating lease obligations | | | 66,652 | | | | 130,901 | | | | 132,820 | | | | 2,955,614 | | | | 3,285,987 | |
Purchase obligations(3) | | | 3,575,849 | | | | — | | | | — | | | | — | | | | 3,575,849 | |
Asset retirement obligations | | | — | | | | — | | | | — | | | | 242,980 | | | | 242,980 | |
Total contractual obligations (INR) | | | 7,877,842 | | | | 9,453,698 | | | | 9,794,486 | | | | 37,083,401 | | | | 64,209,427 | |
Total contractual obligations (US$) | | | 121,478 | | | | 145,778 | | | | 151,033 | | | | 571,833 | | | | 990,122 | |
| | | Payment due by Period | |
| | | Under 1 year | | | 1-3 Years | | | 3-5 Years | | | Over 5 years | | | Total | |
| | | (INR in millions) | |
| Contractual cash obligations | | | | | | | | | | | | | | | |
| Long-term debt (principal) (1) | | | 16,859 | | | | 43,326 | | | | 38,473 | | | | 32,648 | | | | 131,305 | |
| Long-term debt (interest) (2) | | | 7,169 | | | | 10,865 | | | | 5,247 | | | | 20,303 | | | | 43,584 | |
| Operating lease obligations | | | 304 | | | | 636 | | | | 675 | | | | 11,120 | | | | 12,735 | |
| Purchase obligations (3) | | | 22,188 | | | | 9,969 | | | | — | | | | — | | | | 32,157 | |
| Asset retirement obligations | | | — | | | | — | | | | — | | | | 15,082 | | | | 15,082 | |
| Total contractual obligations | | | 46,520 | | | | 64,796 | | | | 44,395 | | | | 79,153 | | | | 234,863 | |
| Total contractual obligations (US$) | | | 566.0 | | | | 788.4 | | | | 540.2 | | | | 963.0 | | | | 2857.6 | |
| (1) | The long-term debt includes project secured term loans and, other secured bank loans. The long-term debt (principal) obligations for foreign currency denominated project borrowings have been converted to Indian rupees using the closing exchange rate as of March 31, 20172023 as per the Reserve Bank of India. |
| (2) | Interest on long-term debt is calculated based on the outstanding balance of the debt at the prevailing interest rate for the corresponding periods. |
| (3) | Consists of asset purchase commitment for construction of solar power plants. |
G. Safe harbor
This information contains forward-looking statements within the meaning of Section 21E of the Securities Exchange Act of 1934 and the Private Securities Litigation Reform Act of 1995, including statements regarding our future financial and operating guidance, operational and financial results such as estimates of nominal contracted payments remaining and portfolio run rate, and the assumptions related to the calculation of the foregoing metrics. Forward-looking statements are generally identifiable by use of forward-looking terminology such as “may”, “will”, “should”, “potential”, “intend”, “expect”, “seek”, “anticipate”, “estimate”, “believe”, “could”, “plan”, “project”, “predict”, “continue”, “future”, “forecast”, “target”, “guideline” or other similar words or expressions. Our ability to predict results or the actual effect of plans or strategies is inherently uncertain, particularly given the economic environment. Although we believe that the expectations reflected in such forward-looking statements are based on reasonable assumptions, our actual results and performance could
differ materially from those set forth in the forward-looking statements and you should not unduly rely on these statements. These forward-looking statements involve risks, uncertainties and other factors that may cause our actual results in future periods to differ materially from those forward-looking statements.
The risks and uncertainties that could cause our results to differ materially from those expressed or implied by such forward-looking statements include, but not limited to:
the availability of additional financing on acceptable terms; changes in the commercial and retail prices of traditional utility generated electricity;
changes in tariffs at which long term PPAs are entered into;
changes in policies
F. Critical Accounting Policies and regulations including net metering and interconnection limits or caps;Estimates
the availability of rebates, tax credits and other incentives;
the availability of solar panels and other raw materials;
our limited operating history, particularly as a new public company;
our ability to attract and retain our relationships with third parties, including our solar partners;
our ability to meet the covenants in our debt facilities;
meteorological conditions; and
such other risks identified in the registration statements and reports that we have file with the U.S. Securities and Exchange Commission, or SEC, from time to time.
All forward-looking statements in this press release are based on information available to us as of the date hereof, and we assume no obligation to update these forward-looking statements.
Recent Accounting Pronouncements
Beginning April 1, 2017, the Company has irrevocably elected to follow public company effective dates for new accounting pronouncements.
In May 2014,December 2019, the FASB issued ASU No. 2014-09, ‘‘Revenue from Contracts with Customers (Topic 606)2019-12, Simplifying the Accounting for Income Taxes (“ASU 2019-12”).’’ This guidance supersedes current guidance on revenue recognition in Topic 605, ‘‘Revenue Recognition.” In addition, there are disclosure requirements related ASU 2019-12 eliminates certain exceptions to the nature, amount, timing,general principles in ASC 740, Income Taxes and uncertainty of revenue recognition. In August 2015,adds guidance to reduce complexity in accounting for income taxes. ASU 2019-12 eliminates, inter alia, the FASB issued ASU No.2015-14 to defergeneral methodology for calculating income taxes in an interim period when a year-to-date loss exceeds the effective date of ASUNo. 2014-09anticipated loss for all entities by onethe year. The core principle of the guidance isIt requires that an entity should recognize revenue to depictreflect the transfereffect of promised goodsan enacted change in tax laws or services to customers in an amount that reflects the consideration to which the entity expects to be entitled in exchange for those goods or services. To achieve that core principle, an entity is required to follow five steps which comprises of (a) identifying the contract(s) with a customer; (b) identifying the performance obligationsrates in the contract; (c) determining the transaction price; (d) allocating the transaction price to the performance obligationsannual effective tax rate computation in the contract and (e) recognizing revenue when (or as)interim period that includes the entity satisfies a performance obligation. The deferral resulted in the new revenue standard beingenactment date. ASU 2019-12 is effective for fiscal years, and interimthe annual periods within those fiscal years, beginning after December 15, 2017 (April 1, 2018 for the Company). The Company has the option of adopting the new revenue standard using either one of two methods: (i) retrospectively to each prior reporting period presented with the option to elect certain practical expedients as defined within ASU No. 2014-09; or (ii) retrospectively with the cumulative effect of initially applying ASU No. 2014-09 recognized at the date of initial application and providing certain additional disclosures as defined per ASU No. 2014-09.
The Company is in the process of evaluating the impact of the standard update. The ultimate impact on revenue resulting from the application of the new standard will be subject to assessments that are dependent on many variables, including, but not limited to, the terms of contractual arrangements. The Company also continues to evaluate the available transition methods and its contractual arrangements. The Company’s considerations include, but are not limited to, the comparability of its financial statements and the comparability
within its industry from application of the new standard to its contractual arrangements. The Company plans to select a transition method by December 2017. The Company has established an implementation team to implement the standard update related to the recognition of revenue from contracts with customers. The Company continues to evaluate the changes to accounting system and processes, and additional disclosure requirements that may be necessary.
On January 5, 2016, the FASB issued ASU 2016-01 (“ASU 2016-01”), Recognition and Measurement of Financial Assets and Financial Liabilities, which amends certain aspects of recognition, measurement, presentation and disclosure of financial instruments. This amendment requires all equity investments to be measured at fair value, with changes in the fair value recognized through net income (other than those accounted for under equity method of accounting or those that result in consolidation of the investee). This standard will be effective for fiscal years beginning after December 15, 2017 (April 1, 2018 for the Company),2020, including interim periods within those fiscal years. The Company doesDuring FY 2022, we applied ASU 2019-12 and noted that the impact of adoption of this guidance did not expect this standard to have a material impacteffect on itsour consolidated financial statementsstatements.
In February 2016,March 2020, the Financial Accounting Standards Board issued ASU No. 2020-04, “Reference Rate Reform (Topic 848): Facilitation of the Effects of Reference Rate Reform on Financial Reporting (“ASU 2020-04”).” ASU 2020-04 provides temporary optional expedients and exceptions to the guidance in U.S. GAAP on contract modifications and hedge accounting to ease the financial reporting burdens related to the expected market transition from the London Interbank Offered Rate (LIBOR) and other interbank offered rates to alternative reference rates. In January 2021, the FASB issued Accounting Standard Update 2021-01 (Topic 848), which amends and clarifies the existing accounting standard issued in March 2020 2020-04 for Reference Rate Reform. Reference rates such as LIBOR, are widely used in a broad range of financial instruments and other agreements. The ASU 2016-02 (“ASU 2016-02”), Leases. ASU 2016-02 specifies thepermits entities to elect certain optional expedients and exceptions when accounting for leases. For leases that were formerly classified as operating,derivative contracts and certain hedging relationships affected by changes in the interest rates used for discounting cash flows, for computing variation margin settlements, and for calculating price alignment interest in connection with reference rate reform activities under way in global financial markets (the “discounting transition”). The ASU 2016-02 requires a lessee to recognize a right-of-use asset and a lease liability, initially measured at the present value of the lease payments, in its balance sheet. The standard also requires a lessee to recognize a single lease cost, calculated so that the cost of the lease is allocated over the lease term, on a generally straight-line basis. In addition, this standard requires both lessees and lessors to disclose certain key information about lease transactions. ASU 2016-022020-04 is effective for public companiesadoption at any time between March 12, 2020 and December 31, 2022, for annual reporting periods,all entities, and interim periods within those years, beginning afterASU 2021-01 is effective for all entities as of January 7, 2021 through December 15, 2018 (April 1, 2019 for31, 2022. As of March 31, 2022, we have not made any contract modifications to replace the Company), including interim periods within those fiscal years usingreference rate in any of its agreements and will continue to evaluate the modified retrospective method, which will require adjustment to all comparative periods presented in the consolidated financial statements. The Company is currently evaluating the impacteffects of adopting this standard on its consolidated financial statementsposition, results of operations, and the approach to be used.cash flows.
In March 2016,
Management does not believe that other recent accounting pronouncements issued by the FASB issued ASU 2016-09 (“ASU 2016-09”), Compensation — Stock Compensation: Improvements to Employee Share-Based Payment Accounting, which relates to the accounting for employee share-based payments. This standard addresses several aspects of the accounting for share-based payment award transactions, including: (a) income tax consequences; (b) classification of awards as either equity or liabilities; and (c) classification on the statement of cash flows; (d) accounting for forfeitures of share-based payments. This standard will be effective for fiscal years beginning after December 15, 2016 (April 1, 2017 for the Company), including interim periods within those fiscal years. The Company is currently evaluating the impact of adopting this standard on(including by its consolidated financial statements.
In August 2016, the FASB issued ASU 2016-15, Statement of Cash Flows — Classification of Certain Cash Receipts and Cash Payments, which clarifies the presentation and classification of certain cash receipts and cash payments in the statement of cash flows. The amendments are an improvement to GAAP because they provide guidance for each of the eight issues, thereby reducing the current and potential future diversity in practice. This guidance is effective for financial statements issued for fiscal years beginning after December 15, 2017 (April 1, 2018 for the Company), and interim periods within those fiscal years and should be applied using a retrospective transition method to each period presented. The Company does not expect this standard toEmerging Issues Task Force) have a material impact on its consolidatedour present or future financial statements.
In October 2016, the FASB issued ASU No. 2016-16, Intra-Entity Transfers of Assets Other Than Inventory, to require the recognition of the income tax effects from an intra-entity transfer of an asset other than inventory.
III. SHARE OWNERSHIP AND TRADING
A. Major Shareholders
The ASU is effective for interim and annual periods beginning after December 15, 2017,following table sets forth certain information with early adoption permitted. Adoption of the ASU is based on a modified retrospective method. The Company intends to early adopt the ASU fiscal year beginning April 1, 2017 and early adoption will result in recognition of deferred tax asset on the income taxes paid on the intra entity transfer of assetsrespect to the extent these are expected to be realised by the subsidiary outsidebeneficial ownership of the tax holiday period. The Company believes on early adoption of this
guidance, tax expense is expected to be lower and accordingly its profit after tax is likely to increase as it will result in recognition of deferred tax assets on intra-entity transfer of assets is likely to be higher than the prepaid taxes it could have recognize earlier.
In November 2016, the FASB issued ASU No. 2016-18, Statement of cash flows — Restricted cash. The amendments apply to all entities that have restricted cash or restricted cash equivalents and are required to present a statement of cash flows under Topic 230. The amendments in this update require that a statement of cash flows should explain the change during the period in the total of cash, cash equivalents, and amounts generally described as restricted cash or restricted cash equivalents. The amendments are effective for fiscal years beginning after December 31, 2017 (April 1, 2018 for the Company) and interim periods within those annual periods. Early adoption is permitted with an adjustment reflectedour Company’s equity shares as of the beginningMarch 27, 2024 by each of the fiscal year in which the amendment is adoption. The Company does not expect the adoption of this ASU to have any effect on its financial position or results of operations.
ITEM 6. DIRECTORS, SENIOR MANAGEMENT AND EMPLOYEES
A. Directors and Senior Management
The following discussion sets forth information regarding our directors and senior managementexecutive officers, by all of our directors and executive officers as a group and by each person known to us to own beneficially more than 5% of the equity shares.
As used in this table, beneficial ownership means the sole or shared power to vote or direct the voting or to dispose of or direct the sale of any security. A person is deemed to be the beneficial owner of securities that can be acquired within 60 days upon the exercise of any option, warrant or right as of March 27, 2024. Equity shares subject to options, warrants or rights that are currently exercisable or exercisable within 60 days are deemed outstanding for computing the ownership percentage of the person holding the options, warrants or rights, but are not deemed outstanding for computing the ownership percentage of any other person. The amounts and percentages are based on 64,166,360 equity shares outstanding as of the date of this table:
| Name | | Number
shares
beneficially
owned | | | % | |
| Directors and Executive Officers: | | | | | | |
| Jaime Garcia Nieto | | | - | | | | - | |
| Philippe Pierre Wind | | | - | | | | - | |
| Muhammad Khalid Peyrye1 | | | - | | | | - | |
| Supriya Prakash Sen | | | 402 | | | | | *(2) |
| Jean-François Boisvenu | | | - | | | | - | |
| Delphine Voeltzel | | | - | | | | - | |
| Gowtamsingh Dabee | | | - | | | | - | |
| Richard Payette | | | - | | | | - | |
| Sunil Gupta | | | - | | | | - | |
| Sugata Sircar | | | - | | | | - | |
| R Narasimhan Iyer | | | - | | | | - | |
| Vijay Kumar Wadhwani | | | - | | | | - | |
| Shweta Srivastava | | | - | | | | - | |
| All Directors and Executive Officers as a Group | | | 402 | | | | | *(2) |
| 5% or Greater Shareholders: | | | | | | | | |
| CDPQ Infrastructures Asia Pte Ltd.3 | | | 34,258,963 | | | | 53.4 | % |
| OMERS4 | | | 13,759,647 | | | | 21.4 | % |
Shareholders’ Agreement
The Company did not have any changes to its shareholders agreement. The shareholders agreement is attached as exhibit no. 4.15, 4.16, 4.17 and 4.18.
| 1 | Mr. Peyrye’s business address is c/o AAA Global Services Ltd., 4th Floor, Iconebene, Rue De L’institut, Ebene, 80817, Mauritius. |
| 3 | CDPQ Infrastructures Asia Pte Ltd., a company organized and existing under the laws of Singapore, is a wholly-owned subsidiary of the Caisse de dépôt et placement du Québec, a body constituted by the Act Respecting the Caisse De Dépôt Et Placement Du Québec. The principal address of the Caisse de dépôt et placement du Québec is 1000, Place Jean-Paul-Riopelle, Montréal, Québec, H2Z 2B3. |
| 4 | During the Fiscal Year 2022, OMERS Infrastructure Asia Holdings Pte. Ltd. (“OMERS”), has acquired the entire stake of 19.4% in the Company, previously held by International Finance Corporation and IFC GIF Investment Company. |
B. Related Party Transactions
We believe that the terms of our related party transactions are comparable to the terms we could obtain from independent third parties. Our Company’s related party transactions are subject to the review and approval of the audit and risk committee of our Board. Our Company’s audit and risk committee will consider whether the transaction is to be conducted on an arm’s length basis and whether the services can be procured from an independent third party. The charter of our audit and risk committee as adopted by our Board provides that we may not enter into any related-party transaction unless and until it has been approved by the audit and risk committee. Refer to “Note 20. Related Party Disclosures” to the Notes to Consolidated Financial Statements for details of transactions with related parties.
C.Distribution
The Company has never declared or paid cash dividends on our equity shares, nor does the Company have any present plan to pay any cash dividends in the foreseeable future. The Company currently intends to retain its available funds and any future earnings to operate and expand its business.
D.Significant Changes
Except as disclosed elsewhere in this annual report, we have not experienced any significant changes since the date of the annual financial statements included in this annual report. See “ ̶ Certain Factors Affecting our Results”.
E.Trading Markets
The NYSE has delisted our Company’s shares due to our failure to timely file our Fiscal 2022 annual report on Form 20-F with the SEC. On July 13, 2023, the NYSE suspended trading in our Company’s shares and commenced delisting proceedings. We took substantial steps to remediate the issues that led to the delayed SEC filings including, among others, the replacement of our independent public accounting firm for our U.S. GAAP consolidated financial statements, strengthening our management team and appointing external consultants to review our internal controls and compliance framework.
On November 13, 2023 our shares were delisted from NYSE. On January 29, 2024, the Company’s shares ceased to be registered with the SEC pursuant to Section 12(b) of the Exchange Act. On April 1, 2024, we also expect that our SEC reporting obligations under Section 15(d) of the Exchange Act will be suspended and the Company will no longer have an obligation to file periodic reports (annual reports on Form 20-F and Form 6-K reports) with the SEC. For more information, see “Risk Factors ̶ The New York Stock Exchange (NYSE) has delisted our Company’s shares due to our failure to timely file periodic reports with the SEC” and also, Risk Factors – “On April 1, 2024, we expect that our SEC reporting obligations under Section 15(d) of the Exchange Act will be suspended and the Company will no longer have an obligation to file periodic reports (annual reports on Form 20-F and Form 6-K reports) with the SEC.”
F.Purchases of Equity Securities by the Issuer and Affiliated Purchasers
Azure did not engage in any share repurchases during fiscal year 2023.
G.Material Modifications to the Rights of Security Holders and Use of Proceeds
There have been no material modifications to the rights of securities holders.
Use of proceeds
In January 2022, we completed a rights offering of 15,828,917 new equity shares to raise up to US$250 million. Each right entitles the holder to purchase 0.3275 equity shares at the subscription price of US$15.79 per whole equity share. HSBC Securities (USA) Inc. and Roth Capital Partners, LLC acted as our dealer managers in connection with the rights offering. The offering by our Company resulted in aggregate gross proceeds before expenses of US$250 million and incurred an underwriter’s commission and other expenses of US$2.9 million. As on March 31, 2023, out of the net equity proceeds, US$100 million was utilized against repayment of corporate debts and US$26.4 million was utilized to pay off certain borrowings. The balance of the proceeds is being utilized for capital and other operational expenses.
IV. MANAGEMENT AND EMPLOYEES
A.Management
Board of Directors
Our Board of Directors (the “Board”) sets policies for our business and monitors the implementation of those policies by our executive officers. Our Board has eight directors. Our Board has in-depth experience in the renewable energy industry and corporate finance and is authorized to appoint officers as it deems appropriate. Provided below is a brief descriptionglobally respected in energy, finance, and public policy. All Board directors are non-executive; five are Independent Non-Executives and three are Non-Executive nominees of our directors’shareholders (two of CDPQ and officers’ business experience.
Mr. Sanjeev Aggarwal was nominated as a director by Helion Venture Partners, Mr. Barney S. Rush was nominated as a director by IFC GIF Investment Company and Mr Cyril Cabanes was nominated by Caisse de dépôt et placement du Québec (CDPQ). Additionally, one of ourOMERS). The following table presents certain information concerning the current board of directors Mr. William B. Elmore resigned inas of March 2017.27, 2024.
None of our officers and directors are related, except Mr. Harkanwal S. Wadhwa and Mr. Inderpreet S. Wadhwa. Mr. Harkanwal S. Wadhwa is the father of Mr. Inderpreet S. Wadhwa.
Mr. Eric Ng Yim On and Mr. Muhammad Khalid Peyrye are executives of AAA Global Services Ltd., which provides incorporation, corporate secretarial and governance services to us.
| | | | | | |
Name of Directors | | Age | | | Position |
Directors:
Panicker Unnikrishnan Mangalath Sukumara | | | | | | |
Inderpreet Singh Wadhwa
| | | 44 | 63 | | Chairman of the Board of Directors and Chief Executive Officer1(from August 19, 2020 to March 13, 2024) |
Harkanwal Singh Wadhwa
Muhammad Khalid Peyrye | | | 72 | | | Director and Chief Operating Officer |
Robert Kelly
| | | 59 | 45 | | Director |
Sanjeev Aggarwal
Supriya Prakash Sen | | 58 | | Director |
| Jean-François Boisvenu | | 58 | | Director (from February 8, 2023) |
| Delphine Voeltzel | | 39 | | Director (from May 11, 2022) |
| Gowtamsingh Dabee | | 56 | | Director (from March 30, 2023) |
| Richard Payette | | 63 | | Director (from July 01,2023) |
| Jaime Garcia Nieto | | 50 | | Director (from October 31, 2023) |
| Philippe Pierre Wind | | 58 | | Director (from October 31, 2023) |
| Richard Alan Rosling | | 61 | | Chairman of the Board of Directors1(from October 1, 2021 to October 11, 2023) |
| Arno Lockheart Harris | | 54 | | Director (until May 31, 2022) |
| Ranjit Gupta | | 53 | | Chief Executive Officer/Managing Director (until April 26, 2022) |
| | | | |
| Sugata Sircar | | 60 | | Director (from October 1, 2022 until April 30, 2023) |
| Christine Ann McNamara | | 64 | | Director (from March 1, 2022 until June 26, 2023) |
| Yung Oy Pin Lun Leung | | 57 | | | Director (until March 16, 2023) |
Barney S. Rush
| | | 65 | | | Director |
Arno Harris
| | | 47 | | | Director |
Cyril Sebastien Dominique Cabanes | | | 42 | | | Director |
Eric Ng Yim On
| | | 49 | | Director (until October, 30 2023) |
| Deepak Malhotra | | 44 | | Director (until October, 29 2023) |
1 On October 11, 2023, Mr. Alan Rosling resigned as Chairman of the Board and as a director of the Company and APIPL. On October 12, 2023, the Company announced that Panicker Unnikrishnan Mangalath became the Chairman of the Board of the Company. On March 13, 2024, Mr. M.S. Unnikrishnan resigned as Chairman of the Board and as a director of the Company.
Below is a summary of the business experience, activities and areas of expertise of our current directors.
| | Name and Designation | | Experience and areas of expertise |
| | Muhammad Khalid Peyrye Independent Director | | ● | One of our resident directors in Mauritius. |
| | ● | Heads the Corporate Secretarial and Administrative cluster of AAA Global Services Ltd. |
| | ● | Previously was a Money Laundering and Compliance officer for a leading financial services company. |
| | | | 38
 | | Supriya Prakash Sen Independent Director | | ● | Over 30 years of experience in banking, private equity, capital markets and multilateral funding and investment as well as significant involvement in sustainability initiatives globally and in India. |
| | | Director● | She was Senior Advisor at McKinsey and a strategy consultant for clients in Southeast Asia, South Asia and China. |
| | |
Senior Management:
| | | | | | |
Surendra Kumar Gupta
| | | 64● | Worked on differentiated funding models for enabling private investment in green infrastructure. |
| | | ● | She holds MBA from IIM, Calcutta and also holds executive development programs in strategic innovation, public policy and governance. |
| | Jean-François Boisvenu
Independent Director | | ● | More than 25 years of extensive experience in corporate and commercial law matters, with particular expertise in international banking transactions, lending and debt capital markets transactions and financial institutions regulation.
|
| | ● | He is a partner at Eversheds Sutherland (Mauritius), prior to that, he was Group Head Legal at AfrAsia Bank Limited and worked at BLC Robert. |
| | ● | Before moving to Mauritius in 2009, he was a partner at the Canadian law firm McCarthy Tétrault (Banking and Insolvency Department). Mr. Boisvenu is a Member of the Quebec Bar (Canada) and a Registered Foreign Lawyer in Mauritius. |
| | ● | He holds degrees in Law from University of Montreal and Quebec Bar School (Canada) and a bachelor’s degree in applied economics from École des Hautes Études Commerciales de Montréal. |
| | Delphine Voeltzel | | ● | She has 15 years of professional experience in the infrastructure sector across Europe and Asia and is leading OMERS Infrastructure’s investment efforts in Asia
|
| Non-Executive Director | | ● | Presently, she is serving as Managing Director at OMERS Infrastructure. |
| | | ● | Responsible for originating and executing new transactions in Asia and managing the existing investment portfolio for OMERS Infrastructure. |
| | | ● | She holds a Master of Science in Management from HEC Paris School of Management. |
| | | ● | Nominated to the Board by OMERS. |

| | Gowtamsingh Dabee | | ● | He has over 25 years of experience as a professional accountant in public practice and industry in Mauritius, Africa, and the Middle East. |
| Independent Director | | ● | Presently he is a Partner of GD Riches Chartered Accountants and is an auditor, public accountant, and insolvency practitioner in Mauritius. |
| | | ● | Prior to that, he served as the CFO and Company Secretary of a multinational corporation in Mauritius where he was instrumental in implementing SOX internal control systems for the group subsidiaries. |
| | | ● | Also worked with the representative office of Andersen Worldwide in Mauritius and the Arthur Andersen Office in Dubai. |
| | | ● | He is an Associate Member of the Institute of Chartered Accountants in England and Wales and a Fellow of Chartered Association of Certified Accountant . He holds an MBA from Surrey Business School, University of Surrey, UK, and an Advanced Diploma in International Tax from the Chartered Institute of Taxation UK. |
| | | | ● | He is a registered insolvency practitioner in Mauritius and a member of INSOL. |

| | Richard Payette Independent Director | | ● | He is a business leader with over four decades of experience in management of global companies and accounting and audit matters. |
| | ● | His area of expertise includes organisational transformation, international market development, finance, audit, governance, and risk management. |
| | ● | He currently serves as a director of Export Development Canada (EDC), Canada’s export credit agency wholly owned by the Government of Canada and the Canadian Public Accountability Board, a regulatory body charged with overseeing audits of Canadian reporting issuers. |
| | ● | He earlier served as Chair of the boards of the Canadian Chamber of Commerce and Fédération de Chambres de Commerce du Québec. |
| | ● | From 2016 until 2020, he served as President and CEO Québec of Manulife and was the CEO for the Americas region at BDO International between 2010 and 2015. |
| | ● | He worked with Raymond Chabot Grant Thornton since 1982 until 2009, lastly as the President and CEO. He is also a member of the advisory boards of Lemay and LexRockAI. |
| | | ● | He is a Fellow of the Chartered Professional Accountants of Canada and holds an ESG Certification and designation. |
| | Jaime Garcia Nieto Non Executive Director | | ● | Mr. García has more than 30 years of experience in international finance and management consulting. |
| ● | Before joining Azure Power, he was the Chief Investment Officer at a family office, where he was responsible for transactions and asset management, including several infrastructure projects. He also worked at The Boston Consulting Group (BCG), a management consulting firm where he was working for different clients in industries including Private Equity and Consumer goods in North America, Europe, and México |
| | | | ● | Mr. García also collaborates with Oxfam, an international non-for profit that focuses on the alleviation of global poverty. He was a Board Member for 8 years and Chair of the Finance Committee. |
| | | | ● | Mr. Garcia holds an MBA from the University of California (UCLA) and a degree in Industrial Engineering from Instituto Tecnológico y de Estudios Superiores de Monterrey. |
| | | | | ● Nominated to the Board by CDPQ. |

| | Philippe Wind Non-Executive Director | | ● | Mr. Wind has more than 30 years of varied experience in the areas of utility, renewable, energy / multi-infrastructure space specializing in origination, deal making, management, operations, construction, engineering, consulting, regulatory, private equity, or project finance areas. |
| | ● | Before joining Azure Power, he was CEO at Actis Singapore managing local Singapore team coordination and monetary Authority Singapore accreditation. He was also Director for energy/infra operations Actis, a large energy/infra investment PE fund. Prior to that he worked with Suez/Engie Group in the infra/utility sector across the world in geographies of China, Malaysia, Indonesia and France. His previous experience also includes his role in WorleyParsons and McKinsey Singapore. |
| | ● | Mr. Wind is since 2022 operating partner for CDPQ infra asia pacific, based in Singapore. Overlooking at asset management in the region. |
| | ● | He is seating at the board of the French chamber of commerce and is also a project finance visiting professor at Singapore ESSEC campus. |
| | ● | Mr. Wind hold a Master of Science in civil engineering and environmental from Ecole Centrale de Lyon (France), an MBA from ESSEC Manheim (France/Germany), and a general management degree from Insead (Singapore). ● Nominated to the Board by CDPQ. |
Executive Officers
The executive officers are responsible for the management of the company under the governance of the Board of Directors. All our executive offices are experienced in their domains. The following table lists our current executive officers.
| Name of Executive Officers | | Age | | Position |
| Sunil Gupta | | 60 | | Chief Executive Officer |
| Sugata Sircar | | 60 | | Chief Financial Officer |
Preet Sandhu
R Narasimhan Iyer | | 60 | | Chief Operating Officer |
| Shweta Srivastava | | 48 | | | Executive Vice PresidentChief Human Resource Officer |
Mohor SenVijay Kumar Wadhwani
| | 45 | | Chief Compliance and Ethics Officer |
Below is a summary of the business experience, activities and areas of expertise of our current executive officers.
| | Name and Designation | | Experience and areas of expertise |
 | | Sunil Gupta
Chief Executive Officer | | ● | Sunil comes with global experience in renewable energy, new energy and digital technologies. He has over two decades of experience in managing growth, operational excellence, and profitability of global renewable energy businesses. |
| | | 67● | Prior to Azure Power, Sunil was the Head – South-East Asia and South Asia Business at Vena Energy (a leading Asia Pacific renewable energy company), managing existing business and developing new projects. |
| | | Chief Administration Officer | ● | Prior to that, he was Group Head – Renewable Energy Business at Sembcorp Industries, Singapore, where he built the renewables business and spearheaded market entry in India, Australia, Singapore and Vietnam. |
Directors
Inderpreet Singh Wadhwa, one of our founders, has been our chief executive officer and a member of our Board of Directors since January 2015, has been the chief executive officer and director of AZI since
November 2008 and was elected as the Chairman of the Board of Directors in June 2017. He has over 20 years of experience in technology and infrastructure businesses. Prior to founding AZI, Mr. Wadhwa previously served as a vice president of Loyalty Lab and a senior director of Oracle Corporation. Mr. Wadhwa received his Bachelor’s degree in Electronics Engineering in 1994 from Guru Nanak Dev University (Punjab). He also graduated from Haas School of Business at University of California Berkeley in 2002.
We believe Mr. Wadhwa is qualified to serve as the Chairman of our Board of Directors because of his extensive experience in infrastructure projects and prior board service as a director of AZI.
Harkanwal Singh Wadhwa has been a member of our Board of Directors since August 2015 and has been a director and chief operating officer of AZI since November 2008. He heads the utilities business unit of the organization and focuses on project development and the internal operations of the company. Prior to joining AZI, Mr. Wadhwa served as chief managing director of National Insurance Limited, India’s largest public insurance organization. He has over 40 years of experience in the financial services industry in India. He served and/or serves on the boards of General Insurance Corporation of India, India International Insurance Private Limited and Loss Prevention Association of India Limited and has extensive experience with the regulatory framework in India. Mr. Wadhwa received his Bachelors of Arts degree from Punjab University in 1963.
We believe Mr. Wadhwa is qualified to serve as a member of our Board of Directors because of his excellent operations and management skills.
Robert Kelly has been a member of our Board of Directors since September 2015 and has been a director of AZI since December 2014. From October 2011 to August 2014, he served as the chief financial officer of SolarCity Corporation in San Mateo, California. From August 2009 to October 2011, he served as chief financial officer of Calera Corporation, a clean technology company. Prior to that, he served as an independent consultant providing financial advice to retail energy providers and power developers and also served in various senior leadership roles at Westinghouse Credit Corporation, Lloyds Bank and The Bank of Nova Scotia. Mr. Kelly served as chief financial officer and executive vice president of Calpine Corporation, an independent power producer, from March 2002 to November 2005, as president of Calpine Finance Company from March 2001 to November 2005, and held various financial management roles with Calpine from 1991 to 2001. Mr. Kelly is also a member of the Board of Directors of Solar Mosaic Inc., a U.S. residential solar lending platform, and Solix Algrediants, Inc. a specialty algae products company for the nutrition and personal care markets. He holds a Bachelor’s degree in Commerce from Memorial University of Newfoundland and an MBA from Dalhousie University, Canada.
We believe Mr. Kelly is qualified to serve as a member of our Board of Directors because of his extensive business experience, relationships with financial institutions and solar companies and prior board service.
Cyril Cabanes has been a member of our board of directors since December 2016. He is currently theVice-President, Head of Infrastructure Transactions, Asia-Pacific at Caisse de dépôt et placement du Québec (CDPQ). He has over 19 years of experience across all facets of infrastructure transactions including acquisitions, financing and fundraising. This includes his term at Marubeni Corp., where he led the Asian IPP investment team in Singapore. Previously, Cyril was Director and Portfolio Manager at Deutsche Bank, where he was responsible for acquisitions, capital raising and product development for Asia-Pacific. Prior to that, Cyril spent 10 years in investment banking and financial markets with RBS, BNP Paribas and UBS. Cyril holds a Masters from ESCP-Europe and an MBA from Drexel University
We believe Mr. Cabanes is qualified to serve as a member of our board of directors because of his extensive experience with the infrastructure sector.
Sanjeev Aggarwal has been a member of our Board of Directors since September 2015 and has been a director of AZI since November 2008. Mr. Aggarwal is a co-founder of Helion Venture Partners and has served
on the boards of Amba Research, MakeMyTrip Limited and UnitedLex Corporation. Prior to Helion Venture Partners, Mr. Aggarwal was the founder and chief executive officer of Daksh. Earlier, he worked for 15 years with leading technology companies serving the domestic Indian market. Mr. Aggarwal led the strategic initiatives at Motorola India and has worked with Digital Equipment Corporation in delivering technology solutions. He has also served as the chief executive officer of 3COM India.
We believe Mr. Aggarwal is qualified to serve as a member of our Board of Directors because of his extensive business experience in the financial industry, relationships with investment firms and prior board service as a director of AZI.
Barney S. Rush has been a member of our Board of Directors since January 2016. He has served on the board of ISO — New England, the electric grid and wholesale market operator for six U.S. states, since October 2013. Since November 2015, he has also been the Senior Representative of Fieldstone Africa, an investment bank raising capital for power projects in Africa. From July 2010 to December 2013, he served as an Operating Partner at Denham Capital Management, L.P., and from July 2003 to November 2009, he served as the CEO of H2Gen Innovations, Inc., a venture capital backed start-up which developed and manufactured skid-mounted hydrogen generators. In addition, Mr. Rush was Group CEO of Mirant Europe and Chairman of the Supervisory Board of Bewag, the electric utility serving Berlin, Germany, from August 1999 to May 2002. Mr. Rush holds a Bachelor’s degree in Social Studies from Harvard College and a Master’s degree in Public Affairs from Woodrow Wilson School of Princeton University.
We believe Mr. Rush is qualified to serve as a member of our Board of Directors because of his extensive business experience in clean-tech and alternative energy industries.
Arno Harris has been a member of our Board of Directors since May 2016. He currently serves as chairman emeritus of the Solar Energy Industry Association and as a board member of Advanced Energy Economy Institute. He founded Recurrent Energy, LLC, in 2006 and held the position of CEO until March 30, 2015, growing it into one of North America’s largest solar project developers before selling the company to Canadian Solar Inc. Prior to his work at Recurrent Energy, LLC, he was CEO of Prevalent Power, Inc. and El Solutions, Inc. (now Suntech Energy Solutions) in addition to founding RedEnvelope, WineShopper.com, and Novo Media Group. Mr. Harris holds a Bachelor’s degree in English Literature from the University of California, Berkeley.
We believe Mr. Harris is qualified to serve as a member of our Board of Directors because of his extensive experience with clean-tech and his widespread background in marketing, sales, and consulting.
Eric Ng Yim On was appointed to our Board of Directors in January 2015 and is one of our resident directors in Mauritius. Mr. Ng has been the chief executive officer of AAA Global Services Ltd. since 2006. Prior to founding AAA Global Services Ltd., Mr. Ng worked for several years with a leading public company listed on the Stock Exchange of Mauritius and served on the board of the holding company as well as its subsidiary companies. Mr. Ng completed his secondary education at the Royal College Curepipe in Mauritius and holds various professional qualifications and memberships, including being a member of the Institute of Chartered Accountants of England and Wales, a member of the International Fiscal Association (Mauritius Branch) and a member of the Mauritius Institute of Professional Accountants.
We believe Mr. Ng is qualified to serve as a member of our Board of Directors because of his extensive experience with public companies and because he is a resident of Mauritius, and two of the members of our Board of Directors are required to be residents of Mauritius under the terms of our Constitution.
Muhammad Khalid Peyrye was appointed to our Board of Directors in January 2015 and is one of our resident directors in Mauritius. Mr. Peyrye is an executive of AAA Global Services Ltd., having joined the organization in 2007. Prior to joining AAA Global Services Ltd., Mr. Peyrye worked for several years with a leading financial services company and accountancy firm. Mr. Peyrye received his Bachelor’s degree in Law
and Management from the University of Mauritius. He has been involved extensively on company formations, company administration, cross-border investment activities and corporate organizational transactions such as mergers and acquisitions and winding-up of companies. In addition to serving as director on the board of several companies in Mauritius, Mr. Peyrye has, in his career, been involved as money laundering reporting officer and compliance officer of various companies involved in the financial services sector.
We believe Mr. Peyrye is qualified to serve as a member of our Board of Directors because of his extensive experience with companies having public accountability and because he is a resident of Mauritius, and two of the members of our Board of Directors are required to be residents of Mauritius under the terms of our Constitution.
Executive Officers
Surendra Kumar Gupta is the chief financial officer and heads the finance and operations along with commercial and industrial business unit (C&I) of the Company. He has over 38 years of international and domestic experience covering strategic business planning, managing business operations and corporate finance. Prior to joining the Company, Mr. Gupta served as the group chief financial officer for Al-Suwaidi Holding Company Limited, a company involved in providing engineering, procurement, construction and maintenance services to Saudi Arabia’s predominant oil and gas industry, from 2007 to 2010. Mr. Gupta received his Bachelor’s degree in Commerce in 1972 from Delhi University. He is a chartered accountant and has been a member of the Institute of Chartered Accountants of India since January 1977.
Preet Sandhu is an executive vice president and heads the Infra business unit of the Company, which covers engineering, procurement, supply chain management, R&D, quality and safety, health and environment. He has over 20 years of experience in civil construction and project development in regulated sectors in India with expertise in transportation, energy and land development. Mr. Sandhu manages engineering and construction for AZI’s projects.
Mohor Sen is the chief administration officer and heads the shared service division of the Company, which covers human resources, marketing and communication, IT and corporate operations of the Company. Mr. Sen has over 40 years of experience working and consulting for corporations in areas including project management, human resources, organizational development and strategic communications. Prior to joining the Company, Mr. Sen provided consulting services to AZI from January 2013 to January 2014. Prior to that, from 2008 to 2013, he provided consulting services to other companies in India, including Reinforced Earth Company and Geopetro International Holding Inc. Mr. Sen received his Bachelor’s degree in Technology from the Indian Institute of Technology Delhi and a Masters of Science from the University of Manchester in the United Kingdom.
B. Compensation
Director Compensation
During fiscal year 2017, we paid cash compensation to Mr. Inderpreet S. Wadhwa and Mr. Harkanwal S. Wadhwa and also granted non-cash compensation to our employees and Directors, in the form of stock options. All options previously granted to employees under the AZI’s employee stock option plan and Employee Stock Option Plan 2015 have been transferred and replaced by options issued pursuant to our 2016 Equity Incentive Plan. The options outstanding as of March 31, 2017 are disclosed separately in the table under “Item 6 — Directors, Senior Management and Employees — B. Compensation—Outstanding Options for Directors and Senior Management.”
Officer Compensation
For the fiscal year 2017, the aggregate compensation (including directors’ fees, but excluding grants of stock option to our directors and executive officers included in the list under the heading — “Item 6A —
Directors, Senior Management and Employees — A. Directors and senior management” was INR 95.1 million (US$1.50 million). Our agreements with each of the members of senior management are listed under the heading “Employment Agreement”. Except as otherwise disclosed, the above cash compensation does not include stock compensation and employee benefits to our Directors and Senior Management.
Employee Benefit Plans
We maintain employee benefit plans in the form of certain statutory and incentive plans covering substantially all of our employees. For fiscal year 2017, the aggregate amount set aside or accrued by us to provide for pension or retirement benefits for executive officers was INR 3.2 million (US$0.1 million).
Provident Fund
In accordance with Indian law, all of our employees in India are entitled to receive benefits under the Employees’ Provident Fund Scheme, 1952, as amended, a retirement benefit scheme under which an equal amount of 12% of the base salary of an employee is contributed both by employer and employee in a fund with government/trust with company.
Gratuity
In accordance with Indian law, we pay gratuity to our eligible employees in India. Under our gratuity plan, an employee is entitled to receive a gratuity payment on his superannuation or on his retirement or on the termination of his or her employment if the employee has rendered continuous service to our company for not less than five years, or if the termination of employment is due to death or disability due to accident or disease. The amount of gratuity payable to an eligible employee is equal to 15 days’ salary based on the last drawn salary for every completed year of employment (or any portion of a year exceeding six months), and currently the aggregate amount of gratuity shall not exceed INR 1,000,000.
Leave Encashment Policy
Under AZI’s leave encashment policy, an employee is entitled to receive a payment in exchange for any accrued leave of absence exceeding 45 days that is outstanding as of April 1 of each fiscal year. Such payment shall be made to the employee by April 30 of that year. In the event of resignation, termination of employment or retirement, an employee is entitled to a payment for the accrued leave of absence up to a maximum of 45 days if the employee has spent at least 240 working days at AZI. The amount of payment to be made for each day of such accrued leave of absence shall be calculated by dividing the last drawn monthly base salary by 30 days.
Employment Agreements
Most of our executive officers have entered into an employment agreement with AZI. Aside from the employee benefit plans, our employment agreements do not provide for any special termination benefits, nor do we have any other arrangements with our directors for special termination benefits.
Each executive officer has acknowledged that ownership of any intellectual property created by him for the company shall vest in the company. Additionally, Mr. Inderpreet Singh Wadhwa and Mr. Preet Sandhu have also agreed to transfer and assign to the company all rights, title and interest in and to all the trademarks, trade names, brand names, patents, designs, domain names and other intellectual property rights created by them for the company.
In addition, each executive officer has agreed to be bound by the non-competition and non-solicit restrictions set forth in his employment agreement. Specifically, each executive officer has agreed, while employed by us and for a period of one year after termination of his employment, not to:
directly or indirectly, enter into the employment of, tender consulting or other services to, acquire any interest in, or otherwise participate in any business that competes, directly or indirectly, with any of the
| | | | | ● | In India, he was instrumental in managing businesses comprising of multiple utility scale wind and solar power generation plants. |
| | | | ● | As a cleantech industry professional, Sunil has also worked with Standard Chartered Bank and Morgan Stanley and has extensive experience in Investment Banking and Corporate Finance. |
| | | | ● | Sunil earned his MBA from Indian Institute of Management, Ahmedabad and B. Tech from Indian Institute of Technology, Delhi. |

| | Sugata Sircar | | ● | Sugata joined the Company as CFO for the Company and the Group and Executive Director Finance for APIPL, after resigning from his position as Independent Director. |
| Chief Financial Officer | | ● | He has over 32 years of experience of which more than 20 years were as CFO, most recently being as CFO at Schneider Electric India. He has worked in various industries including energy and automation, tires, city gas distribution and FMCG. |
| | | ● | He was with Gujarat Gas (subsidiary of British Gas UK) as Finance Director and CFO and then as Managing Director. He also worked with Cabot India, Madura Coats, Britannia Industries and Dunlop. |
| | | ● | His expertise is in partnering strategy building and execution, business performance management; leading business integration and transformation projects; merger and acquisition; governance, compliances, business risk management. |
| | | ● | He is a Chartered Accountant 1989 and has done advanced management programs from Harvard Business School, Kellogs and ISB. |

| | R Narasimhan Iyer | | ● | R Narasimhan Iyer has over 30 years of experience in business operations, strategic execution, power transmission, distribution, metering and renewable energy generation space. |
| Chief Operating Officer | | ● | He holds deep experience in energy sector technologies and robust understanding of energy policies, strategies, institutions and regulations. |
| | | ● | He served as Director Operations at SB Energy (SoftBank Group) and has also worked with companies or entitieslike SunEdison, Schneider Electric, Secure Meters, IBM, and ABB in various roles like roles and capacities. |
| | | ● | He holds a degree in Electrical and Electronics Engineering from Birla Institute of Technology and Science, Pilani and a Gold Medalist in Post Graduate Diploma in International Business from Indian Institute of Foreign Trade, New Delhi. |

| | Shweta Srivastava | | ● | Professional with more than 20 years of diverse human resources experience in Fortune 500 corporations, across industries like hi-tech, consumer, life sciences and infrastructure. |
| Chief Human Resource Officer | | ● | She has diverse experience of working across 14 countries in the same linesMiddle East and Southeast Asia, UK and other international regions. She has led large teams and worked closely with senior management. |
| | | ● | During past years, she has assumed responsibilities spanning various HR functions in Talent Acquisition, Business Partnering, Leadership and OD, Diversity and Inclusion, Employee Engagement, HR Strategy and Growth. |
| | | ● | Her prior experiences include Vedanta Ltd. As the Group Head Talent Acquisition, Sterlite Power (part of business that the company is engagedVedanta Group) as people strategy lead and other senior leadership positions at Indus Towers Limited, United health Group, Qualcomm, Motorola and Ericsson. |
| | | ● | She holds master’s in at the time the employment is terminated; norhuman resources from Pune University and has bachelor’s from Ambedkar University. She has also done Leadership Excellence Program from Harvard Business School. |
solicit, encourage, or induce or attempt to solicit, encourage, or induce any employee or customer, or prospective employees and customers with whom the company has had discussions or negotiations within the last six months of the termination of his employment not to establish a relationship with the company.
The employment agreement for Mr. Surendra Kumar Gupta specifies that he is not to be associated with any competitor of the company whatsoever for a period of at least 12 months after termination of his employment and that he will not solicit or entice any of the company’s customers or any other employee working in the company during or at any time after the termination of their employment.
Equity-Based Compensation
The Company, post the completion of the initial public offering, adopted the 2016 Equity Incentive Plan, existing Employee Stock Option Plan 2015 has been discontinued for issuance of new grants and the outstanding ESOP pool available for issuance of new grants has been transferred to 2016 Equity Incentive Plan.
Our 2016 Equity Incentive Plan is a comprehensive incentive compensation plan under which we can grant equity-based and other incentive awards to our officers, employees and directors.
The objective of the plan is (i) to provide means to enable us to attract and retain high quality human resources in our employment; (ii) to make the compensations and rewards competitive in the market; and (iii) to achieve sustained growth and create shareholder value by aligning the interests of the employees with our long term interests.
Pursuant to the U.S. securities laws and regulations, we have filed Form S-8 for registration of equity shares issuable upon exercise of ESOP grants under our 2016 Equity Incentive Plan with the SEC.
As of March 31, 2017, we had 540,280 equity shares issuable pursuant to the exercise of any outstanding options granted under the ESOP plans and 483,464 equity shares available for issuance pursuant to awards (including the exercise of any options) to be granted under the 2016 Equity Incentive Plan.
The following paragraphs further describe the principal terms of the 2016 Equity Incentive Plan.
Administration
We have appointed Computershare Trust Company, N.A. as plan administrator for the administration of options, including the ESOPs.
Number of Shares Authorized for Grant
Under the terms of the 2016 Equity Incentive Plan, which may be amended from time to time, the sum of all grants made under the equity incentive plan shall not exceed 10% of our total issued and subscribed equity capital.
Eligibility
Our compensation committee may grant options to all eligible employees on the basis of the following criteria: position, role and performance of the employee, tenure in organization and such other factors as the compensation committee may decide from time to time.
Vesting Schedule
The grants made to any individual shall be vested in the following manner:
25% on the expiry of 12 months from the date of grant;
25% on the expiry of 24 months from the date of grant;
25% on the expiry of 36 months from the date of grant;

| | Vijay Wadhwani | | ● | Leading our compliance and ethics program as well as management assurance and internal audit function. Highly accomplished, results driven senior accounting and financial management executive with more than 18 years of progressive experience. |
| Chief Compliance and Ethics Officer | | ● | Worked as a part of the Big 4 audit firm with diverse skills in client management and expertise in managing statutory audit, process consulting and group reporting. |
| | | ● | Experience of working in complex environment with applicability of US GAAP, IFRS and Indian GAAP (now Ind-AS). |
| | | ● | He was working with S.N. Dhawan & CO LLP (Member firm of Mazars in India). Previously worked with Minda Industries Limited and S. R. Batliboi & Co. LLP (Ernst & Young). |
| | | ● | He is Chartered Accountant (May 2001), IBBI Registered Valuer (RV) (Oct 2021). |
25% on the expiry of 48 months from the date of grant.
Option Exercise
There shall be no lock-in period after the options have vested and the options must be exercised by the employees before the end of the tenure of the plan.
Amendment or Termination
Our Board of Directors may in its absolute discretion amend, alter or terminate the 2016 Equity Incentive Plan from time to time, provided that no amendment, alteration or termination in any grant would impair or prejudice the rights of the employee without the consent of the employee, and provided further that the Board of Directors may not, without the approval of the shareholders, amend the 2016 Equity Incentive Plan (1) to increase the aggregate number of shares which may be issued pursuant to the provisions of the equity incentive plan on exercise, surrender of options or upon grants; (2) to change the option exercise price; or (3) to extend the maximum period during which the grants may be made under the plan.
Outstanding Options for Directors and Senior Management
Outstanding options per the S-8 filed on April 18, 2017, under our ESOP plans are:
| | | | | | | | | | |
Name | | Equity Shares
Underlying
Outstanding
Options | | | Exercise Price
per share
(US$ per share) | | | Date of
expiration |
Inderpreet Singh Wadhwa | | | 118,896 | | | | 0.01 | | | July, 20, 2025 |
| | | |
Arno Harris | | | 180,292 | | | | 13.71 | | | July, 20, 2025 |
| | | |
Harkanwal Singh Wadhwa | | | 3,680 | | | | 0.01 | | | July, 20, 2025 |
| | | 40,000 | | | | 4.73 | | | July, 20, 2025 |
| | | |
Preet Sandhu | | | 2,944 | | | | 0.01 | | | July, 20, 2025 |
| | | 10,368 | | | | 1.76 | | | July, 20, 2025 |
| | | 39,200 | | | | 2.71 | | | July, 20, 2025 |
| | | |
Robert D. Kelly | | | 53,650 | | | | 9.35 | | | July, 20, 2025 |
| | | |
Surendra Kumar Gupta | | | 9,024 | | | | 0.01 | | | July, 20, 2025 |
| | | 9,600 | | | | 2.71 | | | July, 20, 2025 |
| | | 19,200 | | | | 4.73 | | | July, 20, 2025 |
| | | |
Gaurav Sharma | | | 87,648 | | | | 2.71 | | | July, 20, 2025 |
| | | |
Mohor Sen | | | 960 | | | | 0.01 | | | July, 20, 2025 |
| | | |
Others | | | 65,128 | | | | 6.50 | | | July, 20, 2025 |
| | | |
Total | | | 640,590 | | | | | | | |
Indemnification Agreements
We have obtained Directors’ and Officers’ liability Insurance to indemnify the Directors and executive officers against certain liabilities and expenses arising from their being a director or officers.
C. B.Board Practices
Board of Directors
We are
Our Company is managed and controlled by its Board. As on March 27, 2024, our Board of Directors. Our Board of Directors consists of nine directors. Our Boardeight directors, of Directors does not have a majoritywhom five are independent non-executive directors and two of independent directors.whom are women. As a foreign private issuer, we are permitted to follow home country corporate governance practices. Certain corporate practice in Mauritius, which is our home country, may differ significantly from the NYSE corporate governance listing standards.standards in other jurisdictions including the NYSE. Unlike the requirements of the NYSE, the corporate governance practice and requirements in Mauritius do not require us as a GBC1
| ● | to have the majority of our Board of Directors be independent; do not require us as a GBC1 to establish a nominations committee; and do not require us to hold regular executive sessions where only independent directors shall be present. In June 2017, the board of the Company established a nominating and corporate governance committee, which will review the corporate governance practices of our Board be independent; |
| ● | to have all our members of our compensation committee or our nomination and corporate governance committee to be independent directors; |
| ● | to have a nomination committee; or |
| ● | to hold regular executive sessions where only independent directors shall be present. |
Please refer “Corporate Governance” section for exceptions availed by the Company.
Terms of Directors and Executive Officers
In accordance with our Company’s Constitution, one-third of our Company’s directors (or, if their number is not a multiple of three, the number nearest to but not greater than one-third) shall be up for re-election by rotation at each annual meeting of our company. The Chairman of the Board and/or the managing director during the tenure shall not be subject to retirement by rotation or be taken into account in determining the number of directors to retire in each year. Any director appointed by the Board after the last annual meeting shall be taken into account in determining which particular directors or the number of directors who are to retire by rotation. The directors up for re-election in each year shall be those who have been in office longest since their last re-election or appointment and as between persons who became or were last re-elected directors on the same day, those up for re-election shall (unless they otherwise agree among themselves) be determined by lot. Any director may be removed by either an ordinary resolution of our shareholders or by the majority vote of the Board of Directors in the following circumstances: for cause, which refers to willful misconduct, fraud, conviction of a felony, gross negligence or breach of a written policy of the company; or if the director becomes mentally unsound or bankrupt or becomes disqualified from being a director under Mauritius law.
Under Mauritius law, the office of a director of our company is required to become vacant at the conclusion of the Company’s annual meeting of our company commencing next after the director attains the age of 70 years. However, a person ofaged 70 or over, the age of 70 years may, by ordinary resolution of which no shorter notice is given than that required to be given for the holding of a meeting of shareholders, be appointed or re-appointed or authorized to continue to hold office as a director until the next annual meeting at which such director’s class is up forre-election.
A vacancy on the Board of Directors mustmay be filled by a majority vote of our Board of Directors or by ordinary resolution of the shareholders.
Executive officers are selected by and serve at the discretion of the Board of Directors.Board.
Duties of Directors
Under Mauritius law, ourthe Company’s directors have a duty to our company to exercise their powers honestly in good faith and in the best interests of our company. Ourthe Company. The directors also have a duty to our company to exercise the degree of care, diligence and skill that a reasonably prudent person would exercise in comparable circumstances. Where a director of a public company also holds office as an executive, the director is required under Mauritius law to exercise that degree of care, diligence and skill which a reasonably prudent and competent executive in that position would exercise. In fulfilling their duty of care to our company, ourthe Company, the directors must ensure compliance with the Mauritius Companies Act and ourthe Company’s Constitution, as amended from time to time. A shareholder has the right to seek damages against ourthe Company’s directors if a duty owed by ourthe directors to him as athe shareholder is breached.
The functions and powers of ourthe Board of Directors include, among others:
Convening shareholders’ annual meetings and reporting its work to shareholders at such meetings;
Authorizing dividends and distributions;
| ● | Convening shareholders’ annual meetings and reporting its work to shareholders at such meetings; |
Appointing officers and determining the term of office of officers;
| ● | Authorizing dividends and distributions; |
Exercising the borrowing powers of our company and mortgaging the property of our company, provided that shareholders’ approval shall be required if any transaction is a major transaction for our company under section 130 of the Mauritius Companies Act, which includes, among others, acquisitions and dispositions worth more than 75% of the value of our company’s assets; and
| ● | Appointing officers and determining the term of office; |
approving the issuance and transfer of shares of our company,
| ● | Exercising the borrowing powers of the Company and mortgaging the property of the Company, provided that shareholders’ approval shall be required if any transaction is a major transaction for the Company under section 130 of the Mauritius Companies Act, which includes, among others, acquisitions and dispositions worth more than 75% of the value of the Company’s assets; and |
| ● | Approving the issuance and transfer of shares of the Company, including the recording of such shares in our share register. |
Subject to the Mauritius Companies Act, ourthe Board of Directors may delegate any one or more of its powers to (i) a committee of directors, (ii) a director or employee of the company,Company (iii) or any other person, any one or moreperson.
C.Management Compensation
Directors and Officers Compensation
For FY 2023, the aggregate compensation (excluding grants of its powers.
Additional Restrictions
A. For so long as International Finance Corporationstock options) to our Chief Executive Officer, Chief Financial Officer and IFC GIF Investment Company I together hold at least 5% (five percent)Chief Operating Officer was INR 133 million (US$1.6 million), and INR 14 million (US$0.2 million) towards fees paid to our Directors. Our binding agreements with each of the share capitalmembers of senior management are listed herein under “Employment Agreement”. Except as otherwise disclosed, the above cash compensation does not include stock compensation and employee benefits to our directors and senior management.
In FY 2023, our Board approved the Amended Directors Compensation Plan 2022 which is effective from October 1, 2022 for independent non-executive Directors not drawing salaries before and the policy is as follows:
| A. | Annual Retainer for board membership - US$50,000 per director |
| B. | Annual Retainer for committee membership - US$5,000 per committee for Audit and Risk, Compensation and Capital Committees. US$3,000 per committee for Nomination and Governance and Sustainability and CSR Committees. |
| C. | Annual Retainer for board and committee chairs – |
| a) | Chairman of the Board (non-executive): US$50,000 |
| c) | Investment and Capital: US$15,000 |
| d) | Compensation, Nomination and Governance and Sustainability and CSR: US$8,000 |
| E. | Restricted Stock (“RS”) will be granted to directors in accordance with the following schedule: |
| a. | A scale of the RS grants as follows: |
| 1. | Year 1: from October 1 (the beginning of the first full year of the board service) to September 30 of the next year: US$20,000. |
| 2. | Year 2 at the outset of the second full year on October 1: US$40,000. |
| 3. | Year 3 at the outset of the third full year on October 1: US$60,000. |
| 4. | Year 4 and beyond at the outset of the fourth full year on October 1: US$75,000. |
| b. | The amount of the RS granted will be valued as of October 1 of the year in question, with the RS equal to the corresponding US$ value, divided by the FMV of the stock price on October 1 (or the next business day) of that year, determined as set out in the Equity Incentive Plan 2016, as amended from time to time. |
| c. | RS grants will be administered as per the Equity Incentive Plan 2016, as amended. |
| d. | The RS grants will be subject to a Period of Restriction of 18 months from the day of grant provided the director remains on the Azure Power board; and provided further that: |
| 1. | if the director voluntarily resigns (or leave the board for other reasons other than for Cause) from the board during a year of service, the Period of Restriction on RS granted for that year will lapse immediately on a pro-rata basis determined as a percentage of days served for that year, and further, the Period of Restriction on the prior year’s award will also lapse if it has not lapsed already; |
| 2. | if a director is removed for Cause, all RS for which the Period of Restriction has not lapsed, regardless of when granted, will be forfeit; and |
| e. | The RS under Period of Restriction will not have voting rights or rights to any dividends or any other distribution from the Company. |
| f. | It is hereby clarified that the granting of RS will be in the form of a letter of grant and RS shall only be transferable to the name of the director when they are earned by the director, which shall be deemed to occur at the end of the Period of Restriction (provided the director remains on the Azure Power Board) or upon the lapsing of the Period of Restriction as evoked in paragraph d1 above. On account of the possibility (albeit remote) that RS may have to be forfeited (as evoked in paragraph d2), the director shall be deemed not to be owed any RS or any other form of emoluments in lieu of the RS until the end of the Period of Restriction / lapsing of the Period of Restriction as stated above. |
The Company’s Board of Directors approved during FY 2024 that all compensation payable to the eligible directors against the RS will be paid in cash at release of the pending financials of the Company for the decisions onrespective financial years.
Remuneration payable under the Directors Remuneration Plan are subject to following matters shall not be taken and/or implemented byrespective conditions:
| a. | Affiliated or nominated directors have elected not to receive any compensation from Company for the time being, |
| b. | Unless otherwise determined, the Mauritian directors will not be covered under this Policy and will be paid as arrangement agreed with AAA Global Services Limited. |
Equity-Based Compensation
Our Company, during FY 2017, adopted the Company unless approved by way of a special resolution of shareholders:
a. amendment to the articles of association or memorandum of association of Azure Power India Private Limited and its subsidiaries, provided that any amendment to the articles of association or memorandum of association of the Company’s subsidiaries (other than Azure Power India Private Limited) shall not requireamended Equity Incentive Plan “2016 Equity Incentive Plan (as amended in 2017)” with approval of the shareholders of the Company if suchobtained at the Annual Meeting held on September 25, 2017. The Company increased the pool size of the existing Stock Option pool by one million shares which took the total pool size to 2,023,744 shares. On April 30, 2020, Company further adopted the amended Equity Incentive Plan “2016 by Equity Incentive Plan (as amended on March 31, 2020). The amendment will require that the fair market value of the Grants to be based on the 10-day daily volume weighted closing price average up to and including the date of determination and some minimal drafting corrections of the Plan.
Our 2016 Equity Incentive Plan (as amended on March 31, 2020) is carried outa comprehensive incentive compensation plan under which we can grant equity-based and other incentive awards to our officers, employees and directors.
The objective of the plan is (i) to provide means to enable us to attract and retain high quality human resources in our employment; (ii) to make the compensations and rewards competitive in the market; and (iii) to achieve sustained growth and create shareholder value by aligning the interests of the employees with our long term interests.
Pursuant to the U.S. securities laws and regulations, we have filed with the SEC a Form S-8 for registration of shares issuable upon exercise of ESOP grants under our 2016 Equity Incentive Plan (as amended in 2017).
As of March 31, 2023, we had 415,813 equity shares issuable pursuant to a project finance, working capital limits, non-fund based facilities, mezzanine financing (if the amount raised is less than 20%exercise of any outstanding options granted under the ESOP plans, the 2016 Equity Incentive Plan and the 2016 Equity Incentive Plan (as amended on March 31, 2020).
The following paragraphs further describe the principal terms of the paid-up share capital of the Company) or any other financing arrangements (if the amount raised is less than 20% of the paid-up share capital of the Company) raised for the Company’s subsidiaries (other than Azure Power India Private Limited) that have been approved by the Board or Board delegated committee of the Company;2016 Equity Incentive Plan (as amended on March 31, 2020).
b. disposal or sale, in a single transaction or a series of related transactions, of more than 50% of the Company’s assets (on a consolidated basis), or entry into a single transaction or a series of related transactions where the Company will incur obligations or liabilities (on a consolidated basis) the value of which is more than 50% of the Company’s assets (on a consolidated basis) before such transaction or series of related transactions;
c. any change in the businessAdministration
The Compensation, Nomination and Governance Committee of the Company or its subsidiaries, such business being understoodis the sole administrator for the administration of options, including the ESOPs. Computershare Trust Company, N.A. has been appointed as plan administrator. The Company has total 2,304,732 shares which are Authorized for Grant as of March 31, 2023.
Under the terms of the 2016 Equity Incentive Plan (as amended on March 31, 2020), which may be amended from time to mean and includetime, the activities that Azure Power India Private Limited is authorized to carry outsum of all grants made under the Main Objects clauseequity incentive plan shall not exceed 10% of our total issued and subscribed equity capital.
Eligibility
Our compensation, nomination and governance committee may grant options to all eligible employees on the basis of the memorandumfollowing criteria: position, role and performance of associationthe employee, tenure in organization and such other factors as the compensation committee may decide from time to time.
Vesting Schedule
The grants made to any individual shall be vested in the following manner:
| ● | 25% on the expiry of 12 months from the date of grant; |
| ● | 25% on the expiry of 24 months from the date of grant; |
| ● | 25% on the expiry of 36 months from the date of grant; and |
| ● | 25% on the expiry of 48 months from the date of grant. |
Option Exercise
There shall be no lock-in period after the options have vested and the options must be exercised by the employees before the end of Azure Power India Private Limitedthe tenure of the plan. In case of termination of services other than not for cause as per the Plan, employees can exercise the options vested as on the last day of employment, as per the respective Post Termination Exercise Period Policy as stated in effecttheir letter of awards.
Restricted Stocks
As part of the Directors Remuneration Plan our Company also granted shadow Restricted Stock (as provided above) during FY 2023 to be vested in 18 months from grant date but accelerated for retirement at the end of a term or involuntary retirement if not for cause. On exercise of these RS, amount payable by our Company will be the number of RS awarded multiplied by the price of the common stock on 22 July 2015;the date the RS are exercised. See section above “B. Compensation, (Directors and Officers Compensation)”.
d.
Amendment or Termination
Our Board may in its absolute discretion amend, alter or terminate the 2016 Equity Incentive Plan (as amended on March 31, 2020) from time to time, provided that no amendment, alteration or termination in any amendmentgrant would impair or prejudice the rights of the employee without the consent of the employee, and provided further that the Board may not, without the approval of the shareholders, amend the 2016 Equity Incentive Plan (as amended on March 31, 2020) (1) to increase the aggregate number of shares which may be issued pursuant to the provisions of the equity incentive plan on exercise, surrender of options or upon grants; (2) to change the option exercise price; or (3) to extend the maximum period during which the grants may be made under the plan.
Outstanding Options for Directors and Senior Management
Outstanding options as of March 31, 2023 under our ESOP/RS plans are as follows:
| Name | | Equity Shares Underlying Outstanding Options | | | Exercise Price per share
(US$ per share) | | | Date of expiration(1) |
| Supriya Prakash Sen | | | 1,402 | | | | 0 | | | August 30, 2027 |
| Others | | | 414,411 | | | | 10.73 to 27.98 | | | July 20, 2025 –
August 30, 2027 |
| Total | | | 415,813 | | | | | | | |
Note: 1. For all the grants issued prior to March 31, 2020, in the event that a participant of our ESOP plan approved byterminates their service with our Company, the Board, except as would notPost Termination Exercise Period shall be: i) 90 days if they served for less than 3 years; ii) 2 years if the service period was more than 3 years but less than 4 years; or iii) an incremental year will be added to the exercise period for each year of service beyond 4 years up to a “material revision” as such term is defined in Section 303A.08maximum period co-terminus with the Equity Incentive Plan 2016 (as amended on March 31, 2020). However, for all the grants issued post March 31, 2020, the Post Termination Stock Option Exercise Periods (“PTEP”) policy was amended to six-month expiration on all new grants awarded.
Indemnification Agreements
We have obtained liability Insurance to indemnify the Directors and executive officers of the New York Stock Exchange Listedour Company Manual.
B. For so long as International Finance Corporation and/against certain liabilities and expenses arising from their being a director or IFC GIF Investment Company I hold any equity shares ofofficers. In addition, the Company the Company shall not, in a single transaction, issue equity shares or share equivalents that are more than 10% (ten percent) of the share capital of the Company, unless approved by the shareholders of the Company by way of an ordinary resolution.has executed indemnity agreements with directors and officers.
D.Board Committees
Our Board of Directors has established the following committees: audit committee, nominatingAudit and corporate governance committee,Risk Committee, Compensation, Nomination and compensation committee. Governance Committee, and Sustainability and Corporate Social Responsibility Committee. These committees assist in the effective functioning of the Board and help them to ensure that the views of directors are effectively represented.
We have written charters for the responsibilities of committees and these are reviewed and approved by the Board on annual basis. The charters of committees are available on our company website. Special committees may be formed from time to time as required to review particular matters or transactions.
Each committee’s members and functions are described below.
Audit Committee
The initial members of our audit committee consisted of Mr. Robert Kelly and Mr. Sanjeev Aggarwal. The same has been reconstituted to include Mr. Arno Harris as the third member of the Committee. Each of these individuals satisfies the independence requirements set forth in the New York Stock Exchange’s Listed Company Manual. They also satisfy the independence requirements of Rule 10A-3 under the Securities Exchange Act of 1934, or the Exchange Act. Risk Committee
Our Board of Directors also has determined that Mr. Kelly qualifies as an audit committee financial expert within the meaning of the SEC rulesAudit and has been appointed as the Chair of the Committee. Our audit committeeRisk Committee oversees our accounting and financial reporting processes and the audits of the financial statements of our company. Our audit committee is responsible for, among other things:
It consists of a chairperson, Mr. Richard Payette, and two members, Ms. Supriya Prakash Sen and Mr. Jean-François Boisvenu.
Selecting our independent auditors and pre-approving all auditing and non-auditing services permitted to be performed by our independent auditors;
Reviewing with
Mr. Richard Payette was appointed as new Chairperson of the independent auditors any audit problems or difficulties and management’s response;
Regularly reviewing the independence of our independent auditors;
Reviewing and approving all related party transactions on an ongoing basis;
Discussing the annual audited financial statements with management and our independent auditors;
Reviewing the adequacy and effectiveness of our accounting and internal control policies and procedures and any steps takenCommittee effective July 1, 2023 (replacing Ms. Christine Ann McNamara who had been in office from March 1, 2022 to monitor and control major financial risk exposures;
Monitoring compliance with our code of business conduct and ethics, including reviewing the adequacy and effectiveness of our procedures to ensure proper compliance;
Meeting separately and periodically with management and our internal and independent auditors;
Reporting regularly to our full Board of Directors; and
Such other matters that are specifically delegated to our audit committee by our Board of Directors from time to time.
Compensation Committee
Initially our compensation committee consisted of Mr. Sanjeev Aggarwal and Ms. Diane Farrell. The same has been reconstituted to replace Ms. Diane Farrell with Mr. Barney Rush and to addJune 26, 2023). Mr. Arno Lockheart Harris asresigned from the thirdmembership of the Committee effective May 31, 2022. Mr. Sugata Sircar was appointed as member of the Committee. Presently,Audit and Risk Committee with effect from October 1, 2022 but left the role on April 30, 2023 to become the CFO. Mr. Barney Rush is the ChairmanJean-François Boisvenu was appointed as member of the Committee. EachAudit and Risk Committee on March 15, 2023.
We have determined that Mr. Payette is an “audit committee financial expert” as defined in Item 16A(b) of these individuals satisfiesForm 20-F. For further information, see “Management and Employees – Management”.
| Mr. Richard Payette | Chairperson |
| Ms. Supriya Prakash Sen | Member |
| Mr. Jean-François Boisvenu | Member |
Responsibilities include:
| ● | Providing oversight of financial reporting and related internal controls; |
| ● | Appointment, compensation and oversight of the independent auditors and pre-approving all auditing and non-auditing services permitted to be performed by independent auditors; |
| ● | Reviewing significant accounting and reporting issues to understand potential impact on financial statements and management’s response; |
| ● | Reviewing and approving of all related party transactions on an ongoing basis; |
| ● | Discussing the annual audited financial statements and quarterly financial statements with management and independent auditors; |
| ● | Reviewing the adequacy and effectiveness of our accounting and internal control policies and procedures and any steps taken to monitor and control major financial risk exposures; |
| ● | Monitoring compliance with our code of business conduct and ethics, including reviewing the adequacy and effectiveness of our procedures to ensure proper compliance; |
| ● | Meeting separately and periodically with management and our internal and independent auditors; |
| ● | Reporting regularly to the Board; |
| ● | Reviewing and approving the Enterprise Risk Management Policy, risk register, mitigation plans, monitoring plan, and test reports; and |
| ● | Such other matters that are specifically delegated to our audit and risk committee by our Board from time to time. |
Compensation, Nomination and Governance Committee
Our Compensation, Nomination and Governance Committee purpose is to assist the independence requirements set forthBoard in the New York Stock Exchange Listed Company Manual. Our compensation committee assists our Board of Directors in reviewing and approving the compensation structure of our directors and executive officers, including all forms of compensation to be provided to our directors and executive officers.fulfilling its responsibilities. Members of the compensation committeeCompensation, Nomination and Governance Committee are not prohibited from direct involvement in determining their own compensation.
Our Compensation, Nomination and Governance Committee consists of three members. Mr. Cyril Sebastien Dominique Cabanes resigned as member of the Compensation, Nomination and Governance Committee on October 30, 2023. Mr. Philippe Pierre Wind was appointed as member of the Compensation Committee on December 5, 2023. Each of our compensation committee members qualifies as a “non-employee director” within the meaning of Rule 16b-3 of the Exchange Act.
Our Company’s chief executive officer may not be present at any committeeCompensation, Nomination and Governance Committee meeting during which his compensation is deliberated. The compensation committee is responsible for, among other things:
Reviewing and approving the compensation package for our executive officers;
Reviewing the compensation of our executive officers and directors and making recommendations to the board with respect to the compensation;
| Ms. Supriya Prakash Sen | Member |
| Ms. Delphine Voeltzel | Member |
| Mr. Philippe Pierre Wind | Member |
Reviewing and approving corporate goals and objectives relevant to the compensation of our chief executive officer, other executive officers and directors evaluating the performance of our chief executive officer, other executive officers and directors in light of those goals and objectives, and setting the compensation level of our chief executive officer, other executive officers and directors based on such evaluation; and
Reviewing periodically and making recommendations to the board regarding any long term incentive compensation or equity plans, programs or similar arrangements, annual bonuses, employee pension and welfare benefit plans.
NominatingResponsibilities include:
Compensation
| ● | Reviewing and approving the compensation package for our executive officers; |
| ● | Reviewing the compensation of our executive officers and directors and making recommendations to the board with respect to the compensation; |
| ● | Reviewing and approving corporate goals and objectives relevant to the compensation of our chief executive officer, other executive officers and directors evaluating the performance of our chief executive officer, other executive officers and directors in light of those goals and objectives, and setting the compensation level of our chief executive officer, other executive officers and directors based on such evaluation; and |
| ● | Reviewing periodically and making recommendations to the board regarding any long-term incentive compensation or equity plans, programs or similar arrangements, annual bonuses, employee pension and welfare benefit plans. |
Nomination and Corporate Governance Committee
| ● | Reviewing and making recommendations to the Board with respect to corporate governance guidelines and issues; |
| ● | Identifying qualified candidates as consistent with the criteria approved by the Board for director nominees and recommending such candidates to the Board for selection for all directorships to be filled by the Board, in conjunction with the Chairman of the Board; |
| ● | Nominating the chairs and members of the Board committees, in conjunction with the Chairman of the Board; and |
| ● | Conducting annual reviews of the Board’s independence, qualifications, and experiences in light of the availability of potential Board members; and oversee the evaluation of the Board. |
We established a Nominating
Sustainability and Corporate GovernanceSocial Responsibility Committee in June 2017.
The NominatingSustainability and Corporate GovernanceSocial Responsibility Committee (“Sustainability and CSR Committee”) consists of two members. Mr. Barney Rush, Mr. Robert Kelly, Mr. Sanjeev Aggarwal, and Mr. Cyril Cabanes. Each of these individuals satisfies the “independence” requirementsDeepak Malhotra resigned as member of the New York Stock Exchange.Sustainability and CSR Committee on October 29, 2023. Mr. Rush is the ChairmanPhilippe Pierre Wind was appointed as a new member of the NominatingSustainability and Corporate Governance Committee.CSR Committee on December 5, 2023. The purpose of the NominatingSustainability and Corporate GovernanceCSR Committee is to assist the Board byin fulfilling the following responsibilities:
its responsibilities listed below.
Reviewing and making recommendations to the Board of Directors with respect to corporate governance guidelines and issues;
Identifying qualified candidates
| Ms. Supriya Prakash Sen | Member |
| Mr. Philippe Pierre Wind | Member |
Responsibilities include:
| ● | Undertake all activities as per CSR policy of the Company; |
| ● | Review the Sustainability and CSR Vision and Strategy; |
| ● | Review the policies, practices, and ensure compliance with these set policies; |
| ● | Review the annual targets and metrics and that this is reflective of industry best practice; |
| ● | Provide input into the Company’s annual sustainability report; and |
| ● | Review issues such as reputation risk, incidents impacting environment, social and governance concerns. |
| ii) | Non-Statutory Committees |
Investment & Capital Committee
Investment & Capital Committee consists of four members. Mr. Deepak Malhotra resigned as consistent withmember of the criteria approved byInvestment & Capital Committee on October 29, 2023. Mr. Jaime García Nieto was appointed as a new member of the Board for director nominees and recommending such candidatesInvestment & Capital Committee on December 5, 2023. Mr. Richard Payette has joined as member of the Investment & Capital Committee on July 1, 2023. The purpose of the Investment & Capital Committee is to the Board for selection for all directorships to be filled byassist the Board in conjunction with the Chairmanrelation to capital raising, investment, and disposition/disinvestment/sale of the Board;projects, maintain adequate liquidity and timely decision making to achieve the Company’s business plan.
| Mr. Richard Payette | Member |
| Ms. Supriya Prakash Sen | Member |
| Ms. Delphine Voeltzel | Member |
| Mr. Jaime García Nieto | Member |
Nominating
Responsibilities include:
| ● | Review and approve or recommend for approval by the Board capital raising, investment commitments including development and bids for new projects, JV’s and partnerships and disposition/disinvestment/sale of the projects in relation to Group as per the Delegation of Authority (“DoA”) for New Projects and JV’s & Partnerships. |
| ● | Review and recommend for approval by the Board of any Company equity, debt issuances and guarantees with partial or limited recourse back to the shareholders. |
| ● | Establish and supervise corporate philosophy and policies regarding project capital raising, allocation, investment, and disposition/disinvestment/sale of the projects. |
| ● | Establish and oversee treasury policies of the Group and as well as periodic review of Group treasury position. |
| ● | Provide guidance overall capital structure for the group, leverage limits, hedging and distribution policies including intra-group distributions and distributions to shareholders. |
| ● | Periodically review and assess whether the Group has adequate options to raise the capital necessary to meet its business plan. |
| ● | Periodically review progress of under construction and under development projects of the Group. |
Other Committees
Special committees may be formed from time to time as required to review particular matters or transactions.
During the chairsleadership transition following the resignation of our previous CEO and membersManaging Director, a Special Committee of the Board committees, in conjunction withwas created to support the Chairman in supervising our operations. This Special Committee was comprised of the Board;Mr. Rosling, Mr. Unnikrishnan, Mr. Malhotra, and Ms. McNamara, it was formed on April 26, 2022 and it was dissolved on August 22, 2022.
Conducting annual reviews of the Board’s independence, qualifications and experiences in light of the availability of potential Board members; and oversee the evaluation
In addition, a Special Committee of the Board was convened in August 2022 to review material projects and contracts over a three-year period for anti-corruption and related compliance issues. This Special Committee is comprised of Directors.Ms. Delphine Voeltzel and Mr. Jean-François Boisvenu.
Code of Business Conduct
The Board also established a Special Finance Committee in July 2023 in connection with capital raising activities. This Special Finance Committee comprises Mr. Richard Payette, Mr. Jean-François Boisvenu and EthicsMs. Supriya Prakash Sen.
Our Code of Business Conduct and Ethics provides that our directors, officers and employees are expected to avoid any action, position or interest that conflicts with the interests of our company or gives the appearance of a conflict. Directors, officers and employees have an obligation under our Code of Business Conduct and Ethics to advance our company’s interests when the opportunity to do so arises.
D.E. Employees
As of March 31, 2017,2023, we had 401427 full time employees.employees and no part time employee. We consider our relations with our employees to be amicable. The following table sets forth the number of our employees for each of the major functions as of March 31, 2017:
| | | | |
| | Number of
Employees | |
Infrastructure
| | | 116 | |
Utilities
| | | 36 | |
Finance and Operations
| | | 142 | |
C&I
| | | 70 | |
Shared services
| | | 37 | |
| | | | |
Total
| | | 401 | |
| | | | |
E. Share Ownership
The following table sets forth information with respect to the beneficial ownership of our equity shares as of2021, March 31, 2017 by each2022 and March 31, 2023:
| | | As of
March 31,
2021 | | | As of
March 31,
2022 | | | As of
March 31,
2023 | |
| Infrastructure | | | 121 | | | | 156 | | | | 128 | |
| Bidding and land strategy | | | 13 | | | | 19 | | | | 22 | |
| Operations and maintenance | | | 248 | | | | 231 | | | | 217 | |
| F&A, Capital, Legal and HRM | | | 89 | | | | 64 | | | | 65 | |
| Total | | | 471 | | | | 470 | | | | 427 | |
Employee Benefit Plans
For FY 2023, the aggregate compensation, including directors’ fees, excluding grants of our directors and allstock options to our directors and executive officers, was INR 14 million (US$0.2 million), see “– Directors and Officers Compensation”. Our agreements with each of the members of senior management are listed herein under “– Employment Agreement.” Except as otherwise disclosed, the above cash compensation does not include stock compensation and employee benefits to our directors and senior management.
Provident Fund
In accordance with Indian law, all of our employees in India are entitled to receive benefits under the Employees’ Provident Fund Scheme, 1952, as amended, a retirement benefit scheme under which an equal amount as required under the Employees’ Provident Funds and Miscellaneous Provisions Act, 1952, of the base salary of an employee is contributed both by employer and employee in a fund with government/trust with company.
Gratuity
In accordance with Indian law, we pay gratuity to our eligible employees in India. Under our gratuity plan, an employee is entitled to receive a gratuity payment on his superannuation or on his retirement or on the termination of his or her employment if the employee has rendered continuous service to our Company for not less than five years, or if the termination of employment is due to death or disability due to accident or disease. The amount of gratuity payable to an eligible employee is equal to 15 days’ salary based on the last drawn salary for every completed year of employment (or any portion of a year exceeding six months).
Leave Encashment Policy
Under our leave encashment policy, an employee is entitled to accumulate up to 45 days of leave. Employees are encouraged to avail of the leave and hence, any balance over 45 days lapses of January 1 of each calendar year. In the event of resignation, termination of employment or retirement, an employee is entitled to a payment for the accrued leave of absence up to a maximum of 45 days. The amount of payment to be made for each day of such accrued leave of absence shall be calculated by dividing the last drawn monthly base salary by 26 days.
Executive Leadership
On April 26, 2022, Mr. Ranjit Gupta and Mr. Murali Subramanian, previously our Managing Director and Chief Operating Officer respectively, resigned from the Company. Both relinquished their roles with the Company and its subsidiaries, and Mr. Gupta also resigned from the Board. Mr. Harsh Shah joined as Chief Executive Officer with effect from July 1, 2022 and subsequently resigned on August 29, 2022 with immediate effect. Thereafter, Mr. Rupesh Agarwal took charge as Acting CEO of the Company on Mr. Shah’s resignation. In November 2022, Mr. R Narasimhan Iyer joined as Chief Operating Officer of the Company.
On April 30, 2023, Mr. Sugata Sircar resigned from his position as Independent Director and joined as Group Chief Financial Officer and became Executive Director Finance of the Company’s subsidiary, Azure Power India Private Limited. Mr. Pawan Agrawal continues as CFO of APIPL and its group of subsidiaries, reporting to Sugata. Subsequently, Mr. Pawan Kumar Agrawal resigned from the Company and his last day in the role was December 31, 2023.
On July 10, 2023, Mr. Sunil Gupta joined the Company as Chief Executive Officer and Managing Director of the Company’s subsidiary, Azure Power India Private Limited. With the appointment of Mr. Sunil Gupta, Mr. Rupesh Agarwal resigned from his role of Acting CEO and relinquished his roles with the Company and its subsidiaries.
Employment Agreements
Our executive officers have entered into employment agreements with the Company.
Each executive officer has acknowledged that ownership of any intellectual property created by him or her for the Company shall remain the property of the Company.
In addition, each executive officer has agreed to be bound by the non-competition and non-solicit restrictions set forth in his employment agreement. Specifically, each executive officer has agreed, while employed by us and after termination of his employment, not to:
| ● | directly or indirectly, enter into the employment of, tender consulting or other services to, acquire any interest in, or otherwise participate in any business that competes, directly or indirectly, with any of the companies or entities in the same lines of business that the Company is engaged in at the time the employment is terminated; nor |
| ● | solicit, encourage, or induce or attempt to solicit, encourage, or induce any employee or customer, or prospective employees and customers with whom the Company has had discussions or negotiations within the last six months of the termination of his employment not to establish a relationship with the Company. |
V. Risk Factors
You should carefully consider the following factors in addition to the other information set forth in this annual report. If any of the following risks actually occur, our business, results of operations, financial condition and cash flows could be materially and adversely affected. In that event, the trading price of our shares could decline, and you may lose part or all of your investment. This annual report also contains forward-looking information that involves risks and uncertainties. Our actual results could differ materially from those anticipated in these forward-looking statements as a groupresult of many factors, including the risks described below and elsewhere in this annual report.
Financial Risks
Our cash reserves and cash flows may be insufficient to meet our working capital requirements and expansion plans absent further financing. Accordingly, our failure to obtain additional financing on acceptable terms and in a timely manner could materially and adversely affect our financial condition.
The delayed availability of our Fiscal 2022 consolidated financial statements (filed with the Fiscal 2022 Form 20-F on October 12, 2023) and our Fiscal 2023 financial statements (filed with this Form 20-F) has limited our ability to draw down borrowings from our bank loan facilities or raise financing from other sources. In addition, we have not been able to dividend cash from project subsidiaries due to breach of covenants related to the delivery of audited financial statements to lenders. For further information, see below “— Our failure to deliver our audited consolidated financial statements and the financial statements of our subsidiaries violates covenants in certain of our financing agreements and materially and adversely affect our business, results of operations, financial condition and cash flows.”
Our working capital requirements and cash flow have been adversely affected by higher levels of general and administrative expenses (excluding SAR expenses) due to substantially higher legal and accounting costs related to whistle-blower and other investigations and compliance reporting to our regulators and legal costs related to defending various litigation matters. Free cash flows at SPVs may not be available to service our working capital requirements until the audited financial statements of the SPVs are submitted for FY 2023.
Further, our cash flow may also be adversely impacted by any liabilities which may arise as a result of the review of certain material projects and contracts over a three-year period for anti-corruption and related compliance issues by the Special Committee and our Audit and Risk Committee and our ongoing reporting of these issues to the SEC and the Department of Justice. For more information, see “— We have conducted investigations into whistle-blower claims and other allegations against persons who served as our directors, officers and employees. We reported the allegations and our findings to the SEC and the U.S. Department of Justice and continue to cooperate with these authorities.”
In addition, our cash and cash flow may not be sufficient to refinance borrowings in the event that a default is declared and the principal is accelerated or to finance contingent liabilities. Accordingly, our failure to obtain additional financing on acceptable terms and in a timely manner to ensure we have sufficient cash could materially and adversely affect our business, results of operations and financial condition.
Our ability to obtain external financing is subject to several uncertainties, including:
| ● | our future results of operations, financial condition and cash flows; |
| ● | the availability of our consolidated financial statements and the financial statements of our subsidiaries and restricted borrowing groups for Fiscal 2023 and subsequent periods; |
| ● | our past credit history and credit ratings (see “— Any downgrade of our credit rating may result in increase in interest cost or may trigger covenant defaults under our loan agreements” below); |
| ● | the prevailing exchange rate of Indian rupee against major currencies, in particular, the U.S. dollar; |
| ● | the continued confidence of banks, financial institutions and debt capital investors in us and the renewable energy industry in India; |
| ● | the interest rate environment in India and internationally; |
| ● | the general condition of global equity and debt capital markets; |
| ● | economic, political and other conditions in the jurisdictions where we operate; |
| ● | regulatory and government support in the form of tax incentives, preferential tariffs, project cost subsidies and other incentives; and |
| ● | our ability to comply with any financial covenants under our debt financing. |
Our ability to obtain additional financing may be dependent on the compliance review of our lenders and creditors in light of the review of certain material projects and contracts over a three-year period for anti-corruption and related compliance issues by the Special Committee and our Audit and Risk Committee and our ongoing reporting of these issues to the SEC and the Department of Justice and to Indian regulatory authorities. For more information, see “— We have conducted investigations into whistle-blower claims and other allegations against persons who served as our directors, officers and employees. We reported the allegations and our findings to the SEC and the U.S. Department of Justice and continue to cooperate with these authorities.”
Failure to obtain additional financing on acceptable terms and in a timely manner could adversely affect our business, results of operations, financial condition and cash flows. Moreover, any additional equity financing may be dilutive to our shareholders, and any debt financing may contain restrictive covenants that limit our flexibility going forward.
Our failure to deliver our audited consolidated financial statements and the financial statements of our subsidiaries violates covenants in certain of our financing agreements and materially and adversely affect our business, results of operations, financial condition and cash flows.
Timely submission of financial statements of our Group, our subsidiaries and/or our subsidiary restricted groups is a key covenant in most of our financing agreements. Due to our inability to meet these covenants due to delays producing Fiscal 2023 (and interim periods therein) financial statements, we secured time various extensions from some of our lenders in respect of these covenants.
In addition, due to our inability to meet these information covenants to date, some of our lenders have started charging us penalty interest rates. In addition, in some of our borrowing facilities, the lenders have also upward revised the rates of interest due to delay in Fiscal 2022 and Fiscal 2023 audited financial statements and our downgrade in credit ratings. These penalty rates of interest and higher rates of interest have increased our finance costs for the projects to which these loans relate. While the penalty interest may cease to be charged upon finalization and submission of the delayed financial statements, the rates of interest which have been revised upwards may not revert to previous levels, and, therefore, may result in continued higher cost of funds for our debt borrowings for these projects.
Any downgrade of our credit rating may result in increase in interest cost or may trigger covenant defaults under our loan agreements.
Most of our external borrowings are required to be rated by accredited credit rating agencies. In Fiscal 2023 and Fiscal 2024, the rating agencies Fitch Ratings, Moody’s Investor Service, CRISIL and Care Ratings each downgraded or announced a review of credit ratings with negative implications of the credit ratings of one or more of our subsidiaries. Downgrades in our credit ratings and other factors have contributed to interest rate increases in some of our borrowings which has increased our financing costs, and other similar interest rate increases are possible.
In addition, in certain of our financing agreements, a downgrade of our credit ratings below BBB or BBB-, could lead to interest rate increases which would further increase financing costs. Further, in certain of our financing agreements, any downgrade of our credit ratings below BBB or BBB-, constitutes a default which could lead to acceleration of the repayment of all or some of the indebtedness owed under these financing agreements. Any such defaults and accelerations also could result in cross-defaults or cross-accelerations of other indebtedness and could materially and adversely affect our business, results of operations, financial condition and cash flows. See “Operating and Financial Review and Prospects – Certain Factors affecting our Results – Credit Rating Downgrades.”
If we fail to comply with financial and other covenants under our loan agreements, our business, results of operations, financial condition and cash flows may be materially and adversely affected.
The financing agreements with respect to our existing project-level indebtedness contain financial and other covenants that require us to maintain certain financial ratios or impose certain restrictions on the disposition of our assets or the conduct of our business. We expect to continue to finance a significant portion of our project development and construction costs with project financing.
Our financing agreements also include certain restrictive covenants whereby we may be required to obtain approval from our lenders to, among other things, incur additional debt, undertake guarantee obligations, enter into any scheme of merger, amalgamation, compromise, demerger or reconstruction, change our capital structure and controlling interest, dispose of or sell assets, transfer shares held by major shareholders to third parties, invest by way of share capital, lend and advance funds, make payments, declare dividends in the event of any default in repayment of debts or failure to maintain financial ratios, place deposits and change our management structure. Most of our lenders also impose significant restrictions in relation to our solar projects, under the terms of the relevant project loans taken by our respective subsidiaries.
In addition, any fines, penalties, ongoing obligations or other measures or relief imposed against us by regulatory authorities (including by the SEC, the U.S. Department of Justice and applicable Indian regulatory authorities) in connection with whistle-blower claims and Special Committee investigations could adversely impact our ability to maintain compliance with the covenants under our credit facilities or result in an event of default thereunder. For more information, see ” — We have conducted investigations into whistle-blower claims and other allegations against persons who served as our directors, officers and employees. We reported the allegations and our findings to the SEC and the U.S. Department of Justice and continue to cooperate with these authorities.”
For information on our failure to timely deliver our audited financial statements, see “— Our failure to deliver our audited consolidated financial statements and the financial statements of our subsidiaries violates covenants in certain of our financing agreements and materially and adversely affect our business, results of operations, financial condition and cash flows.”
Our failure to comply with such covenants or to obtain our lenders’ consent to take restricted actions in a timely manner or with any other terms of the financing documents entered with lenders may result in the declaration of an event of default by one or more of our lenders, which may result in accelerating repayment obligation under the relevant loans and/ or trigger cross defaults under other financing agreements and/ or increase in rate of interest on such loans and/ or other suitable action in terms of the financing documents and the law. We cannot assure you that, in the event of any such acceleration, we will have sufficient resources to repay these borrowings. Failure to meet our obligations under the debt financing agreements could adversely affect our business, results of operations, financial condition and cash flows. Furthermore, a breach of those financial and other covenants or a failure to meet certain financial ratios under these financing agreements could also restrict our ability to pay dividends.
Our substantial indebtedness and volatility in interest rates could adversely affect our business, results of operations, financial condition and cash flows.
We have incurred substantial debt to finance our projects which is secured by project assets. Since certain of our borrowings under a project-specific financing arrangement have floating rates of interest, volatility in interest rates affects the cost of these borrowings. An increase or decrease in interest rates will increase or decrease our interest expense associated with such borrowing.
In periods of volatile interest rates, we seek to finance our projects on a long-term basis with debt matched to cash flows, and we attempt to fix the interest rate and hedge any forex exposure. Such debt could have significant consequences on our operations, including:
| ● | reducing the availability of our cash flow to fund working capital, capital expenditures, acquisitions and other general corporate purposes as a result of our debt service obligations; |
| ● | limiting our ability to obtain additional financing; |
| ● | limiting our flexibility in planning for, or reacting to, changes in our business, the industry in which we operate and the general economy; |
| ● | potentially affecting our credit rating; |
| ● | potentially increasing the cost of any additional financing; and |
| ● | limiting the ability of our project operating subsidiaries to pay dividends to us for working capital or return on our investment. |
Any of these factors and other consequences that may result from our substantial indebtedness could adversely affect our business, results of operations, financial condition and cash flows impacting our ability to meet our payment obligations under our debt. Our ability to meet our payment obligations under our outstanding debt depends on our ability to generate adequate cash flow in the future. This, to some extent, is subject to general economic, financial, competitive, legislative and regulatory factors as well as other factors that are beyond our control.
In addition, certain of our borrowings under a project-specific financing arrangement have floating rates of interest. Therefore, an increase or decrease in interest rates will increase or decrease our interest expense associated with such borrowing. We are affected by volatility in interest rates in our borrowings. Interest rates are highly sensitive to many factors beyond our control, including the monetary policies of the RBI and other central banks, deregulation of the financial sector in India, domestic and international economic and political conditions and other factors. Furthermore, the rise in inflation and consequent fluctuation in interest rates, repo rates (the rates at which the RBI lends to commercial banks) may also be important factors affecting interest rates. A significant increase in interest expense could adversely affect our business, results of operations, financial condition and cash flows impacting our ability to meet our payment obligations under our debt.
We were not profitable in the past three fiscal years, and we may not be profitable in the future.
We have incurred losses since our inception. During Fiscal 2022 and Fiscal 2023, we had a net loss of INR 2,126 million and INR 2,322 million (US$ 28.3 million), respectively. We do not expect to be profitable in Fiscal 2024 and may not be profitable in the future.
Our consolidated general and administrative expenses (excluding SAR expenses) in Fiscal 2023 were higher than our consolidated general and administrative expenses (excluding SAR expenses) in Fiscal 2022 due to higher legal and accounting costs related to whistle-blower and other investigations and legal costs related to defending various litigation matters.
Accordingly, our consolidated general and administrative expenses (excluding SAR expenses) in Fiscal 2023 adversely affected our profitability as well as our cash flows from operations.
Our profitability may also be adversely impacted by any liabilities which may arise as a result of the review of certain material projects and contracts over a three-year period for anti-corruption and related compliance issues by the Special Committee and our Audit and Risk Committee and our ongoing reporting of these issues to the SEC and the Department of Justice. For more information, see “ — We have conducted investigations into whistle-blower claims and other allegations against persons who served as our directors, officers and employees. We reported the allegations and our findings to the SEC and the U.S. Department of Justice and continue to cooperate with these authorities.”
Fluctuations in foreign currency exchange rates may negatively affect our revenue, cost of sales and gross margins and could result in exchange losses.
As the functional currency of our Indian subsidiaries is the Indian rupee, our operating expenses are denominated primarily in Indian rupees. However, some of our capital expenditures, and particularly those for equipment imported from international suppliers, such as solar panels, are denominated in foreign currencies. In addition, some of our borrowings are in foreign currencies, especially the US dollar, and we swap these foreign currencies into Indian rupees to fund our projects and working capital. To the extent that we are unable to match revenue received in our functional currency with costs paid in foreign currencies, or hedge such exposure, exchange rate fluctuations in any such currency could have an adverse effect on our profitability.
We generate substantially all our cash in Indian rupees and, therefore, significant changes in the value of the Indian rupee relative to the other foreign currencies could materially and adversely affect our reported results of operations, financial condition and cash flow and our ability to meet interest and principal payments on borrowings. In addition to currency translation risks, we incur currency transaction risks whenever we or one of our projects enter into a purchase or sales transaction using a currency other than the Indian rupee. We expect our future capital expenditures in connection with our proposed expansion plans to include significant expenditures in foreign currencies for imported solar panels, components, equipment and machinery.
A significant fluctuation in the Indian rupee to U.S. dollar or other foreign currency exchange rates could materially and adversely affect our business, results of operations, financial condition and cash flows. The exchange rate between the Indian rupee and these currencies, primarily the U.S. dollar, has fluctuated in the past and any appreciation or depreciation of the Indian rupee against these currencies can impact our profitability and results of operations. Our results of operations have been impacted by such fluctuations in the past and may be impacted by such fluctuations in the future. For example, the Indian rupee had depreciated against the U.S. dollar in four of the last five years, which may impact our results of operations in future periods. Furthermore, we have borrowings denominated in U.S. dollars, and, as such, an annual decline in the Indian rupee against the U.S. dollar effectively adds to the functional interest rate of our borrowings and the Indian rupee equivalent needed to repay the borrowings, when due. Consequently, depreciation of the Indian rupee to the U.S. dollar, could result an increase in foreign currency related transaction and translation losses and negatively impact our performance.
Our operating results may fluctuate from period to period, which could make our future performance difficult to predict and could cause our operating results for a particular period to fall below expectations.
Our quarterly and half-yearly operating results are difficult to predict and may fluctuate significantly in the future. We have experienced seasonal and quarterly fluctuations in the past, especially in the winter months, and we may experience similar fluctuations in the future. However, given that the renewable energy industry is growing rapidly, those fluctuations may be masked by our recent growth rates and thus may not be readily apparent from our historical operating results. As such, our past quarterly operating results may not be good indicators of future performance.
In addition to the other risks described in this section, the following factors could cause our operating results to fluctuate:
| ● | the expiration or initiation of any central or state subsidies or incentives; |
| ● | our ability to complete installations in a timely manner due to market conditions or due to unavailable financing; |
| ● | our ability to continue to expand our operations, and the amount and timing of expenditures related to such expansions; |
| ● | announcements by us or our competitors of significant acquisitions, strategic partnerships, joint ventures or capital-raising activities or commitments; |
| ● | changes in auction rules; |
| ● | changes in feed-in tariff rates for solar power, VGF, our pricing policies or terms or those of our competitors; |
| ● | actual or anticipated developments in our competitors’ businesses or the competitive landscape; |
| ● | an occurrence of low global horizontal irradiation that affects our generation of solar power; |
| ● | fluctuations due to the COVID-19 pandemic and resulting operational disruptions; |
| ● | change in law or adoption of new accounting pronouncements; and |
| ● | significant volatility in market conditions (including, but not limited to foreign currency rates, interest rates and our share price). |
For these or other reasons, the results of any prior quarterly or annual periods should not be relied upon as indications of our future performance. In addition, with respect to the above factors our actual revenue, key operating and financial metrics and other operating results in future quarters may fall short of the expectations of investors and financial analysts, which could have a material adverse effect on the trading price of our shares.
We have stopped reporting quarterly consolidated financial information.
As a “foreign private issuer” we are not required under SEC rules to report quarterly consolidated financial information and will no longer do so. We shall be providing unaudited half yearly financial statements under green bond indentures. As many of our industry competitors in India and internationally provide quarterly financial information, it will not be possible for investors and research analysts to benchmark our results against the results of our competitors on a quarterly basis. This change could impact the decision of research analysts to cover us or to publish research about us or cause them to change their recommendations regarding our shares adversely, resulting in a decline in our stock price and trading volume.
Compliance risks
The New York Stock Exchange (NYSE) has delisted our Company’s shares due to our failure to timely file periodic reports with the SEC.
As a result of our failure to timely file our Fiscal 2022 annual report on Form 20-F with the SEC, the NYSE informed us on December 7, 2022 that we were not in compliance with its continued listing requirements under the timely filing criteria outlined in Section 802.01E of the NYSE Listed Company Manual and that we would be provided a six-month extension from the due date of the annual report, August 16, 2022, as extended from the original due date of August 1, 2022, pursuant to the Form 12b-25 filed with the SEC on August 1, 2022 to file the annual report on Form 20-F, as well as any other subsequent delayed filings.
On February 14, 2023, the NYSE granted our request for additional time to file our annual report on Form 20-F and any subsequent delayed filings, stating it would provide an additional trading period through July 15, 2023 subject to reassessment on an ongoing basis and that failure to file the annual report on Form 20-F and any subsequent delayed filings by the end of this period could result in a trading suspension. On July 6, 2023, we asked the NYSE for additional time to file our Annual Report, as well as well as our current report on Form 6-K for the six months September 30, 2022 (the “2022 Form 6-K” and, together with the annual report on Form 20-F, the “Delayed Filings”), due to continued delays in the completion of our audit and review of our internal control over financial reporting.
On July 13, 2023, the NYSE suspended trading in our Company’s shares and commenced delisting proceedings (the “Delisting Decision”). As described more fully in our July 13, 2023 Form 6-K, we took substantial steps to remediate the issues that led to the Delayed Filings including, among others, the replacement of our independent public accounting firm for our U.S. GAAP consolidated financial statements, strengthening our management team and appointing external consultants to review our internal controls and compliance framework. On July 26, 2023, we submitted an appeal of the Delisting Decision. However, on October 30,2023, the NYSE Committee for Review affirmed the Delisting Decision. On November 13, 2023 our shares were delisted from trading on the NYSE.
There can be no assurance whether or when our shares would again be listed for trading on the NYSE or another U.S. exchange. Further, the market price of our shares might decline and become more volatile, and the holders of our shares may find that their ability to trade in our shares would be adversely affected. The delisting of our shares could also result in other negative outcomes, including the potential loss or reduction of confidence by customers, business partners and employees, the potential loss or reduction of investor interests, and fewer business and strategic opportunities, any of which could have a material adverse impact on our results of operations, cash flows and financial conditions. The delisting also could impede your ability to resell our shares or the price that you may obtain in any such resale.
Currently, our shares are only available to trade on the over-the-counter (or OTC) “expert” market, where quotations are only directly available to broker dealers and professional investors (not to retail investors).
On April 1, 2024, we expect that our SEC reporting obligations under Section 15(d) of the Exchange Act will be suspended and the Company will no longer have an obligation to file periodic reports (annual reports on Form 20-F and Form 6-K reports) with the SEC.
On October 31, 2023, the NYSE filed a Form 25 pursuant to Rule 12d2-2(b) under the Exchange Act. On January 29, 2024, 90 days after the NYSE filed Form 25, the Company’s shares ceased to be registered with the SEC pursuant to Section 12(b) of the Exchange Act. As the Company had less 300 record holders of its equity securities on the date its 12(b) registration ended, the Company’s shares did not become registered under Section 12(g) in accordance with Rule 12g-2. Further, we expect that on April 1, 2024 the Company’s SEC reporting obligations under Section 15(d) of the Exchange Act will be suspended as the Company is expected to have less than 300 record holders of its equity securities on that date. Once such reporting obligations are suspended, the Company will no longer have an obligation to file periodic reports (annual reports on Form 20-F and Form 6-K reports) with the SEC. This means that the Company expects that it will not be required to file an annual report on Form 20-F with the SEC for Fiscal 2024; however, its reporting obligations under Mauritius law will continue and its reporting obligations to bondholders under its Green Bond indentures will also continue. In addition, other provisions of the Exchange Act and SEC rules thereunder relating to foreign private issuers with equity securities registered under the Exchange Act will no longer apply to the Company including shareholders’ obligations to file beneficial ownership reports publicly with the SEC on Schedule 13D or Schedule 13G.
We have conducted investigations into whistle-blower claims and other allegations against persons who served as our directors, officers and employees. We reported the allegations and our findings to the SEC and the U.S. Department of Justice and continue to cooperate with these authorities.
In May 2022, we received a whistle-blower complaint that alleged health and safety lapses, procedural irregularities, misconduct by certain employees, improper payments and false statements relating to one of our projects belonging to a project subsidiary. Following extensive investigation by the Ethics Committee, supervised by the Board’s Audit and Risk Committee and by external counsel and forensic professionals, we identified evidence of manipulation and misrepresentation of project data by some employees at that project site. Weak controls over payments to a vendor and failures to provide accurate information both internally and externally were found, but no direct evidence was identified that any improper payment was made to any government official. Further, in Fiscal 2023, we reported to SECI that this project had (i) shortfalls in generation and (ii) that it failed to timely complete and commission the requisite contractually required capacity. On January 3, 2023 and January 4, 2023, SECI advised us, inter alia, that the project may be liable for damages and penalties for shortfalls in generation.
In September 2022, we received an additional whistle-blower complaint primarily making similar allegations of misconduct as raised in the May 2022 complaint, as well as allegations of misconduct related to joint ventures and land acquisition, allegations of our failure to be transparent with the market and advisors and other claims. The Ethics Committee, supervised by the Board’s Audit and Risk Committee, with the support of external counsel and forensic accounting professionals, investigated these September 2022 allegations. The investigation of the September 2022 complaint identified significant control issues in the process of acquiring land and land use rights in relation to one of our projects. The investigation specified that third party land aggregators may have been involved in improper payments but no improper transfer of money by the Group was identified. We have made an adjustment (de-capitalization) in the books of accounts of INR138 million (US$1.8 million) In FY 2022 on estimate, as a prudent measure in the given project. Further, we have reviewed the entire amount paid to land aggregators in other projects to identify any similar issue and after an assessment a further adjustment (decapitalisation) aggregating to INR118 million (US$1.6 million) has been made in the books of account in FY 2022 on estimate, as a prudent measure, though no improper payments by the Group could be identified. In line with review made during the previous year, we reviewed the entire amount paid to land aggregators during the current year and made adjustment of INR 28 million (US$ 0.4 million) during the year ended March 31, 2023 on prudent basis though no improper payments by the Group could be identified in current year as well.
Our investigation did not substantiate other portions of this September 2022 whistle-blower complaint.
As part of our investigations of the May 2022 and September 2022 whistle-blower complaints, we also widened our review to include a review of projects commissioned in Fiscal 2022 and Fiscal 2023 to ensure that similar weaknesses were not present. As part of our investigations, we identified inconsistencies in project data in certain of our projects, but no improper payments were identified in connection with these projects.
We have taken a range of actions due to these findings, and the employees involved in the misconduct are no longer associated with us. In accordance with the recommendations of the Ethics Committee, the Board’s Audit and Risk Committee and their legal and forensic advisors, we are implementing remedial measures in both project control and monitoring. Further, we reported the findings from its investigations of the May 2022 and September 2022 whistle-blower complaints to the SEC and the U.S. Department of Justice, and we continue to cooperate with these authorities.
In addition, the Special Committee was convened in August 2022 to review certain material projects and contracts over a three-year period for anti-corruption and related compliance issues. Independent outside counsel and forensic advisors were engaged to support the Special Committee. The Special Committee’s investigation has identified evidence that individuals formerly affiliated with the Group may have had knowledge of, or were involved in, an apparent scheme with persons outside the Group to make improper payments in relation to certain projects. To date, the Special Committee has not identified related improper payments or transfers by the Group. The Special Committee’s investigation is still ongoing. The Special Committee’s review and its findings has impacted the decision-making of the Group in connection with such projects. We have disclosed the details of the Special Committee’s investigation to the SEC and the U.S. Department of Justice, and we continue to cooperate with those agencies.
Our Group including our subsidiaries with respect to affected projects could be exposed to liabilities under the relevant contractual and tender documents (including levy of damages and liquidated damages, reduction of PPA tariffs and/or short closure of capacity), administrative actions (including the risk of PPA cancellation, risk of being debarred from SECI’s future contracts, withdrawal or nullification of commissioning certificates and/or revocation of commissioning extensions) and penalties from customers and other civil liabilities, all of which could adversely impact the revenue, profitability and capitalization of the affected projects. In addition, civil and/or criminal fines and/or penalties by regulatory authorities (including by the SEC, the U.S. Department of Justice and applicable Indian regulatory authorities) could be imposed on us as well as ongoing obligations, remedial corporate measures or other relief against us that could adversely impact our operations. Any such fines, penalties, ongoing obligations or other measures or relief against us could materially and adversely affect our business, results of operations, financial condition and cash flows in future periods. Further, in addition, certain of those outcomes could adversely impact our ability to maintain compliance with the covenants under our credit facilities or result in an event of default thereunder. In addition, we could be exposed to future litigation in connection with any findings of fraud, corruption, or other misconduct by persons who served as our directors, officers and employees.
For further information on the liabilities associated with the whistle-blower complaints and the Special Committee investigation, see “Consolidated Financial Statements as of, and for the year ended, March 31, 2023, Note 27 – Whistle-blower Allegations and Special Committee Investigations.”
Our international corporate structure and operations require us to comply with anti-corruption laws and regulations of the United States and various other jurisdictions. If we are not in compliance with applicable legal requirements, we may be subject to civil or criminal penalties and other remedial measures.
We are subject to the U.S. Foreign Corrupt Practices Act (“FCPA”) which prohibits, in relevant part, U.S. nationals, companies that have securities registered in the U.S. and any officer, director, employee, or agent of such issuer or any shareholder thereof acting on behalf of such issuer from making corrupt payments to foreign officials for the purpose of obtaining or keeping business. The FCPA also imposes obligations to keep accurate books and records, to maintain appropriate internal controls, and to prevent circumvention of such controls. We are also subject to the Indian Penal Code, 1860, the Prevention of Corruption Act, 1988 and the Prevention of Money Laundering Act, 2002 which are applicable on our subsidiaries in India. In addition, we have been and will continue to be subject to anti-corruption, anti-bribery and anti-money laundering legislation in other jurisdictions, which in certain circumstances go beyond the scope of the FCPA rules and regulations.
Any violations of these laws, regulations and procedures by our employees, independent contractors, subcontractors and agents could be costly and time-consuming to investigate and could expose us to administrative, civil or criminal penalties or fines (including under U.S. and Indian laws and regulations as well as other applicable laws). If we were to be investigated for, charged with, or convicted of, violating these laws and regulations, our reputation could be harmed and it could cause some of our investors to sell their interests in our company to be consistent with their internal investment policies or to avoid reputational damage, and some investors might forego the purchase of our shares, all of which may negatively impact the trading prices of our shares. In addition, any administrative, civil or criminal penalties or fines which could materially and adversely affect our business, results of operations, cash flows and financial condition.
For information regarding current investigations of certain whistleblower and other allegations against persons who served as our directors, officers and employees, see — “We have conducted investigations into whistle-blower claims and other allegations against persons who served as our directors, officers and employees. We reported the allegations and our findings to the SEC and the U.S. Department of Justice and continue to cooperate with these authorities.”
Any damages caused by fraud, corruption, or other misconduct by our employees and former employees could adversely affect our business, the results of operations, financial condition and cash flows.
We are exposed to operational risks arising from any inadequacy or failure of internal processes or systems. In addition, we are exposed to risks associated with fraud, corruption, or other misconduct of our directors, officers and employees. Employee or executive misconduct could also involve the improper use or disclosure of confidential information, bribery, data breach or other illegal acts, which could result in regulatory sanctions and reputational or financial harm, including harm to our brand.
Our processes, management information systems, and internal control procedures are designed to monitor our operations and overall compliance. Our systems, however, may not be able to identify every act of non-compliance and/or suspicious transaction in a timely manner, or at all. In addition, certain internal control processes are carried out manually, which may increase the risk that human error, tampering, or manipulation will result in losses that may be difficult to detect.
One of the tools we use to provide assurance is our whistle-blower policy and related procedures, which encourages employees and directors to report concerns related to unethical conduct and governs the investigation of such reports. Our whistle-blower policy sets forth guidelines for our employees and directors to report concerns related to unethical conduct. Under the policy, our Ethics Committee investigates the allegations under the supervision of the Board’s Audit and Risk Committee. The Ethics Committee may, at its discretion, consider appointing an investigator or investigation team internally and/or external parties for the purpose of investigation.
As part of our investigations of certain whistleblower and other allegations against persons who served as our directors, officers and employees, we identified certain unethical and unauthorized conduct by persons who served as our officers, directors and employees. For information regarding certain whistleblower and other allegations, see “— We have identified material weaknesses in our internal control over financial reporting. If we fail to develop and maintain an effective system of internal controls over financial reporting or if we experience additional material weaknesses in the future, we may not be able to accurately or timely report our financial results, which may adversely affect investor confidence.”
We have identified material weaknesses in our internal control over financial reporting. If we fail to develop and maintain an effective system of internal controls over financial reporting or if we experience additional material weaknesses in the future, we may not be able to accurately or timely report our financial results, which may adversely affect investor confidence.
A material weakness is a deficiency, or combination of deficiencies, in internal control over financial reporting such that there is a reasonable possibility that a material misstatement in our financial statements will not be prevented or detected on a timely basis. These deficiencies could result in additional material misstatements to its financial statements that could not be prevented or detected on a timely basis.
Management identified material weaknesses in our internal control over financial reporting as of March 31, 2022. This caused a considerable delay in producing our audited consolidated financial statements for Fiscal 2022 and caused us to fail to meet SEC periodic reporting obligations which in turn ultimately caused our shares to be delisted the NYSE. The delay in completion of financial reporting for FY 2022 in turn caused a delay in the completion of financial reporting for FY 2023.
Further, Management determined that, as of March 31, 2023, our internal controls over financial reporting were ineffective due to inadequacy of certain review controls including control failures in financial statement closing procedures, controls pertaining to capitalization, vendor reconciliation process, land acquisition, documentation on testing of control attributes and completeness and accuracy of reports used including inadequate consideration in designing of risk and controls matrices.
Management, under the supervision of the Company’s Audit and Risk Committee, has initiated remediation actions focused on improving the Group’s internal control and compliance environment to address the control deficiencies that led to material weaknesses. Management is taking support from external consultants while performing this remediation exercise. These efforts include creation of a Management Assurance Service function, assessing and strengthening internal control framework, re-establishing standard operating procedures, implementing enterprise risk management framework, testing operational controls, adding accounting personnel for assistance on critical accounting matters, training of team members, implementing additional process level reviews, and periodic monitoring by the Audit and Risk Committee of the effectiveness of the remedial efforts and overall reporting framework. As it continues to implement such remediation, management may take additional measures or modify the plan elements described above. On March 14, 2024, the Board has appointed Mr. Vijay Kumar Wadhwani as Chief Compliance & Ethics Officer and approved the Chief Compliance & Ethics Charter including specific power and responsibilities.
Management will monitor the effectiveness of remediation plans and will make changes as appropriate. If we fail to develop and maintain an effective system of internal controls over financial reporting or if we experience additional material weaknesses in the future, we may not be able to accurately or timely report our financial results, which may adversely affect investor confidence.
We did not timely file our annual reports on Form 20-F for Fiscal 2022 and Fiscal 2023. In accordance with SEC rules, we are now unable to file new Form F-3 registration statements (including shelf registration statements) for 12 months which may limit our financing options.
We did not file our annual reports on Form 20-F for Fiscal 2022 and Fiscal 2023 by the time provided by SEC rules. In accordance with SEC rules, we are now unable to file new Form F-3 registration statements (including shelf registration statements) until such time we have timely filed all required SEC reports for 12 calendar months. Our inability to use Form F-3 registration statements (including shelf registration statements) may make it more difficult to raise funds in United States and may make our fundraising activities more expensive. In addition, our failure to meet our SEC and NYSE filing obligations has led to the delisting of our shares on the NYSE, see “— The New York Stock Exchange (NYSE) has delisted our Company’s shares due to our failure to timely file periodic reports with the SEC. The inability to files these registration statements and our delisting could materially and adversely affect our business, results of operations, financial condition and cash flows and thus affect the value of our shares.
On April 1, 2024, we expect that our SEC reporting obligations under Section 15(d) of the Exchange Act will be suspended and the Company will no longer have an obligation to file periodic reports (annual reports on Form 20-F and Form 6-K reports) with the SEC. For more information, see “Risk Factors – On April 1, 2024, we expect that our SEC reporting obligations under Section 15(d) of the Exchange Act will be suspended and the Company will no longer have an obligation to file periodic reports (annual reports on Form 20-F and Form 6-K reports) with the SEC.”
As a “foreign private issuer,” we are permitted to, and we will, follow certain home country corporate governance practices which may afford less protection to holders of our shares.
As a “foreign private issuer,” we are permitted to follow certain home country corporate governance practices. As a company incorporated in Mauritius and with securities registered with the SEC, we may follow our home country practice with respect to the composition of its Board and executive sessions and composition of our compensation committee and our nominating and corporate governance committee. The corporate governance practice and requirements in Mauritius do not require us to have a majority independent board or to hold regular executive sessions where only independent directors shall be present. In addition, Mauritius law does not require our compensation committee or our nominating and corporate governance committee to be comprised of only independent directors. Such Mauritian home country practices may afford less protection to holders of our shares than would be available to the shareholders of a U.S. corporation.
We expect that on April 1, 2024 the Company’s SEC reporting obligations under Section 15(d) of the Exchange Act will be suspended as the Company is expected to have less than 300 record holders of its equity securities on that date. Once such reporting obligations are suspended, the Company will no longer have an obligation to file periodic reports (annual reports on Form 20-F and Form 6-K reports) with the SEC. The Company’s reporting obligations under Mauritius law will continue and its reporting obligations to bondholders under its Green Bond indentures will also continue. In addition, other provisions of the Exchange Act and SEC rules thereunder relating to foreign private issuers with equity securities registered under the Exchange Act will no longer apply. For more information, see “Risk Factors - On April 1, 2024, we expect that our SEC reporting obligations under Section 15(d) of the Exchange Act will be suspended and the Company will no longer have an obligation to file periodic reports (annual reports on Form 20-F and Form 6-K reports) with the SEC.”
Procurement, Supply Chain and Construction Risks
We may incur unexpected cost overruns and expenses if the suppliers of components in our solar/wind projects delay or fail to deliver solar modules, solar cells and other components or equipment for any reason.
We enter into contracts with our suppliers to supply solar modules, solar cells and other components or equipment for our solar and wind projects. If our suppliers do not perform their obligations, we may need to enter into new contracts with other suppliers at a higher cost or may suffer schedule disruptions. In addition, our suppliers may have difficulty fulfilling our orders and incur delivery delays, or charge us higher prices, higher up-front payments and deposits, which would result in higher-than-expected prices or less favorable payment terms to develop our projects. Delays in the delivery of ordered components and equipment for our solar and wind projects could delay the completion of our under-construction projects. In addition, our relationship with our suppliers may worsen or lead to disagreements or litigation which could materially and adversely affect our business, results of operations, financial condition and cash flows. Any such delays or disruptions could materially and adversely affect our business, results of operations, financial condition and cash flows and thus affect the value of our shares.
Our construction activities may be subject to cost overruns or delays which may adversely affect our business, results of operations, financial condition and cash flows.
Construction of our solar, wind and other renewable energy projects may be adversely affected by circumstances outside of our control, including inclement weather, adverse geological and environmental conditions, failure to receive regulatory approvals on schedule or third-party delays in providing supplies and other materials. Changes in project plans or designs, or defective or late execution may increase our costs from our initial estimates and cause delays. Increases in the prices of our components and equipment may increase procurement costs. There can be no assurance that the prices of components and equipment required for our power projects that are presently contracted and under construction will not change, which may cause the economic returns available from these projects to differ from our initial projections. Any fluctuations in prices of our components or raw materials materially and adversely affect our business, results of operations, financial condition and cash flows. If we experience unexpected increases in procurement costs, our forecasted revenues and cash flows could be materially adversely affected.
Labor shortages, work stoppages, labor disputes or disruptions in transportation bringing in labor for projects also can significantly delay a project, increase our costs or cause us to breach our performance guarantees under our PPAs, particularly because strikes and labor transportation disruptions are not considered a force majeure event under many of our PPAs. Moreover, local political changes and delays, for instance, caused by state and local elections, as well as demonstrations or protests by local communities and special interest groups could result in, or contribute to, project time and cost overruns for us.
In addition, we sometimes utilize and rely on third-party sub-contractors to construct and install portions of our renewable energy projects. If our subcontractors do not satisfy their obligations or do not perform work that meets our quality standards or if there is a shortage of third-party subcontractors or if there are labor strikes that interfere with the ability of our employees or contractors to complete their work on time or within budget, we could experience significant delays or cost overruns.
We may not be able to recover any of these losses in connection with construction cost overruns or delays.
Any such contingencies that could lead us to fail to generate our expected return from our solar and other renewable energy projects and could materially and adversely affect our business, results of operations, financial condition and cash flows.
We face risks and uncertainties when developing our projects.
The development and construction of our projects (including wind, solar, etc.) involve numerous risks and uncertainties and require extensive research, planning and due diligence. Before we determine that a project is economically, technologically or otherwise feasible, we may be required to incur significant capital expenditure for land and interconnection rights, regulatory approvals, preliminary engineering, equipment procurement, legal and other matters. Success in developing a project depends on many factors, including:
| ● | accurately assessing resources availability at levels deemed acceptable for project development and operations; |
| ● | fluctuations in foreign exchange and inflation rates impacting equipment and supplier costs; |
| ● | fluctuations in the cost and availability of raw materials and purchased components; |
| ● | receiving critical components and equipment (that meet our design specifications) on schedule and on acceptable commercial terms; |
| ● | securing necessary project approvals, licenses and permits in a timely manner; |
| ● | securing appropriate land, with satisfactory land use permits, on reasonable terms; |
| ● | availability of adequate grid infrastructure and obtaining rights to interconnect the project to the grid or to transmit energy; |
| ● | obtaining financing on competitive terms; |
| ● | completing construction on schedule without any unforeseeable delays; and |
| ● | entering into PPAs or other off take arrangements on acceptable terms. |
Generally, our PPAs require that we bring our projects to commercial operation by a certain date. There may be delays or unexpected difficulties in completing our projects because of these or other factors. We may also have to reduce the size of some of our projects due to occurrence of any of these factors. Further, the majority of our PPAs provide for a reduction of tariff if we fail to commission a project by the scheduled commission date. If we are unable to adhere to project timelines for reasons other than as specifically contemplated in the PPAs, it could result in the reduction in tariffs, or other penalties, including paying liquidated damages for delay in commissioning of projects or granting the off taker the right to draw on performance bank guarantees provided by us, including in certain cases up to 100% of the bank guarantee, or the termination of the PPAs. Further, we may also be subject to penalties in respect of failure to ensure transmission of electricity from the project to the grid and the respective off taker, as agreed under the respective PPA and/or transmission agreements. If we experience such problems, our business, results of operations, financial condition and cash flows could be materially and adversely affected.
Our in-house procurement and construction operations expose us to certain risks.
We undertake in-house procurement and construction operations for our solar and wind projects, which exposes us to certain risks that would ordinarily be borne by third parties. For example, entering into third-party EPC contracts on the basis of fixed price contracts would insulate us from adverse price fluctuations for the equipment and materials we use for constructing solar and wind projects. As a result, we are exposed to construction cost risks that could be caused by various factors, including:
| ● | increases in the price and availability of land, labor, equipment and materials; |
| ● | inaccuracies of drawings and technical information; |
| ● | delays in the delivery of equipment and materials to project sites; |
| ● | unanticipated increases in equipment, material and land costs; |
| ● | delays caused by local and seasonal weather conditions; and |
| ● | any other unforeseen design and engineering issues, or physical, site and geological conditions that may result in delays. |
Additionally, we are primarily responsible for all equipment and construction defects, potentially adding to the cost of construction of our projects. Although we generally obtain warranties from our equipment suppliers, we cannot assure that we will be successful with any warranty claims against our suppliers. If our procurement and construction operations are insufficient, we may incur additional costs in engaging third party service providers to undertake our procurement and construction activities or experience significant delays or disruption of our operations. We also enter into solar and wind energy project contracts on a business-to-business basis under which we are responsible for designing, constructing and installing and maintaining these projects. Any delay, default, malfunctioning or unsatisfactory performance by our in-house teams could result in significant losses, damage our reputation and expose us to claims which we may not be able to recover from any third party, and therefore, adversely affect our business, results of operations, financial condition and cash flows. The construction projects are capital intensive, requires significant time and are subject to delays or cost overruns, which could require us to expend additional capital and adversely affect our business and operating results. Such potential events include shortages and late delivery of building materials and facility equipment, installation, commissioning and qualification of equipment, labor disputes, delays or failure in securing the necessary governmental approvals, building sites or land use rights, and other changes to plans necessitated by changes in market conditions. Such delays could adversely affect our business, results of operations, financial condition and cash flows.
Delays in obtaining, or a failure to maintain, governmental approvals and permits required to construct and operate our projects may adversely affect such projects and our business.
The design, construction and operation of our solar and other renewable energy projects are highly regulated, require various governmental approvals and permits, and may be subject to conditions that may be stipulated by relevant government authorities which vary from state to state. There is no certainty that all permits required for a given project will be granted on time or at all. If we fail to obtain or renew such licenses, approvals, registrations and permits in a timely manner, we may not be able to commence or continue operating our projects in accordance with our contracted schedules or at all, which could adversely affect our business, results of operations, financial condition and cash flows. There is also no certainty that relevant government authorities will not take any action in the future which may expose us to penalties or have a material adverse impact on our operations. We are also exposed to changes in the legal and regulatory environment in which we operate, including changing taxes and tariffs and data privacy and protection laws which could, increase our operating costs, or result in litigation or regulatory action.
There are substantial delays between making significant upfront investments in our solar and other renewable energy projects and receiving revenue.
There are generally many months or even years between our initial bid in renewable energy auctions to build solar or other renewable energy projects and the date on which we begin to recognize revenue from the sale of electricity generated by such projects. Our initial investments include, legal, accounting and other third-party fees, costs associated with project analysis and feasibility study, payments for land rights, payments for interconnection and grid connectivity arrangements, government permits, engineering and procurement of solar panels, balance of system costs or other payments, which may be non-refundable. Our projects may not be fully monetized for 25 years given the average length of our PPAs, but we bear the costs of our initial investment upfront. Furthermore, we have historically relied on our own equity contribution, international lenders and bank loans to pay for costs and expenses incurred during project development. Solar and other renewable energy projects generate revenue only after becoming commercially operational and starting to sell electricity to the power grid through off takers. Between our initial investment in the development of solar projects and their connection to the transmission grid, there may be adverse developments, such as unfavorable environmental or geological conditions, pandemics, labor strikes, panel shortages or monsoon weather. Furthermore, we may not be able to obtain all the permits as anticipated and permits that were obtained may expire or become ineffective, any of which may delay construction or commercial operation. Further, we may not be able to obtain project level financing as anticipated, which may delay or halt construction of a particular project. Any such delays could materially and adversely affect our business, results of operations, financial condition and cash flows.
Risks Related to Retention of Management and Key Employees
The loss of our senior management or key employees may adversely affect our ability to conduct our business.
We depend on our management team, and the loss of any key executives could negatively impact our business. We have had successive changes in our senior management in 2022 and 2023 in the CEO, CFO and COO positions, which has created internal disruption, adversely affected our operations and strategy implementation and attracted negative publicity. In this regard, on October 11, 2023, Mr. Alan Rosling resigned as Chairman of the Board and as a director of the Company and APIPL. On October 12, 2023, the Company announced that Mr. M.S. Unnikrishnan became the Chairman of the Board of the Company. Subsequently, on March 13, 2024, Mr. M.S. Unnikrishnan resigned as Chairman of the Board and as a director of the Company and APIPL
There can be no assurance that our competitors will not offer better compensation packages, incentives and other perquisites to such skilled personnel. If we are not able to attract and retain talented employees as required for conducting our business, or if we experience high attrition levels which are largely out of our control, or if we are unable to motivate and retain existing employees, our business, results of operations, financial condition and cash flows may be adversely affected. In addition, an inability to attract and retain sufficient technical and managerial personnel could limit our ability to manage and complete our projects on schedule and within budget, which may adversely affect our business and strategy implementation.
The loss of the services of our key personnel or our inability to recruit or train enough experienced personnel or our inability to manage the attrition levels in different employee categories, may have an adverse effect on our business, results of operations, financial condition and cash flows. Further, if we cannot hire additional qualified personnel or retain them, our ability to expand our business may be impacted. As we expand operations by constructing new renewable energy projects, we will need to continue to attract and retain experienced management, operations and project construction personnel. We may also be required to increase our levels of employee compensation more rapidly than in the past to remain competitive in attracting suitable employees.
Off taker risks related to compliance with the terms of PPAs, delay in payments, and LoAs cancelled
Counterparties to our PPAs may not fulfil their obligations which could materially and adversely affect our business, results of operations, financial condition and cash flows.
We generate electricity income primarily pursuant to PPAs entered into with central and state government-run utilities. If the counterparties to our PPAs do not fulfil their obligations our business, results of operations, financial condition and cash flows could be materially and adversely affected. Our counterparties to our PPAs may become subject to financial stress, insolvency or liquidation proceedings during the term of the relevant contracts, and the credit support received from such customers may not be sufficient to cover our losses in the event of a failure to perform. There may also be disputes raised by the counterparties to the amounts invoiced, or delays associated with collection of receivables from government owned or controlled entities on account of the financial condition of these entities that deteriorated significantly in the past. Where we are selling power to non-governmental entities, we take into account the credit ratings assigned by rating agencies and our ability to collect when assessing the counterparties’ creditworthiness. The Governmental entities to which we sell power generally may not have credit ratings for us to consider, and many of the state governments in India, if rated, would likely rate lower than the GoI. Although the central and state governments in India have taken steps to improve the liquidity, financial condition and viability of state electricity distribution utility companies, there can be no assurance that the utility companies that are currently our customers will have the resources to pay on time or at all.
In addition, our PPA customers may, for any reason, become unable or unwilling to fulfil their related contractual obligations, refuse to accept delivery of power delivered thereunder or otherwise terminate such agreements prior to the expiration thereof. If such events occur, our business, results of operations, financial condition and cash flows could be materially and adversely affected.
There are a limited number of strong credit purchasers of utility scale quantities of electricity which exposes us to risk of LoA cancellations, and our utility scale projects to risk.
Typically, we derive more than 70% of our revenue from our top five customers. Since the transmission and distribution of electricity are either monopolized or highly concentrated in most jurisdictions, there are a limited number of possible purchasers for utility scale quantities of electricity in a given geographic location, including transmission grid operators and central and state-run utilities. For instance, for projects established pursuant to the NSM, solar project developers are required to enter into PPAs with specified implementation agencies (who in turn sell power to Discoms). As a result, there is a concentrated pool of potential buyers for electricity generated by our plants and projects, which may restrict our ability to (1) negotiate favorable terms under new PPAs, and (2) execute PPA for the projects for which we have won and have received LoAs.
Furthermore, if the financial condition of these utilities and/or power purchasers deteriorate or the NSM or other solar policy to which they are currently subject and that compel them to source renewable energy supplies change, demand for electricity produced by our renewable energy plants could be negatively impacted. Consequently, it is difficult to identify new customers, and our inability to retain existing customers and identify new customers can adversely affect our business.
Power Generation Risks
Any constraints in the availability of the electricity grid, including our inability to obtain access to transmission lines in a timely and cost-efficient manner could adversely affect our business.
Delivering power to our power purchasing customers is our responsibility. We generally rely on transmission lines and other transmission and distribution facilities that are owned and operated by transmission or distribution utilities. Where we do not have access to available transmission and distribution networks, we may engage contractors to build transmission lines and other related infrastructure. In such a case, we will be exposed to additional costs and risks associated with developing transmission lines and other related infrastructure, such as the ability to obtain right of way from landowners for the construction of our transmission lines, which may delay and increase the costs of our projects and, thereby, adversely affect our business, results of operations, financial condition and cash flows.
In addition, India’s physical infrastructure, including its electricity grid, is less robust than that of many developed countries. As a result of grid constraints, such as grid congestion and restrictions on transmission capacity of the grid, the transmission and dispatch of the full output of our projects may be curtailed. We may have to stop producing electricity during the period when electricity cannot be transmitted. Such events could reduce the net power generation of our projects from estimated power generation. If construction of renewable energy projects outpaces transmission capacity of electricity grids, we may be dependent on the construction and upgrade of grid infrastructure by the transmission utilities. We cannot assure that the relevant transmission utilities will develop required transmission infrastructure in timely manner, or at all. The curtailment of our power projects’ output levels will reduce our electricity output and limit operational efficiencies, which in turn could adversely affect our business, results of operations, financial condition and cash flows.
Maintenance and expansion of power generation facilities involve significant risks that could result in reduced power generation and financial results.
Our facilities may require periodic upgrading and improvement. Any unexpected operational or mechanical failure, including failure associated with breakdowns, and any decreased operational or management performance, could reduce our facilities’ generating capacity below expected levels and reduce our revenues as a result of generating and selling less power. Degradation of the performance of our projects beyond levels provided for in the related PPAs may also reduce our revenues. Our plants may be adversely affected by storms, high winds or flooding, lower solar insolation resulting in damage and loss of revenue. Unanticipated capital expenditures associated with maintaining, upgrading or repairing our facilities may also reduce profitability, especially because our tariff is fixed in the PPAs, and we may not be able to pass through any unexpected costs in relation to the projects to our customers. Furthermore, we are not able to mitigate such project risks by shifting some or all of the risk to a third-party Engineering, Procurement and Construction or Operations and Maintenance contractor since we provide most of these services in-house. Due to this, our maintenance and power generation facilities may be negatively resulting in reduced power generation and adverse impact on financial results. This impact we may not be able to recover through insurance. If the situation worsens there could be a further adverse impact on our revenues. Further, changes in technology may require us to make additional capital expenditures to upgrade our facilities. The development and implementation of such technology entails technical and business risks and additional costs of implementation.
Changes in the political, fiscal or regulatory environment in India.
A substantial portion of our business and operations are in India, and we are subject to regulatory, economic, social and political uncertainties in India.
Our business and our employees are in India, and we intend to continue to develop and expand our business in India. Consequently, our financial performance will be affected by changes in exchange rates and controls, interest rates, changes in government policies, including taxation policies, social and civil unrest and other political, social and economic developments in or affecting India. An election or a new administration in India or in any of the states could result in uncertainty in the renewable energy market, which could harm our operations.
India has a mixed economy with a large public sector and an extensively regulated private sector. The GoI has exercised and continues to exercise significant influence over many aspects of the Indian economy. Since 1991, successive Indian governments have generally pursued policies of economic liberalization and financial sector reforms, including by significantly relaxing restrictions on the private sector. Nevertheless, the role of the Indian central and state governments in the Indian economy as producers, consumers and regulators has remained significant and there is no assurance that such liberalization policies will continue. The GoI in the past, among other things, imposed controls on the prices of a broad range of goods and services, restricted the ability of businesses to expand existing capacity and reduce the number of their employees, determined the allocation to businesses of raw materials and foreign exchange and reversed their policies of economic liberalization. The performance and growth of our business are necessarily dependent on economic conditions prevalent in India, which may be adversely affected by such developments. We may not be able to react to such changes promptly or in a cost-effective manner. Increased regulation or changes in existing regulations may require us to change our business policies and practices and may increase the cost of providing services to our customers which would have an adverse effect on our business, results of operations, financial condition and cash flows.
Notwithstanding the Reserve Bank of India’s policy initiatives, the course of market interest rates continues to be uncertain due to high inflation, the increase in the fiscal deficit and the GoI’s borrowing program. Any continued or future inflation because of increases in prices of commodities such as crude oil or otherwise, may result in a tightening of monetary policy and could materially and adversely affect our business, results of operations, financial condition and cash flows. Any increase in interest rates or reduction in liquidity could adversely impact our business.
Further, as per the Electricity Act, the state distribution companies in India are required to procure minimum prescribed energy from renewable energy sources in the form of renewable purchase obligation. However, in the past, most of the states have been in non-compliance with the obligation to purchase such minimum amount of energy produced from renewable energy sources, on account of low penalties currently associated with such non-compliance. Accordingly, there may be an adverse impact on our profitability due to resultant lower procurement of renewable energy.
Our long-term growth is also dependent upon the targets set by the GoI for renewable energy. Any change in the present government, a reduction in the targets set by the GoI for renewable energy or a failure to meet the GoI’s targeted installed capacity may result in a slowdown in our growth opportunities and adversely affect our ability to achieve our long-term business objectives, targets and goals.
The regulatory and policy environment affecting the renewable energy sector in India impacts our business.
The regulatory and policy environment in which we operate is evolving and subject to periodic change, and our business, results of operations, financial condition and cash flows could be adversely affected by any unfavorable changes in or interpretations of existing laws, or implementation of new laws. Uncertainty in the applicability, interpretation or implementation of any amendment to, or change in, governing law, regulation or policy in the jurisdictions in which we operate, including by reason of an absence, or a limited body, of administrative or judicial precedent may be time consuming as well as costly for us to resolve and may impact the viability of our business currently or in the future.
Our business, results of operation and financial performance could be adversely affected by any change in laws or interpretation of existing, or the promulgation of, laws, rules and regulations applicable to us. There can be no assurance that the GoI will not implement new regulations and policies which will require us to obtain additional approvals and licenses from the government and other regulatory bodies or impose onerous requirements and conditions on our operations, which could result in increased compliance costs as well as divert significant management time and other resources.
Further, we depend in part on government policies that support renewable energy and enhance the economic feasibility of developing renewable energy projects. The GoI and several of the states in which we operate or plan to operate provide incentives that support the generation and sale of renewable energy, and additional legislation is regularly being considered that could enhance the demand for renewable energy and obligations to use renewable energy sources. In addition, regulatory policies in each person knownstate in India currently provide a favorable framework for securing attractive returns on capital invested. If any of these incentives or policies are adversely amended, eliminated or not extended beyond their current expiration dates, or if funding for these incentives is reduced, or if governmental support of renewable energy development, particularly solar and wind energy, is discontinued or reduced, it could adversely affect our ability to obtain financing, the viability of new renewable energy projects constructed based on current tariff and cost assumptions or the profitability of our existing projects.
We also benefit from a number of other government incentives, including; preferential charges on transmission, wheeling and banking facilities; generation-based incentives schemes for certain wind power assets; tax holidays; and availability of accelerated depreciation for wind and solar power assets. There is no assurance that the GoI and state governments will continue to provide incentives and allow favorable policies to be applicable to us, and these incentives may be available for limited period.
Changes to own beneficiallygovernment policies curtailing renewable energy generation may adversely affect our business. If governmental authorities stop supporting, or reduce or eliminate their support for, the development of renewable energy projects, it may become more than 5%difficult to obtain financing, our economic return on certain projects may be reduced and its financing costs may increase. A delay or failure by governmental authorities to administer incentive programs in a timely and efficient manner could also adversely affect our ability to obtain financing for its projects. These may, in turn, materially and adversely affect business, results of operations, financial condition and cash flows.
Duties on solar equipment imports increase our costs and adversely impact our performance.
The GoI imposes duties on various solar equipment and devices that are key to our business, and such duties are subject to frequent change. These duties can greatly increase our project costs. To the extent we are unable to pass on the impact of such duties to our off takers under any of our PPAs, our business, results of operations, financial condition and cash flows will be adversely affected.
Foreign investment laws in India include certain restrictions, which may affect our future assets sales, acquisitions or investments in India.
India regulates ownership of Indian companies by non-residents, and although many restrictions on foreign investment have been relaxed in recent years others, such as investments from countries bordering India, have been subject to more regulation. Pursuant to the Consolidated Foreign Direct Investment Policy, 2020 (the “FDI Policy”), investments can be made by non-residents in Indian companies to the extent of the percentage of the total capital of the Indian company specified in the FDI Policy. At present, the FDI Policy permits 100% foreign direct investment in Indian companies engaged in the power sector. Under current Indian regulations, transfers of shares between non-residents and residents are permitted (subject to certain exceptions) if they comply with, among other things, the Foreign Exchange Management (Non-debt Instruments) Rules, 2019, as amended from time to time, in relation to pricing and valuation of such shares and certain reporting requirements for such transactions specified by the Reserve Bank of India. If the transfer of shares is not in compliance with such pricing guidelines or reporting requirements or falls under any of the exceptions specified by the Reserve Bank of India, the prior approval of the Reserve Bank of India will be required before any such transfer may be consummated. We may not be able to obtain any required approval from the Reserve Bank of India or any other Indian regulatory authority on any particular terms or at all.
For example, under the FDI policy, the GoI provides additional requirements for foreign investments in India, including requirements with respect to downstream investments by Indian companies owned or controlled by non-resident entities and the transfer of ownership or control, from resident Indian persons or entities to non-residents, of Indian companies in sectors with limits on foreign investment. As substantially all APIPL’s and AZR’s shares are directly held by Azure Power Global Limited, it would be considered an entity owned and controlled by non-residents under applicable Indian laws. Accordingly, any downstream investment by APIPL or AZR into another Indian company will have to be in compliance with conditions applicable to such Indian entity, in accordance with the FDI policy. In addition, there may be investors who may not be able to buy assets we wish to sell in future. There are guidelines in relation to pricing and valuation of shares and restrictions on sources of funding for such investments. To the extent these guidelines become more restrictive, they may restrict our ability to make further equity investments in India, including through Azure Power Global Limited.
Further, India’s Foreign Exchange Management Act, 1999, as amended, and the rules and regulations promulgated thereunder (“FEMA”) prohibit us from borrowing from our Indian subsidiaries. We are permitted to lend to our Indian subsidiaries subject to compliance with India’s policy on external commercial borrowings as promulgated by the Reserve Bank of India from time to time, which specifies certain conditions, including in relation to eligible lenders and borrowers, permitted end use and limits on the all-in cost.
Our ability to raise foreign capital may be constrained by Indian law.
Our Indian subsidiaries are subject to exchange controls that regulate borrowing in foreign currencies. Such regulatory restrictions limit our financing sources and hence could constrain our ability to obtain financings on competitive terms and refinance existing indebtedness. In addition, we cannot assure you that the required approvals will be granted to us without onerous conditions, or at all. Limitations on raising foreign debt may adversely affect our business, results of operations, financial condition and cash flows.
We are subject to various labor laws, regulations and standards in India. Non-compliance with and changes in such laws may adversely affect our business, results of operations, financial condition and cash flows.
We are required to comply with various labor and industrial laws in India. Moreover, new laws are anticipated, which, when implemented, will introduce several new changes, such as introducing a single registration and license for Indian companies, increasing threshold for applicability of certain laws for factories, increase in threshold for engaging contract workers, and government approval for retrenchment (termination) of workers. There is no assurance that our costs of complying with current and future labor laws and other regulations will not adversely affect our business, results of operations, financial condition and cash flows. There is a risk that we may fail to comply with such regulations, which could result in us being exposed to sanctions and fines and may lead us to stop operations which could have an adverse impact on our operations.
Changes in the taxation system in India could adversely affect our business.
Our operations, profitability and cash flows could be adversely affected by any unfavorable changes in central and state-level statutory or regulatory requirements in connection with direct and indirect taxes and duties, including income tax, goods and service tax, (“GST”) in India, or by any unfavorable interpretation taken by the relevant taxation authorities and/or courts and tribunals in India. For example, the GoI levied GST on renewable energy devices as well as on service of construction for solar power plant and wind operated electricity generators. Such income tax rules are subject to change, and any current tax benefits may not be available in the future. Any amendments to Indian tax laws could adversely affect our business, results of operations, financial condition and cash flows.
Health, Safety and Environmental Risks
Our operations have inherent safety risks and hazards that require continuous oversight and substantial insurances coverage.
Construction and generation of power from solar power generation facilities and plants involves inherent safety risks and hazards which must be identified and mitigated. Power generation involves hazardous activities, including high voltages in key equipment and delivering electricity to transmission and distribution systems. Natural risks such as earthquake, flood, lightning, hurricane and wind, other hazards, such as fire, structural collapse and machinery failure also are inherent risks in our operations. These and other hazards can cause personal injury or loss of life, damage to and destruction of property, plant and equipment and contamination of, or damage to, the environment and suspension of operations. We maintain insurance protection that we consider adequate, but we cannot provide any assurance that our insurance will be sufficient or effective under all circumstances and against all hazards or liabilities to which we may be subject. Furthermore, our insurance coverage is subject to deductibles, caps, exclusions and other limitations. A loss for which we are not fully insured could materially and adversely affect our business, results of operations, financial condition and cash flows. Further, due to rising insurance costs and changes in the insurance markets, we cannot provide any assurance that our insurance coverage will continue to be available at all or at rates or on terms similar to those presently available. Any losses not covered by insurance could materially and adversely affect our business, results of operations, financial condition and cash flows.
As part of our investigation of the whistle-blower complaint in May 2022, we discovered deviations from safety and quality norms at one of our project sites. Although no loss time injury or fatality at this site occurred, we implemented mechanisms to remediate the problems identified and in so doing strengthen safety and quality protocols. We also undertook audits at other sites which were under direct supervision of similar personnel and confirmed that the deviation from safety and quality norms and was limited to only one project site. We have now formalized and implemented a “safety consequence management policy” that establishes individual accountability for deviation from the company’s safety management system.
Our operations are subject to governmental, health, safety and environmental regulations, and we may have to incur material costs to comply with these regulations.
The power generation business in India is subject to a broad range of environmental, social (including labor), health, safety and other laws and regulations. These laws and regulations require us to obtain and maintain a number of approvals, licenses, registrations and permits for developing and operating power projects. Additionally, we may need to apply for more approvals in the future, including renewal of approvals that may expire from time to time. Furthermore, our government approvals and licenses are subject to numerous conditions, some of which are onerous and require us to make substantial expenditure. We may incur material costs, including clean up or remediation costs, fines and civil or criminal sanctions, and third-party property damage or personal injury claims, as a result of any violations of or liabilities under environmental or health and safety laws or noncompliance with permits and approvals, which, as a result, may have a material adverse effect on our reputation, business, results of operations, financial condition and cash flows.
Environmental laws and regulations in India have become and continue to be more stringent, and the scope and extent of new environmental regulations, including their effect on our operations, cannot be predicted with any certainty. In case of any change in environmental or pollution regulations, we may be required to invest in, among other things, environmental monitoring, pollution control equipment, and emissions management and other expenditure to comply with environmental standards. Any failure on our part to comply with future regulations applicable to us may result in legal proceedings, including public interest litigation, being commenced against us, third party claims or the levy of regulatory fines.
We currently fall under an exemption granted to solar photovoltaic projects that exempts us from complying with the Environment Impact Assessment Notification, 2006, issued under the Environment (Protection) Act, 1986. While we are not required to obtain consents under the Water (Prevention and Control of Pollution) Act, 1974, Air (Prevention and Control of Pollution) Act, 1981 and the Hazardous Waste (Management, Handling and Transboundary Movement) Rules, 2016, E-waste Management Rules 2016, and certain procedural requirements, such as informing the Pollution Control Board, exists. However, there can be no assurance that we will not be subject to any such consent requirements in the future, and that we will be able to obtain and maintain such consents or clearances in a timely manner, or at all, or that we will not become subject to any regulatory action on account of not having obtained or renewed such clearances in any past periods. Non-compliance witch such environmental and other similar laws and regulations will have a material adverse effect on our reputation, business, results of operations, financial condition and cash flows.
Competition Risks
We may not be able to acquire rights to develop and generate power from new solar projects through the competitive bidding process.
We acquire the rights to develop and generate power from new projects through a competitive bidding process, in which we compete for project awards based primarily on pricing, technical and engineering expertise, financial conditions, including specified minimum net worth criteria, availability of land, financing capabilities and track record. The bidding processes are affected by factors which may be beyond our control, such as market conditions or government incentive programs. If we misjudge our competitiveness when submitting our bids or if we fail to lower our costs to submit competitive bids, we may not acquire the rights on new renewable energy projects. Furthermore, we make assumptions with respect to prices for system components and raw materials, and if prices for system components and raw materials are greater than our assumed prices, our project economics may be adversely affected and the project for which we bid may not remain economically viable.
In addition, rules of the auction process may change. Each state in India has its own regulatory framework and states have their own renewable energy policy. The rules governing the various regional power markets may change from time to time, in some cases, in a way that is contrary to our interests and adverse to our financial returns. For example, most national auctions currently use the reverse auction structure, in which several winners take part in the same project. There can be no assurance that the central and state governments will continue to allow us to utilize such bidding structures and any shift away from the current structures, such as to a Dutch auction, could increase the competition and adversely affect our business, results of operations, financial condition and cash flows.
For information on the risk of not executing PPAs in respect of our 4,000 MWs manufacturing linked tender, see “— We may not be able to sign PPAs for balance capacity of 967 MWs in respect of the 4,000 MWs manufacturing linked tender for which letter of award has already been received.”
We face significant competition from traditional and renewable energy companies.
We face significant competition in the markets in which we operate. Our primary competitors are Indian and international developers and operators of solar projects and other renewable energy sources. We also compete with utilities generating power from conventional fossil fuels. Deregulation of the Indian power sector and increased private sector investment have intensified the competition we face. The Electricity Act, or the Electricity Act, removed certain licensing requirements for power generation companies, provided for open access to transmission and distribution networks and also facilitated additional capacity through captive power projects. These and other similar future reforms do and will provide opportunities for increased private sector participation in power generation.
Furthermore, our competitors may have greater operational, financial, technical, management or other resources to achieve better economies of scale and lower cost of capital, allowing them to bid in the same auction at more competitive rates. Our competitors may also have a more effective or established localized business presence or a greater willingness or ability to operate with little or no operating margins for sustained periods of time. Our competitors may also enter into strategic alliances or form affiliates with other competitors to our detriment. As our competitors grow in scale, they may establish in-house EPC and O&M capabilities, which may offset a current advantage we may have over them. Moreover, suppliers or contractors may merge with our competitors which may limit our choices of suppliers or contractors and hence the flexibility of our overall project execution capabilities. In addition, some of our competitors have developed their own internal solar panel manufacturing capabilities. As the renewable energy industry grows and evolves, we may also face new competitors who are not currently in the market. In addition, we face competition from developers of other renewable energy facilities, including biomass, and nuclear, as well as other forms of renewable electricity generation like hydrogen. Competition from such producers may increase if the technology used to generate electricity from these other renewable energy sources becomes more sophisticated, or if the GoI elects to further strengthen its support of such renewable energy sources. Any increase in competition during the bidding process or reduction in our competitive capabilities could materially and adversely affect our market share and the profit that we generate from our projects.
IT and cyber security risks
Weaknesses, disruptions, failures or cyber security events in our IT systems could adversely impact our business.
We rely on IT systems in connection with financial controls, risk management and transaction processing as well as to manage our power projects. We may be subject to disruptions of our IT systems, arising from events that are wholly or partially beyond our control (for example, damage or incapacitation by human error, natural disasters, electrical or telecommunication outages, sabotage, computer viruses, or loss of support services from third parties such as internet backbone providers). Although we have not experienced material incidents in the past, we may in the future experience incidents of system failures, cyber-attacks and frauds, hacking, phishing, trojans and theft of data or other types of cyber security attacks or incidents that have a material adverse effect on our business, results of operations, financial condition and cash flows. In the event we experience systems interruptions, errors, downtime, incidents of hacking, phishing, or breaches of our data security systems, this may give rise to deterioration in customer service and loss or liability to us and it may materially and adversely affect our reputation, business, results of operations, financial condition and cash flows. Such cyber security events could expose us to a risk of loss or misuse of our information, litigation, reputational damage, violations of applicable privacy and other laws, fines, penalties or losses that are either not insured against or not fully covered by insurance maintained. We may be required to expend significant additional resources to modify our protective measures or to investigate and remediate vulnerabilities.
Risks related to project land and the acquisition of land
We may not be able to find suitable sites for the development of renewable energy projects.
Our ability to realize our business and growth plans is dependent on our ability to develop and secure rights to sites suitable for the development of projects. Suitable sites are determined on the basis of cost, wind, solar and hydro resource levels, topography, grid connection infrastructure and other relevant factors, which may not be available in all areas. Further, wind, solar and hydro energy projects must be interconnected to the power grid in order to deliver electricity, which requires us to find suitable sites with adequate evacuation and transmission infrastructure, including right of way. Solar energy and transmission infrastructure projects also require sufficient contiguous land for development, which may be difficult to procure on suitable terms. Some locations used for evacuation and transmission facilities are not owned by us and are located on land owned by third parties. Land used for our projects is subject to other third-party rights such as rights of passage and rights to place cables and other equipment on the properties, which may interfere with our right to use the land and ultimately impair our operations.
Any failure by us to secure suitable sites may materially impact the development of a project and may also result in non-compliance with related conditions under project agreements. If this occurs across a number of our projects, our business and prospects could be materially and adversely affected.
Land title in India can be uncertain, and it may be subject to onerous conditions which may restrict its use.
There is no central title registry for real property in India, and the documentation of land records in India has not been fully computerized. Property records in India are generally maintained at the state and district level and in local languages and, while digitization is proceeding in many states, have historically been updated manually through physical records. Therefore, property records may not be available online for inspection or updated in a timely manner, may be illegible, untraceable, incomplete or inaccurate in certain respects, or may have been kept in poor condition, which may impede title investigations or our ability to rely on such property records. In addition, there may be a discrepancy between the duration of the principal lease under different orders issued by state governments in respect of a particular parcel of revenue land. Furthermore, title to land in India is often fragmented, and in many cases, land may have multiple owners. Title may also suffer from irregularities, such as non-execution or non-registration of conveyance deeds and inadequate stamping, pending or on-going litigation and may be subjected to encumbrances of which we are unaware. In some cases, owners and those traditionally occupying or using land may differ. Any defects in, or irregularities of, title may result in a loss of development or operating rights over the land, which may prejudice the success of our power projects and require us to write off substantial expenditures in respect of our power projects.
As part of our investigation into whistle-blower complaints, we identified significant control issues in our process of acquiring land and land use rights for one of our projects. For further information, see “— We have conducted investigations into whistle-blower claims and other allegations against persons who served as our directors, officers and employees. We reported the allegations and our findings to the SEC and the U.S. Department of Justice and continue to cooperate with these authorities.”
In addition, improperly executed, unregistered or insufficiently stamped conveyance instruments in a property’s chain of title, unregistered encumbrances in favor of third parties, rights of adverse possessors, ownership claims of family members of prior owners or third parties, or other defects that a purchaser may not be aware of can affect title to a property. As a result, potential disputes or claims over title to the land on which our power projects are or will be constructed may arise. However, an adverse decision from a court or the absence of an agreement with such third parties may result in additional costs and delays in the construction and operating phases of any solar projects situated on such land. Also, such disputes, whether resolved in our favor or not, may divert management’s attention, incur extra-legal cost, harm our reputation or otherwise disrupt our business. For instance, we have filed civil suits in UP and Gujarat seeking directions from the court to the counterparty to execute sale deeds in our favor.
Further, some properties used for our solar projects are subject to other third-party rights such as right of passage and rights to place cables and other equipment on the properties, which may result in certain interferences with our use of the properties. Our rights to the properties used for our solar projects may be challenged by property owners and other third parties for various other reasons as well. Any such challenge, if successful, could impair the development or operations of our solar projects on such properties.
Additionally, the power projects that we may develop or acquire in the future may be located on land that may be subject to onerous conditions under the lease agreements through which we acquire rights to use such land and rights of way. Furthermore, the state government may exercise its rights of eminent domain, or compulsory acquisition in respect of land on which our projects are or will be located. Any of this may adversely affect our business, results of operations, financial condition and cash flows.
We do not own all the land on which we operate.
We lease some of the land that we utilize or intend to utilize for our projects, and we may be subject to conditions under the pertinent lease agreements. Such conditions typically include restrictions on leasehold interest or rights to use the land, continual operating requirements, and other obligations which include obtaining requisite approvals, payment of necessary statutory charges and giving preference to local workers for construction and maintenance. We are also exposed to the risk that these leases will not be extended or will be terminated by the relevant lessors. Some of our projects are located, or will be located, on revenue land that is owned by the state governments or on land acquired or to be acquired from private parties. The timeline for transfer of title in the land is dependent on the type of land on which the projects are, or will be, located, and the policies of the relevant state government in which such land is located. In the case of land acquired from private parties, which is agricultural land, the transfer of such land from agriculturalists to non -agriculturalists such as our Company and the use of such land for non-agricultural purposes may require an order from the relevant state land or revenue authority allowing such transfer or use. For revenue land, we obtain a lease from the relevant government authority. In certain cases, the land leased for the development of renewable energy projects is obtained on a sub-lease. Such land may be subject to disputes on account of right of way, encroachment and other related issues.
The timeline for transfer of title to the land depends on the type of land on which the projects are located and the policies of the relevant state government in which such land is located. In the case of land acquired from private parties, which is agricultural land, the transfer of such land may require an order from the relevant state land or revenue authority allowing such transfer or use. There is no certainty that the outstanding approvals would be received on time, or that lease or sub-lease deeds would be executed in a timely manner, such that the operation of the projects will continue unaffected. In certain cases, any delay in the construction or commissioning of a project may result in termination of the lease. Further, the terms of lease and sub-lease agreements may also not be co-terminus with the lifetime of the power projects. If the relevant lessor does not wish to renew the lease or sub-lease agreements, we may be forced to remove our equipment at the end of the lease and/or sub-leases and we may not be able to find an alternative location in the short term or at all. Consequently, our business, results of operations, financial condition and cash flows could be adversely affected.
Risks of Adverse Weather Events and Natural Calamities
The generation of electricity from solar and wind sources depends on suitable weather.
The electricity produced and revenues generated by our renewable energy projects are highly dependent on weather conditions and air pollution, which are beyond our control. Furthermore, components of our systems, such as solar panels and inverters, could be damaged by severe weather. We generally will be obligated to bear the expense of repairing the damaged solar energy systems that we own, subject to insurance policies in effect, and replacement and spare parts for key components may be difficult or costly to acquire or may be unavailable. Unfavorable weather, high levels of air pollution and atmospheric conditions could impair the effectiveness of our assets or reduce their output beneath their rated capacity or require shutdown of key equipment, impeding operation of our assets and our ability to achieve certain performance guarantees pursuant to our PPAs, forecasted revenues and cash flows. Sustained unfavorable weather could also unexpectedly delay the installation of renewable energy systems, which could result in a delay in us acquiring new projects or increase the cost of such projects. We guarantee the performance of our solar power plants and could suffer monetary consequences if our plants do not produce to our contracted levels.
We base our investment decisions with respect to each solar or wind project on the findings of related solar and wind studies conducted on-site prior to construction. However, actual climatic conditions at a project site may not conform to the findings of these studies and therefore, our facilities may not meet anticipated production levels or the rated capacity of our generation assets, which could adversely affect our business, results of operations, financial condition and cash flows.
Natural calamities could have a negative impact on the Indian economy and adversely affect our business.
India experienced natural calamities such as earthquakes, cyclone and floods in the past few years. We have experienced unusually heavy rainfall and consequent flooding at several of our plants in recent monsoons. The extent and severity of these natural disasters determines their impact on the Indian economy. If climatic conditions or natural disasters occur in areas where our projects and project teams are located, project development, operations, connectivity to the power grid and the provision of O&M services may be adversely affected. In particular, timely delivery of materials and labor availability may be affected. Substantially all our operations and employees are in India and there can be no assurance that we will not be adversely affected by natural disasters in the future or that we will be able to obtain suitable insurance to cover such losses.
Contractual Risks Related to Our PPAs and Fixed Tariffs
In Fiscal 2022, the Special Committee was convened to review certain material projects and contracts over a three-year period for anti-corruption and related compliance issues. Further, the Group will not continue with construction of 3,033 MWs manufacturing linked projects.
We are conducting an ongoing review of our projects under contract to consider their commercial and economic viability. In addition, in Fiscal 2022, the Special Committee was convened to review certain material projects and contracts over a three-year period for anti-corruption and related compliance issues. See” — We have conducted investigations into whistle-blower claims and other allegations against persons who served as our directors, officers and employees. We reported the allegations and our findings to the SEC and the U.S. Department of Justice and continue to cooperate with these authorities.”
Pursuant to the manufacturing linked tender award of 4,000 MW, the Group executed PPAs for a capacity of 2,333 MW with SECI, for which SECI executed a Power Sale Agreement (“PSA”) with the state of Andhra Pradesh during Fiscal 2022. In respect of these 2,333 MW projects, two PILs were filed in the High Court of Andhra Pradesh in Fiscal 2022, challenging various aspects of the manufacturing linked tender and seeking to quash the Andhra Pradesh Regulator’s approval for procurement of capacity tied up by Andhra Pradesh Discoms with SECI pursuant to the tender. The tariff adoption for the capacities by the CERC is subject to the outcome of the PILs. We are not a party to the PIls, and the PILs currently are pending adjudication. Currently, we cannot predict the outcome of these two PILs.
Based on the economics and uncertainties associated with the PILs and ongoing Special Committee review, the Group concluded that it should seek to terminate the PPAs in respect of these 2,333 MW projects and filed a petition at the Andhra Pradesh High Court seeking a declaration that the Group should be discharged from performance of the obligations under the Andhra Pradesh PPAs for a capacity of 2,333 MW as a result of the absence of the unconditional tariff adoption order from the regulatory commission. Since there was a threat by SECI to revoke the Bank Guarantee of US$14.2 million, the Hon’ble High Court in its order dated October 16, 2023, directed SECI not to take coercive steps against the Group until the next date of hearing. This matter is pending.
On March 18, 2024, we received two letters from SECI. In its first letter, SECI stated that it had terminated the PPAs with the Group in respect of the 2,333 MW projects and reserved its rights to take action against the Group including forfeiture of the performance guarantees and success charges and fees in respect of the PPAs and other documentation associated with the 2,333 MW projects. In its second letter, SECI informed the Group that it was awarding the 2,333 MW projects and associated PPAs to a third-party. Further, SECI informed the Group that it had reduced Azure’s capacity allocation under the manufacturing Letter of Award by 2,333MW and its corresponding manufacturing capacity of solar cells and solar modules by 583 MW. Accordingly, the Group has taken a write-off of INR 254 million (US$ 3.1 million) towards irrecoverable costs and a provision of INR 1,223 million (US$14.9 million) towards Bank Guarantees in its consolidated financial statements for Fiscal 2023.
In light of the ongoing Special Committee review as well as economic and execution challenges, the Group has also decided to withdraw from the 700 MW projects which is part of the 4,000 MW manufacturing linked tender awarded by SECI in Fiscal 2020. The Group intends to commence discussions with SECI to ensure an orderly withdrawal from the 700 MW projects and from the obligations of the Group and its subsidiaries under the PPA, Performance Bank Guarantees and other guarantees relating to the projects. Accordingly, the Group has recognized a provision of INR 1,053 million (US$ 12.8 million) in its consolidated financial statements for Fiscal 2023 towards irrecoverable costs and Bank Guarantee in relation to the 700 MW projects.
The Group may be subject to penalties and damages in connection with the termination of the PPAs in respect of the 2,333 MW and withdrawal from the 700 MW PPAs, which may have a material adverse impact on the Group’s business, results of operations and financial condition.
We may not be able to sign PPAs for balance capacity of 967 MWs in respect of the 4,000 MWs manufacturing linked tender for which letter of award has already been received.
In Fiscal 2020, we won a bid for 2,000 MWs manufacturing linked project with SECI, and we also elected to exercise a greenshoe option for an additional 2,000 MWs as per auction guidelines. During Fiscal 2022, we had executed PPAs with SECI for an aggregate of 2,983 MWs out of 4,000 MWs and in January 2023 we executed a PPA for an additional 50 MWs. PPAs for the balance capacity of 967 MWs are still pending for execution with SECI. SECI has stated that they shall only be able to sign PPAs for the remaining 967 MWs, if they get Discoms to sign PSAs for such un-mapped capacity. We will continue our discussions with SECI towards signing PPAs for the balance capacity of 967 MWs. In case we are unable to sign PPAs in respect of this capacity, it could adversely affect our prospects.
In addition, we will not continue with construction of 3,033 MWs manufacturing linked projects, for details see above risk factor “- In Fiscal 2022, the Special Committee was convened to review material projects and contracts over a three-year period for anti-corruption and related compliance issues. Further, the Group will not continue with construction of 3,033 MWs manufacturing linked projects”.
Much of our revenue is exposed to fixed tariffs, changes in tariff regulation and structuring.
Under a long-term PPA, we typically sell power generated from a power plant to central government owned intermediaries or state distribution companies, at pre-determined fixed tariffs. The terms of our PPAs are generally 25 years from the scheduled commissioning dates of the projects. Our PPAs are generally not subject to downward revisions unless we elect to utilize accelerated rate of depreciation or if there is a delay in commissioning our projects, although we have entered into contracts that provide for downward adjustments in the past and may do so in the future. Accordingly, if there is an industry-wide increase in tariffs or if we are seeking an extension of the term of the PPA, we will not be able to renegotiate the terms of the PPA to take advantage of the increased market tariffs. In addition, in the event of increased operational costs, we will not have the ability to reflect a corresponding increase in our tariffs. While some of our PPAs provide for tariff increase due to “change in law,” any such increase in tariff requires regulatory approvals which can be time consuming and expensive. We may face difficulties in recovering the costs (whether by tariff increases or litigation) through such corrective measures, from the respective state distribution companies/ authorities in a timely manner and may also face resistance from the regulators when we seek increases in tariffs. This may lead to disputes and impact our business, results of operations, financial condition and cash flows.
Further, any delay in commissioning the projects or supplying electricity during the term of the PPA may result in reduction in tariffs, based on the terms of the PPA. In some of our PPAs (specifically those executed with SECI), in the event of an early commissioning of the projects prior to the scheduled commissioning date, SECI has the right of first refusal, and may purchase the generated power, only with the consent of the buying utilities. In case of early part-commissioning of the project, the power if purchased, is only purchased at 75% of the tariff payable under the PPA, until the scheduled commissioning date. Similarly, any excess generation, over and above the maximum contracted energy defined in the PPA, would be subject to the consent of the buying utility and shall be purchased at 75% of the tariff otherwise payable under the PPA. Therefore, the prices at which we supply power may have little or no relationship with the costs incurred in generating power, which may lead to fluctuations in our margins. All the above factors limit our business flexibility, expose us to an increased risk of unforeseen business and industry changes and could adversely affect our business, results of operations, financial condition and cash flows.
Our PPAs may be terminated upon the occurrence of certain events.
Our profitability is largely a function of our ability to manage our costs during the terms of the PPAs and operate our power projects at optimal levels. If we are unable to manage our costs effectively or operate our power projects at optimal levels, our business, results of operations, financial condition and cash flows may be adversely affected. Our PPAs typically allow an off taker to terminate the agreement or demand penalties from us upon the occurrence of certain events, including but not limited to, the failure to comply with prescribed minimum shareholding requirements; complete project construction or connection to the transmission grid by a certain date; supply the minimum amount of power specified; comply with prescribed operation and maintenance requirements; obtain regulatory approvals and licenses; comply with technical parameters set forth in grid codes and regulations; and comply with other material terms of the relevant PPAs. Furthermore, most of our PPAs allow termination on a case-by-case basis in the event force majeure event(s) continue for an extended period of time.
In instances of PPA termination where we are entitled to receive termination payments from a counterparty or distribution company due to such counterparty’s or distribution company’s material breach, there can be no certainty that such counterparty or distribution company will make such payments on time or at all. Further, it is unlikely that termination payments will be adequate to pay all the outstanding third-party debt that we have borrowed for the project.
Certain of our PPAs allow our off takers to purchase the relevant project from us under certain circumstances. Some of the PPAs also entitle our lenders to appoint another party as the operator of our projects, under certain circumstances, such as the creation of security contravening the terms of the relevant PPAs, bankruptcy, insolvency or winding up proceedings against a power generator, or a change in control event without the lender’s consent. If any such third party is not appointed within the stipulated time, the PPAs may be terminated by the off takers and we may be required to acquire the project on mutually agreed terms as per the relevant PPAs. If we are unable to acquire the project, the lenders may enforce their mortgage rights under the respective credit agreements. If such buyouts or step-ins occur and we are unable to locate and acquire suitable replacement projects on time or at all, our business, results of operations, financial condition and cash flows may be materially and adversely affected.
Restriction in transfer of PPAs
Certain PPAs, particularly our PPAs executed with SECI, require us to retain the controlling shareholding (more than 50% of the voting rights and paid-up share capital) prevalent at the time of the signing of the PPA from one to three years after the commercial operation date (except with prior approval); however, transfer of controlling shareholding within the same group of companies is permitted with the permission of SECI after the commercial operation date, subject to the condition that the management control remains within the same group of companies. This effectively restricts our ability to generate revenues through sale of allotted projects, until after one to three years from the commercial operation date and can materially and adversely affect our business, results of operations, financial condition and cash flows.
Risk Related to Our Growth Strategy
As part of our growth strategy, we engage in acquisitions which involve a number of risks, that could adversely affect our ability to achieve the benefits and returns expected.
Our growth strategy is to continue to build shareholder value, and we will evaluate acquisition opportunities that satisfy our criteria for value accretive acquisitions, some of which may be significant. Acquisitions involve a number of risks, that could adversely affect our ability to achieve the benefits and returns expected and cause performance to suffer. These risks include:
| ● | lower than expected revenue from the acquired company or assets; |
| ● | problems in integration of the acquired company’s accounting, human resources and other administrative systems, including management information, purchasing, accounting, finance, billing, payroll and benefits and regulatory compliance; |
| ● | use of available cash, new borrowings or borrowings under existing credit facilities to consummate the acquisition may not yield targeted or desired benefits; |
| ● | diversion of management’s attention from existing operations to the integration of acquired companies; |
| ● | difficulties in the assimilation and retention of employees; |
| ● | difficulties in the maintenance of customer relationships; |
| ● | incurring significantly higher capital expenditures and operating expenses, which could substantially limit our operating or financial flexibility; |
| ● | ongoing obligations under agreements related to the acquisition; |
| ● | infringement claims, violation of laws, commercial disputes, tax liabilities and other known and unknown liabilities; and |
| ● | inheritance of claims or liabilities, as a result of strategic acquisitions, including claims from DISCOMs, customers, or other third parties and potential adverse effects on our operating results. |
Risks Related to Litigation and Legal Proceedings
We may become involved in costly and time-consuming litigation, arbitration and other regulatory proceedings, which require significant attention from our management.
We may, in the ordinary course of our business, become involved in litigation, administrative or arbitral proceedings. For example, we are, and may become subject to litigation against counterparties to project agreements, additional demands from Indian governmental or tax authorities, including, but not limited to, on account of differing interpretations of central and state tax statutes in India, which are extensive and subject to change from time to time. Additionally, claims may be brought against or by us from time to time regarding, for example, defective or incomplete work, defective products, personal injuries or deaths, damage to or destruction of property, breach of warranty, late completion of work, delayed payments, breach of module supply contracts, intellectual property rights, regulatory compliance, labor issues, environmental issues and ownership rights. Further, claims may be brought against due to employee and executive compensation related matters. These various claims may subject us to litigation, arbitration and other legal proceedings, which may be expensive, lengthy, disruptive to normal business operations and require significant attention from our management.
If we were found to be liable on any of the claims against us, we would incur a charge against earnings to the extent a reserve had not been established for coverage. If amounts ultimately realized from the claims by us were materially lower than the balances included in our financial statements, we would incur a charge against earnings to the extent profit had already been accrued. Charges and write-downs associated with such legal proceedings could materially and adversely affect our business, results of operations, financial condition and cash flows. Moreover, adverse publicity from such legal proceedings, particularly those resulting in judgments or findings against us, may harm our reputation and competitiveness in the market.
For further information on ongoing claims, see “ Additional Information — Legal Proceedings.”
An action alleging violations of U.S. securities laws has been brought against our Company in the New York.
A class action lawsuit was filed in the U.S. District Court for the Southern District of New York, case number 1:22-cv-07432, against our Company and certain of its former directors and officers alleging violations of U.S. securities laws. The lead plaintiff has filed a First Amended Complaint, and the court set a deadline for the lead plaintiff to file a Second Amended Complaint of 28 days after the date of filing the Fiscal 2022 Form 20-F. The lead plaintiff filed a Second Amended Complaint on November 9, 2023. The Company is vigorously defending against the claims asserted in the lawsuit. Accordingly, we filed a motion to dismiss the lawsuit on March 22, 2024. However, there is no assurance that the court will grant the motion, and, if not, we will incur additional costs in defending the lawsuit which could materially and adversely affect our business, results of operations, financial condition and cash flows. Moreover, adverse publicity from such extended legal proceedings may harm our reputation and competitiveness in the market.
External Risks Including the Global Economy, Unrest, Terrorism War, Downgrading of India’s Debt
Global economic conditions have been challenging and continue to affect the Indian market, which may adversely affect our business, results of operations, financial condition and cash flows.
The Indian economy and its securities markets are influenced by economic developments and volatility in securities markets in other countries. Investors’ reactions to developments in one country may adversely affect the market price of securities of companies located in other countries, including India. Adverse economic developments, such as rising fiscal or trade deficits, or a default on national debt, in other emerging market countries may also affect investor confidence and cause increased volatility in Indian securities markets and indirectly affect the Indian economy in general. Furthermore, global events such as supply chain constraints, rising retail and wholesale inflation, volatility in global oil prices and other commodity prices and events such as the COVID-19 pandemic and the war in Ukraine have impacted the macro-economic conditions. Further, worldwide financial instability could have an adverse impact on the Indian economy, including the adverse foreign exchange rates and higher interest rates. Any other global economic developments or the perception that any of them could occur may adversely affect global economic conditions and the stability of global financial markets and may significantly reduce global market liquidity and restrict the ability of key market participants to operate in certain financial markets. Any of these factors could depress economic activity and restrict our access to capital, which could have an adverse effect on our business, results of operations, financial condition and cash flows.
War, terrorist acts and other acts of violence involving India or other neighboring countries could adversely affect our operations.
Terrorist attacks and other acts of violence or war involving India or other neighboring countries may significantly harm the Indian markets and the worldwide financial markets. The occurrence of any of these events may result in a loss of business or consumer confidence and reduced investment, which could potentially lead to economic recession and adversely affect our business, results of operations, financial condition and cash flows. In addition, any deterioration in international relations may result in investor concern regarding regional stability, which could decrease the price of our shares. Further, our insurance policies for a certain part of our business do not cover terrorist attacks or business interruptions from terrorist attacks or for other reasons.
Any downgrading of India’s sovereign debt rating by an international rating agency could adversely impact our business, results of operations, financial condition and cash flows.
India’s sovereign rating is Baa3 with a “stable” outlook (Moody’s), BBB- with a “stable” outlook (S&P) and BBB- with a “stable” outlook (Fitch). Any adverse revisions to India’s credit ratings by international rating agencies may adversely affect our ratings, terms on which it is able to finance capital expenditure or refinance any existing indebtedness. This could adversely affect our business, results of operations, financial condition and cash flows.
Risks Related to Our Corporate Structure, Control of our Business and Investments in Mauritius Companies
Our Company will have to rely principally on dividends and other distributions on equity paid by its operating subsidiaries and limitations on their ability to pay dividends to our Company could adversely impact your ability to receive dividends on our Company’s equity shares.
Since our Company cannot borrow from our Indian subsidiaries, dividends and other distributions on equity paid by our operating subsidiaries will be our principal source of cash to fund our operations including corporate expenses and taxes. Accordingly, our Company may need to issue additional equity or borrow funds, either of which may be unavailable on attractive terms, if at all.
If our operating subsidiaries incur debt on their own behalf in the future, the instruments governing the debt may restrict their ability to pay dividends or make other distributions to us. As usedour key operating subsidiary, APIPL, is established in India, it is also subject to certain limitations with respect to dividend payments. As of the date of this table, beneficial ownership meansannual report, APIPL has not paid any cash dividends on its shares and does not intend to pay dividends to its equity shareholders, including us, in the soleforeseeable future. Moreover, as we do not own 100% of APIPL, any dividend payment made by APIPL to us will also involve a payment to the other shareholders of APIPL. If we do not receive distributions or sharedpayments from APIPL, the liquidity, financial condition and our cash flows could be materially and adversely affected.
As a shareholder in our Company organized under the laws of Mauritius, you may have greater difficulties in protecting your interests than as a shareholder of a United States corporation.
Our Company is incorporated under the laws of Mauritius. The laws generally applicable to United States corporations and their shareholders may provide shareholders of United States corporations with rights and protection for which there may be no corresponding or similar provisions under the Companies Act 2001 of Mauritius, as amended, or the Mauritius Companies Act. As such, being a holder of our Company’s shares, you may or may not be accorded the same level of shareholder rights and protection that a shareholder of a United States corporation may be accorded under the laws generally applicable to United States corporations and their shareholders. Taken together with the provisions of our Company’s constitution, which our Company adopted with effect upon completion of its public offering in October 2016, some of these differences may result in you having greater difficulties in protecting your interests as our Company’s shareholder than you would have as a shareholder of a United States corporation. This affects, among other things, the circumstances under which transactions involving an interested director are voidable, whether an interested director can be held accountable for any benefit realized in a transaction with us, what rights you may have as a shareholder to enforce specified provisions of the Mauritius Companies Act or our Company’s Constitution, and the circumstances under which we may indemnify our Company’s directors and officers.
Anti-takeover provisions in our Company’s constitutional documents could make an acquisition of us more difficult and may prevent attempts by our Company’s shareholders to replace or remove our Company’s current management.
Provisions in our Company’s Constitution may have the effect of delaying or preventing a change in control or changes in our management, including the following provisions which may be regarded as defensive measures:
| ● | a staggered Board (where only a portion of the Board is subject to election at one time); |
| ● | the ability to issue additional shares (including “blank check” preferred stock); |
| ● | granting directors, the absolute discretion to decline to register a transfer of any shares; |
| ● | requiring that amendments to our Company’s Constitution be approved by a special resolution of the shareholders of our Company; and |
| ● | limiting the liability of, and providing indemnification to, our Company’s directors and officers. |
These provisions may restrict or prevent any attempts by our Company’s shareholders to replace or remove our Company’s current management by making it more difficult for shareholders to replace members of our Board, which is responsible for appointing the members of our Company’s management team. The provisions could also deprive our shareholders of the opportunity to sell their shares at a premium over the prevailing market price by discouraging third parties from seeking to obtain control of us and generally limit the market price of our Company’s shares.
Our Company’s largest shareholder owns 53.4% of our shares and may exercise control of our Company.
Our Company’s largest shareholder, CDPQ Infrastructures Asia Pte Ltd. (“CDPQ Infrastructures”), owns 53.4% of our Company’s shares. CDPQ Infrastructures is a company organized and existing under the laws of Singapore and is a wholly owned subsidiary of the Caisse de dépôt et placement du Québec, a body constituted by the Act Respecting the Caisse De Dépôt Et Placement Du Québec. Consequently, CDPQ Infrastructures has the ability to exercise control over our Company and may have the power to voteelect and remove the Directors and may determine the outcome proposals for corporate action requiring ordinary resolution of our Company’s equity shareholders. The interests of CDPQ Infrastructures may be different from our interests or the interests of other shareholders of our Company. As a result, CDPQ Infrastructures, may delay or defer or initiate a change of control of our Company or a change in our capital structure, delay or defer a merger, sale of assets, or consolidation, or delay or defer the payment of dividends, or delay or defer fresh capital raise, or seek to determine or direct the votingprice at which new capital is raised. At present, CDPQ Infrastructures has two nominee Directors on our Board including Jaime Garcia Nieto and Philippe Wind.
You may have difficulty enforcing judgments against our Company, our Company’s directors and management. Further, investors may not be able to enforce a judgment of a foreign court against our Indian subsidiaries, certain of our Company’s directors, or our key management, except by way of a suit in India on such judgment.
Our Company is incorporated under the laws of Mauritius. Further, we conduct substantially all our operations in India through our key operating subsidiaries in India. All our Company’s directors and officers reside outside the United States, and all our assets and some or all the assets of such persons are located outside the United States. As a result, it may be difficult or impossible to effect service of process within the United States upon our Company or those persons, or to disposerecover against our Company or them on judgments of United States courts, including judgments predicated upon the civil liability provisions of the United States federal securities laws. An award of punitive damages under a United States court judgment based upon United States federal securities laws is likely to be construed by Mauritian and Indian courts to be penal in nature and therefore unenforceable in both Mauritius and India. Further, no claim may be brought in Mauritius or directIndia against our Company or our Company’s directors and officers in the first instance for violation of United States federal securities laws because these laws have no extraterritorial application under Mauritian or Indian law and do not have force of law in Mauritius or India. However, a Mauritian or Indian court may impose civil liability, including the possibility of monetary damages, on our Company or our Company’s directors and officers if the facts alleged in a complaint constitute or give rise to a cause of action under Mauritian or Indian law. Moreover, it is unlikely that a court in Mauritius or India would award damages on the same basis as a foreign court if an action were brought in Mauritius or India or that a Mauritian or Indian court would enforce foreign judgments if it viewed the amount of damages as excessive or inconsistent with Mauritius or Indian practice or public policy.
The courts of Mauritius or India would not automatically enforce judgments of United States courts obtained in actions against our Company or our Company’s directors and officers, predicated upon the civil liability provisions of the United States federal securities laws, or entertain actions brought in Mauritius or India against our Company or such persons predicated solely upon United States federal securities laws. Further, there is no treaty in effect between the United States and Mauritius providing for the enforcement of judgments of United States courts in civil and commercial matters and the United States has not been declared by the GoI to be a reciprocating territory for the purposes of enforcement of foreign judgments, and there are grounds upon which Mauritian or Indian courts may decline to enforce the judgments of United States courts. Some remedies available under the laws of United States jurisdictions, including remedies available under the United States federal securities laws, may not be allowed in Mauritian or Indian courts if contrary to public policy in Mauritius or India. Because judgments of United States courts are not automatically enforceable in Mauritius or India, it may be difficult for you to recover against us or our Company’s directors and officers based upon such judgments. In India, prior approval of the Reserve Bank of India is required to repatriate any amount recovered pursuant to such judgments.
All our operating subsidiaries are incorporated under the laws of India. In addition, certain of our Company’s directors and substantially all our director and officer reside in India, and all or a substantial portion of our assets and such persons are in India. As a result, it may not be possible for investors to effect service of process upon such persons outside India, or to enforce judgments obtained against such parties outside India. In India, recognition and enforcement of foreign judgments are provided for under Section 13 and Section 44A of the Civil Procedure Code, 1908 (the “Civil Code”) on a statutory basis. Section 13 of the Civil Code provides that a foreign judgment shall be conclusive regarding any matter directly adjudicated upon, except: (i) where the judgment has not been pronounced by a court of competent jurisdiction; (ii) where the judgment has not been given on the merits of the case; (iii) where it appears on the face of the proceedings that the judgment is founded on an incorrect view of international law or a refusal to recognize the law of India in cases to which such law is applicable; (iv) where the proceedings in which the judgment was obtained were opposed to natural justice; (v) where the judgment has been obtained by fraud; and (vi) where the judgment sustains a claim founded on a breach of any law then in force in India.
Under the Civil Code, a court in India shall, upon the production of any document purporting to be a certified copy of a foreign judgment, presume that the judgment was pronounced by a court of competent jurisdiction unless the contrary appears on record.
India is not a party to any international treaty in relation to the recognition or enforcement of foreign judgments. Section 44A of the Civil Code provides that where a foreign judgment has been rendered by a superior court, within the meaning of such section, in any country or territory outside India, which the GoI has by notification declared to be a reciprocating territory, it may be enforced in India by proceedings in execution as if the judgment had been rendered by the relevant court in India. However, Section 44A of the Civil Code is applicable only to monetary decrees not being in the nature of any amounts payable in respect of taxes, other charges of a like nature or in respect of a fine or other penalty and does not apply to arbitration awards. Further, the execution of the foreign decree under Section 44A of the Civil Code is also subject to the exceptions under Section 13 of the Civil Code.
The United Kingdom, Singapore and Hong Kong (among others) have been declared by the GoI to be reciprocating territories for the purposes of Section 44A. However, the United States has not been declared by the GoI to be a reciprocating territory for the purposes of Section 44A of the Civil Code. Accordingly, a judgment of a court in a country which is not a reciprocating territory may be enforced in India only by a fresh proceeding suit instituted in a court of India and not by proceedings in execution. Such a suit must be filed in India within three years from the date of the judgment in the same manner as any other suit filed in India to enforce a civil liability in India. It is unlikely that a court in India would award damages on the same basis as a foreign court would if an action were brought in India. Further, it is unlikely that an Indian court would enforce foreign judgments if that court were of the view that the amount of damages awarded was excessive or inconsistent with Indian public policy. A party seeking to enforce a foreign judgment in India is required to obtain approval from the RBI to repatriate outside India any amount recovered pursuant to the execution of such judgment and such amount may be subject to income tax in accordance with applicable laws. In addition, any judgment awarding damages in a foreign currency would be converted into Indian Rupees on the date of the judgment and not the date of payment. We cannot predict whether a suit instituted in an Indian court will be disposed of in a timely manner or be subject to considerable delay.
Risks Related to Our Shares
Our Company does not expect to pay any cash dividends on our Company’s shares.
Our Company has not paid dividends on any of our Company’s shares to date, and our Company currently intends to retain our future earnings, if any, to fund the development and growth of our Company’s business. As a result, capital appreciation, if any, of our Company’s shares are likely to be your sole source of gain for the foreseeable future. Consequently, you will likely only experience a gain from your investment in our Company’s shares if the price of our Company’s shares increases.
In addition, our Company’s ability and decisions whether to pay dividends in the future will depend on our earnings, financial condition and capital requirements. Dividends to U.S. holders may be negatively affected by foreign currency fluctuations. We may not generate sufficient income to cover our operating expenses and pay dividends to our Company’s shareholders, or at all. Our Company’s ability to pay dividends is restricted under our current financing agreements and dividends may be further restricted by financing arrangements that our Company may enter into in the future. Our Company’s future dividend policy will depend on our capital requirements, financing arrangements, results of operations, financial condition and cash flows.
There is no assurance of an active or liquid trading market for our Company’s shares.
Our Company’s shares have historically had low trading volumes, and an active liquid trading market for our Company’s shares may not be maintained in the long term. Trading volumes have been further impacted by the delisting of our shares from the New York Stock Exchange and the trading of our Company’s shares on the OTC “expert” market, where quotations are only directly available to broker dealers and professional investors (not to retail investors). See “— The New York Stock Exchange (NYSE) has delisted our Company’s shares due to our failure to timely file periodic reports with the SEC.”
We cannot be certain that any trading market for our Company’s shares will be sustained or that the present price will correspond to the future price at which our Company’s shares will trade. Loss of liquidity could increase the price volatility of our Company’s shares. Consequently, you may not be able to sell your shares at a price that is attractive to you.
The market price of our Company’s shares has been and may continue to be volatile, and you could lose all or part of your investment.
The trading price of our shares has been volatile and is likely to continue to be volatile. Such volatility will likely be more pronounced due to the delisting of our shares from the NYSE and the ensuing commencement of trading of our shares on the OTC “expert” market. See “— The New York Stock Exchange (NYSE) has delisted our Company’s shares due to our failure to timely file periodic reports with the SEC.”
Additional factors that could cause fluctuations in the market price of our Company’s shares include — trading volume, prices of other securities, market trends, growth of other comparable companies, changes in operating performance, sale of additional shares in the market by us or by other investors, coverage by security analysts, changes in financial estimates, failure to meet analyst or market expectations, press releases by us or our competitors, market speculations, changes in tax and other incentives, regulatory and policy changes, litigations, business acquisitions, changes in accounting standards and economic conditions.
Further, in recent years the stock markets have experienced extreme price and volume fluctuations that have affected and continue to affect the market prices of equity securities of many companies. These fluctuations often have been unrelated or disproportionate to the operating performance of those companies. In addition, the stock prices of many renewable energy companies have experienced wide fluctuations that have often been unrelated to the operating performance of those companies. These broad market and industry fluctuations, as well as general economic, political and market conditions such as recessions, government shutdowns, interest rate changes, or international currency fluctuations, may cause the market price of our Company’s shares to decline.
Sales of a substantial number of our Company’s shares by our Company or our Company’s existing shareholders, could cause our Company’s share price to fall.
Sales of a substantial number of our shares in the public market by our Company or shareholders, or the perception that such sales might occur, could depress the market price of our Company’s shares and could impair our ability to raise capital through the issuance of additional equity securities of our Company. We are unable to predict the effect that these sales and others may have on the prevailing market price of our Company’s shares.
In addition, certain of our Company’s shareholders can require us to register shares owned by them for public sale in the United States. Our Company also has filed a registration statement to register our Company’s shares reserved for future issuance under our Company’s equity compensation plans. Subject to the satisfaction of applicable exercise periods and applicable volume and restrictions that apply to affiliates, our Company’s shares issued upon exercise of outstanding options will become available for immediate resale in the public market upon issuance.
Future sales of our Company’s shares by our existing shareholders may make it more difficult for us to sell equity securities in the future at a time and at a price that we deem appropriate. These sales also could cause the market price of our Company’s shares to decline and make it more difficult for you to sell our Company’s shares.
Future issuances of any security. A person is deemedequity securities may cause a dilution in your shareholding, decrease the trading price of our equity shares, and restrictions agreed to beas part of debt financing arrangements may place restrictions on our operations.
Any issuance of equity securities could dilute the beneficial ownerinterests of our shareholders and could substantially decrease the trading price of our equity shares. Our Company may issue equity or equity-linked securities that can be acquired within 60 daysin the future for a number of reasons, including to finance our working capital and operations and business strategy (including in connection with acquisitions and other transactions), to adjust our ratio of debt to equity, to satisfy our obligations upon the exercise of then-outstanding options or other equity-linked securities, if any, option, warrant or right as on March 31, 2017. Equity Shares subject to options, warrants orfor other reasons. In the case where pre-emptive rights that are currently exercisable or exercisable within 60 days are deemed outstanding for computing the ownership percentage of the person holding the options, warrants or rights, but are not deemed outstanding for computing the ownership percentage of any other person. The amounts and percentages as of March 31, 2017 are based on 25,915,956 equity shares outstanding as of this date:
| | | | | | | | |
Name | | Number shares
beneficially
owned | | | (%) | |
Directors and Officers: | | | | | | | | |
Inderpreet Singh Wadhwa(1) | | | 1,744,150 | | | | 6.73 | % |
Harkanwal Singh Wadhwa | | | 43,680 | | | | 0.17 | % |
Preet Sandhu | | | 52,512 | | | | 0.20 | % |
Surendra Kumar Gupta | | | 37,824 | | | | 0.15 | % |
Mohor Sen | | | 960 | | | | 0.00 | % |
Robert Kelly | | | 26,825 | | | | 0.10 | % |
Sanjeev Aggarwal(2) | | | — | | | | — | |
Barney S. Rush(3) | | | — | | | | — | |
Arno Harris(4) | | | 45,073 | | | | 0.17 | % |
Cyril Cabanes | | | — | | | | — | |
Eric Ng Yim On(5) | | | — | | | | — | |
Muhammad Khalid Peyrye(6) | | | — | | | | — | |
All Directors and Officers as a Group | | | 2,097,650 | | | | 8.09 | % |
5% or Greater Shareholders: | | | | | | | | |
IW Green LLC(7) | | | 1,647,952 | | | | 6.36 | % |
Helion Venture Partners II, LLC(8) | | | 3,426,172 | | | | 13.22 | % |
FC VI India Ventures (Mauritius) Ltd.(9) | | | 3,778,140 | | | | 14.58 | % |
IFC GIF Investment Company I(10) | | | 5,189,452 | | | | 20.02 | % |
International Finance Corporation(11) | | | 2,665,251 | | | | 10.28 | % |
CDPQ Infrastructures Asia Pte Ltd.(12) | | | 5,250,226 | | | | 20.26 | % |
(1) | Includes the equity shares held by IW Green LLC. Mr. Inderpreet Wadhwa is the beneficial owner of all equity interests of IW Green LLC. |
(2) | Does not include any equity shares of Mr. Aggarwal, a managing director of Helion Venture Partners, who may be deemed to beneficially own through interests held by funds managed by Helion Venture Partners. Mr. Aggarwal’s business address is Helion Advisors Private Limited, Tower B, 10th Floor, Vatika Towers, Sector 54, Gurgaon, 122 002, India. |
(3) | Mr. Rush’s business address is 6917 Maple Avenue, Chevy Chase, Maryland 20815. |
(4) | Mr. Harris’ business address is 135 Main Street, Suite 1320, San Francisco, California 94105. |
(5) | Mr. Ng’s business address is c/o AAA Global Services Ltd., 1st Floor, The Exchange 18 Cybercity, Ebene, Mauritius. |
(6) | Mr. Peyrye’s business address is c/o AAA Global Services Ltd., 1st Floor, The Exchange 18 Cybercity, Ebene, Mauritius. |
(7) | The sole member of IW Green LLC is Mr. Inderpreet S. Wadhwa. IW Green LLC was known as IW Green Inc. prior to its conversion to IW Green LLC in October 2015. |
(8) | Helion Investment Management, LLC holds the voting power in Helion Venture Partners II, LLC. SA Holdings Global Ltd and Gupta Goyal Trust are the beneficial owners of Helion Investment Management, LLC. Mr. Sanjeev Aggarwal is the beneficial owner of SA Holdings Global Ltd and Mr. Ashish Gupta and Ms. Nita Goyal are the beneficial owners of Gupta Goyal Trust. Each of the beneficial owners disclaims beneficial ownership in the shares held by the aforementioned entities except to the extent of his or her pecuniary interest therein. The principal address of Helion Venture Partners II, LLC is Les Cascades Building, Edith Cavell Street, Port Louis, Mauritius. |
(9) | FC VI India Holding (Mauritius) Ltd. is the beneficial owner of all equity interests of FC India Venture (Mauritius) Ltd. and exercises sole voting and investment power over the shares owned by FC India Venture (Mauritius) Ltd. Foundation Capital VI, L.P. and Foundation Capital VI Principals Fund, LLC are the beneficial owners of FC VI India Holding (Mauritius) Ltd. The general partner of Foundation Capital VI, L.P. and Foundation Capital VI Principals Fund, LLC is Foundation Capital Management Co. VI, LLC. The managing members of Foundation Capital Management Co. VI, LLC are Mr. Paul Koontz, Mr. Michael Schuh, Mr. Paul Holland, Mr. Richard Redelfs, Mr. Steve Vassallo, Mr. Charles Moldow and Mr. Warren Weiss. Each of the managing members of Foundation Capital Management Co. VI, LLC disclaims beneficial ownership in the shares held by the aforementioned entities except to the extent of his or her pecuniary interest therein. The address of Foundation Capital Management Co. VI, LLC is 250 Middlefield Road, Menlo Park, CA 94025. |
(10) | IFC Global Infrastructure Fund, LP is the beneficial owner of all equity interests of IFC GIF Investment Company I, while IFC Global Infrastructure (GP) LLC and IFC Global Infrastructure (Alternate GP) LLP control the management and operations of with IFC Global Infrastructure Fund, LP. The principal address of IFC GIF Investment Company I is c/o Cim Fund Services Ltd., 33 Edith Cavell Street, Port Louis, Mauritius. |
(11) | International Finance Corporation is an international organization established by Articles of Agreements among its member countries. Its principal address is 2121, Pennsylvania Avenue, NW, Washington, District of Columbia 20433, United States. |
(12) | CDPQ Infrastructures Asia Pte Ltd., a company organized and existing under the laws of Singapore, is a wholly-owned subsidiary of the Caisse de dépôt et placement du Québec, a body constituted by the Act Respecting the Caisse De Dépôt Et Placement Du Québec. The principal address of the Caisse de dépôt et placement du Québec is 1000, place Jean-Paul-Riopelle, Montréal, Québec, H2Z 2B3. |
ITEM 7. MAJOR SHAREHOLDERS AND RELATED PARTY TRANSACTIONS
A. Major Shareholders
Please refer to “Item 6. Directors, Senior Management and Employees—E. Share Ownership”
On October 17, 2016, we completed our initial public offering on the New York Stock Exchange. We sold an aggregate of 3,409,091 equity shares (including 2,242,424 equity shares sold by us and 1,166,667 equity shares sold by the selling shareholders). The price per equity share was US$18.00.
B. Related Party Transactions
We believe that the terms of our related party transactions are comparable to the terms we could obtain from independent third parties. Our related party transactions are subject to the review and approval of the audit committee of our Board of Directors. Our audit committee will consider whether the transaction is to be conducted on an arms-length basis and whether the services can be procured from an independent third party. The charter of our audit committee as adopted by our Board of Directors provides that we may not enter into any related-party transaction unless and until it hashave been approved by the audit committee.
Lease Agreement
On November 28, 2011, AZI entered into a lease agreement, which became effective from December 1, 2011, for our registered office building and a lease arrangement for a guest house, which became effective February 1, 2016 with family members of Mr. Inderpreet Singh Wadhwa. Each transaction was conducted in the normal course of operations, transacted at the market rate and was approved by a majority of the Board of Directors independently. AZI renewed the lease agreement for our office building on October 15, 2013 for a term of five years ending on April 30, 2018, cancellable after 12 months. For the fiscal years ended March 31, 2015, 2016 and 2017, the Company incurred rent expense on office facilities and guest house facilities totaling INR 14.5 million, INR 15.0 million and INR 19.4 million (US$0.3 million), respectively, where the lessors are relatives of the Company’s chief executive officer and another director of AZI. As of March 31, 2016, and 2017, the Company had security deposits with these lessors totaling INR 8.6 million (US$0.1 million).
Private Placements
In June 2014, AZI issued 79,245 Series F compulsorily convertible preferred shares at a price of INR 11,224.75 per share to FC VI India Ventures (Mauritius) Ltd. and Helion Venture Partners II, LLC. The price per share was determined after the foregoing investors offered better pricing terms than the price per share offered in arm’s length negotiations by independent investors. The transaction was approved by the Board of Directors. In connection withwaived, the issuance of Series F compulsorily convertiblesuch additional securities may significantly dilute the equity interests of investors, subordinate the rights of holders of equity shares if preferred shares AZIare issued with rights senior to those afforded to our Company’s equity shares, or harm prevailing market prices for our Company’s equity shares.
If securities or industry analysts do not publish or cease publishing research or reports about us, our business or our market, or if they change their recommendations regarding our shares adversely, our stock price and Mr. Inderpreet Wadhwa entered into an Investment Agreement with the foregoing investors. In December 2014, AZI issued an additional 38,581 Series F compulsorily convertible preferredtrading volume could decline.
The trading market for our shares at a price of INR 11,224.75 per share to FC VI India Ventures (Mauritius) Ltd. and Helion Venture Partners II, LLC.
In June 2014, AZI issued 36,000 compulsorily convertible debentures to International Finance Corporation, at a price of INR 5,000 per share. The price per share was determined after the foregoing investor offered better pricing terms than the price per share offered in arm’s length negotiations by independent investors. The transaction was approvedis influenced by the Boardresearch and reports that industry or securities analysts publish about us, our business, our market or our competitors. Due to our delay in filing the Fiscal 2022 Form 20-F annual report and this Fiscal 2023 Form 20-F annual report, some industry and securities analysts ceased publishing research on us, and we may have lost visibility to the clients of Directors. In February 2015, AZI issued 20,307 additional Series F compulsorily convertible preferred shares at asuch analysts. Further, if any of the analysts who cover us or may cover us in the future change their recommendation regarding our stock adversely, or provide more favorable relative recommendations about our competitors, our stock price would likely decline. If any analyst who covers us or may cover us in the future were to cease coverage of INR 11,224.75 per shareour company or fail to International Finance Corporation.
In June 2015,regularly publish reports on us, we entered into a subscription agreement with International Finance Corporationcould lose visibility in the financial markets, which in turn could cause our stock price or trading volume to decline.
Tax Risks for Shareholders and its affiliated entity forInvestors
You may be subject to Indian taxes on income arising through the sale of 133,285 shares of Series H compulsorily convertible preferred shares for US$60 million, which weour shares.
Pursuant to recent amendments to the Indian Income Tax Act, 1961, as amended, in July 2015. In July 2015, we entered into a subscription agreement with Société de Promotion et de Participation pour la Coopération Économique,income arising directly or PROPARCO, forindirectly through the sale of 18,882 sharesa capital asset, including any share or interest in a company or entity registered or incorporated outside of Series G compulsorily convertible preferred shares for US$8.5 million.
In September 2016, we entered intoIndia, will be liable to tax in India, if such share or interest derives, directly or indirectly, its value substantially from assets (whether tangible or intangible) located in India and whether or not the seller of such share or interest has a subscription agreement, which was subsequently amended, with IFC GIF Investment Company I forresidence, place of business, business connection, or any other presence in India. The share or interest of the salecompany or entity registered or incorporated outside of 55,535 sharesIndia is deemed to derive its value substantially from the assets located in India if the value of Series I compulsorily convertible preferred shares for US$25 million. The closing of this transaction occurred before our initial public offering. Pursuant to the initial public offering, all the compulsorily convertible preferred sharessuch Indian assets exceeds INR100 million and compulsorily convertible debentures were converted into equity shares.
Shareholders Agreements
On July 22, 2015, we, AZI and our founders, Mr. Inderpreet Wadhwa and Mr. Harkanwal Wadhwa, entered into an amended shareholders agreement, or the AZI Shareholder Agreement, (which supersedes earlier shareholder agreements). Pursuant to the AZI Shareholders Agreement, we have the right to nominate four directors to AZI’s board, our founders together have the right to nominate two directors who shall be shareholders or consultants of AZI or Azure Power Global Limited, and shareholders holding more thanrepresents at least 50% of the value of all the assets owned by the company or entity registered or incorporated outside of India. Substantially all our assets are in India.
However, if the transferor of share or interest in a company or entity registered or incorporated outside of India (along with its associated enterprises), neither holds the right of management or control in the company or entity registered or incorporated outside of India nor holds voting power or share capital or interest exceeding 5% of AZIthe total voting power or total share capital or interest in the company or entity registered or incorporated outside of India, at any time during the twelve months preceding the date of transfer, such small shareholders are exempt from the indirect transfer provisions mentioned above. The amendments also do not deal with the interplay between the amendments to the Indian Income Tax Act, 1961, as amended, and the existing Double Taxation Avoidance Agreements that India has entered into with countries such as the United States in case of an indirect transfer. Accordingly, the implications of the recent amendments are presently unclear. If it is determined that these amendments apply to a holder of our shares, such holder could be liable to pay taxes in India on such income.
Our Company may be classified as a fully diluted basis shall have the rightpassive foreign investment company, which could result in adverse U.S. federal income tax consequences to nominate one director who shall be an independent director. The AZI Shareholders Agreement providescertain U.S. investors of our Company’s shares.
Our Company believes that it was not a passive foreign investment company (“PFIC”) for our taxable year ending March 31, 2023 and that, based on the present composition of its income and assets and the way it conducts its business, our Company will does not expect to be a PFIC in our Company’s current taxable year or in the foreseeable future. Whether our Company is the intention of all parties to the
agreement to eventually make AZI our wholly-owned subsidiary. Pursuant to the AZI Shareholders Agreement we have a right to require AZI to purchase all AZI equity securities held by our founders, we havePFIC is a call option pursuant to which we have the right to require our founders to sell all or part of their AZI equity securities to us or our nominee purchaserfactual determination made annually, and our founders haveCompany’s status could change depending, among other things, upon changes in the composition and amount of our gross income and the relative quarterly average value of its assets. If our Company was a put option (notPFIC for any taxable year in which you hold our Company’s shares, you generally would be subject to additional taxes on certain distributions and any gain realized from the sale or other taxable disposition of our shares regardless of whether our Company continued to be a PFIC in any subsequent year, unless you mark your shares to market for tax purposes on an obligation) pursuantannual basis. You are encouraged to which they haveconsult your own tax advisor as to our Company’s status as a PFIC and the righttax consequences to requireyou of such status. A U.S. Holder will not be able to elect to treat us or our nominee purchaseras a qualified electing fund (“QEF”) because we do not intend to purchase all or part of their AZI equity securities, in each case atprepare the minimum price permissible under applicable law for such purchases of AZI equity securities. In addition, the AZI Shareholders Agreement prohibits transfers of AZI equity securities by our founders without our consent.
In addition, on July 22, 2015, we entered intoinformation needed to make a separate shareholders agreement, or the APGL Shareholders Agreement, among us, IFC, Helion Venture Partners II, LLC, Helion Venture Partners India II, LLC, FC VI India Venture (Mauritius) Ltd., DEG, PROPARCO, IFC GIFQEF election. See “Taxation — U.S. Federal Income Taxation — Passive Foreign Investment Company I, or GIF, and IW Green Inc. (which has since been converted to IW Green LLC) and our founders, Mr. Inderpreet Wadhwa and Mr. Harkanwal Wadhwa. The APGL Shareholders Agreement provides for certain preferential rights, including director nomination rights, rights of first offer, drag-along rights, rights of first refusal, co-sale rights, call options, information rights and consent rights on certain corporate matters. The APGL Shareholders Agreement was terminated upon the completionStatus.”
If a United States person is treated as owning at least 10% of our initial offering except forCompany’s shares, the following provisions: (A) a provision requiring, as long as IFC and GIF collectively own an aggregate of 5% of our equity share capital, shareholder approval by special resolution for (i) amendments to AZI and its subsidiaries’ articles of association or memorandum of association, except as such amendmentsholder may be required for certain financing matters, (ii) material salesto include amounts in its U.S. taxable income even if our Company does not make distributions to its shareholders.
If a United States person is treated as owning (directly, indirectly, or disposalsconstructively) at least 10% of the value or voting power of our assets orCompany’s shares, that person may be required to include certain amounts in its U.S. taxable income even if our incurrence of material liabilities, (iii) changesCompany make no distributions to our businessCompany’s shareholders. A United States person that is treated as owning (directly, indirectly, or constructively) at least 10% of the businessvalue or voting power of our Company’s shares may be treated as a “United States shareholder” with respect to each “controlled foreign corporation” in our Group. As a result of tax legislation enacted in 2017, it is not certain under what circumstances our non-U.S. subsidiaries will be treated as controlled foreign corporations. However, because our Group includes a U.S. subsidiary, our non-U.S. subsidiaries could be treated as controlled foreign corporations with respect to any United States shareholders (regardless of whether or not our Company is treated as a controlled foreign corporation). A United States shareholder of a controlled foreign corporation in our Group would be required to report annually and (iv) amendmentsinclude in its U.S. taxable income its pro rata share of “Subpart F income,” “global intangible low-taxed income,” and investments in United States property, if any, related to that controlled foreign corporation, regardless of whether our share option plan; (B)Company makes any distributions. Failure to comply with these reporting obligations may subject a provision requiring,United States shareholder to significant monetary penalties and may prevent the statute of limitations with respect to such shareholder’s U.S. federal income tax return for the year for which reporting was due from starting. An individual that is a United States shareholder with respect to a controlled foreign corporation generally would not be allowed certain tax deductions or foreign tax credits that would be allowed to a United States shareholder that is a U.S. corporation. Because our Company does not maintain U.S. tax books and records, our Company does not expect to be able to furnish to any United States shareholders the information that may be necessary to comply with the shareholder’s reporting and taxpaying obligations under these rules. A U.S. investor should consult its advisors regarding the potential application of these rules to an investment in our Company’s shares, including the possibility that the investor may be treated as longa “United States shareholder” as IFC and/a result of direct, indirect or GIF hold anyconstructive ownership of our equity shares, shareholder approval by ordinary resolution to be obtained for equity issuances of more than 10% of our share capital; and (C) provisions requiring our continued compliance with certain standard policies of IFC and PROPARCO on, among other things, environmental, social and anti-corruption issues, as long as IFC or PROPARCO, respectively, hold any of our equity securities.Company’s shares.
Personal Guarantees
Mr. Inderpreet Singh Wadhwa and Mr. Harkanwal Singh Wadhwa have personally guaranteed a working capital facility provided by the Central Bank of India, for INR 1,980.0 million, in favor of the lender.
In addition, Mr. Inderpreet Singh Wadhwa and Mr. Harkanwal Singh Wadhwa have provided personal guarantees in favor of the Central Bank of India for the repayment of loans of three of our project subsidiaries in the amounts of INR 217 million, INR 586 million and INR 1,201 million, in addition to the payment of any interest and other monies payable to the lender.
Mr. Inderpreet Singh Wadhwa and Mr. Harkanwal Singh Wadhwa did not receive any separate remuneration from the company for providing the guarantees.
C. Interest of Experts and Counsel
Not applicable
VI. ADDITIONAL INFORMATION
A. Consolidated Statements and Other Financial Information
See “Item 18. Financial Statements” for a list of the financial statements filed as part of this annual report.
Legal Proceedings
We are currently involved in and may from time to time, become involved in legal, arbitration or governmental proceedings or be subject to claims arising in the ordinary course of our business. We are not
presently party to any legal proceedings that, in the opinion of our management, would reasonably be expected to have a material adverse effect on our business, financial condition, operating results or cash flows if determined adversely to us. Regardless of the outcome, litigation can have an adverse impact on us because of defensedefence and settlement costs, diversion of management resources and other factors.
Dividend Policy and Dividend Distribution
We have never declared or paid dividends, nor dobeen involved in two arbitration proceedings concerning matters of executive compensation and stock purchase with a former chief executive officer. Our Company and our subsidiary, Azure Power India Private Limited, were respondents in arbitration proceedings initiated by our former Chairman, CEO and Managing Director of our Company, Mr. Inderpreet Singh Wadhwa (“IW”) and erstwhile COO Mr. H.S Wadhwa (“HSW”), in relation to the purchase price of the shares of IW’s and HSW’s in Azure Power India Private Limited before the Singapore International Arbitration Centre (SIAC). The arbitration has been concluded and the award has been issued in our favor. Subsequently, IW and HSW filed an appeal challenging the SIAC award on May 5, 2022, before the Singapore High Court. However, vide order dated June 29, 2022, the appeal filed by IW and HSW has been dismissed. Consequently, the Award in our favor has been upheld. We have filed a petition before the High Court of Delhi seeking enforcement of the Award. There is no adverse order passed by the Hon’ble High Court till date. This matter is next listed for hearing on July 11, 2024.
We were parties to an arbitration proceeding before Singapore International Arbitration Centre (“SIAC”) against one of the module suppliers whereby we claimed amongst others breach of a MSA. We have now amicably settled the dispute. The details of the settlement are confidential.
Pursuant to the manufacturing linked tender award of 4,000 MW, we have executed PPAs for a capacity of 2,333 MW with SECI, for which PSA has been executed with state of Andhra Pradesh. Two PILs have been filed before the hon’ble High Court of Andhra Pradesh against the MoP, MNRE, SECI, Government of Andhra Pradesh, etc. seeking among others (i) quashing of Request for Selection dated June 25, 2019 (“RfS”) issued by SECI pursuant to which Azure was awarded the manufacturing linked project for 4,000 MW capacity, (ii) setting aside of the Letter of Award issued by SECI to Azure pursuant to the RfS, (iii) setting aside of Andhra Pradesh Electricity Regulatory Commission’s order (“APERC Order”) approving procurement of 7 GWs from SECI under the RfS (which includes capacity of 2,333 MW for which PPAs have been executed by us) and (iv) setting aside the CERC order dated April 2, 2022 whereby tariff discovered under the RfS was adopted. CERC had passed an order dated April 02, 2022, adopting tariffs under the PPAs subject to the outcome of the PIL. The next hearing date in these PILs is April 18, 2024.
On account of SECI’s failure to obtain tariff adoption (unconditional) order and other supervening events beyond our control, Azure’s performance under 2,333 MW PPAs tied up with State of Andhra Pradesh was adversely affected. Based on these economic reasons, as well as the ongoing Special Committee investigation, Azure terminated the PPA’s for 2,333 MW. See “Risk Factors - We have conducted investigations into whistle-blower claims and other allegations against persons who served as our directors, officers and employees. We reported the allegations and our findings to the SEC and the U.S. Department of Justice and continue to cooperate with these authorities.” Considering the communication received from SECI and imminent threat of encashment of Bank Guarantees as submitted by us in relation to aforesaid manufacturing tender, we received a favourable order dated October 16, 2023 from the High Court against encashment of such Bank Guarantees and no coercive action against us till the next hearing date. The next hearing date is yet to be intimated.
In the event the PILs are allowed, the same may result in cancellation of the Letter of Award and PPAs awarded to/ executed by us pursuant to the RfS. We cannot predict the outcome of these two PILs, however, if they are allowed this could have a material adverse impact on us.
In relation to our 300 MW Project (Rajasthan 9), we were granted a First Time Charging (“FTC”) approval which was conditional and subject to providing availability of real time data, grid conditions and validity of safety clearance and the undertaking given by us. Subsequently, a Working Group Report, 2022 (“WGR Report”) introduced by the CEA, whereby new requirements have been introduced. Post the issuance of the report, NRLDC has directed us to comply with such requirements by September 30th 2023, failing which the FTC/connectivity of the Project shall be revoked and the plant shall be disconnected. In relation to this, we have filed a petition before the Ld. CERC seeking extension of time for complying with the directions of NRLDC along with interim protection from disconnection from the Grid. The matter was last listed on October 10, 2023 whereby NRLDC made a specific submission that they did not initiate any present planaction against Azure with regard to disconnection. The next date of hearing will be intimated in due course.
In relation to the 2,000 MW (4 PPAs x 500 MW) Projects being set up by us in the state of Rajasthan, we have filed a petition before Ld. CERC seeking declaration that the Transmission Agreement for Connectivity (read with supplementary agreement) executed for availing transmission facilities stands frustrated for the reasons not attributable to us and discharge us from performance of obligations under the said agreement. The petition is presently pending and the next date of hearing will be intimated in due course.
In relation to our 10 MW project in Gujarat, Gujarat Urja Vikas Nigam Limited (“GUVNL”) had filed a petition before the Gujarat Electricity Regulatory Commission (“GERC”), seeking reduction in our PPA tariff from INR 12.51 kWh as determined by GERC under Section 62 of the Electricity Act to INR 8.15 KWh. While GERC and the Appellate Tribunal for Electricity (“APTEL”) dismissed the claims made by GUVNL, an appeal filed by GUVNL against the order of APTEL is pending before the Supreme Court of India, and next date in these matters is to be intimated.
In relation to our 50 MW project in the State of Andhra Pradesh, the Government of Andhra Pradesh followed by the AP distribution licensee (“Discom”) sought to reduce tariffs of our project (along with that of the other developers for solar and wind projects both) from the then PPA tariff of INR 5.89 per unit to INR 2.44 per unit. Azure and other developers filed a writ petition before the High Court at AP challenging this reduction, which was allowed by the Single Judge; however, the Single Judge allowed the Discom to approach the regulatory commission for seeking a reduction in tariff and directed payment to be made to the developers at the reduced rate of INR 2.44 per unit (in case of solar) in the interim. In an appeal, the Division Bench by way of judgment, dated March 15, 2022, set aside the order of the Single Judge to the extent it allowed payment at reduced tariff and the directions to approach the regulatory commission. The Division Bench further directed payments to be made at the PPA tariff within six weeks of date of the Division Bench’s judgment. As Discom failed to make the payments under the PPA, a contempt petition was filed by us. Although Discom has cleared the outstanding principal amount with some deficit, we are contesting the shortfall payment and non-payment of late payment surcharge in the contempt petition. The next date of hearing will be intimated in due course. The Discom had filed a special leave petition (“SLP”) before the Supreme Court challenging the judgment dated March 15, 2022, passed by the Division Bench of the High court of Andhra Pradesh. The SLP was dismissed by the Supreme Court by way of order dated January 2, 2023.The Discom has filed another SLP before the Supreme Court whereby they have challenged the Division Bench’s decision to dismiss the petition pending before the regulatory commission on reduction of tariff in case of a competitively bid project under Section 63 of the Electricity Act. If the Supreme Court allows this SLP it will have an adverse impact on us. The SLP is presently pending and the next date of hearing shall be intimated in due course. Further, other states might also violate binding contractual PPA tariffs following the unfavorable outcome.
A PIL had been initiated by certain individuals and organization claiming to be wildlife experts/interested in conservation of wildlife, before the Supreme Court of India against various state governments such as Rajasthan, Gujarat, and MNRE, MoP among others, seeking protection of the two endangered bird species, namely the GIB and the Lesser Florican found in the states of Rajasthan and Gujarat. The Supreme Court by way of order dated April 19, 2021 issued directions to: (i) underground all low voltage transmission lines, existing and future lines falling in potential and priority habitats of GIB subject to feasibility test, (ii) to convert all existing high voltage lines in priority and potential areas of GIB where found feasible within a period of one year, if not found feasible, the matter to be referred to the committee formed by the Supreme Court which will take a decision on feasibility, and (iii) to install bird diverters on all existing overhead lines in the interim. However, vide its Order dated March 21, 2024, the Supreme Court has modified its earlier Order dated 19.04.2021, the Supreme Court while recognizing the need for balancing the interest of the Great Indian Bustard as well as the interest of renewable sector and India’s commitments to reduce emissions, it has inter alia (i) Restricted the injunction of undergrounding vide order dated April 19, 2021, only to the Priority Area (i.e. 13,163 sq. kms), subject to feasibility; (ii) Eased the restrictions in the Potential Area; and (iii) constituted an expert committee ‘inter alia’ including representatives of the power sector to ascertain the technical feasibility of undergrounding of High Voltage as well Low Voltage transmission lines in the Priority Area and to lay down suitable directives for laying of transmission lines in the Potential Area. The said newly constituted is to complete its task and submit a report to Supreme Court through the Union Government of India on or before July 31, 2024. The next date in the matter has not been intimated.
We and many other developers have projects in the potential area as determined by the court, hence aggrieved by the order, the Solar Power Developers Association (“SPDA”) and Union of India have filed an application before the Supreme Court seeking among others, exemption from undergrounding of transmission lines in potential areas. The matter was last listed on March 22, 2024.The PIL is presently pending and the next date of hearing shall be intimated in due course. The SPDA has filed an application seeking modification of Supreme Court’s order dated April 19, 2021. If the modification application is dismissed, we might entail significant costs and delays. Based on evaluation of management the capital outflow for acquisition and installation of bird divertors are not material. The Company has filed petitions before CERC and MERC seeking relief for change in law. Final arguments in the Petitions before CERC have been concluded and the orders have been reserved. The Petition before MERC is pending and next date of hearing shall be shared in due course.
With regard to our Rajasthan 100 MW Projects, we received a demand seeking payment of land tax as per local law prevailing in the State of Rajasthan. While availing the benefits of amnesty scheme issued by Government of Rajasthan we have paid the demand raised qua land tax. However, we have filed change in law petitions before CERC claiming the amount so paid by us from SECI. The CERC has reserved orders in these petitions.
In relation to the RfS dated 25.05.2021 for setting up of 1200 MW ISTS connected Wind power projects (“RfS”) wherein we have been awarded capacity of 120 MW, SECI has file a Tariff Adoption Petition, before CERC. Inter alia, on account of delay in adoption of tariff, we filed objections against the said adoption of tariff. The petition has been disposed of vide order dated March 9, 2024, whereby CERC has adopted the tariff. Currently we are reviewing the order and exploring the options to file an appeal against the said order passed by CERC.
The Company had filed a petition before Andhra Pradesh Electricity Regulatory Commission (“APERC”) challenging deductions made by off taker from the Company’s monthly invoices on the alleged ground of excess installation with respect to the Company’s 50 MW project in Andhra Pradesh. APERC disallowed the relief sought by the Company. The Company has challenged the aforesaid order before the higher forum and has received a stay of the APERC order. The said appeal before higher forum has been disposed of vide order dated February 5, 2024, holding that in case any coercive action is taken against us by AP Discom, the interim relief given in favour of Azure shall continue to remain in force, for a period of four weeks thereafter, to enable us also to seek interim relief from APERC.
In relation to our 30 MW project in the state of Chhattisgarh, the Revenue Department, Government of Chhattisgarh has issued demand notices under the Madhya Pradesh Electricity Duty Act, 1949 stating that we are liable to pay any cash dividendselectricity duty on our equity sharesthe electricity generated and supplied to the Chhattisgarh Discom. We have filed a petition before the High Court of Chhattisgarh challenging these demand notices. In the event the petition is not allowed we may have to pay the amount as per the demand raised and become liable to pay electricity duty on each unit of electricity generated and supplied. The petition will be listed in due course.
We have received demand notices by Tax Authorities in the foreseeable future. We currently intendstate of Andhra Pradesh under the Andhra Pradesh Tax on Entry of Goods Act, 2001. This demand has been challenged by us by way of writ petitions before the High Court of Andhra Pradesh. In the event the petitions are not allowed we may have to retainsubmit the demand tax amount. The petitions are presently pending and the next date of the hearing will be intimated in due course.
Commissioning of our available fundsthree projects in the state of Rajasthan (Rajasthan 6, Rajasthan 8 and any future earningsRajasthan 9) was delayed due to operatereasons beyond our control for which we were granted extension and expand our business.
B. Significant Changes
Except as disclosed elsewhere in this annual report,accordingly the scheduled commercial operation date (“SCOD”) was revised. In furtherance of grant of extension, we havehad filed a petition before the CERC for declaration that we are not experienced any significant changes sinceliable to pay transmission charges for the period of mismatch between the date of long-term access (“LTA”) operationalization and the annual financial statement includedrevised SCOD of the projects and to pass directions for alignment of the LTA start date with revised SCODs of the projects and to not take any coercive actions in this annual report.
ITEM 9. THE OFFER AND LISTING
A. Offerthe interim. However, CERC decided the petition against us. We have filed an appeal challenging the order. The appeal is presently pending and Listing Detailsthe next date of hearing will be intimated in due course. In the event the appeal is disallowed, we may have to pay the transmission charges from the date of LTA operationalization.
In relation to our 130 MW project located in Rajasthan and supplying electricity to Maharashtra Discom a petition seeking change in law relief for increase in the effective tax rates under the GST laws from 5% to 8.9% (on gross consideration) on the Composite EPC Contracts with effect from January 1, 2019, it has been decided by the Maharashtra Electricity Regulatory Commission (“MERC”) in our favor whereby most of our claimed amount has been allowed. Though, MSEDCL has filed an appeal before the Supreme Court challenging such allowance of our claim, MSEDCL and the Company have entered into a supplementary power purchase agreement whereby MSEDCL has agreed to release the payments in terms of directions passed by MERC subject to the rights available to it under law. In another petition on the same matter, pertaining to our 100 MWs project in Karnataka has been decided in our favor by the Karnataka Electricity Regulatory Commission vide order dated March 07, 2023.
We have filed petitions before the CERC in relation to Rajasthan 6, Rajasthan 8 and Rajasthan 9 projects and before the Assam Electricity Regulatory Commission for Assam 1 project seeking reimbursement of the additional expenses incurred due to increase in the GST rate from 5% to 12% effective from October 1, 2021 on supply of Solar Power Generator. The following table sets forth,petition filed before Assam Electricity Regulatory Commission was decided the petition by way of order dated January 27, 2023, whereby they have directed the parties to reconcile the claim amounts. The petitions before the CERC have been disposed off vide order dated December 21, 2023. We are in process of submitting documents for reconciliation of the claim amount on account of increase in GST rate from 5% to 12% effective from October 1, 2021 on supply of Solar Power Generator. We have also filed Appeals against the said order passed by CERC to the extent of Annuity rate and rate of carrying cost as allowed by CERC, the Appeal will be listed in due course.
We have filed two petitions before the CERC in relation to Rajasthan 8 and Rajasthan 9 projects seeking reimbursement of increase in the rate of basic customs duty from 5% to 20% on the solar inverters being imported into India from February 2, 2021. These petitions have been decided vide order dated January 24, 2024 where CERC inter alia held that said change in basic custom duty is a change in law event and we are entitled for the periods indicated sincecompensation on account of said change in law event.
We had filed two petitions before the CERC in relation to Rajasthan 8 and Rajasthan 9 projects seeking reimbursement of imposed safeguard duty on import of Solar Cells whether or not assembled in modules or panels. The petitions have been decided in the Company’s favor by way of order dated January 20, 2023. However, one off taker for the Rajasthan 8 project has filed an appeal before APTEL which is presently pending. However, no adverse order has been passed.
In connection with an extension of the date of commissioning of a 40 MWs project in Karnataka of one of our equity shares began tradingsubsidiaries, the Karnataka Electricity Regulatory Commission (“KERC”) withdrew the extension granted by the distribution licensee on account of delay due to force majeure and reasons not attributable to us and directed it to enforce a reduced tariff and recover liquidated damages due to delay based on “actual commercial operation date”. Such directions of KERC were challenged in an appeal before the Appellate Tribunal for Electricity (“APTEL”). The appeal was decided in our favor whereby APTEL stated that we were entitled to payment at PPA Tariff. A subsequent appeal against the order dated August 12, 2021 has been filed by the distribution licensee before the Supreme Court and is presently pending. Similarly, we had a favorable order dated February 28, 2020 from APTEL in relation to another 50 MW project in Karnataka wherein it was held that the Company was entitled to full PPA tariff as against the reduced tariff which was being claimed as payable by the off taker. Since the off taker failed to comply with APTEL’s judgment, we filed an execution petition which is currently pending before APTEL. During the pendency of the execution petition, the parties are attempting to amicably settle the matter. The matter is listed for hearing on May 13, 2024.
We had filed a similar petition before KERC, whereby the off taker has reduced our tariff on grounds of delay in commissioning. The petition was decided in the Company’s favor by way of order dated January 4, 2023 whereby KERC has held that the Company is entitled to tariff as stipulated in the Power Purchase Agreement and has directed the off taker to pay the differential outstanding amount, being the difference between contracted tariff and the reduced tariff.
A class action lawsuit that was filed in the U.S. District Court for the Southern District of New York, Stock Exchangecase number 1:22-cv-07432, against our Company and certain of its former directors and officers alleging violations of U.S. securities laws. The lead plaintiff has filed a First Amended Complaint, and the court set a deadline for the lead plaintiff to file a Second Amended Complaint of 28 days after the date of filing the Fiscal 2022 Form 20-F. The lead plaintiff filed a Second Amended Complaint on October 12, 2016 through June 14, 2017,November 9, 2023. The Company is vigorously defending against the high and low sale prices for our equity shares, as reportedclaims asserted in the lawsuit. Accordingly, we filed a motion to dismiss the lawsuit on the New York Stock Exchange under the symbol “AZRE.”March 22, 2024.
| | | | | | | | |
| | | Price per equity share | |
| | | High | | | Low | |
| | | (US$) | |
Annual (fiscal years ended March 31) | | | | | | | | |
2017 (from October 12, 2016) | | | 19.99 | | | | 12.73 | |
2018 (through June 14, 2017) | | | 22.00 | | | | 15.01 | |
Calendar Quarters | | | | | | | | |
Third Quarter 2016 (from October 12, 2016) | | | 18.72 | | | | 12.73 | |
Fourth Quarter 2016 | | | 19.99 | | | | 14.29 | |
First Quarter 2017 | | | 22.00 | | | | 18.59 | |
Second Quarter 2017 (through June 14, 2017) | | | 22.00 | | | | 15.01 | |
Monthly | | | | | | | | |
November 2016 | | | 18.55 | | | | 15.44 | |
December 2016 | | | 18.72 | | | | 15.50 | |
January 2017 | | | 17.71 | | | | 16.10 | |
February 2017 | | | 19.99 | | | | 14.29 | |
March 2017 | | | 18.69 | | | | 16.20 | |
April 2017 | | | 22.00 | | | | 16.10 | |
May 2017 | | | 17.58 | | | | 15.14 | |
June 2017 (through June 14, 2017) | | | 16.69 | | | | 15.01 | |
B. Plan of DistributionBylaws
Not Applicable
C. Markets
Our equity shares are listed on the New York Stock Exchange Market under the symbol “AZRE”.
D. Selling Shareholders
Not applicable
E. Dilution
Not applicable
F. Expenses of the Issue
Not applicable
ITEM 10. ADDITIONAL INFORMATION
A. Share Capital
Not applicable
B. Memorandum and Articles of Association
We incorporate by reference into this annual report on Form 20-F the description of our Amended and Restated Constitution contained in our Form F-1 registration statement on Form F-1 (Registration(File No. 333-208584), as amended from time to time, initially filed with the SEC on December 16, 2015.
C. Material Contracts
We have not entered into any material contracts other than those in the ordinary course of business and other than those described in “Item 4. Information on the Company”“Business Overview” or elsewhere in this annual report.
In Fiscal 2023, we have entered into an agreement to invest INR 1,000 million (US$12.2 million) in Premier Energies Group (“Premier Group”), one of India’s leading manufacturers of solar PV cells and modules, of which an investment of INR 455 million (~US$ 5.5 million) has been made for the subscription of equity shares & compulsorily convertible debentures issued by Premier Energies Investment Private Limited (“PEIPL”), towards subscription of 26% shareholding in PEIPL. Further we have also signed a MSA with Premier Group for the off take of 600 MW capacity per annum manufactured for four years by Premier Group and other operational solar PV cell and modules capacities of Premier. Under the MSA, we have a right to procure modules of up to 600 MW per annum, with a minimum commitment given to off take 300 MW per annum, subject to agreed exemptions.
In Fiscal 2023, we have entered into an agreement for 600 MW DC of high-performance, advanced thin film PV solar modules from First Solar, Inc. The agreement is the first for production from First Solar’s new manufacturing facility in Tamil Nadu, India, which was expected to be commissioned in the second half of 2023. Under the agreement, Azure Power was expected to take delivery of First Solar’s Series 7 photovoltaic PV solar modules from the fourth quarter of 2023 to 2025. However, the same is now likely to start from third quarter of 2024 due to changes in project scheduling. On February 13, 2024, FS India Solar Ventures Private Limited (“First Solar”) sent us a notice that First Solar was terminating the Master Supply Agreement, dated August 22, 2022 (“First Solar MSA”), between First Solar and APIPL. The notice claims that a termination payment of US$29.242 million is due to be paid by APIPL to First Solar under the First Solar MSA. APIPL disputes that such a termination payment is due and intends to engage in commercial discussions with First Solar to resolve the matter.
In Fiscal 2023, we signed a Master Supply Agreement (“MSA”) with Siemens Gamesa Renewable Power Private Limited (“Siemens Gamesa”), a global leader in wind technology. Siemens Gamesa will supply 96 units of SG 3.6-145 onshore wind turbines which will cater to an overall capacity of approximately 346 MW wind projects. On March 05, 2024, Siemens Gamesa sent us a notice which claims a default and damages of INR 1,934 million (US$23.5 million) with respect to charges in relation to rental, storage, logistics cost, commercial impact, WC interest costs, BG charges and overheads. APIPL disputes such claim of default and damages and intends to engage in mutual discussions with Simens Gamesa to resolve the matter amicably.
On May 27, 2023, Radiance have sent us a notice to terminate the Master Share Purchase Agreement in relation to 86.5 MW Rooftop portfolio in relation to Azure Power Rooftop (Genco) Private Limited and related group SPVs. The Company and Radiance have mutually agreed to terminate the transfer in shareholding of the un-transferred 86.5 MW portfolio to Radiance and accordingly, the Purchaser will not purchase from the Sellers and the Sellers will not sell to the Purchaser the AZR Sale Shares (including any Seller Group Loans) as was agreed in the Previous MSPA and further amended under the Amended MSPA.
D. Exchange Controls and Other Limitations Affecting Security Holders
Foreign Direct Investment
Foreign investments in Indian companies are primarily governed by the Foreign Exchange Management Act, 1999, as amended, (“FEMA”),and the rules, regulations and notifications madeissued thereunder, including the Foreign Exchange Management (Transfer or issue of security by a person resident outside India) Regulations, 2000,(Non-debt Instruments) Rules, 2019, as amended (the “NDI Rules”), , and the consolidated foreign direct investment policy (effective as of June 7, 2016)Consolidated Foreign Direct Investment Policy, 2020 dated October 15, 2020 (the ““Consolidated FDI Policy”Policy”) issued by the Department for Promotion of Industrial PolicyIndustry and Promotion,Internal Trade, Ministry of Commerce and Industry, Government of India.GoI (“DPIIT”) read with the press notes issued by the DPIIT to amend the FDI Policy (collectively, the “FDI Regulations”).
Pursuant to the FDI Policy,Regulations, investments can be made by non-residentspersons resident outside India in Indian companies either under the automatic route (those which do not require approval of the GoI or the Reserve Bank of India) or the government route, depending on the sector, amount of investment and up to the extent of the percentage of the total capital of the Indian company specified in the Consolidated FDI Policy. The Consolidated FDI Policy currently allows 100% foreign direct investment in Indian companies engaged in the solar power sector.sector under the automatic route. The FDI PolicyRegulations also prescribesprescribe certain pricing and reporting requirements in respect of issue and transferissuance of sharesequity securities of an Indian company to a non-resident or transfer of such securities between a person resident in India and vice-versa and regulatesa non-resident. The FDI Regulations also regulate downstream investments i.e., indirect investment by a non-resident in an Indian companiescompany through another Indian company that areis not owned or controlled by Indianpersons resident persons. The Government of India amended the method of calculating foreign investment in an Indian company pursuant to Press Note No. 2 (2009 Series) dated February 13, 2009 and Press Note No. 4 (2009 Series) dated February 25, 2009.India.
A person residing outside India (other than a citizen of Pakistan or Bangladesh) or any entity incorporatedresident outside India (other than an entity incorporatedof a country, which shares its land borders with India or the beneficial owner (direct or indirect) of an investment into India, who is situated in, Pakistan or Bangladeshis a citizen of country which shares its land border with India) and an erstwhile Overseas Corporate Body as(as defined in FEMA)the FDI Regulations) has general permission to purchase shares, compulsorily convertible debentures or preference shares of an Indian company, subject to certain terms and conditions.
Currently, subject to certain exceptions, FDI and investmentinvestments by Non-Resident Indians or NRIs (as such term is(“NRIs”, as defined in FEMA)the FDI Regulations), in Indian companies do not require the prior approval of the FIPBGoI or the RBI. The Government of India has indicated that in all cases where FDI is allowed on an automatic basis without FIPB approval, the RBI would continue to be the primary agency for the purposes of monitoring and regulating foreign investment.
Exchange Rates
The consolidated financial statements and other financial data included in this annual report of Azure Power Global Limited are presented in Indian rupees. Azure Power Global Limited’s functional currency is the U.S. dollar and reporting currency is the Indian rupee. Further, AZI’s functional currency is Indian rupees. The functional currencies of AZI’s subsidiaries are their respective local country currencies. The translation from the applicable foreign currencies of AZI’s subsidiaries into Indian rupees is performed for balance sheet accounts using the exchange rate in effect as of the balance sheet date except for shareholders’ equity, preferred shares and certain debt, which are translated at the historical rates in effect at the dates of the underlying transactions. Revenue, expense and cash flow items are translated using average exchange rates for the respective period.
U.S. dollar balances have been translated from Indian rupee amounts solely for the convenience of the readers. The following table sets forth, for each of the periods indicated, the low, average, high and period-end noon buying rates in The City of New York for cable transfers, in Indian rupees per U.S. dollar, as certified for customs purposes by the Federal Reserve Bank of New York. These rates are provided solely for your convenience and are not necessarily the exchange rates that we used in preparation of our consolidated financial statements or elsewhere in this annual report or will use in the preparation of our periodic reports or any other information to be provided to you. We make no representation that any Indian rupee or U.S. dollar amounts referred to in this annual report could have been or could be converted into U.S. dollars or Indian rupees, as the case may be, at any particular rate or at all.
| | | | | | | | | | | | | | | | |
| | | | | | Indian Rupees per U.S.
Dollar Noon Buying Rate | |
Period | | Period End | | | Average(1) | | | Low | | | High | |
2011 | | | 53.01 | | | | 46.86 | | | | 44.00 | | | | 53.71 | |
2012 | | | 54.86 | | | | 53.41 | | | | 48.65 | | | | 57.13 | |
2013 | | | 61.92 | | | | 58.91 | | | | 52.99 | | | | 68.80 | |
2014 | | | 63.04 | | | | 61.21 | | | | 58.30 | | | | 63.67 | |
2015 | | | 66.15 | | | | 64.15 | | | | 61.41 | | | | 67.10 | |
2016 | | | 67.92 | | | | 67.16 | | | | 66.05 | | | | 68.86 | |
December | | | 67.92 | | | | 67.81 | | | | 67.38 | | | | 68.29 | |
2017: | | | | | | | | | | | | | | | | |
January | | | 67.48 | | | | 68.05 | | | | 67.48 | | | | 68.39 | |
February | | | 66.67 | | | | 66.97 | | | | 66.67 | | | | 67.40 | |
March | | | 64.85 | | | | 65.80 | | | | 64.85 | | | | 66.83 | |
April | | | 64.27 | | | | 64.54 | | | | 64.08 | | | | 65.10 | |
May | | | 64.50 | | | | 64.42 | | | | 64.03 | | | | 64.87 | |
June (Through June 9, 2017) | | | 64.24 | | | | 64.35 | | | | 64.24 | | | | 64.42 | |
(1) | Averages for a period other than one month are calculated by using the average of the noon buying rate at the end of each month during the period. Monthly averages are calculated by using the average of the daily noon buying rates during the relevant month. |
Source: Federal Reserve Statistical Release.
E. Taxation
Mauritius Taxation
We are
Our Company is a company holding a Mauritius Category 1 Global Business Company, or GBC1,GBC License issued by the Financial Services Commission and is a tax resident in Mauritius. The Income Tax Act 1995 of Mauritius imposes a tax in Mauritius on our chargeable income at the rate of 15%. However, under the Income Tax (Foreign Tax Credit) Regulations 1996 of Mauritius, subject
Pursuant to the Income Tax Act 1995 and the regulations under the Income Tax (Foreign Tax Credit) Regulations 1996, credit is allowed for foreign tax on the foreign source income of a resident of Mauritius against Mauritius tax computed by reference to the same income, and where credit is allowed against Mauritius tax chargeable in respect of any income, the amount of Mauritius tax so chargeable shall be reduced by the amount of the credit.
Under the Income Tax (Foreign Tax Credit) Regulations 1996, “foreign source income” means income which is not derived from Mauritius and includes in the case of a corporation holding a GBC1 under the Financial Services Act 2007 of Mauritius, income derived in the course of a global business. Subject to the provisions of the Income Tax (Foreign Tax Credit) Regulations 1996, no credit is allowed in respect of foreign tax unless written evidence is presented to the Mauritius Revenue Authority showing the amount of foreign tax which has been charged and for this purpose, “written evidence” includes a receipt of the relevant authorities of the foreign country for the foreign tax or any other evidence that the foreign tax has been deducted or paid to the relevant authorities of that country. However, pursuant to Regulation 8 of the Income Tax (Foreign Tax Credit) Regulations 1996, if written evidence is not presented to the Mauritius Revenue Authority showing the amount of foreign tax charged on our company’s foreign source income, the amount of foreign tax shall nevertheless be conclusively presumed to be equal to 80% of the Mauritius tax chargeable with respect to that income and in such circumstance, the effective tax rate in Mauritius on our chargeable income would be 3%.
Following amendments to the Financial Services Act 2007 of Mauritius pursuant tounder the Finance (Miscellaneous Provisions) Act 2010 in December 2010, Mauritius companies holding a GBC1 issued2018, the Company is as from July 1, 2021 governed by the Financial Services Commissionnew regulatory regime applicable to Global Business Companies. Generally, income tax rate for GBCs is at 15%, but subject to meeting certain prescribed conditions, a partial exemption of 80% may be allowed against certain types of income such as foreign source dividend and interest. Where the GBC derives income, which is subject to foreign tax, and where the said partial exemption has not been applied, the amount of foreign tax paid may be allowed as a credit against income tax payable in Mauritius are permitted to conduct business both in and outside Mauritius (insteadrespect of outside Mauritius only). The operations ofthat income.
As a GBC1 company in Mauritius will beGBC, subject to tax on chargeable income at the rate of 15% in Mauritius.
We hold tax residence certificatesmeeting conditions, our Company may apply for Tax Residence Certificates issued by the Mauritius Revenue Authority. These certificates are required forto benefit from the avoidance of double taxation under the Agreements for the Avoidanceextensive network of Double Taxation Avoidance Agreements signed between Mauritius and other jurisdictions, including India.
Mauritius hasimposes no capital gains tax and has no withholding tax on the payment of dividends.
Investors
Prospective investors are urged to consult their own tax advisers in order to fully understand the tax consequences of an investment in the equity shares.
US
U.S. Federal Income Taxation
The following discussion is a summary of certain U.S. federal income tax considerations generally applicablethat may be relevant to U.S. Holders (as defined below) of the purchase, ownership and disposition of our equity shares. shares by a U.S. Holder (as defined below).
This summary appliesis based on provisions of the Internal Revenue Code of 1986, as amended (the “Code”), and published regulations, rulings and judicial interpretations thereof, in force as of the date hereof. Those authorities may be changed at any time, perhaps retroactively, so as to result in U.S. federal income tax consequences different from those summarized below.
This summary is not a comprehensive discussion of all of the tax considerations that may be relevant to a particular investor’s decision to purchase, hold, or dispose of equity shares. In particular, this summary is directed only to U.S. Holders that hold the equity shareshares as capital assets (generally, property held for investment) and that have the U.S. dollar as their functional currency.. This summary is based on U.S. tax laws in effect as of the date of this annual report, on U.S. Treasury regulations in effect or, in some cases, proposed as of the date of this annual report, and judicial and administrative interpretations thereof available on or before such date. All of the foregoing authorities are subject to change, which could apply retroactively and could affect the tax consequences described below. Moreover, this summary does not address thetax consequences to U.S. federal estate, gift, Medicare, and alternative minimum tax considerations, or any state, local, and non-U.S. tax considerations, relating to the ownership and disposition of our equity shares. The following summary does not address all aspects of U.S.
federal income taxation thatHolders who may be importantsubject to particular investors in light of their individual circumstances or to persons in special tax situationsrules, such as:
Banks and otheras banks, brokers or dealers in securities or currencies, traders in securities electing to mark to market, financial institutions;
Insurance companies;
Pension plans;
Cooperatives;
Regulatedinstitutions, life insurance companies, regulated investment companies;
Realcompanies, real estate investment trusts;
Broker-dealers;
Traderstrusts, tax exempt entities, qualified retirement plans, individual retirement accounts or other tax-deferred accounts, entities that elect to use a mark-to-market method of accounting;
Certain former U.S. citizens or long term residents;
Tax-exempt entities (including private foundations);
Persons liable for alternative minimum tax;
Persons holding equity share as part of a straddle, hedging, conversion or integrated transaction;
Persons that actually or constructively own 10% or more of the total combined voting power of all classes of our voting stock;
Persons who acquired equity share pursuant to the exercise of any employee share option or otherwise as compensation; or
Entities taxableare treated as partnerships for U.S. federal income tax purposes (or partners therein), U.S. Holders that acquired equity shares through the exercise of employee stock options or personsotherwise as compensation for services, U.S. Holders that own or are treated as owning 10% or more of our equity shares by vote or value, U.S. Holders holding equity share through such entities.
INVESTORS ARE URGED TO CONSULT THEIR OWN TAX ADVISORS REGARDING THE APPLICATION OF THEshares as part of a hedging or conversion transaction or a straddle, or U.S. FEDERAL TAX RULES TO THEIR PARTICULAR CIRCUMSTANCES AS WELL AS THE STATE, LOCAL, NON-U.S. AND OTHER TAX CONSEQUENCES TO THEM OF THE OWNERSHIP AND DISPOSITION OF OUR EQUITY SHARES.
Holders whose functional currency is not the U.S. dollar. Moreover, this summary does not address state, local or non-U.S. taxes, the U.S. federal estate and gift taxes, or the net investment income tax applicable to certain non-corporate U.S. Holders, or any individual or corporate alternative minimum tax consequences of acquiring, holding or disposing of equity shares. For purposes of this summary, a “U.S. Holder” is a beneficial owner of our equity shares that, is, for U.S. federal income tax purposes:
An individual whopurposes, is a citizen or resident of the United States;
AStates, a U.S. domestic corporation, (or other entity taxablea trust if a U.S. court is able to exercise primary supervision over its administration and one or more U.S. persons have the authority to control all of its substantial decisions, a trust that has a valid election is in effect to be treated as a corporation for U.S. federal income tax purposes) createdperson, or organized in the United States or under the laws of the United States, any state thereof or the District of Columbia;
Anan estate the income of which is subject to U.S. federal income taxation regardless of its
source; orsources.
A trust that (1) is subject to the primary supervision of a court within the
U.S. and the control of one or more United States persons for all substantial decisions or (2) has a valid election in effect under applicable U.S. Treasury regulations to be treated as a U.S. person.
The tax treatment of a partner in any entity taxable as a partnership for U.S. federal income tax purposes that holds our equity share will depend on the status of such partner and the activities of such partnership. If you are a partner in such partnership, youHolders should consult yourtheir own tax advisors.
Dividendsadvisors about the consequences of the acquisition, ownership, and Other Distributionsdisposition of the equity shares, including the relevance to their particular situation of the considerations discussed below and any consequences arising under foreign, state, local or other tax laws.
Taxation of Dividends
Subject to the passive foreign investment company, or PFIC, rules discusseddiscussion below under “Passive Foreign Investment Company Status,” the gross amount (in U.S. dollars) of any distribution we makeof cash or property with respect to you on our equity shares (including the amount of any taxes
withheld therefrom) will generally be includible in your gross income as dividend income on the date of receipt, but only to the extent that such distribution is paid out of our current or accumulated earnings and profits (as determined under U.S. federal income tax principles). Amounts not treated as dividend income for U.S. federal income tax purposespurposes) will constitutegenerally be includible in a return of capital and will first be applied against and reduce your tax basis in your equity share, but not below zero. Distributions in excess of our current and accumulated earnings and profits and your tax basis in your equity share will be treatedU.S. Holder’s taxable income as capital gain realizedordinary dividend income on the sale or other disposition ofday on which the equity share. However, we do not intend to calculate our earningsdividend is received and profits under U.S. federal income tax principles. Therefore, you should expect that any distribution we make to you will be reported as a dividend even if such distribution would otherwise be treated as a non-taxable return of capital or as capital gain under the rules described above. Any dividends we pay will not be eligible for the dividends-received deduction allowed to corporations under section 243 of the Code.
The Company does not expect to maintain calculations of its earnings and profits in accordance with U.S. federal income tax principles. U.S. Holders therefore should expect that distributions generally will be treated as dividends for U.S. federal income tax purposes.
Subject to certain exceptions, the U.S. dollar amount of dividends received from other U.S. corporations.
Under current law, certainby non-corporate U.S. Holders including individual U.S. Holders, dividendswith respect to the equity shares will be taxedsubject to taxation at a preferential rate if the lower capital gains rate applicable todividends are “qualified dividend income,income.” provided that (1)Because our shares are no longer listed on the NYSE, we do not expect our dividends to meet the requirements of “qualified dividend income.”
Dividend distributions with respect to the Company’s equity shares are readily tradable on an established securities market ingenerally will be treated as “passive category” income from sources outside the United States includingfor purposes of determining a U.S. Holder’s U.S. foreign tax credit limitation.
Dividends paid in a currency other than U.S. dollars will be includable in income in a U.S. dollar amount based on the NYSE, (2) we are neither a PFIC nor treated as such with respect to you for the taxable yearexchange rate in which the dividend is paid and the preceding taxable year and (3) certain holding period requirements are met. You should consult your tax advisors regarding the availability of the lower tax rate applicable to qualified dividend income for any dividends we payeffect on our equity shares, as well as the effect of any change in applicable law after the date of this annual report.
Dividends will generally be treated as income from foreign sources for United States foreign tax credit purposes.receipt whether or not the payment is converted into U.S. dollars at that time. A U.S. Holder may be eligible, subject to complex limitations, to claimHolder’s tax basis in the non-U.S. currency will equal the U.S. dollar amount included in income. Any gain or loss on a foreign tax credit with respect to any foreign withholding taxes imposed on dividends received on our equity share. The rules relating to the determinationsubsequent conversion of the foreign tax credit are complex, and you should consult your tax advisors regarding the availabilitynon-U.S. currency into U.S. dollars for a different amount generally will be U.S. source ordinary income or loss.
Taxation of a foreign tax credit in your particular circumstances.Dispositions of Equity Shares
Dispositions
Subject to the PFIC rules discusseddiscussion below youunder “Passive Foreign Investment Company Status,” if a U.S. Holder realizes gain or loss on the sale, exchange or other disposition of equity shares, that gain or loss will generally recognize taxablebe capital gain or loss on any sale, exchangeand generally will be long-term capital gain or other taxable disposition of an equity share equal to the difference between the amount realized (in U.S. dollars) forloss if the equity share and your adjusted tax basis (in U.S. dollars) in the equity share. If you areshares have been held for more than one year. Long-term capital gain realized by a non-corporate U.S. Holder including an individual U.S. Holder, that has held the equity share for more than one year, you may be eligible for reduced tax rates.generally is subject to taxation at a preferential rate. The deductibility of capital losses is subject to limitations. Any capitalThe amount of gain or loss will be equal to the difference, if any, between the amount realized and the U.S. Holder’s adjusted tax basis in equity shares. A U.S. Holder’s initial tax basis in shares generally be treated as U.S.-source gain or loss for U.S. foreign tax credit purposes. U.S. Holders are urged to consult their tax advisors regardingwill equal the tax consequences if a foreign tax is imposed on a dispositioncost of our equity shares, including the availability of the foreign tax credit under their particular circumstances.
Passive Foreign Investment Company
A non-U.S. corporation will be classified as a PFIC for U.S. federal income tax purposes for any taxable year if either:
such shares.
At least 75% of its gross income for such year is passive income; or
At least 50% of the value of its assets (based on an average of the quarterly values of the assets) during such year produce passive income or are held for the production of passive income.
For this purpose, we will be treated as owning our proportionate share of the assets and earning our proportionate share of the income of any other corporation in which we own, directly or indirectly, at least 25% (by value) of the stock.
Although we are engaged in an active business and we do not generate substantial passive income relative to the revenue from our active business, the PFIC rules are complex. The determination of whether we will be or
become a PFIC will depend, in part, on the composition of our income and assets. Fluctuations in the market price of our equity shares may cause us to become a PFIC for the current or subsequent taxable years because the value of assets for the purpose of the asset test may be determined by reference to the market price of our equity shares. The composition of our income and assets may also be affected by how, and how quickly, we use our liquid assets and the cash raised during our initial public offering. Although, based on our current income and assets, we presently do not expect to be classified as a PFIC for the current taxable year and do not anticipate becoming a PFIC in future taxable years, there can be no assurance in this regard.
If we are determined to be a PFIC for any taxable year (or portion thereof) that is included in the holding period of a U.S. Holder of our equity shares and such U.S. Holder did not make a mark-to-market election as described below, such holder generally will be subject to special rules with respect to:
Any gain recognized
Gain, if any, realized by thea U.S. Holder on the sale or other disposition of our equity shares; and
Any “excess distribution” made to the U.S. Holder (generally, any distributions to such U.S. Holder during a taxable year of the U.S. Holder that are greater than 125% of the average annual distributions received by such U.S. Holder in respect of our equity shares during the three preceding taxable years of such U.S. Holder or, if shorter, such U.S. Holder’s holding period for the equity shares).
Under these rules,
The U.S. Holder’s gain or excess distribution will be allocated ratably over the U.S. Holder’s holding period for the equity share;
The amount allocated to the U.S. Holder’s taxable year in which the U.S. Holder recognized the gain or received the excess distribution, or to the period in the U.S. Holder’s holding period before the first day of our first taxable year in which we qualified as a PFIC, will be taxed as ordinary income;
The amount allocated to other taxable years (or portions thereof) of the U.S. Holder and included in its holding period will be taxed at the highest tax rate in effect for that year and applicable to the U.S. Holder; and
Additional tax equal to the interest charge generally applicable to underpayments of tax will be imposed in respect of the tax attributable to each such other taxable year of the U.S. Holder.
If we are treated as a PFIC with respect to you for any taxable year, if any of our subsidiaries are also PFICs or if we make direct or indirect equity investments in other entities that are PFICs, you will be deemed to own shares in such lower-tier PFICs that are directly or indirectly owned by us in that proportion that the value of the equity share you own bears to the value of all of our equity shares, and you may be subject to the rules described in the preceding two paragraphs for the shares of such lower-tier PFICs that you would be deemed to own. You should consult your tax advisors regarding how the PFIC rules apply to any of our subsidiaries or direct or indirect equity investments.
If a U.S. Holder, at the close of its taxable year, owns stock in a PFIC that are treated as “marketable stock” for United States federal income tax purposes, the U.S. Holder may make a mark-to-market election with respect to such stock for such taxable year. If the U.S. Holder makes a valid mark-to-market election for the first taxable year of the U.S. Holder in which the U.S. Holder holds (or is deemed to hold) our equity shares and for which we are determined to be a PFIC, such holder generally will not be subject to the PFIC rules described above with respect to its equity shares. Instead, in general, the U.S. Holder will include as ordinary income each year the excess, if any, of the fair market value of its equity shares at the end of its taxable year over the adjusted tax basis in its equity shares. The U.S. Holder also will be allowed to take an ordinary loss in respect of the excess, if any, of the adjusted tax basis of its equity shares over the fair market value of its equity shares at the end of its taxable year (but only to the extent of the net amount of previously included income as a result of the mark-to-market election). The U.S. Holder’s adjusted tax basis in its equity shares will be adjusted to reflect any such income or loss amounts, and any further gain recognized on a sale or other taxable disposition of the equity shares will be treated as ordinary income.
The mark-to-market election is available onlyU.S. source income for stocks that are regularly traded on a national securities exchange that is registered with the SEC, including the NYSE, or on aU.S. foreign exchange or market that the Internal Revenue Service determines has rules sufficient to ensure that the market price represents a legitimate and sound fair market value. Although our equity shares are listed on the NYSE, we cannot guarantee that they will continue to be listed and traded on the NYSE. In addition, the mark-to-market election may not be available with respect to any lower-tier PFICs unless shares of such lower-tier PFICs are themselves “marketable stock.”tax credit purposes. U.S. Holders should consult their own tax advisors regarding the availabilityapplication of the foreign tax credit rules to their investment in, and disposition of, the equity shares.
Passive Foreign Investment Company Status
Special U.S. tax consequencesrules apply to companies that are considered to be a PFIC. The Company will be classified as a PFIC in a particular taxable year if, taking into account our proportionate share of the income and assets of its subsidiaries under applicable “look-through” rules, either
| ● | 75 percent or more of the Company’s gross income for the taxable year is passive income; or |
| ● | the average percentage of the value of our assets that produce or are held for the production of passive income is at least 50 percent. |
For this purpose, passive income generally includes dividends, interest, gains from certain commodities transactions, rents, royalties and the excess of gains over losses from the disposition of assets that produce passive income. Gains from commodities transactions, however, are generally excluded from the definition of passive income if such gains are active business gains from the sale of commodities and the corporation’s commodities meet specified criteria.
The Company believes, and the other paragraphs in this disclosure generally assume, that the Company was not a PFIC for our taxable year ending March 31, 2023 and that, based on the present composition of the Company’s income and assets and the manner in which the Company conducts its business, the Company does not expect to be a PFIC in its current taxable year or in the foreseeable future. Whether the Company is a PFIC is a factual determination made annually, and the Company’s status could change depending, among other things, upon changes in the composition and amount of its gross income and the relative quarterly average value of its assets. If the Company was a PFIC for any taxable year in which a U.S. Holder holds the Company’s equity shares, the U.S. Holder generally would be subject to additional taxes on certain distributions and any gain realized from the sale or other taxable disposition of our Company’s equity shares regardless of whether the Company continued to be a PFIC in any subsequent year, unless the U.S. Holder is eligible to make (and does so make) a mark-to-market election in respectfor marketable stock and marks its equity shares to our equity share under their particular circumstances.
Alternatively, amarket for tax purposes on an annual basis pursuant to section 1296 of the Code. A U.S. person that owns stock of a PFIC generally may make a “qualified electing fund” election regarding such corporationHolder will not be able to elect out of the PFIC rules described above regarding excess distributions and recognized gains. We currentlyto treat us as a qualified electing fund (“QEF”) because we do not intend to prepare or provide the information that would enable youneeded to make a qualified electing fundQEF election.
A U.S. Holder that owns, or is deemedHolders are encouraged to consult their own equity shares intax advisor as to the Company’s status as a PFIC during any taxable yearand the tax consequences to them of such status.
Foreign Financial Asset Reporting
Certain U.S. Holders that own “specified foreign financial assets” with an aggregate value in excess of the U.S. Holder may haveapplicable reporting threshold (generally, US$50,000 for unmarried individuals) are generally required to file Internal Revenue Servicean information statement along with their tax returns, currently on IRS Form 86218938, with respect to such assets. “Specified foreign financial assets” include any financial accounts held at a non-U.S. financial institution, as well as securities issued by a non-U.S. issuer that are not held in accounts maintained by financial institutions. U.S. Holder’s U.S. federal income tax return.
You shouldHolders who fail to report the required information could be subject to substantial penalties and extension of the statute of limitations. Prospective investors are encouraged to consult yourwith their own tax advisors regarding how the PFIC rules apply to your investment in our equity sharespossible application of these rules.
Backup Withholding and the elections and reporting requirements discussed above.
Information Reporting and Backup Withholding
Dividend payments with respect to equity shares
Dividends paid on, and proceeds from the sale exchange or other disposition of, the equity shares willto a U.S. Holder generally may be subject to the information reporting torequirements of the US Internal Revenue ServiceCode and possible USmay be subject to backup withholding at a current rate of 28%. Backup withholding will not apply, however, to a USunless the U.S. Holder that furnishes a correctprovides an accurate taxpayer identification number and makes any other required certification on US Internal Revenue Service Form W-9 or that is otherwise exempt from backup withholding. US Holders that are exempt from backup withholding should still complete US Internal Revenue Service Form W-9 to avoid possible erroneous backup withholding. You should consult your tax advisors regarding the application of the US information reporting and backup withholding rules.
establishes an exemption. Backup withholding is not an additional tax. Amounts withheld asThe amount of any backup withholding mayfrom a payment to a U.S. Holder will be credited against your US federal income tax liability, and you may obtainallowed as a refund of any excess amounts withheld underor credit against the backup withholding rules by filing an appropriate claim for refund with the US Internal Revenue Service and furnishing any required information in a timely manner.
Information Reporting with Respect to Foreign Financial Assets
A U.S. Holder that owns “specified foreign financial assets,” including securities issued by a non-U.S. corporation, with an aggregate value in excess of US$50,000 at the end of the year (or a higher dollar amount prescribed by the Internal Revenue Service) may be required to file an information report with respect to such assets with such U.S. Holder’s U.S. federal income tax return, subjectliability, provided the required information is furnished to certain exceptions. These rules also impose penalties if athe U.S. Holder is required to submit such information to the Internal Revenue Service and fails to do so. U.S. Holders are urged to consult their tax advisors regarding the application of this legislation to their ownership of the equity shares.
Transfer Reporting Requirements
A U.S. Holder (includingin a U.S. tax-exempt entity) that transfers cash in exchange for equity of a newly created non-U.S. corporation may be required to file a Form 926 or a similar form with the Internal Revenue Service if (i) such person owned, directly or by attribution, immediately after the transfer at least 10% by vote ortimely manner.
value of the corporation or (ii) if the transferred cash, when aggregated with all transfers made by such person (or any related person) within the preceding 12 month period, exceeds US$100,000. U.S. Holders should consult their tax advisors regarding the applicability of this requirement to their acquisition of equity shares.
Indian Taxation
The discussion contained herein is based on the applicable tax laws of India as in effect on the date hereof and is subject to possible changes in Indian law that may come into effect after such date. Prospective investors should consult their own tax advisers as to the consequences of purchasing the equity shares, including, without limitation, the consequences of the receipt of dividend and the sale, transfer or disposition of the equity shares.
Dividend
Before the Amendment in Finance Act, 2020, i.e., up to March 31, 2020, dividend payments by companies to Azure Power Global Limited by our subsidiary, AZI, areits shareholders, were subject to dividend distribution tax in India payable by AZIcompanies at a rate of 17.304%17.47% (effective rate of TDS after grossing up is 21.17%) on the total amount distributed as a dividend as grossed up by the amount of such dividend distribution tax. Any
Pursuant to the amendment, Dividend Distribution tax (“DDT”) payable by Indian companies has been abolished and dividend income is taxable in the hands of shareholders as per income tax rates applicable on them. However, Indian companies are required to deduct tax at source in respect of our equity shares will notdividend paid. Considering the same from FY 2021 onwards, dividend payments to its shareholders by companies are taxable in the hands of shareholders. However, withholding tax shall be subject to any withholding or deduction in respect ofdeducted at source by companies at the applicable rate under Indian income tax laws so long as our holding company is deemed to be tax resident in Mauritius.
Pursuantlaw pursuant to amendments to the Indian Income Tax Act, 1961, as amended, income arising directly or indirectly through the transfer of a capital asset, including any share or interest in a company or entity registered or incorporated outside India, will be liable to tax in India, if such share or interest derives, directly or indirectly, its value substantially from assets (whether tangible or intangible) located in India and whether or not the seller of such share or interest has a residence, place of business, business connection, or any other presence in India. The share or interest of the company or entity registered or incorporated outside of India, shall be deemed to derive its value substantially from the assets located in India, if the value of such Indian assets exceeds INR 100 million, and represents at least 50% of the value of all the assets owned by the company or entity registered or incorporated outside of India. Substantially all of our assets are located in India. However, if the transferor of share or interest in a company or entity registered or incorporated outside of India (along with its associated enterprises), neither holds the right of management or control in the company or entity registered or incorporated outside of India nor holds voting power or share capital or interest exceeding 5% of the total voting power or total share capital or interest in the company or entity registered or incorporated outside of India, at any time during the twelve months preceding the date of transfer, such small shareholders are exempt from the indirect transfer provisions mentioned above.
The amendments also do not deal with the interplay between the Indian Income Tax Act, 1961, as amended, and the double taxation avoidance agreements that India has entered into with countries such as the United States, in case of an indirect transfer. Accordingly, the implications of these amendments are presently unclear. If it is determined that these amendments apply to a holder of our equity shares, such holder could be liable to pay tax in India on such income.
F. Dividends
The Taxation Laws (Amendment) Act, 2019 received the assent of the President on December 11, 2019 and Paying Agents
Not applicable
G. Statements by Experts
Not applicable
H. Documentspublished in the Gazette of India on Display
All information filed withDecember 12, 2019. The amendment provides an option for the SECcompanies to opt for reduced corporate tax rate of 22% provided they do not claim certain tax benefits under the Income Tax Act. The Company has opted for the reduced tax rate for the subsidiaries which are not eligible for deduction under section 80IA of the Income Tax Act. Further, New domestic companies incorporated on or after October 1, 2019 making fresh investment in manufacturing can be inspected and copiedopt an option to pay income-tax at the public reference facilities maintained by the SEC at 100 F Street, N.E., Washington, D.C. 20549. You can request copiesrate of these documents upon payment of a duplicating fee, by writing15%. This benefit is available to the SEC. Please call the SEC at 1-800-SEC-0330 for further
informationcompanies which do not avail any exemption/incentive and commences their production on the operation of the public reference rooms. The SEC maintains a website atwww.sec.govthat contains reports, proxy and information statements and other information regarding registrants that make electronic filings through its Electronic Data Gathering, Analysis, and Retrieval, or EDGAR, system. All our Exchange Act reports and other SEC filings willbefore March 31, 2024. Also, such companies shall not be available through the EDGAR system.required to pay Minimum Alternate Tax.
I. Subsidiary Information
Not applicable
ITEM 11. QUANTITATIVE AND QUALITATIVE DISCLOSURES ABOUT MARKET RISKF. Quantitative and Qualitative Disclosures about Market Risk
We are exposed to several market risks in our normal business activities. Market risk is the potential loss that may result from market changes associated with our business or with an existing or forecasted financial or commodity transaction. The typestype of market risks we are exposed to areinclude interest rate risk and foreign currency risk.
Interest Rate Risk
As of March 31, 2017,2022, our long-term debt was at both fixed and variable interest rates. Exposure to interest rate fluctuations will depend on the amount of debt that bears interest at variable rates, the time at which the interest rate is adjusted and the quantum of fluctuation in the interest rate.
Our results of operations are subject to interest rate fluctuations on our variable rate borrowings. The sensitivity analysis below havehas been determined based on the exposure to interest rates for non-derivative financial instruments at the balance sheet date. For floating rate liabilities, the analysis is prepared assuming the amount of liability outstanding at the balance sheet date was outstanding for the whole period.
A hypothetical
During FY 2023 and FY 2024, RBI has increased the repo rate by 2.50%. As a result of the same, Indian lenders have also affected increase or decrease in ourtheir benchmark rates. Consequently, the interest rate in one of the debts availed at the variable interest ratesrate has seen an increase by 1% would1.50% due to revision in the benchmark rate of the concerned lender. During FY 2023 and FY 2024 till date, some of the lenders have increased interest rates/ levied additional penalty interest due to delay in submission of audited financials for FY 2022, resulting in overall increase in the effective rate of interest. Even after submission of audited financial statements for FY 2023 and FY 2024, some or all of the lenders may not have had a significant increase or decrease inagree to revision of such increased interest cost for the Company, for ended March 31, 2017.rates/ penalty interest to original rates.
We intend to use hedging strategies to mitigate our exposure to interest rate fluctuations in our foreign currency borrowings, but we may not hedge all of our interest rate risk and, to the extent we enter into interest rate hedges, our hedges may not necessarily have the same duration as the associated indebtedness. Our exposure to interest rate fluctuations will depend on the amount of indebtedness that bears interest at variable rates, the time at which the interest rate is adjusted, the amount of the adjustment, our ability to prepay or refinance variable rate indebtedness when fixed rate debt matures and needs to be refinanced and hedging strategies we may use to reduce the impact of any increases in rates.
Foreign Currency Risk
The functional currency of AZIour Indian subsidiaries is Indian rupees. Werupees, but we have long term debts denominated in U.S. dollars and Indian rupees. FluctuationsWe are partially hedged against exchange rate risk for both of our Green Bonds and fully hedged against other foreign currency loan exposures. The fluctuations in the exchange rates between U.S. dollars and Indian rupees may result in higher fair value adjustments on our outstanding foreign currency loans thereby adversely impacting our earnings.or payables.
We also have two
The Company and its three international subsidiaries have a functional currency which is the U.S. dollar and major purchases of material are transacted in U.S. dollars. Consequently,consequently, we are exposed to foreign exchange risk on purchases from overseas suppliers.routine transactions entered locally by these subsidiaries. The exchange rate between Indian rupees and U.S. dollars has fluctuated significantly in recent years and may continue to fluctuate in the future. Depreciation of the Indian rupee against the U.S. dollar can adversely affect our results of operations.may result in translation loss in the Consolidated Financial Statements.
We have partiallyhedged against exchange rate risk for both of our Green Bonds so as to minimize the effect of any adverse movement in the exchange rates. Further, we have hedged against debts denominated in U.S. dollars in Indian subsidiaries, in order to minimize anthe adverse impact of a large currency movement. These hedges are for a period of up to three years. We have taken foreign currency loans for our Punjab 1, Gujarat 1, Rajasthan 18 project and are also utilizing some trade credits denominated in foreign currency for our Rajasthan 2 projects.9 project.
As of March 31, 2017 we have outstanding option contractsFair value hedges with notional valueamounts of US$15.015.7 million for hedging the foreign currency risk on borrowings denominated in U.S. dollars. The remaining term of these contractsand US$ Nil were outstanding as of March 31, 2017 ranges2022 and 2023, respectively. Changes in the fair value of derivatives designated and qualifying as fair value hedges, together with any changes in the fair value of the hedged firm commitments attributable to the hedged risk, are recorded in the consolidated balance sheet and consolidated statements of operations. Further, cash flow hedges with notional amounts of US$1,097.6 million and US$1,049.0 million were outstanding as of March 31, 2022 and 2023, respectively, with the balance maturity period ranging from 30.5 months to 24 months. These option contracts have a3.3 years as of March 31, 2023. The fair value of these cash flow hedges as of March 31, 2022 and 2023 were US$13.7 million and US$72.7 million of net assets, respectively, and are included in accumulated other comprehensive loss on each reporting date.our consolidated balance sheets. The changes in the fair value of these option contracts are recognized in the consolidated statementsConsolidated Statements of operationsOperations and are included in foreign exchange loss.interest expense.
We continue to monitor our risks and will consider hedging significant foreign currency exposures on an ongoing basis.
ITEM 12. DESCRIPTION OF SECURITIES OTHER THAN EQUITY SECURITIESG. Controls and Procedures
Not applicable
PART II
ITEM 13. DEFAULTS, DIVIDEND ARREARAGES AND DELINQUENCIESNone
ITEM 14. MATERIAL MODIFICATIONS TO THE RIGHTS OF SECURITY HOLDERS AND USE OF PROCEEDS
Material modifications to the rightsEvaluation of the security holders
There have been no material modifications to the rights of securities holders or the use of proceeds
Use of proceeds
On October 17, 2016, we completed our initial public offering and a concurrent private placement of our equity shares pursuant to a Registration Statement on Form F-1, as amended (File No. 333-208584), which became effective on October 11, 2016. Barclays Capital Inc., Credit Suisse Securities (USA) LLC, and Roth Capital Partners, LLC acted as managing underwriters for the issue. An aggregate of 2,242,424 shares were sold by us in the offering along with 1,166,667 shares sold by the selling shareholders at a price of US$18.00 per share. We offered 4,166,667 shares to CDPQ Infrastructures Asia Pte Ltd., a wholly owned subsidiary of Caisse de dépôt et placement du Québec on a concurrent private placement at the same price. The initial offering by the Company and the private placement resulted in aggregate gross proceeds before expense of US$115.4 million and incurred an underwriters commission and other expenses of US$14.4 million. We have used US$100.0 million of the net proceeds to purchase equity shares of our subsidiary AZI as outlined in the registration station and prospectus.
ITEM 15. CONTROLS AND PROCEDURES
A. Disclosure Controls and Procedures
As required by Rules 13a-15 and 15d-15 under the Exchange Act, management, including our group chief executive officerGroup’s Chief Executive Officer and our group chief financial and operating officer,Group’s Chief Financial Officer, has evaluated the effectiveness of our disclosure controls and procedures as of the end of the period covered by this annual report.report, March 31, 2023. Disclosure controls and procedures refer to controls and other procedures designed to ensure that information required to be disclosed in the reports we file or submit under the Exchange Act is recorded, processed, summarized and reported, within the time periods specified in the rules and forms of the SEC. Disclosure controls and procedures include, without limitation, controls and procedures designed to ensure that information required to be disclosed by us in our reports that we file or submit under the Exchange Act is accumulated and communicated to management, including our Group’s principal executive and principal financial officers, or persons performing similar functions, as appropriate to allow timely decisions regarding our required disclosure.
Based on the foregoing, our group chief executive officerGroup’s Chief Executive Officer and our group chief financial and operating officerGroup’s Chief Financial Officer have concluded that, as of March 31, 2017,2023, our disclosure controls and procedures were effective.
B. Management’s Report on Internal Control over Financial Reporting
This annual report does not includeeffective as a report of management’s assessment regarding internal control over financial reporting due to a transition period established by rulesresult of the Securities and Exchange Commission for newly public companies.
C. Attestation Report of the Registered Public Accounting Firm
This annual report does not include an attestation report of our Company’s Registered Public Accounting firm, as the Company being an emerging growth company under JOBS Act is exempted from such attestation requirement.
D. Changes in Internal Control over Financial Reporting
During the period covered by this annual report, there were no changesmaterial weaknesses in our internal control over financial reporting as described below.
Management’s Report on Internal Control Over Financial Reporting
Management is responsible for establishing and maintaining adequate internal control over financial reporting as defined in Rules 13a-15(f) and 15d-15(f) of the Exchange Act. Internal control over financial reporting includes maintaining records that, in reasonable detail, accurately and fairly reflect our transactions; provide reasonable assurance that transactions are recorded as necessary for preparation of our financial statements; provide reasonable assurance that receipts and expenditures of company assets are made in accordance with management authorization; and provide reasonable assurance that unauthorized acquisition, use or disposition of company assets that could have materially affected,a material effect on our financial statements would be prevented or detected on a timely basis. Because of its inherent limitations, internal control over financial reporting is not intended to provide absolute assurance that a misstatement of our financial statements would be prevented or detected. Also, projections of any evaluation of the effectiveness of internal control over financial reporting to future periods are reasonably likelysubject to materially affect,the risk that the controls may become inadequate because of changes in conditions, or that the degree of compliance with the policies or procedures may deteriorate.
Management used the Committee of Sponsoring Organizations of the Treadway Commission Internal Control—Integrated Framework (2013), or the COSO framework, to evaluate the effectiveness of our internal control over financial reportingreporting.
ITEM 16A. AUDIT COMMITTEE FINANCIAL EXPERT
Our BoardA material weakness is a deficiency, or combination of Directors hasdeficiencies, in internal control over financial reporting such that there is a reasonable possibility that a material misstatement in our annual or interim financial statements would not be prevented or detected on a timely basis. The scope of our management’s assessment of the effectiveness of internal control over financial reporting includes all of our consolidated operations. Further, Management determined that, Mr. Kellyas of March 31, 2023, our internal controls over financial reporting were ineffective due to inadequacy of certain review controls including control failures in financial statement closing procedures, controls pertaining to capitalization, vendor reconciliation process, land acquisition, documentation on testing of control attributes and completeness and accuracy of reports used including inadequate consideration in designing of risk and controls matrices.
Management, under the supervision of the Company’s Audit and Risk Committee, has initiated remediation actions focused on improving the Group’s internal control and compliance environment to address the control deficiencies that led to material weaknesses. Management is an “audit committee financial expert” as defined in Item 16A(b)taking support from external consultants while performing this remediation exercise. These efforts include creation of Form 20-Fa Management Assurance Service function, assessing and strengthening internal control framework, testing operational controls, adding accounting personnel for assistance on critical accounting matters, training of team members, implementing additional process level reviews, and periodic monitoring by the SecuritiesAudit and Exchange Commission’s rulesRisk Committee of the effectiveness of the remedial efforts and “independent”overall reporting framework. As it continues to implement such remediation, management may take additional measures or modify the plan elements described above. On March 14, 2024, the Board has appointed Mr. Vijay Kumar Wadhwani as Chief Compliance & Ethics Officer and approved the Chief Compliance & Ethics Charter including specific power and responsibilities.
Our management recognizes that there are inherent limitations in the effectiveness of any system of internal control over financial reporting, including the possibility of human error and the circumvention or override of internal control. Accordingly, even the most effective internal control over financial reporting can provide only reasonable assurance with respect to financial statement preparation and may not prevent or detect all misstatements and can only provide reasonable assurance with respect to the preparation and presentation of our financial statements.
The effectiveness of our internal control over financial reporting as at March 31, 2023 has been audited by ASA & Associates LLP, India, our independent registered public accounting firm, as stated in their report which is reproduced in its entirety below.
H. Corporate Governance
Our Company is a “foreign private issuer” (as such term is defined in Rule 3b-4 under the Exchange Act).
On July 13, 2023, the NYSE suspended trading in our shares and commenced delisting proceedings as a result of our failure to timely file with the SEC our annual report on Form 20-F for the period ended March 31, 2022 and our semi-annual report on Form 6-K for the period ended September 30, 2022. On October 31, 2023, the New York Stock Exchange (NYSE) filed a Form 25 with the SEC for the removal of listing standards.of the Company’s shares from the NYSE. On November 13, 2023 our shares were delisted from NYSE. For further information, see “Risk Factors - The New York Stock Exchange (NYSE) has delisted our Company’s shares due to our failure to timely file periodic reports with the SEC”
We expect that on April 1, 2024 the Company’s SEC reporting obligations under Section 15(d) of the Exchange Act will be suspended as the Company is expected to have less than 300 record holders of its equity securities on that date. Once such reporting obligations are suspended, the Company will no longer have an obligation to file periodic reports (annual reports on Form 20-F and Form 6-K reports) with the SEC. The Company’s reporting obligations under Mauritius law will continue and its reporting obligations to bondholders under its Green Bond indentures will also continue. In addition, other provisions of the Exchange Act and SEC rules thereunder relating to foreign private issuers with equity securities registered under the Exchange Act will no longer apply. For more information, see “Risk Factors - On April 1, 2024, we expect that our SEC reporting obligations under Section 15(d) of the Exchange Act will be suspended and the Company will no longer have an obligation to file periodic reports (annual reports on Form 20-F and Form 6-K reports) with the SEC.”
I. Whistle-Blower Policy
On May 2, 2016, we adopted
The Company is dedicated to fostering and maintaining the highest standards of ethics, integrity, and compliance in all aspects of our business and is committed to a Codework environment that is free from harassment, intimidation, discrimination and retaliation of Conduct forany kind. Our commitment to these principles includes ensuring that employees have a safe and secure avenue to report any concerns. We encourage all employees and a Codestakeholders to speak up without fear of Ethicsretaliation when they observe any behavior that appliesmay violate our company policies or any applicable laws and regulations. The Company takes all complaints seriously and is dedicated to addressing them promptly and impartially to safeguard the interests of our principal executive officer, our principal financial and accounting officerorganization and our other senior officers. employees.
Copies of our Code of Business ConductWhistleblower and EthicsAnti-Retaliation Policy are available on the “Investor Relations” page of our corporate websitewww.azurepower.com or athttp://investors.azurepower.com/~/media/Files/A/Azure-Power-IR/governance-documents/code-of-business-conduct-and-ethics-2-may-2016.pdf.
ITEM 16C. PRINCIPAL ACCOUNTANT FEES AND SERVICESErnstCode of Business Conduct and YoungEthics
The Company has served as our independent registered public accountant for eacha “Code of Business Conduct and Ethics” (the “Code of Ethics”) applicable to every employee, officer and director of the years ended March 31, 2017Company. This Code of Ethics is designed to promote honest and March 31, 2016ethical conduct; fair dealings with stakeholders; compliance with applicable laws, rules and regulations; and prompt reporting of violations of the Code of Ethics. The Code of Ethics provides that our directors, officers, and employees are expected to act in accordance with the highest standards of personal and professional integrity and avoid any action, position or interest that conflicts with the interests of our company or gives the appearance of a conflict. Directors, officers and employees have an obligation under the Code of Ethics to advance the Company’s interests when the opportunity to do so arises. The Company ensures annual training to be imparted to all existing employees and to new joiners at the time of joining.
A copy of the Code of Ethics is available on the “Investor Relations” page of our corporate website www.azurepower.com.
J. Principal Accountant Fees and Services
On July 12, 2023, the Company’s Board approved the appointment of ASA & Associates LLP (“ASA”) as an independent public accounting firm registered with the Public Company Accounting Oversight Board (“PCAOB”), for which auditedthe Company’s US GAAP consolidated financial statements appearfor Fiscal 2022 pursuant to resignation of S.R. Batliboi & Co. LLP. Since, the appointment of ASA was made during Fiscal Year 2024, hence the fees for audit related services will be recognized in this annual report.Fiscal year 2024.
The following table shows the aggregate fees for professional services and other services rendered by ErnstASA & Associates and Young and the various member firms of Ernst and Youngits associates to us, including some of our subsidiaries, in fiscal years 2017 and 2016.FY 2023.
| | | | | | | | | | | | |
| | | 2016 | | | 2017 | | | 2017 | |
Particulars | | (INR) | | | (INR) | | | (US$) | |
Audit fees (audit and review of financial statements and offerings) | | | 58,551,825 | | | | 41,800,000 | | | | 644,564 | |
All other fees (Tax Advisory services) | | | 400,000 | | | | 1,498,000 | | | | 23,099 | |
| | | | | | | | | | | | |
Total | | | 58,951,825 | | | | 43,298,000 | | | | 667,664 | |
| | | | | | | | | | | | |
| | Fiscal 2022 | | | Fiscal 2023* | | | Fiscal 2023* | |
| Particulars | | (INR
millions) | | | (INR
millions) | | | (US$
millions) | |
| Audit fees (audit and review of financial statements and offerings) | | | 71 | | | | - | | | | - | |
| All other fees (tax advisory services) | | | 3 | | | | - | | | | - | |
| Total | | | 74 | | | | - | | | | - | |
| * | Since appointment of ASA was made during Fiscal 2024, hence amount for audit fee and other services will be considered during Fiscal 2024 only. |
The policy of our audit and risk committee is to pre-approve all audit and non-audit services provided by Ernst and Young,external auditors, including audit services, audit-related services and tax services. We have a written policy on the engagement of an external auditor.
ITEM 16D. EXEMPTIONS FROM THE LISTING STANDARDS FOR AUDIT COMMITTEES
Not applicable
ITEM 16E. PURCHASES OF EQUITY SECURITIES BY THE ISSUER AND AFFILIATED PURCHASERS
Not applicable
ITEM 16F. CHANGE IN REGISTRANT’S CERTIFYING ACCOUNTANT
Not applicable
ITEM 16G. CORPORATE GOVERNANCE
We are a “foreign private issuer” (as such term is defined Please also see “Change in Rule 3b-4 under the Exchange Act) and our equity shares are listed on the New York Stock Exchange. Under Section 303A of the New York Stock Exchange Listed Company Manual, New York Stock Exchange listed companies that are foreign private issuers are permitted to follow home country practiceIndependent Registered Public Accounting Firm” below.
Change in lieu of the corporate governance provisions specified by the New York Stock Exchange, with limited exceptions. As required by the New York Stock Exchange Listed Company Manual, we note the following significant differences between our corporate governance practices and the corporate governance practices required to be followed by U.S. domestic companies under the New York Stock Exchange Listed Company Manual:
Independent Registered Public Accounting Firm
Under the New York Stock Exchange Listed Company Manual, the board of directors of U.S. domestic listed companies are required to have a majority of independent directors. We are not subject to this requirement under the Mauritius law and have decided to follow home country practice on this matter. Our board of directors currently does not have a majority of independent directors.
The New York Stock Exchange Listed Company Manual also requires U.S. domestic listed companies to regularly hold executive sessions for non-management directors, or an executive session that only includes independent directors at least once a year. We are not subject to this requirement under the Mauritius law and have decided to follow our home country practice on this matter
ITEM 16H. MINE SAFETY DISCLOSURE
Not applicable
PART III
ITEM 17. FINANCIAL STATEMENTS
See “Item 18. Financial Statements” for a list of the financial statements filedS.R. Batliboi & Co. LLP in its letter dated July 10, 2023, tendered its resignations as part of this annual report.
ITEM 18. FINANCIAL STATEMENTS
The following financial statements are filed as part of this annual report, together with the report of the independent registered public accounting firms:
firm of the Company and the Auditors of the subsidiary companies of APIPL.
Report
ASA & Associates LLP (“ASA”) was appointed as an independent registered public accounting firm of Independent Registered Public Accounting Firm.the Company to replace S.R. Batliboi & Co. LLP as an independent public accounting firm registered with the PCAOB, for the Company’s US GAAP consolidated financial statements for Fiscal 2022. ASA continues as an independent public accounting firm registered with the PCAOB, for the Company’s US GAAP consolidated financial statements for Fiscal 2023.
Consolidated Balance Sheets
On September 5, 2023, Ernst & Young, Mauritius (“EY Mauritius”) tendered its resignations as the statutory auditor of the Mauritius Entities with immediate effect. Pursuant to this resignation, the Company’s Board on September 28, 2023, approved the appointment of ECOVIS (Mauritius) as the new statutory auditors for the fiscal year ending March 31, 20162022 and 2017.
Consolidated Statements of Operations for the yearsfiscal year ended March 31,
2015, 2016 and 2017.2023, to audit the financials of the Mauritius Entities for necessary filings in Mauritius.K. Unresolved SEC Staff comments
Consolidated Statements of Comprehensive loss for the years ended March 31, 2015, 2016 and 2017.
None
Consolidated Statements of Preferred Shares and Shareholders deficit for the years ended March 31, 2015, 2016 and 2017.
L. Information Filed with Securities Regulators
Consolidated Statements of Cash Flows for
The SEC maintains a website at www.sec.gov that contains reports, proxy and information statements and other information regarding registrants that make electronic filings through its Electronic Data Gathering, Analysis, and Retrieval, or EDGAR, system. All our Exchange Act reports and other SEC filings will be available through the years ended March 31, 2015, 2016 and 2017.EDGAR system.
Notes to Consolidated Financial Statements.
ITEM 19. EXHIBITS
EXHIBITS
Exhibit Number | | Description |
Exhibit Number
| | Description
|
| 1.1† | |
1.1† | | The Constitution of Azure Power Global Limited, as currently in effect (incorporated by reference to Exhibit 3.2 of our Registration Statement on Form F-1 (File No. 333 208584)333-208584) filed with the Securities and Exchange Commission on March 31, 2016) |
| | |
| 2.1† | | Form of Equity Share Certificate of Azure Power Global Limited (incorporated by reference to Exhibit 4.1 of our Registration Statement onForm F-1 (file No. 333 208584)333-208584) filed with the Securities and Exchange Commission on December 16, 2015) |
| | |
4.1#†4.2† | | Appointment Letter dated February 27, 2023 to Vijay Kumar Wadhwani |
| | |
| 4.3† | | Indenture amongst Azure Power Energy Limited, Azure Power Global Limited and HSBC Bank USA, National Association for 3.575% senior notes due 2026 |
| | |
| 4.4† | | Executive Employment Agreement, dated April 27, 2022, by and between Azure Power India Private Limited and Harsh Shah |
| | |
| 4.5† | | Executive Release Agreement, dated August 29, 2022, by and between Azure Power India Private Limited, Azure Power Global Limited and Harsh Shah |
| | |
| 4.6† | | Retainership Agreement, dated November 21, 2022, by and between Azure Power Fifty Two Pvt. Ltd. and R Narasimhan Iyer |
| | |
| 4.7† | | Employee Employment Agreement, dated July 20, 2022, by and between Azure Power India Private Limited and Rupesh Agarwal |
| | |
| 4.8† | | Employee Employment Agreement, dated August 29, 2022, by and between Azure Power India Private Limited, Azure Power Global Limited and Rupesh Agarwal |
| | |
| 4.9† | | Appointment Letter dated July 28, 2022 to Shweta Srivastava |
| | |
| 4.10† | | Executive Release Agreement, dated July 11, 2023, by and between Azure Power India Private Limited, Azure Power Global Limited and Rupesh Agarwal |
| | |
| 4.11† | | Employee Employment Agreement, dated May 1, 2023, by and between Azure Power India Private Limited, Azure Power Global Limited and Sugata Sircar |
| | |
| 4.12† | | Employee Employment Agreement, dated April 29, 2023, by and between Azure Power India Private Limited and Sunil K Gupta |
| | |
| 4.13† | | Extension of Retainership Agreement, dated April 24, 2023, by and between Azure Power India Pvt. Ltd. and R Narasimhan Iyer |
| | |
| 4.14† | | 2016 Equity Incentive Plan (as amended on March 31, 2020) (incorporated by reference to Exhibit 10.24.32 of our Registration Statementannual report on Form F-120-F (file No. 333 208584)001-37909) filed with the Securities and Exchange Commission on June 30, 2016)19, 2020) |
| | |
4.2†4.15† | | Shareholders Agreement, dated July 22, 2015, by and among the shareholders named therein and Azure Power Global Limited (incorporated by reference to Exhibit 10.3 of our Registration Statement onForm F-1 (file No. 333 208584)333-208584) filed with the Securities and Exchange Commission on December 16, 2015) |
| | |
4.3†4.16† | | Shareholders Agreement, dated July 22, 2015, by and among Azure Power Global Limited, AZI,APIPL, Inderpreet Singh Wadhwa and Harkanwal Singh Wadhwa (incorporated by reference to Exhibit 10.3 of our Registration Statement onForm F-1 (file No. 333 208584)333-208584) filed with the Securities and Exchange Commission on March 1, 2016) |
| | |
4.4†4.17† | | Amendment to the Shareholders Agreement, dated March 30, 2016, by and among the shareholders named therein and Azure Power Global Limited (incorporated by reference to Exhibit 10.5 of our Registration Statement onForm F-1 (file No. 333 208584)333-208584) filed with the Securities and Exchange Commission on April 19, 2016) |
Exhibit Number | | |
| Description |
4.5† | | |
| 4.18† | | Second Amendment to the Shareholders Agreement, dated September 5, 2016, by and among the shareholders named therein and Azure Power Global Limited (incorporated by reference to Exhibit 10.6 of our Registration Statement onForm F-1 (file No. 333 208584)333-208584) filed with the Securities and Exchange Commission on September 22, 2016) |
| | |
4.6†4.19† | | Sponsor Lock-in Agreement, dated July 22, 2015, by and among the shareholders named therein and IW Green Inc. and Inderpreet Singh Wadhwa (incorporated by reference to Exhibit 10.6 of our Registration Statement onForm F-1 (file No. 333 208584)333-208584) filed with the Securities and Exchange Commission on April 19, 2016) |
| | |
4.7†4.20† | | Amendment to the Sponsor Lock-in Agreement, dated April 16, 2016, by and among the shareholders named therein and IW Green Inc. and Inderpreet Singh Wadhwa (incorporated by reference to Exhibit 10.7 of our Registration Statement onForm F-1 (file No. 333 208584)333-208584) filed with the Securities and Exchange Commission on April 19, 2016) |
| | |
4.8†4.21† | | Second Amendment to the Sponsor Lock-in Agreement, dated September 5, 2016, by and among the shareholders named therein and IW Green Inc. and Inderpreet Singh Wadhwa (incorporated by reference to Exhibit 10.9 of our Registration Statement onForm F-1 (file No. 333 208584)333-208584) filed with the Securities and Exchange Commission on September 22, 2016) |
| | |
4.9†4.22† | | Form of Registration Rights Agreement by and among the shareholders named therein and Azure Power Global Limited (incorporated by reference to Exhibit 10.8 of our Registration Statement onForm F-1 (file No. 333 208584)333-208584) filed with the Securities and Exchange Commission on June 30, 2016) |
| | |
4.10#†4.23† | | Employment Agreement, dated November 7, 2008, by and between AZI and Inderpreet Singh Wadhwa (incorporated by reference to Exhibit 10.5 of our Registration Statement onForm F-1 (file No. 333 208584) filed with the Securities and Exchange Commission on December 16, 2015) |
| |
4.11#† | | Employment Agreement, dated May 5, 2011, by and between AZI and Surendra Kumar Gupta (incorporated by reference to Exhibit 10.6 of our Registration Statement onForm F-1 (file No. 333 208584) filed with the Securities and Exchange Commission on December 16, 2015) |
| |
4.12#† | | Employment Agreement, dated February 1, 2013, by and between AZI and Sandeep Chopra (incorporated by reference to Exhibit 10.7 of our Registration Statement onForm F-1 (file No. 333 208584) filed with the Securities and Exchange Commission on December 16, 2015) |
| |
4.13#† | | Employment Agreement, dated November 1, 2009, by and between AZI and Preet Sandhu (incorporated by reference to Exhibit 10.8 of our Registration Statement onForm F-1 (file No. 333 208584) filed with the Securities and Exchange Commission on December 16, 2015) |
| |
4.14#† | | Employment Agreement, dated August 31, 2011, by and between AZI and Glen Minyard (incorporated by reference to Exhibit 10.9 of our Registration Statement onForm F-1 (file No. 333 208584) filed with the Securities and Exchange Commission on December 16, 2015) |
| |
4.15#† | | Employment Agreement, dated February 1, 2014, by and between AZI and Mohor Sen (incorporated by reference to Exhibit 10.10 of our Registration Statement onForm F-1 (file No. 333 208584) filed with the Securities and Exchange Commission on December 16, 2015) |
| |
4.16† | | Indenture of Lease, dated October 15, 2013, by and between AZI and Sunbir Singh Wadhwa and Kulwinder Wadhwa (incorporated by reference to Exhibit 10.11 of our Registration Statement onForm F-1 (file No. 333 208584) filed with the Securities and Exchange Commission on December 16, 2015) |
| |
4.17† | | Form of Indemnification Agreement by and between Azure Power Global Limited and each of the Officers and Directors of Azure Power Global Limited (incorporated by reference to Exhibit 10.16 of our Registration Statement onForm F-1 (file No. 333 208584)333-208584) filed with the Securities and Exchange Commission on June 15, 2016) |
| | |
| |
4.18† | | Subscription Agreement, dated June 24, 2015, by and among AZI, Inderpreet Singh Wadhwa, Harkanwal Singh Wadhwa and International Finance Corporation (incorporated by reference to Exhibit 10.14 of our Registration Statement onForm F-1 (file No. 333 208584) filed with the Securities and Exchange Commission on December 16, 2015) |
| 4.24† | |
4.19† | | Subscription Agreement, dated June 24, 2015, by and among Azure Power Global Limited, Inderpreet Singh Wadhwa, Harkanwal Singh Wadhwa, IW Green Inc. (which has since been converted to IW Green LLC) and IFC GIF Investment Company I (incorporated by reference to Exhibit 10.13 of our Registration Statement onForm F-1 (file No. 333 208584) filed with the Securities and Exchange Commission on December 16, 2015) |
| |
4.20† | | CCPS Subscription Agreement, dated July 22, 2015, by and among Azure Power Global Limited, Sponsors and Société de Promotion et de Participation pour la Coopération Économique S.A. (incorporated by reference to Exhibit 10.15 of our Registration Statement onForm F-1 (file No. 333 208584) filed with the Securities and Exchange Commission on December 16, 2015) |
| |
4.21† | | Letter Agreement, dated July 27, 2015, by and among Azure Power Global Limited, International Finance Corporation, AZI,APIPL, IW Green Inc. (which has since been converted to IW Green LLC), Inderpreet Singh Wadhwa and Harkanwal Singh Wadhwa (incorporated by reference to Exhibit 10.16 of our Registration Statement onForm F-1 (file No. 333 208584)333-208584) filed with the Securities and Exchange Commission on December 16, 2015) |
| | |
4.22†4.25† | | Third Amendment to the Shareholders Agreement, dated September 28, 2016, by and among the shareholders named therein and Azure Power Global Limited (incorporated by reference to Exhibit 10.23 of our Registration Statement onForm F-1 (file No. 333 208584)333-208584) filed with the Securities and Exchange Commission on October 3, 2016) |
| | |
4.23†4.26† | | CCPS Subscription Agreement, dated September 19, 2016, by and among Azure Power Global Limited, the Sponsors named therein and IFC GIF Investment Company I (incorporated by reference to Exhibit 10.24 of our Registration Statement onForm F-1 (file No. 333 208584)333-208584) filed with the Securities and Exchange Commission on October 3, 2016) |
| | |
4.24†4.27† | | Amendment to CCPS Subscription Agreement, dated September 28, 2016, by and among Azure Power Global Limited, the Sponsors named therein and IFC GIF Investment Company I (incorporated by reference to Exhibit 10.25 of our Registration Statement onForm F-1 (file No. 333 208584)333-208584) filed with the Securities and Exchange Commission on October 3, 2016) |
| | |
4.25†4.28† | | Share Purchase Agreement, dated September 30, 2016, by and between Azure Power Global Limited and CDPQ Infrastructures Asia Pte Ltd. (incorporated by reference to Exhibit 10.26 of our Registration Statement onForm F-1 (file No. 333 208584)333-208584) filed with the Securities and Exchange Commission on October 3, 2016) |
| | |
| 4.29† | | Employment Agreement, dated November 18, 2019, by and between APIPL and Ranjit Gupta (incorporated by reference to Exhibit 4.28 of our annual report on Form 20-F (file No. 001-37909) filed with the Securities and Exchange Commission on June 19, 2020). |
| | |
| 4.30† | | Employment Agreement, dated November 18, 2019, by and between APIPL and Murali Subramanian (incorporated by reference to Exhibit 4.29 of our annual report on Form 20-F (file No. 001-37909) filed with the Securities and Exchange Commission on June 19, 2020). |
Exhibit Number | | Description |
4.26* | | Amended and Restated Shareholders |
| 4.31† | | Subscription Agreement, dated March 28, 2017,November 6, 2019, by and amongbetween Azure Power Global Limited AZI, Inderpreet Singh Wadhwa and Harkanwal Singh Wadhwa.CDPQ Infrastructures Asia Pte Ltd (incorporated by reference to Exhibit 4.30 of our annual report on Form 20-F (file No. 001-37909) filed with the Securities and Exchange Commission on June 19, 2020). |
| | |
8.1*4.32† | | Indenture among Azure Power Solar Energy Private Limited, Azure Power Global Limited and HSBC Bank USA, National Association dated September 24, 2019 (incorporated by reference to Exhibit 4.31 of our annual report on Form 20-F (file No. 001-37909) filed with the Securities and Exchange Commission on June 19, 2020) |
| | |
| 4.33† | | Master Share Purchase agreement dated April 1, 2021, by and between Radiance Renewables Private Limited and APIPL, AZR and entities as mentioned in Schedule 1 of the agreement (incorporated by reference to Exhibit 4.33 of our annual report on Form 20-F (file No. 001-37909) filed with the Securities and Exchange Commission on July 28, 2021) |
| | |
| 4.34† | | Amendment to Employment Agreement, dated July 20, 2020, by and between APIPL and Ranjit Gupta. (incorporated by reference to Exhibit 4.34 of our annual report on Form 20-F (file No. 001-37909) filed with the Securities and Exchange Commission on July 28, 2021) |
| | |
| 4.35† | | Amendment to Employment Agreement, dated July 20, 2020, by and between APIPL and Murali Subramanian. (incorporated by reference to Exhibit 4.35 of our annual report on Form 20-F (file No. 001-37909) filed with the Securities and Exchange Commission on July 28, 2021) |
| | |
| 11.1† | | Code of Business Conduct and Ethics August 26, 2022 |
| | |
| 8.1* | | List of Subsidiaries of Azure Power Global Limited |
| |
11.1* | | Code of Business Conduct and Ethics of the Registrant |
| 12.1* | |
12.1* | | CEO Certification Pursuant to Section 302 of the Sarbanes Oxley Act of 2002 |
| | |
| 12.2* | | CFO Certification Pursuant to Section 302 of the Sarbanes Oxley Act of 2002 |
| | |
| 13.1** | | CEO Certification Pursuant to Section 906 of the Sarbanes Oxley Act of 2002 |
| | |
| 13.2** | | CFO Certification Pursuant to Section 906 of the Sarbanes Oxley Act of 2002 |
| | |
| 101.INS* | | Inline XBRL Instance Document |
| | Document- this instance document does not appear in the Interactive Data File because its XBRL tags are not embedded within the inline XBRL document |
| | |
| 101.SCH* | | Inline XBRL Taxonomy Extension Schema Document |
| | |
| 101.CAL* | | Inline XBRL Taxonomy Extension Calculation Linkbase Document |
| | |
| 101.DEF* | | Inline XBRL Taxonomy Extension Definition Linkbase Document |
| | |
| 101.LAB* | | Inline XBRL Taxonomy Extension Labels Linkbase Document |
| | |
| 101.PRE* | | Inline XBRL Taxonomy Extension Presentation Linkbase Document |
| | |
| 104 | | Cover page interactive Data File (embedded within the Inline XBRL Document) |
#† | Indicates management contract or compensatory plan. |
| * | Filed with this annual report onForm 20-F |
| ** | Furnished with this annual report onForm 20-F |
Signatures
The registrant hereby certifies that it meets all of the requirements for filing on Form20-F and that it has duly caused and authorized the undersigned to sign this annual report on this Form20-F on its behalf.
| | |
| Azure Power Global Limited |
| |
| By: | | /s/ Inderpreet Singh WadhwaSunil Gupta | | |
| Name: | Sunil Gupta | Inderpreet Singh Wadhwa |
| Title: | | Chairman of the Board of Directors and Chief Executive Officer | |
| Azure Power Global Limited | |
| | |
| By: | /s/ Sugata Sircar | | |
| Name: | Sugata Sircar | |
| Title: | Chief Financial Officer | |
Date: June 19, 2017March 28, 2024
INDEX TO CONSOLIDATED FINANCIAL STATEMENTS
| | Page |
| Consolidated Financial Statements | | |
| | | Page | |
Consolidated Financial Statements
| | | | |
Report of Independent Registered Public Accounting Firm (PCAOB ID of ASA & Associates LLP: 3083) | | F-2 |
| | | F-2 | |
Consolidated Balance Sheets as of March 31, 20162022 and 20172023 | | F-7 |
| | | F-3 | |
Consolidated Statements of Operations for the years ended March 31, 2015, 20162021, 2022 and 20172023 | | F-8 |
| | | F-4 | |
Consolidated Statements of Comprehensive Lossloss for the years ended March 31, 2015, 20162021, 2022 and 20172023 | | F-9 |
| | | F-5 | |
Consolidated Statements of Preferred Shares and Shareholders’ Equity/(Deficit)Equity for the years ended March 31, 2015, 20162021, 2022 and 20172023 | | F-10 |
| | | F-6 | |
Consolidated Statements of Cash Flows for the years ended March 31, 2015, 20162021, 2022 and 20172023 | | F-11 |
| | | F-8 | |
Notes to Consolidated Financial Statements | | | F-9 | F-12 |
Report of Independent Registered Public Accounting Firm
The
To the Shareholders and the Board of Directors and Shareholders of
Azure Power Global Limited
Opinion on the Consolidated Financial Statements
We have audited the accompanying consolidated balance sheetssheet of Azure Power Global Limited (the “Company”) and its subsidiaries (the “Group”) as of March 31, 20162023 and 2017, and2022, the related consolidated statements of operations and other comprehensive loss, preferred shares and shareholders’ equity/deficitchanges in equity and cash flows for each of the threetwo years in the period ended March 31, 2017. These2023 and 2022, and the related notes (collectively referred to as the “consolidated financial statements”). In our opinion, the accompanying consolidated financial statements arepresent fairly, in all material respects, the responsibilityfinancial position of the Company’s management. Our responsibility is to express an opinion on these financial statements based on our audits.Group as of March 31, 2023 and 2022, and the results of its operations and its cash flows for each of the two years ended March 31, 2023 and 2022, in conformity with accounting principles generally accepted in the United States of America.
We conducted our auditsalso have audited, in accordance with the standards of the Public Company Accounting Oversight Board (United States). (PCAOB), the Group’s internal control over financial reporting as of March 31, 2023, based on criteria established in Internal Control-Integrated Framework issued by the Committee of Sponsoring Organizations of the Treadway Commission (2013 framework), and our report dated March 27, 2024, expressed an adverse opinion thereon.
Substantial Doubt related to Going Concern
The accompanying consolidated financial statements have been prepared assuming that the Group will continue as a going concern. As discussed in Note 27 to the consolidated financial statements, there are certain ongoing investigations and legal proceedings on the Group, the outcome of which are unascertained at this stage. This event raises a doubt about the Group’s ability to continue as a going concern. Management’s disclosure in this regard are also described in Note 27. The consolidated financial statements do not include any adjustments that might result from the outcome of this uncertainty.
Basis for Opinion
These consolidated financial statements are the responsibility of the Group’s management. Our responsibility is to express an opinion on the Group’s consolidated financial statements based on our audits. We are a public accounting firm registered with the PCAOB and are required to be independent with respect to the Group in accordance with the U.S. federal securities laws and the applicable rules and regulations of the U.S. Securities and Exchange Commission and the PCAOB.
We conducted our audits in accordance with the standards of the PCAOB. Those standards require that we plan and perform the audit to obtain reasonable assurance about whether the financial statements are free of material misstatement. We were not engagedmisstatement, whether due to perform an audit of the Company’s internal control over financial reporting.error or fraud. Our audits included considerationperforming procedures to assess the risks of internal control overmaterial misstatement of the financial reporting as a basis for designing auditstatements, whether due to error or fraud, and performing procedures that are appropriate in the circumstances, but not for the purpose of expressing an opinion on the effectiveness of the Company’s internal control over financial reporting. Accordingly, we express no such opinion. An audit also includesrespond to those risks. Such procedures included examining, on a test basis, evidence supportingregarding the amounts and disclosures in the financial statements, assessingstatements. Our audits also included evaluating the accounting principles used and significant estimates made by management, andas well as evaluating the overall presentation of the financial statement presentation.statements. We believe that our audits provide a reasonable basis for our opinion.
In our opinion,
Emphasis of Matters
| 1. | We draw attention on the following matters: |
| a) | Refer Note 27 to the consolidated financial statements in respect of allegations of improper payments by land aggregators for acquisition of land in one of the projects in the previous years, as more fully described therein. As a result of these allegations, based on review, during the previous year ended March 31, 2022, the management has made an adjustment (de-capitalisation) of INR 253 million (equivalent to USD 3.4 million) on an estimate basis. During the current year, an incremental adjustment amounting to INR 28 million (equivalent to USD 0.40 million) has been made in respect of the above matter. |
| b) | Refer Note 27 to the consolidated financial statements, wherein the Company has voluntarily disclosed certain matters to the U.S. Securities and Exchange Commission and the U.S. Department of Justice. Engagement and cooperation with the aforesaid authorities is continuing on those matters. We are informed that any potential liability or penalty from authorities cannot be assessed at this stage. |
| c) | Refer Note 28 to the consolidated financial statements which describes that the Company has been delisted from the New York Stock Exchange (‘NYSE’) on November 13, 2023. The management believes that the delisting would not have any impact on the operations of the Group. |
Our Audit report is not modified in respect of above matters.
Critical Audit Matters
The critical audit matters communicated below are matters arising from the financial statements referred to above present fairly, in all material respects,current-period audit of the consolidated financial positionstatements that were communicated or required to be communicated to the audit committee and that (1) relate to accounts or disclosures that are material to the consolidated financial statements and (2) involved our especially challenging, subjective, or complex judgments. The communication of critical audit matters does not alter in any way our opinion on the consolidated financial statements, taken as a whole, and we are not, by communicating the critical audit matters below, providing separate opinions on the critical audit matters or on the accounts or disclosures to which they relate.
| a. | Contingencies for investigations, lawsuits and other legal proceedings |
| Critical audit matter description | As discussed in Note 19 and 27 to the consolidated financial statements, due to the ongoing investigations, lawsuits and other legal proceedings, management is of the view, that the Group might be exposed to certain liabilities such as levy of damages, reduction of PPA tariffs, administrative actions from lenders including the risk of PPA cancellation, all of which could adversely impact the revenue, profitability, and capitalization of the affected projects. Any such fines or penalties could materially and adversely affect the Group’s results of operations, financial condition, and cash flows in future periods |
How we addressed the matter in our audit | ● We obtained and evaluated management’s assessment and representation stating that no triggering event such as demand or any potential notice from any lender or regulator has happened, except the ongoing inquiries from U.S. Securities and Exchange Commission and the U.S. Department of Justice. ● The discussions and disclosures to the U.S. Securities and Exchange Commission and the U.S. Department of Justice are ongoing and the Company is cooperating with all the issues raised by the regulators and based on submissions made till date, the management has confirmed that there is no financial impact on the Group as of the date of this report (also refer paragraph on Substantial Doubt related to Going Concern). ● We independently corresponded with the investigators and obtained written response from them. ● We enquired with management and Audit and Risk Committee of the Board of Directors of the Company about the facts and obtained the representation in writing in this respect. ● Considering the potential liabilities which are not presently ascertainable, we have reported the matter by way of emphasis of matter paragraph in this audit report (refer Emphasis of Matters paragraph (b) above) |
| b. | Impairment and other estimates of Property, Plant & Equipment (PPE) |
| Critical audit matter description | As discussed in Note 23 to the consolidated financial statements, the Group uses various inputs to assess indicators of impairment as well as evaluate the need to recognise any impairment provision. Also, the Group relies on various third-party expert reports for the purpose of estimation (e.g. useful life, fair valuation etc). Any departure/deviation in the estimates used will have a significant bearing on the carrying value of the PPE. |
How we addressed the matter in our audit | ● We have reviewed the third-party reports as made available to us and as applicable and the inputs used by management in determining the estimates and have performed following procedures: -We assessed the qualifications, independence, and objectivity of the external experts engaged by management to perform the fair value assessments. We reviewed the scope and terms of their engagement to ensure it aligns with audit requirements. -We reviewed the expert reports, including their methodologies, assumptions, data sources, and findings. We assessed whether the reports were consistent with relevant accounting standards and industry best practices. -We compared the expert report’s conclusions and valuations to the estimates provided by management. ● We evaluated management’s process for identifying indicators of impairment, including changes in market conditions, technological advancements, economic factors, or internal issues that may suggest a potential impairment of PPE. ● We assessed the appropriateness of management’s methods and assumptions used to determine the fair value of PPE when impairment indicators were present. This involved evaluating the selection of valuation models, discount rates, and the use of external experts, if applicable. ● We reviewed the documentation and underlying data used by management in their impairment assessment and fair value determination. This included examining historical financial data, market information, and internal reports. |
ASA & Associates LLP
We have served as the Group’s auditor since 2023.
Gurugram, India
March 27, 2024
Report of Independent Registered Public Accounting Firm
To the Shareholders and the Board of Directors of
Azure Power Global Limited
Opinion on Internal Control Over Financial Reporting
We have audited the internal control over financial reporting as of March 31, 2023 of Azure Power Global Limited at(the “Company”) and its subsidiaries (the “Group”), based on criteria established in Internal Control—Integrated Framework issued by the Committee of Sponsoring Organizations of the Treadway Commission (2013 framework) (the “COSO criteria”). In our opinion, because of the effect of the material weaknesses described below, on the achievement of the objectives of the control criteria, the Group has not maintained effective internal control over financial reporting as of March 31, 20162023, based on the COSO criteria.
A material weakness is a deficiency, or combination of deficiencies, in the internal control over financial reporting, such that there is a reasonable possibility that a material misstatement of the company’s annual or interim financial statements will not be prevented or detected on a timely basis. Management has identified material weaknesses in the design and 2017,operating effectiveness of internal control over financial reporting in relation to land acquisition process, assets capitalisation, vendor reconciliation process and monitoring of management review controls inter-alia including those related to significant estimates and financial statement closing process.
We also have audited, in accordance with the standards of the Public Company Accounting Oversight Board (United States) (PCAOB), the consolidated resultsstatement of itsfinancial position of the Group as of March 31, 2023, the related consolidated statements of operations and itsother comprehensive loss, changes in equity and cash flows for each of the three years inGroup for the periodyear ended March 31, 2017,2023, and the related notes. These material weaknesses were considered in conformitydetermining the nature, timing and extent of audit tests applied in our audit of the financial year ended March 31, 2023 consolidated financial statements and this report does not affect our report dated March 27, 2024, which expressed an unqualified opinion thereon.
Basis for Opinion
The Company’s management is responsible for maintaining effective internal control over financial reporting and for its assessment of the effectiveness of internal control over financial reporting included in the accompanying Management’s Annual Report on Internal Control over Financial Reporting. Our responsibility is to express an opinion on the Group’s internal control over financial reporting based on our audit. We are a public accounting firm registered with the PCAOB and are required to be independent with respect to the Company and the Group in accordance with the U.S. federal securities laws and the applicable rules and regulations of the U.S. Securities and Exchange Commission and the PCAOB.
We conducted our audit in accordance with the standards of the PCAOB. Those standards require that we plan and perform the audit to obtain reasonable assurance about whether effective internal control over financial reporting was maintained in all material respects.
Our audit included obtaining an understanding of internal control over financial reporting, assessing the risk that a material weakness exists, testing and evaluating the design and operating effectiveness of internal control based on the assessed risk, and performing such other procedures as we considered necessary in the circumstances. We believe that our audit provides a reasonable basis for our opinion.
Definition and Limitations of Internal Control Over Financial Reporting
A company’s internal control over financial reporting is a process designed to provide reasonable assurance regarding the reliability of financial reporting and the preparation of financial statements for external purposes in accordance with generally accepted accounting principles. A company’s internal control over financial reporting includes those policies and procedures that (1) pertain to the maintenance of records that, in reasonable detail, accurately and fairly reflect the transactions and dispositions of the assets of the company; (2) provide reasonable assurance that transactions are recorded as necessary to permit preparation of financial statements in accordance with generally accepted accounting principles, and that receipts and expenditures of the company are being made only in accordance with authorizations of management and directors of the company; and (3) provide reasonable assurance regarding prevention or timely detection of unauthorized acquisition, use, or disposition of the company’s assets that could have a material effect on the financial statements.
/s/ Ernst
Because of its inherent limitations, internal control over financial reporting may not prevent or detect misstatements. Also, projections of any evaluation of effectiveness to future periods are subject to the risk that controls may become inadequate because of changes in conditions, or that the degree of compliance with the policies or procedures may deteriorate.
ASA & Young Associates LLP
Gurgaon,
Gurugram, India
June 19, 2017March 27, 2024
AZURE POWER GLOBAL LIMITED
Consolidated Balance Sheets
(INR and US$ amounts in thousands,millions, except share and par value data)
| | | | | | | | | | | | |
| | | As of March 31, | |
| | | 2016
(INR) | | | 2017
(INR) | | | 2017
(USD) | |
| | | | | | | | | (Note 2d) | |
Assets | | | | | | | | | | | | |
Current assets: | | | | | | | | | | | | |
Cash and cash equivalents | | | 3,090,386 | | | | 5,460,670 | | | | 84,205 | |
Investments in available for sale securities | | | — | | | | 3,296,797 | | | | 50,837 | |
Restricted cash | | | 821,891 | | | | 3,629,037 | | | | 55,960 | |
Accounts receivable, net | | | 556,755 | | | | 1,138,605 | | | | 17,558 | |
Deferred IPO cost | | | 208,731 | | | | — | | | | — | |
Prepaid expenses and other current assets# | | | 308,007 | | | | 495,937 | | | | 7,647 | |
| | | | | | | | | | | | |
Total current assets | | | 4,985,770 | | | | 14,021,046 | | | | 216,207 | |
Restricted cash | | | 871,637 | | | | 1,383,414 | | | | 21,333 | |
Property, plant and equipment, net | | | 24,381,429 | | | | 40,942,608 | | | | 631,343 | |
Software, net | | | 14,657 | | | | 15,272 | | | | 235 | |
Deferred income taxes | | | 34,661 | | | | 31,429 | | | | 485 | |
Investments in held to maturity securities | | | 6,785 | | | | 6,631 | | | | 102 | |
Other assets* | | | 595,901 | | | | 1,093,565 | | | | 16,863 | |
| | | | | | | | | | | | |
Total assets | | | 30,890,840 | | | | 57,493,965 | | | | 886,568 | |
| | | | | | | | | | | | |
Liabilities, preferred shares and shareholders’ equity / (deficit) | | | | | | | | | | | | |
Current liabilities: | | | | | | | | | | | | |
Short-term debt | | | 1,258,241 | | | | 2,460,240 | | | | 37,937 | |
Accounts payable | | | 1,899,488 | | | | 3,618,251 | | | | 55,794 | |
Current portion of long-term debt | | | 4,477,696 | | | | 1,554,806 | | | | 23,975 | |
Income taxes payable | | | 45,215 | | | | 232,420 | | | | 3,584 | |
Interest payable | | | 126,122 | | | | 189,309 | | | | 2,919 | |
Deferred revenue | | | 80,201 | | | | 79,937 | | | | 1,233 | |
Other liabilities | | | 214,487 | | | | 484,477 | | | | 7,470 | |
| | | | | | | | | | | | |
Total current liabilities | | | 8,101,450 | | | | 8,619,440 | | | | 132,912 | |
Long-term debt | | | 18,352,714 | | | | 31,142,762 | | | | 480,228 | |
Deferred revenue | | | 1,190,142 | | | | 1,383,691 | | | | 21,337 | |
Deferred income taxes | | | 470,048 | | | | 1,078,255 | | | | 16,627 | |
Asset retirement obligations | | | 94,301 | | | | 242,980 | | | | 3,747 | |
Other liabilities | | | 39,936 | | | | 109,151 | | | | 1,682 | |
| | | | | | | | | | | | |
Total liabilities | | | 28,248,591 | | | | 42,576,279 | | | | 656,533 | |
| | | | | | | | | | | | |
Preferred shares, INR 10 par value, 805,462 and nil shares designated as compulsorily convertible preferred shares as of March 31, 2016 and 2017, respectively | | | 9,733,272 | | | | — | | | | — | |
Redeemablenon-controlling interest | | | 346,754 | | | | 390,827 | | | | 6,027 | |
Shareholders’ equity/(deficit) | | | | | | | | | | | | |
Equity shares, US$ 0.000625 par value; 1,758,080 and 25,915,956 shares issued and outstanding as of March 31, 2016 and 2017 respectively | | | 68 | | | | 1,073 | | | | 17 | |
Additionalpaid-in capital | | | (2,958,166 | ) | | | 18,904,151 | | | | 291,506 | |
Accumulated deficit | | | (4,508,156 | ) | | | (5,723,420 | ) | | | (88,256 | ) |
Accumulated other comprehensive income | | | 28,807 | | | | 40,326 | | | | 622 | |
| | | | | | | | | | | | |
Total APGL shareholders’ equity/(deficit) | | | (7,437,447 | ) | | | 13,222,130 | | | | 203,889 | |
Non-controlling interest | | | (330 | ) | | | 1,304,729 | | | | 20,119 | |
| | | | | | | | | | | | |
Total shareholders’ equity/(deficit) | | | (7,437,777 | ) | | | 14,526,859 | | | | 224,008 | |
| | | | | | | | | | | | |
Total liabilities, preferred share and shareholders’ equity/(deficit) | | | 30,890,840 | | | | 57,493,965 | | | | 886,568 | |
| | | | | | | | | | | | |
| | | As of March 31, | |
| | | 2022 | | | 2023 | | | 2023 | |
| | | (INR) | | | (INR) | | | (US$) | |
| | | | | | | | | (Note 2d) | |
| Assets | | | | | | | | | |
| Current assets: | | | | | | | | | |
| Cash and cash equivalents | | | 18,796 | | | | 12,724 | | | | 154.7 | |
| Restricted cash | | | 3,784 | | | | 7,764 | | | | 94.5 | |
| Accounts receivable, net | | | 6,041 | | | | 5,713 | | | | 69.5 | |
| Investments in held to maturity securities | | | 6 | | | | 7 | | | | 0.1 | |
| Inventory | | | - | | | | 13 | | | | 0.2 | |
| Prepaid expenses and other current assets | | | 1,925 | | | | 1,630 | | | | 20.0 | |
| Assets classified as held for sale (1) | | | 127 | | | | - | | | | - | |
| Total current assets | | | 30,679 | | | | 27,851 | | | | 339.0 | |
| Restricted cash | | | 726 | | | | 479 | | | | 5.8 | |
| Property, plant and equipment, net | | | 144,332 | | | | 143,639 | | | | 1,747.6 | |
| Software, net | | | 8 | | | | 1 | | | | 0.0 | |
| Accounts receivable, net | | | 3,203 | | | | 3,896 | | | | 47.4 | |
| Deferred income taxes | | | 1,920 | | | | 1,137 | | | | 13.8 | |
| Right-of-use assets | | | 4,465 | | | | 4,346 | | | | 52.9 | |
| Other assets | | | 5,190 | | | | 8,730 | | | | 106.2 | |
| Investments | | | 96 | | | | 457 | | | | 5.6 | |
| Total assets | | | 190,619 | | | | 190,536 | | | | 2,318.3 | |
| Liabilities and shareholders’ equity | | | | | | | | | | | | |
| Current liabilities: | | | | | | | | | | | | |
| Short-term debt | | | 7,036 | | | | 7,840 | | | | 95.4 | |
| Accounts payable | | | 3,573 | | | | 1,504 | | | | 18.3 | |
| Current portion of long-term debt | | | 9,209 | | | | 9,414 | | | | 114.5 | |
| Income taxes payable | | | 181 | | | | 386 | | | | 4.7 | |
| Interest payable | | | 1,003 | | | | 1,098 | | | | 13.4 | |
| Deferred revenue | | | 230 | | | | 308 | | | | 3.7 | |
| Lease liabilities | | | 300 | | | | 292 | | | | 3.6 | |
| Other liabilities | | | 5,009 | | | | 5,357 | | | | 65.2 | |
| Liabilities directly associated with assets classified as held for sale (1) | | | 73 | | | | - | | | | - | |
| Total current liabilities | | | 26,614 | | | | 26,199 | | | | 318.8 | |
| Non-current liabilities: | | | | | | | | | | | | |
| Long-term debt | | | 1,12,542 | | | | 1,14,191 | | | | 1,389.4 | |
| Deferred revenue | | | 5,417 | | | | 6,688 | | | | 81.4 | |
| Deferred income taxes | | | 1,936 | | | | 3,338 | | | | 40.6 | |
| Asset retirement obligations | | | 902 | | | | 1,112 | | | | 13.5 | |
| Lease liabilities | | | 3,534 | | | | 3,408 | | | | 41.5 | |
| Other liabilities | | | 98 | | | | 65 | | | | 0.8 | |
| Total liabilities | | | 151,043 | | | | 1,55,001 | | | | 1,886.0 | |
| Shareholders’ equity | | | | | | | | | | | | |
| Equity shares, US$0.000625 par value; 64,161,490 and 64,166,360 shares issued and outstanding as of March 31, 2022, and March 31, 2023, respectively | | | 3 | | | | 3 | | | | 0.0 | |
| Additional paid-in capital | | | 56,726 | | | | 56,743 | | | | 690.4 | |
| Accumulated deficit | | | (15,312 | ) | | | (17,597 | ) | | | (214.1 | ) |
| Accumulated other comprehensive loss | | | (2,503 | ) | | | (4,239 | ) | | | (51.6 | ) |
| Total APGL shareholders’ equity | | | 38,914 | | | | 34,910 | | | | 424.7 | |
| Non-controlling interest | | | 662 | | | | 625 | | | | 7.6 | |
| Total shareholders’ equity | | | 39,576 | | | | 35,535 | | | | 432.3 | |
| Total liabilities and shareholders’ equity | | | 190,619 | | | | 190,536 | | | | 2,318.3 | |
#(1) | Includes Security deposit of INR NilAlso refer note 2(u) and INR 6,407 (US$ 99)note 23 relating to related partiesassets and liabilities directly associated with assets classified as of 31 March, 2016 and March 31, 2017, respectively, also see Note 18.held for sale. |
* | Includes Security deposit of INR 8,567 and INR 2,160 (US$ 33) to related parties as of 31 March, 2016 and March 31, 2017, respectively, also see Note 18. |
See accompanying notes.
AZURE POWER GLOBAL LIMITED
Consolidated Statements of Operations
(INR and US$ amounts in thousands,millions, except share and per share data)
| | | | | | | | | | | | | | | | |
| | | Year ended March 31, | |
| | | 2015 | | | 2016 | | | 2017 | | | 2017 | |
| | | (INR) | | | (INR) | | | (INR) | | | (US$) | |
| | | | | | | | | | | | (Note 2d) | |
Operating revenues: | | | | | | | | | | | | | | | | |
Sale of power | | | 1,124,138 | | | | 2,626,148 | | | | 4,182,985 | | | | 64,502 | |
| | | | |
Operating costs and expenses: | | | | | | | | | | | | | | | | |
Cost of operations (exclusive of depreciation and amortization shown separately below) | | | 79,816 | | | | 190,648 | | | | 375,787 | | | | 5,795 | |
General and administrative | | | 425,952 | | | | 672,841 | | | | 797,161 | | | | 12,292 | |
Depreciation and amortization | | | 322,430 | | | | 687,781 | | | | 1,046,565 | | | | 16,138 | |
| | | | | | | | | | | | | | | | |
Total operating cost and expenses | | | 828,198 | | | | 1,551,270 | | | | 2,219,513 | | | | 34,225 | |
| | | | | | | | | | | | | | | | |
Operating income | | | 295,940 | | | | 1,074,878 | | | | 1,963,472 | | | | 30,277 | |
Other expense: | | | | | | | | | | | | | | | | |
Interest expense, net | | | 831,790 | | | | 2,058,836 | | | | 2,371,836 | | | | 36,574 | |
(Gain)/Loss on foreign currency exchange, net | | | 299,628 | | | | 343,137 | | | | (109,128 | ) | | | (1,683 | ) |
| | | | | | | | | | | | | | | | |
Total other expenses | | | 1,131,418 | | | | 2,401,973 | | | | 2,262,708 | | | | 34,891 | |
| | | | | | | | | | | | | | | | |
Loss before income tax | | | (835,478 | ) | | | (1,327,095 | ) | | | (299,236 | ) | | | (4,614 | ) |
Income tax expense | | | (253,112 | ) | | | (327,745 | ) | | | (892,333 | ) | | | (13,760 | ) |
| | | | | | | | | | | | | | | | |
Net loss | | | (1,088,590 | ) | | | (1,654,840 | ) | | | (1,191,569 | ) | | | (18,374 | ) |
| | | | | | | | | | | | | | | | |
Less: Net loss attributable tonon-controlling interest | | | (5,595 | ) | | | (4,651 | ) | | | (18,924 | ) | | | (292 | ) |
| | | | | | | | | | | | | | | | |
Net loss attributable to APGL | | | (1,082,995 | ) | | | (1,650,189 | ) | | | (1,172,645 | ) | | | (18,082 | ) |
Accretion to Mezzanine CCPS | | | (755,207 | ) | | | (1,347,923 | ) | | | (235,853 | ) | | | (3,637 | ) |
Accretion to redeemablenon-controlling interest | | | — | | | | (29,825 | ) | | | (44,073 | ) | | | (680 | ) |
| | | | | | | | | | | | | | | | |
Net loss attributable to APGL equity shareholders | | | (1,838,202 | ) | | | (3,027,937 | ) | | | (1,452,571 | ) | | | (22,399 | ) |
| | | | | | | | | | | | | | | | |
Net loss per share attributable to APGL equity stockholders | | | | | | | | | | | | | | | | |
Basic and diluted | | | (1,046 | ) | | | (1,722 | ) | | | (111 | ) | | | (1.72 | ) |
| | | | |
Shares used in computing basic and diluted per share amounts | | | | | | | | | | | | | | | | |
Equity shares | | | 1,758,080 | | | | 1,758,080 | | | | 13,040,618 | | | | | |
| | | March 31, | |
| | | 2021
(INR) | | | 2022
(INR) | | | 2023
(INR) | | | 2023
(US$)
(Note 2d) | |
| | | | | | | | | | | | | |
| Operating revenues: | | | | | | | | | | | | |
| Revenue from customers | | | 15,236 | | | | 18,341 | | | | 20,748 | | | | 252.4 | |
| Operating costs and expenses: | | | | | | | | | | | | | | | | |
| Cost of operations (exclusive of depreciation and amortization shown separately below) | | | 1,261 | | | | 1,597 | | | | 1,825 | | | | 22.2 | |
| General and administrative | | | 2,988 | | | | 2,067 | | | | 4,777 | | | | 58.1 | |
| Depreciation and amortization | | | 3,202 | | | | 3,667 | | | | 4,024 | | | | 49.0 | |
| Impairment loss/(reversal) | | | 3,255 | | | | (80 | ) | | | 1,279 | | | | 15.6 | |
| Total operating costs and expenses: | | | 10,706 | | | | 7,251 | | | | 11,905 | | | | 144.9 | |
| Operating income | | | 4,530 | | | | 11,090 | | | | 8,843 | | | | 107.5 | |
| Other expense, net: | | | | | | | | | | | | | | | | |
| Interest expense, net | | | 8,410 | | | | 11,930 | | | | 8,375 | | | | 101.9 | |
| Other (income) / expenses | | | 18 | | | | 3 | | | | (30 | ) | | | (0.4 | ) |
| Loss/ (Gain) on foreign currency exchange, net | | | 7 | | | | (33 | ) | | | 157 | | | | 1.9 | |
| Total other expenses/ (income), net | | | 8,435 | | | | 11,900 | | | | 8,502 | | | | 103.4 | |
| (Loss)/Profit before income tax | | | (3,905 | ) | | | (810 | ) | | | 341 | | | | 4.1 | |
| Income tax expense | | | (296 | ) | | | (1,316 | ) | | | (2,663 | ) | | | (32.4 | ) |
| Net loss | | | (4,201 | ) | | | (2,126 | ) | | | (2,322 | ) | | | (28.3 | ) |
| Less: Net profit / (loss) attributable to non-controlling interest | | | 5 | | | | (22 | ) | | | (37 | ) | | | (0.5 | ) |
| Net loss attributable to APGL equity Shareholders | | | (4,206 | ) | | | (2,104 | ) | | | (2,285 | ) | | | (27.8 | ) |
| Net profit / (loss) per share attributable to APGL equity Shareholders | | | | | | | | | | | | | | | | |
| Basic | | | (87.66 | ) | | | (41.36 | ) | | | (35.61 | ) | | | (0.43 | ) |
| Diluted | | | (87.66 | ) | | | (41.36 | ) | | | (35.61 | ) | | | (0.43 | ) |
| Shares used in computing basic and diluted per share amounts | | | | | | | | | | | | | | | | |
| Basic | | | 47,979,581 | | | | 50,876,360 | | | | 64,166,360 | | | | 64,166,360 | |
| Diluted | | | 47,979,581 | | | | 50,876,360 | | | | 64,166,360 | | | | 64,166,360 | |
See accompanying notes.
AZURE POWER GLOBAL LIMITED
Consolidated Statements of Comprehensive Loss
(INR and US$ amounts in thousands)millions)
| | | | | | | | | | | | | | | | |
| | | Year ended March 31, | |
| | | 2015
(INR) | | | 2016
(INR) | | | 2017
(INR) | | | 2017
(US$) | |
| | | | | | | | | | | | (Note 2d) | |
Net loss attributable to APGL equity shareholders | | | (1,838,202 | ) | | | (3,027,937 | ) | | | (1,452,571 | ) | | | (22,399 | ) |
Add:non-controlling interest | | | (5,595 | ) | | | (4,651 | ) | | | (18,924 | ) | | | (292 | ) |
Other comprehensive loss/(gain), net of tax | | | | | | | | | | | | | | | | |
Foreign currency translation | | | (3,180 | ) | | | (5,615 | ) | | | 10,228 | | | | 158 | |
Unrealized gain on available for sale securities (Net of tax, INR 10,028) | | | — | | | | — | | | | (21,746 | ) | | | (335 | ) |
| | | | | | | | | | | | | | | | |
Total comprehensive loss | | | (1,846,977 | ) | | | (3,038,203 | ) | | | (1,483,013 | ) | | | (22,868 | ) |
Less: total comprehensive loss attributable tonon-controlling interest | | | — | | | | — | | | | — | | | | — | |
| | | | | | | | | | | | | | | | |
Total comprehensive loss attributable to APGL equity shareholders | | | (1,846,977 | ) | | | (3,038,203 | ) | | | (1,483,013 | ) | | | (22,868 | ) |
| | | | | | | | | | | | | | | | |
| | | March 31, | |
| | | 2021 | | | 2022 | | | 2023 | | | 2023 | |
| | | (INR) | | | (INR) | | | (INR) | | | (US$) | |
| | | | | | | | | | | | | |
| Net loss attributable to APGL equity Shareholders | | | (4,206 | ) | | | (2,104 | ) | | | (2,285 | ) | | | (27.8 | ) |
| Add: Non-controlling interest | | | 5 | | | | (22 | ) | | | (37 | ) | | | (0.5 | ) |
| Less: Total comprehensive income attributable to non-controlling interest, included in other comprehensive loss/(gain) | | | — | | | | — | | | | — | | | | — | |
| Other comprehensive (loss)/gain, net of tax | | | | | | | | | | | | | | | | |
| Foreign currency translation | | | 1,600 | | | | 2,943 | | | | (4,603 | ) | | | (56.0 | ) |
| Effective portion of cash flow hedge | | | (778 | ) | | | (5,227 | ) | | | 3,448 | | | | 42.0 | |
| Income tax effect on effective portion of cash flow hedge | | | 143 | | | | 753 | | | | (581 | ) | | | (7.1 | ) |
| Unrealized loss on available-for-sale securities | | | — | | | | — | | | | — | | | | — | |
| Income tax effect on unrealized gain/(loss) on available for sale of securities | | | — | | | | — | | | | — | | | | — | |
| Total other comprehensive (loss)/gain | | | 965 | | | | (1,531 | ) | | | (1,736 | ) | | | (21.1 | ) |
| Total comprehensive income/ (loss) | | | (3,236 | ) | | | (3,657 | ) | | | (4,058 | ) | | | (49.4 | ) |
See accompanying notes.
AZURE POWER GLOBAL LIMITED
Consolidated Statements of Preferred Shares and Shareholders’ Equity/(Deficit)Equity
(INR and US$ amounts in thousands)millions)
| | | | | | | | | | | | | | | | | | | | | | | | | | | | | | | | |
| | | Preferred
shares | | | Equity
shares | | | Additional paid
in capital | | | Accumulated
other
comprehensive
income | | | Accumulated
deficit | | | Total APGL
shareholders’
deficit | | | Non-
controlling
interests | | | Total
shareholders’
deficit | |
Balance as of March 31, 2014 | | | 2,385,725 | | | | 68 | | | | (894,401 | ) | | | 20,012 | | | | (1,745,307 | ) | | | (2,619,628 | ) | | | 10,170 | | | | (2,609,458 | ) |
Proceeds from issue of shares to founders | | | — | | | | — | | | | 68 | | | | — | | | | — | | | | 68 | | | | — | | | | 68 | |
Issuance of series F CCPS | | | 1,549,010 | | | | — | | | | — | | | | — | | | | — | | | | — | | | | — | | | | — | |
Net loss | | | — | | | | — | | | | — | | | | — | | | | (1,082,995 | ) | | | (1,082,995 | ) | | | (5,595 | ) | | | (1,088,590 | ) |
Accretion on Mezzanine CCPS | | | 755,207 | | | | — | | | | (755,207 | ) | | | — | | | | — | | | | (755,207 | ) | | | — | | | | (755,207 | ) |
Other comprehensive loss | | | — | | | | — | | | | — | | | | 3,180 | | | | — | | | | 3,180 | | | | — | | | | 3,180 | |
Share based compensation | | | — | | | | — | | | | 7,428 | | | | — | | | | — | | | | 7,428 | | | | — | | | | 7,428 | |
| | | | | | | | | | | | | | | | | | | | | | | | | | | | | | | | |
Balance as of March 31, 2015 | | | 4,689,942 | | | | 68 | | | | (1,642,112 | ) | | | 23,192 | | | | (2,828,302 | ) | | | (4,447,154 | ) | | | 4,575 | | | | (4,442,579 | ) |
| | | | | | | | | | | | | | | | | | | | | | | | | | | | | | | | |
| | | Equity
share
capital | | | Additional
paid-in
capital | | | Accumulated
other
comprehensive
loss (1) | | | Accumulated
deficit | | | Total APGL
shareholders’
equity | | | Non-
controlling
interests | | | Total
shareholders’
equity | |
| Balance as of March 31, 2020 | | | 2 | | | | 37,533 | | | | (1,937 | ) | | | (8,580 | ) | | | 27,018 | | | | 199 | | | | 27,217 | |
| Proceeds from issuance of equity shares (refer note 16) | | | — | | | | 424 | | | | — | | | | — | | | | 424 | | | | — | | | | 424 | |
| Net loss | | | — | | | | — | | | | — | | | | (4,206 | ) | | | (4,206 | ) | | | 5 | | | | (4,201 | ) |
| Other comprehensive Income | | | — | | | | — | | | | 965 | | | | — | | | | 965 | | | | — | | | | 965 | |
| Share based compensation | | | — | | | | 47 | | | | — | | | | — | | | | 47 | | | | — | | | | 47 | |
| Balance as of March 31, 2021 | | | 2 | | | | 38,004 | | | | (972 | ) | | | (12,786 | ) | | | 24,248 | | | | 204 | | | | 24,452 | |
| | | Equity
share
capital | | | Additional
paid-in
capital | | | Accumulated
other
comprehensive
loss (1) | | | Accumulated
Deficit | | | Total APGL
shareholders’
equity | | | Non-
controlling
interests | | | Total
shareholders’
equity | |
| Balance as of March 31, 2021 | | | 2 | | | | 38,004 | | | | (972 | ) | | | (12,786 | ) | | | 24,248 | | | | 204 | | | | 24,452 | |
| Transaction with NCI | | | — | | | | — | | | | — | | | | (422 | ) | | | (422 | ) | | | 480 | | | | 58 | |
| Proceeds from issuance of equity shares (refer note 16) (3) | | | 1 | | | | 18,621 | | | | — | | | | — | | | | 18,622 | | | | — | | | | 18,622 | |
| Net loss | | | — | | | | — | | | | — | | | | (2,104 | ) | | | (2,104 | ) | | | (22 | ) | | | (2,126 | ) |
| Other comprehensive loss | | | — | | | | — | | | | (1,531 | ) | | | — | | | | (1,531 | ) | | | — | | | | (1,531 | ) |
| Share based compensation | | | — | | | | 101 | | | | — | | | | — | | | | 101 | | | | — | | | | 101 | |
| Balance as of March 31, 2022 | | | 3 | | | | 56,726 | | | | (2,503 | ) | | | (15,312 | ) | | | 38,914 | | | | 662 | | | | 39,576 | |
| | | Equity
share
capital | | | Additional
paid-in
capital | | | Accumulated
other
comprehensive
loss (1) | | | Accumulated
Deficit | | | Total APGL
shareholders’
equity | | | Non-
controlling
interests | | | Total
shareholders’ equity | |
| Balance as of March 31, 2022 | | | 3 | | | | 56,726 | | | | (2,503 | ) | | | (15,312 | ) | | | 38,914 | | | | 662 | | | | 39,576 | |
| Proceeds from issuance of equity shares (2) | | | — | | | | — | | | | — | | | | — | | | | — | | | | — | | | | — | |
| Net profit | | | — | | | | — | | | | — | | | | (2,285 | ) | | | (2,285 | ) | | | (37 | ) | | | (2,322 | ) |
| Other comprehensive loss | | | — | | | | — | | | | (1,736 | ) | | | — | | | | (1,736 | ) | | | — | | | | (1,736 | ) |
| Share based compensation | | | — | | | | 17 | | | | — | | | | — | | | | 17 | | | | — | | | | 17 | |
| Balance as of March 31, 2023 | | | 3 | | | | 56,743 | | | | (4,239 | ) | | | (17,597 | ) | | | 34,910 | | | | 625 | | | | 35,535 | |
| Balance as of March 31, 2023 ((US$) (Note 2(d)) | | | 0.0 | | | | 690.4 | | | | (51.6 | ) | | | (214.1 | ) | | | 424.7 | | | | 7.6 | | | | 432.4 | |
| (1) | Refer note 16 for components of accumulated other comprehensive loss. |
| (2) | Refer note 16 for reconciliation of number of equity shares. |
| (3) | Includes the related immaterial impact of restricted stock units (“RSU”) which had been converted into restricted stock (“RS”)/ share-based settlement during the previous year. |
See accompanying notes.
AZURE POWER GLOBAL LIMITED
Consolidated Statements of Preferred Shares and Shareholders’ Equity/(Deficit)Cash Flows
(INR and US$ amounts in thousands)millions)
| | | Year ended March 31, | |
| | | 2021 | | | 2022 | | | 2023 | | | 2023 | |
| | | (INR) | | | (INR) | | | (INR) | | | US$ | |
| Cash flow from operating activities | | | | | | | | | | | | |
| Net Profit/ (loss) | | | (4,201 | ) | | | (2,126 | ) | | | (2,322 | ) | | | (28.3 | ) |
| Adjustments to reconcile net (loss)/profit to net cash provided by/(used in) operating activities: | | | | | | | | | | | | | | | | |
| Income taxes and deferred tax | | | (329 | ) | | | 457 | | | | 1,614 | | | | 19.6 | |
| Depreciation and amortization | | | 3,202 | | | | 3,667 | | | | 4,024 | | | | 49.0 | |
| Impairment loss//(reversal) | | | 3,255 | | | | (80 | ) | | | 1,279 | | | | 15.6 | |
| Amortization of derivative instrument | | | 1,918 | | | | 1,576 | | | | 1,726 | | | | 21.0 | |
| Loss on disposal of property plant and equipment | | | 32 | | | | 167 | | | | 242 | | | | 2.9 | |
| Share based compensation | | | 1,001 | | | | (295 | ) | | | (629 | ) | | | (7.7 | ) |
| Amortization of debt financing costs | | | 369 | | | | 1,107 | | | | 336 | | | | 4.1 | |
| Employee benefit | | | 45 | | | | 13 | | | | (3 | ) | | | 0.0 | |
| ARO accretion | | | 42 | | | | 46 | | | | 83 | | | | 1.0 | |
| Interest income from investments | | | - | | | | - | | | | (41 | ) | | | (0.5 | ) |
| Non-cash rent expense | | | 169 | | | | 354 | | | | 121 | | | | 1.5 | |
| Allowance for doubtful accounts/ credit losses (net) | | | 294 | | | | (97 | ) | | | 551 | | | | 6.7 | |
| Loan prepayment charges | | | 257 | | | | 1,608 | | | | - | | | | - | |
| Foreign exchange loss/(gain), net | | | 7 | | | | (33 | ) | | | 157 | | | | 1.9 | |
| Change in Operating lease right-of-use assets | | | (371 | ) | | | (809 | ) | | | (349 | ) | | | (4.2 | ) |
| Change in Operating lease liabilities | | | 125 | | | | 497 | | | | 213 | | | | 2.6 | |
| Changes in operating assets and liabilities | | | | | | | | | | | | | | | | |
| Accounts receivable, net | | | (874 | ) | | | (1,057 | ) | | | (916 | ) | | | (11.1 | ) |
| Prepaid expenses and other current assets | | | 20 | | | | (862 | ) | | | 388 | | | | 4.7 | |
| Inventory | | | - | | | | - | | | | (13 | ) | | | (0.2 | ) |
| Other assets | | | 112 | | | | (3,565 | ) | | | 273 | | | | 3.3 | |
| Accounts payable | | | (176 | ) | | | 347 | | | | (994 | ) | | | (12.1 | ) |
| Interest payable | | | (83 | ) | | | (520 | ) | | | 108 | | | | 1.3 | |
| Deferred revenue | | | 224 | | | | 3,184 | | | | 1,349 | | | | 16.4 | |
| Other liabilities | | | (61 | ) | | | 1,018 | | | | 760 | | | | 9.2 | |
| Net cash provided by operating activities | | | 4,977 | | | | 4,597 | | | | 7,957 | | | | 96.7 | |
| Cash flows from investing activities | | | | | | | | | | | | | | | | |
| Purchase of property plant and equipment | | | (18,909 | ) | | | (40,869 | ) | | | (5,953 | ) | | | (72.4 | ) |
| Purchase of software | | | (10 | ) | | | (21 | ) | | | 3 | | | | 0.0 | |
| Investment | | | - | | | | (94 | ) | | | (362 | ) | | | (4.4 | ) |
| Proceeds from disposal of subsidiaries | | | - | | | | 1,557 | | | | 54 | | | | 0.7 | |
| Net cash used in investing activities | | | (18,919 | ) | | | (39,427 | ) | | | (6,258 | ) | | | (76.1 | ) |
| Cash flows from financing activities | | | | | | | | | | | | | | | | |
| Proceeds from issuance of Green Bonds | | | - | | | | 30,285 | | | | - | | | | - | |
| Proceeds from term and other debt | | | 25,510 | | | | 84,663 | | | | 3,104 | | | | 37.8 | |
| Repayment of Green bonds | | | - | | | | (37,069 | ) | | | (5,175 | ) | | | (63.0 | ) |
| Repayments of term and other debt (1) | | | (10,563 | ) | | | (52,953 | ) | | | (2,047 | ) | | | (24.9 | ) |
| Loan prepayment charges | | | (257 | ) | | | (1,608 | ) | | | - | | | | - | |
| Proceeds from issuance of equity shares | | | 402 | | | | 18,622 | | | | - | | | | - | |
| Net cash provided by (used in) financing activities | | | 15,092 | | | | 41,940 | | | | (4,118 | ) | | | (50.1 | ) |
| Effect of exchange rate changes on cash and cash equivalents, and restricted cash | | | 8 | | | | 38 | | | | 80 | | | | 0.9 | |
| Net increase in cash and cash equivalents, and restricted cash (refer note 2 (f)) | | | 1,150 | | | | 7,110 | | | | (2,419 | ) | | | (29.5 | ) |
| Cash and cash equivalents and restricted cash at the beginning of the period | | | 15,517 | | | | 16,158 | | | | 23,306 | | | | 283.6 | |
| Less: Cash and cash equivalents and restricted cash, held for sale | | | (517 | ) | | | - | | | | - | | | | - | |
| Cash and cash equivalents and restricted cash at the end of the period | | | 16,158 | | | | 23,306 | | | | 20,967 | | | | 255.0 | |
| Supplemental disclosure of cash flow information | | | | | | | | | | | | | | | | |
| Cash paid during the year for interest | | | 8,918 | | | | 10,656 | | | | 9,781 | | | | 119.0 | |
| Cash paid during the year for income taxes | | | 488 | | | | 1,011 | | | | 986 | | | | 12.0 | |
| (1) | Includes INR 2,117 million, INR 1,840 million and INR 1,851 million (US$22.5 million) paid towards hedging costs for Solar Green Bonds for the year ended March 31, 2021, 2022, and 2023, respectively. |
| | | | | | | | | | | | | | | | | | | | | | | | | | | | | | | | |
| | | Preferred
shares | | | Equity
shares | | | Additional paid
in capital | | | Accumulated
other
comprehensive
income | | | Accumulated
deficit | | | Total APGL
shareholders’
deficit | | | Non-
controlling
interests | | | Total
shareholders’
deficit | |
Balance as of March 31, 2015 | | | 4,689,942 | | | | 68 | | | | (1,642,112 | ) | | | 23,192 | | | | (2,828,302 | ) | | | (4,447,154 | ) | | | 4,575 | | | | (4,442,579 | ) |
Issuance of Series H CCPS | | | 3,695,407 | | | | — | | | | — | | | | — | | | | — | | | | — | | | | — | | | | — | |
Accretion of CCPS | | | 1,347,923 | | | | — | | | | (1,347,923 | ) | | | — | | | | — | | | | (1,347,923 | ) | | | — | | | | (1,347,923 | ) |
Net loss | | | — | | | | — | | | | — | | | | — | | | | (1,650,189 | ) | | | (1,650,189 | ) | | | (4,651 | ) | | | (1,654,840 | ) |
Other comprehensive loss | | | — | | | | — | | | | — | | | | 5,615 | | | | — | | | | 5,615 | | | | — | | | | 5,615 | |
Adjustment to share capital and reserves of predecessor on transfer of net assets via a common control transaction | | | — | | | | — | | | | (20,205 | ) | | | — | | | | — | | | | (20,205 | ) | | | — | | | | (20,205 | ) |
Accretion of redeemablenon-controlling interest | | | — | | | | — | | | | — | | | | — | | | | (29,825 | ) | | | (29,825 | ) | | | — | | | | (29,825 | ) |
Share based compensation | | | — | | | | — | | | | 51,732 | | | | — | | | | — | | | | 51,732 | | | | — | | | | 51,732 | |
Proceeds from issuance of equity shares | | | — | | | | — | | | | 342 | | | | — | | | | 160 | | | | 502 | | | | (254 | ) | | | 248 | |
| | | | | | | | | | | | | | | | | | | | | | | | | | | | | | | | |
Balance as of March 31, 2016 | | | 9,733,272 | | | | 68 | | | | (2,958,166 | ) | | | 28,807 | | | | (4,508,156 | ) | | | (7,437,447 | ) | | | (330 | ) | | | (7,437,777 | ) |
| | | | | | | | | | | | | | | | | | | | | | | | | | | | | | | | |
| | | | | | | | | | | | | | | | | | | | | | | | | | | | | | | | |
| | | Preferred
shares | | | Equity
shares | | | Additional paid
in capital | | | Accumulated
other
comprehensive
income | | | Accumulated
deficit | | | Total APGL
shareholders’
deficit | | | Non-
controlling
interests | | | Total
shareholders’
deficit | |
Balance as of March 31, 2016 | | | 9,733,272 | | | | 68 | | | | (2,958,166 | ) | | | 28,807 | | | | (4,508,156 | ) | | | (7,437,447 | ) | | | (330 | ) | | | (7,437,777 | ) |
Issuance of Series I CCPS | | | 1,658,166 | | | | — | | | | — | | | | — | | | | — | | | | — | | | | — | | | | — | |
Accretion of CCPS | | | 235,852 | | | | — | | | | (235,852 | ) | | | — | | | | — | | | | (235,852 | ) | | | — | | | | (235,852 | ) |
Net loss | | | — | | | | — | | | | — | | | | — | | | | (1,172,645 | ) | | | (1,172,645 | ) | | | (18,924 | ) | | | (1,191,569 | ) |
Other comprehensive loss | | | — | | | | — | | | | — | | | | 11,519 | | | | — | | | | 11,519 | | | | — | | | | 11,519 | |
Conversion of CCD and CCPS | | | (11,627,290 | ) | | | 738 | | | | 15,357,492 | | | | — | | | | — | | | | 15,358,230 | | | | — | | | | 15,358,230 | |
Sale of stake in subsidiary | | | — | | | | — | | | | 12,527 | | | | — | | | | 1,454 | | | | 13,981 | | | | 1,323,983 | | | | 1,337,964 | |
Accretion of redeemablenon-controlling interest | | | — | | | | — | | | | — | | | | — | | | | (44,073 | ) | | | (44,073 | ) | | | — | | | | (44,073 | ) |
Share based compensation | | | — | | | | — | | | | 13,774 | | | | — | | | | — | | | | 13,774 | | | | — | | | | 13,774 | |
Proceeds from issuance of equity shares | | | — | | | | 267 | | | | 6,714,376 | | | | — | | | | — | | | | 6,714,643 | | | | — | | | | 6,714,643 | |
| | | | | | | | | | | | | | | | | | | | | | | | | | | | | | | | |
Balance as of March 31, 2017 | | | — | | | | 1,073 | | | | 18,904,151 | | | | 40,326 | | | | (5,723,420 | ) | | | 13,222,130 | | | | 1,304,729 | | | | 14,526,859 | |
| | | | | | | | | | | | | | | | | | | | | | | | | | | | | | | | |
Balance as of March 31, 2017 (US$) (Note 2(d)) | | | — | | | | 17 | | | | 291,506 | | | | 622 | | | | (88,256 | ) | | | 203,889 | | | | 20,119 | | | | 224,008 | |
| | | | | | | | | | | | | | | | | | | | | | | | | | | | | | | | |
See accompanying notes.
AZURE POWER GLOBAL LIMITEDConsolidated Statements of Cash Flows
(INR and US$ amounts in thousands)
| | | | | | | | | | | | | | | | |
| | | Year ended March 31, | |
| | | 2015 | | | 2016 | | | 2017 | | | 2017 | |
| | | (INR) | | | (INR) | | | (INR) | | | US$ | |
Cash flow from operating activities | | | | | | | | | | | | | | | | |
Net loss | | | (1,088,590 | ) | | | (1,654,840 | ) | | | (1,191,569 | ) | | | (18,374 | ) |
Adjustments to reconcile net loss to net cash provided from/(used in) operating activities: | | | | | | | | | | | | | | | | |
Deferred income taxes | | | 61,179 | | | | 299,078 | | | | 383,250 | | | | 5,910 | |
Depreciation and amortization | | | 322,430 | | | | 687,781 | | | | 1,046,565 | | | | 16,138 | |
Change in fair value of CCD’s and Series E and G CCPS | | | 286,300 | | | | 671,826 | | | | 164,200 | | | | 2,532 | |
Loss on disposal of property plant and equipment | | | 5,416 | | | | 6,183 | | | | 4,340 | | | | 67 | |
Share based compensation | | | 7,428 | | | | 51,732 | | | | 13,774 | | | | 212 | |
Amortization of debt financing costs | | | 22,090 | | | | 52,762 | | | | 114,085 | | | | 1,759 | |
Realized gain on investments | | | (13,949 | ) | | | (45,375 | ) | | | (72,179 | ) | | | (1,113 | ) |
Deferred rent | | | 12,170 | | | | 19,914 | | | | 59,500 | | | | 918 | |
Allowance for doubtful accounts | | | 947 | | | | 34,478 | | | | — | | | | — | |
Realized and unrealized foreign exchange (gain)/loss, net | | | 299,628 | | | | 343,137 | | | | (109,128 | ) | | | (1,683 | ) |
| | | | |
Changes in operating assets and liabilities | | | | | | | | | | | | | | | | |
Accounts receivable | | | (72,677 | ) | | | (353,277 | ) | | | (581,850 | ) | | | (8,972 | ) |
Prepaid expenses and other current assets | | | (118,332 | ) | | | (119,213 | ) | | | (122,871 | ) | | | (1,895 | ) |
Other assets | | | (241,077 | ) | | | (325,400 | ) | | | (344,562 | ) | | | (5,313 | ) |
Accounts payable | | | (102,863 | ) | | | 126,754 | | | | 18,902 | | | | 291 | |
Interest payable | | | 23,407 | | | | 70,243 | | | | 63,187 | | | | 974 | |
Deferred revenue | | | 85,299 | | | | 952,641 | | | | 193,285 | | | | 2,980 | |
Other liabilities | | | 334,514 | | | | (84,556 | ) | | | 333,881 | | | | 5,148 | |
| | | | | | | | | | | | | | | | |
Net cash flows provided from/ (used) in operating activities | | | (176,680 | ) | | | 733,868 | | | | (27,190 | ) | | | (421 | ) |
| | | | | | | | | | | | | | | | |
Cash flow used in investing activities | | | | | | | | | | | | | | | | |
Purchase of property plant and equipment | | | (8,426,008 | ) | | | (9,096,996 | ) | | | (15,421,498 | ) | | | (237,803 | ) |
Purchase of software | | | (14,408 | ) | | | (7,020 | ) | | | (11,151 | ) | | | (172 | ) |
Purchase of available for sale securities | | | (913,991 | ) | | | (5,025,639 | ) | | | (12,937,425 | ) | | | (199,498 | ) |
Purchase of held to maturity securities | | | — | | | | (6,859 | ) | | | — | | | | — | |
Sale of available for sale securities | | | 927,940 | | | | 5,071,014 | | | | 9,744,735 | | | | 150,266 | |
Investment in subsidiary | | | — | | | | (20,148 | ) | | | — | | | | — | |
Proceeds from sale ofnon-controlling interest in subsidiary | | | — | | | | 316,929 | | | | — | | | | — | |
Net increase in restricted cash | | | (624,527 | ) | | | (390,327 | ) | | | (3,318,923 | ) | | | (51,178 | ) |
| | | | | | | | | | | | | | | | |
Net cash flows used in investing activities | | | (9,050,994 | ) | | | (9,159,046 | ) | | | (21,944,262 | ) | | | (338,385 | ) |
| | | | | | | | | | | | | | | | |
Cash from financing activities | | | | | | | | | | | | | | | | |
Proceeds from issuance of Series H CCPS | | | 1,549,010 | | | | 3,695,407 | | | | — | | | | — | |
Proceeds from issuance of equity shares | | | 68 | | | | 248 | | | | — | | | | — | |
Proceeds from issuance of equity shares in IPO | | | — | | | | — | | | | 7,657,467 | | | | 118,080 | |
Repayments of term and other loan | | | (452,920 | ) | | | (3,490,810 | ) | | | (6,373,210 | ) | | | (98,276 | ) |
Proceeds from term and other loan | | | 8,398,976 | | | | 8,727,875 | | | | 20,993,944 | | | | 323,730 | |
IPO cost incurred | | | (3,045 | ) | | | (9,007 | ) | | | (942,824 | ) | | | (14,539 | ) |
Proceeds from issuance of equity shares of subsidiary | | | — | | | | — | | | | 1,337,964 | | | | 20,632 | |
Proceeds from Series I | | | — | | | | — | | | | 1,658,166 | | | | 25,569 | |
Proceeds from issuance of Series G CCPS | | | — | | | | 541,946 | | | | — | | | | — | |
Proceeds from issuance of CCDS | | | 180,000 | | | | — | | | | — | | | | — | |
| | | | | | | | | | | | | | | | |
Net cash flows from financing activities | | | 9,672,089 | | | | 9,465,659 | | | | 24,331,507 | | | | 375,196 | |
Effect of exchange rate changes on cash and cash equivalents | | | 788 | | | | 5,615 | | | | 10,229 | | | | 160 | |
Net increase in cash and cash equivalents | | | 445,223 | | | | 1,046,096 | | | | 2,370,284 | | | | 36,551 | |
Cash and cash equivalents at the beginning of the year | | | 1,599,067 | | | | 2,044,290 | | | | 3,090,386 | | | | 47,654 | |
| | | | | | | | | | | | | | | | |
Cash and cash equivalents at the end of the year | | | 2,044,290 | | | | 3,090,386 | | | | 5,460,670 | | | | 84,205 | |
| | | | | | | | | | | | | | | | |
Supplemental disclosure of cash flow information | | | | | | | | | | | | | | | | |
Cash paid during the year for interest | | | 844,586 | | | | 1,613,495 | | | | 2,632,667 | | | | 40,596 | |
Cash paid during the year for income taxes | | | 230,383 | | | | 100,857 | | | | 546,578 | | | | 8,428 | |
Non-cash conversion of CCPS and CCD’s | | | — | | | | — | | | | 15,358,230 | | | | 236,827 | |
AZURE POWER GLOBAL LIMITED
Notes to Consolidated Financial Statementsconsolidated financial statements
(INR and US$ amounts in thousands except share and per share data)
1. Organization
Azure Power Global Limited (“APGL” or “Azure”) organized under the laws of Mauritius was incorporated on January 30, 2015. APGL’s subsidiaries are organized under the laws of India (except for one U.S. subsidiary and two U.S. subsidiaries)subsidiaries in Mauritius) and are engaged in the development, construction, ownership, operation, maintenance and management of solar power plants and generation of solarrenewable energy assets based on long-term contracts (power purchase agreements(Power Purchase Agreements or “PPA”) with Indian government entitiesGovernment energy distribution companies as well as other Indian non-governmental energy distribution companies and Indian commercial customers. APGL and its subsidiaries are hereinafter referred to as the “Company”.
Formation and initial public offering (‘IPO’)
On October 17, 2016, During the previous year the Company completed its Initial Public Offering (IPO) and a concurrent private placement of its equity shares pursuant to a Registration Statement on FormF-1, as amended, which became effective on October 11, 2016. An aggregate of 2,242,424 shares were sold by APGL in the offering along with 1,166,667 shares sold by the selling shareholders at a price of US$18.00 per share. Further, 4,166,667 shares were subscribed by CDPQ Infrastructures Asia Pte Ltd., as part of a concurrent private placement at the same price. The IPO and the concurrent private placement resulted in aggregate proceeds net of underwriters fees and other directly related expenses, of US$ 101.0 million.
Prior to the formation of APGL and the reorganization described below, the Company’s operations were entirely conducted through Azure Power India Private Limited (“AZI”) and its subsidiaries. AZI is a company organized under the laws of India. APGL was formed to enable the consummation of the transactions described below and the IPO.
In relation to a shareholders agreement on July 22, 2015 between APGL, thenon-founder investors in AZI and the founders (the “APGL SHA”), APGL purchased from thenon-founder investors in AZI the equity shares and convertible securities in the form of Compulsorily Convertible Debentures (“CCDs”) and Compulsorily Convertible Preferred Shares (“CCPS”) held by them in AZI for an equivalent number of equity shares, CCDs and CCPS in APGL on substantially similar terms as those formerly held in AZI (the “Reorganization”).
Prior to the Reorganization, thenon-founder investors had an 82.6% ownership interest, on an as converted basis (excluding the CCDS and CCPS which convert into a variable and the indeterminable number of equity shares), in AZI with the remaining 17.4% held by the AZI founders. Subsequent to the Reorganization, APGL held an 82.6% interest in AZI, on an as converted basis, with the remaining 17.4% held by the AZI founders. Pursuant to the IPO of APGL in October 2016, the CCD’s and CCPS held by APGL in AZI were converted into equity shares. APGL holds 96.3% of AZI as on March 31, 2017, with the balance being held by AZI founders.
On July 22, 2015, APGL, AZI and the founders entered into another shareholder’s agreement (the “AZI SHA”), which provides that it is the intention of all parties to the AZI SHA to eventually make AZI a wholly owned subsidiary of APGL. As of March 31, 2017, the Company did not own 102,497 equity shares of AZI, representing 3.7% of its equity shares. These equity shares are owned by the AZI founders. Pursuant to the terms of the AZI SHA and theLock-in Agreement, the AZI founders have surrendered, or transferred to APGL, their legal and economic rights associated with these equity shares and being a minority shareholder. In connection therewith and also pursuant to the AZI SHA, the AZI founders and APGL have entered into an option whereby APGL may, at any time and without time limit, cause the AZI founders to transfer their AZI equity shares to APGL for consideration equal to the minimum applicable price as per Indian law, with any proceeds above the face value of such shares (INR 10 or US$0.15 per share) to be distributed among the AZI founders andnon-founder investors (the former CCPS holders) pro rata based on theiras-converted shareholding in APGL. The option does not expire for a period of two years and no consideration was given for this option. In addition, the AZI SHA prohibits a transfer of equity shares held by the founders without the consent of APGL.
AZURE POWER GLOBAL LIMITED
Notes to Consolidated Financial Statements
(INR and US$ amounts in thousands except share and per share data)
Given that the AZI SHA, the option and theLock-in Agreement were purposely designed so that the equity shares held by the AZI founders will never have governing or economic substance, no value, income or loss has been attributed to suchnon-controlling interest.
Mr. Inderpreet Wadhwa, IW Green Inc. and thenon-founder investors entered into a SponsorLock-in Agreement(“Lock-in Agreement”) whereby IW Green Inc., agreed to not disposesale agreement for the disposal of the number of such number of shares of APGL held by it as would represent an equivalent percentage of the shareholding of founders’ shareholding in AZI. This obligation would continue until expiry or the occurrence of a termination event, as defined. In addition, pursuant to theLock-in Agreement, the amount for which the founders sell their shares in AZI (including any sale to APGL) above the face value of such shares (INR 10, or US$0.15, per equity share) plus taxes and expenses incurred by the founders on the transfer of such shares is to be distributed among the founders and the non founders pro rata based on their as converted shareholding in APGL that existed at the date of the agreement. Thenon-founder investors and founders have extended the lock in period, including the period for sharing the excess returns till to a date two years from the completion of APGL’s IPO.its rooftop business. See also Note 23.
The APGL SHA, AZI SHA and their combined effect, including the call option and theLock-In Agreement, replicated the founders and thenon-founder investor’s interests in AZI in APGL on a substantially cash neutral basis and without any gain/loss by one party at the expense of another party. To reflect the economic substance of the APGL SHA, the AZI SHA and the Reorganization, the Company has prepared the consolidated financial statements as though it had been combined with AZI since the earliest period presented, using the ‘pooling of interests method’ of accounting with the assets and liabilities of the entities recorded at their historical carrying values. Similarly, no value has been attributed to thenon-controlling interest still held by the AZI founders in AZI.
2. Summary of significant accounting policies
(a) Basis of presentation
The accompanying consolidated financial statements have been prepared in accordance with accounting principles generally accepted in the United States (“U.S. GAAP”) and are presented in Indian rupees (“INR”), unless otherwise stated. The consolidated financial statements include the accounts of APGL and companies which are directly or indirectly controlled by APGL. All intercompany accounts and transactions have been eliminated upon consolidation. Certain balances relating to prior years have been reclassified, wherever required, to conform to the current year presentation.
All share and per share amounts presented in the consolidated financial statements have been adjusted to reflect the16-for-1 stock split of the Company’s equity shares that was effective on October 6, 2016.
(b) Use of estimates
The preparation of consolidated financial statements in conformity with U.S. GAAP requires management to make estimates and assumptions that affect the reported amounts of assets, liabilities, revenues, costs, expenses and comprehensive lossloss/ gain that are reported and disclosed in the consolidated financial statements and accompanying notes. These estimates are based on management’s best knowledge of current events, historical experience, actions the Company may undertake in the future and on various other assumptions that are believed to be prudent and reasonable under the circumstances. Significant estimates and assumptions are used for, but not limited to impairment of and useful lives of property, plant and equipment, determination of asset retirement obligations, valuation of derivative instruments, hedge accounting, lease liabilities, right to use asset, allowances for doubtful accounts based on payment history, credit rating, valuation of share basedshare-based compensation, income taxes, including
AZURE POWER GLOBAL LIMITED
Notes to Consolidated Financial Statements
(INR and US$ amounts in thousands except share and per share data)
related valuation allowance, energy kilowatts expected to be generated over the entire termuseful life of certain PPAsthe solar power plant, estimated transaction price, including variable consideration, of the Company’s revenue contracts, impairment of other assets, impairment of net assets classified as held for sale and other contingencies and commitments. Although these estimates are based upon management’s best knowledge of current events and actions, actual results could differ from these estimates, and such differences may be material to the consolidated financial statements.
(c) | Foreign currency translation and transactions |
Principles of Consolidation
The accompanying consolidated financial statements include the accounts of APGL, its subsidiaries, and variable interest entities (“VIE”), where the Company has determined it is the primary beneficiary and are prepared in conformity with accounting principles generally accepted in the United States of America (“U.S. GAAP”). The Company uses the equity method to account for its investments in entities where it exercises significant influence over operating and financial policies but does not retain control under either the voting interest model (generally 20% to 50% ownership interest) or the variable interest model. The Company has eliminated all intercompany accounts and transactions.
(c) Foreign currency translation and transactions
The functional currency of APGL is the United States Dollar (“US$”) and reporting currency is Indian rupees (“INR”). The Company’s subsidiaries with operations in India use INR as the functional currency and the subsidiaries in the United States and Mauritius use their respective currenciesUS$ as theirthe functional currencies.currency. The financial statements of APGL and its subsidiaries, other than subsidiaries with a functional currency of INR, are translated into INR using the exchange rate as of the balance sheet date for assets and liabilities, historical exchange rates for equity transactions and average exchange rate for the year for income and expense items. Translation gains and losses are recorded in accumulated other comprehensive income or lossexpenses as a component of shareholders’ equity.
In the financial statements of the Company’s subsidiaries, transactions
Transactions in currencies other than the functional currency are measured and recorded in the functional currency using the exchange rate in effect at the date of the transaction. At the balance sheet date, monetary assets and liabilities that are denominated in currencies other than the functional currency are translated into the functional currency using the exchange rate at the balance sheet date. All gains and losses arising from foreign currency transactions are recorded in the determination of net income or lossloss/(gain) during the year in which they occur.
Revenue, expense and cash flow items are translated using the average exchange rates for the respective year.period. The resulting gains and losses from such translationtranslations are excluded from the determination of earnings and are recognized instead in accumulated other comprehensive loss,loss/ (gain), which is a separate component of shareholders’ equity/(deficit).equity.
Realized and unrealized foreign currency transaction gains and losses, other than those hedged by the Company, arising from exchange rate fluctuations on balances denominated in currencies other than the functional currency of an entity, such as those resulting from the Company’s US dollar (“US$”) denominated borrowings arein other than functional currency is included in ‘LossLoss/(gain) on foreign currency exchange, net’net in the consolidated statements of operations.
(d) | Convenience translation |
(d) Convenience translation
Translation of balances in the consolidated balance sheets and the consolidated statements of operations, comprehensive loss, shareholders’ equity/(deficit)equity and cash flows from INR into US$, as of and for the year ended March 31, 20172023 are solely for the convenience of the readers and were calculated at the rate of US$1.00 = INR 64.85,82.19 , the noon buying rate in New York City for cable transfers in non U.S. currencies, as certified for customs purposes by the Federal Reserve Bank of New York on March 31, 2017.2023 . No representation is made that the INR amounts could have been, or could be, converted, realized or settled into US$ at that rate on March 31, 2017,2023, or at any other rate.
(e) | Cash and cash equivalents |
(e) Cash and cash equivalents
Cash and cash equivalents include cash on hand, demand deposits with banks, term deposits and all other highly liquid investments purchased with an original maturity of three months or less at the date of acquisition and that are readily convertible to cash. The Company has classified term deposits totalingtotalling INR 291,95110,482 million and INR 846,39411,850 million (US$ 13,052) at144.2 million) as of March 31, 20162022 and 2017,2023, respectively, as cash and cash equivalents, because the Company has the ability to redeem these deposits at any time subject to an immaterial interest rate forfeiture. All term deposits are readily convertible into known amount of cash with no more than one day’sday notice.
AZURE POWER GLOBAL LIMITED
Notes to Consolidated Financial Statements
(INR and US$ amounts in thousands except share and per share data)
(f) Restricted cash
Restricted cash consists of cash balances restricted as to withdrawal or usage and relates to cash used to collateralize bank letters of credit supporting the purchase of equipment for solar power plants, bank guarantees issued in relation to the construction of the solar power plants within the timelines stipulated in PPAs and for certain debt service reserves required under the Company’s loan agreements. Restricted cash is classified into current andnon-current portions based on the term of the deposit and the expiration date of the underlying restriction.
The following table presents the components of cash and cash equivalents and restricted cash included in the consolidated balance sheets that sums to the total of such amounts in the Consolidated Statements of Cash Flows:
| | | March 31, | |
| | | 2021 | | | 2022 | | | 2023 | | | 2023 | |
| | | (INR) | | | (INR) | | | (INR) | | | (US$) | |
| | | (In million) | |
| Current Assets | | | | | | | | | | | | |
| Cash and cash equivalents | | | 11,107 | | | | 18,796 | | | | 12,724 | | | | 154.7 | |
| Restricted cash | | | 4,881 | | | | 3,784 | | | | 7,764 | | | | 94.5 | |
| Non-Current Assets | | | | | | | | | | | | | | | | |
| Restricted cash | | | 170 | | | | 726 | | | | 479 | | | | 5.8 | |
| Cash and cash equivalents and restricted cash | | | 16,158 | | | | 23,306 | | | | 20,967 | | | | 255.0 | |
(g) Investments
The Company determines the appropriate classification of investment securities at the time of purchase andre-evaluates such designation at each balance sheet date. The investment securities held by the Company during the periods presented in the accompanying consolidated financial statements are classified as available for saleavailable-for-sale (short-term investments), consisting of liquid mutual funds units andheld-to-maturity investments (long-term investments), consisting of notesNotes of the Bank of Mauritius.
The Company accounts for its investments in accordance with Financial Accounting Standards Board (“FASB”) ASC Topic 320, Accounting for Certain Investments in Debt and Equity Securities.Securities. These investments are considered as available for saleavailable-for-sale and held to maturity.held-to-maturity. Investments classified as available for sale are recorded at fair value, with the unrealized gains or losses, net of tax, reported as a component of accumulated other comprehensive income or lossexpenses in the consolidated statement of shareholders’ equity/(deficit). As of March 31, 2015, and 2016, the Company did not have any short-term available for sale securities and as of March 31, 2017, the Company had INR 3,296,797 (US$ 50,837) as short term investments available for sale securities and unrealized gain of INR 31,774 (US$ 490) on such investments. Realized gains from the sale of available for sale securities during the years ended March 31, 2015, 2016 and 2017 were INR 13,949, INR 45,375 and INR 72,334 (US$ 1,115), respectively and proceeds from the sale of available for sale securities during the year ended March 31, 2015, 2016 and 2017 were INR 927,940, INR 5,071,014 and INR 9,744,735 (US$ 150,266), respectively.equity.
Securities that the Company has positive intent and ability to hold tilluntil maturity are classified asheld-to-maturity securities and stated at amortized cost. As of March 31, 2016,2022, and March 31, 2017,2023, amortized cost of held to maturityheld-to-maturity investments werewas INR 6,7856 million and INR 6,6317 million (US$ 102)0.1 million), respectively. The maturity date of the investment is February 3, 2020 (one to five years).
Realized gains and losses and a decline in value judged to be other than temporary on these investments are included in the consolidated statements of operations. The cost of securities sold or disposed is determined on the First in First Out (“FIFO”) method.
(h) Accounts receivable, net
The Company adopted “ASC Topic 326” Financial Instruments — Credit Losses, effective April 1, 2020 using the modified retrospective transition approach. The new guidance requires the measurement and recognition of expected credit losses (ECL) for financial assets held at amortized cost and replaces the existing incurred loss
impairment model with an expected loss model using the forward-looking information to calculate credit loss estimates. The new model requires consideration of a broader range of relevant information, such as off take ratings historical loss experience, current economic conditions, and reasonable and supportable forecasts. The impact of adoption of this guidance did not have a material effect on the Company’s financial statements.
Credit Risk
Credit risk is the risk that counterparty will not meet its obligations under a financial instrument which consists principally of accounts receivables, cash and cash equivalents and restricted cash, leading to a financial loss. Customer credit risk is managed using the Company’s established policy, procedures and control relating to customer credit risk management. Outstanding accounts receivables are regularly monitored.
The Company’s accounts receivables are generated by selling energy to customers and are reported net of any allowance for uncollectible accounts. The allowance for doubtful accountscredit losses is based on various factors, including the length of time receivables are past due, significantone-time events, the financial health of customers and historical experience. The allowance for doubtful accountscredit losses at March 31, 20162022 and 2017March 31, 2023 was INR 44,478285 million and INR 44,478836 million (US$ 686). Accounts receivable serve as collateral for borrowings under the working capital facility, described in Note 5.
AZURE POWER GLOBAL LIMITED
Notes to Consolidated Financial Statements
(INR and US$ amounts in thousands except share and per share data)10.2 million), respectively.
(i) Property, plant and equipment | Deferred IPO cost |
The Company incurred underwriter fees, legal expenses, printing costs and other costs directly relating to its IPO of INR 966,947 (US$ 14,911). The Company accounted for such costs under ASC340-10-599-1 (SAB Topic 5A) “Expenses of the Offering” as incremental costs directly attributable to an offering of equity shares. These costs were applied against the proceeds from the IPO.
(j) | Property, plant and equipment |
Property, plant and equipment represents the costs of completed and operational solar power plants, as well as the cost of furniture and fixtures, vehicles, office and computer equipment, leasehold improvements, freehold land and construction in progress. Construction in progress represents the accumulated cost of solar power plants that have not been placed into service at the date of the balance sheet. Construction in progress includes the cost of solar modules for which the Company has taken legal title, civil engineering, electrical and other related costs incurred during the construction of a solar power plant. Construction in progress is reclassified to property, plant and equipment when the project begins its commercial operations.
Property, plant and equipment are stated at cost, less accumulated depreciation and accumulated impairment losses. Depreciation is calculated using the straight-line method over the assets’ estimated useful lives as follows:
| | | | |
Plant and machinery (solar power plants) | | 25-35 years |
25 yearsBuilding | | 25-35 years |
Furniture and fixtures | | | 5 years | |
Vehicles | | | 5 years | |
Office equipment | | | 51-5 years | |
Computers | | | 3 years | |
Leasehold improvements related to office facilities are depreciated over the shorter of the lease period or the estimated useful life of the improvement. Lease hold improvements on the solar power plant sites are depreciated over the shorter of the lease term or the remaining period of the PPAs undertaken with the respective customer. Freehold land is not depreciated. Construction in progress is not depreciated until it is ready to be put to use.used.
Improvements to property, plant and equipment deemed to extend the useful economic life of an asset are capitalized. Maintenance and repairs that do not improve efficiency or extend the estimated economic life of an asset are expensed as incurred. Additional capacity, if any, added to property plant and equipment is depreciated over the remaining estimated useful live.
Capitalized interest
Interest incurred on funds borrowed to finance construction of solar power plants is capitalized until the plant is ready for its intended use.
The amount of interest capitalized during the years ended March 31, 2015, 20162021, 2022 and 2017 was2023 were INR 155,012,333 million, INR 219,166595 million and INR 256,802344 million (US$ 3,960)4.2 million), respectively.
(k) | Accounting for impairment of long-lived assets |
(j) Accounting for impairment of long-lived assets
The Company periodically evaluates whether events have occurred that would require revision of the remaining useful life of property, plant and equipment and improvements, or render their carrying value not recoverable. If such circumstances arise, the Company uses an estimate of the undiscounted value of expected
AZURE POWER GLOBAL LIMITED
Notes to Consolidated Financial Statements
(INR and US$ amounts in thousands except share and per share data)
future operating cash flows to determine whether the long-lived assets are impaired. If the aggregate undiscounted cash flows are less than the carrying amount of the assets, the resulting impairment charge to be recorded is calculated based on the excess of the carrying value of the assets over the fair value of such assets, with the fair value determined based on an estimate of discounted future cash flows, appraisals, or other valuation techniques. ThereOther than the planned disposal of the Company’s rooftop business, impairment of assets related to manufacturing linked tender and impairment of one of the project, there were no impairment charges related to remaining long-lived assets recognized during the years ended March 31, 20162022, and 2017.2023 respectively. See also note 23.
(l) | Leases and land use rights |
Certain(k) Leases and land use rights
In February 2016, the FASB issued ASU 2016-02, Leases (“ASC Topic 842”), to increase transparency and comparability among organizations by recognizing a right-of-use asset and a lease liability on the balance sheet for all leases with terms longer than 12 months and disclosing key information about leasing transactions. In July 2018, the FASB issued ASU 2018-11, Leases (Topic 842) – Targeted Improvements, which provided an optional transition method to apply the new lease requirements through a cumulative-effect adjustment in the period of adoption.
The Company adopted the guidance effective April 1, 2019 using the modified retrospective approach and elected certain practical expedients permitted under the transition guidance.
The majority of the Company’s leases relate to leasehold land on which the solar power plants are constructed on and forleases related to office facilities. Leases are reviewed for capital orThe leasehold land related to solar power plants has a lease term ranging between 2 to 35 year which is further extendable on mutual agreement by both lessor and lessee. Where applicable, the company has the consent from the lessors to extend the leases up to 35 years. These leases have rent escalation ranging between 5% to 10%, over the tenure of the lease. All existing leases on the date of adoption of ASC Topic 842, were classified as operating classificationleases as they were concluded at their inception under theprevious guidance of ASC Topic 840,Leases. as permitted by the practical expedient package elected. As the implicit rate in the lease contract is not readily determinable, the company has used its average incremental rate of borrowing of 10% for the purposes of the determination of discount rate. The expenseweighted average remaining lease term for operating leases is 29 years.
On Adoption of ASC 842, all the lease arrangements entered prior to adoption continued to be classified as operating leases is recorded as rent expense on a straight-line basis, over the lease term, beginning with the date theleases. The Company has access tomade an assessment for lease arrangements entered during the property.
Land use rights represent lease prepayments to the lessor. Land use rights are carried at cost less accumulated amortization. Amortization is provided towrite-off the cost of these prepayments on a straight-line basis over the period of the lease or the PPA, whichever is shorter.
year and classified them as operating leases. The Company did not have any capital leasesfinance lease during any of the periods presented in the accompanying consolidated financial statements.
The Company is a lessee in several non-cancellable operating leases, primarily for construction of solar power plants and for office facilities.
The Company determines if an arrangement is or contains a lease at contract inception. The Company recognizes a right-of-use (“ROU”) asset and a lease liability at the lease commencement date. For operating leases, the lease liability is initially and subsequently measured at the present value of the unpaid lease payments at the lease commencement date.
Key estimates and judgments include how the Company determines (1) the discount rate it uses to discount the unpaid lease payments to present value, (2) lease term and (3) lease payments.
ASC Topic 842 requires a lessee to discount its unpaid lease payments using the interest rate implicit in the lease or, if that rate cannot be readily determined, its incremental borrowing rate. Generally, the Company cannot determine the interest rate implicit in the lease because it does not have access to the lessor’s estimated residual value or the amount of the lessor’s deferred initial direct costs. Therefore, the Company generally uses its incremental borrowing rate as the discount rate for the lease. The Company’s incremental borrowing rate for a lease is the rate of interest it would have to pay on a collateralized basis to borrow an amount equal to the lease payments under similar terms.
The lease term for all of the Company’s leases includes the non-cancellable period of the lease plus any additional periods covered by either a Company option to extend (or not to terminate) the lease that the Company is reasonably certain to exercise, or an option to extend (or not to terminate) the lease controlled by the lessor.
Lease payments included in the measurement of the lease liability comprise of the following:
(m) | Asset retirement obligations (ARO)■ | Fixed payments, including in-substance fixed payments, owed over the lease term (which includes termination penalties the Company would owe if the lease term assumes Company exercise of a termination option); |
| | |
| ■ | Variable lease payments, if any, that depend on an index or rate, initially measured using the index or rate at the lease commencement date; |
| | |
| ■ | Amounts expected to be payable under a Company-provided residual value guarantee; and |
| | |
| ■ | The exercise price of a Company option to purchase the underlying asset if the Company is reasonably certain to exercise the option. |
The ROU asset is initially measured at cost, which comprises the initial amount of the lease liability adjusted for lease payments made at or before the lease commencement date, plus any initial direct costs incurred less any lease incentives received.
For operating leases, the ROU asset is subsequently measured throughout the lease term at the carrying amount of the lease liability, plus initial direct costs, plus (minus) any prepaid (accrued) lease payments, less the unamortized balance of lease incentives received. Lease expense for lease payments is recognized on a straight-line basis over the lease term.
The Company has recognized and reported the Right of Use asset, on consolidated balance sheet by INR 4,346 million (US$52.9 million) as well as Lease Liabilities by INR 3,700 million (US$45.1 million) as at March 31, 2023 and INR 4,465 million in Right of Use asset as well as Lease Liabilities by INR 3,834 million as at March 31, 2022 respectively. During the year ended March 31, 2022 and 2023, the Company recorded lease cost of INR 439 million and INR 436 million (US$5.3 million) respectively. See Note 18 to the consolidated financial statements.
ROU assets for operating leases are periodically reduced by impairment losses. The Company uses the long-lived assets impairment guidance in ASC Subtopic 360-10, Property, Plant, and Equipment – Overall, to determine whether a ROU asset is impaired, and if so, the amount of the impairment loss to be recognized. See Note 2(j).
The Company monitors for events or changes in circumstances that require a reassessment of one of its leases. When a reassessment results in the remeasurement of a lease liability, a corresponding adjustment is made to the carrying amount of the corresponding ROU asset unless doing so would reduce the carrying amount of the ROU asset to an amount less than zero. In that case, the amount of the adjustment that would result in a negative ROU asset balance is recorded in the consolidated statements of operations.
Operating lease ROU assets are presented as operating lease right -of -use assets on the consolidated balance sheet. The current portion of operating lease liabilities is included in other current liabilities and the long-term portion is presented separately as operating lease liabilities on the consolidated balance sheet.
The Company has elected not to recognize ROU assets and lease liabilities for short-term leases of warehouses, office, machinery etc. that have a lease term of 12 months or less. The Company recognizes the lease payments associated with its short-term leases as an expense on a straight-line basis over the lease term.
The Company’s corporate office leases generally also include non-lease maintenance services (i.e., common area maintenance). The Company allocates the consideration in the contract to the lease and non-lease maintenance component based on each component’s relative standalone price. The Company determines stand-alone prices for the lease components based on the prices for which other lessors lease similar assets on a stand-alone basis. The Company determines stand-alone prices for the non-lease components (i.e., maintenance services) based on the prices that several suppliers charge for maintenance services for similar assets on a stand-alone basis.
(l) Asset retirement obligations (ARO)
Upon the expiration of a PPA or, if later, the expiration of theland lease agreementarrangement for solar power plants located on leasehold land, the Company is required to remove the solar power plant and restore the land. The Company records the fair value of the liability for the legal obligation to retire the asset in the period in which the obligation is incurred, which is generally when the asset is constructed. When a new liability is recognized, the Company capitalizes it by
increasing the carrying amount of the related long-lived asset, which resultingresults in an ARO asset isbeing depreciated over the remaining useful life of the solar power plant. The liability is accreted and expensed to its present expected future value each period based on a credit adjusted risk free interest rate. Upon settlement of the obligation, the Company eliminates the liability and based on the actual cost to retire, may incur a gain or loss.
The Company’s asset retirement obligations were INR 94,301902 million and INR 242,9801,112 million (US$ 3,747)13.5 million) as of March 31, 20162022 and 2017,2023, respectively. The accretion expense incurred during the years ended March 31, 2015, 20162021, 2022 and 20172023 was INR 2,592,42 million, INR 6,10959 million and INR 9,32983 million (US$ 144)1.0 million), respectively. ThereThe depreciation expense incurred during the years ended March 31, 2021, 2022 and 2023 was no settlementINR 23 million, INR 14 million and INR 21 million (US$0.3 million), respectively.
During the current year, the carrying amount of prior liabilities or revisionsthe ARO liability is increased by INR 210 million (US$2.6 million) primarily due to commissioning of new projects during the Company’s estimated cash flowsyear and accretion expense during the year.
The movement in liability during the current year as of March 31, 2017.2023 and comparative year is as below:
| | | | | | | | 2022 (INR) | | 2023 (INR) | | 2023 (US$) | |
| | | 2016
(INR) | | | 2017
(INR) | | | 2017
(US$) | | | (In million) | |
Beginning balance | | | 70,942 | | | | 94,301 | | | | 1,454 | | | | 811 | | | | 902 | | | | 11.0 | |
Addition during the year | | | 17,250 | | | | 139,350 | | | | 2,149 | | | | 157 | | | | 127 | | | | 1.5 | |
| Impact of change in estimate | | | | (125 | ) | | | — | | | | — | |
Liabilities settled during the year | | | — | | | | — | | | | — | | | | — | | | | — | | | | — | |
Accretion expense during the year | | | 6,109 | | | | 9,329 | | | | 144 | | | | 59 | | | | 83 | | | | 1.0 | |
Ending balance | | | 94,301 | | | | 242,980 | | | | 3,747 | | | | 902 | | | | 1,112 | | | | 13.5 | |
AZURE POWER GLOBAL LIMITED
Notes to Consolidated Financial Statements
(INR and US$ amounts in thousands except share and per share data)(m) Software
The Company capitalizes certain internal software development cost under the provision of ASC Topic350-40Internal-Use Software. As of March 31, 2017,2023, the amount capitalized as software includes the cost of software licenses, as well as related implementation costs, which primarily relate to third party consulting fees. Such license and implementation costs are capitalized and amortized over their estimated useful lives of three years using the straight-line method. On an ongoing basis, the Company assesses the recoverability of its capitalized software intangible assets. Capitalized software costs determined to be unrecoverable are expensed in the period in which the determination is made. As of March 31, 2017,2023, all capitalized software wasis considered fully recoverable.
(n) Debt financing costs
Financing costs incurred in connection with obtaining construction and term financing loans are deferred and amortized over the term of the respective loan using the effective interest rate method. Amortization of debt financing costs is capitalized during construction and recorded as interest expense in the consolidated statements of operations, following commencement of commercial operations of the respective solar power plants. In case of refinancing of existing loans, the Company records the unamortized portion of debt financing costs as an expense and the cost of debt refinancing is deferred and amortized over the remaining term of the refinanced loan.
In April 2015, the FASB issued Accounting Standards UpdateNo. 2015-03 — “Interest — Imputation of Interest (ASC Subtopic835-30) — Simplifying the Presentation of Debt Issuance Cost” which requires the discount or premium and debt issuance costs to be reported in the balance sheet as a direct deduction from the face amount of debt liability. The amendments in this update were effective for financial statements issued for fiscal years beginning after December 15, 2015. The Company has retrospectively adopted the change and presented the debt financing costs as a deduction from the current andnon-current borrowings. The retrospective adoption of this guidance had no impact to the consolidated statements of operations and comprehensive loss or consolidated statements of cash flows. Certain amounts in the prior year’s consolidated balance sheets have been reclassified to conform to the current year presentation. This has resulted in the reclassification of current portion of debt financing cost totaling INR 51,935 at March 31, 2016.
Carrying value of debt financing costs as of March 31, 2016 and March 31, 2017 were INR 438,172 and INR 909,131 (US$14,019) respectively. Amortization of debt financing costs for the fiscal yearyears ended March 31, 2015, 20162021, 2022 and 20172023 was INR 22,090,369 million, INR 52,7621,107 million and INR 114,085336 million (US$1,759)4.1 million), including debt financing costs written off related to the debt refinancing amounting to INR 30 million, INR 739 million and INR Nil, respectively. See Note 12.
Current income taxes are providedThe carrying value of debt financing costs as on March 31, 2022 and 2023 was INR 1,189 million and INR 1,010 million (US$12.3 million). See Note 12.
Further, the Company had debt financing costs of INR 141 million and INR 37 million (US$0.5 million) under other current assets, as on March 31, 2022 and 2023, respectively for in accordance with the laws of the relevant taxing authority. facilities not yet drawn. See Note 6.
(o) Income taxes
Income taxes are recorded under the asset and liability method, as prescribed under ASC Topic 740 Income Taxes,, whereby deferred tax assets and liabilities are recognized for the future tax consequences attributable to differences between the financial statement carrying amounts of existing assets and liabilities and their respective tax base. Deferred tax assets and liabilities are measured using enacted tax rates expected to apply to taxable income in the years in which those temporary differences are expected to be recovered or settled.
The Company establishes valuation allowances against its deferred tax assets when it is more likely than not that all or a portion of a deferred tax asset will not be realized.
AZURE POWER GLOBAL LIMITED
Notes to Consolidated Financial Statements
(INR and US$ amounts in thousands except share and per share data)
The computation of tax liabilities involves dealing with uncertainties in the application of complex tax regulations. The Company applies atwo-step approach to recognize and measure uncertainty in income taxes in accordance with FASB Interpretation No. 48 (“FIN 48”), Accounting for Uncertainty in Income Taxes — an interpretation of ASC Topic 740.740. The first step is to evaluate the tax position for recognition by determining if the weight of available evidence indicates that it is more likely than not that the position will be sustained on audit, including resolution of related appeals or litigation processes, if any. The second step is to measure the tax benefit as the largest amount which is more than 50% likely of being realized upon ultimate settlement. Throughsettlement through March 31, 2017,2023, the Company does not have any unrecognized tax benefits, nor has it recognized any interest or penalties.
In November 2015,
During the FASB issued ASUNo. 2015-17, “Income Taxes (Topic 740): Balance Sheet Classificationyear ended 2019-20, the Taxation Laws (Amendment) Act, 2019 brought key changes to corporate tax rates in the Income Tax Act, 1961, which reduced the tax rate for certain subsidiaries within the group to 25.17%. Azure Power India Private Limited and several of Deferred Taxes”. This guidance requires entitiesits subsidiaries which are claiming tax benefits under section 80-IA of the Income Tax Act had decided not to classify deferredopt for this lower tax liabilitiesbenefit and assetshave continued under the old regime for the fiscal year ended March 31, 2023, the statutory income tax rate as noncurrent in a classified statement of financial position. The guidance is effective for interim and annual periods beginning after December 15, 2016, and may be applied either prospectivelyper the Income Tax Act, 1961 ranges between 25.17% to all deferred34.94%, depending on the tax liabilities and assets or retrospectively to all periods presented. As permitted,regime chosen by the Company elected to early adopt this guidance on a retrospective basis and all deferred tax assets and liabilities are classified asnon-current.particular subsidiary.
(p) Employee benefits
Defined contribution plan
Eligible employees of the Company in India receive benefits from the Provident Fund, administered by the Government of India, which is a defined contribution plan. Both the employees and the Company make monthly contributions to the Provident Fund equal to a specified percentage of the eligible employees’ salary.
The Company has no further funding obligation under the Provident Fund, beyond the contributions elected or required to be made thereunder. Contributions to the Provident Fund by the Company are charged to expense in the period in which services are rendered by the covered employees and amounted to INR 5,693,27 million, INR 10,35027 million and INR 15,73427 million (US$ 243)0.3 million) for the years ended March 31, 2015, 20162021, 2022 and 2017,2023, respectively.
Defined benefit plan
Employees in India are entitled to benefits under the Gratuity Act, a defined benefit post-employment plan covering eligible employees of the Company. This plan provides for alump-sum payment to eligible employees at retirement, death, and incapacitation or on termination of employment, of an amount based on the respective employee’s salary and tenure of employment. As of March 31, 2017,2022, this plan is unfunded.
Current service costs for defined benefit plans are accrued in the period to which they relate. In accordance with ASC Topic 715,Compensation Retirement BenefitBenefit-, the liability in respect of defined benefit plans is calculated annually by the Company using the projected unit credit method and amounted to INR 7,35056 million and INR 11,07748 million (US$ 171)0.6 million) as of March 31, 20162022 and 2017,2023, respectively. Prior service cost, if any, resulting from an amendment to a plan is recognized and amortized over the remaining period of service of the covered employees. Interest costs for the period ended March 31, 20162022 and 20172023 were not significant. See also, Note 22.
Compensated absences
The Company recognizes its liabilities for compensated absences in accordance with ASC Topic 710,Compensation-General. The Company accrues the liability for its employee rights to compensated absence in the year in which it is earned.
AZURE POWER GLOBAL LIMITED
Notes to Consolidated Financial Statements
(INR and US$ amounts in thousands except share and per share data)
(q) Revenue recognition
Revenue from saleSale of power consists of solar energy sold to customers under long term Power Purchase Agreements (PPAs), which generally have a term of 25 years. The Company’s customers are generally the Government of India, power distribution companies and, to a lesser extent, commercial and industrial enterprises. Sale of power includes solar power sold through exchange.
The Company recognizes revenue on PPAs when the solar power plant generates power and is recognized when persuasive evidencesupplied to the customer in accordance with the respective PPA. The company recognizes revenue each period based on the volume of an arrangement exists,solar energy supplied to the fee is fixed or determinable,customer at the price stated in the PPA once the solar energy kilowatts are supplied and collectability is reasonably assured. Revenue is based on the solar energy kilowatts actually supplied to customers multiplied by the rate per kilo-watt hour agreed to in the respective PPAs. The solar energy kilowatts supplied by the Company are validated by the customer prior to billing and recognition of revenue. Revenues from the recovery of safe-guard duties and goods and service tax under the change in law provision are recognized over the PPA period in the proportion of the actual sale of solar energy in kilowatts as per the terms agreed with customers or unless contractually agreed otherwise, once collectability is reasonably assured. Revenue from the sale of carbon credit emissions are recognized at the point in time when control of the carbon emission reduction units is transferred. These are initially recognised at cost.
Where
The Company applies “ASC Topic 606” Revenue from Contracts with Customers, to recognize revenue from sale of power to its customers. Further, under Topic 606, total consideration for PPAs includewith scheduled price changes revenue(price escalation is recognized at lowerapplicable in a solar power plant with 50 MW of operating capacity and price decrease in a solar power plant with 10 MW of operating capacity over the amount billed or by applying the average rate to the energy outputterm of PPA) and for significant financing components, is estimated and recognized over the term of the PPA.agreement. Price escalations create an unbilled receivable, and the price decreases create deferred revenue. The determinationtime value of the lesser amountsignificant financing component is undertaken annually based onrecorded as interest expense. The Company uses the cumulative amountdiscount rate that would have been recognized had each method been consistently applied frombe reflected in a separate financing transaction between the beginning ofentity and its customer at contract inception and recognizes the contract term. The Company estimates the total kilowatt hour units expected to be generated over the entire term of the PPA. The contractual rates are applied to this annual estimate to determine the total estimated revenue amount on a straight-line basis over the term of the PPA.PPAs, and interest expense using the effective interest rate method. The Company then usesalso recognizes incremental costs incurred to obtain a contract in Other Assets in the total estimated revenue and the total estimated kilo-watt hours to compute the average rate used to record revenueconsolidated balance sheet. These amounts are amortized on the actual energy output supplied. The Company compares the actual energy supplied to the estimate of the energy expected to be generateda straight-line basis over the remaining term of the PPA onPPAs and are included as a periodic basis, but at least annually. Based on this evaluation,reduction to revenue in the Company reassesses the energy output estimated over the remaining termconsolidated statements of the PPA and adjusts the revenue recognized and deferred to date. Through March 31, 2017, the adjustments have not been significant. The difference between actual billing and revenue recognized is recorded as deferred revenue.operations.
For the years ended March 31, 2015, 2016 and 2017, the amount of revenue recognized under the PPA’s with scheduled price changes is INR 175,492, INR 168,552 and INR 161,760 (US$ 2,494), respectively.
Revenue from sale of power is recorded net of discounts. Through March 31, 2017, discounts have not been significant.
The Company also records the proceeds received from Viability Gap Funding (VGF)(‘VGF’) on fulfillmentfulfilment of the underlying conditions as deferred revenue. Such deferred VGF revenue is recognized as sale of power in proportion to the actual sale of solar energy kilowatts during the period to the total estimated sale of solar energy kilowatts during the tenure of the applicable power purchase agreement or balance tenure of power purchase agreement, as applicable pursuant to the revenue recognition policy.
The Company also recognise revenue on Late Payment Surcharge and interest on late payment for power supply on reasonable certainty to expect ultimate collection or otherwise based on actual collection, whichever is earlier.
Revenue from customers
Revenue from customers, net consists of the following:
| | | Year ended March 31, | |
| | | 2021 | | | 2022 | | | 2023 | | | 2023 | |
| | | (INR) | | | (INR) | | | (INR) | | | (US$) | |
| | | (In million) | |
| Revenue from Customers: | | | | | | | | | | | | |
| Sale of Power (1) | | | 15,133 | | | | 17,621 | | | | 20,744 | | | | 252.3 | |
| Others (2) | | | 103 | | | | 720 | | | | 4 | | | | 0.1 | |
| Total | | | 15,236 | | | | 18,341 | | | | 20,748 | | | | 252.4 | |
(s)(1) | CostSale of operations (exclusivepower includes revenue for the recovery of depreciationSafe-Guard Duties and amortization)Goods and Service Tax, which is linked to generation of Solar units, resulting from the change in law provision of our PPAs, during the year ended March 31, 2022 and 2023 amounting to INR 340 million and INR 267 million (US$3.3 million) respectively. |
| (2) | Others includes revenue from the sale of carbon credits emissions amounting to INR 720 million and INR 4 million (US$ 0.1 million) during the year ended March 31, 2022 and 2023 respectively. |
Contract balances
The following table provides information about receivables, unbilled receivables, contract acquisition cost and deferred revenue from customers as at March 31, 2022 and 2023, respectively.
| | | As at March 31, | |
| | | 2022 | | | 2023 | | | 2023 | |
| | | INR | | | INR | | | US$ | |
| | | (In million) | |
| Current assets | | | | | | | | | |
| Accounts receivable, net | | | 6,041 | | | | 5,713 | | | | 69.5 | |
| Contract acquisition cost | | | 16 | | | | 17 | | | | 0.2 | |
| Non-current assets | | | | | | | | | | | | |
| Unbilled receivable | | | 253 | | | | 289 | | | | 3.5 | |
| Accounts receivable (net) | | | 3,203 | | | | 3,896 | | | | 47.4 | |
| Contract acquisition cost | | | 322 | | | | 305 | | | | 3.7 | |
| Current liabilities | | | | | | | | | | | | |
| Deferred revenue | | | 230 | | | | 308 | | | | 3.7 | |
| Non-current liabilities | | | | | | | | | | | | |
| Deferred revenue | | | 5,417 | | | | 6,688 | | | | 81.4 | |
Movement in deferred revenue:
| | | As at March 31, | |
| | | 2022 | | | 2023 | | | 2023 | |
| | | INR | | | INR | | | US$ | |
| | | (In million) | |
| Beginning balance | | | 2,463 | | | | 5,647 | | | | 68.7 | |
| Increased as a result of additional cash received against VGF | | | 40 | | | | 152 | | | | 1.8 | |
| Deferred revenue recognized | | | 3,183 | | | | 1,300 | | | | 15.8 | |
| Amount recognized into revenue | | | (39 | ) | | | (103 | ) | | | (1.3 | ) |
| Ending balance | | | 5,647 | | | | 6,996 | | | | 85.1 | |
Accounts receivable – from sale of power consist of accrued revenues due under the PPA, based on the sale of power transferred to the customer, generally requiring payment within 30 to 60 days of sale. As per terms of PPA, payment is unconditional once performance obligations have been satisfied and does not contain any future, unsatisfied performance obligation to be included in this disclosure.
(r) Cost of operations (exclusive of depreciation and amortization)
The Company’s cost of operations consists of expenses pertaining to operations and maintenance of its solar power plants. These expenses include payroll and related costs for maintenance staff, plant maintenance, insurance, and if applicable, lease costs.costs etc.
Depreciation expense is not included in cost of operations but is included within “Depreciation and amortization expense”,amortization” expense, shown separately in the consolidated statements of operations.
(t) | General and administrative expenses |
(s) General and administrative expenses
General and administrative expenses include payroll and related costs for corporate, finance and other support staff, including bonus and share based compensation expense, professional fees and other corporate expenses.
AZURE POWER GLOBAL LIMITED
Notes to Consolidated Financial Statements
(INR and US$ amounts in thousands except share and per share data)(t) Share based compensation
(u) | Share based compensation |
The Company follows guidance under ASC Topic 718,Compensation — Stock Compensation, which requires compensation costs related to share-based transactions, including employee share options, to be recognized in the financial statements based on their fair value. The Company recognizes compensation expense for equity share options including Restricted stocks (RSs) net of estimated forfeitures. Forfeitures are estimated at the time of grant and revised, if necessary, in subsequent periods if actual forfeitures differ from those estimates. Share-based compensation is included in general and administrative expenses and recognized in the consolidated statements of operations based on awards ultimately expected to vest.vest, except the cost of services which is initially capitalized by the Company as part of the cost of property, plant and equipment.
The Company recognizes compensation expense for SARs based on the fair value of the amount payable to employees in respect of SARs, which are settled in cash, with a corresponding increase in liabilities, over the period that the employees unconditionally become entitled to the payment. The liability is remeasured at each reporting date and at settlement date based on the fair value of the SARs or amounts as per best estimated. Any changes in the fair value of the liability are recognized in consolidated statements of operations.
The Company has elected to use the Black-Scholes-Merton valuation model to determine the fair value of share-based awards on the date of grant for employee share options with a fixed exercise price and fixed service-based vesting.
The Company has elected to use the LatticeBlack-Scholes-Merton valuation model to determine the fair value of SARs at each reporting date.
Employee Stock Option and Restricted Stocks
The share-based awards oncompensation expense related to share-based compensation is recorded as a component of general and administrative expenses in the dateCompany’s consolidated statements of grantoperations and totalled INR 44 million, INR 69 million and INR 17 million (US$0.2 million) for employee share options withthe years ended March 31, 2021, March 31, 2022, and 2023, respectively. The amount of share-based compensation expense capitalized during the year ended March 31, 2020, March 31, 2022, and 2023 was INR 8 million, INR 23 million and INR Nil million, respectively.
Stock Appreciation Rights
The share-based compensation expense related to SARs is recorded as a market condition.
component of general and administrative expenses in the Company’s consolidated statements of operations totalled reversal of expense of INR 373 million and reversal of expense of INR 646 million (US$7.9 million) for the year ended March 31, 2022, and 2023, respectively. The amount of share-based compensation expense capitalized during the years ended March 31, 2022, and 2023 was Nil. Refer to note 19Note 21 for details on the Share based compensation.
(u) Assets held-for-sale
Assets and asset disposal group are classified as held-for-sale if their carrying amount will be recovered principally through a sale transaction rather than through continuing use. This condition is regarded as met only when management commits to a plan to sell the asset; the asset is available for immediate sale in its present condition; an active program to locate a buyer and other actions required to complete the plan have been initiated; the sale of the asset is probable within one year or within extended period on account of conditions beyond the control of the Company; the asset is being actively marketed for sale at a reasonable price in relation to its current fair value; and it is unlikely that significant changes to the plan will be made or that the plan will be withdrawn. Assets and liabilities classified as held-for-sale are measured at lower of their carrying amount and fair value less costs to sell and depreciation (amortization) ceases once the asset is classified as held for sale. See also, Note 23.
(v) Contingencies
Liabilities for loss contingencies arising from claims, tax assessments, litigation, fines and penalties and other sources are recorded when it is probable that a liability has been incurred and the amount of the assessment and/or remediation can be reasonably estimated. Legal costs incurred with respect to these items are expensed as incurred.
(w) | Fair value of financial instruments |
(w) Fair value of financial instruments
ASC Topic 820,Fair Value Measurements and Disclosures, -, defines fair value as the price at which an asset could be exchanged or a liability transferred in an orderly transaction between knowledgeable, willing parties in the principal or most advantageous market for the asset or liability. Where available, fair value is based on observable market prices or derived from such prices. Where observable prices or inputs are not available, valuation models are applied. These valuation techniques involve some level of management estimation and judgment, the degree of which is dependent on the price transparency for the instruments or market and the instruments’ complexity.
When considering market participant assumptions in fair value measurements, the following fair value hierarchy distinguishes between observable and unobservable inputs, which are categorized in one of the following levels
(x) | ● | Derivative instrumentsLevel 1 inputs: Unadjusted quoted prices in active markets for identical assets or liabilities accessible to the reporting entity at the measurement date. |
Derivative
| ● | Level 2 inputs: Other than quoted prices included in Level 1 inputs that are observable for the asset or liability, either directly or indirectly, for substantially the full term of the asset or liability. |
| ● | Level 3 inputs: Unobservable inputs for the asset or liability used to measure fair value to the extent that observable inputs are not available, thereby allowing for situations in which there is little, if any, market activity for the asset or liability at measurement date. |
(x) Derivatives and Hedging
In the normal course of business, the Company uses derivative instruments for the purpose of mitigating the exposure from foreign currency fluctuation risks associated with forecasted transactions denominated in certain foreign currencies and to minimize earnings and cash flow volatility associated with changes in foreign currency exchange rates, and not for speculative trading purposes. These derivative contracts are recordedpurchased within the Company’s policy and are with counterparties that are highly rated financial institutions.
Contracts designated as Cash Flow Hedge
Cash flow hedge accounting is followed for derivative instruments to mitigate the exchange rate risk on the consolidated balance sheets at fair value.foreign currency denominated debt instruments. Changes in fair value of derivatives notderivative contracts designated as cash flow hedges are recorded in other comprehensive income/(loss), net of tax, until the hedge transaction occurs. The Company evaluates hedge effectiveness of cash flow hedges at the time a contract is entered into as well as on an ongoing basis or as required. When the relationship between the hedged items and hedging instrument is highly effective at achieving offsetting changes in cashflows attributable to the hedged risk, the Company records in other comprehensive income the entire change in fair value of the designated hedging instrument that is included in the assessment of hedge effectiveness. The cost of the hedge is recorded as an expense over the period of the contract on a straight-line basis.
Fair value hedges: hedging of foreign exchange exposure
Fair value hedge accounting is followed for foreign exchange risk with the objective to reduce the exposure to fluctuations in the fair value of firm commitments due to changes in foreign exchange rates.
Fair value adjustments related to non-financial instruments will be recognized in the hedged item upon recognition and will eventually affect earnings as and when the hedged item is derecognized. Changes in the fair value of derivatives designated and qualifying as fair value hedges, together with any changes in the fair value of the hedged firm commitments attributable to the hedged risk, will be recorded in in the consolidated balance sheet. The gain or loss on the hedging derivative in a hedge of a foreign-currency-denominated firm commitment and the offsetting loss or gain on the hedged firm commitment is recognized in earnings in the accounting period, post the recognition of the hedged item in the balance sheet.
Undesignated contracts
Changes in fair value of undesignated derivative contracts are reported directly in earnings along with the corresponding transaction gains and losses on the items being economically hedged. The Company enters into foreign exchange currency contracts to mitigate and manage the risk of changes in foreign exchange rates. These foreign exchange derivative contracts were entered into to hedge the fluctuations in foreign exchange rates for recognized balance sheet items such as the Company’s U.S. dollar denominated borrowings and areborrowings. The Company has not designated the derivative contracts as hedges for accounting purposes. Realized gains (losses) and changes in the fair value of these foreign exchange derivative contracts are recorded in Loss (gain) on foreign currency exchange, gains (losses), net in the consolidated statements of operations. These derivatives are not held for speculative or trading purposes.
AZURE POWER GLOBAL LIMITED
Notes to Consolidated Financial Statements
(INR and US$ amounts in thousands except share and per share data)(y) Segment information
Operating segments are defined as components of a company about which separate financial information is available that is evaluated regularly by the chief operating decision maker, or decision makingdecision-making group, in deciding how to allocate resources and in assessing performance. The Company’s chief executive officer is the chief operating decision maker. Based on the financial information presented to and reviewed by the chief operating decision maker in deciding how to allocate the resources and in assessing the performance of the Company, the Company has determined that it has a single operating and reporting segment: Sale of power. The Company’s principal operations, revenue and decision-making functions are located in India.
(z) | Non-controlling interest |
(z) Non-controlling interest
Thenon-controlling interest recorded in the consolidated financial statements relates to (i) a 20% ownership in a subsidiary (10MW Gujarat Power Plant) not held by the Company, (ii) a 48.37% ownership in a subsidiary (150MW Punjab Power Plant) not held by the Company, and (iii) a 49% ownership in a subsidiary on an as converted basis (50MW Uttar Pradesh Power Plant)following:
| (i) | 0.83% ownership interest in a subsidiary, a 10MW Gujarat power plant, not held by the Company |
| (ii) | 49.00% ownership interest in a subsidiary, a 50MW Uttar Pradesh power plant, not held by the Company |
| (iii) | 0.16% ownership interest in a subsidiary, a 100 MW Telangana power plant, not held by the Company |
| (iv) | 0.01% ownership interest in Azure Power India Private Limited* not held by the Company |
| (v) | 49% ownership interest in 16 MW rooftop project** of DJB not held by the Company |
| (vi) | 48.6% ownership interest in a subsidiary, a 4 MW rooftop project** with GEDCOL, not held by the Company |
| (vii) | 48.6% ownership interest in a subsidiary, a 11.4 MW** rooftop project with DMRC, not held by the Company |
| (viii) | 48.6% ownership interest in a subsidiary, a 17.8 MW** rooftop project with railways, not held by the Company. |
As of March 31, 2017,2023, the Company recorded anon-controlling interest amounting to INR 1,304,729625 million (US$ 20,119)7.6 million) including INR 18,92437 million (US$ 292)0.5 million) of net loss for the year. As of March 31, 2016, the Company recorded anon-controlling deficit amounting to INR 330, including loss of INR 4,651 for the year Net loss attributable tonon-controlling interest for the year ended March 31, 2015 was2023. As of March 31, 2022, the Company recorded a non-controlling interest amounting to INR 5,595.662 million including INR 22 million of net profit for the year ended March 31, 2022.
(aa)* | Redeemablenon-controlling interestThis remaining ownership by the founders was under arbitration and same has been decided in the favor of the Company, subsequent to the year end. Refer to note 20. |
The redeemablenon-controlling
| ** | During the previous year, the Company has entered into a sale agreement for the disposal of its rooftop business and has transferred the 48.6% and 49% shareholding of identified entities in reference to agreement and has recognized proportionate minority interest of INR 453 million (US$6.0 million) on transfer of its shareholdings of rooftop entities. See also Note 23 |
(aa) Inventory
Carbon emission rights (CERs) received on registered projects are recorded in the financial statements relates to a 29% ownership in a subsidiary (50MW Andhra Pradesh Power Plant) not held by the Company. The investor representing the redeemablenon-controlling interest has a put option to sell its equity interest to the Company for cashas inventory. Inventories are valued at the lower of faircost and net realisable value. Cost includes cost of purchase and other costs incurred in bringing the inventories to their present location and condition. Cost is determined using weighted average method. Net realisable value or a return of 11.5% after March 5, 2019. Thisnon-controlling interest is considered to be redeemable equity under ASC480-10-S99-3A and accordingly it is classified as “mezzanine” equitythe estimated selling price in the Company’s consolidated balance sheet.ordinary course of business, less estimated costs of completion and the estimated costs necessary to make the sale. The Company has adjustedGroup derecognises the carrying amount ofCERs when the redeemablenon-controlling interestcertificate is sold, which occurs when units are transferred to its expected redemption value of INR 346,754 and INR 390,827 (US$ 6,027) at March 31, 2016 and 2017 respectively, based on the guaranteed return which is less than fair value.customer.
bb) |
(ab) Recent accounting pronouncements |
Beginning April 1, 2017, the Company has irrevocably elected to follow public company effective dates for new accounting pronouncements.pronouncements
In May 2014,December 2019, the FASB issued ASUNo. 2014-09, ‘‘Revenue from Contracts with Customers (Topic 606)2019-12, Simplifying the Accounting for Income Taxes (“ASU 2019-12”).’’ This guidance supersedes current guidance on revenue recognition in Topic 605, ‘‘Revenue Recognition.” In addition, there are disclosure requirements related ASU 2019-12 eliminates certain exceptions to the nature, amount, timing,general principles in ASC 740, Income Taxes and uncertainty of revenue recognition. In August 2015,adds guidance to reduce complexity in accounting for income taxes. ASU 2019-12 eliminates, inter alia, the FASB issued ASUNo.2015-14 to defergeneral methodology for calculating income taxes in an interim period when a year-to-date loss exceeds the effective date of ASUNo. 2014-09anticipated loss for all entities by onethe year. The core principle of the guidance isIt requires that an entity should recognize revenue to depictreflect the transfereffect of promised goodsan enacted change in tax laws or services to customers in an amount that reflects the consideration to which the entity expects to be entitled in exchange for those goods or services. To achieve that core principle, an entity is required to follow five steps which comprises of (a) identifying the contract(s) with a customer; (b) identifying the performance obligationsrates in the contract; (c) determining the transaction price; (d) allocating the transaction price to the performance obligationsannual effective tax rate computation in the contract and (e) recognizing revenue when (or as)interim period that includes the entity satisfies a
AZURE POWER GLOBAL LIMITED
Notes to Consolidated Financial Statements
(INR and US$ amounts in thousands except share and per share data)
performance obligation. The deferral resulted in the new revenue standard beingenactment date. ASU 2019-12 is effective for fiscal years, and interimthe annual periods within those fiscal years, beginning after December 15, 2017 (April 1, 2018 for the Company). The Company has the option of adopting the new revenue standard using either one of two methods: (i) retrospectively to each prior reporting period presented with the option to elect certain practical expedients as defined within ASUNo. 2014-09; or (ii) retrospectively with the cumulative effect of initially applying ASUNo. 2014-09 recognized at the date of initial application and providing certain additional disclosures as defined per ASUNo. 2014-09.
The Company is in the process of evaluating the impact of the standard update. The ultimate impact on revenue resulting from the application of the new standard will be subject to assessments that are dependent on many variables, including, but not limited to, the terms of contractual arrangements. The Company also continues to evaluate the available transition methods and its contractual arrangements. The Company’s considerations include, but are not limited to, the comparability of its financial statements and the comparability within its industry from application of the new standard to its contractual arrangements. The Company plans to select a transition method by December 2017. The Company has established an implementation team to implement the standard update related to the recognition of revenue from contracts with customers. The Company continues to evaluate the changes to accounting system and processes, and additional disclosure requirements that may be necessary.
On January 5, 2016, the FASB issuedASU 2016-01 (“ASU2016-01”), Recognition and Measurement of Financial Assets and Financial Liabilities, which amends certain aspects of recognition, measurement, presentation and disclosure of financial instruments. This amendment requires all equity investments to be measured at fair value, with changes in the fair value recognized through net income (other than those accounted for under equity method of accounting or those that result in consolidation of the investee). This standard will be effective for fiscal years beginning after December 15, 2017 (April 1, 2018 for the Company),2020, including interim periods within those fiscal years. The Company doesDuring FY 2022, we applied ASU 2019-12 and noted that the impact of adoption of this guidance did not expect this standard to have a material impacteffect on itsour consolidated financial statementsstatements.
In February 2016,March 2020, the Financial Accounting Standards Board issued ASU No. 2020-04, “Reference Rate Reform (Topic 848): Facilitation of the Effects of Reference Rate Reform on Financial Reporting (“ASU 2020-04”).” ASU 2020-04 provides temporary optional expedients and exceptions to the guidance in U.S. GAAP on contract modifications and hedge accounting to ease the financial reporting burdens related to the expected market transition from the London Interbank Offered Rate (LIBOR) and other interbank offered rates to alternative reference rates. In January 2021, the FASB issued Accounting Standard Update 2021-01 (Topic 848), which amends and clarifies the existing accounting standard issued in March 2020 2020-04 for Reference Rate Reform. Reference rates such as LIBOR, are widely used in a broad range of financial instruments and other agreements. The ASU2016-02 (“ASU2016-02”), Leases. ASU2016-02 specifies the permits entities to elect certain optional expedients and exceptions when accounting for leases. For leases that were formerly classified as operating,derivative contracts and certain hedging relationships affected by changes in the interest rates used for discounting cash flows, for computing variation margin settlements, and for calculating price alignment interest in connection with reference rate reform activities under way in global financial markets (the “discounting transition”). The ASU2016-02 requires a lessee to recognize aright-of-use asset and a lease liability, initially measured at the present value of the lease payments, in its balance sheet. The standard also requires a lessee to recognize a single lease cost, calculated so that the cost of the lease is allocated over the lease term, on a generally straight-line basis. In addition, this standard requires both lessees and lessors to disclose certain key information about lease transactions. ASU2016-02 2020-04 is effective for public companiesadoption at any time between March 12, 2020 and December 31, 2022, for annual reporting periods,all entities, and interim periods within those years, beginning afterASU 2021-01 is effective for all entities as of January 7, 2021 through December 15, 2018 (April 1, 2019 for31, 2022. As of March 31, 2022, we have not made any contract modifications to replace the Company), including interim periods within those fiscal years usingreference rate in any of its agreements and will continue to evaluate the modified retrospective method, which will require adjustment to all comparative periods presented in the consolidated financial statements. The Company is currently evaluating the impacteffects of adopting this standard on its consolidated financial statementsposition, results of operations, and the approach to be used.cash flows.
In March 2016,
Management does not believe that other recent accounting pronouncements issued by the FASB issued ASU2016-09(“ASU 2016-09”), Compensation — Stock Compensation: Improvements to Employee Share-Based Payment Accounting, which relates to the accounting for employee share-based payments. This standard addresses several aspects of the accounting for share-based payment award transactions, including: (a) income tax consequences; (b) classification of awards as either equity or liabilities; and (c) classification on the statement of cash flows; (d) accounting for forfeitures of share-based payments. This standard will be effective for fiscal years beginning after December 15, 2016 (April 1, 2017 for the Company), including interim periods within those fiscal years. The Company is currently evaluating the impact of adopting this standard on(including by its consolidated financial statements.
AZURE POWER GLOBAL LIMITED
Notes to Consolidated Financial Statements
(INR and US$ amounts in thousands except share and per share data)
In August 2016, the FASB issued ASU2016-15, Statement of Cash Flows — Classification of Certain Cash Receipts and Cash Payments, which clarifies the presentation and classification of certain cash receipts and cash payments in the statement of cash flows. The amendments are an improvement to GAAP because they provide guidance for each of the eight issues, thereby reducing the current and potential future diversity in practice. This guidance is effective for financial statements issued for fiscal years beginning after December 15, 2017 (April 1, 2018 for the Company), and interim periods within those fiscal years and should be applied using a retrospective transition method to each period presented. The Company does not expect this standard toEmerging Issues Task Force) have a material impact on its consolidatedour present or future financial statements.
In October 2016, the FASB issued ASUNo. 2016-16, Intra-Entity Transfers of Assets Other Than Inventory, to require the recognition of the income tax effects from an intra-entity transfer of an asset other than inventory. The ASU is effective for interim and annual periods beginning after December 15, 2017, with early adoption permitted. Adoption of the ASU is based on a modified retrospective method. The Company intends to early adopt the ASU fiscal year beginning April 1, 2017 and early adoption will result in recognition of deferred tax asset on the income taxes paid on the intra entity transfer of assets to the extent these are expected to be realized by the subsidiary outside of the tax holiday period. The Company believes on early adoption of this guidance, tax expense is expected to be lower and accordingly its profit after tax is likely to increase as it will result in recognition of deferred tax assets on intra-entity transfer of assets is likely to be higher than the prepaid taxes it could have recognize earlier.
In November 2016, the FASB issued ASUNo. 2016-18, Statement of cash flows — Restricted cash. The amendments apply to all entities that have restricted cash or restricted cash equivalents and are required to present a statement of cash flows under Topic 230. The amendments in this update require that a statement of cash flows should explain the change during the period in the total of cash, cash equivalents, and amounts generally described as restricted cash or restricted cash equivalents. The amendments are effective for fiscal years beginning after December 31, 2017 (April 1, 2018 for the Company) and interim periods within those annual periods. Early adoption is permitted with an adjustment reflected as of the beginning of the fiscal year in which the amendment is adoption. The Company does not expect the adoption of this ASU to have any effect on its financial position or results of operations.
3. Cash and cash equivalents
Cash and cash equivalents consistconsists of the following:
| | | | | | | | | | | | |
| | | 2016
(INR) | | | As of March 31, | |
| | | | 2017
(INR) | | | 2017
(US$) | |
Bank demand deposits | | | 2,798,336 | | | | 4,614,158 | | | | 71,151 | |
Term deposits | | | 291,951 | | | | 846,394 | | | | 13,052 | |
Cash on hand | | | 99 | | | | 118 | | | | 2 | |
| | | | | | | | | | | | |
Total | | | 3,090,386 | | | | 5,460,670 | | | | 84,205 | |
| | | | | | | | | | | | |
AZURE POWER GLOBAL LIMITED
Notes to Consolidated Financial Statements
(INR and US$ amounts in thousands except share and per share data)
| | | As of March 31, | |
| | | 2022 | | | 2023 | | | 2023 | |
| | | (INR) | | | (INR) | | | (US$) | |
| | | (In million) | |
| Balances with current accounts | | | 8,314 | | | | 874 | | | | 10.5 | |
| Bank demand deposits* | | | 10,482 | | | | 11,850 | | | | 144.2 | |
| Total | | | 18,796 | | | | 12,724 | | | | 154.7 | |
| * | Includes unrestricted term deposit having maturity more than one year. |
4. Restricted cash
Restricted cash consists of the following:
| | | | As of March 31, | |
| | | | | | | | 2022 | | 2023 | | 2023 | |
| | | March 31, 2016
(INR) | | | As of March 31, | | | (INR) | | (INR) | | (US$) | |
| | | 2017
(INR) | | | 2017
(US$) | | | (In million) | |
Bank demand deposits | | | 821,891 | | | | 3,629,037 | | | | 55,960 | | | | 3,784 | | | | 7,764 | | | | 94.5 | |
Term deposits | | | 871,637 | | | | 1,383,414 | | | | 21,333 | | | | 726 | | | | 479 | | | | 5.8 | |
| | | | | | | | | | | | 4,510 | | | | 8,243 | | | | 100.3 | |
| | | 1,693,528 | | | | 5,012,451 | | | | 77,293 | | |
Restricted cash — current | | | 821,891 | | | | 3,629,037 | | | | 55,960 | | | | 3,784 | | | | 7,764 | | | | 94.5 | |
| | | | | | | | | | |
Restrictedcash — non-current | | | 871,637 | | | | 1,383,414 | | | | 21,333 | | | | 726 | | | | 479 | | | | 5.8 | |
| | | | | | | | | | |
The increase in the restricted cash balance from March 31, 2016 to March 31, 2017 is due to an increase in Company’s solar power plant construction activities, which in turn has resulted in increased borrowing needs and an increase in the respective restricted cash required by the lenders to cover principal and interest payments and letters of credit needed to purchase solar panels.
5. Accounts receivable
The Company’s accounts receivables are generated by selling energy to customers and are reported net of any allowance for uncollectible accounts. The Company uses ageing analysis, probability of default methods, past facts, significant one-time events, guidelines issued by government authorities, credit rating of customers, current economic conditions and reasonable forecasts that are most relevant in evaluating and estimating the expected credit losses.
The Company writes-off an account receivable in the period that it is deemed uncollectible and records a reduction in the ECL and the balance of the account receivables in the balance sheet.
The Company evaluates the concentration of risk with respect to its accounts receivables as high, due to the limited number of counterparts for its services, being mainly state utilities and government entities. However, the Company does not foresee any significant credit risk attached to receivables from such state utilities/government entities (also refer note 26 below).
The Company analyzed its historical loss information for its accounts receivables and adjusted for forward looking information and determined the following credit loss percentages:
| | | March 31, 2023 | | | March 31, 2022 | |
| Ageing of accounts receivables | | Expected Credit
Losses % | | | Expected Credit
Losses % | |
| Not Due (including unbilled receivables) | | | 0.74 | % | | | 0.57 | % |
| 0-90 days | | | 8.50 | % | | | 2.27 | % |
| 90-180 days | | | 20.78 | % | | | 3.25 | % |
| 180-365 days | | | 31.97 | % | | | 3.34 | % |
| Above 365 days | | | 100 | % | | | 11.19 | % |
Doesn’t include specific provision made for cases under litigation with the customers.
| | | March 31,
2023 | | | March 31,
2022 | |
| | | (INR) | | | (INR) | |
| Ageing of accounts receivables*# | | (In million) | | | (In million) | |
| Not Due (including unbilled receivables) | | | 7,855 | | | | 7,656 | |
| 0-90 days | | | 801 | | | | 360 | |
| 90-180 days | | | 345 | | | | 192 | |
| 180-365 days | | | 255 | | | | 405 | |
| Above 365 days | | | 1,189 | | | | 917 | |
| Total accounts receivables | | | 10,445 | | | | 9,530 | |
| * | Includes Nil and INR 1 million relating to receivables of the Company’s rooftop business being classified as Assets held for sale for the year ended March 31, 2023 and 2022 respectively. Total accounts receivable includes non-current portion. |
| # | Includes receivables of INR 3,868 million (US$47.1 million) in relation to claims of Safeguard duties under change in Law provisions of Power purchase agreement. |
| | | As of March 31, | |
| | | 2022 | | | 2023 | | | 2023 | |
| | | (INR) | | | (INR) | | | (US$) | |
| | | (In million) | |
| Accounts receivable (1) | | | 9,529 | | | | 10,445 | | | | 127.1 | |
| Less: Allowance for doubtful accounts/ credit losses | | | (285 | ) | | | (836 | ) | | | (10.2 | ) |
| Total | | | 9,244 | | | | 9,609 | | | | 116.9 | |
| Non-current | | | 3,203 | | | | 3,896 | | | | 47.4 | |
| Current | | | 6,041 | | | | 5,713 | | | | 69.5 | |
Accounts receivable, net consists of the following:
| | | | | | | | | | | | |
| | | As of March 31, | |
| | | 2016
(INR) | | | 2017
(INR) | | | 2017
(US$) | |
Accounts receivable | | | 601,233 | | | | 1,183,083 | | | | 18,243 | |
Less: Allowance for doubtful accounts | | | (44,478 | ) | | | (44,478 | ) | | | (685 | ) |
| | | | | | | | | | | | |
Total | | | 556,755 | | | | 1,138,605 | | | | 17,558 | |
| | | | | | | | | | | | |
| (1) | Includes INR 5,228 million and INR 5,766 million (US$70.2 million) of unbilled receivables for the year ended March 31, 2022 and 2023, respectively. |
Activity for the allowance for doubtful accounts receivableaccounts/ credit losses is as follows:
| | | | As of March 31, | |
| | | | | | | | 2022 | | | 2023 | | | 2023 | |
| | | As of March 31, | | | (INR) | | | (INR) | | | (US$) | |
| | | 2016
(INR) | | | 2017
(INR) | | | 2017
(US$) | | | (In million) | |
Balance at the beginning of the year | | | 10,000 | | | | 44,478 | | | | 685 | | | | 475 | | | | 285 | | | | 3.5 | |
Provision for doubtful accounts | | | 34,478 | | | | — | | | | — | | |
| | | | | | | | | | | | | | | | | | | | | |
| Provision for doubtful debts/ expected credit losses (net) | | | | (198 | ) | | | 551 | | | | 6.7 | |
| Write offs charged against the allowance | | | | - | | | | - | | | | - | |
| Reclassified to held for sale | | | | - | | | | - | | | | - | |
| Reclassified from held for sale | | | | 8 | | | | - | | | | - | |
Balance at the end of the year | | | 44,478 | | | | 44,478 | | | | 685 | | | | 285 | | | | 836 | | | | 10.2 | |
| | | | | | | | | | |
AZURE POWER GLOBAL LIMITED
NotesIn relation to Consolidated Financial Statements
(the Company’s 50 MW project in Andhra Pradesh, the Andhra Pradesh DISCOM, Southern Power Distribution Company of Andhra Pradesh Ltd (“APSPDCL”), had issued a letter to the Company requesting the reduction of quoted tariff to INR 2.44 per unit as against the PPA rate of INR 5.89 per unit for solar projects from the date of commissioning and US$ amountsthreatened termination of the PPA in thousands except sharecase of refusal to accede to such reduction (“Letter”). The Company had challenged the Letter before the High Court at Vijayawada, as well as the decision of the Government of Andhra Pradesh (“GoAP”) to constitute a High-Level Negotiation Committee to review, negotiate, and bring down” the solar energy purchase prices vide order dated July 1, 2019 (“HLNC Order”). The High Court vide its judgment dated September 24, 2019 (“Judgment”), whilst quashing the aforesaid Letter and HLNC Order, granted its implied blessing to Andhra Pradesh DISCOM to approach the Andhra Pradesh Electricity Regulatory Commission (“APERC”) for reduction of tariff by directing APSPDCL to make payment of outstanding and future invoices at the “interim” rate of Rs. 2.44/- per share data)unit, till the dispute is resolved by APERC. Accordingly, the Company has filed a writ appeal challenging the Judgment, whereby the Company has inter alia sought: (i) setting aside of the Judgment to the limited extent of the direction to Discoms to make payment at the “interim” rate of Rs. 2.44 per unit and the implied blessing granted by the High Court to approach the APERC for reduction of tariff; and (ii) quashing of all actions undertaken by the respondents and/or restrain the respondents from taking any action seeking reduction of tariff under the concluded PPA and/or unilateral alteration of the terms of such PPA, pursuant to the directions in the Judgment, including quashing of the proceedings. Further, the appellate authority during several hearings had directed the DISCOM to remit the overdue receivables at interim rate.
During the previous year on March 15, 2022, High court of Andhra Pradesh, Amaravati has passed an order in favour of the Company and has directed the discom to make the payments of arrears with within six weeks from the date of this order, at the original rate of INR 5.89 per unit mentioned in PPAs.
During the current year, the Company has received a letter from off taker dated August 4, 2022, stating outstanding liability as at May 31, 2022, to be paid in 12 monthly installments. The Company has also received dues pursuant to the same.
6. Prepaid expenses and other current assets
Prepaid expenses and other current assets consist of the following:
| | | | | | | | | | | | |
| | | March 31, 2016
(INR) | | | As of March 31, | |
| | | | 2017
(INR) | | | 2017
(US$) | |
Prepaid income taxes | | | 91,669 | | | | 156,728 | | | | 2,416 | |
Derivative instruments (Note 21) | | | 108,606 | | | | 63,818 | | | | 984 | |
Interest receivable on term deposits | | | 27,731 | | | | 63,352 | | | | 977 | |
Other prepaid expenses | | | 80,001 | | | | 212,039 | | | | 3,270 | |
| | | | | | | | | | | | |
Total | | | 308,007 | | | | 495,937 | | | | 7,647 | |
| | | | | | | | | | | | |
| | | As of March 31, | |
| | | 2022 | | | 2023 | | | 2023 | |
| | | (INR) | | | (INR) | | | (US$) | |
| | | (In million) | |
| Derivative asset - current (Note 25) | | | 13 | | | | 210 | | | | 2.6 | |
| Interest receivable on term deposits | | | 98 | | | | 221 | | | | 2.7 | |
| Prepaid debt financing costs | | | 141 | | | | 37 | | | | 0.5 | |
| Balance with statutory authorities | | | 267 | | | | 224 | | | | 2.7 | |
| Prepaid bank guarantee charges | | | 62 | | | | 35 | | | | 0.4 | |
| Prepaid insurance and other expenses | | | 95 | | | | 220 | | | | 2.7 | |
| Advance to suppliers | | | 998 | | | | 95 | | | | 1.2 | |
| Other | | | 251 | | | | 588 | | | | 7.2 | |
| Total | | | 1,925 | | | | 1,630 | | | | 20.0 | |
7. Property, plant and equipment, net
Property, plant and equipment, net consistconsists of the following:
| | | | Estimated | | | As of March 31, | |
| | | | | | | | | | Useful Life | | | 2022 | | | 2023 | | | 2023 | |
| | | Estimated
Useful Life
(in years) | | | March 31,
2016
(INR) | | | As of March 31, | | | (in years) | | | (INR) | | | (INR) | | | (US$) | |
| | | 2017
(INR) | | 2017
(US$) | | | (In million) | |
Plant and machinery (solar power plants) | | 25 | | | 21,330,457 | | | 35,664,766 | | | 549,958 | | | | 25-35 | | | | 135,580 | | | | 150,631 | | | | 1832.7 | |
| Leasehold improvements — solar power plant | | | | 25-35 | | | | 6,297 | | | | 6,091 | | | | 74.1 | |
Furniture and fixtures | | 5 | | | 5,142 | | | 6,043 | | | 93 | | | | 5 | | | | 13 | | | | 10 | | | | 0.1 | |
Vehicles | | 5 | | | 12,633 | | | 13,177 | | | 203 | | | | 5 | | | | 83 | | | | 88 | | | | 1.1 | |
Office equipment | | 5 | | | 10,645 | | | 15,926 | | | 246 | | | | 1-5 | | | | 125 | | | | 135 | | | | 1.6 | |
Computers | | 3 | | | 19,812 | | | 29,827 | | | 460 | | | | 3 | | | | 102 | | | | 114 | | | | 1.4 | |
Leasehold improvements — solar power plant | | 25 | | | 1,436,256 | | | 2,434,449 | | | 37,540 | | |
Leasehold improvements — office | | 1-3 | | | 13,694 | | | 19,010 | | | 293 | | | | 1-3 | | | | 152 | | | | 152 | | | | 1.8 | |
| | | | | | | | | | | | | | | | | | 142,352 | | | | 157,221 | | | | 1,912.8 | |
| Less: Accumulated depreciation | | | | | | | | 15,758 | | | | 19,685 | | | | 239.5 | |
| Less: Accumulated impairment | | | | | | | | 2,802 | | | | 3,368 | | | | 41.0 | |
| | | | 22,828,639 | | | 38,183,198 | | | 588,793 | | | | | | | | 123,792 | | | | 134,168 | | | | 1,632.3 | |
Less: Accumulated depreciation | | | | 1,450,519 | | | 2,484,595 | | | 38,313 | | |
| | | | | | | | | | | | |
| | | | 21,378,120 | | | 35,698,603 | | | 550,480 | | |
Freehold land | | | | 527,645 | | | 1,421,912 | | | 21,926 | | |
| Freehold land* | | | | | | | | 3,224 | | | | 3,748 | | | | 45.6 | |
Construction in progress | | | | 2,475,664 | | | 3,822,093 | | | 58,937 | | | | | | | | 17,316 | | | | 5,723 | | | | 69.7 | |
| | | | | | | | | | | | |
Total | | | | 24,381,429 | | | 40,942,608 | | | 631,343 | | | | | | | | 144,332 | | | | 143,639 | | | | 1,747.6 | |
| | | | | | | | | | | | |
Depreciation expense on property, plant and equipment was INR 318,411,3,165 million, INR 679,6983,639 million and INR 1,036,0294,020 million (US$ 15,976)48.9 million) for the years ended March 31, 2015, 20162021, 2022 and 2017,2023, respectively.
The Company has received government grants Refer note 23 for impairment recognized and classification of assets held for sale during the construction of rooftop projects amounting to INR 11,700, INR 16,900 and INR Nil for the years ended March 31, 2015, 2016 and 2017, respectively. The proceeds from these grants have been recorded as a reduction to the carrying value of the related rooftop projects.
AZURE POWER GLOBAL LIMITED
Notes to Consolidated Financial Statements
(INR and US$ amounts in thousands except share and per share data)current year.
* Also see note 27. “Whistle-blower Allegations and Special Committee Investigation” for adjustment towards payment made to land aggregators.
8. Software, net consists of the following:
| | | | Estimated | | As of March 31, | |
| | | | | | | | | | Useful Life | | 2022 | | | 2023 | | | 2023 | |
| | | Estimated
Useful Life
(in years) | | | March 31,
2016
(INR) | | | March 31, | | | (in years) | | (INR) | | | (INR) | | | (US$) | |
| | | 2017
(INR) | | 2017
(US$) | | | (In million) |
Software licenses and related implementation costs | | 3 Years | | | 27,688 | | | 38,839 | | | 599 | | | 3 Years | | | 169 | | | | 166 | | | | 2.0 | |
Less: Accumulated amortization | | | | 13,031 | | | 23,567 | | | 364 | | | | | | 161 | | | | 165 | | | | 2.0 | |
| | | | | | | | | | | | |
Total | | | | 14,657 | | | 15,272 | | | 235 | | | | | | 8 | | | | 1 | | | | 0.0 | |
| | | | | | | | | | | | |
Aggregate amortization expense for software was INR 4,019,37 million, INR 8,08328 million and INR 10,5364 million (US$ 162)0.1 million) for the years ended March 31, 2015, 20162021, 2022 and 2017,2023, respectively.
Estimated amortization expense for the years ending March 31, 2018, 2019, and 20202024 is INR 8,301, INR 4,504, INR 2,467,1 million respectively.
9. Other assets
Other assets consist of the following:
| | | | As of March 31, | |
| | | | | | | | 2022 | | | 2023 | | | 2023 | |
| | | March 31,
2016
(INR) | | | As of March 31, | | | (INR) | | | (INR) | | | (US$) | |
| | | 2017
(INR) | | | 2017
(US$) | | | (In million) | |
Prepaid income taxes | | | 288,771 | | | | 666,574 | | | | 10,279 | | | | 646 | | | | 361 | | | | 4.4 | |
Derivative instruments (Note 21) | | | 83,426 | | | | 61,120 | | | | 942 | | |
| Derivative asset (Note 25) | | | | 3,530 | | | | 7,302 | | | | 88.8 | |
Interest receivable on term deposits | | | 85,154 | | | | 128,678 | | | | 1,984 | | | | 28 | | | | 33 | | | | 0.4 | |
Security deposit to related party (Note 18) | | | 8,567 | | | | 2,160 | | | | 33 | | |
Land use rights | | | 91,218 | | | | 114,178 | | | | 1,761 | | |
Prepaid expenses | | | — | | | | 32,806 | | | | 506 | | |
| Security deposits | | | | 373 | | | | 386 | | | | 4.7 | |
| Contract acquisition cost | | | | 322 | | | | 305 | | | | 3.7 | |
| Unbilled receivables | | | | 253 | | | | 289 | | | | 3.5 | |
Other | | | 38,765 | | | | 88,049 | | | | 1,358 | | | | 38 | | | | 54 | | | | 0.7 | |
| | | | | | | | | | |
Total | | | 595,901 | | | | 1,093,565 | | | | 16,863 | | | | 5,190 | | | | 8,730 | | | | 106.2 | |
| | | | | | | | | | |
AZURE POWER GLOBAL LIMITED
Notes to Consolidated Financial Statements
(INR and US$ amounts in thousands except share and per share data)10. Investments
10.Investments, consists of the following:
| | | As of March 31, | |
| | | 2022 | | | 2023 | | | 2023 | |
| | | (INR) | | | (INR) | | | (US$) | |
| | | (In million) | |
| Investment | | | 96 | | | | 457 | | | | 5.6 | |
| Total | | | 96 | | | | 457 | | | | 5.6 | |
During the year ended March 31, 2022, the Company entered in a non-binding obligation with M/s Premier Energies limited (“Premier/ Manufacturer”), a solar module manufacturing company, relating to execution of tender received from SECI. During Fiscal Year 2021-22, the Company invested INR 94 million in equity shares of Premier Energies International Private Limited (“PEIPL”). During the current year, the Company further invested INR 43 million (US$0.5 million) in equity shares (without dividend rights) and INR 319 million (US$3.9 million) in Compulsory Convertible Debentures of PEIPL. During the current year, the Company has entered into related module supply agreements and share and debentures subscription agreements with Premier. The Company is entitled for return of 10% p.a. on investment made under the agreement.
11. Other liabilities
Other current liabilities, consists of the following:
| | | As of March 31, | |
| | | 2022 | | | 2023 | | | 2023 | |
| | | (INR) | | | (INR) | | | (US$) | |
| | | (In million) | |
| Derivative liability (See Note 25) | | | 2,499 | | | | 1,542 | | | | 18.8 | |
| Provision for employee benefits | | | 11 | | | | 21 | | | | 0.3 | |
| Provision for SAR to employees (See Note 21) | | | 844 | | | | - | | | | - | |
| Payable to statutory authorities | | | 291 | | | | 148 | | | | 1.8 | |
| Other payables | | | 1,364 | | | | 3,646 | | | | 44.3 | |
| Total | | | 5,009 | | | | 5,357 | | | | 65.2 | |
Other non-current liabilities, consists of the following:
| | | As of March 31, | |
| | | 2022 | | | 2023 | | | 2023 | |
| | | (INR) | | | (INR) | | | (US$) | |
| | | (In million) | |
| Derivative liability (See Note 25) | | | 7 | | | | - | | | | - | |
| Provision for gratuity | | | 53 | | | | 39 | | | | 0.5 | |
| Provision for compensated absences | | | 38 | | | | 26 | | | | 0.3 | |
| Total | | | 98 | | | | 65 | | | | 0.8 | |
12. Long term debt
Long term debt, consists of the following:
| | | | | | | | | | | | |
| | | March 31,
2016
(INR) | | | As of March 31, | |
| | | | 2017
(INR) | | | 2017
(US$) | |
Compulsorily convertible debentures 5.0% — DEG | | | 1,272,400 | | | | — | | | | — | |
Compulsorily convertible debentures 10.0% — IFC | | | 478,900 | | | | — | | | | — | |
Compulsorily convertible debentures 0% — IFC II | | | 140,100 | | | | — | | | | — | |
Compulsorily convertible debentures 5% — IFC III | | | 241,100 | | | | — | | | | — | |
Series E compulsorily convertible preferred shares (140,000 shares) | | | 837,300 | | | | — | | | | — | |
Series G compulsorily convertible preferred shares (18,882 shares) | | | 630,900 | | | | — | | | | — | |
| | | | | | | | | | | | |
| | | 3,600,700 | | | | — | | | | — | |
| | | | | | | | | | | | |
Secured term loans, net of financing costs: | | | | | | | | | | | | |
Foreign currency loans | | | 5,889,467 | | | | 5,385,949 | | | | 83,052 | |
Indian rupee loans | | | 13,340,243 | | | | 27,311,619 | | | | 421,151 | |
| | | | | | | | | | | | |
| | | 19,229,710 | | | | 32,697,568 | | | | 504,203 | |
| | | | | | | | | | | | |
Total debt | | | 22,830,410 | | | | 32,697,568 | | | | 504,203 | |
Less current portion | | | 4,477,696 | | | | 1,554,806 | | | | 23,975 | |
| | | | | | | | | | | | |
Long-term debt | | | 18,352,714 | | | | 31,142,762 | | | | 480,228 | |
| | | | | | | | | | | | |
Compulsorily convertible debentures (CCDs)
| | | As of March 31, | |
| | | 2022 | | | 2023 | | | 2023 | |
| | | (INR) | | | (INR) | | | (US$) | |
| | | (In million) | |
| Secured term loans: | | | | | | | | | |
| Foreign currency loans | | | 75,709 | | | | 77,474 | | | | 942.6 | |
| Indian rupee loans | | | 44,924 | | | | 44,970 | | | | 547.2 | |
| Unsecured term loans: | | | | | | | | | | | | |
| Indian rupee loans* | | | 1,118 | | | | 1,161 | | | | 14.1 | |
| Total debt | | | 121,751 | | | | 123,605 | | | | 1,503.9 | |
| Less: current portion | | | 9,209 | | | | 9,414 | | | | 114.5 | |
| Long-term debt | | | 112,542 | | | | 114,191 | | | | 1,389.4 | |
| * | Pertains to unsecured term loan taken by subsidiaries, forming the part of disposable group during the current year from its minority shareholders amounting to INR 1,161 million (US$14.1 million) as at March 31, 2023 and INR 1,118 million as at March 31, 2022. |
Foreign currency term loans
Pursuant
3.575% Senior Notes
During the year ended March 31, 2022, Azure Power Energy Limited (one of the subsidiaries of APGL) issued 3.575% US$ denominated Senior Notes (“3.575% Senior Notes” or “Green Bonds”) and raised INR 30,285 million, net of issuance expense of INR 408 million. The issuance expenses have been recorded as finance cost, using the effective interest rate method and the unamortized balance of such amounts is netted with the carrying value of the Green Bonds. The Green Bonds are listed on the Singapore Exchange Securities Trading Limited. In accordance with the terms of the issue, the proceeds were used for repayment of 5.5% Senior Notes. The interest on the 3.575% Senior Notes is payable on a semi-annual basis principal is payable on a semi-annual instalment ranging from 3.4% to 3.8% and balance 67.4% on maturity in August 2026. As of March 31, 2023, the net carrying value of the Green Bonds was INR 30,247 million (US$368.0 million). The Green Bonds are secured by a pledge of Azure Power Energy Limited’s shares held by Azure Power Global Limited.
5.65% Senior Notes
During the year ended March 31, 2020, Azure Power Solar Energy Private Limited (one of the subsidiaries of APGL) issued 5.65% US$ denominated Senior Notes (“5.65% Senior Notes” or “Green Bonds”) and raised INR 24,400 million net of discount of INR 7 million at 0.03% and issuance expense of INR 397 million. The discount on issuance of the Green Bonds and the issuance expenses have been recorded as finance cost, using the effective interest rate method and the unamortized balance of such amounts is netted with the carrying value of the Green Bonds. The Green Bonds are listed on the Singapore Exchange Securities Trading Limited.
In accordance with the terms of the issue, the proceeds were used for repayment of project level loans. The interest on the 5.65% Senior Notes are payable on a semi-annual basis and the principal amount is payable in December 2024. As of March 31, 2023, the net carrying value of the Green Bonds was INR 28,615 million (US$348.2 million). The Company continues to guarantee the principal and interest repayments to the IPO in October 2016,investors and the guarantee shall become ineffective on meeting certain financial covenants. The Green Bonds are secured fixed charge by the Company convertedover the capital stock of Azure Power Solar Energy Private Limited. Investment of APSEL in non-convertible debentures of group entities are further secured by a first priority security interest (to be shared on pari-passu basis) over all the CCD’s (DEG, IFC, IFC II and IFC III CCDs) which had guaranteed returns ranging from 18.4 % per annum to 20.0% per annum into 1,826,305 equity shares. The CCD’s converted contained the following terms and conditions:
Voting
The holdersimmovable properties of the CCDsentities by an equitable mortgage.
Loan from Export Development Canada and Standard Chartered Bank (Singapore) Limited
During the year ended March 31, 2021, the Company borrowed INR 6,931 million (US$93.0 million) from Export Development Canada and Standard Chartered Bank (Singapore) Limited. The funds were entitledprovided to voting rightsproject SPVs as shareholder loans or through other thaninstrument for certain specific matters based on their proportionate voting rights as definedcapital expenditure or for payment of capital expenditure in respect of various specified projects. These facilities are foreign currency loans and specified in the shareholder and CCD agreements.
Term
Unless converted, the DEG, IFC, IFC II and IFC III CCDs matured 20 years from the date of the respective issuance being November 10, 2031, December 14, 2030, January 3, 2033 and September 5, 2034, respectively.
Interest
The DEG CCDs carriedcarry an interest rate of 5.0% per annum throughLIBOR+Margin of 3.95% and the dateloan is repayable in 8 half yearly instalments ranging from 2.5% - 32.5% commencing from November 2021 and ending May 2025. The borrowing is collateralized by the shares of their conversion into equity sharesproject SPVs, a hypothecation/charge over receivables of the Company. The first interest payment was eighteen months from the issuance date followed by quarterly payments until the earliernet carrying value of the dateloan as of conversion or maturity.March 31, 2023 is INR 4,822 million (US$58.7 million).
Indian Rupee Non-Convertible Debentures
During the year ended March 31, 2019, the Company issued Non-Convertible Debentures in two of its subsidiaries and borrowed INR 548 million, net of issuance expense of INR 14 million. The IFC CCDs carrieddebentures carry an interest rate of 10.0%10.32% per annum throughannum. The debentures are repayable in October 2024 and interest payments are payable every three months commencing from April 2019. During the dateyear ended March 31, 2020, the Company issued further Non-Convertible Debentures in four of their conversion into equity sharesits subsidiaries and borrowed INR 439 million (US$5.8 million), net of issuance expenses of INR 19 million (US$0.3 million) under the same facility. The debentures carry an interest rate of 9.85% to 10.87% per annum. The debentures are repayable in October 2024 and interest payments are payable every three months commencing from March 2020. The issuance expenses are amortized over the term of the Company.contract using the effective interest rate method. The borrowing is collateralized by first interest payment was eighteen months fromranking pari passu mortgage charge on all immovable and movable properties of related subsidiary within the issuance date followed by quarterly payments until the earliergroup with a net carrying value of the date of conversion or maturity.
AZURE POWER GLOBAL LIMITED
Notes to Consolidated Financial Statements
(INR and US$ amounts in thousands except share and per share data)
The IFC II CCDs did not carry an annual interest rate. However, if any dividends were paid to equity shareholders or the holders of the Compulsorily Convertible Preferred Shares (“CCPS”), the IFC II holders were entitled to interest/dividends equal to the return provided to the equity shareholders or the CCPs shareholders, whichever is higher.
The IFC III CCDs carried an interest at a rate of 5.0% per annum through the date of their conversion into equity shares of the Company. The first interest payment was eighteen months from the issuance date followed by quarterly payments until the earlier of the date of conversion or maturity.
The CCDs converted upon the Company’s IPO at a price such that the holder earned an internal rate of return ranging from 18.4% per annum to 20.0% per annum.
Buyback obligation
In case Company was not able to complete the Qualified Initial Public Offering (“QIPO”) date of December 31, 2016, or upon a breach of the funding requirements of the CCD holders or upon the occurrence of a liquidation event, as defined, the holders of the CCDs had an option, at their discretion, to require the Company to buyback the equity shares held by them after the conversion of their CCDs into equity shares so as to give them their required returns ranging from 18.4% per annum to 20.0% per annum.
2,710 million (US$33.0 million). As of March 31, 2016, these debentures were held by AGPL and2023, the QIPO date was modified to December 31, 2016. The CCDs amounting to INR 2,132,500 had been classified as current liability assuming redemption at or before the modified QIPO date.
Accounting
In accordance with ASC Topic 480 Distinguishing Liabilities from Equity, the CCDs were recorded at their respective fair values at period end. The fairnet carrying value was determined based on a discounted cash flow analysis under the income approach. Changes in their fair value were recorded as interest expense in the statements of operations. The carrying amount of the CCDs included the unrealized changes in the fair value of INR 950,490 as of March 31, 2016. Issuance costs on the CCDs were expensed as incurred.
Interest expense, including changes to fair value, on the CCDs for the years ended March 31, 2015, 2016 and 2017Non-Convertible Debentures was INR 248,831, INR 408,172, and INR 90,360992 million (US$ 1,392), respectively.
Series E and Series G Compulsorily Convertible Preferred Shares (Series E and G CCPS)
Pursuant to the IPO in October 2016, the Company has converted the Series E and Series G CCPS into 1,286,598 equity shares so as to give the holders their guaranteed returns of 18.4% per annum.
On April 18, 2013, AZI had issued shares of Series E CCPS for net proceeds of INR 491,400 (US$7,935)12.1 million). On July 25, 2015, the Series E CCPS in AZI were exchanged for similar instruments in APGL having identical terms and conditions. On August 5, 2015, APGL issued shares of Series G CCPS for net proceeds of INR 541,946 (US$8,188).
Series E and G CCPS contained the following key terms and conditions, as amended.
AZURE POWER GLOBAL LIMITED
Notes to Consolidated Financial Statements
(INR and US$ amounts in thousands except share and per share data)
Voting
The holders of the Series E and G CCPS were not entitled to voting rights other than for certain specific matters based on their proportionate voting right as defined and specified in the shareholder and the Series E and G CCPS agreements.
Term
Series E and G CCPS were redeemable within twenty years from the date of their respective allotment on April 18, 2033 and August 5, 2035, respectively
Dividend
Each of the Series E and G CCPS holders were entitled to a 5.0% per sharenon-cumulative dividend, declared and paid in accordance with the Indian Companies Act of 2013. Should the equity or the Series A, B, C, D, F or H CCPS holder in any financial year received a dividend payout higher than 5% per annum of the amount invested by such investors, the Series E and G CCPS holders were entitled to receive an additional dividend equal to the difference between the percentage return earned by the equity or the Series A, B, C, D, F or H CCPS holders and the rate of dividends received by the Series E and G CCPS holders. The Company had not declared or paid any dividends through March 31, 2017.
Buyback obligation
At any time after the expiry of the QIPO date of December 31, 2016, or if the funding covenants of the Series E and G CCPS are breached, the Series E and G CCPS holders had an option, at their discretion, to require the Company to buyback the equity shares held by them after conversion of the Series E and G CCPS into equity shares so as to give them a required return of 15.0% per annum and 16.0% per annum, respectively.
Accounting
In accordance with ASC Topic 480, the Series E and G CCPS were classified as a liability and recorded at fair value at each period end. The fair value had been determined based on the discounted cash flow analysis under the income approach. Changes in their fair valuation were recorded as interest expense in the statements of operations. The carrying amount of series E and G CCPS included the unrealized changes in their fair value of INR 434,901 as of March 31, 2016. Issuance costs on the CCPS were expensed as incurred. As of March 31, 2016,2023, the Series ECompany was not in compliance with the financial covenants related to this borrowing and G CCPS werehas classified asthe loan under current liabilities and converted into equity shares as of March 31, 2017.debt.
Project level secured term loans
Foreign currency loans
From June 2009 through September 2009
During the year ended March 31, 2019, the Company borrowed INR 309,631552 million, as project level financing for some of its rooftop projects. During the year ended March 31, 2020, the Company further borrowed INR 135 million (US$6,230)1.8 million) and INR 271 million (US$3.6 million) under the same facility. These foreign currency facilities carry an annual interest rate of LIBOR + 2.75%. The facility is repayable in October 2024 and interest payments are payable every three months commencing from April 2019. The borrowing is collateralized by first ranking pari passu mortgage charge on all immovable and movable properties of the borrower with a net carrying value of INR 2,710 million (US$33.0 million) as on March 31, 2023. The net carrying value of the loan as of March 31, 2023 is INR 1086 million (US$13.2 million). As of March 31, 2023, the Company was not in compliance with the financial covenants related to this borrowing and has classified the loan under current debt.
During the year ended March 31, 2022, the Company borrowed amount of INR 11,756 million (US$154.9 million) from MUFG Bank, Société Générale, Export development Canada and Hong Kong Mortgage corporation limited for financing of its 300 MW solar project with Solar Energy Corporation of India., The interest on these facilities will be paid on a floating rate which is LIBOR + Margin of 2.1% p.a. payable on quarterly basis. The principal amount is repayable in 17 quarterly instalments ranging from 0.163% to 0.629% commencing from April 2022 and balance 87.192% is payable in June 2026. The loan is collateralized by movable and immovable properties of the underlying solar power project assets with net carrying value of INR 13,438 million (US$163.5 million) as of March 31, 2023, and pledge of 100% of equity shares of the SPV held by the Azure Power India Private Limited and its nominee. The net carrying value of the loan as of March 31, 2023 is INR 12,703 million (US$154.6 million).
Indian rupee loans
The net carrying value of the loan as of March 31, 2023, is INR 365 million (US$4.4 million), borrowed for financing of a 25 MW solar power project whichwith NTPC Vidyut Vyapar Nigam Limited from Kotak Infrastructure Debt Fund Limited. The loan carries an interest rate of 8.25% per annum and the loan is repayable in 42 quarterly instalments ranging from 2.09% to 2.80% of loan amount commencing from September 2021. The borrowing is collateralized by movable and immovable properties of the underlying solar power project assets with a fixednet carrying value of INR 453 million (US$5.5 million) as of March 31, 2023 and pledge of 51% of equity shares of the SPV held by the Azure Power India Private Limited.
The net carrying value of the loan as of March 31, 2023 is INR 1,406 million (US$17.1 million), borrowed for financing of a 30 MW solar power project with Chhattisgarh State Power Distribution Company Ltd from Indian renewable Energy Development Agency Limited (IREDA). The loan carries interest rate.rate of 7.5% per annum and the interest rate is subject to reset every three years based upon rate of interest notified by IREDA as per applicable grading. The loan is repayable in 48 equal168 monthly instalments ranging from 0.50% - 0.60% of the loan amount commencing from April, 2022 and ending on March 2036. The loan is secured by first charge on Company’s movable and immovable properties and hypothecation on all the movable fixed asset with net carrying value INR 1,492 million (US$18.2 million) as of March 31, 2023.
The net carrying value of the loan as of March 31, 2023, is INR 2,004 million (US$24.4 million), borrowed for financing of a 50 MW solar power project with NTPC Limited from NIIF Infrastructure Finance Limited. The loan carries interest rate of 7.75% per annum and interest rate is subject to reset in every five years from initial disbursement and loan is repayable in 64 quarterly instalments ranging from 1.05% to 2.45% of loan amount commencing from December 2021 . The loan is collateralized by movable and immovable properties of the underlying solar power project assets with net carrying value of INR 2,445 million (US$29.8 million) and pledge of 51% of equity shares of the SPV held by the Azure Power India Private Limited.
The net carrying value of the loan borrowed for financing a 100 MW solar power project with NTPC Limited as of March 31, 2023 is INR 4,795 million (US$58.3 million) from NIIF infrastructure Finance Limited and Aseem Infrastructure Finance Limited. These loans carry interest rate of 7.75% per annum and the interest rate is subject to reset for every five years in case of loan taken from NIIF Infrastructure Finance Limited based upon -35 bps (“Spread”) over and above the NIIF IFL 5 YR Benchmark Rate and for every three years in case of loan taken from Aseem Infrastructure Finance Limited based upon AIFL Benchmark Rate/Benchmark Rate and the applicable Spread. These facilities are repayable in 63 quarterly instalments ranging from 1.23% to 2.55% of the loan amount commencing from December 2021 and ending on June 2037. These facilities are secured by first charge on Company’s movable and immovable properties and hypothecation on all the movable fixed assets both present and future with a net carrying value of INR 4,882 million (US$59.4 million) as of March 31, 2023.
During the year ended March 31, 2022, the Company borrowed amount of INR 3,264 million (US$39.7 million), net of initial installments, which commencedfrom Tata Cleantech Capital Limited for financing of its 200 MW solar project with Solar Energy Corporation of India. The loan carries interest rate of 7.50% and the interest rate is subject to reset every three years based upon TCCL New Prime Lending Rate- Long Term (TCCL NPLR-LT). The loan is repayable in 70 quarterly instalments ranging from 1.1% - 1.71% of the loan amount commencing from December 2021 and ending on December 15, 2010.March 2039. The borrowing is collateralized by the underlying solar power project assets with a net carrying value of INR 292,9868,572 million (US$ 4,518)104.3 million) as of March 31, 2017.2023. The net carrying value of the loan as of March 31, 2023 is INR 3,029 million (US$36.9 million).
From February 2011 through June 2011,
During the year ended March 31, 2022, the Company borrowed amount of INR 1,233,0842,467 million (US$26,835)30.0 million) , net of initial instalment, from Axis Bank for the financing of a 10its 200 MW solar power project whichwith Solar Energy Corporation of India. Loan has interest rate of 3 years MCLR and as of March 31, 2023, the loan carries a fixed interest rate of 7.50% and the interest rate is subject to reset every three years based upon 3 year MCLR rate. The loan is repayable in 54 equal
AZURE POWER GLOBAL LIMITED
Notes70 quarterly instalments ranging from 1.10% to Consolidated Financial Statements
(INR1.71% of the loan amount commencing from December 2022 and US$ amounts in thousands except share and per share data)
quarterly installments which commencedending on September 15, 2012.March 2039. The borrowing is collateralized by the underlying solar power project assets with a net carrying value of INR 1,082,1828,572 million (US$ 16,687)104.3 million) as of March 31, 2017.2023. The net carrying value of the loan as of March 31, 2023 is INR 2,291 million (US$27.9 million).
From October 2011 through
During the year ended March 2012,31, 2019, the Company borrowed INR 782,793124 million (US$15,777)1.5 million) as an External Commercial Borrowings from International Finance Corporation (IFC) for some of its rooftop projects. These facilities carry an interest rate of 10.74% and interest payments are payable every three months which commenced April 2019. The borrowing is collateralized by first ranking pari passu mortgage charge on all immovable and movable properties of the borrower with a net carrying value of INR 2,267 million (US$27.6 million) as of March 31, 2023. The loan is repayable on October 15, 2024. The net carrying value of the loan as of March 31, 2023 is INR 123 million (US$1.5 million). As of March 31, 2023, the Company was not in compliance with the financial covenants related to this borrowing and has classified the loan under current debt.
During the year ended March 31, 2020 and March 31, 2021, the Company borrowed INR 463 million (US$5.6 million) and INR 56 million (US$0.8 million) as a project level financing for financing of a 516 MW rooftop solar power project whichfrom the State Bank of India (‘SBI’). These facilities carry an annual interest rate of 6 months MCLR + 1.45%. As of March 31, 2023, the loan carries a fixed interest rate.rate of 8.50% per annum. The loan is repayable in 6652 quarterly installments commencing July 15, 2012.June 2020. The borrowing is collateralized by first charge on Company’s movable and immovable properties of the underlying solar power project assets with a net carrying value of INR 573 million (US$7.0 million) as of March 31, 2023 and pledge of 51% shares of the SPV held by Azure Power India Private Limited and Corporate Guarantee which shall terminate as per conditions stipulated in the Rupee Term Loan Agreement. The net carrying value of the loan as of March 31, 2023 is INR 317 million (US$3.9 million).
The net carrying value of the loan borrowed for financing of its 90 MW solar project with Assam Power Distribution Company Limited as on March 31, 2023 is INR 3,409 (US$41.5 million) from Indian renewable energy development agency limited (IREDA The loan carry fixed interest rate of 7.5% payable monthly as applicable for Renewable Energy Projects with 3 year reset as per IREDA’s policy. The loan is repayable in 234 monthly instalments ranging from 0.30% to 0.70% of loan amount commencing October 2022. The borrowing is collateralized by the underlying solar power project assets with a net carrying value of INR 618,1884,705 million (US$ 9,533)57.3 million) as of March 31, 2017.2023, pledge of 51% shares of SPV held by the Azure Power India Pvt Ltd and further the loan is guaranteed by Azure Power India Pvt Ltd.
From October 2012 through September 2013,
The net carrying value of the Companyloan as of March 31, 2023 is INR 2,225 million (US$27.1 million), borrowed INR 3,503,984 (US$63,709) for the financing of a 35 MW solar power project which carries a fixedwith NTPC Vidyut Vyapar Nigam Limited from NIIF Infrastructure Finance Ltd and Kotak Infra Debt Fund Limited. These facilities carry an interest rate. Therate of 8% per annum. the loan is repayable in 36 semi-annual installments which commenced on August 20, 2013.47 quarterly instalments ranging from 1.59% to 2.44% of loan amount commencing from September 2021. The borrowing is collateralized by movable and immovable properties of the underlying solar power project assets with a net carrying value of INR 2,897,2302,217 million (US$ 44,676)27.0 million) as of March 31, 2017.2023 and pledge of 51% shares of the SPV held by the Azure Power India Pvt Ltd.
The fixednet carrying value of the loan borrowed for financing of its 600 MW solar project with Solar Energy Corporation of India as on March 31, 2023 is INR 22,152 million (US$269.5 million). from L & T finance Limited, Indian renewable Energy Development Agency Limited (IREDA) and L&T Infra Credit Pvt Ltd. The loan carries rate of interest foreign currency loans carry anof 7.2% payable monthly and the interest rate ranging from 4.07% to 6.43%is applicable for Renewable Energy Projects with an Integrated Rating of IR-2, with 3 year reset as per annum.
During the year ended March 31, 2015, the Company entered into an unsecured credit facility commitment for financing future rooftop solar power projects. The total amount of the facility is INR 1,326,658 (US$20,000). The interest rate for the facility is fixed at lender’s base rate plus 2.25% per annum at the time of first disbursement. TheL&T Finance policy. loan is repayable in 54 quarterly243 installments which will commence on October 15, 2017. During the period ended March 31, 2017, anranging from 0.30% to 0.58% of loan amount of INR 49,077 (US$ 757) at an interest rate of 4.42% has been borrowed under this facility and the Company has incurred deferred financing cost of INR 17,640 (US$ 272) in relation to this facility.commencing from July 2022. The borrowing is collateralized by the underlying solar power project assets with a net carrying value of INR 47,38926,784 million (US$ 731)325.9 million) as of March 31, 2017.2023, pledge of 51% of equity shares and CCDs of the SPV held by the Azure Power India Private Limited and further the loan is guaranteed by Azure Power India Pvt Ltd.
During the year ended March 31, 2021, the Company borrowed an amount of INR 413 million (US$5.0 million) from Kotak Infrastructure Debt Fund Limited for financing of a 10 MW solar power project with Bangalore Electricity Supply Company Limited. As on March 31, 2023 the loan carries the interest rate of 11% per annum, The loan is repayable in 54 quarterly instalments ranging from 1.85% - 1.88% commencing from December 2020. The borrowing is collateralized by movable and immovable properties of the underlying solar power project assets with a net carrying value of INR 587 million (US$7.1 million) as of March 31, 2023, net carrying value of the foreign currency loans includes unrealized foreign exchange losses of INR 1,580,504 and INR 1,560,068 (US$ 24,057)loan as of March 31, 2016 and 2017, respectively.2023 is INR 336 million (US$4.1 million).
The net carrying value of the loan borrowed for financing of its 300 MW solar project with Solar Energy Corporation of India as on March 31, 2023 is INR 1,534 million (US$18.7 million) from State Bank of India. The loan carries interest rate of SBI 6-month MCLR +2.60%which is presently 9.55% p.a. payable monthly and after operation date the interest rate will be 6 Month MCLR plus margin based on credit ratings payable monthly. The loan is repayable in 222 installments ranging from 0.21% to 0.77% of the loan amount commencing from December 2022. The borrowing is collateralized by first ranking pari passu mortgage charge on all immovable and movable properties of the borrower with a net carrying value of INR 15,882 million (US$193.3 million) as on March 31,2023 and pledge of 51% equity shares of the Company in requiredheld by holding Company.
During the current year, certain subsidiaries falling under the disposable group of rooftop entities has raised unsecured term loans from its minority shareholder amounting to maintain principal and interest, bothINR 1,161 million (US$14.1 million) as defined in the respective agreements, as a reserve with banks specified by the respective lenders. Such amounts, totaling INR 418,572 and INR 436,239 (US$ 6,727) at March 31, 20162023 and 2017,INR 1,118 million (US$14.7 million) as at March 31, 2022 respectively. These funds have been used for settlement of inter group loans between subsidiaries. which are classifiedalso consolidated in the Company.
As of March 31, 2023, the Company has unused commitments excluding Rooftop portfolio for long-term financing arrangements amounting to INR 3,820 million (US$46.5 million) for solar power projects.
Trade credit
As of March 31, 2023, the Company has a buyer’s credit facility amounting to INR 7,840 million (US$95.4 million) for one of its under construction SPVs for 300 MW solar power project with Solar Energy Corporation of India. This facility carries a floating interest rate of 12 Month SOFR and spread ranging plus 0.21 PCT.
Other long-term loans
During the previous year ended March 31, 2022, the Company has taken loan of INR 7 million (US$0.1 million) from HDFC Bank. Borrowing under this facility is repayable in 60 monthly instalments from 1.39% - 1.98% of the loan amount commencing from November 2021 and ending October 2026. The facility carries an interest rate of 7.2%per annum. The loan is repaid during the current year ended March 31, 2023.
During the previous year ended March 31, 2022, the Company has taken loan of INR 2 million (US$0.0 million) from HDFC Bank. The loan was repayable in 60 monthly instalments ranging from 1.39% - 1.97% of the loan amount commencing from January 2022 and ending December 2026. The facility carries an interest rate of 7.1% as restricted cashnon-current onof March 31, 2023. The net carrying value of the consolidated balance sheets.loan as of March 31, 2023, is INR 2 million (US$0.0 million).
During the current year ended March 31, 2023, the Company has obtained car loan of INR 8 million (US$0.1 million). Borrowing under this facility is repayable in 60 monthly instalments ranging from 1.38% - 1.98% of the loan amount commencing from January 2022 and ending December 2026. The foreign currency loansfacility carries an interest rate of 7.35% as of March 31, 2023. The net carrying value of the loan as of March 31, 2023, is INR 7 million (US$0.1 million).
Covenants and debt financing costs
These aforementioned borrowings are subject to certain financial andnon-financial covenants. Financial covenants include cash flow to debt service, indebtedness to net worth ratio, debt equity ratio and maintenance of debt service balances. As of March 31, 2017, the Company is in compliance with all such covenants.
Indian rupee loans
The Indian rupee loans are subject to certain financial andnon-financial covenants. Financial covenants include cash flow to debt service ratio, indebtedness to net worth ratio, debt equity ratio, debt service coverage ratio, receivable to sales ratio and maintenance of debt service balances. As of March 31, 2017, the Company is in compliance with all such covenants.
In December 2013, the Company borrowed INR 143,740 (US$2,195) for the financing of a 2.5 MW solar power project, which carries an interest rate of 12.15% per annum to be periodically revised by the lender. The interest rate as of March 31, 2017 was 12.15% per annum and the weighted average interest rate for the year ended March 31, 2017 was 12.15% per annum. The loan is repayable in 29 semi-annual installments which commenced on January 15, 2014. The borrowing is collateralized by the underlying solar power project assets with a net carrying value of INR 141,911 (US$ 2,188) as of March 31, 2017.
AZURE POWER GLOBAL LIMITED
Notes to Consolidated Financial Statements
(INR and US$ amounts in thousands except share and per share data)
From March 2014 through March 2016, the Company borrowed INR 228,848 (US$ 3,454) for financing of a 4 MW solar rooftop power project, which carries an interest rate at a base rate, as defined, plus 2.25% per annum. The interest rate as of March 31, 2017 was 11.95% per annum and the weighted average interest rate for the year ended March 31, 2017 was 11.95% per annum. The loan is repayable in 54 quarterly installments commencing on March 28, 2015. The borrowing is collateralized by the underlying solar rooftop power project assets with a net carrying value of INR 239,012 (US$ 3,686) as of March 31, 2017.
From March 2014 through September 2014, the Company borrowed INR 1,880,000 (US$28,702) for financing of a 34 MW solar power project, which has been refinanced by new loan amounting to INR 1,740,000 (US$ 26,831) during September, 2016. The unamortized carrying value of ancillary cost of borrowing as on the date of refinancing of INR 35,014 (US$ 540) has been expensed as interest expense during the period. The floating interest rate as of March 31, 2017 was 10.6% — 11.0% per annum and the weighted average interest rate for the year ended March 31, 2017 was 11.58% per annum. The loan is repayable in 70 equal quarterly installments commencing October 1, 2016. The borrowing is collateralized by the underlying solar power project assets with a net carrying value of INR 1,772,555 (US$27,333) as of March 31, 2017.
In September 2014, the Company borrowed INR 550,000 (US$8,397) for financing of a 10 MW solar power project, which carries a floating rate of interest at a base rate, as defined, plus 2.25% per annum. The floating interest rate as of March 31, 2017 was 11.25% per annum and the weighted average interest rate for the year ended March 31, 2017 was 12.14% per annum. The loan is repayable in 44 quarterly installments commencing January 27, 2016. The borrowing is collateralized by the underlying solar power project assets with a net carrying value of INR 539,974 (US$ 8,327) as of March 31, 2017
From November 2014 through January 2015, the Company borrowed INR 585,000 (US$ 8,931) for financing of a 10 MW solar power project, which carries a floating rate of interest to be periodically revised by the lender. The floating interest rate as of March 31, 2017 was 11.25% per annum and the weighted average interest rate for the year ended March 31, 2017 was 12.14% per annum. The loan is repayable in 58 quarterly installments commencing January 17, 2016. The borrowing is collateralized by the underlying solar power project assets with a net carrying value of INR 576,958 (US$ 8,897) as of March 31, 2017.
From May 2015 through June 2015, the Company borrowed INR 1,601,000 (US$24,188) for financing of a 30 MW solar power project, which carries a floating rate of interest at a base rate plus 1.5% per annum. The floating interest rate as of March 31, 2017 was 11.75% per annum and the weighted average interest rate for the year ended March 31, 2017 was 11.75% per annum. The loan is repayable in 57 quarterly instalments commencing March 31, 2016. The borrowing is collateralized by the underlying solar power project assets with a net carrying value of INR 1,665,521 (US$ 25,683) as of March 31, 2017.
From December 2014 through September 2015, the Company borrowed INR 2,050,000 (US$30,971) for financing of a 40 MW solar power project, which carries a floating rate of interest which will reset after every 2 years from the date of commissioning. The interest rate as of March 31, 2017 from a consortium of lenders was in the range of 11.43 % per annum to 12.25 % per annum floating with additional 1% per annum interest during the construction period. The weighted average interest rate for the year ended March 31, 2017 was 11.98 % per annum. The loan is repayable in 57 quarterly instalments commencing October 15, 2015. The borrowing is collateralized by the underlying solar power project assets with a net carrying value of INR 2,067,759 (US$ 31,885) as of March 31, 2017.
From December 2014 through September 2015, the Company borrowed INR 2,363,100 (US$35,702) for financing of a 40 MW solar power project, which carries a floating rate of interest which will reset after every
AZURE POWER GLOBAL LIMITED
Notes to Consolidated Financial Statements
(INR and US$ amounts in thousands except share and per share data)
2 years from the date of commissioning. The interest rate as of March 31, 2017 from a consortium of lenders was 12.25% per annum floating with additional 1% per annum interest during construction period. The weighted average interest rate for the year March 31, 2017 was 12.25% per annum. The loan is repayable in 48 quarterly instalments commencing May 31, 2016. The borrowing is collateralized by the underlying solar power project assets with a net carrying value of INR 2,380,771 (US$ 36,712) as of March 31, 2017.
From December 2014 through September 2015, the Company borrowed INR 1,173,500 (US$17,729) for financing of a 20 MW solar power project, which carries a floating rate of interest which will reset after every 2 years from the date of commissioning. The interest rate as of March 31, 2017 from a consortium of lenders was 12.25% per annum floating with additional 1% per annum interest during the construction period. The weighted average interest rate for the year ended March 31, 2017 was 12.25% per annum. The loan is repayable in 48 quarterly instalments commencing May 31, 2016. The borrowing is collateralized by the underlying solar power project assets with a net carrying value of INR 1,186,929 (US$ 18,303) as of March 31, 2017.
In September 2015, the Company borrowed INR 1,233,000 (US$18,824) for financing of a 28 MW solar power project, which has been refinanced by new loan amounting to INR 1,600,000 (US$ 24,672) during August, 2016. The unamortized carrying value of ancillary cost of borrowing as on the date of refinancing of INR 23,159 (US$ 357) has been expensed as interest expense during the period. The floating interest rate as of March 31, 2017 was 11.00% per annum and the weighted average interest rate for the year ended March 31, 2017 was 11.38% per annum. The loan is repayable in 72 quarterly installments commencing October 1, 2016. The borrowing is collateralized by the underlying solar power project assets with a net carrying value of INR 1,419,299 (US$ 21,886) as of March 31, 2017.
In January 2016, the Company borrowed INR250,000 (US$ 3,774) for financing of a 5 MW solar power project, which carries a floating rate of interest which will be subject to revision on expiry of every 2 years as per the interest guidelines of IREDA. The rate of interest is 11.4% and the weighted average interest rate for the year ended March 31, 2017 was 11.4% per annum with additional interest during construction period of 0.5% per annum. The loan is repayable in 48 monthly installments commencing March 31, 2017. The borrowing is collateralized by the underlying solar power project assets with a net carrying value of INR 299,643 (US$ 4,621) as of March 31, 2017.
From January 2016 through March 2016, the Company borrowed INR2,562,300 (US$ 39,511) for financing of a 50 MW solar power project, which carries a floating rate of interest at a base rate, as defined, minus 2.55% per annum. The floating interest rate as of March 31, 2017 was 10.95% per annum and the weighted average interest rate for the year ended March 31, 2017 was 11.77% per annum. The loan is repayable in 65 quarterly installments commencing June 30, 2017. The borrowing is collateralized by the underlying solar power project assets with a net carrying value of INR 2,952,478 (US$ 45,528) as of March 31, 2017.
From April 2016 through May 2016, the Company borrowed INR 463,050 (US$ 7,140) for financing of a 10 MW solar power project. The floating interest rate as of March 31, 2017 was 12.15% per annum and the weighted average interest rate for the year ended March 31, 2017 was 12.15% per annum. The loan is repayable in 56 quarterly installments commencing October 1, 2016. The borrowing is collateralized by the underlying solar power project assets with a net carrying value of INR 622,670 (US$ 9,602) as of March 31, 2017.
From May 2016 through March 2017, the Company borrowed INR 538,100 (US$ 8,298) for financing of a 10 MW solar power project. The floating interest rate as of March 31, 2017 was 11.35% per annum and the weighted average interest rate for the year ended March 31, 2017 was 11.35% per annum. The loan is repayable in 60 quarterly installments commencing June 30, 2017. The borrowing is collateralized by the underlying solar power project assets with a net carrying value of INR 598,902 (US$ 9,235) as of March 31, 2017.
AZURE POWER GLOBAL LIMITED
Notes to Consolidated Financial Statements
(INR and US$ amounts in thousands except share and per share data)
From August 2016 through March 2017, the Company borrowed INR 5,981,800 (US$ 92,241) for financing of a 150 MW solar power project. The floating interest rate as of March 31, 2017 was 10.50% — 11.25% per annum and the weighted average interest rate for the year ended March 31, 2017 was 11.25% per annum. The loan is repayable in 66 quarterly installments commencing December 31, 2017. The borrowing is collateralized by the underlying solar power project assets with a net carrying value of INR 6,304,848 (US$ 97,222) as of March 31, 2017.
In November 2016, the Company borrowed INR 261,400 (US$ 4,031) for financing of a 14 MW solar power project. The floating interest rate as of March 31, 2017 was 11.20% per annum and the weighted average interest rate for the year ended March 31, 2017 was 11.20% per annum. The loan is repayable in 55 quarterly installments commencing June 30, 2018. The borrowing is collateralized by the underlying solar power project assets with a net carrying value of INR 296,518 (US$ 4,572) as of March 31, 2017.
From October 2016 through February 2017, the Company borrowed INR 1,293,472 (US$ 19,946) for financing of a 40 MW solar power project from consortium of lenders. The floating interest rate as of March 31, 2017 was 10.35% — 11.75% per annum and the weighted average interest rate for the year ended March 31, 2017 was 11.04% per annum. The loan is repayable in 64 quarterly installments commencing January 15, 2017. The borrowing is collateralized by the underlying solar power project assets with a net carrying value of INR 2,377,467 (US$ 36,661) as of March 31, 2017.
From October 2016 through November 2016, the Company borrowed INR 1,315,371 (US$ 20,283) for financing of a 40 MW solar power project from consortium of lenders. The floating interest rate as of March 31, 2017 was 10.35% — 11.75% per annum and the weighted average interest rate for the year ended March 31, 2017 was 10.93% per annum. The loan is repayable in 64 quarterly installments commencing January 15, 2017. The borrowing is collateralized by the underlying solar power project assets with a net carrying value of INR 2,145,837 (US$ 33,089) as of March 31, 2017.
In November 2016, the Company borrowed INR 356,250 (US$ 5,493) for financing of a 7 MW solar power project. The floating interest rate as of March 31, 2017 was 11.25% per annum and the weighted average interest rate for the year ended March 31, 2017 was 11.25% per annum. The loan is repayable in 63 quarterly installments commencing October 1, 2017. The borrowing is collateralized by the underlying solar power project assets with a net carrying value of INR 415,359 (US$ 6,405) as of March 31, 2017.
In March 2017, the Company borrowed INR 1,000,000 (US$ 15,420) for financing of a 100 MW solar power project. The floating interest rate as of March 31, 2017 was 11.00% per annum and the weighted average interest rate for the year ended March 31, 2017 was 11.00% per annum. The loan is repayable in 74 quarterly installments commencing September 30, 2018. The borrowing is collateralized by the underlying solar power project assets with a net carrying value of INR 396,337 (US$ 6,112) as of March 31, 2017.
In March 2017, the Company borrowed INR 825,000 (US$ 12,722) for financing of a 50 MW solar power project. The floating interest rate as of March 31, 2017 was 11.25% per annum and the weighted average interest rate for the year ended March 31, 2017 was 11.25% per annum. The loan is repayable in 63 quarterly installments commencing September 30, 2018. The borrowing is collateralized by the underlying solar power project assets with a net carrying value of INR 899,177 (US$ 13,865) as of March 31, 2017.
In March 2017, the Company borrowed INR 375,000 (US$ 5,783) for financing of a 10 MW solar power project. The floating interest rate as of March 31, 2017 was 10.75% per annum and the weighted average interest rate for the year ended March 31, 2017 was 10.75% per annum. The loan is repayable in 37 quarterly
AZURE POWER GLOBAL LIMITED
Notes to Consolidated Financial Statements
(INR and US$ amounts in thousands except share and per share data)
installments commencing September 30, 2017. The borrowing is collateralized by the underlying solar power project assets with a net carrying value of INR 567,092 (US$ 8,745) as of March 31, 2017.
In March 2017, the Company borrowed INR 2,300,000 (US$ 35,466) for financing of a 100 MW solar power project from consortium of lenders. The floating interest rate as of March 31, 2017 was 10.75% —12.00% per annum and the weighted average interest rate for the year ended March 31, 2017 was 11.88% per annum. The loan is repayable in 73 quarterly installments commencing June 30, 2018. The borrowing is collateralized by the underlying solar power project assets with a net carrying value of INR 2,228,308 (US$ 34,361) as of March 31, 2017.
As of March 31, 2017,2023, the Company has unused commitmentswas in compliance with the financial covenants or remediated the non-compliance prior to the issuance of these financial statements except for long-term financing arrangements amountingthe loans aggregating to INR 16,227,730 (US$ 250,235) for solar power projects.
For certain of the Indian rupee loans, two of the directors of2,202 million, wherein the Company have provided personal guaranteeswas not in favor ofcompliance with the lendersfinancial covenants and have also pledged part of their shareholding with these lenders.
Short termclassified the loan facilities
Facility 1
In September 2015, the Company entered into a revolving credit facility in the amount of INR 1,000,000 (US$15,108). Borrowings under this facility are repayable within 12 months of disbursement. Two directors of AZI have given personal guarantees in favor of the lenders. The Company has also pledged shareholding of two project subsidiaries.
In November 2015, the Company borrowed INR 480,000 (US$7,334) for financing a 10 MW solar power project. The weighted average interest rate for the year ended March 31, 2017 was 13.25% per annum. The loan is repayable within 12 months from the date of 1st disbursement for the project and is further collateralized by the assets created from the respective disbursement. The borrowing has been repaid during the year and no amounts are outstanding under this facility at March 31, 2017.
In December 2015, the Company borrowed INR 418,000 (US$6,320) for financing a 10 MW solar power project. The weighted average interest rate for the year ended March 31, 2017 was 13.25% per annum. The loan is repayable within 12 months from the date of first disbursement for the project and is further collateralized by the assets created from the respective disbursement. The borrowing has been repaid during the year and no amounts are outstanding under this facility at March 31, 2017.
Facility 2
In February 2016, the Company borrowed INR 375,000 (US$5,660) for financing a 10 MW solar power project. The weighted average interest rate for the year ended March 31, 2017 was 13.25% per annum. The loan is repayable within 12 months from the date of disbursement for the project and is collateralized by the assets created from the disbursement. The borrowing has been repaid during the year and no amounts are outstanding under this facility at March 31, 2017
Facility 3
In February 2017, the Company borrowed INR 2,500,000 (US$ 38,551) for financing a 100 MW solar power project. The interest rate as of March 31, 2017 was 12.75% per annum. The loan is repayable within 12 months from the date of disbursement for the project and is collateralized by the assets created from the disbursement.
AZURE POWER GLOBAL LIMITED
Notes to Consolidated Financial Statements
(INR and US$ amounts in thousands except share and per share data)current debt.
From time to time, the Company is required to maintain principal and interest, both as defined in the respective agreements, as a form of collateral with banks specified by the respective lenders. Such amounts, totaling INR 918,690 (US$ 14,166) as of March 31, 2016, are classified as restricted cash on the consolidated balance sheets. Generally, under the terms of the loan agreements entered into by the Company’s project subsidiaries, the project subsidiaries are restricted from paying dividends, to APGL if they default in payment of their principal, interest and other amounts due to the lenders under their respective loan agreements. Certain of APGL’s project subsidiaries also may not pay dividends to AZI out of restricted cash.
As
The carrying value of debt financing costs as on March 31, 2022 and March 31, 2023 was INR 1,189 million and INR 1,010 million (US$12.3 million), respectively, for the above loans, which is amortized over the term of the contract using the effective interest rate method.
Timely submission of financial statements of the Group, our subsidiaries and/or our subsidiary restricted groups is a key covenant in most of our financing agreements. We have received the time extensions from all lenders until April 30, 2024, towards submission of audited financial statements for FY 2022-23 and expect to submit the audited financial statements with lenders within given extended timelines.
Restricted cash
The Company is required to maintain principal and interest, both as defined in the respective agreements, as a reserve with banks specified by the respective lenders. Such amounts, totalling INR 1,786 million and INR 3,402 million (US$41.4 million) as of March 31, 2017,2022 and March 31, 2023, respectively, are classified as restricted cash on the Company has fully drawn the commitments for revolving credit facilities for solar power projects.consolidated balance sheets.
As of March 31, 2017,2023, the aggregate maturities of long termlong-term debt isare as follows:
| | | | | | | | |
| | | Annual maturities | |
| March 31, | | INR | | | US$ | |
2018 | | | 1,622,519 | | | | 25,020 | |
2019 | | | 2,225,730 | | | | 34,321 | |
2020 | | | 2,048,910 | | | | 31,595 | |
2021 | | | 2,733,616 | | | | 42,153 | |
2022 | | | 2,503,208 | | | | 38,600 | |
Thereafter | | | 22,433,053 | | | | 345,922 | |
| | | | | | | | |
Total | | | 33,567,036 | | | | 517,611 | |
| | | | | | | | |
| | | Annual maturities (1) | |
| As of March 31, | | INR | | | US$ | |
| | | (In million) | |
| 2024 | | | 24,028 | | | | 292.3 | |
| 2025 | | | 43,840 | | | | 533.4 | |
| 2026 | | | 10,351 | | | | 125.9 | |
| 2027 | | | 39,013 | | | | 474.7 | |
| 2028 | | | 4,707 | | | | 57.3 | |
| Thereafter | | | 52,951 | | | | 644.2 | |
| Total: aggregate maturities of long-term debt | | | 174,890 | | | | 2127.8 | |
| Less: carrying value of unamortized debt financing costs | | | (1,010 | ) | | | (12.3 | ) |
| Net maturities of long-term debt | | | 173,880 | | | | 2,115.5 | |
| Less: current portion of long-term debt | | | 9,414 | | | | 114.5 | |
| Long-term debt | | | 164,466 | | | | 2,001.0 | |
11.
| (1) | Long term debt (principal) obligations for foreign currency denominated borrowings have been translated to Indian rupees using the closing exchange rate as of March 31, 2023 as per Reserve Bank of India. |
13. Income Taxes
The individual entities within the Company file individual tax returns as per the regulations existing in their respective jurisdictions.
The fiscal year under the Indian Income Tax Act ends on March 31. A portion of the Company’s Indian operations qualify for deduction from taxable income because its profits are attributable to undertakings engaged in development of solar power projects under section80-IA of the Indian Income Tax Act, 1961. This holiday is available for a period of ten consecutive years out of fifteen years beginning from the year in which the Company generates power (“Tax Holiday Period”), however,. However, the exemption is only available to the projects completed on or before March 31, 2017. The Company anticipates that it will claim the aforesaid deduction in the last ten years out of fifteen years beginning with the year in which the Company generates power and when it has taxable income. Accordingly, its current operations are taxable at the normally applicable tax rates.
Due to the Tax Holiday Period, a substantial portion of the temporary differences between the book and tax basis of the Company’s assets and liabilities do not have any tax consequences as they are expected to reverse within the Tax Holiday Period.
AZI and a subsidiary provide services to other group subsidiaries and incur income taxesrates, based on profits from these services. These services are capitalizable by the subsidiaries and are hence capitalized as part of property, plant and equipment in the standalone financial statements of such subsidiaries and deducted in their respective income tax return in the form of depreciation expense. However, these capitalized costs are eliminated in the Company’s consolidated financial statements. AZI treats the income tax it incurs on the provision of such services to its subsidiaries as prepaid income taxes to the extent the amounts are expected to be deductible by the subsidiaries in their tax returns outside of the Tax Holiday Period.
AZURE POWER GLOBAL LIMITED
Notes to Consolidated Financial Statements
(INR and US$ amounts in thousands except share and per share data)eligibility criteria.
The provision (benefit) for income taxes consists of the following:
| | | | | | | | | | | | |
| | | Current | | | Deferred | | | Total | |
Year ended March 31, 2015 | | | 191,933 | | | | 61,179 | | | | 253,112 | |
Year ended March 31, 2016 | | | 28,667 | | | | 299,078 | | | | 327,745 | |
Year ended March 31, 2017 | | | 509,083 | | | | 383,250 | | | | 892,333 | |
| | | | | | | | | | | | |
US$ | | | 7,850 | | | | 5,910 | | | | 13,760 | |
Income/(loss) before income taxes is as follows:
| | | | | | | | | | | | | | | | |
| | | As of March 31, | |
| | | 2015
(INR) | | | 2016
(INR) | | | 2017
(INR) | | | 2017
(US$) | |
Domestic operations | | | (247 | ) | | | (56,881 | ) | | | (28,504 | ) | | | (440 | ) |
Foreign operations | | | (835,231 | ) | | | (1,270,214 | ) | | | (270,732 | ) | | | (4,174 | ) |
| | | | | | | | | | | | | | | | |
Total | | | (835,478 | ) | | | (1,327,095 | ) | | | (299,236 | ) | | | (4,614 | ) |
The significant components of the net deferred income tax assets and liabilities exclusive of amounts that would not have any tax consequences because they will reverse within the Tax Holiday Period, are as follows:
| | | | | | | | | | | | |
| | | As of March 31, | |
| | | 2016
(INR) | | | 2017
(INR) | | | 2017
(US$) | |
Deferred tax assets: | | | | | | | | | | | | |
Allowance for doubtful accounts | | | 415 | | | | 415 | | | | 6 | |
Other deductible temporary difference | | | 202,505 | | | | 243,950 | | | | 3,763 | |
Net operating loss | | | 379,920 | | | | 12,845 | | | | 198 | |
| | | | | | | | | | | | |
Gross deferred tax assets | | | 582,840 | | | | 257,210 | | | | 3,967 | |
Valuation allowance | | | (8,569 | ) | | | (12,845 | ) | | | (198 | ) |
| | | | | | | | | | | | |
Total gross deferred tax assets | | | 574,271 | | | | 244,365 | | | | 3,769 | |
| | | | | | | | | | | | |
| Deferred tax liabilities: | | | | | | | | | | | | |
Depreciation and amortization | | | (988,897 | ) | | | (1,261,828 | ) | | | (19,458 | ) |
Gain on sale ofnon-controlling interest | | | (19,333 | ) | | | (19,335 | ) | | | (298 | ) |
Other comprehensive income | | | — | | | | (10,028 | ) | | | (154 | ) |
Other taxable temporary differences | | | (1,428 | ) | | | — | | | | — | |
| | | | | | | | | | | | |
Total gross deferred tax liabilities | | | (1,009,658 | ) | | | (1,291,191 | ) | | | (19,910 | ) |
Net deferred tax liability | | | (435,387 | ) | | | (1,046,826 | ) | | | (16,141 | ) |
At March 31, 2016 and 2017, net deferred tax assets were INR 34,661 and INR 31,429 (US$ 485), and net deferred tax liabilities were INR 470,048 and INR 1,078,255 (US$ 16,627), respectively.
At March 31, 2017, the Company performed an analysis of the deferred tax asset valuation allowance for APGL and its Indian and US subsidiaries. Based on the analysis, the Company has concluded that a valuation allowance offsetting the deferred tax assets is required as of March 31, 2017 on the basis that it is more likely than not that APGL will not be able to utilize the entirety of its net operating losses as it has no business operations of its own.
AZURE POWER GLOBAL LIMITED
Notes to Consolidated Financial Statements
(INR and US$ amounts in thousands except share and per share data)
Change in the valuation allowance for deferred tax assets as of March 31, 2015, 2016 and 2017 is as follows:
| | | | | | | | | | | | | | | | |
| | | March 31, | |
| | | 2015 | | | 2016 | | | 2017 | | | 2017 | |
| | | (INR) | | | (INR) | | | (INR) | | | (US$) | |
Opening valuation allowance | | | 61,129 | | | | 37 | | | | 8,569 | | | | 132 | |
Movement during the period | | | (61,092 | ) | | | 8,532 | | | | 4,275 | | | | 66 | |
Closing valuation allowance | | | 37 | | | | 8,569 | | | | 12,845 | | | | 198 | |
The effective income tax rate differs from the amount computed by applying the statutory income tax rate to loss before income taxes as follows:
| | | | | | | | | | | | | | | | | | | | | | | | |
| | | Year ended 2015 | | | Year ended 2016 | | | Year ended 2017 | |
| | | Tax | | | % | | | Tax | | | % | | | Tax | | | % | |
Statutory income tax benefit | | | (283,979 | ) | | | (33.99 | %) | | | (459,308 | ) | | | (34.61 | %) | | | (103,494 | ) | | | (34.60 | %) |
Temporary differences reversing in the Tax Holiday Period | | | 223,409 | | | | 26.74 | % | | | 428,034 | | | | 32.25 | % | | | 223,897 | | | | 74.87 | % |
Taxes on intercompany transaction reversing in the Tax Holiday Period | | | 321,323 | | | | 38.46 | % | | | 256,143 | | | | 19.30 | % | | | 741,474 | | | | 247.96 | % |
Valuation allowance on net operating losses | | | (61,092 | ) | | | (7.31 | %) | | | 8,532 | | | | 0.64 | % | | | 4,275 | | | | 1.42 | % |
Other difference | | | 53,451 | | | | 6.40 | % | | | 94,344 | | | | 7.11 | % | | | 26,180 | | | | 8.55 | % |
| | | | | | | | | | | | | | | | | | | | | | | | |
| | | 253,112 | | | | 30.30 | % | | | 327,745 | | | | 24.70 | % | | | 892,333 | | | | 298.20 | % |
| | | | | | | | | | | | | | | | | | | | | | | | |
The Company had adopted the provisions of ASC Topic 740 as they relate to uncertain income tax positions. Tax exposures can involve complex issues and may require extended periods to resolve. The Company does not have any uncertain tax positions requiring to be reserved for.recognition. The Company reassesses its tax positions in light of changing facts and circumstances, such as the closing of a tax audit, refinement of an estimate, or changes in tax codes. To the extent that the final tax outcome of these matters differs from the amounts recorded, such differences will impact the provision for income taxes in the period in which such determination is made.
The provision (benefit) for income taxes consists of the following:
| | | Year ended March 31, | |
| | | 2021 | | | 2022 | | | 2023 | | | 2023 | |
| | | INR | | | INR | | | INR | | | US$ | |
| | | (In million) | |
| Current tax expense (1) | | | 242 | | | | 485 | | | | 707 | | | | 8.6 | |
| Withholding tax on interest on Inter-Company debt related to green bonds | | | 384 | | | | 367 | | | | 342 | | | | 4.2 | |
| Deferred income tax (benefit)/expense | | | (330 | ) | | | 464 | | | | 1,614 | | | | 19.6 | |
| Total | | | 296 | | | | 1,316 | | | | 2,663 | | | | 32.4 | |
| (1) | Current tax on profit before tax. Current tax includes reversal of INR 78 million (US$1.0 million) for tax adjustment relating to earlier years |
Income/(loss) before income taxes is as follows:
| | | March 31, | |
| | | 2021 | | | 2022 | | | 2023 | | | 2023 | |
| | | (INR) | | | (INR) | | | (INR) | | | (US$) | |
| | | (In million) | |
| Domestic operations | | | 8 | | | | 19 | | | | 333 | | | | 4.1 | |
| Foreign operations | | | (3,913 | ) | | | (829 | ) | | | 8 | | | | 0.1 | |
| Total | | | (3,905 | ) | | | (810 | ) | | | 341 | | | | 4.2 | |
Net deferred income taxes on the consolidated balance sheet is as follows:
| | | March 31, | |
| | | 2022 | | | 2023 | | | 2023 | |
| | | (INR) | | | (INR) | | | (US$) | |
| | | (In million) | |
| Deferred tax assets | | | 4,201 | | | | 3,592 | | | | 43.7 | |
| Less: valuation allowance | | | (2,281 | ) | | | (2,455 | ) | | | (29.9 | ) |
| Net deferred tax assets | | | 1,920 | | | | 1,137 | | | | 13.8 | |
| Deferred tax liability | | | 1,936 | | | | 3,338 | | | | 40.6 | |
At March 31, 2023, the Company performed an analysis of the recoverability of the deferred tax asset. Based on the analysis, the Company has concluded that a valuation allowance offsetting the deferred tax assets is required. Change in the valuation allowance for deferred tax assets as of March 31, 2022 and March 31, 2023 is as follows:
| | | March 31, | |
| | | 2022 | | | 2023 | | | 2023 | |
| | | (INR) | | | (INR) | | | (US$) | |
| | | (In million) | |
| Opening valuation allowance | | | 1,088 | | | | 2,281 | | | | 27.8 | |
| Movement during the Year* | | | 1,193 | | | | 174 | | | | 2.1 | |
| Closing valuation allowance | | | 2,281 | | | | 2,455 | | | | 29.9 | |
| * | For financial year 2022 and 2023, The movement also includes INR 843 million and INR 843 million (US$10.3 million) respectively relating to capital loss on rooftop and other asset classified as held for sale. The movement for financial year 2022 and 2023 also includes INR 125 million and reversal of INR Nil million respectively relating to other rooftop assets that are part of the sale agreement which are expected to be settled beyond 12 months. |
The significant components of the net deferred income tax assets and liabilities exclusive of amounts that would not have any tax consequences because they will reverse within the Tax Holiday Period, are as follows:
| | | As of March 31, | |
| | | 2022 | | | 2023 | | | 2023 | |
| | | (INR) | | | (INR) | | | (US$) | |
| | | (In million) | |
| Deferred tax assets: | | | |
| Net operating loss (a) | | | 12,309 | | | | 16,191 | | | | 197.0 | |
| Tax on Inter — Company margin | | | 210 | | | | (26 | ) | | | (0.3 | ) |
| Deferred revenue | | | 503 | | | | 599 | | | | 7.3 | |
| Asset retirement obligation | | | 232 | | | | 285 | | | | 3.5 | |
| Minimum alternate tax credit | | | 765 | | | | 1,287 | | | | 15.7 | |
| Other deductible temporary difference | | | 226 | | | | 376 | | | | 4.6 | |
| Capital loss on investment in rooftop and other assets | | | 843 | | | | 843 | | | | 10.3 | |
| Valuation allowance | | | (2,281 | ) | | | (2,455 | ) | | | (29.9 | ) |
| Deferred tax liabilities: | | | | | | | | | | | | |
| Depreciation and amortization | | | (12,732 | ) | | | (18,639 | ) | | | (226.8 | ) |
| Other comprehensive income | | | (91 | ) | | | (662 | ) | | | (8.1 | ) |
| Net deferred tax (liability) asset | | | (16 | ) | | | (2,201 | ) | | | (26.7 | ) |
(a) Includes deferred tax on unabsorbed depreciation that can be carried forward indefinitely for set off as per income tax laws.
APGL, the holding company and two of its subsidiaries incorporated in Mauritius have an applicable income tax rate of 15%. However, the group’s significant operations are based in India and are taxable as per the Indian Income Tax Act, 1961. For effective tax reconciliation purposes, the applicable tax rate in India has been considered. The income tax rate differs from the amount computed by applying the statutory income tax rate to loss before income taxes and is as follows:
| | | For the year ended March 31, | |
| | | 2021 | | | 2022 | | | 2023 | |
| | | Tax (INR million) | | | % | | | Tax (INR million) | | | % | | | Tax (INR million) | | | % | | | US$ million | |
| | | | |
| Statutory income tax (benefit)/expense | | | (1,365 | ) | | | 34.94 | % | | | (283 | ) | | | 34.94 | % | | | 119 | | | | 34.94 | % | | | 1.4 | |
| Temporary differences reversing in the Tax Holiday Period | | | (1,070 | ) | | | 27.40 | % | | | (9 | ) | | | (1.11 | )% | | | (586 | ) | | | (171.85 | )% | | | (7.1 | ) |
| Permanent timing differences | | | 1,423 | | | | (36.44 | )% | | | 43 | | | | (3.05 | )% | | | 2,919 | | | | 855.72 | % | | | 35.5 | |
| Valuation allowance created / (reversed) during the year | | | 871 | | | | (22.30 | )% | | | 1,193 | | | | (147.32 | )% | | | 174 | | | | 51.03 | % | | | 2.1 | |
| Tax adjustment relating to earlier years | | | - | | | | - | | | | 42 | | | | (5.19 | | | | (78 | ) | | | (22.87 | )% | | | (0.9 | ) |
| Withholding tax on interest on Inter-Company debt related to green bonds | | | 384 | | | | (9.83 | )% | | | 367 | | | | (45.31 | )% | | | 342 | | | | 100.29 | % | | | 4.2 | |
| Other difference | | | 53 | | | | (1.36 | )% | | | (37 | ) | | | (4.57 | )% | | | (227 | ) | | | (66.57 | )% | | | (2.8 | ) |
| Total | | | 296 | | | | (7.58 | )% | | | 1,316 | | | | (162.46 | )% | | | 2,663 | | | | 780.69 | % | | | 32.4 | |
During the year end March 31, 2020, The Taxation Laws (Amendment) Act, 2019 has brought key changes to corporate tax rates in the Income Tax Act, 1961, which reduced the tax rate for certain subsidiaries within the group to 25.17%. Azure Power India Private Limited and several of its subsidiaries which are claiming tax benefits under section 80-IA of the Income Tax Act had decided not to opt for this lower tax benefit and have continued under the old regime for the fiscal year ended March 31, 2022 and 2023. The statutory income tax rate as per the Income Tax Act, 1961 ranges between 25.17% to 34.94%, depending on the tax regime chosen by the particular subsidiary.
As of March 31, 2016,2021, 2022, and 2017,2023, deferred income taxes have not been provided for the Company’s share of undistributed net earnings of foreign operations due to management’s intent to reinvest such amounts indefinitely. Those earnings totaled INR 664,789 INR 1,217,312 and INR 1,315,335 (US$ 20,283) for the years ended March 31, 2015, 2016 and 2017, respectively.
AZURE POWER GLOBAL LIMITED
Notes to Consolidated Financial Statements
(INR and US$ amounts in thousands except share and per share data)
12.14. Interest expense, net
Interest expense, net consists of the following:
| | | | | | | | | | | | | | | | |
| | | Year ended March 31, | |
| | | 2015
(INR) | | | 2016
(INR) | | | 2017
(INR) | | | 2017
(US) | |
Interest expense: | | | | | | | | | | | | | | | | |
CCDs | | | 248,831 | | | | 408,172 | | | | 90,360 | | | | 1,392 | |
Series E and G CCPS | | | 96,500 | | | | 263,654 | | | | 73,840 | | | | 1,139 | |
Term loans | | | 598,845 | | | | 1,547,382 | | | | 2,439,052 | | | | 37,611 | |
Bank charges and other | | | 55,454 | | | | 106,568 | | | | 160,740 | | | | 2,479 | |
| | | | | | | | | | | | | | | | |
| | | 999,630 | | | | 2,325,776 | | | | 2,763,992 | | | | 42,621 | |
Interest income: | | | | | | | | | | | | | | | | |
Term and fixed deposits | | | 151,860 | | | | 221,532 | | | | 319,823 | | | | 4,932 | |
Gain on sale of investments | | | 13,949 | | | | 45,375 | | | | 72,074 | | | | 1,111 | |
Investmentsheld-to-maturity | | | — | | | | 33 | | | | 259 | | | | 4 | |
Interest Income related party | | | 2,031 | | | | — | | | | — | | | | — | |
| | | | | | | | | | | | | | | | |
| | | 167,840 | | | | 266,940 | | | | 392,156 | | | | 6,047 | |
| | | | | | | | | | | | | | | | |
Total | | | 831,790 | | | | 2,058,836 | | | | 2,371,836 | | | | 36,574 | |
| | | | | | | | | | | | | | | | |
| | | Year ended March 31, | |
| | | 2021 | | | 2022 | | | 2023 | | | 2023 | |
| | | (INR) | | | (INR) | | | (INR) | | | (US$) | |
| | | (In million) | |
| Interest expense: | | | | | | | | | | | | |
| Term loans | | | 8,399 | | | | 9,577 | | | | 9,644 | | | | 117.3 | |
| Bank charges and other (1) | | | 598 | | | | 3,069 | | | | 369 | | | | 4.5 | |
| Loss on account of modification of contractual cash flows | | | - | | | | 294 | | | | 30 | | | | 0.4 | |
| | | | 8,997 | | | | 12,940 | | | | 10,043 | | | | 122.2 | |
| Interest income: | | | | | | | | | | | | | | | | |
| Term and fixed deposits | | | 554 | | | | 578 | | | | 977 | | | | 11.9 | |
| Others | | | 33 | | | | 432 | | | | 691 | | | | 8.4 | |
| | | | 587 | | | | 1,010 | | | | 1,668 | | | | 20.3 | |
| Total | | | 8,410 | | | | 11,930 | | | | 8,375 | | | | 101.9 | |
13. (Gain)/ loss
| (1) | Bank charges and other includes amortization of debt financing costs of INR 369 million, INR 1,107 million and INR 336 million (US$4.1 million) for the years ended March 31, 2021, 2022 and 2023, respectively, and includes debt financing costs written off related to the debt refinancing amounting to INR 30 million, INR 739 million and INR Nil million respectively. |
15. Loss on foreign currency exchange
(Gain)/ loss
Loss on foreign currency exchange consists of the following:
| | | | | | | | | | | | | | | | |
| | | Year ended March 31, | |
| | | 2015
(INR) | | | 2016
(INR) | | | 2017
(INR) | | | 2017
(US$) | |
Unrealized loss/ (gain) on foreign currency loans | | | 240,656 | | | | 338,297 | | | | (126,943 | ) | | | (1,958 | ) |
Realized gain on foreign currency loans | | | (42,280 | ) | | | (80,542 | ) | | | (106,299 | ) | | | (1,639 | ) |
Unrealized loss on derivative instruments | | | 7,342 | | | | 11,069 | | | | 61,862 | | | | 954 | |
Realized loss on derivative instruments | | | 93,910 | | | | 74,313 | | | | 123,792 | | | | 1,909 | |
Other gain on foreign currency exchange | | | — | | | | — | | | | (61,540 | ) | | | (949 | ) |
| | | | | | | | | | | | | | | | |
| | | 299,628 | | | | 343,137 | | | | (109,128 | ) | | | (1,683 | ) |
| | | | | | | | | | | | | | | | |
| | | Year ended March 31, | |
| | | 2021 | | | 2022 | | | 2023 | | | 2023 | |
| | | (INR) | | | (INR) | | | (INR) | | | (US$) | |
| | | (In million) | |
| Unrealized loss/ (gain) on foreign currency loans | | | (12 | ) | | | 1 | | | | 26 | | | | 0.3 | |
| Realized (gain) loss on foreign currency loans | | | 13 | | | | - | | | | - | | | | - | |
| Realized loss/ (gain) on derivative instruments | | | (1 | ) | | | (4,886 | ) | | | - | | | | - | |
| Other loss on foreign currency exchange | | | 7 | | | | 4,852 | | | | 131 | | | | 1.6 | |
| Total | | | 7 | | | | (33 | ) | | | 157 | | | | 1.9 | |
14.
16. Equity and preferred shares
Equity shares
Equity shares have a par value of US$0.000625 per share at APGL. There is no limit on the number of equity shares authorized. As of March 31, 2016,2022, and 2017,2023, there were 1,758,08064,161,490 and 25,915,95664,166,360 equity shares issued and outstanding.
| | | As of March 31, | |
| | | 2022 | | | 2022 | | | 2023 | | | 2023 | |
| | | Number of shares | | | INR in thousands | | | Number of shares | | | INR in thousands | |
| Issued: | | | | | | | | | | | | |
| Outstanding and fully paid: | | | | | | | | | | | | |
| Equity shares of US$0.000625 par value each | | | | | | | | | | | | |
| Beginning balance | | | 48,195,962 | | | | 2,090 | | | | 64,161,490 | | | | 2,837 | |
| Issuance of new shares (1) | | | 15,828,917 | | | | 741 | | | | - | | | | - | |
| Exercise of ESOPs (2) | | | 136,611 | | | | 6 | | | | 4,870 | | | | 1 | |
| Ending balance | | | 64,161,490 | | | | 2,837 | | | | 64,166,360 | | | | 2,838 | |
AZURE POWER GLOBAL LIMITED
Notes to Consolidated Financial Statements
(INR and US$ amounts in thousands except share and per share data)
| (1) | During the previous year, the Company’s has raised proceeds of INR 18,621 million (US$245.4 million) net of issuance expenses through its Rights offering and has issued 15,828,917 equity shares (par value $0.000625 per share) at US$15.79 per share. These proceeds from the rights offering have been invested in subsidiaries and are utilised for repayment of existing corporate borrowings. |
| (2) | Refer Note 21 for details of ESOPs exercised during the year. |
Compulsorily convertible preferred ShareAccumulated other comprehensive loss
There is no limit of number of preferred shares. The Compulsorily Convertible Preferred Shares (CCPS), treated as mezzanine equity, consisted of the following:
| | | | | | | | | | | | |
| | | No of Shares | | | Total consideration
(INR) | | | Price per
share
(USD)* | |
Series A | | | 38,770 | | | | 92,492 | | | | 49 | |
Series B | | | 181,046 | | | | 503,994 | | | | 61 | |
Series C | | | 229,880 | | | | 381,600 | | | | 34 | |
Series D | | | 84,348 | | | | 474,964 | | | | 102 | |
Series F | | | 138,133 | | | | 1,550,508 | | | | 184 | |
Series H | | | 133,285 | | | | 3,840,339 | | | | 450 | |
Series I | | | 55,535 | | | | 1,666,490 | | | | 450 | |
| | | | | | | | | | | | |
| | | 860,997 | | | | 8,510,387 | | | | | |
| | | | | | | | | | | | |
In November 2008, AZI had issued 38,770 Series A CCPS for consideration of INR 91,617, (net of INR 875 share issue expenses). In February 2010, AZI had issued 181,046 Series B CCPS for consideration of INR 500,731 (net of INR 3,263 share issue expenses). In September 2011, AZI had issued 229,880 Series C CCPS for consideration of INR 377,562 (net of INR 4,038 share issue expenses). In September 2012, AZI had issued 84,348 Series D CCPS for consideration of INR 474,964 (net of INR NIL share issue expenses). From June 2014 to January 2015 AZI had issued 138,133 series F CCPS for a total consideration of INR 1,549,010 (net of INR 1,498 share issue expenses). Unless converted, the term of the Series A CCPS is a maximum of 19 years from the date of issue, whereas the terms of the Series B, Series C, Series D and Series F CCPS is a maximum of 20 years, as amended, from the date of issue. On July 25, 2015, the Series A, Series B, Series C, Series D, and Series F CCPS in AZI were exchanged for similar instruments in APGL having identical terms and conditions.
On July 25, 2015, APGL issued 133,285 Series H CCPS for consideration of INR 3,695,407 (net of INR 144,932 share issuance expenses). Unless converted, the term of the Series H CCPS is a maximum of 20 years from the date of issue. In September 2016, APGL issued 55,535 Series I CCPS for a consideration of INR 1,658,166 (net of INR 8,324 share issue expenses) with a term unless converted for 20 years from the date of issue.
The rights, preferences and privileges of the Company’s Series A, Series B, Series C, Series D, Series F, Series H and Series I CCPS (collectively, the “Mezzanine CCPS”) are as follows:
Voting
The Mezzanine CCPS rank pari passu with regards to voting rights. Holders of Mezzanine CCPS were entitled to vote on all matters and were entitled to the number of votes equal to the number of equity shares into which the Mezzanine CCPS shares were then convertible on the basis of the applicable conversion factor.
Dividend
Each of the Series A, Series B, Series C, Series D, and Series F holders of the Mezzanine CCPS were entitled to a 8.0% per annum per sharenon-cumulative dividend. Series H and Series I CCPS were entitled to an
AZURE POWER GLOBAL LIMITED
Notes to Consolidated Financial Statements
(INR and US$ amounts in thousands except share and per share data)
8% per annum per share cumulative dividendThe following represents the changes and thereafter they all participate pro rata on an as converted basis with the equity shareholders on any distributions madebalances to the equity shareholders. The Company had not declared or paid any dividends through March 31, 2017. The dividend had been accreted as liquidation preference.
Conversion
Eachcomponents of the Series A, Series B, Series D, Series F, Series H and Series I CCPS are convertible into equity shares of the Company at the option of the CCPS holders at any time at a conversion ratio of 1:1. The Series C CCPS were convertible into equity shares of the Company at the option of the CCPS holder at any time at a conversion ratio of 1:0.3423. Any Mezzanine CCPS which have not been converted into equity shares of the Company were compulsorily converted into equity shares of the Company, at the aforementioned ratios, upon listing of shares on execution of a QIPO or at their maturity date. Pursuant to the IPO in October 2016, the Company converted all the outstanding CCPS into 14,635,882 equity shares.
Liquidation
On occurrence of a liquidation event, as defined in the terms of the Mezzanine CCPS agreements, the Series A holders were eligible to receive an amount equal to 140% of the cash paid for the Series A CCPS, plus accrued and unpaid dividends, and the Series B, Series C, and Series D holders had the right to receive an amount equal to 200% of the cash paid, plus accrued and unpaid dividends, and the Series F holders had the right to receive an amount equal to 150% of the cash paid, plus accrued and unpaid dividends, and the Series H and Series I CCPS holders had the right to receive an amount equal to 108% of the cash paid, plus accrued and unpaid dividends. Upon such a liquidation event, the holders of the CCDs and Series E and G CCPS were entitled to receive amounts in preference to the Series B, Series C, Series D, Series F, Series H and Series I CCPS, who in turn receive amounts in preference to the holders of the Series A CCPS. Series A CCPS holders received amounts in preference to the Company’s equity shareholders.
Accounting
The Company had evaluated its accounting for the Mezzanine CCPS pursuant to ASC Topic 480 and ASC Topic 815 Derivative and Hedging. The Mezzanine CCPS did not satisfy the criteria for liability classification described in ASC Topic 480. In addition, the embedded features of the Mezzanine CCPS did not satisfy the criteria for separate accounting of the derivative from the host instrument pursuant to ASC Topic 815. However, because the Mezzanine CCPS contain certain redemption features that are not solely within the Company’s control, the Mezzanine CCPS were classified as temporary equity in the consolidated balance sheets.
The Mezzanine CCPS were being accreted to their buyback value through February 25, 2016, the earliest buyback date, so that the carrying amount equaled the mandatory redemption value at such date. Subsequently, the Company entered into an arrangement with the Mezzanine CCPS holders to extend the buyback date to December 31, 2016, without increasing the buyback value.
The Company incurred issuance costs amounting to INR 162,931 (US$2,512) which have been netted against the proceeds received from the issuance of Series A, Series B, Series C, Series D, Series F, Series H and Series I Mezzanine CCPS. The issuance costs were being accreted over the respective redemption periods on a straight-line basis. The amount accreted totaled INR 1,899, INR 147,532 and INR 8,324 (US$ 128) during the years ended March 31, 2015, 2016 and 2017, respectively.
AZURE POWER GLOBAL LIMITED
Notes to Consolidated Financial Statements
(INR and US$ amounts in thousands except share and per share data)accumulated other comprehensive loss:
| | | Foreign
currency
translation,
net of taxes | | | Cashflow
Hedge,
net of taxes | | | Total
accumulated
other
comprehensive
loss,
net of taxes | |
| | | (INR) | | | (INR) | | | (INR) | |
| | | (in millions) | | | (in millions) | | | (in millions) | |
| | | | |
| Balance as of March 31, 2021 | | | (6,082 | ) | | | 5,110 | | | | (972 | ) |
| Adjustments during the year | | | 2,943 | | | | (4,474 | ) | | | (1,531 | ) |
| Balance as of March 31, 2022 | | | (3,139 | ) | | | 636 | | | | (2,503 | ) |
| Adjustments during the year | | | (4,603 | ) | | | 2,867 | | | | (1,736 | ) |
| Balance as of March 31, 2023 | | | (7,742 | ) | | | 3,503 | | | | (4,239 | ) |
| Balance as of March 31, 2023 ((US$) (Note 2(d)) | | | (94.2 | ) | | | 42.6 | | | | (51.6 | ) |
15.
17. Earnings per share
The Company calculates earnings per share in accordance with FASB ASC Topic 260 Earnings perPer Share and FASB ASC Topic260-10-45 Determining Whether Instruments Granted in Share-Based Payment Transactions Are Participating Securities. Basic and diluted earnings losses per equity share give effect to the change in the number of equity shares of the Company. The calculation of basic earnings per equity share is determined by dividing net profit/loss attributable to APGL equity shareholders by the weighted average number of equity shares outstanding during the respective periods. The potentially dilutive shares, consisting of employee share options compulsorily convertible debentures, and compulsorily convertible preferred shares have been included in the computation of diluted net earnings per share and the weighted average shares outstanding, except where the result would be anti-dilutive.
The Mezzanine CCPS shareholders were entitled to participate, along with the equity shareholders, in the earnings of the Company. Under ASC Topic 260Earnings per Share, such participative rights would require the two class method of reporting EPS. As the preferred shares do not participate in losses, the Company had excluded these shares, as including them would be antidilutive.
Net (loss)/profit per share is presented below:
| | | | | | | | | | | | |
| | | Year ended March 31 | |
| | | 2015
(INR) | | | 2016
(INR) | | | 2017
(INR) | |
Net loss attributable to APGL equity shareholders | | | (1,082,995 | ) | | | (1,650,189 | ) | | | (1,172,645 | ) |
Add: Accretion on Mezzanine CCPS | | | (755,207 | ) | | | (1,347,923 | ) | | | (235,853 | ) |
Add: Accretion on redeemablenon-controlling interest | | | — | | | | (29,825 | ) | | | (44,073 | ) |
| | | | | | | | | | | | |
Total (A) | | | (1,838,202 | ) | | | (3,027,937 | ) | | | (1,452,571 | ) |
| | | | | | | | | | | | |
Shares outstanding for allocation of undistributed income: | | | | | | | | | | | | |
Equity shares | | | 1,758,080 | | | | 1,758,080 | | | | 25,915,956 | |
| | | |
Weighted average shares outstanding | | | | | | | | | | | | |
Equity shares (B) | | | 1,758,080 | | | | 1,758,080 | | | | 13,040,618 | # |
| | | |
Net loss per share — basic and diluted | | | | | | | | | | | | |
Equity shares (C=A/B) | | | (1,046 | ) | | | (1,722 | ) | | | (111 | ) |
| | | Year ended March 31 | |
| | | 2021 | | | 2022 | | | 2023 | | | 2023 | |
| | | (INR) | | | (INR) | | | (INR) | | | (US$) | |
| | | (amounts in millions, except share and per share data) | |
| Net loss attributable to APGL equity shareholders (A) | | | (4,206 | ) | | | (2,104 | ) | | | (2,285 | ) | | | (27.8 | ) |
| Shares outstanding for allocation of undistributed income: | | | | | | | | | | | | | | | | |
| Equity shares | | | 48,195,962 | | | | 64,161,490 | | | | 64,166,360 | | | | 64,166,360 | |
| Weighted average shares outstanding | | | | | | | | | | | | | | | | |
| Equity shares – Basic (B) | | | 47,979,581 | | | | 50,876,360 | | | | 64,166,360 | | | | 64,166,360 | |
| Equity shares – Diluted (C) | | | 47,979,581 | | | | 50,876,360 | | | | 64,166,360 | | | | 64,166,360 | |
| Net (loss)/profit per share – basic and diluted | | | | | | | | | | | | | | | | |
| Equity earnings/(loss) per share – Basic (D=A/B) | | | (87.66 | ) | | | (41.36 | ) | | | (35.61 | ) | | | (0.43 | ) |
| Equity earnings/(loss) per share – Diluted (E=A/C) | | | (87.66 | ) | | | (41.36 | ) | | | (35.61 | ) | | | (0.43 | ) |
# — The Company had 1,758,080 equity
Refer to Note 16 for details of shares outstanding for the period from April 1, 2016 till October 12, 2016 and 25,915,956 equity shares were outstanding from October 12, 2016 till March 31, 2017.issued.
The number of share options outstanding but not included in the computation of diluted earnings per equity share because their effect was antidilutive is 461,136, 414,880,184,600 and 540,280413,843 for years ended March 31, 2015, 20162022 and 2017,2023, respectively.
The CCDs, Series E CCPS and the Series G CCPS have not been considered for the computation of diluted earnings per share because these are considered to be anti-dilutive.
18. Leases
16. Leases
The Company leases office facilities and land use rights under operating lease agreements. Minimum lease payments underhas several non-cancellable operating leases, are recognized on a straight line basis over the term of the lease. Rent expenseprimarily for operating leases for the years ended March 31, 2015, 2016 and 2017 was INR 44,169, INR 70,039 and INR 172,528 (US$ 2,660), respectively.
AZURE POWER GLOBAL LIMITED
Notes to Consolidated Financial Statements
(INR and US$ amounts in thousands except share and per share data)
Future minimum lease payments undernon-cancellable operating leases as of March 31, 2017 are:
| | | | | | | | |
Year ended March 31, | | Amount (INR) | | | US$ | |
Fiscal 2018 | | | 66,652 | | | | 1,028 | |
Fiscal 2019 | | | 66,796 | | | | 1,030 | |
Fiscal 2020 | | | 64,105 | | | | 989 | |
Fiscal 2021 | | | 66,262 | | | | 1,022 | |
Fiscal 2022 | | | 66,558 | | | | 1,026 | |
Thereafter | | | 2,955,614 | | | | 45,576 | |
| | | | | | | | |
Total | | | 3,285,987 | | | | 50,671 | |
| | | | | | | | |
17. Commitments, guarantees and contingencies
Capital commitments
During the normal course of business, the Company purchases assets for the construction of solar power plants and estimatesfor office facilities, warehouses, and office space that have a lease term ranging between 2 to 35 years (after considering further extendable period on mutual agreement by both lessor and lessee). The Company has considered the renewal options in determining the lease term to the extent it will incur INR 3,870,066 (US$ 59,677) duringwas reasonably certain to exercise those renewal options and accordingly, associated potential option payments are included as part of lease payments.
The components of lease cost for the twelve monthsyear ended March 31, 20182022 and March 31, 2023 were as follows:
| | | For the year ended March 31, | |
| | | 2022 | | | 2023 | | | 2023 | |
| | | INR | | | INR | | | US$ | |
| | | (In million) | |
| Operating lease cost | | | 439 | | | | 436 | | | | 5.3 | |
| Short-term lease cost | | | 17 | | | | 22 | | | | 0.3 | |
| Total lease cost | | | 456 | | | | 458 | | | | 5.6 | |
Amounts reported in relationthe consolidated balance sheet as of March 31, 2022 and March 31, 2023 were as follows:
| | | As at
March 31, | | | As at
March 31, | | | As at
March 31, | |
| | | 2022 | | | 2023 | | | 2023 | |
| | | INR | | | INR | | | US$ | |
| | | (In million) | |
| Non-current assets | | | | | | | | | |
| Right-of-use assets* | | | 4,465 | | | | 4,346 | | | | 52.9 | |
| Non-current liabilities | | | | | | | | | | | | |
| Lease liabilities | | | 3,534 | | | | 3,408 | | | | 41.5 | |
| Current liabilities | | | | | | | | | | | | |
| Lease liabilities | | | 300 | | | | 292 | | | | 3.6 | |
| Total operating lease liabilities | | | 3,834 | | | | 3,700 | | | | 45.1 | |
| * | Also see note 27. “Whistle-blower Allegations and Special Committee Investigation” for adjustment towards payment made to land aggregators |
Other information related to such purchase commitments.leases as of March 31, 2022 and March 31, 2023 was as follows:
Guarantees
| | | As at
March 31, | | | As at
March 31, | | | As at
March 31, | |
| | | 2022 | | | 2023 | | | 2023 | |
| | | INR | | | INR | | | US$ | |
| | | (In million) | |
| Supplemental cash flow information: | | | | | | | | | |
| Cash paid for amounts included in the measurement of lease liabilities | | | 310 | | | | 347 | | | | 4.2 | |
| Weighted average remaining lease term | | | 30 years | | | | 29 years | | | | | |
| Incremental borrowing rate | | | 10 | % | | | 10 | % | | | | |
Maturities of lease liabilities under non-cancellable leases as of March 31, 2023 are as follows:
| Year ended March 31, 2023 | | Amount (INR) | | | US$ | |
| | | (In million) | |
| Fiscal 2024 | | | 304 | | | | 3.7 | |
| Fiscal 2025 | | | 314 | | | | 3.8 | |
| Fiscal 2026 | | | 322 | | | | 3.9 | |
| Fiscal 2027 | | | 332 | | | | 4.0 | |
| Fiscal 2028 | | | 342 | | | | 4.2 | |
| Thereafter | | | 11,120 | | | | 135.3 | |
| Total undiscounted lease payments | | | 12,734 | | | | 154.9 | |
| Less: Imputed interest | | | 9,034 | | | | 109.8 | |
| Total lease liabilities | | | 3,700 | | | | 45.1 | |
19. Commitments, guarantees and contingencies
The commitments for the purchase of property, plant and equipment were INR 2,857 million and INR 32,157 million (US$391.3 million) as of March 31, 2022 and 2023 respectively.
The terms of our PPAs provide for the annual delivery of a minimum amount of electricity at fixed prices. Under the terms of the PPAs, we have issued irrevocable performance bank guarantees. These in total amount to INR 5,179 and INR 2,409 million (US$29.3 million) as of March 31, 2022 and 2023, respectively.
As of March 31, 2022 and 2023, the Company issueshas irrevocable performance bank guarantees aggregating to INR 2,320 million and INR 904 million (US$11.0 million) respectively, in relation to its obligation to construct solar power plants as required by the PPA. Such outstandingunder construction projects. Further, bank guarantees amounted toof INR 1,189,2001,517 million and INR 1,534,7001,154 million (US$ 23,665)14.0 million) as of March 31, 20162022 and 2017, respectively. The2023 respectively are in relation to commissioned projects as per respective PPAs and other project requirements.
Bank guarantees expire on the commissioningamounting to INR 458 million and INR 78 million (US$0.9 million) as of the constructed solar power plant.March 31, 2022 and 2023 respectively, have been issued to meet Debt-Service Reserve Account (DSRA) requirements for outstanding loans.
The Company has
We have also obtained guarantees from financial institutions as a part of the bidding process for establishing solar projects amounting to INR 1,192,000873 million and INR 1,092,000267 million (US$ 16,839)3.2 million) as of March 31, 20162022 and 2017,2023 respectively. The Company hasWe have given term deposits as collateral for those guarantees which are classified as restricted cash on the consolidated balance sheet.
The terms
Further, INR 11 million and INR 5 million (US$0.1 million) bank guarantee as of the PPAs provide for the annual delivery of a minimum amount of electricity at fixed prices.
Contingencies
As at March 31, 2017, the Company has received demand2022 and 2023 respectively, are towards other commitments. The funds released from maturity/settlement of existing bank guarantees can be used for liquidation damages totaling INR 65,000 (US$ 1,002) for projects completed beyond the contractually agreed dates. The Company has filed an appeal against such demands and has received a stay order from the appellant authorities. The management believes the reason for delay were not attributable to the Company, based on advice from its legal advisors and the facts underlying the Company’s position, it believes that the probability that it will ultimately be found liable for these assessments is remote and accordingly has not accrued any amount with respect to these matters in its consolidated financial statements. The Company does not expect the impact of these demands to have a material adverse effect on it financial position, results of operations or cash flows.future operational activities.
18.
| (a) | A PIL had been initiated by certain individuals claiming to be wildlife experts/interested in conservation of wildlife, before the Supreme Court of India against various state governments such as Rajasthan, Gujarat, and MNRE, MoP among others, seeking protection of the two endangered bird species, namely the GIB and the Lesser Florican found in the states of Rajasthan and Gujarat. The Supreme Court by way of order dated April 19, 2021 issued directions to: (i) underground all low voltage transmission lines, existing and future lines falling in potential and priority habitats of GIB, (ii) to convert all existing high voltage lines in priority and potential areas of GIB where found feasible within a period of one year, if not found feasible, the matter to be referred to the committee formed by the Supreme Court which will take a decision on feasibility, and (iii) to install bird diverters on all existing overhead lines in the interim. We and many other developers have projects in the potential area as determined by the court, hence aggrieved by the order, the Solar Power Developers Association (“SPDA”) and Union of India have filed an application before the Supreme Court seeking among others, exemption from undergrounding of transmission lines in potential areas. The matter was last listed on November 30, 2022, whereby directions were passed to parties to ensure installation of bird diverters in the Priority Area and for them to be in compliance with quality standards issued by the Supreme Court Committee. As per the directions of Supreme Court, for its solar power plants, the Company installed bird divertors in the habitats of Great-Indian Bustard during FY 2022-23. The PIL is presently pending. The SPDA has filed an application seeking modification of Supreme Court’s order dated April 19, 2021. Further, the Supreme Court vide its order dated March 21, 2024 modified its earlier order dated April 19, 2021 directing the Central Government to constitute an expert committee to examine the issue of installing overhead and underground powerlines in the priority areas marked for the conservation of the Great Indian Bustard (GIB). The expert committee on the GIB issue will, inter-alia, look into (i) the scope and feasibility of laying down underground and overhead transmission lines, (ii) measures for the conservation of GIB, and (iii) identifying suitable alternatives for laying down power lines in the future. The expert committee is required to submit its report latest by July 31, 2024. Citing practical difficulties in laying down underground transmission lines, the Supreme Court has also restricted the requirement of laying down underground transmission lines only to the priority area (covering roughly 13,163 sq km). If the modification application is dismissed, we might entail significant costs and delays. |
20. Related Party Disclosures
For
In respect of second matter, during the years ended theprevious year ended March 31, 2015, 2016 and 2017, the Company incurred rent expense on office facilitiesreceived a favorable Award from Singapore International Arbitration Centre in relation to the purchase price of shares, held by Mr. Inderpreet Singh Wadhwa and guest house facilities totaling INR 14,490, INR 14,970Mr. H. S. Wadhwa (erstwhile Chief Operating Officer), in Azure Power India Private Limited. However, Mr. Inderpreet Singh Wadhwa has challenged the award and INR 19,362 (US$ 299),
AZURE POWER GLOBAL LIMITED
Notes to Consolidated Financial Statements
(INR and US$ amounts in thousands except share and per share data)
respectively, wherefiled an appeal before the lessors are relativesHigh Court of Singapore. The appeal challenging the Company’s chief executive officer and another director of APGL. As of March 31, 2016, and 2017,SIAC Award has been dismissed by the Company had security deposits with these lessors totaling INR 8,567 and INR 8,567 (US$ 132).Singapore court.
19.
21. Share based compensation
On July 28, 2015, the Company’s Board of Directors approved the
The Company has a 2015 Stock Option Plan (the “2015 Plan”and 2016 Equity Incentive Plan and as amended on March 31, 2020 (collectively “ESOP Plans”) allowing for a grant of up to 568,688 options. During August 2016,duly approved by the Board approved to increaseand had 2,023,744 stock options in the employee stock option pool from 568,688 to 1,023,744 shares and the existing Employee Stock Option Plan 2015 has been discontinued for issuance of new grants and the outstanding stock option pool available for issuance of new grants are transferred to 2016 Equity Incentive Plan (the “2016 Plan”).
pool. Under the 2015 Plan and 2016 Plan,ESOP Plans, the Compensation Committee on behalf of Board of Directors (the “Directors”) may from time to time make grants to one or more employees, determined by it to be eligible for participation inunder the 2015 and 2016 Plans.plans.
The Compensation Committee determines which employees are eligible to receive the equity awards, the number of equity awards to be granted, the exercise price, the vesting period and the exercise period. The vesting period will be decided by the Compensation Committee as and when any grant takes place. All options granted under these plans shall vest over a period of 4 years from the date of grant with 25% vesting at the end of year one, 25% vesting at the end of year two, 25% vesting at the end of year three and 25% vesting at the end of year four unless specified otherwise. Shares forfeited by the Company are transferred back to the employee stock pool and shall be available for new grants.
Options are deemed to have been issued under these plans only to the extent actually issued and delivered pursuant to a grant. To the extent that a grant lapses or the rights of its grantee terminate, any equity shares subject to such grant are again available for new grants.
The option grant is at such price as may be determined by the Compensation Committee and is specified in the option grant. The grant is in writing and specifies the number of options granted the price payable for exercising the options, the date/s on which some or all of the options shall be eligible for vesting, fulfillmentfulfilment of the performance and other conditions, if any, subject to whichwhen vesting shall take place and other terms and conditions thereto. The option grant is not transferable and can be exercised only by the employeesemployees/ Key Managerial personal (KMP) of the Company.
Employee Stock Option Plan and Restricted Stocks (RS)
Options granted under the plan are exercisable into equity shares of the Company, have a contractual life equal to the shorter of ten years, andor July 20, 2025, or July 20, 2027, as the case may be, and vest equitably over four years, unless specified otherwise in the applicable award agreement. The Company recognizes compensation cost, reduced by the estimated forfeiture rate, over the vesting period of the option. A summary of share option activity during the years ended March 31, 20162022 and 2017March 31, 2023 is set out below:
| | | | | | | | |
| | | Number of shares | | | Weighted average
exercise price in INR * | |
Outstanding as of March 31, 2016 | | | 414,880 | | | | 207 | |
Granted | | | 125,400 | | | | 1,496 | |
Exercised | | | — | | | | — | |
Forfeitures | | | — | | | | — | |
| | | | | | | | |
Options outstanding as of March 31, 2017 | | | 540,280 | | | | 506 | |
| | | | | | | | |
Vested and exercisable as of March 31, 2017 | | | 409,328 | | | | 166 | |
| | | | | | | | |
| | | Number of
options | | | Weighted
average
exercise price
in INR | |
| Options outstanding as of March 31, 2021 | | | 703,708 | | | | 1,217 | |
| Granted (1) | | | 24,205 | | | | 1583 | |
| Exercised | | | (136,611 | ) | | | 788 | |
| Forfeited | | | (32,474 | ) | | | 1,613 | |
| Options outstanding as of March 31, 2022 | | | 558,829 | | | | 1,314 | |
| Vested and exercisable as of March 31, 2022 | | | 250,784 | | | | 1,128 | |
Available
| (1) | Includes 4,748 RSU granted during the year to its Directors. |
| | | Number of
options | | | Weighted
average
exercise price
in INR | |
| Options outstanding as of March 31, 2022 | | | 558,829 | | | | 1,314 | |
| Granted (1) | | | 543 | | | | - | |
| Exercised | | | (4,870 | ) | | | 112 | |
| Forfeited | | | (138,687 | ) | | | 1,455 | |
| Options outstanding as of March 31, 2023 | | | 415,813 | | | | 1,276 | |
| Vested and exercisable as of March 31, 2023 | | | 281,960 | | | | 1,183 | |
| (1) | Includes 543 RSU granted during the year to its Directors. |
Total options available for grant as of March 31, 2017 is 483,464 options.
AZURE POWER GLOBAL LIMITED
Notes to Consolidated Financial Statements
(INR and US$ amounts in thousands except share and per share data)2023 was 457,114 ESOPs.
The Black-Scholes-Merton option pricing model includes assumptions regarding dividend yields, expected volatility, expected option term, and risk-free interest rates. The Company estimates expected volatility based on the historical volatility of comparable publicly traded companies for a period that is equal to the expected term of the options because it does not haveCompany (considering sufficient history of its own volatility.data is available now for identifying the volatility). The risk-free interest rate is based on the treasuryyield of relevant time period based on US government bonds issued by the Indian Government in effect at the time of grant for a period commensurate with the estimated expected life. The expected term of options granted is derived using the “simplified” method as allowed under the provisions of ASC Topic 718 due to insufficient historical exercise history data to provide a reasonable basis upon which to estimate expected term.
The fair value of each share option granted to employeesemployees/ RS is estimated on the date of grant using the Black- Scholes option-pricing model with the following weighted average assumptions:
| | | | |
| | | Year ended March 31, |
| | | 2016 | | 2017 |
Dividend yield | | 0.00% | | 0.00% |
Expected term (in years) | | 5.0 - 6.8 | | 4.5 - 7.2 |
Expected volatility | | 37.2% - 41.6% | | 31.0% - 41.7% |
Risk free interest rate | | 7.60% - 8.08% | | 2.15% - 7.61% |
On July 28, 2015, the Company issued 414,880 options as replacement for the 414,880 AZI outstanding options under its option plan. In addition to the replacement of the options, the Company modified certain other terms of the options originally granted by AZI.
In accordance with ASC Topic 718, Compensation — Stock Compensation, cancellation of options at AZI and reissue of options at APGL as well as the modification of certain other terms were considered as a plan modification. In respect of the option modifications, the Company computed the incremental fair value of the options. The incremental fair value of INR 45,719 (US$ 705) was determined as a difference between the fair value of the modified option and that of the original option, both estimated at the time of modification. The incremental fair value as per the vesting schedule as on the date of modification that are recorded amounted to INR 41,334 (US$ 637).
| | | | |
| | | July 25, 2015 |
Particulars | | Pre-
modification | | Post-
modification |
Options granted | | 29,684 | | 25,930 |
Equity value (INR) | | 7,642 | | 8,943 |
Dividend yield | | 0.00% | | 0.00% |
Expected term (in years) | | 0.2-2.8 | | 5.0-6.8 |
Expected volatility | | 37.2% - 41.6% | | 37.2% - 41.6% |
Risk free interest rate | | 7.60% - 8.08% | | 7.60% - 8.08% |
Outstanding options as of March 31, 2017 include 80,000 options with a market vesting condition. The fair value of these options was determined using the Lattice valuation model with the following assumptions:
| | Year ended March 31, | | |
Volatility
| | 2022 | | | 48.12023* | % |
Risk- free interest rate
Dividend yield | | | 8.180% | | % | | - | |
| Expected term (in years) | | | 3.8 – 5.1 | | | | - | |
| Expected volatility | | | 46.3% - 47.8% | | | | - | |
| Risk free interest rate | | | 0.55% - 0.80% | | | | - | |
The result of the Lattice valuation model concludes that the probability of achieving the market conditions to be 5.72% and the fair value of the options has been fully recorded as expense.
AZURE POWER GLOBAL LIMITED
Notes to Consolidated Financial Statements
(INR and US$ amounts in thousands except share and per share data)
| * | No new grants have been made by the Company during the current year. |
As of March 31, 2016,2022, and 2017,2023, the aggregate intrinsic value of all outstanding options was INR 133,285 and INR 140,864 (US$ 2,172), respectively.Nil.
The share basedshare-based compensation expense related to share options (including RS) is recorded as a component of general and administrative expenses in the Company’s consolidated statements of operations and totaled, INR 7,428,36 million, INR 51,73269 million and INR 13,77417 million (US$ 212)0.2 million) for the years ended March 31, 2015 20162021, 2022 and 2017,2023, respectively. The amount of share-based compensation expense capitalized during the year ended March 31, 2022 and 2023 was INR 23 million and INR Nil million, respectively.
Unrecognized compensation cost for unvested options as of March 31, 20172023 is INR 11,38532 million (US$176)0.4 million), which is expected to be expensed over a weighted average period of 1.72.1 years.
The intrinsic value of options exercised during the year ended March 31, 2016,2022, and March 31, 20172023 was INR 30Nil million and nil (US$ nil).INR Nil respectively.
During November 2018, the Company repriced the exercise price for 692,507 options, which were previously awarded to certain officers, employees and directors under the ESOP plans from US$13.25 to US$11.90 per share. All terms and conditions of the eligible options, including the vesting schedule, service condition and other terms remain the same. The impact of the repricing of the options has been considered in the company’s financial statements.
The intrinsic value per option at the date of grant during the years ended March 31, 20162022 and 20172023 is as follows:
| | | | | | | | | | | | | | | | |
Date of grant | | No. of options
granted | | | Deemed fair value of
equity shares | | | Intrinsic value per option
at the time of grant | | | Valuation used | |
July 1, 2015 | | | 13,808 | | | | 477 | | | | 476 | | | | Retrospective | |
May 4, 2016 | | | 87,872 | | | | 602 | | | | (1 | ) | | | Retrospective | |
August 18, 2016 | | | 22,528 | | | | 337 | | | | 336 | | | | Retrospective | |
March 8, 2017 | | | 15,000 | | | | 1,133 | | | | — | | | | Market price | |
| Date of grant | | No. of options
granted | | | Deemed fair
value of
equity shares
(INR) | | | Intrinsic value
per option
at the time of
grant (INR) | | | Valuation used |
| October 01, 2020* | | | 4,273 | | | | 2,320 | | | | — | | | Market price |
| March 31, 2021 | | | 182,800 | | | | 2,057 | | | | — | | | Market price |
| July 7, 2021 | | | 20,000 | | | | 1,838 | | | | — | | | Market price |
| (1)* | Pertains to RSUs converted into RSs at the prevailing market price. |
Stock Appreciation Rights (SARs)
The Company granted incentive compensation in the form of Stock Appreciation Rights (“SARs”), as defined in the Company’s 2016 Equity Incentive Plan, as amended on March 31, 2020, to its CEO and COO. The SARs have been granted in 4 tranches with maturity dates up to financial year March 31, 2028.
A summary of SARs activity during the periods ending March 31, 2022 and 2023 is set out below:
| | | Number of
SARs | | | Weighted
average
exercise price
in INR | |
| SAR outstanding as of March 31, 2021 | | | 1,875,000 | | | | 810 | |
| Granted | | | - | | | | - | |
| Exercised | | | - | | | | - | |
| Options outstanding as of March 31, 2022 | | | 1,875,000 | | | | 810 | |
| Vested as of March 31, 2022 | | | 680,000 | | | | 805 | |
| Exercisable as of March 31, 2022 | | | 130,000 | | | | 1,154 | |
| | | Number of
SARs | | | Weighted
average
exercise price
in INR | |
| SAR outstanding as of March 31, 2022 | | | 1,875,000 | | | | 810 | |
| Granted | | | - | | | | - | |
| SAR forfeited/reversed during the year | | | (1,195,000 | ) | | | 771 | |
| Options outstanding as of March 31, 2023 | | | 680,000 | | | | 878 | |
| Vested as of March 31, 2023 | | | 680,000 | | | | 878 | |
| Exercisable as of March 31, 2023 | | | 680,000 | | | | 878 | |
The fair value of each SAR granted to employees is estimated at each reporting date using the Black- Scholes option-pricing model with the following weighted average assumptions:
| | Year ended March 31, | |
| | 2022 | | | 2023* | |
| Dividend yield | | | 0% | | | | - | |
| Expected term (in years) | | | 3.2 – 4.7 | | | | - | |
| Expected volatility | | | 49.32% - 52.52% | | | | - | |
| Risk free interest rate | | | 2.45% -2.49% | | | | - | |
| * | Fair value of SARs as of March 31, 2023 has been taken basis the shares exceedsexpected settlement with the exercise price.EX CEO and COO. |
20.
The share-based compensation expense related to SARs is recorded as a component of general and administrative expenses in the Company’s consolidated statements of operations totalled reversal of INR 373 million and reversal of expense of INR 646 million (US$7.9 million) for the year ended March 31, 2022 and 2023, respectively. The amount of share-based compensation expense capitalized during the year ended March 31, 2022 and 2023 was INR Nil million. The carrying value of the liability recorded for SARs as at March 31, 2022 and 2023 was INR 844 million and INR 198 million (US$2.4 million), respectively.
Unrecognized compensation cost for unvested SARs as of March 31, 2023 is INR Nil million.
On April 26, 2022, the Company through its Board of Directors has accepted the resignations of erstwhile CEO and COO of the Company. Both of the KMP’s were relinquished from their roles with the Company/ Group with immediate effect. Considering the same adjustment in relation to SARs of the CEO and COO has been made in Fiscal Year 2023.
The fair value per SAR at the date of grant is as follows:
| Date of grant | | No. of
SARs
granted | | | Deemed fair
value of
SAR (INR) | | | Vesting
period | | Valuation
used |
| July 18, 2019 | | | 200,000 | | | | 722 | | | February 2020 | | Market price |
| July 18, 2019 | | | 1,600,000 | | | | 722 | | | March 31, 2020 to
July 31, 2027 | | Market price |
| March 30, 2020 | | | 170,000 | | | | 1,069 | | | March 31, 2021 to
March 31, 2024 | | Market price |
| March 30, 2021 | | | 80,000 | | | | 2,056 | | | March 31, 2022 to
March 31, 2025 | | Market price |
22. Post retirement plans
The Company has a defined benefit gratuity plan. Every employee who has completed five years or more of service is entitled to a gratuity on departure at 15 days salary (last drawn salary) for each completed year of service. The Scheme is unfunded and accrued cost is recognized through a provision in the accounts of the company.
The following table sets forth the changes in projected benefit obligations -
| | | As of March 31, | |
| | | 2022 | | | 2023 | | | 2023 | |
| | | (INR) | | | (INR) | | | (US$) | |
| | | (In million) | |
| Benefit obligation at beginning of year | | | 50 | | | | 56 | | | | 0.7 | |
| Service cost | | | 14 | | | | 14 | | | | 0.2 | |
| Interest cost | | | 4 | | | | 5 | | | | 0.1 | |
| Net actuarial loss (gain) | | | (8 | | | | (17 | ) | | | (0.2 | ) |
| Benefits paid | | | (4 | ) | | | (10 | ) | | | (0.1 | ) |
| Benefit obligation at end of year | | | 56 | | | | 48 | | | | 0.6 | |
Amounts recognized in statement of financial position at March 31 consist of: | | | | | | | | | | | | |
| Other non-current liabilities | | | 53 | | | | 39 | | | | 0.5 | |
| Other current liabilities | | | 3 | | | | 9 | | | | 0.1 | |
| Net amount recognized | | | 56 | | | | 48 | | | | 0.6 | |
Components of Net Periodic Benefit Cost (Income)
Net periodic benefit cost (income) for our postretirement benefit plans consisted of the following and is recorded as a component of general and administrative expenses in the Company’s consolidated statement of operations:
| | | Year ended March 31 | |
| | | 2022 | | | 2023 | | | 2023 | |
| | | (INR) | | | (INR) | | | (US$) | |
| | | (In million) | |
| Service Cost | | | 14 | | | | 14 | | | | 0.2 | |
| Interest Cost | | | 4 | | | | 5 | | | | 0.1 | |
| Amortization of: | | | | | | | | | | | | |
| Net actuarial loss (gain) | | | (8 | ) | | | (17 | ) | | | (0.2 | ) |
| Net periodic benefit cost (income) | | | 10 | | | | 2 | | | | 0.1 | |
The principal assumptions used in determining gratuity for the Company’s plans are shown below:
| | | Year ended March 31 | |
| | | 2022 | | | 2023 | |
| Discount rate | | | 7.92 | % | | | 7.92 | % |
| Salary escalation rate | | | 10.00 | % | | | 10.00 | % |
| Employee turnover rate | | | 9.00 | % | | | 30.00 | % |
| Retirement age | | | 58 years | | | | 58 years | |
The following estimated payments to the defined benefit plan in future years:
| | | Year ended March 31 | |
| | | 2022 | | | 2023 | | | 2023 | |
| | | (INR) | | | (INR) | | | (US$) | |
| | | (In million) | |
| Within the next | | | | | | | | | |
| - 1 year | | | 4 | | | | 9 | | | | 0.1 | |
| - 1 and 2 years | | | 3 | | | | 19 | | | | 0.2 | |
| - 2 and 3 years | | | 4 | | | | 18 | | | | 0.2 | |
| - 3 and 4 years | | | 5 | | | | 16 | | | | 0.2 | |
| - 4 and 5 years | | | 5 | | | | 14 | | | | 0.2 | |
| - 5 and 10 years | | | 24 | | | | 24 | | | | 0.3 | |
23. Impairment of assets and Assets held for sale
In April 2021, the Company has entered into an agreement with Radiance to sell certain subsidiaries (the “Rooftop Subsidiaries”) with an operating capacity of 153 MW (the “Rooftop Portfolio”) for INR 5,350 million, subject to certain purchase price adjustments (the “Rooftop Sale Agreement”). Pursuant to the Rooftop Sale Agreement, Radiance will acquire 100% of the equity ownership of the Rooftop Subsidiaries owned by the Group. The Company had recognized an impairment loss in relation to the Rooftop Subsidiaries aggregating to INR 3,255 million during the year ended March 31, 2021, pursuant thereto these assets (net) are carried at its fair values in the financial statements.
As per the terms of the Rooftop Sale Agreement out of 43.2 MW operating capacity that are part of the Restricted Groups (as defined in the respective Green Bond Indentures) during August 2021, post refinancing of 5.5% Senior Notes and repayment of loan relating to one of a rooftop project of 10 MW the company transferred 100% shareholding in the that project to Radiance and 48.6% of the equity ownership of entities forming part of Restricted Group having 33.2 MW operating capacity has also been transferred to Radiance on the closing date. Pursuant to the terms of the Green Bond Indentures, the remaining 51.4% will only be transferred post refinancing of the Green Bonds.
The transfer of ownership for the remaining operating capacity of 33.2 MW for the Solar Green Bonds is not anticipated to occur within 12 months, hence, the assets and liabilities of these subsidiaries are not presented as “Assets classified as held for sale” and instead continue to be classified within the respective balance sheet captions in the consolidated financial statements at March 31, 2023 and March 31, 2022 respectively.
There is also a restriction on transfer of equity ownership relating to the 16 MW project with Delhi Jal Board (DJB), wherein 49% of the equity ownership was transferred to Radiance on closing date, and the remaining 51% will be transferred on or after March 31, 2024. Accordingly, the related assets and liabilities of the DJB 16 MW project are not presented as “Assets classified as held for sale” and instead continue to be classified within the respective balance sheet captions at March 31, 2023 and March 31, 2022 respectively.
During the current year, Company has transferred 100% shareholding in relation to 2.5 MW operating capacity.
In the event the sale of the Rooftop Subsidiaries does not occur, the Company must reimburse Radiance the equity value of the assets not transferred along with an 10.5% per annum equity return.
Further, the Company and Radiance have mutually agreed to terminate the transfer in shareholding of the remaining un-transferred 86.5 MW portfolio to Radiance, and accordingly, the Purchaser will not purchase from the Sellers and the Sellers will not sell to the Purchaser the AZR Sale Shares (including any Seller Group Loans) as was agreed in the Previous MSPA and further amended under the Amended MSPA. Accordingly, the assets and related liabilities of these subsidiaries are not presented as “Assets classified as held for sale” and instead re-classified within the respective balance sheet captions in the consolidated balance sheet as at March 31, 2022 and March 31, 2023.
The assets and liabilities of the Rooftop Subsidiaries classified as held for sale, together with the calculation of the related impairment loss is shown below.
| | | As of March 31, | |
| | | 2022 | | | 2023 | | | 2023 | |
| | | (INR) | | | (INR) | | | (US$) | |
| | | (In million) | |
| Current assets: | | | | | | | | | |
| Cash and cash equivalents | | | 41 | | | | - | | | | - | |
| Restricted cash | | | 9 | | | | - | | | | - | |
| Accounts receivable, net | | | 1 | | | | - | | | | - | |
| Total current assets | | | 51 | | | | - | | | | - | |
| Property, plant and equipment, net | | | 96 | | | | - | | | | - | |
| Total assets (A) | | | 147 | | | | - | | | | - | |
| Liabilities | | | | | | | | | | | | |
| Current liabilities: | | | | | | | | | | | | |
| Accounts payable | | | 1 | | | | - | | | | - | |
| Current portion of long-term debt | | | 66 | | | | - | | | | - | |
| Interest payable | | | 2 | | | | - | | | | - | |
| Other liabilities | | | 4 | | | | - | | | | - | |
| Total current liabilities | | | 73 | | | | - | | | | - | |
| Non-current liabilities | | | - | | | | - | | | | - | |
| Total liabilities (B) | | | 73 | | | | - | | | | - | |
| Net Assets (C=A-B) | | | 74 | | | | - | | | | - | |
| Fair value (D) | | | 54 | | | | - | | | | - | |
| Impairment loss/ (reversal)* (E=C-D) | | | 20 | | | | - | | | | - | |
The fair value of consideration related to the rooftop sale in previous year includes expected recovery of VGF for INR 463 million (US$6.1 million). The Company has undertaken to refund to the purchaser an amount equivalent to 85% of any shortfall in recovery of VGF. Based on the current circumstances, management has assessed that they have complied with the conditions associated with the grant of VGF and hence have determined that the recovery of the VGF is likely.
During the previous year ended March 31, 2022, in respect of the 33.2 MW operating capacity that are part of the Restricted Groups, and 16 MW project with Delhi Jal Board, the Company has consolidated the entities in the consolidated financial statements and net carrying value of assets are reinstated. The Company has reported the Minority interest equivalent to shareholding transferred to Radiance.
24. Fair Value Measurements
FASB
ASC Topic 820Fair Value Measurements and Disclosures defines fair value as the price that would be received to sell an asset or paid to transfer a liability in an orderly, hypothetical transaction between market participants at the measurement date. ASC Topic 820 establishes a three-tier value hierarchy of fair value measurement based upon the whether the inputs to that measurement are observable or unobservable. Observable inputs reflect data obtained from independent sources while unobservable inputs reflect the Company’s market assumptions. ASC Topic 820 prioritizes the inputs used in the valuation methodologies in measuring fair value as follows:
Level 1 — Observable inputs that reflect quoted prices (unadjusted) for identical assets or liabilities in active markets.
Level 2 — Includes other inputs that are directly or indirectly observable in the marketplace. Observable inputs, other than Level 1 quoted prices for similar instruments in active markets; quoted prices for similar or identical instruments in markets that are not active; and valuations using models in which all significant inputs are observable in active markets.
Level 3 — Unobservable inputs which are supported by little or no market activity.
The fair value hierarchy also requires an entity to maximize the use of observable inputs and minimize the use of unobservable inputs when measuring fair value.
AZURE POWER GLOBAL LIMITED
Notes to Consolidated Financial Statements
(INR and US$ amounts in thousands except share and per share data)
In accordance with ASC Topic 820, assets and liabilities are to be measured based on the following valuation techniques:
Market approach — Prices and other relevant information generated by market transactions involving identical or comparable assets or liabilities.
Income approach — converting the future amounts based on the market expectations to its present value using the discounting methodology.
Cost approach — Replacement cost method.
The valuation techniques used by the Company to measure and report the fair value of certain financial assets and liabilities on a recurring basis are as follows;
Foreign exchange derivative contracts
The Company enters into foreign exchange derivativeoption contracts to hedge fluctuations in foreign exchange rates for recognized balance sheet items such as foreign exchange term loans. The Company mitigates the credit risk of these foreign exchange derivativeoption contracts by transacting with highly rated counterparties in India which are major banks. The Company used the super derivatives option pricing model based on the principles of the Black-Scholes modeluses valuation models to determine the fair value of the foreign exchange derivativeoption contracts. The inputs considered in this model include the theoretical value of a call option, the underlying spot exchange rate as of the balance sheet date, the contracted price of the respective option contract, the term of the option contract, the implied volatility of the underlying foreign exchange rates and the risk freerisk-free interest rate as of the balance sheet date. The techniques and models incorporate various inputs including the credit worthiness of counterparties, foreign exchange spot and forward rates, interest rate yield curves, forward rate yield curves of the underlying.underlying option contracts. The Company classifies the fair value of these foreign exchange derivativeoption contracts in Level 2 because the inputs used in the valuation model are observable in active markets over the term of the respective option contracts.
| | | Fair value measurement at reporting date using | |
| | | | | | Quoted Prices | | | | | | | |
| | | | | | in Active | | | Significant | | | | |
| | | | | | Markets for | | | Other | | | Significant | |
| | | As of | | | Identical | | | Observable | | | Unobservable | |
| | | March 31, | | | Assets | | | Inputs | | | Inputs | |
| Description | | 2022 | | | (Level 1) | | | (Level 2) | | | (Level 3) | |
| | | (In million) | |
| Assets | | | | | | | | | | | | |
| Current assets | | | | | | | | | | | | |
| Forward exchange derivative contracts (INR) | | | 13 | | | | - | | | | 13 | | | | - | |
| Non-current assets | | | | | | | | | | | | | | | | |
| Fair valuation of swaps and options (INR) | | | 2,647 | | | | - | | | | 2,647 | | | | - | |
| Forward exchange derivative contracts (INR) | | | 883 | | | | - | | | | 883 | | | | - | |
| Total assets (INR) | | | 3,543 | | | | - | | | | 3,543 | | | | - | |
| Total assets (US$) | | | 46.7 | | | | - | | | | 46.7 | | | | - | |
| | | Fair value measurement at reporting date using | |
| | | | | | Quoted Prices | | | | | | | |
| | | | | | in Active | | | Significant | | | | |
| | | | | | Markets for | | | Other | | | Significant | |
| | | As of | | | Identical | | | Observable | | | Unobservable | |
| | | March 31, | | | Assets | | | Inputs | | | Inputs | |
| Description | | 2022 | | | (Level 1) | | | (Level 2) | | | (Level 3) | |
| | | (In million) | |
| Liabilities | | | | | | | | | | | | |
| Current liabilities | | | | | | | | | | | | |
| Forward exchange derivative contracts (INR) | | | 106 | | | | - | | | | 106 | | | | - | |
| Fair valuation of swaps and forward (INR) | | | 658 | | | | - | | | | 658 | | | | - | |
| Fair valuation of swaps and options (INR) | | | 1,735 | | | | - | | | | 1,735 | | | | - | |
| Non-current liabilities | | | | | | | | | | | | | | | | |
| Fair valuation of swaps and forward (INR) | | | 7 | | | | - | | | | 7 | | | | - | |
| Total Liabilities (INR) | | | 2,506 | | | | - | | | | 2,506 | | | | - | |
| Total Liabilities (US$) | | | 33.0 | | | | - | | | | 33.0 | | | | - | |
AZURE POWER GLOBAL LIMITED
Notes to Consolidated Financial Statements
(INR and US$ amounts in thousands except share and per share data)
Compulsorily convertible debentures, Series E and G compulsorily convertible preferred shares
The Company classified the fair value of the CCDs, Series E and Series G CCPS in level 3 because the fair values have been derived using valuation techniques in which one or more significant inputs are unobservable. The Company used a discounted cash flow analysis under the income approach, to determine the fair value of the CCDs, Series E and Series G CCPs. This valuation model includes various inputs including issue price, liquidation amount, committed internal rate of return, discount rate and coupon rate.
| | | | | | | | | | | | | | | | |
| | | Fair Value measurement at reporting date using | |
Description | | As of
March 31,
2016
(INR) | | | Quoted Prices
in Active
Markets for
Identical
Assets
(Level 1)
(INR) | | | Significant
Other Observable
Inputs (Level 2)
(INR) | | | Significant
Unobservable
Inputs
(Level 3)
(INR) | |
Assets | | | | | | | | | | | | | | | | |
Current assets | | | | | | | | | | | | | | | | |
Foreign exchange derivative contracts | | | 108,606 | | | | — | | | | 108,606 | | | | — | |
Noncurrent assets | | | | | | | | | | | | | | | | |
Foreign exchange derivative contracts | | | 83,426 | | | | — | | | | 83,426 | | | | — | |
| | | | | | | | | | | | | | | | |
Total assets | | | 192,032 | | | | — | | | | 192,032 | | | | — | |
| | | | | | | | | | | | | | | | |
Liabilities | | | | | | | | | | | | | | | | |
Current liability | | | | | | | | | | | | | | | | |
Compulsorily convertible debentures | | | 2,132,500 | | | | — | | | | — | | | | 2,132,500 | |
Series E and Series G compulsorily convertible preferred shares | | | 1,468,200 | | | | — | | | | — | | | | 1,468,200 | |
Total liabilities | | | 3,600,700 | | | | — | | | | — | | | | 3,600,700 | |
| | | | | | | | | | | | | | | | |
| | | Fair value measurement at reporting date using | |
| | | | | | Quoted Prices | | | | | | | |
| | | | | | in Active | | | Significant | | | | |
| | | | | | Markets for | | | Other | | | Significant | |
| | | As of | | | Identical | | | Observable | | | Unobservable | |
| | | March 31, | | | Assets | | | Inputs | | | Inputs | |
| Description | | 2023 | | | (Level 1) | | | (Level 2) | | | (Level 3) | |
| | | (In million) | |
| Assets | | | | | | | | | | | | |
| Current Asset | | | | | | | | | | | | |
| Fair valuation of swaps and forward (INR) | | | 210 | | | | - | | | | 210 | | | | - | |
| Non-current assets | | | | | | | | | | | | | | | | |
| Fair valuation of swaps and options (INR) | | | 5,447 | | | | - | | | | 5,447 | | | | - | |
| Fair valuation of swaps and forward (INR) | | | 1,855 | | | | - | | | | 1,855 | | | | - | |
| Total assets (INR) | | | 7,512 | | | | - | | | | 7,512 | | | | - | |
| Total assets (US$) | | | 91.4 | | | | - | | | | 91.4 | | | | - | |
| | | | | | | | | | | | | | | | |
| | | Fair Value measurement at reporting date using | |
Description | | As of
March 31,
2017
(INR) | | | Quoted Prices
in Active
Markets for
Identical
Assets
(Level 1)
(INR) | | | Significant
Other Observable
Inputs (Level 2)
(INR) | | | Significant
Unobservable
Inputs
(Level 3)
(INR) | |
Assets | | | | | | | | | | | | | | | | |
Current assets | | | | | | | | | | | | | | | | |
Available for sale securities | | | 3,296,797 | | | | 3,296,797 | | | | — | | | | — | |
Foreign exchange derivative contracts | | | 63,818 | | | | — | | | | 63,818 | | | | — | |
Noncurrent assets | | | | | | | | | | | | | | | | |
Foreign exchange derivative contracts | | | 61,120 | | | | — | | | | 61,120 | | | | — | |
| | | | | | | | | | | | | | | | |
Total assets | | | 3,421,735 | | | | 3,296,797 | | | | 124,938 | | | | — | |
| | | | | | | | | | | | | | | | |
| | | Fair value measurement at reporting date using | |
| | | | | | Quoted Prices | | | | | | | |
| | | | | | in Active | | | Significant | | | | |
| | | | | | Markets for | | | Other | | | Significant | |
| | | As of | | | Identical | | | Observable | | | Unobservable | |
| | | March 31, | | | Assets | | | Inputs | | | Inputs | |
| Description | | 2023 | | | (Level 1) | | | (Level 2) | | | (Level 3) | |
| | | (In million) | |
| Liabilities | | | | | | | | | | | | |
| Current liabilities | | | | | | | | | | | | |
| Forward exchange derivative contracts (INR) | | | 108 | | | | - | | | | 108 | | | | - | |
| Fair valuation of swaps and forwards (INR) | | | 3 | | | | - | | | | 3 | | | | - | |
| Fair valuation of swaps and options (INR) | | | 1,431 | | | | - | | | | 1,431 | | | | - | |
| Total Liabilities (INR) | | | 1,542 | | | | - | | | | 1,542 | | | | - | |
| Total Liabilities (US$) | | | 18.8 | | | | - | | | | 18.8 | | | | - | |
AZURE POWER GLOBAL LIMITED
Notes to Consolidated Financial Statements
(INR and US$ amounts in thousands except share and per share data)
Changes in compulsorily convertible debentures are as follows:
| | | | | | | | |
| | | INR | | | US$ | |
Balance as of March 31, 2014 | | | 1,428,800 | | | | 22,032 | |
Issuance of CCDs IFC III | | | 180,000 | | | | 2,776 | |
Increase in fair value | | | 189,800 | | | | 2,927 | |
| | | | | | | | |
Balance as of March 31, 2015 | | | 1,798,600 | | | | 27,735 | |
Increase in fair value | | | 333,900 | | | | 5,149 | |
| | | | | | | | |
Balance as of March 31, 2016 | | | 2,132,500 | | | | 32,884 | |
Increase in fair value | | | 56,400 | | | | 870 | |
Conversion of CCDs into equity share | | | (2,188,900 | ) | | | (33,754 | ) |
| | | | | | | | |
Balance as of March 31, 2017 | | | — | | | | — | |
| | | | | | | | |
Changes in Series E and Series G compulsorily convertible preferred shares are as follows:
| | | | | | | | |
| | | INR | | | US$ | |
Balance as of March 31, 2014 | | | 566,100 | | | | 8,729 | |
Increase in fair value | | | 96,500 | | | | 1,488 | |
| | | | | | | | |
Balance as of March 31, 2015 | | | 662,600 | | | | 10,217 | |
Issuance of Series G CCPS | | | 541,946 | | | | 8,357 | |
Increase in fair value | | | 263,654 | | | | 4,066 | |
| | | | | | | | |
Balance as of March 31, 2016 | | | 1,468,200 | | | | 22,640 | |
Increase in fair value | | | 73,841 | | | | 1,139 | |
Conversion of CCPS into equity shares | | | (1,542,041 | ) | | | (23,779 | ) |
| | | | | | | | |
Balance as of March 31, 2017 | | | — | | | | — | |
| | | | | | | | |
The carrying amount of cash and cash equivalents, including restricted cash, accounts receivable, accounts payables, and other current financial assets and liabilities approximate their fair value largely due to the short-term maturities of these instruments.instruments and are classified as level 2. There have been no transfers between categories during the current year.
The carrying value and fair value of the Company’s fixed rate project financing term loans is as follows:
| | | | As of March 31, | |
| | | | | | | | 2022 | |
| | | As of March 31, | | | Carrying Value | | Fair Value * | | | | |
| | | 2016 | | | (INR) | | (INR) | | US$ | |
| | | Carrying Value
(INR) | | | Fair Value
(INR) | | | US$ | | | (In million) | |
Fixed rate project financing loans: | | | | | | | | | | | | | |
Foreign currency loans | | | 5,995,393 | | | | 6,241,606 | | | | 94,213 | | | | 56,785 | | | | 57,032 | | | | 751.7 | |
| Indian rupee loans | | | | 4,006 | | | | 3,580 | | | | 47.2 | |
| | | As of March 31, | |
| | | 2023 | |
| | | Carrying Value | | | Fair Value * | | | | |
| | | (INR) | | | (INR) | | | US$ | |
| | | (In million) | |
| Fixed rate project financing loans: | | | | | | | | | |
| Foreign currency loans | | | 58,863 | | | | 45,963 | | | | 559.2 | |
| Indian rupee loans | | | 3,719 | | | | 4,417 | | | | 53.7 | |
| | | | | | | | | | | | |
| | | As of March 31, | |
| | | 2017 | |
| | | Carrying Value
(INR) | | | Fair Value
(INR) | | | US$ | |
Fixed rate project financing loans: | | | | | | | | | | | | |
Foreign currency loans | | | 5,497,166 | | | | 5,560,038 | | | | 85,737 | |
AZURE POWER GLOBAL LIMITED
Notes to Consolidated Financial Statements
(INR and US$ amounts in thousands except share and per share data)
The Company uses the yield method to estimate the fair value of fixed rate loans using interest rate change as an input. The carrying amount of the CompaniesCompany’s variable rate project financing terms loans approximate, theretheir fair values due to their variable interest rates.
The carrying value and fair value of the Company’s investment in the Bank of Mauritius notes, classified asheld-to-maturity held to maturity securities is as follows:
| | | | As of March 31, | |
| | | | | | | | 2022 | |
| | | As of March 31, | | | Carrying Value | | Fair Value * | | | | |
| | | 2016 | | | (INR) | | (INR) | | US$ | |
| | | Carrying Value
(INR) | | | Fair Value
(INR) | | | US$ | | | (In million) | |
Non-current investments: | | | | | | | | | | | | | |
Fixed rate Bank of Mauritius notes | | | 6,785 | | | | 7,382 | | | | 111 | | | | 6 | | | | 6 | | | | 0.1 | |
| | | | As of March 31, | |
| | | | | | | | 2023 | |
| | | As of March 31, | | | Carrying Value | | Fair Value * | | | | |
| | | 2017 | | | (INR) | | (INR) | | US$ | |
| | | Carrying Value
(INR) | | | Fair Value
(INR) | | | US$ | | | (In million) | |
Non-current investments: | | | | | | | | | | | | | |
Fixed rate Bank of Mauritius notes | | | 6,631 | | | | 6,865 | | | | 106 | | | | 7 | | | | 7 | | | | 0.1 | |
The Company uses the yield method to estimate the fair value of fixed rate Bank of Mauritius notes by using interest rate as an input. The carrying amount of the Company’s investment in fixed rate Bank of Mauritius notes approximate, their fair values relative to variable interest rates.
21.
* Fair value measurement at reporting date using significant unobservable inputs (Level 3).
25. Derivative instruments and hedging activities
Option Contracts Undesignated as Hedge
(Gains)/Losses on foreign exchange derivative contracts for the year ended March 31, 2021, 2022 and 2023 aggregated INR Nil million, INR Nil million and INR Nil, respectively.
Contracts designated as a Cashflow Hedge
The Company hedged the foreign currency exposure risk related to certain intercompany loans denominated in foreign currency through a call spread option with a full swap for coupon payments. The Company also availed trade credit facilities denominated in foreign currencies which were fully hedged through interest rate swaps. The foreign currency forward contracts and options were not entered into for trading or speculative purposes.
The Company documented each hedging relationship and assessed its initial effectiveness on inception date and the subsequent effectiveness was tested as determined at the time of inception of the contract. The gain or loss on the hedge contracts was recorded in accumulated other comprehensive income to the extent the hedge contracts were effective. The gain or loss on the hedge contracts shall be reclassified to interest expense when the coupon payments and principal repayments are made on the related investments. The hedge contracts were effective as of March 31, 2023.
The following table presents outstanding notional amount and balance sheet location information related to foreign exchange derivative contracts as of March 31, 20162022 and 2017:2023:
| | | As of March 31, 2023 | |
| | | Notional
Amount | | | Non-
Current
Liabilities
(Fair Value) | | | Current
Liabilities
(Fair Value) | | | Prepaid
expenses and
other current
assets
(Fair Value) | | | Other
Non-Current
Assets
(Fair Value) | | | Other
Non-Current
Assets
(Fair Value) | | | Current
Liabilities
(Fair Value) | | | Non-
Current
Liabilities
(Fair Value) | | | Prepaid
expenses and
other current
assets
(Fair Value) | |
| | | (US$) | | | (INR) | | | (INR) | | | (INR) | | | (INR) | | | (US$) | | | (US$) | | | (US$) | | | (US$) | |
| | | Audited | |
| | | (In million) | |
| Fair valuation of swaps and options | | | 721.6 | | | | - | | | | 1,431 | | | | - | | | | 5,447 | | | | 66.3 | | | | 17.4 | | | | - | | | | - | |
| Forward exchange derivative contract | | | 97.4 | | | | - | | | | 108 | | | | - | | | | - | | | | - | | | | 1.3 | | | | - | | | | - | |
| Fair valuation of swaps and forward | | | 230.0 | | | | - | | | | 3 | | | | 210 | | | | 1,855 | | | | 22.6 | | | | 0.0 | | | | - | | | | 2.6 | |
| | | | | | | | | | | | | | | | | | | | | | | | |
| | | March 31, 2016 | | | March 31, 2017 | |
| | | Notional
Amount
(US$) | | | Prepaid Expenses
and Other
Current Asset
(INR) | | | Other
Assets
(INR) | | | Notional
Amount
(US$) | | | Prepaid Expenses
and Other
Current Asset
(INR) | | | Other
Assets
(INR) | |
Foreign currency option contracts | | | 14,976 | | | | 108,606 | | | | 83,426 | | | | 12,111 | | | | 63,818 | | | | 61,120 | |
| | | As of March 31, 2022 | |
| | | Notional
Amount | | | Non-
Current
Liabilities
(Fair Value) | | | Current
Liabilities
(Fair Value) | |
Prepaid
expenses and
other current assets
(Fair Value) | | | Other
Non-Current
Assets
(Fair Value) | | | Other
Non-Current
Assets
(Fair Value) | | | Current
Liabilities
(Fair Value) | | | Non-
Current
Liabilities
(Fair Value) | | Prepaid
expenses and
other current
assets
(Fair Value) | | |
| | | (US$) | | | (INR) | | | (INR) | | (INR) | | | (INR) | | | (US$) | | | (US$) | | | (US$) | | (US$) | | |
| | | Audited | |
| | | (In million) | |
| Fair valuation of swaps and options | | 753.9 | | | - | | | 1,735 | | - | | | 2,647 | | | 34.9 | | | 22.9 | | | - | | - | | |
| Forward exchange derivative contract | | 93.8 | | | - | | | 106 | | 13 | | | - | | | - | | | 1.4 | | | - | | 0.2 | | |
| Fair valuation of swaps and forward | | 253.7 | | | 7 | | | 658 | | - | | | 883 | | | 11.6 | | | 8.7 | | | 0.1 | | - | | |
The company recorded the net fair value of derivative liability of INR 4,404 million and INR 4,935 million (US$60.0 million) in the Other comprehensive income for the year ended March 31, 2022 and 2023, respectively and recorded an expense of INR 1,302 million and INR 1,726 million (US$21.0 million) related to the amortization of the cost of the hedge for the year ended March 31, 2022 and 2023, respectively.
The foreign exchange derivative contracts mature generally over a period of 30.7 – 3.3 years.
Contracts designated as fair value hedge
The Company hedged the exposure to 24 months.fluctuations in the fair value of firm commitments denominated in foreign currency through forward exchange derivative contracts. Fair value adjustments related to non-financial instruments will be recognized in the hedged item upon recognition and will eventually affect earnings as and when the hedged item is derecognized. Changes in the fair value of derivatives designated and qualifying as fair value hedges, together with any changes in the fair value of the hedged firm commitments attributable to the hedged risk, will be recorded in in the consolidated balance sheet. The gain or loss on the hedging derivative in a hedge of a foreign-currency-denominated firm commitment and the offsetting loss or gain on the hedged firm commitment is recognized in earnings in the accounting period, post the recognition of the hedged item in the balance sheet. The forward exchange derivative contracts were not entered into for trading or speculative purposes.
(Gains)/Losses on
The foreign exchange derivative contracts formature generally over a period of 1 months – 9 months.
The Company documented each hedging relationship and assessed its initial effectiveness on inception date and the subsequent effectiveness was tested as determined at the time of inception of the contract. The hedge contracts were effective as of March 31, 2023.
| | | As of March 31, 2022 |
| | | Notional | | Current Liabilities (Fair value) | | | Prepaid expenses and other current assets (Fair value) | | Prepaid expenses and other current assets (Fair value) | | | Current Liabilities (Fair value) | |
| | | (US$) | | (INR) | | | (INR) | | (US$) | | | (US$) | |
| | | Audited |
| | | (In million) |
| Forward exchange derivative contracts | | 15.7 | | | 12 | | | 1 | | | 0.0 | | | | 0.2 | |
The company recorded the fair value of derivative asset/liability of INR 12 million and INR Nil as at March 31, 2022 and 2023, respectively and incurred an amount of INR 1,001 million and INR Nil related to acquisition of capital assets during the year ended March 31, 2015, 20162022 and 2017 aggregated INR 101,252, INR 85,382 and INR 185,654 (US$ 2,863),2023, respectively.
22.
26. Concentrations of credit risk
Financial instruments that potentially subject the Company to significant concentrations of credit risk consist principally of cash and cash equivalents, restricted cash, accounts receivables and derivative instruments. The Company mitigates the risk of credit losses from financing instruments, other than tradeaccounts receivables, by selecting counter parties that are well known Indian or international banks.
AZURE POWER GLOBAL LIMITED
Notes to Consolidated Financial Statements
(INR and US$ amounts in thousands except share and per share data)
The following customers account for more than 10% of the Company’s accounts receivable and sale of power as of and for the year ended March 31, 20162022 and 2017:2023:
| | | March 31, 2022 | | | March 31, 2023 | |
| | | % of Sale | | | % of Accounts | | | % of Sale | | | % of Accounts | |
| Customer Name | | of Power | | | Receivable | | | of Power | | | Receivable | |
| Solar Energy Corporation of India | | | 30.09 | % | | | 39.64 | % | | | 42.31 | % | | | 47.02 | % |
| Punjab State Power Corporation Limited | | | 10.71 | % | | | 4.53 | % | | | 9.35 | % | | | 5.42 | % |
| NTPC Vidyut Vyapar Nigam Limited | | | 15.23 | % | | | 5.42 | % | | | 13.73 | % | | | 4.81 | % |
| Hubli Electricity Supply Company Limited | | | 5.32 | % | | | 10.49 | % | | | 3.93 | % | | | 8.91 | % |
| Chamundeshwari Electricity Supply Company | | | 2.88 | % | | | 8.20 | % | | | 2.57 | % | | | 10.67 | % |
| Andhra Pradesh Power Coordination Committee | | | 2.83 | % | | | 13.12 | % | | | 2.44 | % | | | 7.44 | % |
| | | | | | | | | | | | | | | | |
| | | March 31, 2016 | | | March 31, 2017 | |
Customer Name | | % of Accounts
Receivable | | | % of Sale
of Power | | | % of Accounts
Receivable | | | % of Sale
of Power | |
NTPC Vidyut Vyapar Nigam Limited | | | 11.4 | % | | | 25.2 | % | | | 5.6 | % | | | 15.6 | % |
Punjab State Power Corporation Limited | | | 15.9 | % | | | 17.0 | % | | | 39.3 | % | | | 24.1 | % |
Solar Energy Corporation of India | | | 48.5 | % | | | 29.0 | % | | | 21.9 | % | | | 23.4 | % |
Chhattisgarh State Corporation | | | 12.8 | % | | | 7.5 | % | | | 7.7 | % | | | 7.4 | % |
23.
27. Whistle-blower Allegations and Special Committee Investigation
In May 2022, we received a whistle-blower complaint that alleged health and safety lapses, procedural irregularities, misconduct by certain employees, improper payments and false statements relating to one of our projects belonging to a project subsidiary. Following extensive investigation by the Ethics Committee, supervised by the Board’s Audit and Risk Committee and by external counsel and forensic professionals, we identified evidence of manipulation and misrepresentation of project data by some employees at that project site. Weak controls over payments to a vendor and failures to provide accurate information both internally and externally were found, but no direct evidence that any improper payment was made to any government official was identified. Further, in Fiscal 2023, we reported to SECI that this project had (i) shortfalls in generation and (ii) that it failed to timely complete and commission the requisite contractually required capacity. On January 3, 2023 and January 4, 2023, SECI advised us, inter alia, that the project may be liable for damages and penalties for shortfalls in generation.
In September 2022, we received an additional whistle-blower complaint primarily making similar allegations of misconduct as raised in the May 2022 complaint, as well as allegations of misconduct related to joint ventures and land acquisition, allegations of our failure to be transparent with the market and advisors and other claims. The Ethics Committee, supervised by the Board’s Audit and Risk Committee, with the support of external counsel and forensic accounting professionals, investigated these September 2022 allegations. The investigation of the September 2022 complaint identified significant control issues in the process of acquiring land and land use rights in relation to one of our projects. The investigation specified that third party land aggregators may have been involved in improper payments but no improper transfer of money by the Group was identified. We have made an adjustment (de-capitalization) in the books of accounts of INR 138 million (US$1.8 million) on estimate, as a prudent measure in the given project. Further, we have reviewed the entire amount paid to land aggregators in other projects to identify any similar issue and after an assessment a further adjustment (decapitalisation) aggregating to INR 118 million (US$1.6 million) has been made in the books of account for FY 2022 on estimate, as a prudent measure, though no improper payments by the Group could be identified. In line with review made during the previous year, we reviewed reviewed the entire amount paid to land aggregators during the current year and made adjustment of INR 28 million (US$0.4 million) during the year ended March 31, 2023 on prudent basis though no improper payments by the Group could be identified in current year as well.
Our investigation did not substantiate other portions of this September 2022 whistle-blower complaint.
As part of our investigations of the May 2022 and September 2022 whistle-blower complaints, we also widened our review to include a review of projects commissioned in Fiscal 2022 and Fiscal 2023 to ensure that similar weaknesses were not present. As part of our investigations, we identified inconsistencies in project data in certain of our projects, but we identified no improper payments made in connection with these projects.
We have taken a range of actions due to these findings, and the employees involved in the misconduct are no longer associated with us. In accordance with the recommendations of the Ethics Committee, the Board’s Audit and Risk Committee and their legal and forensic advisors, we are implementing remedial measures in both project control and monitoring. Further, we reported the findings from its investigations of the May 2022 and September 2022 whistle-blower complaints to the SEC and the U.S. Department of Justice, and we continue to cooperate with these authorities.
In addition, a Special Committee of the Board (the “Special Committee”) was convened in August 2022 to review certain material projects and contracts over a three-year period for anti-corruption and related compliance issues. Independent outside counsel and forensic advisors were engaged to support the Special Committee. The Special Committee’s investigation has identified evidence that individuals formerly affiliated with the Group may have had knowledge of, or were involved in, an apparent scheme with persons outside the Group to make improper payments in relation to certain projects. To date, the Special Committee has not identified related improper payments or transfers by the Group. The Special Committee’s investigation is still ongoing. The Special Committee’s review and its findings has impacted the decision-making of the Group in connection with such projects. We have disclosed the details of the Special Committee’s investigation to the SEC and the U.S. Department of Justice, and we continue to cooperate with those agencies.
Our Group including our subsidiaries with respect to affected projects could be exposed to liabilities under the relevant contractual and tender documents (including levy of damages and liquidated damages, reduction of PPA tariffs and/or short closure of capacity), administrative actions (including the risk of PPA cancellation, risk of being debarred from SECI’s future contracts, withdrawal or nullification of commissioning certificates and/or revocation of commissioning extensions) and penalties from customers and other civil liabilities, all of which could adversely impact the revenue, profitability and capitalization of the affected projects. In addition, civil and/or criminal fines and/or penalties by regulatory authorities (including by the SEC, the U.S. Department of Justice and applicable Indian regulatory authorities) could be imposed on us as well as ongoing obligations, remedial corporate measures or other relief against us that could adversely impact our operations. Any such fines, penalties, ongoing obligations or other measures or relief against uscould materially and adversely affect our business, results of operations, financial condition and cash flows in future periods. Further, in addition, certain of those outcomes could adversely impact our ability to maintain compliance with the covenants under our credit facilities or result in an event of default thereunder. In addition, we could be exposed to future litigation in connection with any findings of fraud, corruption, or other misconduct by persons who served as our directors, officers and employees.
28. Subsequent events
During April 2017,
On May 3, 2023, the CompensationCompany announced the appointment of Mr. Sugata Sircar as CFO for the Company and the Group and Executive Director, Finance of the Company’s subsidiary, Azure Power India Private Limited, with effect from May 1, 2023. He subsequently resigned from his position as Non-executive Independent Director and member of the Company’s Audit & Risk Committee modified stock options grantedand Capital Committee.
On May 3, 2023, the Company has announced the appointment of Mr. Sunil Gupta as Chief Executive Officer (CEO) effective July 10, 2023, replacing the acting CEO, Rupesh Agarwal.
On May 27, 2023, Radiance have sent the Company a notice to two directors. The grants were modifiedterminate the Master Share Purchase Agreement in relation to increase the number of options granted86.5 MW Rooftop portfolio in relation to Azure Power Rooftop (Genco) Private Limited and to reduce the exercise price.
related group SPVs. The Company commenced commercial operationsand Radiance have mutually agreed to terminate the transfer in shareholding of its 100MW solar power plant locatedthe un-transferred 86.5 MW portfolio to Radiance and accordingly, the Purchaser will not purchase from the Sellers and the Sellers will not sell to the Purchaser the AZR Sale Shares (including any Seller Group Loans) as was agreed in Andhra Pradesh, subsequent tothe Previous MSPA and further amended under the Amended MSPA. The assets and related liabilities of these subsidiaries are not presented as “Assets classified as held for sale” and instead re-classified within the respective balance sheet captions in the consolidated balance sheet as at March 31, 2017.2022.
The Company evaluated all other events or transactions that occurred after March 31, 2017. Based on this evaluation,
On June 16, 2023, the Company is not awarehas announced the appointment of any event or transactions that would require recognition or disclosure inMr. Richard Payette as an Independent non-executive Director on the financial statements.Company’s Board effective July 1, 2023.
On June 23, 2023, the Company has announced the resignation of Ms. Christine Ann Mc Namara as an Independent non-executive Director on the Company’s Board.
On October 11, 2023, Mr. Alan Rosling resigned as Chairman of the Board and as a director of the Company and APIPL. Mr. M.S. Unnikrishnan then became the Chairman of the Board of the Company.
F-48Mr. Deepak Malhotra and Mr. Cyril Sebastien Dominique Cabanes resigned as directors of the Company on October 29, 2023 and October 30, 2023 respectively. On October 31, 2023, Mr. Jaime Garcia Nieto and Mr. Philippe Pierre Wind were appointed as directors of the Company. Both directors are non-executive nominees of the majority shareholder, CDPQ.
On December 14, 2023, APSEPL and APEL completed a consent solicitation in respect the 2024 Notes and 2026 Notes. Under the same, APSEPL and APEL sought the consent of the Noteholders of each of the 2024 Notes and 2026 Notes to amend certain terms of Bond Indentures. Pursuant to the terms of the amended Indentures, APSEPL and APEL launched tender offers for the 2024 Notes and the 2026 Notes on February 16, 2024. The early deadline of the tender offers was on March 1, 2024 and APSEPL and APEL purchased US$40,000,000 of the 2024 Notes and US$14,477,000 of the 2026 Notes respectively on March 11, 2024.
On March 13, 2024, Mr. M.S. Unnikrishnan resigned as Chairman of the Board and as a director of the Company and APIPL.
Subsequent to year end, the Company has received favorable orders for entitlement of compensation related to “change in law” event for increase in GST rate from 5% to 12 % and introduction & imposition of Safeguard Duty aggregating to INR 1,423 million. These favorable orders have been considered as subsequent adjusting event, accordingly the Company has recognised the same in the books of account as on 31st March 2023.
On February 13, 2024, FS India Solar Ventures Private Limited (“First Solar”) sent us a notice that First Solar was terminating the Master Supply Agreement, dated August 22, 2022 (“First Solar MSA”), between First Solar and APIPL. The notice claims that a termination payment of US$29.242 million is due to be paid by APIPL to First Solar under the First Solar MSA. APIPL disputes that such a termination payment is due and intends to engage in commercial discussions with First Solar to resolve the matter.
On March 05, 2024, Siemens Gamesa sent us a notice which claims a default and damages of INR 1,934 million (US$23.5 million) in connection with a supply agreement between Siemens Gamesa and APIPL in respect of our 345.6 MW wind power project in the state of Karnataka. APIPL disputes such claim of default and damages and intends to engage in mutual discussions with Simens Gamesa to resolve the matter.
On March 18, 2024, we received two letters from SECI. In its first letter, SECI stated that it had terminated the PPAs with the Group in respect of the 2,333 MW projects and reserved its rights to take action against the Group including forfeiture of the performance guarantees and success charges and fees in respect of the PPAs and other documentation associated with the 2,333 MW projects. In its second letter, SECI informed the Group that it was awarding the 2,333 MW projects and associated PPAs to a third-party. Further, SECI informed the Group that it had reduced Azure’s capacity allocation under the manufacturing Letter of Award by 2,333MW and its corresponding manufacturing capacity of solar cells and solar modules by 583 MW.
On July 13, 2023, the NYSE suspended trading in our Company’s shares and commenced delisting proceedings (the “Delisting Decision”). As described more fully in our July 13, 2023 Form 6-K, we took substantial steps to remediate the issues that led to the Delayed Filings including, among others, the replacement of our independent public accounting firm for our U.S. GAAP consolidated financial statements, strengthening our management team and appointing external consultants to review our internal controls and compliance framework. On July 26, 2023, we submitted an appeal of the Delisting Decision. However, on October 30,2023, the NYSE Committee for Review affirmed the Delisting Decision. On November 13, 2023 our shares were delisted from trading on the NYSE.


