UNITED STATES

SECURITIES AND EXCHANGE COMMISSION

Washington, D.C. 20549

FORM20-F

(Mark one)


REGISTRATION STATEMENT PURSUANT TO SECTION 12(b) OR (g) OF THE SECURITIES EXCHANGE ACT OF 1934

OR


ANNUAL REPORT PURSUANT TO SECTION 13 OR 15(d) OF THE SECURITIES EXCHANGE ACT OF 1934

FOR THE FISCAL YEAR ENDED DECEMBER 31, 20172018

OR


TRANSITION REPORT PURSUANT TO SECTION 13 OR 15(d) OF THE SECURITIES EXCHANGE ACT OF 1934

OR


SHELL COMPANY REPORT PURSUANT TO SECTION 13 OR 15(d) OF THE SECURITIES EXCHANGE ACT OF 1934

Date of event requiring this shell company report

For the transition period from                    to                    

Commission file number001-04547

UNILEVER N.V.


(Exact name of Registrant as specified in its charter)

The Netherlands


(Jurisdiction of incorporation or organization)

Weena 455, 3013 AL, Rotterdam, The Netherlands


(Address of principal executive offices)

R. Sotamaa, Chief Legal Officer and Group Secretary

Tel: +44(0)2078225252, Fax: +44(0)2078225464

100 Victoria Embankment, London EC4Y 0DY UK

(Name, telephone number, facsimile number and address of Company Contact)

Securities registered or to be registered pursuant to Section 12(b) of the Act:


Title of each class


Name of each exchange on which registered

N.V. New York registry shares each representing one

ordinary share of nominal amount of0.16 each

  New York Stock Exchange

4.8% Notes due 2019

2.2% Notes due 2019

2.1% Notes due 2020

1.8% Notes due 2020

4.25% Notes due 2021

2.75% Notes due 2021

1.375% Notes due 2021

3.0% Notes due 2022

2.2% Notes due 2022

3.125% Notes due 2023

3.25% Notes due 2024

2.6% Notes due 2024

3.375% Notes due 2025

3.1% Notes due 2025

2.0% Notes due 2026

2.9% Notes due 2027

3.5% Notes due 2028

5.9% Notes due 2032

4.8% Notes due 2019


New York Stock Exchange

New York Stock Exchange

New York Stock Exchange

New York Stock Exchange

New York Stock Exchange

New York Stock Exchange

New York Stock Exchange

New York Stock Exchange

New York Stock Exchange

New York Stock Exchange

New York Stock Exchange

New York Stock Exchange

New York Stock Exchange

New York Stock Exchange

New York Stock Exchange

New York Stock Exchange

New York Stock Exchange

New York Stock Exchange

Securities registered or to be registered pursuant to Section 12(g) of the Act:None

Securities for which there is a reporting obligation pursuant to Section 15(d) of the Act:None

Indicate the number of outstanding shares of each of the issuer’s classes of capital or common stock as of the close of the period covered by the annual report.

The total number of outstanding shares of the issuer’s capital stock at the close of the period covered by the annual report was:1,714,727,700 ordinary shares

Indicate by check mark if the registrant is a well-known seasoned issuer, as defined in Rule 405 of the Securities Act:

Yes        No

If this report is an annual or transition report, indicate by check mark if the registrant is not required to file reports pursuant to Section 13 or 15(d) of the Securities Exchange Act of 1934:

Yes        No

Indicate by check mark whether the registrant: (1) has filed all reports required to be filed by Section 13 or 15(d) of the Securities Exchange Act of 1934 during the preceding 12 months (or for such shorter period that the registrant was required to file such reports), and (2) has been subject to such filing requirements for the past 90 days.

Yes        No

Indicate by check mark whether the registrant has submitted electronically and posted on its corporate Web site, if any, every Interactive Data File required to be submitted and posted pursuant to Rule 405 of RegulationS-T (§232.405 of this chapter) during the preceding 12 months (or for such shorter period that the registrant was required to submit and post such files).

Yes        No

Indicate by check mark whether the registrant is a large accelerated filer, an accelerated filer, or anon-accelerated filer. See definition of “accelerated filer,” “large accelerated filer,” and “emerging growth company” inRule 12b-2 of the Exchange Act.


Large Accelerated filer  Accelerated filer  Non-accelerated filer  Emerging Growth Company 

If an emerging growth company that prepares its financial statements in accordance with U.S. GAAP, indicate by check mark if the registrant has elected not to use the extended transition period for complying with any new or revised financial accounting standards* provided pursuant to Section 13(a) of the Exchange Act. 

*The term ‘‘new or revised financial accounting standard’’ refers to any update issued by the Financial Accounting Standards Board to its Accounting Standards Codification after April 5, 2012.

Indicate by check mark which basis of accounting the registrant has used to prepare the financial statements included in this filing:


U.S. GAAP International Financial Reporting Standards
as issued by the International Accounting
Standards Board
  Other 

If ‘Other’ has been checked in response to the previous question, indicate by check mark which financial statement item the registrant has elected to follow. Item 17         Item 18 

If this is an annual report, indicate by check mark whether the registrant is a shell company (as defined inRule 12b-2 of the Exchange Act):

Yes         No 


CAUTIONARY STATEMENT

This document may contain forward-looking statements, including ‘forward-looking statements’ within the meaning of the United States Private Securities Litigation Reform Act of 1995. Words such as ‘will’, ‘aim’, ‘expects’, ‘anticipates’, ‘intends’, ‘looks’, ‘believes’, ‘vision’, or the negative of these terms and other similar expressions of future performance or results, and their negatives, are intended to identify such forward-looking statements. These forward-looking statements are based upon current expectations and assumptions regarding anticipated developments and other factors affecting the Unilever Group (the ‘Group’). They are not historical facts, nor are they guarantees of future performance.

Because these forward-looking statements involve risks and uncertainties, there are important factors that could cause actual results to differ materially from those expressed or implied by these forward-looking statements. Among other risks and uncertainties, the material or principal factors which could cause actual results to differ materially are: Unilever’s global brands not meeting consumer preferences; Unilever’s ability to innovate and remain competitive; Unilever’s investment choices in its portfolio management; inability to find sustainable solutions to support long-term growth;growth including to plastic packaging; the effect of climate change on Unilever’s business; significant changes or deterioration in customer relationships; the recruitment and retention of talented employees; disruptions in our supply chain;chain and distribution; increases or volatility in the cost of raw materials and commodities; the production of safe and high quality products; secure and reliable IT infrastructure; successful execution of acquisitions, divestitures and business transformation projects; economic, social and political risks and natural disasters; financial risks; failure to meet high and ethical standards; and managing regulatory, tax and legal matters.

These forward-looking statements speak only as of the date of this document. Except as required by any applicable law or regulation, the Group expressly disclaims any obligation or undertaking to release publicly any updates or revisions to any forward-looking statements contained herein to reflect any change in the Group’s expectations with regard thereto or any change in events, conditions or circumstances on which any such statement is based.

Further details of potential risks and uncertainties affecting the Group are described in the Group’s filings with the London Stock Exchange, Euronext Amsterdam and the US Securities and Exchange Commission, including in the Unilever Annual Report and Accounts 2017.2018.


LOGOLOGO


MAKING

SUSTAINABLE LIVING

COMMONPLACE


ANNUAL REPORT ON

FORM20-F 2017 2018


ANNUAL REPORT ON

FORM20-F 20172018

This document is made up of the Strategic Report, the Governance Report, the Financial Statements and Notes, and Additional Information for US Listing Purposes.

The Unilever Group consists of Unilever N.V. (NV) and Unilever PLC (PLC) together with the companies they control. The terms “Unilever”, the “Group”, “we”, “our” and “us” refer to the Unilever Group.

Our Strategic Report, pages 1 to 33,35, contains information about us, how we create value and how we run our business. It includes our strategy, business model, market outlook and key performance indicators, as well as our approach to sustainability and risk. The Strategic Report is only part of the Annual Report and Accounts 2017.2018. The Strategic Report has been approved by the Boards and signed on their behalf by Ritva Sotamaa – Group Secretary.

Our Governance Report, pages 3436 to 7665 contains detailed corporate governance information, our Committee reports and how we remunerate our Directors.

Our Financial Statements and Notes are on pages 7766 to 155.127.

Pages 1 to 157147 constitute the Unilever Annual Report and Accounts 20172018 for UK and Dutch purposes, which we may also refer to as ‘this Annual Report and Accounts’ throughout this document.

The Directors’ Report of PLC on pages 3436 to 46, 7749, 66 (Statement of Directors’ responsibilities), 10897 (Dividends on ordinary capital), 121110 to 126115 (Treasury Risk Management), 145 (branch disclosure)133 and 151 and 155137 (Post balance sheet event) and 145 (branch disclosure) has been approved by the PLC Board and signed on its behalf by Ritva Sotamaa – Group Secretary.

The Strategic Report, together with the Governance Report, constitutes the report of the Directors within the meaning of SectionArticle 2:391 of the Dutch Civil Code and has been approved by the NV Board and signed on its behalf by Ritva Sotamaa – Group Secretary.

Pages 158148 to 179167 are included as Additional Information for US Listing Purposes.

ONLINE

You can find more information about Unilever online at


LOGOLOGO www.unilever.com

For further information on the Unilever Sustainable Living Plan (USLP) visit


LOGOLOGO www.unilever.com/sustainable-living

The Annual Report on Form20-F 20172018 along with other relevant documents can be downloaded at


LOGOLOGO www.unilever.com/ara2017/ara2018/downloads

CONTENTS  

Strategic Report

   1 

About us

   1 

Chairman’s statement

   2 

Board of Directors

   3 

Chief Executive Officer’s review

   4 

Unilever Leadership Executive (ULE)

   5 

Our performance

   6 

Financial performance

   6 

Unilever Sustainable Living Plan

   7 

A changing world

   8 

Our value creation model

   9 

Our strategy

   10 

Delivering long-term value for our stakeholders

   11 

Our consumers

   11 

Society and environment

   13 

Sustainable Development Goals

   15 

Our people

   16 

Our partners

   17 

Our shareholders

   18 

Financial ReviewNon-financial information statement

   19 

Financial Review

20

Risks

   2627 

Governance Report

   3436 

Corporate Governance

   3436 

Report of the Audit Committee

41

Report of the Corporate Responsibility Committee

   43 

Report of the Nominating and Corporate GovernanceResponsibility Committee

   4546 

Directors’ Remuneration Report of the Nominating and
Corporate Governance Committee

   4748
Directors’ Remuneration Report50 

Financial Statements

   7766 

Statement of Directors’ responsibilities

66
Independent auditors’ reports67
Consolidated financial statements75
Consolidated income statement75
Consolidated statement of comprehensive income75
Consolidated statement of changes in equity76
Consolidated balance sheet   77 

Independent auditors’ reportsConsolidated cash flow statement

   78 

ConsolidatedNotes to the consolidated financial statements

   8679 

Consolidated income statementGroup Companies

   86138 

Consolidated statement of comprehensive incomeShareholder Information

   86146 

Consolidated statement of changes in equityIndex

   87

Consolidated balance sheet

88

Consolidated cash flow statement

89

Notes to the consolidated financial statements

90

Shareholder Information

156

Index

157147 

Additional Information for US Listing Purposes

   158148 


ABOUT US  


AT A GLANCE

UNILEVER IS ONEOUR BRANDS ARE AVAILABLE IN OVER 190 COUNTRIES. THIS GIVES US A UNIQUE OPPORTUNITY TO POSITIVELY IMPACT THE LIVES OF PEOPLE ALL OVER THE WORLD’S LEADING CONSUMER GOODS COMPANIES, MAKING AND SELLING AROUND 400 BRANDS IN MORE THAN 190 COUNTRIES.WORLD.

Every day, 2.5 billion people use our products to feel good, look good and get more out of life. Our range of world-leading, household-namearound 400 household brands includes Lipton, Knorr, Dove, Axe,Rexona, Hellmann’s and Omo. ThirteenWe are one of the largest fast moving consumer goods (FMCG) companies globally. In 2018 we had 12 brands with turnover of over a billion euros or more. The strength of our global brands is reflected in Kantar’s Brand Footprint report published in May 2018. It found that 13 of the world’s top 50 FMCG brands – based on market penetration and consumer interactions – are owned by Unilever up from twelvewith these brands chosen 36 billion times each year. This is significantly more than any other FMCG company in the previous year, with our nearest competitor owning just five, according to Kantar’s brand footprint report in May 2017.study.

In 2017 we had 13 billion euro brands. In addition ourOur portfolio also includes trusted and iconic local brands designed to meet the specific needs of consumers in their home market such as Bango in Indonesia, PureitBrooke Bond in India and SuaveBrilhante in the United States.Brazil. We are increasingly seeing our local brands and innovations being rolled out to more markets such as Lakme and Breyers Delights. Our geographic reach gives us an unparalleled global presence, including a unique position in emerging markets which generate 58% of our turnover.

During 2017,From the beginning of 2018, Unilever operatedbegan operating across four categories.three new Divisions created as part of our efforts to accelerate shareholder value creation. The largest wasby turnover is Beauty & Personal Care followed by Foods & Refreshment then Home Care and Refreshment. Each one is discussed in more detailCare. Details of each can be found on pages 11 andto 12. In April 2017, we announced our intention to combine our Foods and Refreshment categories (which took effect on 1 January 2018) and the divestmentThe sale of our Spreadsspreads business which we expect to completewas also completed inmid-2018mid-2018. after a6.825 billion offer from KKR in December 2017. These changes willcreate a strong platform to accelerate our strategy of long-term, sustainable shareholder value creation. In this Annual Report and Accounts, we report the performance of Foods and Refreshment separately because they were separate categories for the reporting period. They will be reported together from 2018 onwards.Our strategy is explained in detail on page 10.

Our business activities span a complex global value chain. Seechain which is described on page 9 for more details.9. At the heart of our business is a workforce of 161,000155,000 people (as at 31 December 2018) who are driven by our Purposepurpose and empowered to excel in our fast-changing markets. Unilever’sThe combination of global scale and local agility has become yet more effective through the continued implementation of our Connected 4 Growth (C4G) change programme to meet consumer trends which are detailed on page 8. Our employees are supported by leadership teams with representatives from over 70 countries. Of our business leaders, 80% are local to their markets reflecting the deep local expertise at the heart of our business. This rises to more than 90% when we include managers who support those teams.

In this volatile and uncertain world, protecting Unilever through the fostering of business integrity is anon-negotiable for all employees. Our Code of Business Principles (the Code), and the 24 policies that support it (Code Policies), set out the behaviour standards required from all our employees.people. The Code Policies cover a number of areas, including counteringanti-bribery and corruption, (eg anti-bribery), respecting people (eg respect, dignity and fair treatment)treatment of people and safeguarding information.personal data and privacy. Together, the Code and Code Policies help us put our values of Integrity, Respect, Responsibility and Pioneering into practice. See page 16 for more on our Code and Code Policies.

Our employeesDuring the year the Boards withdrew proposals to simplify Unilever’s dual-headed legal structure after extensive engagement with shareholders. We remain firmly committed to our 2020 financial programme and are supported by a management team with representatives from around 90 countries. In emerging markets, more than 70%confident of our country leadership teams are local. It is this combination of global strengthmeeting its key targets and deep local expertise which lies at the heart ofobjectives as our success in developing strong, consumer-relevant innovation.

To harness these global and local advantages we have changed the way we are organised. Central to this strategy is the accelerated implementation of Connected 4 Growth (C4G), the largest change programme Unilever has undergone in the last ten years to create a faster, simpler organisation. Our new C4G organisation is now fully operational. We expect the benefits of C4G to be realised progressively during 2018delivers more efficiency, lower costs and 2019. C4G’s strategic role is explained in moresignificant operational and financial benefits.

This Annual Report and Accounts provides further detail on page 10.

A further change to make Unileverour performance during the year and how our business model is delivering strong returns for shareholders and a simplermore sustainable way of doing business for the benefit of all our stakeholders. Find out more about our performance on pages 6 and more flexible business has been a review by the Boards of our dual-headed legal structure. The review by the Boards is continuing and the outcome will be announced in due course.7.
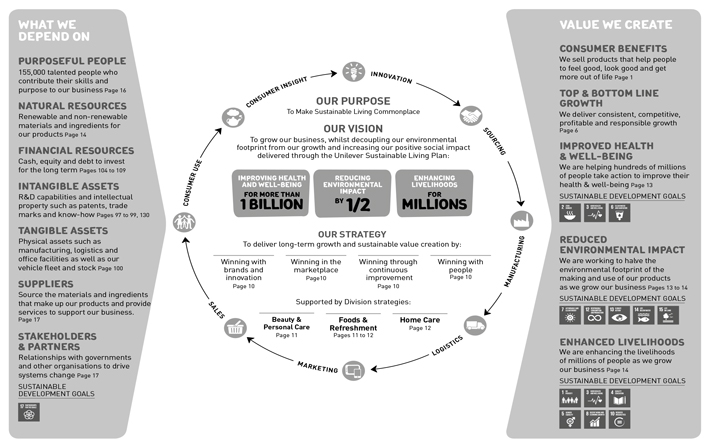
 

OUR PURPOSE

UNILEVER HAS A CLEARUNILEVER’S PURPOSE IS TO MAKE SUSTAINABLE LIVING COMMONPLACE. WE BELIEVE THIS IS THE BEST WAY TO DELIVER LONG-TERM SUSTAINABLE GROWTH.

AsWe believe long-term sustainable growth is best delivered through brands that offer great performance and have a genuine purpose. Washing shirts whiter or making hair healthier and shinier is still vitally important, but product performance by itself is no longer enough. Consumers are looking for more.

At Unilever, we encourage our brand managers to take a stance and make a positive difference to society. Purpose defines a brand in people’s minds and is best delivered through action. It’s only through action that consumers will see purpose as more than marketing.

Our company purpose ‘To make sustainable living commonplace’ is unequivocal. We want to help create a world where everyone can live well within the pacenatural limits of change accelerates inthe planet. We put sustainable living at the heart of everything we do, including our markets, we are creating a stronger, simplerbrands and more agile business. These changes will help us to deliverproducts, our Purposestandards of behaviour and our Visionpartnerships which drive transformational change across our value chain.

Purpose takes many forms amongst our brands. Some, like Lifebuoy, take on life-threatening diseases associated with poor hygiene with programmes to growchange handwashing behaviour. Domestos’ purpose is to improve sanitation for millions of people who do not have access to a toilet. Our brands can also be a catalyst to promote positive cultural norms. Brooke Bond’s purpose ‘Common ground is only a cup away’ is highly relevant in an increasingly divided world and can be applied well locally. In India, it addresses religious tensions. In the Gulf, divorce. In Canada,same-sex relationships.

Some of our brands take an activist stance, mobilising citizens to change policy or create social movements. For example, Ben & Jerry’s builds movements around issues such as climate change and the refugee crisis. Seventh Generation – with its plant-based products – campaigns for renewable energy. Deodorant brand Rexona’s purpose is to help reverse physical inactivity, a big issue for societies facing increasingly sedentary lifestyles. Rexona believes ‘the more you move, the more you live’ supported by Motion Sense technology which works through movement. Radiant believes everyone deserves an opportunity to shine. It goes beyond bright clothes and helping consumers ‘dress to progress’, enhancing skills through its Career Academies. Each market focuses on the skills that matter locally. In Brazil that’s entrepreneurial and business whilst decouplingskills. In India, English language skills.

All of Unilever’s brands are on a journey to becoming purposeful. Sustainable Living brands are those that are furthest ahead. In 2017, 26 of our brands qualified as Sustainable Living brands including ourB-Corp certified brands such as Ben & Jerry’s, Seventh Generation and Pukka Herbs, which means that they meet high standards of social and environmental footprint from ourperformance, transparency and legal accountability. Our Sustainable Living brands grew 46% faster than the rest of the business and delivered more than 70% of Unilever’s growth, and increasing our positive social impact.driven by consumer demand for brands with purpose at their core.

However volatile and uncertain the world becomes,is, Unilever’s Purposepurpose – supported by the Unilever Sustainable Living Plan (USLP) and Visionbrands with purpose – will remain steadfast because we believe that managing for the long termbenefit of multiple stakeholders is the best way for us to grow.

We are well placednow looking beyond the current USLP as many of our targets end in 2020. We carried out an extensive listening exercise on the future of sustainable business. We spoke to deliver long-term value through our strategy, category strategies and the Unilever Sustainable Living Plan (USLP), launched in 2010. These are supported by a transformational change agenda which combines our own actions with a stakeholder approach to external advocacy and public policy. Our scale and reach mean we are well placed to capture the economic opportunities presented by the United Nations Sustainable Development Goals (SDGs). Find out more about how we are creating value from the SDGs on page 15.

The USLP is a value driver in its own right. Our commitment to the USLP’s three big goals of improving health and well-being forapproximately 300 stakeholders, including more than 1 billion people by 2020, halving our environmental footprint by 2030,130 external experts, and enhancing livelihoods for millions by 2020 has delivered growth forheard from over 40,000 employees through a ‘Have Your Say’ survey. They gave us their views on the business. In 2016, 18 of our top 40 brands qualified as Sustainable Living brands, growing 50% faster than the rest of the business, while delivering more than 60% of Unilever’s growth. Their success is driven by the growing consumer demand for brandspriorities that have purpose at their core. Our 2017 Sustainable Living brandsthey would like Unilever to focus on. The results will be announced in May 2018 once the analysis is complete. Find out more about our Sustainable Living brands on pages 11used to 13.

The USLP also delivers lower costs through reduced waste, energy and packaging. It lowers risks in our supply chain by securing a sustainable supply of critical raw materials such as palm oil and tea. And it also increases trust in our business - particularly among consumers, employees, investors and governments.

We work in partnership with governments and other organisations to drive transformational change across society with initiatives to help realise the SDGs. These are themselves opportunities to grow our business by addressing unmet challenges while alleviating major social and environmental issues, such as climate change and deforestation, creating more opportunities for women and enhancing livelihoods, promoting health and well-being and championing sustainable agriculture and food security.

Our track record over the past eight years proves our multi-stakeholder model of long-term, compounding, sustainable growth is working for shareholders. See page 18 for more details. At the same time, we have helped more than 601 million people improve their health and hygiene. We have enabled 1.6 million small-scale retailers and 716,000 smallholder farmers to access initiatives aiming to increase their incomes or improve their agricultural practices. And we have sourced 56% of our agricultural raw materials sustainably.

This Annual Report and Accounts provides further detail on our performance during the year and how our business model is delivering accelerated returns for shareholders and a more sustainable way of doing business for the benefit of all our stakeholders. Find out more about our performance on pages 6 and 7.co-create Unilever’s future agenda.


Annual Report on Form 20-F 20172018 Strategic Report 1


CHAIRMAN’S STATEMENT  


As we look back on 2017, it2018 PERFORMANCE

I am pleased to report that 2018 was another year of consistent top and bottom line performance for Unilever. Solid revenue growth was combined with good profitability and cash flow delivery. This despite a challenging year for the global economy, with subdued growth and high levels of volatility undermining consumer confidence in many parts of the world.

Unilever is quite clearalso operating in a sector that the consumer goods sector is going through a vast amount ofexperiencing widespread change and disruption. Increasingly fragmented media channels and routesAlthough challenging, these changes offer significant opportunities to market are transforming the shopper experience and leaving the way open for many more new players to enter our markets. Consumers’ own behaviour is also changing, with a much higher importance being placed today on products that satisfy a growing desire for naturalness and authenticity.

It all makes this a very exciting time to be in consumer goods and while change on this scale brings its own challenges, there are many more opportunities in my view, especially for companies able to respondmove with the kind of speed and agility and who can tailor their offering to changing consumer preferences. To that today’s environment demands.

For Unilever,end, the organisational changes of recent years - with a much greater focus on front-line empowerment - combined withBoards are very confident that Unilever’s strategy and the steady strengtheningmeasures it has taken to strengthen its organisation, sharpen its portfolio and sharpening of our portfolio, mean that the Group isdigitise its operations make it well placed to take advantagecapture new and emerging growth opportunities.

The Boards also believe that the Unilever Sustainable Living Plan continues to set Unilever apart as a business highly attuned to the growing desire among consumers for companies and brands that serve a wider societal and environmental need.

In 2018 we also completed successfully the complex disposal of the spreads business. Our ShareBuy-back programme delivered on its intention to buy back shares with an aggregate market value of6 billion, in line with Unilever’s objective to return theafter-tax proceeds of the spreads disposal to shareholders.

SIMPLIFICATION

Following a thorough review and widespread consultation, the Boards put forward proposals in 2018 to simplify Unilever’s dual-headed structure under a new single holding company.

In developing the proposal – including a recommendation to incorporate in the Netherlands while maintaining listings in the Netherlands, the UK and the US – the Boards were motivated by the opportunity to unlock value by simplifying Unilever and giving it added flexibility to compete effectively over the longer-term.

We recognised however that the proposal did not receive support from a significant group of shareholders and therefore considered it appropriate to withdraw. The Boards still believe that simplifying Unilever’s dual-headed structure would, over time, provide opportunities to further accelerate value creation and would serve Unilever’s best long-term interests.

Since withdrawing the proposal, I have met with a significant number of PLC and NV shareholders to discuss further ideas and possible next steps. It is clear from all these changing market dynamics. Theremeetings that there is widespread support for the principles and strategic rationale behind Simplification. In these meetings, I also no doubt,took the opportunity to reaffirm our commitment to further strengthen our corporate governance. Accordingly, in my view,February 2019, we followed through on our commitment to cancel the NV Preference Shares, in itself a major step towards simplifying the company’s share capital.

BOARD COMPOSITION AND SUCCESSION

The 2018 AGMs marked the retirement of Ann Fudge as aNon-Executive Director and Vice-Chairman of the Boards. On behalf of the Boards, I would like to thank Ann for her outstanding and valued contribution to Unilever.

I was also delighted that you elected Andrea Jung as aNon-Executive Director at the same AGMs. Andrea brings highly relevant experience and expertise to Unilever and is a very welcome addition to the Boards.

CEO SUCCESSION

A key focus for the Boards last year was to manage the CEO succession, with Paul Polman stepping down as CEO after 10 years with the Group.

After a rigorous and wide-ranging selection process, the Boards were unanimous in its decision to appoint Alan Jope to the role. Alan became CEO on 1 January 2019 and is being proposed as an Executive Director at the 2019 AGMs.

Alan has led Unilever’s unflinchinglargest Division, Beauty & Personal Care, for the last four years and he has been a member of the Group’s Leadership Executive since 2011. His previous roles include running Unilever’s business in North Asia. Alan has deep understanding and wide experience of Unilever’s business and markets. He is a strong, dynamic and values-driven leader with an impressive track record of delivering consistent high-quality performance across both developed and emerging markets. The Boards warmly welcome Alan to the role and look forward to working closely with him in the years ahead.

Unilever has been transformed under the leadership of Paul Polman. He has overseen ten years of consistent top and bottom line growth and very competitive returns to shareholders. He leaves with the company’s geographic footprint and brand portfolio stronger and well positioned for future growth.

Paul’s pioneering commitment to sustainable and equitable growth have marked him – and the company – out as reflectedleaders in the field. Thanks to his visionary leadership and tireless efforts, Unilever Sustainable Living Plan, has growing resonance among consumersis not only one of the most admired and respected companies in the world over.today, but also one of the most desired employers.

These factors certainly contributed to another strong year for Unilever, with solid revenue growth, strong profitabilityPaul retired as CEO and good cash flow performances. These results capped what has been an eventful year foras a Board member on 31 December 2018. He will support the transition process in the first half of 2019 and will leave the Group which included – in February – an unexpected takeover attempt.

The Board had no hesitation in rejectingearly July. We thank him for his remarkable contribution to the offer for all the shares of Unilever N.V.company and PLC, which we believed was without any financial or strategic merit. Even though the offer was quickly withdrawn, it did highlight further opportunities to capture the value we see in Unilever at a faster rate.

To that end, the Board and management undertook a thorough review on how to accelerate sustainable shareholder value creation, building on the Group’s successful long-term compounding growth model. A wide-ranging package of measures announced in April was well received and by the end of the year the Group was able to report strong progress towards those goals.

At the heart of the review was an acceleration of the Group’s existing strategy, including faster implementation of the successful Connected for Growth change programme, first introduced in 2016, as well as the further sharpening and strengthening of the portfolio. No fewer than twelve acquisitions were announced or completed in 2017. Significantly, the Group also announced in December the sale of the Spreads business to KKR.

As part of the review the Group also announced the setting of a long-term goal towards an underlying operating margin target of 20% by 2020 and the completion of a5 billion sharebuy-back programme. Another important outcome was a commitment to simplify the Group’s capital structure, and hence provide Unilever with the flexibility for further – and bigger – portfolio change if deemed necessarywish him every success in the future. The review of the dual-headed structure is progressing well, and while no decisions have yet been taken, the Board considers that unification with a single share class would be in the best interests of Unilever and its shareholders as a whole.

Whatever the outcome of the dual-headed structure review, the Board is determined that Unilever will remain at the forefront of good corporate governance and to that end we have already announced that it would be our intention to maintain listings in the Netherlands, the United Kingdom and the United States, and continue to apply both the UK and Dutch corporate governance codes.

These are important matters, but the Board also remains firmly focussed on the Group’s number one priority of continued outperformance over both the medium and the long-term. The events of this year havere-affirmed our confidence that Unilever has both the quality of management and the clarity of strategy needed to deliver on this objective.REMUNERATION

During the review earlier in the year, I met2018 we also continued to consult with investors in Europe and North America as part of a consultation exercise involving 50 of the Group’s top shareholders and other investors. The meetings were valuable in confirming the widespread support among shareholders for Unilever’s long-term compounding growth model, whilst also helping to identify opportunities to accelerate value creation.

We also conducted a separate consultation on our proposed new Remuneration Policy, particularly for the Executive Directors. At the 2017 AGMs you provided your strong support to the implementation of a reward framework that encourages and enhances thea strong performance culture that Paul Polman has built at Unilever by enabling Unilever managers within Unilever to have an even stronger personal commitment to Unilever share ownership. The proposed

At the 2018 AGMs, we asked shareholders to approve a new Remuneration Policy will be put tothat would align the pay of our Executive Directors fully with the Reward Framework we introduced following the 2017 AGMs. Whilst shareholders to beapproved the new Remuneration Policy, we recognised that a significant minority of NV and PLC shareholders voted upon atagainst the proposal. On pages 50 and 51 of the 2018 AGMsDirectors’ Remuneration Report, we describe in Maydetail the principal concerns and how we responded to enable this. Further information on our proposals can be found inthem and other changes to the Compensation Committee’s report on pages 47 to 76.implementation of the Remuneration Policy.

EVALUATION

OurFollowing the external Board evaluation in 2017, was externally facilitated andwe used a simplified internal evaluation this year. While we concluded that the results were discussed atBoards continued to operate in an effective manner overall, the April 2017 Board meeting. The Board continues to perform effectively with good leadership and competent and engaged members, and has the appropriateBoards decided that it will maintain a particular focus on bothin-year performanceportfolio and strategy for the future. Reflecting on the lessons learnt by thechannel strategies and digitisation. Each Board in the previous year the Board agreed, in particular, in the evaluation discussions to:

maintain an ongoing focus on strategy and emerging risks during the year in addition to the deep focus on strategy once a year;
continue to ensure that Board succession planning is closely aligned to Unilever’s strategy. In this regard the Board welcomed the skills and capabilities matrix developed by the Nominating and Corporate Governance Committee as a tool to helpalso performed its own self-evaluation, agreeing areas where it could enhance Board succession discussions; and,
ensure that the Board programme and agendas allow the best exposure to Unilever’s business and its senior management.

Further detail on the evaluation process this year, together with the Board’s remit, operations and the topics the Board regularly discusses and debates can be found in the Governance section on pages 34 to 76.

BOARD COMPOSITION AND SUCCESSION

During the year, we saw the departure of Professor Louise Fresco who I would like to thank for her outstanding contribution to Unilever. The Board remains truly diverse in their nationality, experience and gender, with the proportion of femaleNon-Executive Directors in 2017 at 45%.effectiveness further. These are described within each Committee Report.

LOOKING AHEAD

Confidence in our outlook was reflected earlier in the year when we announced a 12% increase in the dividend for the 2017 financial year. Despite the factEven though trading conditions are likely to remain challenging in 2018,2019, the Board remainsBoards remain confident both in the outlook and in the strategy for the Group.Group, reflected by an 8% increase in the dividend for the 2018 financial year.

Finally, on behalfOver the year, Board members have visited Unilever operations in several parts of the Board, I would like to thank our many stakeholdersworld, including China and the United States. We have seenfirst-hand the depth of talent that exists within the company, as well as the 161,000 hardworkingcommitment of Unilever people to go on improving the lives of consumers and the societies in which the company operates. On behalf of the Boards, I want to thank all of the 155,000 employees of Unilever for their remarkable efforts.

Equally we have been pleased to engage with many of the company’s other stakeholders, without whom Unilever could not be successful. That includes our shareholders, who I also want to thank for their continued support and commitment.of the company.

MARIJN DEKKERS

CHAIRMAN


2 Strategic Report  Annual Report on Form 20-F 20172018


BOARD OF DIRECTORS  


OVERVIEW OF EXECUTIVE &NON-EXECUTIVE DIRECTORS


MARIJN DEKKERSChairman


Previous experience: Bayer AG (CEO); Thermo Fisher Scientific Inc. (CEO).

Current external appointments: Novalis LifeSciences LLC (Founder and Chairman); General Electric Company (NED); Quanterix Corporation (Director); Georgetown University (member Board of Directors); Foundation for the National Institutes of Health (Director).


ANN FUDGE Vice-Chairman/Senior Independent Director

YOUNGME MOON


PAUL POLMAN

CEOALAN JOPE


GRAEME PITKETHLY

CFO


NILS SMEDEGAARD

Vice-Chairman/SeniorCEOCFOANDERSEN

Independent Director


Previous experience:General Electric Company (NED); Marriott International, Inc. (NED); Young & Rubicam, Inc.Harvard Business School (Chairman and CEO)Senior Associate Dean for the MBA Program); Massachusetts Institute of Technology (Professor); Avid Technology (NED).

Current external appointments:Novartis AG (NED)Sweetgreen Inc (Board Member); Northrop Grumman Corporation (NED)Jand Inc (Board Member); Catalyst, Inc. (Director); US Programs Advisory Panel of Gates Foundation (Chairman); Brookings Institution (Honorary Trustee)Harvard Business School (Professor).


Dutch, Male, 61.NationalityBritishAge54, Male. Appointed CEO: January 2009.2019. Appointed Director: October 2008.Alan Jope will be proposed for election as an Executive Director at the 2019 AGMs.

Previous experience:Procter & Gamble Co. (Group President, Europe)Beauty and Personal Care Division (President); Nestlé SA (CFO)Unilever Russia, Africa and Middle East (President); Alcon Inc. (Director).

Current external appointments:DowDuPont, Inc. (NED)Unilever North Asia (President); World Business Council for Sustainable Development (Chairman, Executive Committee)SCC and Dressings (Global Category Leader); Financing Capitalism for the Long-Term (FCLT), Global (Board member)Home and Personal Care North America (President).


NationalityBritish Male, 51.Age52, Male. Appointed CFO: October 2015. Appointed Director: April 2016. Attended 6/6 planned Board Meetings and 4/4 ad hoc Board Meetings.

Previous experience:Unilever UK and Ireland (EVP and General Manager); Finance Global Markets (EVP); Group Treasurer; Head of M&A; FLAG Telecom (VP Corporate Development); PwC.

Current external appointments:Financial Stability Board Task Force on Climate Related Financial Disclosure (Vice Chair).


Previous experience:A.P. Moller – Maersk A/S (Group CEO); Carlsberg A/S and Carlsberg Breweries A/S (CEO); European Round Table of Industrialists (Vice-Chairman); Unifeeder S/A (Chairman).

Current external appointments:AKZO Nobel N.V. (Chairman); BP Plc (NED); Dansk Supermarked A/S (Chairman); Unifeeder S/A (Chairman); Faerch Plast (Chairman).


LAURA CHA


VITTORIO COLAO


JUDITH HARTMANN


MARY MAANDREA JUNG


Previous experience:Securities and Futures Commission, Hong Kong (Deputy Chairman); China Securities Regulatory Commission (Vice Chairman); China Telecom Corporation Limited (NED); 12th National People’s Congress of China (Hong Kong Delegate).

Current external appointments:HSBC Holdings plc (NED); China Telecom Corporation Limited (NED;Hong Kong Exchanges and Clearing Ltd(Non-Executive Chairman); Foundation Asset Management Sweden AB (Senior international advisor)adviser); Executive Council of the Hong Kong Special Administrative Region(Non-official member); 12th National People’s Congress of China (Hong Kong Delegate).


Previous experience:Vodafone Group plc (CEO); RCS MediaGroup SpA (CEO); McKinsey & Company (Partner); Finmeccanica Group Services SpA (renamed to Leonardo SpA) (NED); RAS Insurance SpA (merged with Allianz AG), (NED).

Current external appointments:Vodafone Group plc (CEO); Bocconi University (International Advisory Council)(NED and Executive Committee member); European Round Table of Industrialists (Vice-Chairman)Oxford Martin School (Advisor).


Previous experience:General Electric (various roles); Bertelsmann SE & Co. KGaA (CFO); RTL Group SA (NED); Penguin Random House LLC (NED).

Current external appointments:ENGIE Group CFO(CFO and EVP North America and UK/Ireland;Ireland); Suez (NED).


Previous experience:Avon Products Inc (CEO); General Electric (Board Member); Daimler AG (Board Member).

Currentexternal appointments:Grameen America Inc (President and CEO); Apple Inc (NED); Wayfair Inc (NED).

MARY MA

STRIVE MASIYIWA

JOHN RISHTON

FEIKE SIJBESMA

Previous experience:TPG Capital, LP (Partner); TPG China Partners(Co-Chairman).

Current external appointments:Lenovo Group Ltd. (NED); Boyu Capital Consultancy Co. Ltd (Managing Partner); MXZ Investment Limited (Director); Securities and Futures Commission, Hong Kong (NED).


STRIVE MASIYIWA

YOUNGME MOON

JOHN RISHTON

FEIKE SIJBESMA

Previous experience:Africa Against Ebola Solidarity Trust(Co-Founder and Chairman); Grow Africa(Co-Chairman); Nutrition International (formerly known as Micronutrient Initiative) (Chairman).

Current external appointments:Econet Group (Founder and Group Executive Chairman); Econet Wireless Zimbabwe Ltd (Director); The Alliance for a Green Revolution in Africa (AGRA)Not-for-Profit Corporation (Chairman); Rockefeller Foundation (Trustee).


Previous experience:Harvard Business School (Chairman and Senior Associate Dean for the MBA Program); Massachusetts Institute of Technology (Professor); Avid Technology (NED).

Current external appointments:Rakuten, Inc. (NED); Sweetgreen Inc (Board Member); Harvard Business School (Professor).

Previous experience:Rolls-Royce Holdings plc (CEO); Koninklijke Ahold NV (merged to Koninklijke Ahold Delhaize NV) (CEO, President and CFO); ICA (now ICA Gruppen AB)(NED).

Current external appointments:Informa plc (NED); Serco Group plc (NED); Associated British Ports Holdings Ltd. (NED).


Previous experience:Supervisory Board of DSM Nederland B.V. (Chairman); Utrecht University (Supervisory)(Supervisory Director); Stichting Dutch Cancer Institute/ Antoni van Leeuwenhoek Hospital NKI/AVL) (Supervisory)(Supervisory Director).

Current external appointments:Koninklijke DSM NV (CEO and Chairman of the Managing Board); De Nederlandsche Bank NV (Member of the Supervisory Board); Carbon Pricing Leadership Coalition (High Level Assembly Co- Chairman)Co-Chairman), Climate Leader for the World Bank Group Leader, convened by World Bank Group.


NON-EXECUTIVE DIRECTORS


 MARIJN  NILS LAURA  VITTORIO ANN JUDITH  MARY  STRIVE YOUNGME  JOHN FEIKE  MARIJN NILS  LAURA  VITTORIO JUDITH  ANDREA  MARY  STRIVE YOUNGME  JOHN FEIKE
 DEKKERS  ANDERSEN CHA  COLAO FUDGE HARTMANN  MA  MASIYIWA MOON  RISHTON SIJBESMA  DEKKERS ANDERSEN  CHA  COLAO HARTMANN  JUNG  MA  MASIYIWA MOON  RISHTON SIJBESMA
                                  

Age

 60  59 68  56 66 48  65  57 53  60 58  61 60  69  57 49  59  66  58 54  61 59


Gender

 Male  Male Female  Male Female Female  Female  Male Female  Male Male  Male Male  Female  Male Female  Female  Female  Male Female  Male Male


Nationality

 Dutch /

American

  Danish Chinese  Italian American Austrian  Chinese  Zimbab-
wean
 American  British Dutch  Dutch /
American
 Danish  Chinese  Italian Austrian  American /
Canadian
  Chinese  Zimbabwean American  British Dutch


Appointment date

 April
2016
  April
2015
 May
2013
  July
2015
 May

2009

 April
2015
  May
2013
  April

2016

 April
2016
  May

2013

 November

2014

  April

2016

 April

2015

  May

2013

  July

2015

 April

2015

  May

2018

  May

2013

  April

2016

 April

2016

  May

2013

 November

2014


Committee membership*

 CC, NCGC  AC NCGC  CC CC

(Chairman)

 AC  CC  CRC

(Chairman)

 CRC  AC

(Chairman)

 CRC, NCGC

(Chairman)

  CC, NCGC

(Chairman)

 AC  NCGC  CC

(Chairman)

 AC  CC  CC  CRC

(Chairman)

 CRC  AC

(Chairman)

 CRC, NCGC


Leadership of complex global entities


Finance


Broad Board experience


Consumer / FMCG insights


Geo-political exposure


Financial expertise


FMCG/consumer insights


Emerging markets experience


Digital insights


Sales & marketing


Marketing and sales expertise


Science & technology


Science, technology and innovation expertise


CSR experience


HR and remuneration in international firms


Attendance at planned Board Meetings

 6/6  6/6 6/6  6/6 6/6 6/6  6/6  6/6 6/6  6/6 6/6  6/6 6/6  6/6  6/6 6/6  3/3  6/6  6/6 6/6  6/6 6/6


Attendance at ad hoc Board Meetings

 8/8  8/8 6/8  7/8 5/8 6/8  8/8  7/8 7/8  5/8 7/8  4/4 2/4  2/4  4/4 3/4  3/3  4/4  3/4 4/4  3/4 4/4


Tenure as at 2017 AGMs

 1  2 4  2 8 2  4  1 1  4 3

Tenure as at 2018 AGMs

  2 3  5  3 3  0  5  2 2  5 4


*

AC refers to the Audit Committee; CC refers to the Compensation Committee; CRC refers to the Corporate Responsibility Committee; and NCGC refers to the Nominating and Corporate Governance Committee.


Annual Report on Form 20-F 20172018 Strategic Report 3


CHIEF EXECUTIVE OFFICER’S REVIEW


Widespread economic and geopolitical uncertainty meant that the global business environment remained challenging in 2018. Currency depreciation in a number of key markets fuelled inflationary pressures and dampened consumer demand, while input costs rose steadily on the back of escalating commodity prices.

A CHALLENGING BACKDROP TO THE YEARSOLID PERFORMANCE

2017Against this backdrop, Unilever delivered a solid performance. Underlying sales grew by 3.1%, excluding the recently-divested spreads business (2.9% including spreads). Growth was another challenging yearprofitable, bringing our underlying operating margin to 18.4%, up 90 basis points, which also drove a healthy free cash flow of5 billion for the world economy,year.

Importantly, the overall shape and quality of the performance was encouraging. We achieved a good balance of price and volume growth. Growth was broad-based, across each of our three global Divisions – Beauty & Personal Care, Home Care and Foods & Refreshment. Our continuing margin progression was underpinned by well-embedded savings and efficiency programmes, and an improving mix from underlying sales growth in particular forBeauty & Personal Care.

Inspired by the consumer goods industry. Consumer confidence continued to be hit by a combination of stagnating wages, recessionary pressuresUnilever Sustainable Living Plan, we also saw our brands with the most distinct and widespread politicalwell-articulated social and economic uncertainty. While the economic system is working for some, the benefits are still not widely felt, and inequality is rising in most countries. That’s not good for the consumer goods industry. Climate change is also becoming an increasing risk factor for most sectors, makingenvironmental purpose grow significantly faster than our own mitigating actions even more important.other brands.

At the same time, our industry experienced unprecedented levels of disruptionThe performance last year driven by the accelerating pacedemonstrates I believe that our strategy is working. By empowering our three global Divisions, we are allowing for more strategic allocation of technology. When combined with significant changesresource and for greater differentiation in meeting changing consumer behaviour, these events are causing manufacturersneeds. Beauty & Personal Care, for example, made good progress in moving to more premium positions and retailers alike to rethink fundamentally how they reach, serve and – ultimately – delight consumers in markets that are more dynamic and open to entry than ever before.

THE IMPORTANCE OF CONSISTENT PERFORMANCE

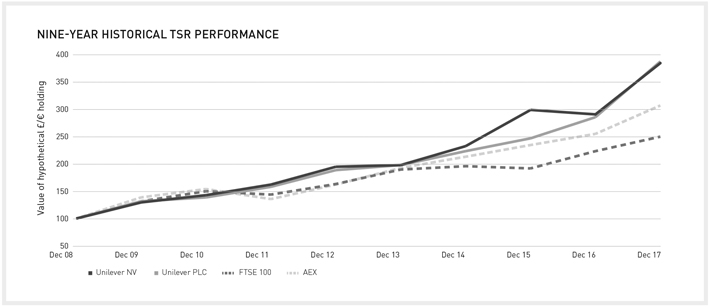
Delivering consistent, market-beating performance in such volatile and fast-changing markets is increasingly challenging. Not many companies achieve it. In fact, a McKinsey & Co study found that over a thirty-year period only 40% of nonfinancial companies thenexpanding in the S&P 500 survived. “It’s grow or go” they concluded and “60% have gone” (‘Why it’s a world of grow or go’. McKinsey & Co). By contrast, those companies that can deliver consistent performance in a responsible way get rewarded.

Judged against these criteria, it is not difficult to see why Unilever finds itself one of the best performing companies in our sector,high growth segments. Home Care built on its already strong emerging market footprint with a total shareholder return overstrategy of market development andbenefit-led innovation for emerging needs. Whilst Foods & Refreshment was combined into a single division bringing more scale and focus to allow faster transformation of our portfolio.

The results in 2018re-affirm the last nine yearsenduring strength of closeUnilever’s brands and the growing resilience of our organisational model, as well as underlining Unilever’s ability to 300%. In that time the Group has also delivereddeliver consistent top and bottom line progress. This goesperformance even in very challenging conditions. Nevertheless, we are determined to step up the proportion of our business that is winning market share as part of moving our sales growth more consistently into the middle of our multi-year3-5% targeted range.

A YEAR OF PROGRESS

As well as delivering a solid set of results, we also made good progress in 2018 in strengthening the overall business to be ready for future opportunities:

By empowering those closest to the heart ofmarketplace, and by linking our responsible long-term compounding growth model - based on continuously high levels ofre-investment - which has served Unilever well for many years. Indeed, it is worth noting that one pound invested in Unilever inglobal brand teams across the FTSE in 1986 would have generated a return four times higher than the market average.

A GOOD YEAR

2017 saw a continuation of this trend. Underlying sales excluding spreads, which we have agreed to sell, grew 3.5% (3.1% including spreads), representing a good performance in largely subdued markets. Growth was broad-based – across all our categories – and of good quality, supported by high levels of brand and marketing investment.

There was excellent progress on absolute profitability and on underlying operating margin – by 110 basis points – helped by strong delivery against the key savings and efficiency programmes behindworld, our Connected for Growth (C4G) change programme, which started inorganisational model is helping to increase speed and agility, as well as giving rise to a greater entrepreneurial spirit inside the company. As an illustration of this, time to market with new innovations to meet local trends is now40%-50% faster compared to 2016. We also launched 19 new brands, including Love Home and Planet, a range of plant-based, home-cleaning products and aTwo-thirdsfollow-up to our successful launch of the more than2 billion of savings generated in 2017 werere-invested behind growing our brands innatural and sustainable hair and skincare product range, Love Beauty and Planet.

In line with our long-term model. The increasestrategy, we continued to move the portfolio in underlying operating profit also contributed to a record free cash flow delivery at5.4 billion, an improvement of0.6 billion.

By any measure, this represents a good,all-round performance, as well as further evidencethe direction of the transformation of Unilever to a sustainable growth company. In this environment, we continue to believe that a long-term focus on multiple stakeholders, behind a purpose-driven sustainable business model, is the best guarantee of future success.

LOOKING AHEAD WITH CONFIDENCE

Although the global economy is showing signs of improvement, we can expect 2018 to be another challenging year, with further rapid and wide-ranging disruption to our markets. In addressing these challenges, we are benefiting, I believe, from having started early in anticipating – and responding to – manyfaster-growing segments of the trends and developments we currently seere-shaping our markets.

By anticipating, for example, themarket, especially those that speak to consumers’ growing desire of consumers for more natural products and authentic productspurpose-driven brands. The vast majority of businesses we have acquired over recent years are now growing by double digits on a yearly basis and we were delighted at the end of last year to announce the acquisition of GlaxoSmithKline’s Health Food Drinks portfolio, including its iconic Horlicks brand in India and the rest of Asia, further increasing our presence in the highly attractive health-food category. We also completed successfully the complex disposal of the spreads business, returning theafter-tax proceeds to shareholders.

The way people shop and access brands is changing rapidly and we made good progress in 2018 in positioning ourselves effectively in

new and faster-growing channels. Oure-commerce sales were up by 47%, ahead of globale-commerce market growth and putting us well on the road to building a scalee-commerce business. We also accelerated the growth of our business with Discounters, in the Health and Beauty channel and in theout-of-home eating market.

The digital transformation of the company also continues apace. We are working successfully with leading global technology companies to build world-class technology and data analytics infrastructure. Through the sophisticated and responsible leveraging of our data insights, we are close to reaching our goal of being able to connect directly with a billion of our consumers. In our operations, we have already automated over 700 processes – saving time and reducing cost – and for brands that serve a deeper purpose –ourin-house training programmes are increasingly focussed on the relevance and impactdigitalup-skilling of our own people.

Our attractiveness as an employer of choice grew still further in 2018. Unilever Sustainable Living Plan, introducedis now the number one FMCG graduate employer of choice in 2010, has increased steadily. Last year we reported

that the growth of our sustainable living brands was outstripping other brandsalmost 50 countries. That is a remarkable achievement, and accounted for 60% oftestament to Unilever’s growth.

The leadership role Unilever has played more widely in pioneering responsible business models was also further acknowledged last year. Indeed, for the seventh consecutive year Unilever topped the GlobeScan/SustainAbility ranking of 1,000 sustainability experts around the world – the longest-running and most extensive survey of its kind. The study identified integrating sustainability into the heart of the business, demonstrating executive leadership, strong performance in supply chain management,values and commitment to be a force for good in the world.

Strengthened by these measures, we are good in shape for the future. We ended 2018 with 58% of our turnover in the emerging markets and enjoying number 1 or 2 positions in 85% of the key markets and categories in which we compete. Our Beauty & Personal Care business – where some of the biggest growth opportunities exist – now represents 40% of our turnover. All of this makes us well placed to capture the many opportunities that exist across our markets.

LOOKING AHEAD

Building on these strong foundations, I have already made clear that my first priority as CEO will be to accelerate quality growth. For us, that means aninvestment-led approach based on delivering our 4G growth model – consistent growth, competitive growth, profitable growth and responsible growth, with an equal focus on each.

In particular, I want to leave no doubt that I intend to build further on Unilever’scentury-old commitment to responsible business. ‘Making Sustainable Development Goals (SDGs),Living Commonplace’ will remain our purpose as among key reasons behinda company and we will use this to keep Unilever at the Group’s leadership, concludingforefront of ensuring business is a force for good. More and more of our brands will become explicit about the positive social and environmental impact they have. This is entirely aligned to the instincts of our people and to the expectations of our consumers. It is not about putting purpose ahead of profits, it is purpose that “Unilever continues to be seen asdrives profits.

Despite the global leader on sustainability”.

We areprogress we have made in recent years, I am also benefiting from the company-wide implementation of Connected for Growth. By streamlining the Group and by empowering our front-line operators, C4G is providing the combination of resilience and agilityclear that today’s trading environment demands. We are already seeing the benefits, with employees reporting– in a significant improvement inworld where the speed of decision-makingchange is relentless – we need to quicken the pace of everything we do still further. I want to make speed and skills for a greater ‘biasdigital age a hallmark of Unilever under my leadership.

If we can do all this then I am confident we can achieve our strategic aims and deliver many years of solid cash flow, further underlying operating margin improvement and good quality growth.

AND FINALLY…

I want to thank my colleagues throughout the whole company for action’.their hard work in delivering these results. Unilever is fortunate to have such talented and dedicated people and I am deeply aware of my responsibilities to them – and to our many other stakeholders – in being asked to lead this wonderful company.

A key measure of C4G’s longer term success will be our abilityI especially want toroll-out bigger and more impactful innovations even quicker, both globally and locally. Again, there is evidence of improved performance. The number of local launches was substantially up in 2017. Our key emphasis, however, remains on our core, global brands and on developing strategic, global launches based on larger projects with more consumer benefits. We already see some great examples of this, including in 2017 with thank my predecessor, Paul Polman. Unilever has been transformed under his inspiring leadership. He has worked tirelessly to make the launch of Magnum Pints, providing the ultimateice-cream and chocolate experience in a tub; theroll-out of Baby Dove to a further 19 countries; the relaunch of the Hellmann’s brand with strengthened naturalness claims in 28 markets, as well as theroll-out of Hellmann’s organic variants in both Europe and North America;company stronger and the continuedroll-outworld a better place. It has been a privilege to serve with him and an honour now to succeed him.

I also want to thank the Unilever Board of Directors for their confidence and invaluable guidance as I take on the incredibly successful Domestos toilet blocks, now in 33 countries, helpingrole. And, finally, to drive double-digit growthour shareholders, thank you for the brand. It is a further measure of the strength of our brands that more of them appearyour ongoing support and belief in the annual Kantar Global Ranking of Most Chosen Consumer Brands than those of our competitors.

In the spirit of the C4G changes, we also announced last year the bringing together of our Foods and Refreshment categories into a single division, based in Rotterdam. The work for this was completed in 2017. We believe the new Foods & Refreshment division can become an even stronger global powerhouse, benefiting from the scale and efficiencies that the integration will bring.

We have also moved decisively in recent years to reshape our portfolio in anticipation of changing consumer trends and to help maximise new and burgeoning growth opportunities. Over the last three years, we have made – or announced – 22 acquisitions. Twelve of these came last year alone as we accelerated our portfolio transformation further, making 2017 one of the most active acquisition periods in the company’s history.

These new businesses strengthen our portfolio in a variety of ways. Some give us access to fast-growing segments of markets incompany, which we are already active but currently under-represented, such as Carver Korea, which will enable us to leverage the growing demand for Korean skin care products. Others will enable us to expand in complementary, adjacent categories, such as colour cosmetics (Hourglass) and air purification (Blue Air). Some give us greater regional scale in existing categories, as is the case with the acquisition of the Quala home and personal care business in Latin America and EAC in Myanmar. And others bring skills and capabilities in new, rapidly emerging segments, including subscription anddirect-to-consumer models (e.g. Dollar Shave Club and our Prestige beauty businesses).

Having announced earlier in the year the intention to divest our spreads business, 2017 also ended with the announcement of the sale of the business to KKR for a little over6.8 billion.

This combination of an increasingly relevant Unilever Sustainable Living Plan, a C4G change model that supports the kind of speed, agility and organisational resilience needed to compete in today’s markets; and a sharper portfolio better weighted to higher growth categories and geographies, gives us the confidence that we can go on delivering consistent, market-beating performance.

4Strategic ReportAnnual Report on Form 20-F 2017


We are also particularly well placed, I believe, to capture the opportunities of the digital revolution - and the unprecedented explosion in data – which are transforming our markets and our ways of operating. Again, we started early. Our digital marketing capabilities, for example, have frequently been recognised as among the best in the industry and the online sales of our brands increased by a further 80% last year, making it a1.7 billion business for us. However, this area is moving fast. The amount of data in the world is more than doubling every two years. Our ambition is to build a billionone-to-one consumer relationships, leveraging ourin-house People Data Centres and the opportunity they give us to connect with consumers in a meaningful way through real-time analytics. We need to continue driving this critical agenda, which is why we are investing heavily in digital, experimenting with a range of new,direct-to-consumer business models and embarking on an enterprise wide digital transformation programme.

THE POWER OF OUR PEOPLE

Ultimately, Unilever’s success will come down to its ability to attract and retain the most talented individuals and to motivate and inspire them with a mission and a purpose that speaks to the long-term aims and values of the company.

Here, again, we start from a strong base. A remarkable 90% of employees’ express pride in working for Unilever, well above the industry average. And last year the number of countries in which Unilever was named ‘most desired employer’ rose to 44 of the 52

markets in which we recruit - a more than 25% increase on the year before and a remarkable testament to the attractiveness of our employer proposition and our purpose-driven model.

At the heart of our people agenda is a focus on creating a balanced and inclusive workforce. This focus not only underpins Unilever’s longstanding values – especially tolerance and respect - but also guarantees the diversity of thought and ideas on which our business depends. We made further strides again in 2017, not least in the area of gender balance, with the proportion of female managers rising to 47% of our total management population.

DELIVERING FOR ALL OUR STAKEHOLDERS

In conclusion, let me thank all of the wonderful people of Unilever – and the many more we partner with around the world – who worked soalways work hard to make 2017 such a strong and positive year for the Group. It was a year in which our long-term compounding growth model was questioned by some, but was ultimately shown to be a model that unequivocally delivers in the interests of Unilever and its multiple stakeholders, including shareholders.retain.

PAUL POLMANALAN JOPE

CHIEF EXECUTIVE OFFICER


4Strategic ReportAnnual Report on Form 20-F 2018


UNILEVER LEADERSHIP EXECUTIVE (ULE) OVERVIEW

FOR PAUL POLMANALAN JOPE AND GRAEME PITKETHLY SEE PAGE 3


DAVID BLANCHARD

Chief R&D Officer


MARC ENGEL

Chief Supply Chain Officer


HANNEKE FABER

President, Europe


ALAN JOPEKEES KRUYTHOFF

President, PersonalHome Care


NationalityBritishAge53,54, Male

Appointed to ULEJanuary 2013 (will retire in April 2019)

Joined Unilever1986

Previous Unilever posts include:

Unilever Research & Development (SVP); Unilever Canada Inc. (Chairman); Foods America (SVP Marketing Operations); Global Dressings (VP R&D); Margarine and Spreads (Director of Product Development).

Current external appointments:

Ingleby Farms and Forests (NED).


NationalityDutchAge51,52, Male

Appointed to ULEJanuary 2016

Joined Unilever1990

Previous Unilever posts include:

Unilever East Africa and Emerging Markets (EVP); Chief Procurement Officer; Supply Chain, Spreads, Dressings and Olive Oil Europe (VP); Ice Cream Brazil (Managing Director); Ice Cream Brazil (VP); Corporate Strategy Group; Birds Eye Wall’s, Unilever UK (Operations Manager).

Current external appointments:

PostNL (Supervisory Board member).


NationalityDutchAge48,49, FemaleAppointed to ULEJanuary 2018

Joined Unilever2018

Previous posts include:

Royal Ahold Delhaize (CEIO & EC),;

Royal Ahold (CCO),; P&G (VP & GM).

Current external appointments:

Bayer AG (Supervisory Board member), Leading Executives Advancing Diversity (LEAD) (advisory board member).


NationalityBritishAge53, Male

Appointed to ULENovember 2011

Joined Unilever1985

Previous Unilever posts include:

Unilever Russia, Africa and Middle East (President); Unilever North Asia (President); SCC and Dressings (Global Category Leader); Home and Personal Care North America (President).

KEES KRUYTHOFF

President, Home Care

LEENA NAIR

Chief Human Resources Officer

NITIN PARANJPE

President, Foods and Refreshment

RITVA SOTAMAA

Chief Legal Officer and Group Secretary

NationalityDutchAge49,50, Male

Appointed to ULENovember 2011

Joined Unilever1993

Previous Unilever posts include:President, North America and Global Head of Customer Development; Brazil (EVP); Unilever Foods South Africa (CEO); Unilever Bestfoods Asia (SVP and Board member).

Current external appointments:

Pepsi/Lipton JV (Board member);appointments: Enactus (Chairman).


LEENA NAIR

Chief Human Resources Officer

NITIN PARANJPE

President, Foods and
Refreshment

RITVA SOTAMAA

Chief Legal Officer and Group Secretary

AMANDA SOURRY

President, North America & Global Head of Customer Development

NationalityIndianAge48,49, Female

Appointed to ULEMarch 2016

Joined Unilever1992

Previous Unilever posts include:HR Leadership and Organisational Development and Global Head of Diversity (SVP); Hindustan Unilever Limited (Executive Director HR); Hindustan Lever (various roles).


NationalityIndianAge54,55, Male

Appointed to ULEOctober 2013

Joined Unilever1987

Previous Unilever posts includeinclude:: President Home Care; EVP South Asia and Hindustan Unilever Limited (CEO); Home and Personal Care, India (Executive Director); Home Care (VP); Fabric Wash (Category Head); Laundry and Household Cleaning, Asia (Regional Brand Director).


NationalityFinnishAge54,55, Female

Appointed to ULEFebruary 2013

Joined Unilever2013

Previous posts include:Siemens AG – Siemens Healthcare (GC); General Electric Company – GE Healthcare (various positions including GE Healthcare Systems (GC)); Instrumentarium Corporation (GC).

Current external appointments:

Fiskars Corporation (NED).


AMANDA SOURRY

President, North America & Global Head of Customer Development

KEITH WEED

Chief Marketing & Communications Officer

NationalityBritishAge54,55, Female

Appointed to ULEOctober 2015

Joined Unilever1985

Previous Unilever posts include:

President Foods; Global Hair (EVP); Unilever UK and Ireland (EVP and Chairman); Global Spreads and Dressings (EVP); Unilever US Foods (SVP).

Current external appointments:PVH Corporation. (NED).

PVH Corp. (NED).


KEITH WEED

Chief Marketing & Communications Officer

NationalityBritishAge56,57, Male

Appointed to ULEApril 2010 (will retire in May 2019).

Joined Unilever1983

Previous Unilever posts include:

Global Home Care and Hygiene (EVP); Lever Fabergé (Chairman); Hair and Oral Care (SVP).

Current external appointments:

Business in the Community International Board (Chairman); Business in the Community (Board member); Effie (Board member); Historical Advertising Trust (President); Advertising Association (President); Grange Park Opera (Trustee).


Annual Report on Form 20-F 20172018 Strategic Report 5


OUR PERFORMANCE


FINANCIAL PERFORMANCE


GROWING THE BUSINESS  2017   2016   2015 
GROUP               

TURNOVER GROWTH


Turnover growth averaged 1.0% over five years

   1.9%    (1.0%)    10.0% 

UNDERLYING SALES GROWTH*


Underlying sales growth averaged 3.6% over five years

   3.1%^    3.7%    4.1% 

UNDERLYING VOLUME GROWTH*


Underlying volume growth averaged 1.5% over five years

   0.8%    0.9%    2.1% 

OPERATING MARGIN


Operating margin averaged 15.4% over five years

   16.5%    14.8%    14.1% 

UNDERLYING OPERATING MARGIN*


Underlying operating margin has steadily increased over five years from 15.1% to 17.5%

   17.5%    16.4%    15.6% 

FREE CASH FLOW*


Unilever has generated free cash flow of22.0 billion over five years

   5.4 billion    4.8 billion    4.8 billion 
CATEGORIES               


PERSONAL CARE


Turnover

   20.7 billion    20.2 billion    20.1 billion 
   

Turnover growth

   2.6%    0.5%    13.2% 
   

Underlying sales growth

   2.9%^    4.2%    4.1% 
   

Operating margin

   19.8%    18.4%    18.1% 
   

Underlying operating margin

   21.1%    20.0%    19.7% 


HOME CARE


Turnover

   10.6 billion    10.0 billion    10.2 billion 
   

Turnover growth

   5.6%    (1.5%)    10.9% 
   

Underlying sales growth

   4.4 %^    4.9%    5.9 % 
   

Operating margin

   10.8%    9.5%    7.3% 
   

Underlying operating margin

   12.2%    10.9%    8.4% 


FOODS


Turnover

   12.5 billion    12.5 billion    12.9 billion 
   

Turnover growth

   (0.1%)    (3.1%)    4.5% 
   

Underlying sales growth

   1.0%^    2.1%    1.5% 
   

Operating margin

   18.2%    17.4%    17.8% 
   

Underlying operating margin

   19.7%    19.1%    19.1% 


REFRESHMENT


Turnover

   9.9 billion    10.0 billion   10.1 billion 
   

Turnover growth

   (0.8%)    (1.1%)    10.3% 
   

Underlying sales growth

   4.9%^    3.5%    5.4 % 
   

Operating margin

   13.5%    9.7%    8.3% 
   

Underlying operating margin

   12.7%    11.1%    10.2% 

*Key Financial Indicators.

^Wherever referenced in this document, 2017 underlying sales growth does not include Q4 price growth in Venezuela. See pages 22 to 23 onnon-GAAP measures for more details.

Underlying sales growth, underlying volume growth, underlying operating margin and free cash flow arenon-GAAP measures. In order to provide a clear picture of our performance against the objectives set out in our strategic review we report underlying operating margin, which excludes restructuring costs, in place of the previously reported core operating margin. For further information about these measures, and the reasons why we believe they are important for an understanding of the performance of the business, please refer to our commentary onnon-GAAP measures on page 22.

6Strategic ReportAnnual Report on Form 20-F 2017


UNILEVER SUSTAINABLE LIVING PLAN

    2017  2016  2015 
IMPROVING HEALTH & WELL-BEING     
BIG GOAL: By 2020 we will help more than a billion people take action to improve their health and well-being. See page 13     

HEALTH & HYGIENE

      
Target: By 2020 we will help more than a billion people to improve their health and hygiene. This will help reduce the incidence of life-threatening diseases like diarrhoea.   601 million   538 millionf   482 millionr 

NUTRITION

      
Target: By 2020 we will double the proportion of our portfolio that meets the highest nutritional standards, based on globally recognised dietary guidelines. This will help hundreds of millions of people to achieve a healthier diet.   39%   35%   34%r 
REDUCING ENVIRONMENTAL IMPACT      
BIG GOAL: By 2030 our goal is to halve the environmental footprint of the making and use of our products as we grow our business. See pages 13 and 14 

GREENHOUSE GASES


Target: Halve the greenhouse gas impact of our products across the lifecycle by 2030

(greenhouse gas impact per consumer use).

   9%   8%   7%q 
Target: By 2020 CO2emissions from energy from our factories will be at or below 2008 levels despite significantly higher volumes (reduction in CO2from energy per tonne of production since 2008).**+   (47%)   (43%)f   (39%)r 

WATER


Target: Halve the water associated with the consumer use of our products by 2020

(water impact per consumer use).

   (2%)   (7%)   (1%)r 
Target: By 2020 water abstraction by our global factory network will be at or below 2008 levels despite significantly higher volumes (reduction in water abstraction per tonne of production since 2008).**   (39%)   (37%)f   (37%)r 

WASTE


Target: Halve the waste associated with the disposal of our products by 2020

(waste impact per consumer use).

   (29%)   (28%)f   (26%)q 
Target: By 2020 total waste sent for disposal will be at or below 2008 levels despite significantly higher volumes (reduction in total waste per tonne of production since 2008).**   (98%)   (96%)f   (97%)r 

SUSTAINABLE SOURCING


Target: By 2020 we will source 100% of our agricultural raw materials sustainably

(% of tonnes purchased).

   56%   51%   60%^ 
ENHANCING LIVELIHOODS      
BIG GOAL: By 2020 we will enhance the livelihoods of millions of people as we grow our business. See page 14 

FAIRNESS IN THE WORKPLACE


Target: By 2020 we will advance human rights across our operations and extended supply chain, by:


•  Sourcing 100% of procurement spend from suppliers meeting the mandatory requirements of the Responsible Sourcing Policy (% of spend of suppliers meeting the Policy)

   55%   -   - 

•  Reducing workplace injuries and accidents (Total Recordable Frequency Rate of workplace accidents per million hours worked)**

   0.89   1.01f   1.12r 

OPPORTUNITIES FOR WOMEN

      
Target: By 2020 we will empower 5 million women, by:   1,259,000LOGO    920,000   806,000 

•  Promoting safety for women in communities where we operate

   7,000   7,000   6,000 

•  Enhancing access to training and skills (number of women)

   1,175,000   836,000   730,000 

•  Expanding opportunities in our value chain (number of women)

   77,000   77,000   70,000 

•  Building a gender-balance organisation with a focus on management (% of managers that are women)**

   47%   46%   45% 

INCLUSIVE BUSINESS

      
Target: By 2020 we will have a positive impact on the lives of 5.5 million people by:      

•  Enabling small-scale retailers to access initiatives aiming to improve their income
(number of small-scale retailers)

   1.6 millionLOGO    1.5 million   1.8 million 

•  Enabling smallholder farmers to access initiatives aiming to improve their agricultural practices

   716,000LOGO    650,000   600,000 

Baseline 2010 unless otherwise stated

**KeyNon-Financial Indicators.
PricewaterhouseCoopers (PwC) assured in 2017. For details and 2017 basis of preparation see www.unilever.com/ara2017/downloads
fPwC assured in 2016. For details and 2016 basis of preparation seewww.unilever.com/sustainable-living/our-approach-to-reporting/reports-and-publications-archive
rPwC assured in 2015. For details and 2015 basis of preparation seewww.unilever.com/sustainable-living/our-approach-to-reporting/reports-and-publications-archive
qGreenhouse Gases was assured as a 6% increase in 2015 by PwC. This was restated to 7% in 2016 as we revised our 2010 baseline with updated product data. Waste was assured as a 29% reduction in 2015 by PwC. This was restated to 26% in 2016 as we revised our 2010 baseline with updated recycling data.
During the year we have amended how we assess compliance with the Responsible Sourcing Policy, hence prior year numbers are not comparable. See page 14 for further details.
LOGOAround 370,000 women have accessed initiatives under both the Inclusive Business and the Opportunities for Women pillars in 2017.
( )In the table above, brackets around numbers indicate a negative trend which, for environmental metrics, represents a reduction in impact
+Target approved by the Science Based Targets Initiative
^See page 13 for more information

Annual Report on Form 20-F 2017Strategic Report7


A CHANGING WORLD

UNILEVER OPERATES IN THE FAST-MOVING CONSUMER GOODS (FMCG) INDUSTRY, ONE OF THE LARGEST AND MOST COMPETITIVE INDUSTRIES IN THE WORLD.

The top 25 global FMCG players generate sales of over500 billion in markets characterised by their highly dynamic nature. Rapid change is now a constant, caused by fragmentation throughout the value chain, requiring fast, innovative and profitable responses in areas such as supply chain, customer development, marketing and brand innovation.

In response we have taken a number of strategic actions including the sale of our Spreads business, the integration of our Foods and Refreshment categories, the announcement or completion of 12 acquisitions in faster growing segments and channels, and the acceleration of our Connected 4 Growth (C4G) change programme. Launched in 2016 to create a faster, simpler organisation, we are realising C4G’s benefits through digitally connectedend-to-end marketing, R&D and supply chain, and a more agile organisation leveraging our global scale and local expertise.

FASTER PACE OF CHANGE

There is no doubt that the business environment is changing at a faster pace than ever. These changes bring challenges but also significant opportunity. We see changes in a number of areas, notably in consumer preferences,route-to-market channels, media and brand communication and the competitive landscape.

Consumers are taking radically different paths when purchasing brands, often combining both offline and online channels where influencers are a growing force. Younger consumers are prioritising meaning over materialism, demanding brands with a point of view and more authenticity, transparency and sustainability. More people moving into the global workforce, especially in emerging markets, is resulting in long-term shifts in demand for products with greater convenience and time-saving attributes, notably in Foods and Home Care, but without sacrificing quality or sustainability benefits. The trend of growing middle classes continues, albeit challenged by incomes rising only slowly in some emerging markets and inequality increasing globally.

Channels to reach consumers are also fragmenting, with less reliance on ‘big box’ retailers ase-commerce continues to grow, driven in part bydirect-to-consumer models. The global FMCGe-commerce channel continues to grow by 30% a year according to the latest industry reports. Specialist channels, such as drug stores, continue to grow in significance as do discount and convenience stores.

The proliferation of diverse digital and social media channels has led to significant media fragmentation. Digital advertising is playing an increasingly important role in brand advertising – now around 40% of the total advertising market. However, tackling viewability standards and fraud in digital advertising through verification of views – and demonstrating the value of digital advertising spend – are ongoing challenges for the industry.

Responses to change are predicated on the need for efficiency and margin improvement as competition intensifies. Some global players are adopting models prioritising cost-cutting over long-term investment.

Local players present a growing challenge. They react swiftly with innovations meeting local trends, one reason why responses, such as Unilever’s C4G programme, are critical in marrying the benefits of global scale, in areas such as marketing and R&D, with entrepreneurial country teams empowered to lead launches that meet local trends.

A MIXED ECONOMIC OUTLOOK

This pace of change comes as market conditions across many of our markets remain challenging. There are, however, grounds for optimism as local currencies are stabilising and real wages are making a recovery. We are starting to see signs of improvement in some of the large emerging markets such as India and China but others, notably Brazil, are suffering economic problems with consumers spending less. This requires further rapid, local responses from brands.

In Europe, the industry is seeing high promotion levels keeping prices down. Volumes are slowly picking up in certain markets. Consumers, while remaining cost conscious, are also seeking occasions to buy more premium and prestige products in return for economising on some of their routine household shopping. In North America, although GDP performance is positive, this has not translated into significant growth in our markets.

LONGER-TERM MACRO FORCES

Our markets are also shaped by systemic macro forces which impact at a different pace. We periodically review these trends to ensure our strategy and plans are fit for the future. Based on our latest macro forces analysis, we believe there are four distinct but overlapping trends that will shape the world over the next ten years: the multipolar world, the environment under stress, digital and technology revolution and people living differently (see pages 10 to 18 for our response).

Slow global growth is accentuating the financial and political polarisation within countries. Nationalist and protectionist tendencies are rising, threatening the progress of globalisation and free trade in recent decades.

Strains on the natural environment are intensifying with the impacts of climate change and water scarcity increasingly visible. Momentum is gathering globally to tackle climate change following the Paris Agreement, which came into force in 2016, aiming to limit temperature rise this century to below 2 degrees Celsius abovepre-industrial levels. Concerns about the planet and society are matched by concerns about our own health. Obesity kills more people than hunger, while many populations struggle to find sufficient nourishment in their diets, presenting opportunities to meet these growing consumer needs.

Companies continue with the rapid development of new technologies. These include artificial intelligence, robotics, voice technology and virtual reality to engage with consumers in new ways. Data, and the Internet of Things, are disrupting traditional business models using technologies such as blockchain and increasingly sophisticated smart devices. Digitisation also comes with risk, at an individual, government and company level, over data privacy and security as well as brand safety.

Consumers are now living in communities that are becoming more diverse with fragmented identities. Younger generations, especially Millennials and Generation Z, are having a powerful influence on cultural norms such as diversity and gender. Older generations will exert a strong economic influence with the number of people aged 80 and over expected to triple by 2050. Migration is having a profound effect on national identity. Today, one in 30 people are international migrants living abroad, a 40% rise since 2000. People are encouraged to move, in part, by the rise of global megacities of ten million-plus inhabitants. These will rise from 31 to 41 by 2030. Such urbanisation is expected to create an additional 500 millionone-person households between 2016 and 2030.

8Strategic ReportAnnual Report on Form 20-F 2017


OUR VALUE CREATION MODEL

UNILEVER HAS A PROVEN BUSINESS MODEL THAT SUPPORTS LONG-TERM, COMPOUNDING GROWTH AND SUSTAINABLE VALUE CREATION.

Our business activities span a complex, global value chain. Starting with consumer insights, we track changing consumer sentiment through our 25 People Data Centres around the world. Through close collaboration between marketing and R&D, we use our insights to inform product development, leveraging our900 million annual R&D spend.

We work with thousands of suppliers and spend around34 billion on goods and services, including approximately13 billion on ingredients and raw materials for our products. Our global manufacturing operations across more than 300 factories in 69 countries turn these materials into products.

Our products are then distributed via a network of more than 400 globally coordinated warehouses to 25 million retail stores, from large supermarkets, hypermarkets, wholesalers and cash and carry, to small convenience stores, as well as other fast-growing channels such ase-commerce,out-of-home anddirect-to-consumer. We work in close partnership with customers to ensure our brands are always available and properly displayed.

We are the second largest advertiser in the world, based on media spend. Alongside more conventional advertising, we create an increasing amount of tailored content ourselves to market our brands, using digital channels that are better targeted, more personalised and provide more accurate consumer insights. And in doing so, our value chain cycle repeats itself.

Underlying our value chain is a set of defining strengths which set us apart from our competitors: our portfolio of global brands and local jewels; a presence in more than 190 countries with 58% of our turnover in emerging markets; deep distribution capability through

ever more complex channels and a talent pool of local management – 70% of our leaders are local.

Our strategy (see page 10) and our category strategies (see pages 11 and 12) harness these strengths to deliver competitive top and bottom line growth, and capital efficiency which in turn drives underlying earnings per share, free cash flow and return on invested capital – and ultimately attractive returns for shareholders. To respond further to the increasing pace of change and the need to go further and faster in value creation, we are accelerating our C4G programme of organisational change to create a faster, simpler organisation. For more on C4G see page 10.

Combined with C4G, in April 2017, we set out financial targets to further accelerate shareholder value. These include underlying sales growth ahead of our markets, which in current market conditions we expect to translate into underlying sales growth of3-5% each year up to 2020, projected savings of6 billion by 2019 and an expansion of underlying operating margin from 16.4% to 20% by 2020. Return on Invested Capital is expected to be sustained in the high teens and dividends will continue to rise, reflecting increased confidence in the outlook for profit growth and cash generation.

Sustainable value creation also means investing for the long term, which is why the Unilever Sustainable Living Plan (USLP) is at the heart of our business model and Vision to grow our business, whilst decoupling our environmental footprint from our growth and increasing our positive social impact, in turn contributing to the United Nations Sustainable Development Goals (see page 15).

Our strategy and business model continue to deliver growth that is consistent, competitive, profitable and responsible. Between 2009 and 2017 it has delivered underlying sales growth of 4.3% a year while operating margin expanded by 390 basis points to 16.5%. In 2017 free cash flow increased to over5 billion while return on invested capital was 19.2%. Longer term, Unilever has grown dividends by an average of 8% per year over the last 37 years, with no reductions.

LOGO

Annual Report on Form 20-F 2017Strategic Report9


OUR STRATEGY

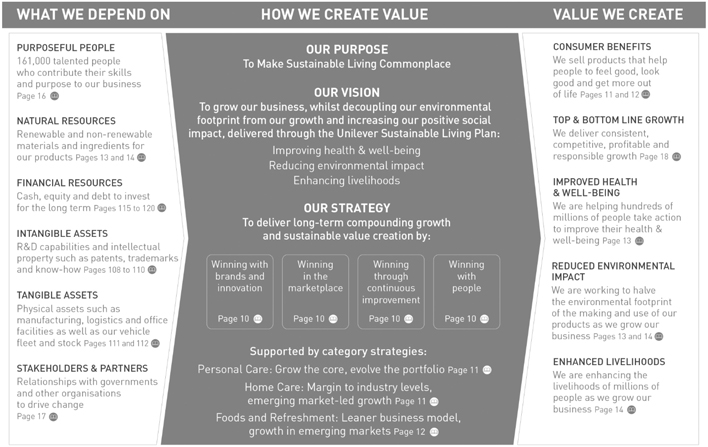
GROWING THE CORE, EVOLVING THE PORTFOLIO AND DEVELOPING CHANNELS ARE AT THE HEART OF OUR STRATEGY TO DELIVER LONG-TERM, COMPOUNDING GROWTH AND SUSTAINABLE VALUE CREATION.

Our strategy helps us deliver top and bottom line growth in a fast-changing world. It is underpinned by Connected 4 Growth (C4G), a significant organisational change programme which aims to create a faster, simpler organisation while creating a culture of empowerment, collaboration and experimentation. We expect the benefits of C4G to be realised progressively during 2018 and 2019.

WINNING WITH BRANDS AND INNOVATION

Consumer preferences are changing and they are taking radically different paths when purchasing brands. We must therefore innovate faster to respond to these changes. While the level of innovation will vary by category, depending on market requirements and brand strategies we use 70:20:10 as a general percentage guideline. The ‘70’ innovation projects are global roll-outs, such as Baby Dove which was launched in 19 markets in 2017. Local innovations marketed through global brands make up the ‘20’ part of our portfolio, such as the launch of Comfort Sakura in Japan. The ‘10’ are hyper-local launches such as the Sunsilk Yuya range in Mexico which respond directly to local requirements.

To enable this, C4G has created more than 200 Country Category Business Teams (CCBTs) which are multifunctional entrepreneurial units which break down silos by combining marketing, R&D, customer development and supply chain expertise. They have ownership of their own profit and loss account and are empowered to take decisions for their local requirements. Through CCBTs, we are aiming for more relevant innovations, which are rolled out faster. We are already seeing an improvement in time to market across our portfolio. At the same time, we are seeing more rapid local innovations to meet local trends. CCBTs are supported by 45 Brand Communities, which ensure global collaboration and best practice sharing.

Consumers increasingly seek brands that are authentic and which they can trust. Our Sustainable Living brands are a key differentiator in this regard. In 2016, 18 of our top 40 brands were Sustainable Living brands which combine a powerful purpose with products contributing to the Unilever Sustainable Living Plan. See page 13 for more.

Related principal risks (see pages 28 to 30):Brand preference, Economic and political instability, Portfolio management, Safe and high-quality products, Sustainability, Climate Change

WINNING THROUGH CONTINUOUS IMPROVEMENT

C4G plays a significant role in driving competitive growth, but it is also responsible for margin expansion to deliver profitable growth. Through sharper financial discipline governing overhead spending, and ourzero-based budgeting approach, we are reducing costs as well as uncovering new and innovative ways of working.

In the supply chain, we have rolled out the 5S: smart programme across all categories. 5S drives cost savings, but it is more than a conventional cost saving exercise. It examines the business for improvements more broadly across the entire value chain, driving savings through smart buying, smart sourcing and smart product portfolio, all of which leverage our Partner to Win programme. 5S also drives revenue and margin through smart mix and smart pricing which we deliver through our Net Revenue Management programme. In Home Care alone, the 5S programme has delivered material savings of450 million in 2017.

Customer development is using virtual reality tools to test ahead of new launches, savings costs and cutting project times compared to traditional methods using physical storemock-ups.

In marketing, we are creating more of our own content in house while making existing assets go further. Our 17U-Studios in 12 countries are creating content for brand teams faster and around 30% cheaper than external agencies. In addition, we are using our global and agency networks in order to access efficient production solutions and locations. We continue to applyzero-based budgeting to improve efficiencies in areas such as brand and marketing investment.

Related principal risks (see pages 28 to 29):Supply chain, Sustainability, Climate Change

WINNING IN THE MARKETPLACE

We reach 2.5 billion consumers every day through 25 million retail stores. We are constantly evolving our portfolio through our C4G approach to reach consumers in all income brackets. This stretches from our prestige range in Personal Care, built from carefully selected acquisitions such as Carver Korea and Hourglass, down to Domex, a new toilet detergent innovation in powder format launched in just seven months for the lowest income groups in India. But we also reach wide into new geographies, with brands expanding to meet future pockets of growth such as Pure Leaf tea in North America and Sunlight dishwash in Central & Eastern Europe.

Data is key to informing innovation, gathered from publicly available information, but also from our 25 People Data Centres around the world. These identify trends and insights from social listening and engaging with consumers with ideas for new launches and formats. Alongside innovation, customer development is a key driver of growth. Our Category Channel Development Leaders sit on our CCBTs and work closely with our marketing professionals so products are available when and where consumers want them, in the format they prefer, utilising Net Revenue Management, supported by compelling and relevant communications.

E-commerce remains a key and growing channel. Our online business is now close to delivering 4% of Unilever turnover. We have more than 800 people dedicated to building our business through numerous online channels such as Amazon, Taobao in China, online grocery websites, as well asdirect-to-consumer models deployed by Dollar Shave Club, T2 and a number of our prestige brands.

Related principal risks (see pages 28 to 30):Customer relationships, Economic and political instability, Portfolio management, Sustainability, Climate change

WINNING WITH PEOPLE

At the heart of C4G is a founder’s mindset that will power long-term value creation. It involves more collaboration, more experimentation through test and learn, embracing failure to gain insight and an obsession with customers and consumers. An owner’s mindset empowers our people to take responsibility for delivering business results. Through our CCBTs and Brand Communities, they take innovations from global teams and land them in markets. But they are also empowered, and provided with the resources, to develop local innovations with speed.

C4G gives our people licence to take responsibility for resources, driving efficiency improvements throughzero-based budgeting and reinvesting the proceeds in higher growth areas. With a more entrepreneurial culture we are also changing the way our people are rewarded, with more long-term share-based incentive schemes that reward both business performance and progress on our Unilever Sustainable Living Plan (USLP) targets (see page 7).

To ensure we develop the right capabilities and skills needed for these different ways of working and new entrepreneurial leadership qualities, we are investing in continuous,‘always-on’ learning programmes that are available when people need them in the most relevant format.

Attracting and retaining the best talent is vital to value creation and our Purpose of Making Sustainable Living Commonplace is a clear differentiator, with 72% of employees believing sustainability drives growth in the business. In 2017, Unilever was the number one FMCG graduate recruiter in 44 countries.

Related principal risks (see pages 28 to 30):Talent, Business transformation, Sustainability

10Strategic ReportAnnual Report on Form 20-F 2017


DELIVERING LONG-TERM VALUE FOR OUR STAKEHOLDERS

OUR CONSUMERS

Meeting the needs of consumers is at the heart of our value creation model and strategy. We reach them through our four categories.

PERSONAL CARE

OUR PERSONAL CARE CATEGORY GENERATED TURNOVER OF20.7 BILLION, ACCOUNTING FOR 39% OF UNILEVER’S TURNOVER AND 46% OF OPERATING PROFIT.

The category is our largest and includes five brands with turnover of1 billion or above, Axe, Dove, Lux, Rexona and Sunsilk and other household names such as TRESemmé, Signal, Lifebuoy and Vaseline. Personal Care has leading global positions in hair, skin cleansing and deodorants, and strong local positions in skin care and oral care. Its prestige range leads in premiumising our brand portfolio with turnover of425 million from brands such as Dermalogica.

Personal Care’s strategy is to deliver competitive growth in its core, while evolving the overall portfolio in response to market trends. It has four markets generating turnover of more than1 billion: US, India, Brazil and Indonesia, highlighting its emerging market strengths which generated12.5 billion of turnover. Underlying sales growth in the category during 2017 was 2.9%, a slowdown from 2016, while operating margin rose 140 basis points to 19.8%.

Growing the core and evolving areas such as naturals, prestige and baby was a key focus of innovation and investment in 2017. The Simple sensitive skin care range was rolled out to new markets, while several brands such as Dove and Sunsilk launched natural extensions. In India, Lever Ayush, a brand formulated using ayurvedic ingredients was launched and offers a range of skin, hair and oral care products. Hijab Fresh, a hand and body lotion specifically developed for Muslim consumers, was launched in Indonesia. Other launches included KJU Perfumed by Lux in China, capitalising on the appeal of Korean beauty, and Signal’s White Now Correction range in Europe. North America launched two brands: the millennial-focused hair care and skin cleansing brand, Love Beauty & Planet and ApotheCARE Essentials, a range of apothecary-inspired haircare products.

The business faced pressure in two of its largest markets, Brazil and Indonesia, due to difficult economic conditions which affected volumes. North America saw growth increase in hair care and skin cleansing while in Europe, consumers remain cost conscious and the retail environment challenging.

Several acquisitions were completed in line with the category’s strategy. Carver Korea was bought to strengthen our footprint in skin care in China, Japan and South Korea. Hourglass, a luxury colour cosmetics brand, Schmidt’s Naturals deodorant brand and Sundial Brands, a US hair care and skin care company serving multicultural and millennial consumers were acquired in 2017. An agreement was also announced in 2017 to acquire the home care and personal care business of Quala S.A., adding hair and male grooming brands in north Latin America.

The category has several Sustainable Living brands such as Axe, Dove, Rexona, Lifebuoy and Smile (Signal and Pepsodent) which are central to the ambitions of the USLP. Dove, Lifebuoy and Signal have programmes to achieve Unilever’s goal of improving health and well-being for more than one billion people by 2020. Dove launched the Real Beauty Pledge in 2017 which promises that Dove will: always feature real women, never models, in campaigns; will portray women as they are in real life and will help girls build body confidence and self-esteem to realise their potential. Axe’s positioning, which embraces the individuality of real, modern men, supported Unilever’s work on Unstereotype.

The media landscape continues to fragment, requiring efficiencies in producing marketing content and more efficient use of existing assets. This approach helped Personal Care meet savings targets fromzero-based budgeting, expanding margins. Low volume growth and short-term volatility are risks but Personal Care is well-positioned to

respond to local competition, and remains a highly attractive growth and margin opportunity in an ever more connected world where its emerging market footprint is a major asset.

GROWING THE BUSINESS  2018  2017  2016 
GROUP             

TURNOVER GROWTH


Turnover growth averaged 0.6% over five years

   (5.1%  1.9%   (1.0%

UNDERLYING SALES GROWTH*


Underlying sales growth averaged 3.3% over five years

   2.9%  3.1%  3.7% 

UNDERLYING VOLUME GROWTH*


Underlying volume growth averaged 1.3% over five years

   1.9%   0.8%   0.9% 

OPERATING MARGIN


Operating margin averaged 17.3% over five years

   24.6%   16.5%   14.8% 

UNDERLYING OPERATING MARGIN*


Underlying operating margin has steadily increased over five years from 15.5% to 18.4%

   18.4%   17.5%   16.4% 

FREE CASH FLOW*


Unilever has generated free cash flow of23.0 billion over five years

   5.0 billion   5.4 billion   4.8 billion 
DIVISIONS             

BEAUTY & PERSONAL CARE


Turnover

   20.6 billion   20.7 billion   20.2 billion 

Turnover growth

   (0.3%  2.6%   0.5% 

Underlying sales growth

   3.1%  2.9%  4.2% 

Operating margin

   20.0%   19.8%   18.4% 

Underlying operating margin

   21.9%   21.1%   20.0% 


FOODS & REFRESHMENT


Turnover

   20.2 billion   22.4 billion   22.5 billion 

Turnover growth

   (9.9%  (0.4%  (2.2%

Underlying sales growth

   2.0%  2.7%  2.7% 

Operating margin

   35.8%   16.1%   14.0% 

Underlying operating margin

   17.5%   16.7%   15.6% 


HOME CARE

OUR HOME CARE CATEGORY GENERATED TURNOVER OFTurnover

10.1 billion10.6 BILLION, ACCOUNTING FOR 20% OF UNILEVER’S TURNOVER AND 13% OF OPERATING PROFIT.

Home Care includes two global brands with turnover ofbillion

10.0 billion or more, namely Dirt is Good (Omo and Persil) and Surf. Other leading brands include Comfort, Domestos, Sunlight, Cif, Pureit, the water purification brand and Blueair, the air purification business.

Turnover growth

(4.2%5.6%(1.5%

Home Care’s strategic role is to grow profitability and it made good progress during 2017, generatingUnderlying sales growth

4.2%4.4%4.9%

Operating margin

11.5%10.8%9.5%

Underlying operating margin

13.0%12.2%10.9%

*

Key Financial Indicators.

^

Wherever referenced in this document, 2018 underlying sales growth of 4.4% and increasing operating margin by 130 basis points to 10.8%. Its emerging markets footprint, accounting for 80% of turnover, and its leading brands delivered leadership positions in seven of its top ten markets. This resilience came against a slowdown in several key markets, combined with commodity inflation and currency fluctuations. However, premiumisation, portfolio evolution and expansion in new geographies all contributed to strongdoes not include price growth in South Asia, AfricaVenezuela for the whole of 2018 and in Argentina from July 2018. 2017 underlying sales growth does not include Q4 price growth in Venezuela. See pages 23 and 24 onnon-GAAP measures for more details.

The Group has revised its operating segments to align with the new structure under which the business is managed. Beginning 2018, operating segment information is provided based on three product areas: Beauty & Personal Care, Foods & Refreshment and Home Care.

Underlying sales growth, underlying volume growth, underlying operating margin and free cash flow arenon-GAAP measures. For further information about these measures, and the reasons why we believe they are important for an understanding of the performance of the business, please refer to our commentary onnon-GAAP measures on page 23.

6Strategic ReportAnnual Report on Form 20-F 2018


UNILEVER SUSTAINABLE LIVING PLAN

       TARGET      2018  2017  2016 
IMPROVING HEALTH & WELL-BEING     
BIG GOAL: By 2020 we will help more than a billion people take action to improve their health and well-being. See page 13.


HEALTH & HYGIENE

       
Target: By 2020 we will help more than a billion people to improve their health and hygiene. This will help reduce the incidence of life-threatening diseases like diarrhoea.  1 billion  653 million  601 million  538 millionf

NUTRITION

       
Target: By 2020 we will double (ie up to 60%) the proportion of our portfolio that meets the highest nutritional standards, based on globally recognised dietary guidelines. This will help hundreds of millions of people to achieve a healthier diet.  60%   48%   39%¥   35% 
REDUCING ENVIRONMENTAL IMPACT      
BIG GOAL: By 2030 our goal is to halve the environmental footprint of the making and use of our products as we grow our business. See pages 13 to 14.


GREENHOUSE GASES

       
Target: Halve the greenhouse gas impact of our products across the lifecycle (from the sourcing of the raw materials to the greenhouse gas emissions linked to people using our products) by 2030 (greenhouse gas impact per consumer use).+  (50%  6%q   9%¥   8% 
Target: By 2020 CO2 emissions from energy from our factories will be at or below 2008 levels despite significantly higher volumes (reduction in CO2 from energy per tonne of production since 2008).**  £145.92   70.46    76.77¥   83.52f 

WATER

       
Target: Halve the water associated with the consumer use of our products by 2020 (water impact per consumer use).  (50%  (2%)q   (2%)¥   (7%
Target: By 2020 water abstraction by our global factory network will be at or below 2008 levels despite significantly higher volumes (reduction in water abstraction per tonne of production since 2008).**  £2.97    1.67    1.80¥   1.85f 

WASTE

       
Target: Halve the waste associated with the disposal of our products by 2020 (waste impact per consumer use).  (50%   (31%)q   (29%  (28%)f 
Target: By 2020 total waste sent for disposal will be at or below 2008 levels despite significantly higher volumes (reduction in total waste per tonne of production since 2008).**  £7.91    0.20    0.18¥   0.35f 

SUSTAINABLE SOURCING

       
Target: By 2020 we will source 100% of our agricultural raw materials sustainably (% of tonnes purchased).  100%   56%   56%   51% 
ENHANCING LIVELIHOODS      
BIG GOAL: By 2020 we will enhance the livelihoods of millions of people as we grow our business. See page 14.


FAIRNESS IN THE WORKPLACE

       
Target: By 2020 we will advance human rights across our operations and extended supply chain, by:                

•  Sourcing 100% of procurement spend from suppliers meeting the mandatory requirements of the Responsible Sourcing Policy (% of spend of suppliers meeting the Policy).

  100%    61%     55%¥     

•  Reducing workplace injuries and accidents (Total Recordable Frequency Rate of workplace accidents per million hours worked)**.

       0.69    0.89¥   1.01f 

OPPORTUNITIES FOR WOMEN

       
Target: By 2020 we will empower 5 million women, by:                

•  Promoting safety for women in communities where we operate.


•  Enhancing access to training and skills (number of women).

  million    1.85 millionLOGO     1.26 million¥   0.92 million 

•  Expanding opportunities in our value chain (number of women).


•  Building a gender-balanced organisation with a focus on management (% of managers that are women)**.

  50%    49%    47%¥   46% 

INCLUSIVE BUSINESS

       
Target: By 2020 we will have a positive impact on the lives of 5.5 million people by:                

•  Enabling small-scale retailers to access initiatives aiming to improve their income (number of small-scale retailers).

  million   1.73 millionLOGO   1.60 million   1.53 million 

•  Enabling smallholder farmers to access initiatives aiming to improve their agricultural practices.

  0.5 million   0.75 millionLOGO   0.72 million¥   0.65 million 

Baseline 2010 unless otherwise stated

**

KeyNon-Financial Indicators.

PricewaterhouseCoopers assured in 2018. For details and 2018 basis of preparation seewww.unilever.com/investor-relations/annual-report-and-accounts/

¥

PricewaterhouseCoopers assured in 2017. For details and 2017 basis of preparation seewww.unilever.com/sustainable-living/our-approach-to-reporting/reports-and-publications-archive

f

PricewaterhouseCoopers assured in 2016. For details and 2016 basis of preparation seewww.unilever.com/sustainable-living/our-approach-to-reporting/reports-and-publications-archive

During 2017 and 2018 we amended how we assessed compliance with the Responsible Sourcing Policy, henceyear-on-year data is not comparable.

LOGO

Around 490,000 women have accessed initiatives under both the Inclusive Business and the region of North Africa, Middle East, Turkey, Russia, UkraineOpportunities for Women pillars in 2018.

( )

In the table above, brackets around numbers indicate a negative trend which, for environmental metrics, represents a reduction in impact.

+

Target approved by the Science Based Targets Initiative.

q

The spreads business was sold inmid-2018 and Belarus.

In more challenging European, South East Asian and some Latin American markets, investment in core brands resulted in growth for Radiant in Brazil, Comfort in China and Sunlight in Indonesia. This was complemented by successful launches of Surf laundry detergents and Sunlight Dishwashing tablets in Central & Eastern Europe, combinedis excluded from the performance measure (including the baseline) to ensure alignment with the continued success of Domestos toilet blocks in Europe and liquid laundry detergents in South East Asia. Future growth markets have been strengthened by the announcement to purchase the home care and personal careexisting business of Quala S.A. in 2017 which will add brands in north Latin America, and Unilever’s joint venture to form EAC Unilever Myanmar Company Limited.structure.

Consistent with Unilever’s Connected 4 Growth programme, Home Care met changing consumer trends with local innovations launched at speed. The Italian Cif team identified the potential for nozzles to deliver either a spray or a foam and launched within seven months. Comfort Sakura, a millennial-inspired cherry blossom fragrance in Japan and China, was launched in five months.

Global innovations also accelerated. Capitalising
Annual Report on the increased penetration of dishwash machines, Sun dishwasher tablets with improved performance, were launched within 12 months. The category continued its innovation in laundry by launching Persil Powergems, a revolutionary format with a new concentrated formula which both lowers our greenhouse gas footprint and delivers high performance.Form 20-F 2018Strategic Report7


A CHANGING WORLD

UNILEVER OPERATES IN THE FAST-MOVING CONSUMER GOODS (FMCG) INDUSTRY, ONE OF THE WORLD’S LARGEST, MOST COMPETITIVE AND DYNAMIC.

MARKET OVERVIEW

The top 25 global FMCG players generate sales of over700 billion in markets characterised by their dynamic nature. A global, digital economy is fuelling rapid change characterised by fragmentation throughout the value chain. This requires fast, innovative, profitable global and local responses in areas such as supply chain, customer development, marketing and brand innovation.

In response, Unilever has reorganised into three Divisions: Beauty

& Personal Care, Foods & Refreshment and Home Care. Each has implemented our C4G change programme which was introduced in 2016 to create a simpler organisation capable of innovating more quickly to evolve our brand portfolios and meet changing trends more effectively – harnessing our global scale and local expertise. Acquisitions of new brands have further supplemented our core portfolios.

The use and threat of tariffs for political leverage continues to drive uncertainty in our markets. Currency volatility in Argentina, Turkey and Pakistan as well as major political disruption in markets such as Brazil, continues to demand rapid local responses from our brands.

Our business is shaped by systemic macro forces. We periodically review these to ensure our strategy remains relevant. We believe there are four distinct but overlapping macro trends that will shape the world over the next ten years.

DIGITAL AND TECHNOLOGY REVOLUTION

Business is evolving at a faster pace than ever. Traditional understanding and engagement with consumers is being redefined. Digital technology is transforming relationships with consumers – from connectivity and the Internet of Things, to robotics, artificial intelligence and augmented reality. All are linked by more targeted and data-driven marketing.

Fragmentation remains a principal driver of change, impacting consumer journeys,route-to-market channels and media, and brand spend. Consumers are taking different paths to purchase, often combining offline and online channels where influencers are a growing force. Younger consumers continue to prioritise meaning over materialism and are demanding more authenticity, transparency and natural ingredients. The talkability of brands is vital in a fragmented digital media landscape, favouring those with a strong point of view, or purpose, relevant to consumers. The growth of the global workforce and middle class consumers, especially in emerging markets, has resulted in long-term shifts favouring greater convenience and time-saving attributes.

Channels to reach consumers are equally fragmented. There is less reliance on ‘big box’ retailers withe-commerce growing 13% globally, driven bydirect-to-consumer models and platforms such as Amazon and Alibaba. The market is also polarising between specialist channels and discounters and convenience stores, creating both risks and opportunities for FMCG companies.

The proliferation of digital and social media channels has resulted in media fragmentation, with digital advertising now about 40% of the market. However, improving standards and tackling fraud to protect the integrity of digital marketing are major challenges.

POLARISED WORLD

Slow and uneven economic growth, rising inequality, political polarisation and the rise of nationalism within countries is impacting consumer confidence. At the same time, consumers continue to have low confidence in government, business, media and NGOs, according to the Edelman Trust Barometer. However, according to the same study, three out of four people agree a company can take action to both increase profits while improving economic and social conditions in the community it operates in.

ENVIRONMENT UNDER PRESSURE

According to a 2018 Intergovernmental Panel on Climate Change report, the world is on course for warming of 1.5 degrees Celsius by as early as 2030. Drought, floods, extreme heat and poverty for hundreds of millions are threatened if no action is taken to curb emissions. The cost of inaction will be profound, estimated to be about $44 trillion in lost GDP. But the rewards for positive action are substantial and thanks to the Paris Agreement, nearly 200 countries are pursuing carbon reforms. This is helping to open about $23 trillion in opportunities for climate-smart investments in 21 emerging markets alone by 2030.

Climate change also threatens our food system which must produce 50% more food to feed over 9 billion people by 2050. However, changing weather patterns and growing seasons threaten suitable cultivation areas around the world. Business can spur positive change and achieving food security could create 80 million jobs and business opportunities worth $2.3 trillion annually by 2030. Linked to climate change is water scarcity, a threat to 3.2 billion people. If current usage continues the world will have only 60% of its required water by 2030. See pages 30 and 33 to 35 for more on climate change risks.

Other environmental concerns are growing in significance, such as plastic packaging. The Ellen MacArthur Foundation found that 95% of the value of plastic packaging is lost to the economy after one short use, equivalent of$80-120 billion lost to the global economy each year. See pages 14 to 15 and 30 for more on plastic packaging risks and opportunities.

PEOPLE LIVING DIFFERENTLY

Concerns about the planet and society are matched by concerns about our own health and what we eat. Growing urbanisation is shaping new health priorities while the cost of care is also rising, placing health services under increased pressure. Obesity kills more people than hunger, while many populations struggle to find sufficient nourishment in their diets. Sugar is seen as a major threat which has resulted in a number of countries choosing to implement a tax on it. For food companies, this presents a mix of challenges and opportunities. Meanwhile, public awareness around mental health issues continues to grow, particularly with digital connectivity.

Consumers are now living in communities that are becoming more diverse with fragmented identities. Younger generations, especially Millennials and Generation Z, continue to have a powerful influence on cultural norms – on issues such as diversity and discrimination. Meanwhile, older generations are exerting a strong economic influence. The number of people aged 80 or over is expected to triple by 2050.

Migration is having a profound effect on national identity. One in 30 people are international migrants living abroad, a 40% rise since 2000. People are encouraged to move, in part, by the rise of global megacities with more than ten million inhabitants. The number of these will rise from 31 to 41 by 2030. Such urbanisation is expected to create an additional 500 millionone-person households between 2016 and 2030. Climate change looks set to increase migration even further as populations are displaced due to rising sea levels and changing climates.

The #MeToo movement has encapsulated a major shift in women’s rights. The global gender gap in primary school completion and enrolment in secondary school has closed, however barriers and opportunities remain, particularly on equal pay. According to the World Bank, gender equality would enrich the global economy by an estimated $160 trillion if women were earning as much as men in the workplace. Men themselves face changing roles. Time spent with children has almost quadrupled for men since 1965 and in some countries the burden of care is changing in response to improved paternity leave entitlements and shared parental leave. Changing demographics and societal expectations present significant risks and opportunities for FMCG companies.

Find out more about how we are responding to the trends outlined in this section in delivering value for our stakeholders (pages 11 to 18).

Home Care’s innovations responded quickly to consumers’ desires for hygiene, natural ingredients and products that care for sensitive skin. Seventh Generation, a US acquisition in 2016 and a pioneer of plant-based products, grew by double digits. Sensitive, a growing segment addressing skin sensitivity, saw the launch of Dirt is Good Sensitive (Persil, Omo) in 24 countries while Neutral, another 2016 acquisition, is now in 11 countries.

The category continued to help consumers improve their health and livelihoods notably through its Sustainable Living brands such as Cif, Dirt is Good, Domestos, Radiant and Surf. Domestos, with double digit growth in 2017, helped more than ten million people gain improved access to a toilet while the Domex brand in India launched alow-cost toilet cleaner for low income groups. SmartFoam, a new rinse-efficient, water-saving technology already available in South Africa under the Sunlight brand, was incorporated into the Rin (Radiant) detergent bar in India while Rin also grew its Career Ready Academy, a programme to help young people and women shine in their chosen career through language, presentation and entrepreneurial training.

Home Care’s priority in the year ahead is to remain agile and continue to reinvest savings from its 5S programme (see page 10), ensuring continued resilience to persistent competitive pressures and economic headwinds.
8Strategic ReportAnnual Report on Form 20-F 2018


OUR VALUE CREATION MODEL

UNILEVER HAS A PROVEN BUSINESS MODEL THAT SUPPORTS LONG-TERM, SUSTAINABLE VALUE CREATION.

Our business activities span a complex, global and cyclical value chain. The start of our value chain is consumer insight. We track changing consumer sentiment through our 27 People Data Centres around the world. Through close collaboration between marketing and R&D, we use our insights to inform product development, leveraging our900 million annual R&D spend. Our research aims to bring together the best thinking and ideas from wherever they exist – within Unilever and beyond, including universities and specialist companies.

We work with tens of thousands of suppliers and spend around34 billion on goods and services. Our supply chain sources the materials and ingredients that make up our products. Our global manufacturing operations across more than 300 factories in 69 countries turn these raw materials into products with a total volume of nearly 19 million tonnes.

Our products are then distributed via a network of around 400 globally coordinated distribution centres to 26 million retail stores, from large supermarkets, hypermarkets, wholesalers and cash and carry, to small convenience stores, as well as other fast-growing channels such ase-commerce,out-of-home anddirect-to-consumer.

We are the second largest advertiser in the world, based on media spend. We create an increasing amount of tailored content ourselves to market our brands, using digital channels.

Underpinning our value chain is a set of defining strengths which set us apart from our competitors: our portfolio of global,purpose-led brands and local jewels; a geographic presence in more than 190 countries with 58% of our turnover in emerging markets; deep distribution capability through ever more complex channels; and a talent pool of local leaders – over 80% of our business leaders are local to their markets.

Our strategy (see page 10) and our Divisional strategies (see pages 11 to 12) harness these strengths to deliver competitive top and

bottom-line growth, and capital efficiency which in turn drives underlying operating margin, free cash flow and return on invested capital – and ultimately attractive returns for shareholders.

To respond further to the increasing pace of change and accelerate value creation, we have embedded our C4G programme across all Divisions so we are a faster, simpler organisation. We are also rapidly embracing new digital technologies such as the Internet of Things, AI and robotics to get even closer to our value chain partners and consumers.

Our strategy and business model continue to deliver solid growth. From 2014 to 2018 we have delivered average underlying sales growth of 3.3% a year while underlying operating margin increased by an average 70 basis points per year to 18.4%. Longer term, Unilever has grown dividends by an average of 8% per year over the last 38 years, with no reductions.

We are on track to meet a number of targets to accelerate shareholder value since 2017. These include underlying sales growth ahead of our markets, which we expect to translate into underlying sales growth of3-5% each year up to 2020, projected cumulative savings of6 billion by 2019 and an expansion of underlying operating margin from 18.4% in 2018 to 20% by 2020. Return on Invested Capital is expected to be sustained in the high teens and dividends will continue to rise, reflecting confidence in the outlook for profit growth and cash generation.

Sustainable value creation also means creating value for the many stakeholders Unilever relies on. The Unilever Sustainable Living Plan (USLP) is at the heart of our multi-stakeholder business model and vision to grow our business, whilst decoupling our environmental footprint from our growth and increasing our positive social impact – in turn contributing to the United Nations Sustainable Development Goals (see page 15). The USLP helps us to deliver more growth through our brands with purpose, less risk by future proofing our supply chain, lower costs througheco-efficiency practices and more trust from the stakeholders who we rely on.


Annual Report on Form 20-F 2017Strategic Report11

LOGO

Annual Report on Form 20-F 2018Strategic Report9


DELIVERING LONG-TERM VALUE FOR OUR STAKEHOLDERSCONTINUED

OUR STRATEGY


GROWING THE CORE, EVOLVING THE PORTFOLIO AND DEVELOPING CHANNELS ARE AT THE HEART OF OUR STRATEGY.

Our strategy helps us deliver top and bottom line growth in a fast-changing world. It is underpinned by C4G which aims to create a faster, simpler organisation.

WINNING WITH BRANDS AND INNOVATION


Rapid innovation is critical to respond effectively to the fragmentation we are experiencing in consumer segments, routes to market and media channels. Innovation varies by Division based on market requirements and brand strategies but we split projects into three separate groups. Firstly, we have global roll-outs, such as the Sunsilk Natural Recharge launched in 5 markets in 2018. Secondly, we have local innovations marketed through global brands, such as our partnership with Kinder (owned by Ferrero) which was launched in several European countries following success in France. Finally, we have local brands with local innovation, such as Vim bars with mint extract launched in India.

Our faster response to consumer trends is due to different ways of working to meet the needs of local consumers and customers, and quick decision-making. Global marketing networks called Brand Communities work hand in hand with more than 230 Country Category Business Teams (CCBTs) that operate as multifunctional entrepreneurial units. This allows for more experimentation, responsiveness and scaling up of innovation across markets. We are already seeing an improvement in time to market across our portfolio as a result of a range of initiatives to speed up the innovation process. For example, time to market with new innovations to meet local trends is now40-50% faster compared to 2016.

Our portfolios are evolving to meet consumer demand for brands that take a stand on issues they care about. Unilever’s purpose and our Sustainable Living brands are key to driving purchase preference. Consumer trust in brands is also driven by their experiences of marketing. In 2018 we took a key role in the industry ensuring digital responsibility covering content, platforms and measurement while also campaigning to improve influencer marketing and combat fraud in the digital ecosystem.

Related principal risks (pages 29 to 32):Brand preference, Economic and political instability, Portfolio management, Safe and high-quality products, Sustainability, Climate change, Plastic packaging


FOODS AND REFRESHMENT


Foods and Refreshment combined into a single category on 1 January 2018. In this Annual Report and Accounts the categories will be reported separately because they were separate categories for the reporting period. They will be reported together from 2018 onwards. The new category is well-positioned to continue top and bottom line growth, improve operating margins and leverage its portfolio.

WINNING THROUGH CONTINUOUS IMPROVEMENT


FOODSC4G plays a significant role in driving growth, but is also responsible for margin expansion for profitable growth. Through sharper financial discipline governing overhead spending, and ourzero-based budgeting (ZBB) approach, we are reducing costs and uncovering innovative ways of working.

OUR FOODS CATEGORY GENERATED TURNOVER OF12.5 BILLION, ACCOUNTING FOR 23% OF UNILEVER’S TURNOVER AND 26% OF OPERATING PROFIT.

Our two global Foods brands with turnover ofWe are applying the 5S ‘smart’ programme across the Group which cuts costs and examines the business case for improvements more broadly driving savings through smart buying, smart sourcing and a smart product portfolio, as well as leveraging our supplier Partner to Win programme. 5S also drives revenue and margin through smart mix and smart pricing delivered through our Net Revenue Management programme. 5S is delivering over1 billion or above - Knorrof savings per year, with the aim to reinvesttwo-thirds of these savings.

Brand and Hellmann’s – account for almost two thirds ofMarketing Investment is focused on maximising return on spend. We are increasing spend in the category turnover (excluding Spreads). The rest of the turnover is generated by smaller brands including local jewelsareas driving growth, such as Bangodigital media andin-store, whilst reducing production and promotional spend. In 2018 we generated savings in Indonesia, MaizenaBMI of over500 million. We are creating more contentin-house while making existing assets go further. Our 16U-Studios in Latin America, Kissan13 countries create brand content faster and more efficiently than external agencies. Improvements to measurement and verification of digital audiences ensure we maximise value in digital advertising alongside improvements in the measurement of influencer follower data.

Related principal risks (pages 29 and 31):Brand preference, Supply chain

WINNING IN THE MARKETPLACE

Every day, 2.5 billion people use our products. We evolve our portfolio to reach consumers in all income brackets from our prestige range in Beauty & Personal Care, built from carefully selected acquisitions, to theroll-out of affordable products, such as Domex Toilet Cleaning Powder in India, and Robertsons in South Africa. In December 2017, we signed an agreement to disposefor low income consumers. We reach wide into new geographies, with brands expanding into new pockets of our global Spreads business. Completion is expectedmid-2018. More details on page 18.

Foods enjoyed a good year with continued consistent and profitable growth with underlying sales up 1.0% and operating margin increasing 80 basis points to 18.2%. Strong growth was delivered in emerging markets, which account for 46% of turnover with a compound annual growth rate of about 7% based on the last three years. The broad-based growth was particularly driven by Indonesia, Philippines, China, Mexico, Argentina, Nigeria, South Africa, India, Pakistan and Turkey. The performance was driven by core businesses such as cooking products, meal makers, and mayonnaise while benefiting from innovation and renovations and a focus on accessibility through our channels. Brazil had a challenging year because of recession, although there were signs of improving trends in the second half led by Hellmann’s portfolio relaunch and Knorr’s ‘Know Me Better’ campaign launch promoting itslaunching Ben & Jerry’sall-naturalMoo-phoria seasonings.

In developed markets conditions were more challenging, however progress was made on portfolio modernisation, where consumer demand continues to focus on greater naturalness and authenticity. Unilever has responded with new Knorr Sides launcheslow calorie ice cream in the US and natural, organic, vegetarianPremium Cif sprays in 15 European markets in 2018.

Data is key and ‘free from’ Knorr offerings in Europe. Hellmann’s launched itspurpose-led ‘On the Side of Food’ campaign along with a new visual identity. This global brand activity was supported by local jewels such as Unox, Conimex and Pot Noodle enteringon-trend segments including plant based, snacking and chilled.

Digital activation continues to be a strategic focus for Foods, with innovations and advertising campaigns based on a digital and mobile-first approach. Both Hellmann’s ‘On the Side of Food’ and Knorr’s ‘Know Me Better’ campaigns were designed to engage consumers in conversations on sustainable nutrition. Unilever Food Solutions, which directly supplies restaurant operators and distributors, had another year of impressive growth. It generated turnover of2.7 billion and is well placed to capitalise on risingout-of-home food consumption. It delivered broad based growth, including double digit underlying sales growth in China, its biggest market.

Our Sustainable Nutrition strategy, launched in 2016, is central to our strategic ambition to be recognised as a progressive foods company. It was spearheaded by Hellmann’s and Knorr, which are both Sustainable Living brands. Knorr continued to deliver sustainable sourcing and fortification programmes and maintained its commitment to raising animal welfare standards, while Hellmann’s made significant progress in shifting to sustainably sourced oils and cage-free eggs, with the latter delivered into the US three years ahead of the original commitment. Hellmann’s ketchup introduced a variant sweetened with honey and another made with red and green tomatoes, reducing food waste. Additionally, 39% of our Foods and Refreshment portfolio, based on sales volume, is compliant with Unilever’s highest nutritional standards, that are aligned with World Health Organization criteria. Our recently acquired businesses – Sir Kensington’s in the US and Mãe Terra in Brazil – are well aligned to our Sustainable Nutrition strategy.

Unilever’s Connected 4 Growth initiative means Foods is better placed to take advantage of local insights at increased speed. A third of Foods’ regional and local innovations reached the market in less than seven months. At the same time, the category’s strong global presence also provides critical scale, for example Hellmann’s relaunch was undertaken in more than 25 markets.

REFRESHMENT

OUR REFRESHMENT CATEGORY GENERATED TURNOVER OF9.9 BILLION, ACCOUNTING FOR 18% OF UNILEVER’S TURNOVER AND 15% OF OPERATING PROFIT.

Refreshment includes three brands with turnover of1 billion or above, Heartbrand (eg Wall’s), Magnum and Lipton, alongside household names including Brooke Bond and Ben & Jerry’s. Its premium positioned brands includes T2, Pure Leaf and Taj Mahal in tea, and Grom and Talenti in ice cream. Refreshment’s strategic role is to deliver growth and cash while generating margin improvement. Performance was strong,build one billionone-to-one consumer relationships through our People Data Centres which connect us with the highest growth in half a decade, driven by an acceleration of growth in tea and ice cream.

The category’s underlying sales growth increased 4.9% reflecting strengthened emerging market performance resulting from continued focus on core brands, portfolio evolution and addressing key consumer trends. These include premiumisation, health and wellness, andout-of-home consumption. Profitability grew with operating margins increasing 380 basis points to 13.5%. Margins were boosted byzero-based budgeting, C4G and future finance savings. Ice cream benefited from improved channel mix and its cash contribution has more than doubled over four years. Nearly all our markets had growth with China, India and Turkey delivering double-digit performances, while Europe enjoyed a fourth year of growth in ice cream. North America remained challenging in a competitive context, but strengthened as the year progressed.

In Ice Cream, performance was fuelled by premium andon-trend innovation. Magnum delivered double-digit growth, driven by Magnum Doubles and the launch into premium pints, sitting alongside our premium brands such as Talenti and Grom Gelato. Ben & Jerry’s expanded‘on-the-go’ with the launch of the Pint Slices format in the US, while the ‘Wich range continued growth in Europe. In the ‘free-from’ segment, Unilever continued its growth of the Ben & Jerry’snon-dairy range and expanded Swedish Glace into new markets.

Premiumisation of tea saw the acquisition of Pukka Herbs, the fastest growing organic tea brand, and Tazo in North America, responding to demand for speciality teas. These join Refreshment’s premium Tea portfolio of Sir Thomas Lipton, T2, which continues its roll out, and the Pure Leaf brand. Innovation in health and wellness included the launch of a range of Liptonbenefit-led teas, entering new premium segments.

Refreshment continued to build a stronger and more agile business. More than half of Refreshment innovation projects were regionally led. Breyers Delights, our response to the low calorie, high protein trend in North America reached the market in under six months. Turnover momentum came through developing channels.On-the-go continues strongly in markets with .com delivery service and platforms providing new access to consumers. Premium tea brands gave access to premium restaurants, hotels and department stores as well as partnerships with retailers.

The category has several Sustainable Living brands including Ben & Jerry’s, Breyers, Brooke Bond and Lipton. Markets featuring Brooke Bond’spurpose-led advertising, centred on finding common ground over tea, grew almost three times faster than others. Our ‘I am Wall’s’ programme continued to employ micro entrepreneurs across 25 countries while our purchase of climate-friendly ice cream freezer cabinets continued, increasing to around 2.6 million. Responsible nutrition was another strategic driver for Refreshment with 90% of our packaged ice cream by volume containing 250 calories or fewer per portion (calculated based on 87% of global ice cream sales volume).

12Strategic ReportAnnual Report on Form 20-F 2017


SOCIETY AND ENVIRONMENT

THE UNILEVER SUSTAINABLE LIVING PLAN IS OUR BLUEPRINT FOR SUSTAINABLE AND INCLUSIVE GROWTH.

We want our growth to reward shareholders but we want society to benefit too. Our 161,000 employees received5.4 billion in pay in 2017, and our retailers and distributors who sell our products in more than 190 countries generated income and employment. Our suppliers also benefited from the34 billion we spent on goods and services in 2017. The taxes we pay are another important contribution. Total taxes borne by Unilever in 2017 were3.9 billion, of which2.2 billion was corporation tax. Unilever fully complies with the tax laws in the countries where we operate. Where tax law is unclear, or has not kept pace with modern business practice, we interpret our obligationsconsumers in a responsible way guidedthrough real-time analytics. Our 27 People Data Centres identify trends from social listening alongside engaging with consumers on ideas for new launches. Our contact with consumers is governed by our Tax Principles.Code Policy on Personal Data & Privacy which sets out the steps we take to protect personal data.

Alongside innovation, customer development is key to growth, ensuring products are available when and where consumers want them, in the format they prefer, at the right price.E-commerce remains a crucial channel. Online is now around 5% of Unilever turnover. In Chinae-commerce accounts for over 20% of turnover. We are building our business through online channels such as Amazon, Taobao in China, online grocery websites, anddirect-to-consumer models deployed by Dollar Shave Club, T2 and our prestige brands.

Related principal risks (pages 29, 30 and 32):Customer relationships, Economic and political instability, Portfolio management, Sustainability, Climate change

WINNING WITH PEOPLE

With unprecedented change happening externally, we are taking action in a number of areas to ensure we are more agile, digitally focused and networked. Our website has further details.C4G programme is empowering our people with an owner’s mindset and gives them the licence to take greater responsibility. Through C4G we are already seeing higher levels of empowerment, collaboration, experimentation and increased speed in decision-making.

Our vision

To develop the capabilities, skills and leadership which support new ways of inclusiveworking, we are investing in continuous,‘always-on’ learning programmes. We are particularly focused on digital capabilities. To developpurpose-led and future-fit leaders, in 2018 we launched new Standards of Leadership. Developed in collaboration with thought leaders and groups of young and senior leaders, the new Standards recognise the need for leaders to embrace both the inner and outer aspects of leadership. The ‘outer game’ is what leaders need to do to succeed; the ‘inner game’ is about their inner purpose which guides their behaviours and actions.

Attracting and retaining talent is vital to support our growth which delivers value for multiple stakeholders, is encapsulated in theambitions. Purpose and our Unilever Sustainable Living Plan (USLP). The USLP represents a simple idea – that business should put itself at the service remain key talent attractors with 75% of society. By doing so it will generate consistent and profitable growth. The USLP has three big goals: improving the health and well-being of more than one billion people by 2020; halvingemployees in our environmental footprint by 2030; and enhancing livelihoods for millions by 2020. These goals, detailed below, are supported by a transformational change agenda. This combines our own actions and our partnership approach to external advocacy, with public policy goals, to create change on a systemic scale which2018 UniVoice survey believing their role contributes to the 17 United Nations Sustainable Development Goals (see page 15USLP and 70% believing they can fulfil their purpose at work. To reinforce this link and give more people a stake in the business we are developing our approach to reward by including more long-term share-based incentives for more). Our Sustainable Living Report is availablebusiness performance and progress on our website and contains extensive disclosure on our activities and actions across all USLP commitments.targets.

THE BUSINESS CASE

The USLP drives value for Unilever, generating more growth, lower costs, less risk and more trust in the business. Our Sustainable Living brands, which combine a powerful purpose with products contributing to the USLP, are a key differentiator in this regard. In 2016, 18 of our top 40 brands were Sustainable Living brands including Ben & Jerry’s, Dove and Signal. Our Sustainable Living brands grew 50% faster than our other brands, and accounted for 60% of total growth.

Business benefits are also delivered through product innovation which responds to environmental issues such as water scarcity and greenhouse gas emissions at the same time as helping consumers. For example, Sunlight’s breakthrough SmartFoam technology, delivering superior performance, less suds and half the amount of water needed, continues to grow in South Africa and expanded to more formats in India. It provides a critical benefit for water-stressed areas and contributes to our USLP target of halving the water associated with consumer use of our products by 2020.

The USLP delivers significant benefits to our business. For example, by using less energy we have avoided energy costs in our factories of over490 million since our baseline year of 2008; and by using fewer materials and producing less waste we have avoided costs of over260 million over the same period.

The USLP responds directly to a number of macro forces (see page 8) that are both risks and opportunities in our markets – such as a lack of access to water and sanitation, strains on the food system and the climate and the environment, and rising inequality. Sustainability is one of our principal risks. Another one of ourRelated principal risks is climate change (see pages 32(pages 29, 31 and 33) and mitigating its physical impacts is critical because we depend32):Talent, Business transformation, Sustainability

10Strategic ReportAnnual Report on raw materials sourced from countries that are particularly vulnerable to rising seas and temperatures and changing weather patterns. We have performed high-level assessmentsForm 20-F 2018


DELIVERING LONG-TERM VALUE FOR OUR STAKEHOLDERS

OUR CONSUMERS

Our three Divisions meet the constantly changing needs of consumers by harnessing our global scale and local expertise. Innovation is the fuel, creating great products that consumers love, from nutritionally balanced foods and refreshments, to affordable soaps that combat disease, luxurious shampoos and everyday household care products. Whatever the brand, wherever it is bought, we’re working to ensure that it plays a part in helping fulfil our purpose as a business – making sustainable living commonplace.

BEAUTY & PERSONAL CARE

BEAUTY & PERSONAL CARE (BPC) GENERATED TURNOVER OF20.6 BILLION, ACCOUNTING FOR 40% OF UNILEVER’S TURNOVER AND 33% OF OPERATING PROFIT IN 2018.

The Division is our largest and includes five global brands with turnover of1 billion or above, namely Axe, Dove, Lux, Rexona and Sunsilk, as well as other household names such as TRESemmé, Signal, Lifebuoy and Vaseline. BPC has leading global positions in hair care, skin cleansing and deodorants, and strong local positions in skin care and oral care. The prestige business leads in premiumising our portfolio with turnover of490 million from brands including Dermalogica and Hourglass.

BPC’s strategic ambition is to become the most valuable and admired BPC company, led by its purpose ‘Beauty that cares for people, society and our planet’. Its priorities are to continue to grow its core brands, build afuture-fit portfolio, lead in high-growth spaces and adopt a new model of marketing. The priorities reflect and respond to key trends shaping the Division. 2018 saw increasing fragmentation across route to market, retail channels and media, alongside growing data, analytic and automation capabilities. Together these trends are creating a more dynamic, complex and sophisticated landscape with greater segmentation, differentiation and personalisation.

BPC’s core brands are introducing new innovations and formats quickly and at scale, such as the new shower mousses from Axe, Dove and Radox as well as a growing range of products which respond to the trend for natural and wellbeing products. During 2018 we launched Vaseline Clinical Care and Dove Derma Series in the fast-growing therapeutics segment and Dove Facial Cleansing Series infused with 100% plant-derived botanical oils in Japan. Hair care has created and launched multiple naturals products, creating a business with over300 million in turnover in 2018.

Succeeding in the hyper-fragmented world demands greater consumer responsiveness and we are proud to have launched nine new brands over the past two years: ApotheCARE Essentials, Hijab Fresh,K-Bright,K-JU, Korea Glow, Love Beauty and Planet, Pure Derm, Purifi and Skinsei. Love Beauty and Planet has expanded from North America into four markets in Europe and is now active across several categories including skin cleansing, deodorants, skin care and hair care.

Our acquisitions play a key role in building the future-fit portfolio. In the last four years, BPC has acquired 13 companies including wellbeing focused Equilibra in 2018. AHC (Carver Korea), acquired in 2017, showed stronge-commerce performance and in 2018, we rolled it out to Taiwan, Hong Kong, Singapore, Malaysia and Russia. Schmidt’s Naturals, also acquired in 2017, has extended beyond deodorants into more categories. The acquisition of Quala S.A completed in February 2018. Within two months of acquisition, its Savile and Ego extensions had brought to market multiple new products in five categories. Strong progress has been made building a highly attractive prestige portfolio which is on track to becoming a1 billion business. Our most recent acquisition in prestige, Hourglass, is growing fast, expanding into new geographies and with a commitment to become entirely vegan by 2020.

Future growth will depend on accelerating the adoption of a new model of marketing focused on brands with purpose, generating great content, delivered via digital channels using advanced data and analytics. The model is creating many new consumer touchpoints. For instance, Axe collaborated with DJ Martin Garrix to launch his Burn Out video with over 40 million YouTube views to date, celebrating the brand’s message of individuality. In Latin America, Sunsilk partnered with an online influencer toco-create products for curly hair.

Ourpurpose-led brands are well positioned to meet growing concerns about the fragility of the planet and consumer preference for more

sustainable products. In October we joined calls from consumers, NGOs and politicians for a worldwide ban on animal testing of cosmetics and Dove, the Division’s biggest brand, achieved PETA accreditation as ‘cruelty free’. The PETA cruelty-free logo will start appearing on many packs in 2019 and more brands are set to follow. We are also developing new packaging solutions with less plastic, better plastic and no plastic. REN launched a sea kelp and magnesium body wash in a bottle made from 100% recycled plastic, with 20% from recovered ocean plastic. Simple launched biodegradable face wipes made from renewable plant fibres and sustainable wood pulp. More packaging innovations will be launched in 2019.

Overall, underlying sales growth was 3.1%, driven by skin care and skin cleansing, but partly offset by slower growth in deodorants and oral care due to market and competitive pressures. Profitability progressed with underlying operating margin improving 80 basis points to 21.9%. Geographically, a number of countries grew above the market including US, Canada and the UK while emerging markets such as Pakistan and Bangladesh also had high growth. Brazil underperformed as did Japan and parts of Western Europe, where markets were flat to declining. In our channels,e-commerce remains a key driver of growth alongside the Health & Beauty channel where we would like to see faster growth following a slow year, especially in North America.

Looking ahead, we will continue to build our future-fit portfolio while adopting the new model of marketing, to deliver strong growth, making an accretive contribution to Unilever’s top and bottom line.

FOODS & REFRESHMENT

FOODS & REFRESHMENT (F&R) GENERATED TURNOVER OF20.2 BILLION, ACCOUNTING FOR 40% OF UNILEVER’S TURNOVER AND 58% OF OPERATING PROFIT IN 2018.

The Division launched in January 2018 after the previous Foods and Refreshment Categories merged. The integration and relocation of the global teams to Rotterdam is complete. The disposal of the spreads business was also completed in July. F&R now includes the foods, ice cream and beverages categories, as well as Unilever Food Solutions, our dedicated foodservice business. F&R is home to five global brands with turnover of1 billion or above, namely Knorr, Hellmann’s, Magnum, Lipton and Heart brand (eg Wall’s) as well as other famous global brands including Brooke Bond and Ben & Jerry’s. It also includes local jewels such as Bango and Robertson’s plus recent B Corp acquisitions such as Pukka Herbs, Sir Kensington’s and Mãe Terra. F&R’s ambition is to accelerate growth while improving underlying operating margin. F&R’s purpose ‘Taste good, Feel good, Force for good’ underpins our strategic priorities which are to: transform the portfolio; organise for agility and lower costs; and transform capabilities.

Our efforts to transform the F&R portfolio are driven by consumer insights. For example, we are seeing stronger preference for healthier products with more natural and organic ingredients. F&R has launched a number of products addressing this trend, including Magnum and Hellmann’s vegan variants in Europe, meat-free Knorr launches in the Nordics and Ben & Jerry’snon-dairy alternatives. Knorr also expanded its organic and 100% natural ranges in Europe. In our beverages category, we continue to grow our ‘good for me tea’ ranges. Lipton’s range, which includes variants such as detox and stress-less, continued its globalroll-out with strong performance. Recently acquired brands such as Pukka Herbs are being rolled out at pace. However, given continuous acceleration of the external landscape, we have to step up portfolio transformation further and increase the speed of our response to trends.

Our market-focused organisation and agility supports our portfolio transformation and delivered several new brands in 2018 such as RED RED (UK), Culture Republick (US), and Jawara (Indonesia). We announced an agreement to acquire Horlicks and other consumer healthcare nutrition products in India and other Asian markets from GlaxoSmithKline (GSK), and also acquired the Vegetarian Butcher (Netherlands) and three ice cream brands – Adityaa (India), Betty (Romania) and Denny (Bulgaria). After success in the US, Breyers Delights was launched in Europe. In addition, we introduced innovative licensed ice cream brands including Kinder in Europe and Cornetto Oreo in India.

Annual Report on our business of 2°C and 4°C global warming scenarios which show that without action, both scenarios represent financial risks by 2030, mainly arising from higher costs. That said, in managing these financial risks our business model would not require material change. See pages 32 to 33.Form 20-F 2018Strategic Report11


DELIVERING LONG-TERM VALUE FOR OUR STAKEHOLDERSCONTINUED

Consumers’ shopping habits continue to change. We launched the IceCreamNow platform in partnership with restaurant delivery services, building a new home-delivery channel. We have also launched a globalfront-of-house programme to showcase our teas and condiments in restaurants, hotels and bars, and to capitalise on the growth of eating out andout-of-home consumption. These represent significant business opportunities.

The second F&R strategic priority is to organise for agility and lower costs. In 2018, our 5S and ZBB programmes stepped up fuelling our gross margin and marketing support. We will continue our savings programme to reduce structural costs, while providing funding for portfolio transformation and margin expansion. Our speed to market has improved by almost a third, reflecting how C4G is helping to unlock speed and agility. We are also piloting new ways of working across our teams.

Our final strategic priority is to transform our capabilities with a focus on R&D, lean innovation and precision marketing. The creation of ourstate-of-the art global Foods Innovation Centre in Wageningen (Netherlands) will further strengthen our innovation capability. It is scheduled to open in 2019. We are also enhancing our capabilities in digital-driven marketing through extra resourcing across key markets, upskilling our current teams and hiring digital savvy marketeers.

These strategic priorities are underpinned by the development of morepurpose-led brands. Knorr, Hellmann’s, Lipton, Brooke Bond and Ben & Jerry’s continued to grow, each fuelled by a unique purpose which is resonating with consumers. Brooke Bond for example continued its work tackling cultural taboos through its campaigns, addressingsame-sex relationships in Canada and divorce in the Gulf markets. Meanwhile, Hellmann’s launched a major focus on food waste with an activation in Brazil to inspire people to use Hellmann’s to transform leftovers into tasty meals. Action on plastic packaging is another priority for F&R. We have partnered with Ioniqa and Indorama Ventures to pioneer a technology which converts PET waste into virgin grade material for use in food packaging. In the UK, PG tips started to introduce 100% biodegradable plant-based pyramid bags. More innovations and new technologies are in the pipeline.

During 2018 F&R turnover declined 9.9% to20.2 billion, due to the sale of spreads and currency devaluation. Underlying sales growth was 2.0% while our underlying operating margin improved by 80 basis points to reach 17.5%. Europe returned good results in ice cream, underpinned by good weather and innovations such as Magnum pints and Kinder ice cream. However, developed markets overall remain difficult and are seeing slower volume growth due to increasing segmentation of consumer preferences, especially in foods, where our efforts on portfolio transformation were not enough to offset the headwinds. Traditional channels in Europe such as supermarkets and hypermarkets continue to discount, creating deflationary pressure. Latin America had a challenging year due to tough economic conditions, a truckers’ strike in Brazil and currency headwinds in Argentina which affected growth in these two markets. Excluding Latin America, emerging markets generally delivered a strong performance. Several key markets including India, China and Turkey saw double-digit growth reflecting the strong potential in emerging markets.

F&R will continue to drive growth and margin by focusing on its strategic priorities. Our portfolio transformation,step-up in capabilities and shift in culture are of paramount importance to meet these objectives.

HOME CARE

HOME CARE GENERATED TURNOVER OF10.1 BILLION, ACCOUNTING FOR 20% OF UNILEVER’S TURNOVER AND

9% OF OPERATING PROFIT IN 2018.

Home Care is home to two global brands with turnover of1 billion or above, namely Dirt is Good (eg Omo and Persil) and Surf. Other leading brands include Comfort, Domestos, Sunlight, Cif, Seventh Generation as well as our air and water purification brands Blueair, Pureit and Truliva/Qinyuan. 79.5% of our turnover is in developing and emerging countries. Home Care’s ambition is to deliver sustained underlying sales growth and step up underlying operating margin.

The rapid change of consumer habits, media, competitors and channels, as well as heightened environmental stress, has redefined Home Care’s

growth opportunities. The Division responded to these changes by creating four consumer-centric categories: Fabric solutions which focuses on ready to wear clothes (eg Omo, Surf, Radiant); Fabric sensations which focuses on fabrics, fashion and lifestyle (eg Comfort, Snuggle); Home & hygiene (eg Sunlight, Sun) which focuses on delivering care for a cleaner world; and life essentials which unites our air and water purification brands (eg Pureit, Truliva, Blueair). Home Care’s purpose ‘Making your home a better world. Making our world a better home’ underpins the Division’s strategic priorities: strengthening further the foundation of the business; making Home Care fit for the future; and investing in capabilities.

Home Care strengthened the foundations of the business by delivering superior products and benefits. We launched Cif Specialist sprays across 15 countries in Europe whilst continuing toroll-out our toilet blocks to 11 more markets. We expanded our product portfolio into high potential geographies, building on our most established brands such asOmo-branded floor cleaners in Brazil. Our Comfort Intense ultra-concentrated fabric conditioners are now in 20 markets and continue to enjoy strong growth.

Our brands made progress in embracing purpose to connect more meaningfully with consumers – in particular millennials. In India, Domex enrolled renowned movie stars in its ‘Pick up the brush’ campaign to help overcome the social stigma associated with cleaning toilets, a key barrier to improve sanitation. Seventh Generation, acquired in 2016, stepped up its advocacy for Climate Justice together with the Sierra Club to move cities to commit to 100% renewable energy. Home Care’s biggest brand, Omo/Persil, joined forces with National Geographic, IKEA and Lego to promote the developmental benefits of play in children.

The second pillar of our strategy is to future-proof our business to lead new trends. We intensified our efforts and increased our footprint in the fast-growing natural segment through the launch of Omo naturals in New Zealand, France and Brazil among others, theroll-out of Seventh Generation in more markets and the launch of Sunlight Naturals across South-East Asia and South Africa. Our brands such as Cif, Omo/Persil and Seventh Generation responded to growing concerns about plastic by including recycled plastic in their packaging. Home Care launched Day2, a dry wash spray that revives clothes between washes – saving time and water. Our ultra-concentrated laundry gems, a new format launched in the UK in 2017, performed below expectations. In South Africa we reacted quickly to the drought in Cape Town with Domestos Flush Less, a toilet spray that disinfects and eliminates odours without the need to flush. We increased our presence ine-commerce, crossing500 million of sales and continued to experiment with new business models such aspeer-to-peer laundry services.

The third strategic pillar is investing in our capabilities. This includes partnering to tap into the opportunities that data brings to make Home Care more efficient and better able to seize growth opportunities. In China, our water purification brand, Truliva, partnered with Alibaba to develop an online leasing market for water purifiers. We also joined forces with Ms Paris, the Chinese dress rental platform, that allows consumers to hire designer dresses and return without laundering. To support our R&D efforts, we have inaugurated the Materials Innovation Factory at the University of Liverpool, a world-class centre of excellence in advanced material chemistry and an ecosystem that brings together innovation partners and leading academics to develop more sustainable and superior formula and packaging for our brands.

Home Care delivered underlying sales growth of 4.2% while our underlying operating margin improved by 80 basis points to reach 13.0%. Key drivers of growth were North and South Asia with South East Asia, Middle-East, Turkey and the US also performing strongly. By contrast, our performance in Latin America was challenged by a trucker’s strike and extreme inflationary pressures. Our home & hygiene and fabric sensations categories delivered strong, broad-based profitable growth whereas life essentials performed below expectations largely driven by a significant decline in category growth in air purification in China and intense competitive pressures. Margin expansion in fabric solutions was hampered by inflationary headwinds and competitive pressures on pricing.

Home Care will continue to drive growth and margin by shifting our portfolio and footprint towards the higher growth, more profitable market segments, formats, channels and geographies while continuing to address with agility changing consumer preferences.

Trust is essential for any business, but it must be earned. The USLP is a key driver of trust among our employees and potential recruits. We

are number one FMCG graduate employer of choice in 44 countries where we recruit. We have been ranked first in the annual Globescan survey of sustainability leaders for seven years.

IMPROVING HEALTH & WELL-BEING

Our activities impact the health and well-being of millions of people – throughbrand-led health and hygiene, and nutrition interventions. Significant progress has been made against our first USLP goal of helping more than one billion people improve their health and well-being by 2020. By the end of 2017, we had reached 601 million people, making a significant contribution to the Sustainable Development Goal
12Strategic ReportAnnual Report on Form 20-F 2018


SOCIETY AND ENVIRONMENT

OUR MULTI-STAKEHOLDER MODEL AIMS TO REWARD OUR SHAREHOLDERS WHILE POSITIVELY IMPACTING SOCIETY.

Our impact on society starts with our 155,000 employees who received5.3 billion in pay in 2018, and extends across our value chain including the millions of retailers and distributors who sell our products in more than 190 countries, generating income and employment for many more. Our suppliers also benefit from the34 billion we spent on goods and services in 2018. The taxes we pay are another important contribution to society. Total tax borne by Unilever in 2018 was3.7 billion, of which2.3 billion was corporation tax. Unilever fully complies with the tax laws in the countries where we operate. Where tax law is unclear, or has not kept pace with modern business practice, we interpret our obligations in a responsible way, guided by our Tax Principles.

UNILEVER SUSTAINABLE LIVING PLAN

Our impact on society is significant but we want our impact to go beyond business as usual, delivering value for multiple stakeholders at the same time as growing our business. This idea is encapsulated in the Unilever Sustainable Living Plan (USLP) which represents a simple idea – that business growth and sustainability are not mutually exclusive. By focusing on sustainable growth, we believe we will generate consistent and profitable long-term shareholder returns. The USLP has three big goals: improving the health and well-being of more than one billion people by 2020; halving our environmental footprint by 2030; and enhancing livelihoods for millions by 2020. These goals are supported by over 50 time-bound stretching targets and a transformational change agenda which aims to create change on a systemic scale. We are making good progress overall against our targets although some remain a challenge to achieve by the end of 2020. Our Sustainable Living Report includes extensive disclosure on progress against our USLP targets including challenges we have faced, some of which are summarised in this section of the Annual Report & Accounts.

Our actions on sustainability are creating value in numerous ways, generating more growth, lower costs, less risk and more trust in the business. Our Sustainable Living brands, which combine a powerful purpose with products contributing to the USLP, are a key driver of growth. In 2017, 26 of our top 40 brands were Sustainable Living brands including Ben & Jerry’s, Dove and Lifebuoy. Our Sustainable Living brands grew 46% faster than our other brands and accounted for 70% of total growth. Product innovations which respond to water scarcity and climate change at the same time as helping consumers, continue to create growth opportunities for us. Recent sustainability innovations which deliver consumer benefits include our new Love Beauty and Planet range in the US which uses fast-rinse technology in its conditioners thereby requiring less water. Domestos Flush Less, available in water-scarce South Africa, keeps toilets clean while saving nine litres of water per flush.

The USLP strengthens our business by helping us to save costs. Since our baseline year of 2008 we have saved over600 million on energy costs in our factories; and by using fewer materials and producing less waste we have avoided costs of approximately234 million.

Through the USLP, we are also responding directly to a number of macro forces (see page 8) that are both risks and opportunities in our markets – such as a lack of access to water and sanitation, strains on the food system, climate, the environment, and rising inequality. We have identified the broad issue of sustainability, related to the achievement of our goals in the USLP, as a principal risk (page 29) as well as a number of specific risks including climate change (page 30) and plastic packaging (page 30). Mitigating the physical impacts of climate change is critical because we depend on raw materials sourced from countries that are particularly vulnerable to rising sea temperatures and changing weather patterns. See pages 33 to 35 for our response to the risks and opportunities from alow-carbon economy.

Trust is essential for any business, but it must be earned. The USLP is a key driver of trust among our employees and potential recruits. We are the number one FMCG graduate employer of choice in around 50 countries where we recruit. We have been ranked first in the annual GlobeScan survey of sustainability leaders for eight years and also came top of the Dow Jones Sustainability Index Personal Products sector in 2018.

IMPROVING HEALTH & WELL-BEING

Our activities impact the health and well-being of millions of people – throughbrand-led health and hygiene, and nutrition interventions. Significant progress has been made against our first USLP goal of helping more than one billion people improve their health and well-being by 2020. By the end of 2018, we had reached 653 million people, making a significant contribution to the Sustainable Development Goal on Clean Water and Sanitation (SDG6).

Lifebuoy leads with one of the world’s largest handwashing behaviour change programmes. Since 2010, its programme has reached 426 million people through schools, health clinics and community outreach. Lifebuoy currently only counts those people reached throughon-ground programmes. However, we have long believed the totality of our marketing efforts contribute to changing handwashing behaviour, including mass scale TV advertising. To test this, we ran a study in our biggest market, India, to assess the effectiveness of specific Lifebuoy TV adverts with the same methodology used to evaluate ouron-ground programmes. The study showed a significant increase in frequency of handwashing with soap after watching the adverts. The result shows mass media can impact health behaviours at scale, giving Lifebuoy the opportunity to reach millions more people and potentially bringing us closer to our 2020 target of reaching 1 billion people. As a next step, we are progressing peer review publication and aim to include TV reach in our Health & Well-being performance figures for 2018 alongside ouron-ground programme reach.

Our Vaseline brand is helping to heal the skin of people affected by poverty or emergencies. The Vaseline Healing Project, in partnership with Direct Relief, is providing dermatological care, skin health training, Vaseline Jelly and other medical supplies. Its ambition is to help heal the skin of five million people by 2020 and has reached over two and a half million people since 2015. Marketing activities featuring the Vaseline Healing Project have had measurable, positive impacts on sales growth and brand equity. In 2017 the programme sent dermatologists to Syrian refugee camps in Jordan and conducted healing missions in India, the US, Philippines, Thailand and Mexico.

The second pillar of our Health & Well-being goal is our commitment on nutrition: to double the proportion of our portfolio that meets the highest nutritional standards, based on globally recognised dietary guidelines. This will help hundreds of millions of people to achieve a healthier diet, a key part of the Global Goal on Zero Hunger (SDG2). So far 39% of our products have reached this standard and are on track to meet our 2020 commitment. In support of our Code Policy on Responsible Marketing, in 2017 94% of our Foods and Refreshment portfolio had full nutrition labelling on pack that aligned with Unilever’s product labelling criteria (based on 97% of global sales from 1 April 2017 to 30 June 2017).

In order to increase the reach and social impact of some of our biggest health & hygiene programmes we continue to explore the potential of using mass media and digital to drive behaviour change at greater scale, as well as scaling up partnerships to increase the reach of more conventionalon-ground programmes. Dove, one of Unilever’s biggest brands which grew at 7.8% in 2018, has reached around 35 million young people since 2004 through its Self-Esteem Project. To expand its reach, Dove has partnered with the Cartoon Network to create Steven Universe mini episodes which bring to life the proven themes from ouron-ground programmes to boost self-esteem for young people. Our aim is that this will reach 20 million young people over the next two years. This series is supported by a music video which has so far received over 1.8 million views on YouTube. As well as reaching more young people with body confidence messaging, this activity is helping to raise overall awareness of Dove’s work to improve self-esteem which correlates with higher purchase intent.

Since 2010, Lifebuoy’s programmes have reached 458 million people through schools, health clinics and community outreach. Lifebuoy has recently expanded its behaviour change programme on the importance of handwashing with soap using mobile technology. The new service aims to reach out to women in media dark areas, providing free advice to mothers on their child’s health. Another recent Lifebuoy partnership with Gavi (the Vaccine Alliance) ties together the importance of handwashing with soap and immunisation, using a variety of channels including home visits and mobile communications. While our programmes have focused on reaching children and motherson-ground, we have long believed that TV advertising can drive behaviour change. To test this, we ran a study in India to assess the effectiveness of specific Lifebuoy TV adverts. The study showed a significant increase in the frequency of handwashing with soap after people watched the adverts. We are progressing with peer review publication of our study.

For more than a decade, we have been working to make our products even healthier by increasing goodness and reducing nutrients of concern like sugar, salt and saturated fat. We aim to double the proportion of our portfolio that meets the highest nutritional standards, based on globally recognised dietary guidelines. So far 48% of our products have reached this standard and we are on track to meet our 2020 commitment. We are also using the power of our brands to empower people to make responsible choices. In support of our Code Policy on Responsible Marketing, in 2018 95% of our Foods and Refreshment portfolio had full nutrition labelling on pack that aligned with Unilever’s product labelling criteria (based on 96% of global sales from 1 April 2018 to 30 June 2018). We continued our efforts to improve the goodness in our products and set out the ambition to provide 200 billion servings by 2022 containing at least one of the 5 key micronutrients: iron, iodine, zinc, vitamin A or D. We are developing plans to deliver against the ambition.

REDUCING ENVIRONMENTAL IMPACT

Our activities impact the environment, principally through the use of water, energy and land as well as the production of waste and greenhouse gas emissions, largely as a result of consumer use.

In 2016 we stopped buying GreenPalm certificates for palm oil which resulted in a temporary dip in our overall sustainable sourcing performance compared to 2015. By the end of 2017, the total volume of our agricultural raw materials that were sustainably sourced increased to 56%. We These impacts are one of the major buyers of palm oilreflected in the worldUSLP environmental pillar and itare supported by our Environmental Policy which is one of the most significant raw materials we sourceavailable on our website. Our environmental big goal is by volume. Our goal to source 100% of our palm oil sustainably from physical, certified sources by 2019 is on track with 56% of our palm oil volumes already physically certified in 2017. As part of the agreement to dispose of our global Spreads business to KKR, they will

Annual Report on Form 20-F 2017Strategic Report13


DELIVERING LONG-TERM VALUE FOR OUR STAKEHOLDERSCONTINUED

continue to work towards the goal of sourcing 100% sustainable palm oil by 2019.

We believe that growth cannot come at the expense of the planet. That is why our goal by 2030 is to halve the environmental footprint of the making and use of our products as we grow our business. This is a challenging target requiring action across our value chain on waste, water and greenhouse gas emissions. In doing so we will contributeemissions – in turn contributing to a number of the Sustainable Development Goals, principally Climate Action (SDG13)Goals.

As a consumer goods company, we are acutely aware of the causes and Responsible Consumption & Production (SDG12).

consequences of the linear ‘take-make-dispose’ model of consumption. We are taking action across our value chain to reduce, reuse, recycle and recover post-consumer waste and move towards a more circular model. Our manufacturing operations have seen a reduction in total waste disposed to landfill, or incineration without energy recovery, of around 98%97% per tonne of production since 2008. We maintained

Annual Report on Form 20-F 2018Strategic Report13


DELIVERING LONG-TERM VALUE FOR OUR STAKEHOLDERSCONTINUED

Furthermore, we achieved zeronon-hazardous waste to landfill across our global factory network during 2017.in 2015 and have maintained this every year since. We are more than half way towards meeting our 2020 commitment to reduce waste associated with the disposal of our products. This has reduced by about 29%31% since 2010 due to increases in consumer recycling and changes in our portfolio.

In 2017, we made a further commitment on waste, ensuring that all our plastic packaging will be fully reusable, recyclable or compostable by 2025. Our investmentWe are moving in innovative technologies such as CreaSolv is key. This technology makes it possiblethe right direction to recycle small, multi-layered sachets in which manymake all of our products are sold, especiallypackaging recyclable but there is more work to do. Find out more on page 15. Seventh Generation is eliminating virgin petroleum plastic (new plastic made from oil) and virgin fibre (virgin wood pulp) from its packs and has committed that all its packaging will be fully recyclable or compostable by 2020. In Brazil, Omo is launching its first plant-based detergent in emerging markets. If our initial pilot proves commercially viable, we will open source the technology.a 100% recyclable pack containing recycled plastic.

We have made significant reductions inreduced the water used in manufacturing – 39%by 44% per tonne of production since 2008. Our biggest water impact occurs when consumers shower, bathe and clean clothes with our products. Our target is to reduce by half the amount ofIn 2018, our water impact per consumer use reduced by 2020.around 2% compared to 2010. We have reducedrecognise that we are a long way short of halving our water use by 2% through innovations such as low rinse laundry products. However,impact and we will not achieve this has been offsetvery challenging target by the end of 2020. This is due in part to our portfolio being made up of more products that have a higher than average water footprint than in 2010 and the significant consumer behaviour change needed to reduce water consumption when our products are used, where the vast majority of our water footprint resides. Going forward we want to broaden our water strategy by recognising the role of water in our consumers’ lives and its importance as a growth of products with higher water use in the portfolio, including conventional laundry products.

driver for our business. We are committed to implementingdeveloping and launching innovative products which deliver the recommendationsbenefits people need with less water, or even no water at all, as well as products that improve the quality of the Task Force on Climate-related Financial Disclosures on the risks and opportunities faced by Unilever (see pages 32 and 33 for more). Our carbon reduction targets, officially approved by the Science-Based Targets Initiative (a partnership between CDP, UN Global Compact, WRI and WWF) are a key part of our climate risk disclosures.water.

Since 2008, we have cut CO2 from energy in our manufacturing by 47% per tonne of production. As with water, our biggest greenhouse gas impact comes through consumer use. The greenhouse gas impact of our products across their lifecycle continues to edge up and has now increased by about 9%6% since 2010. The acquisitionWe are having more success in areas that are within our direct control such as manufacturing where we have cut CO2 from energy by 52% per tonne of some skin cleansing and hair care brands whichproduction compared to 2008. Similarly, we continue to make savings through the ongoingroll-out of freezer cabinets that use more climate-friendly natural (hydrocarbon) refrigerants. Our ability to meet our target partly depends on changes in the energy markets worldwide, such as the rate of installation of renewable electricity in many countries. We have a higher greenhouse gas impact per consumer use, remainsrole to play as an industry leader to help shape those markets. We are committed to implementing the main reason for this. Seerecommendations of the Taskforce on Climate-related Financial Disclosures (see pages 7, 3233 to 33 and 39 for more climate-related disclosures.35). Two of our carbon reduction targets have been officially approved by the Science-Based Targets Initiative.

Our effortssustainable sourcing strategy focuses on a set of key agricultural crops, which are not only crucial to our brands, but also where we can drive measurable impact for sustainable transformation of the environment have received external recognition. CDP,industry. By thenon-profit global environmental disclosure platform, has awarded Unilever end of 2018, the total volume of our agricultural raw materials that were sustainably sourced was 56%. In line with our strategy, sustainably sourced volumes for our 12 key crops increased by over 4% including significant increases for palm oil and tea, whilst our sustainably sourced volumes for non-key crops reduced. As a placeresult, our performance versus 2017 was flat. The sale of our spreads business during 2018 had a slight downward impact on overall sustainable sourcing performance given the 2017 substantial volume of sustainable palm oil used by our spreads business.

A Lists for Climate, Water, Forests and Supplier Engagement. This recognisesnumber of key activities moved our actionssustainable sourcing agenda forward in 2018. We deepened our commitment to transparency with the last year to tackle climate changepublication of our palm oil mill list and the associated challengescreation of water scarcity, sustainable agriculturea grievance tracker for our palm oil supply; and sustainable energy use across our value chain.we, along with key NGOs including WWF, initiated a new jurisdictional approach to palm oil in Malaysia. The additional programmes were also supported by digital solutions like leveraging satellite data for deforestation detection and risk assessments, mapping of smallholder parcels in Indonesia, sending critical weather alerts to farmers’ mobiles in India, and using the Internet of Things to optimise tea production in Kenya. We are also piloting innovative approaches to achieving upstream traceability in several supply chains.

ENHANCING LIVELIHOODS

Our activities have the potential to positively impact the livelihoods of not only our employees, but the millions of people who are involved in our value chain – notably smallholder farmers and small-scale

retailers. By 2020, we aim to enhance the livelihoods of millions of people as we grow our business.

In 2017,2018, we made steady progress across the three pillars of our Enhancing Livelihoods goal.

We believe that women’s empowerment is the single greatest enabler of human development and economic growth. We are building a gender-balanced organisation (page 16) while promotingimproving women’s safety for women by working with UN Women in

Assam, India, the communities in which we operate, and developing employment opportunities through the Shakti programme.

programme which has provided work for around 113,000 women, equipping them to sell Unilever products in low income rural communities. Shakti continues to scale up in India, Sri Lanka, Pakistan and Nigeria and is now being rolled out to new countries, including Colombia. By 2017,2018, we had also enabled about 1,175,0001,724,000 women to access initiatives aiming to develop their skills. Radiant, our laundry detergent brand, has formed a Career Academy initiative in India and Brazil to equip aspiring women with the skills to realise their potential.

As well as directly creating wealth and jobs, our business supports millions of people who source, make and sell our products – we call this inclusive business. In 2017,By 2018, we had enabled about 716,000746,000 smallholder farmers and around 1.6over 1.7 million small-scale retailers to access initiatives to improve agricultural practices or increase incomes. The Philippines Kabisig programme, for example, trains bothhas reached over 165,000 small retailers, and their supplierstraining them in stock control, financial management, sales and customer service – increasing the earning potential of small-scale retailers at the same time as growing turnover for Unilever. See page 17 for more.

Our Responsible Sourcing Policy (RSP) is at the heart of our ambition to source 100% of procurement spend responsibly and through suppliers that meet our RSP requirements. In 2017,2018, we relaunchedfocused on completing the onboarding of high risk suppliers into our RSP programmecompliance database and programme. Over 20,000 suppliers have now completed their registration and are undergoing review processes allowing us to strengthen our approach and to drive an increase in the number of suppliers committingverify their compliance to the programme. The relaunch includes improved verificationRSP and remediation requirements, and anti-bribery and corruption compliance processes. We are focusing on addressing high risk issues in our supply chain and building capacityidentify areas for our procurement function and our suppliers.remediation. In 2017, 55%2018, 61% of procurement spend was through suppliers who were assessed as meeting the mandatory requirements of the RSP.

We continue to focus on the eradication of forced labour in global supply chains through supplier awareness raising and training events, and have made progress on the removal of worker recruitment fees through the Leadership Group for Responsible Recruitment and Consumer Goods Forum. As part of our global Framework for Fair Compensation, we brought forward our ambition for no direct Unilever employee to earn less than a living wage, to the end of 2018. We joined the Ethical Tea Partnership to drive improvements for tea workers and farmers. We have also created Global Land Rights Principles and Guidance policy.

We continued to embed human rights with a focus on our eight salient issues (ie those at risk of the most severe negative impact through Unilever’s activities or business relationships) as described. We also began a process to review these through a series of global and regional consultations. This year, one of our primary areas of focus has been on the eradication of forced labour in our Humansupply chain through training, capacity building and driving a robust vetting process for temporary labour agencies. We launched and are rolling out our Land Rights Report. This report was updated at the end of 2017 to include disclosure on our human rights issues activitiesPrinciples and due diligence processes.Implementation Guidance. Human rights risks are included as part of our sustainability and ethical principal risks (see pages 2829 and 30)33). See our website and our latest Human Rights report for more on our activities and due diligence processes.

Safety is a critically important part of our USLP. Our Vision Zero strategy continues to aim for: Zero Fatalities; Zero Injuries; Zero Motor Vehicle Accidents; Zero Process Incidents; and Zero Tolerance of Unsafe Behaviour and Practices. This is supported by our Code Policy on Occupational Health & Safety. Our Total Recordable Frequency Rate from 1 October 2017 to 30 September 2018 went from 0.89 accidents per 1 million hours worked in 2017 to 0.69, thanks to a continuous focus in high risk areas. See page 47 for more on safety.

DRIVING TRANSFORMATIONAL CHANGE

WhileOur USLP is a bold ambition to achieve change within our company. However, we are on track to achieve most of our USLP commitments, we are also aware that the biggest challenges facing the world cannot be addressed byjust one company alone. among many and the problems our society faces are urgent, large and complex. Our ‘transformational change’ agenda combines direct action on the SDGs with partnerships and external advocacy to create change on a systemic scale – while unlocking business opportunities at the same time.

We are changing ourselves asworking on a business butnumber of areas where we want to help change the system in which business is done. We want to act as catalysts for change more broadly, as convenors to facilitate progressive discussion and bring others together, and as collaborators in partnerships to deliver positive business, social and environmental impact at scale. By being part of the solution to the world’s challenges, businesses have the opportunity to win the trust of consumers while helping create societies and economies in which they can grow and succeed.

We aim to use our scale and influence to help bring about transformational change in four areas wherebelieve we can make the biggest differencedifference: climate change and which represent the biggest marketforests; sustainable agriculture, land use and food security; health and well-being including water, sanitation and hygiene; and improving livelihoods and creating more opportunities for Unilever: Climate Change & Forests; Sustainable Agriculture, Land Use & Livelihoods; Health & Well-Being and Women’s Empowerment. To understandwomen. Many of these issues relate directly to the challenges thatSDGs. We are preventing society andstepping up our ecosystems from thriving, and to find ways to help address them, we take a multi-stakeholder approach. We engageengagement with shareholders, governments, NGOs and civil society organisationsothers in our industry on these issues. We are also developing a range of partnerships that will accelerate and we shape the business landscape through advocacy. By leveraging our partnerships, blended finance, digital andscale new business models, we believe transformational change is possible.solutions.


14 Strategic Report  Annual Report on Form 20-F 20172018


REALISING THE BUSINESS OPPORTUNITYUNLOCKING GROWTH OPPORTUNITIES FROM THE SUSTAINABLE DEVELOPMENT GOALS

OUR SCALE AND REACH MEAN WE ARE WELL PLACED TO CAPTURE VALUE FROM THE GLOBAL GOALS.

The Sustainable Development Goals (SDGs) are fundamental to future economic and business growth. The Business & Sustainable Development Commission,co-founded by Unilever, concluded that

successful delivery of the SDGs will create market opportunities of at least $12 trillion a year. By using our resources as a business to address issues such as sanitation, hygiene, nutrition, gender equality and climate change – among other interconnected growth opportunities covered by the SDGs – we are delivering benefits for our business, shareholders and society. Partnerships (SDG17) play a key role in unlocking these opportunities. Business, governments and civil society must work together, through innovative partnerships, with new types of funding and new business models. We are working to make progresswith a range of partners across many of the SDGs, often through the USLP, which is our blueprint for sustainable growth. In doing so, we are unlocking new markets and investing in brands with purpose and innovation.brands. Below we provide fourthree examples where we have taken action in 2018. There are taking action. The interdependence and mutuality of the goals ensures that progress against one leads to progress against others. More details and examples of our approach and how we are benefiting from the SDGs can be foundmany more on our website.


SDG5: GENDER EQUALITYSDG1 – NO POVERTY: EMPOWERING SMALL-SCALE RETAILERS FOR GROWTH

LOGOOur products are sold in more than 190 countries, generating income and employment for millions of retailers and distributors who bring our brands to consumers. Inclusive distribution models such as Shakti and our retailer training programmes such as Kabisig in the Philippines help small-scale retailers to grow while strengthening our own sales and supply networks.
For any small retailer, selling out of a product line is a missed opportunity. But for retailers who are stuck in cash economies without access to credit, especially in the developing world, running out of stock can be a routine event.
In 2017, we began a strategic partnership with Mastercard in Kenya. Together, we’ve launched the Jaza Duka (‘fill up your store’) initiative, which uses a combination of innovative technology, targeted training and the strength of our relationships with our distribution network to free retailers from the constraints of cash, helping them fulfil their potential.
By digitising the processes of buying supplies and selling goods, small-scale retailers can build the credentials they need to access short-term working capital loans from Kenya Commercial Bank. This gives them better control of their inventory, so they can keep their shelves full and meet consumer demand. They are also able to access training and essential financial tools to help them grow their sales and incomes. Our research found that stores that fully moved to the new platform grew their sales of Unilever products by up to 20%. These are still early days. But if the partnership keeps succeeding, we believe it could help drive growth and improve incomes.

Our partnership with Mastercard is just one of a number of exciting new innovative last-mile distribution projects which harness the power of digital ande-commerce to create positive social impact at the same time as helping retailers grow.


Related Goals:SDG4: Quality Education; SDG17: Partnerships for the Goals

According to McKinsey, as much as $28 trillion could be added to global GDP by 2025 by advancing women’s equality. However, based on current trends, the World Economic Forum predicts that it will take 217 years for the workplace gender gap to close. Addressing gender equality is a moral and economic imperative. For Unilever, gender equality delivers tangible business benefits by widening the pool of experience and expertise across our supply chain and in our workforce. The majority of our shoppers globally are also women.

Our brands are seizing the opportunity through education and empowerment programmes. Dove, one of Unilever’s biggest brands which grew at 6% in 2017, has reached around 29 million young people since 2004 through its Self-Esteem Project. As well as raising awareness about body confidence, our data reveals that awareness of the Project correlates with higher purchase intent.

We are also taking action within our business on gender equality. Forty-seven per cent of management are now women and our Framework for Fair Compensation is helping to ensure equal pay for equal work.

Across our distribution network and supply chain we are supporting small-scale retailers and smallholder farmersSDG6 many of whom are women – to extend our reach and secure supply of vital agricultural raw materials. Around 370,000 women have accessed Unilever smallholder farmer programmes and small-scale retailer initiatives such as Shakti and Kabisig Summits.

SDG6: CLEAN WATER AND SANITATIONSANITATION: ADDRESSING BASIC NEEDS THROUGH OUR PRODUCTS


Related Goals:SDG3: Good Health and Well-being; SDG17: Partnerships for the Goals

LOGO

Nearly a billion people defecate in the open and around two and a half2.3 billion people live without adequate sanitation. Addressing water, sanitation and hygiene needs is a significant opportunity for Unilever since severalUnilever. A number of our health and hygiene brands directly address these needs through products and innovative partnerships which drive growth and deliver positive impact at scale.

scale, including Lifebuoy, Domestos, Vaseline, Signal and Pureit.

Domestos, which grew 10% in 2017,is one of our fastest growing brands, has committed to help 25 million people gain improved access to a toilet. Through our partnershiptoilet by 2020 in countries such as India. By partnering with UNICEF, over ten16 million people between 2012 and 20162017 gained access to a toilet through behaviour changebehaviour-change interventions and capacity building initiatives – contributing positivelycapacity-building initiatives. In 2018, Domestos went one step further and refocused its brand and marketing investment around its purpose. The new ‘Unstoppable’ campaign, now live in the UK and Poland, is showcasing how Domestos is helping to consumer sentimentfight germs while improving sanitation conditions for millions around the brand.

world.

Pureit, our water purification business, is another brand that is well positioned to address clean water needs in India.South Asia. It has provided 96106 billion litres of safe drinking water since 2005 through the sale of water purifiers, well on its way towards its ambitionpurifiers. Pureit is looking at different models to serve communities with accessible and affordable clean drinking water where it is most needed. One model is community water plants, which provide 20 litres of providing 150 billion litresclean drinking water from a central point for just 8 to 10 rupees. In 2017, we began partnering with Water Health International (WHI) who are global experts in community water systems. So far, we have set up four pilot plants in the city of Tumkur in India, managed by 2020.

Lifebuoy is the world’s number one antibacterial soap, sold in nearly 60 countries which grew 6% in 2017. It has championed the message of better health through hygiene for well over a century. Since 2010, its programme has reached 426 million people through schools, health clinics and community outreach – boosting sales in countries with high rates of diarrhoea-related child deaths, such as India.

WHI.

SDG12: RESPONSIBLE CONSUMPTION AND PRODUCTIONThese examples show that everyday products can help prevent disease and improve people’s wellbeing, while helping us grow our business.


Related Goals:SDG2: Zero Hunger; SDG15: Life on Land; SDG17: Partnerships for the Goals

Unilever’s ‘Making Purpose Pay’ research shows that over 50% of consumers want to choose brands that are more sustainable, and that demand for sustainable products cuts across demographic and socio-economic groups.

Unilever’s brands are well-placed to meet consumers’ growing desire for more sustainable products. Our Sustainable Living brands are the ‘gold standard’ in our portfolio, combining a strong social or environmental purpose, with products that contribute to achieving the USLP goals. In 2016, they grew 50% faster than the rest of the business, delivering more than 60% of Unilever’s growth.

One such brand is Knorr, which grew 4% in 2017, with a ‘farm to fork’ consumer proposition. Ninety-eight per cent of the top 13 vegetables and herbs in our Knorr sauces, soups and seasonings were sourced sustainably in 2017. Knorr is also addressing undernutrition and creating growth opportunities, selling four billion vitamin A fortified seasoning servings in 2017.

Signal is another Sustainable Living brand which grew at 7% in 2017. It is harnessing its purpose to encourage people to brush day and night through TV advertising andon-ground programmes in a number of markets. In doing so, it reaches new populations with vital health interventionsSDG12and potential consumers.

SDG13: CLIMATE ACTIONRESPONSIBLE CONSUMPTION AND PRODUCTION: RETHINKING PLASTIC PACKAGING


Related Goals:SDG7: Affordable & Clean Energy; SDG15: Life on Land; SDG17: PartnershipsLOGO

Plastic has become an integral part of our lives. It protects products and makes them easy to dispense or reseal after use. But with that has emerged the enormous – and growing – problem of plastic waste. It is littering our environment, polluting our seas and killing aquatic life. The challenge is that so little plastic packaging is currently recycled, recyclable or reusable. The result is a significant economic loss for society and business. It is for these reasons that we have singled out plastic packaging as a principal risk for our business in 2018 (see page 30 for more).
In 2017, we were one of the Goals

Few now seriously challengefirst multinational companies to make a public commitment to address plastic packaging waste. By 2025, all our plastic packaging will be reusable, recyclable or compostable and at least 25% of it will come from recycled plastic content. To help deliver these commitments we have an internal framework: Less plastic. Better plastic. No plastic. ‘Less plastic’ is about cutting down how much we use in the need for urgent action on climate change – from greeningfirst place. Since 2010 we’ve reduced the gridweight of our packaging by 18% through lightweighting and design improvements. For example, several years ago we launched MuCell technology which usesgas-injection to eliminating deforestation. Thanks tocreate gas bubbles in the Paris Agreement nearly 200 countries are pressing ahead withlow-carbon reforms, helping to open up around $23 trillion in opportunities for climate-smart investments by 2030. Investing to eliminate carbon emissions from our operations is the smart choice for Unilever, reducing costs and risk.

We have already increasedmiddle layer of a bottle wall. This cuts the amount of energy purchased from renewable sourcesplastic by at least 15%.

‘Better plastics’ is about making our products recyclable and eliminating problematic materials. Specifically, how we get recycled content in our packaging – a number of our brands are working to incorporate post-consumer recycled (PCR) plastic in their products including Love Beauty and Planet, TRESemmé, Sunlight and Omo. Better plastics is also about how we work with governments and partners to build infrastructure so we can help keep plastic in the economy and out of the natural environment. Our Community Waste Banks and CreaSolv®Sachet recycling technology pilot plant in Indonesia are at the heart of these efforts. The plant is currently processing around three tonnes of discarded sachets per day with an aim to eliminate coalscale up this process.
‘No plastics’ is about thinking differently – using alternative materials such as aluminium, glass, paper and board where possible and removing plastic where it is not necessary, such as plastic stiffeners from our energy mix by 2020 –soap bars. We’re also looking at reuse, encouraging shoppers to refill or reuse through vending machines. It’s early days but we are committed to findingnon-plastic packaging solutions.

We’re putting significant resource into tackling the issues associated with a goalplastic packaging. It makes business sense to become carbon positive by 2030, making the surplus energy available to the markets and communities where we operate. Oureco-efficiency savings have avoided cumulative energy costs of over490 million since 2008.

Unilever has long recognised the interdependency of climate and forests. We helped lead the Consumer Goods Forum towards azero-deforestation commitment across four commodities, including palm oil. We are tackling deforestationkeep plastic in the palm oil industry through our own sustainable palm oil commitmenteconomy and partnerships. Unilever, along with others, will invest up to $25 million between 2018 and 2022 to support sustainable commodity projects. Our investment will focus on smallholder palm oil farmers in Indonesia, thereby securingis imperative for the supply of sustainable palm oil.planet.


Annual Report on Form 20-F 20172018 Strategic Report 15


DELIVERING LONG-TERM VALUE FOR OUR STAKEHOLDERSCONTINUED

DELIVERING LONG-TERM VALUE FOR OUR STAKEHOLDERSCONTINUED


OUR PEOPLE

WE ARE CREATING AN ORGANISATION AND CULTURE WHERE OURUNILEVER EMPLOYEES ARE EMPOWERED TO ACT LIKE ENTREPRENEURS AND BUSINESS OWNERS.OWNERS IN A PURPOSEFUL CULTURE.

We are helping our people develop new skills, new waysThe world of workingwork is rapidly changing. Automation, flexible resourcing and new entrepreneurial leadership qualities within a culture that values diversity in all its forms. In turn this helps us attractbusiness models continue to impact our business and retain the best talent which is vital to accelerate long-term value creation.

The macro forces described on page 8 have a fundamental impact on the workplace. Competition for talent is intensifying.workforce. The workforce expects more flexibility and is increasingly freelance and afreelance. A job for life is no longer the norm. Once employed, people require continuous learning tomust regularly reinvent themselves with new skills. The digital transformation of work and they expect more flexibility in working practices. The growth of artificial intelligence and roboticsautomation is disrupting work in ways that are still being understood. Anxiety at work is on the rise and thebringing both great benefits, but also great disruption. The composition of the workforce is changing.changing too. By 2020, Millennials will be 60%make up around 35% of the global workforce. Just over half of Unilever’s own workforce in 2018 were Millennials.

CREATING AFUTURE-FIT WORKFORCE

In response to the trends outlined above, we are taking action across our business, including simplifying processes and ways of working to free people fromnon-value adding tasks so they can focus on key priorities. 2018 saw the continued implementation of Connected 4 Growth (C4G), our organisational change programme, and the creation of three new Divisions to bring further focus and simplicity. Our regular surveys show that 74% of our people now feel more empowered to make decisions. Our time to bring innovations to market is now40-50% faster than in 2016.

With the advance of AI and robotics, it is more important than ever that we strike the right balance between the use of technology and more human-centred approaches. We have invested in Una Hub, anAI-based platform, which automates responses to all general employee enquiries so People Experience Leads and HR Business Partners can focus on more complex queries, and provideface-to-face support where relevant.

Our research shows that a focus on purpose helps attract talent and binds us together for growth. Through our People with Purpose programme, more than 30,000 employees have joined workshops to help them define their purpose, with 50,000 targeted by 2020. At2019. Our global Univoice survey results reinforce the same timeimportance of these workshops – 92% of employees who believe they can live their purpose at Unilever, also say that their job inspires them to go the workforceextra mile.

As the workplace changes it is ageingimportant that we continue to prioritise mental wellbeing. In 2018, we officially recognised World Mental Health Day in October and five generations may be working togethercontinue to invest in the same company in the18-80 workforce. In short, aone-size-fits-all human resource strategy no longer works.

Our strategic approach to managing our workforce is: more simple, more human, more impact. We want to reduce complexity, understandmental wellbeing of our people, as individuals, not by job titles or work levels,alongside their physical wellbeing. This builds on theroll-out of a mental wellbeing framework globally several years ago which guides us in tackling the health risks across our business.

Another area of focus is on personalising training and personalise interventionscapability building to builddevelop the right leaders and teams.teams who are fit for the future. We are taking action acrossresponding to demands for new skills through continuous learning. Since the launch of Degreed, our online learning platform in 2017, 76,000 people have access to 2.3 million pieces of learning content, with 55,000 pieces being consumed on a numbermonthly basis, including PowerUp, our digital upskilling programme. We are also accelerating impact through new agile ways of areasworking. In the UK and US we are piloting more agile team structures to make this happen.

DEVELOPING AN OWNER’S MINDSET

C4G, our largest organisational change programme in more than a decade, was fully implemented during 2017 with the benefits to be realised progressively during 2018 and 2019. C4G encourages and equips people to adopt an owner’s mindset by giving them more control through a simplified organisational and reward structure. An owner’s mindset means more ownership and collaboration, clarity of purpose, more test and learn, embracing failure to gain insight, and an obsession with customers and consumers – ultimately driving long-term value creation and financial rewards for our employees. This mindset hands teams in local markets responsibility for business results. They are encouraged to treat resources as if they were their own, helping ensure we maintainhave the highest levels of efficiency.right people, doing the right job at the right time, while breaking down silos.

RECRUITMENT AND RETENTION

Our C4G programmeattractiveness as an employer is improving amongst Millennial and Generation Z recruits. We are the number one FMCG graduate employer of choice in around 50 countries and the most followed FMCG employer on LinkedIn with over 4 million followers as at the end of 2018.

In 2018 we introduced more ways to give our employees a voice, through monthly pulse surveys and global and local surveys on a range of topics, reaching around 70,000 people. Our largest listening exercise is the platform throughannual engagement survey called UniVoice which people are now empowered to deploy ourzero-based budgeting approach to allocating resources and our 5S programmecovered a representative sample of supply chain margin improvement (see page 10). This drives simplification, partnerships with third parties, and smarter pricing policies in our channels. Part of developing an owner’s mindset, and coping with the quicker pace of change in our markets, is adopting an ‘always on’ learning culture. Learning and building capability is critical in a hyper-connected world. In 2017, we launched ‘My Learning’ powered by Degreed, a social learning platform with a daily feed of materials customised to individual profiles, combining Unilever content with external sources including TED Talks and MIT.

Behavioural change requires the right incentives. For 2,872 senior management employees, incentives have been simplified to include fixed pay, a bonus as a percentage of fixed pay and a long-term managementco-investment plan (MCIP) linked to financial and USLP performance (see pages 6 and 7). In addition, the long-term MCIP will be rolled out to the remainder of managementalmost 25,000 office-based employees in 2018. Fornon-managementWe maintained high levels of employee engagement – 90% of employees said they were proud to work for Unilever and our Engagement Index remained at 74%. The survey also reinforced the

importance of focusing on speed and responsiveness to the market. We use survey results to help us take action in areas where there is room for improvement. For example, last year we have a share purchase scheme so that everyone can have a stakeimplemented the new Standards of Leadership in Unilever’s long-term success.response to feedback we received. Alongside our UniVoice survey, we use Glassdoor to benchmark our employee experience. As at 31 December 2018, our rating of 3.9 out of 5 was above the site average of 3.2.

GENDER

DIVERSITY AND INCLUSION

We are developing anwant our culture to be inclusive, culture, promoting gender balance and respecting the contribution of all employees regardless of gender, age, race, disability or sexual orientation. Consistent withorientation – as set out in our Code Policy on Respect, Dignity &and Fair Treatment, Unilever aims to ensure that applications for employment from everyone are given full and fair consideration and that everyone is given access to training, development and career opportunities.Treatment.

The USLP sets out clear targets for expanding opportunities and enhancing access to skills and training for women in our value chain. It also sets out our ambition to build a gender-balanced workforce within Unilever, with 50% of women in management positions by 2020. Our Opportunities for Women white paper, publishedBy the end of 2018, 49% of total management were women (47% in 2017, contains more details on these targets. 2017). Among the top 92 executives, 23% were women (22% in 2017). If you include employees who are statutory directors of the corporate entities whose financial information is included in the Group’s 2018 consolidated accounts in this Annual Report and Accounts, the number increases to 474 (71%) males and 190 (29%) females. 38% (5 out of 13) of the Board were female (38% in 2017). Of our total workforce of 154,848, 101,383 (65%) were male and 53,465 (35%) were female at the end of 2018.

We run programmes across Unilever aimed at attracting, retaining and developing female talent. This includes developing candidates for potential future roles, maintaining balanced slates,aiming for ‘balanced slates’ so that we interview equal numbers of men and women for roles, and practical help such as a minimum 16 weeks’weeks paid maternity leave as a global standard – more than the regulatory requirement in over 50% of countries where we operate. In 2018, we also committed to introduce by the end of 2019, three weeks of fully paid paternity leave as a benefit to all new fathers, adopting partners and parents insame-sex couples.

Unilever has a commitment to gender equality and fairness in the workplace based on equal pay for equal work and achieving greater gender balance. Pay and overall reward is intended to be gender neutral, with any differences between employees in similar jobs reflecting performance and skill. Unilever has a long-standing commitment to gender equality and fairness in the workplace based on equal pay for equal work and achieving greater gender balance, particularly at management levels. Gender pay gaps develop where there is a representational imbalance between genders. When we look at our worldwide business as a whole, in countries with more than 250 employees, the average female pay was 26% higher than male pay in 2018 (2017: 25%). This is largely due to the fact that 80% of our lower paying blue-collar roles are held by male employees. ‘Equal pay for equal work’ is our primary ambition and is a crucial part of fair compensation. Our Framework for Fair Compensation reviews the average pay differences between genders at each work level.level and in each country. The most recent analysis highlights that there is more work to do to continue improving our gender balance, and related gender pay gaps, at various levels and in various countries throughout the business.

ByBUSINESS INTEGRITY

Our principles and values apply to all our employees through our Code and Code Policies. Our employees undertake mandatory annual training on these Policies via online training modules and an annual business integrity pledge. Our Business Integrity guidelines include clear processes for managing Code breaches. For more information on Business Integrity see our website.

In 2018 1,206 whistleblowing incidents were opened (defined as Code Policy cases raised). We closed 1,252 incidents across all areas of our Code and Code Policies, with 662 confirmed breaches. In 2018, we terminated the employment of 330 people. Business integrity risks are included as part of our ethical and legal and regulatory principal risks (see page 30). The Code and Code Policies reflect our desire to fight corruption in all its forms. We are committed to eradicating any practices or behaviours though ourzero-tolerance policy.

Our Responsible Sourcing Policy and Responsible Business Partner Policy help to give us visibility of our third parties to ensure their business principles are consistent with our own.

16Strategic ReportAnnual Report on Form 20-F 2018


OUR PARTNERS

WE WORK WITH MANY PARTNERS TO SUPPORT THE SUSTAINABLE GROWTH OF OUR BUSINESS.

ENGAGING STAKEHOLDERS

We have many interactions with our stakeholders on a daily basis. Our Code of Business Principles and Code Policies guide how we interact with suppliers, customers, governments,Non-Governmental Organisations (NGOs) and trade associations in particular. Only authorised and appropriately trained employees or representatives can engage with these groups and we require that a record should be kept of all interactions and that all engagement must be conducted: in a transparent manner with honesty, integrity and openness; in compliance with laws and in accordance with Unilever’s values. Our website contains further disclosure on how we engage with our stakeholders.

SUPPLIERS

Our supply chain is very diverse and highly dynamic as we respond to changing consumer preferences, in line with our C4G programme. Our suppliers help us meet consumer needs by innovating, creating capacity and delivering quality materials and services for our products. We work with a large range of suppliers in over 160 countries – from multinational companies through to SMEs and smallholder farmers.

We screen suppliers in relation to their supply chain capabilities and the level of associated environmental and social risk. Managing supplier risk is a key role of our Supply Chain function. All suppliers must complete our registration process to assess compliance with the mandatory requirements of our Responsible Sourcing Policy which includes anti-bribery and corruption. We conduct audits and follow up issues identified where necessary.

Partner to Win is our approach to building long-term relationships with selected key strategic supplier partners in order to achieve mutual growth. It focuses on five key areas: quality and service, innovation, value, sustainability and capacity and capability. Partner to Win helps us strengthen supplier and customer collaboration and improves operational efficiency. In 2018, we had 175 Partner to Win suppliers, representing 35% of total procurement spend.

We came first in the annual Gartner Supply Chain Top 25 for the third year running, emphasising our leading practices in the area of supply chain management, in particular on sustainability and digitalisation.

CUSTOMERS

In a fragmented channel landscape, those companies that best serve their shoppers and customers with bespoke solutions will benefit most. Unilever serves consumers through ten different channels: hyper and supermarkets,e-commerce, out of home, drug stores, small stores, discounters, Food Solutions, Unilever International, prestige channel and global retail.

We serve around 26 million retail stores globally of which we cover eight million directly and another 18 million indirectly through wholesale and cash & carry.

In 2018 we focused on developing oure-commerce channels, digitising our value chain to respond to the rapid fragmentation of traditional routes to market. We are actively driving B2C and B2Be-commerce in our top 30 markets. Our focus is to build a balancede-commerce business model, growing acrosse-retailers, bricks and mortar online sales anddirect-to-consumer businesses. In 2018 we signed a logistics partnership with JD.com, China’s largest retailer. JD will help to bring our most popular products to the mosthard-to-reach communities in China, securely and quickly.

Health & Beauty channels have been an area of focus for Beauty

& Personal Care. In Europe we have been increasing our presence and share with the discounter channel, which continues to see growth, contributing to top line growth for Unilever while delivering incremental gross profit.

We are collaborating with hyper and supermarkets to win with omni-channel shoppers and evolve new experiential concepts with these large-scale retailers to ensure Unilever brands enjoy the best positioning in store and online.

We continue to engage with small-scale retailers by professionalising their store operations through capability training. Our Rise Sales Academy is currently being piloted in Nigeria and Sri Lanka to deliver store operations retail training for micro retailers across the world. In turn, this will help contribute to our USLP target to improve the incomes of 5 million small-scale retailers in our distribution network.

GOVERNMENTS

Weco-operate and engage with governments, regulators and legislators, both directly and through trade associations, in the development of proposed legislation and regulation which may affect our business interests. All employees involved in political engagement must comply with our Code of Business Principles and Code Policies. We do not support or fund political parties or candidates or any groups that promote party interests.

Our participation in policy discussions is varied, covering macro topics such as climate change, nutrition and plastic packaging. We engage with government stakeholders directly or through membership of representative organisations, including trade associations.

TRADE ASSOCIATIONS

We are members of and support a number of trade associations and similar organisations which help us to advance our public policy interests. We keep a record of our trade association memberships and membership fees, which is regularly updated. We also engage with peer companies, both individually and in coalitions, on issues of mutual interest. This includes working together to implement sustainable business strategies and drive change.

These associations reflect our global scale and presence across several product categories. We list our global memberships in the Engaging with stakeholders section on our website. We are registered in the Transparency Register of the European Union. Our US trade association memberships can be found on the FAQ section of the Unilever USA website.

NON-GOVERNMENTAL ORGANISATIONS

We are building transformational partnerships in collaboration with NGOs who share our vision for a more sustainable future. These partnerships are instrumental in improving the quality of people’s lives, driving growth, achieving our USLP targets and contributing to the Sustainable Development Goals.

In collaboration with NGOs, we build programmes on the ground to implement our brands’ purpose in addition to advancing our efforts in areas such as sustainable sourcing and distribution – often in partnership with governments and other businesses. We drive scale through new business models, digital technologies and external financing.

Our leadership engages with stakeholders through platforms such as the World Economic Forum, UN Global Compact, the World Business Council for Sustainable Development and the Consumer Goods Forum, championing a more inclusive model of capitalism and the pursuit of long-term value creation for the benefit of multiple stakeholders. Partnerships with NGOs are crucial to deliver the United Nations Sustainable Development Goals (see page 15).

Annual Report on Form 20-F 2018Strategic Report17


DELIVERING LONG-TERM VALUE FOR OUR STAKEHOLDERSCONTINUED

OUR SHAREHOLDERS

WE DELIVERED SOLID PERFORMANCE IN 2018 AND REMAIN ON TRACK FOR OUR 2020 TARGETS.

We aim to build long-term relationships with our shareholders through positive engagement for the benefit of all our stakeholders. We engage directly with our shareholders on a broad range of financial and environmental, social and governance (ESG) matters. During 2018 we engaged with shareholders on a number of topics including our Remuneration Policy and on the simplification of Unilever. See page 39 and our website for more details. In addition to direct engagement we regularly engage indirectly via ESG ratings organisations such as MSCI, Sustainalytics and ISS, as well as investor-focused sustainability rankings such CDP and the Dow Jones Sustainability Index.

PERFORMANCE IN 2018

Underlying sales growth for 2018 was 2.9% and underlying operating margin was 18.4%, a rise of 90 basis points. Turnover declined by 5.1% due to the sale of spreads and currency devaluation; operating margin was 24.6% due to profit on the spreads disposals.

Emerging markets saw a good performance in underlying sales growth of 4.6% including improved price growth in response to commodity inflation. Notable improvements were in India, which was strong across all categories, and China where strong volume growth was seen particularly ine-commerce. Argentina was classified ashyper-inflationary and price growth was excluded from underlying figures from July; any volume growth or decline is included within underlying figures. North America saw an improvement in underlying sales growth and there was acceleration in the US, helped by our acquisition programme in recent years, particularly in BPC. Europe remains challenged by a deflationary environment generally. We delivered solid volume-driven growth across our business with good margin progression.

We generated5.0 billion of free cash flow and 18.8% return on capital. Underlying earnings per share was2.36, a rise of 5.2%, and dividends were increased 8%, reflecting Unilever’s confidence in future profit growth and cash generation. Diluted earnings per share was3.48. Our share price has fallen 0.42% for PLC shareholders and risen 0.98% for NV shareholders. For information on ournon-GAAP measure, see pages 23 to 26.

PROGRESS AGAINST OUR 2020 FINANCIAL TARGETS

In April 2017, we set out financial targets for 2020 to further accelerate shareholder value. In 2018 we maintained a strong delivery of savings with over2 billion of savings from the supply chain, ZBB and change programmes. As a result, we are on track to meet our cumulative savings target of6 billion by 2019 and a 2020 underlying operating margin target of 20%, compared to 16.4% in 2016.

We continue to maintain our leverage by targeting a Net Debt to underlying EBITDA ratio of 2x, consistent with a credit rating of at least A/A2. During 2018, we returned6 billion to shareholders through our share buyback programme following the sale of spreads.

During the year the Boards decided to withdraw proposals to revise Unilever’s dual-headed legal structure after extensive engagement with shareholders. We remain firmly committed to our 2020 improvement programme and are confident of meeting its key goals. To simplify our capital structure, we cancelled the NV preference shares in February 2019 (see page 38).

BUSINESS TRANSFORMATION

Our brand portfolio continues to evolve to match our Divisions’ strategic priorities, resulting in the sale of assets that no longer fit our growth model or the acquisition of assets that take us into new market segments and build new market positions. This active portfolio management means that in the past nine years we have sold6.8 billion of turnover, mainly in the lower growth foods businesses. During that same period, we have acquired approximately5.3 billion of turnover. The spreads disposals in July allow Foods & Refreshment to focus on growth.

Actively managing our brand portfolio through acquisitions and disposals remains an important strategic growth driver. In December we announced an agreement to acquire the Health Food Drinks portfolio of GlaxoSmithKline (GSK) in India, Bangladesh and 20 other predominantly Asian markets. Further details of the transaction can be found on our website. The acquisition includes iconic brands such as Horlicks and Boost, and a product portfolio supported by strong nutritional claims. The transaction is aligned with our strategy to increase our presence in health-food categories and in high-growth emerging markets. The transaction is subject to customary regulatory and shareholder approvals, with expected completion around 12 months from the announcement.

In October we completed the acquisition of a 75% stake in the Italian personal care business Equilibra which has a growing presence in the natural skin and hair care segments. We also completed the acquisition of Quala’s Beauty & Personal Care and Home Care brands. We acquired a number of exciting new businesses including the Vegetarian Butcher (Netherlands) which expands our portfolio into plant-based foods, and three ice cream brands – Adityaa (India), Betty (Romania) and Denny (Bulgaria). With the exception of brands launched in countries where they were not previously sold, acquisitions and disposals only contribute to underlying sales growth from 12 months after completion.

A key part of our 2020 programme is faster portfolio evolution in order to focus Unilever on more rapidly growing segments. This process continued at pace during 2018 with the focus on new brand launches and evolving our core brands. Our C4G organisation means we can respond to consumer trends more quickly. We have launched nearly 30 brands in the last two years. Local brands are also being launched more quickly followed by rapid globalroll-out, for instance Breyers Delights, Love Beauty and Planet and Lakme all responding to the trend for more natural and healthy products.

Evolving our core brands has also accelerated. Brands such as Dove, Lifebuoy and Sunsilk in Beauty & Personal Care all launched new variants responding to consumer trends. In Home Care there were new launches of Domestos, Cif and Comfort while Foods & Refreshment extended the Knorr, Hellmann’s and Lipton brands with newon-trend variants (for more information on brand launches see pages 11 to 12).

Realising the opportunities from digital technology to help deliver further growth and margin improvement is another key part of our business transformation. We have launched a digital transformation programme across all aspects of our value chain. We have 30 platforms across Unilever which power our business using digital technologies. Our Enterprise & Technology Solutions team is set up to deliver a technologically enabled Unilever for the future while ensuring that processes and activities are shared and scaled across the business. This will allow us to use technology as a competitive advantage rather than a cost.

Digital technology changed our approach to marketing some time ago but the transformation of Unilever more broadly has begun at pace. AI, machine learning and voice related technologies are being used to deliver personalised and immersive experiences to our consumer platforms such as Recipedia and Cleanipedia websites. We are also driving digital through our R&D organisation, introducing new tools to increase the speed, efficiency and quality of our innovation processes.

18Strategic ReportAnnual Report on Form 20-F 2018


NON-FINANCIAL INFORMATION STATEMENT

In accordance with sections 414CA and 414CB of the Companies Act 2006 which outline new requirements fornon-financial reporting, the table below is intended to provide our stakeholders with the content they need to understand our development, performance, position and the impact of our activities with regards to specifiednon-financial matters. Further information on these matters can be found in our online Sustainable Living Report, Human Rights Report as well as policy documents contained on our website.

Non-financial matter and relevant sections

of Annual Report

Annual Report page reference
Environmental matters
Relevant sections of Annual Report & Accounts:

•  Reducing environmental impact

•  Policy: Pages 13 and 33 to 35

•  In focus: climate change risks and opportunities

•  Position and performance: Pages 7 and 13 to 14

•  Risk: Pages 30 and 33 to 34

•  Impact: Pages 13 to 15 and 33 to 35

Social and community matters
Relevant sections of Annual Report & Accounts:

•  Improving health and well-being

•  Policy: Pages 13 and 15

•  Enhancing livelihoods

•  Position and performance: Pages 7, 13 to 15

•  Safety

•  Risk: Page 31

•  Engaging stakeholders

•  Impact: Pages 13 to 15

Employee matters

Relevant sections of Annual Report & Accounts:

•  Developing a future-fit workforce

•  Policy: Pages 14 and 16

•  Diversity and inclusion

•  Position and performance: Pages 10 and 16

•  Recruitment and retention

•  Risk: Page 29

•  Enhancing livelihoods

•  Impact: Page 14 and 16

Human rights matters
Relevant sections of Annual Report & Accounts:

•  Diversity and inclusion

•  Policy: Pages 14 and 17

•  Enhancing livelihoods

•  Position and performance: Pages 7 and 14

•  Risk: Page 29

•  Impact: Pages 14 and 17

Anti-corruption and bribery matters
Relevant section of Annual Report & Accounts:

•  Business integrity

•  Policy: Page 16

•  Position and performance: Page 16

•  Risk: Pages 29 and 31

•  Impact: Page 16

Annual Report on Form 20-F 2018Strategic Report19


FINANCIAL REVIEW

FINANCIAL OVERVIEW 2018

CONSOLIDATED INCOME STATEMENT

Turnover declined by 5.1% to51.0 billion including an unfavourable currency impact of 6.7% (2017: 2.1% unfavourable currency impact) mainly due to weakening of currencies in key emerging markets such as Brazil, Argentina and India. Underlying sales growth^ was 2.9% (2017: 3.1%), with a positive contribution from all divisions. Underlying volume growth was 1.9% (2017: 0.8%) and underlying price growth was 0.9% (2017: 2.3%). The net impact of acquisitions and disposals was a reduction in turnover of 1.0% (2017: 0.9% increase) with the impact of recent acquisitions such as Carver Korea and Quala outweighed by the disposal of the spreads businesses. Emerging markets contributed 58% of total turnover (2017: 58%) with underlying sales growth of 4.6% (2017: 5.9%) coming from price growth of 1.7% and volume growth of 2.8%. Developed markets underlying sales growth was 0.5% coming from volume growth of 0.7% slightly offset by price decline of 0.2%.

Underlying operating margin improved by 0.9 percentage points to 18.4%. Gross margin improved by 0.5 percentage points driven by margin-accretive innovations and continued strong delivery from our‘5-S’ savings programmes. As a percentage of turnover, overheads and brand and marketing investment were down by 0.3 percentage points and 0.1 percentage points respectively as a result of productivity gains fromzero-based budgeting.

Operating profit was up 41.5% to12.5 billion (2017:8.9 billion) as a result of3,176 million fromnon-underlying items.Non-underlying items within operating profit comprised a gain on spreads disposal of4,331 million, a credit from the early settlement of contingent consideration related to the Blueair acquisition of277 million, partially offset by restructuring costs of914 million, acquisition and disposal related costs of201 million and impairment andone-off items of317 million.

Highlights for the year ended 31 December

    2018   2017   % change 

Turnover ( million)


50,982


53,715


(5.1


Operating profit ( million)


12,535


8,857


41.5


Underlying operating profit ( million)*


9,359


9,400


(0.4


Profit before tax ( million)


12,383


8,153


51.9


Net profit ( million)


9,808


6,486


51.2


Diluted earnings per share ()


3.48


2.15


62.0


Underlying earnings per share ()*


2.36


2.24


5.2


Net finance costs were481 million in 2018 compared with877 million in 2017, which included aone-off cost of382 million for the buyback of the Unilever NV preference shares. The cost of financing net borrowings was57 million higher than 2017. The increase was primarily driven by an increase in net debt which was partially offset by lower interest rates and a prior yearone-off in Brazil relating to the interest element of an indirect tax amnesty programme. The average interest rate on net debt reduced to 2.2% from 2.7% in 2017. The pensions financing charge was25 million, down from96 million in 2017 reflecting a lower pension deficit at the beginning of 2018.

A monetary gain of122 million was recorded following adoption of IAS 29 ‘Financial Reporting in Hyperinflationary Economies’ in Argentina (see note 1) from 1 July 2018.

The effective tax rate was 21.1% compared with 20.8% in the prior year. In both years the rate was low relative to longer term norms, due to the significant impact on tax of the disposals of our spreads businesses in 2018 and US tax reform in 2017.

Net profit from joint ventures and associates was up 19% at185 million, with the increase coming mainly from a gain on disposal of the spreads business of the Portuguese joint venture. Other income fromnon-current investments was22 million versus18 million in the prior year.

Diluted earnings per share were up 62.0% at3.48. The increase was mainly driven by the4,331 million gain on disposal for the spreads businesses, improvement in operating margin and the impact of the share buyback programmes.

The independent auditors’ reports issued by KPMG Accountants N.V. and KPMG LLP on the consolidated results of the Group, as set out in the financial statements, were unqualified and contained no exceptions or emphasis of matter. For more details see pages 67 to 74.

The consolidated financial statements have been prepared in accordance with IFRS as adopted by the EU and IFRS as issued by the International Accounting Standards Board. The critical accounting policies and those that are most significant in connection with our financial reporting are set out in note 1 on pages 79 to 82 and are consistent with those applied in 2017.

*

Certain measures used in our reporting are not defined under IFRS. For further information about these measures, please refer to the commentary onnon-GAAP measures on pages 23 to 26.

^

Wherever referenced in this report, underlying sales growth (USG) and underlying price growth (UPG) do not include price growth in Venezuela for the whole of 2018 and in Argentina from July 2018. USG and UPG for 2017 do not include Q4 2017 price growth in Venezuela. See pages 23 and 24 onnon-GAAP measures for further details.

20Strategic ReportAnnual Report on Form 20-F 2018


The Group has revised its operating segments to align with the new structure under which the business is managed. Operating segment information is now provided based on three product areas: Beauty & Personal Care, Foods & Refreshment and Home Care.

BEAUTY & PERSONAL CARE

    2018   2017     % change 
Turnover ( million)     20,624      20,697    (0.3
Operating profit ( million)   4,130    4,103    0.7 
Underlying operating profit ( million)   4,508    4,375    3.0 
Operating margin (%)   20.0    19.8    0.2 
Underlying operating margin (%)   21.9    21.1    0.8 
Underlying sales growth (%)   3.1    2.9   
Underlying volume growth (%)   2.5    1.4   
Underlying price growth (%)   0.6    1.5      

KEY DEVELOPMENTS

Turnover declined by 0.3% including a negative currency impact of 7.0%. Acquisitions contributed 3.9% and underlying sales growth was 3.1%. Dove delivered another year of broad-based growth. Skin care grew strongly helped by innovations such as the new Vaseline range with clinical strength moisturisation and other brands addressing the fast growing naturals trend including Love, Beauty & Planet. Growth in skin cleansing was helped by innovations such as the relaunch of Lifebuoy with active silver, new premium formats including Dove exfoliating body polishes and our new cleansing brands such as Korea Glow. Deodorants delivered good volume growth helped by strong performance on Dove but pricing was muted. The newly acquired Schmidt’s grew strongly. Sales in oral care were flat due to ongoing competitive pressures. Prestige performed well with double digit growth on Hourglass, Ren, Living Proof and Kate Sommerville as well as improved momentum on Dermalogica and Murad. Dollar Shave Club grew double digits and continued to build scale in the US.
Underlying operating profit increased by133 million. Underlying operating margin and underlying sales growth improvement added302 million and136 million respectively, offset by a484 million adverse impact from exchange rate movements. Acquisition related activities contributed179 million. Underlying operating margin improvement reflects brand and marketing efficiencies from zero based budgeting.

FOODS & REFRESHMENT

    2018   2017    % change 
Turnover ( million)     20,227      22,444   (9.9
Operating profit ( million)   7,245    3,616   100.4 
Underlying operating profit ( million)   3,534    3,737   (5.4
Operating margin (%)   35.8    16.1   19.7 
Underlying operating margin (%)   17.5    16.7   0.8 
Underlying sales growth (%)   2.0    2.7  
Underlying volume growth (%)   1.3    (0.2 
Underlying price growth (%)   0.7    3.0     

KEY DEVELOPMENTS

Turnover declined by 9.9% including a negative currency impact of 5.6%. Acquisitions and disposals had an unfavourable impact of 6.4% reflecting the disposal of the spreads business. Underlying sales growth was 2.0% coming from volume growth of 1.3% and price growth of 0.7%. Ice cream had another strong year helped by innovations on our premium brands which included a new Magnum praline variant and anon-dairy range of Ben & Jerrys. The launch of Kinder® ice cream and good weather helped to drive strong ice cream growth in Europe. Sales in tea grew modestly: emerging markets growth was driven by good performance on core brands like Brooke Bond in India whilst in developed markets challenges in black tea offset good growth from Pukka and the new organic Lipton

range. In savoury, Knorr was helped by good performance of cooking products in emerging markets and more organic and natural innovations such as a new ‘soup in glass’ range. In dressings, campaigns centred around Hellmann’s purpose to fight food waste helped to increase brand equity, but sales were held back by promotional intensity particularly in the US. Our actions to transform the portfolio are working: strong innovations including Knorr rice and pasta pots as well as our new brands Red Red, PrepCo and Mãe Terra helped us build scale in the fast growing snacking segment.

Underlying operating profit declined by203 million including a236 million adverse contribution from exchange rate movements. Underlying operating margin improvement added247 million and underlying sales growth contributed56 million. Acquisition and disposal related activities had an overall negative impact of270 million mainly due to loss of profit of the spreads business from the date of its disposal on 2 July 2018. Underlying operating margin improvement reflects strong gross margin improvement and lower overheads despite an adverse impact from the spreads disposal.

HOME CARE

    2018   2017     % change 
Turnover ( million)     10,131      10,574    (4.2
Operating profit ( million)   1,160    1,138    1.9 
Underlying operating profit ( million)   1,317    1,288    2.3 
Operating margin (%)   11.5    10.8    0.7 
Underlying operating margin (%)   13.0    12.2    0.8 
Underlying sales growth (%)   4.2    4.4   
Underlying volume growth (%)   2.3    2.1   
Underlying price growth (%)   1.9    2.3      

KEY DEVELOPMENTS

Turnover declined by 4.2% including an adverse currency impact of 8.3%. Underlying sales growth was 4.2%, coming from volume growth of 2.3% and price growth of 1.9%. Home and hygiene grew strongly led by Sunlight which was helped by a new communication focussed on building functional awareness, as well as the continued success of Domestos toilet blocks. In fabric sensations, Comfort was helped by market development in India and China as well as the launch into Germany. Fabric solutions grew strongly helped by our strategy to encourage consumers in emerging markets to uptrade to premium formulations like Surf Excel Matics in India, and innovations such as Omo eco active with recycled packaging, plant extracts and naturally derived fragrances. Seventh Generation also grew well.
Underlying operating profit increased by29 million, including a144 million adverse contribution from exchange rate movements. Underlying operating margin improvement contributed113 million. Underlying sales growth and acquisition and disposal related activities added55 million and5 million respectively. Underlying operating margin improvement was mainly due to lower overheads and brand and marketing efficiencies.

Annual Report on Form 20-F 2018Strategic Report21


FINANCIAL REVIEWCONTINUED

CASH FLOW

Cash flow from operating activities was9.0 billion, a decline of0.5 billion compared to the prior year. Free cash flow was5.0 billion, a reduction of0.4 billion on the prior year. The reductions reflected the impact of currency devaluation and higher working capital, including a0.4 billion increase arising from the disposal of spreads.

    € million
2018
   million
2017
 
Operating profit   12,535   8,857 

Depreciation, amortisation and impairment


1,747


1,538


Changes in working capital


(793


(68

Pensions and similar obligations less payments


(128


(904

Provisions less payments


55


200


Elimination of (profits)/losses on disposals


(4,299


(298

Non-cash charge for share-based compensation


196


284


Other adjustments


(266


(153

Cash flow from operating activities


  9,047


  9,456


Income tax paid


(2,294


(2,164

Net capital expenditure


(1,424


(1,621

Net interest and preference dividends paid


(367


(316

Free cash flow*


4,962


5,355


Net cash flow (used in)/from investing activities


4,644


(5,879

Net cash flow (used in)/from financing activities


(11,548


(1,433

*

Certain measures used in our reporting are not defined under IFRS. For further information about these measures, please refer to the commentary onnon-GAAP measures on pages 23 to 26.

Net inflow from investing activities was4.6 billion, an increase of10.5 billion compared to the prior year. The increase reflects proceeds of7.2 billion from the disposal of spreads and higher spend on acquisitions during the prior year.

The net outflow from financing activities was11.5 billion, compared with1.4 billion in the prior year. In 2018 there were repayments of financial liabilities of6.6 billion compared with2.6 billion in 2017; and an outflow from changes in short-term borrowings of4.0 billion, compared with an inflow of2.7 billion in 2017. The cash outflow in respect of the repurchase of shares in 2018 was6.0 billion, compared with5.0 billion in the prior year.

BALANCE SHEET

At 31 December 2018, Unilever’s combined market capitalisation was121.8 billion compared with127.9 billion at the end of 2017, 47%2017.

Goodwill and intangible assets increased by1.1 billion mainly coming from the acquisition of total management were women, upQuala and restatement of goodwill in relation to adoption of IAS 29 ‘Financial Reporting in Hyperinflationary Economies’ in Argentina (see note 1 and note 9). The increase was partially offset by impairment of Blueair. All material goodwill and indefinite-life intangible assets have been tested for impairment with no charge recognised during the year other than for Blueair. Othernon-current assets decreased by0.4 billion mainly due to a reduction in the value of pension assets.

    € million
2018
    million
2017
 
Goodwill and intangible assets   29,493    28,401 

Othernon-current assets


14,482


14,901


Current assets


15,481


16,983


Total assets


59,456


60,285


Current liabilities


19,772


23,177


Non-current liabilities


27,392


22,721


Total liabilities


47,164


45,898


Shareholders’ equity


11,572


13,629


Non-controlling interest


720


758


Total equity


12,292


14,387


Total liabilities and equity


  59,456


  60,285


Current assets decreased from 46%17.0 billion to15.5 billion mainly reflecting the reduction in 2016. Among the top 93 executives, 22% were women (22% in 2016). If you include employees who are statutory directorsassets held for disposals as a result of the corporate entities whose financial information is includedcompletion of the spreads transactions on 2 July 2018. Current liabilities were19.8 billion, a decrease of3.4 billion compared to the prior year. The decrease was due to repayment of short-term liabilities which were replaced by long term borrowings.Non-current liabilities were27.4 billion, an increase of4.7 billion on the prior year. During the year the Group issued bonds worth over6.0 billion and repaid notes of about1.0 billion. See note 15C for analysis of bonds and other loans.

The table below shows the movement in net pension liability during the year. The increase from0.6 billion at the beginning of the year to0.9 billion at the end of 2018 was primarily due to reduced pension assets, driven by adverse equity markets towards the end of 2018.

    € million
2018
1 January(561

Current service cost

(220

Employee contributions

17

Actual return on plan assets (excluding interest)

(1,108

Net interest cost

(25

Actuarial gain

671

Employer contributions

383

Currency retranslation

26

Other movements(a)

(57

31 December

(874

(a)

Other movements relate to special termination benefits, past service costs including losses/(gains) on curtailment, settlements and other immaterial movements. For more details see note 4B on pages 87 to 92.

FINANCE AND LIQUIDITY

Approximately0.8 billion (or 26%) of the Group’s cash and cash equivalents are held in the parent and central finance companies, for maximum flexibility. These companies provide loans to our subsidiaries that are also funded through retained earnings and third party borrowings. We maintain access to global debt markets through an infrastructure of short and long-term debt programmes. We make use of plain vanilla derivatives, such as interest rate swaps and foreign exchange contracts, to help mitigate risks. More detail is provided in notes 16, 16A, 16B and 16C on pages 110 to 115.

The remaining2.4 billion (74%) of the Group’s 2017cash and cash equivalents are held in foreign subsidiaries which repatriate distributable reserves on a regular basis. For most countries, this is done through dividends free of tax. This balance includes154 million (2017:206 million, 2016:240 million) of cash that is held in a few countries where we face cross-border foreign exchange controls and/or other legal restrictions that inhibit our ability to make these balances available in any means for general use by the wider business.The cash will generally be invested or held in the relevant country and, given the other capital resources available to the Group, does not significantly affect the ability of the Group to meet its cash obligations.

We closely monitor all our exposures and counter-party limits.

Unilever has committed credit facilities in place for general corporate purposes. The undrawn bilateral committed credit facilities in place on 31 December 2018 were $7,865 million.

22Strategic ReportAnnual Report on Form 20-F 2018


CONTRACTUAL OBLIGATIONS AT 31 DECEMBER 2018


million


Total


million
Due
within

1 year


million
Due
in1-3
years


million
Due
in3-5
years


million
Due in
over 5
years


Long-term debt


24,428


2,950


4,533


4,683


12,262


Interest on financial liabilities


3,723


467


800


628


1,828


Operating lease obligations


2,464


481


758


501


724


Purchase obligations(a)


520


421


94


1


4


Finance leases


187


20


37


34


96


Other long-term commitments


1,390


678


590


95


27


Other financial liabilities


150


149


1


Total


32,862


5,166


6,813


5,942


14,941


(a)

For raw and packaging materials and finished goods.

Further details are set out in the following notes to the consolidated accountsfinancial statements: note 10 on pages 100 and 101, note 15C on page 108 and 109, and note 20 on pages 120 to 122. Unilever is satisfied that its financing arrangements are adequate to meet its working capital needs for the foreseeable future. In relation to the facilities available to the Group, borrowing requirements do not fluctuate materially during the year and are not seasonal.

AUDIT FEES

Included within operating profit is21 million (2017:20 million) paid to the external auditor, of which16 million (2017:14 million) related to statutory audit services.

NON-GAAP MEASURES

Certain discussions and analyses set out in this Annual Report and Accounts (and the Additional Information for US Listing Purposes) include measures which are not defined by generally accepted accounting principles (GAAP) such as IFRS. We believe this information, along with comparable GAAP measurements, is useful to investors because it provides a basis for measuring our operating performance, and our ability to retire debt and invest in new business opportunities. Our management uses these financial measures, along with the most directly comparable GAAP financial measures, in evaluating our operating performance and value creation.Non-GAAP financial measures should not be considered in isolation from, or as a substitute for, financial information presented in compliance with GAAP. Wherever appropriate and practical, we provide reconciliations to relevant GAAP measures.

EXPLANATION AND RECONCILIATION

OFNON-GAAP MEASURES

Unilever uses ‘constant rate’ and ‘underlying’ measures primarily for internal performance analysis and targeting purposes. We present certain items, percentages and movements, using constant exchange rates, which exclude the impact of fluctuations in foreign currency exchange rates. We calculate constant currency values by translating both the current and the prior period local currency amounts using the prior period average exchange rates into euro, except for countries where the impact of consumer price inflation rates has escalated to extreme levels. In these countries, the local currency amounts before the application of IAS 29 are translated into euros using the period closing exchange rate.

The table below shows exchange rate movements in our key markets.


Annual
  average
rate in

2018


Annual
  average
rate in

2017


Brazilian real (1 = BRL)

  4.282    3.573 

Chinese yuan (1 = CNY)


7.807


7.608


Indian rupee (1 = INR)


80.730


73.258


Indonesia rupiah (1 = IDR)


16831


15011


Philippine peso ( 1 = PHP)


62.379


56.596


UK pound sterling (1 = GBP)


0.884


0.876


US dollar (1 = US$)


1.185


1.123


In the following sections we set out our definitions of the followingnon-GAAP measures and provide reconciliations to relevant GAAP measures:

underlying sales growth;
underlying volume growth;
underlying price growth;
non-underlying items;
underlying earnings per share;
underlying operating profit and underlying operating margin;
underlying effective tax rate;
constant underlying earnings per share;
free cash flow;
return on assets;
net debt; and
return on invested capital.

UNDERLYING SALES GROWTH

Underlying Sales Growth (USG) refers to the increase in turnover for the period, excluding any change in turnover resulting from acquisitions, disposals and changes in currency. We believe this measure provides valuable additional information on the underlying sales performance of the business and is a key measure used internally. The impact of acquisitions and disposals is excluded from USG for a period of 12 calendar months from the applicable closing date. Turnover from acquired brands that are launched in countries where they were not previously sold is included in USG as such turnover is more attributable to our existing sales and distribution network than the acquisition itself. Also excluded is the impact of price growth from countries where the impact of consumer price inflation (CPI) rates has escalated to extreme levels.

There are two countries where we have determined extreme levels of CPI exist. The first is Venezuela where in Q4 2017 inflation rates exceeded 1,000% and management considered that the situation would persist for some time. Consequently, price growth in Venezuela has been excluded from USG since Q4 2017. The second is Argentina, which from Q3 2018 has been accounted for in accordance with IAS 29, and thus from Q3 2018 Argentina price growth is excluded from USG. The adjustment made at Group level as a result of these two exclusions was a reduction in price growth of 32.4% for the year. This treatment for both countries will be kept under regular review.

Prior to Q3 2018 USG only excluded the impact of price changes in countries where consumer price inflation has escalated to extreme levels of 1,000% or more. However, given the need to account for our Argentinian business in accordance with IAS 29, we have now also excluded price changes in countries that need to be accounted for in accordance with IAS 29. Prior to Q3 2018 there were no countries that were accounted for under IAS 29, so no restatements are necessary.

Annual Report on Form 20-F 2018Strategic Report23


FINANCIAL REVIEWCONTINUED

The reconciliation of USG to changes in the GAAP measure turnover is as follows:

TOTAL GROUP  2018
vs 2017
  2017
vs 2016
 

Turnover growth (%)(a)


(5.1


1.9


Effect of acquisitions (%)


2.0


1.3


Effect of disposals (%)


(3.0


(0.4

Effect of exchange rates (%)(b)


(6.7


(2.1

Underlying sales growth (%)(b)


2.9


3.1


BEAUTY & PERSONAL CARE


2018

    vs 2017


2017

    vs 2016


Turnover growth (%)(a)


(0.3


2.6


Effect of acquisitions (%)


3.9


1.8


Effect of disposals (%)


(0.1

Effect of exchange rates (%)(b)


(7.0


(1.9

Underlying sales growth (%)(b)

   3.1   2.9 

FOODS & REFRESHMENT


  2018
vs 2017
  2017
vs 2016
 

Turnover growth (%)(a)


(9.9


(0.4

Effect of acquisitions (%)


0.8


0.2


Effect of disposals (%)


(7.2


(0.8

Effect of exchange rates (%)(b)


(5.6


(2.4

Underlying sales growth (%)(b)


2.0


2.7


HOME CARE  2018
vs 2017
  2017
vs 2016
 

Turnover growth (%)(a)


(4.2


5.6


Effect of acquisitions (%)


0.5


3.1


Effect of disposals (%)


(0.2


(0.2

Effect of exchange rates (%)(b)


(8.3


(1.7

Underlying sales growth (%)(b)


4.2


4.4


(a)

Turnover growth is made up of distinct individual growth components, namely underlying sales, currency impact, acquisitions and disposals. Turnover growth is arrived at by multiplying these individual components on a compounded basis as there is a currency impact on each of the other components. Accordingly, turnover growth is more than just the sum of the individual components.

(b)

For 2018 underlying price growth in Venezuela (from January 2018) and Argentina (from July 2018) has been excluded from underlying sales growth and an equal and opposite adjustment made in effect of exchange rate. For 2017 only Q4 price growth in Venezuela has been excluded.

UNDERLYING VOLUME GROWTH

Underlying volume growth (UVG) is part of USG and means, for the applicable period, the increase in turnover in such period calculated as the sum of (i) the increase in turnover attributable to the volume of products sold; and (ii) the increase in turnover attributable to the composition of products sold during such period. UVG therefore excludes any impact on USG due to changes in prices.

UNDERLYING PRICE GROWTH

Underlying price growth (UPG) is part of USG and means, for the applicable period, the increase in turnover attributable to changes in prices during the period. UPG therefore excludes the impact to USG due to (i) the volume of products sold; and (ii) the composition of products sold during the period. In determining changes in price we exclude the impact of price growth in Argentina and Venezuela as explained in USG above.

The relationship between USG, UVG and UPG is set out below:

    2018
    vs 2017
   2017
    vs 2016
 

Underlying volume growth (%)


1.9


0.8


Underlying price growth (%)(a)


0.9


2.3


Underlying sales growth (%)


2.9


3.1


(a)

For 2018 underlying price growth in Venezuela (from January 2018) and Argentina (from July 2018) has been excluded from underlying price in the table above and an equal and opposite adjustment made in the effect of exchange rates. For 2017 only Q4 price growth in Venezuela has been excluded.

Refer to page 21 for the relationship between USG, UVG and UPG for each of the categories.

NON-UNDERLYING ITEMS

Severalnon-GAAP measures are adjusted to exclude items defined asnon-underlying due to their nature and/or frequency of occurrence.

Non-underlying items within operating profit are: gains or losses on business disposals, acquisition and disposal related costs, restructuring costs, impairments and other significantone-off items within operating profit
Non-underlying items not in operating profit but within net profit are: significant and unusual items in net finance cost, monetary gain/(loss) arising from hyperinflationary economies, share of profit/(loss) of joint ventures and associates and taxation
Non-underlying items are bothnon-underlying items within operating profit and thosenon-underlying items not in operating profit but within net profit

Refer to note 3 for details ofnon-underlying items.

UNDERLYING EARNINGS PER SHARE

Underlying earnings per share (underlying EPS) is calculated as underlying profit attributable to shareholders’ equity divided by the diluted combined average number increasesof share units. In calculating underlying profit attributable to 510 malesshareholders’ equity, net profit attributable to shareholders’ equity is adjusted to eliminate thepost-tax impact ofnon-underlying items. This measure reflects the underlying earnings for each share unit of the Group.

Refer to note 7 on page 96 for reconciliation of net profit attributable to shareholders’ equity to underlying profit attributable to shareholders’ equity.

24Strategic ReportAnnual Report on Form 20-F 2018


UNDERLYING OPERATING PROFIT AND UNDERLYING OPERATING MARGIN

Underlying operating profit and 192 (27%) females. 38% (five outunderlying operating margin mean operating profit and operating margin before the impact of 13)non-underlying items within operating profit. Underlying operating profit represents our measure of segment profit or loss as it is the primary measure used for making decisions about allocating resources and assessing performance of the segments.

The reconciliation of operating profit to underlying operating profit is as follows:

    € million
2018
   million
2017


Operating profit


12,535


8,857


Non-underlying items within operating profit (see note 3)


(3,176


543


Underlying operating profit


9,359


9,400


Turnover


50,982


53,715


Operating margin


24.6


16.5


Underlying operating margin

   18.4  17.5

Further details ofnon-underlying items can be found in note 3 on page 85 of the consolidated financial statements.

UNDERLYING EFFECTIVE TAX RATE

The underlying effective tax rate is calculated by dividing taxation excluding the tax impact ofnon-underlying items by profit before tax excluding the impact ofnon-underlying items and share of net profit/(loss) of joint ventures and associates. This measure reflects the underlying tax rate in relation to profit before tax excludingnon-underlying items before tax and share of net profit/(loss) of joint ventures and associates. Tax impact onnon-underlying items within operating profit is the sum of the tax on eachnon-underlying item, based on the applicable country tax rates and tax treatment. This is shown in the following table:

    € million
2018
   million
2017


Taxation


2,575


1,667


Tax impact of:


Non-underlying items within operating profit(a)


(259


77


Non-underlying items not in operating profit but within net profit(a)


(29


578


Taxation before tax impact ofnon-underlying

   2,287   2,322 

Profit before taxation


12,383


8,153


Non-underlying items within operating profit before tax(a)


(3,176


543


Non-underlying items not in operating profit but within net profit before tax(b)


(122


382


Share of net (profit)/loss of joint ventures and associates


(185


(155


Profit before tax excludingnon-underlying items before tax and share of net profit/ (loss) of joint ventures and associates

   8,900   8,923 

Underlying effective tax rate


   25.7  26.0

(a)

Refer to note 3 for further details on these items.

(b)

2018 amount excludes32 million gain on disposal of spreads business by the joint venture in Portugal which is included in the share of net profit/(loss) of joint ventures and associates line. Including the32 million, totalnon-underlying items not in operating profit but within net profit before tax is154 million. See note 3.

CONSTANT UNDERLYING EARNINGS PER SHARE

Constant underlying earnings per share (constant underlying EPS) is calculated as underlying profit attributable to shareholders’ equity at constant exchange rates and excluding the impact of both translational hedges and price inflation in Venezuela (for the whole of 2018) and Argentina (from July 2018) divided by the diluted average number of ordinary shares. This measure reflects the underlying earnings for each ordinary share of the Group in constant exchange rates.

The reconciliation of underlying profit attributable to shareholders’ equity to constant underlying earnings attributable to shareholders’ equity and the calculation of constant underlying EPS is as follows:

    € million
2018
   million
2017


Underlying profit attributable to shareholders’ equity(a)


6,365


6,315


Impact of translation from current to constant exchange rates and translational hedges


7,112


95


Impact of Venezuela and Argentina price inflation(b)


(6,551


Constant underlying earnings attributable to shareholders’ equity


6,926


6,410


Diluted combined average number of share units (millions of units)


2,694.8


2,814.0


Constant underlying EPS ()


2.57


2.28


(a)

See note 7.

(b)

See pages 23 and 24 for further details.

From 2018, in our reporting of growth in constant underlying EPS, we translate the prior period using an annual average exchange rate rather than monthly averages. This change has been made to align with the prior period constant exchange rate used for calculating USG. The impact of this is an increase of0.01 per share in 2017 constant underlying EPS.

FREE CASH FLOW

Free cash flow (FCF) is defined as cash flow from operating activities, less income taxes paid, net capital expenditures and net interest payments and preference dividends paid. It does not represent residual cash flows entirely available for discretionary purposes; for example, the repayment of principal amounts borrowed is not deducted from FCF. FCF reflects an additional way of viewing our liquidity that we believe is useful to investors because it represents cash flows that could be used for distribution of dividends, repayment of debt or to fund our strategic initiatives, including acquisitions, if any.

The reconciliation of net profit to FCF is as follows:

    € million
2018
   million
2017


Net profit


9,808


6,486


Taxation


2,575


1,667


Share of net profit of joint ventures/associates and other income fromnon-current investments


(207


(173


Net monetary gain arising from hyperinflationary economies


(122


Net finance costs


481


877


Depreciation, amortisation and impairment


1,747


1,538


Changes in working capital


(793


(68


Pensions and similar obligations less payments


(128


(904


Provisions less payments


55


200


Elimination of (profits)/losses on disposals


(4,299


(298


Non-cash charge for share-based compensation


196


284


Other adjustments


(266


(153


Cash flow from operating activities


9,047


9,456


Income tax paid


(2,294


(2,164


Net capital expenditure


(1,424


(1,621


Net interest and preference dividends paid


(367


(316


Free cash flow


4,962


5,355


Net cash flow (used in)/from investing activities


4,644


(5,879


Net cash flow (used in)/from financing activities


(11,548


(1,433


Annual Report on Form 20-F 2018Strategic Report25


FINANCIAL REVIEWCONTINUED

RETURN ON ASSETS

Return on assets is a measure of the return generated on assets for each division. This measure provides additional insight on the performance of the divisions and assists in formulating long-term strategies with respect to allocation of capital, across divisions. Division return on assets is calculated as underlying operating profit after tax for the division divided by the annual average of: property, plant and equipment, net assets held for sale (excluding goodwill and intangibles), inventories, trade and other current receivables, and trade payables and other current liabilities, for each division. The annual average is computed by adding the amounts at the beginning and the end of the calendar year and dividing by two.

     € million     € million         € million       
     Beauty &     Foods &     Home         € million 
2018    Personal Care         Refreshment     Care     Total 

Underlying operating profit before tax


4,508


3,534


1,317


9,359


Tax on underlying operating profit


(1,159


(908


(338


(2,405

Underlying operating profit after tax


3,349


2,626


979


6,954


Property plant and equipment


3,631


4,783


1,933


10,347


Net assets held for sale


1


25


26


Inventories


1,737


1,761


803


4,301


Trade and other receivables


2,319


3,027


1,139


6,485


Trade payables and other current liabilities


(5,478


(5,984


(2,995


(14,457

Period end assets (net)


2,210


3,612


880


6,702


Average assets for the period (net)


2,178


3,830


799


6,807


Division return on assets


154


69


123


102

2017


Underlying Operating Profit before tax


4,375


3,737


1,288


9,400


Tax on underlying operating profit


(1,139


(972


(335


2,446


Underlying Operating Profit after tax


3,236


2,765


953


6,954


Property plant and equipment


3,520


5,104


1,787


10,411


Net assets held for sale


1


742


743


Inventories


1,590


1,637


735


3,962


Trade and other receivables


2,018


2,172


1,032


5,222


Trade payables and other current liabilities


(4,984


(5,606


(2,836


(13,426

Period end assets (net)


2,145


4,049


718


6,912


Average assets for the period (net)


2,122


4,201


778


7,101


Division return on assets


152


66


122


98

NET DEBT

Net debt is defined as the excess of total financial liabilities, excluding trade payables and other current liabilities, over cash, cash equivalents and other current financial assets, excluding trade and other current receivables. It is a measure that provides valuable additional information on the summary presentation of the Group’s net financial liabilities and is a measure in common use elsewhere.

The reconciliation of total financial liabilities to net debt is as follows:

    € million
2018
   million
2017
 

Total financial liabilities


(24,885


(24,430


Current financial liabilities


(3,235


(7,968

Non-current financial liabilities


(21,650


(16,462

Cash and cash equivalents as per balance sheet


3,230


3,317


Cash and cash equivalents as per cash flow statement


3,090


3,169


Add bank overdrafts deducted therein


140


167


Less cash and cash equivalents held for sale


(19

Other current financial assets


874


770


Net debt


(20,781


(20,343

RETURN ON INVESTED CAPITAL

Return on invested capital (ROIC) is a measure of the return generated on capital invested by the Group. The measure provides a guide rail for long-term value creation and encourages compounding reinvestment within the business and discipline around acquisitions with low returns and long payback. ROIC is calculated as underlying operating profit after tax divided by the annual average of: goodwill, intangible assets, property, plant and equipment, net assets held for sale, inventories, trade and other current receivables, and trade payables and other current liabilities.

    € million
2018
   million
2017
 

Underlying operating profit before tax(a)


9,359


9,400


Tax on underlying operating profit(b)


(2,405


(2,446

Underlying operating profit after tax


6,954


6,954


Goodwill


17,341


16,881


Intangible assets


12,152


11,520


Property, plant and equipment


10,347


10,411


Net assets held for sale


108


3,054


Inventories


4,301


3,962


Trade and other current receivables


6,485


5,222


Trade payables and other current liabilities


(14,457


(13,426

Period-end invested capital


36,277


37,624


Average invested capital for the period


36,951


36,222


Return on average invested capital


18.8


19.2

(a)

See reconciliation of operating profit to underlying operating profit on page 25.

(b)

Tax on underlying operating profit is calculated as underlying operating profit before tax multiplied by underlying effective tax rate of 25.7% (2017: 26.0%) which is shown on page 25.

26Strategic ReportAnnual Report on Form 20-F 2018


RISKS

OUR RISK APPETITE AND APPROACH

TO RISK MANAGEMENT

Risk management is integral to Unilever’s strategy and to the achievement of Unilever’s long-term goals. Our success as an organisation depends on our ability to identify and exploit the opportunities generated by our business and the markets we are in. In doing this we take an embedded approach to risk management which puts risk and opportunity assessment at the core of the Board agenda, which is female, comparedwhere we believe it should be.

Unilever adopts a risk profile that is aligned to our vision to grow our business, while decoupling our environmental footprint from our growth and increasing our positive social impact. Our appetite for risk is driven by the following:

Our growth should be consistent, competitive, profitable and responsible.
Our behaviours must be in line with 43% (sixour Code of Business Principles and Code Policies.
We strive to continuously improve our operational efficiency and effectiveness.
We aim to maintain a single A credit rating on a long-term basis.

Our approach to risk management is designed to provide reasonable, but not absolute, assurance that our assets are safeguarded, the risks facing the business are being assessed and mitigated and all information that may be required to be disclosed is reported to Unilever’s senior management including, where appropriate, the Chief Executive Officer and Chief Financial Officer.

ORGANISATION

The Boards assume overall accountability for the management of risk and for reviewing the effectiveness of Unilever’s risk management and internal control systems.

The Boards have established a clear organisational structure with well defined accountabilities for the principal risks that Unilever faces in the short, medium and long term. This organisational structure and distribution of accountabilities and responsibilities ensure that every country in which we operate has specific resources and processes for risk reviews and risk mitigation. This is supported by the Unilever Leadership Executive, which takes active responsibility for focusing on the principal areas of risk to Unilever. The Boards regularly review these risk areas, including consideration of environmental, social and governance matters, and retain responsibility for determining the nature and extent of the significant risks that Unilever is prepared to take to achieve its strategic objectives.

FOUNDATION AND PRINCIPLES

Unilever’s approach to doing business is framed by our Purpose and values (see page 1). Our Code of Business Principles sets out the standards of 14)behaviour that we expect all employees to adhere to.Day-to-day responsibility for ensuring these principles are applied throughout Unilever rests with senior management across categories, geographies and functions. A network of Business Integrity Officers and Committees supports the activities necessary to communicate the Code, deliver training, maintain processes and procedures (including support lines) to report and respond to alleged breaches, and to capture and communicate learnings.

We have a framework of Code Policies that underpins the Code of Business Principles and set out thenon-negotiable standards of behaviour expected from all our employees.

For each of our principal risks we have a risk management framework detailing the controls we have in 2016. Ofplace and who is responsible for managing both the overall risk and the individual controls mitigating that risk.

Unilever’s functional standards define mandatory requirements across a range of specialist areas such as health and safety, accounting and reporting and financial risk management.

PROCESSES

Unilever operates a wide range of processes and activities across all its operations covering strategy, planning, execution and performance management. Risk management is integrated into every stage of this business cycle. These procedures are formalised and documented and are increasingly being centralised and automated into transactional and other information technology systems.

ASSURANCE ANDRE-ASSURANCE

Assurance on compliance with the Code of Business Principles and all of our Code Policies is obtained annually from Unilever management via a formal Code declaration. In addition, there are specialist awareness and training programmes which are run throughout the year and vary depending on the business priorities. These specialist compliance programmes supplement the Code declaration. Our Corporate Audit function plays a vital role in providing to both management and the Boards an objective and independent review of the effectiveness of risk management and internal control systems throughout Unilever.

BOARDS’ ASSESSMENT OF COMPLIANCE WITH THE RISK MANAGEMENT FRAMEWORKS

The Boards, advised by the Committees where appropriate, regularly review the significant risks and decisions that could have a material impact on Unilever. These reviews consider the level of risk that Unilever is prepared to take in pursuit of the business strategy and the effectiveness of the management controls in place to mitigate the risk exposure.

The Boards, through the Audit Committee, have reviewed the assessment of risks, internal controls and disclosure controls and procedures in operation within Unilever. They have also considered the effectiveness of any remedial actions taken for the year covered by this Annual Report and Accounts and up to the date of its approval by the Boards.

Details of the activities of the Audit Committee in relation to this can be found in the Report of the Audit Committee on pages 43 to 45.

Further statements on compliance with the specific risk management and control requirements in the Dutch Corporate Governance Code, the UK Corporate Governance Code, the US Securities Exchange Act (1934) and the Sarbanes-Oxley (2002) Act can be found on pages 41 and 42.

Annual Report on Form 20-F 2018Strategic Report27


RISKSCONTINUED

VIABILITY STATEMENT

The Directors have reviewed the long-term prospects of the Group in order to assess its viability. This review incorporated the activities and key risks of the Group together with the factors likely to affect the Group’s future development, performance, financial position, cash flows, liquidity position and borrowing facilities as described on pages 1 to 26. In addition, we describe in notes 15 to 18 on pages 104 to 120 the Group’s objectives, policies and processes for managing its capital, its financial risk management objectives, details of its financial instruments and hedging activities and its exposures to credit and liquidity risk.

ASSESSMENT

In order to report on the long-term viability of the Group, the Directors reviewed the overall funding capacity and headroom available to withstand severe events and carried out a robust assessment of the principal risks facing the Group, including those that would threaten its business model, future performance, solvency or liquidity. The assessment assumes that any debt maturing in the next three years can bere-financed at commercially acceptable terms or via our current standby facility. This assessment also included reviewing and understanding the mitigation factors in respect of each of those risks. The risk factors are summarised on pages 29 to 33.

The viability assessment has two parts:

First, the Directors considered the period over which they have a reasonable expectation that the Group will continue to operate and meet its liabilities, taking into account current debt facilities and debt headroom; and

Second, they considered the potential impact of severe but plausible scenarios over this period, including:

assessing scenarios for each individual principal risk, for example the termination of our relationships with the three largest global customers; the loss of all material litigation cases; a major IT data breach and the lost cost and growth opportunities from not keeping up with technological changes; and

assessing scenarios that involve more than one principal risk including the following multi risk scenarios:

Multi risk

scenarios modelled

Level of

severity reviewed

Link to

principal risk

Contamination issue with one of our products leading to lower sales of products of this brand and the temporary closure of our largest sourcing unit.

A fine equal to 1% of Group turnover was considered along with damage to our largest brand and disruption to supply chain.

•  Safe and high-quality products

•  Brand preference

•  Supply chain

Major global incident affecting one or more of the Group’s key locations resulting in an outage for a year in a key sourcing unit and significant water shortages in our key developing markets.

The complete loss of all of our turnover in our largest geographic market was considered along with destruction of a key sourcing unit and reduced demand for our products that require water.

•  Economic and political instability

•  Supply chain

•  Climate change

Global economic downturn leading to an increase in funding costs and the loss of our three largest customers.Significant business disruption in our largest emerging market was considered with the impact of losing our three key customers.

•  Economic and political instability

•  Treasury and pensions

•  Customer relationships

FINDINGS

���

Firstly, a three-year period is considered appropriate for this viability assessment because it is the period covered by the strategic plan; and it enables a high level of confidence in assessing viability, even in extreme adverse events, due to a number of factors such as:

the Group has considerable financial resources together with established business relationships with many customers and suppliers in countries throughout the world;

high cash generation by the Group’s operations and access to the external debt markets;

flexibility of cash outflow with respect to significant marketing programmes and capital expenditure projects which usually have a2-3 year horizon; and

the Group’s diverse product and geographical activities which are impacted by continuously evolving technology and innovation.

Secondly, for each of our 14 principal risks, worst case plausible scenarios have been assessed together with multiple risk scenarios. None of the scenarios reviewed, either individually or in aggregate would cause Unilever to cease to be viable.

CONCLUSION

On the basis described above, the Directors have a reasonable expectation that the Group will be able to continue in operation and meet its liabilities as they fall due over the three-year period of their assessment.

PRINCIPAL RISK FACTORS

Our business is subject to risks and uncertainties. On the following pages we have identified the risks that we regard as the most relevant to our business. These are the risks that we see as most material to Unilever’s business and performance at this time. There may be other risks that could emerge in the future.

All the principal risks could impact our business within the next two years (ie short-term risks), or could impact our business over the next three to five years (ie medium-term risks). Some principal risks, such as climate change, could also impact over the longer term (ie beyond five years).

Our principal risks have not fundamentally changed this year apart from the addition of a plastic packaging risk. Given the nature of our business, a reduction in the amount of plastic packaging and increase in the use of recyclable content in our packaging is critical to our future success.

28Strategic ReportAnnual Report on Form 20-F 2018


As well as identifying the most relevant risks for our business we reflect on whether we think the level of risk associated with each of our principal risks is increasing or decreasing. In addition to our plastic packaging risk there are three areas where we believe there is an increased level of risk:

Customer Relationships: technology is changing our channel landscape and hence changing the nature of the relationships with our traditional customers as well as requiring us to develop relationships with new customers who are drivinge-commerce development;

Systems and Information: the number of cybersecurity attacks is still increasing significantly, and incidents are becoming more sophisticated as technology further evolves; and

Business Transformation: this risk has increased as a result of the speed of technological change which means the pressure to digitalise our business to take advantage of the opportunities it presents, both in terms of growth and cost efficiency, is increasing.

If the circumstances in these risks occur or are not successfully mitigated, our cash flow, operating results, financial position, business and reputation could be materially adversely affected. In addition, risks and uncertainties could cause actual results to vary from those described, which may include forward-looking statements, or could impact on our ability to meet our targets or be detrimental to our profitability or reputation.

DESCRIPTION OF RISK

BRAND PREFERENCE

As a branded goods business, Unilever’s success depends on the value and relevance of our brands and products to consumers around the world and on our ability to innovate and remain competitive.

Consumer tastes, preferences and behaviours are changing more rapidly than ever before, and Unilever’s ability to identify and respond to these changes is vital to our business success.

Technological change is disrupting our traditional brand communication models. Our ability to develop and deploy the right communication, both in terms of messaging content and medium is critical to the continued strength of our brands.

We are dependent on creating innovative products that continue to meet the needs of our consumers and getting these new products to market with speed. If we are unable to innovate effectively, Unilever’s sales or margins could be materially adversely affected.

PORTFOLIO MANAGEMENT

Unilever’s strategic investment choices will affect the long-term growth and profits of our business.

Unilever’s growth and profitability are determined by our portfolio of categories, geographies and channels and how these evolve over time. If Unilever does not make optimal strategic investment decisions, then opportunities for growth and improved margin could be missed.

SUSTAINABILITY

The success of our business depends on finding sustainable solutions to support long-term growth.

Unilever’s vision to grow our business, while decoupling our environmental footprint from our growth and increasing our positive social impact, will require more sustainable ways of doing business. In a world where resources are scarce and demand for them continues to increase, it is critical that we succeed in reducing our resource consumption and converting to sustainably sourced supplies. In doing this we are dependent on the efforts of partners and various certification bodies. We are also committed to improving health and well-being and enhancing livelihoods around the world so Unilever and our communities grow successfully together. There can be no assurance that sustainable business solutions will be developed and failure to do so could limit Unilever’s growth and profit potential and damage our corporate reputation.

Annual Report on Form 20-F 2018Strategic Report29


RISKSCONTINUED

DESCRIPTION OF RISK

CLIMATE CHANGE

Climate changes and governmental actions to reduce such changes may disrupt our operations and/or reduce consumer demand for our products.

Climate changes are occurring around the globe which may impact our business in various ways. They could lead to water shortages which would reduce demand for those of our products that require a significant amount of water during consumer use. They could also lead to an increase in raw material and packaging prices or reduced availability. Governments may take action to reduce climate change such as the introduction of a carbon tax or zero net deforestation requirements which could impact our business through higher costs or reduced flexibility of operations.

Increased frequency of extreme weather (storms and floods) could cause increased incidence of disruption to our manufacturing and distribution network. Climate change could result therefore in making products less affordable or less available for our consumers resulting in reduced growth and profitability.

PLASTIC PACKAGING

A reduction in the amount of plastic and an increase in the use of recyclable content in our packaging is critical to our future success.

Both consumer and customer responses to the environmental impact of plastic waste and emerging regulation by governments to tax or ban the use of certain plastics requires us to find solutions to reduce the amount of plastic we use; increase recycling post-consumer use; and to source recycled plastic for use in our packaging. We are also dependent on the work of our industry partners to create and improve recycling infrastructures throughout the globe.

Not only is there a risk around finding appropriate replacement materials, due to high demand the cost of recycled plastic or other alternative packaging materials could significantly increase in the foreseeable future and this could impact our business performance. We could also be exposed to higher costs as a result of taxes or fines if we are unable to comply with plastic regulations which would again impact our profitability and reputation.

CUSTOMER RELATIONSHIPS

Successful customer relationships are vital to our business and continued growth.

Maintaining strong relationships with our existing customers and building relationships with new customers who have built new technology-enabled business models to serve changing shopper habits are necessary to ensure our brands are well presented to our consumers and available for purchase at all times.

The strength of our customer relationships also affects our ability to obtain pricing and competitive trade terms. Failure to maintain strong relationships with customers could negatively impact our terms of business with affected customers and reduce the availability of our products to consumers.

30Strategic ReportAnnual Report on Form 20-F 2018


DESCRIPTION OF RISK

TALENT

A skilled workforce and agile ways of working are essential for the continued success of our business.

Our ability to attract, develop and retain the right number of appropriately qualified people is critical if we are to compete and grow effectively.

This is especially true in our key emerging markets where there can be a high level of competition for a limited talent pool. The loss of management or other key personnel or the inability to identify, attract and retain qualified personnel could make it difficult to manage the business and could adversely affect operations and financial results.

SUPPLY CHAIN

Our business depends on purchasing materials, efficient manufacturing and the timely distribution of products to our customers.

Our supply chain network is exposed to potentially adverse events such as physical disruptions, environmental and industrial accidents, trade restrictions or disruptions at a key supplier, which could impact our ability to deliver orders to our customers.

The cost of our products can be significantly affected by the cost of the underlying commodities and materials from which they are made. Fluctuations in these costs cannot always be passed on to the consumer through pricing.

Changes in trade relationships between Europe and the UK as a result of Brexit could give rise to both a supply and cost issue.

SAFE AND HIGH QUALITY PRODUCTS

The quality and safety of our products are of paramount importance for our brands and our reputation.

The risk that raw materials are accidentally or maliciously contaminated throughout the supply chain or that other product defects occur due to human error, equipment failure or other factors cannot be excluded.

SYSTEMS AND INFORMATION

Unilever’s operations are increasingly dependent on IT systems and the management of information.

The cyber-attack threat of unauthorised access and misuse of sensitive information or disruption to operations continues to increase. Such an attack could inhibit our business operations in a number of ways, including disruption to sales, production and cash flows, ultimately impacting our results.

In addition, increasing digital interactions with customers, suppliers and consumers place ever greater emphasis on the need for secure and reliable IT systems and infrastructure and careful management of the information that is in our possession to ensure data privacy.

Annual Report on Form 20-F 2018Strategic Report31


RISKSCONTINUED

DESCRIPTION OF RISK

BUSINESS TRANSFORMATION

Successful execution of business transformation projects is key to delivering their intended business benefits and avoiding disruption to other business activities.

Unilever is continually engaged in major change projects, including acquisitions, disposals and organisational transformation, to drive continuous improvement in our business and to strengthen our portfolio and capabilities. A number of key projects were announced in 2017 to accelerate sustainable shareholder value creation. Failure to execute such initiatives successfully could result in under-delivery of the expected benefits and there could be a significant impact on the value of the business.

Continued digitalisation of our business models and processes together with enhancing data management capabilities is a critical part of our transformation. Failure to keep pace with such technological change would significantly impact our growth and profitability.

ECONOMIC AND POLITICAL INSTABILITY

Unilever operates around the globe and is exposed to economic and political instability that may reduce consumer demand for our products, disrupt sales operations and/or impact the profitability of our operations.

Adverse economic conditions may affect one or more countries within a region, or may extend globally.

Government actions such as foreign exchange or price controls can impact on the growth and profitability of our local operations.

Unilever has more than half its turnover in emerging markets which can offer greater growth opportunities but also expose Unilever to related economic and political volatility.

TREASURY AND PENSIONS

Unilever is exposed to a variety of external financial risks in relation to Treasury and Pensions.

The relative values of currencies can fluctuate widely and could have a significant impact on business results. Further, because Unilever consolidates its financial statements in euros it is subject to exchange risks associated with the translation of the underlying net assets and earnings of its foreign subsidiaries.

We are also subject to the imposition of exchange controls by individual countries which could limit our ability to import materials paid in foreign currency or to remit dividends to the parent company.

Unilever may face liquidity risk, ie difficulty in meeting its obligations, associated with its financial liabilities. A material and sustained shortfall in our cash flow could undermine Unilever’s credit rating, impair investor confidence and also restrict Unilever’s ability to raise funds.

We are exposed to market interest rate fluctuations on our floating rate debt. Increases in benchmark interest rates could increase the interest cost of our floating rate debt and increase the cost of future borrowings.

In times of financial market volatility, we are also potentially exposed to counter-party risks with banks, suppliers and customers.

Certain businesses have defined benefit pension plans, most now closed to new employees, which are exposed to movements in interest rates, fluctuating values of underlying investments and increased life expectancy. Changes in any or all of these inputs could potentially increase the cost to Unilever of funding the schemes and therefore have an adverse impact on profitability and cash flow.

32Strategic ReportAnnual Report on Form 20-F 2018


DESCRIPTION OF RISK

ETHICAL

Acting in an ethical manner, consistent with the expectations of customers, consumers and other stakeholders, is essential for the protection of the reputation of Unilever and its brands.

Unilever’s brands and reputation are valuable assets and the way in which we operate, contribute to society and engage with the world around us is always under scrutiny both internally and externally. Despite the commitment of Unilever to ethical business and the steps we take to adhere to this commitment, there remains a risk that activities or events cause us to fall short of our desired standard, resulting in damage to Unilever’s corporate reputation and business results.

LEGAL AND REGULATORY

Compliance with laws and regulations is an essential part of Unilever’s business operations.

Unilever is subject to national and regional laws and regulations in such diverse areas as product safety, product claims, trademarks, copyright, patents, competition, employee health and safety, data privacy, the environment, corporate governance, listing and disclosure, employment and taxes.

Failure to comply with laws and regulations could expose Unilever to civil and/or criminal actions leading to damages, fines and criminal sanctions against us and/or our employees with possible consequences for our corporate reputation.

Changes to laws and regulations could have a material impact on the cost of doing business. Tax, in particular, is a complex area where laws and their interpretation are changing regularly, leading to the risk of unexpected tax exposures. International tax reform remains a key focus of attention with the OECD’s Base Erosion & Profit Shifting project and further potential tax reform in the EU and Switzerland.

IN FOCUS: CLIMATE CHANGE RISKS AND OPPORTUNITIES

UNILEVER HAS PUBLICLY COMMITTED TO IMPLEMENTING THE RECOMMENDATIONS OF THE TASK FORCE ON CLIMATE-RELATED FINANCIAL DISCLOSURES.

Unilever recognises the importance of disclosing climate-related risks and opportunities. Adopting the Taskforce on Climate-Related Financial Disclosures (TCFD) recommendations is an important step forward in enabling market forces to drive efficient allocation of capital and support a smooth transition to alow-carbon economy.

In this Annual Report and Accounts, we continue to integrate climate-related disclosures throughout the Strategic Report narrative. However, in recognition of the growing significance of the impacts of climate change on our business, we have also summarised the risks and opportunities arising from climate change, and our response below.

The Boards take overall accountability for the management of climate change risks and opportunities with support from the ULE and the USLP Steering Team (see page 46). Chaired by Keith Weed in 2018, the USLP Steering Team includes nine members of the ULE and meets five times a year. During 2018, there were numerous agenda items on topics related to climate change including our overall climate strategy and our renewable electricity target.

For management employees (including the ULE), incentives include fixed pay, a bonus as a percentage of fixed pay and a long-term managementco-investment plan (MCIP) linked to financial and USLP performance. The USLP component accounts for 25% of total MCIP award. The sustainability component of MCIP includes consideration of our progress against climate change, water and palm oil targets, which among others, underpin our climate strategy. See pages 52 to 54 for more on MCIP.

UNDERSTANDING IMPACT

Climate change has been identified as a principal risk to Unilever which has the potential to impact our business in the short, medium and long-term. Further details on the nature of climate risks and opportunities for Unilever can be found in our 2018 CDP Climate submission (see further climate change disclosures on pages 7 and 14).

To further understand the impact that climate change could have on Unilever’s business we performed a high-level assessment of the impact of 2°C and 4°C global warming scenarios. The 2°C and 4°C scenarios are constructed on the basis that average global temperatures will have increased by 2°C and 4°C in the year 2100.

Between today and 2100 there will be gradual changes towards these endpoints and we have looked at the impact on our business in 2030 assuming we have the same business activities as we do today. We also made the following simplifying assumptions:

In the 2°C scenario, we assumed that in the period to 2030 society acts rapidly to limit greenhouse gas emissions and puts in place measures to restrain deforestation and discourage emissions (for example implementing carbon pricing at$75-$100 per tonne, taken from the International Energy Agency’s 450 scenario). We have assumed that there will be no significant impact to our business from the physical ramifications of climate change by 2030 – ie from greater scarcity of water or increased impact of severe weather events. The scenario assesses the impact on our business from regulatory changes.
In the 4°C scenario, we assumed climate policy is less ambitious and emissions remain high so the physical manifestations of climate change are increasingly apparent by 2030. Given this we have not included impacts from regulatory restrictions but focus on those resulting from the physical impacts.

Annual Report on Form 20-F 2018Strategic Report33


We identified the material impacts on Unilever’s business arising from each of these scenarios based on existing internal and external data. The impacts were assessed without considering any actions that Unilever might take to mitigate or adapt to the adverse impacts or to introduce new products which might offer new sources of revenue as consumers adjust to the new circumstances.

The main impacts of the 2°C scenario were as follows:

Carbon pricing is introduced in key countries and hence there are increases in both manufacturing costs and the costs of raw materials such as dairy ingredients and the metals used in packaging.
Zero net deforestation requirements are introduced and a shift to sustainable agriculture puts pressure on agricultural production, raising the price of certain raw materials.

The main impacts of the 4°C scenario were as follows:

Chronic and acute water stress reduces agricultural productivity in some regions, raising prices of raw materials.
Increased frequency of extreme weather (storms and floods) causes increased incidence of disruption to our manufacturing and distribution networks.
Temperature increase and extreme weather events reduce economic activity, GDP growth and hence sales levels fall.

Our analysis shows that, without action, both scenarios present financial risks to Unilever by 2030, predominantly due to increased costs. However, while there are financial risks which would need to be managed, we would not have to materially change our business model. The most significant impacts of both scenarios are on our supply chain where costs of raw materials and packaging rise, due to carbon pricing and rapid shift to sustainable agriculture in a 2°C scenario and due to chronic water stress and extreme weather in a 4°C scenario. The impacts on sales and our own manufacturing operations are relatively small.

The results of this analysis confirm the importance of doing further work to ensure that we understand the critical dependencies of climate change on our business and to ensure we have action plans in place to help mitigate these risks and thus prepare the business for the future environment in which we will operate.

During 2018 we developed and piloted an approach to assess the impact of climate change on our key commodities. We selected soy for this pilot based on its importance to Unilever (large purchased volume), it being ahigh-profile crop in the countries where it is grown and the availability of good historical price data and suitable climate models.

We developed a methodology which combined forecasting future yields and quantifying the impact on commodity prices of soybean oil. Climate change was the only price factor accounted for in the model used to calculate the impact. Other factors which impact price, such as technology and acreage, were excluded. The model considered the direct risks from climate change to the price of soybean oil, such as change in yield and change in supply. Three modelling steps were performed:

Yield estimation: We analysed multiple agriculture and climate models to provide a forecast range of expected yields in key growing regions.
Price relationship: An econometric model was developed, based on an analysis of the soybean oil market and historical trends, to estimate the impact of climate-induced yield changes on future prices. This model considered the importance ofco-products eg soybean meal, substitution potential eg with sunflower oil and industrial uses of soybean oil, as well as the impact of yield on price.
Impact estimation: Future yields and price impacts were then translated into an estimated financial exposure from climate change for our business, using our forecast procurement volumes.

Our pilot analysis showed that soybean yields may increase over the 2030 and 2050-time horizon and that subsequent lower prices may then lead to small potential reductions in our procurement spend on soy. While the results may indicate a low financial risk to our business, we would need to consider a wider range of risk factors when determining our strategic response. Indirect risks from climate change, such as catastrophic events or external policy response and adaptation could also have an impact but were not included in our modelling. Furthermore, these pilot results are

specific to soy and can’t be applied to other crops. We have therefore decided to get broader understanding on the climate change risks to our agricultural sourcing and extend our analysis to two other important crops to Unilever: Palm Oil and Tea, for which suitable climate change models for yield predictions will be available in 2019.

RESPONDING TO RISKS AND OPPORTUNITIES

Unilever’s vision is to grow our business whilst decoupling our growth from our environmental footprint and increasing positive social impact. This vision explicitly recognises that sustainable growth – including management of climate-related risks and opportunities – is the only way to create long-term value for all our stakeholders.

The Unilever Sustainable Living Plan (USLP) was developed to deliver our vision. It is fully integrated with our business strategy. Climate-related issues are integral to the USLP. Two of our GHG reduction targets included in the USLP are recognised as science-based:

Halve the greenhouse gas impact of our products across the lifecycle by 2030 (this target covers all the phases across the lifecycle of our products: ingredients/raw materials, manufacturing, distribution, retail, packaging, consumer use and disposal)
Reduce scope 1 and 2 greenhouse gas emissions by 100% from our own operations by 2030 (this is part of our ambition to be become carbon positive in our manufacturing by 2030)

We are taking action across our value chain to reduce our emissions, creating growth opportunities and minimising risk. Our commitment to source 100% of our palm oil from sustainable sources is helping to avoid emissions from deforestation (see pages 14 and 47). Our efforts to reduce energy and GHG emissions in manufacturing are helping us to save costs. For example, by using less energy, we have already avoided energy costs in our factories of over600 million since our baseline year of 2008.

Our divisions are taking action to reduce emissions. In Home Care we are focusing on concentrated liquid laundry detergents such as Persil, Omo and Surf Small & Mighty which help consumers to wash clothes at lower temperatures, reducing GHG by up to 50% per load. We have removed phosphates from all laundry powders worldwide, resulting in lower greenhouse gas emissions of up to 50% per consumer use. Our Foods & Refreshment division has prioritised reducing greenhouse gas emissions from ice cream freezers since 2008. As the world’s largest producer of ice cream, we have committed to accelerating theroll-out of freezer cabinets that use more climate-friendly natural (hydrocarbon) refrigerants. By 2018 our total workforcepurchase of 160,566, 107,064 (67%) were malethese cabinets had increased to around 2.9 million.

Detailed Lifecycle Analysis has shown that our GHG contribution from animal-based agriculture, including fats and 53,502 (33%) were femaleproteins, is relatively low: 7.5% for Foods & Refreshment and 2.5% for total Unilever. While emissions are comparatively low, the business opportunity is significant for natural and plant-based foods and beverages. We have a range of vegan and vegetarian variants such as Hellmann’s vegan mayonnaise, Ben & Jerry’snon-dairy ice creams, Magnum vegan and other options (see pages 11 to 12). We continue to actively promote vegetarian and vegan recipes, notably via our Knorr brand websites.

A number of our targets directly address risks and opportunities related to water scarcity caused by climate change. We estimate that the sale of products which address water scarcity issues could increase in our Home Care and Beauty & Personal Care divisions where a number of products are available which address water scarcity and/ or have a lower GHG in use. For example, our Beauty & Personal Care division is investing in water smart product innovations such as dry shampoo and cleansing conditioner which help consumers use less water while also offering relevant benefits such as reduced colour loss and damage which can arise from frequent washing. Home Care is combining insights in consumer behaviour and water consumption with innovative technology to develop new market opportunities, launching products and formulations that address water scarcity and help our consumers save water. Day2, the world’s first dry wash spray is made with only 0.02% of the water in a normal laundry load. Sunlight2-in-1 Handwashing Laundry Powder and Rin (Radiant) detergent bar are also helping to reduce water consumption at point of use in water-stressed countries.

34Strategic ReportAnnual Report on Form 20-F 2018


Home Care is home to three brands, Pureit, Truliva/Qinyuan and Blueair, which are responding directly to issues related to climate change. Pureit and Truliva, our water purification businesses, offer products which provide safe drinking water to millions of people with a lower carbon footprint than alternatives. Our detailed lifecycle analysis shows that Pureit’s total carbon footprint is at least 80% lower than boiled or bottled water. Blueair, our indoor air purification business acquired in 2016, removes contaminants from the air, including hazardous sooty particles associated with the combustion of fossil fuels.

Several other targets in our USLP indirectly address climate risk and opportunities by aiming to support groups who are vulnerable to the effects of climate change and who are critical to our future growth, notably smallholder farmers and women in low income countries.

Unilever continues to support a number of policy measures to accelerate the transition to alow-carbon economy, including the pricing of carbon and removal of fossil fuel subsidies which act as negative carbon prices. We believe that carbon pricing is a fundamental part of the global response to climate change and without it, the world is unlikely to meet its greenhouse gas reduction targets. We have publicly supported calls for carbon pricing and are members of The Carbon Pricing Leadership Coalition, hosted by the World Bank. In 2016, we implemented an internal price on carbon as part of the business case appraisal for large capital expenditure projects. The carbon price is also applied to emissions from our manufacturing sites to raise a clean-tech fund. So far,73 million has been allocated to this fund for energy and water saving projects. In January 2018 the price of carbon was40 per tonne.

MEASURING AND REPORTING

We have been measuring and reporting on our energy and water consumption and carbon emissions since 1995. The USLP includes a number of stretching targets which relate to climate risks and opportunities across our value chain. Performance against key targets can be found on page 7 with commentary on page 13 and 14. Our website contains detailed commentary on our USLP targets as well as actions we are taking to achieve them.

Our ability to meet our climate-related targets partly depends on changes in the energy markets worldwide, such as the rate of installation of renewable electricity in many countries. We have a role to play as an industry leader to help shape those markets. We are working collaboratively with partners, suppliers and others to achieve our ambition.

We’ve created a detailed plan to annually assess the feasibility for Unilever to reach our target to halve the greenhouse gas impact of our products across the lifecycle by 2030, taking both external transitions towards alow-carbon economy as well as the latest available data and assumptions about our GHG footprint into account. The basis of this plan is the set of around 2,800 products representative of our global portfolio across all divisions for which we have full value-chain lifecycle analysis results.

We recalculated the footprint of these products using the latest 2030 projections on external transitions to alow-carbon economy (eg International Energy Agency 2030 projection on grid changes to renewable energy),low-carbon transition plans in our operations (eg achieving zero net deforestation by 2020, using 100% renewable energy by 2020) and Innovation Roadmaps (eg redesign for lower embedded carbon emissions, transforming the temperature-controlled supply chain).

In line with the Large and Medium sized Companies and Groups (Accounts and Reports) Regulations 2008 as amended by the Companies Act 2006 (Strategic Report and Directors’ Report) Regulations 2013 our greenhouse gas (GHG) emissions are set out below. For Scope 1 and 2 we report our CO2 emissions only but not other GHG emissions as these are considered to be not material. For Scope 3 we report our GHG emissions (eg CO2, CH4, N2O) in terms of CO2 equivalents.

We report our emissions with reference to the latest Greenhouse Gas Protocol Corporate Accounting and Reporting Standard (GHG Protocol) to calculate emissions of carbon dioxide from the combustion of fuels and the operation of facilities (Scope 1) and from purchased electricity, heat, steam and cooling (Scope 2, market-based method). Each year PwC assure selected manufacturing environmental metrics including carbon emissions from energy use and energy use per tonne of production.

The GHG data below relates to emissions during the12-month period from 1 October to 30 September. This period is different from the Strategic Report, Directors’ Report and Financial Statements which are calendar year.

UNILEVER GREENHOUSE GAS EMISSIONS BY ACTIVITY^

    2018   2017 
Manufacturing (scope 1 and 2)    

Scope 1 (tonnes CO2)

   711,875    773,856 

Scope 2* (tonnes CO2)

   726,167    793,472 

Total Scope 1 & 2* (tonnes CO2)

   1,438,042    1,567,328 

Intensity ratio (kg CO2 per tonne of production)

   70.46    76.77 
Distribution centres, research laboratories, marketing and sales offices (scope 1 and 2)


Scope 1 (tonnes CO2)

   20,052    20,039 

Scope 2* (tonnes CO2)

   100,924    102,292 

Total Scope 1 & 2* (tonnes CO2)

   120,976    122,331 
Upstream and downstream of Unilever operations
– top 3 emissions sources (scope 3)


Consumer use


(downstream) (tonnes CO2e)q

   39,895,946    38,697,432 

Ingredients and packaging


    (upstream) (tonnes CO2e)

   14,985,897    15,000,941 

Distribution and retail


    (downstream) (tonnes CO2e)LOGO

   4,368,626    3,895,589 

^

Carbon emission factors are used to convert energy used in our operations to emissions of CO2. Carbon emission factors for fuels are provided by the Intergovernmental Panel on Climate Change (IPCC).

+

For manufacturing we have selected an intensity ratio based on production. This aligns with our long-standing reporting of manufacturing performance. Emissions from the combustion of biogenic fuels (biomass, fuel crops etc) within our operations are reported separately to other Scope 1 and 2 emissions, as recommended by the GHG Protocol, and excluded from our intensity ratio calculation. The data also excludes Scope 3 emissions (including consumer use of our products) which we report as part of our Unilever Sustainable Living Plan.

*

Carbon emission factors for grid electricity calculated according to the ‘market-based method’ are supplier-specific emissions factors reflecting contractual arrangements with electricity suppliers. Where supplier-specific emissions factors are not available, carbon emissions factors reflect the country where each operation is located and are provided by the International Energy Agency (IEA).

q

We measure the full GHG footprint of our product portfolio and annual sales using an LCA method compliant with the ISO 14040 standard. We measure the consumer use phase using a combination of primary habits data and on pack recommendations of use combined with lifecycle inventory data. We measure a representative sample of products across 14 countries which account for around60-70% of our annual sales volume.

We use a combination of external lifecycle inventory databases (secondary data) and supplier specific data (primary data eg for surfactants, perfumes and some of food ingredients) to measure the GHG emissions of purchased ingredients and packaging materials used in the production of our products.

LOGO

Downstream distribution is calculated using average distances and modes of transport derived from data collected from our distribution network and logistic providers.

FURTHER CLIMATE CHANGE DISCLOSURES

This Annual Report and Accounts contains additional disclosures on our climate change risks and opportunities:

Governance and remuneration: pages 46 to 47 and 52 to 54
Strategy for climate change: page 14
Risk management: page 30
Metrics and targets: pages 7 and 13 to 14

Our website contains disclosures on our greenhouse gas and water USLP targets.

LOGOwww.unilever.com/sustainable-living/our-sustainable-living-report-hub

Our CDP Climate submission contains extensive disclosure on our climate risks, opportunities, impacts and mitigating actions (password required).

LOGOwww.cdp.net

Annual Report on Form 20-F 2018Strategic Report35


GOVERNANCE REPORT

CORPORATE GOVERNANCE

UNILEVER’S STRUCTURE

Since its formation in 1930, the Unilever Group has operated as nearly as practicable as a single economic entity. This is achieved by special provisions in the Articles of Association of NV and PLC, together with a series of agreements between NV and PLC which are together known as the Foundation Agreements (described below). These agreements enable Unilever to achieve unity of management, operations, shareholders’ rights, purpose and mission and can be found on our website.

The Equalisation Agreement makes the economic position of the shareholders of NV and PLC, as far as possible, the same as if they held shares in a single company and also regulates the mutual rights of the shareholders of NV* and PLC. Under this agreement, NV and PLC must adopt the same financial periods and accounting policies.

The Deed of Mutual Covenants provides that NV and PLC and their respective subsidiary companies shallco-operate in every way for the purpose of maintaining a common operating policy. They shall exchange all relevant information about their respective businesses – the intention being to create and maintain a common operating platform for the Unilever Group throughout the world. This Deed also contains provisions for the allocation of assets within the Unilever Group.

Under the Agreement for Mutual Guarantees of Borrowing between NV and PLC, each company will, if asked by the other, guarantee the borrowings of the other and the other’s subsidiaries. These arrangements are used, as a matter of financial policy, for certain significant borrowings. They enable lenders to rely on our combined financial strength.

Each NV ordinary share represents the same underlying economic interest in the Unilever Group as each PLC ordinary share. However, NV and PLC remain separate legal entities with different shareholder constituencies and separate stock exchange listings. Shareholders cannot convert or exchange the shares of one for the shares of the other. More information on the exercise of voting rights can be found in NV’s and PLC’s Articles of Association and in the Notices of Meetings for our NV and PLC AGMs, all of which can be found on our website.

*

Throughout this report, when referring to NV shares or shareholders, the term ‘shares’ or ‘shareholder’ also encompasses a depositary receipt or a holder of depositary receipts.

LOGO

www.unilever.com/investor-relations/agm-and-corporate-

governance/legal-structure-and-foundation-agreements/

BOARDS

The Boards of NV and PLC have ultimate responsibility for the management, general affairs, direction, performance and long-term success of our business as a whole. The Boards areone-tier boards, the same people are on both Boards and the responsibility of the Directors is collective, taking into account their respective roles as Executive Directors andNon-Executive Directors. The majority of the Directors areNon-Executive Directors who essentially have a supervisory role. In the normal course Unilever has two Executive Directors, the Chief Executive Officer (CEO) and the Chief Financial Officer (CFO). On 31 December 2018 the current CEO resigned and his successor, Alan Jope, was appointed on 1 January 2019. Alan will be proposed to be appointed as an Executive Director at the end2019 AGMs. Consequently, between 1 January 2019 and the 2019 AGMs in May we have one Executive Director.

A list of our current Directors, their roles on the Boards, their dates of appointment, tenure and their other major appointments is set out on page 3.

The Boards have delegated the operational running of the Unilever Group to the CEO with the exception of the following matters which are reserved for the Boards: structural and constitutional matters, corporate governance, approval of dividends, approval and monitoring of overall strategy for the Unilever Group, approval of significant transactions or arrangements in relation to mergers, acquisitions, joint ventures and pensions. The CEO is responsible to the Boards in relation to the operational running of the Group and other powers delegated to him by the Boards. The CEO can delegate any of his powers and discretions, and he does so delegate to members of the Unilever Leadership Executive (ULE) (with power tosub-delegate). The ULE is composed of the CEO, CFO and other senior executives who assist the CEO in the discharge of the powers delegated to the CEO by the Boards. Members of the ULE report to the CEO, and the CEO supervises and determines the roles, activities and responsibilities of the ULE. While ULE members (other than the CEO and the CFO) are not part of the Boards’ decision-making process, to provide the Boards with deeper insights, ULE members often attend those parts of the Board meetings which relate to the operational running of the Group. The ULE currently consists of the CEO, CFO, the Division Presidents, the Presidents for Europe and North America, and the Chief Research and Development Officer, Chief HR Officer, Chief Legal Officer and Group Secretary, Chief Marketing and Communications Officer and Chief Supply Chain Officer.

The biographies of ULE members are on page 5.

BOARD COMMITTEES

The Boards have established four Board Committees: the Audit Committee, the Compensation Committee, the Corporate Responsibility Committee and the Nominating and Corporate Governance Committee. The terms of reference of these Committees can be found on our website and the reports of each Committee, including attendance at meetings in 2018, can be found on pages 43 to 65.

LOGO

www.unilever.com/investor-relations/agm-and-corporate-

governance/board-and-management-committees/

THE GOVERNANCE OF UNILEVER

Further details of the roles and responsibilities of the Chairman, Senior Independent Director/Vice-Chairman, CEO, CFO and other corporate officers and how our Boards effectively operate as one board, govern themselves and delegate their authorities are set out in the document entitled ‘The Governance of Unilever’, which can be found on our website.

The Governance of Unilever also describes the Foundation Agreements, Directors’ appointment, tenure, induction and training, Directors’ ability to seek independent advice at Unilever’s expense and details about Board and Management Committees (including the Disclosure Committee).

LOGO

www.unilever.com/investor-relations/agm-and-corporate-

governance/our-corporate-governance/

36Governance ReportAnnual Report on Form 20-F 2018


BOARD EFFECTIVENESS

BOARD MEETINGS

A minimum of fiveface-to-face meetings are planned throughout the calendar year to consider important corporate events and actions, for example, the half-year and full-year results announcements of the Unilever Group; the development of and approval of the overall strategy of the Unilever Group; oversight of the performance of the business; review of risks and internal risk management and control systems; authorisation of major transactions; declaration of dividends; convening of shareholders’ meetings; succession planning; review of the functioning of the Boards and their Committees; culture; and review of corporate responsibility and sustainability, in particular the Unilever Sustainable Living Plan. Other ad hoc Board meetings are convened to discuss strategic, transactional and governance matters that arise. In 2018 the Boards met physically in January, March, May, July, October and November. Meetings of the Boards may be held either in London or in Rotterdam or such other locations as the Boards think fit, with one or twooff-site Board meetings a year. The Chairman sets the Boards’ agenda, ensures the Directors receive accurate, timely and clear information, and promotes effective relationships and open communication between the Executive andNon-Executive Directors.

ATTENDANCE

The table showing the attendance of current Directors at Board meetings in 2018 can be found on page 3. If Directors are unable to attend a Board meeting they have the opportunity beforehand to discuss any agenda items with the Chairman. Ann Fudge attended four of the Board meetings she was eligible to attend before retiring from the Boards on 3 May 2018.

NON-EXECUTIVE DIRECTOR MEETINGS

TheNon-Executive Directors usually meet as a group, without the Executive Directors present, when there is aface-to-face Board meeting. In 2018 they met five times. The Chairman, or in his absence the Senior Independent Director/Vice-Chairman, chairs such meetings.

BOARD EVALUATION

Each year the Boards formally assess their own performance with the aim of helping to improve the effectiveness of both the Boards and the Committees. At least once every three years an independent third party facilitates the evaluation. The last external evaluation was performed in 2017. The evaluation consists of individual interviews with the Directors by the Chairman and, when relevant, by the external evaluator. These interviews are complemented by the completion by all Directors of three confidential online evaluation questionnaires on the efficiency and effectiveness of our Boards, CEO and Chairman. The Boards evaluation questionnaire this year focused on a number of key areas including Strategy, Risk/Financial Controls, Board Effectiveness and Information/Knowledge. The Chairman’s statement on page 2 describes the key actions agreed by the Boards following the evaluation.

The evaluation of the performance of the Chairman and CEO is led by the Senior Independent Director/Vice-Chairman and Chairman respectively, and the bespoke questionnaires will be used to support these evaluations. Committees of the Boards evaluate themselves annually under supervision of their respective Chairs taking into account the views of respective Committee members and the Boards. The key actions agreed by each Committee in the 2018 evaluations can be found in each Committee Report.

APPOINTMENT

In seeking to ensure that NV and PLC have the same Directors, the Articles of Association of NV and PLC contain provisions which are designed to ensure that both NV and PLC shareholders are presented with the same candidates for election as Directors. Anyone being elected as a Director of NV must also be elected as a Director of PLC and vice versa. Therefore, if an individual fails to be elected to both companies he or she will be unable to take his or her place on either Board.

The report of the Nominating and Corporate Governance Committee (NCGC) on pages 48 and 49 describes the work of the NCGC in Board appointments and recommendations forre-election. In addition, shareholders are able to nominate Directors. The procedure for shareholders to nominate Directors is contained within the document entitled ‘Appointment procedure for NV and PLC Directors’ which is available on our website. To do so they must put a resolution to both the NV and PLC AGMs in line with local requirements. Directors are appointed by shareholders by a simple majority vote at each AGM.

LOGO

www.unilever.com/investor-relations/agm-and-corporate-

governance/board-and-management-committees/

DIRECTOR INDUCTION AND TRAINING

All new Directors participate in a comprehensive induction programme when they join the Boards. The Chairman ensures that ongoing training is provided for Directors by way of site visits, presentations and circulated updates at (and between) Board and Board Committee meetings on, among other things, Unilever’s business, environmental, social, corporate governance, regulatory developments and investor relations matters. For example, in 2018 the Directors received presentations on Information Security, Digital, the Supply Chain and Simplification.

INDEPENDENCE AND CONFLICTS

As theNon-Executive Directors make up the Committees of the Boards, it is important that they can be considered to be independent. Each year the Boards conduct a thorough review of theNon-Executive Directors’, and their related or connected persons’, relevant relationships referencing the criteria set out in ‘The Governance of Unilever’ which is derived from the relevant best practice guidelines in the Netherlands, UK and US. The Boards currently consider all ourNon-Executive Directors to be independent of Unilever.

We attach special importance to avoiding conflicts of interest between NV and PLC and their respective Directors. The Boards ensure that there are effective procedures in place to avoid conflicts of interest by Board members. A Director must without delay report any conflict of interest or potential conflict of interest to the Chairman and to the other Directors, or, in case any conflict of interest or potential conflict of interest of the Chairman, to the Senior Independent Director/Vice-Chairman and to the other Directors. The Director in question must provide all relevant information to the Boards, so that the Boards can decide whether a reported (potential) conflict of interest of a Director qualifies as a conflict of interest within the meaning of the relevant laws. A Director may not vote on, or be counted in a quorum in relation to, any resolution of the Boards in respect of any situation in which he or she has a conflict of interest. The procedures that Unilever has put in place to deal with conflicts of interest operate effectively.

Unilever recognises the benefit to the individual and the Unilever Group of senior executives acting as directors of other companies but, to ensure outside directorships of our Executive Directors do not involve an excessive commitment or conflict of interest, the number of outside directorships of listed companies is generally limited to one per Executive Director and approval is required from the Chairman.

INDEMNIFICATION

The terms of NV Directors’ indemnification are provided for in NV’s Articles of Association. The power to indemnify PLC Directors is provided for in PLC’s Articles of Association and deeds of indemnity have been agreed with all PLC Directors. Third-party directors’ and officers’ liability insurance was in place for all Unilever Directors throughout 2018 and is currently in force.

In addition, PLC provides indemnities (including, where applicable, a qualifying pension scheme indemnity provision) to the Directors of three subsidiaries each of which acts as trustee of a Unilever UK pension fund. Appropriate trustee liability insurance is also in place.

Annual Report on Form 20-F 2018Governance Report37


CORPORATE GOVERNANCECONTINUED

OUR SHARES

NV SHARES

SHARE CAPITAL

NV’s issued share capital on 31 December 2018* was made up of:

274,356,432 split into 1,714,727,700 ordinary shares of0.16 each; and

1,028,568 split into 2,400 special ordinary shares numbered 1 – 2,400 known as special ordinary shares.

*

When referred to the issued share capital on 31 December 2018 also62,065,550 split into two classes (6% and 7%) of cumulative preference shares was outstanding. All 6% and 7% cumulative preference shares were held in treasury as a result of which these shares cannot be voted upon in the General Meeting of NV. The resolutions of the General Meeting of NV and the Board of NV to cancel these shares were filed on 29 November 2018 with the Dutch Trade Register and an announcement thereof in a daily and nationally distributed newspaper in the Netherlands was made on 5 December 2018. These shares were cancelled on 6 February 2019.

LISTINGS

NV has ordinary shares (UNIA) and depositary receipts for such ordinary shares (UNA) listed on Euronext Amsterdam and, as US New York Registry Shares* (UN) on the New York Stock Exchange.

*

One New York Registry Share represents one NV ordinary share with a nominal value of0.16.

VOTING RIGHTS

NV shareholders can cast one vote for each0.16 nominal capital they hold and can vote in person or by proxy. The voting rights attached to NV’s outstanding shares are split as follows:


Total number

of votes


        % of issued

capital


1,714,727,700 ordinary shares

   1,714,727,700(a)    99.63 

2,400 special shares


6,428,550


0.37


As at 31 December 2018:

(a)

254,012,896 shares were held in treasury and 9,336,215 shares were held to satisfy obligations under share-based incentive schemes. These shares and the special shares are not voted on. All 6% and 7% cumulative preference shares were held in treasury as a result of which these shares cannot be voted upon, as described within the Share Capital section above.

SHARE ISSUES AND PURCHASE OF SHARES

At the NV AGM held on 3 May 2018 the Board of NV was designated as the corporate body authorised to resolve on the issue of, or on the granting of rights to subscribe for, shares not yet issued and to restrict or exclude the statutorypre-emption rights that accrue to shareholders upon issue of shares, on the understanding that this authority is limited to 33% of NV’s issued ordinary share capital and to disapplypre-emption rights to 5% of NV’s issued share capital for general corporate purposes and an additional 5% authority only in connection with an acquisition or specified capital investment.

In addition, at NV’s 2018 AGM the NV Board was designated as the corporate body authorised to purchase (i) ordinary shares with a maximum of 10% of the issued share capital as well as (ii) any and all 6% and 7% cumulative preference shares.

These authorities expire on the earlier of the conclusion of the 2019 NV AGM or the close of business on 30 June 2019 (the last date by which NV must hold an AGM in 2019). Such authorities (other than with respect to the 6% and 7% cumulative preference shares) are renewed annually.

During 2018 companies within the Unilever Group purchased 4,000,000 NV ordinary shares, representing 0.23% of the issued ordinary share capital, for183,380,649. These purchases were made to facilitate grants made in connection with Unilever’s employee compensation programmes. Further information on these purchases can be found in note 4C to the consolidated accounts on page 93.

In addition, NV conducted a share buyback programme during 2018 with an aggregate market value of approximately3 billion bought back in the form of 62,202,168 NV ordinary shares (or depositary receipts in respect of such ordinary shares).

Following a public offer and a subsequent squeeze out procedure, Unilever Corporate Holdings Nederland B.V. (UCHN), an indirect wholly owned subsidiary of PLC, acquired all 6% cumulative preference shares and 7% cumulative preference shares. Unilever N.V. purchased these 6% cumulative preference shares and 7% cumulative preference shares on 2 October 2018. The resolutions of the General Meeting of NV and the Board of NV to cancel these shares were filed on 29 November 2018, as described within the Share Capital section above.

Further information on these purchases can be found in note 4C to the consolidated accounts on page 93.

NV SPECIAL ORDINARY SHARES

To ensure unity of management, the provisions within the NV Articles of Association containing the rules for appointing NV Directors cannot be changed without the permission of the holders of the special ordinary shares numbered 1 – 2,400 inclusive. These NV special ordinary shares may only be transferred to one or more other holders of such shares. The joint holders of these shares are N.V. Elma and United Holdings Limited, which are subsidiaries of NV and PLC respectively. The Boards of N.V. Elma and United Holdings Limited comprise three Directors of the Unilever Boards.

TRUST OFFICE

The Foundation Unilever N.V. Trust Office (Stichting Administratiekantoor Unilever N.V.) is a trust office with a board independent of Unilever. As part of its corporate objects, the Trust Office issues depositary receipts in exchange for the NV ordinary shares. These depositary receipts are listed on Euronext Amsterdam, as are the NV ordinary shares themselves

Holders of depositary receipts can under all circumstances exchange their depositary receipts for the underlying shares (and vice versa) and are entitled to dividends and all economic benefits on the underlying shares held by the Trust Office. There are no limitations on the holders’ voting rights, they can attend all General Meetings of NV, either personally or by proxy, and have the right to speak. The Trust Office only votes shares that are not represented at a General Meeting. The Trust Office votes in such a way as it deems to be in the long-term interests of the holders of the depositary receipts. This voting policy is laid down in the Conditions of Administration that apply to the depositary receipts.

The Trust Office’s shareholding fluctuates daily. Its holdings on

31 December 2018 were 1,268,051,254 NV ordinary shares (73.95%).

At the 2018 NV AGM, the Trust Office represented 36.95% of all votes present at the meeting.

The current members of the board at the Trust Office are Mr J H Schraven (Chairman), Mr P M L Frentrop, Mr A Nühn and Ms C M S Smits-Nusteling. The Trust Office reports periodically on its activities. Further information on the Trust Office, including its Articles of Association, Conditions of Administration and Voting Policy, can be found on its website.

LOGOwww.administratiekantoor-unilever.nl/eng/home

38Governance ReportAnnual Report on Form 20-F 2018


PLC SHARES

SHARE CAPITAL

PLC’s issued share capital on 31 December 2018 was made up of:

£36,934,840 split into 1,187,191,284 ordinary shares of 319p each; and
£100,000 of deferred stock of £1 each.

LISTINGS

PLC has ordinary shares (ULVR) listed on the London Stock Exchange and, as American Depositary Receipts* (UL), on the New York Stock Exchange.

*

One American Depository Receipt represents one PLC ordinary share with a nominal value of 319p.

VOTING RIGHTS

PLC shareholders can cast one vote for each 319p nominal capital they hold and can vote in person or by proxy. The voting rights attached to PLC’s outstanding shares are split as follows:


Total number

of votes


        % of issued

capital


1,187,191,284 ordinary shares

   1,187,191,284    99.73 

£100,000 deferred stock


3,214,285


0.27


As at 31 December 2018:

(a)

18,660,634 shares were held by PLC in treasury and 5,645,392 shares were held by NV group companies. These shares and the deferred stock are not voted on.

SHARE ISSUES AND PURCHASE OF SHARES

At the 2018 PLC AGM held on 2 May 2018 the PLC Directors were authorised to issue new shares, up to a maximum of £12,755,555 nominal value (which at the time represented approximately 33% of PLC’s issued ordinary share capital) and to disapplypre-emption rights up to approximately 5% of PLC’s issued ordinary share capital for general corporate purposes and an additional 5% authority only in connection with an acquisition or specified capital investment.

In addition, at PLC’s 2018 AGM the PLC Board was authorised to make market purchases of its ordinary shares, up to a maximum of just under 10% of PLC’s issued ordinary share capital and within the limits prescribed in the resolution until the earlier of the conclusion of PLC’s 2019 AGM and 30 June 2019. These authorities are renewed annually and authority will be sought at PLC’s 2019 AGM.

During 2018 companies within the Unilever Group purchased 2,222,000 PLC ordinary shares, representing 0.19% of the issued share capital, for £87,978,671. These purchases were made to facilitate grants made in connection with its employee compensation programmes. Further information on these purchases can be found in note 4C to the consolidated accounts on page 93.

In addition, PLC conducted a share buyback programme during 2018 with an aggregate market value of approximately £3 billion bought back in the form of 63,236,433 PLC ordinary shares.

On 31 July 2018, PLC cancelled 110,493,623 PLC ordinary shares of 319p each held in treasury, representing 8.43% of the issued share capital. On 19 September 2018, PLC cancelled a further 12,471,454 PLC ordinary shares of 319p each held in treasury, representing 1.04% of the issued share capital.

PLC DEFERRED STOCK

To support unity of management, the holders of PLC’s deferred stock have rights within PLC’s Articles of Association relating to any changes in the rules for appointing PLC Directors. The joint holders of the PLC deferred stock are N.V. Elma and United Holdings Limited, which are subsidiaries of NV and PLC respectively. The Boards of N.V. Elma and United Holdings Limited comprise three Directors of the Unilever Boards.

OUR SHAREHOLDERS

SIGNIFICANT SHAREHOLDERS OF NV

As far as Unilever is aware, the only holder of more than 3% of, or 3% of voting rights attributable to, NV’s share capital (‘Disclosable Interests’) on 31 December 2018 (apart from the Foundation Unilever N.V. Trust Office, see page 38) is BlackRock, Inc. (BlackRock) as indicated in the table below.

Shareholder  Class of shares  Total number of
shares held
   % of relevant
class
 

BlackRock

  ordinary shares       66,947,018    3.90 

BlackRock notified the AFM that its holding changed to 4.02% on

19 February 2019. Between 1 January 2016 and 21 February 2019, BlackRock, NN Group N.V. (NN), ASR Nederland N.V. (ASR) and UCHN, see page 38, have held more than 3% in the share capital of NV.

SIGNIFICANT SHAREHOLDERS OF PLC

As far as Unilever is aware, the only holders of more than 3% of, or 3% of voting rights attributable to, PLC’s ordinary share capital on 31 December 2018 (apart from shares held in treasury by PLC, see page 39), are BlackRock and the Leverhulme Trust as indicated in the table below.

Shareholder  Class of shares  

Total number

of shares held

   % of relevant
class
 

BlackRock

  ordinary shares       77,176,319    6.60 

The Leverhulme Trust

  ordinary shares   46,931,182    4.02 

As far as Unilever is aware, no new Disclosable Interests have been notified to PLC between 1 January 2019 and 21 February 2019 (the latest practicable date for inclusion in this report). Between 1 January 2016 and 21 February 2019, (i) BlackRock, and (ii) the aggregated holdings of the trustees of the Leverhulme Trust and the Leverhulme Trade Charities Trust, have held more than 3% of, or 3% of voting rights attributable to, PLC’s ordinary shares.

STAKEHOLDER ENGAGEMENT

We value open and effective communication with our stakeholders. The primary responsibility for stakeholder engagement, which is generally related to the operations of the business, rests with our Executive Directors.Non-Executive Directors also actively engage with stakeholders as part of their oversight duties and responsibilities that have not been delegated to the Executive Directors.

SHAREHOLDERS

The CFO has lead responsibility for shareholder engagement, with the active involvement of the CEO and supported by the Investor Relations department.

The Executive Directors’ investor relations programme continued in 2018 with meetings held with institutional shareholders in major cities globally. The Executive Directors and members of the Investor Relations team also meet a large number of investors at the industry conferences they attend. In 2018 industry conferences attended by Unilever representatives included events in London, Paris, Stockholm, Boston and New York.

Our annual investor seminar in December also allowed investors to meet the Chairman, CEO,CEO-designate, CFO and other members of senior management. The event was held at the offices of Hindustan Unilever in Mumbai and focused on Unilever’s emerging markets expertise as well as the digital transformation of the business.

In 2018, as part of the strategic review of options to accelerate sustainable value creation and our proposal to simplify the Unilever corporate structure, the Chairman met and spoke with global investors during the year. The Chair of the Compensation Committee also extensively engaged with and sought feedback from investors in relation to our Remuneration Policy.

Annual Report on Form 20-F 2018Governance Report39


CORPORATE GOVERNANCECONTINUED

On an ongoing basis, the Boards are briefed on investor reactions to the Unilever Group’s quarterly results announcements and on any issues raised by shareholders that are relevant to their responsibilities.

We maintain a frequent dialogue with our principal institutional shareholders and regularly collect feedback. Private shareholders are encouraged to give feedback via shareholder.services@unilever.com. Our shareholders are also welcome to raise any issues directly with the Chairman or the Senior Independent Director/Vice-Chairman, and the Chairman, Executive Directors and Chairs of the Committees are also generally available to answer questions from the shareholders at the AGMs each year.

OTHERS

Our Executive Directors andNon-Executive Directors also engage with a wide-ranging group of stakeholders during specific Unilever events. For example, we annually organise one or more Board Relationship meetings offering our Directors the opportunity to directly meet our key customers, suppliers, agencies, NGOs, trade associations and advisers. In 2018, such meetings were held in the Netherlands and the UK.

EMPLOYEES

In order to allow ourNon-Executive Directors to gainfirst-hand experience of our operations and to engage in a broader context, we organise one or more site visits annually. During these site visits,Non-Executive Directors are informed about local market conditions and operations as well as relevant local matters. Typically, the programme allowsNon-Executive to meet management and young talent at these sites. In 2018, such site visits were held in China, Germany, the Netherlands and the US. In terms of engaging with employees, ourNon-Executive Directors actively participate in our management development programme sharing knowledge and insight on a mutual basis.

LOGOwww.unilever.com/investor-relations/

GENERAL MEETINGS

Both NV and PLC hold an AGM each year. At the AGMs the Chairman gives his thoughts on governance aspects of the preceding year and the CEO gives a detailed review of the performance of the Unilever Group over the last year. Shareholders are encouraged to attend the relevant meeting and to ask questions at or in advance of the meeting. Indeed, the question and answer session forms an important part of each meeting. The external auditors are welcomed to the AGMs and are entitled to address the meetings.

Provision 4.1.8 of the Corporate Governance Code in the Netherlands (Dutch Code) and Code Provision E.2.3 of the UK Corporate Governance Code (UK Code) require all Directors to attend both the NV and PLC AGMs. As questions asked at our AGMs tend to focus on business related matters, governance and the remit of our Board Committees, the Chairman, CEO, CFO and the Chairs of our four Committees of the Board attend both our AGMs and the remaining members of the Board attend at least one AGM.

The 2018 AGMs were held in Rotterdam and London in May and the topics raised by shareholders included:e-commerce, mergers & acquisitions, sustainability, Simplification, remuneration, total shareholder return, Brexit and data protection.

Shareholders of NV may propose resolutions if they individually or together hold at least 1% of NV’s issued capital in the form of shares or depositary receipts issued for NV shares. Shareholders who together represent at least 10% of the issued capital of NV can, under certain circumstances, also requisition the District Court to allow them to convene an Extraordinary General Meeting to deal with specific resolutions.

Shareholders of PLC may propose resolutions if they individually or together hold shares representing at least 5% of the total voting rights of PLC, or 100 shareholders who hold on average £100 each in nominal value of PLC share capital can require PLC to propose a resolution at a General Meeting. PLC shareholders holding in aggregate 5% of the issued PLC ordinary shares are able to convene a General Meeting of PLC.

Information on the 2019 AGMs can be found within the NV and PLC AGM Notices which will be published in March 2019.

REQUIRED MAJORITIES

Resolutions are usually adopted at NV and PLC General Meetings by an absolute majority of votes cast, unless there are other requirements under the applicable laws or NV’s or PLC’s Articles of Association. For example, there are special requirements for resolutions relating to the alteration of the Articles of Association, the liquidation of NV or PLC and the alteration of the Equalisation Agreement.

A proposal to alter the Articles of Association of NV can only be made by the NV Board. A proposal to alter the Articles of Association of PLC can be made either by the PLC Board or by requisition of shareholders in accordance with the UK Companies Act 2006. Unless expressly specified to the contrary in PLC’s Articles of Association, PLC’s Articles of Association may be amended by a special resolution. Proposals to alter the provisions in the Articles of Association of NV and PLC respectively relating to the unity of management require the prior approval of meetings of the holders of the NV special ordinary shares and the PLC deferred stock. The Articles of Association of both NV and PLC can be found on our website.

LOGO

www.unilever.com/investor-relations/agm-and-corporate-

governance/legal-structure-and-foundation-agreements/

RIGHT TO HOLD AND TRANSFER SHARES

Unilever’s constitutional documents place no limitations on the right to hold or transfer NV and PLC ordinary shares. There are no limitations on the right to hold or exercise voting rights on the ordinary shares of NV and PLC imposed by Dutch or English law.

40Governance ReportAnnual Report on Form 20-F 2018


CORPORATE GOVERNANCE COMPLIANCE

GENERAL

We conduct our operations in accordance with internationally accepted principles of good governance and best practice, while ensuring compliance with the corporate governance requirements applicable in the countries in which we operate. Unilever is subject to corporate governance requirements (legislation, codes and/or standards) in the Netherlands, the UK and the US and in this section we report on our compliance against these.

MATERIAL CONTRACTS

Under the European Takeover Directive as implemented in the Netherlands and the UK, the UK Companies Act 2006 and rules of the US Securities and Exchange Commission, Unilever is required to provide information on contracts and other arrangements essential or material to the business of the Unilever Group. Other than the Foundation Agreements referred to on page 36, we believe we do not have any such contracts or arrangements.

THE NETHERLANDS

In 2018, NV complied with almost all the principles and best practice provisions of the Dutch Code, with the exception of Dutch Code Provision 4.1.8 as noted in the General Meetings section above and the best practice provision set out below. The Dutch Code is available on the Monitoring Committee Corporate Governance Code’s website.

Best Practice Provision 3.2.3

The Dutch Code provides that in case of dismissal, the remuneration of an Executive Director should not exceed one year’s salary.

It is our policy to set the level of severance payments for Executive Directors at no more than one year’s salary, unless the Boards, on the recommendation of the Compensation Committee, find this manifestly unreasonable given circumstances or unless otherwise dictated by applicable law.

Corporate Governance Statements:

In addition to an explanation ofnon-compliance to the Dutch Code, as set out above, the Dutch Code also requires the Board to confirm, and the Board hereby confirms that:

this Annual Report and Accounts provides sufficient insights into any failings in the effectiveness of the internal risk management and control systems;
the systems mentioned above provide reasonable assurance that the financial reporting does not contain any material inaccuracies;
based on the current state of affairs, it is justified that the financial reporting is prepared on a going concern basis; and
this Annual Report and Accounts states those material risks and uncertainties that are relevant to the expectation of NV’s continuity for the period of 12 months after the preparation of this Annual Report and Accounts.

The statements in this paragraph are not statements in accordance with the requirements of Section 404 of the US Sarbanes-Oxley Act of 2002.

Furthermore, NV is required to make a statement concerning corporate governance as referred to in article 2a of the decree on the content of the management report (Besluit inhoud bestuursverslag) (the Decree).

The information required to be included in this corporate governance statement as described in articles 3, 3a and 3b of the Decree can be found on our website.

LOGOwww.commissiecorporategovernance.nl
LOGOwww.unilever.com/corporategovernance

THE UNITED KINGDOM

In 2018, PLC complied with all UK Code provisions with the exception of UK Code Provision E.2.3 as noted in the General Meetings section above. The UK Code is available on the Financial Reporting Council’s (FRC) website.

Risk Management and Control: Our approach to risk management and systems of internal control is in line with the recommendations in the FRC’s revised guidance ‘Risk management, internal control and related financial and business reporting’ (the Risk Guidance). It is Unilever’s practice to review acquired companies’ governance procedures and to align them to the Unilever Group’s governance procedures as soon as is practicable.

Greenhouse Gas (GHG) Emissions: Information on GHG emissions can be found on page 35.

Employee Involvement and Communication: Unilever’s UK companies maintain formal processes to inform, consult and involve employees and their representatives. A National Consultative Forum comprising employees and management representatives from key locations meets regularly to provide a forum for discussing issues relating to Unilever sites in the United Kingdom. We recognise collective bargaining on a number of sites and engage with employees via the Sourcing Unit Forum, which includes national officer representation from the three recognised trade unions. A European Works Council, embracing employee and management representatives from countries within Europe, has been in existence for several years and provides a forum for discussing issues that extend across national boundaries.

Equal Opportunities and Diversity: Consistent with our Code of Business Principles, Unilever aims to ensure that applications for employment from everyone are given full and fair consideration and that everyone is given access to training, development and career opportunities. Every effort is made to retrain and support employees who become disabled while working within the Group.

LOGOwww.frc.org.uk/
LOGOwww.unilever.com/sustainable-living/values-and-values/

Annual Report on Form 20-F 2018Governance Report41


CORPORATE GOVERNANCECONTINUED

THE UNITED STATES

Both NV and PLC are listed on the New York Stock Exchange (NYSE). As such, both companies must comply with the requirements of US legislation, regulations enacted under US securities laws and the Listing Standards of the NYSE, that are applicable to foreign private issuers, copies of which are available on their websites.

We are substantially compliant with the Listing Standards of the NYSE applicable to foreign private issuers except as set out below.

We are required to disclose any significant ways in which our corporate governance practices differ from those typically followed by US companies listed on the NYSE. Our corporate governance practices are primarily based on the requirements of the UK Listing Rules, the UK Code and the Dutch Code but substantially conform to those required of US companies listed on the NYSE. The only significant way in which our corporate governance practices differ from those followed by domestic companies under Section 303A Corporate Governance Standards of the NYSE is that the NYSE rules require that shareholders must be given the opportunity to vote on all equity-compensation plans and material revisions thereto, with certain limited exemptions. The UK Listing Rules require shareholder approval of equity-compensation plans only if new or treasury shares are issued for the purpose of satisfying obligations under the plan or if the plan is a long-term incentive plan in which a director may participate. Amendments to plans approved by shareholders generally only require approval if they are to the advantage of the plan participants. Furthermore, Dutch law and NV’s Articles of Association require shareholder approval of equity-compensation plans only if the Executive Directors are able to participate in such plans. Under Dutch law, shareholder approval is not required for material revisions to equity-compensation plans unless the Executive Directors participate in a plan and the plan does not contain its own procedure for revisions.

Attention is drawn to the Report of the Audit Committee on pages 43 to 45. In addition, further details about our corporate governance are provided in the document entitled ‘The Governance of Unilever’ which can be found on our website.

LOGOwww.nyse.com/index
LOGOwww.sec.gov

All senior executives and senior financial officers have declared their understanding of and compliance with Unilever’s Code of Business Principles and the related Code Policies. No waiver from any provision of the Code of Business Principles or Code Policies was granted in 2018 to any of the persons falling within the scope of the SEC requirements. The Code of Business Principles and related Code Policies are published on our website.

Risk Management and Control: Following a review by the Disclosure Committee, Audit Committee and Boards, the CEO and the CFO concluded that the design and operation of the Unilever Group’s disclosure controls and procedures, including those defined in the United States Securities Exchange Act of 1934 – Rule 13a – 15(e), as at 31 December 2018 were effective.

Unilever is required by Section 404 of the US Sarbanes-Oxley Act of 2002 to report on the effectiveness of its internal control over financial reporting. This requirement is reported on within the section entitled ‘Management’s Report on Internal Control over Financial Reporting’ on page 156.

In February 2017, the Group received a public potential offer by The Kraft Heinz Company for $50 per share in respect of all of NV and PLC shares. Unilever rejected the proposal.

LOGO

www.unilever.com/investor-relations/agm-and-corporate-

governance/our-corporate-governance/

42Governance ReportAnnual Report on Form 20-F 2018


REPORT OF THE AUDIT COMMITTEE

COMMITTEE MEMBERS AND ATTENDANCE

ATTENDANCE

John RishtonChair

8/8

Nils Andersen

8/8

Judith Hartmann

8/8

This table shows the membership of the Committee together with their attendance at meetings during 2018. If Directors are unable to attend a meeting, they have the opportunity beforehand to discuss any agenda items with the Committee Chair. Attendance is expressed as the number of meetings attended out of the number eligible to be attended.

HIGHLIGHTS OF 2018

•  Annual Report and Accounts

•  Tax regulations, provisions and disclosure

•  Information security, including Cyber, and IT resilience

•  Supply Chain flexibility and continuity of supply

•  Accounting for significant Mergers and Acquisitions

•  Acquisition Review

•  Spreads Disposal

•  IFRS 15 ‘Revenue from Contracts with Customers’ and IFRS 16 ‘Leases’

PRIORITIES FOR 2019

•  Tax regulations, provisions and disclosure

•  Information Security, including Cyber, and IT resilience

•  IFRS 16 ‘Leases’

•  Accounting for significant Mergers and Acquisitions

MEMBERSHIP OF THE COMMITTEE

The Audit Committee is comprised only of independentNon-Executive Directors with a minimum requirement of three such members. It is chaired by John Rishton and the other members are Nils Andersen and Judith Hartmann. For the purposes of the US Sarbanes-Oxley Act of 2002 John Rishton is the Audit Committee’s financial expert. The Boards have satisfied themselves that the current members of the Audit Committee are competent in financial matters and have recent and relevant experience. Other attendees at Committee meetings (or part thereof) were the Chief Financial Officer, Chief Auditor, EVP Financial Control, Risk Management, Pensions & Sustainability, Chief Legal Officer and Group Secretary and the external auditors. Throughout the year the Committee members periodically met without others present and also held separate private sessions with the Chief Financial Officer, Chief Auditor and the external auditors, allowing the Committee to discuss any issues in more detail.

ROLE OF THE COMMITTEE

The role and responsibilities of the Audit Committee are set out in written terms of reference which are reviewed annually by the Committee, taking into account relevant legislation and recommended good practice. The terms of reference are contained within ‘The Governance of Unilever’ which is available on our website atwww.unilever.com/corporategovernance. The Committee’s responsibilities include, but are not limited to, the following matters, and relevant issues are brought to the attention of the Boards:

oversight of the integrity of Unilever’s financial statements;
review of Unilever’s quarterly and annual financial statements (including clarity and completeness of disclosure) and approval of the quarterly trading statements for quarter 1 and quarter 3;
oversight of risk management and internal control arrangements;
oversight of compliance with legal and regulatory requirements;
oversight of the external auditors’ performance, objectivity, qualifications and independence; the approval process ofnon-audit services; recommendation to the Boards of the nomination of the external auditors for shareholder approval; and approval of their fees, refer to note 25 on page 126;
the performance of the internal audit function; and
approval of the Unilever Leadership Executive (ULE) expense policy and the review of Executive Director expenses.

In order to help the Committee meet its oversight responsibilities, each year management organise knowledge sessions for the Committee on subject areas within its remit. In 2018, a session was held with Unilever Management on the acquisition of the Dollar Shave Club, which included a briefing on the acquisition case, recent performance, and key learnings that might be relevant for future acquisitions. In addition, John Rishton visited the Indian MCO in Mumbai, where the developments of routes to market, controls automation and centralisation were reviewed and discussed in detail. Mr Rishton also visited the Indian finance and IT hub in Bangalore where progress being made on monitoring systems of potential cyber threat and access controls were reviewed.

HOW THE COMMITTEE HAS DISCHARGED ITS RESPONSIBILITIES

During the year, the Committee’s principal activities were as follows:

FINANCIAL STATEMENTS

The Committee reviewed prior to publication the quarterly financial press releases together with the associated internal quarterly reports from the Chief Financial Officer and the Disclosure Committee and, with respect to the half-year and full-year results, the external auditors’ reports. It also reviewed this Annual Report and Accounts and the Annual Report on Form20-F 2018. These reviews incorporated the accounting policies and significant judgements and estimates underpinning the financial statements as disclosed within note 1 on pages 79 to 82. Particular attention was paid to the following significant issues in relation to the financial statements:

revenue recognition – estimation of discounts, incentives on sales made during the year, refer to note 2 on pages 82 to 84;
direct tax provisions, refer to note 6 on pages 94 to 96; and
indirect tax provisions and contingent liabilities, refer to note 19 on page 120.

Annual Report on Form 20-F 2018Governance Report43


REPORT OF THE AUDIT COMMITTEECONTINUED

The external auditors have agreed the list of significant issues discussed by the Audit Committee. In addition to these risks KPMG, as required by auditing standards, also consider the risk of management override of controls. Nothing has come to either our attention or the attention of KPMG to suggest any material suspected or actual fraud relating to management override of controls.

For each of the above areas the Committee considered the key facts and judgements outlined by management. Members of management attended the section of the meeting of the Committee where their item was discussed to answer any questions or challenges posed by the Committee. The issues were also discussed with the external auditors and further information can be found on pages 67 to 74. The Committee was satisfied that there are relevant accounting policies in place in relation to these significant issues and management have correctly applied these policies.

At the request of the Boards the Committee undertook to:

review the appropriateness of adopting the going concern basis of accounting in preparing the annual financial statements; and
assess whether the business was viable in accordance with the requirement of the UK Corporate Governance Code. The assessment included a review of the principal risks facing Unilever, their potential impact, how they were being managed, together with a discussion as to the appropriate period for the assessment. The Committee recommended to the Boards that there is a reasonable expectation that the Group will be able to continue in operation and meet its liabilities as they fall due over the three-year period (consistent with the period of the strategic plan) of the assessment.

At the request of the Boards the Committee also considered whether the Unilever Annual Report and Accounts 2018 was fair, balanced and understandable and whether it provided the necessary information for shareholders to assess the Group’s position and performance, business model and strategy. The Committee was satisfied that, taken as a whole, the Unilever Annual Report and Accounts 2018 is fair, balanced and understandable.

RISK MANAGEMENT AND INTERNAL CONTROL ARRANGEMENTS

The Committee reviewed Unilever’s overall approach to risk management and control, and its processes, outcomes and disclosure. It reviewed:

the Controller’s Quarterly Risk and Control Status Report, including Code of Business Principles cases relating to frauds and financial crimes and significant issues received through the Unilever Code Support Line;
the 2018 corporate risks for which the Audit Committee had oversight and the proposed 2019 corporate risks identified by the ULE;
management’s improvements to reporting and internal financial control arrangements, through further automation and centralisation;
processes related to information security, including cyber security;
tax planning, and related risk management;
treasury policies, including debt issuance and hedging; and
litigation and regulatory investigations.

The Committee reviewed the application of the requirements under Section 404 of the US Sarbanes-Oxley Act of 2002 with respect to internal controls over financial reporting. In addition, the Committee reviewed the annual financial plan and Unilever’s dividend policy and dividend proposals.

During 2018 the Committee continued its oversight of the independent assurance work that is performed on a number of our USLP metrics (selected on the basis of their materiality to the USLP).

In fulfilling its oversight responsibilities in relation to risk management, internal control and the financial statements, the Committee met regularly with senior members of management and is satisfied with the key judgements taken.

INTERNAL AUDIT FUNCTION

The Committee reviewed Corporate Audit’s audit plan for the year and agreed its budget and resource requirements. It reviewed interim andyear-end summary reports and management’s response. The Committee engaged an independent third party to perform an effectiveness review of the function. The review concluded that the function is compliant with the IIA (Chartered Institute of Internal Auditors) Standards in all material aspects. The Committee also carried out an evaluation of the performance of the internal audit function and was satisfied with the effectiveness of the function. The Committee met independently with the Chief Auditor during the year and discussed the results of the audits performed during the year.

AUDIT OF THE ANNUAL ACCOUNTS

KPMG, Unilever’s external auditors and independent registered public accounting firm, reported in depth to the Committee on the scope and outcome of the annual audit, including their audit of internal controls over financial reporting as required by Section 404 of the US Sarbanes-Oxley Act of 2002. Their reports included audit and accounting matters, governance and control, and accounting developments.

The Committee held independent meetings with the external auditors during the year and reviewed, agreed, discussed and challenged their audit plan, including their assessment of the financial reporting risk profile of the Group. The Committee discussed the views and conclusions of KPMG regarding management’s treatment of significant transactions and areas of judgement during the year. The Committee considered these views and comments and is satisfied with the treatment in the financial statements.

EXTERNAL AUDITORS

KPMG have been the Group’s auditors since 2014 and shareholders approved theirre-appointment as the Group’s external auditors at the 2018 AGMs. On the recommendation of the Committee, the Directors will be proposing there-appointment of KPMG at the AGMs in May 2019.

Both Unilever and KPMG have safeguards in place to avoid the possibility that the external auditors’ objectivity and independence could be compromised, such as audit partner rotation and the restriction onnon-audit services that the external auditors can perform as described below. Both the KPMG partners with overall responsibility for the audit of NV and PLC will rotate off the assignment after completion of the 2018year-end financial statements. One of the new partners already has experience of the Unilever global audit, and the other partner underwent an induction programme through much of thisyear-end to ensure a smooth transition. KPMG has issued a formal letter to the Committee outlining the general procedures to safeguard independence and objectivity, disclosing the relationship with the Company and confirming their audit independence.

Each year, the Committee assesses the effectiveness of the external audit process which includes discussing feedback from the members of the Committee and stakeholders at all levels across Unilever. Interviews are also held with key senior management within both Unilever and KPMG.

The Committee also reviewed the statutory audit, audit related andnon-audit related services provided by KPMG and compliance with Unilever’s documented approach, which prescribes in detail the types of engagements, listed below, for which the external auditors can be used:

statutory audit services, including audit of subsidiaries;
audit related engagements – services that involve attestation, assurance or certification of factual information that may be required by external parties;
non-audit related services – work that our external auditors are best placed to undertake, which may include:
audit and assurance certificates / statements
bond issue comfort letters
internal control reviews.

44Governance ReportAnnual Report on Form 20-F 2018


Unilever has for many years maintained a policy which prescribes in detail the types of engagements for which the external auditors can be used and prohibits several types of engagements, including:

bookkeeping or similar services;
design and/or implementation of systems or processes related to financial information or risk management;
valuation, actuarial and legal services;
internal audit;
broker, dealer, investment adviser or investment bank services;
transfer pricing advisory services
staff secondments of any kind;
Payroll tax;
Customs duties; and
Tax services (except in exceptional and rare circumstances such as where they are the only firm able to provide the service).

All audit related engagements over250,000 andnon-audit related engagements over100,000 required specific advance approval by the Audit Committee Chairman. The Committee further approved all engagements below these levels which have been authorised by the EVP Financial Control, Risk Management, Pension & Sustainability. These authorities are reviewed regularly and, where necessary, updated in the light of internal developments, external developments and best practice. Since the appointment of KPMG in 2014 to 2016 the level ofnon-audit fees has been below 7% of the annual audit fee. In 2017 and 2018 the level ofnon-audit fees has been higher at 41% and 31% respectively due to assurance work relating to the disposal of our Spreads business and the Simplification project.

The Committee confirms that the Group is in compliance with The Statutory Audit Services for Large Companies Market Investigation (Mandatory use of Competitive Tender Processes and Audit Committee Responsibilities) Order 2014. The last tender for the audit of the annual accounts was performed in 2013.

EVALUATION OF THE AUDIT COMMITTEE

As part of the internal Board evaluation carried out in 2018, the Boards evaluated the performance of the Committee. The Committee also carried out an assessment of its own performance in 2018. While overall the Committee members concluded that the Committee is performing effectively, the Committee agreed that to further enhance its effectiveness it needed to ensure the Committee members continued to develop their knowledge of the Group’s operations which would involve further knowledge sessions and site visits.

John Rishton

Chair of the Audit Committee

Nils Andersen

Judith Hartmann

Annual Report on Form 20-F 2018Governance Report45


REPORT OF THE CORPORATE

RESPONSIBILITY COMMITTEE

COMMITTEE MEMBERS AND ATTENDANCE

ATTENDANCE

Strive Masiyiwa(Member since April 2017)Chair

4/4

Youngme Moon

4/4

Feike Sijbesma

3/4

This table shows the membership of the Committee together with their attendance at meetings during 2018. If Directors are unable to attend a meeting, they have the opportunity beforehand to discuss any agenda items with the Committee Chair. Attendance is expressed as the number of meetings attended out of the number eligible to be attended.

HIGHLIGHTS OF 2018

•  Competition and anti-bribery compliance

•  Third-party compliance

•  Product quality and safety

•  Unilever Sustainable Living Plan (USLP)

PRIORITIES FOR 2019

•  Compliance with Unilever policies on fair competition and anti-bribery and requirements for third parties

•  Product quality and safety

•  Unilever Sustainable Living Plan (USLP) including plastic packaging

ROLE OF THE COMMITTEE

The Corporate Responsibility Committee oversees Unilever’s conduct as a responsible global business. As the Unilever Sustainable Living Plan (USLP) is at the heart of Unilever’s vision to grow its business whilst decoupling its environmental footprint from its growth and increasing its positive social impact, the Committee tracks the progress and potential risks associated with the USLP.

The Committee is also charged with ensuring that Unilever’s reputation is protected and enhanced. Therefore a central element of its role is the need to identify any external developments that are likely to have an influence upon Unilever’s standing in society, and to ensure that appropriate and effective communications policies are in place to support the company’s reputation.

The Committee’s discussions are informed by the experience of the senior leaders invited to the Committee to share their views on a variety of topics and external trends. Many of these leaders are members of the Unilever Sustainable Living Plan Steering Team, the group of senior executives accountable for driving sustainable growth through Unilever’s brands and operations. These discussions ensure the Committee stays abreast of current and emerging trends and any potential risks arising from sustainability issues. This enables the Boards to draw on a well-rounded view of issues.

During 2018 the Committee reviewed its terms of reference and approved minor changes to the terms.

The Committee’s responsibilities are complemented by those of the Audit Committee, which is responsible for reviewing significant breaches of the Code of Business Principles as part of its remit to review risk management and for overseeing the independent assurance programme for the USLP.

The Committee’s terms of reference are set outwww.unilever.com/ corporategovernance and details of the USLP Steering Team atwww.unilever.com/sustainable-living/our-strategy/our-sustainability-governance/

MEMBERS OF THE COMMITTEE

The Corporate Responsibility Committee comprises threeNon-Executive Directors: Strive Masiyiwa (Chair), Feike Sijbesma and Youngme Moon. The Chief Marketing & Communications Officer and the Chief Sustainability Officer attend the Committee’s meetings. The Chief Business Integrity Officer also attends to present Unilever’s company report that covers cases under Unilever’s Code of Business Principles (the Code) as well as updates on third-party compliance, product quality and safety.

MEETINGS

Meetings are held quarterly and ad hoc as required – four were held in 2018. The Committee Chairman is responsible for reporting the findings from meeting to the Boards, thus ensuring that the Boards can fulfil their oversight responsibilities.

Following the Committee’s terms of reference and Unilever’s principal risks and priorities, the Committee’s agenda covers the Code and third-party compliance, alongside litigation, occupational and product safety, the USLP and corporate reputation as well as a range of strategic and current issues. In addition to the areas listed below, in 2018 the Committee also reviewed topics such as media communications, the process for integrating business acquisitions and progress on alternatives to animal testing.

CODE OF BUSINESS PRINCIPLES

The Code and associated Code Policies set out the standards of conduct expected of all Unilever employees in their business endeavours. Compliance with these is an essential element in ensuring Unilever’s continued business success and is identified as an ethical and legal and regulatory risk to Unilever.

While the Chief Executive Officer is responsible for implementing these principles, supported by the Global Code and Policy Committee, the Corporate Responsibility Committee is responsible for oversight of the Code and Code Policies, ensuring that they remain fit for purpose and are appropriately applied. It maintains close scrutiny of the mechanisms for implementing the Code and Code Policies. This is vital as compliance is essential to promote and protect Unilever’s values and standards, and hence the good reputation of the Group. At each meeting the Committee reviews an analysis of investigations intonon-compliance with the Code and Code Policies and is alerted to any trends arising from these investigations.

The Chief Legal Officer and Group Secretary reports to the Committee on litigation and regulatory matters which may have a reputational impact including environmental issues, bribery and corruption compliance and competition law compliance. The Committee studied how compliance was achieved during 2018. For further information please see notes 19 and 20 to the consolidated financial statements.

As another of its other priorities in 2018, the Committee also scrutinised the mechanisms for anti-bribery compliance. The primary mechanism is to understand the profiles of the markets Unilever operates in and to ensure that there are robust internal and third-party compliance programmes in place. These are complemented by training for all employees in tandem with advanced capacity building for those in the Business Integrity and Legal functions.

PRINCIPLES AND STANDARDS FOR THIRD PARTIES

The Committee retained its focus on third-party compliance in 2018. Extending Unilever’s values to third parties remains a priority, not only to generate continued responsible growth and a positive social impact on the industry, but to counter the significant risk thatnon-compliance by third parties can pose, particularly in the context of increasing regulation around the world.

The Committee tracks compliance with Unilever’s Responsible Sourcing Policy (RSP) for suppliers and its Responsible Business Partner Policy (RBPP) for customers and distributors. Together they set out Unilever’s requirements that third parties conduct business with integrity, openness and respect for universal human rights and core labour principles. Sourcing 100% of Unilever’s procurement spend in line with the RSP is also a target within the USLP.

The policies enable Unilever to evaluate risk and provide the right measures to address the diversity of market conditions in which it operates and the range of third parties it works with. The Committee was briefed on progress. For the RSP, this detailed the number of suppliers making a positive commitment to the policy, greater alignment on industry standards via the process of mutual recognition and a substantial increase in site audits and resulting corrective action plans. Enhanced anti-bribery and corruption screening was also put in place. The training and enhancements developed for the RBPP include new IT tools launched in over 180 countries, simpler assessment processes, enhanced due diligence and risk mitigation plans.

46Governance ReportAnnual Report on Form 20-F 2018


SAFETYHighlights for the year ended 31 December

We continue

    2018   2017   % change 

Turnover ( million)


50,982


53,715


(5.1


Operating profit ( million)


12,535


8,857


41.5


Underlying operating profit ( million)*


9,359


9,400


(0.4


Profit before tax ( million)


12,383


8,153


51.9


Net profit ( million)


9,808


6,486


51.2


Diluted earnings per share ()


3.48


2.15


62.0


Underlying earnings per share ()*


2.36


2.24


5.2


Net finance costs were481 million in 2018 compared with877 million in 2017, which included aone-off cost of382 million for the buyback of the Unilever NV preference shares. The cost of financing net borrowings was57 million higher than 2017. The increase was primarily driven by an increase in net debt which was partially offset by lower interest rates and a prior yearone-off in Brazil relating to the interest element of an indirect tax amnesty programme. The average interest rate on net debt reduced to 2.2% from 2.7% in 2017. The pensions financing charge was25 million, down from96 million in 2017 reflecting a lower pension deficit at the beginning of 2018.

A monetary gain of122 million was recorded following adoption of IAS 29 ‘Financial Reporting in Hyperinflationary Economies’ in Argentina (see note 1) from 1 July 2018.

The effective tax rate was 21.1% compared with 20.8% in the prior year. In both years the rate was low relative to longer term norms, due to the significant impact on tax of the disposals of our effortsspreads businesses in 2018 and US tax reform in 2017.

Net profit from joint ventures and associates was up 19% at185 million, with the increase coming mainly from a gain on disposal of the spreads business of the Portuguese joint venture. Other income fromnon-current investments was22 million versus18 million in the prior year.

Diluted earnings per share were up 62.0% at3.48. The increase was mainly driven by the4,331 million gain on disposal for the spreads businesses, improvement in operating margin and the impact of the share buyback programmes.

The independent auditors’ reports issued by KPMG Accountants N.V. and KPMG LLP on the consolidated results of the Group, as set out in the financial statements, were unqualified and contained no exceptions or emphasis of matter. For more details see pages 67 to achieve74.

The consolidated financial statements have been prepared in accordance with IFRS as adopted by the EU and IFRS as issued by the International Accounting Standards Board. The critical accounting policies and those that are most significant in connection with our Vision Zero strategy: Zero Fatalities; Zero Injuries; Zero Motor Vehicle Accidents; Zero Process Incidents;financial reporting are set out in note 1 on pages 79 to 82 and Zero Toleranceare consistent with those applied in 2017.

*

Certain measures used in our reporting are not defined under IFRS. For further information about these measures, please refer to the commentary onnon-GAAP measures on pages 23 to 26.

^

Wherever referenced in this report, underlying sales growth (USG) and underlying price growth (UPG) do not include price growth in Venezuela for the whole of 2018 and in Argentina from July 2018. USG and UPG for 2017 do not include Q4 2017 price growth in Venezuela. See pages 23 and 24 onnon-GAAP measures for further details.

20Strategic ReportAnnual Report on Form 20-F 2018


The Group has revised its operating segments to align with the new structure under which the business is managed. Operating segment information is now provided based on three product areas: Beauty & Personal Care, Foods & Refreshment and Home Care.

BEAUTY & PERSONAL CARE

    2018   2017     % change 
Turnover ( million)     20,624      20,697    (0.3
Operating profit ( million)   4,130    4,103    0.7 
Underlying operating profit ( million)   4,508    4,375    3.0 
Operating margin (%)   20.0    19.8    0.2 
Underlying operating margin (%)   21.9    21.1    0.8 
Underlying sales growth (%)   3.1    2.9   
Underlying volume growth (%)   2.5    1.4   
Underlying price growth (%)   0.6    1.5      

KEY DEVELOPMENTS

Turnover declined by 0.3% including a negative currency impact of Unsafe Behaviour7.0%. Acquisitions contributed 3.9% and Practices. This vision is supportedunderlying sales growth was 3.1%. Dove delivered another year of broad-based growth. Skin care grew strongly helped by innovations such as the new Vaseline range with clinical strength moisturisation and other brands addressing the fast growing naturals trend including Love, Beauty & Planet. Growth in skin cleansing was helped by innovations such as the relaunch of Lifebuoy with active silver, new premium formats including Dove exfoliating body polishes and our new cleansing brands such as Korea Glow. Deodorants delivered good volume growth helped by strong performance on Dove but pricing was muted. The newly acquired Schmidt’s grew strongly. Sales in oral care were flat due to ongoing competitive pressures. Prestige performed well with double digit growth on Hourglass, Ren, Living Proof and Kate Sommerville as well as improved momentum on Dermalogica and Murad. Dollar Shave Club grew double digits and continued to build scale in the US.
Underlying operating profit increased by133 million. Underlying operating margin and underlying sales growth improvement added302 million and136 million respectively, offset by a484 million adverse impact from exchange rate movements. Acquisition related activities contributed179 million. Underlying operating margin improvement reflects brand and marketing efficiencies from zero based budgeting.

FOODS & REFRESHMENT

    2018   2017    % change 
Turnover ( million)     20,227      22,444   (9.9
Operating profit ( million)   7,245    3,616   100.4 
Underlying operating profit ( million)   3,534    3,737   (5.4
Operating margin (%)   35.8    16.1   19.7 
Underlying operating margin (%)   17.5    16.7   0.8 
Underlying sales growth (%)   2.0    2.7  
Underlying volume growth (%)   1.3    (0.2 
Underlying price growth (%)   0.7    3.0     

KEY DEVELOPMENTS

Turnover declined by 9.9% including a negative currency impact of 5.6%. Acquisitions and disposals had an unfavourable impact of 6.4% reflecting the disposal of the spreads business. Underlying sales growth was 2.0% coming from volume growth of 1.3% and price growth of 0.7%. Ice cream had another strong year helped by innovations on our premium brands which included a new Magnum praline variant and anon-dairy range of Ben & Jerrys. The launch of Kinder® ice cream and good weather helped to drive strong ice cream growth in Europe. Sales in tea grew modestly: emerging markets growth was driven by good performance on core brands like Brooke Bond in India whilst in developed markets challenges in black tea offset good growth from Pukka and the new organic Lipton

range. In savoury, Knorr was helped by good performance of cooking products in emerging markets and more organic and natural innovations such as a new ‘soup in glass’ range. In dressings, campaigns centred around Hellmann’s purpose to fight food waste helped to increase brand equity, but sales were held back by promotional intensity particularly in the US. Our actions to transform the portfolio are working: strong innovations including Knorr rice and pasta pots as well as our new brands Red Red, PrepCo and Mãe Terra helped us build scale in the fast growing snacking segment.

Underlying operating profit declined by203 million including a236 million adverse contribution from exchange rate movements. Underlying operating margin improvement added247 million and underlying sales growth contributed56 million. Acquisition and disposal related activities had an overall negative impact of270 million mainly due to loss of profit of the spreads business from the date of its disposal on 2 July 2018. Underlying operating margin improvement reflects strong gross margin improvement and lower overheads despite an adverse impact from the spreads disposal.

HOME CARE

    2018   2017     % change 
Turnover ( million)     10,131      10,574    (4.2
Operating profit ( million)   1,160    1,138    1.9 
Underlying operating profit ( million)   1,317    1,288    2.3 
Operating margin (%)   11.5    10.8    0.7 
Underlying operating margin (%)   13.0    12.2    0.8 
Underlying sales growth (%)   4.2    4.4   
Underlying volume growth (%)   2.3    2.1   
Underlying price growth (%)   1.9    2.3      

KEY DEVELOPMENTS

Turnover declined by 4.2% including an adverse currency impact of 8.3%. Underlying sales growth was 4.2%, coming from volume growth of 2.3% and price growth of 1.9%. Home and hygiene grew strongly led by Sunlight which was helped by a new communication focussed on building functional awareness, as well as the continued success of Domestos toilet blocks. In fabric sensations, Comfort was helped by market development in India and China as well as the launch into Germany. Fabric solutions grew strongly helped by our Code Policystrategy to encourage consumers in emerging markets to uptrade to premium formulations like Surf Excel Matics in India, and innovations such as Omo eco active with recycled packaging, plant extracts and naturally derived fragrances. Seventh Generation also grew well.
Underlying operating profit increased by29 million, including a144 million adverse contribution from exchange rate movements. Underlying operating margin improvement contributed113 million. Underlying sales growth and acquisition and disposal related activities added55 million and5 million respectively. Underlying operating margin improvement was mainly due to lower overheads and brand and marketing efficiencies.

Annual Report on Form 20-F 2018Strategic Report21


FINANCIAL REVIEWCONTINUED

CASH FLOW

Cash flow from operating activities was9.0 billion, a decline of0.5 billion compared to the prior year. Free cash flow was5.0 billion, a reduction of0.4 billion on Occupational Health & Safety. Unilever reports safety datathe prior year. The reductions reflected the impact of currency devaluation and higher working capital, including a0.4 billion increase arising from Octoberthe disposal of spreads.

    € million
2018
   million
2017
 
Operating profit   12,535   8,857 

Depreciation, amortisation and impairment


1,747


1,538


Changes in working capital


(793


(68

Pensions and similar obligations less payments


(128


(904

Provisions less payments


55


200


Elimination of (profits)/losses on disposals


(4,299


(298

Non-cash charge for share-based compensation


196


284


Other adjustments


(266


(153

Cash flow from operating activities


  9,047


  9,456


Income tax paid


(2,294


(2,164

Net capital expenditure


(1,424


(1,621

Net interest and preference dividends paid


(367


(316

Free cash flow*


4,962


5,355


Net cash flow (used in)/from investing activities


4,644


(5,879

Net cash flow (used in)/from financing activities


(11,548


(1,433

*

Certain measures used in our reporting are not defined under IFRS. For further information about these measures, please refer to the commentary onnon-GAAP measures on pages 23 to 26.

Net inflow from investing activities was4.6 billion, an increase of10.5 billion compared to September. Our Total Recordable Frequency Rate (TRFR)the prior year. The increase reflects proceeds of7.2 billion from the disposal of spreads and higher spend on acquisitions during the prior year.

The net outflow from financing activities was11.5 billion, compared with1.4 billion in the prior year. In 2018 there were repayments of financial liabilities of6.6 billion compared with2.6 billion in 2017; and an outflow from changes in short-term borrowings of4.0 billion, compared with an inflow of2.7 billion in 2017. The cash outflow in respect of the repurchase of shares in 2018 was6.0 billion, compared with5.0 billion in the prior year.

BALANCE SHEET

At 31 December 2018, Unilever’s combined market capitalisation was121.8 billion compared with127.9 billion at the end of 2017.

Goodwill and intangible assets increased by1.1 billion mainly coming from the acquisition of Quala and restatement of goodwill in relation to adoption of IAS 29 ‘Financial Reporting in Hyperinflationary Economies’ in Argentina (see note 1 October 2016and note 9). The increase was partially offset by impairment of Blueair. All material goodwill and indefinite-life intangible assets have been tested for impairment with no charge recognised during the year other than for Blueair. Othernon-current assets decreased by0.4 billion mainly due to 30 September 2017 wenta reduction in the value of pension assets.

    € million
2018
    million
2017
 
Goodwill and intangible assets   29,493    28,401 

Othernon-current assets


14,482


14,901


Current assets


15,481


16,983


Total assets


59,456


60,285


Current liabilities


19,772


23,177


Non-current liabilities


27,392


22,721


Total liabilities


47,164


45,898


Shareholders’ equity


11,572


13,629


Non-controlling interest


720


758


Total equity


12,292


14,387


Total liabilities and equity


  59,456


  60,285


Current assets decreased from 1.01 accidents per 1 million hours worked17.0 billion to 0.89,15.5 billion mainly reflecting the reduction in assets held for disposals as a result of the continuous focuscompletion of the spreads transactions on safety2 July 2018. Current liabilities were19.8 billion, a decrease of3.4 billion compared to the prior year. The decrease was due to repayment of short-term liabilities which were replaced by long term borrowings.Non-current liabilities were27.4 billion, an increase of4.7 billion on the prior year. During the year the Group issued bonds worth over6.0 billion and repaid notes of about1.0 billion. See note 15C for analysis of bonds and other loans.

The table below shows the movement in high risk areas. In manufacturing, we focused on process safetynet pension liability during the year. The increase from0.6 billion at the beginning of the year to0.9 billion at the end of 2018 was primarily due to reduced pension assets, driven by adverse equity markets towards the end of 2018.

    € million
2018
1 January(561

Current service cost

(220

Employee contributions

17

Actual return on plan assets (excluding interest)

(1,108

Net interest cost

(25

Actuarial gain

671

Employer contributions

383

Currency retranslation

26

Other movements(a)

(57

31 December

(874

(a)

Other movements relate to special termination benefits, past service costs including losses/(gains) on curtailment, settlements and other immaterial movements. For more details see note 4B on pages 87 to 92.

FINANCE AND LIQUIDITY

Approximately0.8 billion (or 26%) of the Group’s cash and cash equivalents are held in the parent and central finance companies, for maximum flexibility. These companies provide loans to our subsidiaries that are also funded through standardsretained earnings and enhanced individual qualificationsthird party borrowings. We maintain access to global debt markets through an infrastructure of short and long-term debt programmes. We make use of plain vanilla derivatives, such as well as through our partner programme, Safety to Win. As a result of these initiatives, we achieved a 46% reduction in process safety incidents versus prior years. On our construction sites, we have focused on a global Work at Heights training programme. We continue to promote safe driving with the help of our new standards on safe travelinterest rate swaps and foreign exchange contracts, to help mitigate road related risks. More detail is provided in notes 16, 16A, 16B and 16C on pages 110 to 115.

BUSINESS INTEGRITYThe remaining2.4 billion (74%) of the Group’s cash and cash equivalents are held in foreign subsidiaries which repatriate distributable reserves on a regular basis. For most countries, this is done through dividends free of tax. This balance includes154 million (2017:206 million, 2016:240 million) of cash that is held in a few countries where we face cross-border foreign exchange controls and/or other legal restrictions that inhibit our ability to make these balances available in any means for general use by the wider business.The cash will generally be invested or held in the relevant country and, given the other capital resources available to the Group, does not significantly affect the ability of the Group to meet its cash obligations.

We communicateclosely monitor all our Codeexposures and Code Policies internally and externally. Our employees must undertake mandatory annual training on our Code and Code Policies via online training modules as well as making an annual business integrity pledge. The Code and Code Policies reflect our desire to fight corruption in all its forms. We are committed to being ano-bribe business and eradicating any practices or behaviours in this regard. Thiszero-tolerance policy extends to our employees, contractors, third parties, new acquisitions and joint-ventures. In 2017 we deployed new mandated interactive training on anti-bribery for all employees. Our Business Integrity guidelines include clear processes for managing Code breaches. In 2017, we closed 1,654 incidents across all areas of our Code and Code Policies, with 709 confirmed breaches. In 2017, we terminated 279 employees. Business integrity risks are included as part of our ethical and legal and regulatory principal risks (see page 31).counter-party limits.

Unilever also requires its third-party business partners to adhere to business principles consistent with our own. These expectations are set outhas committed credit facilities in our Responsible Sourcing Policy (RSP) and Responsible Business Partner Policy, which underpin our third-party compliance programme. We identify high risk partners who undergo specific due diligence via our third-party compliance programme. In 2017, we closed 85 key incidents across all areas of our RSP.place for general corporate purposes. The undrawn bilateral committed credit facilities in place on 31 December 2018 were $7,865 million.


1622 Strategic Report  Annual Report on Form 20-F 20172018


CONTRACTUAL OBLIGATIONS AT 31 DECEMBER 2018


million


Total


million
Due
within

1 year


million
Due
in1-3
years


million
Due
in3-5
years


million
Due in
over 5
years


Long-term debt


24,428


2,950


4,533


4,683


12,262


Interest on financial liabilities


3,723


467


800


628


1,828


Operating lease obligations


2,464


481


758


501


724


Purchase obligations(a)


520


421


94


1


4


Finance leases


187


20


37


34


96


Other long-term commitments


1,390


678


590


95


27


Other financial liabilities


150


149


1


Total


32,862


5,166


6,813


5,942


14,941


(a)

For raw and packaging materials and finished goods.

Further details are set out in the following notes to the consolidated financial statements: note 10 on pages 100 and 101, note 15C on page 108 and 109, and note 20 on pages 120 to 122. Unilever is satisfied that its financing arrangements are adequate to meet its working capital needs for the foreseeable future. In relation to the facilities available to the Group, borrowing requirements do not fluctuate materially during the year and are not seasonal.

AUDIT FEES

Included within operating profit is21 million (2017:20 million) paid to the external auditor, of which16 million (2017:14 million) related to statutory audit services.

OUR PARTNERSNON-GAAP MEASURES

STAKEHOLDER ENGAGEMENT AND PARTNERSHIP IS ESSENTIAL TO GROW OUR BUSINESS AND TO REACH THE AMBITIOUS TARGETS SET OUT IN THE USLP.

Certain discussions and analyses set out in this Annual Report and Accounts (and the Additional Information for US Listing Purposes) include measures which are not defined by generally accepted accounting principles (GAAP) such as IFRS. We believe this information, along with comparable GAAP measurements, is useful to investors because it provides a basis for measuring our operating performance, and our ability to retire debt and invest in new business opportunities. Our Code of Business Principlesmanagement uses these financial measures, along with the most directly comparable GAAP financial measures, in evaluating our operating performance and Code Policies guide how we interact with our partners – among others suppliers, customers, governments,value creation.Non-GovernmentalNon-GAAP Organisations (NGOs) and trade associations. Only authorised and appropriately trained employeesfinancial measures should not be considered in isolation from, or representatives can engage with these groups andas a record should be kept of all interactions. All engagement must be conducted: in a transparent manner with honesty, integrity and openness;substitute for, financial information presented in compliance with GAAP. Wherever appropriate and practical, we provide reconciliations to relevant GAAP measures.

EXPLANATION AND RECONCILIATION

OFNON-GAAP MEASURES

Unilever uses ‘constant rate’ and ‘underlying’ measures primarily for internal performance analysis and targeting purposes. We present certain items, percentages and movements, using constant exchange rates, which exclude the impact of fluctuations in foreign currency exchange rates. We calculate constant currency values by translating both the current and the prior period local currency amounts using the prior period average exchange rates into euro, except for countries where the impact of consumer price inflation rates has escalated to extreme levels. In these countries, the local currency amounts before the application of IAS 29 are translated into euros using the period closing exchange rate.

The table below shows exchange rate movements in our key markets.


Annual
  average
rate in

2018


Annual
  average
rate in

2017


Brazilian real (1 = BRL)

  4.282    3.573 

Chinese yuan (1 = CNY)


7.807


7.608


Indian rupee (1 = INR)


80.730


73.258


Indonesia rupiah (1 = IDR)


16831


15011


Philippine peso ( 1 = PHP)


62.379


56.596


UK pound sterling (1 = GBP)


0.884


0.876


US dollar (1 = US$)


1.185


1.123


In the following sections we set out our definitions of the followingnon-GAAP measures and international lawsprovide reconciliations to relevant GAAP measures:

underlying sales growth;
underlying volume growth;
underlying price growth;
non-underlying items;
underlying earnings per share;
underlying operating profit and underlying operating margin;
underlying effective tax rate;
constant underlying earnings per share;
free cash flow;
return on assets;
net debt; and
return on invested capital.

UNDERLYING SALES GROWTH

Underlying Sales Growth (USG) refers to the increase in turnover for the period, excluding any change in turnover resulting from acquisitions, disposals and changes in currency. We believe this measure provides valuable additional information on the underlying sales performance of the business and is a key measure used internally. The impact of acquisitions and disposals is excluded from USG for a period of 12 calendar months from the applicable closing date. Turnover from acquired brands that are launched in countries where they were not previously sold is included in USG as such turnover is more attributable to our existing sales and distribution network than the acquisition itself. Also excluded is the impact of price growth from countries where the impact of consumer price inflation (CPI) rates has escalated to extreme levels.

There are two countries where we have determined extreme levels of CPI exist. The first is Venezuela where in Q4 2017 inflation rates exceeded 1,000% and management considered that the situation would persist for some time. Consequently, price growth in Venezuela has been excluded from USG since Q4 2017. The second is Argentina, which from Q3 2018 has been accounted for in accordance with Unilever’s values (see page 1).IAS 29, and thus from Q3 2018 Argentina price growth is excluded from USG. The adjustment made at Group level as a result of these two exclusions was a reduction in price growth of 32.4% for the year. This treatment for both countries will be kept under regular review.

SUPPLIERS

Delivering Unilever’s VisionPrior to Q3 2018 USG only excluded the impact of growing our business, whilst decoupling our environmental footprint from our growth and improving our positive social impact, is not something we can achieve on our own. Every day, we work with thousands of suppliers who are helping us achieve successprice changes in the countries where consumer price inflation has escalated to extreme levels of 1,000% or more. However, given the need to account for our products are sold. Our suppliers help us innovate, create value, capacity and capability, deliver quality and service and drive market transformationArgentinian business in accordance with responsible and sustainable living.

A significant portion of our growth comes from innovation, delivering leading-edge products into the marketplace. We anticipate that around 70% of our innovations are linked to working with our strategic suppliers. That’s why we invest in long-term mutually beneficial relationships with our key suppliers through our Partner to Win programme, so we can share capabilities andco-innovate for shared growth. Partner to Win is about shaping the next horizon together and is a unique opportunity to unlock value for Unilever and our partners. It helps us strengthen supplier and customer collaboration, it enables improved overallend-to-end operational efficiency and mutual capability building and sharing.

CUSTOMERS

In a fragmented channel landscape, those companies that best serve their shoppers and customers with bespoke solutions will benefit most. Unilever serves consumers through ten different channels: hyper and supermarkets,e-commerce, out of home, drug stores, small stores, discounters, Food Solutions, Unilever International, prestige channel and global retail. We serve around 25 million retail stores globally of which we cover eight million directly and another 17 million indirectly through wholesale and cash & carry. Unilever has had a historic competitive advantage through its distributor network covering around seven million stores, which contribute to approximately 20% of our turnover.

Hyper and supermarkets represent around 50% of our current turnover and are under growth and margin pressure with shoppers moving to discounters ande-commerce. Experiential concepts play an important role to ensure that Unilever brands enjoy the best positioning and visibility in store. To respond to these challenges in Europe, in partnership with our customer Carrefour, we created the ‘Aisle of Joy’ concept which is currently in over 1,000 stores and driving ice cream growth. Similarly, our ‘What’s for dinner’ programme has approximately 190,000 touchpoints in Europe and ensures proximity of Unilever food products with relevant ingredients.

We are rolling out a technology solution to connect retailers to distributors. We are also upskilling small-scale retailers by professionalising their store operations. For instance, our Kabisig Summits in the Philippines train both retailers and their suppliers in stock control, financial management, sales and customer service. To date, over 87,000 owners have attended summits, delivering a significant uplift in our turnover.

In Kenya,IAS 29, we have formed a partnershipnow also excluded price changes in countries that need to be accounted for in accordance with MastercardIAS 29. Prior to offer a low risk credit solutionQ3 2018 there were no countries that were accounted for the purchase of Unilever products. This not only increases the earnings potential of retailers, but ensures that our

productsunder IAS 29, so no restatements are stocked and available. If the pilot is successful we hope to roll the partnership out to other markets where we have a large number of small-scale retailers.

E-commerce remains a key and growing channel. Our online business is now close to delivering 4% of Unilever turnover. We are actively drivinge-commerce sales in 39 markets. Our focus is to build a balancede-commerce business model, growing acrosse-retailers, bricks and mortar online sales anddirect-to-consumer businesses. We continue to roll out our Perfect Store concept to online channels, ensuring shoppers can find variants of Unilever brands quickly and easily, regardless of screen size or device.

GOVERNMENTS

Weco-operate with and engage with governments, regulators and legislators, both directly and through trade associations, in the development of proposed legislation and regulation which may affect our business interests. All employees involved in political engagement must promote our corporate principles and comply with our Code of Business Principles and Code Policies. We do not support or fund political parties or candidates or any groups that promote party interests. No political contributions were made in 2017. Our participation in policy discussions is varied, covering macro topics like climate change, through to detailed product safety standards. We engage with stakeholders directly as Unilever or through membership of representative organisations, including trade associations.

TRADE ASSOCIATIONS

We are members of and support a number of trade associations and similar organisations which help us to advance our public policy interests. We keep a record of our trade association memberships and membership fees, which is regularly updated. We also engage with peer companies, both individually and in coalitions, on issues of mutual interest. This includes working together to implement sustainable business strategies and drive change.

These associations reflect our global scale and presence across several product categories. We list our major global memberships in the ‘Engaging with Stakeholders’ section on our website. We are registered in the Transparency Register of the European Union. Our trade association memberships in the US can be found on the FAQ section of the Unilever USA website.

Our businesses are active at a local level participating in trade associations in our markets and contributing to public policy and interest group debates in areas such as safety and environmental impact, sustainable sourcing and nutrition. They do so in clear alignment with global priorities and closely follow local laws and Unilever’s Code of Business Principles and Code Policies.

NON-GOVERNMENTAL ORGANISATIONS

We are building transformational partnerships in collaboration with NGOs and other stakeholders who share our vision for a more sustainable future. These partnerships are instrumental in improving the quality of people’s lives, achieving our USLP targets and driving the growth of our business.

In collaboration with NGOs, we build programmes on the ground to implement our brands’ social missions in addition to advancing our efforts in areas such as sustainable sourcing and distribution – often in partnership with governments and other private sector organisations. We drive scale through new business models, digital technologies and external financing.

We recognise that our actions alone cannot achieve the system change necessary to overcome the world’s major challenges, such as climate change and poverty. Our leadership engages with stakeholders through platforms such as the World Economic Forum, UN Global Compact, the World Business Council for Sustainable Development and the Consumer Goods Forum, championing a more inclusive model of capitalism and the pursuit of long-term value creation for the benefit of multiple stakeholders. Partnerships with NGOs are crucial to deliver the United Nations Sustainable Development Goals (see page 15).necessary.


Annual Report on Form 20-F 20172018 Strategic Report 1723


DELIVERING LONG-TERM VALUE FOR OUR STAKEHOLDERS

FINANCIAL REVIEWCONTINUED


The reconciliation of USG to changes in the GAAP measure turnover is as follows:

OUR SHAREHOLDERS

TOTAL GROUP  2018
vs 2017
  2017
vs 2016
 

Turnover growth (%)(a)


(5.1


1.9


Effect of acquisitions (%)


2.0


1.3


Effect of disposals (%)


(3.0


(0.4

Effect of exchange rates (%)(b)


(6.7


(2.1

Underlying sales growth (%)(b)


2.9


3.1


BEAUTY & PERSONAL CARE


2018

    vs 2017


2017

    vs 2016


Turnover growth (%)(a)


(0.3


2.6


Effect of acquisitions (%)


3.9


1.8


Effect of disposals (%)


(0.1

Effect of exchange rates (%)(b)


(7.0


(1.9

Underlying sales growth (%)(b)

   3.1   2.9 

FOODS & REFRESHMENT


  2018
vs 2017
  2017
vs 2016
 

Turnover growth (%)(a)


(9.9


(0.4

Effect of acquisitions (%)


0.8


0.2


Effect of disposals (%)


(7.2


(0.8

Effect of exchange rates (%)(b)


(5.6


(2.4

Underlying sales growth (%)(b)


2.0


2.7


HOME CARE  2018
vs 2017
  2017
vs 2016
 

Turnover growth (%)(a)


(4.2


5.6


Effect of acquisitions (%)


0.5


3.1


Effect of disposals (%)


(0.2


(0.2

Effect of exchange rates (%)(b)


(8.3


(1.7

Underlying sales growth (%)(b)


4.2


4.4


DESPITE CONTINUED VOLATILITY IN OUR MARKETS, OUR PROVEN MODEL OF LONG-TERM COMPOUNDING

(a)

Turnover growth is made up of distinct individual growth components, namely underlying sales, currency impact, acquisitions and disposals. Turnover growth is arrived at by multiplying these individual components on a compounded basis as there is a currency impact on each of the other components. Accordingly, turnover growth is more than just the sum of the individual components.

(b)

For 2018 underlying price growth in Venezuela (from January 2018) and Argentina (from July 2018) has been excluded from underlying sales growth and an equal and opposite adjustment made in effect of exchange rate. For 2017 only Q4 price growth in Venezuela has been excluded.

UNDERLYING VOLUME GROWTH AND SUSTAINABLE VALUE CREATION ENSURED ANOTHER GOOD YEAR FOR SHAREHOLDERS.

Underlying salesvolume growth (UVG) is part of USG and means, for 2017 was up 3.1%the applicable period, the increase in turnover in such period calculated as the sum of (i) the increase in turnover attributable to the volume of products sold; and (ii) the increase in turnover attributable to the composition of products sold during such period. UVG therefore excludes any impact on USG due to changes in prices.

UNDERLYING PRICE GROWTH

Underlying price growth (UPG) is part of USG and means, for the applicable period, the increase in turnover attributable to changes in prices during the period. UPG therefore excludes the impact to USG due to (i) the volume of products sold; and (ii) the composition of products sold during the period. In determining changes in price we exclude the impact of price growth in Argentina and Venezuela as explained in USG above.

The relationship between USG, UVG and UPG is set out below:

    2018
    vs 2017
   2017
    vs 2016
 

Underlying volume growth (%)


1.9


0.8


Underlying price growth (%)(a)


0.9


2.3


Underlying sales growth (%)


2.9


3.1


(a)

For 2018 underlying price growth in Venezuela (from January 2018) and Argentina (from July 2018) has been excluded from underlying price in the table above and an equal and opposite adjustment made in the effect of exchange rates. For 2017 only Q4 price growth in Venezuela has been excluded.

Refer to page 21 for the relationship between USG, UVG and UPG for each of the categories.

NON-UNDERLYING ITEMS

Severalnon-GAAP measures are adjusted to exclude items defined asnon-underlying due to their nature and/or frequency of occurrence.

Non-underlying items within operating margin was 17.5%, a riseprofit are: gains or losses on business disposals, acquisition and disposal related costs, restructuring costs, impairments and other significantone-off items within operating profit
Non-underlying items not in operating profit but within net profit are: significant and unusual items in net finance cost, monetary gain/(loss) arising from hyperinflationary economies, share of 110 basis points. Turnover growthprofit/(loss) of joint ventures and associates and taxation
Non-underlying items are bothnon-underlying items within operating profit and thosenon-underlying items not in operating profit but within net profit

Refer to note 3 for 2017 was 1.9% and operating margin was 16.5%. details ofnon-underlying items.

UNDERLYING EARNINGS PER SHARE

Underlying earnings per share was2.24 a rise(underlying EPS) is calculated as underlying profit attributable to shareholders’ equity divided by the diluted combined average number of 10.7% and dividends were increased 12%, reflecting Unilever’s confidence in futureshare units. In calculating underlying profit growth and cash generation. Diluted earnings per share wasattributable to shareholders’ equity, net profit attributable to shareholders’ equity is adjusted to eliminate the2.15. For information on ournon-GAAPpost-tax impact ofnon-underlying items. This measure see pages 22 to 24.

Overreflects the last three years, our sustainable value creation model has continued to deliver for shareholders. Between 2015 and 2017, average underlying sales growth rose 3.6% a year and underlying operating margin rose 190 basis points to 17.5%. Turnover grew an average of 3.6% a year and underlying earnings perfor each share was up 7.8% a year. During this period, we generated15 billion of free cash flow while a high-teens return on capital was maintained. Dividends rose an average of 8% a year and our share price has risen 58% for PLC shareholders and 46% for NV shareholders.

Over the past three years total shareholder returns have increased 49%, reflecting Unilever’s enduring strengths: a portfolio ofpurpose-led global and local brands, a presence in more than 190 countries with 58% of turnover generated from emerging markets, deep penetration and expertise in channels reaching 2.5 billion consumers every day, and a talent pool of local management – over 70% of our leaders are local.

Generating growth ahead of our markets remains a principal objective for our categories across most of our geographies. While overall market growth remains subdued, especially in developing markets, conditions are starting to pick up in many emerging markets. The implementation of C4G and the steps we have taken to drive efficiency gains and margin expansion, means we have the resources to invest behind our brands to continue to deliver top and bottom line growth (see page 28 for risks).

DEVELOPMENTS IN 2017

With this track record in mind, the Boards undertook a detailed and comprehensive review of options to accelerate sustainable value creation. The review, announced in February 2017 and completed by early April 2017, highlighted the quickened pace of change in our markets and the opportunity to unlock more shareholder value, at a faster pace over the next three years by accelerating our C4G change programme and driving targeted savings throughzero-based budgeting and, in the supply chain, our 5S programme (see page 10).

Targets for value creation were announced as partunit of the review. These include underlying sales growth (USG) aheadGroup.

Refer to note 7 on page 96 for reconciliation of our markets, which in current market conditions is expectednet profit attributable to translate into USG of3-5%. Overall underlying operating margin is targeted to expand to 20% in 2020 compared to 17.5% in 2017, supported by an increase in expected cumulative savings during the three-year period 2017-2019 from4 billion to6 billion. Balance sheet leverage is targeted at 2.0x Net Debt to EBITDA consistent with a credit rating of at least A/A2. A5 billion share buyback was completed in 2017 and further returns to shareholders will be assessed versus the opportunity to undertake value-enhancing acquisitions. Meanwhile a high-teens return on invested capital is targeted as well as sustainable, attractive and growing dividends.

Having embedded C4G, we also started to combine our Foods and Refreshment categories to create a world-leading business with turnover of more than20 billion. The category will unlock future growth more quickly and result in faster margin progression and took effect from 1 January 2018. It is headquartered in the Netherlands where we are also establishing a Global Foods Innovation Centre.

As previously announced, the Boards are conducting a review of the dual-headed legal structure. This review is progressing well and the Boards consider that unification with a single share class would be in the best interests of Unilever and its shareholders as a whole, providing greater ongoing strategic flexibility for value-creating portfolio change. The review by the Boards is continuing and the outcome will be announced in due course. Whatever the outcome, upon any unification, the Boards intend to: maintain listings in the Netherlands, United Kingdom and United States; continue to apply both the UK and Dutch corporate governance codes and terminate the NV preference shares.

EVOLVING OUR PORTFOLIO

Our brand portfolio continues to evolve to match our categories’ strategic priorities, resulting in the sale of assets that no longer fit our growth model or the acquisition of assets that take us into new market segments and build new market positions. This active portfolio management means that in the past eight years we have sold5.8 billion of turnover (excluding Spreads), mainly in the lower growth Foods businesses. During that same period, we have acquired approximately4.7 billion of turnover. With the exception of brands launched in countries where they were not previously sold, acquisitions and disposals only contributeshareholders’ equity to underlying sales growth from 12 months after completion. The acquisitions and disposals made or announced since 2015 are expectedprofit attributable to add one percentage point to our ongoing underlying sales growth rate from 2019.

Our acquisitions approach identifies brands that provide Unilever with a position in higher growth segments, some of which could become the1 billion brands of the future. These include Personal Care (eg Carver Korea) and prestige businesses (eg Living Proof) as well as premium price brands in mass markets (eg Sir Kensington’s), new channels (eg Dollar Shave Club) and naturals segments (eg Seventh Generation). The acquired businesses are often run using flexible business models, preserving their entrepreneurial culture.

During 2017, we announced the acquisition of Carver Korea for2.28 billion, the fastest growing skincare business in South Korea giving access to the North Asian skincare markets. Hourglass was acquired as a luxury colour cosmetics brand, a high growth category driven by social media and channel diversity, that joins our growing prestige range built from previous acquisitions in recent years, such as Dermalogica and Murad. Meanwhile, we announced an agreement to acquire the personal care and home care business of Quala S.A. in 2017 which will bring leading local brands to Unilever in north Latin America in haircare, oral care, male grooming and fabric conditioners.

In Foods and Refreshment, we announced the acquisition of Brazilian natural and organic foods business Mãe Terra - popular with increasingly health-conscious consumers. We also acquired Pukka Herbs, the world’s fastest growing organic tea brand, to continue the process of premiumising our tea portfolio. Sir Kensington’s, another acquisition during the year, is a US condiments business in the organic and naturals segment with a strong millennial consumer base that complements Unilever’s sustainable sourcing policies and further modernises the Foods portfolio. We also added to our ice cream brands with the acquisition in Australia of Weis which uses locally sourced, natural and high quality ingredients.

In 2017 we announced the disposal of our Spreads business to KKR for6.825 billion on a cash-free, debt-free basis. The offer is subject to certain regulatory approvals and employee consultation in certain jurisdictions. Completion is expectedmid-2018. We intend to return the net cash realised to shareholders, unless more value-creating acquisition alternatives arise. During 2017 we also announced the sale of the South Africa spreads business to Remgro and completed the sale of AdeS in Latin America to Coca Cola FEMSA and The Coca Cola Company for US$575 million.shareholders’ equity.


1824 Strategic Report  Annual Report on Form 20-F 2018


UNDERLYING OPERATING PROFIT AND UNDERLYING OPERATING MARGIN

Underlying operating profit and underlying operating margin mean operating profit and operating margin before the impact ofnon-underlying items within operating profit. Underlying operating profit represents our measure of segment profit or loss as it is the primary measure used for making decisions about allocating resources and assessing performance of the segments.

The reconciliation of operating profit to underlying operating profit is as follows:

    € million
2018
   million
2017


Operating profit


12,535


8,857


Non-underlying items within operating profit (see note 3)


(3,176


543


Underlying operating profit


9,359


9,400


Turnover


50,982


53,715


Operating margin


24.6


16.5


Underlying operating margin

   18.4  17.5

Further details ofnon-underlying items can be found in note 3 on page 85 of the consolidated financial statements.

UNDERLYING EFFECTIVE TAX RATE

The underlying effective tax rate is calculated by dividing taxation excluding the tax impact ofnon-underlying items by profit before tax excluding the impact ofnon-underlying items and share of net profit/(loss) of joint ventures and associates. This measure reflects the underlying tax rate in relation to profit before tax excludingnon-underlying items before tax and share of net profit/(loss) of joint ventures and associates. Tax impact onnon-underlying items within operating profit is the sum of the tax on eachnon-underlying item, based on the applicable country tax rates and tax treatment. This is shown in the following table:

    € million
2018
   million
2017


Taxation


2,575


1,667


Tax impact of:


Non-underlying items within operating profit(a)


(259


77


Non-underlying items not in operating profit but within net profit(a)


(29


578


Taxation before tax impact ofnon-underlying

   2,287   2,322 

Profit before taxation


12,383


8,153


Non-underlying items within operating profit before tax(a)


(3,176


543


Non-underlying items not in operating profit but within net profit before tax(b)


(122


382


Share of net (profit)/loss of joint ventures and associates


(185


(155


Profit before tax excludingnon-underlying items before tax and share of net profit/ (loss) of joint ventures and associates

   8,900   8,923 

Underlying effective tax rate


   25.7  26.0

(a)

Refer to note 3 for further details on these items.

(b)

2018 amount excludes32 million gain on disposal of spreads business by the joint venture in Portugal which is included in the share of net profit/(loss) of joint ventures and associates line. Including the32 million, totalnon-underlying items not in operating profit but within net profit before tax is154 million. See note 3.

CONSTANT UNDERLYING EARNINGS PER SHARE

Constant underlying earnings per share (constant underlying EPS) is calculated as underlying profit attributable to shareholders’ equity at constant exchange rates and excluding the impact of both translational hedges and price inflation in Venezuela (for the whole of 2018) and Argentina (from July 2018) divided by the diluted average number of ordinary shares. This measure reflects the underlying earnings for each ordinary share of the Group in constant exchange rates.

The reconciliation of underlying profit attributable to shareholders’ equity to constant underlying earnings attributable to shareholders’ equity and the calculation of constant underlying EPS is as follows:

    € million
2018
   million
2017


Underlying profit attributable to shareholders’ equity(a)


6,365


6,315


Impact of translation from current to constant exchange rates and translational hedges


7,112


95


Impact of Venezuela and Argentina price inflation(b)


(6,551


Constant underlying earnings attributable to shareholders’ equity


6,926


6,410


Diluted combined average number of share units (millions of units)


2,694.8


2,814.0


Constant underlying EPS ()


2.57


2.28


(a)

See note 7.

(b)

See pages 23 and 24 for further details.

From 2018, in our reporting of growth in constant underlying EPS, we translate the prior period using an annual average exchange rate rather than monthly averages. This change has been made to align with the prior period constant exchange rate used for calculating USG. The impact of this is an increase of0.01 per share in 2017 constant underlying EPS.

FREE CASH FLOW

Free cash flow (FCF) is defined as cash flow from operating activities, less income taxes paid, net capital expenditures and net interest payments and preference dividends paid. It does not represent residual cash flows entirely available for discretionary purposes; for example, the repayment of principal amounts borrowed is not deducted from FCF. FCF reflects an additional way of viewing our liquidity that we believe is useful to investors because it represents cash flows that could be used for distribution of dividends, repayment of debt or to fund our strategic initiatives, including acquisitions, if any.

The reconciliation of net profit to FCF is as follows:

    € million
2018
   million
2017


Net profit


9,808


6,486


Taxation


2,575


1,667


Share of net profit of joint ventures/associates and other income fromnon-current investments


(207


(173


Net monetary gain arising from hyperinflationary economies


(122


Net finance costs


481


877


Depreciation, amortisation and impairment


1,747


1,538


Changes in working capital


(793


(68


Pensions and similar obligations less payments


(128


(904


Provisions less payments


55


200


Elimination of (profits)/losses on disposals


(4,299


(298


Non-cash charge for share-based compensation


196


284


Other adjustments


(266


(153


Cash flow from operating activities


9,047


9,456


Income tax paid


(2,294


(2,164


Net capital expenditure


(1,424


(1,621


Net interest and preference dividends paid


(367


(316


Free cash flow


4,962


5,355


Net cash flow (used in)/from investing activities


4,644


(5,879


Net cash flow (used in)/from financing activities


(11,548


(1,433


Annual Report on Form 20-F 2018Strategic Report25


FINANCIAL REVIEWCONTINUED

RETURN ON ASSETS

Return on assets is a measure of the return generated on assets for each division. This measure provides additional insight on the performance of the divisions and assists in formulating long-term strategies with respect to allocation of capital, across divisions. Division return on assets is calculated as underlying operating profit after tax for the division divided by the annual average of: property, plant and equipment, net assets held for sale (excluding goodwill and intangibles), inventories, trade and other current receivables, and trade payables and other current liabilities, for each division. The annual average is computed by adding the amounts at the beginning and the end of the calendar year and dividing by two.

     € million     € million         € million       
     Beauty &     Foods &     Home         € million 
2018    Personal Care         Refreshment     Care     Total 

Underlying operating profit before tax


4,508


3,534


1,317


9,359


Tax on underlying operating profit


(1,159


(908


(338


(2,405

Underlying operating profit after tax


3,349


2,626


979


6,954


Property plant and equipment


3,631


4,783


1,933


10,347


Net assets held for sale


1


25


26


Inventories


1,737


1,761


803


4,301


Trade and other receivables


2,319


3,027


1,139


6,485


Trade payables and other current liabilities


(5,478


(5,984


(2,995


(14,457

Period end assets (net)


2,210


3,612


880


6,702


Average assets for the period (net)


2,178


3,830


799


6,807


Division return on assets


154


69


123


102

2017


Underlying Operating Profit before tax


4,375


3,737


1,288


9,400


Tax on underlying operating profit


(1,139


(972


(335


2,446


Underlying Operating Profit after tax


3,236


2,765


953


6,954


Property plant and equipment


3,520


5,104


1,787


10,411


Net assets held for sale


1


742


743


Inventories


1,590


1,637


735


3,962


Trade and other receivables


2,018


2,172


1,032


5,222


Trade payables and other current liabilities


(4,984


(5,606


(2,836


(13,426

Period end assets (net)


2,145


4,049


718


6,912


Average assets for the period (net)


2,122


4,201


778


7,101


Division return on assets


152


66


122


98

NET DEBT

Net debt is defined as the excess of total financial liabilities, excluding trade payables and other current liabilities, over cash, cash equivalents and other current financial assets, excluding trade and other current receivables. It is a measure that provides valuable additional information on the summary presentation of the Group’s net financial liabilities and is a measure in common use elsewhere.

The reconciliation of total financial liabilities to net debt is as follows:

    € million
2018
   million
2017
 

Total financial liabilities


(24,885


(24,430


Current financial liabilities


(3,235


(7,968

Non-current financial liabilities


(21,650


(16,462

Cash and cash equivalents as per balance sheet


3,230


3,317


Cash and cash equivalents as per cash flow statement


3,090


3,169


Add bank overdrafts deducted therein


140


167


Less cash and cash equivalents held for sale


(19

Other current financial assets


874


770


Net debt


(20,781


(20,343

RETURN ON INVESTED CAPITAL

Return on invested capital (ROIC) is a measure of the return generated on capital invested by the Group. The measure provides a guide rail for long-term value creation and encourages compounding reinvestment within the business and discipline around acquisitions with low returns and long payback. ROIC is calculated as underlying operating profit after tax divided by the annual average of: goodwill, intangible assets, property, plant and equipment, net assets held for sale, inventories, trade and other current receivables, and trade payables and other current liabilities.

    € million
2018
   million
2017
 

Underlying operating profit before tax(a)


9,359


9,400


Tax on underlying operating profit(b)


(2,405


(2,446

Underlying operating profit after tax


6,954


6,954


Goodwill


17,341


16,881


Intangible assets


12,152


11,520


Property, plant and equipment


10,347


10,411


Net assets held for sale


108


3,054


Inventories


4,301


3,962


Trade and other current receivables


6,485


5,222


Trade payables and other current liabilities


(14,457


(13,426

Period-end invested capital


36,277


37,624


Average invested capital for the period


36,951


36,222


Return on average invested capital


18.8


19.2

(a)

See reconciliation of operating profit to underlying operating profit on page 25.

(b)

Tax on underlying operating profit is calculated as underlying operating profit before tax multiplied by underlying effective tax rate of 25.7% (2017: 26.0%) which is shown on page 25.

26Strategic ReportAnnual Report on Form 20-F 2018


RISKS

OUR RISK APPETITE AND APPROACH

TO RISK MANAGEMENT

Risk management is integral to Unilever’s strategy and to the achievement of Unilever’s long-term goals. Our success as an organisation depends on our ability to identify and exploit the opportunities generated by our business and the markets we are in. In doing this we take an embedded approach to risk management which puts risk and opportunity assessment at the core of the Board agenda, which is where we believe it should be.

Unilever adopts a risk profile that is aligned to our vision to grow our business, while decoupling our environmental footprint from our growth and increasing our positive social impact. Our appetite for risk is driven by the following:

Our growth should be consistent, competitive, profitable and responsible.
Our behaviours must be in line with our Code of Business Principles and Code Policies.
We strive to continuously improve our operational efficiency and effectiveness.
We aim to maintain a single A credit rating on a long-term basis.

Our approach to risk management is designed to provide reasonable, but not absolute, assurance that our assets are safeguarded, the risks facing the business are being assessed and mitigated and all information that may be required to be disclosed is reported to Unilever’s senior management including, where appropriate, the Chief Executive Officer and Chief Financial Officer.

ORGANISATION

The Boards assume overall accountability for the management of risk and for reviewing the effectiveness of Unilever’s risk management and internal control systems.

The Boards have established a clear organisational structure with well defined accountabilities for the principal risks that Unilever faces in the short, medium and long term. This organisational structure and distribution of accountabilities and responsibilities ensure that every country in which we operate has specific resources and processes for risk reviews and risk mitigation. This is supported by the Unilever Leadership Executive, which takes active responsibility for focusing on the principal areas of risk to Unilever. The Boards regularly review these risk areas, including consideration of environmental, social and governance matters, and retain responsibility for determining the nature and extent of the significant risks that Unilever is prepared to take to achieve its strategic objectives.

FOUNDATION AND PRINCIPLES

Unilever’s approach to doing business is framed by our Purpose and values (see page 1). Our Code of Business Principles sets out the standards of behaviour that we expect all employees to adhere to.Day-to-day responsibility for ensuring these principles are applied throughout Unilever rests with senior management across categories, geographies and functions. A network of Business Integrity Officers and Committees supports the activities necessary to communicate the Code, deliver training, maintain processes and procedures (including support lines) to report and respond to alleged breaches, and to capture and communicate learnings.

We have a framework of Code Policies that underpins the Code of Business Principles and set out thenon-negotiable standards of behaviour expected from all our employees.

For each of our principal risks we have a risk management framework detailing the controls we have in place and who is responsible for managing both the overall risk and the individual controls mitigating that risk.

Unilever’s functional standards define mandatory requirements across a range of specialist areas such as health and safety, accounting and reporting and financial risk management.

PROCESSES

Unilever operates a wide range of processes and activities across all its operations covering strategy, planning, execution and performance management. Risk management is integrated into every stage of this business cycle. These procedures are formalised and documented and are increasingly being centralised and automated into transactional and other information technology systems.

ASSURANCE ANDRE-ASSURANCE

Assurance on compliance with the Code of Business Principles and all of our Code Policies is obtained annually from Unilever management via a formal Code declaration. In addition, there are specialist awareness and training programmes which are run throughout the year and vary depending on the business priorities. These specialist compliance programmes supplement the Code declaration. Our Corporate Audit function plays a vital role in providing to both management and the Boards an objective and independent review of the effectiveness of risk management and internal control systems throughout Unilever.

BOARDS’ ASSESSMENT OF COMPLIANCE WITH THE RISK MANAGEMENT FRAMEWORKS

The Boards, advised by the Committees where appropriate, regularly review the significant risks and decisions that could have a material impact on Unilever. These reviews consider the level of risk that Unilever is prepared to take in pursuit of the business strategy and the effectiveness of the management controls in place to mitigate the risk exposure.

The Boards, through the Audit Committee, have reviewed the assessment of risks, internal controls and disclosure controls and procedures in operation within Unilever. They have also considered the effectiveness of any remedial actions taken for the year covered by this Annual Report and Accounts and up to the date of its approval by the Boards.

Details of the activities of the Audit Committee in relation to this can be found in the Report of the Audit Committee on pages 43 to 45.

Further statements on compliance with the specific risk management and control requirements in the Dutch Corporate Governance Code, the UK Corporate Governance Code, the US Securities Exchange Act (1934) and the Sarbanes-Oxley (2002) Act can be found on pages 41 and 42.

Annual Report on Form 20-F 2018Strategic Report27


RISKSCONTINUED

VIABILITY STATEMENT

The Directors have reviewed the long-term prospects of the Group in order to assess its viability. This review incorporated the activities and key risks of the Group together with the factors likely to affect the Group’s future development, performance, financial position, cash flows, liquidity position and borrowing facilities as described on pages 1 to 26. In addition, we describe in notes 15 to 18 on pages 104 to 120 the Group’s objectives, policies and processes for managing its capital, its financial risk management objectives, details of its financial instruments and hedging activities and its exposures to credit and liquidity risk.

ASSESSMENT

In order to report on the long-term viability of the Group, the Directors reviewed the overall funding capacity and headroom available to withstand severe events and carried out a robust assessment of the principal risks facing the Group, including those that would threaten its business model, future performance, solvency or liquidity. The assessment assumes that any debt maturing in the next three years can bere-financed at commercially acceptable terms or via our current standby facility. This assessment also included reviewing and understanding the mitigation factors in respect of each of those risks. The risk factors are summarised on pages 29 to 33.

The viability assessment has two parts:

First, the Directors considered the period over which they have a reasonable expectation that the Group will continue to operate and meet its liabilities, taking into account current debt facilities and debt headroom; and

Second, they considered the potential impact of severe but plausible scenarios over this period, including:

assessing scenarios for each individual principal risk, for example the termination of our relationships with the three largest global customers; the loss of all material litigation cases; a major IT data breach and the lost cost and growth opportunities from not keeping up with technological changes; and

assessing scenarios that involve more than one principal risk including the following multi risk scenarios:

Multi risk

scenarios modelled

Level of

severity reviewed

Link to

principal risk

Contamination issue with one of our products leading to lower sales of products of this brand and the temporary closure of our largest sourcing unit.

A fine equal to 1% of Group turnover was considered along with damage to our largest brand and disruption to supply chain.

•  Safe and high-quality products

•  Brand preference

•  Supply chain

Major global incident affecting one or more of the Group’s key locations resulting in an outage for a year in a key sourcing unit and significant water shortages in our key developing markets.

The complete loss of all of our turnover in our largest geographic market was considered along with destruction of a key sourcing unit and reduced demand for our products that require water.

•  Economic and political instability

•  Supply chain

•  Climate change

Global economic downturn leading to an increase in funding costs and the loss of our three largest customers.Significant business disruption in our largest emerging market was considered with the impact of losing our three key customers.

•  Economic and political instability

•  Treasury and pensions

•  Customer relationships

FINDINGS

���

Firstly, a three-year period is considered appropriate for this viability assessment because it is the period covered by the strategic plan; and it enables a high level of confidence in assessing viability, even in extreme adverse events, due to a number of factors such as:

the Group has considerable financial resources together with established business relationships with many customers and suppliers in countries throughout the world;

high cash generation by the Group’s operations and access to the external debt markets;

flexibility of cash outflow with respect to significant marketing programmes and capital expenditure projects which usually have a2-3 year horizon; and

the Group’s diverse product and geographical activities which are impacted by continuously evolving technology and innovation.

Secondly, for each of our 14 principal risks, worst case plausible scenarios have been assessed together with multiple risk scenarios. None of the scenarios reviewed, either individually or in aggregate would cause Unilever to cease to be viable.

CONCLUSION

On the basis described above, the Directors have a reasonable expectation that the Group will be able to continue in operation and meet its liabilities as they fall due over the three-year period of their assessment.

PRINCIPAL RISK FACTORS

Our business is subject to risks and uncertainties. On the following pages we have identified the risks that we regard as the most relevant to our business. These are the risks that we see as most material to Unilever’s business and performance at this time. There may be other risks that could emerge in the future.

All the principal risks could impact our business within the next two years (ie short-term risks), or could impact our business over the next three to five years (ie medium-term risks). Some principal risks, such as climate change, could also impact over the longer term (ie beyond five years).

Our principal risks have not fundamentally changed this year apart from the addition of a plastic packaging risk. Given the nature of our business, a reduction in the amount of plastic packaging and increase in the use of recyclable content in our packaging is critical to our future success.

28Strategic ReportAnnual Report on Form 20-F 2018


As well as identifying the most relevant risks for our business we reflect on whether we think the level of risk associated with each of our principal risks is increasing or decreasing. In addition to our plastic packaging risk there are three areas where we believe there is an increased level of risk:

Customer Relationships: technology is changing our channel landscape and hence changing the nature of the relationships with our traditional customers as well as requiring us to develop relationships with new customers who are drivinge-commerce development;

Systems and Information: the number of cybersecurity attacks is still increasing significantly, and incidents are becoming more sophisticated as technology further evolves; and

Business Transformation: this risk has increased as a result of the speed of technological change which means the pressure to digitalise our business to take advantage of the opportunities it presents, both in terms of growth and cost efficiency, is increasing.

If the circumstances in these risks occur or are not successfully mitigated, our cash flow, operating results, financial position, business and reputation could be materially adversely affected. In addition, risks and uncertainties could cause actual results to vary from those described, which may include forward-looking statements, or could impact on our ability to meet our targets or be detrimental to our profitability or reputation.

DESCRIPTION OF RISK

BRAND PREFERENCE

As a branded goods business, Unilever’s success depends on the value and relevance of our brands and products to consumers around the world and on our ability to innovate and remain competitive.

Consumer tastes, preferences and behaviours are changing more rapidly than ever before, and Unilever’s ability to identify and respond to these changes is vital to our business success.

Technological change is disrupting our traditional brand communication models. Our ability to develop and deploy the right communication, both in terms of messaging content and medium is critical to the continued strength of our brands.

We are dependent on creating innovative products that continue to meet the needs of our consumers and getting these new products to market with speed. If we are unable to innovate effectively, Unilever’s sales or margins could be materially adversely affected.

PORTFOLIO MANAGEMENT

Unilever’s strategic investment choices will affect the long-term growth and profits of our business.

Unilever’s growth and profitability are determined by our portfolio of categories, geographies and channels and how these evolve over time. If Unilever does not make optimal strategic investment decisions, then opportunities for growth and improved margin could be missed.

SUSTAINABILITY

The success of our business depends on finding sustainable solutions to support long-term growth.

Unilever’s vision to grow our business, while decoupling our environmental footprint from our growth and increasing our positive social impact, will require more sustainable ways of doing business. In a world where resources are scarce and demand for them continues to increase, it is critical that we succeed in reducing our resource consumption and converting to sustainably sourced supplies. In doing this we are dependent on the efforts of partners and various certification bodies. We are also committed to improving health and well-being and enhancing livelihoods around the world so Unilever and our communities grow successfully together. There can be no assurance that sustainable business solutions will be developed and failure to do so could limit Unilever’s growth and profit potential and damage our corporate reputation.

Annual Report on Form 20-F 2018Strategic Report29


RISKSCONTINUED

DESCRIPTION OF RISK

CLIMATE CHANGE

Climate changes and governmental actions to reduce such changes may disrupt our operations and/or reduce consumer demand for our products.

Climate changes are occurring around the globe which may impact our business in various ways. They could lead to water shortages which would reduce demand for those of our products that require a significant amount of water during consumer use. They could also lead to an increase in raw material and packaging prices or reduced availability. Governments may take action to reduce climate change such as the introduction of a carbon tax or zero net deforestation requirements which could impact our business through higher costs or reduced flexibility of operations.

Increased frequency of extreme weather (storms and floods) could cause increased incidence of disruption to our manufacturing and distribution network. Climate change could result therefore in making products less affordable or less available for our consumers resulting in reduced growth and profitability.

PLASTIC PACKAGING

A reduction in the amount of plastic and an increase in the use of recyclable content in our packaging is critical to our future success.

Both consumer and customer responses to the environmental impact of plastic waste and emerging regulation by governments to tax or ban the use of certain plastics requires us to find solutions to reduce the amount of plastic we use; increase recycling post-consumer use; and to source recycled plastic for use in our packaging. We are also dependent on the work of our industry partners to create and improve recycling infrastructures throughout the globe.

Not only is there a risk around finding appropriate replacement materials, due to high demand the cost of recycled plastic or other alternative packaging materials could significantly increase in the foreseeable future and this could impact our business performance. We could also be exposed to higher costs as a result of taxes or fines if we are unable to comply with plastic regulations which would again impact our profitability and reputation.

CUSTOMER RELATIONSHIPS

Successful customer relationships are vital to our business and continued growth.

Maintaining strong relationships with our existing customers and building relationships with new customers who have built new technology-enabled business models to serve changing shopper habits are necessary to ensure our brands are well presented to our consumers and available for purchase at all times.

The strength of our customer relationships also affects our ability to obtain pricing and competitive trade terms. Failure to maintain strong relationships with customers could negatively impact our terms of business with affected customers and reduce the availability of our products to consumers.

30Strategic ReportAnnual Report on Form 20-F 2018


FINANCIAL REVIEW  


DESCRIPTION OF RISK

TALENT

A skilled workforce and agile ways of working are essential for the continued success of our business.

Our ability to attract, develop and retain the right number of appropriately qualified people is critical if we are to compete and grow effectively.

This is especially true in our key emerging markets where there can be a high level of competition for a limited talent pool. The loss of management or other key personnel or the inability to identify, attract and retain qualified personnel could make it difficult to manage the business and could adversely affect operations and financial results.

SUPPLY CHAIN

Our business depends on purchasing materials, efficient manufacturing and the timely distribution of products to our customers.

Our supply chain network is exposed to potentially adverse events such as physical disruptions, environmental and industrial accidents, trade restrictions or disruptions at a key supplier, which could impact our ability to deliver orders to our customers.

The cost of our products can be significantly affected by the cost of the underlying commodities and materials from which they are made. Fluctuations in these costs cannot always be passed on to the consumer through pricing.

Changes in trade relationships between Europe and the UK as a result of Brexit could give rise to both a supply and cost issue.

SAFE AND HIGH QUALITY PRODUCTS

The quality and safety of our products are of paramount importance for our brands and our reputation.

The risk that raw materials are accidentally or maliciously contaminated throughout the supply chain or that other product defects occur due to human error, equipment failure or other factors cannot be excluded.

SYSTEMS AND INFORMATION

Unilever’s operations are increasingly dependent on IT systems and the management of information.

The cyber-attack threat of unauthorised access and misuse of sensitive information or disruption to operations continues to increase. Such an attack could inhibit our business operations in a number of ways, including disruption to sales, production and cash flows, ultimately impacting our results.

In addition, increasing digital interactions with customers, suppliers and consumers place ever greater emphasis on the need for secure and reliable IT systems and infrastructure and careful management of the information that is in our possession to ensure data privacy.

Annual Report on Form 20-F 2018Strategic Report31


RISKSCONTINUED


DESCRIPTION OF RISK

BUSINESS TRANSFORMATION

Successful execution of business transformation projects is key to delivering their intended business benefits and avoiding disruption to other business activities.

Unilever is continually engaged in major change projects, including acquisitions, disposals and organisational transformation, to drive continuous improvement in our business and to strengthen our portfolio and capabilities. A number of key projects were announced in 2017 to accelerate sustainable shareholder value creation. Failure to execute such initiatives successfully could result in under-delivery of the expected benefits and there could be a significant impact on the value of the business.

Continued digitalisation of our business models and processes together with enhancing data management capabilities is a critical part of our transformation. Failure to keep pace with such technological change would significantly impact our growth and profitability.

ECONOMIC AND POLITICAL INSTABILITY

Unilever operates around the globe and is exposed to economic and political instability that may reduce consumer demand for our products, disrupt sales operations and/or impact the profitability of our operations.

Adverse economic conditions may affect one or more countries within a region, or may extend globally.

Government actions such as foreign exchange or price controls can impact on the growth and profitability of our local operations.

Unilever has more than half its turnover in emerging markets which can offer greater growth opportunities but also expose Unilever to related economic and political volatility.

TREASURY AND PENSIONS

Unilever is exposed to a variety of external financial risks in relation to Treasury and Pensions.

The relative values of currencies can fluctuate widely and could have a significant impact on business results. Further, because Unilever consolidates its financial statements in euros it is subject to exchange risks associated with the translation of the underlying net assets and earnings of its foreign subsidiaries.

We are also subject to the imposition of exchange controls by individual countries which could limit our ability to import materials paid in foreign currency or to remit dividends to the parent company.

Unilever may face liquidity risk, ie difficulty in meeting its obligations, associated with its financial liabilities. A material and sustained shortfall in our cash flow could undermine Unilever’s credit rating, impair investor confidence and also restrict Unilever’s ability to raise funds.

We are exposed to market interest rate fluctuations on our floating rate debt. Increases in benchmark interest rates could increase the interest cost of our floating rate debt and increase the cost of future borrowings.

In times of financial market volatility, we are also potentially exposed to counter-party risks with banks, suppliers and customers.

Certain businesses have defined benefit pension plans, most now closed to new employees, which are exposed to movements in interest rates, fluctuating values of underlying investments and increased life expectancy. Changes in any or all of these inputs could potentially increase the cost to Unilever of funding the schemes and therefore have an adverse impact on profitability and cash flow.

32Strategic ReportAnnual Report on Form 20-F 2018


DESCRIPTION OF RISK

ETHICAL

Acting in an ethical manner, consistent with the expectations of customers, consumers and other stakeholders, is essential for the protection of the reputation of Unilever and its brands.

Unilever’s brands and reputation are valuable assets and the way in which we operate, contribute to society and engage with the world around us is always under scrutiny both internally and externally. Despite the commitment of Unilever to ethical business and the steps we take to adhere to this commitment, there remains a risk that activities or events cause us to fall short of our desired standard, resulting in damage to Unilever’s corporate reputation and business results.

LEGAL AND REGULATORY

Compliance with laws and regulations is an essential part of Unilever’s business operations.

Unilever is subject to national and regional laws and regulations in such diverse areas as product safety, product claims, trademarks, copyright, patents, competition, employee health and safety, data privacy, the environment, corporate governance, listing and disclosure, employment and taxes.

Failure to comply with laws and regulations could expose Unilever to civil and/or criminal actions leading to damages, fines and criminal sanctions against us and/or our employees with possible consequences for our corporate reputation.

Changes to laws and regulations could have a material impact on the cost of doing business. Tax, in particular, is a complex area where laws and their interpretation are changing regularly, leading to the risk of unexpected tax exposures. International tax reform remains a key focus of attention with the OECD’s Base Erosion & Profit Shifting project and further potential tax reform in the EU and Switzerland.

IN FOCUS: CLIMATE CHANGE RISKS AND OPPORTUNITIES

UNILEVER HAS PUBLICLY COMMITTED TO IMPLEMENTING THE RECOMMENDATIONS OF THE TASK FORCE ON CLIMATE-RELATED FINANCIAL OVERVIEW 2017DISCLOSURES.

CONSOLIDATED INCOME STATEMENTUnilever recognises the importance of disclosing climate-related risks and opportunities. Adopting the Taskforce on Climate-Related Financial Disclosures (TCFD) recommendations is an important step forward in enabling market forces to drive efficient allocation of capital and support a smooth transition to alow-carbon economy.

TurnoverIn this Annual Report and Accounts, we continue to integrate climate-related disclosures throughout the Strategic Report narrative. However, in recognition of the growing significance of the impacts of climate change on our business, we have also summarised the risks and opportunities arising from climate change, and our response below.

The Boards take overall accountability for the management of climate change risks and opportunities with support from the ULE and the USLP Steering Team (see page 46). Chaired by Keith Weed in 2018, the USLP Steering Team includes nine members of the ULE and meets five times a year. During 2018, there were numerous agenda items on topics related to climate change including our overall climate strategy and our renewable electricity target.

For management employees (including the ULE), incentives include fixed pay, a bonus as a percentage of fixed pay and a long-term managementco-investment plan (MCIP) linked to financial and USLP performance. The USLP component accounts for 25% of total MCIP award. The sustainability component of MCIP includes consideration of our progress against climate change, water and palm oil targets, which among others, underpin our climate strategy. See pages 52 to 54 for more on MCIP.

UNDERSTANDING IMPACT

Climate change has been identified as a principal risk to Unilever which has the potential to impact our business in the short, medium and long-term. Further details on the nature of climate risks and opportunities for Unilever can be found in our 2018 CDP Climate submission (see further climate change disclosures on pages 7 and 14).

To further understand the impact that climate change could have on Unilever’s business we performed a high-level assessment of the impact of 2°C and 4°C global warming scenarios. The 2°C and 4°C scenarios are constructed on the basis that average global temperatures will have increased by 1.9%2°C and 4°C in the year 2100.

Between today and 2100 there will be gradual changes towards these endpoints and we have looked at the impact on our business in 2030 assuming we have the same business activities as we do today. We also made the following simplifying assumptions:

In the 2°C scenario, we assumed that in the period to 2030 society acts rapidly to limit greenhouse gas emissions and puts in place measures to restrain deforestation and discourage emissions (for example implementing carbon pricing at$75-$10053.7 billion including an unfavourable currency per tonne, taken from the International Energy Agency’s 450 scenario). We have assumed that there will be no significant impact to our business from the physical ramifications of climate change by 2030 – ie from greater scarcity of water or increased impact of 2.1% (2016: 5.1% unfavourable currency impact) mainlysevere weather events. The scenario assesses the impact on our business from regulatory changes.
In the 4°C scenario, we assumed climate policy is less ambitious and emissions remain high so the physical manifestations of climate change are increasingly apparent by 2030. Given this we have not included impacts from regulatory restrictions but focus on those resulting from the physical impacts.

Annual Report on Form 20-F 2018Strategic Report33


We identified the material impacts on Unilever’s business arising from each of these scenarios based on existing internal and external data. The impacts were assessed without considering any actions that Unilever might take to mitigate or adapt to the adverse impacts or to introduce new products which might offer new sources of revenue as consumers adjust to the new circumstances.

The main impacts of the 2°C scenario were as follows:

Carbon pricing is introduced in key countries and hence there are increases in both manufacturing costs and the costs of raw materials such as dairy ingredients and the metals used in packaging.
Zero net deforestation requirements are introduced and a shift to sustainable agriculture puts pressure on agricultural production, raising the price of certain raw materials.

The main impacts of the 4°C scenario were as follows:

Chronic and acute water stress reduces agricultural productivity in some regions, raising prices of raw materials.
Increased frequency of extreme weather (storms and floods) causes increased incidence of disruption to our manufacturing and distribution networks.
Temperature increase and extreme weather events reduce economic activity, GDP growth and hence sales levels fall.

Our analysis shows that, without action, both scenarios present financial risks to Unilever by 2030, predominantly due to strengtheningincreased costs. However, while there are financial risks which would need to be managed, we would not have to materially change our business model. The most significant impacts of both scenarios are on our supply chain where costs of raw materials and packaging rise, due to carbon pricing and rapid shift to sustainable agriculture in a 2°C scenario and due to chronic water stress and extreme weather in a 4°C scenario. The impacts on sales and our own manufacturing operations are relatively small.

The results of this analysis confirm the importance of doing further work to ensure that we understand the critical dependencies of climate change on our business and to ensure we have action plans in place to help mitigate these risks and thus prepare the business for the future environment in which we will operate.

During 2018 we developed and piloted an approach to assess the impact of climate change on our key commodities. We selected soy for this pilot based on its importance to Unilever (large purchased volume), it being ahigh-profile crop in the countries where it is grown and the availability of good historical price data and suitable climate models.

We developed a methodology which combined forecasting future yields and quantifying the impact on commodity prices of soybean oil. Climate change was the only price factor accounted for in the model used to calculate the impact. Other factors which impact price, such as technology and acreage, were excluded. The model considered the direct risks from climate change to the price of soybean oil, such as change in yield and change in supply. Three modelling steps were performed:

Yield estimation: We analysed multiple agriculture and climate models to provide a forecast range of expected yields in key growing regions.
Price relationship: An econometric model was developed, based on an analysis of the euro. Underlying salessoybean oil market and historical trends, to estimate the impact of climate-induced yield changes on future prices. This model considered the importance ofco-products eg soybean meal, substitution potential eg with sunflower oil and industrial uses of soybean oil, as well as the impact of yield on price.
Impact estimation: Future yields and price impacts were then translated into an estimated financial exposure from climate change for our business, using our forecast procurement volumes.

Our pilot analysis showed that soybean yields may increase over the 2030 and 2050-time horizon and that subsequent lower prices may then lead to small potential reductions in our procurement spend on soy. While the results may indicate a low financial risk to our business, we would need to consider a wider range of risk factors when determining our strategic response. Indirect risks from climate change, such as catastrophic events or external policy response and adaptation could also have an impact but were not included in our modelling. Furthermore, these pilot results are

specific to soy and can’t be applied to other crops. We have therefore decided to get broader understanding on the climate change risks to our agricultural sourcing and extend our analysis to two other important crops to Unilever: Palm Oil and Tea, for which suitable climate change models for yield predictions will be available in 2019.

RESPONDING TO RISKS AND OPPORTUNITIES

Unilever’s vision is to grow our business whilst decoupling our growth from our environmental footprint and increasing positive social impact. This vision explicitly recognises that sustainable growth – including management of climate-related risks and opportunities – is the only way to create long-term value for all our stakeholders.

The Unilever Sustainable Living Plan (USLP) was 3.1%^ (2016: 3.7%),developed to deliver our vision. It is fully integrated with aour business strategy. Climate-related issues are integral to the USLP. Two of our GHG reduction targets included in the USLP are recognised as science-based:

Halve the greenhouse gas impact of our products across the lifecycle by 2030 (this target covers all the phases across the lifecycle of our products: ingredients/raw materials, manufacturing, distribution, retail, packaging, consumer use and disposal)
Reduce scope 1 and 2 greenhouse gas emissions by 100% from our own operations by 2030 (this is part of our ambition to be become carbon positive contributionin our manufacturing by 2030)

We are taking action across our value chain to reduce our emissions, creating growth opportunities and minimising risk. Our commitment to source 100% of our palm oil from sustainable sources is helping to avoid emissions from deforestation (see pages 14 and 47). Our efforts to reduce energy and GHG emissions in manufacturing are helping us to save costs. For example, by using less energy, we have already avoided energy costs in our factories of over600 million since our baseline year of 2008.

Our divisions are taking action to reduce emissions. In Home Care we are focusing on concentrated liquid laundry detergents such as Persil, Omo and Surf Small & Mighty which help consumers to wash clothes at lower temperatures, reducing GHG by up to 50% per load. We have removed phosphates from all categories. Underlying volume growth was 0.8% (2016: 0.9%) and underlying price growth was 2.3% (2016: 2.8%). Acquisitions and disposals had a favourable contributionlaundry powders worldwide, resulting in lower greenhouse gas emissions of 0.9% (2016: 0.6%) reflecting recent acquisitions including Blueair, Living Proof and Carver Korea. Emerging markets contributed 58%up to 50% per consumer use. Our Foods & Refreshment division has prioritised reducing greenhouse gas emissions from ice cream freezers since 2008. As the world’s largest producer of total turnover (2016: 57%) with underlying sales growth of 5.9% (2016: 6.5%) coming from price growth of 4.2% and volume growth of 1.6%. Developed markets underlying sales declined by 0.6% evenly balanced between price and volume.

Underlying operating margin improved by 1.1 percentage pointsice cream, we have committed to 17.5%. Gross margin improved by 0.4 percentage points driven by positive mix andaccelerating theroll-out of freezer cabinets that use more climate-friendly natural (hydrocarbon) refrigerants. By 2018 our total purchase of these cabinets had increased to around 2.9 million.

Detailed Lifecycle Analysis has shown that our GHG contribution from animal-based agriculture, including fats and proteins, is relatively low: 7.5% for Foods & Refreshment and 2.5% for total Unilever. While emissions are comparatively low, the business opportunity is significant for natural and plant-based foods and beverages. We have a range of vegan and vegetarian variants such as Hellmann’s vegan mayonnaise, Ben & Jerry’snon-dairy ice creams, Magnum vegan and other options (see pages 11 to 12). We continue to actively promote vegetarian and vegan recipes, notably via our Knorr brand websites.

A number of our targets directly address risks and opportunities related to water scarcity caused by climate change. We estimate that the sale of products which address water scarcity issues could increase in our Home Care and Beauty & Personal Care divisions where a number of products are available which address water scarcity and/ or have a lower GHG in use. For example, our Beauty & Personal Care division is investing in water smart product innovations such as dry shampoo and cleansing conditioner which help consumers use less water while also offering relevant benefits such as reduced colour loss and damage which can arise from frequent washing. Home Care is combining insights in consumer behaviour and water consumption with innovative technology to develop new market opportunities, launching products and formulations that address water scarcity and help our consumers save water. Day2, the world’s first dry wash spray is made with only 0.02% of the water in a normal laundry load. Sunlight2-in-1 Handwashing Laundry Powder and Rin (Radiant) detergent bar are also helping to reduce water consumption at point of use in water-stressed countries.

34Strategic ReportAnnual Report on Form 20-F 2018


Home Care is home to three brands, Pureit, Truliva/Qinyuan and Blueair, which are responding directly to issues related to climate change. Pureit and Truliva, our water purification businesses, offer products which provide safe drinking water to millions of people with a lower carbon footprint than alternatives. Our detailed lifecycle analysis shows that Pureit’s total carbon footprint is at least 80% lower than boiled or bottled water. Blueair, our indoor air purification business acquired in 2016, removes contaminants from the air, including hazardous sooty particles associated with the combustion of fossil fuels.

Several other targets in our USLP indirectly address climate risk and opportunities by aiming to support groups who are vulnerable to the effects of climate change and who are critical to our future growth, notably smallholder farmers and women in low income countries.

Unilever continues to support a number of policy measures to accelerate the transition to alow-carbon economy, including the pricing of carbon and removal of fossil fuel subsidies which act as negative carbon prices. We believe that carbon pricing is a fundamental part of the global response to climate change and without it, the world is unlikely to meet its greenhouse gas reduction targets. We have publicly supported calls for carbon pricing and are members of The Carbon Pricing Leadership Coalition, hosted by the World Bank. In 2016, we implemented an internal price on carbon as part of the business case appraisal for large capital expenditure projects. The carbon price is also applied to emissions from our manufacturing sites to raise a clean-tech fund. So far,73 million has been allocated to this fund for energy and water saving projects. In January 2018 the price of carbon was40 per tonne.

MEASURING AND REPORTING

We have been measuring and reporting on our energy and water consumption and carbon emissions since 1995. The USLP includes a number of stretching targets which relate to climate risks and opportunities across our value chain. Performance against key targets can be found on page 7 with commentary on page 13 and 14. Our website contains detailed commentary on our USLP targets as well as actions we are taking to achieve them.

Our ability to meet our climate-related targets partly depends on changes in the energy markets worldwide, such as the rate of installation of renewable electricity in many countries. We have a role to play as an industry leader to help shape those markets. We are working collaboratively with partners, suppliers and others to achieve our ambition.

We’ve created a detailed plan to annually assess the feasibility for Unilever to reach our target to halve the greenhouse gas impact of our products across the lifecycle by 2030, taking both external transitions towards alow-carbon economy as well as the latest available data and assumptions about our GHG footprint into account. The basis of this plan is the set of around 2,800 products representative of our global portfolio across all divisions for which we have full value-chain lifecycle analysis results.

We recalculated the footprint of these products using the latest 2030 projections on external transitions to alow-carbon economy (eg International Energy Agency 2030 projection on grid changes to renewable energy),low-carbon transition plans in our operations (eg achieving zero net deforestation by 2020, using 100% renewable energy by 2020) and Innovation Roadmaps (eg redesign for lower embedded carbon emissions, transforming the temperature-controlled supply chain).

In line with the Large and Medium sized Companies and Groups (Accounts and Reports) Regulations 2008 as amended by the Companies Act 2006 (Strategic Report and Directors’ Report) Regulations 2013 our greenhouse gas (GHG) emissions are set out below. For Scope 1 and 2 we report our CO2 emissions only but not other GHG emissions as these are considered to be not material. For Scope 3 we report our GHG emissions (eg CO2, CH4, N2O) in terms of CO2 equivalents.

We report our emissions with reference to the latest Greenhouse Gas Protocol Corporate Accounting and Reporting Standard (GHG Protocol) to calculate emissions of carbon dioxide from the combustion of fuels and the operation of facilities (Scope 1) and from purchased electricity, heat, steam and cooling (Scope 2, market-based method). Each year PwC assure selected manufacturing environmental metrics including carbon emissions from energy use and energy use per tonne of production.

The GHG data below relates to emissions during the‘5-S’12-month savingsperiod from 1 October to 30 September. This period is different from the Strategic Report, Directors’ Report and Financial Statements which are calendar year.

UNILEVER GREENHOUSE GAS EMISSIONS BY ACTIVITY^

    2018   2017 
Manufacturing (scope 1 and 2)    

Scope 1 (tonnes CO2)

   711,875    773,856 

Scope 2* (tonnes CO2)

   726,167    793,472 

Total Scope 1 & 2* (tonnes CO2)

   1,438,042    1,567,328 

Intensity ratio (kg CO2 per tonne of production)

   70.46    76.77 
Distribution centres, research laboratories, marketing and sales offices (scope 1 and 2)


Scope 1 (tonnes CO2)

   20,052    20,039 

Scope 2* (tonnes CO2)

   100,924    102,292 

Total Scope 1 & 2* (tonnes CO2)

   120,976    122,331 
Upstream and downstream of Unilever operations
– top 3 emissions sources (scope 3)


Consumer use


(downstream) (tonnes CO2e)q

   39,895,946    38,697,432 

Ingredients and packaging


    (upstream) (tonnes CO2e)

   14,985,897    15,000,941 

Distribution and retail


    (downstream) (tonnes CO2e)LOGO

   4,368,626    3,895,589 

^

Carbon emission factors are used to convert energy used in our operations to emissions of CO2. Carbon emission factors for fuels are provided by the Intergovernmental Panel on Climate Change (IPCC).

+

For manufacturing we have selected an intensity ratio based on production. This aligns with our long-standing reporting of manufacturing performance. Emissions from the combustion of biogenic fuels (biomass, fuel crops etc) within our operations are reported separately to other Scope 1 and 2 emissions, as recommended by the GHG Protocol, and excluded from our intensity ratio calculation. The data also excludes Scope 3 emissions (including consumer use of our products) which we report as part of our Unilever Sustainable Living Plan.

*

Carbon emission factors for grid electricity calculated according to the ‘market-based method’ are supplier-specific emissions factors reflecting contractual arrangements with electricity suppliers. Where supplier-specific emissions factors are not available, carbon emissions factors reflect the country where each operation is located and are provided by the International Energy Agency (IEA).

q

We measure the full GHG footprint of our product portfolio and annual sales using an LCA method compliant with the ISO 14040 standard. We measure the consumer use phase using a combination of primary habits data and on pack recommendations of use combined with lifecycle inventory data. We measure a representative sample of products across 14 countries which account for around60-70% of our annual sales volume.

We use a combination of external lifecycle inventory databases (secondary data) and supplier specific data (primary data eg for surfactants, perfumes and some of food ingredients) to measure the GHG emissions of purchased ingredients and packaging materials used in the production of our products.

LOGO

Downstream distribution is calculated using average distances and modes of transport derived from data collected from our distribution network and logistic providers.

FURTHER CLIMATE CHANGE DISCLOSURES

This Annual Report and Accounts contains additional disclosures on our climate change risks and opportunities:

Governance and remuneration: pages 46 to 47 and 52 to 54
Strategy for climate change: page 14
Risk management: page 30
Metrics and targets: pages 7 and 13 to 14

Our website contains disclosures on our greenhouse gas and water USLP targets.

LOGOwww.unilever.com/sustainable-living/our-sustainable-living-report-hub

Our CDP Climate submission contains extensive disclosure on our climate risks, opportunities, impacts and mitigating actions (password required).

LOGOwww.cdp.net

Annual Report on Form 20-F 2018Strategic Report35


GOVERNANCE REPORT

CORPORATE GOVERNANCE

UNILEVER’S STRUCTURE

Since its formation in 1930, the Unilever Group has operated as nearly as practicable as a single economic entity. This is achieved by special provisions in the Articles of Association of NV and PLC, together with a series of agreements between NV and PLC which are together known as the Foundation Agreements (described below). These agreements enable Unilever to achieve unity of management, operations, shareholders’ rights, purpose and mission and can be found on our website.

The Equalisation Agreement makes the economic position of the shareholders of NV and PLC, as far as possible, the same as if they held shares in a single company and also regulates the mutual rights of the shareholders of NV* and PLC. Under this agreement, NV and PLC must adopt the same financial periods and accounting policies.

The Deed of Mutual Covenants provides that NV and PLC and their respective subsidiary companies shallco-operate in every way for the purpose of maintaining a common operating policy. They shall exchange all relevant information about their respective businesses – the intention being to create and maintain a common operating platform for the Unilever Group throughout the world. This Deed also contains provisions for the allocation of assets within the Unilever Group.

Under the Agreement for Mutual Guarantees of Borrowing between NV and PLC, each company will, if asked by the other, guarantee the borrowings of the other and the other’s subsidiaries. These arrangements are used, as a matter of financial policy, for certain significant borrowings. They enable lenders to rely on our combined financial strength.

Each NV ordinary share represents the same underlying economic interest in the Unilever Group as each PLC ordinary share. However, NV and PLC remain separate legal entities with different shareholder constituencies and separate stock exchange listings. Shareholders cannot convert or exchange the shares of one for the shares of the other. More information on the exercise of voting rights can be found in NV’s and PLC’s Articles of Association and in the Notices of Meetings for our NV and PLC AGMs, all of which can be found on our website.

*

Throughout this report, when referring to NV shares or shareholders, the term ‘shares’ or ‘shareholder’ also encompasses a depositary receipt or a holder of depositary receipts.

LOGO

www.unilever.com/investor-relations/agm-and-corporate-

governance/legal-structure-and-foundation-agreements/

BOARDS

The Boards of NV and PLC have ultimate responsibility for the management, general affairs, direction, performance and long-term success of our business as a whole. The Boards areone-tier boards, the same people are on both Boards and the responsibility of the Directors is collective, taking into account their respective roles as Executive Directors andNon-Executive Directors. The majority of the Directors areNon-Executive Directors who essentially have a supervisory role. In the normal course Unilever has two Executive Directors, the Chief Executive Officer (CEO) and the Chief Financial Officer (CFO). On 31 December 2018 the current CEO resigned and his successor, Alan Jope, was appointed on 1 January 2019. Alan will be proposed to be appointed as an Executive Director at the 2019 AGMs. Consequently, between 1 January 2019 and the 2019 AGMs in May we have one Executive Director.

A list of our current Directors, their roles on the Boards, their dates of appointment, tenure and their other major appointments is set out on page 3.

The Boards have delegated the operational running of the Unilever Group to the CEO with the exception of the following matters which are reserved for the Boards: structural and constitutional matters, corporate governance, approval of dividends, approval and monitoring of overall strategy for the Unilever Group, approval of significant transactions or arrangements in relation to mergers, acquisitions, joint ventures and pensions. The CEO is responsible to the Boards in relation to the operational running of the Group and other powers delegated to him by the Boards. The CEO can delegate any of his powers and discretions, and he does so delegate to members of the Unilever Leadership Executive (ULE) (with power tosub-delegate). The ULE is composed of the CEO, CFO and other senior executives who assist the CEO in the discharge of the powers delegated to the CEO by the Boards. Members of the ULE report to the CEO, and the CEO supervises and determines the roles, activities and responsibilities of the ULE. While ULE members (other than the CEO and the CFO) are not part of the Boards’ decision-making process, to provide the Boards with deeper insights, ULE members often attend those parts of the Board meetings which relate to the operational running of the Group. The ULE currently consists of the CEO, CFO, the Division Presidents, the Presidents for Europe and North America, and the Chief Research and Development Officer, Chief HR Officer, Chief Legal Officer and Group Secretary, Chief Marketing and Communications Officer and Chief Supply Chain Officer.

The biographies of ULE members are on page 5.

BOARD COMMITTEES

The Boards have established four Board Committees: the Audit Committee, the Compensation Committee, the Corporate Responsibility Committee and the Nominating and Corporate Governance Committee. The terms of reference of these Committees can be found on our website and the reports of each Committee, including attendance at meetings in 2018, can be found on pages 43 to 65.

LOGO

www.unilever.com/investor-relations/agm-and-corporate-

governance/board-and-management-committees/

THE GOVERNANCE OF UNILEVER

Further details of the roles and responsibilities of the Chairman, Senior Independent Director/Vice-Chairman, CEO, CFO and other corporate officers and how our Boards effectively operate as one board, govern themselves and delegate their authorities are set out in the document entitled ‘The Governance of Unilever’, which can be found on our website.

The Governance of Unilever also describes the Foundation Agreements, Directors’ appointment, tenure, induction and training, Directors’ ability to seek independent advice at Unilever’s expense and details about Board and Management Committees (including the Disclosure Committee).

LOGO

www.unilever.com/investor-relations/agm-and-corporate-

governance/our-corporate-governance/

36Governance ReportAnnual Report on Form 20-F 2018


BOARD EFFECTIVENESS

BOARD MEETINGS

A minimum of fiveface-to-face meetings are planned throughout the calendar year to consider important corporate events and actions, for example, the half-year and full-year results announcements of the Unilever Group; the development of and approval of the overall strategy of the Unilever Group; oversight of the performance of the business; review of risks and internal risk management and control systems; authorisation of major transactions; declaration of dividends; convening of shareholders’ meetings; succession planning; review of the functioning of the Boards and their Committees; culture; and review of corporate responsibility and sustainability, in particular the Unilever Sustainable Living Plan. Other ad hoc Board meetings are convened to discuss strategic, transactional and governance matters that arise. In 2018 the Boards met physically in January, March, May, July, October and November. Meetings of the Boards may be held either in London or in Rotterdam or such other locations as the Boards think fit, with one or twooff-site Board meetings a year. The Chairman sets the Boards’ agenda, ensures the Directors receive accurate, timely and clear information, and promotes effective relationships and open communication between the Executive andNon-Executive Directors.

ATTENDANCE

The table showing the attendance of current Directors at Board meetings in 2018 can be found on page 3. If Directors are unable to attend a Board meeting they have the opportunity beforehand to discuss any agenda items with the Chairman. Ann Fudge attended four of the Board meetings she was eligible to attend before retiring from the Boards on 3 May 2018.

NON-EXECUTIVE DIRECTOR MEETINGS

TheNon-Executive Directors usually meet as a group, without the Executive Directors present, when there is aface-to-face Board meeting. In 2018 they met five times. The Chairman, or in his absence the Senior Independent Director/Vice-Chairman, chairs such meetings.

BOARD EVALUATION

Each year the Boards formally assess their own performance with the aim of helping to improve the effectiveness of both the Boards and the Committees. At least once every three years an independent third party facilitates the evaluation. The last external evaluation was performed in 2017. The evaluation consists of individual interviews with the Directors by the Chairman and, when relevant, by the external evaluator. These interviews are complemented by the completion by all Directors of three confidential online evaluation questionnaires on the efficiency and effectiveness of our Boards, CEO and Chairman. The Boards evaluation questionnaire this year focused on a number of key areas including Strategy, Risk/Financial Controls, Board Effectiveness and Information/Knowledge. The Chairman’s statement on page 2 describes the key actions agreed by the Boards following the evaluation.

The evaluation of the performance of the Chairman and CEO is led by the Senior Independent Director/Vice-Chairman and Chairman respectively, and the bespoke questionnaires will be used to support these evaluations. Committees of the Boards evaluate themselves annually under supervision of their respective Chairs taking into account the views of respective Committee members and the Boards. The key actions agreed by each Committee in the 2018 evaluations can be found in each Committee Report.

APPOINTMENT

In seeking to ensure that NV and PLC have the same Directors, the Articles of Association of NV and PLC contain provisions which are designed to ensure that both NV and PLC shareholders are presented with the same candidates for election as Directors. Anyone being elected as a Director of NV must also be elected as a Director of PLC and vice versa. Therefore, if an individual fails to be elected to both companies he or she will be unable to take his or her place on either Board.

The report of the Nominating and Corporate Governance Committee (NCGC) on pages 48 and 49 describes the work of the NCGC in Board appointments and recommendations forre-election. In addition, shareholders are able to nominate Directors. The procedure for shareholders to nominate Directors is contained within the document entitled ‘Appointment procedure for NV and PLC Directors’ which is available on our website. To do so they must put a resolution to both the NV and PLC AGMs in line with local requirements. Directors are appointed by shareholders by a simple majority vote at each AGM.

LOGO

www.unilever.com/investor-relations/agm-and-corporate-

governance/board-and-management-committees/

DIRECTOR INDUCTION AND TRAINING

All new Directors participate in a comprehensive induction programme when they join the Boards. The Chairman ensures that ongoing training is provided for Directors by way of site visits, presentations and circulated updates at (and between) Board and Board Committee meetings on, among other things, Unilever’s business, environmental, social, corporate governance, regulatory developments and investor relations matters. For example, in 2018 the Directors received presentations on Information Security, Digital, the Supply Chain and Simplification.

INDEPENDENCE AND CONFLICTS

As theNon-Executive Directors make up the Committees of the Boards, it is important that they can be considered to be independent. Each year the Boards conduct a thorough review of theNon-Executive Directors’, and their related or connected persons’, relevant relationships referencing the criteria set out in ‘The Governance of Unilever’ which is derived from the relevant best practice guidelines in the Netherlands, UK and US. The Boards currently consider all ourNon-Executive Directors to be independent of Unilever.

We attach special importance to avoiding conflicts of interest between NV and PLC and their respective Directors. The Boards ensure that there are effective procedures in place to avoid conflicts of interest by Board members. A Director must without delay report any conflict of interest or potential conflict of interest to the Chairman and to the other Directors, or, in case any conflict of interest or potential conflict of interest of the Chairman, to the Senior Independent Director/Vice-Chairman and to the other Directors. The Director in question must provide all relevant information to the Boards, so that the Boards can decide whether a reported (potential) conflict of interest of a Director qualifies as a conflict of interest within the meaning of the relevant laws. A Director may not vote on, or be counted in a quorum in relation to, any resolution of the Boards in respect of any situation in which he or she has a conflict of interest. The procedures that Unilever has put in place to deal with conflicts of interest operate effectively.

Unilever recognises the benefit to the individual and the Unilever Group of senior executives acting as directors of other companies but, to ensure outside directorships of our Executive Directors do not involve an excessive commitment or conflict of interest, the number of outside directorships of listed companies is generally limited to one per Executive Director and approval is required from the Chairman.

INDEMNIFICATION

The terms of NV Directors’ indemnification are provided for in NV’s Articles of Association. The power to indemnify PLC Directors is provided for in PLC’s Articles of Association and deeds of indemnity have been agreed with all PLC Directors. Third-party directors’ and officers’ liability insurance was in place for all Unilever Directors throughout 2018 and is currently in force.

In addition, PLC provides indemnities (including, where applicable, a qualifying pension scheme indemnity provision) to the Directors of three subsidiaries each of which acts as trustee of a Unilever UK pension fund. Appropriate trustee liability insurance is also in place.

Annual Report on Form 20-F 2018Governance Report37


CORPORATE GOVERNANCECONTINUED

OUR SHARES

NV SHARES

SHARE CAPITAL

NV’s issued share capital on 31 December 2018* was made up of:

274,356,432 split into 1,714,727,700 ordinary shares of0.16 each; and

1,028,568 split into 2,400 special ordinary shares numbered 1 – 2,400 known as special ordinary shares.

*

When referred to the issued share capital on 31 December 2018 also62,065,550 split into two classes (6% and 7%) of cumulative preference shares was outstanding. All 6% and 7% cumulative preference shares were held in treasury as a result of which these shares cannot be voted upon in the General Meeting of NV. The resolutions of the General Meeting of NV and the Board of NV to cancel these shares were filed on 29 November 2018 with the Dutch Trade Register and an announcement thereof in a daily and nationally distributed newspaper in the Netherlands was made on 5 December 2018. These shares were cancelled on 6 February 2019.

LISTINGS

NV has ordinary shares (UNIA) and depositary receipts for such ordinary shares (UNA) listed on Euronext Amsterdam and, as US New York Registry Shares* (UN) on the New York Stock Exchange.

*

One New York Registry Share represents one NV ordinary share with a nominal value of0.16.

VOTING RIGHTS

NV shareholders can cast one vote for each0.16 nominal capital they hold and can vote in person or by proxy. The voting rights attached to NV’s outstanding shares are split as follows:


Total number

of votes


        % of issued

capital


1,714,727,700 ordinary shares

   1,714,727,700(a)    99.63 

2,400 special shares


6,428,550


0.37


As at 31 December 2018:

(a)

254,012,896 shares were held in treasury and 9,336,215 shares were held to satisfy obligations under share-based incentive schemes. These shares and the special shares are not voted on. All 6% and 7% cumulative preference shares were held in treasury as a result of which these shares cannot be voted upon, as described within the Share Capital section above.

SHARE ISSUES AND PURCHASE OF SHARES

At the NV AGM held on 3 May 2018 the Board of NV was designated as the corporate body authorised to resolve on the issue of, or on the granting of rights to subscribe for, shares not yet issued and to restrict or exclude the statutorypre-emption rights that accrue to shareholders upon issue of shares, on the understanding that this authority is limited to 33% of NV’s issued ordinary share capital and to disapplypre-emption rights to 5% of NV’s issued share capital for general corporate purposes and an additional 5% authority only in connection with an acquisition or specified capital investment.

In addition, at NV’s 2018 AGM the NV Board was designated as the corporate body authorised to purchase (i) ordinary shares with a maximum of 10% of the issued share capital as well as (ii) any and all 6% and 7% cumulative preference shares.

These authorities expire on the earlier of the conclusion of the 2019 NV AGM or the close of business on 30 June 2019 (the last date by which NV must hold an AGM in 2019). Such authorities (other than with respect to the 6% and 7% cumulative preference shares) are renewed annually.

During 2018 companies within the Unilever Group purchased 4,000,000 NV ordinary shares, representing 0.23% of the issued ordinary share capital, for183,380,649. These purchases were made to facilitate grants made in connection with Unilever’s employee compensation programmes. Further information on these purchases can be found in note 4C to the consolidated accounts on page 93.

In addition, NV conducted a share buyback programme during 2018 with an aggregate market value of approximately3 billion bought back in the form of 62,202,168 NV ordinary shares (or depositary receipts in respect of such ordinary shares).

Following a public offer and a subsequent squeeze out procedure, Unilever Corporate Holdings Nederland B.V. (UCHN), an indirect wholly owned subsidiary of PLC, acquired all 6% cumulative preference shares and 7% cumulative preference shares. Unilever N.V. purchased these 6% cumulative preference shares and 7% cumulative preference shares on 2 October 2018. The resolutions of the General Meeting of NV and the Board of NV to cancel these shares were filed on 29 November 2018, as described within the Share Capital section above.

Further information on these purchases can be found in note 4C to the consolidated accounts on page 93.

NV SPECIAL ORDINARY SHARES

To ensure unity of management, the provisions within the NV Articles of Association containing the rules for appointing NV Directors cannot be changed without the permission of the holders of the special ordinary shares numbered 1 – 2,400 inclusive. These NV special ordinary shares may only be transferred to one or more other holders of such shares. The joint holders of these shares are N.V. Elma and United Holdings Limited, which are subsidiaries of NV and PLC respectively. The Boards of N.V. Elma and United Holdings Limited comprise three Directors of the Unilever Boards.

TRUST OFFICE

The Foundation Unilever N.V. Trust Office (Stichting Administratiekantoor Unilever N.V.) is a trust office with a board independent of Unilever. As part of its corporate objects, the Trust Office issues depositary receipts in exchange for the NV ordinary shares. These depositary receipts are listed on Euronext Amsterdam, as are the NV ordinary shares themselves

Holders of depositary receipts can under all circumstances exchange their depositary receipts for the underlying shares (and vice versa) and are entitled to dividends and all economic benefits on the underlying shares held by the Trust Office. There are no limitations on the holders’ voting rights, they can attend all General Meetings of NV, either personally or by proxy, and have the right to speak. The Trust Office only votes shares that are not represented at a General Meeting. The Trust Office votes in such a way as it deems to be in the long-term interests of the holders of the depositary receipts. This voting policy is laid down in the Conditions of Administration that apply to the depositary receipts.

The Trust Office’s shareholding fluctuates daily. Its holdings on

31 December 2018 were 1,268,051,254 NV ordinary shares (73.95%).

At the 2018 NV AGM, the Trust Office represented 36.95% of all votes present at the meeting.

The current members of the board at the Trust Office are Mr J H Schraven (Chairman), Mr P M L Frentrop, Mr A Nühn and Ms C M S Smits-Nusteling. The Trust Office reports periodically on its activities. Further information on the Trust Office, including its Articles of Association, Conditions of Administration and Voting Policy, can be found on its website.

LOGOwww.administratiekantoor-unilever.nl/eng/home

38Governance ReportAnnual Report on Form 20-F 2018


PLC SHARES

SHARE CAPITAL

PLC’s issued share capital on 31 December 2018 was made up of:

£36,934,840 split into 1,187,191,284 ordinary shares of 319p each; and
£100,000 of deferred stock of £1 each.

LISTINGS

PLC has ordinary shares (ULVR) listed on the London Stock Exchange and, as American Depositary Receipts* (UL), on the New York Stock Exchange.

*

One American Depository Receipt represents one PLC ordinary share with a nominal value of 319p.

VOTING RIGHTS

PLC shareholders can cast one vote for each 319p nominal capital they hold and can vote in person or by proxy. The voting rights attached to PLC’s outstanding shares are split as follows:


Total number

of votes


        % of issued

capital


1,187,191,284 ordinary shares

   1,187,191,284    99.73 

£100,000 deferred stock


3,214,285


0.27


As at 31 December 2018:

(a)

18,660,634 shares were held by PLC in treasury and 5,645,392 shares were held by NV group companies. These shares and the deferred stock are not voted on.

SHARE ISSUES AND PURCHASE OF SHARES

At the 2018 PLC AGM held on 2 May 2018 the PLC Directors were authorised to issue new shares, up to a maximum of £12,755,555 nominal value (which at the time represented approximately 33% of PLC’s issued ordinary share capital) and to disapplypre-emption rights up to approximately 5% of PLC’s issued ordinary share capital for general corporate purposes and an additional 5% authority only in connection with an acquisition or specified capital investment.

In addition, at PLC’s 2018 AGM the PLC Board was authorised to make market purchases of its ordinary shares, up to a maximum of just under 10% of PLC’s issued ordinary share capital and within the limits prescribed in the resolution until the earlier of the conclusion of PLC’s 2019 AGM and 30 June 2019. These authorities are renewed annually and authority will be sought at PLC’s 2019 AGM.

During 2018 companies within the Unilever Group purchased 2,222,000 PLC ordinary shares, representing 0.19% of the issued share capital, for £87,978,671. These purchases were made to facilitate grants made in connection with its employee compensation programmes. Further information on these purchases can be found in note 4C to the consolidated accounts on page 93.

In addition, PLC conducted a share buyback programme during 2018 with an aggregate market value of approximately £3 billion bought back in the form of 63,236,433 PLC ordinary shares.

On 31 July 2018, PLC cancelled 110,493,623 PLC ordinary shares of 319p each held in treasury, representing 8.43% of the issued share capital. On 19 September 2018, PLC cancelled a further 12,471,454 PLC ordinary shares of 319p each held in treasury, representing 1.04% of the issued share capital.

PLC DEFERRED STOCK

To support unity of management, the holders of PLC’s deferred stock have rights within PLC’s Articles of Association relating to any changes in the rules for appointing PLC Directors. The joint holders of the PLC deferred stock are N.V. Elma and United Holdings Limited, which are subsidiaries of NV and PLC respectively. The Boards of N.V. Elma and United Holdings Limited comprise three Directors of the Unilever Boards.

OUR SHAREHOLDERS

SIGNIFICANT SHAREHOLDERS OF NV

As far as Unilever is aware, the only holder of more than offset increases3% of, or 3% of voting rights attributable to, NV’s share capital (‘Disclosable Interests’) on 31 December 2018 (apart from the Foundation Unilever N.V. Trust Office, see page 38) is BlackRock, Inc. (BlackRock) as indicated in commodity costs.the table below.

Shareholder  Class of shares  Total number of
shares held
   % of relevant
class
 

BlackRock

  ordinary shares       66,947,018    3.90 

BlackRock notified the AFM that its holding changed to 4.02% on

19 February 2019. Between 1 January 2016 and 21 February 2019, BlackRock, NN Group N.V. (NN), ASR Nederland N.V. (ASR) and UCHN, see page 38, have held more than 3% in the share capital of NV.

SIGNIFICANT SHAREHOLDERS OF PLC

As far as Unilever is aware, the only holders of more than 3% of, or 3% of voting rights attributable to, PLC’s ordinary share capital on 31 December 2018 (apart from shares held in treasury by PLC, see page 39), are BlackRock and the Leverhulme Trust as indicated in the table below.

Shareholder  Class of shares  

Total number

of shares held

   % of relevant
class
 

BlackRock

  ordinary shares       77,176,319    6.60 

The Leverhulme Trust

  ordinary shares   46,931,182    4.02 

As far as Unilever is aware, no new Disclosable Interests have been notified to PLC between 1 January 2019 and 21 February 2019 (the latest practicable date for inclusion in this report). Between 1 January 2016 and 21 February 2019, (i) BlackRock, and (ii) the aggregated holdings of the trustees of the Leverhulme Trust and the Leverhulme Trade Charities Trust, have held more than 3% of, or 3% of voting rights attributable to, PLC’s ordinary shares.

STAKEHOLDER ENGAGEMENT

We value open and effective communication with our stakeholders. The primary responsibility for stakeholder engagement, which is generally related to the operations of the business, rests with our Executive Directors.Non-Executive Directors also actively engage with stakeholders as part of their oversight duties and responsibilities that have not been delegated to the Executive Directors.

SHAREHOLDERS

The CFO has lead responsibility for shareholder engagement, with the active involvement of the CEO and supported by the Investor Relations department.

The Executive Directors’ investor relations programme continued in 2018 with meetings held with institutional shareholders in major cities globally. The Executive Directors and members of the Investor Relations team also meet a large number of investors at the industry conferences they attend. In 2018 industry conferences attended by Unilever representatives included events in London, Paris, Stockholm, Boston and New York.

Our annual investor seminar in December also allowed investors to meet the Chairman, CEO,CEO-designate, CFO and other members of senior management. The event was held at the offices of Hindustan Unilever in Mumbai and focused on Unilever’s emerging markets expertise as well as the digital transformation of the business.

In 2018, as part of the strategic review of options to accelerate sustainable value creation and our proposal to simplify the Unilever corporate structure, the Chairman met and spoke with global investors during the year. The Chair of the Compensation Committee also extensively engaged with and sought feedback from investors in relation to our Remuneration Policy.

Annual Report on Form 20-F 2018Governance Report39


CORPORATE GOVERNANCECONTINUED

On an ongoing basis, the Boards are briefed on investor reactions to the Unilever Group’s quarterly results announcements and on any issues raised by shareholders that are relevant to their responsibilities.

We maintain a frequent dialogue with our principal institutional shareholders and regularly collect feedback. Private shareholders are encouraged to give feedback via shareholder.services@unilever.com. Our shareholders are also welcome to raise any issues directly with the Chairman or the Senior Independent Director/Vice-Chairman, and the Chairman, Executive Directors and Chairs of the Committees are also generally available to answer questions from the shareholders at the AGMs each year.

OTHERS

Our Executive Directors andNon-Executive Directors also engage with a wide-ranging group of stakeholders during specific Unilever events. For example, we annually organise one or more Board Relationship meetings offering our Directors the opportunity to directly meet our key customers, suppliers, agencies, NGOs, trade associations and advisers. In 2018, such meetings were held in the Netherlands and the UK.

EMPLOYEES

In order to allow ourNon-Executive Directors to gainfirst-hand experience of our operations and to engage in a broader context, we organise one or more site visits annually. During these site visits,Non-Executive Directors are informed about local market conditions and operations as well as relevant local matters. Typically, the programme allowsNon-Executive to meet management and young talent at these sites. In 2018, such site visits were held in China, Germany, the Netherlands and the US. In terms of engaging with employees, ourNon-Executive Directors actively participate in our management development programme sharing knowledge and insight on a mutual basis.

LOGOwww.unilever.com/investor-relations/

GENERAL MEETINGS

Both NV and PLC hold an AGM each year. At the AGMs the Chairman gives his thoughts on governance aspects of the preceding year and the CEO gives a detailed review of the performance of the Unilever Group over the last year. Shareholders are encouraged to attend the relevant meeting and to ask questions at or in advance of the meeting. Indeed, the question and answer session forms an important part of each meeting. The external auditors are welcomed to the AGMs and are entitled to address the meetings.

Provision 4.1.8 of the Corporate Governance Code in the Netherlands (Dutch Code) and Code Provision E.2.3 of the UK Corporate Governance Code (UK Code) require all Directors to attend both the NV and PLC AGMs. As questions asked at our AGMs tend to focus on business related matters, governance and the remit of our Board Committees, the Chairman, CEO, CFO and the Chairs of our four Committees of the Board attend both our AGMs and the remaining members of the Board attend at least one AGM.

The 2018 AGMs were held in Rotterdam and London in May and the topics raised by shareholders included:e-commerce, mergers & acquisitions, sustainability, Simplification, remuneration, total shareholder return, Brexit and data protection.

Shareholders of NV may propose resolutions if they individually or together hold at least 1% of NV’s issued capital in the form of shares or depositary receipts issued for NV shares. Shareholders who together represent at least 10% of the issued capital of NV can, under certain circumstances, also requisition the District Court to allow them to convene an Extraordinary General Meeting to deal with specific resolutions.

Shareholders of PLC may propose resolutions if they individually or together hold shares representing at least 5% of the total voting rights of PLC, or 100 shareholders who hold on average £100 each in nominal value of PLC share capital can require PLC to propose a resolution at a General Meeting. PLC shareholders holding in aggregate 5% of the issued PLC ordinary shares are able to convene a General Meeting of PLC.

Information on the 2019 AGMs can be found within the NV and PLC AGM Notices which will be published in March 2019.

REQUIRED MAJORITIES

Resolutions are usually adopted at NV and PLC General Meetings by an absolute majority of votes cast, unless there are other requirements under the applicable laws or NV’s or PLC’s Articles of Association. For example, there are special requirements for resolutions relating to the alteration of the Articles of Association, the liquidation of NV or PLC and the alteration of the Equalisation Agreement.

A proposal to alter the Articles of Association of NV can only be made by the NV Board. A proposal to alter the Articles of Association of PLC can be made either by the PLC Board or by requisition of shareholders in accordance with the UK Companies Act 2006. Unless expressly specified to the contrary in PLC’s Articles of Association, PLC’s Articles of Association may be amended by a special resolution. Proposals to alter the provisions in the Articles of Association of NV and PLC respectively relating to the unity of management require the prior approval of meetings of the holders of the NV special ordinary shares and the PLC deferred stock. The Articles of Association of both NV and PLC can be found on our website.

LOGO

www.unilever.com/investor-relations/agm-and-corporate-

governance/legal-structure-and-foundation-agreements/

RIGHT TO HOLD AND TRANSFER SHARES

Unilever’s constitutional documents place no limitations on the right to hold or transfer NV and PLC ordinary shares. There are no limitations on the right to hold or exercise voting rights on the ordinary shares of NV and PLC imposed by Dutch or English law.

40Governance ReportAnnual Report on Form 20-F 2018


CORPORATE GOVERNANCE COMPLIANCE

GENERAL

We conduct our operations in accordance with internationally accepted principles of good governance and best practice, while ensuring compliance with the corporate governance requirements applicable in the countries in which we operate. Unilever is subject to corporate governance requirements (legislation, codes and/or standards) in the Netherlands, the UK and the US and in this section we report on our compliance against these.

MATERIAL CONTRACTS

Under the European Takeover Directive as implemented in the Netherlands and the UK, the UK Companies Act 2006 and rules of the US Securities and Exchange Commission, Unilever is required to provide information on contracts and other arrangements essential or material to the business of the Unilever Group. Other than the Foundation Agreements referred to on page 36, we believe we do not have any such contracts or arrangements.

THE NETHERLANDS

In 2018, NV complied with almost all the principles and best practice provisions of the Dutch Code, with the exception of Dutch Code Provision 4.1.8 as noted in the General Meetings section above and the best practice provision set out below. The Dutch Code is available on the Monitoring Committee Corporate Governance Code’s website.

Best Practice Provision 3.2.3

The Dutch Code provides that in case of dismissal, the remuneration of an Executive Director should not exceed one year’s salary.

It is our policy to set the level of brandseverance payments for Executive Directors at no more than one year’s salary, unless the Boards, on the recommendation of the Compensation Committee, find this manifestly unreasonable given circumstances or unless otherwise dictated by applicable law.

Corporate Governance Statements:

In addition to an explanation ofnon-compliance to the Dutch Code, as set out above, the Dutch Code also requires the Board to confirm, and marketing investment was flat in local currencies versus the prior year, as savings from advertising production werere-invested in increased media spend. As a percentage of turnover, brandBoard hereby confirms that:

this Annual Report and marketing investment was down by 0.6 percentage points. Overheads reduced by 0.1 percentage points, driven by a further reductionAccounts provides sufficient insights into any failings in the cost base partially offseteffectiveness of the internal risk management and control systems;
the systems mentioned above provide reasonable assurance that the financial reporting does not contain any material inaccuracies;
based on the current state of affairs, it is justified that the financial reporting is prepared on a going concern basis; and
this Annual Report and Accounts states those material risks and uncertainties that are relevant to the expectation of NV’s continuity for the period of 12 months after the preparation of this Annual Report and Accounts.

The statements in this paragraph are not statements in accordance with the requirements of Section 404 of the US Sarbanes-Oxley Act of 2002.

Furthermore, NV is required to make a statement concerning corporate governance as referred to in article 2a of the decree on the content of the management report (Besluit inhoud bestuursverslag) (the Decree).

The information required to be included in this corporate governance statement as described in articles 3, 3a and 3b of the Decree can be found on our website.

LOGOwww.commissiecorporategovernance.nl
LOGOwww.unilever.com/corporategovernance

THE UNITED KINGDOM

In 2018, PLC complied with all UK Code provisions with the exception of UK Code Provision E.2.3 as noted in the General Meetings section above. The UK Code is available on the Financial Reporting Council’s (FRC) website.

Risk Management and Control: Our approach to risk management and systems of internal control is in line with the recommendations in the FRC’s revised guidance ‘Risk management, internal control and related financial and business reporting’ (the Risk Guidance). It is Unilever’s practice to review acquired companies’ governance procedures and to align them to the Unilever Group’s governance procedures as soon as is practicable.

Greenhouse Gas (GHG) Emissions: Information on GHG emissions can be found on page 35.

Employee Involvement and Communication: Unilever’s UK companies maintain formal processes to inform, consult and involve employees and their representatives. A National Consultative Forum comprising employees and management representatives from key locations meets regularly to provide a forum for discussing issues relating to Unilever sites in the United Kingdom. We recognise collective bargaining on a number of sites and engage with employees via the Sourcing Unit Forum, which includes national officer representation from the three recognised trade unions. A European Works Council, embracing employee and management representatives from countries within Europe, has been in existence for several years and provides a forum for discussing issues that extend across national boundaries.

Equal Opportunities and Diversity: Consistent with our Code of Business Principles, Unilever aims to ensure that applications for employment from everyone are given full and fair consideration and that everyone is given access to training, development and career opportunities. Every effort is made to retrain and support employees who become disabled while working within the Group.

LOGOwww.frc.org.uk/
LOGOwww.unilever.com/sustainable-living/values-and-values/

Annual Report on Form 20-F 2018Governance Report41


CORPORATE GOVERNANCECONTINUED

THE UNITED STATES

Both NV and PLC are listed on the New York Stock Exchange (NYSE). As such, both companies must comply with the requirements of US legislation, regulations enacted under US securities laws and the Listing Standards of the NYSE, that are applicable to foreign private issuers, copies of which are available on their websites.

We are substantially compliant with the Listing Standards of the NYSE applicable to foreign private issuers except as set out below.

We are required to disclose any significant ways in which our corporate governance practices differ from those typically followed by investmentUS companies listed on the NYSE. Our corporate governance practices are primarily based on the requirements of the UK Listing Rules, the UK Code and the Dutch Code but substantially conform to those required of US companies listed on the NYSE. The only significant way in capabilitieswhich our corporate governance practices differ from those followed by domestic companies under Section 303A Corporate Governance Standards of the NYSE is that the NYSE rules require that shareholders must be given the opportunity to vote on all equity-compensation plans and material revisions thereto, with certain limited exemptions. The UK Listing Rules require shareholder approval of equity-compensation plans only if new or treasury shares are issued for the purpose of satisfying obligations under the plan or if the plan is a long-term incentive plan in which a director may participate. Amendments to plans approved by shareholders generally only require approval if they are to the advantage of the plan participants. Furthermore, Dutch law and NV’s Articles of Association require shareholder approval of equity-compensation plans only if the Executive Directors are able to participate in such plans. Under Dutch law, shareholder approval is not required for material revisions to equity-compensation plans unless the Executive Directors participate in a plan and the plan does not contain its own procedure for revisions.

Attention is drawn to the Report of the Audit Committee on pages 43 to 45. In addition, further details about our corporate governance are provided in the document entitled ‘The Governance of Unilever’ which can be found on our website.

LOGOwww.nyse.com/index
LOGOwww.sec.gov

All senior executives and senior financial officers have declared their understanding of and compliance with Unilever’s Code of Business Principles and the related Code Policies. No waiver from any provision of the Code of Business Principles or Code Policies was granted in 2018 to any of the persons falling within the scope of the SEC requirements. The Code of Business Principles and related Code Policies are published on our website.

Risk Management and Control: Following a review by the Disclosure Committee, Audit Committee and Boards, the CEO and the CFO concluded that the design and operation of the Unilever Group’s disclosure controls and procedures, including new business modelsthose defined in the United States Securities Exchange Act of 1934 – Rule 13a – 15(e), as at 31 December 2018 were effective.

Unilever is required by Section 404 of the US Sarbanes-Oxley Act of 2002 to report on the effectiveness of its internal control over financial reporting. This requirement is reported on within the section entitled ‘Management’s Report on Internal Control over Financial Reporting’ on page 156.

In February 2017, the Group received a public potential offer by The Kraft Heinz Company for $50 per share in respect of all of NV and PLC shares. Unilever rejected the proposal.

LOGO

www.unilever.com/investor-relations/agm-and-corporate-

governance/our-corporate-governance/

42Governance ReportAnnual Report on Form 20-F 2018


REPORT OF THE AUDIT COMMITTEE

COMMITTEE MEMBERS AND ATTENDANCE

ATTENDANCE

John RishtonChair

8/8

Nils Andersen

8/8

Judith Hartmann

8/8

This table shows the membership of the Committee together with their attendance at meetings during 2018. If Directors are unable to attend a meeting, they have the opportunity beforehand to discuss any agenda items with the Committee Chair. Attendance is expressed as the number of meetings attended out of the number eligible to be attended.

HIGHLIGHTS OF 2018

•  Annual Report and Accounts

•  Tax regulations, provisions and disclosure

•  Information security, including Cyber, and IT resilience

•  Supply Chain flexibility and continuity of supply

•  Accounting for significant Mergers and Acquisitions

•  Acquisition Review

•  Spreads Disposal

•  IFRS 15 ‘Revenue from Contracts with Customers’ and IFRS 16 ‘Leases’

PRIORITIES FOR 2019

•  Tax regulations, provisions and disclosure

•  Information Security, including Cyber, and IT resilience

•  IFRS 16 ‘Leases’

•  Accounting for significant Mergers and Acquisitions

MEMBERSHIP OF THE COMMITTEE

The Audit Committee is comprised only of independente-commerce.Non-Executive Directors with a minimum requirement of three such members. It is chaired by John Rishton and the other members are Nils Andersen and Judith Hartmann. For the purposes of the US Sarbanes-Oxley Act of 2002 John Rishton is the Audit Committee’s financial expert. The Boards have satisfied themselves that the current members of the Audit Committee are competent in financial matters and have recent and relevant experience. Other attendees at Committee meetings (or part thereof) were the Chief Financial Officer, Chief Auditor, EVP Financial Control, Risk Management, Pensions & Sustainability, Chief Legal Officer and Group Secretary and the external auditors. Throughout the year the Committee members periodically met without others present and also held separate private sessions with the Chief Financial Officer, Chief Auditor and the external auditors, allowing the Committee to discuss any issues in more detail.

ROLE OF THE COMMITTEE

The role and responsibilities of the Audit Committee are set out in written terms of reference which are reviewed annually by the Committee, taking into account relevant legislation and recommended good practice. The terms of reference are contained within ‘The Governance of Unilever’ which is available on our website atwww.unilever.com/corporategovernance. The Committee’s responsibilities include, but are not limited to, the following matters, and relevant issues are brought to the attention of the Boards:

oversight of the integrity of Unilever’s financial statements;
review of Unilever’s quarterly and annual financial statements (including clarity and completeness of disclosure) and approval of the quarterly trading statements for quarter 1 and quarter 3;
oversight of risk management and internal control arrangements;
oversight of compliance with legal and regulatory requirements;
oversight of the external auditors’ performance, objectivity, qualifications and independence; the approval process ofnon-audit services; recommendation to the Boards of the nomination of the external auditors for shareholder approval; and approval of their fees, refer to note 25 on page 126;
the performance of the internal audit function; and
approval of the Unilever Leadership Executive (ULE) expense policy and the review of Executive Director expenses.

In order to help the Committee meet its oversight responsibilities, each year management organise knowledge sessions for the Committee on subject areas within its remit. In 2018, a session was held with Unilever Management on the acquisition of the Dollar Shave Club, which included a briefing on the acquisition case, recent performance, and key learnings that might be relevant for future acquisitions. In addition, John Rishton visited the Indian MCO in Mumbai, where the developments of routes to market, controls automation and centralisation were reviewed and discussed in detail. Mr Rishton also visited the Indian finance and IT hub in Bangalore where progress being made on monitoring systems of potential cyber threat and access controls were reviewed.

HOW THE COMMITTEE HAS DISCHARGED ITS RESPONSIBILITIES

Operating profitDuring the year, the Committee’s principal activities were as follows:

FINANCIAL STATEMENTS

The Committee reviewed prior to publication the quarterly financial press releases together with the associated internal quarterly reports from the Chief Financial Officer and the Disclosure Committee and, with respect to the half-year and full-year results, the external auditors’ reports. It also reviewed this Annual Report and Accounts and the Annual Report on Form20-F 2018. These reviews incorporated the accounting policies and significant judgements and estimates underpinning the financial statements as disclosed within note 1 on pages 79 to 82. Particular attention was up 13.5%paid to the following significant issues in relation to the financial statements:

revenue recognition – estimation of discounts, incentives on sales made during the year, refer to note 2 on pages 82 to 84;
direct tax provisions, refer to note 6 on pages 94 to 96; and
indirect tax provisions and contingent liabilities, refer to note 19 on page 120.

Annual Report on Form 20-F 2018Governance Report43


REPORT OF THE AUDIT COMMITTEECONTINUED

The external auditors have agreed the list of significant issues discussed by the Audit Committee. In addition to these risks KPMG, as required by auditing standards, also consider the risk of management override of controls. Nothing has come to either our attention or the attention of KPMG to suggest any material suspected or actual fraud relating to management override of controls.

For each of the above areas the Committee considered the key facts and judgements outlined by management. Members of management attended the section of the meeting of the Committee where their item was discussed to answer any questions or challenges posed by the Committee. The issues were also discussed with the external auditors and further information can be found on pages 67 to 74. The Committee was satisfied that there are relevant accounting policies in place in relation to these significant issues and management have correctly applied these policies.

At the request of the Boards the Committee undertook to:

review the appropriateness of adopting the going concern basis of accounting in preparing the annual financial statements; and
assess whether the business was viable in accordance with the requirement of the UK Corporate Governance Code. The assessment included a review of the principal risks facing Unilever, their potential impact, how they were being managed, together with a discussion as to the appropriate period for the assessment. The Committee recommended to the Boards that there is a reasonable expectation that the Group will be able to continue in operation and meet its liabilities as they fall due over the three-year period (consistent with the period of the strategic plan) of the assessment.

At the request of the Boards the Committee also considered whether the Unilever Annual Report and Accounts 2018 was fair, balanced and understandable and whether it provided the necessary information for shareholders to assess the Group’s position and performance, business model and strategy. The Committee was satisfied that, taken as a whole, the Unilever Annual Report and Accounts 2018 is fair, balanced and understandable.

RISK MANAGEMENT AND INTERNAL CONTROL ARRANGEMENTS

The Committee reviewed Unilever’s overall approach to risk management and control, and its processes, outcomes and disclosure. It reviewed:

the Controller’s Quarterly Risk and Control Status Report, including Code of Business Principles cases relating to frauds and financial crimes and significant issues received through the Unilever Code Support Line;
the 2018 corporate risks for which the Audit Committee had oversight and the proposed 2019 corporate risks identified by the ULE;
management’s improvements to reporting and internal financial control arrangements, through further automation and centralisation;
processes related to information security, including cyber security;
tax planning, and related risk management;
treasury policies, including debt issuance and hedging; and
litigation and regulatory investigations.

The Committee reviewed the application of the requirements under Section 404 of the US Sarbanes-Oxley Act of 2002 with respect to internal controls over financial reporting. In addition, the Committee reviewed the annual financial plan and Unilever’s dividend policy and dividend proposals.

During 2018 the Committee continued its oversight of the independent assurance work that is performed on a number of our USLP metrics (selected on the basis of their materiality to the USLP).

In fulfilling its oversight responsibilities in relation to risk management, internal control and the financial statements, the Committee met regularly with senior members of management and is satisfied with the key judgements taken.

INTERNAL AUDIT FUNCTION

The Committee reviewed Corporate Audit’s audit plan for the year and agreed its budget and resource requirements. It reviewed interim andyear-end summary reports and management’s response. The Committee engaged an independent third party to perform an effectiveness review of the function. The review concluded that the function is compliant with the IIA (Chartered Institute of Internal Auditors) Standards in all material aspects. The Committee also carried out an evaluation of the performance of the internal audit function and was satisfied with the effectiveness of the function. The Committee met independently with the Chief Auditor during the year and discussed the results of the audits performed during the year.

AUDIT OF THE ANNUAL ACCOUNTS

KPMG, Unilever’s external auditors and independent registered public accounting firm, reported in depth to the Committee on the scope and outcome of the annual audit, including their audit of internal controls over financial reporting as required by Section 404 of the US Sarbanes-Oxley Act of 2002. Their reports included audit and accounting matters, governance and control, and accounting developments.

The Committee held independent meetings with the external auditors during the year and reviewed, agreed, discussed and challenged their audit plan, including their assessment of the financial reporting risk profile of the Group. The Committee discussed the views and conclusions of KPMG regarding management’s treatment of significant transactions and areas of judgement during the year. The Committee considered these views and comments and is satisfied with the treatment in the financial statements.

EXTERNAL AUDITORS

KPMG have been the Group’s auditors since 2014 and shareholders approved theirre-appointment as the Group’s external auditors at the 2018 AGMs. On the recommendation of the Committee, the Directors will be proposing there-appointment of KPMG at the AGMs in May 2019.

Both Unilever and KPMG have safeguards in place to avoid the possibility that the external auditors’ objectivity and independence could be compromised, such as audit partner rotation and the restriction onnon-audit services that the external auditors can perform as described below. Both the KPMG partners with overall responsibility for the audit of NV and PLC will rotate off the assignment after completion of the 2018year-end financial statements. One of the new partners already has experience of the Unilever global audit, and the other partner underwent an induction programme through much of thisyear-end to ensure a smooth transition. KPMG has issued a formal letter to the Committee outlining the general procedures to safeguard independence and objectivity, disclosing the relationship with the Company and confirming their audit independence.

Each year, the Committee assesses the effectiveness of the external audit process which includes discussing feedback from the members of the Committee and stakeholders at all levels across Unilever. Interviews are also held with key senior management within both Unilever and KPMG.

The Committee also reviewed the statutory audit, audit related andnon-audit related services provided by KPMG and compliance with Unilever’s documented approach, which prescribes in detail the types of engagements, listed below, for which the external auditors can be used:

statutory audit services, including audit of subsidiaries;
audit related engagements – services that involve attestation, assurance or certification of factual information that may be required by external parties;
non-audit related services – work that our external auditors are best placed to undertake, which may include:
audit and assurance certificates / statements
bond issue comfort letters
internal control reviews.

44Governance ReportAnnual Report on Form 20-F 2018


Unilever has for many years maintained a policy which prescribes in detail the types of engagements for which the external auditors can be used and prohibits several types of engagements, including:

bookkeeping or similar services;
design and/or implementation of systems or processes related to financial information or risk management;
valuation, actuarial and legal services;
internal audit;
broker, dealer, investment adviser or investment bank services;
transfer pricing advisory services
staff secondments of any kind;
Payroll tax;
Customs duties; and
Tax services (except in exceptional and rare circumstances such as where they are the only firm able to provide the service).

All audit related engagements over8.9 billion (2016:250,000 andnon-audit related engagements over7.8 billion) including543 million100,000 required specific advance approval by the Audit Committee Chairman. The Committee further approved all engagements below these levels which have been authorised by the EVP Financial Control, Risk Management, Pension & Sustainability. These authorities are reviewed regularly and, where necessary, updated in the light of internal developments, external developments and best practice. Since the appointment of KPMG in 2014 to 2016 the level ofnon-underlyingnon-audit items.fees has been below 7% of the annual audit fee. In 2017 and 2018 the level ofNon-underlyingnon-audit items within operating profit are638 million restructuring costs, acquisitionfees has been higher at 41% and disposal-related costs of159 million andone-off costs of80 million partly offset by gain on31% respectively due to assurance work relating to the disposal of our Spreads business and the Simplification project.

The Committee confirms that the Group is in compliance with The Statutory Audit Services for Large Companies Market Investigation (Mandatory use of Competitive Tender Processes and Audit Committee Responsibilities) Order 2014. The last tender for the audit of the annual accounts was performed in 2013.

EVALUATION OF THE AUDIT COMMITTEE

As part of the internal Board evaluation carried out in 2018, the Boards evaluated the performance of the Committee. The Committee also carried out an assessment of its own performance in 2018. While overall the Committee members concluded that the Committee is performing effectively, the Committee agreed that to further enhance its effectiveness it needed to ensure the Committee members continued to develop their knowledge of the Group’s operations which would involve further knowledge sessions and site visits.

John Rishton

Chair of the Audit Committee

Nils Andersen

Judith Hartmann

Annual Report on Form 20-F 2018Governance Report45


REPORT OF THE CORPORATE

RESPONSIBILITY COMMITTEE

COMMITTEE MEMBERS AND ATTENDANCE

ATTENDANCE

Strive Masiyiwa(Member since April 2017)Chair

4/4

Youngme Moon

4/4

Feike Sijbesma

3/4

This table shows the membership of the Committee together with their attendance at meetings during 2018. If Directors are unable to attend a meeting, they have the opportunity beforehand to discuss any agenda items with the Committee Chair. Attendance is expressed as the number of meetings attended out of the number eligible to be attended.

HIGHLIGHTS OF 2018

•  Competition and anti-bribery compliance

•  Third-party compliance

•  Product quality and safety

•  Unilever Sustainable Living Plan (USLP)

PRIORITIES FOR 2019

•  Compliance with Unilever policies on fair competition and anti-bribery and requirements for third parties

•  Product quality and safety

•  Unilever Sustainable Living Plan (USLP) including plastic packaging

ROLE OF THE COMMITTEE

The Corporate Responsibility Committee oversees Unilever’s conduct as a responsible global business. As the Unilever Sustainable Living Plan (USLP) is at the heart of Unilever’s vision to grow its business whilst decoupling its environmental footprint from its growth and increasing its positive social impact, the Committee tracks the progress and potential risks associated with the USLP.

The Committee is also charged with ensuring that Unilever’s reputation is protected and enhanced. Therefore a central element of its role is the need to identify any external developments that are likely to have an influence upon Unilever’s standing in society, and to ensure that appropriate and effective communications policies are in place to support the company’s reputation.

The Committee’s discussions are informed by the experience of the senior leaders invited to the Committee to share their views on a variety of topics and external trends. Many of these leaders are members of the Unilever Sustainable Living Plan Steering Team, the group companies of senior executives accountable for driving sustainable growth through Unilever’s brands and operations. These discussions ensure the Committee stays abreast of current and emerging trends and any potential risks arising from sustainability issues. This enables the Boards to draw on a well-rounded view of issues.

During 2018 the Committee reviewed its terms of reference and approved minor changes to the terms.

The Committee’s responsibilities are complemented by those of the Audit Committee, which is responsible for reviewing significant breaches of the Code of Business Principles as part of its remit to review risk management and for overseeing the independent assurance programme for the USLP.

The Committee’s terms of reference are set outwww.unilever.com/ corporategovernance334 million. and details of the USLP Steering Team atwww.unilever.com/sustainable-living/our-strategy/our-sustainability-governance/

MEMBERS OF THE COMMITTEE

The Corporate Responsibility Committee comprises threeNon-Executive Directors: Strive Masiyiwa (Chair), Feike Sijbesma and Youngme Moon. The Chief Marketing & Communications Officer and the Chief Sustainability Officer attend the Committee’s meetings. The Chief Business Integrity Officer also attends to present Unilever’s company report that covers cases under Unilever’s Code of Business Principles (the Code) as well as updates on third-party compliance, product quality and safety.

MEETINGS

Meetings are held quarterly and ad hoc as required – four were held in 2018. The Committee Chairman is responsible for reporting the findings from meeting to the Boards, thus ensuring that the Boards can fulfil their oversight responsibilities.

Following the Committee’s terms of reference and Unilever’s principal risks and priorities, the Committee’s agenda covers the Code and third-party compliance, alongside litigation, occupational and product safety, the USLP and corporate reputation as well as a range of strategic and current issues. In addition to the areas listed below, in 2018 the Committee also reviewed topics such as media communications, the process for integrating business acquisitions and progress on alternatives to animal testing.

CODE OF BUSINESS PRINCIPLES

The Code and associated Code Policies set out the standards of conduct expected of all Unilever employees in their business endeavours. Compliance with these is an essential element in ensuring Unilever’s continued business success and is identified as an ethical and legal and regulatory risk to Unilever.

While the Chief Executive Officer is responsible for implementing these principles, supported by the Global Code and Policy Committee, the Corporate Responsibility Committee is responsible for oversight of the Code and Code Policies, ensuring that they remain fit for purpose and are appropriately applied. It maintains close scrutiny of the mechanisms for implementing the Code and Code Policies. This is vital as compliance is essential to promote and protect Unilever’s values and standards, and hence the good reputation of the Group. At each meeting the Committee reviews an analysis of investigations intonon-compliance with the Code and Code Policies and is alerted to any trends arising from these investigations.

The Chief Legal Officer and Group Secretary reports to the Committee on litigation and regulatory matters which may have a reputational impact including environmental issues, bribery and corruption compliance and competition law compliance. The Committee studied how compliance was achieved during 2018. For further information please see notes 19 and 20 to the consolidated financial statements.

As another of its other priorities in 2018, the Committee also scrutinised the mechanisms for anti-bribery compliance. The primary mechanism is to understand the profiles of the markets Unilever operates in and to ensure that there are robust internal and third-party compliance programmes in place. These are complemented by training for all employees in tandem with advanced capacity building for those in the Business Integrity and Legal functions.

PRINCIPLES AND STANDARDS FOR THIRD PARTIES

The Committee retained its focus on third-party compliance in 2018. Extending Unilever’s values to third parties remains a priority, not only to generate continued responsible growth and a positive social impact on the industry, but to counter the significant risk thatnon-compliance by third parties can pose, particularly in the context of increasing regulation around the world.

The Committee tracks compliance with Unilever’s Responsible Sourcing Policy (RSP) for suppliers and its Responsible Business Partner Policy (RBPP) for customers and distributors. Together they set out Unilever’s requirements that third parties conduct business with integrity, openness and respect for universal human rights and core labour principles. Sourcing 100% of Unilever’s procurement spend in line with the RSP is also a target within the USLP.

The policies enable Unilever to evaluate risk and provide the right measures to address the diversity of market conditions in which it operates and the range of third parties it works with. The Committee was briefed on progress. For the RSP, this detailed the number of suppliers making a positive commitment to the policy, greater alignment on industry standards via the process of mutual recognition and a substantial increase in site audits and resulting corrective action plans. Enhanced anti-bribery and corruption screening was also put in place. The training and enhancements developed for the RBPP include new IT tools launched in over 180 countries, simpler assessment processes, enhanced due diligence and risk mitigation plans.

46Governance ReportAnnual Report on Form 20-F 2018


Highlights for the year ended 31 December


  2017   2016   

% change


   2018   2017   % change 

Turnover ( million)


53,715


52,713


2


50,982


53,715


(5.1


Operating profit ( million)


8,857


7,801


14


12,535


8,857


41.5


Underlying operating profit ( million)*


9,400


8,624


9


9,359


9,400


(0.4


Profit before tax ( million)


8,153


7,469


9


12,383


8,153


51.9


Net profit ( million)


6,486


5,547


17


9,808


6,486


51.2


Diluted earnings per share ()


2.15


1.82


18


3.48


2.15


62.0


Underlying earnings per share ()*


2.24


2.03


11


2.36


2.24


5.2


Net finance costs increased bywere314481 million toin 2018 compared with877 million (2016:563 million) as theyin 2017, which included aone-off finance chargecost of382 million for the buyback of the Unilever NV preference shares. The cost of financing net borrowings was57 million higher than 2017. The increase was primarily driven by an increase in net debt which was partially offset by lower interest rates and a prior yearone-off in Brazil relating to the book premium paid on the buybackinterest element of preference shares in Unilever N.V.an indirect tax amnesty programme. The net cost of financing borrowings was399 million,70 million lower than prior year. The decrease was due to a lower average interest rate ofon net debt reduced to 2.2% from 2.7% compared to 3.5% in 2016, and to lower other interest costs2017. The pensions financing charge was25 million, down fromone-off credits in Brazil. Pension financing was a charge of96 million compared toin 2017 reflecting a lower pension deficit at the beginning of 2018.

A monetary gain of94122 million was recorded following adoption of IAS 29 ‘Financial Reporting in the prior year.Hyperinflationary Economies’ in Argentina (see note 1) from 1 July 2018.

The effective tax rate was 21.1% compared with 20.8% versus 26.2% in the prior year. The changeIn both years the rate was mainlylow relative to longer term norms, due to the significant impact on tax of the disposals of our spreads businesses in 2018 and US tax reform that led to aone-off tax benefit coming from restating deferred tax balances at the new lower federal tax rate, partially offset by the tax impact of the AdeS business disposal.in 2017.

Net profit from joint ventures and associates was up 22%19% at155185 million, anwith the increase coming mainly from growth in profits from the Pepsi Lipton joint venture and profit froma gain on disposal of an investment in athe spreads business of the Portuguese joint venture in India.venture. Other income fromnon-current investments was1822 million compared toversus10418 million in the prior year which included a gain of107 million from the sale of financial assets.year.

Diluted earnings per share increasedwere up 62.0% at3.48. The increase was mainly driven by 18.4% tothe2.15 reflecting improved operating margins,578 million US tax reform and a3094,331 million gain on disposal for the spreads businesses, improvement in operating margin and the impact of the AdeS business. Underlying earnings per share increased by 10.7% to2.24. This measure excludes the post tax impact ofnon-underlying items (see page 23 for explanation ofnon-underlying items).buyback programmes.


The independent auditors’ reports issued by KPMG Accountants N.V. and KPMG LLP on the consolidated results of the Group, as set out in the financial statements, were unqualified and contained no exceptions or emphasis of matter. For more details see pages 7867 to 85.74.

The consolidated financial statements have been prepared in accordance with IFRS as adopted by the EU and IFRS as issued by the International Accounting Standards Board. The critical accounting policies and those that are most significant in connection with our financial reporting are set out in note 1 on pages 9079 to 9382 and are consistent with those applied in 2016.2017.


*

Certain measures used in our reporting are not defined under IFRS. For further information about these measures, please refer to the commentary onnon-GAAP measures on pages 2223 to 25.26.

^

Wherever referenced in this report, 2017 underlying sales growth (USG) and underlying price growth (UPG) do not include anyprice growth in Venezuela for the whole of 2018 and in Argentina from July 2018. USG and UPG for 2017 do not include Q4 2017 price growth in Venezuela. See pages 22 to 23 and 24 onnon-GAAP measures for further details.

Annual Report on Form 20-F 2017Strategic Report19


FINANCIAL REVIEWCONTINUED

PERSONAL CARE

    2017   2016   % change 

Turnover ( million)

   20,697    20,172    2.6 

Operating profit ( million)

   4,103    3,704    10.8 

Underlying operating profit ( million)

   4,375    4,033    8.5 

Operating margin (%)

   19.8    18.4    1.4 

Underlying operating margin (%)

   21.1    20.0    1.1 

Underlying sales growth (%)

   2.9    4.2   

Underlying volume growth (%)

   1.4    1.6   

Underlying price growth (%)

   1.5    2.6      

KEY DEVELOPMENTS

Turnover growth of 2.6% included a negative currency impact of 1.9%. Acquisitions and disposals contributed 1.7% and underlying sales growth was 2.9%. Personal Care benefited from a strong set of innovations that included five new brand launches. The portfolio continues to grow organically and through acquisitions in attractive segments and channels. Acquisitions of 2017 included Living Proof, Hourglass, Carver Korea, Sundial Brands and Schmidt’s Naturals. Previous acquisitions of Dollar Shave Club and Kate Somerville grew in double digits, while Dermalogica grew 5%. Growth was negatively impacted by difficult market conditions particularly in Brazil and Indonesia. Skin cleansing delivered good growth helped by Dove shower foam, and Baby Dove which wasrolled-out to 26 countries. In hair care, the global expansion into natural propositions contributed tovolume-led growth.
Underlying operating profit increased by342 million. Underlying operating margin and underlying sales growth improvement added237 million and116 million respectively, offset by a11 million adverse impact from exchange rate movements. Acquisition and disposal related activities had no net impact. Underlying operating margin improvement was principally driven by higher gross margins and brand and marketing efficiencies from zero based budgeting.

HOME CARE

    2017   2016   % change 

Turnover ( million)

   10,574    10,009    5.6 

Operating profit ( million)

   1,138    949    19.9 

Underlying operating profit ( million)

   1,288    1,086    18.6 

Operating margin (%)

   10.8    9.5    1.3 

Underlying operating margin (%)

   12.2    10.9    1.3 

Underlying sales growth (%)

   4.4    4.9   

Underlying volume growth (%)

   2.1    1.3   

Underlying price growth (%)


   2.3    3.6      

KEY DEVELOPMENTS

Turnover grew 5.6% including a negative currency impact of 1.7%. Underlying sales growth was 4.4% coming from volume growth of 2.1% and price growth of 2.3%. Acquisitions and disposals contributed a favourable 2.9%. The roll-outs of Surf into Central and Eastern Europe and Omo into Iran performed well. In laundry, growth was driven by strong performances of the fabric conditioner Comfort in Asia and Europe, and the value brand Brilhante in Latin America. In 2017, the portfolio benefited from the acquisition of EAC Myanmar. The acquisition of Seventh Generation in 2016 with its natural proposition performed well and started to contribute to underlying sales growth towards the end of the year.
Underlying operating profit increased by202 million including a56 million adverse contribution from exchange rate movements. Underlying operating margin added141 million and underlying sales growth contributed48 million. Acquisition and disposal related activities contributed70 million. Underlying operating margin improvement reflects strong delivery of the5-S programme andzero-based budgeting.

FOODS

    2017  2016  % change 

Turnover ( million)

   12,512   12,524   (0.1

Operating profit ( million)

   2,275   2,180   4.4 

Underlying operating profit ( million)

   2,471   2,394   3.2 

Operating margin (%)

   18.2   17.4   0.8 

Underlying operating margin (%)

   19.7   19.1   0.6 

Underlying sales growth (%)

   1.0   2.1  

Underlying volume growth (%)

   (0.7  (0.5 

Underlying price growth (%)


   1.7   2.6     

KEY DEVELOPMENTS

Turnover declined by 0.1% including an adverse currency impact of 1.1%. Underlying sales growth was 1.0%, which is lower than the prior year by 1.1 percentage points. The category continued to modernise the portfolio through innovations and acquisitions such as Mae Terra. Growth was adversely affected by a 2.4% underlying sales decline of the Spreads business, which will be divested in 2018. Savoury had a good performance driven by Knorr which responded well to consumer needs such as naturalness and time-saving cooking products. In dressings, Hellmann’s relaunched the brand with stronger natural claims in 25 markets while the organic variants have been rolled out from North America into Europe.
Underlying operating profit increased by77 million, including a28 million adverse contribution from exchange rate movements. Underlying operating margin improvement contributed79 million. Underlying sales growth and acquisition and disposal related activities added25 million and1 million respectively. Underlying operating margin improvement was mainly due to brand and marketing efficiencies.

REFRESHMENT

    2017  2016   % change 

Turnover ( million)

   9,932   10,008    (0.8

Operating profit ( million)

   1,341   968    38.5 

Underlying operating profit ( million)

   1,266   1,111    14.0 

Operating margin (%)

   13.5   9.7    3.8 

Underlying operating margin (%)

   12.7   11.1    1.6 

Underlying sales growth (%)

   4.9  3.5   

Underlying volume growth (%)

   0.4   1.0   

Underlying price growth (%)


   4.5  2.6      

KEY DEVELOPMENTS

Turnover declined by 0.8% including an adverse currency impact of 3.9%. Acquisitions and disposals had a negative impact of 1.4% and underlying sales growth was a favourable 4.9%. Refreshments had a good year despite increased new entrants’ activity particularly in North America. Innovations behind premium ice cream brands performed well, including Magnum pints that deliver the ultimate chocolate and ice cream experience in a tub. Leaf tea showed good growth, as we are increasingly seeing benefits of our innovations in speciality and premium tea. T2 continued to show double-digit growth while Pure Leaf was introduced to Canada and the United Kingdom after a successful launch in the United States.
Underlying operating profit was155 million higher mainly from underlying operating margin improvement, which contributed163 million. Underlying sales growth added55 million, while acquisition and disposal related activities and exchange rate movements had a negative impact of24 million and39 million respectively. Underlying operating margin was up primarily due to improvements in gross margin in both ice cream and tea reflecting premiumisation of the portfolio and savings delivery.
^Wherever referenced in this report, 2017 underlying sales growth and underlying price growth do not include any Q4 price growth in Venezuela. See pages 22 to 23 onnon-GAAP measures for further details.


20 Strategic Report  Annual Report on Form 20-F 20172018


The Group has revised its operating segments to align with the new structure under which the business is managed. Operating segment information is now provided based on three product areas: Beauty & Personal Care, Foods & Refreshment and Home Care.

BEAUTY & PERSONAL CARE

    2018   2017     % change 
Turnover ( million)     20,624      20,697    (0.3
Operating profit ( million)   4,130    4,103    0.7 
Underlying operating profit ( million)   4,508    4,375    3.0 
Operating margin (%)   20.0    19.8    0.2 
Underlying operating margin (%)   21.9    21.1    0.8 
Underlying sales growth (%)   3.1    2.9   
Underlying volume growth (%)   2.5    1.4   
Underlying price growth (%)   0.6    1.5      

KEY DEVELOPMENTS

Turnover declined by 0.3% including a negative currency impact of 7.0%. Acquisitions contributed 3.9% and underlying sales growth was 3.1%. Dove delivered another year of broad-based growth. Skin care grew strongly helped by innovations such as the new Vaseline range with clinical strength moisturisation and other brands addressing the fast growing naturals trend including Love, Beauty & Planet. Growth in skin cleansing was helped by innovations such as the relaunch of Lifebuoy with active silver, new premium formats including Dove exfoliating body polishes and our new cleansing brands such as Korea Glow. Deodorants delivered good volume growth helped by strong performance on Dove but pricing was muted. The newly acquired Schmidt’s grew strongly. Sales in oral care were flat due to ongoing competitive pressures. Prestige performed well with double digit growth on Hourglass, Ren, Living Proof and Kate Sommerville as well as improved momentum on Dermalogica and Murad. Dollar Shave Club grew double digits and continued to build scale in the US.
Underlying operating profit increased by133 million. Underlying operating margin and underlying sales growth improvement added302 million and136 million respectively, offset by a484 million adverse impact from exchange rate movements. Acquisition related activities contributed179 million. Underlying operating margin improvement reflects brand and marketing efficiencies from zero based budgeting.

FOODS & REFRESHMENT

    2018   2017    % change 
Turnover ( million)     20,227      22,444   (9.9
Operating profit ( million)   7,245    3,616   100.4 
Underlying operating profit ( million)   3,534    3,737   (5.4
Operating margin (%)   35.8    16.1   19.7 
Underlying operating margin (%)   17.5    16.7   0.8 
Underlying sales growth (%)   2.0    2.7  
Underlying volume growth (%)   1.3    (0.2 
Underlying price growth (%)   0.7    3.0     

KEY DEVELOPMENTS

Turnover declined by 9.9% including a negative currency impact of 5.6%. Acquisitions and disposals had an unfavourable impact of 6.4% reflecting the disposal of the spreads business. Underlying sales growth was 2.0% coming from volume growth of 1.3% and price growth of 0.7%. Ice cream had another strong year helped by innovations on our premium brands which included a new Magnum praline variant and anon-dairy range of Ben & Jerrys. The launch of Kinder® ice cream and good weather helped to drive strong ice cream growth in Europe. Sales in tea grew modestly: emerging markets growth was driven by good performance on core brands like Brooke Bond in India whilst in developed markets challenges in black tea offset good growth from Pukka and the new organic Lipton

range. In savoury, Knorr was helped by good performance of cooking products in emerging markets and more organic and natural innovations such as a new ‘soup in glass’ range. In dressings, campaigns centred around Hellmann’s purpose to fight food waste helped to increase brand equity, but sales were held back by promotional intensity particularly in the US. Our actions to transform the portfolio are working: strong innovations including Knorr rice and pasta pots as well as our new brands Red Red, PrepCo and Mãe Terra helped us build scale in the fast growing snacking segment.

Underlying operating profit declined by203 million including a236 million adverse contribution from exchange rate movements. Underlying operating margin improvement added247 million and underlying sales growth contributed56 million. Acquisition and disposal related activities had an overall negative impact of270 million mainly due to loss of profit of the spreads business from the date of its disposal on 2 July 2018. Underlying operating margin improvement reflects strong gross margin improvement and lower overheads despite an adverse impact from the spreads disposal.

HOME CARE

    2018   2017     % change 
Turnover ( million)     10,131      10,574    (4.2
Operating profit ( million)   1,160    1,138    1.9 
Underlying operating profit ( million)   1,317    1,288    2.3 
Operating margin (%)   11.5    10.8    0.7 
Underlying operating margin (%)   13.0    12.2    0.8 
Underlying sales growth (%)   4.2    4.4   
Underlying volume growth (%)   2.3    2.1   
Underlying price growth (%)   1.9    2.3      

KEY DEVELOPMENTS

Turnover declined by 4.2% including an adverse currency impact of 8.3%. Underlying sales growth was 4.2%, coming from volume growth of 2.3% and price growth of 1.9%. Home and hygiene grew strongly led by Sunlight which was helped by a new communication focussed on building functional awareness, as well as the continued success of Domestos toilet blocks. In fabric sensations, Comfort was helped by market development in India and China as well as the launch into Germany. Fabric solutions grew strongly helped by our strategy to encourage consumers in emerging markets to uptrade to premium formulations like Surf Excel Matics in India, and innovations such as Omo eco active with recycled packaging, plant extracts and naturally derived fragrances. Seventh Generation also grew well.
Underlying operating profit increased by29 million, including a144 million adverse contribution from exchange rate movements. Underlying operating margin improvement contributed113 million. Underlying sales growth and acquisition and disposal related activities added55 million and5 million respectively. Underlying operating margin improvement was mainly due to lower overheads and brand and marketing efficiencies.

Annual Report on Form 20-F 2018Strategic Report21


FINANCIAL REVIEWCONTINUED


CASH FLOW

Free cash flow increased by0.6 billion to5.4 billion despite aone-off contribution of0.6 billion to our pension funds. Cash flow from operating activities was9.59.0 billion, an increasea decline of0.20.5 billion compared to the prior year. The increaseFree cash flow was driven by higher operating profit and lower capital expenditure, which was 3.0%5.0 billion, a reduction of turnover compared to 3.6% of turnover in0.4 billion on the prior year, partially offset byyear. The reductions reflected the impact of currency devaluation and higher working capital, including aone-off contribution to pension funds.0.4 billion increase arising from the disposal of spreads.


  € million
2017
  million
2016
   € million
2018
  million
2017
 

Operating profit

   8,857  7,801    12,535  8,857 

Depreciation, amortisation and impairment

   1,538  1,464   


1,747


1,538


Changes in working capital

   (68 51   


(793


(68

Pensions and similar obligations less payments

   (904 (327  


(128


(904

Provisions less payments

   200  65   


55


200


Elimination of (profits)/losses on disposals

   (298 127   


(4,299


(298

Non-cash charge for share-based compensation

   284  198   


196


284


Other adjustments

   (153 (81  


(266


(153

Cash flow from operating activities

   9,456  9,298   


  9,047


  9,456


Income tax paid

   (2,164 (2,251  


(2,294


(2,164

Net capital expenditure

   (1,621 (1,878  


(1,424


(1,621

Net interest and preference dividends paid

   (316 (367  


(367


(316

Free cash flow*

   5,355  4,802   


4,962


5,355


Net cash flow (used in)/from investing activities

   (5,879 (3,188  


4,644


(5,879

Net cash flow (used in)/from financing activities

   (1,433 (3,073  


(11,548


(1,433


*

Certain measures used in our reporting are not defined under IFRS. For further information about these measures, please refer to the commentary onnon-GAAP measures on pages 2223 to 25.26.

Net outflowinflow from investing activities was5.94.6 billion, (2016:3.2 billion) reflecting an increase inof10.5 billion compared to the prior year. The increase reflects proceeds of7.2 billion from the disposal of spreads and higher spend on acquisitions during the year (see note 21).prior year.

NetThe net outflow infrom financing activities was1.411.5 billion, compared towith3.11.4 billion in the prior year. The decrease relates to higher borrowings during the year partlyoff-set by investment in acquisitions and the share buyback programmeIn 2018 there were repayments of financial liabilities of5 billion.6.6 billion compared with2.6 billion in 2017; and an outflow from changes in short-term borrowings of4.0 billion, compared with an inflow of2.7 billion in 2017. The cash outflow in respect of the repurchase of shares in 2018 was6.0 billion, compared with5.0 billion in the prior year.

BALANCE SHEET

At 31 December 2017,2018, Unilever’s combined market capitalisation was127.9121.8 billion compared with110.2127.9 billion at the end of 2016.2017.

Goodwill and intangible assets increased by1.01.1 billion mainly coming from the acquisitionsacquisition of Carver KoreaQuala and Sundial Brands, partlyrestatement of goodwill in relation to adoption of IAS 29 ‘Financial Reporting in Hyperinflationary Economies’ in Argentina (see note 1 and note 9). The increase was partially offset by goodwill relating to the Spreads business which has been classified as held for sale.impairment of Blueair. All material goodwill and indefinite-life intangible assets have been tested for impairment with no charge recognised during the year.

year other than for Blueair. Othernon-current assets remained flat atdecreased by15.0 billion. This includes0.4 billion mainly due to a reduction in the value of pension assets.

    € million
2018
    million
2017
 
Goodwill and intangible assets   29,493    28,401 

Othernon-current assets


14,482


14,901


Current assets


15,481


16,983


Total assets


59,456


60,285


Current liabilities


19,772


23,177


Non-current liabilities


27,392


22,721


Total liabilities


47,164


45,898


Shareholders’ equity


11,572


13,629


Non-controlling interest


720


758


Total equity


12,292


14,387


Total liabilities and equity


  59,456


  60,285


Current assets for funded schemes in surplus amountingdecreased from17.0 billion to2.215.5 billion compared to0.7 billionmainly reflecting the reduction in 2016. The increase was driven by strong investment returns and aone-off cash injection of0.6 billion.

    € million
2017
    million
2016
 

Goodwill and intangible assets

   28,401    27,433 

Othernon-current assets

   14,901    15,112 

Assets held for sale

   3,224    206 

Other current assets

   13,759    13,678 


Total assets

   60,285    56,429 

Liabilities held for sale

   170    1 

Other current liabilities

   23,007    20,555 

Non-current liabilities

   22,721    18,893 


Total liabilities

   45,898    39,449 

Shareholders’ equity

   13,629    16,354 

Non-controlling interest

   758    626 


Total equity

   14,387    16,980 


Total liabilities and equity

   60,285    56,429 

Assetsassets held for saledisposals as a result of3.2 billion and liabilities held for sale the completion of0.2 billion primarily relate to the Spreads business which we have signed an agreement to sell. Other current assets were13.7 billion which is the same level as in the prior year.

Other currentspreads transactions on 2 July 2018. Current liabilities were23.019.8 billion, (2016:a decrease of20.6 billion) and3.4 billion compared to the prior year. The decrease was due to repayment of short-term liabilities which were replaced by long term borrowings.non-currentNon-current liabilities were22.727.4 billion, (2016:18.9 billion) Thean increase in borrowings reflects the share buyback of54.7 billion on the prior year. During the year the Group issued bonds worth over6.0 billion and the cost of acquisitions.

On 30 January 2017 we issued £0.35 billion 1.125% fixed rate notes due February 2022. On 9 February 2017 we issued a1.2 billion bond, equally split between 0.375% fixed rate notes due February 2023 and 1.0% fixed rate notes due February 2027. On 2 May 2017 we issued a quadruple-tranche $3.15 billion bond, comprising of fixed raterepaid notes of $0.8 billion at 1.8% due May 2020, $0.85 billion at 2.2% due May 2022, $0.5 billion at 2.6% due May 2024about1.0 billion. See note 15C for analysis of bonds and $1.0 billion at 2.9% due May 2027. On 31 July 2017 we issued a triple-tranche1.9 billion bond, comprising of fixed rate notes of0.5 billion at 0% due July 2021,0.65 billion at 0.875% due July 2025 and0.75 billion at 1.375% due July 2029. On 15 September 2017 we issued a £0.5 billion bond, equally split between 1.375% fixed rate notes due September 2024 and 1.875 % fixed rate notes due September 2029.other loans.

The table below shows the movement in net pension liability during the year. The reductionincrease from3.20.6 billion at the beginning of the year to0.60.9 billion at the end of 20172018 was primarily due to strong investment returns and company contributions to defined benefit plans, mainly inreduced pension assets, driven by adverse equity markets towards the UK. Cash expenditure on pensions was1.3 billion (2016:0.7 billion).end of 2018.


   € million
20172018
 

1 January

  (3,173561

Current service cost


(245220

Employee contributions


18

17

Actual return on plan assets (excluding interest)


1,475

(1,108

Net interest cost


(9625

Actuarial lossgain


145

671

Employer contributions


1,105

383

Currency retranslation


180

26

Other movements(a)


30

(57

31 December


(874

(561


(a) 

Other movements relate to special termination benefits, past service costs including losses/(gains) on curtailment, settlements and reclassification of benefits.other immaterial movements. For more details see note 4B on pages 98 and 103.87 to 92.

FINANCE AND LIQUIDITY

Approximately1.00.8 billion (or 31%26%) of the Group’s cash and cash equivalents are held in the parent and central finance companies, for ensuring maximum flexibility. These companies provide loans to our subsidiaries that are also funded through retained earnings and third party borrowings. We maintain access to global debt markets through an infrastructure of short and long-term debt programmes. We make use of plain vanilla derivatives, such as interest rate swaps and foreign exchange contracts, to help mitigate risks. More detail is provided in notes 16, 16A, 16B and 16C on pages 121110 to 126.115.

The remaining2.32.4 billion (69%(74%) of the Group’s cash and cash equivalents are held in foreign subsidiaries which repatriate distributable reserves on a regular basis. For most countries, this is done through dividends free of tax. This balance includes154 million (2017:206 million, (2016:2016:240 million, 2015:284 million) of cash that is held in a few countries where we face cross-border foreign exchange controls and/or other legal restrictions that inhibit our ability to make these balances available in any means for general use by the wider business. Thebusiness.The cash will generally be invested or held in the relevant country and, given the other capital resources available to the Group, does not significantly affect the ability of the Group to meet its cash obligations.

We closely monitor all our exposures and counter-party limits.

Unilever has committed credit facilities in place for general corporate purposes. The undrawn bilateral committed credit facilities in place on 31 December 20172018 were US$ 7,865 million. Further details are given in note 16A. In addition, Unilever had undrawn revolving364-day bilateral credit facilities in aggregate of4,000$7,865 million.


Annual Report on Form 20-F 201722 Strategic Report  21Annual Report on Form 20-F 2018


FINANCIAL REVIEWCONTINUED


CONTRACTUAL OBLIGATIONS AT 31 DECEMBER 20172018


€ million


Total

    million
Due
within
1 year
    million
Due in
1-3
years
    million
Due in
3-5
years
    million
Due in
over
5 years
  

million


Total


million
Due
within

1 year


million
Due
in1-3
years


million
Due
in3-5
years


million
Due in
over 5
years


Long-term debt


23,876


7,688


3,752


3,911


8,525


24,428


2,950


4,533


4,683


12,262


Interest on financial liabilities


2,847


392


593


434


1,428


3,723


467


800


628


1,828


Operating lease obligations


2,454


418


705


545


786


2,464


481


758


501


724


Purchase obligations(a)


595


484


96


15


-


520


421


94


1


4


Finance leases


206


20


35


33


118


187


20


37


34


96


Other long-term commitments


1,645


790


614


210


31


1,390


678


590


95


27


Other financial liabilities


177


177


-


-


-


150


149


1


Total


31,800


9,969


5,795


5,148


10,888


32,862


5,166


6,813


5,942


14,941


(a) 

For raw and packaging materials and finished goods.

Further details are set out in the following notes to the consolidated financial statements: note 10 on pages 111100 and 112,101, note 15C on page 119 to 120,108 and 109, and note 20 on pages 131 and 132.120 to 122. Unilever is satisfied that its financing arrangements are adequate to meet its working capital needs for the foreseeable future. In relation to the facilities available to the Group, borrowing requirements do not fluctuate materially during the year and are not seasonal.

AUDIT FEES

Included within operating profit is2021 million (2016:(2017:1520 million) paid to the external auditor, of which1416 million (2016:(2017:14 million) related to statutory audit services.

NON-GAAP MEASURES

Certain discussions and analyses set out in this Annual Report and Accounts (and the Additional Information for US Listing Purposes) include measures which are not defined by generally accepted accounting principles (GAAP) such as IFRS. We believe this information, along with comparable GAAP measurements, is useful to investors because it provides a basis for measuring our operating performance, and our ability to retire debt and invest in new business opportunities. Our management uses these financial measures, along with the most directly comparable GAAP financial measures, in evaluating our operating performance and value creation.Non-GAAP financial measures should not be considered in isolation from, or as a substitute for, financial information presented in compliance with GAAP. Wherever appropriate and practical, we provide reconciliations to relevant GAAP measures.

CHANGE IN REPORTING OF PERFORMANCE MEASURES

Following our strategic review earlier this year, we announced that we would be accelerating savings programmes and being more active in the development of our portfolio, including exiting from our Spreads business. This will mean spending significant funds on restructuring costs. In order to provide a clear picture of our performance against the objectives set out in the announcement of the outcome of the review, where relevant, ournon-GAAP measures will now exclude restructuring costs, the change from our previous measure of core operating profit is the additional exclusion of restructuring costs that are not related to acquisitions and disposals.

Ournon-GAAP measures have therefore changed from ‘core operating profit’, ‘core operating margin’, ‘core earnings per share’, ‘core effective tax rate’ and ‘constant core earnings per share’ to ‘underlying operating profit’, ‘underlying operating margin’, ‘underlying earnings per share’, ‘underlying effective tax rate’ and ‘constant underlying earnings per share’ respectively. These measures are explained further on the following pages.

EXPLANATION AND RECONCILIATION

OFNON-GAAP MEASURES

Unilever uses ‘constant rate’ and ‘underlying’ measures primarily for internal performance analysis and targeting purposes. We present certain items, percentages and movements, using constant exchange rates, which exclude the impact of fluctuations in foreign currency exchange rates. We calculate constant currency values by translating both the current and the prior period local currency amounts into euro using the prior period average exchange rates.rates into euro, except for countries where the impact of consumer price inflation rates has escalated to extreme levels. In these countries, the local currency amounts before the application of IAS 29 are translated into euros using the period closing exchange rate.

The table below shows exchange rate movements in our key markets.


 Annual
average rate
in 2017
   Annual
average rate
in 2016
  

Annual
  average
rate in

2018


Annual
  average
rate in

2017


Brazilian real (1 = BRL)

  4.282    3.573 

Chinese yuan (1 = CNY)


7.807


7.608


Indian rupee (1 = INR)


80.730


73.258


Indonesia rupiah (1 = IDR)


16831


15011


Philippine peso ( 1 = PHP)


62.379


56.596


UK pound sterling (1 = GBP)


0.884


0.876


US dollar (1 = US$)

  1.123    1.111  


1.185


1.123


Indian rupee (1 = INR)

  73.258    74.588 

Brazilian real (1 = BRL)

  3.573    3.889 

UK pound sterling (1 = GBP)

  0.876    0.815 

Indonesia rupiah (1 = IDR)

  15011    14770 

Chinese yuan (1 = CNY)

  7.608    7.355 

Argentine peso ( 1 = ARS)

  18.401    16.292 

In the following sections we set out our definitions of the followingnon-GAAP measures and provide reconciliations to relevant GAAP measures:

underlying sales growth;
underlying volume growth;
underlying price growth;
non-underlying items;
underlying earnings per share;
underlying operating profit and underlying operating margin;
underlying earnings per share;
underlying effective tax rate;
constant underlying earnings per share;
free cash flow;
return on assets;
net debt; and
return on invested capital.

UNDERLYING SALES GROWTH

Underlying sales growthSales Growth (USG) refers to the increase in turnover for the period, excluding any change in turnover resulting from acquisitions, disposals and changes in currency. We believe this measure provides valuable additional information on the underlying sales performance of the business and is a key measure used internally. The impact of acquisitions and disposals is excluded from USG for a period of 12 calendar months from the applicable closing date. Turnover from acquired brands that are launched in countries where they were not previously sold is included in USG as such turnover is more attributable to our existing sales and distribution network than the acquisition itself. We believe this measure provides valuable additional information on the underlying sales performance of the business and is a key measure used internally. Also excluded is the impact of price growth from countries where the impact of consumer price inflation (CPI) rates has escalated to extreme levels.

There are two countries where we have determined extreme levels of CPI exist. The first is Venezuela where in Q4 2017 inflation rates haveexceeded 1,000% and management considered that the situation would persist for some time. Consequently, price growth in Venezuela has been excluded from USG since Q4 2017. The second is Argentina, which from Q3 2018 has been accounted for in accordance with IAS 29, and thus from Q3 2018 Argentina price growth is excluded from USG. The adjustment made at Group level as a result of these two exclusions was a reduction in price growth of 32.4% for the year. This treatment for both countries will be kept under regular review.

Prior to Q3 2018 USG only excluded the impact of price changes in countries where consumer price inflation has escalated to extreme levels and where management forecastof 1,000% or more. However, given the need to account for our Argentinian business in accordance with IAS 29, we have now also excluded price changes in countries that such a situation will continueneed to be accounted for an extended period of time; at least one year.in accordance with IAS 29. Prior to Q3 2018 there were no countries that were accounted for under IAS 29, so no restatements are necessary.


22Annual Report on Form 20-F 2018 Strategic Report Annual Report on Form 20-F 201723


FINANCIAL REVIEWCONTINUED


The reconciliation of USG to changes in the GAAP measure turnover is as follows:


TOTAL GROUP  2017
vs 2016
  2016
vs 2015
 

Turnover growth (%)(a)

   1.9   (1.0

Effect of acquisitions (%)

   1.3   0.8 

Effect of disposals (%)

   (0.4  (0.2

Effect of exchange rates (%)(b)

   (2.1  (5.1


Underlying sales growth (%)(b)


3.1


3.7


PERSONAL CARE


  2017
vs 2016
  2016
vs 2015
 

Turnover growth (%)(a)

   2.6   0.5 

Effect of acquisitions (%)

   1.8   1.7 

Effect of disposals (%)

   (0.1  (0.3

Effect of exchange rates (%)

   (1.9  (4.9


Underlying sales growth (%)


2.9


4.2


FOODS


  2017
vs 2016
  2016
vs 2015
 

Turnover growth (%)(a)

   (0.1  (3.1

Effect of acquisitions (%)

   0.1    

Effect of disposals (%)

   (0.1  (0.3

Effect of exchange rates (%)

   (1.1  (4.7


Underlying sales growth (%)


1.0


2.1


HOME CARE  2017
vs 2016
  2016
vs 2015
 

Turnover growth (%)(a)

   5.6   (1.5

Effect of acquisitions (%)

   3.1   0.6 

Effect of disposals (%)

   (0.2  (0.2

Effect of exchange rates (%)

   (1.7  (6.5


Underlying sales growth (%)


4.4


4.9


REFRESHMENT  2017
vs 2016
  2016
vs 2015
 

Turnover growth (%)(a)

   (0.8  (1.1

Effect of acquisitions (%)

   0.3   0.2 

Effect of disposals (%)

   (1.7  (0.1

Effect of exchange rates (%)(b)

   (3.9  (4.6


Underlying sales growth (%)(b)


4.9


3.5


The reconciliation of USG to changes in the GAAP measure turnover is as follows:

TOTAL GROUP  2018
vs 2017
  2017
vs 2016
 

Turnover growth (%)(a)


(5.1


1.9


Effect of acquisitions (%)


2.0


1.3


Effect of disposals (%)


(3.0


(0.4

Effect of exchange rates (%)(b)


(6.7


(2.1

Underlying sales growth (%)(b)


2.9


3.1


BEAUTY & PERSONAL CARE


2018

    vs 2017


2017

    vs 2016


Turnover growth (%)(a)


(0.3


2.6


Effect of acquisitions (%)


3.9


1.8


Effect of disposals (%)


(0.1

Effect of exchange rates (%)(b)


(7.0


(1.9

Underlying sales growth (%)(b)

   3.1   2.9 

FOODS & REFRESHMENT


  2018
vs 2017
  2017
vs 2016
 

Turnover growth (%)(a)


(9.9


(0.4

Effect of acquisitions (%)


0.8


0.2


Effect of disposals (%)


(7.2


(0.8

Effect of exchange rates (%)(b)


(5.6


(2.4

Underlying sales growth (%)(b)


2.0


2.7


HOME CARE  2018
vs 2017
  2017
vs 2016
 

Turnover growth (%)(a)


(4.2


5.6


Effect of acquisitions (%)


0.5


3.1


Effect of disposals (%)


(0.2


(0.2

Effect of exchange rates (%)(b)


(8.3


(1.7

Underlying sales growth (%)(b)


4.2


4.4


(a) 

Turnover growth is made up of distinct individual growth components, namely underlying sales, currency impact, acquisitions and disposals. Turnover growth is arrived at by multiplying these individual components on a compounded basis as there is a currency impact on each of the other components. Accordingly, turnover growth is more than just the sum of the individual components.

(b) Q4

For 2018 underlying price growth in Venezuela (from January 2018) and Argentina (from July 2018) has been excluded from underlying sales growth and an equal and opposite adjustment made in effect of exchange rate. For 2017 only Q4 price growth in Venezuela has been excluded.

UNDERLYING VOLUME GROWTH

Underlying volume growth (UVG) is part of USG and means, for the applicable period, the increase in turnover in such period calculated as the sum of (i) the increase in turnover attributable to the volume of products sold; and (ii) the increase in turnover attributable to the composition of products sold during such period. UVG therefore excludes any impact on USG due to changes in prices.

UNDERLYING PRICE GROWTH

Underlying price growth (UPG) is part of USG and means, for the applicable period, the increase in turnover attributable to changes in prices during the period. UPG therefore excludes the impact to USG due to (i) the volume of products sold; and (ii) the composition of products sold during the period. In determining changes in price we exclude the impact of price changes arisinggrowth in countries where consumer price inflation (CPI) rates have escalated to extreme levels of 1,000% or moreArgentina and where management forecast that this situation is going to continue for an extended period of time; at least one year. This happens very rarely butVenezuela as explained in the fourth quarter of 2017 the actual and forecast inflation rates for Venezuela triggered such an exclusion. This treatment will be kept under regular review, but will not be revised until the fourth quarter of 2018 at the earliest.USG above.

The relationship between USG, UVG and UPG is set out below:


  2017
vs 2016
   2016
vs 2015
   2018
    vs 2017
   2017
    vs 2016
 

Underlying volume growth (%)

   0.8    0.9   


1.9


0.8


Underlying price growth (%)(a)

   2.3    2.8   


0.9


2.3


Underlying sales growth (%)

   3.1    3.7   


2.9


3.1


(a) Q4

For 2018 underlying price growth in Venezuela (from January 2018) and Argentina (from July 2018) has been excluded from underlying price in the table above and an equal and opposite adjustment made in the effect of exchange rates. For 2017 only Q4 price growth in Venezuela has been excluded.

The adjustment made at total Group level in the above table in respect of Q4 price growth in Venezuela was 0.8%. Prior to this adjustment being made, price growth at total Group level would have been 3.1% and exchange rate impact would have been (2.9)%. The corresponding adjustment for Refreshment was 4.4%. There is no adjustment in the other categories.

Refer to page 2021 for the relationship between USG, UVG and UPG for each of the categories.

NON-UNDERLYING ITEMS

Severalnon-GAAP measures are adjusted to exclude items defined asnon-underlying due to their nature and/or frequency of occurrence.

Non-underlying items within operating profit are: gains or losses on business disposals, acquisition and disposal related costs, restructuring costs, impairments and other significantone-off items within operating profit
Non-underlying items not in operating profit but within net profit are: significant and unusual items in net finance cost, monetary gain/(loss) arising from hyperinflationary economies, share of profit/(loss) of joint ventures and associates and taxation
Non-underlying items are bothnon-underlying items within operating profit and thosenon-underlying items not in operating profit but within net profit

Refer to note 3 for details ofnon-underlying items.

UNDERLYING EARNINGS PER SHARE

Underlying earnings per share (underlying EPS) is calculated as underlying profit attributable to shareholders’ equity divided by the diluted combined average number of share units. In calculating underlying profit attributable to shareholders’ equity, net profit attributable to shareholders’ equity is adjusted to eliminate thepost-tax impact ofnon-underlying items. This measure reflects the underlying earnings for each share unit of the Group.

Refer to note 7 on page 10796 for reconciliation of net profit attributable to shareholders’ equity to underlying profit attributable to shareholders’ equity.


Annual Report on Form 20-F 201724 Strategic Report  23Annual Report on Form 20-F 2018


FINANCIAL REVIEWCONTINUED


UNDERLYING OPERATING PROFIT AND UNDERLYING OPERATING MARGIN

Underlying operating profit and underlying operating margin mean operating profit and operating margin before the impact ofnon-underlying items within operating profit. Underlying operating profit represents our measure of segment profit or loss as it is the primary measure used for making decisions about allocating resources and assessing performance of the segments.

The reconciliation of operating profit to underlying operating profit is as follows:


  € million
2017
  million
2016
   € million
2018
  million
2017
 

Operating profit


8,857


7,801


12,535


8,857


Non-underlying items within operating profit (see note 3)


543


823


(3,176


543


Underlying operating profit


9,400


8,624


9,359


9,400


Turnover


53,715


52,713


50,982


53,715


Operating margin


16.5


14.8


24.6


16.5


Underlying operating margin


17.5


16.4


   18.4 17.5

Further details ofnon-underlying items can be found in note 3 on page 9685 of the consolidated financial statements.

UNDERLYING EFFECTIVE TAX RATE

The underlying effective tax rate is calculated by dividing taxation excluding the tax impact ofnon-underlying items by profit before tax excluding the impact ofnon-underlying items and share of net profit/(loss) of joint ventures and associates. This measure reflects the underlying tax rate in relation to profit before tax excludingnon-underlying items before tax and share of net profit/(loss) of joint ventures and associates. Tax impact onnon-underlying items within operating profit is the sum of the tax on eachnon-underlying item, based on the applicable country tax rates and tax treatment.

The reconciliation of taxation to taxation before tax impact ofnon-underlying items This is as follows:shown in the following table:


  € million
2017
  million
2016
   € million
2018
  million
2017
 

Taxation


1,667


1,922


2,575


1,667


Tax impact of:


Non-underlying items within operating profit(a)


77


213


(259


77


Non-underlying items not in operating profit but within net profit(a)


578


-


(29


578


Taxation before tax impact ofnon-underlying items


2,322


2,135


Taxation before tax impact ofnon-underlying

   2,287  2,322 

Profit before taxation


8,153


7,469


12,383


8,153


Non-underlying items within operating profit before tax(a)


543


823


(3,176


543


Non-underlying items not in operating profit but within net profit before tax(a)


382


-


Non-underlying items not in operating profit but within net profit before tax(b)


(122


382


Share of net (profit)/loss of joint ventures and associates


(155


(127


(185


(155


Profit before tax excludingnon-underlying items before tax and share of net profit/(loss) of joint ventures and associates


8,923


8,165


Profit before tax excludingnon-underlying items before tax and share of net profit/ (loss) of joint ventures and associates

   8,900  8,923 

Underlying effective tax rate


26.0


26.1


   25.7 26.0


(a) 

Refer to note 3 for further details on these items.

(b)

2018 amount excludes32 million gain on disposal of spreads business by the joint venture in Portugal which is included in the share of net profit/(loss) of joint ventures and associates line. Including the32 million, totalnon-underlying items not in operating profit but within net profit before tax is154 million. See note 3.

CONSTANT UNDERLYING EARNINGS PER SHARE

Constant underlying earnings per share (constant underlying EPS) is calculated as underlying profit attributable to shareholders’ equity at constant exchange rates and excluding the impact of both translational hedges and Q4 price growthinflation in Venezuela (for the whole of 2018) and Argentina (from July 2018) divided by the diluted combined average number of share units.ordinary shares. This measure reflects the

underlying earnings for each ordinary share unit of the Group in constant exchange rates.

The reconciliation of underlying profit attributable to shareholders’ equity to constant underlying earnings attributable to shareholders’ equity and the calculation of constant underlying EPS is as follows:


  € million
2017
  million
2016
   € million
2018
  million
2017
 

Underlying profit attributable to shareholders’ equity(a)


6,315


5,785


6,365


6,315


Impact of translation of earnings between constant and current exchange rates and translational hedges


310


194


Impact of Q4 2017 Venezuela price growth(b)


(153


-


Impact of translation from current to constant exchange rates and translational hedges


7,112


95


Impact of Venezuela and Argentina price inflation(b)


(6,551


Constant underlying earnings attributable to shareholders’ equity


6,472


5,979


6,926


6,410


Diluted combined average number of share units (millions of units)


2,814.0


2,853.9


2,694.8


2,814.0


Constant underlying EPS (€)


2.30


2.10


Constant underlying EPS ()


2.57


2.28


(a) 

See note 77.

(b) 

See pages 2223 and 2324 for further detailsdetails.

In calculating the movementFrom 2018, in our reporting of growth in constant underlying EPS, we translate the prior period using an annual average exchange rate rather than monthly averages. This change has been made to align with the prior period constant exchange rate used for calculating USG. The impact of this is an increase of0.01 per share in 2017 constant underlying EPS for 2017 is compared to the underlying EPS for 2016 as adjusted for the impact of translational hedges, which was2.07.EPS.

FREE CASH FLOW

Within the Unilever Group, freeFree cash flow (FCF) is defined as cash flow from operating activities, less income taxes paid, net capital expenditures and net interest payments and preference dividends paid. It does not represent residual cash flows entirely available for discretionary purposes; for example, the repayment of principal amounts borrowed is not deducted from FCF. FCF reflects an additional way of viewing our liquidity that we believe is useful to investors because it represents cash flows that could be used for distribution of dividends, repayment of debt or to fund our strategic initiatives, including acquisitions, if any.

The reconciliation of net profit to FCF is as follows:


  € million
2017
  million
2016
   € million
2018
  million
2017
 

Net profit


6,486


5,547


9,808


6,486


Taxation


1,667


1,922


2,575


1,667


Share of net profit of joint ventures/associates and other income fromnon-current investments


(173


(231


(207


(173


Net monetary gain arising from hyperinflationary economies


(122


Net finance costs


877


563


481


877


Depreciation, amortisation and impairment


1,538


1,464


1,747


1,538


Changes in working capital


(68


51


(793


(68


Pensions and similar obligations less payments


(904


(327


(128


(904


Provisions less payments


200


65


55


200


Elimination of (profits)/losses on disposals


(298


127


(4,299


(298


Non-cash charge for share-based compensation


284


198


196


284


Other adjustments


(153


(81


(266


(153


Cash flow from operating activities


9,456


9,298


9,047


9,456


Income tax paid


(2,164


(2,251


(2,294


(2,164


Net capital expenditure


(1,621


(1,878


(1,424


(1,621


Net interest and preference dividends paid


(316


 (367   


(367


(316


Free cash flow


5,355


4,802


4,962


5,355


Net cash flow (used in)/from investing activities


(5,879


(3,188


4,644


(5,879


Net cash flow (used in)/from financing activities


(1,433


(3,073


(11,548


(1,433


24Annual Report on Form 20-F 2018 Strategic Report Annual Report on Form 20-F 201725


FINANCIAL REVIEWCONTINUED


RETURN ON ASSETS

Return on assets is a measure of the return generated on assets for each category.division. This measure provides additional insight on the performance of the categoriesdivisions and assists in formulating long termlong-term strategies with respect to allocation of capital, across categories. Categorydivisions. Division return on assets is calculated as underlying operating profit (UOP) after tax for the Categorydivision divided by the annual average of: property, plant and equipment, net assets held for sale (excluding goodwill and intangibles), inventories, trade and other current receivables, and trade payables and other current liabilities, for each category.division. The annual average is computed by adding the amounts at the beginning and the end of the calendar year dividedand dividing by two.


    € million   € million € million   € million € million € million     € million     € million         € million       
    Personal   Home Home Care and       Foods and     Beauty &     Foods &     Home         € million 
2018    Personal Care         Refreshment     Care     Total 

Underlying operating profit before tax


4,508


3,534


1,317


9,359


Tax on underlying operating profit


(1,159


(908


(338


(2,405

Underlying operating profit after tax


3,349


2,626


979


6,954


Property plant and equipment


3,631


4,783


1,933


10,347


Net assets held for sale


1


25


26


Inventories


1,737


1,761


803


4,301


Trade and other receivables


2,319


3,027


1,139


6,485


Trade payables and other current liabilities


(5,478


(5,984


(2,995


(14,457

Period end assets (net)


2,210


3,612


880


6,702


Average assets for the period (net)


2,178


3,830


799


6,807


Division return on assets


154


69


123


102

2017    Care   Care Personal Care   Foods Refreshment Refreshment                     

Underlying Operating Profit before tax

     4,375    1,288   5,663    2,471   1,266   3,737     


4,375


3,737


1,288


9,400


Tax on underlying operating profit

     (1,139   (335  (1,474   (643  (329  (972    


(1,139


(972


(335


2,446


Underlying Operating Profit after tax

     3,236    953   4,189    1,828   937   2,765     


3,236


2,765


953


6,954


Property plant and equipment

     3,520    1,787   5,307    1,835   3,269   5,104     


3,520


5,104


1,787


10,411


Net assets held for sale

     1    -   1    741   1   742     


1


742


743


Inventories

     1,590    735   2,325    694   943   1,637     


1,590


1,637


735


3,962


Trade and other receivables

     2,018    1,032   3,050    1,203   969   2,172     


2,018


2,172


1,032


5,222


Trade payables and other current liabilities

     (4,984   (2,836  (7,820   (2,960  (2,646  (5,606    


(4,984


(5,606


(2,836


(13,426

Period end assets (net)

     2,145    718   2,863    1,513   2,536   4,049     


2,145


4,049


718


6,912


Average assets for the period (net)

     2,122    778   2,900    1,560   2,641   4,201     


2,122


4,201


778


7,101


Category Return on assets

     152   122  144   117  35  66

2016


Underlying Operating Profit before tax

     4,033    1,086  5,119    2,394  1,111  3,505 

Tax on underlying operating profit

     (1,054   (284 (1,338   (626 (291 (917

Underlying Operating Profit after tax

     2,979    802  3,781    1,768  820  2,588 

Property plant and equipment

     3,537    1,940  5,477    2,691  3,505  6,196 

Net assets held for sale

     8    4  12    16  79  95 

Inventories

     1,680    732  2,412    875  991  1,866 

Trade and other receivables

     1,952    969  2,921    1,212  969  2,181 

Trade payables and other current liabilities

     (5,078   (2,807 (7,885   (3,187 (2,799 (5,986

Period end assets (net)

     2,099    838  2,937    1,607  2,745  4,352 

Average assets for the period (net)

     1,938    777  2,715    1,562  2,638  4,200 

Category Return on assets

     154   103 139   113 31 62

Division return on assets


152


66


122


98


NET DEBT

Net debt is defined as the excess of total financial liabilities, excluding trade payables and other current liabilities, over cash, cash equivalents and other current financial assets, excluding trade and other current receivables. It is a measure that provides valuable additional information on the summary presentation of the Group’s net financial liabilities and is a measure in common use elsewhere.

The reconciliation of total financial liabilities to net debt is as follows:


  € million
2017
  million
2016
   € million
2018
  million
2017
 

Total financial liabilities


(24,430


(16,595


(24,885


(24,430


Current financial liabilities

   (7,968 (5,450  


(3,235


(7,968

Non-current financial liabilities

   (16,462 (11,145  


(21,650


(16,462

Cash and cash equivalents as per balance sheet


3,317


3,382


3,230


3,317


Cash and cash equivalents as per cash flow

   3,169  3,198 

Cash and cash equivalents as per cash flow statement


3,090


3,169


Add bank overdrafts deducted therein

   167  184   


140


167


Less cash and cash equivalents held for sale

   (19  -   


(19

Other current financial assets

   770  599   


874


770


Net debt


(20,343


(12,614


(20,781


(20,343

RETURN ON INVESTED CAPITAL

Return on invested capital (ROIC) is a measure of the return generated on capital invested by the Group. The measure provides a guide rail for long-term value creation and encourages compounding reinvestment within the business and discipline

around acquisitions with low returns and long payback. ROIC is calculated as underlying operating profit after tax divided by the annual average of: goodwill, intangible assets, property, plant and equipment, net assets held for sale, inventories, trade and other current receivables, and trade payables and other current liabilitiesliabilities.


  € million
2017
  million
2016
   € million
2018
  million
2017
 

Underlying operating profit before tax(a)

   9,400  8,624   


9,359


9,400


Tax on underlying operating profit(b)

   (2,446 (2,255  


(2,405


(2,446

Underlying operating profit after tax

   6,954  6,369   


6,954


6,954


Goodwill

   16,881  17,624   


17,341


16,881


Intangible assets

   11,520  9,809   


12,152


11,520


Property, plant and equipment

   10,411  11,673   


10,347


10,411


Net assets held for sale

   3,054  205   


108


3,054


Inventories

   3,962  4,278   


4,301


3,962


Trade and other current receivables

   5,222  5,102   


6,485


5,222


Trade payables and other current liabilities

   (13,426 (13,871  


(14,457


(13,426

Period-end invested capital

   37,624  34,820   


36,277


37,624


Average invested capital for the period

   36,222  33,231   


36,951


36,222


Return on average invested capital(c)

   19.2 19.2  


18.8


19.2


(a) 

See reconciliation of operating profit to underlying operating profit on page 24.25.

(b) 

Tax on underlying operating profit is calculated as underlying operating profit before tax multiplied by underlying effective tax rate of 25.7% (2017: 26.0% (2016: 26.1%) which is shown on page 24.

(c)As noted on page 22 under the heading ‘Change in reporting of performance measures’, our previousnon-GAAP measure of core operating profit is no longer used and we instead use underlying operating profit. We have changed our definition of ROIC to align with this change and restated 2016 ROIC, which has moved from 17.9% to 19.2%.25.


Annual Report on Form 20-F 201726 Strategic Report  25Annual Report on Form 20-F 2018


RISKS


OUR RISK APPETITE AND APPROACH

TO RISK MANAGEMENT

Risk management is integral to Unilever’s strategy and to the achievement of Unilever’s long-term goals. Our success as an organisation depends on our ability to identify and exploit the opportunities generated by our business and the markets we are in. In doing this we take an embedded approach to risk management which puts risk and opportunity assessment at the core of the Board agenda, which is where we believe it should be.

Unilever adopts a risk profile that is aligned to our Visionvision to grow our business, whilstwhile decoupling our environmental footprint from our growth and increasing our positive social impact. Our appetite for risk is driven by the following:

Our growth should be consistent, competitive, profitable and responsible.
Our behaviours must be in line with our Code of Business Principles and Code Policies.
We strive to continuously improve our operational efficiency and effectiveness.
We aim to maintain a single A credit rating on a long-term basis.

Our approach to risk management is designed to provide reasonable, but not absolute, assurance that our assets are safeguarded, the risks facing the business are being assessed and mitigated and all information that may be required to be disclosed is reported to Unilever’s senior management including, where appropriate, the Chief Executive Officer and Chief Financial Officer.

ORGANISATION

The Boards assume overall accountability for the management of risk and for reviewing the effectiveness of Unilever’s risk management and internal control systems.

The Boards have established a clear organisational structure with well defined accountabilities for the principal risks that Unilever faces in the short, medium and long-term.long term. This organisational structure and distribution of accountabilities and responsibilities ensure that every country in which we operate has specific resources and processes for risk reviewreviews and risk mitigation. This is supported by the Unilever Leadership Executive, which takes active responsibility for focusing on the principal areas of risk to Unilever. The Boards regularly review these risk areas, including consideration of environmental, social and governance matters, and retain responsibility for determining the nature and extent of the significant risks that Unilever is prepared to take to achieve its strategic objectives.

FOUNDATION AND PRINCIPLES

Unilever’s approach to doing business is framed by our Purpose and values (see page 1). Our Code of Business Principles sets out the standards of behaviour that we expect all employees to adhere to.Day-to-day responsibility for ensuring these principles are applied throughout Unilever rests with senior management across categories, geographies and functions. A network of Business Integrity Officers and Committees supports the activities necessary to communicate the Code, deliver training, maintain processes and procedures (including support lines) to report and respond to alleged breaches, and to capture and communicate learnings.

We have a framework of Code Policies that underpinunderpins the Code of Business Principles and set out thenon-negotiable standards of behaviour expected from all our employees.

For each of our principal risks we have a risk management framework detailing the controls we have in place and who is responsible for managing both the overall risk and the individual controls mitigating that risk.

Unilever’s functional standards define mandatory requirements across a range of specialist areas such as health and safety, accounting and reporting and financial risk management.

PROCESSES

Unilever operates a wide range of processes and activities across all its operations covering strategy, planning, execution and performance management. Risk management is integrated into every stage of this business cycle. These procedures are formalised and documented and are increasingly being centralised and automated into transactional and other information technology systems.

ASSURANCE ANDRE-ASSURANCE

Assurance on compliance with the Code of Business Principles and all of our Code Policies is obtained annually from Unilever management via a formal Code declaration. In addition, there are specialist awareness and training programmes which are run throughout the year and vary depending on the business priorities. These specialist compliance programmes supplement the Code declaration. Our Corporate Audit function plays a vital role in providing to both management and the Boards an objective and independent review of the effectiveness of risk management and internal control systems throughout Unilever.


BOARDS’ ASSESSMENT OF COMPLIANCE WITH THE RISK MANAGEMENT FRAMEWORKS

The Boards, advised by the Committees where appropriate, regularly review the significant risks and decisions that could have a material impact on Unilever. These reviews consider the level of risk that Unilever is prepared to take in pursuit of the business strategy and the effectiveness of the management controls in place to mitigate the risk exposure.

The Boards, through the Audit Committee, have reviewed the assessment of risks, internal controls and disclosure controls and procedures in operation within Unilever. They have also considered the effectiveness of any remedial actions taken for the year covered by this Annual Report and Accounts and up to the date of its approval by the Boards.

Details of the activities of the Audit Committee in relation to this can be found in the Report of the Audit Committee on pages 4143 to 42.45.

Further statements on compliance with the specific risk management and control requirements in the Dutch Corporate Governance Code, the UK Corporate Governance Code, the US Securities Exchange Act (1934) and the Sarbanes-Oxley (2002) Act can be found on pages 39 to 40.41 and 42.


26Annual Report on Form 20-F 2018 Strategic Report Annual Report on Form 20-F 201727


RISKSCONTINUED


VIABILITY STATEMENT

The Directors have reviewed the long-term prospects of the Group in order to assess its viability. This review incorporated the activities and key risks of Unilever,the Group together with the factors likely to affect itsthe Group’s future development, performance, the financial position, of Unilever, its cash flows, liquidity position and borrowing facilities areas described on pages 1 to 25.26. In addition, we describe in notes 15 to 18 on pages 115104 to 130 Unilever’s120 the Group’s objectives, policies and processes for managing its capital, its financial risk management objectives, details of its financial instruments and hedging activities and its exposures to credit and liquidity risk.

ASSESSMENT

In order to report on the long-term viability of Unilever,the Group, the Directors reviewed the overall funding capacity and headroom available to withstand severe events and carried out a robust assessment of the principal risks facing Unilever,the Group, including those that would threaten its business model, future performance, solvency or liquidity. The assessment assumes that any debt maturing in the next three years can bere-financed at commercially acceptable terms or via our current standby facility. This assessment also included reviewing and understanding the mitigation factors in respect of each of those risks. The risksrisk factors are summarised on pages 2829 to 31.33.

The viability assessment has two parts:

First, the Directors considered the period over which they have a reasonable expectation that Unileverthe Group will continue to operate and meet its liabilities;liabilities, taking into account current debt facilities and debt headroom; and

Second, they considered the potential impact of severe but plausible scenarios over this period, including:

assessing scenarios for each individual principal risk, for example the termination of our relationships with the three largest global customers; the loss of all material litigation cases; a major IT data breach and the destruction of three of our largest sourcing units;lost cost and growth opportunities from not keeping up with technological changes; and

assessing scenarios that involve more than one principal risk such as:including the following multi risk scenarios:

Multi risk

scenarios modelled

Level of

severity reviewed

Link to

principal risk

 a contamination

Contamination issue with one of our products leading to a fine equal to 1% of Unilever’s turnover, lower sales of impacted products of this brand and the temporary closure of our largest sourcing unit;unit.

  a major IT data breach resulting in a

A fine equal to 2%1% of Unilever’sGroup turnover was considered along with damage to our largest brand and disruption to supply chain.

•  Safe and high-quality products

•  Brand preference

•  Supply chain

Major global incident affecting one or more of the Group’s key locations resulting in an outage for a year in a key system resultingsourcing unit and significant water shortages in the temporary inability to sell products;our key developing markets.

The complete loss of all of our turnover in our largest geographic market was considered along with destruction of a key sourcing unit and reduced demand for our products that require water.

•  Economic and political instability

•  Supply chain

•  Climate change

 a global
Global economic downturn leading to an increase in funding costs and the loss of our three largest customers.Significant business disruption in our largest emerging market was considered with the impact of losing our three key customers.

•  Economic and political instability

•  Treasury and pensions

•  Customer relationships

FINDINGS

A
���

Firstly, a three-year period is considered appropriate for this viability assessment because it is the period covered by the strategic plan; and it enables a high level of confidence in assessing viability, even in extreme adverse events, due to a number of factors such as:

the period covered by Unilever’s ongoing strategic planning; and it enables a high level of confidence in assessing viability, even in extreme adverse events, due to a number of factors such as:

Unilever’sGroup has considerable financial resources together with established business relationships with many customers and suppliers in countries throughout the world;

high cash generation by Unilever’s operations;the Group’s operations and access to the external debt markets;

flexibility of cash outflow with respect to significant marketing programmes and capital expenditure projects which usually have a2-3 year horizon; and

Unilever’s

the Group’s diverse product and geographical activities which are impacted by continuously evolving technology and innovation.

Taking into account Unilever’s current position and plans,Secondly, for each of our 14 principal risks, worst case plausible scenarios have been assessed together with multiple risk scenarios. None of the Directors believe that there is no plausible scenario thatscenarios reviewed, either individually or in aggregate would threaten our business model, future performance, solvency or liquidity over the next three years.cause Unilever to cease to be viable.

CONCLUSION

On the basis described above, the Directors have a reasonable expectation that Unileverthe Group will be able to continue in operation and meet its liabilities as they fall due over the three-year period of their assessment.


PRINCIPAL RISK FACTORS

Our business is subject to risks and uncertainties. On the following pages we have identified the risks that we regard as the most relevant to our business. These are the risks that we see as most material to Unilever’s business and performance at this time. There may be other risks that could emerge in the future.

All the principal risks could impact our business within the next two years (i.e.(ie short-term risks), or could impact our business over the next three to five years (i.e.(ie medium-term risks). Some principal risks, such as climate change, could also impact over the longer-term (i.e.longer term (ie beyond 5five years).

Our principal risks have not fundamentally changed this year. We have updatedyear apart from the descriptionsaddition of severala plastic packaging risk. Given the nature of our principal risksbusiness, a reduction in the amount of plastic packaging and increase in the use of recyclable content in our packaging is critical to reflect the significant impact that technological changes are having on our consumers, customers and operations. In addition, we have made specific reference within our business transformation risk to the initiatives announced in April 2017 to ‘accelerate sustainable shareholder value creation’.future success.

28Strategic ReportAnnual Report on Form 20-F 2018


As well as identifying the most relevant risks for our business we reflect on whether we think the level of risk associated with each of our principal risks is increasing or decreasing. ThereIn addition to our plastic packaging risk there are fourthree areas where we believe there is an increased level of risk which are:risk:

Brand Equity: our brand equity risk is increasing and changing in nature as technology impacts both the speed at which consumer trends change and our brand communication models;

Customer Relationships: technology is changing our channel landscape and hence changing the nature of the relationships with our traditional customers as well as requiring us to develop relationships with new customers who are drivinge-commerce development;

Systems and Information: the number of cybersecurity attacks areis still increasing significantly, and incidents are becoming more sophisticated as technology further evolves; and

Business Transformation: this risk has increased as a result of the scalespeed of technological change which means the pressure to digitalise our business to take advantage of the initiatives announcedopportunities it presents, both in April 2017 to further accelerate shareholders’ value.terms of growth and cost efficiency, is increasing.

If the circumstances in these risks occur or are not successfully mitigated, our cash flow, operating results, financial position, business and reputation could be materially adversely affected. In addition, risks and uncertainties could cause actual results to vary from those described, which may include forward-looking statements, or could impact on our ability to meet our targets or be detrimental to our profitability or reputation.


Annual Report on Form 20-F 2017Strategic Report27


RISKSCONTINUED


DESCRIPTION OF RISK


BRAND PREFERENCE


As a branded goods business, Unilever’s success depends on the value and relevance of our brands and products to consumers around the world and on our ability to innovate and remain competitive.


Consumer tastes, preferences and behaviours are changing more rapidly than ever before, and Unilever’s ability to identify and respond to these changes is vital to our business successsuccess.


Technological change is disrupting our traditional brand communication models. Our ability to develop and deploy the right communication, both in terms of messaging content and medium is critical to the continued strength of our brands.


We are dependent on creating innovative products that continue to meet the needs of our consumers and getting these new products to market with speed. If we are unable to innovate effectively, Unilever’s sales or margins could be materially adversely affected.


PORTFOLIO MANAGEMENT


Unilever’s strategic investment choices will affect the long-term growth and profits of our business.


Unilever’s growth and profitability are determined by our portfolio of categories, geographies and channels and how these evolve over time. If Unilever does not make optimal strategic investment decisions, then opportunities for growth and improved margin could be missed.


SUSTAINABILITY


The success of our business depends on finding sustainable solutions to support long-term growth.


Unilever’s Visionvision to grow our business, while decoupling our environmental footprint from our growth and increasing our positive social impact, will require more sustainable ways of doing business. In a world where resources are scarce and demand for them continues to increase, it is critical that we succeed in reducing our resource consumption and converting to sustainably sourced supplies. In doing this we are dependent on the efforts of partners and various certification bodies. We are also committed to improving health and wellbeingwell-being and enhancing livelihoods around the world so Unilever and our communities grow successfully together. There can be no assurance that sustainable business solutions will be developed and failure to do so could limit Unilever’s growth and profit potential and damage our corporate reputation.


Annual Report on Form 20-F 2018Strategic Report29


RISKSCONTINUED

DESCRIPTION OF RISK


CLIMATE CHANGE


Climate changes and governmental actions to reduce such changes may disrupt our operations and/or reduce consumer demand for our products.


Climate changes are occurring around the globe which may impact our business in various ways. They could lead to water shortages which would reduce demand for those of our products that require a significant amount of water during consumer use. They could also lead to an increase in raw material and packaging prices or reduced availability. Governments may take action to reduce climate change such as the introduction of a carbon tax or zero net deforestation requirements which could impact our business through higher costs or reduced flexibility of operations.


Increased frequency of extreme weather (storms and floods) could cause increased incidence of disruption to our manufacturing and distribution network. Climate change could result therefore in making products less affordable or less available for our consumers resulting in reduced growth and profitability.


28PLASTIC PACKAGING
 Strategic ReportAnnual Report on Form 20-F 2017


DESCRIPTION OF RISKA reduction in the amount of plastic and an increase in the use of recyclable content in our packaging is critical to our future success.

Both consumer and customer responses to the environmental impact of plastic waste and emerging regulation by governments to tax or ban the use of certain plastics requires us to find solutions to reduce the amount of plastic we use; increase recycling post-consumer use; and to source recycled plastic for use in our packaging. We are also dependent on the work of our industry partners to create and improve recycling infrastructures throughout the globe.

Not only is there a risk around finding appropriate replacement materials, due to high demand the cost of recycled plastic or other alternative packaging materials could significantly increase in the foreseeable future and this could impact our business performance. We could also be exposed to higher costs as a result of taxes or fines if we are unable to comply with plastic regulations which would again impact our profitability and reputation.


CUSTOMER RELATIONSHIPS

Successful customer relationships are vital to our business and continued growth.


Maintaining strong relationships with our existing customers and building relationships with new customers who have built new technology enabledtechnology-enabled business models to serve changing shopper habits are necessary to ensure our brands are well presented to our consumers and available for purchase at all times.


The strength of our customer relationships also affects our ability to obtain pricing and competitive trade terms. Failure to maintain strong relationships with customers could negatively impact our terms of business with affected customers and reduce the availability of our products to consumers.


30Strategic ReportAnnual Report on Form 20-F 2018


DESCRIPTION OF RISK


TALENT

A skilled workforce and agile ways of working are essential for the continued success of our business.


Our ability to attract, develop and retain the right number of appropriately qualified people is critical if we are to compete and grow effectively.


This is especially true in our key emerging markets where there can be a high level of competition for a limited talent pool. The loss of management or other key personnel or the inability to identify, attract and retain qualified personnel could make it difficult to manage the business and could adversely affect operations and financial results.


SUPPLY CHAIN

Our business depends on purchasing materials, efficient manufacturing and the timely distribution of products to our customers.


Our supply chain network is exposed to potentially adverse events such as physical disruptions, environmental and industrial accidents, trade restrictions or disruptions at a key supplier, which could impact our ability to deliver orders to our customers.


The cost of our products can be significantly affected by the cost of the underlying commodities and materials from which they are made. Fluctuations in these costs cannot always be passed on to the consumer through pricing.


Changes in trade relationships between Europe and the UK as a result of Brexit could give rise to both a supply and cost issue.


SAFE AND HIGH QUALITY PRODUCTS

The quality and safety of our products are of paramount importance for our brands and our reputation.


The risk that raw materials are accidentally or maliciously contaminated throughout the supply chain or that other product defects occur due to human error, equipment failure or other factors cannot be excluded.


Annual Report on Form 20-F 2017Strategic Report29


RISKSCONTINUED

DESCRIPTION OF RISK

SYSTEMS AND INFORMATION
 

SYSTEMS AND INFORMATION

Unilever’s operations are increasingly dependent on IT systems and the management of information.

Increasing digital interactions with customers, suppliers and consumers place ever greater emphasis on the need for secure and reliable IT systems and infrastructure and careful management of the information that is in our possession.


The cyber-attack threat of unauthorised access and misuse of sensitive information or disruption to operations continues to increase. Such an attack could inhibit our business operations in a number of ways, including disruption to sales, production and cash flows, ultimately impacting our results.


In addition, increasing digital interactions with customers, suppliers and consumers place ever greater emphasis on the need for secure and reliable IT systems and infrastructure and careful management of the information that is in our possession to ensure data privacy.

Annual Report on Form 20-F 2018Strategic Report31


RISKSCONTINUED

DESCRIPTION OF RISK


BUSINESS TRANSFORMATION

Successful execution of business transformation projects is key to delivering their intended business benefits and avoiding disruption to other business activities.


Unilever is continually engaged in major change projects, including acquisitions, disposals and organisational transformation, to drive continuous improvement in our business and to strengthen our portfolio and capabilities. A number of key projects were announced in 2017 to accelerate sustainable shareholder value creation. Failure to execute such initiatives successfully could result in under-delivery of the expected benefits and there could be a significant impact on the value of the business.


Continued digitalisation of our business models and processes together with enhancing data management capabilities is a critical part of our transformation. Failure to keep pace with such technological change would significantly impact our growth and profitability.


ECONOMIC AND POLITICAL INSTABILITY

Unilever operates around the globe and is exposed to economic and political instability that may reduce consumer demand for our products, disrupt sales operations and/or impact the profitability of our operations.


Adverse economic conditions may affect one or more countries within a region, or may extend globally.


Government actions such as foreign exchange or price controls can impact on the growth and profitability of our local operations.


Unilever has more than half its turnover in emerging markets which can offer greater growth opportunities but also expose Unilever to related economic and political volatility.


30Strategic ReportAnnual Report on Form 20-F 2017


DESCRIPTION OF RISK


TREASURY AND PENSIONS

Unilever is exposed to a variety of external financial risks in relation to Treasury and Pensions.


The relative values of currencies can fluctuate widely and could have a significant impact on business results. Further, because Unilever consolidates its financial statements in euros it is subject to exchange risks associated with the translation of the underlying net assets and earnings of its foreign subsidiaries.


We are also subject to the imposition of exchange controls by individual countries which could limit our ability to import materials paid in foreign currency or to remit dividends to the parent company.


Unilever may face liquidity risk, ie difficulty in meeting its obligations, associated with its financial liabilities. A material and sustained shortfall in our cash flow could undermine Unilever’s credit rating, impair investor confidence and also restrict Unilever’s ability to raise funds.


We are exposed to market interest rate fluctuations on our floating rate debt. Increases in benchmark interest rates could increase the interest cost of our floating rate debt and increase the cost of future borrowings.


In times of financial market volatility, we are also potentially exposed to counter-party risks with banks, suppliers and customers.


Certain businesses have defined benefit pension plans, most now closed to new employees, which are exposed to movements in interest rates, fluctuating values of underlying investments and increased life expectancy. Changes in any or all of these inputs could potentially increase the cost to Unilever of funding the schemes and therefore have an adverse impact on profitability and cash flow.


32Strategic ReportAnnual Report on Form 20-F 2018


DESCRIPTION OF RISK


ETHICAL

Acting in an ethical manner, consistent with the expectations of customers, consumers and other stakeholders, is essential for the protection of the reputation of Unilever and its brands.


Unilever’s brands and reputation are valuable assets and the way in which we operate, contribute to society and engage with the world around us is always under scrutiny both internally and externally. Despite the commitment of Unilever to ethical business and the steps we take to adhere to this commitment, there remains a risk that activities or events cause us to fall short of our desired standard, resulting in damage to Unilever’s corporate reputation and business results.


LEGAL AND REGULATORY

Compliance with laws and regulations is an essential part of Unilever’s business operations.


Unilever is subject to national and regional laws and regulations in such diverse areas as product safety, product claims, trademarks, copyright, patents, competition, employee health and safety, data privacy, the environment, corporate governance, listing and disclosure, employment and taxes.


Failure to comply with laws and regulations could expose Unilever to civil and/or criminal actions leading to damages, fines and criminal sanctions against us and/or our employees with possible consequences for our corporate reputation.


Changes to laws and regulations could have a material impact on the cost of doing business. Tax, in particular, is a complex area where laws and their interpretation are changing regularly, leading to the risk of unexpected tax exposures. International tax reform remains a key focus of attention with the OECD’s Base Erosion & Profit Shifting project and further potential tax reform in the EU and Switzerland.


Annual Report on Form 20-F 2017Strategic Report31


IN FOCUS: CLIMATE CHANGE RISKS AND OPPORTUNITIES

UNILEVER HAS PUBLICLY COMMITTED TO IMPLEMENTING THE RECOMMENDATIONS OF THE TASK FORCE ON CLIMATE-RELATED FINANCIAL DISCLOSURES.

As a growing number of investors demand more information on how companies are addressing the effects of climate change, Unilever recognises the importance of disclosing climate-related risks and opportunities. Adopting the Taskforce on Climate-Related Financial Disclosures (TCFD) recommendations is an important step forward in enabling market forces to drive efficient allocation of capital and support a smooth transition to alow-carbon economy.

In this Annual Report and Accounts, we continue to integrate climate-related disclosures throughout the Strategic Report narrative. However, in recognition of the growing significance of the impacts of climate change on our business, we have also summarised the risks and opportunities arising from climate change, and our response below.

The Boards take overall accountability for the management of climate change risks and opportunities with support from the ULE and the USLP Steering Team (see page 43)46). Chaired by Keith Weed in 2018, the USLP Steering Team includes nine members of the ULE and meets five times a year. During 2017,2018, there were numerous agenda items on topics related to climate change. change including our overall climate strategy and our renewable electricity target.

For 2,872 senior management employees (including the ULE), incentives include fixed pay, a bonus as a percentage of fixed pay and a long-term managementco-investment plan (MCIP) linked to financial and USLP performance – includingperformance. The USLP component accounts for 25% of total MCIP award. The sustainability component of MCIP includes consideration of our progress against climate change, water and sustainable sourcingpalm oil targets, (see page 58). The long-term MCIP will be rolled outwhich among others, underpin our climate strategy. See pages 52 to the remainder of management employees in 2018.54 for more on MCIP.

UNDERSTANDING IMPACT

Climate change has been identified as a principal risk to Unilever which has the potential to impact our business in the short, medium and long-term. Further details on the nature of climate risks and opportunities for Unilever can be found in our 2018 CDP Climate submission (see page 28)further climate change disclosures on pages 7 and 14).

To further understand the impact that climate change could have on Unilever’s business we performed a high-level assessment of the impact of 2°C and 4°C global warming scenarios. The 2°C and 4°C scenarios are constructed on the basis that average global temperatures will have increased by 2°C and 4°C in the year 2100.

Between today and 2100 there will be gradual changes towards these endpoints and we have looked at the impact on our business in 2030 assuming we have the same business activities as we do today. We also made the following simplifying assumptions:

In the 2°C scenario, we assumed that in the period to 2030 society acts rapidly to limit greenhouse gas emissions and puts in place measures to restrain deforestation and discourage emissions (for example implementing carbon pricing at$75-$100 per tonne, taken from the International Energy Agency’s 450 scenario). We have assumed that there will be no significant impact to our business from the physical ramifications of climate change by 2030 – ie from greater scarcity of water or increased impact of severe weather events. The scenario assesses the impact on our business from regulatory changes.
In the 4°C scenario, we assumed climate policy is less ambitious and emissions remain high so the physical manifestations of climate change are increasingly apparent by 2030. Given this we have not included impacts from regulatory restrictions but focus on those resulting from the physical impacts.

Annual Report on Form 20-F 2018Strategic Report33


We identified the material impacts on Unilever’s business arising from each of these scenarios based on existing internal and external data. The impacts were assessed without considering any actions that Unilever might take to mitigate or adapt to the adverse impacts or to introduce new products which might offer new sources of revenue as consumers adjust to the new circumstances.

The main impacts of the 2°C scenario were as follows:

Carbon pricing is introduced in key countries and hence there are increases in both manufacturing costs and the costs of raw materials such as dairy ingredients and the metals used in packagingpackaging.
Zero net deforestation requirements are introduced and a shift to sustainable agriculture puts pressure on agricultural production, raising the price of certain raw materialsmaterials.

The main impacts of the 4°C scenario were as follows:

Chronic and acute water stress reduces agricultural productivity in some regions, raising prices of raw materialsmaterials.
Increased frequency of extreme weather (storms and floods) causes increased incidence of disruption to our manufacturing and distribution networksnetworks.
Temperature increase and extreme weather events reduce economic activity, GDP growth and hence sales levels fallfall.

Our analysis shows that, without action, both scenarios present financial risks to Unilever by 2030, predominantly due to increased costs. However, while there are financial risks which would need to be managed, we would not have to materially change our business model. The most significant impacts of both scenarios are on our supply chain where costs of raw materials and packaging rise, due to carbon pricing and rapid shift to sustainable agriculture in a 2°C scenario and due to chronic water stress and extreme weather in a 4°C scenario. The impacts on sales and our own manufacturing operations are relatively small.

The results of this analysis confirm the importance of doing further work to ensure that we understand the critical dependencies of climate change on our business and to ensure we have action plans in place to help mitigate these risks and thus prepare the business for the future environment in which we will operate. We plan

During 2018 we developed and piloted an approach to conduct further analysis onassess the impact of climate change on our agricultural supply chainkey commodities. We selected soy for this pilot based on its importance to Unilever (large purchased volume), it being ahigh-profile crop in the countries where it is grown and the availability of good historical price data and suitable climate models.

We developed a methodology which combined forecasting future yields and quantifying the impact on commodity prices of soybean oil. Climate change was the only price factor accounted for in the model used to calculate the impact. Other factors which impact price, such as technology and acreage, were excluded. The model considered the direct risks from climate change to the price of soybean oil, such as change in yield and change in supply. Three modelling steps were performed:

Yield estimation: We analysed multiple agriculture and climate models to provide a forecast range of expected yields in key growing regions.
Price relationship: An econometric model was developed, based on an analysis of the soybean oil market and historical trends, to estimate the impact of changing weather patterns (including both persistent effectsclimate-induced yield changes on future prices. This model considered the importance ofco-products eg soybean meal, substitution potential eg with sunflower oil and industrial uses of soybean oil, as well as the impact of yield on price.
Impact estimation: Future yields and price impacts were then translated into an estimated financial exposure from climate change for our business, using our forecast procurement volumes.

Our pilot analysis showed that soybean yields may increase over the 2030 and 2050-time horizon and that subsequent lower prices may then lead to small potential reductions in our procurement spend on soy. While the results may indicate a low financial risk to our business, we would need to consider a wider range of risk factors when determining our strategic response. Indirect risks from climate change, such as droughtscatastrophic events or external policy response and adaptation could also have an impact but were not included in our modelling. Furthermore, these pilot results are

specific to soy and can’t be applied to other crops. We have therefore decided to get broader understanding on the temporary effects of storms) on critical marketsclimate change risks to our agricultural sourcing and manufacturing.extend our analysis to two other important crops to Unilever: Palm Oil and Tea, for which suitable climate change models for yield predictions will be available in 2019.

RESPONDING TO RISKS AND OPPORTUNITIES

Unilever’s vision is to grow our business whilst decoupling our growth from our environmental footprint and increasing positive social impact. This vision explicitly recognises that sustainable growth – including management of climate-related risks and opportunities – is the only way to create long-term value for all our stakeholders.

The Unilever Sustainable Living Plan (USLP) was developed to deliver our vision. It is fully integrated with our business strategy. Climate-related issues are integral to the USLP. Two of our GHG reduction targets included in the USLP are recognised as science-based:

Halve the greenhouse gas impact of our products across the lifecycle by 2030 (this target covers all the phases across the lifecycle of our products: ingredients/raw materials, manufacturing, distribution, retail, packaging, consumer use and disposal)
Reduce scope 1 and 2 greenhouse gas emissions by 100% from our own operations by 2030 (this is part of our ambition to be become carbon positive in our manufacturing by 2030)

We are taking action to address our climate change risks in line with the output from the scenario analysis, as well as benefiting from any opportunities these changes could present across our value chain. In 2018, we will launch the Sustainable Agriculture Code (SAC) 2017 which gives Unilever,chain to reduce our farmersemissions, creating growth opportunities and suppliers a setminimising risk. Our commitment to source 100% of rigorous standardsour palm oil from sustainable sources is helping to drive sustainability improvements across our supply chain. The revised SAC incorporates standards on Climate Smart Agriculture. Further risk assessment on individual cropsavoid emissions from deforestation (see pages 14 and countries of origin will allow47). Our efforts to reduce energy and GHG emissions in manufacturing are helping us to focus efforts on implementation of Climate Smart Agriculture. We are also committed to eliminating the deforestation associated with commodity supply chains, with a particular focus on sustainable palm oil production (see pages 13 and 15).

Our 2030 carbon positive target commits us to eliminating fossil fuels from our manufacturing operationssave costs. For example, by using onlyless energy, from renewable sources and supporting the generation of more renewablewe have already avoided energy than we consume, making the surplus available to the communitiescosts in which we operate (see page 15). Since 2008, our factories have avoided costs of over490600 million through cumulative energy savings – and in doing so minimisingsince our exposurebaseline year of 2008.

Our divisions are taking action to future regulatory costs.

Climate change has the potential to impact our brands in different ways dependingreduce emissions. In Home Care we are focusing on the raw materials used in the production of our products and their end use. We are developing product innovations with less greenhouse gases across the value chain and less water in use (see pages 11, 13 and 14). Our categories’ response to climate change has been guided by a review of the areas where we can have the biggest impact on mitigating climate risk or benefiting from climate opportunity.

32Strategic ReportAnnual Report on Form 20-F 2017


Our Personal Care category has identified several areas of focus to mitigate risks and benefit from opportunities. These include the development of compressed deodorants which use 50% less propellant gas and 25% less aluminium in their packaging than standard aerosol deodorants. The category is also investing in water smart product innovationsconcentrated liquid laundry detergents such as dry shampooPersil, Omo and cleansing conditionerSurf Small & Mighty which help consumers use less hot water while also offering relevant benefits such as reduced colour loss and damage which can arise from frequent washing.

Home Care has focused its efforts in several areas. To mitigate risk, it hasto wash clothes at lower temperatures, reducing GHG by up to 50% per load. We have removed phosphates from all laundry powders worldwide, resulting in lower greenhouse gas emissions of up to 50% per consumer use. ItOur Foods & Refreshment division has prioritised reducing greenhouse gas emissions from ice cream freezers since 2008. As the world’s largest producer of ice cream, we have committed to accelerating theroll-out of freezer cabinets that use more climate-friendly natural (hydrocarbon) refrigerants. By 2018 our total purchase of these cabinets had increased to around 2.9 million.

Detailed Lifecycle Analysis has shown that our GHG contribution from animal-based agriculture, including fats and proteins, is relatively low: 7.5% for Foods & Refreshment and 2.5% for total Unilever. While emissions are comparatively low, the business opportunity is significant for natural and plant-based foods and beverages. We have a range of vegan and vegetarian variants such as Hellmann’s vegan mayonnaise, Ben & Jerry’snon-dairy ice creams, Magnum vegan and other options (see pages 11 to 12). We continue to actively promote vegetarian and vegan recipes, notably via our Knorr brand websites.

A number of our targets directly address risks and opportunities related to water scarcity caused by climate change. We estimate that the sale of products which address water scarcity issues could increase in our Home Care and Beauty & Personal Care divisions where a number of products are available which address water scarcity and/ or have a lower GHG in use. For example, our Beauty & Personal Care division is investing in water smart product innovations such as dry shampoo and cleansing conditioner which help consumers use less water while also offering relevant benefits such as reduced colour loss and damage which can arise from frequent washing. Home Care is combining insights in consumer behaviour and water consumption with innovative technology to develop new market opportunities, launching products and formulations that address water scarcity and help our consumers save water. Day2, the world’s first dry wash spray is made with only 0.02% of the water in a normal laundry load. Sunlight2-in-1 Handwashing Laundry Powder and Rin (Radiant) detergent bar and Comfort One Rinse fabric conditioner are examples of successful innovations which are reducingalso helping to reduce water consumption at point of use (see page 14).in water-stressed countries.

34Strategic ReportAnnual Report on Form 20-F 2018


Home Care is also home to three brands, Pureit, Truliva/Qinyuan and Blueair, which are responding directly to issues related to climate change. Pureit and Qinyuan,Truliva, our water purification businesses, are providingoffer products which provide safe drinking water to millions of people with a lower carbon footprint than alternatives. Our detailed life cyclelifecycle analysis shows that Pureit’s total carbon footprint is at least 80% lower than boiled or bottled water. Blueair, our indoor air purification business acquired in 2016, removes contaminants from the air, including hazardous sooty particles associated with the combustion of fossil fuels.

Our Foods categorySeveral other targets in our USLP indirectly address climate risk and opportunities by aiming to support groups who are vulnerable to the effects of climate change and who are critical to our future growth, notably smallholder farmers and women in low income countries.

Unilever continues to develop its response to the growing trend, and business opportunity, for natural and plant-based food, thereby reducing emissions from livestock. We have a range of vegan and vegetarian products and actively endorse plant-based lifestyles via positive, proactive consumer communication campaigns. By the end of 2017, around 500 Unilever food products in Europe were endorsed by the European Vegetarian Union and our global brands Hellmann’s, Flora (Becel) and Ben & Jerry’s now offer vegan and vegetarian variants. The category is also encouraging more consumers and chefs to cook plant-based meals via our Knorr and Unilever Food Solutions recipe hubs.

In Refreshment, we have prioritised reducing greenhouse gas emissions from ice cream freezers since 2008 (see page 12). As the world’s largest producer of ice cream, we have committed to accelerating the roll-out of freezer cabinets that use more climate-friendly natural (hydrocarbon) refrigerants. By 2017 our total purchase of these cabinets had increased to around 2.6 million. We are working on further innovations to make more improvements in freezer energy efficiency, including investigating the use of renewable energy, such as solar, to power our cabinets.

Unilever supportssupport a number of policy measures to accelerate the transition to alow-carbon economy, including the pricing of carbon and removal of fossil fuel subsidies which act as negative carbon prices. We believe that carbon pricing is a fundamental part of the global response to climate change and without it, the world is unlikely to meet its greenhouse gas reduction targets. We have publicly supported calls for carbon pricing and are members of The Carbon Pricing Leadership Coalition, hosted by the World Bank. In 2016, we implemented an internal price on carbon of30 per tonne for significant capital expenditure projects as part of the business case appraisal for large capital expenditure projects. The carbon price is also applied to emissions from our manufacturing sites to raise a ‘clean-tech’clean-tech fund. So far,6373 million has been raised byallocated to this fund for energy and water saving projects. In January 2018 we increased the price of carbon towas40 per tonne.

MEASURING AND REPORTING

The USLP includes a number of stretching commitments which relate to climate risks and opportunities across our value chain. It includes a target to halve the greenhouse gas impact of our products across the lifecycle by 2030 and a commitment to become carbon positive in our operations by 2030. Our water targets include halving the water associated with the consumer use of our products by 2020 and reducing water abstracted at manufacturing sites. Performance against these targets can be found on page 7.

We have been measuring and reporting on our energy and water consumption and carbon emissions since 1995. The USLP includes a number of stretching targets which relate to climate risks and opportunities across our value chain. Performance against key targets can be found on page 7 with commentary on page 13 and 14. Our website contains extensive reporting on our performance as well as more detailed commentary on our USLP targets as well as actions we are taking to achieve them.

For 2017, PwC assuredOur ability to meet our measurementclimate-related targets partly depends on changes in the energy markets worldwide, such as the rate of installation of renewable electricity in many countries. We have a role to play as an industry leader to help shape those markets. We are working collaboratively with partners, suppliers and others to achieve our ambition.

We’ve created a detailed plan to annually assess the feasibility for Unilever to reach our target to halve the greenhouse gasesgas impact of our products across the value chain and water usedlifecycle by our consumers,2030, taking both external transitions towards alow-carbon economy as well as the latest available data and assumptions about our GHG footprint into account. The basis of this plan is the set of around 2,800 products representative of our global portfolio across all divisions for which we have full value-chain lifecycle analysis results.

We recalculated the footprint of these products using the latest 2030 projections on external transitions to alow-carbon economy (eg International Energy Agency 2030 projection on grid changes to renewable energy),low-carbon transition plans in our operations (eg achieving zero net deforestation by 2020, using 100% renewable energy by 2020) and Innovation Roadmaps (eg redesign for lower embedded carbon emissions, transforming the temperature-controlled supply chain).

In line with the Large and Medium sized Companies and Groups (Accounts and Reports) Regulations 2008 as amended by the Companies Act 2006 (Strategic Report and Directors’ Report) Regulations 2013 our greenhouse gas (GHG) emissions are set out below. For Scope 1 and 2 we report our CO2 emissions only but not other GHG emissions as these are considered to be not material. For Scope 3 we report our GHG emissions (eg CO2, CH4, N2O) in terms of CO2 equivalents.

We report our emissions with reference to the latest Greenhouse Gas Protocol Corporate Accounting and Reporting Standard (GHG Protocol) to calculate emissions of carbon dioxide from the combustion of fuels and the operation of facilities (Scope 1) and from purchased electricity, heat, steam and cooling (Scope 2, market-based method). Each year PwC assure selected manufacturing environmental metrics including water abstraction per tonne of production, carbon emissions from energy use and energy use per tonne of production.

The GHG data below relates to emissions during the12-month period from 1 October to 30 September. This period is different from the Strategic Report, Directors’ Report and Financial Statements which are calendar year.

UNILEVER GREENHOUSE GAS EMISSIONS BY ACTIVITY^

    2018   2017 
Manufacturing (scope 1 and 2)    

Scope 1 (tonnes CO2)

   711,875    773,856 

Scope 2* (tonnes CO2)

   726,167    793,472 

Total Scope 1 & 2* (tonnes CO2)

   1,438,042    1,567,328 

Intensity ratio (kg CO2 per tonne of production)

   70.46    76.77 
Distribution centres, research laboratories, marketing and sales offices (scope 1 and 2)


Scope 1 (tonnes CO2)

   20,052    20,039 

Scope 2* (tonnes CO2)

   100,924    102,292 

Total Scope 1 & 2* (tonnes CO2)

   120,976    122,331 
Upstream and downstream of Unilever operations
– top 3 emissions sources (scope 3)


Consumer use


(downstream) (tonnes CO2e)q

   39,895,946    38,697,432 

Ingredients and packaging


    (upstream) (tonnes CO2e)

   14,985,897    15,000,941 

Distribution and retail


    (downstream) (tonnes CO2e)LOGO

   4,368,626    3,895,589 

^

Carbon emission factors are used to convert energy used in our operations to emissions of CO2. Carbon emission factors for fuels are provided by the Intergovernmental Panel on Climate Change (IPCC).

+

For manufacturing we have selected an intensity ratio based on production. This aligns with our long-standing reporting of manufacturing performance. Emissions from the combustion of biogenic fuels (biomass, fuel crops etc) within our operations are reported separately to other Scope 1 and 2 emissions, as recommended by the GHG Protocol, and excluded from our intensity ratio calculation. The data also excludes Scope 3 emissions (including consumer use of our products) which we report as part of our Unilever Sustainable Living Plan.

*

Carbon emission factors for grid electricity calculated according to the ‘market-based method’ are supplier-specific emissions factors reflecting contractual arrangements with electricity suppliers. Where supplier-specific emissions factors are not available, carbon emissions factors reflect the country where each operation is located and are provided by the International Energy Agency (IEA).

q

We measure the full GHG footprint of our product portfolio and annual sales using an LCA method compliant with the ISO 14040 standard. We measure the consumer use phase using a combination of primary habits data and on pack recommendations of use combined with lifecycle inventory data. We measure a representative sample of products across 14 countries which account for around60-70% of our annual sales volume.

We use a combination of external lifecycle inventory databases (secondary data) and supplier specific data (primary data eg for surfactants, perfumes and some of food ingredients) to measure the GHG emissions of purchased ingredients and packaging materials used in the production of our products.

LOGO

Downstream distribution is calculated using average distances and modes of transport derived from data collected from our distribution network and logistic providers.

FURTHER CLIMATE CHANGE DISCLOSURES

This Annual Report and Accounts contains additional disclosures on our climate change risks and opportunities:

Governance and remuneration: pages 4346 to 47 and 4752 to 7654
Strategy for climate change: pagespage 14 and 15
Risk management: page 2830
Metrics and targets: pages 7 and 13 andto 14

Unilever’sOur website also contains disclosures on our greenhouse gasesgas and water USLP targets.


LOGO

LOGO
  www.unilever.com/sustainable-living/our-sustainable-living-report-hub

Our CDP Climate submission contains extensive disclosure on our climate risks, opportunities, impacts and mitigating actions (password required).

LOGOwww.cdp.net


Annual Report on Form 20-F 20172018 Strategic Report 3335


GOVERNANCE REPORT

CORPORATE GOVERNANCE


UNILEVER’S STRUCTURE

Since its formation in 1930, the Unilever Group has operated as nearly as practicable as a single economic entity. This is achieved by special provisions in the Articles of Association of NV and PLC, together with a series of agreements between NV and PLC which are together known as the Foundation Agreements (described below). These agreements enable Unilever to achieve unity of management, operations, shareholders’ rights, purpose and mission and can be found on our website.

The Equalisation Agreement makes the economic position of the shareholders of NV and PLC, as far as possible, the same as if they held shares in a single company and also regulates the mutual rights of the shareholders of NV* and PLC. Under this agreement, NV and PLC must adopt the same financial periods and accounting policies.

The Deed of Mutual Covenants provides that NV and PLC and their respective subsidiary companies shallco-operate in every way for the purpose of maintaining a common operating policy. They shall exchange all relevant information about their respective businesses – the intention being to create and maintain a common operating platform for the Unilever Group throughout the world. This Deed also contains provisions for the allocation of assets within the Unilever Group.

Under the Agreement for Mutual Guarantees of Borrowing between NV and PLC, each company will, if asked by the other, guarantee the borrowings of the other and the other’s subsidiaries. These arrangements are used, as a matter of financial policy, for certain significant borrowings. They enable lenders to rely on our combined financial strength.

Each NV ordinary share represents the same underlying economic interest in the Unilever Group as each PLC ordinary share. However, NV and PLC remain separate legal entities with different shareholder constituencies and separate stock exchange listings. Shareholders cannot convert or exchange the shares of one for the shares of the other. More information on the exercise of voting rights can be found in NV’s and PLC’s Articles of Association and in the Notices of Meetings for our NV and PLC AGMs, all of which can be found on our website.


*

Throughout this report, when referring to NV shares or shareholders, the term ‘shares’ or ‘shareholder’ also encompasses a depositary receipt or a holder of depositary receipts.


LOGO  LOGO

www.unilever.com/investor-relations/agm-and-corporate-governance/agm-and-corporate-

governance/legal-structure-and-foundation-agreements/

BOARDS

The Boards of NV and PLC have ultimate responsibility for the management, general affairs, direction, performance and long-term success of our business as a whole. The Boards areone-tier boards, the same people are on both Boards and the responsibility of the Directors is collective, taking into account their respective roles as Executive Directors andNon-Executive Directors. The majority of the Directors areNon-Executive Directors who essentially have a supervisory role. In the normal course Unilever has two Executive Directors, the Chief Executive Officer (CEO) and the Chief Financial Officer (CFO). On 31 December 2018 the current CEO resigned and his successor, Alan Jope, was appointed on 1 January 2019. Alan will be proposed to be appointed as an Executive Director at the 2019 AGMs. Consequently, between 1 January 2019 and the 2019 AGMs in May we have one Executive Director.

A list of our current Directors, their roles on the Boards, their dates of appointment, tenure and their other major appointments is set out on page 3.

The Boards have delegated the operational running of the Unilever Group to the CEO with the exception of the following matters which are reserved for the Boards: structural and constitutional matters, corporate governance, approval of dividends, approval and monitoring of overall strategy for the Unilever Group, approval of significant transactions or arrangements in relation to mergers, acquisitions, joint ventures and pensions. The CEO is responsible to the Boards in relation to the operational running of the Group and other powers delegated to him by the Boards. The CEO can delegate any of his powers and discretions, and he does so delegate to members of the Unilever Leadership Executive (ULE) (with power tosub-delegate). The ULE is composed of the CEO, CFO and other senior executives who assist the CEO in the discharge of the powers delegated to the CEO by the Boards. Members of the ULE report to the CEO, and the CEO supervises and determines the roles, activities and responsibilities of the ULE. WhilstWhile ULE members (other than the CEO and the CFO) are not part of the Boards’ decision-making process, to provide the Boards with deeper insights, ULE members often attend those parts of the Board meetings which relate to the operational running of the Group. The ULE currently consists of the CEO, CFO, the CategoryDivision Presidents, the Presidents for Europe and North America, and the Chief Category Research and Development Officer, Chief HR Officer, Chief Legal Officer and Group Secretary, Chief Marketing and Communications Officer and Chief Supply Chain Officer.

The biographies of ULE members are on page 5.

BOARD COMMITTEES

The Boards have established four Board Committees: the Audit Committee, the Compensation Committee, the Corporate Responsibility Committee and the Nominating and Corporate Governance Committee. The terms of reference of these Committees can be found on our website and the reports of each Committee, including attendance at meetings in 2017,2018, can be found on pages 4143 to 76.65.


LOGO  LOGO

www.unilever.com/investor-relations/agm-and-corporate-governance/agm-and-corporate-

governance/board-and-management-committees/

THE GOVERNANCE OF UNILEVER

Further details of the roles and responsibilities of the Chairman, Senior Independent Director/Vice-Chairman, CEO, CFO and other corporate officers and how our Boards effectively operate as one board, govern themselves and delegate their authorities are set out in the document entitled ‘The Governance of Unilever’, which can be found on our website.

The Governance of Unilever also describes the Foundation Agreements, Directors’ appointment, tenure, induction and training, Directors’ ability to seek independent advice at Unilever’s expense and details about Board and Management Committees (including the Disclosure Committee).


LOGO  LOGO

www.unilever.com/investor-relations/agm-and-corporate-governance/agm-and-corporate-

governance/our-corporate-governance/


3436 Governance Report  Annual Report on Form 20-F 20172018


BOARD EFFECTIVENESS

BOARD MEETINGS

A minimum of fiveface-to-face meetings are planned throughout the calendar year to consider important corporate events and actions, for example, the half-year and full-year results announcements of the Unilever Group; the development of and approval of the overall strategy of the Unilever Group; oversight of the performance of the business; review of risks and internal risk management and control systems; authorisation of major transactions; declaration of dividends; convening of shareholders’ meetings; succession planning; review of the functioning of the Boards and their Committees; culture; and review of corporate responsibility and sustainability, in particular the Unilever Sustainable Living Plan. Other ad hoc Board meetings are convened to discuss strategic, transactional and governance matters that arise. In 20172018 the Boards met physically in January, February, April,March, May, July, October and November. Meetings of the Boards may be held either in London or in Rotterdam or such other locations as the Boards think fit, with one or twooff-site Board meetings a year. The Chairman sets the Boards’ agenda, ensures the Directors receive accurate, timely and clear information, and promotes effective relationships and open communication between the Executive andNon-Executive Directors.

ATTENDANCE

The table showing the attendance of current Directors at Board meetings in 20172018 can be found on page 3. If Directors are unable to attend a Board meeting they have the opportunity beforehand to discuss any agenda items with the Chairman. Louise FrescoAnn Fudge attended fivefour of the Board meetings she was eligible to attend before retiring from the Boards on 27 April 2017.3 May 2018.

NON-EXECUTIVE DIRECTOR MEETINGS

TheNon-Executive Directors usually meet as a group, without the Executive Directors present, usually four or five timeswhen there is a year to consider relevant items as agreed by them.face-to-face Board meeting. In 20172018 they met sixfive times. The Chairman, or in his absence the Vice-Chairman/Senior Independent Director,Director/Vice-Chairman, chairs such meetings.

BOARD EVALUATION

Each year the Boards formally assess their own performance with the aim of helping to improve the effectiveness of both the Boards and the Committees. At least once every three years an independent third party facilitates the evaluation. In April 2017 JCA Group Limited (JCA), an independent third-party consultant, facilitated anThe last external Board evaluation. JCA has no other connection with the Unilever Group. No questionnaires were usedevaluation was performed in the evaluation this year given questionnaires were completed for the last Board evaluation in November 2016.2017. The evaluation consistedconsists of individual interviews with the Directors by JCA followedthe Chairman and, when relevant, by the external evaluator. These interviews are complemented by the completion by all Directors of three confidential online evaluation questionnaires on the efficiency and effectiveness of our Boards, CEO and Chairman. The Boards evaluation questionnaire this year focused on a number of key areas including Strategy, Risk/Financial Controls, Board discussions at both the AprilEffectiveness and July Board meetings on both the outcome of the evaluation and proposed actions to enhance the Board’s effectiveness.Information/Knowledge. The Chairman’s Statementstatement on page 2 describes the key actions agreed by the Boards following the evaluation.

The evaluation exercise.

of the performance of the Chairman and CEO is led by the Senior Independent Director/Vice-Chairman and Chairman respectively, and the bespoke questionnaires will be used to support these evaluations. Committees of the Boards evaluate themselves annually under supervision of their respective Chairs taking into account the views of respective Committee members and the Boards. The key actions agreed by each Committee in the 20172018 evaluations can be found in each Committee Report.

APPOINTMENT

In seeking to ensure that NV and PLC have the same Directors, the Articles of Association of NV and PLC contain provisions which are designed to ensure that both NV and PLC shareholders are presented with the same candidates for election as Directors. Anyone being elected as a Director of NV must also be elected as a Director of PLC and vice versa. Therefore, if an individual fails to be elected to both companies he or she will be unable to take his or her place on either Board.

The report of the Nominating and Corporate Governance Committee (NCGC) on pages 4548 and 4649 describes the work of the NCGC in Board appointments and recommendations forre-election. In addition, shareholders are able to nominate Directors. The procedure for shareholders to nominate Directors is contained within the document entitled ‘Appointment procedure for NV and PLC Directors’ which is available on our website. To do so they must put a resolution to both the NV and PLC AGMs in line with local requirements. Directors are appointed by shareholders by a simple majority vote at each AGM.


LOGOLOGO  

www.unilever.com/investor-relations/agm-and-corporate-governance/agm-and-corporate-

governance/board-and-management-committees/

DIRECTOR INDUCTION AND TRAINING

All new Directors participate in a comprehensive induction programme when they join the Boards. The Chairman ensures that ongoing training is provided for Directors by way of site visits, presentations and circulated updates at (and between) Board and Board Committee meetings on, among other things, Unilever’s business, environmental, social, corporate governance, regulatory developments and investor relations matters. For example, in 20172018 the Directors received presentations on Corporate Ventures, Marketing, Channel and Customer Development,Information Security, Digital, the Supply Chain and R&D.Simplification.

INDEPENDENCE AND CONFLICTS

As theNon-Executive Directors make up the Committees of the Boards, it is important that they can be considered to be independent. Each year the Boards conduct a thorough review of theNon-Executive Directors’, and their related or connected persons’, relevant relationships referencing the criteria set out in ‘The Governance of Unilever’ which is derived from the relevant best practice guidelines in the Netherlands, UK and US. The Boards currently consider all ourNon-Executive Directors to be independent of Unilever.

We attach special importance to avoiding conflicts of interest between NV and PLC and their respective Directors. The Boards ensure that there are effective procedures in place to avoid conflicts of interest by Board members. If an actual, apparentA Director must without delay report any conflict of interest or potential conflict arises, the materiality of that conflict will be determined by the Group Secretary. If the conflict exceeds any materiality thresholds set from time to time, the Boards will be asked to consider the conflict and, if determined to be appropriate, authorisation of the conflict will be given by the Boardsinterest to the relevant Director. The authorisation includes conditions relating to keeping Unilever information confidentialChairman and to the Director’s exclusion from receivingother Directors, or, in case any conflict of interest or potential conflict of interest of the Chairman, to the Senior Independent Director/Vice-Chairman and discussingto the other Directors. The Director in question must provide all relevant information at Board meetings. Conflicts are reviewed annually by the Boards. In between those reviews Directors have a duty to inform the Boards, so that the Boards can decide whether a reported (potential) conflict of anyinterest of a Director qualifies as a conflict of interest within the meaning of the relevant changes to their situation.laws. A Director may not vote on, or be counted in a quorum in relation to, any resolution of the Boards in respect of any situation in which he or she has a conflict of interest. The procedures that Unilever has put in place to deal with conflicts of interest operate effectively.

Unilever recognises the benefit to the individual and the Unilever Group of senior executives acting as directors of other companies but, to ensure outside directorships of our Executive Directors do not involve an excessive commitment or conflict of interest, the number of outside directorships of listed companies is generally limited to one per Executive Director and approval is required from the Chairman.

INDEMNIFICATION

The terms of NV Directors’ indemnification are provided for in NV’s Articles of Association. The power to indemnify PLC Directors is provided for in PLC’s Articles of Association and deeds of indemnity have been agreed with all PLC Directors. Third partyThird-party directors’ and officers’ liability insurance was in place for all Unilever Directors throughout 20172018 and is currently in force.

In addition, PLC provides indemnities (including, where applicable, a qualifying pension scheme indemnity provision) to the Directors of three subsidiaries each of which acts as trustee of a Unilever UK pension fund. Appropriate trustee liability insurance is also in place.


Annual Report on Form 20-F 20172018 Governance Report 3537


CORPORATE GOVERNANCECONTINUED


OUR SHARES

NV SHARES

SHARE CAPITAL

NV’s issued share capital on 31 December 20172018* was made up of:

274,356,432 split into 1,714,727,700 ordinary shares of0.16 each; and

1,028,568 split into 2,400 special ordinary shares numbered 1 – 2,400 known as special ordinary shares; and

62,065,550 split into two classes (6% and 7%) of cumulative preference shares*.

shares.


*

When referred to the issued share capital on 31 December 2018 also62,065,550 split into two classes (6% and 7%) of cumulative preference shares was outstanding. All 6% and 7% cumulative preference shares were held in treasury as a result of which these shares cannot be voted upon in the General Meeting of NV. The resolutions of the General Meeting of NV and the Board of NV to cancel these shares were filed on 29 November 2018 with the Dutch Trade Register and an announcement thereof in a daily and nationally distributed newspaper in the Netherlands was made on 5 December 2018. These shares are included within liabilities (note 15C).were cancelled on 6 February 2019.

LISTINGS

NV has listings of ordinary shares 6% and 7% cumulative preference shares(UNIA) and depositary receipts for such ordinary shares and 7% cumulative preference shares(UNA) listed on Euronext Amsterdam and, a listing ofas US New York Registry Shares* (UN) on the New York Stock Exchange.


*

One New York Registry Share represents one NV ordinary share with a nominal value of0.16.

VOTING RIGHTS

NV shareholders can cast one vote for each0.16 nominal capital they hold and can vote in person or by proxy. The voting rights attached to NV’s outstanding shares are split as follows:


Total number

of votes

 % of issued capital   

Total number

of votes


        % of issued

capital


1,714,727,700 ordinary shares

   1,714,727,700(a)   81.30    1,714,727,700(a)    99.63 

2,400 special shares

   6,428,550   0.30   


6,428,550


0.37


123,382 6% cumulative preference shares

   330,485,595(b)   15.67 

21,438 7% cumulative preference shares

   57,424,094(c)   2.72 

As at 31 December 2017:2018:

(a) 191,810,728

254,012,896 shares were held in treasury and 9,728,1819,336,215 shares were held to satisfy obligations under share-based incentive schemes.

(b)1 These shares and the special shares are not voted on. All 6% cumulative preference share was held in treasury.
(c)1and 7% cumulative preference share wasshares were held in treasury.treasury as a result of which these shares cannot be voted upon, as described within the Share Capital section above.

The special shares and the shares under (a), (b) and (c) are not voted on.

SHARE ISSUES AND BUY BACKSPURCHASE OF SHARES

NV may issue shares not yet issued and grant rights to subscribe for shares only pursuant to a resolution of the General Meeting or of another corporate body designated for such purpose by a resolution of the General Meeting. At the NV AGM held on 26 April 20173 May 2018 the Board of NV was designated as the corporate body authorised to resolve on the issue of, or on the granting of rights to subscribe for, shares not yet issued and to restrict or exclude the statutorypre-emption rights that accrue to shareholders upon issue of shares, on the understanding that this authority is limited to 10% of the issued share capital of NV, plus an additional 10% of the issued share capital of NV in connection with or on the occasion of mergers, acquisitions or strategic alliances.

These authorities expire on the earlier of the conclusion of the 2018 NV AGM or the close of business on 30 June 2018 (the last date by which NV must hold an AGM in 2018). Such authorities are renewed annually. However, it is intended to align the NV and PLC authorities as from the 2018 AGMs. At the 2018 NV AGM, NV will therefore seek shareholder authority to issue new ordinary shares up to 33% of NV’s issued ordinary share capital and to disapplypre-emption rights up to 5% of NV’s issued share capital for general corporate purposes and an additional 5% authority only in connection with an acquisition or specified capital investment.

In addition, at NV’s 2018 AGM the NV Board was designated as the corporate body authorised to purchase (i) ordinary shares with a maximum of 10% of the issued share capital as well as (ii) any and all 6% and 7% cumulative preference shares.

These authorities expire on the earlier of the conclusion of the 2019 NV AGM or the close of business on 30 June 2019 (the last date by which NV must hold an AGM in 2019). Such authorities (other than with respect to the 6% and 7% cumulative preference shares) are renewed annually.

During 20172018 companies within the Unilever Group purchased 2,260,0004,000,000 NV ordinary shares, representing 0.13%0.23% of the issued ordinary share capital, for111,205,702.6 and 493,000 NV New York Registry Shares, representing 0.03% of the issued ordinary share capital,

for $26,420,256.183,380,649. These purchases were made to facilitate grants made in connection with Unilever’s employee compensation programmes. Further information on these purchases can be found in note 4C to the consolidated accounts on page 93.

In addition, NV conducted a share buy-backbuyback programme during 20172018 with an aggregate market value of approximately2.53 billion bought back in the form of 50,250,09962,202,168 NV ordinary shares (or depositary receipts in respect of such ordinary shares).

By means ofFollowing a public offer and a subsequent squeeze out procedure, Unilever Corporate Holdings Nederland B.V. (UCHN), an indirect wholly owned subsidiary of PLC, acquired approximately 99% of all outstanding6% cumulative preference shares and 7% cumulative preference shares. Unilever N.V. purchased these 6% cumulative preference shares and 7% cumulative preference shares during 2017. This represents an important step in simplifying the capital structure.on 2 October 2018. The offer valued allresolutions of the issued 6%General Meeting of NV and 7% cumulative preferencethe Board of NV to cancel these shares that were not held in treasury by NV at 448 million.

Sincefiled on 29 November 2018, as described within the public offer was declared unconditional, a number of private agreements have been completed regarding the sale and transfer of the 6% and 7% cumulative preference shares to UCHN at a price equal to the public offer price. UCHN has also initiated statutory buy-out proceedings to acquire the remaining issued 6% and 7% cumulative preference shares. In addition, in an announcement on 28 November 2017, Unilever stated the Boards’ intention to terminate the 6% and 7% cumulative preference shares upon any unification.Share Capital section above.

Further information on these purchases can be found in note 4C to the consolidated accounts on pages 103 and 104.page 93.

NV SPECIAL ORDINARY SHARES

To ensure unity of management, the provisions within the NV Articles of Association containing the rules for appointing NV Directors cannot be changed without the permission of the holders of the special ordinary shares numbered 1 – 2,400 inclusive. These NV special ordinary shares may only be transferred to one or more other holders of such shares. The joint holders of these shares are N.V. Elma and United Holdings Limited, which are subsidiaries of NV and PLC respectively. The Boards of N.V. Elma and United Holdings Limited comprise three Directors of the Unilever Boards.

TRUST OFFICE

The Foundation Unilever N.V. Trust Office (Stichting Administratiekantoor Unilever N.V.) is a trust office with a board independent of Unilever. As part of its corporate objects, the Trust Office issues depositary receipts in exchange for the NV ordinary shares and NV 7% cumulative preference shares. These depositary receipts are listed on Euronext Amsterdam, as are the NV ordinary and 7% cumulative preference shares themselves.themselves

Holders of depositary receipts can under all circumstances exchange their depositary receipts for the underlying shares (and vice versa) and are entitled to dividends and all economic benefits on the underlying shares held by the Trust Office. There are no limitations on the holders’ voting rights, they can attend all General Meetings of NV, either personally or by proxy, and have the right to speak. The Trust Office only votes shares that are not represented at a General Meeting. The Trust Office votes in such a way as it deems to be in the long-term interests of the holders of the depositary receipts. This voting policy is laid down in the Conditions of Administration that apply to the depositary receipts.

The Trust Office’s shareholding fluctuates daily. Its holdings on

31 December 20172018 were 1,320,059,0351,268,051,254 NV ordinary shares (76.98%) and 116 NV 7% cumulative preference shares (0.54%(73.95%).

At the 20172018 NV AGM, the Trust Office represented 32.9%36.95% of all votes present at the meeting.

The current members of the board at the Trust Office are Mr J H Schraven (Chairman), Mr P M L Frentrop, Mr A Nühn and Ms C M S Smits-Nusteling. The Trust Office reports periodically on its activities. Further information on the Trust Office, including its Articles of Association, Conditions of Administration and Voting Policy, can be found on its website.

Unilever considers the arrangements of the Trust Office to be appropriate and in the interests of NV and its shareholders given the size of the voting rights attached to the financing preference shares and the relatively low attendance of holders of ordinary shares at the General Meetings of NV.


LOGOLOGO  www.administratiekantoor-unilever.nl/eng/home


3638 Governance Report  Annual Report on Form 20-F 20172018


PLC SHARES

SHARE CAPITAL

PLC’s issued share capital on 31 December 20172018 was made up of:

 £40,760,42036,934,840 split into 1,310,156,3611,187,191,284 ordinary shares of 319p each; and
£100,000 of deferred stock of £1 each.

LISTINGS

PLC has ordinary shares (ULVR) listed on the London Stock Exchange and, as American Depositary Receipts* (UL), on the New York Stock Exchange.


*

One American Depository Receipt represents one PLC ordinary share with a nominal value of 319p.

VOTING RIGHTS

PLC shareholders can cast one vote for each 319p nominal capital they hold and can vote in person or by proxy. This means that shareholders can cast one vote for each PLC ordinary share or PLC American Depositary Receipt of Shares. Therefore, the total number ofThe voting rights attached to PLC’s outstanding shares isare split as follows:


Total number

of votes

 % of issued capital   

Total number

of votes


        % of issued

capital


1,310,156,361 ordinary shares

  1,310,156,361(a)   99.76 

1,187,191,284 ordinary shares

   1,187,191,284    99.73 

£100,000 deferred stock

  3,214,285   0.24   


3,214,285


0.27


As at 31 December 2017:2018:

(a) Of which 78,389,278

18,660,634 shares were held by PLC in treasury and 6,074,2835,645,392 shares were held by NV group companies. These shares and the deferred stock are not voted on.

The PLC Board may, subject to the UK Companies Act 2006 and the passing of the appropriate resolutions at a General Meeting, issue shares within the limits prescribed within the resolutions. SHARE ISSUES AND PURCHASE OF SHARES

At the 20172018 PLC AGM held on 27 April 20172 May 2018 the PLC Directors were authorised to issue new shares, up to a maximum of £13,300,000£12,755,555 nominal value (which at the time represented approximately 33% of PLC’s issued ordinary share capital) and to disapplypre-emption rights up to approximately 5% of PLC’s issued ordinary share capital for general corporate purposes and an additional 5% authority only in connection with an acquisition or specified capital investment.

In addition, at PLC’s 20172018 AGM the PLC Board was authorised to make market purchases of its ordinary shares, up to a maximum of 128,345,000 shares representing just under 10% of PLC’s issued ordinary share capital and within the limits prescribed in the resolution until the earlier of the conclusion of PLC’s 20182019 AGM and 30 June 2018.2019. These authorities are renewed annually and authority will be sought at PLC’s 20182019 AGM.

During 20172018 companies within the Unilever Group purchased 1,667,0002,222,000 PLC ordinary shares, representing 0.13%0.19% of the issued share capital, for £68,225,066.£87,978,671. These purchases were made to facilitate grants made in connection with its employee compensation programmes. Further information on these purchases can be found in note 4C to the consolidated accounts on pages 103 and 104. page 93.

In addition, PLC conducted a share buy-backbuyback programme during 20172018 with an aggregate market value of approximately £2.2£3 billion bought back in the form of 51,692,28463,236,433 PLC ordinary shares.

On 31 July 2018, PLC cancelled 110,493,623 PLC ordinary shares of 319p each held in treasury, representing 8.43% of the issued share capital. On 19 September 2018, PLC cancelled a further 12,471,454 PLC ordinary shares of 319p each held in treasury, representing 1.04% of the issued share capital.

PLC DEFERRED STOCK

To support unity of management, the holders of PLC’s deferred stock have rights within PLC’s Articles of Association relating to any changes in the rules for appointing PLC Directors. The joint holders of the PLC deferred stock are N.V. Elma and United Holdings Limited, which are subsidiaries of NV and PLC respectively. The Boards of N.V. Elma and United Holdings Limited comprise three Directors of the Unilever Boards. The provisions within the PLC Articles of Association containing the rules for appointing PLC Directors cannot be changed without the permission of the holders of PLC’s deferred stock.


OUR SHAREHOLDERS

SIGNIFICANT SHAREHOLDERS OF NV

As far as Unilever is aware, the only holdersholder of more than 3% of, or 3% of voting rights attributable to, NV’s share capital on (‘Disclosable Interests’) on 31 December 20172018 (apart from the Foundation Unilever N.V. Trust Office, see page 36) are38) is BlackRock, Inc. (BlackRock) and UCHN, see page 36, as indicated in the table below.


Shareholder  Class of shares Total number of
shares held
 % of relevant
class
   Class of shares  Total number of
shares held
   % of relevant
class
 

BlackRock


ordinary shares


  66,947,018   3.90   ordinary shares       66,947,018    3.90 

UCHN


6% cumulative preference shares


  122,985   99.68 

UCHN


7% cumulative preference shares


  21,320   99.44 

As far as Unilever is aware, new Disclosable Interests have beenBlackRock notified to the AFM betweenthat its holding changed to 4.02% on

19 February 2019. Between 1 January 20182016 and 21 February 2018 (the latest practicable date for inclusion in this report). Between 1 January 2015 and 21 February 2018,2019, BlackRock, NN Group N.V. (NN) and, ASR Nederland N.V. (ASR) and UCHN, see page 38, have held more than 3% in the share capital of NV. During 2017 Unilever Corporate Holdings Nederland B.V. acquired from NN and ASR all of their 6% and 7% cumulative preference shares.

SIGNIFICANT SHAREHOLDERS OF PLC

As far as Unilever is aware, the only holders of more than 3% of, or 3% of voting rights attributable to, PLC’s ordinary share capital on 31 December 20172018 (apart from shares held in treasury by PLC, see page 37)39), are BlackRock and the Leverhulme Trust as indicated in the table below.


Shareholder  Class of shares 

Total number

of shares held

 % of relevant
class
   Class of shares  

Total number

of shares held

   % of relevant
class
 

BlackRock


ordinary shares    

  84,013,193   6.8   ordinary shares       77,176,319    6.60 

The Leverhulme Trust


ordinary shares

  68,531,182   5.6   ordinary shares   46,931,182    4.02 

No disclosable changes in interests in the share capital of PLCAs far as Unilever is aware, no new Disclosable Interests have been notified to PLC between 1 January 20182019 and 21 February 20182019 (the latest practicable date for inclusion in this report). Between 1 January 20152016 and 21 February 2018,2019, (i) BlackRock, and (ii) the aggregated holdings of the trustees of the Leverhulme Trust and the Leverhulme Trade Charities Trust, have held more than 3% of, or 3% of voting rights attributable to, PLC’s ordinary shares.

SHAREHOLDERSTAKEHOLDER ENGAGEMENT

Unilever valuesWe value open constructive and effective communication with our shareholders. Our shareholders can raise issues directlystakeholders. The primary responsibility for stakeholder engagement, which is generally related to the operations of the business, rests with our Executive Directors.Non-Executive Directors also actively engage with stakeholders as part of their oversight duties and responsibilities that have not been delegated to the Chairman and, if appropriate, the Vice-Chairman and Senior Independent Director. Executive Directors.

SHAREHOLDERS

The CFO has lead responsibility for investor relations,shareholder engagement, with the active involvement of the CEO. They areCEO and supported by ourthe Investor Relations department which organises presentations for analysts and investors. These and other materials (e.g. an Introduction to Unilever and AGM materials) are generally made available on our website.

Annual Report on Form 20-F 2017Governance Report37


CORPORATE GOVERNANCECONTINUEDdepartment.

Principal shareholders: theThe Executive Directors’ investor relations programme continued in 20172018 with meetings held with institutional shareholders in eleven major cities in Europe, North America and Asia. In all, they met more than 100 investors during these roadshows. In addition, our Chairman met investors in Europe and North America. As part of the strategic review of options to accelerate sustainable value creation, we sought feedback from our Top 50 shareholders and other investors.globally. The feedback was shared with, and discussed by, the Boards.

Quarterly announcements: briefings on quarterly results are given via teleconference and are accessible by telephone or via our website.

Annual investor seminar: this annual event was held at our Englewood Cliffs offices in the US in November. It focused on our Connected 4 Growth programme. The event was attended by the Chairman, CEO, CFO and other senior management. The slides shown and an audio recording of the presentations were made available and can be accessed on our website. This allows those investors not attending in person to access the information provided at the event.

Investor conferences: the Executive Directors and members of the Investor Relations team also meet a large number of investors at the industry conferences they attend. In 2017 the2018 industry conferences that were attended by Unilever representatives included broker sponsored conferencesevents in London, Paris, Stockholm, Boston and New York, TorontoYork.

Our annual investor seminar in December also allowed investors to meet the Chairman, CEO,CEO-designate, CFO and Singapore.other members of senior management. The event was held at the offices of Hindustan Unilever in Mumbai and focused on Unilever’s emerging markets expertise as well as the digital transformation of the business.

FeedbackIn 2018, as part of the strategic review of options to accelerate sustainable value creation and our proposal to simplify the Unilever corporate structure, the Chairman met and spoke with global investors during the year. The Chair of the Compensation Committee also extensively engaged with and sought feedback from shareholders: weinvestors in relation to our Remuneration Policy.

Annual Report on Form 20-F 2018Governance Report39


CORPORATE GOVERNANCECONTINUED

On an ongoing basis, the Boards are briefed on investor reactions to the Unilever Group’s quarterly results announcements and on any issues raised by shareholders that are relevant to their responsibilities.

We maintain a frequent dialogue with our principal institutional shareholders and regularly collect feedback. We use this feedback to help shape our investor programme and future shareholder communications. Private shareholders are encouraged to give feedback via shareholder.services@unilever.com. TheOur shareholders are also welcome to raise any issues directly with the Chairman or the Senior Independent Director/Vice-Chairman, and the Chairman, Executive Directors and Chairs of the Committees are also generally available to answer questions from the shareholders at the AGMs each year.

OTHERS

Our Executive Directors andNon-Executive Directors also engage with a wide-ranging group of stakeholders during specific Unilever events. For example, we annually organise one or more Board awareness:Relationship meetings offering our Directors the Boardsopportunity to directly meet our key customers, suppliers, agencies, NGOs, trade associations and advisers. In 2018, such meetings were held in the Netherlands and the UK.

EMPLOYEES

In order to allow ourNon-Executive Directors to gainfirst-hand experience of our operations and to engage in a broader context, we organise one or more site visits annually. During these site visits,Non-Executive Directors are briefedinformed about local market conditions and operations as well as relevant local matters. Typically, the programme allowsNon-Executive to meet management and young talent at these sites. In 2018, such site visits were held in China, Germany, the Netherlands and the US. In terms of engaging with employees, ourNon-Executive Directors actively participate in our management development programme sharing knowledge and insight on investor reactions to the Unilever Group’s quarterly results announcements and are briefed on any issues raised by shareholders that are relevant to their responsibilities.a mutual basis.


LOGOLOGO  www.unilever.com/investor-relations/

GENERAL MEETINGS

Both NV and PLC hold an AGM each year. At the AGMs the Chairman gives his thoughts on governance aspects of the preceding year and the CEO gives a detailed review of the performance of the Unilever Group over the last year. Shareholders are encouraged to attend the relevant meeting and to ask questions at or in advance of the meeting. Indeed, the question and answer session forms an important part of each meeting. The external auditors are welcomed to the AGMs and are entitled to address the meetings.

Provision 4.1.8 of the Corporate Governance Code in the Netherlands (Dutch Code) and Code Provision E.2.3 of the UK Corporate Governance Code (UK Code) require all Directors to attend both the NV and PLC AGMs. As questions asked at our AGMs tend to focus on business related matters, governance and the remit of our Board Committees, the Chairman, CEO, CFO and the Chairs of our four Committees of the Board attend both our AGMs and the remaining members of the Board attend at least one AGM.

The 20172018 AGMs were held in Rotterdam and London in AprilMay and the topics raised by shareholders included: Acquisition policy, progress of the Unilever Sustainable Living Plan, the Baking, Cookinge-commerce, mergers & acquisitions, sustainability, Simplification, remuneration, total shareholder return, Brexit and Spreads business, tax transparency, the NV cumulative preference shares, remuneration policy, Brexit, innovation and risk assessment.data protection.

Shareholders of NV may propose resolutions if they individually or together hold at least 1% of NV’s issued capital in the form of shares or depositary receipts issued for NV shares. Shareholders who together represent at least 10% of the issued capital of NV can, under certain circumstances, also requisition the District Court to allow them to convene an Extraordinary General Meeting to deal with specific resolutions.

Shareholders of PLC may propose resolutions if they individually or together hold shares representing at least 5% of the total voting rights of PLC, or 100 shareholders who hold on average £100 each in nominal value of PLC share capital can require PLC to propose a resolution at a General Meeting. PLC shareholders holding in aggregate 5% of the issued PLC ordinary shares are able to convene a General Meeting of PLC.

Information on the 20182019 AGMs can be found within the NV and PLC AGM Notices which will be published in March 2018.2019.

REQUIRED MAJORITIES

Resolutions are usually adopted at NV and PLC General Meetings by an absolute majority of votes cast, unless there are other requirements under the applicable laws or NV’s or PLC’s Articles of Association. For example, there are special requirements for resolutions relating to the alteration of the Articles of Association, the liquidation of NV or PLC and the alteration of the Equalisation Agreement.

A proposal to alter the Articles of Association of NV can only be made by the NV Board. A proposal to alter the Articles of Association of PLC can be made either by the PLC Board or by requisition of shareholders in accordance with the UK Companies Act 2006. Unless expressly specified to the contrary in PLC’s Articles of Association, PLC’s Articles of Association may be amended by a special resolution. Proposals to alter the provisions in the Articles of Association of NV and PLC respectively relating to the unity of management require the prior approval of meetings of the holders of the NV special ordinary shares and the PLC deferred stock. The Articles of Association of both NV and PLC can be found on our website.


LOGOLOGO  

www.unilever.com/investor-relations/agm-and-corporate-governance/agm-and-corporate-

governance/legal-structure-and-foundation-agreements/

RIGHT TO HOLD AND TRANSFER SHARES

Unilever’s constitutional documents place no limitations on the right to hold or transfer NV and PLC ordinary shares. There are no limitations on the right to hold or exercise voting rights on the ordinary shares of NV and PLC imposed by Dutch or English law.


3840 Governance Report  Annual Report on Form 20-F 20172018


CORPORATE GOVERNANCE COMPLIANCE

GENERAL

We conduct our operations in accordance with internationally accepted principles of good governance and best practice, whilstwhile ensuring compliance with the corporate governance requirements applicable in the countries in which we operate. Unilever is subject to corporate governance requirements (legislation, codes and/or standards) in the Netherlands, the UK and the US and in this section we report on our compliance against these.

MATERIAL CONTRACTS

Under the European Takeover Directive as implemented in the Netherlands and the UK, the UK Companies Act 2006 and rules of the US Securities and Exchange Commission, Unilever is required to provide information on contracts and other arrangements essential or material to the business of the Unilever Group. Other than the Foundation Agreements referred to on page 34,36, we believe we do not have any such contracts or arrangements.

THE NETHERLANDS

During 2017, the new Dutch Code came into effect in the Netherlands. The Dutch Code is available on the Monitoring Committee Corporate Governance Code’s website.In 2018, NV compliescomplied with almost all the principles and best practice provisions of the Dutch Code, with the exception of Dutch Code Provision 4.1.8 as noted in the paragraphs on General Meetings within the Our Shareholders section above and the best practice provisionsprovision set out below. The Dutch Code is available on the Monitoring Committee Corporate Governance Code’s website.

Best Practice Provision 3.2.3

The Dutch Code provides that in case of dismissal, the remuneration of an Executive Director should not exceed one year’s salary.

It is our policy to set the level of severance payments for Executive Directors at no more than one year’s salary, unless the Boards, on the recommendation of the Compensation Committee, find this manifestly unreasonable given circumstances or unless otherwise dictated by applicable law.

Best Practice Provision 4.3.4

The Dutch Code provides that the voting rights attached to financing preference shares should be based on the fair value of the capital contribution.

The voting rights of the 6% and 7% cumulative preference shares issued by NV between 1927 and 1964 are based on their nominal value, as prescribed by Dutch law. NV agrees with the principle in the Dutch Code that the voting rights should be based on a fair value of the capital contribution. As mentioned in the Our Shares section above, Unilever has announced the Boards’ intention to terminate the 6% and 7% cumulative preference shares upon any unification.

Corporate Governance Statements:

In addition to an explanation ofnon-compliance to the Dutch Code, as set out above, the Dutch Code also requires the Board to confirm, and the Board hereby confirms that:

this Annual Report and Accounts provides sufficient insights into any failings in the effectiveness of the internal risk management and control systems;
the systems mentioned above provide reasonable assurance that the financial reporting does not contain any material inaccuracies;
based on the current state of affairs, it is justified that the financial reporting is prepared on a going concern basis; and
this Annual Report and Accounts states those material risks and uncertainties that are relevant to the expectation of NV’s continuity for the period of twelve12 months after the preparation of this Annual Report and Accounts.

The statements in this paragraph are not statements in accordance with the requirements of Section 404 of the US Sarbanes-Oxley Act of 2002.

Furthermore, NV is required to make a statement concerning corporate governance as referred to in article 2a of the decree on the content of the management report (Besluit inhoud bestuursverslag) (the Decree).

The information required to be included in this corporate governance statement as described in articles 3, 3a and 3b of the Decree can be found on our website.


LOGOLOGO  www.commissiecorporategovernance.nl

LOGOLOGO  www.unilever.com/corporategovernance

THE UNITED KINGDOM

PLC, being a company that is incorporated in the UK and listed on the London Stock Exchange, is required to state how it has applied the main principles and how far it has complied with the provisions set out in the UK Code, which is available on the Financial Reporting Council’s (FRC) website. In 20172018, PLC complied with all UK Code provisions with the exception of UK Code Provision E.2.3 as noted in the General Meetings section above. The UK Code is available on the Financial Reporting Council’s (FRC) website.

Risk Management and Control: Our approach to risk management and systems of internal control is in line with the recommendations in the FRC’s revised guidance ‘Risk management, internal control and related financial and business reporting’ (the Risk Guidance). It is Unilever’s practice to review acquired companies’ governance procedures and to align them to the Unilever Group’s governance procedures as soon as is practicable.

Greenhouse Gas (GHG) Emissions: In line with the Large and Medium-sized Companies and Groups (Accounts and Reports) Regulations 2008 as amended by the Companies Act 2006 (Strategic Report and Directors’ Report) Regulations 2013 our greenhouse gas performance is set out below. We report our CO2Information on GHG emissions with reference to the latest Greenhouse Gas (GHG) Protocol Corporate Accounting and Reporting Standard (GHG Protocol) to calculate emissions of carbon dioxide from the combustion of fuels (Scope 1) and from purchased electricity, heat, steam and cooling (Scope 2, market-based method). From 2017, we are extending our reporting of emissions from manufacturing facilities to also include research laboratories, marketing/sales offices and distribution centres because the additional data is now collected for reporting of our ‘carbon positive’ emissions reduction programme.

Carbon emission factors are used to convert energy used in our operations to emissions of CO2. Carbon emission factors for fuels are provided by the Intergovernmental Panelcan be found on Climate Change (IPCC).

Carbon emission factors for grid electricity calculated according to the ‘market-based method’ are supplier-specific emissions factors reflecting contractual arrangements with electricity suppliers. Where supplier-specific emissions factors are not available, carbon emissions factors reflect the country where each operation is located and are provided by the International Energy Agency (IEA). For manufacturing we have selected an intensity ratio based on production; this aligns with our long-standing reporting of manufacturing performance.

The GHG data relates to emissions during the 12-month period from 1 October 2016 to 30 September 2017. This period is different from that for which the remainder of the Directors’ Report is prepared (which is the calendar year 2017).

EMISSIONS OF CO2FROM MANUFACTURING,

1 OCTOBER 2016 TO 30 SEPTEMBER 2017

(1 OCTOBER 2015 TO 30 SEPTEMBER 2016)

Scope 1773,856 tonnes CO2 (840,633 tonnes CO2)
Scope 2793,472 tonnes CO2(864,936 tonnes CO2)
(market-based method)
Total Scope 1 & 21,567,328 tonnes CO2(1,705,569 tonnes
   CO2f)
Intensity ratio76.77 kg CO2per tonne of production

(83.52 kg CO2per tonne of productionf)

PricewaterhouseCoopers (PwC) assured in 2017. For details and 2017 basis of preparation see www.unilever.com/ara2017/downloads.
fPwC assured in 2016. For details and 2016 basis of preparation see www.unilever.com/sustainable-living/our-approach-to-reporting/reports-and-publications-archive.

Annual Report on Form 20-F 2017Governance Report39


CORPORATE GOVERNANCECONTINUED

EMISSIONS OF CO2 FROM DISTRIBUTION CENTRES, RESEARCH LABORATORIES, MARKETING AND SALES OFFICES, 1 OCTOBER 2016 TO 30 SEPTEMBER 2017
Scope 120,039 tonnes CO2
Scope 2102,292 tonnes CO2
(market-based method)

Total Scope 1 & 2

122,331 tonnes CO2

Emissions from the combustion of biogenic fuels (biomass, fuel crops etc) within our operations are reported separately to other Scope 1 and 2 emissions, as recommended by the GHG Protocol, and excluded from our intensity ratio calculation. The data also excludes Scope 3 emissions (including consumer use of our products) which we report as part of our Unilever Sustainable Living Plan.page 35.

Employee Involvement and Communication: Unilever’s UK companies maintain formal processes to inform, consult and involve employees and their representatives. A National Consultative Forum comprising employees and management representatives from key locations meets regularly to provide a forum for discussing issues relating to Unilever sites in the United Kingdom. We recognise collective bargaining on a number of sites and engage with employees via the Sourcing Unit Forum, which includes national officer representation from the three recognised trade unions. A European Works Council, embracing employee and management representatives from countries within Europe, has been in existence for several years and provides a forum for discussing issues that extend across national boundaries.

Equal Opportunities and Diversity: Consistent with our Code of Business Principles, Unilever aims to ensure that applications for employment from everyone are given full and fair consideration and that everyone is given access to training, development and career opportunities. Every effort is made to retrain and support employees who become disabled while working within the Group.


LOGOLOGO  www.frc.org.uk/

LOGOLOGO  www.unilever.com/sustainable-living/values-and-values/

Annual Report on Form 20-F 2018Governance Report41


CORPORATE GOVERNANCECONTINUED

THE UNITED STATES

Both NV and PLC are listed on the New York Stock Exchange (NYSE). As such, both companies must comply with the requirements of US legislation, regulations enacted under US securities laws and the Listing Standards of the NYSE, that are applicable to foreign private issuers, copies of which are available on their websites.

We are substantially compliant with the Listing Standards of the NYSE applicable to foreign private issuers except as set out below.

We are required to disclose any significant ways in which our corporate governance practices differ from those typically followed by US companies listed on the NYSE. Our corporate governance practices are primarily based on the requirements of the UK Listing Rules, the UK Code and the Dutch Code but substantially conform to those required of US companies listed on the NYSE. The only significant way in which our corporate governance practices differ from those followed by domestic companies under Section 303A Corporate

Governance Standards of the NYSE is that the NYSE rules require that shareholders must be given the opportunity to vote on all equity-compensation plans and material revisions thereto, with certain limited exemptions. The UK Listing Rules require shareholder approval of equity-compensation plans only if new or treasury shares are issued for the purpose of satisfying obligations under the plan or if the plan is a long-term incentive plan in which a director may participate. Amendments to plans approved by shareholders generally only require approval if they are to the advantage of the plan participants. Furthermore, Dutch law and NV’s Articles of Association require shareholder approval of equity-compensation plans only if the Executive Directors are able to participate in such plans. Under Dutch law, shareholder approval is not required for material revisions to equity-compensation plans unless the Executive Directors participate in a plan and the plan does not contain its own procedure for revisions.

Attention is drawn to the Report of the Audit Committee on pages 41 and 42.43 to 45. In addition, further details about our corporate governance are provided in the document entitled ‘The Governance of Unilever’ which can be found on our website.


LOGOLOGO  www.nyse.com/index

LOGOLOGO  www.sec.gov

All senior executives and senior financial officers have declared their understanding of and compliance with Unilever’s Code of Business Principles and the related Code Policies. No waiver from any provision of the Code of Business Principles or Code Policies was granted in 20172018 to any of the persons falling within the scope of the SEC requirements. The Code of Business Principles and related Code Policies are published on our website.

Risk Management and Control: Following a review by the Disclosure Committee, Audit Committee and Boards, the CEO and the CFO concluded that the design and operation of the Unilever Group’s disclosure controls and procedures, including those defined in the United States Securities Exchange Act of 1934 – Rule 13a – 15(e), as at 31 December 20172018 were effective, and that subsequently until 23 February 2018 (the date of the approval of this Annual Report and Accounts (and the Additional Information for US Listing Purposes) by the Boards there have been no significant changes in the Unilever Group’s internal controls, or in other factors that could significantly affect those controls.effective.

Unilever is required by Section 404 of the US Sarbanes-Oxley Act of 2002 to report on the effectiveness of its internal control over financial reporting. This requirement is reported on within the section entitled ‘Management’s Report on Internal Control over Financial Reporting’ on page 168.156.

In February 2017, the Group received a public potential offer by The Kraft Heinz Company for $50 per share in respect of all of NV and PLC shares. Unilever rejected the proposal.


LOGOLOGO  

www.unilever.com/investor-relations/agm-and-corporate-governance/agm-and-corporate-

governance/our-corporate-governance/


4042 Governance Report  Annual Report on Form 20-F 20172018


REPORT OF THE AUDIT COMMITTEE


COMMITTEE MEMBERS AND ATTENDANCE


   ATTENDANCE


John Rishton

Chair

 7 / 78/8
  

Nils Andersen

 7 / 78/8
  

Judith Hartmann

 7 / 7

Mary Ma(Member until April 2017)

4 / 48/8
 

This table shows the membership of the Committee together with their attendance at meetings during 2017.2018. If Directors are unable to attend a meeting, they have the opportunity beforehand to discuss any agenda items with the Committee Chair. Attendance is expressed as the number of meetings attended out of the number eligible to be attended.


HIGHLIGHTS OF 20172018


•  Annual Report and Accounts

•  Connected 4 Growth (C4G) programme

•  Tax regulations, provisions and disclosure

•  Information security, including Cyber, and IT resilience

•  Supply Chain flexibility and continuity of supply

•  Accounting for significant Mergers and Acquisitions

•  Acquisition Review

•  US tax reformSpreads Disposal

•  IFRS 15 ‘Revenue from Contracts with Customers’ and IFRS 16 ‘Leases’


PRIORITIES FOR 20182019


•  Tax regulations, provisions and disclosure

•  Information Security, including Cyber, and IT resilience

•  Supply Chain flexibility and continuity of supplyIFRS 16 ‘Leases’

•  Accounting for significant Mergers and Acquisitions

•  IFRS 16 ‘Leases’

MEMBERSHIP OF THE COMMITTEE

The Audit Committee is comprised only of independentNon-Executive Directors with a minimum requirement of three such members. It is chaired by John Rishton. The composition ofRishton and the Committee changed after the AGMs in April 2017 when Mary Ma retired from the Committee. The other members are Nils Andersen and Judith Hartmann. For the purposes of the US Sarbanes-Oxley Act of 2002 John Rishton is the Audit Committee’s financial expert. The Boards have satisfied themselves that the current members of the Audit Committee are competent in financial matters and have recent and relevant experience. Other attendees at Committee meetings (or part thereof) were the Chief Financial Officer, Chief Auditor, EVP Financial Control, Risk Management, Pensions & Sustainability, Chief Legal Officer and Group Secretary and the external auditors. Throughout the year the Committee members periodically met without others present and also held separate private sessions with the Chief Financial Officer, Chief Auditor and the external auditors, allowing the Committee to discuss any issues in more detail directly.detail.

ROLE OF THE COMMITTEE

The role and responsibilities of the Audit Committee are set out in written terms of reference which are reviewed annually by the Committee, taking into account relevant legislation and recommended good practice. The terms of reference are contained within ‘The Governance of Unilever’ which is available on our website atwww.unilever.com/corporategovernance.corporategovernance. The Committee’s responsibilities include, but are not limited to, the following matters, and relevant issues are brought to the attention of the Boards:

oversight of the integrity of Unilever’s financial statements;
review of Unilever’s quarterly and annual financial statements (including clarity and completeness of disclosure) and approval of the quarterly trading statements for quarter 1 and quarter 3;
oversight of risk management and internal control arrangements;
oversight of compliance with legal and regulatory requirements;
oversight of the external auditors’ performance, objectivity, qualifications and independence; the approval process ofnon-audit services; recommendation to the Boards of the nomination of the external auditors for shareholder approval; and approval of their fees, refer to note 2625 on page 137;126;
the performance of the internal audit function; and
approval of the Unilever Leadership Executive (ULE) expense policy and the review of Executive Director expenses.

In order to help the Committee meet its oversight responsibilities, each year management organise knowledge sessions for the Committee on subject areas within its remit. In 2017,2018, a joint session was held with the Corporate Responsibility CommitteeUnilever Management on the Unilever Sustainable Living Plan (USLP),acquisition of the Dollar Shave Club, which included a briefing on the methodology, impactacquisition case, recent performance, and performance of Unilever’s Sustainable Living Brands.key learnings that might be relevant for future acquisitions. In addition, John Rishton visited both Brazil, where Indirect Taxation was reviewedthe Indian MCO in detail, and the UK and Ireland MCOMumbai, where the developments of routes to market, controls automation and centralisation were reviewed and discussed in detail. Mr Rishton also visited the Indian finance and IT hub in Bangalore where progress being made on monitoring systems of C4G, including within the Finance Function,potential cyber threat and access controls around promotional activity were discussed.reviewed.

HOW THE COMMITTEE HAS DISCHARGED ITS RESPONSIBILITIES

During the year, the Committee’s principal activities were as follows:

FINANCIAL STATEMENTS

The Committee reviewed prior to publication the quarterly financial press releases together with the associated internal quarterly reports from the Chief Financial Officer and the Disclosure Committee and, with respect to the half-year and full-year results, the external auditors’ reports. It also reviewed this Annual Report and Accounts and the Annual Report on Form20-F 2017. 2018. These reviews incorporated the accounting policies and significant judgements and estimates underpinning the financial statements as disclosed within note 1 on pages 9079 to 93.82. Particular attention was paid to the following significant issues in relation to the financial statements:

revenue recognition – estimation of discounts, incentives on sales made during the year, refer to note 2 on pages 9382 to 95;84;
direct tax provisions, refer to note 6 on pages 10594 to 107;96; and
indirect tax provisions and contingent liabilities, refer to note 19 on page 130;120.
accounting for the acquisition of Carver Korea – measurement of assets and liabilities acquired at fair value, particularly intangible assets, refer to note 21 on pages 132 to 135; and

Annual Report on Form 20-F 2018Governance Report43


REPORT OF THE AUDIT COMMITTEECONTINUED

presentation of the Spreads business, refer to note 22 on page 136.

The external auditors have agreed the list of significant issues discussed by the Audit Committee. In addition to these risks KPMG, as required by auditing standards, also consider the risk of management override of controls. Nothing has come to either our attention or the attention of KPMG to suggest any material suspected or actual fraud relating to management override of controls.

For each of the above areas the Committee considered the key facts and judgements outlined by management. Members of management attended the section of the meeting of the Committee where their item was discussed to answer any questions or challenges posed by the Committee. The issues were also discussed with the external auditors.auditors and further information can be found on pages 67 to 74. The Committee was satisfied that there are relevant accounting policies in place in relation to these significant issues and management have correctly applied these policies.

At the request of the Boards the Committee undertook to:

review the appropriateness of adopting the going concern basis of accounting in preparing the annual financial statements; and
assess whether the business was viable in accordance with the requirement of the UK Corporate Governance Code. The assessment included a review of the principal risks facing Unilever, their potential impact, how they were being managed, together with a discussion as to the appropriate period for the assessment. The Committee recommended to the Boards that there is a reasonable expectation that the Group will be able to continue in operation and meet its liabilities as they fall due over the three-year period (consistent with the period of the strategic plan) of the assessment.

Annual Report on Form 20-F 2017Governance Report41


REPORT OF THE AUDIT COMMITTEECONTINUED

At the request of the Boards the Committee also considered whether the Unilever Annual Report and Accounts 20172018 was fair, balanced and understandable and whether it provided the necessary information for shareholders to assess the Group’s position and performance, business model and strategy. The Committee was satisfied that, taken as a whole, the Unilever Annual Report and Accounts 20172018 is fair, balanced and understandable.

RISK MANAGEMENT AND INTERNAL CONTROL ARRANGEMENTS

The Committee reviewed Unilever’s overall approach to risk management and control, and its processes, outcomes and disclosure. It reviewed:

the Controller’s Quarterly Risk and Control Status Report, including Code of Business Principles cases relating to frauds and financial crimes and significant issues received through the Unilever Code Support Line;
the 20172018 corporate risks for which the Audit Committee had oversight and the proposed 20182019 corporate risks identified by the ULE;
management’s improvements to reporting and internal financial control arrangements, through further automation and centralisation;
processes related to information security, including cyber security;
tax planning, and related risk management;
treasury policies, including debt issuance and hedging; and
litigation and regulatory investigations.

The Committee reviewed the application of the requirements under Section 404 of the US Sarbanes-Oxley Act of 2002 with respect to internal controls over financial reporting. In addition, the Committee reviewed the annual financial plan and Unilever’s dividend policy and dividend proposals.

During 20172018 the Committee continued its oversight of the independent assurance work that is performed on a number of our USLP metrics (selected on the basis of their materiality to the USLP).

In fulfilling its oversight responsibilities in relation to risk management, internal control and the financial statements, the Committee met regularly with senior members of management and is satisfied with the key judgements taken.

INTERNAL AUDIT FUNCTION

The Committee reviewed Corporate Audit’s audit plan for the year and agreed its budget and resource requirements. It reviewed interim andyear-end summary reports and management’s response. The Committee engaged an independent third party to perform an effectiveness review of the function. The review concluded that the function is compliant with the IIA (Chartered Institute of Internal Auditor’s)Auditors) Standards in all material aspects. The Committee also carried out an evaluation of the performance of the internal audit function and was satisfied with the effectiveness of the function. The Committee met independently with the Chief Auditor during the year and discussed the results of the audits performed during the year.

AUDIT OF THE ANNUAL ACCOUNTS

KPMG, Unilever’s external auditors and independent registered public accounting firm, reported in depth to the Committee on the scope and outcome of the annual audit, including their audit of internal controls over financial reporting as required by Section 404 of the US Sarbanes-Oxley Act of 2002. Their reports included audit and accounting matters, governance and control, and accounting developments.

The Committee held independent meetings with the external auditors during the year and reviewed, agreed, discussed and challenged their audit plan, including their assessment of the financial reporting risk profile of the Group. The Committee discussed the views and conclusions of KPMG regarding management’s treatment of significant transactions and areas of judgement during the year. The Committee considered these views and comments and is satisfied with the treatment in the financial statements.

EXTERNAL AUDITORS

KPMG have been the Group’s auditors since 2014 and shareholders approved theirre-appointment as the Group’s external auditors at the 20172018 AGMs. On the recommendation of the Committee, the Directors will be proposing there-appointment of KPMG at the AGMs in May 2018.2019.

Both Unilever and KPMG have safeguards in place to avoid the possibility that the external auditors’ objectivity and independence could be compromised, such as audit partner rotation and the restriction onnon-audit services that the external auditors can perform as described below. TheBoth the KPMG partners with overall responsibility for the audit of NV and PLC will rotate off the assignment after completion of the 2018year-end financial statements. One of the new partners already has experience of the Unilever global audit, and the other partner underwent an induction programme through much of thisyear-end to ensure a smooth transition. KPMG has issued a formal letter to the Committee reviewedoutlining the report from KPMG ongeneral procedures to safeguard independence and objectivity, disclosing the actions they take to complyrelationship with the professionalCompany and regulatory requirements and best practice designed to ensureconfirming their independence from Unilever.audit independence.

Each year, the Committee assesses the effectiveness of the external audit process which includes discussing feedback from the members of the Committee and stakeholders at all levels across Unilever. Interviews are also held with key senior management within both Unilever and KPMG.

The Committee also reviewed the statutory audit, audit related andnon-audit related services provided by KPMG and compliance with Unilever’s documented approach, which prescribes in detail the types of engagements, listed below, for which the external auditors can be used:

statutory audit services, including audit of subsidiaries;
audit related engagements – services that involve attestation, assurance or certification of factual information that may be required by external parties;
non-audit related services – work that our external auditors are best placed to undertake, which may include:
audit and assurance certificates / statements
bond issue comfort letters
internal control reviews.

44 Governance Reportaudit and assurance certificates / statements
  bond issue comfort lettersAnnual Report on Form 20-F 2018
internal control reviews.


Unilever has for many years maintained a policy which prescribes in detail the types of engagements for which the external auditors can be used and prohibits several types of engagements, including:

bookkeeping or similar services;
design and/or implementation of systems or processes related to financial information or risk management;
valuation, actuarial and legal services;
internal audit;
broker, dealer, investment adviser or investment bank services;
transfer pricing advisory services
staff secondments of any kind;
Payroll tax;
Customs duties; and
Tax services (except in exceptional and rare circumstances such as where they are the only firm able to provide the service).

All audit related engagements over250,000 andnon-audit related engagements over100,000 required specific advance approval by the Audit Committee Chairman. The Committee further approved all engagements below these levels which have been authorised by the EVP Financial Control, Risk Management, Pension & Sustainability. These authorities are reviewed regularly and, where necessary, updated in the light of internal developments, external developments and best practice. Since the appointment of KPMG in 2014 to 2016 the level ofnon-audit fees has been below 7% of the annual audit fee. In 2017 and 2018 the level ofnon-audit fees has been higher at 41% and 31% respectively due to assurance work relating to the disposal of our Spreads business and the Simplification project.

The Committee confirms that the Group is in compliance with The Statutory Audit Services for Large Companies Market Investigation (Mandatory use of Competitive Tender Processes and Audit Committee Responsibilities) Order 2014. The last tender for the audit of the annual accounts was performed in 2013.

EVALUATION OF THE AUDIT COMMITTEE

As part of the internal Board evaluation carried out in 2017,2018, the Boards evaluated the performance of the Committee. The Committee also carried out an assessment of its own performance in 2017. Whilst2018. While overall the Committee members concluded that the Committee is performing effectively, the Committee agreed that to further enhance its effectiveness it needed to ensure the Committee members continued to develop their knowledge of the Group’s operations which would involve further knowledge sessions and site visits.

John Rishton

Chair of the Audit Committee

Nils Andersen

Judith Hartmann


42Annual Report on Form 20-F 2018 Governance Report Annual Report on Form 20-F 201745


REPORT OF THE CORPORATE

RESPONSIBILITY COMMITTEE


COMMITTEE MEMBERS AND ATTENDANCE


   ATTENDANCE


Strive Masiyiwa(Member since April 2017)

Chair

 2 / 24/4

Louise Fresco(Member until April 2017)

 2 / 2

Laura Cha(Member until April 2017)

2 / 2

Youngme Moon

 4/4 / 4

Feike Sijbesma

 4 / 3/4
 

This table shows the membership of the Committee together with their attendance at meetings during 2017.2018. If Directors are unable to attend a meeting, they have the opportunity beforehand to discuss any agenda items with the Committee Chair. Attendance is expressed as the number of meetings attended out of the number eligible to be attended.


HIGHLIGHTS OF 20172018


•  Compliance with Code of Business Principles

•  Progress on the Unilever Sustainable Living Plan (USLP)

-  Climate strategy

-  Enhancing livelihoods

•  Product quality and safety

PRIORITIES FOR 2018

•  Competition and anti-bribery compliance

•  Third-party compliance

•  Product quality and safety

•  Unilever Sustainable Living Plan (USLP)


PRIORITIES FOR 2019

•  Compliance with Unilever policies on fair competition and anti-bribery and requirements for third parties

•  Product quality and safety

•  Unilever Sustainable Living Plan (USLP) including plastic packaging

ROLE OF THE COMMITTEE

The Corporate Responsibility Committee oversees Unilever’s conduct as a responsible global business. As the Unilever Sustainable Living Plan (USLP) is at the heart of Unilever’s vision to grow its business whilst decoupling its environmental footprint from its growth and increasing its positive social impact, the Committee tracks the progress and potential risks associated with the USLP.

The Committee is also charged with ensuring that Unilever’s reputation is protected and enhanced. Therefore a central element of its role is the need to identify any external developments that are likely to have an influence upon Unilever’s standing in society, and to ensure that appropriate and effective communications policies are in place to support the company’s reputation.

Committee members report their findings to the Boards, thus ensuring that the Boards can fulfil their oversight responsibilities. The Committee’s discussions are informed by the experience of the senior leaders invited to the Committee to share their views on a variety of topics and external trends. Many of these leaders are members of the Unilever Sustainable Living Plan Steering Team, the group of senior executives accountable for driving sustainable growth through Unilever’s brands and operations. These discussions ensure the Committee stays abreast of current and emerging trends and any potential risks arising from sustainability issues. In return, Committee members bring their own diverse perspectives to the table. This enables the Boards to draw on a well-rounded view of issues.

During 20172018 the Committee reviewed its terms of reference and the Boards approved minor changes to the terms.

The Committee’s responsibilities are complemented by those of the Audit Committee, which is responsible for reviewing significant breaches of the Code of Business Principles as part of itits remit to review risk management and for overseeing the independent assurance programme for the USLP.

The Committee’s terms of reference are set outwww.unilever.com/corporategovernance and details of the USLP

Steering Team atwww.unilever.com/sustainable-living/our-strategy/our-sustainability-governance/

MEMBERS OF THE COMMITTEE

The Corporate Responsibility Committee comprises threeNon-Executive Directors: Strive Masiyiwa (Chair), Feike Sijbesma and Youngme Moon. Strive Masiyiwa succeeded Louise Fresco as chair of the Committee at the AGM in April 2017. Laura Cha retired from the Committee at the AGM.TheThe Chief Marketing & Communications Officer and the Executive Vice President for Sustainable Business & CommunicationsChief Sustainability Officer attend the Committee’s meetings. The Chief Business Integrity Officer also attends partto present Unilever’s company report that covers cases under Unilever’s Code of each meeting.Business Principles (the Code) as well as updates on third-party compliance, product quality and safety.

MEETINGS

Meetings are held quarterly and ad hoc as required – four meetings were held in 2017.2018. The Committee Chairman is responsible for reporting the findings from meeting to the Boards.Boards, thus ensuring that the Boards can fulfil their oversight responsibilities.

Following the Committee’s terms of reference and Unilever’s principal risks and the priorities, the Committee sets itself, the Committee’s agenda covers Unilever’sthe Code of Business Principles (the Code),and third-party compliance, alongside litigation, occupational and product safety, the USLP and corporate reputation as well as a range of strategic and current issues.

To help In addition to the areas listed below, in 2018 the Committee meet its oversight responsibilities, each year management organise knowledge sessionsalso reviewed topics such as media communications, the process for the Committeeintegrating business acquisitions and progress on subject areas within its remit. In 2017 a joint session was held with the Audit Committeealternatives to brief members on progress in developing Unilever’s Sustainable Living brands. These are brands which combine a strong purpose delivering a social or environmental benefit with products contributing to at least one of the goals in the USLP.animal testing.

CODE OF BUSINESS PRINCIPLES

The Code and associated Code Policies set out the standards of conduct expected of all Unilever employees in their business endeavours. Compliance with these is an essential element in ensuring Unilever’s continued business success. Thesuccess and is identified as an ethical and legal and regulatory risk to Unilever.

While the Chief Executive Officer is responsible for implementing these principles, supported by the Global Code and Policy Committee, which is chaired by the Chief Legal Officer and Group Secretary.

TheCorporate Responsibility Committee is responsible for the oversight of the Code and Code Policies, ensuring that they remain fit for purpose and are appropriately applied. It maintains close scrutiny of the mechanisms for implementing the Code and Code Policies. This is vital as compliance is essential to promote and protect Unilever’s values and standards, and hence the good reputation of the Group. At each meeting the Committee reviews an analysis of investigations intonon-compliance with the Code and Code Policies and is alerted to any trends arising from these investigations.

PRINCIPLES AND STANDARDS FOR THIRD PARTIES

In 2017 the Committee placed special emphasis on third-party compliance and was briefed on how Unilever’s programmes seek to ensure business integrity.

Extending Unilever’s values to third parties remains a priority, not only to generate continued responsible growth and a positive social impact on the industry, but to counter the significant risk that non-compliance by third parties can pose, particularly in the context of increasing regulation around the world, as exemplified by the UK’s Modern Slavery Act and initiatives seeking to fight corruption and other forms of economic crime. To this end, Unilever is working to harmonise its programmes across its value chain. Central to this is ensuring that these evaluate risks and provide the right measures to address the diversity of market conditions it operates in and the range of third parties it works with. Using external indices as well as internal expertise, Unilever is able to first target relationships presenting the highest risk for assessment.

The Committee monitors compliance with Unilever’s Responsible Sourcing Policy (RSP) for suppliers and the roll-out of its Responsible Business Partner Policy (RBPP) for customers. Both policies share 12 fundamental principles. They form the basis of ongoing dialogue with suppliers and customers on the standards Unilever expects them to meet – and will work with them to achieve.

Annual Report on Form 20-F 2017Governance Report43


REPORT OF THE CORPORATE

RESPONSIBILITY COMMITTEE CONTINUED

SAFETY

The Committee reviews quarterly scorecards of progress on occupational safety and product safety. These are complemented by regular in-depth discussions so that Committee members may reassure themselves that Unilever’s systems and processes remain robust.

Unilever’s focus on safety supports its growth ambition: sustainable growth is only achieved if Unilever also grows responsibly – by providing safe, high quality products, and protecting employees and the people and communities in which it operates.

A priority for Unilever in 2017 was to ensure occupational safety is recognised as the personal and everyday responsibility of all those working at Unilever. A mandatory safety leadership programme supported this by building awareness of safety from the top down: designed to help managers demonstrate and embed best practice in every team, its aim is to ensure that everyone who works at Unilever gets home safely every day.

Process safety in factories is an equally important priority. Improved standards, enhanced qualifications for employees and a Safety to Win programme for partners all contributed to safer manufacturing sites in 2017. Unilever’s approach, which is based on the identification of risk, resulted in a 46% reduction in process safety incidents versus 2016. And overall, these initiatives contributed to a lower Total Recordable Frequency Rate (TRFR) with accidents decreasing from 1.01 accidents per 1 million hours worked in 2016 to 0.89 in 2017 (measured 1 October 2016 to 30 September 2017).

On product safety, the Committee was briefed on the comprehensive processes Unilever has in place to ensure its products and services are safe for their intended use. Like occupational safety, the approach is based on risk identification and mitigation which covers all aspects of the value chain from development, sourcing, manufacture and transport to consumer use and disposal of the product. Unilever’s approach is centred on the application of rigorous standards based on sound science and the principle of Safe by Design and Safe in Execution. It has a comprehensive programme in place to drive performance improvements at its own manufacturing sites, manufacturing partners and raw and material pack suppliers. The learnings from this programme are being embedded across Unilever’s functions. The outcome represents a step change in performance with marketplace incidents reduced by 46% in 2017.

UNILEVER SUSTAINABLE LIVING PLAN (USLP)

Unilever is putting sustainable living at the heart of its brands to inspire consumers, grow sales and deliver on its purpose of making sustainable living commonplace. Consumers are becoming much more aware of the positive difference brands can make to social and environmental issues, and also the difference they themselves can make through their everyday shopping choices. The Committee was briefed on Unilever’s extensive research to understand whether consumers’ views on sustainability translate to actual purchasing choices. The research* showed that sustainability is no longer a niche issue and that 54% of consumers want to buy more sustainably. More people are taking action to live more sustainably, and sustainability issues are relevant to consumers in both developed and emerging markets. Against this backdrop, Unilever’s 18 Sustainable Living Brands grew 50% faster than the rest of the business and delivered more than 60% of the company’s growth in 2016.

In 2017 the Committee scrutinised the delivery of the USLP goal to halve the GHG emissions of its products across the lifecycle by 2030 and the climate change strategy that drives action towards this goal. Committee members were briefed on the plans in place to grow the business while meeting the UN’s goal of staying below a 2 degree Celsius rise in temperature. These plans encompass Unilever’s own manufacturing, its suppliers and its objectives for brands and innovation. Taking action on climate change brings benefits such as lower operational costs and greater resilience in energy supply, as well as improving the security of supply of raw

materials and avoiding disruption from extreme weather events. By proactively cutting its greenhouse gas (GHG) footprint, Unilever also reduces exposure to environmental regulation and taxes.

The Committee also reviewed Unilever’s plans for sustainable agricultural sourcing; its environmental compliance programme for factories; and progress on sustainable packaging – as in January 2017 Unilever announced it would commit to 100% recyclable plastic packaging by 2025 and called on the FMCG industry to accelerate progress towards a more circular economy.

At the end of the year, the Committee reviewed Unilever’s human rights ambitions, which are part of the Enhancing Livelihoods goal of the USLP. Unilever is working to embed human rights across its business and in tandem, is working with suppliers to ensure that the fundamental principles of its Responsible Sourcing Policy are met and that best practice is advanced. By addressing strategic human rights issues and helping the business tackle and prevent endemic abuses in global value chains, it is seeking to deliver a positive social impact alongside business growth. Unilever’s second Human Rights Report was published in December 2017, setting out its progress and challenges in this complex area (available atwww.unilever.com/sustainable-living/enhancing-livelihoods/fairness-in-the-workplace).

*Highlights of Unilever’s consumer research are published in Making Purpose Pay atwww.unilever.com/sustainable-living/our-strategy/embedding-sustainability

MONITORING REPUTATION

A global business working in many countries experiences many issues that may impact the business. So it is crucial that the Committee has a sound understanding of how Unilever’s reputation is viewed by others, and of the processes in place for managing any issues that may harm its good standing in society. To this end, the Committee studied the impact the USLP has had on Unilever’s reputation, as reflected in the annual GlobeScan Sustainability Leaders Survey and elsewhere. It was also briefed on Unilever’s well-established system for identifying and responding to short and longer-term issues. Enhancements made to this system include: a sharper focus on priority issues in market; issue-handling training for teams; and a more sophisticated approach to tracking issues across social media. It also studied the most significant issues managed through this system and the lessons learned from them.

LITIGATION REVIEW

The Chief Legal Officer and Group Secretary reports to the Committee on litigation and regulatory matters which may have a reputational impact including environmental issues, bribery and corruption compliance and competition law compliance. The Committee studied how compliance was achieved during 2018. For further information please see notes 19 and 20 to the consolidated financial statements.

As another of its other priorities in 2018, the Committee also scrutinised the mechanisms for anti-bribery compliance. The primary mechanism is to understand the profiles of the markets Unilever operates in and to ensure that there are robust internal and third-party compliance programmes in place. These are complemented by training for all employees in tandem with advanced capacity building for those in the Business Integrity and Legal functions.

PRINCIPLES AND STANDARDS FOR THIRD PARTIES

The Committee retained its focus on third-party compliance in 2018. Extending Unilever’s values to third parties remains a priority, not only to generate continued responsible growth and a positive social impact on the industry, but to counter the significant risk thatnon-compliance by third parties can pose, particularly in the context of increasing regulation around the world.

The Committee tracks compliance with Unilever’s Responsible Sourcing Policy (RSP) for suppliers and its Responsible Business Partner Policy (RBPP) for customers and distributors. Together they set out Unilever’s requirements that third parties conduct business with integrity, openness and respect for universal human rights and core labour principles. Sourcing 100% of Unilever’s procurement spend in line with the RSP is also a target within the USLP.

The policies enable Unilever to evaluate risk and provide the right measures to address the diversity of market conditions in which it operates and the range of third parties it works with. The Committee was briefed on progress. For the RSP, this detailed the number of suppliers making a positive commitment to the policy, greater alignment on industry standards via the process of mutual recognition and a substantial increase in site audits and resulting corrective action plans. Enhanced anti-bribery and corruption screening was also put in place. The training and enhancements developed for the RBPP include new IT tools launched in over 180 countries, simpler assessment processes, enhanced due diligence and risk mitigation plans.

46Governance ReportAnnual Report on Form 20-F 2018


SAFETY

Sustainable growth is only achieved if Unilever also grows responsibly – by providing safe, high quality products, and protecting employees and the people and communities in which it operates. Safe and high quality products are one of Unilever’s principal risks, see page 31.

Occupational safety continues to be the personal and everyday responsibility of all those working at Unilever. Reducing Unilever’s Total Recordable Frequency Rate (TRFR) is also a target within the USLP. In 2018 TRFR continued to decrease – from 0.89 accidents per 1 million hours worked in 2017 to 0.69 in 2018 (measured 1 October 2017 to 30 September 2018).

In factories, Unilever’s World Class Manufacturing programme hardwires safety into all aspects of the production process – by enabling good design principles, engineering and operating practices to be applied from the start of any project. This focus drove a reduction of 39.5% in process safety incidents in 2018. Capacity building and leadership also improved safety for contractors (those who work on Unilever sites under the direct supervision of their own management), reducing their recordable injuries by half 51% over 2014-2018 (measured by Lost-Time Injuries Frequency Rate, LTIFR).

Unilever’s approach to product safety is based on risk identification and mitigation. This approach covers all aspects of the value chain – from development, sourcing, manufacture and transport to consumer use and disposal of the product – and is centred on the application of rigorous standards based on sound science and the principle of Safe by Design and Safe in Execution. Thanks to a strong focus on product quality, a significant improvement was achieved in 2018 with potentially serious marketplace incidents reduced by 40%. Over 2017-2018, potentially serious marketplace incidents originating in manufacturing have been reduced by 88% and those originating in suppliers of raw and packing materials have been halved.

HUMAN RIGHTS

By addressing strategic human rights issues and helping the business tackle and prevent endemic abuses in global value chains, Unilever is seeking to deliver a positive social impact alongside business growth.

Unilever’s human rights aims are part of the Enhancing Livelihoods goal of the USLP and human rights are included within the company’s sustainability and ethical risks. See pages 29 and 33.

In 2018 Unilever continued to embed human rights with a focus on its eight salient issues (ie those at risk of the most severe negative impact through Unilever’s activities or business relationships). These are set out in Unilever’s Human Rights Report 2017, with an update on further progress at the end of 2018. The Committee noted that Unilever’s approach to this work is sophisticated and that while there is still much to do, it is making good progress in this complex field. See page 14 for more.

PALM OIL

Palm oil is one of Unilever’s most significant raw materials and Unilever is one of the world’s major buyers of palm oil. Alongside sustainability and supply chain, Unilever has identified climate change as one of its principal risks (see page [29]) and is committed to eliminating the deforestation associated with unsustainable palm oil production. Securing supplies of sustainable palm oil is therefore a critical element in Unilever’s business and climate strategy and represents a significant target in the USLP.

The Committee was briefed on plans for driving transformational change in the palm oil sector. Unilever’s Sustainable Palm Oil Sourcing Policy has a focus on the implementation of No Deforestation, No Peat, No Exploitation of people or communities (NDPE) commitments by 2020. However, implementation and enforcement remain challenging. To support the transformation of the sector and the implementation of its Policy, Unilever is investing in multiple initiatives. One example is the &Green Fund which is designed to kick-start investments in deforestation-free agriculture in countries that are working to reduce deforestation and peat degradation. Unilever was announced as the first investor. The Fund aims to protect over 5 million hectares of forest and peatlands by 2020, byde-risking private capital investments into large-scale deforestation-free production, protection and inclusion initiatives. With an aim to trigger $1.6 billion in private capital investments, the Fund is an opportunity to jointly shape solutions to mitigate deforestation and a good illustration of the collaborative, transformational approaches the company is seeking to scale.

To promote transparency and traceability of palm oil sourcing, in 2018 Unilever was also the first consumer goods company to publish the names of its suppliers and a map of the 1,400 palm oil mills in its extended supply chain on its website. This was accompanied by a more visible grievance mechanism to facilitate the reporting of issues ofnon-compliance in the supply chain.

Another important step was an industry-first partnership with Indonesian government-owned palm oil plantation company PT Perkebunan Nusantara (PTPN). The partnership is designed to support local mills and smallholder farmers to produce palm oil according to the NDPE standards that are key to multi-sector efforts to transform the palm oil industry.

PACKAGING WASTE

Packaging waste, particularly post-consumer plastic packaging waste in oceans and waterways, has never been higher on the global agenda than in 2018. Plastic packaging now sits alongside climate change as a major environmental challenge and is identified as a risk for Unilever’s business, see page 30.

Unilever has reduced the waste associated with the disposal of its products by 31% since 2010 (measured as impact per consumer use, towards a target of 50%) and is making strong progress in its own operations and product design. However, the challenge for post-consumer waste is in having the right infrastructure in place to ensure materials are collected and processed, while encouraging consumers to segregate and recycle them.

To support its specific, time-bound targets, at the beginning of 2018 Unilever introduced a new three-part framework designed to sharpen thinking on plastic packaging and innovation: i) Less Plastic means using lighter, stronger and better materials which have a lower environmental impact; ii) Better Plastic entails eliminating problematic materials and using recyclable plastics with a minimum 25% recycled content; iii) No Plastic involves using alternative materials, new packaging formats and alternative models of consumption such as vending – to help reduce use ofsingle-use plastics through innovation, behaviour change and new business models. See page 15 for more.

MCIP

Unilever’s Reward Framework includes the ManagementCo-investment Plan (MCIP), a long-term incentive plan that is linked to financial and USLP performance (see page 53). Corporate Responsibility Committee members shared their views on the context and progress of the USLP and sustainability initiatives with the Compensation Committee to help inform its recommendation on MCIP.

EVALUATION OF THE CORPORATE RESPONSIBILITY COMMITTEE

As part of the internal Boardboard evaluation carried out in 2017,2018, the Boards evaluated the performance of the Committee. The Committee also carried out an assessment of its own performance in 2017. Whilst2018. While overall the Committee members concluded that the Committee is performing effectively, the Committee has agreed to further enhance its effectiveness by reviewing howkeeping close track on progress on the USLP has been embedded intoambitious Unilever Sustainable Living Plan. This will ensure the Group maintains its sustainability momentum and how it should evolve.leadership.

Strive MasiyiwaFeike Sijbesma

3/4

ChairThis table shows the membership of the Corporate Responsibility Committee together with their attendance at meetings during 2018. If Directors are unable to attend a meeting, they have the opportunity beforehand to discuss any agenda items with the Committee Chair. Attendance is expressed as the number of meetings attended out of the number eligible to be attended.

Youngme Moon

Feike SijbesmaHIGHLIGHTS OF 2018

Further details on the USLP will be set out in Unilever’s online

•  Competition and anti-bribery compliance

•  Third-party compliance

•  Product quality and safety

•  Unilever Sustainable Living Report 2017, to be published in April 2018.Plan (USLP)

www.unilever.com/sustainable-living


44Governance ReportAnnual Report on Form 20-F 2017

PRIORITIES FOR 2019

•  Compliance with Unilever policies on fair competition and anti-bribery and requirements for third parties

•  Product quality and safety

•  Unilever Sustainable Living Plan (USLP) including plastic packaging

ROLE OF THE COMMITTEE

The Corporate Responsibility Committee oversees Unilever’s conduct as a responsible global business. As the Unilever Sustainable Living Plan (USLP) is at the heart of Unilever’s vision to grow its business whilst decoupling its environmental footprint from its growth and increasing its positive social impact, the Committee tracks the progress and potential risks associated with the USLP.

The Committee is also charged with ensuring that Unilever’s reputation is protected and enhanced. Therefore a central element of its role is the need to identify any external developments that are likely to have an influence upon Unilever’s standing in society, and to ensure that appropriate and effective communications policies are in place to support the company’s reputation.

The Committee’s discussions are informed by the experience of the senior leaders invited to the Committee to share their views on a variety of topics and external trends. Many of these leaders are members of the Unilever Sustainable Living Plan Steering Team, the group of senior executives accountable for driving sustainable growth through Unilever’s brands and operations. These discussions ensure the Committee stays abreast of current and emerging trends and any potential risks arising from sustainability issues. This enables the Boards to draw on a well-rounded view of issues.

During 2018 the Committee reviewed its terms of reference and approved minor changes to the terms.

The Committee’s responsibilities are complemented by those of the Audit Committee, which is responsible for reviewing significant breaches of the Code of Business Principles as part of its remit to review risk management and for overseeing the independent assurance programme for the USLP.

The Committee’s terms of reference are set outwww.unilever.com/ corporategovernance and details of the USLP Steering Team atwww.unilever.com/sustainable-living/our-strategy/our-sustainability-governance/

MEMBERS OF THE COMMITTEE

The Corporate Responsibility Committee comprises threeNon-Executive Directors: Strive Masiyiwa (Chair), Feike Sijbesma and Youngme Moon. The Chief Marketing & Communications Officer and the Chief Sustainability Officer attend the Committee’s meetings. The Chief Business Integrity Officer also attends to present Unilever’s company report that covers cases under Unilever’s Code of Business Principles (the Code) as well as updates on third-party compliance, product quality and safety.

MEETINGS

Meetings are held quarterly and ad hoc as required – four were held in 2018. The Committee Chairman is responsible for reporting the findings from meeting to the Boards, thus ensuring that the Boards can fulfil their oversight responsibilities.

Following the Committee’s terms of reference and Unilever’s principal risks and priorities, the Committee’s agenda covers the Code and third-party compliance, alongside litigation, occupational and product safety, the USLP and corporate reputation as well as a range of strategic and current issues. In addition to the areas listed below, in 2018 the Committee also reviewed topics such as media communications, the process for integrating business acquisitions and progress on alternatives to animal testing.

CODE OF BUSINESS PRINCIPLES

The Code and associated Code Policies set out the standards of conduct expected of all Unilever employees in their business endeavours. Compliance with these is an essential element in ensuring Unilever’s continued business success and is identified as an ethical and legal and regulatory risk to Unilever.

While the Chief Executive Officer is responsible for implementing these principles, supported by the Global Code and Policy Committee, the Corporate Responsibility Committee is responsible for oversight of the Code and Code Policies, ensuring that they remain fit for purpose and are appropriately applied. It maintains close scrutiny of the mechanisms for implementing the Code and Code Policies. This is vital as compliance is essential to promote and protect Unilever’s values and standards, and hence the good reputation of the Group. At each meeting the Committee reviews an analysis of investigations intonon-compliance with the Code and Code Policies and is alerted to any trends arising from these investigations.

The Chief Legal Officer and Group Secretary reports to the Committee on litigation and regulatory matters which may have a reputational impact including environmental issues, bribery and corruption compliance and competition law compliance. The Committee studied how compliance was achieved during 2018. For further information please see notes 19 and 20 to the consolidated financial statements.

As another of its other priorities in 2018, the Committee also scrutinised the mechanisms for anti-bribery compliance. The primary mechanism is to understand the profiles of the markets Unilever operates in and to ensure that there are robust internal and third-party compliance programmes in place. These are complemented by training for all employees in tandem with advanced capacity building for those in the Business Integrity and Legal functions.

PRINCIPLES AND STANDARDS FOR THIRD PARTIES

The Committee retained its focus on third-party compliance in 2018. Extending Unilever’s values to third parties remains a priority, not only to generate continued responsible growth and a positive social impact on the industry, but to counter the significant risk thatnon-compliance by third parties can pose, particularly in the context of increasing regulation around the world.

The Committee tracks compliance with Unilever’s Responsible Sourcing Policy (RSP) for suppliers and its Responsible Business Partner Policy (RBPP) for customers and distributors. Together they set out Unilever’s requirements that third parties conduct business with integrity, openness and respect for universal human rights and core labour principles. Sourcing 100% of Unilever’s procurement spend in line with the RSP is also a target within the USLP.

The policies enable Unilever to evaluate risk and provide the right measures to address the diversity of market conditions in which it operates and the range of third parties it works with. The Committee was briefed on progress. For the RSP, this detailed the number of suppliers making a positive commitment to the policy, greater alignment on industry standards via the process of mutual recognition and a substantial increase in site audits and resulting corrective action plans. Enhanced anti-bribery and corruption screening was also put in place. The training and enhancements developed for the RBPP include new IT tools launched in over 180 countries, simpler assessment processes, enhanced due diligence and risk mitigation plans.

46Governance ReportAnnual Report on Form 20-F 2018


REPORT OF THE NOMINATING AND

CORPORATE GOVERNANCE COMMITTEE


SAFETY

Sustainable growth is only achieved if Unilever also grows responsibly – by providing safe, high quality products, and protecting employees and the people and communities in which it operates. Safe and high quality products are one of Unilever’s principal risks, see page 31.

Occupational safety continues to be the personal and everyday responsibility of all those working at Unilever. Reducing Unilever’s Total Recordable Frequency Rate (TRFR) is also a target within the USLP. In 2018 TRFR continued to decrease – from 0.89 accidents per 1 million hours worked in 2017 to 0.69 in 2018 (measured 1 October 2017 to 30 September 2018).

In factories, Unilever’s World Class Manufacturing programme hardwires safety into all aspects of the production process – by enabling good design principles, engineering and operating practices to be applied from the start of any project. This focus drove a reduction of 39.5% in process safety incidents in 2018. Capacity building and leadership also improved safety for contractors (those who work on Unilever sites under the direct supervision of their own management), reducing their recordable injuries by half 51% over 2014-2018 (measured by Lost-Time Injuries Frequency Rate, LTIFR).

Unilever’s approach to product safety is based on risk identification and mitigation. This approach covers all aspects of the value chain – from development, sourcing, manufacture and transport to consumer use and disposal of the product – and is centred on the application of rigorous standards based on sound science and the principle of Safe by Design and Safe in Execution. Thanks to a strong focus on product quality, a significant improvement was achieved in 2018 with potentially serious marketplace incidents reduced by 40%. Over 2017-2018, potentially serious marketplace incidents originating in manufacturing have been reduced by 88% and those originating in suppliers of raw and packing materials have been halved.

HUMAN RIGHTS

By addressing strategic human rights issues and helping the business tackle and prevent endemic abuses in global value chains, Unilever is seeking to deliver a positive social impact alongside business growth.

Unilever’s human rights aims are part of the Enhancing Livelihoods goal of the USLP and human rights are included within the company’s sustainability and ethical risks. See pages 29 and 33.

In 2018 Unilever continued to embed human rights with a focus on its eight salient issues (ie those at risk of the most severe negative impact through Unilever’s activities or business relationships). These are set out in Unilever’s Human Rights Report 2017, with an update on further progress at the end of 2018. The Committee noted that Unilever’s approach to this work is sophisticated and that while there is still much to do, it is making good progress in this complex field. See page 14 for more.

PALM OIL

Palm oil is one of Unilever’s most significant raw materials and Unilever is one of the world’s major buyers of palm oil. Alongside sustainability and supply chain, Unilever has identified climate change as one of its principal risks (see page [29]) and is committed to eliminating the deforestation associated with unsustainable palm oil production. Securing supplies of sustainable palm oil is therefore a critical element in Unilever’s business and climate strategy and represents a significant target in the USLP.

The Committee was briefed on plans for driving transformational change in the palm oil sector. Unilever’s Sustainable Palm Oil Sourcing Policy has a focus on the implementation of No Deforestation, No Peat, No Exploitation of people or communities (NDPE) commitments by 2020. However, implementation and enforcement remain challenging. To support the transformation of the sector and the implementation of its Policy, Unilever is investing in multiple initiatives. One example is the &Green Fund which is designed to kick-start investments in deforestation-free agriculture in countries that are working to reduce deforestation and peat degradation. Unilever was announced as the first investor. The Fund aims to protect over 5 million hectares of forest and peatlands by 2020, byde-risking private capital investments into large-scale deforestation-free production, protection and inclusion initiatives. With an aim to trigger $1.6 billion in private capital investments, the Fund is an opportunity to jointly shape solutions to mitigate deforestation and a good illustration of the collaborative, transformational approaches the company is seeking to scale.

To promote transparency and traceability of palm oil sourcing, in 2018 Unilever was also the first consumer goods company to publish the names of its suppliers and a map of the 1,400 palm oil mills in its extended supply chain on its website. This was accompanied by a more visible grievance mechanism to facilitate the reporting of issues ofnon-compliance in the supply chain.

Another important step was an industry-first partnership with Indonesian government-owned palm oil plantation company PT Perkebunan Nusantara (PTPN). The partnership is designed to support local mills and smallholder farmers to produce palm oil according to the NDPE standards that are key to multi-sector efforts to transform the palm oil industry.

PACKAGING WASTE

Packaging waste, particularly post-consumer plastic packaging waste in oceans and waterways, has never been higher on the global agenda than in 2018. Plastic packaging now sits alongside climate change as a major environmental challenge and is identified as a risk for Unilever’s business, see page 30.

Unilever has reduced the waste associated with the disposal of its products by 31% since 2010 (measured as impact per consumer use, towards a target of 50%) and is making strong progress in its own operations and product design. However, the challenge for post-consumer waste is in having the right infrastructure in place to ensure materials are collected and processed, while encouraging consumers to segregate and recycle them.

To support its specific, time-bound targets, at the beginning of 2018 Unilever introduced a new three-part framework designed to sharpen thinking on plastic packaging and innovation: i) Less Plastic means using lighter, stronger and better materials which have a lower environmental impact; ii) Better Plastic entails eliminating problematic materials and using recyclable plastics with a minimum 25% recycled content; iii) No Plastic involves using alternative materials, new packaging formats and alternative models of consumption such as vending – to help reduce use ofsingle-use plastics through innovation, behaviour change and new business models. See page 15 for more.

MCIP

Unilever’s Reward Framework includes the ManagementCo-investment Plan (MCIP), a long-term incentive plan that is linked to financial and USLP performance (see page 53). Corporate Responsibility Committee members shared their views on the context and progress of the USLP and sustainability initiatives with the Compensation Committee to help inform its recommendation on MCIP.

EVALUATION OF THE CORPORATE RESPONSIBILITY COMMITTEE

As part of the internal board evaluation carried out in 2018, the Boards evaluated the performance of the Committee. The Committee also carried out an assessment of its own performance in 2018. While overall the Committee members concluded that the Committee is performing effectively, the Committee has agreed to further enhance its effectiveness by keeping close track on progress on the ambitious Unilever Sustainable Living Plan. This will ensure the Group maintains its sustainability momentum and leadership.

COMMITTEE MEMBERS, MEMBERSHIP STATUS AND
ATTENDANCE

ATTENDANCE

Feike Sijbesma

Chair

5 / 5

Laura Cha

5 / 5

Marijn Dekkers

5 / 5
This table shows the membership of the Committee together with their attendance at meetings during 2017. If Directors are unable to attend a meeting, they have the opportunity beforehand to discuss any agenda items with the Committee Chair. Attendance is expressed as the number of meetings attended out of the number eligible to be attended.

HIGHLIGHTS OF 2017

•  Develop pipeline of potential (Non-Executive and Executive) Director candidates

•  Capability Mapping

•  Monitoring of Corporate Governance developments

PRIORITIES FOR 2018

•  Continued focus on development of a strong pipeline of potential Non-Executive and Executive Director candidates and managing succession

•  Follow up on actions agreed from the 2017 external Board evaluation

•  Continued focus on Board Diversity

ROLE AND MEMBERSHIP OF THE COMMITTEE

The Nominating and Corporate Governance Committee is responsible for evaluating the balance of skills, experience, independence, diversity and knowledge on the Boards and for drawing up selection criteria, ongoing succession planning and appointment procedures for both internal and external appointments. It also has oversight of all matters relating to corporate governance and brings any issues in this respect to the attention of the Boards.

The Committee’s terms of reference are set out in ‘The Governance of Unilever’ which can be found on our website atwww.unilever.com/corporategovernance. During the year, the Committee reviewed its own terms of reference to determine whether its responsibilities are properly described. The amended terms became effective on 1 January 2018.

The Committee is comprised of two Non-Executive Directors and the Chairman. The Group Secretary acts as secretary to the Committee. Other attendees at Committee meetings in 2017 (or part thereof) were the Chief Executive Officer and the Chief HR Officer.

In 2017 the Committee met five times. At the start of the year the Committee considered the results of the Committee’s annual self-evaluation for 2016 and its priorities for the year and used these to help create an annual plan for meetings for 2017.

APPOINTMENT AND REAPPOINTMENT OF DIRECTORS

Reappointment: All Directors (unless they are retiring) are nominated by the Boards for re-election at the AGMs each year on the recommendation of the Committee who, in deciding whether to nominate a Director, takes into consideration the outcomes of the Chairman’s discussions with each Director on individual performance, the evaluation of the Boards and its Committees and the continued good performance of individual Directors. Non-Executive Directors normally serve for a period of up to nine years. The average tenure of the Non-Executive Directors who have retired from the Boards over the past ten years has been seven years. The schedule the Committee uses for orderly succession planning of Non-Executive Directors can be found on our website at unilever.com/committees. Louise Fresco did not put herself forward for re-election at the AGMs in April 2017. She had served eight years on the Boards. The Committee proposed the reappointment of all other Directors and the Directors were appointed by shareholders by a simple majority vote at the AGMs.

The Committee also recommends to the Boards candidates for election as Chairman and Vice-Chairman and Senior Independent Director. After being reappointed as Non-Executive Directors at the 2017 AGMs, Ann Fudge remained the Vice-Chairman and Senior Independent Director and John Rishton, Ann Fudge and Feike Sijbesma respectively remained Chairs of the Audit Committee, Compensation Committee and Nominating and Corporate Governance Committee. Strive Masiyiwa became Chair of the Corporate Responsibility Committee in April 2017.

Director Succession Planning and Appointment: In consultation with the Committee, the Boards review the adequacy of succession planning processes and the actual succession planning at Board level. In 2017 no new Non-Executive Directors were nominated by the Boards for appointment at the AGMs.

When recruiting, the Committee will take into account the profile of Unilever’s Boards of Directors set out in ‘The Governance of Unilever’ which is in line with the recommendations of applicable governance regulations and best practice. Pursuant to the profile the Boards should comprise a majority of Non-Executive Directors who are independent of Unilever, free from any conflicts of interest and able to allocate sufficient time to carry out their responsibilities effectively. With respect to composition and capabilities, the Boards should be in keeping with the size of Unilever, its strategy, portfolio, consumer base, culture, geographical spread and its status as a listed company and have sufficient understanding of the markets and business where Unilever is active in order to understand the key trends and developments relevant for Unilever. The objective pursued by the Boards is to have a variety of nationality, race, gender, ethnicity and relevant skills and expertise. It is important that the Boards have sufficient global experience and outlook, and financial literacy. As discussed later in this Report, Unilever currently has diverse Boards in terms of gender and nationality and, as can be seen from the subset of the mapping that this Committee has done of the current Non-Executive Directors’ skills and capabilities on page 3, composition and capabilities in line with our Board profile described above.

Unilever Leadership Executive (ULE) Succession Planning and Appointment: In consultation with the Committee, the Boards review the adequacy of succession planning processes and the actual succession planning at ULE level. In 2017 the Boards were consulted by the Chief Executive Officer upon the selection criteria and appointment procedures for senior management changes, including the changes to the ULE that took effect at the start of 2018.

Annual Report on Form 20-F 2017Governance Report45


REPORT OF THE NOMINATING AND

CORPORATE GOVERNANCE COMMITTEECONTINUED

DIVERSITY POLICY

Unilever has long understood the importance of diversity within our workforce because of the wide range of consumers we connect with globally. This goes right through our organisation, starting with the Boards. Unilever’s Board Diversity Policy, which is reviewed by the Committee each year, is reflected on our website atwww.unilever.com/boardsofunilever. The Boards feel that, whilst gender and ethnicity are an important part of diversity, Unilever Directors will continue to be selected on the basis of their wide-ranging experience, backgrounds, skills, knowledge and insight.

In 2017 the Committee also reviewed and considered relevant recommendations on diversity and remains pleased that over a third of our Non-Executive Directors are women and that there are eight nationalities represented on the Boards.

CORPORATE GOVERNANCE DEVELOPMENTS

The Committee reviews relevant proposed legislation and changes to relevant corporate governance codes at least twice a year. It carefully considers whether and how the proposed laws/rules would impact upon Unilever and whether Unilever should participate in consultations on the proposed changes. For example, during 2017, developments and learnings from the first year of the Market Abuse Regulation were discussed by the Committee and the new Dutch Corporate Governance Code and Boardroom diversity were considered by the Committee.

EVALUATION

As part of the Board evaluation carried out in 2017, the Boards evaluated the performance of the Committee. The Committee also carried out an assessment of its own composition and performance in 2017. The Committee members concluded that the Committee is performing effectively.

Feike Sijbesma

3/4

ChairThis table shows the membership of the Nominating and Corporate

Governance Committee

Laura Cha

Marijn Dekkers

46Governance ReportAnnual Report on Form 20-F 2017


DIRECTORS’ REMUNERATION REPORT

COMMITTEE MEMBERS AND ATTENDANCE

ATTENDANCE

Ann Fudge

Chair

6 / 6

Vittorio Colao

6 / 6

Marijn Dekkers

6 / 6

Mary Ma(Member since April 2017)

3 / 3

Strive Masiyiwa(Member until April 2017)

3 / 3

This table shows the membership of the Committee together with their attendance at meetings during 2017. together with their attendance at meetings during 2018. If Directors are unable to attend a meeting, they have the opportunity beforehand to discuss any agenda items with the Committee Chair. Attendance is expressed as the number of meetings attended out of the number eligible to be attended.

LETTER FROM THE CHAIR

DEAR SHAREHOLDERS,

I am pleased to present Unilever’s 2017 Directors’ Remuneration Report. Outlined below is our performance and the decisions we have made on remuneration.

BUSINESS PERFORMANCE AND REMUNERATION OUTCOMES FOR 2017

ANNUAL BONUS: GOOD ALL-ROUND PERFORMANCE WITH ACCELERATED VALUE CREATION

Unilever has delivered a strong set of results in 2017 with competitive growth and substantially increased margin, earnings and cash-flow once more. Unilever is on track towards its 2020 goals of growing both top line ahead of markets and solid margin expansion. This reflects the strong focus on the core portfolio and profitability, accelerated portfolio transition with acquisitions and disposals, and a streamlined, more focused organization. These results demonstrate the proven multi-stakeholder model of long-term compounding growth and sustainable value creation. The Compensation Committee aligned earnings per share and operating margin measures within the annual bonus and long-term incentive plans with the change in reporting of performance measures as announced in July 2017. These measures are therefore assessed on an underlying basis (ie Underlying Earnings per Share (UEPS) and Underlying Operating Margin (UOM) within the relevant periods for 2015, 2016, and 2017 GSIP and MCIP awards); for further details, please see page 67 below. The Committee believes that on an underlying basis the stretch within the respective Earnings per Share and Operating Margin measures is as demanding or more than originally set.

Despite market conditions remaining challenging in 2017, underlying sales grew 3.1% (3.5% excluding Spreads)1, with growth in all our categories (except for Spreads, which we are in the process of divesting). Underlying operating margin improvement of +110 basis points reflects strong savings delivery, despite a volatile commodities market and significant currency headwinds. For the annual bonus calculations, free cash flow (FCF) is calculated on a constant basis at6.1 billion (equivalent to the6.0 billion at current rates). For incentive outcomes FCF is adjusted to exclude the one-off pension funding contribution of0.6 billion. Nonetheless, even if this pension contribution had been included, the incentive outcome would have been the same, with performance above the top of the range. The cash outcome was fueled by the significant underlying operating margin improvement, drive for efficiency in capital expenditure and disciplined control of working capital.

1These amounts do not include any Q4 price growth in Venezuela; for further details see pages 23 and 24.

HIGHLIGHTS OF 2017

•  Review and adaptation of Unilever’s new Reward Framework for our Executive Directors, with an emphasis on alignment with strategy and long-term value creation, personal investment in Unilever shares, and simplified variable pay with safeguards to prevent high levels of pay not justified by performance.

•  Constructive engagement with shareholders and shareholder representative bodies during the year in advance of the implementation of this new Reward Framework for our Executive Directors.

•  Ongoing review of our ‘Fair Compensation Framework’, with a particular emphasis on gender pay gap analysis and related reporting requirements, to ensure that Unilever pays all our people fairly and with responsibility, respect and integrity.

This resulted in a calculated pay-out for the 2017 bonus of 122%, which was endorsed by the Compensation Committee as representing a balanced assessment of the underlying performance of the business. Following application of personal performance multipliers and application of the maximum bonus limits under the Remuneration Policy, an annual bonus of 200% of salary was awarded for the CEO and an annual bonus of 150% of salary for the CFO.

GLOBAL SHARE INCENTIVE PLAN (GSIP) AND MANAGEMENT CO-INVESTMENT PLAN (MCIP): SUSTAINED PERFORMANCE DELIVERY

Over the past three years, Unilever has delivered consistent financial performance. During this period, underlying sales growth was 3.6% per annum, and margin improvement was an average of +63 basis points per year; Unilever also generated strong operating cash flow, with cumulative operating cash flow of19.1 billion. Unilever finished 4th in the peer group for total shareholder return (TSR) over this three-year period. On the basis of this performance, the Committee determined that the GSIP and MCIP awards to the end of 2017 will vest at 148% of initial target award levels (ie 74% of maximum for GSIP, and 99% of maximum for MCIP (which is capped at 150% for the Executive Directors)).

NEW REWARD FRAMEWORK

As you know, last year the Compensation Committee undertook a comprehensive review of our Reward Framework across Unilever, consulting extensively with our shareholders. As described in the 2016 Directors’ Remuneration Report, the review resulted in a new Reward Framework, which was introduced this year below Board level to support Unilever’s long-term business strategy. With strong shareholder approval, some features of the new Reward Framework were implemented for Executive Directors in 2017, with full implementation deferred to 2018. This phased approach has enabled us to assess the new Reward Framework in practice and further consider the feedback from investors during last year’s consultation.

The implementation of the new Reward Framework for the ‘Top 500’ executives below Board level has been completed successfully. In 2018 we will extend the Framework to encompass Unilever’s top 3,000 managers. In the following paragraphs, we set out proposals to align the pay of our Executive Directors fully with the new Reward Framework in 2018.

GUIDING PRINCIPLES

Under the new Reward Framework, the Management Co-Investment Plan (MCIP) becomes the only long-term incentive. That means executives must continuously invest their annual bonus in Unilever shares through MCIP to maintain current levels of pay. This further strengthens long term executive commitment and continues to drive our executives to apply an owner’s mindset in everything they do.

Annual Report on Form 20-F 2017Governance Report47


DIRECTORS’ REMUNERATION REPORTCONTINUED

In applying this approach to Executive Directors, their pay is:

Simple – the compensation package comprises just three elements of fixed pay, annual bonus, and long-term incentive
Focused – distinct measures drive short- and long-term incentives
Longer-term – an extended performance horizon of five years
Driven by share ownership – executives have to invest in Unilever shares to receive any long-term incentive, and must maintain a significant personal shareholding, including after leaving Unilever
Restrained – to continue to receive the same amount of total pay as previously, Executive Directors must invest more in Unilever shares, and an additional test ensures that pay can only materially exceed the current maximum if truly justified by performance.

The Committee has aimed to maintain comparable levels of pay for the same performance while simplifying reward, extending the performance horizon and requiring even higher levels of personal investment in Unilever shares. The section ‘Implications of the new Reward Framework’ on pages 49 and 50 demonstrate how this has been achieved.

SUMMARY OF ELEMENTS

Element

Features

Fixed pay

Single consolidated fixed pay element, paid in cash

Annual bonus

Target 150% of Fixed Pay for CEO and 120% for CFO with multiplier of up to 1.5x at maximum based only on business performance (not personal performance)

MCIP

CEO and CFO can invest up to 67% of their gross annual bonus into Unilever shares which are matched based on performance over four years, with no match shares at threshold, 1.5x matching shares at Target performance and 3x match at Maximum

Cap

Any combined annual bonus and MCIP pay-out above 75% of the maximum is subject to a further test, which requires the Committee to review the quality and sustainability of performance, and allows them to reduce the award if appropriate. This means that total pay-for the CEO can only reach or exceed the previous maximum level for truly exceptional and sustainable performance.

Shareholding

5x fixed pay for the CEO and 4x for the CFO to be built up within five years of appointment. 100% of the requirement continues for a year after leaving, and 50% for two years.


A more detailed description

HIGHLIGHTS OF 2018

•  Competition and anti-bribery compliance

•  Third-party compliance

•  Product quality and safety

•  Unilever Sustainable Living Plan (USLP)

PRIORITIES FOR 2019

•  Compliance with Unilever policies on fair competition and anti-bribery and requirements for third parties

•  Product quality and safety

•  Unilever Sustainable Living Plan (USLP) including plastic packaging

ROLE OF THE COMMITTEE

The Corporate Responsibility Committee oversees Unilever’s conduct as a responsible global business. As the Unilever Sustainable Living Plan (USLP) is at the heart of Unilever’s vision to grow its business whilst decoupling its environmental footprint from its growth and increasing its positive social impact, the Committee tracks the progress and potential risks associated with the USLP.

The Committee is also charged with ensuring that Unilever’s reputation is protected and enhanced. Therefore a central element of its role is the need to identify any external developments that are likely to have an influence upon Unilever’s standing in society, and to ensure that appropriate and effective communications policies are in place to support the company’s reputation.

The Committee’s discussions are informed by the experience of the senior leaders invited to the Committee to share their views on a variety of topics and external trends. Many of these leaders are members of the Unilever Sustainable Living Plan Steering Team, the group of senior executives accountable for driving sustainable growth through Unilever’s brands and operations. These discussions ensure the Committee stays abreast of current and emerging trends and any potential risks arising from sustainability issues. This enables the Boards to draw on a well-rounded view of issues.

During 2018 the Committee reviewed its terms of reference and approved minor changes to the terms.

The Committee’s responsibilities are complemented by those of the Audit Committee, which is responsible for reviewing significant breaches of the Code of Business Principles as part of its remit to review risk management and for overseeing the independent assurance programme for the USLP.

The Committee’s terms of reference are set outwww.unilever.com/ corporategovernance and details of the USLP Steering Team atwww.unilever.com/sustainable-living/our-strategy/our-sustainability-governance/

MEMBERS OF THE COMMITTEE

The Corporate Responsibility Committee comprises threeNon-Executive Directors: Strive Masiyiwa (Chair), Feike Sijbesma and Youngme Moon. The Chief Marketing & Communications Officer and the Chief Sustainability Officer attend the Committee’s meetings. The Chief Business Integrity Officer also attends to present Unilever’s company report that covers cases under Unilever’s Code of Business Principles (the Code) as well as updates on third-party compliance, product quality and safety.

MEETINGS

Meetings are held quarterly and ad hoc as required – four were held in 2018. The Committee Chairman is responsible for reporting the findings from meeting to the Boards, thus ensuring that the Boards can fulfil their oversight responsibilities.

Following the Committee’s terms of reference and Unilever’s principal risks and priorities, the Committee’s agenda covers the Code and third-party compliance, alongside litigation, occupational and product safety, the USLP and corporate reputation as well as a range of strategic and current issues. In addition to the areas listed below, in 2018 the Committee also reviewed topics such as media communications, the process for integrating business acquisitions and progress on alternatives to animal testing.

CODE OF BUSINESS PRINCIPLES

The Code and associated Code Policies set out the standards of conduct expected of all Unilever employees in their business endeavours. Compliance with these is an essential element in ensuring Unilever’s continued business success and is identified as an ethical and legal and regulatory risk to Unilever.

While the Chief Executive Officer is responsible for implementing these principles, supported by the Global Code and Policy Committee, the Corporate Responsibility Committee is responsible for oversight of the Code and Code Policies, ensuring that they remain fit for purpose and are appropriately applied. It maintains close scrutiny of the mechanisms for implementing the Code and Code Policies. This is vital as compliance is essential to promote and protect Unilever’s values and standards, and hence the good reputation of the Group. At each meeting the Committee reviews an analysis of investigations intonon-compliance with the Code and Code Policies and is alerted to any trends arising from these investigations.

The Chief Legal Officer and Group Secretary reports to the Committee on litigation and regulatory matters which may have a reputational impact including environmental issues, bribery and corruption compliance and competition law compliance. The Committee studied how compliance was achieved during 2018. For further information please see notes 19 and 20 to the consolidated financial statements.

As another of its other priorities in 2018, the Committee also scrutinised the mechanisms for anti-bribery compliance. The primary mechanism is to understand the profiles of the markets Unilever operates in and to ensure that there are robust internal and third-party compliance programmes in place. These are complemented by training for all employees in tandem with advanced capacity building for those in the Business Integrity and Legal functions.

PRINCIPLES AND STANDARDS FOR THIRD PARTIES

The Committee retained its focus on third-party compliance in 2018. Extending Unilever’s values to third parties remains a priority, not only to generate continued responsible growth and a positive social impact on the industry, but to counter the significant risk thatnon-compliance by third parties can pose, particularly in the context of increasing regulation around the world.

The Committee tracks compliance with Unilever’s Responsible Sourcing Policy (RSP) for suppliers and its Responsible Business Partner Policy (RBPP) for customers and distributors. Together they set out Unilever’s requirements that third parties conduct business with integrity, openness and respect for universal human rights and core labour principles. Sourcing 100% of Unilever’s procurement spend in line with the RSP is also a target within the USLP.

The policies enable Unilever to evaluate risk and provide the right measures to address the diversity of market conditions in which it operates and the range of third parties it works with. The Committee was briefed on progress. For the RSP, this detailed the number of suppliers making a positive commitment to the policy, greater alignment on industry standards via the process of mutual recognition and a substantial increase in site audits and resulting corrective action plans. Enhanced anti-bribery and corruption screening was also put in place. The training and enhancements developed for the RBPP include new IT tools launched in over 180 countries, simpler assessment processes, enhanced due diligence and risk mitigation plans.

46Governance ReportAnnual Report on Form 20-F 2018


SAFETY

Sustainable growth is only achieved if Unilever also grows responsibly – by providing safe, high quality products, and protecting employees and the people and communities in which it operates. Safe and high quality products are one of Unilever’s principal risks, see page 31.

Occupational safety continues to be the personal and everyday responsibility of all those working at Unilever. Reducing Unilever’s Total Recordable Frequency Rate (TRFR) is also a target within the USLP. In 2018 TRFR continued to decrease – from 0.89 accidents per 1 million hours worked in 2017 to 0.69 in 2018 (measured 1 October 2017 to 30 September 2018).

In factories, Unilever’s World Class Manufacturing programme hardwires safety into all aspects of the production process – by enabling good design principles, engineering and operating practices to be applied from the start of any project. This focus drove a reduction of 39.5% in process safety incidents in 2018. Capacity building and leadership also improved safety for contractors (those who work on Unilever sites under the direct supervision of their own management), reducing their recordable injuries by half 51% over 2014-2018 (measured by Lost-Time Injuries Frequency Rate, LTIFR).

Unilever’s approach to product safety is based on risk identification and mitigation. This approach covers all aspects of the value chain – from development, sourcing, manufacture and transport to consumer use and disposal of the product – and is centred on the application of rigorous standards based on sound science and the principle of Safe by Design and Safe in Execution. Thanks to a strong focus on product quality, a significant improvement was achieved in 2018 with potentially serious marketplace incidents reduced by 40%. Over 2017-2018, potentially serious marketplace incidents originating in manufacturing have been reduced by 88% and those originating in suppliers of raw and packing materials have been halved.

HUMAN RIGHTS

By addressing strategic human rights issues and helping the business tackle and prevent endemic abuses in global value chains, Unilever is seeking to deliver a positive social impact alongside business growth.

Unilever’s human rights aims are part of the Enhancing Livelihoods goal of the USLP and human rights are included within the company’s sustainability and ethical risks. See pages 29 and 33.

In 2018 Unilever continued to embed human rights with a focus on its eight salient issues (ie those at risk of the most severe negative impact through Unilever’s activities or business relationships). These are set out in Unilever’s Human Rights Report 2017, with an update on further progress at the end of 2018. The Committee noted that Unilever’s approach to this work is sophisticated and that while there is still much to do, it is making good progress in this complex field. See page 14 for more.

PALM OIL

Palm oil is one of Unilever’s most significant raw materials and Unilever is one of the world’s major buyers of palm oil. Alongside sustainability and supply chain, Unilever has identified climate change as one of its principal risks (see page [29]) and is committed to eliminating the deforestation associated with unsustainable palm oil production. Securing supplies of sustainable palm oil is therefore a critical element in Unilever’s business and climate strategy and represents a significant target in the USLP.

The Committee was briefed on plans for driving transformational change in the palm oil sector. Unilever’s Sustainable Palm Oil Sourcing Policy has a focus on the implementation of No Deforestation, No Peat, No Exploitation of people or communities (NDPE) commitments by 2020. However, implementation and enforcement remain challenging. To support the transformation of the sector and the implementation of its Policy, Unilever is investing in multiple initiatives. One example is the &Green Fund which is designed to kick-start investments in deforestation-free agriculture in countries that are working to reduce deforestation and peat degradation. Unilever was announced as the first investor. The Fund aims to protect over 5 million hectares of forest and peatlands by 2020, byde-risking private capital investments into large-scale deforestation-free production, protection and inclusion initiatives. With an aim to trigger $1.6 billion in private capital investments, the Fund is an opportunity to jointly shape solutions to mitigate deforestation and a good illustration of the collaborative, transformational approaches the company is seeking to scale.

To promote transparency and traceability of palm oil sourcing, in 2018 Unilever was also the first consumer goods company to publish the names of its suppliers and a map of the 1,400 palm oil mills in its extended supply chain on its website. This was accompanied by a more visible grievance mechanism to facilitate the reporting of issues ofnon-compliance in the supply chain.

Another important step was an industry-first partnership with Indonesian government-owned palm oil plantation company PT Perkebunan Nusantara (PTPN). The partnership is designed to support local mills and smallholder farmers to produce palm oil according to the NDPE standards that are key to multi-sector efforts to transform the palm oil industry.

PACKAGING WASTE

Packaging waste, particularly post-consumer plastic packaging waste in oceans and waterways, has never been higher on the global agenda than in 2018. Plastic packaging now sits alongside climate change as a major environmental challenge and is identified as a risk for Unilever’s business, see page 30.

Unilever has reduced the waste associated with the disposal of its products by 31% since 2010 (measured as impact per consumer use, towards a target of 50%) and is making strong progress in its own operations and product design. However, the challenge for post-consumer waste is in having the right infrastructure in place to ensure materials are collected and processed, while encouraging consumers to segregate and recycle them.

To support its specific, time-bound targets, at the beginning of 2018 Unilever introduced a new three-part framework designed to sharpen thinking on plastic packaging and innovation: i) Less Plastic means using lighter, stronger and better materials which have a lower environmental impact; ii) Better Plastic entails eliminating problematic materials and using recyclable plastics with a minimum 25% recycled content; iii) No Plastic involves using alternative materials, new packaging formats and alternative models of consumption such as vending – to help reduce use ofsingle-use plastics through innovation, behaviour change and new business models. See page 15 for more.

MCIP

Unilever’s Reward Framework includes the ManagementCo-investment Plan (MCIP), a long-term incentive plan that is linked to financial and USLP performance (see page 53). Corporate Responsibility Committee members shared their views on the context and progress of the USLP and sustainability initiatives with the Compensation Committee to help inform its recommendation on MCIP.

EVALUATION OF THE CORPORATE RESPONSIBILITY COMMITTEE

As part of the internal board evaluation carried out in 2018, the Boards evaluated the performance of the Committee. The Committee also carried out an assessment of its own performance in 2018. While overall the Committee members concluded that the Committee is performing effectively, the Committee has agreed to further enhance its effectiveness by keeping close track on progress on the ambitious Unilever Sustainable Living Plan. This will ensure the Group maintains its sustainability momentum and leadership.

Strive Masiyiwa

Chair of the Corporate Responsibility Committee

Youngme Moon

Feike Sijbesma

Further details on the USLP will be set out in Unilever’s online Sustainable Living Report 2018, to be published in April 2019.

Annual Report on Form 20-F 2018Governance Report47


REPORT OF THE NOMINATING AND

CORPORATE GOVERNANCE COMMITTEE

COMMITTEE MEMBERS, MEMBERSHIP STATUS
AND ATTENDANCE

ATTENDANCE

Marijn DekkersChair

5/5

Laura Cha

5/5

Feike Sijbesma(Chair until May 2018)

5/5

This table shows the membership of the elementsCommittee together with their attendance at meetings during 2018. If Directors are unable to attend a meeting, they have the opportunity beforehand to discuss any agenda items with the Committee Chair. Attendance is expressed as the number of meetings attended out of the new Reward Frameworknumber eligible to be attended.

HIGHLIGHTS OF 2018

•  Continued focus on development of a strong pipeline of potentialNon-Executive and Executive Director candidates and managing succession

•  CEO succession

•  Follow up on actions agreed from the 2017 external Board evaluation

•  Continued focus on Board Diversity

PRIORITIES FOR 2019

•  Continued focus on development of a comparisonstrong pipeline of potentialNon-Executive and Executive Director candidates and managing succession, with focus on Board Diversity

•  Follow up on actions agreed from the 2018 external Board evaluation

•  Continued focus on Corporate Governance

ROLE AND MEMBERSHIP OF THE COMMITTEE

The Nominating and Corporate Governance Committee is responsible for evaluating the balance of skills, experience, independence, diversity and knowledge on the Boards and for drawing up selection criteria, ongoing succession planning and appointment procedures for both internal and external appointments. It also has oversight of all matters relating to corporate governance and brings any issues in this respect to the attention of the Boards.

The Committee’s terms of reference are set out in ‘The Governance of Unilever’ which can be found on our website atwww.unilever.com/corporategovernance. During the year, the Committee reviewed its own terms of reference to determine whether its responsibilities are properly described. The amended terms became effective on 1 January 2019.

The Committee is comprised of twoNon-Executive Directors and the Chairman. The Group Secretary acts as secretary to the Committee. Other attendees at Committee meetings in 2018 (or part thereof) were the Chief Executive Officer and the Chief HR Officer.

In 2018 the Committee met five times. At the start of the year the Committee considered the results of the Committee’s annual self-evaluation for 2017 and its priorities for the year and used these to help create an annual plan for meetings for 2018.

APPOINTMENT AND REAPPOINTMENT OF DIRECTORS AND ULE

Reappointment: All Directors (unless they are retiring) are nominated by the Boards forre-election at the AGMs each year on the recommendation of the Committee who, in deciding whether to nominate a Director, take into consideration the outcomes of the Chairman’s discussions with each Director on individual performance, the evaluation of the Boards and its Committees and the continued good performance of individual Directors.Non-Executive Directors normally serve for a period of up to nine years. The average tenure of theNon-Executive Directors who have retired from the Boards over the past ten years has been seven years. The schedule the Committee uses for orderly succession planning ofNon-Executive Directors can be found on our website at unilever.com/committees. Ann Fudge did not put herself forward forre-election at the AGMs in May 2018. She had served nine years on the Boards. The Committee proposed the reappointment of all other Directors and the Directors were appointed by shareholders by a simple majority vote at the AGMs.

The Committee also recommends to the Boards candidates for election as Chairman and Senior Independent Director/Vice-Chairman. After being reappointed asNon-Executive Directors at the 2018 AGMs, Youngme Moon became the Senior Independent Director/Vice-Chairman and John Rishton and Strive Masiyiwa remained Chairs of the Audit Committee and the Corporate Responsibility Committee respectively. Vittorio Colao became Chair of the Compensation Committee and Marijn Dekkers became Chair of the Nominating and Corporate Governance Committee.

Succession Planning and Appointment: In consultation with the Committee, the Boards review the adequacy of succession planning processes and the actual succession planning at Board level.

When recruiting, the Committee will take into account the profile of Unilever’s Boards of Directors set out in ‘The Governance of Unilever’ which is in line with the recommendations of applicable governance regulations and best practice. Pursuant to the profile the Boards should comprise a majority ofNon-Executive Directors who are independent of Unilever, free from any conflicts of interest and able to allocate sufficient time to carry out their responsibilities effectively. With respect to composition and capabilities, the Boards should be in keeping with the size of Unilever, its strategy, portfolio, consumer base, culture, geographical spread and its status as a listed company and have sufficient understanding of the markets and business where Unilever is active in order to understand the key trends and developments relevant for Unilever. The objective pursued by the Boards is to have a variety of nationality, race, gender, ethnicity and relevant skills and expertise. It is important that the Boards have sufficient global experience and outlook, and financial literacy. As discussed later in this Report, Unilever currently has diverse Boards in terms of gender and nationality and, as can be seen from the subset ofthe mapping that this Committee has done of the currentNon-Executive Directors’ skills and capabilities on page 3, composition and capabilities in line with our Board profile described above.

2018 appointments: The Committee recommended to the Boards to nominate Andrea Jung as a newNon-Executive Director at the 2018 AGMs taking into account the views of Egon Zehnder. In May 2018 the AGMs resolved to appoint Andrea Jung with immediate effect. She has further strengthened the Boards in the areas of consumer/FMCG insights, sales & marketing and leadership of global entities.

Upon Paul Polman’s notice of retirement as CEO and Executive Director effective 31 December 2018, the Committee recommended to appoint Alan Jope as his successor. In forming its recommendation, the Committee had reviewed the selection criteria which had been developed as part of succession planning and the extensive slate of potential candidates and their respective capabilities by reference to those criteria. Considering Alan Jope’s skills set, depth of understanding and experience of Unilever and the sector and markets in which the Group operates, as well as his track record of delivering high quality performance, the Committee recommended that Alan Jope be nominated by the Boards as the new CEO effective 1 January 2019, which appointment was approved by the Board of Directors in November 2018. Alan Jope will be proposed to be appointed as Executive Director at the AGMs in May 2019.

48Governance ReportAnnual Report on Form 20-F 2018


Unilever Leadership Executive (ULE) Succession Planning and Appointment: In consultation with the Committee, the Boards review the adequacy of succession planning processes and the actual succession planning at ULE level. In 2018 the Boards were consulted by the Chief Executive Officer upon the selection criteria and appointment procedures for senior management changes.

DIVERSITY POLICY

Unilever has long understood the importance of diversity within our workforce because of the wide range of consumers we connect with globally. This goes right through our organisation, starting with the Boards. Unilever’s Board Diversity Policy, which is reviewed by the Committee each year, is reflected on our website atwww.unilever.com/boardsofunilever. The Boards feel that, while gender and ethnicity are an important part of diversity, Unilever Directors will continue to be selected on the basis of their wide-ranging experience, backgrounds, skills, knowledge and insight.

In 2018 the Committee also reviewed and considered relevant recommendations on diversity and remains pleased that 45% of ourNon-Executive Directors are women and that there are nine nationalities represented on the Boards.

CORPORATE GOVERNANCE DEVELOPMENTS

The Committee reviews relevant proposed legislation and changes to relevant corporate governance codes at least twice a year. It carefully considers whether and how the proposed laws/rules would impact upon Unilever and whether Unilever should participate in consultations on the proposed changes. For example, during 2018, developments of the Dutch and the UK Corporate Governance Codes, the EU Shareholders Rights Directive and Boardroom diversity were discussed by the Committee.

EVALUATION

As part of the Board evaluation carried out in 2018, the Boards evaluated the performance of the Committee. The Committee also carried out an assessment of its own composition and performance in 2018. The Committee members concluded that the Committee is performing effectively.

Marijn Dekkers

Chair of the Nominating and Corporate

Governance Committee

Laura Cha

Feike Sijbesma

Annual Report on Form 20-F 2018Governance Report49


DIRECTORS’ REMUNERATION REPORT

COMPENSATION COMMITTEE

MEMBERS AND ATTENDANCE

ATTENDANCE

Vittorio ColaoChair (since May 2018)

5/5

Marijn Dekkers

5/5

Mary Ma

5/5

Andrea Jung(Member since May 2018)

2/2

Ann Fudge(Member and Chair until May 2018)

3/3

This table shows the membership of the Committee together with their attendance at meetings during 2018. If Directors are unable to attend a meeting, they have the opportunity beforehand to discuss any agenda items with the current packageCommittee Chair. Attendance is provided on page 51.

CONVERSION TO DELIVERING PAY IN EUROS

Last year we explained to investors that we intend to convertexpressed as the paynumber of Executive Directors to euros.

From 2018 Executive Directors’ pay will be denominated in euros (using the average exchange rate as per our 2016 Annual Report and Accounts: euro 1 = GBP 0.8152). This aligns the Executive Directors to the restmeetings attended out of the senior leadership ‘Top 100’ team whose pay is already denominated in euros. The illustrative valuesnumber eligible to be attended.

LETTER FROM THE CHAIR

DEAR SHAREHOLDERS,

As the new Compensation Committee Chair, I am pleased to present Unilever’s Directors’ Remuneration Report (DRR) 2018. In the sections below, I set out the Committee’s activities in 2018, including remuneration outcomes for 2018 and describe our Executive Director changes. I also reflect on the feedback we received on our new Remuneration Policy which was approved at the 2018 AGMs and detail our remuneration decisions for 2019.

BUSINESS PERFORMANCE AND REMUNERATION OUTCOMES FOR 2018

ANNUAL BONUS

In determining the Underlying Sales Growth (USG) target for the annual bonus plan we assumed a full year of Argentinian price growth. Due to the application of IAS 29 hyperinflationary accounting from 1 July and the consequent removal of Argentinian pricing in our reported USG of 2.9%, we have included the Argentinian pricing to give a sales growth of 3.4% for the bonus calculation. Underlying Operating Margin (UOM) improved by 90bps to 18.4% driven by 50bps gross margin improvement and 30 bps of overheads reduction reflecting both the impact of our innovations and ongoing savings programmes. In 2018 we delivered over2 billion of savings. In determining the Free Cash Flow (FCF) target for the annual bonus plan we assumed that Unilever would retain the working capital balances related to the Spreads business at closing. However as part of the deal we received payment for the working capital, thus the reported FCF of5.0 billion was adjusted to5.6 billion for the bonus calculation to both include the cash tax on disposals (0.2 billion) per the definition and cash received (0.4 billion) in respect of the transfer of working capital to KKR at closing.

These results are solid, demonstrating Unilever’s ability to continue to grow profitably and keep generating value in challenging market conditions. Performance against 2018 targets resulted in an outcome for the 2018 annual bonus of 76% of target. Accordingly, having assessed the quality of results and satisfied itself that this outcome reflected the underlying performance of the business in 2018, the Committee confirmed a bonus of 76% of target opportunity (114% of Fixed Pay against a target of 150%) for the former CEO, Paul Polman, and of 76% of target opportunity (91% of Fixed Pay against a target of 120%) for the CFO, Graeme Pitkethly, as detailed on page 55.

GLOBAL SHARE INCENTIVE PLAN (GSIP) AND MANAGEMENTCO-INVESTMENT PLAN (MCIP)

Unilever has delivered consistent top and bottom line growth with USG at an average of 3.4% over the past three years, and margin improvement at an average of +83 basis points. Unilever also generated strong cumulative operating cash flow of19.1 billion and finished 5th out of 19 in our peer group for total shareholder return (TSR). This performance against 2016-2018 targets resulted in an outcome for GSIP and MCIP of 132%. Having confirmed that this outcome reflected the underlying performance of the business over

HIGHLIGHTS OF 2018

•  Review and adaptation of the proposed Reward Framework are shown below in sterling for ease of comparison with the current arrangements.

DISCRETION

To ensure that the outcome of formulaic incentive plans fairly reflects the underlying performance of the business, the Committee already has the discretion to adjust the formulaic outcome of the annual bonus by up to plus or minus 25% to reflect its assessment of the underlying performance of the business. We now introduce the same for the new MCIP by up to plus or minus 10%. Any such adjustment would be explained in full in the Directors’ Remuneration Report (DRR) and cannot result in an outcome greater than the plan maximum.

Summary of the Committee’s track record of discretion for annual bonus over the last five years


Year   

Formula Outcome


Actual

Decision


Adjustment based on Quality of Results


2012   183 140  Reduction of 43 points
2013   103 95  Reduction of 8 points
2014   68 80  Increase of 12 points
2015   118 110  Reduction of 8 points
2016   121 110  Reduction of 11 points

In addition, any combined pay-out from annual bonus and MCIP above 75% of the maximum opportunity will be subject to a further sustainability test by the Committee, described on page 50.

TRANSITION TO THE NEW REWARD FRAMEWORK

Subject to shareholder approval of our new Remuneration Policy at the 2018 AGMs, we will transition to theUnilever’s new Reward Framework for Executive Directors through the following steps:

final GSIP grant in February 2018 to maintain total value of remuneration during transition, after which GSIP awards will be discontinued;
moving to the revised level of Fixed Pay with effect from May 2018, following the 2018 AGMs;
investment of up to 67% of 2017 annual bonus (based on the previous lower bonus opportunity) in the four-year MCIP in May 2018 following the AGMs, and vesting in February 2022 on the new 1 for 1.5 matching basis at target; and
2018 annual bonus awarded under the new Remuneration Policy and invested into the MCIP in 2019, vesting in 2023, subject to an additional one-year retention period before vested shares can be sold.

These proposals, and their implications in terms of pay outcomes for Executive Directors, are set out in more detail on pages 49 to 52 below, and in the Annual Remuneration Report on pages 63 and 64.

FRAMEWORK FOR FAIR COMPENSATION

The Committee is aware of and takes into consideration reward conditions elsewhere in the Group. We are also aware of the developing regulatory environment on executive pay in the UK, Europe and the US, and will continue to monitor this over the coming year so that we can respond to new requirements and best practice. We have already taken a leading position in this area, with Board oversight of wider pay and conditions being reflected through the ULSP. We are proud of the Framework for Fair Compensation introduced by Unilever in December 2015 as part of ULSP:

LOGO

www.unilever.com/sustainable-living/the-sustainable-living-plan/enhancing-livelihoods/fairness-in-the-workplace/fair-compensation/

Through this framework, Unilever has announced the target to achieve living wage compliance for all our employees globally by 2020. In line with the new Dutch Corporate Governance Code we are disclosing pay ratios for both our Executive Directors, relativewith an emphasis on alignment with strategy and long-term value creation, personal investment in Unilever shares, and simplified variable pay with safeguards to the UK and Dutch management populations.prevent high levels of pay not justified by performance.

Following extensive discussions

•  Constructive engagement with key shareholders and shareholder representative bodies during the Committee recommends these proposedyear both before and after the implementation of this new Reward Framework for our Executive Directors.

•  Executive Director changes, for your approvalwith the announcement of Paul Polman’s retirement and his replacement by Alan Jope as CEO.

the plan duration, the Committee confirmed a vesting ratio of 132% (corresponding to 66% of maximum for GSIP and 88% of maximum for MCIP, which is capped at 150% for the Executive Directors), as detailed on page 56.

The Committee did not apply any discretionary adjustments to annual bonus or GSIP/MCIP outcomes.

EXECUTIVE DIRECTOR CHANGES

Paul Polman stepped down from the role of CEO and Executive Director on 31 December 2018 and will retire from employment on 2 July 2019. He will continue to be paid in line with our Remuneration Policy during this period. Paul was awarded a bonus for 2018, and his GSIP and MCIP 2016-2018 awards vested on 11 February 2019, as set out below. His other inflight long-term incentive awards will vest on their normal timeframe based on Unilever’s performance and will bepro-rated to his retirement date. No new incentive awards (neither bonus nor MCIP) will be made to Paul Polman. Further details are set out on page 60.

Alan Jope has been appointed CEO effective 1 January 2019 and will be proposed for election as Executive Director to the Boards at the AGMs in May 2019. Alan Jope’s Fixed Pay for his role as CEO has been set at1,450,000, with annual bonus and MCIP opportunity in line with our Remuneration Policy. Further details of Alan Jope’s remuneration package are set out on page 52.

UNILEVER’S REMUNERATION POLICY

Unilever’s Remuneration Policy is based on simplicity and transparency with just three elements: Fixed Pay, annual bonus and the MCIP through which executives must invest their bonus (after having paid tax) in Unilever shares to receive match shares that may vest based on Unilever’s performance over the following four years.

The Policy was approved at our May 2018 AGMs with a significant minority voting against. Through the year we undertook extensive consultation with our shareholders and their representative bodies to ensure we fully understood the concerns that some investors had with our Policy.

I was very encouraged that most shareholders appreciated the direction our Remuneration Policy is taking in terms of simplification, increased share ownership commitment and lengthened timeframes for performance measurement. However, the extent of the changes we made over the previous two years clearly led to an impression of complexity, which we underestimated.

The Committee carefully considered all of the feedback received, both negative and positive. I summarise below the principal issues together with the Committee’s decisions, highlighting where we have made changes to the implementation of the Remuneration Policy to reflect shareholders’ feedback and where we concluded that the Policy supports the achievement of Unilever’s strategy and shareholders’ interests.

Increase of 2018 fixed pay, annual bonus and maximum pay opportunity of former CEO Paul Polman:

This concern was largely addressed by Paul’s decision not to accept the proposed 5% increase in Fixed Pay. Alan Jope has been appointed CEO at a Fixed Pay level 14% lower than Paul’s previous rate.

50Governance ReportAnnual Report on Form 20-F 2018


LOGO

www.unilever.com/investor-relations/agm-and-corporate-
governance/ (Statement on Remuneration Policy)

In addition, the Committee retains the additional safeguard outlined in the 2017 DRR: if the result of combined annual bonus and MCIP performance outcomes exceeds 75% of the maximum total opportunity (excluding the effects of share price change and dividends on share awards) the Committee will review rigorously the quality and sustainability of underlying performance and then may apply its discretion to reduce or cap the MCIP performance outcome applicable to the Executive Directors. For Alan Jope, this ‘handbrake test’ consequently would apply when his total pay level reaches approximately8.8m (a level more than 20% below Paul Polman’s previous maximum pay opportunity), as indicated in the CEO Pay Comparison table below.

The Committee has decided to apply no increases to Executive Directors’ Fixed Pay levels for 2019. It is the Committee’s intention to review remuneration levels and award Fixed Pay increases in future years subject to the development and performance of the Executive Directors in their role.

CEO Pay Comparison table:

   CEO Target Total Pay €m p.a.   
    

Alan

Jope


Paul

Polman


Paul Polman  

    Previous Policy  


Fixed Pay

   1.450    1.689    1.689   

Annual Bonus

   2.175    2.534    1.487   

MCIP* Match Share Award

   2.175    2.534    0.892   

GSIP Share Award

             2.478   

Total

   5.800          6.757                6.546   

Personal MCIP* Investment

in Unilever shares

   1.450    1.689    0.892   
       CEO Maximum Total Pay €m p.a.       
    

Alan

Jope


Paul

Polman


Paul Polman  

    Previous Policy  


Fixed Pay

   1.450    1.689    1.689   

Annual Bonus

   3.263    3.801    2.478   

MCIP* Match Share Award

   6.525    7.602    2.230   

GSIP Share Award

             4.956   

Total

   11.238    13.092    11.353   
Personal MCIP* Investment in Unilever shares   2.175    2.534    1.652   

75% Safeguard Test

(‘Handbrake’)

   8.791          10.241      

*

MCIP at the 2018 AGMs.maximum investment

Consolidation of pension and allowances into a single Fixed Pay number: The consolidation of all fixed pay elements into one single number provides simplicity and transparency and since 2017 applies across the Unilever Leadership Executive (ULE) and our ‘Top 100’ managers. We continue to position Fixed Pay levels for our Executive Directors conservatively against our peer group. The Committee will therefore continue with the consolidated Fixed Pay approach.

Mandatory minimum threshold of 33% of bonus investment into MCIP: In response to feedback received, the Committee will reintroduce a requirement for members of the ULE, including CEO and CFO to invest at least 33% of their bonus in Unilever shares through MCIP.

Sustainability Progress Index assessment: Many investors wanted to know how we will assess our progress on sustainability, which was introduced as a performance measure for MCIP from 2017. The Committee will provide an annual progress report in the DRR providing transparency on the assessment of the Sustainability Progress Index, based on a joint assessment conducted with the Corporate Responsibility Committee. On page 53 we report the update for 2017 and 2018 performance.
Buy-out awards for Executive Directors: The Committee’s intention in normal circumstances is to use only transition awards when hiring executive directors from outside Unilever to replace awards forgone. The Committee intends to state this position formally in the Remuneration Policy when it is next renewed.

Overall, the Committee has concluded that the Remuneration Policy supports the reshaping of our business and acceleration of our transformation as we move towards achieving our strategic 2020 objectives. In implementing the Policy, the Committee will continue to seek investors’ feedback and review any concerns. We will ensure that the Policy continues to provide strong and clear links between Unilever’s business strategy, shareholders’ interests and executives’ incentives.

During the coming year, the Committee will continue to monitor developments in remuneration policy and prevailing market practice, including the implementation of the changes to the UK Corporate Governance Code and remuneration reporting regulations. We value a continuing dialogue with institutional investors, employees and other stakeholders to make sure that our Remuneration Policy remains fit for purpose and aligned to support the delivery of Unilever’s strategy.

ENGAGING WITH EMPLOYEES

The Committee is aware of and takes into consideration reward conditions elsewhere in the Group. We are proud of the Framework for Fair Compensation introduced by Unilever as part of the USLP, which includes the target to achieve living wage compliance for all our employees globally by 2020, a goal we are on track to complete earlier than planned:

Ann FudgeLOGO

www.unilever.com/sustainable-living/the-sustainable-living-
plan/enhancing-livelihoods/fairness-in-the-workplace/fair-
compensation/

The Committee welcomes recent UK corporate governance developments, which apply from 1 January 2019 and we are working towards implementing and reporting against these new standards. We have decided to adopt early the key features of the new remuneration reporting regulations including disclosure of the CEO pay ratio, which can be found on page 63. We already comply with many of the principles of the new UK Corporate Governance Code.

The Boards decided to share the responsibility for workforce engagement among allNon-Executive Directors as a collective point of contact. We have developed a number of initiatives to ensure that theNon-Executive Directors are able to engage with the workforce and get a sense of employee sentiment. These will include the chance to meet and hear from cohorts of employees of all levels,face-to-face, allowing for an open discussion on issues important to our employees.

We are also looking at ways we can use technology to give the Committee clear visibility of all employees’ pay across the Unilever Group, so that the Committee can better consider colleagues’ pay and their views on it to provide for the best possible alignment with Executive pay.

IMPLEMENTATION REPORT

The Annual Remuneration Report overleaf describes the implementation of our Remuneration Policy in 2018 and our remuneration decisions for 2019. Both PLC and NV shareholders will have an advisory vote on the implementation of our Remuneration Policy at the 2019 AGMs.

On behalf of the Committee and the entire Board, I thank all shareholders and their representatives for the constructive engagement in 2018 and 2019 and the valuable feedback and suggestions. We are grateful for your continuing support and welcome any future guidance.

Vittorio Colao

Chair of the Compensation Committee


48Governance ReportAnnual Report on Form 20-F 2017


IMPLICATIONS OF THE NEW REWARD FRAMEWORK

The Committee has aimed to maintain comparable levels of pay for the same performance while simplifying reward, extending the performance horizon and requiring even higher levels of personal investment in Unilever shares. Unilever’s Executive Directors will:

1.earn annual bonus in line with Unilever’s short-term performance;

2.invest up to 67% of their gross annual bonus in Unilever shares, which they need to hold for at least four years;

3.earn MCIP Match shares in line with Unilever’s long-term performance over the four years following the annual bonus year;

4.hold vested MCIP Match shares (after tax) for a further one-year retention period to ensure a five-year duration from grant; and

5.maintain a substantial personal shareholding throughout, and for two years beyond, their employment.

This sequence creates an incentive plan with performance measured over five years with distinct short- and long-term targets.

PROPOSED TARGET TOTAL PAY IS CLOSELY ALIGNED TO CURRENT LEVELS BUT ONLY IF THERE IS FAR HIGHER INVESTMENT IN SHARES THROUGH MCIP

Our Executive Directors will need to invest significantly more in Unilever shares through MCIP to keep their total target pay at current levels. Personal investments in the table below are calculated at 60% of gross annual bonus (the current maximum) and are made after tax has been paid, and so likely represent amounts that exceed their after-tax annual bonus. At this far higher level of personal investment, proposed total target pay is 4% higher for the CEO and 2% higher for the CFO. Effectively, to maintain total target pay at current levels, Executive Directors must invest their entire annual bonus in shares held for four years.


£

Current


£

Proposed


%
change


CEO


Personal Investment into MCIP

   727,200    1,301,381    79% 
Total Target Pay at 60% of gross annual bonus invested in Unilever shares through MCIP   5,336,323    5,567,020    4% 

CFO


Personal Investment into MCIP

   393,750    647,325    64% 

Total Target Pay at 60% of bonus invested in through MCIP


   2,890,625    2,948,925    2% 

Modelling based on historic outcomes for annual bonus and MCIP likewise showed almost identical levels of pay-out on average.

We propose to increase the maximum that Executive Directors can invest in Unilever shares through MCIP from 60% to 67% (two-thirds) of gross annual bonus. This effectively encourages Executive Directors to nearly double their (after-tax) personal investment in Unilever shares. If they invest at the new maximum and achieve demanding short- and long-term performance targets, their total target pay increases; by 8% for the CEO and by 6% for the CFO.

FIXED PAY IS SIMPLIFIED

Fixed Pay under the new Reward Framework consolidates salary, fixed allowance and supplemental pension into one element and incorporates a 5% increase for both CEO (who last received a salary adjustment in 2013) and CFO (who received a 5% salary adjustment in 2017). The proposed fixed pay increase for the CEO is below the average cumulative increase for the workforce over the five years since his salary was last increased. The CFO was promoted into his current role (18 months) ago on a salary below market median, and the proposed increase reflects a progressive move towards market competitive levels as he becomes established in role.


£

Current


£

Proposed

   %
change
 

CEO


Salary

   1,010,000    1,445,979   

Fixed Allowance

   250,000     

Supplemental Pension

   117,123           

Total Fixed Pay

   1,377,123    1,445,979    5% 

CFO


Salary

   656,250    899,063   

Fixed Allowance

   200,000     

Supplemental Pension


Total Fixed Pay

   856,250    899,063    5% 

VARIABLE PAY IS SIMPLIFIED

We simplify Variable Pay by discontinuing GSIP, the performance share plan. Annual bonus and MCIP are rebalanced to keep target Variable Pay closely aligned to current levels. MCIP converts annual bonus into a long-term shareholding as Executive Directors are eligible for the MCIP match (shown below) only to the extent they invest their annual bonus in Unilever shares, which must be held for the four-year duration of the MCIP cycle.


£

Current


£

Proposed


%
change


CEO


Target annual bonus

   1,212,000    2,168,969   

Target MCIP Match*

   727,200    1,952,072   

Target GSIP

   2,020,000           

Total Variable Pay

   3,959,200    4,121,041    4% 

CFO


Target annual bonus

   656,250    1,078,875   

Target MCIP Match*

   393,750    970,988   

Target GSIP

   984,375           

Total Variable Pay

   2,034,375    2,049,863    1% 

*Target MCIP Match in the table above is based on investing 60% of annual bonus in Unilever shares through MCIP

As detailed in the ‘At a Glance’ summary, target annual bonus becomes 150% of Fixed Pay for the CEO and 120% for CFO. Under the new Reward Framework, annual bonus will be based entirely on Unilever’s business results for Executive Directors; the current personal performance multiplier within the annual bonus calculation will be discontinued. At target, MCIP will match 1.5 shares for every 1 share purchased by an Executive Director investing annual bonus (after tax) in Unilever shares (the current target match is 1 share). Because personal investments in MCIP are made from after-tax income, the target MCIP Match shown above may require an individual to actually invest more than the after-tax value of annual bonus in MCIP shares (which must be held for at least five years from the date of grant before they can be sold).

Annual Report on Form 20-F 2017Governance Report49


DIRECTORS’ REMUNERATION REPORTCONTINUED

INCREASED UPSIDE FOR MORE INVESTMENT IN UNILEVER SHARES AND HIGHER PERFORMANCE

The combination of annual bonus and MCIP creates a five-year incentive plan with distinct short- and long-term performance targets.

To earn maximum pay under the new Reward Framework, Executive Directors must deliver truly outstanding performance over the full five years. Firstly, they need to deliver maximum business performance for annual bonus (150% of target). Then, they must invest in Unilever shares at the maximum (67% of gross maximum annual bonus). Finally, they must deliver maximum business performance for the following four-year duration of the MCIP (200% of target). If they achieve this, their maximum reward under the new Reward Framework is correspondingly higher than before, when performance was measured over shorter periods (three years for GSIP and four years for annual bonus followed by old MCIP).


£

Current


£

Proposed


%
change


CEO


Personal Investment into MCIP

   1,212,000    2,168,969    79% 

Fixed Pay

   1,377,123    1,445,979   

Max annual bonus

   2,020,000    3,253,453   

Max MCIP

   1,818,000    6,506,906   

Max GSIP

   4,040,000    0      

Maximum Total Variable Pay

Opportunity

   9,255,123    11,206,338    21% 

CFO


Personal investment into MCIP

   590,625    1,078,875    83% 

Fixed Pay

   856,250    899,063   

Max annual bonus

   984,375    1,618,313   

Max MCIP

   885,938    3,236,625   

Max GSIP

   1,968,750    0      

Maximum Total Variable Pay

Opportunity

   4,695,313    5,754,001    23% 

The Committee is of the view that this increased maximum opportunity is fully justified by higher risk and more stretching performance requirements:

MCIP performance is now measured over four years rather than three years and so is more challenging to sustain;
maximum pay requires maximum performance over five consecutive years, comprising a bonus year and subsequent four-year MCIP period, as opposed to four years currently;
Executive Directors are required to hold their vested MCIP shares for one additional year (ie five years from grant) before they may be sold;
Executive Directors must invest nearly double the amount of funds into Unilever shares, and will likely have lower take-home pay as a result, as investment is out of after-tax income; and
based on historic performance outcomes for annual bonus and MCIP, the new Reward Framework would have delivered less than the current maximum pay level, and so any future reward over the current maximum will be for performance higher than in the past.

The increased opportunity therefore represents higher pay only for higher performance and risk.

RESTRAINT ON MAXIMUM PAY

The Committee fully intends to continue its rigorous approach to target setting and if Executive Directors were able to deliver actual performance at the top of the range over five years, we believe investors would see the proposed maximum pay level as being fully justified. The Committee also notes that this higher maximum pay opportunity is in line with Unilever’s remuneration benchmarking peer group, although this was not a driver for setting the award level.

To prevent high levels of pay that are not justified by performance, the Committee has put a further safeguard in place. If the result of combined annual bonus and MCIP performance multipliers exceeds 75% of the maximum total pay opportunity, the Committee will apply an additional discretionary test. To award incentive payouts above 75% of the maximum (excluding the effect of share price change and dividends on share awards), the Committee must review rigorously the quality and sustainability of underlying performance and may then apply its discretion to reduce or cap the MCIP performance multiplier applicable to the two Executive Directors. Any such review of performance above 75% of maximum will be reported in the Directors’ Remuneration Report.

75% of maximum incentive opportunity for the CEO under the new Reward Framework equates to total pay of £8.8m (excluding benefits as provided under the Remuneration Policy – see page 53) which is 95% of the previous maximum pay level. Therefore, as a result of this safeguard, the CEO’s remuneration can only reach or exceed the previous maximum if the Committee can justify this on the basis of the long-term quality and sustainability of performance.

50Governance Report

Annual Report on Form 20-F 2017


AT A GLANCE: HOW THE REMUNERATION POLICY WILL APPLY TO EXECUTIVE DIRECTORS IN 2018

The table below sets out a summary of the new Reward Framework that will apply during the 2018 financial year subject to shareholder approval at our 2018 AGMs. Further details are set out in the Directors’ Remuneration Policy on pages 53 to 62.

Current Reward Framework


Proposed Reward Framework


CEO


CFO


CEO


CFO


Salary(GBP)

  £1,010,000   £656,250    

Fixed allowance(GBP)

  £250,000   £200,00    

Supplemental pension(GBP)

  £117,123               

Salary(converted to euros)

  1,238,960   805,017  Fixed Pay(euros)  1,773,772   1,102,874 

Fixed allowance(euros)

  306,673   245,339  Consolidates salary, fixed allowance and supplemental pension 

Supplemental pension(euros)


143,674


into one element and incorporates a 5% increase


Annual bonus

   Annual bonus  

% of salary at Target

  120%   100%  % of Fixed Pay at Target  150%   120% 

% of salary at Maximum

  200%   150%  % of Fixed Pay at Maximum  225%   180% 

MCIP

   MCIP  

Personal investment in Unilever Shares through MCIP is matched based on Unilever’s performance against long-term targets


Max investment % of annual bonus

  60%   60%  Max investment % of annual bonus  67% (2/3rd)   67% (2/3rd) 

1 Match Share for each Investment Share vesting in the range


 1.5 Match Share for each Investment Share vesting in the range 

% of salary at Target

  72%   60%  % of Fixed Pay at Target  150%   120% 

% of salary at Maximum

  180%   135%  % of Fixed Pay at Maximum  450%   360% 

GSIP


% of salary at Target

  200%   150%  GSIP discontinued after 2018 

% of salary at Maximum


400%


300%


Target pay: 60% annual bonus invested

  £5,336,323   £2,890,625    

Personal investment (60% annual bonus)

  £727,200   £393,750           

Target pay: 60% annual bonus inv. (euros)

  6,546,029   3,545,909  Target pay: 60% annual bonus inv. (euros)  6,829,023   3,617,425 
   Increase  4%   2% 

Personal investment into MCIP (60% annual bonus)

  892,051   483,010  Personal investment into MCIP (60% annual bonus)  1,596,395   794,069 
   Increase  79%   64% 
   Target pay: 67% (2/3rd) annual bonus invested  7,095,089   3,749,770 
   Increase  8%   6% 
   Personal investment into MCIP (67% (2/3rd) annual bonus)  1,773,772   882,299 
          Increase  99%   83% 

Maximum pay(GBP)

  £9,255,123   £4,695,313           

Maximum pay(euros)

  11,353,193   5,579,706  Maximum pay(euros)  13,746,735   7,058,391 
   Increase  21%   23% 

Personal investment at maximum pay

  1,486,752   724,515  Personal investment at maximum pay  2,660,658   1,323,448 
          Increase  79%   83% 

Notes:

MCIP investment: to maintain focus on long-term performance through MCIP, if the annual bonus outcome is below 50% of target, participants can invest up to 50% of Fixed Pay into Unilever shares. To avoid doubt, headline percentage figures in the table above have been rounded up where relevant, so the exact figures shown in relation to MCIP investment under the proposed reward framework reflect an individual’s investment of two-thirds of annual bonus rather than exactly 67% (see further on page 55).

Discretion: the Committee will have the discretion to adjust the formulaic outcome of the new MCIP, by up to plus or minus 10%, to reflect its assessment of the underlying long-term performance of the business. Any such adjustment would be explained in full in the DRR (please note that the Committee also retains the discretion to adjust the formulaic outcome of the annual bonus, by up to plus or minus 25%).

Currency: from 2018, Executive Directors’ pay will be denominated in euros (using the ARA 2016 average exchange rate of euro 1 = GBP 0.8152), as this aligns them to the rest of the senior leadership team (‘Top 100’) whose pay is already denominated in euros. The illustrative values of the proposed Reward Framework are also shown in sterling above for ease of comparison with the current arrangements.

Four-year version of MCIP: first introduced for 2017-2020 performance cycle (previously three years).

Consultation: in accordance with the new Dutch Corporate Governance Code, the Executive Directors have had the opportunity to consider and reflect on their own pay proposals.

Maximum pay: this maximum level of pay will only be delivered following a review by the Committee of the long-term quality and sustainability of performance.

Annual Report on Form 20-F 2017 Governance Report 51


DIRECTORS’ REMUNERATION REPORTCONTINUED

INCENTIVE PERFORMANCE MEASURES

Performance measures for Executive Directors that will apply to MCIP and GSIP granted in 2018 and the 2018 annual bonus are as follows:

ANNUAL BONUS –
performance measuresWeight

Underlying Sales Growth

33%

(USG)

Underlying Operating Margin

33%

Improvement (UOM)

Free Cash Flow

33%

(FCF)

MCIP –
performance measuresWeight

Underlying Sales Growth

25%

(USG)

Underlying Earnings Per Share

25%

(UEPS) growth

Return on Invested Capital

25%

(ROIC)

Sustainability Progress Index

25%

(USLP)

GSIP –
performance measuresWeight

Underlying Sales Growth

25%

(USG)

Underlying Operating Margin

25%

Improvement (UOM)

Cumulative Operating Cash Flow

25%

(COCF)

Total Shareholder Return

25%

(TSR)

Further details in relation to performance target ranges for the MCIP and GSIP granted in 2018 are set out in the Annual Remuneration Report on pages 63 and 64 below. Performance target ranges for the annual bonus are considered to be commercially sensitive and will be disclosed in full in the 2018 Directors’ Remuneration Report.

52Governance ReportAnnual Report on Form 20-F 2017


DIRECTORS’ REMUNERATION POLICY

POLICY REPORT

POLICY TABLE

The following sets out our new Directors’ Remuneration Policy (the Remuneration Policy). It fundamentally continues our existing policy principles, updated as necessary to reflect the full extension of these to our Executive Directors as set out above. This new Remuneration Policy will be presented for approval by shareholders at the 2018 AGMs and, if approved, will apply to payments made after that date and will replace the existing remuneration policy in its entirety. It is intended that the new Remuneration Policy will apply for three years, although the Compensation Committee may seek approval for a new policy at an earlier point if it is considered appropriate. The supporting information section provides the rationale for any changes from the existing remuneration policy where appropriate.

FIXED PAY

PURPOSE AND LINK TO STRATEGY

Supports the recruitment and retention of Executive Directors of the calibre required to implement our strategy. Reflects the individual’s skills, experience, performance and role within the Group. Provides a simple competitive alternative to the separate provision of salary, itemised benefits and pension.

OPERATION

Set by the Boards on the recommendation of the Committee and generally reviewed once a year, with any changes usually effective from 1 January (although changes may be made at any other time if the Committee considers that is appropriate).

Fixed pay is paid in cash and is generally paid monthly.

Fixed pay is set at an appropriate level to attract and retain Executive Directors of the required calibre, taking into account:

•  our policy generally to pay at around the median of an appropriate peer group of other global companies of a similar financial size and complexity to Unilever;*

•  the individual’s skills, experience and performance; and

•  pay and conditions across the wider organisation.

PERFORMANCE MEASURES

n/a.

OPPORTUNITY

Any increases will normally be in line with the range of increases awarded to other employees within the Group.

Increases may be above this level or applied more frequently in certain circumstances, such as:

•  where there is, in the Committee’s opinion, a significant change in an Executive Director’s scope or role;

•  where a new Executive Director has been appointed to the Boards at a rate lower than the typical market level for such a role and becomes established in the role; and

•  where it is considered necessary to reflect significant changes in market practice.

The maximum aggregate increase for the current Executive Directors during the time in which this policy applies will be no higher than 15%. This excludes the proposed increase to fixed pay rates for the CEO and CFO for 2018.

SUPPORTING INFORMATION

Base salary, fixed allowances and (for the current CEO) the supplemental pension accrual have been consolidated into fixed pay to substantially simplify the package. We have introduced a formal maximum increase into the Remuneration Policy as well as the general guidance on increases set out above.

*  The current peer group includes AstraZeneca, BASF, Bayer, BHP Billiton, BMW (XET), BP, British American Tobacco, BT, Carrefour, Centrica, Daimler (XET), Danone, Diageo, GlaxoSmithKline, Henkel (XET), Imperial Brands, L’Oréal, Metro, National Grid, Nestlé, Novartis, Reckitt Benckiser, Rio Tinto, Roche, Royal Dutch Shell, SABMiller, Sanofi, Siemens, Tesco, Total and Volkswagen. The peer group used for benchmarking purposes is reviewed regularly and companies are added and/or removed at the Committee’s discretion to ensure that it remains appropriate.

BENEFITS

PURPOSE AND LINK TO STRATEGY

Provides certain benefits on a cost-effective basis to aid attraction and retention of Executive Directors.

OPERATION

Benefits include provision of death, disability and medical insurance cover, directors’ liability insurance and actual tax return preparation costs. Other benefits may be provided in the future where it is considered necessary by the Committee and/or required by legislation.

In the event that Unilever were to require an existing or new Executive Director to relocate, Unilever may pay appropriate relocation allowances for a specified time period of no more than three years. This may cover costs such as (but not limited to) relocation, cost of living, housing benefit, home leave, tax and social security equalisation and education assistance.

In line with the commitments made to the current CEO upon recruitment, Unilever pays the social security obligation in the CEO’s country of residence to protect him against the difference between the employee social security obligations in his country of residence versus the UK.

Executive Directors are entitled to participate on the same terms as all UK employees in the Unilever PLC ShareBuy plan.

OPPORTUNITY

Based on the cost to Unilever of providing the benefit and dependent on individual circumstances.

Relocation allowances – the level of such benefits would be set at an appropriate level by the Committee, taking into account the circumstances of the individual and typical market practice.

Social security obligation in the current CEO’s country of residence dependent on earnings and rates of social security.

Awards under the all-employee Unilever PLC ShareBuy Plan may be up to HMRC-approved limits. The only change in the value of the current benefits (for single figure purposes) will reflect changes in the costs of providing those benefits.

PERFORMANCE MEASURES

n/a.

SUPPORTING INFORMATION

There are no changes relative to the previous remuneration policy, other than the consolidation of the supplemental pension accrual for the current CEO into fixed pay. The CEO received this accrual to compensate him for the arrangement forfeited on leaving his previous employer, which was conditional on remaining employed with Unilever to age 60 and subsequently retiring from active service or his death or total disability prior to retirement.

Annual Report on Form 20-F 2017Governance Report53


DIRECTORS’ REMUNERATION REPORTCONTINUED

ANNUAL BONUS

PURPOSE AND LINK TO STRATEGY

Incentivises year-on-year delivery of rigorous short-term financial, strategic and operational objectives selected to support our annual business strategy and the ongoing enhancement of shareholder value.

The ability to recognise performance through annual bonus enables us to manage our cost base flexibly and react to events and market circumstances.

OPERATION

Each year Executive Directors may have the opportunity to participate in the annual bonus plan. Executive Directors are set a target opportunity that is assessed against the Business Performance Multiplier of up to 150% of target opportunity at the end of the year.

Unless otherwise determined by the Committee, Executive Directors can invest up to a maximum of 67% of their gross annual bonus into Unilever shares under the MCIP (see the MCIP section on page 55).

Ultimate remedy/malus and claw-back provisions apply (see details on page 56).

OPPORTUNITY

Target annual bonus opportunities (as a percentage of fixed pay) are:

•  CEO – 150%

•  Other Executive Directors – 120%

Maximum annual bonus opportunities (as a percentage of fixed pay) are:

•  CEO – 225%

•  Other Executive Directors – 180%

Achievement of threshold performance results in a payout of 0% of the maximum opportunity, with straight-line vesting between threshold and maximum.

PERFORMANCE MEASURES

The Business Performance Multiplier is based on a range of business metrics set by the Committee on an annual basis to ensure that they are appropriately stretching for the delivery of threshold, target and maximum performance. These performance measures may include underlying sales growth (USG), underlying operating margin improvement (UOM) and free cash flow (FCF).

The Committee has discretion to adjust the formulaic outcome of the Business Performance Multiplier up or down by up to plus or minus 25%, based on results, if it believes this better reflects the underlying performance of Unilever. In any event, the overall Business Performance Multiplier will not exceed 150%. The use of any discretion will be fully disclosed in the Directors’ Remuneration Report for the year to which discretion relates.

The Committee may introduce non-financial measures in the future subject to a minimum of 70% of targets being financial in nature.

Performance is normally measured over the financial year.

SUPPORTING INFORMATION

Maximum opportunity has increased from 200% of base salary to 225% of fixed pay for the CEO, and from 150% of base salary to 180% of fixed pay for the CFO. The increase is designed to maintain target variable pay closely aligned to current levels. There will no longer be a personal performance multiplier on the annual bonus, which is driven entirely by business performance for Executive Directors.

54Governance ReportAnnual Report on Form 20-F 2017


MANAGEMENT CO-INVESTMENT PLAN (MCIP)

PURPOSE AND LINK TO STRATEGY

The MCIP encourages senior management to invest their own money into Unilever shares, aligning their interests with shareholders, and focus on the sustained delivery of high performance results over the long term.

OPERATION

The MCIP is a share matching arrangement whereby Executive Directors can invest their own money into Unilever shares (investment shares) and be awarded matching shares which vest at the end of a four-year performance period. Upon vesting, Executive Directors will have an additional one year retention period on their matching shares to ensure there is a five-year duration between the grant of the match shares and the first date on which the vested match shares can be sold.

Depending on Unilever’s performance, Executive Directors may receive up to 3 x the number the shares they have purchased provided that they keep them for the duration of the four-year period.

Executive Directors are able to choose whether they invest in PLC or NV shares or a 50/50 mix. Executive Directors receive a corresponding number of performance-related shares (matching shares). Matching shares will be awarded in the same form as the investment shares (ie in PLC or NV shares or a 50/50 mix).

Ultimate remedy/malus and claw-back provisions apply (see details on page 56).

OPPORTUNITY

Executive Directors may invest up to 67% of their gross annual bonus into Unilever shares (although in practice we anticipate that the figure of two thirds will actually be used wherever practicable).

The number of matching shares received at the end of the performance period is a multiple of the number of shares invested into the MCIP which depends on performance as follows (there is straight line vesting between each of the points below):

•  Threshold – 0 x

•  Target – 1.5 x

•  Maximum – 3 x

The maximum possible opportunity as a percentage of fixed pay is therefore:

•  CEO – 450% (225% x 67% x 3)

•  Other Executive Directors – 360% (180% x 67% x 3)

Dividend equivalents may be earned (in cash or additional shares) on the award when and to the extent that the award vests.

PERFORMANCE MEASURES

The Committee sets performance measures for each MCIP matching share award. These will be tested over the four financial years starting with the financial year following the year to which the annual bonus relates.

MCIP performance measures are currently Underlying Sales Growth, Underlying Earnings Per Share growth, Return On Invested Capital, and the Unilever Sustainability Progress Index. Each measure has a 25% weighting. The Committee retains the discretion to change these measures and/or weighting for future grants, based on strategic priorities for Unilever at that time.

The Committee will ensure that the targets set are appropriately rigorous for the delivery of threshold, target and maximum performance.

The Committee retains the discretion to adjust the formulaic outcome of long-term business performance by up to plus or minus 10% to reflect its assessment of the underlying long-term performance. As a further safeguard, the Committee will apply an additional discretionary test if the result of combined annual bonus and MCIP performance multipliers exceeds 75% of the maximum total incentive opportunity (disregarding share price movements and dividend equivalents). To award incentive payouts above 75% of the maximum, the Committee will review the quality and sustainability of underlying performance, and may then apply its discretion to reduce or cap the MCIP performance multiplier for Executive Directors to the extent it deems it appropriate. Any scale-back or cap in the MCIP performance multiple will be applied consistently to the two Executive Directors.

SUPPORTING INFORMATION

Maximum opportunity as a percentage of fixed pay has increased from 180% of basic salary to 450% of fixed pay for the CEO and from 135% of basic salary to 360% of fixed pay for the CFO to reflect that the Global Share Incentive Plan (GSIP) has been discontinued and the MCIP is the only long-term incentive plan. This significantly simplifies the overall remuneration structure and puts a strong focus on Executive Directors investing in Unilever shares.

There is now no minimum level of investment required (previously 25% of gross annual bonus). The maximum level of investment has increased from 60% to 67% of the gross annual bonus. This means that Executive Directors may have to invest a significant value of their fixed pay or personal funds in order to access the maximum possible value under the MCIP.

If Executive Directors choose not to invest in Unilever shares through the MCIP their total pay will be no more than fixed pay and annual bonus, which means their total pay will be significantly less than it is under Unilever’s existing remuneration policy. This constitutes a strong incentive for the Executive Directors to invest in the MCIP and so there is no longer a minimum investment in the MCIP.

The performance measures for the MCIP granted in 2017 have been amended to reflect some of the April 2017 initiatives to accelerate shareholder value (see pages 64 and 67).

The MCIP, which operates under the plan rules approved at the 2017 AGMs, is assessed over a four-year performance period and Executive Directors have to hold any vested MCIP match shares one additional year before those shares can be sold. This additional retention requirement on vested MCIP match shares falls away two years after Executive Directors leave Unilever. This fully aligns the requirement for additional retention with the existing post-termination holding requirements.

Annual Report on Form 20-F 2017Governance Report55


DIRECTORS’ REMUNERATION REPORTCONTINUED

ELEMENTS OF PREVIOUS POLICY THAT WILL CONTINUE

MCIP and GSIP awards granted under a previous remuneration policy will continue to operate under the terms of that policy and the relevant plan rules. Further details of the terms of the awards made are included in the Annual Remuneration Reports for their respective years. This applies to the GSIP awards granted in 2015, 2016, 2017 and 2018 and the MCIP awards granted in 2015, 2016 and 2017. This provision will cease to apply once all of these awards have vested, been exercised or been forfeited as appropriate as per the relevant policy and plan rules. Additional details are set out below.

CLAW-BACK, ULTIMATE REMEDY, DISCRETION AND FLEXIBILITY

Claw-back: The Committee has discretion to reclaim or claw back some or all of the value of awards of performance-related payments to Executive Directors in the event of a significant downward restatement of the financial results of Unilever. This includes the annual bonus together with any awards that have been made and/or vested shares under the GSIP and the MCIP (awards under both this Remuneration Policy and any previous remuneration policy). This claw-back may be effected up to two years from vesting by reducing outstanding awards or requiring the return of the net value of vested awards to Unilever.

Ultimate remedy/malus: Grants under the GSIP and MCIP (under both this Remuneration Policy and any previous remuneration policy) are subject to ultimate remedy. Upon vesting of an award, the Committee shall have the discretionary power to adjust the value of the award if the award, in the Committee’s opinion taking all circumstances into account, produces an unfair result. In exercising this discretion, the Committee may take into account Unilever’s performance against non-financial measures. The Committee may apply malus to reduce a MCIP award granted under this Remuneration Policy or to GSIP or MCIP awards granted from 2015 under any previous remuneration policy, or determine that any such award will not vest or only vest in part in the event of a significant downward restatement of the financial results of Unilever, gross misconduct or gross negligence, material breach of Unilever’s Code of Business Principles or any of the Unilever Code Policies, breach of restrictive covenants by which the individual has agreed to be bound, or conduct by the individual which results in significant losses or serious reputation damage to Unilever. The annual bonus will also be subject to malus on the same grounds as apply for MCIP awards. This power is an addition to the normal discretion to adjust awards and the additional sustainability test outlined in the policy table.

For future awards under the MCIP, the Committee may change the terms of a performance measure or target in accordance with its terms or if anything happens which causes the Committee reasonably to consider it appropriate to do so, and may adjust the number or class of shares subject to awards if certain corporate events (eg rights issues) occur. For legacy awards under the MCIP and GSIP, the Committee may change the terms of a performance measure or target during the performance period to take into account any structural changes relating to the shares or the Group (eg rights issues) in accordance with established market practice.

The Committee reserves the right to make any remuneration payments and payments for loss of office (including exercising any relevant discretions) notwithstanding that they are not in line with this Remuneration Policy where the terms of the payment were agreed before this Remuneration Policy came into effect or at a time when the relevant individual was not a Director of Unilever N.V. or PLC and, in the opinion of the Committee, the payment was not in consideration for the individual becoming a Director of Unilever N.V. or PLC. For these purposes, ‘payments’ includes the Committee satisfying awards of variable remuneration and, in relation to an award over shares, the terms of the payment are ‘agreed’ at the time the award is granted.

REMUNERATION SCENARIOS: OUR EMPHASIS ON PERFORMANCE-RELATED PAY

It is Unilever’s policy that the total remuneration package for Executive Directors should be competitive with other global companies and that a significant proportion should be performance-related.

For the remuneration scenarios below, the maximum and target pay opportunities have been chosen to be consistent with the current levels for Executive Directors. In reviewing the appropriate level of pay opportunity for the Executive Directors, the Committee considers internal and external comparators. Although pay is not driven by benchmarking, the Committee is aware that pay needs to be within a reasonable range of competitive practice. The Committee notes that total target pay for the Executive Directors is between median and lower quartile for the benchmark group used by the Committee (see page 53).

The Committee typically reviews, on at least an annual basis, the impact of different performance scenarios on the potential reward opportunity and payouts to be received by Executive Directors and the alignment of these with the returns that might be received by shareholders. The Committee believes that the level of remuneration that can be delivered in the various scenarios is appropriate for the level of performance delivered and the value that would be delivered to shareholders. The charts below show hypothetical values of the remuneration package for Executive Directors in the first full year of the policy (excluding the transition year) under three assumed performance scenarios. The dotted line reflects the point above which the Committee must make a further positive determination in order for the award value to vest, in line with the additional performance test set out in the Policy.

LOGO

56Governance ReportAnnual Report on Form 20-F 2017


DETAILS OF FIXED ELEMENT OF REMUNERATION FOR CEO AND CFO AND ASSUMPTIONS FOR SCENARIO CHARTS

FIXED REMUNERATION

Assumptions as follows (for actual Executive Director pay details please see Annual Remuneration Report below):

•  Fixed pay for CEO effective from 1 May 2018 =1,773,772.

•  Fixed pay for CFO =1,102,874.

•  Benefits assumed to be612,296 for CEO and23,648 for CFO.

VARIABLE REMUNERATION  

BELOW

THRESHOLD

•  No 2018 annual bonus payout and no vesting under the MCIP or the GSIP.

ON TARGET

•  Target payout of the 2018 annual bonus (150% of fixed pay for the CEO and 120% of fixed pay for the CFO).

•  Target vesting under the MCIP (1.5 x matching shares of the target 2018 annual bonus for CEO and CFO).

•  Scenarios assume 67% of the gross annual bonus is invested.

MAXIMUM

•  Maximum payout of the 2018 annual bonus (225% of fixed pay for the CEO and 180% of fixed pay for the CFO).

•  Maximum vesting under the MCIP (3 x matching of the maximum 2018 annual bonus for CEO and CFO).

•  Scenarios assume 67% of the gross annual bonus is invested.

NOTES TO

VARIABLE REMUNERATION

•  Participants in the MCIP may choose how much they wish to invest in Unilever shares, up to 67% of the value of their gross annual bonus. At this level of investment (as shown above in the maximum scenario) the participant will likely have to invest all of their post-tax annual bonus and more than half of their after-tax fixed pay earned in the year (depending on the individuals’ personal tax situation). This would be a significant personal contribution into Unilever shares.

•  Dividends, dividend equivalents and share price movements are ignored for the purposes of the illustrations above.

MAXIMUM

THAT COULD BE

EARNED WITHOUT

ADDITIONAL

COMMITTEE

APPROVAL

•  The Committee have set a range of performance outcomes, above which the Committee will review both the quality and sustainability of actual underlying performance delivery, to ensure the appropriate payout is warranted.

•  The above charts illustrate a pay outcome above which additional Committee approval may be required, being 75% of the maximum total incentive opportunity. See the MCIP section in the Remuneration Policy for full details.

LEGACY ARRANGEMENTS

For the duration of this Remuneration Policy, entitlements arising before the adoption of this Remuneration Policy will continue to be honoured in line with the approved remuneration policy under which they were granted, or their contractual terms. The last award under the legacy MCIP was made on 11 February 2016, relating to the annual bonus earned in 2015, which will vest on 11 February 2019. The last award under the GSIP rules approved at the 2007 AGMs was made on 13 February 2017 and will vest on 13 February 2020. The last GSIP award under the Unilever Share Plan approved at the 2017 AGMs was made on 16 February 2018 and will vest on 16 February 2021. Further details of the terms of these awards can be found within the remuneration policy approved at the 2014 AGMs, and the relevant Annual Report and Accounts.

PERFORMANCE MEASURES AND THE LINK TO STRATEGY

Performance measures are selected to align with Unilever’s short-term performance targets and long-term business strategy objectives. Unilever’s primary business objective is to create value in a sustainable way. Performance measures focus management on the delivery of a combination of top-line revenue growth and bottom-line profit growth that Unilever believes will build shareholder value over the longer term.

The measures chosen for the incentives will support the delivery of this objective, with distinct measures for each of the short- and longer-term incentive programmes. For the short-term incentive, we continue to have a balanced set of performance measures in terms of sales, profitability and cash flow. Performance measures for our long-term incentive relate to the key objectives driving long-term value creation for investors: growth (in the form of USG) is fundamental to our model; underlying earnings per share (UEPS) growth gives clear line of sight to share price via the Price/Earnings multiple; sustainability (USLP) is at the heart of our strategy for long-term value creation; and return on invested capital (ROIC) is an important measure of value creation, and an appropriate measure for ULE members given their decision-making responsibility regarding merger and acquisition activity.

The following sets out the performance measures for short- and long-term incentive plans to be awarded in 2018, as well as the business performance and the behaviours that they drive.

Annual Report on Form 20-F 2017Governance Report57


DIRECTORS’ REMUNERATION REPORTCONTINUED

APPROACH TO TARGET SETTING

  INCENTIVE PLAN

PERFORMANCE MEASURE

LINK TO STRATEGY

  SHORT-TERM:

  ANNUAL BONUS

Underlying sales growth (USG) at constant rates

Clear, simple and well understood measure supporting the achievement of Unilever’s growth ambition

Underlying operating margin improvement (UOM) at current rates

Underlines the importance of achieving increasingly profitable growth

Free cash flow (FCF) at current rates

Provides clear focus on the achievement of Unilever’s cash generation ambition and on cost reduction

  LONG-TERM:

  MCIP

Underlying sales growth (USG) (compound annual growth rate (CAGR) at constant rates)

Supports the achievement of Unilever’s ambition to deliver sustainable growth over the longer term

Underlying earnings per share (UEPS) growth at current rates

Provides focus on shareholder value creation through a measure which is widely understood and applied externally by investors in valuing companies

Return on invested capital (ROIC)

Supports disciplined investment of capital within the business and discourages acquisitions with low returns and long paybacks (an especially relevant measure for members of the ULE who make investment decisions)

Unilever sustainability progress index (USLP)

The Unilever Sustainable Living Plan (USLP) helps to secure long-term value creation by decoupling our growth from our environmental impact, while increasing our positive social impact. To avoid over-focus on any one element of the USLP, the progress index is an assessment made by the Committee (with input from the Corporate Responsibility Committee) taking into account progress towards the targets in our reported USLP scorecard.

  LONG-TERM:

  GSIP

USG at constant rates

Supports the achievement of Unilever’s ambition to deliver sustainable growth over the longer term

UOM at current rates

Underlines the importance of achieving sustainable profitable growth over the longer term

Cumulative operating cash flow

Provides clear focus on the achievement of Unilever’s cash generation ambition and on cost reduction

Relative total shareholder return (TSR)Provides a relative ranking of share price growth and dividend compared with a set of peer companies

The Committee sets performance targets for incentive plans, taking into account internal budgets, business priorities and external forecasts so that the targets are sufficiently stretching. Good performance results in target payout while maximum payout is only achieved for delivering exceptional performance.

58Governance ReportAnnual Report on Form 20-F 2017


DIFFERENCES IN PAY POLICY GENERALLY

As the Chairman’s letter sets out, we now propose to bring the reward arrangements for our Executive Directors in line with those introduced in 2017 for the rest of our ULE and ‘Top 500’ managers, ie simplifying pay for this whole population into three elements:

fixed pay;
annual bonus; and
MCIP.

The core principle of our new Reward Framework is to continue to drive an ‘owner’s mindset’. All executives must now continuously invest more of their annual bonus in Unilever shares to maintain current levels of pay. We believe this drives executives to apply an even stronger owner’s mindset in everything they do. The implementation of the new Reward Framework for senior management below Board level has been a success, and we will extend the implementation in 2018 to the next layer of management to encompass Unilever’s top 3,000 managers.

Accordingly, our MCIP is now the only long-term incentive for this senior population. The new Reward Framework has been structured in a way to maintain broadly the same levels of pay for target performance, if they continue to invest 67% of their gross annual bonus in Unilever shares through the MCIP.

We plan to continue applying the principles driving these proposals to the way we pay all of our 15,000+ managers, not just our senior leaders. As a responsible employer with around 161,000 people in 113 countries as at year end, we are also very mindful of how we pay our manynon-management staff.

Remuneration arrangements are determined throughout the Group based on the same principle: that reward should support our business strategy and should be sufficient to attract and retain high-performing individuals without paying more than is necessary. Unilever is a global organisation with employees at a number of different levels of seniority and in a number of different countries and, while this principle underpins all reward arrangements, the way it is implemented varies by geography and level.

In principle, all our managers participate in the same Unilever annual bonus scheme with the same performance measures based on Unilever’s overall performance. All middle and senior management are invited to participate in the MCIP, which in 2018 will be extended to approximately 12,000 more junior managers worldwide as well. Wherever possible, all other employees have the opportunity to participate in the global ‘buy 3 get 1 free’ employee share plan called ‘SHARES’, which is offered in more than 100 countries.

Through these initiatives we will encourage all our employees fully to adopt an owner’s mindset with the goal of achieving our growth ambition, so they can continuously reinvest and share in the future long-term success of Unilever.

CONSIDERATION OF CONDITIONS ELSEWHERE IN THE GROUP

When determining the pay of Executive Directors, the Committee considers the pay arrangements for other employees in the Group, including considering the average global pay review budget for the management population, to ensure that remuneration arrangements for Executive Directors remain reasonable.

Unilever employs around 161,000 people in 113 countries as at year end and, given this geographic spread and other factors, the Committee did not consider that it was appropriate to consult employees on the Remuneration Policy for Executive Directors during the year. However, Unilever takes the views of its employees seriously and on an ongoing basis we conduct the‘Rate-My-Reward’ survey to gauge the views of employees on the different parts of their reward package.

The Committee has taken note of Unilever’s Fair Compensation Framework and the advanced living wage awareness initiative together with responsible supplier policies within the Group. Over the last three years we have also offered the SHARES plan to ournon-management staff around the world. We will continue to advance these initiatives over the year ahead and beyond to enhance the livelihoods of all our employees.

LOGOwww.unilever.com/sustainable-living/the-sustainable-living-plan/enhancing-livelihoods/fairness-in-the-workplace/fair-compensation/

CONSIDERATION OF SHAREHOLDER VIEWS

The Committee takes the views of shareholders seriously. We maintain an open and regular dialogue with our shareholders on remuneration matters, including consulting with our largest investors and shareholder representative bodies, when we are considering making material changes to our Remuneration Policy. Accordingly, shareholders have been consulted extensively and their views have been influential in shaping this Remuneration Policy. Their feedback influenced our proposals in relation to the balance between fixed and variable pay, between the annual bonus and MCIP components, and the development of the additional sustainability test on payouts above set levels.

MINIMUM SHAREHOLDING REQUIREMENT

The remuneration arrangements applicable to our Executive Directors require them to build and retain a personal shareholding in Unilever (within five years from the date of appointment with extra time granted if requirements increase significantly) to align their interests with those of Unilever’s long-term shareholders. The current requirement is 5 x base salary for the CEO and 4 x base salary for the CFO. When the new Remuneration Policy takes effect, these requirements will be measured over fixed pay.

Upon leaving Unilever, all Executive Directors will be required to maintain at least 100% of their minimum shareholding requirement for one year after leaving, and at least 50% for two years after leaving. If the leaver has not yet met their shareholding requirements on departure they will be required to retain the shares they do own up to these limits. Upon vesting of MCIP match shares, Executive Directors will have to wait one additional year to ensure there is a five-year duration between the grant of the Match shares and the first date on which the vested Match shares can be sold.

The additional one year retention requirement for Executive Directors after MCIP match shares vest will fall away two years after Executive Directors leave Unilever. This fully aligns the requirement for additional retention with the existing post-termination holding requirements.

Annual Report on Form 20-F 2017Governance Report59


DIRECTORS’ REMUNERATION REPORTCONTINUED

REMUNERATION POLICY FOR NEW HIRES

 AREA

POLICY AND OPERATION

 OverallThe Committee will pay new Executive Directors in accordance with the approved Remuneration Policy and all its elements as set out herein above. The terms of service contracts will not overall be more generous than those of the current CEO and CFO summarised below in the ‘service contracts’ paragraph. The ongoing annual remuneration arrangements for new Executive Directors will therefore comprise fixed pay, benefits, annual bonus and MCIP. In addition, the recruitment policy below permits the Committee to take the following actions, as appropriate, in the best interests of Unilever and its shareholders. For internal promotions, any variable remuneration element awarded in respect of a prior role may be paid out according to its original terms.
 Fixed pay

Fixed pay would be set at an appropriate level to recruit the best candidate based on their skills, experience and current remuneration.

 Benefits

Benefits provision would be in line with the approved relevant Remuneration Policy. Where appropriate the Executive Director may also receive relocation benefits or other benefits reflective of normal market practice in the territory in which the Executive Director is employed. In addition, the Committee may agree that Unilever will pay certain allowances linked to repatriation on termination of employment.

 Incentive awardsIncentive awards would be made under the annual bonus and MCIP in line with the relevant Remuneration Policy.

In addition to normal incentive awards, additional awards may be made to align the joiner as quickly as possible with Unilever’s long-term goals, and to reflect value forfeited through an individual leaving their current employer.

 Transition awards

 andbuy-out

 awards

Transition awards

In the event that we were to appoint a new Executive Director, the Committee’s preferred approach would be to align the incoming Executive Director with our own performance-based Reward Framework by requiring them to invest in Unilever shares from the outset and aligning them fully with our inflight MCIP performance cycles and targets alongside their new colleagues at Unilever, recognising that no other long-term incentive will be vesting in their first years of employment at Unilever. We see this as the most sustainable approach to the remuneration of incoming Executive Directors over the longer term. To achieve this, we propose where appropriate to offer incoming Executive Directors a Transition Award (TA) instead of abuy-out arrangement. The TA should normally be no more valuable than the awards foregone.

The TA permits the joiner to potentially receive matching awards underin-flight cycles of the MCIP as if they had invested a proportion of their target annual bonus into the MCIP cycles that started before they joined Unilever. The TA bridges the lengthy gap between an incoming Executive Director’s arrival and the first maturity of incentives at Unilever, after the first five-year performance horizon has been reached (this role is usually played less elegantly bybuy-out awards). The TA also facilitates the new Executive Director in building the required level of personal shareholding within five years of joining Unilever. The level of TA offered by the Committee would take into account the circumstances of the case including the value of any awards foregone at the previous employer. A TA may be offered by the Committee for allin-flight cycles or only some.
The TA requires the incoming Executive Director to commit to a minimum level of investment in future MCIP cycles to be eligible for an equivalent level of Match shares in inflight MCIP cycles. For example, if the incoming Executive Director has an initial target annual bonus of ‘100’, the maximum TA the Committee may offer would be based on this level of award. If the Executive Director commits to investing at the maximum level of 67% of annual bonus in MCIP for each of the next four years, the maximum TA award would be 67 worth of Match shares in each of up to four inflight MCIP cycles (ie a total of 67 x 4 = 267) with vesting based on Unilever’s actual performance to the vesting date and only if the Executive Director actually invests at least 67% of their annual bonus awards through MCIP for the duration of the TA. Accordingly, the TA may be worth up to 267% of the new Executive Director’s initial target annual bonus and vests 25% per year thereafter at the actual performance multiplier (0 x to 3 x) for the MCIP cycle ending in the corresponding year, and so is entirely subject to Unilever’s performance.
Within these limits the Committee will determine the size of the TA based on individual circumstances, with the aim that the TA should normally be no more valuable than any awards foregone. As stated above, to be eligible for the TA, the Executive Director must invest no less than a corresponding percentage of actual annual bonus into new cycles of MCIP starting in each of the years that the TA vests. The TA vesting in any year will be forfeited if the corresponding level of investment the new Executive Director has made into the MCIP in that year is lower than the initial commitment. If the Executive Director elects to make a higher investment in new MCIP cycles than the initial commitment, the TA will not be increased.
A TA would normally only be offered if required to compensate an Executive Director for awards foregone. If an Executive Director joins without the need to compensate for awards foregone, a TA generally would not be provided, other than in exceptional circumstances.
Buy-out awards
The TA is the Committee’s preferred approach. However, there are clearly circumstances where the TA would not be effective. For example, for some incoming Executive Directors who are forfeiting no (orlow-value) awards it might not be justified to make a TA in respect of every outstanding MCIP cycle. For others, it might not be enough to facilitate departure from their current employer if they had an exceptionally large value of accrued awards, or if awards were not subject to performance conditions. For those reasons, the Committee reserves discretion to make appropriate joining arrangements with the intention that the TA orbuy-out awards in aggregate should normally be no more valuable than the awards foregone. Accordingly, the Committee may elect to compensate Executive Directors hired from outside for any awards they lose by leaving previous employers broadly on alike-for-like basis (although a TA may form part of this). Incoming Executive Directors will be required to retain all shares vesting from any share awards until their minimum shareholding requirements have been met in full.

If abuy-out award is required, the Committee would aim to reflect the nature, timing, and value of awards forgone in any replacement awards. Awards may be made in cash, shares or any other method as deemed appropriate by the Committee. Where possible, share awards will be replaced with share awards. Where performance measures applied to the forfeited awards, performance measures will be applied to the replacement award or the award size will be discounted accordingly. In establishing the appropriate value of anybuy-out the Committee would also take into account the value of the other elements of the new remuneration package. The Committee would aim to minimise the cost to Unilever, althoughbuy-out awards are not subject to a formal maximum. Any awards would be broadly no more valuable than those being replaced.

60Governance ReportAnnual Report on Form 20-F 2017


SERVICE CONTRACTS

POLICY IN RELATION TO EXECUTIVE DIRECTOR SERVICE CONTRACTS AND PAYMENTS IN THE EVENT OF LOSS OF OFFICE

SERVICE CONTRACTS & NOTICE PERIOD  

Current Executive Directors’ service contracts are terminable upon notice (12 months’ notice from Unilever, 6 months’ notice from the Executive Director), and are available for shareholders to view at the AGMs or on request from the Group Secretary. Starting dates of the service contracts for the current CEO and CFO:

CEO: 1 October 2008 (signed on 7 October 2008); and

CFO: 1 October 2015 (signed on 16 December 2015).

TERMINATION PAYMENTS

A payment in lieu of notice can be made, to the value of no more than 12 months’ fixed pay and other benefits (unless the Boards, at the proposal of the Committee, find this manifestly unreasonable given the circumstances or unless dictated by applicable law).

OTHER ELEMENTS

•  Executive Directors may, at the discretion of the Boards, remain eligible to receive an annual bonus for the financial year in which they cease employment. Such annual bonus will be determined by the Committee taking into account time in employment and performance.

•  Treatment of share awards is as set out in the section on leaver provisions, below.

•  Any outstandingall-employee share arrangements will be treated in accordance with HMRC-approved terms.

•  Other payments, such as legal or other professional fees, repatriation or relocation costs and/or outplacement fees, may be paid if it is considered appropriate.

•  The Committee reserves the discretion to approve gifts to Executive Directors who are retiring or who are considered by the Boards to be otherwise leaving in good standing (eg those leaving office for any reason other than termination by Unilever or in the context of misconduct). If the value of the gift for any one Executive Director exceeds £5,000 it will be disclosed in the Annual Remuneration Report. Where a tax liability is incurred on any such a gift, the Committee has the discretion to approve the payment of such liability on behalf of the Executive Director in addition to the value of the gift.

LEAVER PROVISIONS IN SHARE PLAN RULES

‘GOOD LEAVERS’ AS DETERMINED BY THE COMMITTEE IN ACCORDANCE WITH THE PLAN RULES*

LEAVERS IN OTHER CIRCUMSTANCES*  

CHANGE OF CONTROL

INVESTMENT SHARES (MCIP)

Investment shares are not impacted by termination (although they may be transferred to the personal representative of the Executive Director in the event of his or her death without causing the corresponding matching shares to lapse).

Investment shares are not impacted by termination.

Investment shares may normally be disposed of in connection with a change of control without causing the corresponding matching shares to lapse.

Alternatively, Executive Directors may be required to exchange the investment shares for equivalent shares in the acquiring company.

MATCHING SHARES (MCIP),   PERFORMANCE SHARES (GSIP)

Awards will normally vest following the end of the original performance period, taking into account performance and (unless the Boards on the proposal of the Committee determine otherwise)pro-rated for time in employment.

Alternatively, the Boards may determine that awards shall vest upon termination based on performance at that time andpro-rated for time in employment (unless the Boards on the proposal of the Committee determine otherwise). If an Executive Director dies, awards will vest at the time of death at the target level of vesting (pro-rated for time in employment if the director had previously left as a good leaver).

Awards will normally lapse upon termination.Awards will vest based on performance at the time of the change of control and the Boards, on the proposal of the Committee, have the discretion topro-rate for time. Alternatively, Executive Directors may be required to exchange the awards for equivalent awards over shares in the acquiring company.

*An Executive Director will usually be treated as a good leaver if he or she leaves due toill-health, injury or disability, retirement with Unilever’s agreement or redundancy. The Boards may decide to treat an Executive Director who leaves in other circumstances as a good leaver. An Executive Director will not be treated as a good leaver if he or she chooses to leave for another job elsewhere unless the Boards determine otherwise, if he or she is summarily dismissed or leaves because of concerns about performance. In deciding whether or not to treat an Executive Director as a good leaver, the Boards will have regard to his or her performance in the role.

If Unilever is affected by a demerger, special distribution or other transaction which may affect the value of awards, the Committee may allow matching shares under the current and legacy MCIP and performance shares under the GSIP to vest early over such number of shares as it shall determine (to the extent any performance measures have been met) and awards may bepro-rated to reflect the acceleration of vesting at the Committee’s discretion.

Annual Report on Form 20-F 2017Governance Report61


DIRECTORS’ REMUNERATION REPORTCONTINUED

NON-EXECUTIVE DIRECTORS

KEY ASPECTS OF UNILEVER’S 2018 FEE POLICY FORNON-EXECUTIVE DIRECTORS

APPROACH TO SETTING FEES

Non-Executive Directors receive annual fees from Unilever N.V. and PLC. The Boards determineNon-Executive Director fee levels, which are limited to5,284,200 in total per year (which number is based on the limits as currently approved by N.V. and PLC shareholders using 2017 average FX rate (£1 =1.14210).)

Unilever’s policy is to set fees at a level which is sufficient to attract, motivate and retain high-class talent of the calibre required to direct the strategy of the business. They are set taking into account:

•  Unilever’s Group-wide reward philosophy;

•  the commitment and contribution expected by the Group; and

•  fee levels paid in other globalnon-financial services companies based in Europe.

Fees are paid in cash.

OPERATION

Unilever applies a modular fee structure forNon-Executive Directors to ensure we fairly reflect the roles and responsibilities of Committee membership and Chairmanship. Our basic philosophy is to pay the Chairman anall-inclusive fee. Other Board members receive a basic fee and additional fees for being Vice-Chair, chairing or membership of various Committees. The fees are currently split 50/50 between PLC (in sterling) and NV (in euros). The Boards may decide to pay fees in any other currency based on such foreign exchange rates as the Boards shall determine, provided totalNon-Executive Director fees stay within the annual limits as approved by shareholders from time to time. The 2018 fee structure can be found in the Annual Remuneration Report on page 71. The fee structure may vary from year to year within the terms of this Remuneration Policy.

Fees are normally reviewed annually but may be reviewed less frequently.

Additional allowances are made available toNon-Executive Directors where appropriate, to reflect any additional time commitment or duties.

OTHER ITEMS

Non-Executive Directors are encouraged to build up a personal shareholding of at least 100% of their total annual fees over the five years from appointment.

Non-Executive Directors are not entitled to participate in any of the Group’s incentive plans.

All reasonable travel and other expenses incurred byNon-Executive Directors in the course of performing their duties are considered to be business expenses and are reimbursed together with any tax payable.Non-Executive Directors also receive expenses relating to the attendance of the Director’s spouse or partner, when they are invited by Unilever. Other benefits or additional payments may be provided in the future if, in the view of the Boards, this is considered appropriate. Such benefits and/or payments would be within the total annual limits as approved by shareholders as described above.

The Committee reserves the discretion to approve gifts toNon-Executive Directors who are retiring or who are considered by the Boards to be otherwise leaving in good standing (eg those leaving office for any reason other than termination by Unilever or in the context of misconduct. If the value of the gift for any oneNon-Executive Director exceeds £5,000 it will be disclosed in the Annual Remuneration Report. Where a tax liability is incurred on any such a gift the Committee has the discretion to approve the payment of such liability on behalf of theNon-Executive Director in addition to the value of the gift.

REMUNERATION POLICY FOR NEWNON-EXECUTIVE DIRECTOR HIRES

In the event of hiring a newNon-Executive Director, the Committee will align the remuneration package with the Remuneration Policy as set out above.

NON-EXECUTIVE DIRECTORS’ LETTERS OF APPOINTMENT

The terms of engagement ofNon-Executive Directors are set out in letters of appointment which eachNon-Executive Director signs upon appointment.Non-Executive Directors are currently appointed for aone-year term, subject to satisfactory performance, renomination at the discretion of the Boards on the recommendation of the Nominating and Corporate Governance Committee andre-election at forthcoming annual shareholder meetings. It is Unilever’s expectation thatNon-Executive Directors serve for a minimum of three years. The letters of appointment allow for Unilever to terminate aNon-Executive Director’s appointment in cases of gross misconduct, bankruptcy or where theNon-Executive Director is prevented from occupying such a position by law.

The letters do not contain provision for notice periods or compensation if theNon-Executive Directors’ appointments are terminated by Unilever.Non-Executive Directors may terminate their engagement upon three months’ notice. Except in exceptional circumstances, the Boards will not proposeNon-Executive Directors for renomination when nine years have elapsed since the date of their appointment. Letters of appointment are available for inspection on request from the Group Secretary.

In considering appointments to the Boards, the Directors and Unilever give due consideration to the time commitment required to fulfil the role appropriately.

62Governance ReportAnnual Report on Form 20-F 2017


ANNUAL REMUNERATION REPORT

The following sets out how Unilever’s existing remuneration policy (available(which was approved by shareholders at the May 2018 AGMs and is available on our website) was implemented in 2017,2018, and how our updated Remuneration Policy (set out on pages 53 to 62)it will be implemented if it receives shareholder approval at the 2018 AGMs.

in 2019.


LOGOLOGO www.unilever.com/ara2016/downloads    (existing remuneration policy set out in Annual Report & Accounts 2016)remuneration-policy

IMPLEMENTATION OF THE REMUNERATION POLICY IN 20182019 FOR EXECUTIVE DIRECTORSOUR CEO (ALAN JOPE) AND CFO (GRAEME PITKETHLY)

If approved by shareholders, Unilever’s updated Remuneration Policy will be implemented with effect from the 2018 AGMs as set out below. If the updated Remuneration Policy is not approved, Unilever’s existing Remuneration Policy (as approved at the 2017 AGMs) will continue to apply.

ELEMENTS OF REMUNERATION

ALAN JOPE

Alan Jope became CEO on 1 January 2019. He will be proposed for election as an Executive Director of the Boards of NV and PLC at the AGMs in May 2019. The Committee approved the remuneration package for Alan Jope set out in the table below (shown as for “CEO”), which came into effect from 1 January 2019, and will remain unchanged if he is appointed as an Executive Director at the May 2019 AGMs. His remuneration package is in accordance with the approved Remuneration Policy. The Committee believes that the positioning of the package represents an acceptable balance in view of various considerations, such as Paul Polman’s package, competitive external market pay rates across Unilever’s peer group and Alan’s previous package and experience.


ELEMENTS OF

REMUNERATION    

  AT A GLANCE  ADDITIONAL INFORMATION


FIXED PAY


Annual fixed payFixed Pay effective from May 2018:

January 2019:

•  CEO:1,773,7721,450,000

•  CFO:1,102,874


Details of the rationale for the fixed pay proposals forour Executive DirectorsDirectors’ Fixed Pay amounts can be found above and in the section ‘Implications of the new Reward Framework’Chair Letter on pages 49 and 50.page 51.


OTHER BENEFIT ENTITLEMENTS


  Implemented in line with the 2018 Remuneration Policy.   n/a
  
ANNUAL BONUS  

•  Implemented in line with the 2018 Remuneration Policy.

•  Target annual bonus of 150% of fixed payFixed Pay for the CEO and 120% of fixed payFixed Pay for the CFO.

•  Business Performance Multiplier of between 0% and 150% based on achievement against business targets over the year.

•  Maximum annual bonus is 225% of fixed payFixed Pay for the CEO and 180% for the CFO.


For 2018,2019, the Business Performance Multiplier will be based on the following metrics:


LOGO

LOGO


A 0% multiplier will be applied for threshold performance, and up to 150% multiplier for maximum performance. Performance target ranges are considered to be commercially sensitive and will be disclosed in full with the corresponding performance outcomes retrospectively following the end of the relevant performance year.


GSIP 2018

AWARDS

MCIP
  

•  Implemented in line with the 20142018 Remuneration Policy.

•  Final GSIPWith effect from the 2018 bonus Executive Directors are required to invest a minimum of 33% of their bonus into MCIP.

•  Matching shares are awarded based on performance up to a maximum of 3 x matching shares.

•  MCIP award to be made on 1623 April 2019, vesting 9 February 2018 (vesting 16 February 2021)2023 (with a requirement to hold vested matching shares for a furtherone-year retention period).

•  Target award 200%Alan Jope and Graeme Pitkethly both elected to invest the maximum value of base salarytheir 2018 bonus into MCIP investment shares, giving a maximum value from the matching shares for the CEO (based on current salary = £1,010,000)of1,748,972 and 150% of base salary for the CFO (current salary = £656,250).of2,021,700.

•  Maximum vesting of 200% of initial award (so maximum vesting of 400% of base salary for the CEO (£4,040,000), and 300% of base salary for the CFO (£1,968,750)).

•  In addition, atwo-year post- vesting retention period will apply to this award (beyond the three-year vesting period) for the CEO and CFO.


Performance conditions are assessed over a three-yearfour-year period. The performance conditions and target ranges for 20182019 awards under the MCIP will be as follows:


LOGO

Performance at threshold results in no matching shares being awarded, target performance results in an award of 1.5 x matching shares, up to a maximum award of 3 x matching shares, with straight-line vesting between threshold and maximum. Participants are required to hold all their own investment shares and remain employed by Unilever for the duration of the relevant performance period.

52Governance ReportAnnual Report on Form 20-F 2018


ELEMENTS OF

REMUNERATION    

AT A GLANCEADDITIONAL INFORMATION

MCIP (CONTINUED)

The target range for ROIC has been reduced by 50bps from the MCIP 2018- 21 cycle to reflect the dilutive impact of IFRS16 Lease Accounting. The target range for UEPS was increased in previous MCIP cycles to reflect the benefit of the Share Buyback programmes in 2017 and 2018 and the significant step up in margin required to achieve an Underlying Operating Margin of 20% by 2020. The target range has now been normalised to reflect the reduction in operational leverage following the earlier years of margin improvement and the reduction in benefit from the Share Buyback programmes over the 2019-2022 performance cycle. Accordingly, the UEPS target range returns towards the levels originally set for MCIP 2017-2020 of 5% to 10%. The range has been widened to reflect the impact of exchange rate volatility in delivering current currency UEPS over a four-year plan cycle. The Committee views 6% compound annual growth in UEPS as a stretching but achievable target for 2019-2022. It should also be noted that the Remuneration Policy provides the Committee with the ability to adjust the formulaic outcome of MCIP by +/- 10% to reflect the underlying performance of the business.

Performance update on Sustainability Progress Index for MCIP:

With effect from 2017, one of the performance measures for MCIP is our progress on sustainability, measured by the sustainability progress index (SPI). The SPI is an assessment made jointly by the Compensation Committee and the Corporate Responsibility Committee (CRC) taking into account Unilever’s wider progress on sustainability together with progress towards the targets in our reported USLP scorecard. The Committees determine a numerical rating for the previous year’s SPI in the range of zero to 200%; annual ratings will then be tallied as an average SPI Index for each four-year MCIP performance period. At the end of the year, the Committees will disclose a progress report on the year’s SPI performance assessment. At the end of the MCIP performance period the Committee will disclose a narrative setting out the SPI performance achieved and the corresponding outcome that the Committee has determined for the SPI over the four-year cycle.

The SPI score for MCIP performance years 2017 and 2018 (relating to the USLP reports of 2016 and 2017 respectively) is set out below.

To avoid over-focus on a small number of elements, the 2017 SPI assessment was undertaken on a holistic basis. USLP targets were assessed on progress towards the target’s end date, rather than in the year. Each target was rated as:on-plan for target date achievement;off-plan for target date; and percentage achieved by target date (where the target date has already passed).

For the 2018 assessment, the SPI was reviewed in terms of: (i) progress towards the 10 USLP pillar targets; (ii) Unilever’s transformational change agenda; (iii) our performance on sustainable living brands; and (iv) the impact of Unilever’s activity on Sustainability. Thereby, the SPI assessment included progress of important workstreams as well as towards wider ambitions which flow from the USLP about how we should lead industry and coalition groups to drive change. This recognises major problems that are central to our business, such as for example the contribution of Palm Oil to deforestation and climate change, or the damage to the oceans, food chains and fresh water supplies from single use plastics.

MCIP performance year (USLP Report year)

SPI

score

Summary of rationale for SPI score
     LOGO

2017 (USLP Report 2016)

120

2016 saw good progress across the USLP with 80% of our detailed targets ‘on track’, and seven of the nine pillar targets on track. We continued to pursue our transformational change agenda with impact, driving action on Water Sanitation and Hygiene (WASH), climate change, sustainable agriculture and empowering women at the same time as driving business growth through morepurpose-led brands. Our Sustainable Living Brands grew 50% faster than the rest of the business. We had the top position in the most important independent rankings and indices worldwide.

Annual Report on Form 20-F 2018Governance Report53


DIRECTORS’ REMUNERATION REPORTCONTINUED

ELEMENTS OF REMUNERATION    AT A GLANCEADDITIONAL INFORMATION

MCIP (CONTINUED)

MCIP performance

year (USLP

Report year)

SPI

score

Summary of rationale for SPI score

2018 (USLP Report 2017)

120

In 2017 we made significant progress on our transformational change agenda with impact, driving action on WASH, climate change, sustainable agriculture, empowering women and responsible digital marketing. We also improved our progress on brands with purpose, with Sustainable Living Brands contributing 70% of turnover growth. Unilever’s activities remained highly influential with consistently high scores on independent rankings and indices worldwide. Internally our employee engagement scores showed very strong affiliation with our USLP and sustainable growth. We remained ‘on track’ for seven of the nine pillar targets (except Water and the Inclusive Business pillar) and around 80% of our 50+ USLP targets. A number have been achieved well in advance of their target date.


For 2019, the three business-focusedCRC will again review which elements should be included in the SPI performance conditions, 25% of target awards vest for achieving threshold performance, 100% for targetassessment. Throughout 2019 the CRC will review progress on sustainability with a view to providing the Committee with their annual SPI assessment and 200% for maximum performance (with straight-line vesting between threshold and maximum). For the TSR measure, 50% of the target award vests for threshold performance at 10th place, 100% at 7th place, and 200% vests at 3rd place or above (with straight-line vesting occurring between these points).recommendation.

ULTIMATE REMEDY/MALUS AND CLAW-BACK

Grants under the GSIP and MCIP are subject to ultimate remedy as explained in the Remuneration Policy. Malus and claw-back apply to all performance-related payments as explained in the Remuneration Policy.

In 2018, the Committee did not reclaim or claw back any of the value of awards of performance-related payments to Executive Directors.

SINGLE FIGURE OF REMUNERATION AND IMPLEMENTATION OF THE REMUNERATION POLICY IN 2018 FOR OUR CEO (PAUL POLMAN) AND CFO (GRAEME PITKETHLY)

The table below shows a single figure of remuneration for each of our Executive Directors for the years 2017 and 2018. Theyear-on-year comparison reflects the implementation of our new Reward Framework for Executive Directors in May 2018, and so is impacted by bothmid-year structural change (with prior figures refreshed to provide a comparison point as detailed in the explanatory footnotes) and ongoing fluctuation in the exchange rates used to convert pay elements denominated in pounds sterling to euros for reporting purposes. A full overview of our ‘Fixed Pay’ model as it now applies to our Executive Directors is set out in the Chair Letter on page 50.


  Paul Polman      

  CEO (UK) (€’000)      

   Graeme Pitkethly
CFO (UK) (€’000)
 
          2018   2017         2018      2017 

Fixed Pay elements

  (A) Fixed Pay(a)   1,602    1,439    1,058   978 
  (B) Conditional supplemental pension(b)   44    134        

Fixed Pay elements(sub-total)

     1,646    1,573    1,058   978 

(C) Other benefits

     526    613    26   24 

(D) Annual bonus

     1,926    2,307    1,006   1,124 

Long-term incentives

  (E) MCIP matching shares – (required by UK law)   2,742    2,042    683(c)    285(c)  


(F) GSIP performance shares – (required by UK law)

   4,886    5,126    2,267(c)    704(c)  
     

Long-term incentives(sub-total)

   7,628    7,168    2,950   989 

Total remuneration paid – (required by UK law) (A+B+C+D+E+F)

   11,726    11,661    5,040   3,115 

(G) Share awards (required by Dutch law)

   4,535    7,154    1,774   2,187 

Total remuneration paid – (required by Dutch law) (A+B+C+D+G)

   8,633    11,647    3,864   4,313 

(a)

‘Fixed Pay’ for these purposes comprises each individual’s basic salary and fixed allowance paid in the period prior to May 2018 and each individual’s Fixed Pay paid thereafter following the implementation of our new Reward Framework for Executive Directors. 2017 numbers are restated to provide a comparison point, with the 2017 figure for Fixed Pay comprising base salary plus fixed allowance accordingly (with 2017 Fixed Pay of 1,439 for Paul Polman comprising 1,154 base salary plus 285 fixed allowance, and 2017 Fixed Pay of 978 for Graeme Pitkethly comprising 750 base salary plus 228 fixed allowance (all figures in‘000)).


(b)

‘Conditional Supplemental Pension’ for these purposes comprises the conditional supplemental pension paid to Paul Polman in the period prior to May 2018, at which point it was incorporated into his ‘Fixed Pay’ as described in last year’s Directors’ Remuneration Report.

(c)

Graeme Pitkethly’s GSIP and MCIP values in the above single figure table for 2017 include GSIP performance shares and MCIP matching shares previously granted to him in 2015 before his appointment as an Executive Director, and include gross delivery costs (including tax and social security).

Where relevant, amounts for 2018 have been translated into euros using the average exchange rate over 2018 (1 = £0.8835 / CHF 1.1573), excluding amounts in respect of MCIP and GSIP which have been translated into euros using the exchange rate at vesting date of 11 February 2019 (1 = £0.8784). Amounts for 2017 have been translated into euros using the average exchange rate over 2017 (1 = £0.8756 / CHF 1.1061), excluding amounts in respect of MCIP and GSIP which have been translated into euros using the exchange rate at vesting date of 13 February 2018 (1 = £0.8882).

We do not grant our Executive Directors any personal loans or guarantees.

54Governance ReportAnnual Report on Form 20-F 2018


ELEMENTS OF SINGLE FIGURE REMUNERATION 2018

(A) FIXED PAY

For 2018, this comprises each individual’s base salary and fixed allowance paid prior to 1 May 2018 (translated into euros where necessary using the average exchange rate over 2018 of1 = £0.8835), and each individual’s Fixed Pay paid from 1 May 2018 onwards following the implementation of our new Reward Framework for Executive Directors (paid in euros), for a total of:

CEO –1,601,582

CFO –1,058,298

(B) CONDITIONAL SUPPLEMENTAL PENSION

CEO (Paul Polman):Conditional supplemental pension provision agreed with Paul Polman on hiring, which will be paid on his retirement (or his death or total disability prior to retirement). Contributions were made for the period up to 1 May 2018 (when this item was discontinued upon the implementation of our new Reward Framework for Executive Directors) at the rate of 12% of a capped salary equivalent to £976,028, resulting in contributions for 2018 of £39,041.

(C) OTHER BENEFITS

For 2018 this comprises:


      Paul Polman
CEO (UK)

(€)


(a) 


Graeme Pitkethly
CFO (UK)

(€)


(a) 

    2018  2018 

Medical insurance cover and actual tax return preparation costs

   44,896   17,702 

Provision ofdeath-in-service benefits and administration

   11,707   8,340 

Payment to protect against difference between employee social security obligations in country of residence versus UK

   469,788   0 

Total


                   526,391                     26,042 

(a)

The numbers in this table are quoted in euros (translated where necessary using the average exchange rate over 2018 of1 = £0.8835 / CHF 1.1573.

(D) ANNUAL BONUS

Annual bonus 2018 actual outcomes

CEO –1,925,810 (which is 51% of maximum, 114% of Fixed Pay).

CFO –1,005,821 (which is 51% of maximum, 91% of Fixed Pay).

This includes cash and the portion of annual bonus that Executive Directors have indicated will bere-invested in shares under the MCIP (satisfying the requirement now effective to invest at least 33%). See below for details. Performance against targets:

LOGO

Further details of the annual bonus outcomes are described in the Chair Letter on page 50. The calculatedpay-out for Unilever’s 2018 performance ratio of 76% was endorsed by the Committee as representing a balanced assessment of underlying performance of the business.

Paul Polman

LOGO

*

Figure reflects Paul Polman’s decision not to accept the 5% increase in Fixed Pay proposed at the 2018 AGMs.

Graeme Pitkethly

LOGO

Annual Report on Form 20-F 2018Governance Report55


DIRECTORS’ REMUNERATION REPORTCONTINUED

Annual bonus measures are not impacted by share price growth. Paul Polman’s annual bonus was paid to him wholly in Unilever N.V. shares (after deduction for tax withholding) which he will be required to hold until the second anniversary of his retirement date (see page 60 for further details about leaving arrangements for Paul Polman).

(E) MCIP – UK LAW REQUIREMENT

2018 OUTCOMES

This includes MCIP matching shares granted on 11 February 2016 (based on the percentage of 2015 annual bonus that Paul Polman and Graeme Pitkethly had invested in Unilever shares, as well as performance in the three-year period to 31 December 2018) which vested on 11 February 2019. Further details of the performance measures (including the impact of our April 2017 toughening of performance measures to align thenon- GAAP margin measure from COM to UOM) are disclosed below in note (F).

The values included in the single figure table for 2018 are calculated by multiplying the number of shares granted on 11 February 2016 (including additional shares in respect of accrued dividends through to 31 December 2018) by the level of vesting (132% of target award) and the share prices on the date of vesting (NV48.55 and PLC £42.06). Performance measures and performance against them are as set out in the table under heading (F) below. These have been translated into euros using the exchange rate on the date of vesting (1 = £0.8784). These results indicate a value of669,930 delivered through performance and2,072,491 delivered through share price growth for Paul Polman, and a value of188,506 delivered through performance and492,950 delivered through share price growth for Graeme Pitkethly.

(F) GSIP – UK LAW REQUIREMENT

2018 OUTCOMES

This includes GSIP performance shares granted on 11 February 2016, based on performance in the three-year period to 31 December 2018, which vested on 11 February 2019.

The values included in the single figure table for 2018 are calculated by multiplying the number of shares granted on 11 February 2016 (including additional shares in respect of accrued dividends through to 31 December 2018) by the level of vesting (132% of target award) and the share price on the date of vesting (NV48.55 and PLC £42.06). These have been translated into euros using the exchange rate on the date of vesting (1 = £0.8784). These results indicate a value of1,347,596 delivered through performance and3,524,011 delivered through share price growth for Paul Polman, and a value of625,424 delivered through performance and1,635,506 delivered through share price growth for Graeme Pitkethly.

Performance against targets:

LOGO

(a)

For the relative TSR measure, Unilever’s TSR is measured against a comparator group of other consumer goods companies. TSR measures the return received by a shareholder, capturing both the increase in share price and the value of dividend income (assuming dividends are reinvested). The TSR results are measured on a common currency basis to better reflect the shareholder experience. The current TSR peer group consists of 18 companies (19 including Unilever) as follows:


Avon


Colgate-Palmolive


Henkel


L’Oréal


Reckitt Benckiser

Beiersdorf

Danone

Kao

Nestlé

Shiseido

Campbell Soup

General Mills

Kellogg’s

PepsiCo

Coca-Cola

Estée Lauder

Kimberly-Clark

Procter & Gamble

The Committee may change the TSR vesting levels set out above if the number of companies in the TSR comparator group changes (eg via M&A activity etc).

Annual Report on Form 20-F 2017Beiersdorf  Governance ReportDanone  63


DIRECTORS’ REMUNERATION REPORTCONTINUED

ELEMENTS OF

REMUNERATION    

Kao
  AT A GLANCENestlé  ADDITIONAL INFORMATIONShiseido

MCIP

•  Implemented in line with the 2018 Remuneration Policy.

•  MCIP award to be made on 3 May 2018 (vesting 16 February 2022).

•  Paul Polman elected to invest the value of 67% (£1,353,400) of his 2017 annual bonus into the MCIP.

•  Graeme Pitkethly elected to invest the value of 67% (£659,531) of his 2017 annual bonus in MCIP investment shares.

•  Matching shares are awarded based on performance up to a maximum of 3 x matching shares.

•  Therefore the maximum value from the matching shares for the CEO would be £4,060,200 and for the CFO would be £1,978,594.

Performance conditions are assessed over a four-year period. The performance conditions and target ranges for 2018 awards under the MCIP will be as follows:

LOGO

Performance at threshold results in no matching shares being awarded, target performance results in an award of 1.5 x matching shares, up to a maximum award of 3 x matching shares, with straight-line vesting between threshold and maximum. Participants are required to hold all their own investment shares and remain employed by Unilever for the duration of the relevant performance period.

It is the Committee’s intention that management should be assessed against the progress they make on the USLP as a whole, rather than selected components of it. Accordingly, each year the Committee will determine a numerical rating for the previous year’s MCIP Sustainability Progress Index in the range of zero to 200%, with 100% representingon-target performance; annual ratings will then be tallied as an average index for each four-year MCIP performance period. At the end of the MCIP performance period, the Committee will disclose a full narrative setting out the performance achieved and the corresponding outcome that the Committee determines for the Sustainability Progress Index.

64Campbell Soup  Governance ReportGeneral Mills  Annual Report on Form 20-F 2017Kellogg’sPepsiCo


ULTIMATE REMEDY/MALUS AND CLAW-BACK

Grants under the GSIP and MCIP are subject to ultimate remedy as explained in the 2018 Remuneration Policy. Malus and claw-back apply to all performance-related payments as explained in the 2018 Remuneration Policy.

In 2017, the Committee did not reclaim or claw back any of the value of awards of performance-related payments to Executive Directors.

SINGLE FIGURE OF REMUNERATION AND IMPLEMENTATION OF THE REMUNERATION POLICY IN 2017 FOR EXECUTIVE DIRECTORS

The table below shows a single figure of remuneration for each of our Executive Directors, for the years 2016 and 2017.


Paul Polman

CEO (UK)

(€’000)


Graeme Pitkethly
CFO (UK)

(€’000)

 
          2017   2016         2017       2016(a) 

(A) Base salary

   1,154    1,239    750    511 

(B) Fixed allowances and other benefits

   898    855    252    185 

(C) Annual bonus

   2,307    2,289    1,124    928 

(D) MCIP matching shares – (required by UK law)                                                      

   2,042    1,240    285(b)    153(b) 

Long-term incentives


(E) GSIP performance shares – (required by UK law)                                                 

   5,126    2,603    704(b)    305(b) 

Long-term incentives(sub-total)

   7,169    3,843    989    458 

(F) Conditional supplemental pension

   134    144    -    - 

Total remuneration paid – (required by UK law) (A+B+C+D+E+F)

   11,661    8,370    3,115    2,082 

(G) Share awards (required by Dutch law)

   7,154    3,170    2,187    674 

Total remuneration paid – (required by Dutch law) (A+B+C+F+G)

   11,647    7,697    4,313    2,298 

(a)The figures included relate to amounts paid or payable to Graeme Pitkethly for his services from 21 April 2016 for the remainder of the year, being the date on which he was appointed as an Executive Director of the Boards of NV and PLC.
(b)Graeme Pitkethly’s GSIP and MCIP values in the above single figure table for 2016 and 2017 include GSIP performance shares and MCIP matching shares previously granted to him in 2014 and 2015, before his appointment as an Executive Director. The value shown for 2017 for awards granted in 2015 include gross delivery costs, including tax and social security.

Where relevant, amounts for 2017 have been translated into euros using the average exchange rate over 2017 (1 = £0.8756), excluding amounts in respect of MCIP and GSIP which have been translated into euros using the exchange rate at vesting date of 13 February 2018 (1 = £0.8882). Amounts for 2016 have been translated into euros using the average exchange rate over 2016 (1 = £0.8152), excluding amounts in respect of MCIP and GSIP which have been translated into euros using the exchange rate at vesting date of 14 February 2017 (1 = £0.8494).

We do not grant our Executive Directors any personal loans or guarantees.

ELEMENTS OF SINGLE FIGURE REMUNERATION 2017

(A) BASE SALARY

Salary set in sterling and paid in 2017:

CEO – £1,010,000.
CFO – £656,250.

(B) FIXED ALLOWANCE AND OTHER BENEFITS

For 2017 this comprises:


      Paul Polman
CEO (UK)

(£)


(a) 


Graeme Pitkethly
CFO (UK)

(£)


(a) 

    2017  2017 

Fixed allowance

   285,525   228,420 

Medical insurance cover and actual tax return preparation costs

   102,238   17,130 

Provision ofdeath-in-service benefits and administration

   13,952   6,518 
Payment to protect against difference between employee social security obligations in country of residence versus UK   496,106   - 

Total


897,821


252,068


(a)The numbers in this table are quoted in euros (translated from sterling where necessary using the average exchange rate over 2017 of1 = £0.8756).

Annual Report on Form 20-F 2017Coca-Cola  Governance ReportEstée Lauder  65


DIRECTORS’ REMUNERATION REPORTCONTINUED

(C) ANNUAL BONUS

Annual bonus 2017 actual outcomes

CEO – £2,020,000 (which is 100% of maximum, 200% of base salary).
CFO – £984,375 (which is 100% of maximum, 150% of base salary).

This includes cash and the portion of annual bonus that Executive Directors have indicated will bere-invested in shares under the MCIP. See below for details. Performance against targets:

LOGO

Further details of the annual bonus outcomes are described in the Chair Letter on page 47. The calculatedpay-out for Unilever’s 2017 performance ratio of 122% was endorsed by the Committee as representing a balanced assessment of underlying performance of the business.

Paul Polman

In determining annual bonus outcomes for Paul Polman, the Committee also considered his leadership and very strong personal performance. In 2017 Paul led Unilever to take a further step up in delivery with another year of strongtop- and bottom-line growth. This consistency of performance is a key hallmark of his leadership and it has now been firmly established over the 9 years since he became CEO. The quality of the performance in 2017 matched the strength of the results with broad-based growth across all retained Categories and strong levels of brand support and investment. Most importantly, through a series of initiatives culminating in ‘Connected 4 Growth’ (C4G), announced in fall 2016, Paul has taken Unilever closer to our consumers through an organization able to respond with the agility required to compete effectively in our rapidly changing marketplace. During the year Unilever significantly strengthened its portfolio through acquisitions and disposals. Engagement scores have remained high (74%) and Pride in Unilever remains at a remarkable 90%. In addition to his firm internal leadership Paul continues to build Unilever’s external profile and reputation, helping the Company to attract and retain key talent as a leading employer of choice across our markets worldwide. In 2017 Paul received a number of notable awards for his business and humanitarian leadership. As a consequence of the review of his personal performance, Paul Polman was awarded a personal performance multiplier of 140%. This resulted in his receiving an annual bonus capped by our remuneration policy at 200% of his base salary, calculated as follows:

LOGO

Graeme Pitkethly

In determining annual bonus outcomes for Graeme Pitkethly, the Committee considered his leadership and very strong personal commitment to the performance of the business. In 2017, Graeme led Unilever’s capital allocation, services delivery, technology investment and performance management to a year of good delivery. Record savings throughzero-based budgeting provided the flexibility to invest behind our brands and capabilities to fuel future growth while increasing our margins. 2017 was also a year of accelerated portfolio change, with several strategic acquisitions and the divestiture of the Spreads business repositioning Unilever for future growth. Capital allocation was disciplined, with new leverage targets achieved and the Unilever NV preference shares repurchased, setting a platform for greater strategic flexibility and improved corporate governance. In 2017, Unilever delivered a strong step up in profitability and cash flow, maintaining competitive growth, while increasing the impact of Finance and ETS across Unilever. As a consequence of the review of his personal performance, Graeme Pitkethly was awarded a personal performance multiplier of 125%. This resulted in his receiving an annual bonus capped by our remuneration policy at 150% of his base salary, calculated as follows:

LOGO

66Kimberly-Clark  Governance ReportProcter & Gamble  Annual Report on Form 20-F 2017


(D) MCIP – UK LAW REQUIREMENT

2017 OUTCOMES

This includes MCIP matching shares granted on 13 February 2015 (based onThe Committee may change the percentage of 2014 annual bonus that Paul Polman and Graeme Pitkethly had invested in Unilever shares, as well as performance in the three-year period to 31 December 2017) which vested on 13 February 2018. Further details of the performance measures (including the impact of our April 2017 toughening of performance measures to align thenon-GAAP margin measure from COM to UOM) are disclosed below in note (E).

The values included in the single figure table for 2017 are calculated by multiplyingTSR vesting levels set out above if the number of shares granted on 13 February 2015 (including additional shares in respect of accrued dividends through to 31 December 2017) by the level of vesting (148% of target award for the CEO and 142% of target award for the CFO) and the share prices on the date of vesting (NV43.57 and PLC £37.91). The CFO’s award vested at a different level than the CEO’s award as it relates to an award granted in 2015 before his appointment as an Executive Director. Performance measures and performance against them are as set outcompanies in the table below (although the weightings of the measures were different for participants below Board level, so the weightings of each measure in the award that vested for the CFO are Underlying Sales Growth at 30%, Margin Improvement at 30%, Cumulative Operating Cash Flow at 30% and TSR at 10%). These have been translated into euros using the exchange rate on the date of vesting (1 = £0.8882)comparator group changes (eg via M&A activity etc).

(E) GSIP – UK LAW REQUIREMENT

2017 OUTCOMES

This includes GSIP performance shares granted on 13 February 2015, based on performance in the three-year period to 31 December 2017, which vested on 13 February 2018.

The values included in the single figure table for 2017 are calculated by multiplying the number of shares granted on 13 February 2015 (including additional shares in respect of accrued dividends through to 31 December 2017) by the level of vesting (148% of target award for the CEO and 142% of target award for the CFO) and the share price on the date of vesting (NV43.57 and PLC £37.91). The CFO’s award vested at a different level than the CEO’s award as it relates to an award granted in 2015 before his appointment as an Executive Director with the performance measures and weighting as set out under heading (D) above. These have been translated into euros using the exchange rate on the date of vesting (1 = £0.8882).

Performance against targets:

LOGO

(a)For details of comparator group please see page 63.

Further details of the GSIP and MCIP outcomes are described in the Chair Letter on page 47,50, with details of ourstepped-up plans for shareholder value creation (and related treatment of inflight legacy awards) available on our website:


LOGOLOGO www.unilever.com/ara2017/downloads (Compensation Committee Statement: Alignment of Performance Measures for 2017)

On the basis of this performance, the Committee determined that the GSIP and MCIP awards to the end of 20172018 will vest at 148%132% of initial target award levels (ie 74%66% of maximum for GSIP and 99%88% of maximum for MCIP (which is capped at 150% for the Executive Directors)).

(F) CONDITIONAL SUPPLEMENTAL PENSION

CEO (Paul Polman): Conditional supplemental pension provision agreed with Paul Polman on hiring, which will be paid on his retirement (or his death or total disability prior to retirement). Contributions are made at the rate of 12% of capped salary which, in 2017, was £976,028, resulting in contributions of £117,123.

(G) SHARE INCENTIVES – DUTCH LAW REQUIREMENT

As per the Dutch requirements, these costs arenon-cash costs and relate to the expenses recognised for the period following IFRS 2. This is based on share prices on grant dates and a 98% adjustment factor for GSIP shares and MCIP matching shares awarded in 2018, 2017 2016 and 2015.2016.


Annual Report on Form 20-F 201756 Governance Report  67Annual Report on Form 20-F 2018


DIRECTORS’ REMUNERATION REPORTCONTINUED


SCHEME INTERESTS AWARDED IN THE YEAR


PLAN


MCIP(a)

Conditional matching share award made on 173 May 20172018


GSIP(a)

Conditional share award made on

13on 16 February 20172018

  
BASIS OF AWARD  

Based on the level of 20162017 annual bonus paid in 20172018 invested by the CEO and CFO. The following numbers of matching shares were awarded on 173 May 20172018(b)(a):


CEO:

PLC – 0

NV – 26,57850,519


CFO:

PLC – 5,42312,408

NV – 5,42312,408


Maximum vesting results in 150% of targetthe above awards vesting.


The CEO received a target award of 200% of base salary.salary at the time (as disclosed in the Directors’ Remuneration Report 2017).


CEO:

PLC – 30,53226,209

NV – 30,53226,209


The CFO received a target award of 150% of base salary.salary at the time (as disclosed in the Directors’ Remuneration Report 2017).


CFO:

PLC – 14,17112,772

NV – 14,17112,772


Maximum vesting results in 200% of target awards vesting, which translates to a maximum vesting of 400% of base salary for the CEO and 300% of base salary for the CFO.


MAXIMUM FACE VALUE OF AWARDS  


CEO:£1,719,1973,469,898(c)(b)

CFO:£688,6941,685,412(c)(b)


CEO:£4,095,9974,560,247(d)(c)

CFO:£1,901,0992,222,270(d)(c)


THRESHOLD VESTING

(% of (% OF TARGET AWARD)


Four equally weighted long-term performance measures.

0% of the target award vests for threshold performance.


Four equally weighted long-term performance measures. For the three business-focused metrics, 25% of the target award vests for threshold performance. For the TSR measure, 50% of the target award vests for threshold performance.


PERFORMANCE PERIOD


1 January 20172018 – 31 December 20202021

(with a requirement to hold vested matching shares for a furtherone-year retention period).


1 January 20172018 – 31 December 20192020

(with a requirement to hold vested shares for a furtherone-year retention period).


DETAILS OF

PERFORMANCE

MEASURES


Subject to four equally weighted performance measures:


Subject to four equally weighted performance measures:


LOGO

LOGO


LOGOLOGO


Participants are required to hold all their own investment shares and normally to remain employed by Unilever for the duration of the relevant performance period.


(a) Please refer to our website for restated details of the equivalent tables from page 70 of the Directors’ Remuneration Report 2016, which incorrectly stated performance ranges.

LOGOwww.unilever.com/ara2017/downloads     (Compensation Committee Statement: Alignment of Performance Measures for 2017)

(b)Under MCIP, Executive Directors can choose whether they invest in NV or PLC shares, or NV shares or an equal number of shares in each. Executive Directorsand receive a corresponding number of performance-related matching shares. Matching shares will be awarded in the same form as the investment shares (ie in PLC shares, NV shares or an equal number of shares in each). On 173 May 2017,2018, the CEO invested 60%67%1,119,888)1,353,400) and the CFO invested 60%67%453,750)659,531) of their 20162017 annual bonus in MCIP investment shares. Theshares (the CEO elected to invest fully in NV shares. Theshares, and the CFO elected to receive an equal number of shares in each of PLC and NV.NV, in line with the share choice provisions in operation at the time).

(c)(b) 

Face values are calculated by multiplying the number of shares granted on 173 May 20172018 by the share price on that day of PLC £41.54£39.55 and NV49.2545.79 respectively, assuming maximum performance and therefore maximum vesting of 150% for MCIP and then translating into sterlingeuros using an average exchange rate over 20172018 of1 = £0.8756.£0.8835.

(d)(c) 

Face values are calculated by multiplying the number of shares granted on 1316 February 20172018 by the share price on that day of PLC £32.99£38.02 and NV38.9343.97 respectively, assuming maximum performance and therefore maximum vesting of 200% for GSIP and then translating into sterlingeuros using an average exchange rate over 20172018 of1 = £0.8756.£0.8835.


68Annual Report on Form 20-F 2018 Governance Report Annual Report on Form 20-F 201757


MINIMUM SHAREHOLDING REQUIREMENT AND EXECUTIVE DIRECTOR SHARE INTERESTS (UNAUDITED)

The remuneration arrangements applicable to our Executive Directors require them to build and retain a personal shareholding in Unilever (by the later of 2018 or five years from their date of appointment) to align their interests with those of Unilever’s shareholders. Incoming Executive Directors will be required to retain all shares vesting from any share awards made since their appointment until their minimum shareholding requirements have been met in full.

The table below shows the Executive Directors’ share ownership against the minimum shareholding requirements as at 31 December 20172018 and the interest in NV and PLC ordinary shares of Executive Directors and their connected persons as at 31 December 2017.2018.

When calculating an Executive Director’s personal shareholding the following methodology is used:

Base salaryFixed Pay at the date of measurement.measurement, in line with the application of the new Reward Framework to our Executive Directors (resulting in a de facto increase in the share ownership requirement applicable to them from the previous multiple of base salary).

Shares in either Unilever PLC or Unilever N.V. (or a combination of both) will qualify provided they are personally owned by the Executive Director, by a member of his (immediate) family or by certain corporate bodies, trusts or partnerships as required by law from time to time (each a ‘connected person’).

Shares purchased under the MCIP, whether from the annual bonus or otherwise, will qualify as from the moment of purchase as these are held in the individual’s name and are not subject to further restrictions.

Shares or entitlements to shares that are subject only to the Director remaining in employment will qualify on a net of tax basis.

Shares awarded on a conditional basis by way of the GSIP or MCIP will not qualify until the moment of vesting (ie once the precise number of shares is fixed after the three-year vesting period for the GSIP, or a four-year vesting period for the MCIP, has elapsed).

The shares will be valued on the date of measurement or, if that outcome fails the personal shareholding test, on the date of acquisition.

The share price for the relevant measurement date will be based on the average closing share prices and the euro/sterling/US dollar exchange rates from the 60 calendar days prior to the measurement date.

Executive Directors are required to hold shares to the value of 100% of their shareholding requirement for 12 months post cessation of employment at Unilever, and 50% of these shares for 24 months post cessation of employment with Unilever. ULE members are required to build a shareholding of 400% of base salaryFixed Pay (500% for the CEO). This requirement is 150% of base salaryFixed Pay for the ‘Top 100’ management layer below ULE.

EXECUTIVE DIRECTORS’ AND THEIR CONNECTED PERSONS’ INTERESTS IN SHARES AND SHARE OWNERSHIP


   Share ownership
guideline as % of
   Have guidelines   Actual share    
ownership as a %    
     Shares held as at    
1 January 2017(b)
    Shares held as at    
31 December 2017(b)
   base salary (as at
31 December 2017)
   been met (as at
31 December 2017)?
   of base salary (as at    
31 December 2017)(a)
     NV    PLC        NV    PLC

CEO:Paul Polman

   500    Yes    5,293%       824,245    307,239        952,374    314,130

CFO:Graeme Pitkethly

   400    Yes    641%       32,189    42,908        44,496    55,797


Share

ownership

       Actual share    
ownership as     
   

Shares held as at    

1 January 2018(b)

   Shares held as at    
31 December 2018(b)


guideline as %

of Fixed Pay (as

at 31 December

2018)


Have guidelines

been met (as at
31 December

2018)?


a % of Fixed    
Pay (as at 31    

December    

2018)(a)

   NV   PLC       NV   PLC 

CEO:Paul Polman

   500    Yes            4,116%            952,374           314,130              1,118,459           324,351 

CFO:Graeme Pitkethly

   400    Yes    471%      44,496    55,797        35,340    73,495 
(a) 

Calculated based on the minimum shareholding requirements and methodology set out above and the base salaries as detailedheadline Fixed Pay for the CEO and CFO in section (A) on page 65.as at 31 December 2018 (ie1,689,307 for the CEO and1,102,874 for the CFO).

(b) 

NV shares are ordinary0.16 shares and PLC shares are ordinary 319p shares.

During the period between 31 December 20172018 and 21 February 2018,2019, the following changes in interests have occurred:

Graeme Pitkethly purchased 76 PLC shares under the Unilever PLC ShareBuy Plan: 3 on 9 January 20182019 at a share price of £40.795,£40.88, and a further 43 on 8 February 20182019 at a share price of £38.490;£41.75; and

as detailed under headings (D)(E) and (E)(F) on page 67,56, on 1311 February 2018:2019:

Paul Polman acquired 46,878 NV shares following the vesting of his 2015 MCIP award, and 116,972 NV shares following the vesting of his 2015 GSIP award, in accordance with his share choice to receive 100% NV shares on the vesting of these awards; and
Graeme Pitkethly acquired 3,454 PLC shares following the vesting of his 2015 MCIP award, and 4,966 NV shares and 5,013 PLC shares following the vesting of his 2015 GSIP award.

Paul Polman acquired 56,487 NV shares following the vesting of his 2016 MCIP award, and 101,887 NV shares following the vesting of his 2016 GSIP award; and

Graeme Pitkethly acquired 7,057 NV shares and 7,118 PLC shares following the vesting of his 2016 MCIP award, and 46,729 PLC shares following the vesting of his 2016 GSIP award.

The voting rights of the Directors (Executive andNon-Executive) and members of the ULE who hold interests in the share capital of NV and PLC are the same as for other holders of the class of shares indicated. As at 21 February 20182019 none of the Directors’ (Executive andNon-Executive) or other ULE members’ shareholdings amounted to more than 1% of the issued shares in that class of share, excluding the holdings of the Leverhulme Trust and the Leverhulme Trade Charities Trust, which amounted to 5.7%4.19%. All shareholdings in the table above are beneficial. In addition, 68,531,18246,931,182 shares are held by the Leverhulme Trust and 2,035,582 shares are held by the Leverhulme Trade Charities Trust, of which Paul Polman is a director.

INFORMATION IN RELATION TO OUTSTANDING SHARE INCENTIVE AWARDS

As at 31 December 2017,2018, Paul Polman held awards over a total of 316,539317,936 shares which are subject to performance conditions, and Graeme Pitkethly held awards over a total of 94,313139,570 shares which are subject to performance conditions. There are no awards of shares without performance conditions and no awards in the form of options.


Annual Report on Form 20-F 201758 Governance Report  69Annual Report on Form 20-F 2018


DIRECTORS’ REMUNERATION REPORTCONTINUED


MANAGEMENTCO-INVESTMENT PLAN

The following conditional shares vested during 20172018 or were outstanding at 31 December 20172018 under the MCIP:


      Balance of
conditional shares
at 1 January 2017
 Conditional shares   
awarded in 2017(a)
                            

Balance of
conditional shares
at 31 December 2017

       Balance of
conditional shares
at 1 January 2018
 Conditional shares   
awarded in 2018(a)
                            Balance of
conditional shares
at 31 December 2018
 
  Share
type
   

Original

award


Performance   
period   

1 January 2017 to   
31 December 2019   


Price at

award

   Dividend   
shares   
accrued   
during   
the year(d)
   Vested in   
2017(e)
   Additional
shares
earned in
2017
   Price at
vesting
   Shares
lapsed
   

No. of

shares

   Share
type
   

Original

award


Performance period   

1 January 2018 to   
31 December 2021   

   Price at
award
   Dividend   
shares   
accrued   
during   
the year(d)
   Vested in   
2018(e)
   

Additional
shares
earned

in 2018

   Price at
vesting
   Shares
lapsed
   No. of
shares
 

Paul Polman

   NV    116,723(b)   26,578      49.25    2,433       31,964       0   38.805    13,699    100,071    NV    100,071(b)    50,519      45.79         3,477       46,878       15,204         €43.57          0    122,393 
   PLC    0(b)   0      £41.54    0       0       0   £32.855    0    0    PLC    0(b)    0      £39.55    0       0       0         £37.91    0    0 

Graeme Pitkethly

   NV    7,369(c)   5,423      49.25    224       1,964       0   38.805    374    10,678    NV    10,678(c)    12,408      45.79    653       0       0         €43.57    0    23,739 
   PLC    9,765(c)   5,423      £41.54    326       1,983       0   £32.855    377    13,154    PLC    13,154(c)    12,408      £39.55    688       3,454       1,023         £37.91    0    23,819 


(a)(a) 

Each award of conditional matching shares vests four years after the date of the award, subject to performance conditions and an additional retention period (further details can be found on page 68.57). Awards are all subject to continued employment and maintenance of the underlying investment shares. Under MCIP, Executive Directors are able to choose whether they invest in PLC or NV shares or an equal number of shares in each. Executive Directorseach, and receive a corresponding number of performance-related matching shares.shares (currently 1.5 x matching shares for each investment share purchased). Matching shares will be awarded in the same form as the investment shares (ie in PLC shares, NV shares or an equal number of shares in each). On 173 May 2017,2018, Paul Polman and Graeme Pitkethly each invested in the MCIP 60%67% of their annual bonus earned during 20162017 and paid in 2017,2018, and received a corresponding award of 1.5 x matching shares (which will vest, subject to performance, on 16 February 2021)2022).

(b) 

This includes a grant of 41,775 NV shares made on 14 February 2014 (70% of which vested on 14 February 2017), a grant of 29,128 NV shares made on 13 February 2015 (which vested on 13 February 2018), a grant of 39,318 NV shares made on 11 February 2016 (vesting(which vested on 11 February 2019), a grant of 26,578 NV shares made on 17 May 2017 (vesting on 16 February 2021), and 6,5025,047 NV shares from reinvested dividends accrued in prior years in respect of awards.

(c)(c) 

This includes grants that were made to Graeme Pitkethly before his appointment as Executive Director on 21 April 2016 being a grant of 2,139 of each of NV and PLC shares made on 14 February 2014 (84% of which vested on 14 February 2017),(being a grant of 2,215 PLC shares made on 13 February 2015 (vesting(which vested on 13 February 2018), and a grant of 4,912 of each of NV and PLC shares made on 11 February 2016 (vesting(which vested on 11 February 2019), a grant of 5,423 of each of NV and 318PLC shares made on 17 May 2017 (vesting on 16 February 2021) and 343 NV shares and 499604 PLC shares from reinvested dividends accrued in prior years in respect of awards.

(d) 

Reflects reinvested dividend equivalents accrued during 20172018 and subject to the same performance conditions as the underlying matching shares.

(e) 

The 1413 February 20142015 grant vested on 1413 February 20172018 at 70%148% for Paul Polman and 84%142% for Graeme Pitkethly. In accordance with Unilever’s existing remuneration policy, Executive Directors are able to choose whether they receive any shares due to vest under MCIP in PLC or NV shares or an equal number of shares in each. Paul Polman elected for share choice and chose to receive his shares in the form of 100% NV shares, and Graeme Pitkethly elected to receive his shares in the form of an equal number of shares in each of PLC and NV.

LOGOwww.unilever.com/ara2016/downloads     (existing remuneration policy set out in Annual Report & Accounts 2016)

GLOBAL SHARE INCENTIVE PLAN

The following conditional shares vested during 20172018 or were outstanding at 31 December 20172018 under the GSIP:


      Balance of
conditional shares
at 1 January 2017
 Conditional shares   
awarded in 2017(a)
     ��                      Balance of
conditional shares
at 31 December 2017
       Balance of
conditional shares
at 1 January 2018
 Conditional shares    
awarded in 2018(a)
                            

Balance of

conditional shares
at 31 December 2018

 
  Share
type
   

Original

award


Performance   
period   

1 January 2017 to   
31 December 2019   

   Price at
award
   

Dividend   
shares   
accrued   
during   

the year(d)

   Vested in   
2017(e)
   Additional
shares
earned in
2017
   Price at
vesting
   Shares
lapsed
   No. of
shares
   Share
type
   

Original

award

 Performance period    
1 January 2018 to    
31 December 2020    
   Price at
award
   Dividend    
shares    
accrued    
during    
the  year(d)
   Vested in   
2018(e)
   Additional
shares
earned in
2018
   Price at
vesting
   Shares
lapsed
   No. of
shares
 

Paul Polman

   NV    122,311(b)   30,532      38.93    2,809       33,437       0   38.805    14,330    107,885    NV    107,885(b)    26,209       43.970         3,100        58,738       19,051       €43.57    0    97,507 
   PLC    123,129(b)   30,532      £32.99    3,143       33,755       0   £32.855    14,466    108,583    PLC    108,583(b)    26,209       £38.015    3,309        59,294       19,231       £37.91    0    98,038 

Graeme Pitkethly

   NV    24,752(c)   14,171      38.93    886       3,915       0   38.805    745    35,149    NV    35,149(c)    12,772       43.970    1,459        4,966       1,469       €43.57    0    45,883 
   PLC    24,874(c)   14,171      £32.99    991       3,952       0   £32.855    752    35,332    PLC    35,332(c)    12,772       £38.015    1,557        5,013       1,482       £37.91    0    46,130 


(a) 

Each award of conditional shares vests three years after the date of the award, subject to performance conditions (further details can be found on page 68.57). The 20172018 award was made on 1316 February 20172018 (vesting 1317 February 2020)2021).

(b) 

This includes a grant of 43,700 of each of NV and PLC shares made on 14 February 2014 (70% of which vested on 14 February 2017), a grant of 36,497 of each of NV and PLC shares made on 13 February 2015 (vesting(which vested on 13 February 2018), a grant of 35,115 of each of NV and PLC shares made on 11 February 2016 (vesting(which vested on 11 February 2019), a grant of 30,532 of each of NV and 6,999PLC shares made on 13 February 2017 (vesting on 13 February 2020) and 5,741 NV shares and 7,8176,439 PLC shares from reinvested dividends accrued in prior years in respect of awards.

(c) 

This includes grants that were made to Graeme Pitkethly before his appointment as Executive Director on 21 April 2016 being a grant of 4,263 of each of NV and PLC shares made on 14 February 2014 (84% of which vested on 14 February 2017),(being a grant of 3,216 of each of NV and PLC shares made on 13 February 2015 (which vested on 13 February 2018), and a grant of 16,297 of each of NV and PLC shares made on 11 February 2016 (vesting(which vested on 11 February 2019)), a grant of 14,171 of each of NV and PLC shares made on 13 February 2017 (vesting on 13 February 2020), and 9761,465 NV shares and 1,0981,648 PLC shares from reinvested dividends accrued in prior years in respect of awards.

((d)d)

Reflects reinvested dividend equivalents accrued during 2017,2018, subject to the same performance conditions as the underlying GSIP shares.

(e) 

The 1413 February 20142015 grant vested on 1413 February 20172018 at 70%148% for Paul Polman and 84%142% for Graeme Pitkethly. In accordance with Unilever’s existing remuneration policy, Executive Directors are able to choose whether they receive any shares due to vest under GSIP in PLC or NV shares or an equal number of shares in each. Paul Polman elected for share choice and chose to receive his shares in the form of 100% NV shares. Therefore, upon vesting, his 1413 February 20142015 PLC award was cancelled and converted and delivered to him as 33,74958,234 NV shares (resulting in a total vesting for the 1413 February grant of 67,186116,972 NV shares). Graeme Pitkethly elected to receive his shares in the form of an equal number of shares in each of PLC and NV.

LOGOwww.unilever.com/ara2016/downloads     (existing remuneration policy set out in Annual Report & Accounts 2016)

On 16 February 2018, under the GSIP Paul Polman received an award of 26,209 NV and 26,209 PLC performance-related shares, and Graeme Pitkethly received an award of 12,772 NV and 12,772 PLC performance-related shares.


70Annual Report on Form 20-F 2018 Governance Report Annual Report on Form 20-F 201759


EXECUTIVE DIRECTORS’ SERVICE CONTRACTS

Starting dates of our Executive Directors’ service contracts:

Paul Polman:Polman (CEO and Executive Director to 31 December 2018): 1 October 2008 (signed on 7 October 2008)2008, and terminated due to retirement with effect from 2 July 2019); and

Graeme Pitkethly: 1 October 2015 (signed on 16 December 2015).

Arrangements for Alan Jope will be in line with our Remuneration Policy and effective from his date of appointment as CEO on 1 January 2019.

Service contracts are available to shareholders to view at the AGMs or on request from the Group Secretary, and can be terminated with 12 months’ notice from Unilever or six months’ notice from the Executive Director. A payment in lieu of notice can be made of no more than one year’s base salary, fixed allowance and other benefits. Other payments that can be made to Executive Directors in the event of loss of office are disclosed in our existing Remuneration Policy which is available on our website, and in our Remuneration Policy detailed above (in the event of its approval by shareholders).website.


LOGOLOGO www.unilever.com/ara2016/downloads    (existing remuneration policy set out in Annual Report & Accounts 2016)remuneration-policy

PAYMENTS TO FORMER DIRECTORS / PAYMENTS FOR LOSS OF OFFICE

There have been no payments to former Directors or payments for loss of office during the year.

Paul Polman stepped down as CEO and Executive Director with effect from 31 December 2018, and will retire from employment with Unilever effective 2 July 2019 (the “Retirement Date”). Until his Retirement Date he will assist with an orderly transition and handover of responsibilities.

In accordance with his service agreement and our Remuneration Policy, Paul Polman:

will continue to receive Fixed Pay and benefits up to the Retirement Date;

remained eligible to receive a discretionary bonus in respect of 2018, determined by the Compensation Committee in the normal way and at the normal time dependent on the Company’s performance, and paid to him wholly in Unilever N.V. shares (after deduction for tax withholding) which he will be required to hold until the second anniversary of the Retirement Date (see pages 55 to 56 for details);

will not participate in the MCIP 2019-2022 and will not receive any bonus in respect of the 2019 financial year;

as he is retiring, will be treated as a good leaver and hence his outstanding awards under the MCIP and GSIP long term share incentive plans will remain capable of vesting in accordance with the rules of the relevant plan. Consequently, it is anticipated that these awards will bepro-rated as follows reflecting Paul Polman’s actual length of service within the vesting period:

a) GSIP and MCIP 2016 – 2018 vested on 11 February 2019: 100% (see page 56 for details);

b) GSIP 2017 – 2019 vesting around 13 February 2020: 79%;

c) MCIP 2017 – 2020 vesting around 17 February 2021: 57%;

d) GSIP 2018 – 2020 vesting around 17 February 2021: 46%; and

e) MCIP 2018 – 2021 vesting around 16 February 2022: 31%;

and will then vest, subject to Company performance, on the respective vesting dates;

will remain subject to the Company’s minimum shareholding requirements and needs to retain Unilever shares worth at least 5 times his annual Fixed Pay level until the first anniversary of the Retirement Date and 50% of that amount until the second anniversary of the Retirement Date. Additionally, the Company will continue to pay Paul Polman’s social security obligation in his country of residence on all Unilever source income arising to protect him against the difference between the employee social security obligations in his country of residence versus the UK. The precise cost of this provision will depend on Paul Polman’s total earnings (which will primarily be influenced by the value of his outstanding MCIP and GSIP share awards when they vest) and applicable rates of social security;

will continue to receive tax return preparation services in respect of total Unilever earnings;

through to the Retirement Date or to the later date as specified below, after which such benefits will cease, will continue to receive:

Family Medical Cover to 31 December 2019; and

Death & Disability Insurance Cover.

Details of all payments made to and receivable by Paul Polman will be disclosed in the Directors’ Remuneration Report within the Annual Report and Accounts as required going forward.

IMPLEMENTATION OF THE REMUNERATION POLICY IN 20182019 FORNON-EXECUTIVE DIRECTORS

The Committee reviewedcurrentNon-Executive Director fee levels in 2017 against established external benchmarks,will not be changed for 2019, and noted thatwe will review fee levels had essentially remained unchanged for six years (with2020 during the exceptioncourse of Chairman and Vice Chairman fee levels, which had been adjusted on succession in those positions). Accordingly, the Committee recommended updatingNon-Executive Director fee levels as set out in theyear. The table below to be implementedoutlines the current fee structure with effect from the 2018 AGMs (with fees paid 50% by each of Unilever N.V. and Unilever PLC at(at a constant GBP:EUR exchange rate of £1 =1.2817):


Roles and responsibilities  Current
Annual Fee £
   Proposed
Increase £ p.a.
   Revised
Annual Fee £
   Revised
Annual Fee €
 
BasicNon-Executive Director Fee   75,000    10,000    85,000    108,949 
Chairman (all inclusive)   600,000    25,000    625,000    801,092 
Vice Chairman (modular)   30,000    10,000    40,000    51,270 
Member of Nominating and Corporate Governance Committee   10,000    5,000    15,000    19,226 
Member of Compensation Committee   10,000    5,000    15,000    19,226 
Member of Corporate Responsibility Committee   10,000    5,000    15,000    19,226 
Member of Audit Committee   15,000    5,000    20,000    25,635 
Chair of Nominating and Corporate Governance Committee   20,000    10,000    30,000    38,452 
Chair of Compensation Committee   20,000    10,000    30,000    38,452 
Chair of Corporate Responsibility Committee   20,000    10,000    30,000    38,452 
Chair of Audit Committee   30,000    10,000    40,000    51,270 
Roles and responsibilitiesCurrent Annual Fee €  
BasicNon-Executive Director Fee           108,949  
Chairman (all inclusive)801,092  
Vice Chairman (modular)51,270  
Member of Nominating and Corporate Governance Committee19,226  
Member of Compensation Committee19,226  
Member of Corporate Responsibility Committee19,226  
Member of Audit Committee25,635  
Chair of Nominating and Corporate Governance Committee38,452  
Chair of Compensation Committee38,452  
Chair of Corporate Responsibility Committee38,452  
Chair of Audit Committee51,270  

All reasonable travel and other expenses incurred byNon-Executive Directors in the course of performing their duties are considered to be business expenses.Non-Executive Directors also receive expenses relating to the attendance of the Director’s spouse or partner, when they are invited by Unilever.


Annual Report on Form 20-F 201760 Governance Report  71Annual Report on Form 20-F 2018


DIRECTORS’ REMUNERATION REPORTCONTINUED


SINGLE FIGURE OF REMUNERATION IN 20172018 FORNON-EXECUTIVE DIRECTORS

The table below shows a single figure of remuneration for each of ourNon-Executive Directors, for the years 20162017 and 2017.2018.


     2018         2017    
     Total      Total   
     2017 ��        2016       Fees(a)   Benefits(b)    remuneration    Fees(a)    Benefits(b)    remuneration   
Non-Executive Director   

Fees

    €’000

(a) 


Benefits

€’000

(b) 


Total
remuneration
€’000


Fees

’000

(a) 


Benefits

’000

(b) 


Total
remuneration
’000


       €’000  €’000   €’000    PLC   NV   ’000   

Marijn Dekkers(c)

   727   13   740    502  18  520    744  13  757    727   13   740   

Michael Treschow(d)(h)

             230  5  235 

Nils Andersen

   109   3   112    111  17  128    121  9  130    109   3   112   

Laura Cha

   107      107    119     119    115     115    107      107   

Vittorio Colao

   103      103    107     107 

Louise Fresco(g)

   38      38    119     119 

Vittorio Colao(d)

   127     127    103      103   

Louise Fresco(e)

             38      38   

Ann Fudge(f)

   151   24   175    157     157    50     50    151   24   175   

Judith Hartmann

   109   3   112    113  9  122    121  7  128    109   3   112   

Andrea Jung(g)

   80     80          –   

Mary Ma

   105      105    113     113    115     115    105      105   

Strive Masiyiwa(e)

   111      111    71     71 

Strive Masiyiwa(h)

   131     131    111      111   

Youngme Moon

   103      103    71     71    147     147    103      103   

Hixonia Nyasulu(h)

             38     38 

John Rishton(i)

   127      127    132  8  140    143     143    127      127   

Feike Sijbesma(j)

   127      127    132     132 

Feike Sijbesma

   135     135    127      127   

Total

   1,917   43   1,960        2,015  57  2,072    2,029  29  2,058    1,917   43   1,960   


(a)(a) 

This includes fees received from NV in euros and PLC in sterling for 20162017 and 20172018 respectively. Includes basicNon-Executive Director fee and Committee chairmanship and/or membership. Where relevant, amounts for 2018 have been translated into euros using the average exchange rate over 2018 (1 = £0.8835). Amounts for 2017 have been translated into euros using the average exchange rate over 2017 (1 = £0.8756).

(b) 

The only benefit received relates to travel by spouses or partners where they are invited by Unilever.

(c) 

Chairman with effect from 21 April 2016.and Chair of the Nominating and Corporate Governance Committee.

(d) Chairman until 21 April 2016.

Chair of the Compensation Committee from 3 May 2018.

(e) Chair, Corporate Responsibility Committee from 27 April 2017.
(f)Vice Chairman and

Chair of the Compensation Committee.

(g)Chair, Corporate Responsibility Committee until 27 April 2017 (retired from the Boards at the April 2017 AGMs).

(f)

Vice Chairman and Chair of the Compensation Committee until 3 May 2018 (retired from the Boards at the May 2018 AGMs).

(g)

Appointed at the May 2018 AGMs.

(h) Retired from

Chair of the Boards at the April 2016 AGMs.Corporate Responsibility Committee.

(i)(i) 

Chair of the Audit Committee.

(j)Chair, Nominating and Corporate Governance Committee.

We do not grant ourNon-Executive Directors any personal loans or guarantees, nor are they entitled to any severance payments.

NON-EXECUTIVE DIRECTORS’ INTERESTS IN SHARES

Non-Executive Directors are encouraged to build up a personal shareholding of at least 1 x their annual fees over the five years from 1 January 2012 (or appointment, if later). The table shows the interests in NV and PLC ordinary shares ofNon-Executive Directors and their connected persons as at 31 December 2017.2018. There has been no change in these interests between 31 December 20172018 and 21 February 2018 (other than Laura Cha, who bought 2,000 NV shares on 2 February 2018 at a share price of47.11).2019.


  Share type   Shares held at
1 January 2017
   Shares held at
31 December 2017
   Share type   Shares held at
1 January 2018
   

Shares held at
31 December

2018


Marijn Dekkers

   NV NY    20,000    20,000    NV NY    20,000    20,000 
   PLC ADRs    -    -    PLC ADRs         

Nils Andersen

   NV    6,014    6,014    NV    6,014    6,014 
   PLC    -    -    PLC         

Laura Cha

   NV    310    660    NV    660    2,660 
   PLC    208    858    PLC    858    858 

Vittorio Colao

   NV    3,600    4,600    NV    4,600    4,600 
   PLC    -    -    PLC         

Louise Fresco

   NV    1,800    1,800(a) 
   PLC    -    -(a) 

Ann Fudge

   NV NY    196    282    NV NY    282    282(a)  
   PLC ADRs    5,000    5,000    PLC ADRs    5,000    5,000(a)  

Judith Hartmann

   NV    2,500    2,500 
   PLC         
  Share type   Shares held at  
1 January 2017  
   Shares held at    
31 December 2017    
   Share type   Shares held at
1 January 2018
 

Shares held at  
31 December  

2018  


Judith Hartmann

   NV    1,000      2,500     

Andrea Jung

   NV    4,576(b)    4,576   
   PLC    -      -        PLC       –   

Mary Ma

   NV    -      860        NV    860   860   
   PLC    400      860        PLC    860   860   

Strive Masiyiwa

   NV    -      -        NV       –   
   PLC    -      1,130        PLC    1,130   1,130   

Youngme Moon

   NV NY    2,000      2,000        NV NY    2,000   2,000   
   PLC ADRs    -      -        PLC ADRs       –   

John Rishton

   NV    3,340      3,340        NV    3,340   3,340   
   PLC    -      2,000        PLC    2,000   2,000   

Feike Sijbesma

   NV    10,000      10,000        NV    10,000   10,000   
   PLC    -      -        PLC       –   
 

(a)(a) 

Shares held at 27 April 20173 May 2018 (the date by which Louise FrescoAnn Fudge retired from the Boards).

(b)

Shares held at 3 May 2018 (the date when Andrea Jung was appointed to the Boards).


72Annual Report on Form 20-F 2018 Governance Report Annual Report on Form 20-F 201761


DIRECTORS’ REMUNERATION REPORTCONTINUED


NON-EXECUTIVE DIRECTORS’ LETTERS OF APPOINTMENT

AllNon-Executive Directors were reappointed to the Boards at the 20172018 AGMs, with the exception of Louise FrescoAndrea Jung (who was appointed for the first time) and Ann Fudge (who retired from the Boards in 2017)Boards).


        Date first appointedEffective date of
Non-Executive Director  

        Date first appointed

to the Board


Boards
 
    current appointmentEffective date of
        current appointment

(a) 

Marijn Dekkers

   21 April 2016    27 April 20173 May 2018 

Nils Andersen

   30 April 2015    27 April 20173 May 2018 

Laura Cha

   15 May 2013    27 April 20173 May 2018 

Vittorio Colao

   1 July 2015    27 April 20173 May 2018 

Louise FrescoAnn Fudge

   14 May 2009    n/a 

Ann Fudge

14 May 200927 April 2017

Judith Hartmann

   30 April 2015    27 April 20173 May 2018 

Andrea Jung

3 May 20183 May 2018

Mary Ma

   15 May 2013    27 April 20173 May 2018 

Strive Masiyiwa

   21 April 2016    27 April 20173 May 2018 

Youngme Moon

   21 April 2016    27 April 20173 May 2018 

John Rishton

   15 May 2013    27 April 20173 May 2018 

Feike Sijbesma

   1 November 2014    27 April 20173 May 2018 


(a) 

The unexpired term for allNon-Executive Directors’ letters of appointment is the period up to the 20182019 AGMs, as they all, unless they are retiring, submit themselves for annual reappointment.

OTHER DISCLOSURES RELATED TO DIRECTORS’ REMUNERATION

SERVING AS ANON-EXECUTIVE ON THE BOARD OF ANOTHER COMPANY

Executive Directors serving asnon-executive directors on the boards of other companies are permitted to retain all remuneration and fees earned from outside directorships subject to a maximum of one outside listed directorship (see ‘Independence and Conflicts’ on page 3537 for further details).

Paul Polman is anon-executive director of DowDuPont Inc. (formerly The Dow Chemical Company) and received an annual fee of102,39997,051 ($115,000) based on the average exchange rate over the year 20172018 of1 = $0.8904.$1.1850. In addition, he received a restricted award of 2,7502,680 ordinary shares with a nominal value of $2.50 per share in the capital of DowDuPont Inc. The shares include the rights to vote and to receive dividends thereon. The shares cannot be sold or transferred until Paul Polman leaves the board of directors of DowDuPont Inc., and in any case not earlier than 12 May 2019.25 April 2020.

NINE-YEARTEN-YEAR HISTORICAL TOTAL SHAREHOLDER RETURN (TSR) PERFORMANCE

The graph below includes:

growth in the value of a hypothetical £100 holding over nineten years’ FTSE 100 comparison based on30-trading-day average values; and

growth in the value of a hypothetical100 investment over nineten years’ AEX comparison based on30-trading-day average values.

The Committee has decided to show Unilever’s performance against the FTSE 100 Index, London and also the Euronext 100 index (AEX), Amsterdam as these are the most relevant indices in the UK and the Netherlands where we have our principal listings. Unilever is a constituent of both these indices.


LOGO

TEN-YEAR HISTORICAL TSR PERFORMANCE

LOGO


Annual Report on Form 20-F 201762 Governance Report  73Annual Report on Form 20-F 2018


DIRECTORS’ REMUNERATION REPORTCONTINUED


CEO SINGLE FIGURE NINE-YEARTEN-YEAR HISTORY

The table below shows the nine-yearten-year history of the CEO single figure of total remuneration:


    2009  2010  2011  2012  2013  2014  2015  2016  2017    

CEO


Single figure of total remuneration (‘000)

   3,859   6,292   6,010   7,852   7,740   9,561   10,296   8,370   11,661    
Annual bonus award rates against
maximum opportunity
   82  80  68  100  78  66  92  92  100% 
GSIP performance shares vesting rates
against maximum opportunity
   n/a   47  44  55  64  61  49  35  74% 
MCIP matching shares vesting rates
against maximum opportunity
   n/a   n/a   n/a   n/a   n/a   81  65  47  99% 
Share Matching Plan vesting rates against
maximum opportunity(a)
   100  100  n/a   n/a   n/a   n/a   n/a   n/a   n/a    
                                                                                                                        
    2009  2010  2011  2012  2013  2014  2015  2016  2017  2018    

CEO

           
Single figure of total remuneration (‘000)   3,859   6,292   6,010   7,852   7,740   9,561   10,296   8,370   11,661   11,726    
Annual bonus award rates against maximum opportunity   82  80  68  100  78  66  92  92  100  51% 
GSIP performance shares vesting rates against maximum opportunity   n/a   47  44  55  64  61  49  35  74  66% 
MCIP matching shares vesting rates against maximum opportunity   n/a   n/a   n/a   n/a   n/a   81  65  47  99  88% 
Share Matching Plan vesting rates against maximum opportunity(a)   100  100  n/a   n/a   n/a   n/a   n/a   n/a   n/a   n/a    


(a) 

Shown in year of award.

PERCENTAGE CHANGE IN REMUNERATION OF EXECUTIVE DIRECTORS (CEO/CFO)

The table below shows the percentage change from 20162017 to 20172018 for base salary, bonus andFixed Pay, other benefits (excluding pension) and bonus for the CEO, CFO and all UK and Dutch management in Unilever. The subset of UK and Dutch management has been used as a fair representation of our dual listing status.


% change from 2016 to 2017  Salary           Bonus           Benefits
(not including
pension)
 
% change from 2017 to 2018  Fixed Pay           Bonus   Other benefits    
(not including    
pension)    
 

CEO(a)(b)

   -6.9%    0.8%    5.0%    11.3%    -16.5%              -19.2%     

CFO(a)(c)

   -2.2%    21.1%    -5.5%    8.2%    -10.5%    8.3%     

UK and Dutch management(d)

   3.0%    31.4%    5.6%    8.0%    4.9%    -0.2%     


(a) 

Calculated using the data from the Executive Directors’ single figure table on page 6554 (for information on exchange rates please see the footnotes in that table).

(b) It

The CEO Fixed Pay and other benefits figures reflect the implementation of our new Reward Framework in 2018, including the consolidation of conditional supplemental pension accrual into Fixed Pay from the 2018 AGMs, and changes in the relevant sterling:euro exchange rates. The reduction in benefits value is noted that although the CEO’s salary hasalso due to variations in charges for social security and tax return preparation fees, both of which decreased in the above table, this is due to currency movements, rather than any change in remuneration amounts, as his salary denominated in sterling remained the same in 2016 and 2017.2018.

(c) To enable meaningful comparison

The increase in Fixed Pay shown for the CFO reflects the implementation of the CFO’s pay between 2016 and 2017, the CFO’s 2016 salary and benefits (as disclosedour new Reward Framework in the 2016 Directors’ Remuneration Report, page 67) have been extrapolated to cover the whole year from 1 January to 31 December 2016, notwithstanding that Graham Pitkethly was only appointed as an Executive Director of the Boards of NV and PLC (and paid as such)2018, including a 5% increase in Fixed Pay with effect from 21 April 2016.the 2018 AGMs, and changes in the relevant sterling:euro exchange rates. The CFO’syear-on-year changeincrease in bonusbenefits value is driven by a higher bonus performance ratio and higher personal performance multiplier for 2017.due to an increase in private medical insurance costs.

(d) Figures for

For the UK and Dutch management population, Fixed Pay numbers have been restated to include cash-related benefits employees receive as part of their total compensation, to ensure we can accurately compare Fixed Pay for the management population against that of the CEO and CFO. Figures are also been affected by significant changes in the average sterling:euro exchange rates for 2016 and 2017 and 2018, as well as a higherlower bonus performance ratio (with benefits also increasing duein 2018 compared to the introduction of the new Reward Framework for our ‘Top 500’ managers in 2017).2017.

EXECUTIVE DIRECTORS (CEO/CFO) PAY RATIO COMPARISON

The table below provides a more detailed breakdown ofshows how pay for the fixed and variable pay elements (excluding pension) for each ofCEO compares to our UK employees at the 25th percentile, median and Dutch management Work Levels, showing how each management Work Level compares to the CEO and CFO in 2017 (with equivalent figures from 2016 included in the adjacent table for comparison purposes).75th percentile.


LOGO

74Governance ReportAnnual Report on Form 20-F 2017


Year                    25th Percentile           Median Percentile                 75th Percentile         Mean Pay Ratio 

Year ending 31 December 2018

  Salary:     £28,804    £37,000      £50,021        
   

Pay and benefits

(excluding pension):

     £34,400    £41,443      £57,800        
   Pay ratio (Option A):     301    250      179      147 

Figures for the CEO and CFO are calculated using the data from the Executive Directors’ single figure table on page 65. To enable meaningful comparison54 (where relevant, translated into pounds using the average exchange rate over 2018 (1 = £0.8835)).

Option A was used to calculate the pay and benefits (excluding pension) of the CFO’s pay between 201625th percentile, median and 2017,75th percentile UK employees because the CFO’s 2016 salarydata was readily available for all UK employees of the group and benefitsOption A is the most accurate method (as disclosed init is based on total full-time equivalent total reward for all UK employees for the 2016 Directors’ Remuneration Report, page 67) have been extrapolated to cover the whole year from 1 Januaryrelevant financial year). Figures are calculated by reference to 31 December 2016, notwithstanding that Graeme Pitkethly was only appointed as an Executive Director of2018, and the Boards of NVrespective salary and PLC (and paid as such) with effect from 21 April 2016; we have usedpay and benefits (excluding pension) figures for each quartile are set out in the CFO’s actualtable above. Full-time equivalent figures are calculated on apro-rated basis.

Annual bonus and long-term incentives (GSIP and MCIP) were not calculated following the statutory method for single-figure pay. Instead, variable pay figures for the relevant years (which reflect his lower awards and vesting rates for GSIP and MCIP prior to being promoted to CFO, as set out on page 67 above for 2017 and in the 2016 Directors’ Remuneration Report, page 69). We have applied a similar approach for WL6, calculating averages based on actual variable pay awards and corresponding vesting rates.

Variable pay figures for our other management Work Levels WL2-5 arewere calculated using:

target annual bonus values multiplied by the actual bonus performance ratio for the respective year (so disregarding personal performance multipliers, which equal out across the population as a whole);

target GSIP values (multiplied by the actual GSIP performance ratio for the respective year, based on closing share prices on the vesting date); and

MCIP values calculated at an appropriate average for the relevant Work Level of employees, ie an average 45% investment of bonus for WL3 employees andemployees; 60% forWL4-5 employees (with vesting again at actual MCIP performance ratio, based on closing share prices on the vesting date); and for WL6, based on actual variable pay awards and corresponding vesting rates.

The reason for this is it would be unduly onerous to recalculate these figures when, based on a sample, the impact of such recalculation is expected to be limited.

We expect to report on trends in these figures and links to wider pay, reward and progression policies in future years in line with relevant reporting requirements.

Annual Report on Form 20-F 2018Governance Report63


DIRECTORS’ REMUNERATION REPORTCONTINUED

The table below provides a more detailed breakdown of the fixed and variable pay elements for each of our UK and Dutch Work Levels, showing how each Work Level compares to the CEO and CFO in 2018 (with equivalent figures from 2017 included for comparison purposes).

LOGO

Figures for the CEO and CFO are calculated using the data from the Executive Directors’ single figure table on page 54. Accordingly, theyear-on-year comparison reflects the implementation of our new Reward Framework for Executive Directors in May 2018, and so is impacted by bothmid-year structural change and ongoing fluctuation in the exchanges rates used to convert pay elements denominated in pounds sterling to euros for reporting purposes.

For our other Work Levels, variable pay figures are calculated on the basis set out in the preceding paragraphs. Fixed Pay figures reflect all elements of pay (including allowances) and benefits paid in cash, but exclude pensions. This year, we have also expanded the table to include data for our WL1(non-management) staff in the UK and Netherlands.

Changes in pay ratios between 20162017 and 20172018 reflect a higherlower bonus performance ratio in 2017 (122%2018 (90%, compared to 110%122% in 2016)2017), and higherlower GSIP and MCIP vesting outcomes (which play an increasing part in total reward from WL3 upwards, particularly with the introduction of the new Reward Framework for ourWL4-6 employees in 2017). As the new Reward Framework is rolled out to2017 and our WL3 employees andin 2018, with an invitation to participate in MCIP is extended to WL2 employees in 2018 we expect to see this reflected in future charts accordingly.as well).Year-on-year comparisons also reflect significant changes in the average sterling:euro exchange rates for 20162017 and 2017;2018; where relevant, amounts for 2018 have been translated using the average exchange rate over 2018 (1 = £0.8835), and amounts for 2017 have been translated using the average exchange rate over 2017 (1 = £0.8756), and amounts for 2016 have been translated using the average exchange rate over 2016 (1 = £0.8152).

For this comparison, pension costs have been excluded for UK and Dutch management staff because these include some defined benefit pension plan elements, the actual cost of which to the company varies year by year. For the Executive Directors, pension costs are a proportionately smaller element of the total compensation package (see single figure table on page 65) than for UK and Dutch management staff. Excluding pension costs in this comparison consequently increases the pay ratio relative to WL2-4.

RELATIVE IMPORTANCE OF SPEND ON PAY

The chart below shows the relative spend on pay compared with dividends paid to Unilever shareholders and underlying earnings. Underlying earnings represent the underlying profit attributable to Unilever shareholders, adjusted to eliminate various items, and provides a good reference point to compare spend on pay.


LOGOLOGO


*

In calculating underlying profit attributable to shareholders’ equity, net profit attributable to shareholders’ equity is adjusted to eliminate thepost-tax impact ofnon-underlying items in operating profit and any other significant unusual terms within net profit but not operating profit (see note 7 on page 10796 for details).

64Governance ReportAnnual Report on Form 20-F 2018


THE COMPENSATION COMMITTEE

The Committee’s membership was further refreshed in 2017. Ann Fudge (Chair),2018. Vittorio Colao, Marijn Dekkers and Vittorio Colao allMary Ma served throughout this period, while Strive Masiyiwa stepped down fromwith Vittorio Colao being appointed Chair on 3 May 2018, upon Ann Fudge’s retirement; Andrea Jung joined the Committee on 27 April 2017, with his place being taken by Mary Ma on the same date.

The Committee reviewed its terms of reference during the year. The Committee’s revised terms of reference are contained within ‘The Governance of Unilever’, and are also set out on our website.


LOGO

LOGO
 www.unilever.com/investor-relations/agm-and-corporate-governance/

As part of the Board evaluation carried out in 2017,2018, the Boards evaluated the performance of the Committee. The Committee also carried out an assessment of its own performance in 2017.2018. While overall the Committee members concluded that the Committee is performing effectively, the Committee has agreed to further enhance its effectiveness by reviewing progress in implementingmonitoring the newresponsiveness of the Reward Framework below senior management levels,to rapidly evolving market conditions and adding a knowledgefinance briefing session on the continued appropriateness of performance measures for HR/compensation strategy for 2018, and considering the skill mix of members in the context of Committee Chair succession.

Annual Report on Form 20-F 2017Governance Report75


DIRECTORS’ REMUNERATION REPORTCONTINUED

incentive plans.

ADVISERS

While it is the Committee’s responsibility to exercise independent judgement, the Committee does request advice from management and professional advisers, as appropriate, to ensure that its decisions are fully informed given the internal and external environment.

The Committee appointed Tom Gosling of PricewaterhouseCoopers (PwC) following a tender process to provideprovided the Committee with independent advice on various matters it considered. During 2017,2018, the wider PwC firm has also provided tax and consultancy services to Unilever including tax compliance, transfer pricing, othertax-related services, contract compliance reviews, internal audit advice and secondees, third-party risk and compliance advice, cyber security advice, sustainability assurance and consulting; PwC has also been assisting with financial due diligence on M&A transactions undertaken by the Unilever Group. PwC is a member of the Remuneration Consultants Group and, as such, voluntarily operates under the code of conduct in relation to executive remuneration consulting in the UK, which is available online.


LOGO

LOGO
 www.remunerationconsultantsgroup.com(Code (Code of Conduct: Executive Remuneration Consulting)

The Committee is satisfied that the PwC engagement partner and team, which provide remuneration advice to the Committee, do not have connections with Unilever N.V. or Unilever PLC that might impair their independence. The Committee reviewed the potential for conflicts of interest and judged that there were appropriate safeguards against such conflicts. The fees paid to PwC in relation to advice provided to the Committee in the year to 31 December 20172018 were £59,400.£146,650. This figure is calculated based on time spent and expenses incurred for the majority of advice provided, but on occasion for specific projects a fixed fee may be agreed.

During the year, the Committee also sought input from the CEO (Paul Polman), the Chief Human Resources Officer (Leena Nair) and the EVP Global Head of Reward (Peter Newhouse) on various subjects including the remuneration of senior management. No individual Executive Director was present when their own remuneration was being determined to ensure a conflict of interest did not arise, although the Committee has separately sought and obtained Executive Directors’ own views when determining the amount and structure of their remuneration before recommending individual packages to the BoardBoards for approval. The Committee also received legal and governance advice from the formerChief Legal Officer and Group Secretary (Tonia Lovell)(Ritva Sotamaa) and the General Counsel - Executive Remuneration & Employment (Margot Fransen).

SHAREHOLDER VOTING

Unilever remains committed to ongoing shareholder dialogue and takes an active interest in voting outcomes. In the event of a substantial vote against a resolution in relation to Directors’ remuneration, Unilever would seek to understand the reasons for any such vote and would set out in the following Annual Report and Accounts any actions in response to it.it (as set out in the Letter from the Chair on page 50 in relation to our further engagement with shareholders following last year’s voting on our Remuneration Policy). The following table sets out actual voting in respect of our previous report:


Voting outcome (% of votes)


For


Against


2016 Directors’ Remuneration Report (excluding the Directors’ Remuneration Policy) (2017 AGM)(a)

  PLC   98.14%    1.86% 

2016 Directors’ Remuneration Policy (2017 AGM)(b)

  PLC   95.83%    4.17% 

2016 Directors’ Remuneration Policy (2017 AGM)(c)

  NV   97.90%    2.10% 

Voting outcome (% of votes)


For    


Against    


2017 Directors’ Remuneration Report (excluding the Directors’ Remuneration Policy) (2018 AGM)(a)

  PLC     97.19%      2.81% 

2017 Directors’ Remuneration Policy (2018 AGM)(b)

  PLC     64.19%      35.81% 

2017 Directors’ Remuneration Policy (2018 AGM)(c)

    NV     73.06%      26.94% 


(a) 7,780,454

18,758,929 votes were withheld (approximately 0.61%2.09% of share capital)capital represented on 2 May 2018).


(b) 1,634,396

38,734,868 votes were withheld (approximately 0.13%4.31% of share capital)capital represented on 2 May 2018).


(c) 131,936,737

15,018,135 votes were withheld (approximately 7.05%1.03% of share capital)capital represented on 3 May 2018).

The Directors’ Remuneration Report is not subject to a shareholder vote in the Netherlands. It has been approved by the Boards, and signed on their behalf by Ritva Sotamaa, Chief Legal Officer and Group Secretary.


76Annual Report on Form 20-F 2018 Governance Report Annual Report on Form 20-F 201765


FINANCIAL STATEMENTS

STATEMENT OF DIRECTORS’ RESPONSIBILITIES


ANNUAL ACCOUNTS

The Directors are required by Part 9 of Book 2 of the Civil Code in the Netherlands and by the UK Companies Act 2006 to prepare accounts for each financial year which give a true and fair view of the state of affairs of the Unilever Group, and the NV and PLC entities, as at the end of the financial year and of the profit or loss and cash flows for that year.

The Directors consider that, in preparing the accounts, the Group and the NV and PLC entities have used the most appropriate accounting policies, consistently applied and supported by reasonable and prudent judgements and estimates, and that all International Financial Reporting Standards as adopted by the EU and as issued by the International Accounting Standards Board (in the case of the consolidated financial statements), Financial Reporting Standard 101 ‘Reduced Disclosure Framework’ (FRS 101) and Dutch law (in the case of the NV parent company accounts) which they consider to be applicable have been followed.

The Directors have responsibility for ensuring that NV and PLC keep accounting records which disclose with reasonable accuracy their financial position and which enable the Directors to ensure that the accounts comply with the relevant legislation. They also have a general responsibility for taking such steps as are reasonably open to them to safeguard the assets of the Group, and to prevent and detect fraud and other irregularities.

This statement, which should be read in conjunction with the Independent Auditors’ reports, is made with a view to distinguishing for shareholders the respective responsibilities of the Directors and of the auditors in relation to the accounts.

A copy of the financial statements of the Unilever Group is placed on our website atwww.unilever.com/investorrelations.investorrelations. The maintenance and integrity of the website are the responsibility of the Directors, and the work carried out by the auditors does not involve consideration of these matters. Accordingly, the auditors accept no responsibility for any changes that may have occurred to the financial statements since they were initially placed on the website. Legislation in the UK and the Netherlands governing the preparation and dissemination of financial statements may differ from legislation in other jurisdictions.

INDEPENDENT AUDITORS AND DISCLOSURE OF INFORMATION TO AUDITORS

UK law sets out additional responsibilities for the Directors of PLC regarding disclosure of information to auditors. To the best of each of the Directors’ knowledge and belief, and having made appropriate enquiries, all information relevant to enabling the auditors to provide their opinions on PLC’s consolidated and parent company accounts has been provided. Each of the Directors has taken all reasonable steps to ensure their awareness of any relevant audit information and to establish that Unilever PLC’s auditors are aware of any such information.


DIRECTORS’ RESPONSIBILITY STATEMENT

Each of the Directors confirms that, to the best of his or her knowledge:

The Unilever Annual Report and Accounts 2017,2018, taken as a whole, is fair, balanced and understandable, and provides the information necessary for shareholders to assess the Group’s position and performance, business model and strategy;
The financial statements which have been prepared in accordance with International Financial Reporting Standards as adopted by the EU and as issued by the International Accounting Standards Board (in the case of the consolidated financial statements) and Financial Reporting Standard 101 ‘Reduced Disclosure Framework’ (FRS 101) and UK accounting standards and Part 9 of Book 2 of the Dutch Civil Code (in the case of the NV parent company accounts), give a true and fair view of the assets, liabilities, financial position and profit or loss of the Group and the undertakings included in the consolidation taken as a whole; and
The Strategic Report includes a fair review of the development and performance of the business and the position of the Group and the undertakings included in the consolidation taken as a whole, together with a description of the principal risks and uncertainties that they face.

The Directors and their roles are listed on pages 3 and 34.36.

GOING CONCERN

The activities of the Group, together with the factors likely to affect its future development, performance, the financial position of the Group, its cash flows, liquidity position and borrowing facilities are described on pages 1 to 25.26. In addition, we describe in notes 15 to 18 on pages 115104 to 130120 the Group’s objectives, policies and processes for managing its capital; its financial risk management objectives; details of its financial instruments and hedging activities and its exposures to credit and liquidity risk. Although not assessed over the same period as going concern, the viability of the Group has been assessed on page 27.28.

The Group has considerable financial resources together with established business relationships with many customers and suppliers in countries throughout the world. As a consequence, the Directors believe that the Group is well placed to manage its business risks successfully despite the current uncertain outlook.

After making enquiries, the Directors consider it appropriate to adopt the going concern basis of accounting in preparing this Annual Report and Accounts.

INTERNAL AND DISCLOSURE CONTROLS AND PROCEDURES

Please refer to page 27pages 28 and 29 for a discussion of Unilever’s principal risk factors and to pages 2829 to 3133 for commentary on the Group’s approach to risk management and control.


Annual Report on Form 20-F 201766 Financial Statements  77Annual Report on Form 20-F 2018


INDEPENDENT AUDITORS’ REPORTS


REPORT OF INDEPENDENT REGISTERED PUBLIC ACCOUNTING FIRMS

TO THE SHAREHOLDERS AND BOARD OF DIRECTORSTo the Shareholders and Board of Directors

UNILEVERUnilever N.V. AND UNILEVER PLCand Unilever PLC:

Opinions on the Consolidated Financial Statements and Internal Control Over Financial ReportingOPINIONS ON THE CONSOLIDATED FINANCIAL STATEMENTS AND INTERNAL CONTROL OVER FINANCIAL REPORTING

We have audited the accompanying consolidated balance sheets of the Unilever Group (Unilever N.V. and Unilever PLC, together with their subsidiaries) as of 31 December 20172018 and 2016,2017, the related consolidated income statements, consolidated statements of comprehensive income, consolidated statements of changes in equity, and consolidated cash flow statements for each of the years in the three-year period ended 31 December 20172018, and the related notes on pages 8675 to 145127 of the Unilever Group’s Annual Report (excluding note 2625 on page 137)126) and the Guarantor financial information included in the Guarantor Statements on pages 170158 to 174162 of this Form20-F (hereafter referred to as ‘ConsolidatedConsolidated Financial Statements’)Statements). We also have audited the Unilever Group’s internal control over financial reporting as of 31 December 2017,2018, based on criteria established in the Internal Control Integrated Framework (2013) issued by the Committee of Sponsoring Organizations of the Treadway Commission.

In our opinion, the Consolidated Financial Statements referred to above present fairly, in all material respects, the financial position of the Unilever Group as of 31 December 20172018 and 2016,2017, and the results of its operations and its cash flows for each of the years in the three-year period ended 31 December 2017,2018, in conformity with International Financial Reporting Standards (IFRS) as issued by the International Accounting Standards Board and in conformity with IFRS as adopted by the European Union. Also in our opinion, the Unilever Group maintained, in all material respects, effective internal control over financial reporting as of 31 December 2017,2018, based on criteria established in Internal Control Integrated Framework (2013) issued by the Committee of Sponsoring Organizations of the Treadway Commission.

The Unilever Group acquired Carver Korea Co, Ltd, Mae Terra, TAZO, Sundial,Adityaa Milk, Equilibra, Betty Ice, Denny Ice and Schmidt’s NaturalsVegetarian Butcher on 27 September 2018, 1 October 2018,

1 November 2017, 12018, 3 December 2017, 11 December 2017, 18 December 20172018 and 31 December 2017,2018, respectively, and management excluded from its assessment of the effectiveness of the Unilever Group’s internal control over financial reporting as of 31 December 2017, Carver Korea Co, Ltd, Mae Terra, TAZO, Sundial,2018, Adityaa Milk, Equilibra, Betty Ice, Denny Ice and Schmidt’s Naturals’Vegetarian Butcher’s internal control over financial reporting associated with approximately 7.8%0.5% of the Unilever Group’s total assets as at 31 December 2017 and approximately 0.17%0.02% of the Unilever Group’s turnover included in the Consolidated Financial Statements of the Unilever Group as of and for the year ended 31 December 2017.2018. Our audit of internal control over financial reporting of the Unilever Group also excluded an evaluation of the internal control over financial reporting of Carver Korea Co, Ltd, Mae Terra, TAZO, Sundial,Adityaa Milk, Equilibra, Betty Ice, Denny Ice and Schmidt’s Naturals.Vegetarian Butcher.

BASIS FOR OPINIONOPINIONS

The Unilever Group’s management is responsible for these Consolidated Financial Statements, for maintaining effective internal control over financial reporting, and for its assessment of the effectiveness of internal control over financial reporting, included in the accompanying Management’s Report on Internal Control over Financial Reporting included on page 168156 of this Form20-F. Our responsibility is to express an opinion on the Unilever Group’s Consolidated Financial Statements and an opinion on the Unilever Group’s internal control over financial reporting based on our audits. We are a public accounting firmsfirm registered with the Public Company Accounting Oversight Board (United States) (“PCAOB”)(PCAOB) and are required to be independent with respect to the Company in accordance with the U.S. federal securities laws and the applicable rules and regulations of the Securities and Exchange Commission and the PCAOB.

We conducted our audits in accordance with the standards of the PCAOB. Those standards require that we plan and perform the audits to obtain reasonable assurance about whether the Consolidated Financial Statements are free of material misstatement, whether due to error or fraud, and whether effective internal control over financial reporting was maintained in all material respects.

Our audits of the Consolidated Financial Statements included performing procedures to assess the risks of material misstatement of the Consolidated Financial Statements, whether due to error or fraud, and performing procedures that respond to those risks. Such procedures included examining, on a test basis, evidence regarding the amounts and disclosures in the Consolidated Financial Statements. Our audits also included evaluating the accounting principles used and significant estimates made by management, as well as evaluating the overall presentation of the Consolidated Financial Statements. Our audit of internal control over financial reporting included obtaining an understanding of internal control over financial reporting, assessing the risk that a material weakness exists, and testing and evaluating the design and operating effectiveness of internal control based on the assessed risk. Our audits also included performing such other procedures as we considered necessary in the circumstances. We believe that our audits provide a reasonable basis for our opinions.

DEFINITION AND LIMITATIONS OF INTERNAL CONTROL OVER FINANCIAL REPORTING

A company’s internal control over financial reporting is a process designed to provide reasonable assurance regarding the reliability of financial reporting and the preparation of financial statements for external purposes in accordance with generally accepted accounting principles. A company’s internal control over financial reporting includes those policies and procedures that (1) pertain to the maintenance of records that, in reasonable detail, accurately and fairly reflect the transactions and dispositions of the assets of the company; (2) provide reasonable assurance that transactions are recorded as necessary to permit preparation of financial statements in accordance with generally accepted accounting principles, and that receipts and expenditures of the company are being made only in accordance with authorizations of management and directors of the company; and (3) provide reasonable assurance regarding prevention or timely detection of unauthorized acquisition, use, or disposition of the company’s assets that could have a material effect on the financial statements.

Because of its inherent limitations, internal control over financial reporting may not prevent or detect misstatements. Also, projections of any evaluation of effectiveness to future periods are subject to the risk that controls may become inadequate because of changes in conditions, or that the degree of compliance with the policies or procedures may deteriorate.


/s/ KPMG LLP/s/ KPMG Accountants N.V.
KPMG LLP KPMG Accountants N.V.

London, United Kingdom

/s/ KPMG LLP


Amsterdam, the Netherlands

/s/ KPMG Accountants N.V.

We have served as auditors of the Unilever GroupGroup’s auditors since 20142014.


23 February 20186 March 2019


78Annual Report on Form 20-F 2018Financial Statements67


THIS PAGE INTENTIONALLY

LEFT BLANK

68 Financial Statements  Annual Report on Form 20-F 20172018


THIS PAGE INTENTIONALLY

LEFT BLANK


Annual Report on Form 20-F 20172018 Financial Statements 7969


THIS PAGE INTENTIONALLY

LEFT BLANK


8070 Financial Statements  Annual Report on Form 20-F 20172018


THIS PAGE INTENTIONALLY

LEFT BLANK


Annual Report on Form 20-F 20172018 Financial Statements 8171


THIS PAGE INTENTIONALLY

LEFT BLANK


8272 Financial Statements  Annual Report on Form 20-F 20172018


THIS PAGE INTENTIONALLY

LEFT BLANK


Annual Report on Form 20-F 20172018 Financial Statements 8373


THIS PAGE INTENTIONALLY

LEFT BLANK


8474 Financial Statements  Annual Report on Form 20-F 2017


THIS PAGE INTENTIONALLY

LEFT BLANK

Annual Report on Form 20-F 2017Financial Statements852018


CONSOLIDATED FINANCIAL STATEMENTS

UNILEVER GROUP


CONSOLIDATED INCOME STATEMENT

for the year ended 31 December

                                                        
                                                                         Notes 

€ million


2018


 million


2017


 million


2016

 
  Notes          

€ million


2017


 million


2016


 million


2015


Turnover

  2           53,715   52,713   53,272   2  50,982   53,715   52,713 

Operating profit

  2           8,857   7,801   7,515   2  12,535   8,857   7,801 

After (charging)/creditingnon-underlying items

  3           (543  (823  (796  3  3,176   (543  (823

Net finance costs

  5           (877  (563  (493  5   (481  (877  (563
  

Finance income

     157   115   144    135   157   115 
  

Finance costs

     (556  (584  (516   (591  (556  (584
  

Pensions and similar obligations

     (96  (94  (121   (25  (96  (94
  

Net finance costnon-underlying items

  3           (382  -   -   3      (382   

Net monetary gain/(loss) arising from hyperinflationary economies

  1  122       

Share of net profit/(loss) of joint ventures and associates

  11           155   127   107   11      185   155   127 

After creditingnon-underlying items

  3  32       

Other income/(loss) fromnon-current investments and associates

     18   104   91   22   18   104 

Profit before taxation

     8,153   7,469   7,220   12,383   8,153   7,469 

Taxation

  6A           (1,667  (1,922  (1,961  6A  (2,575  (1,667  (1,922

After crediting tax impact ofnon-underlying items

  3           655   213   180 

After (charging)/crediting tax impact ofnon-underlying items

  3  (288  655   213 

Net profit

     6,486   5,547   5,259   9,808   6,486   5,547 

Attributable to:


Non-controlling interests

     433   363   350   419   433   363 

Shareholders’ equity

      6,053   5,184   4,909    9,389   6,053   5,184 

Combined earnings per share

  7              7    

Basic earnings per share ()

     2.16   1.83   1.73   3.50   2.16   1.83 

Diluted earnings per share ()

      2.15   1.82   1.72    3.48   2.15   1.82 


CONSOLIDATED STATEMENT OF COMPREHENSIVE INCOME

for the year ended 31 December


                                                                         Notes 

€ million


2018


 million


2017


 million


2016

 
  Notes          € million
2017
    million
2016
   

 million

2015


Net profit

       6,486      5,547      5,259   9,808   6,486   5,547 

Other comprehensive income

  6C                6C    

Items that will not be reclassified to profit or loss:


Remeasurement of defined benefit pension plans net of tax

  15B           1,282    (980   884 

Items that may be reclassified subsequently to profit or loss:


Currency retranslation gains/(losses) net of tax(a)

  15B           (983   217    (481

Fair value gains/(losses) on financial instruments net of tax

  15B           (75   (15   100 

Items that will not be reclassified to profit or loss, net of tax:


Gains/(losses) on equity instruments measured at fair value through other comprehensive
income(a)

  51       

Remeasurement of defined benefit pension plans

  15B      (328  1,282   (980

Items that may be reclassified subsequently to profit or loss, net of tax:


Gains/(losses) on cash flow hedges

  (55  (68   

Currency retranslation gains/(losses)

  15B  (861  (983  217 

Fair value gains/(losses) on financial instruments(a)

  15B      (7  (15

Total comprehensive income

     6,710    4,769    5,762   8,615   6,710   4,769 

Attributable to:


Non-controlling interests

     381    374    357   407   381   374 

Shareholders’ equity

      6,329    4,395    5,405    8,208   6,329   4,395 


(a) Includes fair value gains/(losses) on net investment hedges and exchange differences in net investments in foreign operations

Classification has changed following adoption of(909) million (2016:(365) million; 2015: 617 million). IFRS 9. See note 1 for further details.

References in the consolidated income statement, consolidated statement of comprehensive income, consolidated statement of changes in equity, consolidated balance sheet and consolidated cash flow statement relate to notes on pages 9079 to 145,127, which form an integral part of the consolidated financial statements.


86Annual Report on Form 20-F 2018 Financial Statements Annual Report on Form 20-F 201775


CONSOLIDATED FINANCIAL STATEMENTS

UNILEVER GROUPCONTINUED


CONSOLIDATED STATEMENT OF CHANGES IN EQUITY


  € million   € million € million € million € million € million € million 
  € million € million € million € million € million € million € million 
Consolidated statement of changes in equity  Called up
share
capital
   Share
premium
account
 

Other

reserves

 Retained
profit
 Total Non-
controlling
interests
 

Total

equity

   Called
up share
capital
 Share
premium
account
 Other
reserves
 Retained
profit
 Total Non-
controlling
interests
 Total
equity
 

31 December 2014

   484    145  (7,538 20,560  13,651  612  14,263 

31 December 2015

   484  152  (7,816 22,619  15,439  643  16,082 

Profit or loss for the period

   -    -   -  4,909  4,909  350  5,259            5,184  5,184  363  5,547 

Other comprehensive income net of tax:


Fair value gains/(losses) on financial instruments

   -    -  100   -  100   -  100 

Fair value gains/(losses) on financial instruments(a)

        (15    (15    (15

Remeasurement of defined benefit pension plans net of tax

   -    -   -  882  882  2  884            (980 (980    (980

Currency retranslation gains/(losses)

   -    -  (377 (109 (486 5  (481        189  17  206  11  217 

Total comprehensive income

   -    -  (277 5,682  5,405  357  5,762         174  4,221  4,395  374  4,769 

Dividends on ordinary capital

   -    -   -  (3,404 (3,404  -  (3,404           (3,600 (3,600    (3,600

Movements in treasury shares(b)

   -    -  6  (282 (276  -  (276

Share-based payment credit(c)

   -    -   -  150  150   -  150 

Movements in treasury shares(d)

        (45 (213 (258    (258

Share-based payment credit(e)

           198  198     198 

Dividends paid tonon-controlling interests

   -    -   -   -   -  (326 (326                 (364 (364

Currency retranslation gains/(losses) net of tax

   -    7   -   -  7   -  7      (18       (18    (18

Other movements in equity

   -    -  (7 (87 (94  -  (94        244  (46 198  (27 171 

31 December 2015

   484    152  (7,816 22,619  15,439  643  16,082 

31 December 2016

   484  134  (7,443 23,179  16,354  626  16,980 

Profit or loss for the period

   -    -   -  5,184  5,184  363  5,547            6,053  6,053  433  6,486 

Other comprehensive income net of tax:


Fair value gains/(losses) on financial instruments

   -    -  (15  -  (15  -  (15

Fair value gains/(losses) on financial instruments(a)

        (76    (76 1  (75

Remeasurement of defined benefit pension plans net of tax

   -    -   -  (980 (980  -  (980           1,282  1,282     1,282 

Currency retranslation gains/(losses)

   -    -  189  17  206  11  217         (903 (27 (930 (53 (983

Total comprehensive income

   -    -  174  4,221  4,395  374  4,769         (979 7,308  6,329  381  6,710 

Dividends on ordinary capital

   -    -   -  (3,600 (3,600  -  (3,600           (3,916 (3,916    (3,916

Movements in treasury shares(b)

   -    -  (45 (213 (258  -  (258

Share-based payment credit(c)

   -    -   -  198  198   -  198 

Repurchase of shares(b)

        (5,014    (5,014    (5,014

Other movements in treasury shares(d)

        (30 (174 (204    (204

Share-based payment credit(e)

           284  284     284 

Dividends paid tonon-controlling interests

   -    -   -   -   -  (364 (364                 (345 (345

Currency retranslation gains/(losses) net of tax

   -    (18  -   -  (18  -  (18     (4       (4    (4

Other movements in equity

   -    -  244  (46 198  (27 171         (167 (33 (200 96  (104

31 December 2016

   484    134   (7,443  23,179   16,354   626   16,980 

31 December 2017

   484   130   (13,633  26,648   13,629   758   14,387 

Hyperinflation restatement to 1 January 2018 (see note 1)

            393   393      393 

1 January 2018 after restatement

   484   130   (13,633  27,041   14,022   758   14,780 

Profit or loss for the period

   -    -   -   6,053   6,053   433   6,486             9,389   9,389   419   9,808 

Other comprehensive income net of tax:


Fair value gains/(losses) on financial instruments

   -    -   (76  -   (76  1   (75

Remeasurement of defined benefit pension plans net of tax

   -    -   -   1,282   1,282   -   1,282 

Other comprehensive income, net of tax:


Gains/(losses) on:(a)


Equity instruments

         51      51      51 

Cash flow hedges

         (56     (56  1   (55

Remeasurement of defined benefit pension plans

            (330  (330  2   (328

Currency retranslation gains/(losses)

   -    -   (903  (27  (930  (53  (983         (836  (10  (846  (15  (861

Total comprehensive income

   -    -   (979  7,308   6,329   381   6,710          (841  9,049   8,208   407   8,615 

Dividends on ordinary capital

   -    -   -   (3,916  (3,916  -   (3,916            (4,081  (4,081     (4,081

Repurchase of shares(a)

   -    -   (5,014  -   (5,014  -   (5,014

Other movements in treasury shares(b)

   -    -   (30  (174  (204  -   (204

Share-based payment credit(c)

   -    -   -   284   284   -   284 

Repurchase of shares(b)

         (6,020     (6,020     (6,020

Cancellation of treasury shares(c)

   (20     5,069   (5,049         

Other movements in treasury shares(d)

         (8  (245  (253     (253

Share-based payment credit(e)

            196   196      196 

Dividends paid tonon-controlling interests

   -    -   -   -   -   (345  (345                  (342  (342

Currency retranslation gains/(losses) net of tax

   -    (4  -   -   (4  -   (4      (1        (1     (1

Other movements in equity

   -    -   (167  (33  (200  96   (104

31 December 2017

   484    130   (13,633  26,648   13,629   758   14,387 

Hedging gain/(loss) transferred to non-financial assets

         71      71      71 

Other movements in equity(f)

         76   (646  (570  (103  (673

31 December 2018

   464   129   (15,286  26,265   11,572   720   12,292 


(a) 

Classification in 2018 has changed following adoption of IFRS 9. See note 1 for further details.

(b)

Repurchase of shares reflects the cost of acquiring ordinary shares as part of the share buyback programmeprogrammes announced on 19 April 2018 and 6 April 2017 (refer note 24 on page 137). At 31 December 2017 these shares have not been cancelled and are recognised as treasury shares.2017.

(b)(c)

During 2018 122,965,077 PLC ordinary shares were cancelled. The amount paid to repurchase these shares was initially recognised in other reserves and is transferred to retained profit on cancellation.

(d) 

Includes purchases and sales of treasury shares other than the share buyback programme, and transfer from treasury shares to retained profit of share-settled schemes arising from prior years and differences between exercise and grant price of share options.

(c)(e) 

The share-based payment credit relates to thenon-cash charge recorded in operating profit in respect of the fair value of share options and awards granted to employees.

(f)

Includes a662 million premium paid for purchase of the non-controlling interest in Unilever South Africa from Remgro.


Annual Report on Form 20-F 201776 Financial Statements  87Annual Report on Form 20-F 2018


CONSOLIDATED FINANCIAL STATEMENTS

UNILEVER GROUPCONTINUED


CONSOLIDATED BALANCE SHEET

as at 31 December


  Notes                      € million
2017
            million
2016
   Notes         € million
2018
      million
2017
 

Assets


Non-current assets


Goodwill

  9     16,881   17,624    9      17,341   16,881 

Intangible assets

  9     11,520   9,809    9      12,152   11,520 

Property, plant and equipment

  10     10,411   11,673    10      10,347   10,411 

Pension asset for funded schemes in surplus

  4B     2,173   694    4B      1,728   2,173 

Deferred tax assets

  6B     1,085   1,354    6B      1,117   1,085 

Financial assets

  17A     675   673    17A      642   675 

Othernon-current assets

  11     557   718    11      648   557 
       43,302   42,545 
       43,975   43,302 

Current assets


Inventories

  12     3,962   4,278    12      4,301   3,962 

Trade and other current receivables

  13     5,222   5,102    13      6,485   5,222 

Current tax assets

       488   317        472   488 

Cash and cash equivalents

  17A     3,317   3,382    17A      3,230   3,317 

Other financial assets

  17A     770   599    17A      874   770 

Assets held for sale

  22     3,224   206    22      119   3,224 
       16,983   13,884 
       15,481   16,983 

Total assets

         60,285   56,429          59,456   60,285 

Liabilities


Current liabilities


Financial liabilities

  15C     7,968   5,450    15C      3,235   7,968 

Trade payables and other current liabilities

  14     13,426   13,871    14      14,457   13,426 

Current tax liabilities

       1,088   844        1,445   1,088 

Provisions

  19     525   390    19      624   525 

Liabilities held for sale

  22     170   1    22      11   170 
       23,177   20,556 
       19,772   23,177 

Non-current liabilities


Financial liabilities

  15C     16,462   11,145    15C      21,650   16,462 

Non-current tax liabilities

       118   120        174   118 

Pensions and post-retirement healthcare liabilities:


Funded schemes in deficit

  4B     1,225   2,163    4B      1,209   1,225 

Unfunded schemes

  4B     1,509   1,704    4B      1,393   1,509 

Provisions

  19     794   1,033    19      697   794 

Deferred tax liabilities

  6B     1,913   2,061    6B      1,923   1,913 

Othernon-current liabilities

  14     700   667    14      346   700 
       27,392   22,721 
       22,721   18,893 

Total liabilities

       45,898   39,449        47,164   45,898 

Equity


Shareholders’ equity


Called up share capital

  15A     484   484    15A      464   484 

Share premium account

       130   134        129   130 

Other reserves

  15B     (13,633  (7,443   15B      (15,286  (13,633

Retained profit

       26,648  23,179        26,265  26,648 
       13,629  16,354 
       11,572  13,629 

Non-controlling interests

       758  626        720  758 

Total equity

       14,387  16,980        12,292  14,387 

Total liabilities and equity

         60,285  56,429          59,456  60,285 

These financial statements have been approved by the Directors.

The Board of Directors

23 February 20186 March 2019


88Annual Report on Form 20-F 2018 Financial Statements Annual Report on Form 20-F 201777


CONSOLIDATED FINANCIAL STATEMENTS

UNILEVER GROUPCONTINUED


CONSOLIDATED CASH FLOW STATEMENT

for the year ended 31 December


           € million    million    million 
              € million        million        million   Notes   2018 2017 2016 
  Notes  2017 2016 2015 

Net profit

       6,486  5,547  5,259        9,808  6,486  5,547 

Taxation

       1,667  1,922  1,961        2,575  1,667  1,922 

Share of net profit of joint ventures/associates and other income/(loss) fromnon-current investments
and associates

       (173 (231 (198       (207 (173 (231

Net monetary gain arising from hyperinflationary economies

       (122      

Net finance costs

  5     877   563   493    5      481   877   563 

Operating profit

       8,857   7,801   7,515        12,535   8,857   7,801 

Depreciation, amortisation and impairment

       1,538   1,464   1,370        1,747   1,538   1,464 

Changes in working capital:

       (68  51   720        (793  (68  51 
  

Inventories

       (104  190   (129       (471  (104  190 
  

Trade and other receivables

       (506  142   2        (1,298  (506  142 
  

Trade payables and other liabilities

       542   (281  847        976   542   (281

Pensions and similar obligations less payments

       (904  (327  (385       (128  (904  (327

Provisions less payments

       200   65   (94       55   200   65 

Elimination of (profits)/losses on disposals

       (298  127   26        (4,299  (298  127 

Non-cash charge for share-based compensation

       284   198   150        196   284   198 

Other adjustments

       (153  (81  49 

Other adjustments(a)

       (266  (153  (81

Cash flow from operating activities

       9,456   9,298   9,351        9,047   9,456   9,298 

Income tax paid

       (2,164  (2,251  (2,021       (2,294  (2,164  (2,251

Net cash flow from operating activities

       7,292   7,047   7,330        6,753   7,292   7,047 

Interest received

       154   105   119        110   154   105 

Purchase of intangible assets

       (158  (232  (334       (203  (158  (232

Purchase of property, plant and equipment

       (1,509  (1,804  (1,867       (1,329  (1,509  (1,804

Disposal of property, plant and equipment

       46   158   127        108   46   158 

Acquisition of group companies, joint ventures and associates

       (4,896  (1,731  (1,897       (1,336  (4,896  (1,731

Disposal of group companies, joint ventures and associates

       561   30   199        7,093   561   30 

Acquisition of othernon-current investments

       (317  (208  (78       (94  (317  (208

Disposal of othernon-current investments

       251   173   127        151   251   173 

Dividends from joint ventures, associates and othernon-current investments

       138   186   176        154   138   186 

(Purchase)/sale of financial assets

       (149  135   (111       (10  (149  135 

Net cash flow (used in)/from investing activities

       (5,879  (3,188  (3,539       4,644   (5,879  (3,188

Dividends paid on ordinary share capital

       (3,916  (3,609  (3,331       (4,066  (3,916  (3,609

Interest and preference dividends paid

       (470  (472  (579       (477  (470  (472

Net change in short-term borrowings

       2,695   258   245        (4,026  2,695   258 

Additional financial liabilities

       8,851   6,761   7,566        10,595   8,851   6,761 

Repayment of financial liabilities

       (2,604  (5,213  (6,270       (6,594  (2,604  (5,213

Capital element of finance lease rental payments

       (14  (35  (14       (10  (14  (35

Buy back of preference shares

  25     (448  -   - 

Buyback of preference shares

          (448   

Repurchase of shares

  24     (5,014  -   -    24      (6,020  (5,014   

Other movements on treasury shares

       (204  (257  (276       (257  (204  (257

Other financing activities

       (309  (506  (373       (693  (309  (506

Net cash flow (used in)/from financing activities

       (1,433  (3,073  (3,032       (11,548  (1,433  (3,073

Net increase/(decrease) in cash and cash equivalents

       (20  786   759        (151  (20  786 

Cash and cash equivalents at the beginning of the year

       3,198   2,128   1,910        3,169   3,198   2,128 

Effect of foreign exchange rate changes

       (9  284   (541       72   (9  284 

Cash and cash equivalents at the end of the year

  17A      3,169   3,198   2,128    17A       3,090   3,169   3,198 

(a)

2018 includes anon-cash credit of277 million from early settlement of contingent consideration relating to Blueair.

The cash flows of pension funds (other than contributions and other direct payments made by the Group in respect of pensions and similar obligations) are not included in the Group cash flow statement.


Annual Report on Form 20-F 201778 Financial Statements  89Annual Report on Form 20-F 2018


NOTES TO THE CONSOLIDATED FINANCIAL STATEMENTS

UNILEVER GROUP


1. ACCOUNTING INFORMATION AND POLICIES

The accounting policies adopted are the same as those which were applied for the previous financial year, except as set out below under the heading ‘Recent accounting developments’.

UNILEVER

The two parent companies, NV and PLC, together with their group companies, operate as a single economic entity (the Unilever Group, also referred to as Unilever or the Group). NV and PLC have the same Directors and are linked by a series of agreements, including an Equalisation Agreement, which are designed so that the positions of the shareholders of both companies are as closely as possible the same as if they held shares in a single company.

The Equalisation Agreement provides that both companies adopt the same accounting principles. It also requires that dividends and other rights and benefits attaching to each ordinary share of NV, be equal in value to those rights and benefits attaching to each ordinary share of PLC, as if each such unit of capital formed part of the ordinary share capital of one and the same company.

BASIS OF CONSOLIDATION

Due to the operational and contractual arrangements referred to above, NV and PLC form a single reporting entity for the purposes of presenting consolidated financial statements. Accordingly, the financial statements of Unilever are presented by both NV and PLC as their respective consolidated financial statements. Group companies included in the consolidation are those companies controlled by NV or PLC. Control exists when the Group has the power to direct the activities of an entity so as to affect the return on investment.

The net assets and results of acquired businesses are included in the consolidated financial statements from their respective dates of acquisition, being the date on which the Group obtains control. The results of disposed businesses are included in the consolidated financial statements up to their date of disposal, being the date control ceases.

Intra-group transactions and balances are eliminated.

COMPANIES LEGISLATION AND ACCOUNTING STANDARDS

The consolidated financial statements have been prepared in accordance with International Financial Reporting Standards (IFRS) as adopted by the European Union (EU) and IFRIC Interpretations. They are also in compliance with IFRS as issued by the International Accounting Standards Board (IASB).

These financial statements are prepared under the historical cost convention unless otherwise indicated.

These financial statements have been prepared on a going concern basis. Refer to the going concern statement on page 77.66.

ACCOUNTING POLICIES

Accounting policies are included in the relevant notes to the consolidated financial statements. These are presented as text highlighted in grey on pages 9379 to 145.127. The accounting policies below are applied throughout the financial statements.

FOREIGN CURRENCIES

The consolidated financial statements are presented in euros. The functional currencies of NV and PLC are euros and sterling respectively. Items included in the financial statements of individual group companies are recorded in their respective functional currency which is the currency of the primary economic environment in which each entity operates.

Foreign currency transactions in individual group companies are translated into functional currency using exchange rates at the date of the transaction. Foreign exchange gains and losses from settlement of these transactions, and from translation of monetary assets and liabilities atyear-end exchange rates, are recognised in the income statement except when deferred in equity as qualifying hedges.

In preparing the consolidated financial statements, the balances in individual group companies are translated from their functional currency into euros. TheApart from the financial statements of group companies in hyperinflationary economies (see below), the income

statement, the cash flow statement and all other movements in assets and liabilities are translated at average rates of exchange as a proxy for the transaction rate, or at the transaction rate itself if more appropriate. Assets and liabilities are translated atyear-end exchange rates.

The financial statements of group companies whose functional currency is the currency of a hyperinflationary economy are adjusted for inflation and then translated into euros. Amounts shown for prior years for comparative purposes are not modified. To determine the existence of hyperinflation, the Group assesses the qualitative and quantitative characteristics of the economic environment of the country, such as the cumulative inflation rate over the previous three years.

The ordinary share capital of NV and PLC is translated in accordance with the Equalisation Agreement. The difference between the value for PLC and the value by applying theyear-end rate of exchange is taken to other reserves (see note 15B on page 117)106).

The effect of exchange rate changes during the year on net assets of foreign operations is recorded in equity. For this purpose net assets include loans between group companies and any related foreign exchange contracts where settlement is neither planned nor likely to occur in the foreseeable future.

The Group applies hedge accounting to certain exchange differences arising between the functional currencies of a foreign operation and NV or PLC as appropriate, regardless of whether the net investment is held directly or through an intermediate parent. Differences arising on retranslation of a financial liability designated as a foreign currency net investment hedge are recorded in equity to the extent that the hedge is effective. These differences are reported within profit or loss to the extent that the hedge is ineffective.

Cumulative exchange differences arising since the date of transition to IFRS of 1 January 2004 are reported as a separate component of other reserves. In the event of disposal or part disposal of an interest in a group company either through sale or as a result of a repayment of capital, the cumulative exchange difference is recognised in the income statement as part of the profit or loss on disposal of group companies.

CLASSIFICATION OF ARGENTINA AS

A HYPER-INFLATIONARY ECONOMY

The Argentinian economy was designated as hyperinflationary from

1 July 2018. As a result, application of IAS 29 ‘Financial Reporting in Hyperinflationary Economies’ has been applied to all Unilever entities whose functional currency is the Argentinian Peso. IAS 29 requires that adjustments are applicable from the start of the relevant entity’s reporting period. For Unilever that is from 1 January 2018. The application of IAS 29 includes:

Adjustment of historical costnon-monetary assets and liabilities for the change in purchasing power caused by inflation from the date of initial recognition to the balance sheet date;
Adjustment of the income statement for inflation during the reporting period;
The income statement is translated at the period end foreign exchange rate instead of an average rate; and
Adjustment of the income statement to reflect the impact of inflation and exchange rate movement on holding monetary assets and liabilities in local currency.

The main effects on the Group consolidated financial statements for 2018 are:

Total assets increased by538 million driven by an increase of369 million to goodwill (see note 9) and171 million due to property, plant and equipment (see note 10);
Opening retained profit increased by393 million reflecting the impact of adjusting the historical cost ofnon-monetary assets and liabilities from the date of their initial recognition to 1 January 2018 for the effect of inflation;
Turnover is reduced by75 million;
Operating profit is reduced by37 million; and
A net monetary gain of122 million is recognised from the inflation and exchange rate movements in the year on the net monetary items held in Argentinian Peso.

Annual Report on Form 20-F 2018Financial Statements79


NOTES TO THE CONSOLIDATED FINANCIAL STATEMENTS

UNILEVER GROUPCONTINUED

1. ACCOUNTING INFORMATION AND POLICIESCONTINUED

CRITICAL ACCOUNTING ESTIMATES AND JUDGEMENTS

The preparation of financial statements requires management to make judgements and estimates in the application of accounting policies that affect the reported amounts of assets, liabilities, income and expenses. Actual results may differ from these estimates. Estimates and judgements are continuously evaluated and are based on historical experience and other factors, including expectations of future events that are believed to be reasonable. Revisions to accounting estimates are recognised in the period in which the estimate is revised and in any future period affected.

The following judgements are those that management believe have the most significant effect on the amounts recognised in the Group’s financial statements:


Separate presentation of items in the income statement – certain items of income or expense are presented separately asnon-underlying items. These are excluded in several of our performance measures, including underlying operating profit and underlying earnings per share due to their nature and/or frequency of occurrence. See note 3 for further details.
Disclosure of Spreads assets and liabilities – following the announcement to dispose of our Spreads business, management have assessed whether this would meet the criteria for presentation as a discontinued operation. As Spreads contribution to the overall group is approximately 6 % of group turnover and 2 % of total assets, management have concluded that it does not represent a separate major line of business, or component of the Group and so should not be presented as a discontinued operation. The Spreads assets and liabilities have been presented in the financial statements as held for sale – see note 22.

90Financial StatementsAnnual Report on Form 20-F 2017


1.ACCOUNTING INFORMATION AND POLICIESCONTINUED

Utilisation of tax losses and recognition of other deferred tax assets – The Group operates in many countries and is subject to taxes in numerous jurisdictions. Management uses judgement to assess the recoverability of tax assets such as whether there will be sufficient future taxable profits to utilise losses – see note 6B.
Likelihood of occurrence of provisions and contingent liabilities – events can occur where there is uncertainityuncertainty over future obligations. Judgement is required to determine if an outflow of economic resources is probable, or possible but not probable. Where it is probable, a liability is recognised and further judgement is used to determine the level of the provision. Where it is possible but not probable, further judgement is used to determine if the likelihood is remote, in which case no disclosures are provided; if the likelihood is not remote then judgement is used to determine the contingent liability disclosed. Unilever does not have provisions and contingent liabilities for the same matters. External advice is obtained for any material cases. See notes 6A, 19 and 20.

are provided; if the likelihood is not remote then judgement is used to determine the contingent liability disclosed. Unilever does not have provisions and contingent liabilities for the same matters. External advice is obtained for any material cases. See notes 6A, 19 and 20.

The following estimates are those that management believe have the most significant risk of causing a material adjustment to the carrying amounts of assets and liabilities within the next financial year are:

Measurement of defined benefit obligations – the valuations of the Group’s defined benefit pension plan obligations are dependent on a number of assumptions. These include discount rates, inflation and life expectancy of scheme members. Details of these assumptions and sensitivities are in note 4B.
Assumptions used in discounted cash flow projections – estimates of future business performance, cash generation, long termlong-term growth and discount rates are used in our assessment of impairment of assets at the balance sheet date. Details of the estimates used in the impairment reviews for significant cash generating units are set out in note 9; no reasonably plausible changes in a key assumption would cause an impairment.
Measurement of consideration and assets and liabilities acquired as part of business combinations – contingent consideration depends on an acquired business achieving targets within a fixed period. Estimates of future performance are required to calculate the obligations at the time of acquisition and at each subsequent reporting date. See note 21 for further information. Additionally, estimates are required to value the assets and liabilities acquired in business combinations. Intangible assets such as brands are commonly a core part of an acquired business as they allow us to obtain more value than would otherwise be possible.


RECENT ACCOUNTING DEVELOPMENTS

ADOPTED BY THE GROUP

The Group applied for the first timefirst-time amendments to the following standardstandards from 1 January 2017. This did not have a material impact on the Group.2018.


APPLICABLE

STANDARD

 KEY REQUIREMENTS IMPACT ON GROUP
        

Amendments to IAS 7

‘Statement of Cash Flows’

This change adds a new requirement to explain changes in liabilities related to financing activities.

The required disclosure has been included in note 15C.

All other standards or amendments to standards that have been issued by the IASB and were effective by 1 January 2017 were not applicable to Unilever.

Annual Report on Form 20-F 2017Financial Statements91


NOTES TO THE CONSOLIDATED FINANCIAL STATEMENTS

UNILEVER GROUPCONTINUED

1. ACCOUNTING INFORMATION AND POLICIESCONTINUED

NEW STANDARDS, AMENDMENTS AND INTERPRETATIONS OF EXISTING STANDARDS THAT ARE NOT YET EFFECTIVE AND HAVE NOT BEEN EARLY ADOPTED BY THE GROUP

The following three new standards have been released, but are not yet adopted by the Group. The expected impact and progress is shown below.

APPLICABLE STANDARDKEY REQUIREMENTS
OR CHANGES IN ACCOUNTING POLICY
IMPLEMENTATION PROGRESS
AND EXPECTED IMPACT

IFRS 9

‘Financial Instruments’

Effective from the year ended 31 December 2018

The standard has been endorsed by the EU


This standard introduces new requirements in three areas:


Classification and measurement:

Financial assets willare now be classified based on

1)  the objective of the Group in holding the asset and

2) an assessment of whether  the contractual cash flows are solely payments of principal and interest.flows.


Impairment:

A new expected credit loss model will beis used for calculating impairment on financial assets. A loss event does not have to occur before credit losses are recognised.


Hedge accounting:

New general hedge accounting requirements will allow hedge accounting based on the Group’s risk management policies rather than only prescribed scenarios.


During 2017,On 1 January 2018, the Group concluded preparations foradopted IFRS 9 ‘Financial Instruments’, which replaced IAS 39 ‘Financial Instruments – Recognition and Measurement’. As there was no material impact from the adoption of this standard, the Group has not restated the comparative information relating to prior years.

Classification and measurement:

On 1 January 2018, the Group reclassified its financial assets to the new requirements in IFRS 9.

Classificationcategories based on the Group’s reason for holding the assets and measurement:

The net effect, using 2017-year end balances, is that approximately120 millionthe nature of financial assets previously measured at fair value through equity will be measured at amortised cost.the cash flows from the assets. See note 17A for further information. There arewere no other significant changes in classification.

Based on historic fair value movementsto the classification or measurement of these assets, the impact on profit or loss will be immaterial.

There will be no impact onGroup’s financial liabilities.


Impairment:

From 1 January 2018, the Group implemented an expected credit loss impairment model for financial assets. For trade receivables, we will make minor refinements to ourthe calculation methodology has been updated to be more specific about ageing.consider expected losses based on ageing profile. The impactadoption of applying this will be immaterial.the expected loss approach has not resulted in a material change in impairment provision for any financial asset.


For other financial assetsHedge accounting:

The Group applied the expected impact of applying the new expected loss model will be immaterial.

Hedge accounting:

We have updated our hedge documentation to align with theaccounting requirements of IFRS 9 from 1 January 2018.prospectively. At the date of initial application all of the Group’s existing hedge relationships were eligible to be treated as continuing hedge relationships.


Our current hedge relationships will qualify as hedges

80Financial StatementsAnnual Report on adoption of IFRS 9.Form 20-F 2018


1. ACCOUNTING INFORMATION AND POLICIESCONTINUED

APPLICABLE

STANDARD

KEY REQUIREMENTSIMPACT ON GROUP


IFRS 15 ‘Revenue

‘Revenue from

Contracts with Customers’

Effective from the year ended 31 December 2018

The standard has been endorsed by the EU


The standard clarifies the accounting for bundled services and identifying each ‘performance obligation’ in contractual arrangements. It also provides more guidance on the measurement of revenue contracts which have discounts, rebates, payments to suppliers and consignment stock.


We have completed our review ofOn 1 January 2018 the requirements ofGroup adopted IFRS 15 against our existing‘Revenue from Contracts with Customers’ with no impact as the accounting policies in particular for trade expenditure, consignment stock, bad debts, other incentives and recognising license and franchise income.

As a result of our review we concluded that our current accounting policies arewere already in line with the new standard.

All other standards or amendments to standards that have been issued by the IASB and were effective by 1 January 2018 were not applicable to Unilever.

NEW STANDARDS, AMENDMENTS AND INTERPRETATIONS OF EXISTING STANDARDS THAT ARE NOT YET EFFECTIVE AND HAVE NOT BEEN EARLY ADOPTED BY THE GROUP

The following new standards have been released but are not yet adopted by the Group. The expected impact and progress is shown below.

APPLICABLE

STANDARD

KEY REQUIREMENTS
OR CHANGES IN ACCOUNTING POLICY
IMPLEMENTATION PROGRESS
AND EXPECTED IMPACT


IFRS 16

‘Leases’ ‘Leases’


Effective from the year ended 31 December 2019


The standard has been endorsed by the EU


This standard changes the recognition, measurement, presentation and disclosure of leases. In particular it requires lessees to record all leases on the balance sheet with exemptions available for low value and short-term leases. At the commencement of a lease, a lessee will recognise lease payments (lease liability) and an asset representing the right to use the asset during the lease term(right-of-use asset). Lessees will subsequently reduce the lease liability when paid and recognise depreciation on theright-of-use asset.

A lease liability is remeasured upon the occurrence of certain events such as a change in the lease term or a change in an index or rate used to determine lease payments. The remeasurement normally also adjusts theright-of-use asset.

The standard has no impact on the actual cash flows of a group. However the standard requires the capitalisation, and subsequent depreciation, of costs that are currently expensed as paid which impacts disclosures of cash flows within the cash flow statement. The amounts currently expensed as operating cash outflows which will instead be capitalised are presented as financing cash outflows.


DueThe preparations for this standard are substantially complete. The Group intends on adopting the ‘full retrospective’ approach and in our 2019 reporting the comparative information relating to the number of countries we operate in, significant work is required to estimate: the assets and liabilities thatprior years will need to be recognised on adoption of the new standard; the impact on Group profit; and reporting of cash flows.restated.


In note 20, we outlineThe Group has reviewed all relevant contracts to identify leases. This review included an assessment about whether the contract depends on a specific asset, whether the Group obtains substantially all the economic benefits from the use of that asset and whether the Group has the right to direct the use of that asset. Based on this assessment, we calculated the restatement impact as at the transition date. From 1 January 2019 the Group will focus on ensuring that the revised process for identifying and accounting for leases is followed.

The Group intends to use the exemptions provided by IFRS 16 for short-term leases (less than a year) and leases forlow-value assets.

The estimated impact of IFRS 16 on the Group’s financial statements at 31 December 2018 is as follows:

Balance sheet:

The Group estimates that the adoption of IFRS 16 will result in an increase in total assets of approximately1.7 billion, split between land and buildings of1.3 billion and plant and machinery of0.4 billion.

Based on the geographies, this is approximately0.5 billion in Europe,0.5 billion in The Americas and0.7 billion in Asia/AMET/ RUB.

Financial liabilities are expected to increase by approximately1.9 billion.

Income statement:

The Group estimates that the adoption of IFRS 16 will result in increased depreciation of approximately470��million from theright-of-use assets. This will offset the reduction in operating lease commitmentsexpenses of around550 million per year, resulting in an overall increase in operating profit of2.5 billion. However,80 million. Finance costs are expected to increase by approximately90 million per year due to the changes in the definition of a lease term and potential embedded leases that we believe need to be identified andinterest recognised on the balance sheet, it has not yet been possible to estimate the amount of right of use assets and lease liabilities that will be recognised on the balance sheet. We have also not yet decided which exemptions will be adopted.liabilities.


DuringStatement of Cash Flows:

The Group estimates that the year we have establishedadoption of IFRS 16 will increase cash flows from operating activities by approximately550 million with a project team and begun an initial impact assessment exercise. We have also begun a reviewrelated increase in cash flows used in financing activities of the systems and processes that will need550 million which relates to be updatedlease payments previously expensed as a result of this change. We expect to conclude preparations by the end of 2018.

paid.


92Annual Report on Form 20-F 2018 Financial Statements Annual Report on Form 20-F 201781


NOTES TO THE CONSOLIDATED FINANCIAL STATEMENTS

UNILEVER GROUPCONTINUED


1. ACCOUNTING INFORMATION AND POLICIESCONTINUED


In addition to the above, based on an initial review the Group does not currently believe adoption of the following standard/amendments will have a material impact on the consolidated results or financial position of the Group.


APPLICABLE

STANDARD


KEY REQUIREMENTS

OR CHANGES IN ACCOUNTING POLICY


IFRIC 23 ‘Uncertainty over income tax treatments’


Effective from the year ended 31 December 2019


The IFRIC Interpretation has been endorsed by the EU


This interpretation clarifies how entities should reflect uncertainties over income tax treatments, such asin particular when assessing the outcome a tax authority might reach with full knowledge and information if it were to determine separately or together.make an examination. Based on preliminary work, we estimate the impact willis estimated to be immaterial, we are in the process of reviewing our existing arrangements to determine the impact on adoption.immaterial.


IFRS 17 ‘Insurance Contracts’


Effective from the year ended 31 December 2021


The standard is not yet endorsed by the EU


This standard introduces a new model for accounting for insurance contracts. Based on preliminary work we estimate the impact will be immaterial, we are in the process of reviewing ourWork continues to review existing arrangements to determine the impact on adoption. Based on preliminary work the impact is estimated to be immaterial.


Amendments to IAS 19 ‘Employee Benefits’


Effective from the year ended 31 December 2019


The standard is not yet endorsed by the EU


The change clarifiesrequires that following plan amendments, curtailmentcurtailments or settlements, current service and net interest costs for the remainder of the reporting period should be calculated in line with updated actuarial assumptions. The amendment is to be applied prospectively.

All other standards or amendments to standards that have been issued by the IASB and are effective from 1 January 20182019 onwards are not applicable to Unilever.


2. SEGMENT INFORMATION


SEGMENTAL REPORTING

Beauty & Personal Care

  primarily sales of skin care and hair care products, deodorants and oral care products.

Foods & Refreshment

primarily sales of soups, bouillons, sauces, snacks, mayonnaise, salad dressings, margarines and spreads, ice cream andtea-based beverages

Home Care

  primarily sales of home care products, such as powders, liquids and capsules, soap bars and a wide range of cleaning products.

Foods

primarily sales of soups, bouillons, sauces, snacks, mayonnaise, salad dressings, margarines and spreads.

Refreshment

primarily sales of ice cream andtea-based beverages.

REVENUE

Turnover comprises sales of goods after the deduction of discounts, sales taxes and estimated returns. It does not include sales between group companies. Discounts given by Unilever include rebates, price reductions and incentives given to customers, promotional couponing and trade communication costs. Accumulated experience is used to estimate the provision for discounts, using the most likely amount method; revenue is only recognised to the extent that it is highly probable a significant reversal will not occur.

Turnover is recognised when the risks and rewardscontrol of the underlying products have been substantiallybeing sold has transferred to our customer and when there are no longer any unfulfilled obligations to the customer. DependingThis is generally on delivery to the customer but depending on individual customer terms, this can be at the time of dispatch, delivery or upon formal customer acceptance. This is considered the appropriate point where the performance obligations in our contracts are satisfied as Unilever no longer have control over the inventory.

Our customers have the contractual right to return goods only when authorised by Unilever. At 31 December 2018, an estimate has been made of goods that will be returned and a liability has been recognised for this amount. An asset has also been recorded for the corresponding inventory that is estimated to return to Unilever using a best estimate based on accumulated experience.

Some of our customers are distributors who may be able to return unsold goods in consignment arrangements. A liability is recognised where we receive payment from a customer before transferring control of the goods being sold.

UNDERLYING OPERATING PROFIT

Underlying operating profit means operating profit before the impact ofnon-underlying items within operating profit (see note 3). Underlying operating profit represents our measure of segment profit or loss as it is the primary measure used for the purpose of making decisions about allocating resources and assessing performance of segments. Underlying operating margin is calculated as underlying operating profit divided by turnover.


Annual Report on Form 20-F 201782 Financial Statements  93Annual Report on Form 20-F 2018


NOTES TO THE CONSOLIDATED FINANCIAL STATEMENTS

UNILEVER GROUPCONTINUED


2. SEGMENT INFORMATIONCONTINUED

The Group has revised its operating segments to align with the new structure under which the business is managed. Beginning 2018, operating segment information is provided based on three product areas: Beauty & Personal Care, Foods & Refreshment and Home Care.


Notes


      € million

Beauty &

    Personal Care


      € million

Foods &

    Refreshment


(a) 


            € million

Home

Care


            € million


Total


2018


Turnover

    20,624   20,227   10,131   50,982 

Operating profit

    4,130   7,245   1,160   12,535 

Non-underlying items

 3    378   (3,711  157   (3,176

Underlying operating profit

    4,508   3,534   1,317   9,359 

Share of net profit/(loss) of joint ventures and associates

    (1  183   3   185 

Significantnon-cash charges:


Within underlying operating profit:


Depreciation and amortisation

    510   773   256   1,539 

Share-based compensation and othernon-cash charges(b)

    102   102   46   250 

Withinnon-underlying items:


Impairment and othernon-cash charges(c)

    122   164   263   549 
           € million       € million       € million       € million       € million       € million       € million    
 Notes    Personal
Care
 

Home

Care

 Home and
Personal
Care
 Foods 

Refresh-

ment


Foods and
Refresh-

ment(a)

    Total       
          

2017


Turnover

    20,697   10,574   31,271   12,512   9,932   22,444    53,715    20,697  22,444  10,574  53,715 
   

Operating profit

    4,103   1,138   5,241   2,275   1,341   3,616    8,857    4,103  3,616  1,138  8,857 

Non-underlying items

 3    272   150   422   196   (75  121     543  3   272  121  150  543 

Underlying operating profit

    4,375   1,288   5,663   2,471   1,266   3,737    9,400    4,375  3,737  1,288  9,400 
   

Share of net profit/(loss) of joint ventures and associates

    8   4   12   7   136   143    155    8  143  4  155 

Significantnon-cash charges:


Within underlying operating profit:


Depreciation and amortisation

    488   248   736   321   481   802    1,538    488  802  248  1,538 

Share-based compensation and othernon-cash charges(b)

    164   79   243   96  ��78   174    417    164  174  79  417 

Withinnon-underlying items:


Impairment and othernon-cash charges(c)

   80   48   128   76   115   191    319    80  191  48  319 


2016


Turnover

   20,172  10,009   30,181  12,524  10,008   22,532     52,713    20,172  22,532  10,009  52,713 
    

Operating profit

   3,704  949   4,653  2,180  968   3,148     7,801    3,704  3,148  949  7,801 

Non-underlying items

 3   329  137   466  214  143   357     823  3   329  357  137  823 

Underlying operating profit

   4,033  1,086   5,119  2,394  1,111   3,505     8,624    4,033  3,505  1,086  8,624 
    

Share of net profit/(loss) of joint ventures and associates

   (5 1   (4 4  127   131     127    (5 131  1  127 

Significantnon-cash charges:


Within underlying operating profit:


Depreciation and amortisation

   437  236   673  322  469   791     1,464    437  791  236  1,464 
    

Share-based compensation and othernon-cash charges(b)

   134  86   220  76  59   135     355    134  135  86  355 

Withinnon-underlying items:


Impairment and othernon-cash charges(c)

   74  45   119  75  49   124     243    74  124  45  243 
     

2015


Turnover

   20,074  10,159   30,233  12,919  10,120   23,039    53,272 
         

Operating profit

   3,637  740   4,377  2,298  840   3,138    7,515 

Non-underlying items

 3   314  115   429  170  197   367     796 

Underlying operating profit

   3,951  855   4,806  2,468  1,037   3,505    8,311 
   

Share of net profit/(loss) of joint ventures and associates

   (4  -   (4 4  107   111    107 

Significantnon-cash charges:


Within underlying operating profit:


Depreciation and amortisation

   377  235   612  308  450   758    1,370 

Share-based compensation and othernon-cash charges(b)

   125  76   201  72  57   129    330 

Withinnon-underlying items:


Impairment and othernon-cash charges(c)

   142  58   200  41  96   137    337 


(a) 

Foods and& Refreshment is expected to be reported together from 2018. For the prior year figures, Foods and Refreshment have been combined to align with the current structure.

(b) 

Othernon-cash charges within underlying operating profit includesinclude movements in provisions from underlying activities, excluding movements arising fromnon-underlying activities.

(c) 

Othernon-cash charges withinnon-underlying items includes movements in restructuring provisions, movements in certain legal provisions (in 20172018 and 2015)2017), and foreign exchange losses resulting from remeasurement of the Argentinian business (in 2016 and 2015) and Venezuelan business (in 2015)(2016).

Transactions between the Unilever Group’s reportable segments are immaterial and are carried out on an arm’s length basis.

The Unilever Group is not reliant on revenues from transactions with any single customer and does not receive 10% or more of its revenues from transactions with any single customer.

Segment assets and liabilities are not provided because they are not reported to or reviewed by our chief operating decision-maker, which is Unilever Leadership Executive (ULE) as explained in the Corporate Governance Section.


94Annual Report on Form 20-F 2018 Financial Statements Annual Report on Form 20-F 201783


NOTES TO THE CONSOLIDATED FINANCIAL STATEMENTS

UNILEVER GROUPCONTINUED


2. SEGMENT INFORMATIONCONTINUED


The home countries of the Unilever Group are the Netherlands and the United Kingdom. Turnover andnon-current assets for these two countries combined, for the United States (being the largest country outside the home countries) and for all other countries are:


             € million             € million             € million             € million 
2017  Netherlands/
United
Kingdom
   

United

States

   Others   Total 

Turnover

   3,849    8,532    41,334    53,715 

Non-current assets(d)

   3,781    11,820    23,768    39,369 

2016


Turnover

   3,819    8,263    40,631    52,713 

Non-current assets(d)

   4,770    11,696    23,358    39,824 

2015


Turnover

   4,157    7,956    41,159    53,272 

Non-current assets(d)

   4,878    9,674    22,336    36,888 

(d)Non-current assets excluding financial assets, deferred tax assets and pension assets for funded schemes in surplus.Non-current assets were reduced in all the geographies as a result of the reclassification of Spreadsnon-current assets to current assets - assets held for sale (refer to note 22); this was offset in the United States and other geographies by the impact of goodwill and intangible assets from acquisitions.

No other country had turnover ornon-current assets (as shown above) greater than 10% of the Group total.

             € million    € million    € million    € million 
    Netherlands/
United
Kingdom
  

United

States

  Others  Total 

2018


Turnover

   3,679   8,305   38,998   50,982 

Non-current assets(d)

   4,070   12,193   24,225   40,488 

2017


Turnover

   3,849   8,532   41,334   53,715 

Non-current assets(d)

   3,781   11,820   23,768   39,369 

2016


Turnover

   3,819   8,263   40,631   52,713 

Non-current assets(d)

   4,770   11,696   23,358   39,824 


(d)  Non-current assets excluding financial assets, deferred tax assets and pension assets for funded schemes in surplus.


No other country had turnover ornon-current assets (as shown above) greater than 10% of the Group total.


ADDITIONAL INFORMATION BY GEOGRAPHIES

Although the Group’s operations are managed by product area, we provide additional information based on geographies. The analysis of turnover by geographical area is stated on the basis of origin.

             € million            € million            € million             € million 
    
Asia/
AMET/RUB
 
(e) 
  

The

Americas


  Europe    Total 

2017


Turnover

   23,266   17,525   12,924    53,715 

Operating profit

   3,802   3,086   1,969    8,857 

Non-underlying items

   306   (23  260    543 

Underlying operating profit

   4,108   3,063   2,229    9,400 

Share of net profit/(loss) of joint ventures and associates

   12   112   31    155 

2016


Turnover

   22,445   17,105   13,163    52,713 

Operating profit

   3,275   2,504   2,022    7,801 

Non-underlying items

   254   401   168    823 

Underlying operating profit

   3,529   2,905   2,190    8,624 

Share of net profit/(loss) of joint ventures and associates

   (2  108   21    127 

2015


Turnover

   22,425   17,294   13,553    53,272 

Operating profit

   3,019   2,273   2,223    7,515 

Non-underlying items

   181   399   216    796 

Underlying operating profit

   3,200   2,672   2,439    8,311 

Share of net profit/(loss) of joint ventures and associates

   (1  96   12    107 

(e)Refers to Asia, Africa, Middle East, Turkey, Russia, Ukraine and Belarus.

Transactions between the Unilever Group’s geographical regions are immaterial and are carried out on an arm’s length basis.


          € million  € million  € million  € million

Asia/
AMET/RUB

(e)

The

Americas


EuropeTotal

2018

Turnover

22,86816,02012,09450,982

Operating profit

4,7773,5864,17212,535

Non-underlying items

(437(892(1,847(3,176

Underlying operating profit

4,3402,6942,3259,359

Share of net profit/(loss) of joint ventures and associates

11471185

2017

Turnover

23,26617,52512,92453,715

Operating profit

3,8023,0861,9698,857

Non-underlying items

306(23260543

Underlying operating profit

4,1083,0632,2299,400

Share of net profit/(loss) of joint ventures and associates

1211231155

2016

Turnover

22,44517,10513,16352,713

Operating profit

3,2752,5042,0227,801

Non-underlying items

254401168823

Underlying operating profit

3,5292,9052,1908,624

Share of net profit/(loss) of joint ventures and associates

(210821127

(e)

Refers to Asia, Africa, Middle East, Turkey, Russia, Ukraine and Belarus.

Transactions between the Unilever Group’s geographical regions are immaterial and are carried out on an arm’s length basis.

Annual Report on Form 20-F 2017Financial Statements95


NOTES TO THE CONSOLIDATED FINANCIAL STATEMENTS

UNILEVER GROUPCONTINUED

84Financial StatementsAnnual Report on Form 20-F 2018


3. OPERATING COSTS ANDNON-UNDERLYING ITEMS


BRAND AND MARKETING INVESTMENT

Brand and marketing investment includes costs incurred for the purpose of building and maintaining brand equity and awareness. These include media, advertising production, promotional materials and engagement with consumers. These costs are charged to the income statement as incurred.

RESEARCH AND DEVELOPMENT

Expenditure on research and development includes staff costs, material costs, depreciation of property, plant and equipment and other costs directly attributable to research and product development activities. These costs are charged to the income statement as incurred.incurred, except for those development costs which meet the criteria for capitalisation - see note 9.

NON-UNDERLYING ITEMS

Non-underlying items are costs and revenues relating to gains and losses on business disposals, acquisition and disposal-related costs, restructuring costs, impairments and otherone-off items within operating profit, and other significant and unusual items within net profit but outside of operating profit, which we collectively termnon-underlying items due to their nature and/or frequency of occurrence. These items are significant in terms of nature and/or amount and are relevant to an understanding of our financial performance.

Restructuring costs are charges associated with activities planned by management that significantly change either the scope of the business or the manner in which it is conducted.


          € million          million          million  € million      million      million 
  2017 2016 2015  2018 2017 2016 

Turnover

   53,715  52,713  53,272   50,982  53,715  52,713 

Cost of sales

   (30,547 (30,229 (30,808  (28,769 (30,547 (30,229
   

of which: Distribution costs

   (3,241 (3,246 (3,358  (3,098 (3,241 (3,246
      

Gross profit

   23,168  22,484  22,464   22,213  23,168  22,484 

Selling and administrative expenses

   (14,311 (14,683 (14,949  (9,678 (14,311 (14,683
   

of which: Brand and marketing investment

   (7,566 (7,731 (8,003  (7,164 (7,566 (7,731
  

Research and development

   (900 (978 (1,005  (900 (900 (978
      

Operating profit

   8,857  7,801  7,515   12,535  8,857  7,801 

NON-UNDERLYING ITEMS(a)

Non-underlying items are disclosed on the face of the income statement to provide additional information to users to help them better understand underlying business performance.


                  € million          million          million  € million      million      million 
  Notes        2017 2016 2015  2018 2017 2016 

Non-underlying items within operating profit before tax

       (543 (823 (796  3176  (543 (823

Acquisition and disposal-related costs(a)


(159


(132


(105


  76  (159 (132
  

Gain/(loss) on disposal of group companies(b)

       334  (95 (9  4,331  334  (95
  

Restructuring costs

       (638 (578 (446  (914 (638 (578
  

Impairments and otherone-off items(c)

       (80 (18 (236  (317 (80 (18

Tax onnon-underlying items within operating profit

       77  213  180   (259 77  213 

Non-underlying items within operating profit after tax

         (466 (610 (616  2,917  (466 (610

Non-underlying items not in operating profit but within net profit before tax

          154  (382   

Premium paid on buy back of preference shares

   25      (382  -   - 
   

Premium paid on buyback of preference shares

    (382   
  

Share of gain on disposal of Spreads business in Portugal JV

  32       
  

Net monetary gain arising from hyperinflationary economies

  122       

Tax impact ofnon-underlying items not in operating profit but within net profit

       578   -   -   (29 578    

Tax on premium paid on buy back of preference shares (non deductible)

       -   -   - 

Impact of US tax reform

   6A      578   -   - 
   

Tax on premium paid on buyback of preference shares (non deductible)


Impact of US tax reform(d)

  (29 578    

Non-underlying items not in operating profit but within net profit after tax

         196   -   -   125  196    

Non-underlying items after tax(d)

       (270 (610 (616

Non-underlying items after tax(e)

  3,042  (270 (610

Attributable to:


Non-controlling interest

       (8 (9 (11  18  (8 (9

Shareholders’ equity

         (262 (601 (605  3,024  (262 (601


(a)Previously we have reported

2018 includes a credit ofnon-core items. From 2017 we reportnon-underlying items and have revised the presentation277 million from early settlement of 2016 and 2015 information.contingent consideration relating to Blueair.

(b) 

2018 includes a gain of4,331 million on disposal of spreads business. 2017 includes a gain of309 million from the sale of AdeS soy beverage business in Latin America.

(c) 

2018 includes a charge of208 million relating to impairment of Blueair intangible asset. Also included is a charge of98 million for litigation matters comprised of48 million for UK pension obligations and50 million for legal cases in relation to investigations by national competition authorities. 2017 includes an80 million charge for legal cases in relation to investigations by national competition authorities including those within Italy and South Africa. 2016 includes18 million in foreign exchange losses resulting from remeasurement of the Argentinian business (2015:52 million). 2015 includes an86 million charge for legal cases related to a number of investigations by local competition regulators, a14 million charge relating to otherone-off legal cases, and84 million in foreign exchange losses resulting from remeasurement of the Venezuelan business.

(d) 

On 22 December 2017, HR1, formerly known as the Tax Cuts and Jobs Act was signed into law in the United States. As a result, tax benefit of578 million was recognised in 2017, primarily due tore-measurement of deferred tax assets and liabilities at the new lower 21% federal tax rate.

(e)

Non-underlying items after tax is calculated asnon-underlying items within operating profit after tax plusnon-underlying items not in operating profit but within net profit after taxtax.


96Annual Report on Form 20-F 2018 Financial Statements Annual Report on Form 20-F 201785


NOTES TO THE CONSOLIDATED FINANCIAL STATEMENTS

UNILEVER GROUPCONTINUED


3. OPERATING COSTS ANDNON-UNDERLYING ITEMSCONTINUED


OTHER

Other significant cost items within operating costs include:


                  € million        million          million           € million        million        million 
  Notes        2017 2016 2015   Notes        2018 2017 2016 

Staff costs

   4A      (6,712 (6,523 (6,555   4A      (6,552 (6,712 (6,523

Raw and packaging materials and goods purchased for resale

       (21,579 (21,122 (21,543       (20,526 (21,579 (21,122

Amortisation of finite-life intangible assets and software

   9      (365 (310 (273   9      (348 (365 (310

Depreciation of property, plant and equipment

   10      (1,173 (1,154 (1,097   10      (1,191 (1,173 (1,154

Exchange gains/(losses):

       (214 (209 (87       (49 (214 (209
   

On underlying transactions

       (51 (28 (118       (116 (51 (28
  

On covering forward contracts

       (163 (181 31        67  (163 (181

Lease rentals:

       (557 (531 (534       (556 (557 (531
   

Minimum operating lease payments

       (568 (536 (546       (568 (568 (536
  

Less:Sub-lease income relating to operating lease agreements

       11  5  12        12  11  5 


4. EMPLOYEES

4A. STAFF AND MANAGEMENT COSTS


          € million          million          million   € million        million        million 
Staff costs  2017 2016 2015   2018 2017 2016 

Wages and salaries

   (5,416 (5,347 (5,474   (5,346 (5,416 (5,347

Social security costs

   (613 (606 (606   (571 (613 (606

Other pension costs

   (399 (372 (325   (439 (399 (372

Share-based compensation costs

   (284 (198 (150   (196 (284 (198
   (6,712 (6,523 (6,555
   (6,552 (6,712 (6,523
  ‘000 ‘000 ‘000 
  ‘000 ‘000 ‘000 
Average number of employees during the year  2017 2016 2015   2018 2017 2016 

Asia/AMET/RUB

   93  95  97    88  93  95 

The Americas

   41  42  42    40  41  42 

Europe

   31  32  32    30  31  32 
   165  169  171 
   158  165  169 
  € million  million  million 
  € million  million  million 
Key management compensation  2017 2016 2015   2018 2017 2016 

Salaries and short-term employee benefits

   (34 (31 (34   (40 (34 (31

Post-employment benefits

   -  (1 (1        (1

Share-based benefits(a)

   (20 (17 (30   (19 (20 (17


(54


(49


(65


(59


(54


(49


Of which:Executive Directors

   (14 (13 (18

Of which: Executive Directors

   (15 (14 (13
Other(b)   (40 (36 (47   (44 (40 (36

Non-Executive Directors’ fees

   (2 (2 (2   (2 (2 (2
   (56 (51 (67   (61 (56 (51


(a) 

Share-based benefits are shown on a vesting basis.

(b) 

Other includes all members of the Unilever Leadership Executive, other than Executive Directors.

Key management are defined as the members of Unilever Leadership Executive (ULE) and theNon-Executive Directors. Compensation for the ULE includes the full yearfull-year compensation for ULE members who joined part way through the year.


Annual Report on Form 20-F 201786 Financial Statements  97Annual Report on Form 20-F 2018


NOTES TO THE CONSOLIDATED FINANCIAL STATEMENTS

UNILEVER GROUPCONTINUED


4B. PENSIONS AND SIMILAR OBLIGATIONS


For defined benefit plans, operating and finance costs are recognised separately in the income statement. The amount charged to operating cost in the income statement is the cost of accruing pension benefits promised to employees over the year, plus the costs of individual events such as past service benefit changes, settlements and curtailments (such events are recognised immediately in the income statement). The amount charged or credited to finance costs is a net interest expense calculated by applying the liability discount rate to the net defined benefit liability or asset. Any differences between the expected interest on assets and the return actually achieved, and any changes in the liabilities over the year due to changes in assumptions or experience within the plans, are recognised immediately in the statement of comprehensive income.

The defined benefit plan surplus or deficit on the balance sheet comprises the total for each plan of the fair value of plan assets less the present value of the defined benefit liabilities (using a discount rate based on high-quality corporate bonds, or a suitable alternative where there is no active corporate bond market).

All defined benefit plans are subject to regular actuarial review using the projected unit method, either by external consultants or by actuaries employed by Unilever. The Group policy is that the most material plans, representing approximately 85%84% of the defined benefit liabilities, are formally valued every year. Other material plans, accounting for a further 13%12% of the liabilities, have their liabilities updated each year. Group policy for the remaining plans requires a full actuarial valuation at least every three years. Asset values for all plans are updated every year.

For defined contribution plans, the charges to the income statement are the company contributions payable, as the company’s obligation is limited to the contributions paid into the plans. The assets and liabilities of such plans are not included in the balance sheet of the Group.

DESCRIPTION OF PLANS

The Group increasingly operates a number of defined contribution plans, the assets of which are held in external funds. In certain countries the Group operates defined benefit pension plans based on employee pensionable remuneration and length of service. The majority of defined benefit plans are either career average, final salary or hybrid plans and operate on a funded basis. Benefits are determined by the plan rules and are linked to inflation in some countries. Our largest plans are in the UK and Netherlands. In the UK, we operate a combination of an open career average defined benefit plan with a salary limit for benefit accrual, and a defined contribution plan. In the Netherlands, we operate a collective defined contribution plan for all new benefit accrual and a closed career average defined benefit plan for benefits built up to April 2015.

The Group also provides other post-employment benefits, mainly post-employment healthcare plans in the United States. These plans are predominantly unfunded.

GOVERNANCE

The majority of the Group’s externally funded plans are established as trusts, foundations or similar entities. The operation of these entities is governed by local regulations and practice in each country, as is the nature of the relationship between the Group and the Trustees (or equivalent) and their composition. Where Trustees (or equivalent) are in place to operate plans, they are generally required to act on behalf of the plan’s stakeholders. They are tasked with periodic reviews of the solvency of the fund in accordance with local legislation and play a role in the long-term investment and funding strategy. The Group also has an internal body, the Pensions and Equity Committee, that is responsible for setting the company’s policies and decision-making on plan matters, including but not limited to design, funding, investments, risk management and governance.

INVESTMENT STRATEGY

The Group’s investment strategy in respect of its funded plans is implemented within the framework of the various statutory requirements of the territories where the plans are based. The Group has developed policy guidelines for the allocation of assets to different classes with the objective of controlling risk and maintaining the right balance between risk and long-term returns in order to limit the cost to the Group of the benefits provided. To achieve this, investments are well diversified, such that the failure of any single investment would not have a material impact on the overall level of assets. The plans continue to invest a good proportion of the assets in equities, which the Group believes offer the best returns over the long-term,long term, commensurate with an acceptable level of risk. The plans expose the Group to a number of actuarial risks such as investment risk, interest rate risk, longevity risk and, in certain markets, inflation risk. There are no unusual entity or plan-specific risks to the Group. For risk control, the pension funds also have significant investments in liability matching assets (bonds) as well as in property and other alternative assets; additionally, the Group uses derivatives to further mitigate the impact of the risks outlined above. The majority of assets are managed by a number of external fund managers with a small proportion managedin-house. Unilever has a pooled investment vehicle (Univest) which it believes offers its pension plans around the world a simplified externally managed investment vehicle to implement their strategic asset allocation models, currently for bonds, equities and alternative assets. The aim is to provide high-quality, well diversified, cost-effective, risk-controlled vehicles. The pension plans’ investments are overseen by Unilever’s internal investment company, the Univest Company.

ASSUMPTIONS

With the objective of presenting the assets and liabilities of the pensions and other post-employment benefit plans at their fair value on the balance sheet, assumptions under IAS 19 are set by reference to market conditions at the valuation date. The actuarial assumptions used to calculate the benefit liabilities vary according to the country in which the plan is situated. The following table shows the assumptions, weighted by liabilities, used to value principal defined benefit plans (representing approximately 96% of total pension liabilities)liabilities and other post-employment benefits.benefit liabilities).


   31 December 2017   31 December 2016 
          Defined benefit
pension plans
   

Other

      post-employment
benefit plans

         Defined benefit
pension plans
   

Other

post-employment
benefit plans


Discount rate

   2.5%    4.2%    2.6%    4.8% 

Inflation

   2.5%    n/a    2.5%    n/a 

Rate of increase in salaries

   2.8%    3.0%    2.9%    3.0% 

Rate of increase for pensions in payment (where provided)

   2.4%    n/a    2.4%    n/a 

Rate of increase for pensions in deferment (where provided)

   2.6%    n/a    2.7%    n/a 

Long-term medical cost inflation

   n/a    5.3%    n/a    5.3% 

98Financial StatementsAnnual Report on Form 20-F 2017


4B. PENSIONS AND SIMILAR OBLIGATIONSCONTINUED

   31 December 2018   31 December 2017 
    

      Defined    

benefit    
pension plans    


Other post-    

employment    
    benefit plans    


      Defined    

benefit    
pension plans    


Other post-    

employment    
benefit plans    


Discount rate

   2.7%    4.8%    2.5%    4.2% 

Inflation

   2.5%    n/a        2.5%    n/a     

Rate of increase in salaries

   2.8%    3.0%    2.8%    3.0% 

Rate of increase for pensions in payment (where provided)

   2.4%    n/a        2.4%    n/a     

Rate of increase for pensions in deferment (where provided)

   2.6%    n/a        2.6%    n/a     

Long-term medical cost inflation

   n/a        5.3%    n/a        5.3% 

The valuations of other post-employment benefit plans generally assume a higher initial level of medical cost inflation, which falls from 7% to the long-term rate within the next five years. Assumed healthcare cost trend rates have a significant effect on the amounts reported for healthcare plans.

Annual Report on Form 20-F 2018Financial Statements87


NOTES TO THE CONSOLIDATED FINANCIAL STATEMENTS

UNILEVER GROUPCONTINUED

4B. PENSIONS AND SIMILAR OBLIGATIONSCONTINUED

For the most importantUK and Netherlands pension plans, representing approximately 68% of all defined benefit planspension liabilities, the assumptions used at 31 December 20172018 and 20162017 were:


 United Kingdom Netherlands United Kingdom Netherlands 
         2017                 2016                 2017                 2016                     2018             2017             2018             2017 

Discount rate

 2.5% 2.7% 1.8% 1.8%  2.8 2.5  1.8 1.8

Inflation

 3.1% 3.2% 1.7% 1.7%  3.2 3.1  1.6 1.7

Rate of increase in salaries

 3.0% 3.1% 2.2% 2.2%  3.1%    3.0%     2.1%    2.2%   

Rate of increase for pensions in payment
(where provided)

 3.0% 3.1% 1.7% 1.7%  3.1 3.0  1.6 1.7

Rate of increase for pensions in deferment
(where provided)

 3.0% 3.1% 1.7% 1.7%  3.1 3.0  1.6 1.7

Number of years a current pensioner is
expected to live beyond age 65:


Men

 22.1 22.5 22.5 21.8  22.1  22.1   22.5  22.5 

Women

 24.0 24.6 24.3 24.0  24.0  24.0   24.0  24.3 

Number of years a future pensioner currently aged 45 is expected to live beyond age 65:


Men

 22.6 23.8 24.6 24.1  22.7  22.6   24.4  24.6 

Women

 25.6 26.5 26.6 26.3  25.6  25.6   26.1  26.6 

Demographic assumptions, such as mortality rates, are set with having regard to the latest trends in life expectancy (including expectations of future improvements), plan experience and other relevant data. These assumptions are reviewed and updated as necessary as part of the periodic actuarial valuation of the pension plans. The years of life expectancy for 20172018 above have been translated from the following tables:

UK: The year of use S2 series all pensioners (‘S2PA’) tables have been adopted, which are based on the experience of UK pension schemes over the period 2004-2011. Scaling factors are applied reflecting the experience of our pension funds appropriate to the member’s gender and status. Future improvements in longevity have been allowed for in line with the 2016 CMI core projections (Sk = 7.5) and a 1% pa long-term improvement rate.

Netherlands: The Dutch Actuarial Society’s AG Prognosetafel 20162018 table is used with correction factors (2017) to allow for the typically longer life expectancy for fund members relative to the general population. This table has anin-built allowance for future improvements in longevity.

The remaining defined benefit plans are considered immaterial. Their assumptions vary due to a number of factors including the currency and long termlong-term economic conditions of the countries where they are situated.

INCOME STATEMENT

The charge to the income statement comprises:


                    € million            million            million                 € million            million            million 
  Notes        2017 2016 2015   Notes   2018 2017 2016 

Charged to operating profit:


Defined benefit pension and other benefit plans:


Current service cost

       (245 (226 (271     (220 (245 (226

Employee contributions

       18  17  17      17  18  17 

Special termination benefits

       (4 (6 (9     (16 (4 (6

Past service cost including (losses)/gains on curtailments

       23  32  129      (41 23  32 

Settlements

       4  (2 6        4  (2

Defined contribution plans

       (195 (187 (197     (179 (195 (187

Total operating cost

   4A      (399 (372 (325   4A    (439 (399 (372

Finance income/(cost)

   5      (96 (94 (121   5    (25 (96 (94

Net impact on the income statement (before tax)

         (495 (466 (446      (464 (495 (466

STATEMENT OF COMPREHENSIVE INCOME

Amounts recognised in the statement of comprehensive income on the remeasurement of the net defined benefit liability.


            € million            million            million             € million            million            million 
  2017 2016 2015   2018 2017 2016 

Return on plan assets excluding amounts included in net finance income/(cost)

   1,475  1,877  (254   (1,108 1,475  1,877 

Actuarial gains/(losses) arising from changes in demographic assumptions

   222  (217 (22   42  222  (217

Actuarial gains/(losses) arising from changes in financial assumptions

   (210 (2,963 1,167    611  (210 (2,963

Experience gains/(losses) arising on pension plan and other benefit plan liabilities

   133  82  233    18  133  82 

Total of defined benefit costs recognised in other comprehensive income

   1,620  (1,221 1,124    (437 1,620  (1,221


Annual Report on Form 20-F 201788 Financial Statements  99Annual Report on Form 20-F 2018


NOTES TO THE CONSOLIDATED FINANCIAL STATEMENTS

UNILEVER GROUPCONTINUED


4B. PENSIONS AND SIMILAR OBLIGATIONSCONTINUED


BALANCE SHEET

The assets, liabilities and surplus/(deficit) position of the pension and other post-employment benefit plans at the balance sheet date were:


€ million

2017


 million

2016

   € million 2018  million 2017 
            Pension
plans
 Other post-
employment
  benefit plans
           Pension
plans
 Other post-
employment
benefit plans
           Pension
plans
 Other post-
employment
      benefit plans
               Pension
plans
 Other post-
employment
    benefit plans
 

Fair value of assets

   22,361   21  21,162  21    20,867   13  22,361  21 

Present value of liabilities

   (22,420  (523 (23,751 (605   (21,288  (466 (22,420 (523

Net liabilities

   (59  (502 (2,589 (584

Pension liability net of assets

   (59  (502 (2,589 (584   (421  (453 (59 (502

Of which in respect of:


Funded plans in surplus:


Liabilities

   (17,132  -  (5,833  -    (16,182    (17,132   

Assets

   19,302   3  6,524  3    17,909   1  19,302  3 

Aggregate surplus

   2,170   3  691  3 

Pension asset net of liabilities

   2,170   3  691  3    1,727   1  2,170  3 

Funded plans in deficit:


Liabilities

   (4,267  (35 (16,783 (36   (4,149  (30 (4,267 (35

Assets

   3,059   18  14,638  18    2,958   12  3,059  18 

Pension liability net of assets

   (1,208  (17 (2,145 (18   (1,191  (18 (1,208 (17

Unfunded plans:


Pension liability

   (1,021  (488 (1,135 (569   (957  (436 (1,021 (488

A surplus is deemed recoverable to the extent that the Group can benefit economically from the surplus. Unilever assesses the maximum economic benefit available through a combination of refunds and reductions in future contributions in accordance with local legislation and individual financing arrangements with each of our funded defined benefit plans.

RECONCILIATION OF CHANGE IN ASSETS AND LIABILITIES

Movements in assets during the year:

        UK      Netherlands  

    Rest of

world


    € million

2017

Total

      UK      Netherlands  

    Rest of

world


     million

2016

Total


1 January

   9,963   5,116   6,104   21,183   9,950   4,873   5,919   20,742 

Employee contributions

   -   1   17   18   -   -   17   17 

Settlements

   -   -   (8  (8  -   -   -   - 

Actual return on plan assets (excluding amounts in net finance income/charge)

   863   275   337   1,475   1,412   281   184   1,877 

Interest income

   270   91   179   540   329   120   215   664 

Employer contributions

   778   43   284   1,105   202   11   299   512 

Benefit payments

   (457  (169  (613  (1,239  (456  (169  (701  (1,326

Reclassification of benefits(a)

   -   -   (1  (1  -   -   (2  (2

Currency retranslation

   (379  -   (312  (691  (1,474  -   173   (1,301

31 December

   11,038   5,357   5,987   22,382   9,963   5,116   6,104   21,183 

(a)Certain liabilities have been reclassified as employee benefit liabilities.

100Financial StatementsAnnual Report on Form 20-F 2017


4B. PENSIONS AND SIMILAR OBLIGATIONSCONTINUED

Movements in liabilities during the year:

        UK      Netherlands      Rest of
world
  

    € million
2017

Total

      UK      Netherlands      Rest of
world
  

     million
2016

Total


1 January

   (10,981  (4,877  (8,498  (24,356  (10,602  (4,443  (8,017  (23,062

Current service cost

   (114  (6  (125  (245  (89  (3  (134  (226

Employee contributions

   -   -   -   -   -   -   -   - 

Special termination benefits

   -   -   (4  (4  -   -   (6  (6

Past service costs including losses/(gains) on curtailments

   5   12   6   23   5   4   23   32 

Settlements

   -   -   12   12   -   -   (2  (2

Interest cost

   (286  (86  (264  (636  (347  (109  (302  (758

Actuarial gain/(loss) arising from changes in demographic assumptions

   312   (96  6   222   23   (19  (221  (217

Actuarial gain/(loss) arising from changes in financial assumptions

   (189  -   (21  (210  (1,919  (524  (520  (2,963

Actuarial gain/(loss) arising from experience adjustments

   144   (37  26   133   29   46   7   82 

Benefit payments

   457   169   613   1,239   456   169   701   1,326 

Reclassification of benefits(a)

   -   8   -   8   -   2   -   2 

Currency retranslation

   397   -   474   871   1,463   -   (27  1,436 

31 December

   (10,255  (4,913  (7,775  (22,943  (10,981  (4,877  (8,498  (24,356

(a)Certain liabilities have been reclassified as employee benefit liabilities.

Movements in (deficit)/surplus during the year:

        UK      Netherlands      Rest of
world
  

    € million

2017

Total

      UK      Netherlands      Rest of
world
  

     million
2016

Total


1 January

   (1,018  239   (2,394  (3,173  (652  430   (2,098  (2,320

Current service cost

   (114  (6  (125  (245  (89  (3  (134  (226

Employee contributions

   -   1   17   18   -   -   17   17 

Special termination benefits

   -   -   (4  (4  -   -   (6  (6

Past service costs including losses/(gains) on curtailments

   5   12   6   23   5   4   23   32 

Settlements

   -   -   4   4   -   -   (2  (2

Actual return on plan assets (excluding amounts in net finance income/charge)

   863   275   337   1,475   1,412   281   184   1,877 

Interest cost

   (286  (86  (264  (636  (347  (109  (302  (758

Interest income

   270   91   179   540   329   120   215   664 

Actuarial gain/(loss) arising from changes in demographic assumptions

   312   (96  6   222   23   (19  (221  (217

Actuarial gain/(loss) arising from changes in financial assumptions

   (189  -   (21  (210  (1,919  (524  (520  (2,963

Actuarial gain/(loss) arising from experience adjustments

   144   (37  26   133   29   46   7   82 

Employer contributions

   778   43   284   1,105   202   11   299   512 

Benefit payments

   -   -   -   -   -   -   -   - 

Reclassification of benefits(a)

   -   8   (1  7   -   2   (2  - 

Currency retranslation

   18   -   162   180   (11  -   146   135 

31 December

   783   444   (1,788  (561  (1,018  239   (2,394  (3,173

(a)Certain liabilities have been reclassified as employee benefit liabilities.

The actual return on plan assets during 2017 was2,015 million, being1,475 milliongroup of asset returns and540 millionplans within “Rest of interest income shownworld” category in the tables above (2016:2,541 million).

The duration of the defined benefit plan liabilities (representing 96% of total pension liabilities) and the split of liabilities betweenbelow are not materially different categories of plan participants are:with respect to their risks that would require disaggregated disclosure.


               UK       Netherlands       Rest of
world(a)
              2017
Total
              UK       Netherlands       Rest  of
world(a)
            2016
Total
 

Duration (years)

   17    19    13    8 to 24    18    20    14    8 to 20 

Active members

   14%    22%    16%    18%    15%    25%    19%    20% 

Deferred members

   32%    30%    15%    26%    33%    30%    14%    26% 

Retired members

   54%    48%    69%    56%    52%    45%    67%    54% 

(a)Rest of world numbers shown are weighted averages by liabilities.
       UK   Netherlands      Rest of
world
  

    € million
2018

Total

      UK   Netherlands      Rest of
world
       million
2017
Total
 

1 January

  11,038   5,357   5,987   22,382   9,963   5,116   6,104   21,183 

Employee contributions

        17   17      1   17   18 

Settlements

        (1  (1        (8  (8

Actual return on plan assets (excluding amounts in net finance income/charge)

  (459  (303  (346  (1,108  863   275   337   1,475 

Interest income

  274   95   182   551   270   91   179   540 

Employer contributions

  95   14   274   383   778   43   284   1,105 

Benefit payments

  (472  (166  (561  (1,199  (457  (169  (613  (1,239

Currency retranslation

  (147     12   (135  (379     (312  (691

Others

     (1  (9  (10        (1  (1

31 December

      10,329   4,996   5,555   20,880   11,038   5,357   5,987   22,382 


Annual Report on Form 20-F 20172018 Financial Statements 10189


NOTES TO THE CONSOLIDATED FINANCIAL STATEMENTS

UNILEVER GROUPCONTINUED


4B. PENSIONS AND SIMILAR OBLIGATIONSCONTINUED


PLAN ASSETSMovements in liabilities during the year:

       UK      Netherlands      Rest of
world
  

    € million

2018

Total

      UK      Netherlands      Rest of
world
  

     million

2017

Total


1 January

  (10,255  (4,913  (7,775  (22,943  (10,981  (4,877  (8,498  (24,356

Current service cost

  (109  (4  (107  (220  (114  (6  (125  (245

Employee contributions


Special termination benefits

        (16  (16        (4  (4

Past service costs including (losses)/gains on curtailments

  (46  8   (3  (41  5   12   6   23 

Settlements

        1   1         12   12 

Interest cost

  (254  (87  (235  (576  (286  (86  (264  (636

Actuarial gain/(loss) arising from changes in demographic assumptions

     53   (11  42   312   (96  6   222 

Actuarial gain/(loss) arising from changes in financial assumptions

  351   84   176   611   (189     (21  (210

Actuarial gain/(loss) arising from experience adjustments

  (45  37   26   18   144   (37  26   133 

Benefit payments

  472   166   561   1,199   457   169   613   1,239 

Currency retranslation

  147      14   161   397      474   871 

Others

     (8  18   10      8      8 

31 December

  (9,739  (4,664  (7,351  (21,754  (10,255  (4,913  (7,775  (22,943

Movements in (deficit)/surplus during the year:


       UK      Netherlands      Rest of
world
  

    € million

2018

Total

      UK      Netherlands      Rest of
world
  

     million

2017

Total


1 January

  783   444   (1,788  (561  (1,018  239   (2,394  (3,173

Current service cost

  (109  (4  (107  (220  (114  (6  (125  (245

Employee contributions

        17   17      1   17   18 

Special termination benefits

        (16  (16        (4  (4

Past service costs including (losses)/gains on curtailments

  (46  8   (3  (41  5   12   6   23 

Settlements

                    4   4 

Actual return on plan assets (excluding amounts in net finance income/charge)

  (459  (303  (346  (1,108  863   275   337   1,475 

Interest cost

  (254  (87  (235  (576  (286  (86  (264  (636

Interest income

  274   95   182   551   270   91   179   540 

Actuarial gain/(loss) arising from changes in demographic assumptions

     53   (11  42   312   (96  6   222 

Actuarial gain/(loss) arising from changes in financial assumptions

  351   84   176   611   (189     (21  (210

Actuarial gain/(loss) arising from experience adjustments

  (45  37   26   18   144   (37  26   133 

Employer contributions

  95   14   274   383   778   43   284   1,105 

Benefit payments


Currency retranslation

        26   26   18      162   180 

Others

     (9  9         8   (1  7 

31 December

  590   332   (1,796  (874  783   444   (1,788  (561

The actual return on plan assets during 2018 was(557) million, being(1,108) million of asset returns and551 million of interest income shown in the tables above (2017:2,015 million).

90Financial StatementsAnnual Report on Form 20-F 2018


4B. PENSIONS AND SIMILAR OBLIGATIONSCONTINUED

The fair valueduration of the principal defined benefit plan liabilities (representing 96% of total pension liabilities and other post-employment benefit liabilities) and the split of liabilities between different categories of plan assets, which are reported net of fund liabilities that are not employee benefits, at the end of the reporting period for each category are as follows:participants are:


              UK  Netherlands   
    Rest of
world
 
(a) 


           2018

Total


              UK   Netherlands   
    Rest of
world


     2017
Total


Duration (years)

   17  18  12  7 to 23   17   19   13   8 to 24 

Active members

   12 15 21 15  14  22  16  18

Deferred members

   33 38 16 29  32  30  15  26

Retired members

   55 47 63 56  54  48  69  56

(a) Rest of world numbers shown are weighted averages by liabilities.

PLAN ASSETS

The fair value of plan assets, which are reported net of fund liabilities that are not employee benefits, at the end of the reporting period for each category are as follows:

The group of plans within “Rest of world” category in the tables below are not materially different with respect to their risks that would require disaggregated disclosure.


€ million

31 December 2017


million

31 December 2016


€ million

31 December 2018


million

31 December 2017

 
  UK Netherlands   Rest of
world
 Pension
plans
Total
 UK Netherlands   Rest of
world
 Pension
plans
Total
   UK Netherlands Rest of
world
 

2018

Total

 UK Netherlands Rest of
world
 2017
Total
 

Total plan assets

   11,038   5,357    5,966   22,361  9,963  5,116    6,083  21,162    10,329  4,996  5,542  20,867   11,038   5,357   5,966   22,361 

Assets


Equities total

   4,538   1,876    1,909   8,323  4,418  1,831    1,884  8,133    3,182  1,594  1,505  6,281   4,538   1,876   1,909   8,323 

– Europe

   1,093   703    594   2,390  1,065  623    509  2,197 

– North America

   2,320   668    842   3,830  2,266  698    865  3,829 

– Other

   1,125   505    473   2,103  1,087  510    510  2,107 

Europe

   731  480  451  1,662   1,093   703   594   2,390 

North America

   1,723  714  682  3,119   2,320   668   842   3,830 

Other

   728  400  372  1,500   1,125   505   473   2,103 

Fixed income total

   4,210   2,500    2,954   9,664  4,727  2,665    2,890  10,282    4,963  2,595  2,947  10,505   4,210   2,500   2,954   9,664 

– Government bonds

   2,162   879    1,376   4,417  2,774  1,114    1,438  5,326 

– Investment grade corporate bonds

   1,368   485    1,207   3,060  1,361  438    1,128  2,927 

– Other fixed income

   680   1,136    371   2,187  592  1,113    324  2,029 

Government bonds

   2,474  769  1,253  4,496   2,162   879   1,376   4,417 

Investment grade corporate bonds

   984  502  1,167  2,653   1,368   485   1,207   3,060 

Other fixed income

   1,505  1,324  527  3,356   680   1,136   371   2,187 

Private equity

   401   89    3   493  504  124    6  634    363  82  2  447   401   89   3   493 

Property and real estate

   810   411    246   1,467  830  410    221  1,461    852  451  276  1,579   810   411   246   1,467 

Hedge funds

   673     297   970  687  3    481  1,171    663     120  783   673      297   970 

Other

   463   427    274   1,164  246  63    282  591    435  293  389  1,117   463   427   274   1,164 

Other plans

      312   312   -   -    336  336         312  312         312   312 

Fund liabilities that are not employee benefits


Derivatives

   (57  54    (29  (32 (1,449 20    (17 (1,446   (129 (19 (9 (157  (57  54   (29  (32

The fair values of the above equity and fixed income instruments are determined based on quoted market prices in active markets. The fair value of private equity, properties, derivatives and hedge funds are not based on quoted market prices in active markets. The Group uses swapsderivatives and other instruments to hedge some of its exposure to inflation and interest rate risk – the degree of this hedging of liabilities was 45%55% for interest rate and 55% for inflation for the UK plan (2016: 35%) and 30%32% for interest rate and 29% for inflation for the Netherlands plan (2016: 35%).plan. Foreign currency exposures in part are also hedged by the use of forward foreign exchange contracts. Assets included in the Other category are commodities, cash and insurance contracts which are also unquoted assets.

Equity securities include Unilever securities amounting to1412 million (0.1% of total plan assets) and1214 million (0.1% of total plan assets) at

31 December 20172018 and 20162017 respectively. Property includes property occupied by Unilever amounting to3228 million at 31 December 2017 (2016:2018 (2017:3432 million).

The pension assets above exclude the assets in a Special Benefits Trust amounting to6359 million (2016:(2017:7963 million) to fund pension and similar liabilities in the United States (see also note 17A on pages 127 to 128)page 117). In 2016, pensions assets also excluded68 million in an escrow account that would otherwise have been payable to the UK pension fund. In 2017, as a result of the triennial valuation of the UK fund, the monies held in escrow have been(68 million at the end of 2016) were returned to the Group (see also note 11 page 112 and 113).Group.

SENSITIVITIES

The sensitivity of the overall pension liabilities to changes in the weighted key assumptions are:


     Change in liabilities       Change in liabilities 
         Change in assumption                                      UK               Netherlands               Total                  Change in assumption               UK       Netherlands                   Total   

Discount rate

          Increase by 0.5%           -8%    -9%    -7%            Increase by 0.5%    -8%    -9%    -7%   

Inflation rate

          Increase by 0.5%           +7%    +9%    +6%            Increase by 0.5%    7%    9%    6%   

Life expectancy

          Increase by 1 year           +4%    +4%    +4%            Increase by 1 year    4%    4%    4%   

Long-term medical cost inflation(b)

          Increase by 1.0%           0%    0%    +1%            Increase by 1.0%    0%    0%    2%   

(b)

Long-term medical cost inflation only relates to post-retirement medical plans.

An equivalent decrease in each assumption would have an equal and opposite impact on liabilities.


(b)Long-term medical cost inflation only relates to post retirement medical plans.
Annual Report on Form 20-F 2018Financial Statements91


NOTES TO THE CONSOLIDATED FINANCIAL STATEMENTS

UNILEVER GROUPCONTINUED

4B. PENSIONS AND SIMILAR OBLIGATIONSCONTINUED

The sensitivity analyses above have been determined based on reasonably possible changes of the respective assumptions occurring at the end of the reporting period and may not be representative of the actual change. It is based on a change in the key assumption while holding all other assumptions constant. When calculating the sensitivity to the assumption, the same method used to calculate the liability recognised in the balance sheet has been applied. The methods and types of assumptions used in preparing the sensitivity analysis did not change compared with the previous period.

102Financial StatementsAnnual Report on Form 20-F 2017


4B. PENSIONS AND SIMILAR OBLIGATIONSCONTINUED

CASH FLOW

Group cash flow in respect of pensions and similar post-employment benefits comprises company contributions paid to funded plans and benefits paid by the company in respect of unfunded plans. The table below sets out these amounts:


           million

2018

             € million
2017
              million
2016
              million
2015
  

               million

2019

                 € million
2018
                  million
2017
                  million
2016
 
 Estimate                 Estimate                

Company contributions to funded plans:


Defined benefit

  245    954    355    356   230    238    954    355 

Defined contributions

  205    195    187    197   185    179    195    187 

Benefits paid by the company in respect of unfunded plans:


Defined benefit

  150    151    157    157   150    144    151    157 

Group cash flow in respect of pensions and similar benefits

  600    1,300    699    710   565    561    1,300    699 

Following the conclusion of the 2016 triennial valuation of the UK pension fund the Group in agreement with the trustees, decided to contribute £600 million into the fund in 2017. Deficit contributions to the UK pension fund are expected to be nil for the next few years.years

The Group’s funding policy is to periodically review the contributions made to the plans while taking account of local legislations.

4C. SHARE-BASED COMPENSATION PLANS


The fair value of awards at grant date is calculated using appropriate pricing models. This value is expensed over their vesting period, with a corresponding credit to equity. The expense is reviewed and adjusted to reflect changes to the level of awards expected to vest, except where this arises from a failure to meet a market condition. Any cancellations are recognised immediately in the income statement.

As at 31 December 2017,2018, the Group had share-based compensation plans in the form of performance shares, share options and other share awards.

The numbers in this note include those for Executive Directors and other key management shown in note 4A on page 97,86.Non-Executive Directors do not participate in any of the share-based compensation plans.

The charge in each of the last three years is shown below, and relates to equity-settled plans:


                € million                million                  million                 € million                million                million 
Income statement charge  2017 2016 2015   2018 2017 2016 

Performance share plans

   (273 (185 (143   (183 (273 (185

Other plans

   (11 (13 (7   (13 (11 (13
   (284 (198 (150   (196 (284 (198

PERFORMANCE SHARE PLANS

Performance share awards are made in respect of the Global Share Incentive Plan (GSIP) and the ManagementCo-Investment Plan (MCIP). The awards of each plan will vest between 0 and 200% of grant level, subject to the level of satisfaction of performance measures (limits for Executive Directors may vary, and are detailed in the Directors’ Remuneration Report on pages 4750 to 76)65).

Under the GSIP, Unilever’s managers receive annual awards of NV and PLC shares. The performance measures for GSIP are underlying sales growth, underlying operating margin, and cumulative operating cash flow for the Group, although GSIP awards to certain managers below Unilever Leadership Executive level may be subject to similar performance measures specific to their business unit. There is an additional target based on relative total shareholder return for senior executives. GSIP awards will vest after three years.

From 2017, theThe MCIP allows Unilever’s managers to invest a proportion of their annual bonus (a maximum of 60%67% for Executive Directors, 100% for other managers) in shares in Unilever, and to receive a corresponding award of performance-related shares. The performance measures for MCIP are underlying sales growth, underlying EPS growth, and sustainability progress index for the Group. There is an additional target of return on invested capital for senior executives. MCIP awards will vest after four years.

A summary of the status of the Performance Share Plans as at 31 December 2018, 2017 2016 and 20152016 and changes during the years ended on these dates is presented below:


2018

Number

of shares


2017

Number

of shares


2016

Number

of shares


2017

Number of

shares


2016

Number of
shares


2015

Number of
shares


Outstanding at 1 January

             14,818,060      15,979,140      17,468,291            13,684,747      14,818,060      15,979,140 

Awarded

   4,962,345  7,016,274  8,890,394    6,870,882  4,962,345  7,016,274 

Vested

   (4,723,861 (6,983,053 (8,448,454   (5,854,388 (4,723,861 (6,983,053

Forfeited

   (1,371,797 (1,194,301 (1,931,091   (1,066,723 (1,371,797 (1,194,301

Outstanding at 31 December

   13,684,747  14,818,060  15,979,140    13,634,518  13,684,747  14,818,060 


Annual Report on Form 20-F 201792 Financial Statements  103Annual Report on Form 20-F 2018


NOTES TO THE CONSOLIDATED FINANCIAL STATEMENTS

UNILEVER GROUPCONTINUED


4C. SHARE-BASED COMPENSATION PLANSCONTINUED


Share award value information                          2017                           2016                           2015                   2018                   2017                   2016 

Fair value per share award during the year

   €42.59    35.43    33.17    €42.44    42.59    35.43 

ADDITIONAL INFORMATION

At 31 December 2017,2018, shares and options in NV or PLC totalling 14,760,786 (2016: 16,085,024)14,595,111 (2017: 14,760,786) were heldoutstanding in respect of share-based compensation plans of NV, PLC and its subsidiaries, including North American plans.

To satisfy the options and awards granted, certain NV group companies hold 15,802,464 (2016: 16,936,797)15,010,429 (2017: 15,802,464) ordinary shares of NV or PLC. Shares acquired during 20172018 represent 0.15%0.21% of the Group’s called up share capital. The balance of shares held in connection with share plans at

31 December 20172018 represented 0.5% (2016: 0.6%(2017: 0.5%) of the Group’s called up share capital.

The book value of695704 million (2016:(2017:727695 million) of all shares held in respect of share-based compensation plans for both NV and PLC is eliminated on consolidation by deduction from other reserves. Their market value at 31 December 20172018 was739700 million (2016:(2017:658739 million).

At 31 December 2017,2018, the exercise price of nilNil PLC options (2016: nil)(2017: Nil) were above the market price of the shares.

Shares held to satisfy options and awards are accounted for in accordance with IAS 32 ‘Financial Instruments: Presentation’. All differences between the purchase price of the shares held to satisfy options and awards granted and the proceeds received for the shares, whether on exercise or lapse, are charged to reserves. The basis of the charge to operating profit for the economic value of options granted is discussed on page 103.92.

Between 31 December 20172018 and 21 February 20182019 (the latest practicable date for inclusion in this report), 1,268,802Nil shares were granted, 5,293,7095,534,564 shares were vested and 29,55192,699 shares were forfeited related to the Performance Share Plans.


5. NET FINANCE COSTS


Net finance costs are comprised of finance costs and finance income, including net finance costs in relation to pensions and similar obligations.

Finance income includes income on cash and cash equivalents and income on other financial assets. Finance costs include interest costs in relation to financial liabilities.

Borrowing costs are recognised based on the effective interest method.


Net finance costs  Notes                    2017             2016             2015   Notes   

€ million

            2018


million

            2017


million

            2016


Finance costs

       (556 (584 (516     (591  (556  (584

Bank loans and overdrafts

       (46 (67 (56     (44  (46  (67

Interest on bonds and other loans(a)

       (519 (501 (492     (560  (519  (501

Dividends paid on preference shares

       (4 (4 (4

Net gain/(loss) on transactions for which hedge accounting is not applied(b)

       13  (12 36 

Dividends paid on preference shares(b)

        (4  (4

Net gain/(loss) on transactions for which hedge accounting is not applied(c)

     13   13   (12
  

On foreign exchange derivatives

       384  (215 (218     144   384   (215
  

Exchange difference on underlying items

       (371 203  254      (131  (371  203 

Finance income

       157  115  144      135   157   115 

Pensions and similar obligations

   4B      (96 (94 (121   4B    (25  (96  (94

Net finance costs beforenon-underlying items(c)

       (495 (563 (493

Premium paid on buy back of preference shares

   25      (382  -   - 

Net finance costs beforenon-underlying items(d)

     (481  (495  (563
         (877 (563 (493

Premium paid on buyback of preference shares

        (382   
      (481  (877  (563


(a) 

Interest on bonds and other loansloans’ includes the impact of interest rate derivatives that are part of a fair value hedge accounting relationshiprelationships and the related recycling of results from the cash flow hedge accounting reserve relating to derivatives that were part of a cash flow hedge accounting relation.reserve. Includes an amount of(15) million (2017:(26) million (2016: nil)million) relating to unwinding of discount on deferred consideration for acquisitions and38 million (2017:65 million (2016: nil)million) release of provision for interest on indirect tax cases in Brazil for which a federal tax amnesty has been applied.Brazil.

(b) 

Preference shares were repurchased in 2017.

(c)

For further details of derivatives for which hedge accounting is not applied, please refer to note 16C.

(c)(d) 

See note 3 for explanation ofnon-underlying items.


104Annual Report on Form 20-F 2018 Financial Statements Annual Report on Form 20-F 201793


NOTES TO THE CONSOLIDATED FINANCIAL STATEMENTS

UNILEVER GROUPCONTINUED


6. TAXATION

6A. INCOME TAX


Income tax on the profit for the year comprises current and deferred tax. Income tax is recognised in the income statement except to the extent that it relates to items recognised directly in equity.

Current tax is the expected tax payable on the taxable income for the year, using tax rates enacted or substantively enacted at the balance sheet date, and any adjustments to tax payable in respect of previous years.

Current tax in the consolidated income statement will differ from the income tax paid in the consolidated cash flow statement primarily because of deferred tax arising on temporary differences and payment dates for income tax occurring after the balance sheet date.

Unilever is subject to taxation in the many countries in which it operates. The tax legislation of these countries differs, is often complex and is subject to interpretation by management and the government authorities. These matters of judgement give rise to the need to create provisions for tax payments that may arise in future years.years with respect to transactions already undertaken. Provisions are made against individual exposures and take into account the specific circumstances of each case, including the strength of technical arguments, recent case law decisions or rulings on similar issues and relevant external advice. The provision is estimated based on the individual most likely outcome approach.


  € million  million  million   € million  million  million 
Tax charge in income statement                   2017                  2016                  2015                    2018                  2017                  2016 

Current tax


Current year

   (2,398 (2,026 (1,992   (2,647 (2,398 (2,026

Over/(under) provided in prior years

   (21 158  (57   (10 (21 158 
   (2,419 (1,868 (2,049
   (2,657 (2,419 (1,868

Deferred tax


Origination and reversal of temporary differences

   51  (65 82    3  51  (65

Changes in tax rates

   609  (7 (13   (13 609  (7

Recognition of previously unrecognised losses brought forward

   92  18  19    92  92  18 
   752  (54 88 
   (1,667 (1,922 (1,961   82  752  (54
   (2,575 (1,667 (1,922

The reconciliation between the computed weighted average rate of income tax expense, which is generally applicable to Unilever companies, and the actual rate of taxation charged is as follows:


Reconciliation of effective tax rate  %
                 2017
 %
                 2016
 %
                 2015
   

%

                 2018


%

                 2017


%

                 2016


Computed rate of tax(a)

   26  26  24    25  26  26 

Differences between computed rate of tax and effective tax rate due to:


Incentive tax credits

   (4 (4 (5   (3 (4 (4

Withholding tax on dividends

   2  3  2    2  2  3 

Expenses not deductible for tax purposes

   1  1  1    1  1  1 

Irrecoverable withholding tax

   1  1  2    1  1  1 

Income tax reserve adjustments – current and prior year

   -  (1 2    1     (1

Transfer to/(from) unrecognised deferred tax assets

   1   -  1      1    

Others

   (1  -   -    (1 (1   

Underlying effective tax rate

   26  26  27    26  26  26 

Non-underlying items within operating profit(b)

   1   -  1    (1 1    

Premium paid on buy back of preference shares(b)

   1   -   - 

Premium paid on Buyback of preference shares(b)

     1    

Impact of US tax reform(b)

   (7  -   -      (7   

Impact of Spreads disposal(b)

   (4      

Effective tax rate

   21  26  28    21  21  26 


(a) 

The computed tax rate used is the average of the standard rate of tax applicable in the countries in which Unilever operates, weighted by the amount of underlying profit before taxation generated in each of those countries. For this reason, the rate may vary from year to year according to the mix of profit and related tax rates.

(b) 

See note 3 for explanation ofnon-underlying itemsitems.

Our tax rate is reduced by incentive tax credits, the benefit from preferential tax regimes that have been legislated by the countries and provinces concerned in order to promote economic development and investment. The tax rate is increased by business expenses which are not deductible for tax, such as entertainment costs and some interest expense and by irrecoverable withholding taxes on dividends paid by subsidiary companies and on other cross-border payments such as royalties and service fees, which cannot be offset against other taxes due. In 20172018 the effective tax rate has been increasedwas reduced by disposals in relatively high taxed locations and the significant impact ofnon-deductible costs relating to thebuy-back spreads disposals where a significant part of preference shares.

Impact of US Tax Reform – On 22 December 2017 HR1, formerly known as the Tax Cuts and Jobs Act, was signed into lawdisposals benefited from the participation exemption in the United States. As a result of this, we have recognized a tax benefit of578 million, primarily due to are-measurement of US deferred tax assets and liabilities at the new lower 21% federal tax rate. This benefit is excluded from underlying earnings per share. The US tax rate reduction will have a positive impact on our future tax rate but the Act includes other provisions related to cross border payments which could offset this benefit. We are still assessing the overall impact on our future effective tax rate but at this stage we do not expect it to be significant.Netherlands.

The Group’s future tax charge and effective tax rate could be affected by several factors, including changes in tax laws and their interpretation and still to be determined tax reform proposals in the EU, Switzerland and Switzerland,the continuing OECD international tax reform work, as well as the impact of acquisitions, disposals and any restructuring of our businesses.


Annual Report on Form 20-F 201794 Financial Statements  105Annual Report on Form 20-F 2018


NOTES TO THE CONSOLIDATED FINANCIAL STATEMENTS

UNILEVER GROUPCONTINUED


6B. DEFERRED TAX


Deferred tax is recognised using the liability method on taxable temporary differences between the tax base and the accounting base of items included in the balance sheet of the Group. Certain temporary differences are not provided for as follows:


goodwill not deductible for tax purposes;


the initial recognition of assets or liabilities that affect neither accounting nor taxable profit; and


differences relating to investments in subsidiaries to the extent that it is probable that they will not reverse in the foreseeable future.


The amount of deferred tax provided is based on the expected manner of realisation or settlement of the carrying amount of assets and liabilities, using tax rates enacted, or substantively enacted, at the year end.

A deferred tax asset is recognised only to the extent that it is probable that future taxable profits will be available against which the asset can be utilised. Deferred tax assets are reduced to the extent that it is no longer probable that the related tax benefit will be realised.


  € million € million € million € million  million  million  million  million   € million € million € million € million  million  million  million  million 
Movements in 2017 and 2016  As at
1 January
2017
 Income
statement
 Other As at
31 December
2017
 As at
1 January
2016
 Income
statement
 Other As at
31 December
2016
 
Movements in 2018 and 2017  As at
1 January
2018
 Income
statement
 Other As at
31 December
2018
 As at
1 January
2017
 Income
statement
 Other As at
31 December
2017
 

Pensions and similar obligations

   766   (16  (434  316  557  7  202  766    316  (26 114  404   766   (16  (434  316 

Provisions and accruals

   922   (154  (115  653  708  68  146  922    653  193  (25 821   922   (154  (115  653 

Goodwill and intangible assets

   (1,928  654   (378  (1,652 (1,301 (104 (523 (1,928   (1,652 (154 (105 (1,911  (1,928  654   (378  (1,652

Accelerated tax depreciation

   (870  109   82   (679 (752 (85 (33 (870   (679 5  (5 (679  (870  109   82   (679

Tax losses

   131   (36  35   130  123  (6 14  131    130  11  (11 130   131   (36  35   130 

Fair value gains

   (7  104   3   100  (25 14  4  (7   100  58  (3 155   (7  104   3   100 

Fair value losses

   29   65   (70  24  16  8  5  29    24  (2    22   29   65   (70  24 

Share-based payments

   169   (5  30   194  190  (14 (7 169    194  (14 (5 175   169   (5  30   194 

Other

   81   31   (26  86  (75 58  98  81    86  11  (20 77   81   31   (26  86 
   (707  752   (873  (828 (559 (54 (94 (707
   (828 82  (60 (806  (707  752   (873  (828

At the balance sheet date, the Group had unused tax losses of4,6765,346 million (2016:(2017:4,1384,676 million) and tax credits amounting to612570 million (2016:(2017:644612 million) available for offset against future taxable profits. Deferred tax assets have not been recognised in respect of unused tax losses of4,1794,914 million (2016:(2017:3,6224,179 million) and tax credits of612570 million (2016:(2017:629612 million), as it is not probable that there will be future taxable profits within the entities against which the losses can be utilised. The majorityMany of these tax losses and credits arise in tax jurisdictions where they do not expire with the exception of2,9344,752 million (2016:(2017:2,3632,934 million) comprising mainly corporate income tax losses in the Netherlands which expire between now and 2026 and state and federal tax losses in the US which expire between now and 2037.2027.

Other deductible temporary differences of5148 million (2016:(2017:5251 million) have not been recognised as a deferred tax asset. There is no expiry date for these differences.

At the balance sheet date, the aggregate amount of temporary differences associated with undistributed earnings of subsidiaries for which deferred tax liabilities have not been recognised was1,7192,681 million (2016:(2017:1,5571,719 million). No liability has been recognised in respect of these differences because the Group is in a position to control the timing of the reversal of the temporary differences, and it is probable that such differences will not reverse in the foreseeable future.

Deferred tax assets and liabilities are offset when there is a legally enforceable right to set off current tax assets against current tax liabilities and when the deferred income taxes relate to the same fiscal authority. The following amounts, determined after appropriate offsetting, are shown in the consolidated balance sheet:


      € million          million € million  million         € million          million       € million       million € million  million   € million    million 
Deferred tax assets and liabilities  Assets
2017
 

Assets

2016

      Liabilities
2017
      Liabilities
2016
 

Total

2017


Total

2016

   Assets
2018
 Assets
2017
    Liabilities
2018
    Liabilities
2017
 

Total

2018


Total

2017


Pensions and similar obligations

   294  568   22  198   316  766    334   294  70   22  404   316 

Provisions and accruals

   465  579   188  343   653  922    578   465  243   188  821   653 

Goodwill and intangible assets

   86  2   (1,738 (1,930  (1,652 (1,928   41   86  (1,952  (1,738 (1,911  (1,652

Accelerated tax depreciation

   (21 (60  (658 (810  (679 (870   (64  (21 (615  (658 (679  (679

Tax losses

   125  128   5  3   130  131    126   125  4   5  130   130 

Fair value gains

   23  28   77  (35  100  (7   12   23  143   77  155   100 

Fair value losses

   3  9   21  20   24  29    2   3  20   21  22   24 

Share-based payments

   74  44   120  125   194  169    59   74  116   120  175   194 

Other

   36  56   50  25   86  81    29   36  48   50  77   86 
   1,085  1,354   (1,913 (2,061  (828 (707
   1,117   1,085  (1,923  (1,913 (806  (828

Of which deferred tax to be recovered/(settled) after more than 12 months

   730  1,157   (1,868 (2,206  (1,138 (1,049   840   730  (2,046  (1,868 (1,206  (1,138


106Annual Report on Form 20-F 2018 Financial Statements Annual Report on Form 20-F 201795


NOTES TO THE CONSOLIDATED FINANCIAL STATEMENTS

UNILEVER GROUPCONTINUED


6C. TAX ON OTHER COMPREHENSIVE INCOME


Income tax is recognised in other comprehensive income for items recognised directly in equity.

Tax effects of the components of other comprehensive income were as follows:


          € million         € million         € million          million          million            million       € million       € million         € million        million        million        million 
  

Before

tax

2017


Tax
(charge)/
credit

2017


After

tax

2017


Before

tax

2016


Tax
(charge)/
credit

2016


After

tax

2016


Before

tax

2018


Tax
(charge)/
credit

2018


After

tax

2018


Before

tax

2017


Tax
(charge)/
credit

2017


After

tax

2017


Fair value gains/(losses) on financial instruments

   (61  (14  (75 (15  -    (15

Gains/(losses) on:(a)


Equity instruments at fair value through other comprehensive income

   51       51          

Cash flow hedges

   (70  15    (55 (62 (6 (68

Other financial instruments

            1  (8 (7

Remeasurements of defined benefit pension plans

   1,620   (338  1,282  (1,221 241    (980   (437  109    (328 1,620  (338 1,282 

Currency retranslation gains/(losses)

   (1,024  41   (983 217   -    217    (869  8    (861 (1,024 41  (983
   535   (311  224  (1,019 241    (778
   (1,325  132    (1,193 535  (311 224 
(a)

Classification has changed following adoption of IFRS 9. See note 1 for further details.


7. COMBINED EARNINGS PER SHARE


The combined earnings per share calculations are based on the average number of share units representing the combined ordinary shares of NV and PLC in issue during the period, less the average number of shares held as treasury shares.

In calculating diluted earnings per share and underlying earnings per share, a number of adjustments are made to the number of shares, principally, the exercise of share options by employees.

Underlying earnings per share is calculated as underlying profit attributable to shareholders’ equity divided by the diluted combined average number of share units. In calculating underlying profit attributable to shareholders’ equity, net profit attributable to shareholders’ equity is adjusted to eliminate thepost-tax impact ofnon-underlying items in operating profit and any other significant unusual items within net profit but not operating profit.

Earnings per share for total operations for the 12 months were as follows:


                          2018             2017             2016 
                        2017             2016             2015 

Basic earnings per share

       2.16  1.83  1.73     3.50  2.16  1.83 

Diluted earnings per share

       2.15  1.82  1.72     3.48  2.15  1.82 

Underlying earnings per share

         2.24  2.03  1.93      2.36  2.24  2.03 
          Millions of share units      


Millions of share units

 
Calculation of average number of share units            2017 2016 2015      2018 2017 2016 

Average number of shares: NV

       1,714.7  1,714.7  1,714.7     1,714.7  1,714.7  1,714.7 

PLC

       1,310.2  1,310.2  1,310.2     1,264.0  1,310.2  1,310.2 

Less treasury shares held by employee share trusts and companies

       (223.3 (184.7 (184.8    (295.4 (223.3 (184.7

Combined average number of share units - used for basic earnings per share

       2,801.6  2,840.2  2,840.1 

Combined average number of share units – used for basic earnings per share

    2,683.3  2,801.6  2,840.2 

Add dilutive effect of share-based compensation plans

       12.4  13.7  15.3     11.5  12.4  13.7 

Diluted combined average number of share units – used for diluted and underlying earnings per share

         2,814.0  2,853.9  2,855.4      2,694.8  2,814.0  2,853.9 
Calculation of earnings  Notes  


€ million
2018

  million
2017
  million
2016
 
Calculation of earnings  Notes        € million
2017
  million
2016
  million
2015
 

Net profit

       6,486  5,547  5,259     9,808  6,486  5,547 

Non-controlling interests

       (433 (363 (350    (419 (433 (363

Net profit attributable to shareholders’ equity – used for basic and diluted earnings per share

       6,053  5,184  4,909     9,389  6,053  5,184 

Post tax impact ofnon-underlying items

   3      262  601  605    3   (3,024 262  601 

Underlying profit attributable to shareholders’ equity – used for underlying earnings per share

         6,315  5,785  5,514      6,365  6,315  5,785 


Annual Report on Form 20-F 201796 Financial Statements  107Annual Report on Form 20-F 2018


NOTES TO THE CONSOLIDATED FINANCIAL STATEMENTS

UNILEVER GROUPCONTINUED


8. DIVIDENDS ON ORDINARY CAPITAL


Dividends are recognised on the date that the shareholder’s right to receive payment is established. This is generally the date when the dividend is declared.


              € million              million              million       € million      million      million 
Dividends on ordinary capital during the year  2017 2016 2015   2018 2017 2016 

NV dividends

   (2,154 (1,974 (1,862   (2,262 (2,154 (1,974

PLC dividends

   (1,762 (1,626 (1,542   (1,819 (1,762 (1,626
   (3,916 (3,600 (3,404
   (4,081 (3,916 (3,600

Four quarterly interim dividends were declared and paid during 20172018 totalling1.40 (2016:1.52 (2017:1.26)1.40) per NV ordinary share and £1.22 (2016: £1.04)£1.33 (2017: £1.22) per PLC ordinary share.

Quarterly dividends of0.360.39 per NV ordinary share and £0.32£0.34 per PLC ordinary share were declared on 1 February 2018,31 January 2019, to be paid in March 2018.2019. See note 2726 ‘Events after the balance sheet date’ on page 137.127. Total dividends declared in relation to 20172018 were1.43 (2016:1.55 (2017:1.28)1.43) per NV ordinary share and £1.26 (2016: £1.09)£1.35 (2017: £1.26) per PLC ordinary share.


9. GOODWILL AND INTANGIBLE ASSETS

GOODWILL

Goodwill is initially recognised based on the accounting policy for business combinations (see note 21). Goodwill is subsequently measured at cost less amounts provided for impairment. The Group has 13nine cash generating units (CGUs), of which 12 are based on the three geographical areas and four product categories (excludingthree divisions. Global Spreads from the Foods category). Abusiness which was recognised as a separate CGU in 2017 has been recognised for the global Spreads business on the announcement to dispose of the business.disposed off in 2018.

Goodwill acquired in a business combination is allocated to the Group’s CGUs, or groups of CGUs, that are expected to benefit from the synergies of the combination. These might not always be the same as the CGUs that include the assets and liabilities of the acquired business. Each unit or group of units to which the goodwill is allocated represents the lowest level within the Group at which the goodwill is monitored for internal management purposes, and is not larger than an operating segment.

INTANGIBLE ASSETS

Separately purchased intangible assets are initially measured at cost, being the purchase price as at the date of acquisition. On acquisition of new interests in group companies, Unilever recognises any specifically identifiable intangible assets separately from goodwill. These intangible assets are initially measured at fair value as at the date of acquisition.

Development expenditure for internally-produced intangible assets is capitalised only if the costs can be reliably measured, future economic benefits are probable, the product is technically feasible and the Group has the intent and the resources to complete the project. Research expenditure to support development of internally-produced intangible assets is recognised in profit or loss as incurred.

Indefinite-life intangibles mainly comprise trademarks and brands.brands, for which there is no foreseeable limit to the period over which they are expected to generate net cash inflows. These are considered to have an indefinite life, given the strength and durability of our brands and the level of marketing support.These assets are not amortised but are subject to a review for impairment annually, or more frequently if events or circumstances indicate this is necessary. Any impairment is charged to the income statement as it arises.

Finite-life intangible assets mainly comprise software, patented andnon-patented technology,know-how and customer lists. These assets are amortised on a straight-line basis in the income statement over the period of their expected useful lives, or the period of legal rights if shorter. None of the amortisation periods exceeds ten years.

.


108Annual Report on Form 20-F 2018 Financial Statements Annual Report on Form 20-F 201797


NOTES TO THE CONSOLIDATED FINANCIAL STATEMENTS

UNILEVER GROUPCONTINUED


9. GOODWILL AND INTANGIBLE ASSETSCONTINUED


          € million         € million         € million         € million         € million 
      Finite-life intangible assets   
        Indefinite-life     
Movements during 2018  Goodwill intangible
assets
 Software Other Total 

Cost


1 January 2018

   18,042   10,275   2,499   1,090   31,906 

Hyperinflation restatement to 1 January 2018

   244   25   3      272 

Acquisitions of group companies

   470   825      12   1,307 

Disposals of group companies

   (1  (1        (2

Reclassification to held for sale(a)

   (227  (55  (1     (283

Reclassification from held for sale

      9         9 

Additions

         201   2   203 

Disposals

            (15  (15

Currency retranslation

   (151  156   (15  14   4 

Hyperinflationary adjustment

   125   13   2      140 

31 December 2018

   18,502   11,247   2,689   1,103   33,541 

Accumulated amortisation and impairment


1 January 2018

   (1,161  (14  (1,637  (693  (3,505

Hyperinflation restatement to 1 January 2018

         (3     (3

Amortisation/impairment for the year

      (198  (297  (61  (556

Disposals

            14   14 

Currency retranslation

         12   (8  4 

Hyperinflationary adjustment

         (2     (2

31 December 2018

   (1,161  (212  (1,927  (748  (4,048

Net book value 31 December 2018(b)

   17,341   11,035   762   355   29,493 
          € million € million         € million         € million         € million    million  million  million  million  million 
    Finite-life intangible assets       Finite-life intangible assets   
    Indefinite-life     
Movements during 2017  Goodwill 

  Indefinite-life

intangible

assets


Software

 Other Total   Goodwill intangible assets Software Other Total 

Cost


1 January 2017

   18,789   8,358   2,578   1,068   30,793    18,789  8,358  2,578  1,068  30,793 

Acquisitions of group companies

   2,557   2,622   -   88   5,267    2,557  2,622     88  5,267 

Reclassification to held for sale(a)

   (2,228  (82  (1  -   (2,311   (2,228 (82 (1    (2,311

Reclassification from held for sale

   28   -   -   -   28    28           28 

Additions

   -   -   153   1   154         153  1  154 

Disposals

   -   -   (78  (1  (79        (78 (1 (79

Currency retranslation

   (1,104  (623  (153  (66  (1,946   (1,104 (623 (153 (66 (1,946

31 December 2017

   18,042   10,275   2,499   1,090   31,906    18,042  10,275  2,499  1,090  31,906 

Accumulated amortisation and impairment


1 January 2017

   (1,165  (13  (1,484  (698  (3,360   (1,165 (13 (1,484 (698 (3,360

Amortisation/impairment for the year

   -   -   (324  (41  (365        (324 (41 (365

Disposals

   -   -   78   1   79         78  1  79 

Currency retranslation

   4   (1  93   45   141    4  (1 93  45  141 

31 December 2017

   (1,161  (14  (1,637  (693  (3,505   (1,161 (14 (1,637 (693 (3,505

Net book value 31 December 2017(b)

   16,881   10,261   862   397   28,401    16,881  10,261  862  397  28,401 
  € million € million € million € million € million 
    Finite-life intangible assets 
Movements during 2016  Goodwill 

Indefinite-life

intangible

assets

 Software Other Total 

Cost


1 January 2016

   17,378  7,444  2,538  819  28,179 

Acquisitions of group companies

   1,140  911   -  236  2,287 

Disposals of group companies

   (2 (83  -   -  (85

Reclassification to held for sale

   (55  -   -   -  (55

Additions

   -  2  225  6  233 

Disposals

   -   -  (42 (1 (43

Currency retranslation

   328  84  (143 8  277 

31 December 2016

   18,789  8,358  2,578  1,068  30,793 

Accumulated amortisation and impairment


1 January 2016

   (1,165 (13 (1,269 (673 (3,120

Amortisation/impairment for the year

   -   -  (291 (19 (310

Disposals

   -   -  42  1  43 

Currency retranslation

   -   -  34  (7 27 

31 December 2016

   (1,165 (13 (1,484 (698 (3,360

Net book value 31 December 2016(b)

   17,624  8,345  1,094  370  27,433 


(a) 

Goodwill and intangibles amounting to2,311283 million has been reclassified as held for sale in relation to the Spreads business. Referand Alsa baking and dessert businesses. In 20172,311 million goodwill and intangibles related to note 22Spreads business were reclassified as held for further details.sale.

(b) 

Within the indefinite-life intangible assets there are three brands that have a significant carrying value: Knorr1,7701,789 million (2016:(2017:1,8661,770 million), Carver Korea1,5201,534 million (2016:(2017: nil)1,520 million) and Hellmann’s1,1601,195 million (2016:(2017:1,3021,160 million).

There are no significant carrying amounts of goodwill and intangible assets that are allocated across multiple cash generating units.

Goodwill acquired in a business combination is allocated to Unilever’s cash generating units for the purposes of impairment testing. The assets acquired in business combinations are also assessed to determine the impact on the Group’s cash generating units, particularly whether new cash generating units are created. This assessment and allocation has not been completed for any of the acquisitions completed during 2017,2018 except for goodwill and assets acquired for Living Proofin the Quala acquisition which are included in the Beauty & Personal Care The Americas and Home Care The Americas cash generating unit.units. At 31 December 2017 goodwill of2,405 million has not been allocated to Unilever’s cash generating units for the purposes of impairment testing,2018, there is no indication that the acquired goodwill and assets are impaired.

The impact of applying IAS 29 for Argentina has increased goodwill by369 million. The goodwill that relates to our business in Argentina was initially recognised in 2000 when Unilever acquired Bestfoods. In accordance with IAS 29 this goodwill has been adjusted for inflation from the date of recognition until 31 December 2018. Our impairment testing included this inflated amount.


Annual Report on Form 20-F 201798 Financial Statements  109Annual Report on Form 20-F 2018


NOTES TO THE CONSOLIDATED FINANCIAL STATEMENTS

UNILEVER GROUPCONTINUED


9. GOODWILL AND INTANGIBLE ASSETSCONTINUED


IMPAIRMENT CHARGES

We have tested all material goodwill and indefinite-life intangible assets for impairment. No impairments were identified.identified except for the Blueair intangibles. The Blueair acquisition included an element of deferred consideration payable in 2021. The terms relating to this element allowed the sellers to request an early settlement for a reduced sum. Such a request was made in 2018 and the payment was made to the sellers, reducing the consideration payable by277 million and generating a credit innon-underlying items within the line ‘acquisition & disposal related costs’. This early termination has been considered as a trigger event for an impairment review for Blueair intangible assets and a208 million charge has been recognised innon-underlying items within the line ‘impairments and otherone-off items’ (see note 3)

SIGNIFICANT CGUS

The goodwill and indefinite-life intangible assets held in the three CGUs relating to Foods (excluding spreads) across the geographical areas and& Refreshment Europe, Foods & Refreshment The Americas, Beauty & Personal Care The Americas and Beauty & Personal Care Asia/AMET/RUB are considered significant within the total carrying amounts of goodwill and indefinite-life intangible assets at 31 December 20172018 in terms of size, headroom and sensitivity to assumptions used.

The goodwill and indefinite-life intangible assets held in the significant CGUs are:


  € billion   € billion 
2018 CGUs              Goodwill       Indefinite-life
intangible
assets
 

Foods & Refreshment Europe

   3.9    1.6 

Foods & Refreshment The Americas

   3.9    2.1 

Beauty & Personal Care The Americas

   4.0    2.8 

Beauty & Personal Care Asia/AMET/RUB

   1.7    2.0 
  € billion   € billion    billion    billion 
2017 CGUs              Goodwill   

    Indefinite-life

intangible

assets

               Goodwill   

Indefinite-life

intangible assets


Foods (excluding spreads) Europe

   4.5    1.6    4.5    1.6 

Foods (excluding spreads) The Americas

   2.8    1.4    2.8    1.4 

Foods (excluding spreads) Asia/AMET/RUB

   1.5    0.4    1.5    0.4 

Personal Care The Americas

   2.5    1.5 

Beauty & Personal Care The Americas

   2.5    1.5 

In addition,2017 the global Spreadsspreads CGU iswas also considered significant, with a carrying value of2,228 million in goodwill and82 million in indefinite-life intangible assets. These have beenwere classified as assets held for sale, refer note 22.sale.

    billion    billion 
2016 CGUs              Goodwill         Indefinite-life
intangible
assets
 

Foods Europe

   5.8    1.6 

Foods The Americas

   3.9    1.6 

Foods Asia/AMET/RUB

   1.8    0.5 

Personal Care The Americas

   2.8    1.7 

Value in use has been calculated as the present value of projected cash flows. Apre-tax discount rate of 7.4% (2016:(2017: 7.4%) was used.

For the significant CGUs, the following key assumptions were used in the discounted cash flow projections:


  Foods   Foods   Foods     Personal Care   

Foods &

          Refreshment


Foods &

Refreshment


Beauty &

Personal Care


Beauty &

Personal Care


          (excluding

spreads)


Europe


          (excluding

spreads)

The

Americas


(excluding

spreads)

Asia/

          AMET/RUB


The

Americas

   Europe   The Americas   

The

Americas


Asia/

AMET/RUB


Longer-term sustainable growth rates

   0.9%    1.5%    3.9%    1.5%    1.2%    1.6%    1.6%    3.8% 

Average near-term nominal growth rates

   -2.1%    3.8%    6.3%    4.7%    0.0%    0.7%    2.8%    3.9% 

Average operating margins

   17%    21%    18%    20%    16%    15%    20%    22% 

The projections cover a period of five years, as we believe this to be the most appropriate timescale over which to review and consider annual performances before applying a fixed terminal value multiple to the final year cash flows.

The growth rates and margins used to estimate future performance are based on the conservative end of the range of estimates from past performance, our annual forecast and three year strategic plan extended to year 4 and 5.

We have performed sensitivity analyses around the base assumptions. There are no reasonably possible changes in a key assumption that would cause the carrying amount to exceed the recoverable amount.


110Annual Report on Form 20-F 2018 Financial Statements Annual Report on Form 20-F 201799


NOTES TO THE CONSOLIDATED FINANCIAL STATEMENTS

UNILEVER GROUPCONTINUED


10. PROPERTY, PLANT AND EQUIPMENT


Property, plant and equipment is measured at cost including eligible borrowing costs less depreciation and accumulated impairment losses.

Depreciation is provided on a straight-line basis over the expected average useful lives of the assets. Residual values are reviewed at least annually. Estimated useful lives by major class of assets are as follows:

•   Freehold buildings (no depreciation on freehold land)

  40 years

•   Leasehold land and buildings

  40 years (or life of lease if less)

•   Plant and equipment

  2–20 years

Property, plant and equipment is subject to review for impairment if triggering events or circumstances indicate that this is necessary. If an indication of impairment exists, the asset’s or cash generating unit’s recoverable amount is estimated and any impairment loss is charged to the income statement as it arises.


  € million € million         € million   € million € million         € million 
  Land and Plant and     Land and Plant and   
Movements during 2017            buildings           equipment Total 
Movements during 2018            buildings           equipment Total 

Cost


1 January 2017

   4,745   16,462   21,207 

1 January 2018

   4,462   14,936   19,398 

Hyperinflation restatement to 1 January 2018

   37   182   219 

Acquisitions of group companies

   13   29   42    11   31   42 

Disposals of group companies

   (16  (78  (94

Additions

   314   1,218   1,532    249   1,091   1,340 

Disposals

   (19  (440  (459   (97  (607  (704

Hyperinflationary adjustment

   49   93   142 

Currency retranslation

   (384  (1,283  (1,667   (91  (351  (442

Reclassification as held for sale(a)

   (191  (972  (1,163

31 December 2017

   4,462   14,936   19,398 

Reclassification as held for sale

   (17  (54  (71

31 December 2018

   4,603   15,321   19,924 

Accumulated depreciation


1 January 2017

   (1,483  (8,051  (9,534

Disposals of group companies

   1   29   30 

1 January 2018

   (1,429  (7,558  (8,987

Hyperinflation restatement to 1 January 2018

   (10  (106  (116

Depreciation charge for the year

   (142  (1,031  (1,173   (125  (1,066  (1,191

Disposals

   14   400   414    62   529   591 

Hyperinflationary adjustment

   (7  (53  (60

Currency retranslation

   100   543   643    15   128   143 

Reclassification as held for sale

   81   552   633    10   33   43 

31 December 2017

   (1,429  (7,558  (8,987

Net book value 31 December 2017(b)

   3,033   7,378   10,411 

Includes payments on account and assets in course of construction

   93   972   1,065 

31 December 2018

   (1,484  (8,093  (9,577

Net book value 31 December 2018(a)

   3,119   7,228   10,347 

Includes capital expenditures for assets under construction

   130   956   1,086 


(a) 

Includes548302 million in property plant and equipment related to the Spreads business. Refer to note 22 for further details.

(b)Includes247 million (2016:249 million) of freehold land.

The Group has commitments to purchase property, plant and equipment of323324 million (2016:(2017:478323 million).


Annual Report on Form 20-F 2017100 Financial Statements  111Annual Report on Form 20-F 2018


NOTES TO THE CONSOLIDATED FINANCIAL STATEMENTS

UNILEVER GROUPCONTINUED


10. PROPERTY, PLANT AND EQUIPMENTCONTINUEDCONTINUED


  € million € million         € million   € million € million             € million 
  Land and Plant and     Land and Plant and   
Movements during 2016            buildings           equipment Total 
Movements during 2017              buildings             equipment Total 

Cost


1 January 2016

   4,551  15,366  19,917 

1 January 2017

   4,745  16,462  21,207 

Acquisitions of group companies

   -  13  13    13  29  42 

Disposals of group companies

   (1 (11 (12   (16 (78 (94

Additions

   358  1,553  1,911    314  1,218  1,532 

Disposals

   (84 (521 (605   (19 (440 (459

Currency retranslation

   23  64  87    (384 (1,283 (1,667

Reclassification as held for sale

   (102 (2 (104

31 December 2016

   4,745  16,462  21,207 

Reclassification as held for sale(a)

   (191 (972 (1,163

31 December 2017

   4,462  14,936  19,398 

Accumulated depreciation


1 January 2016

   (1,443 (7,416 (8,859

1 January 2017

   (1,483 (8,051 (9,534

Disposals of group companies

   1  7  8    1  29  30 

Depreciation charge for the year

   (149 (1,005 (1,154   (142 (1,031 (1,173

Disposals

   56  332  388    14  400  414 

Currency retranslation

   5  (15 (10   100  543  643 

Reclassification as held for sale

   47  46  93    81  552  633 

31 December 2016

   (1,483 (8,051 (9,534

Net book value 31 December 2016

   3,262  8,411  11,673 

Includes payments on account and assets in course of construction

   189  1,236  1,425 

31 December 2017

   (1,429 (7,558 (8,987

Net book value 31 December 2017(b)

   3,033  7,378  10,411 

Includes capital expenditures for assets under construction

   93  972  1,065 

(a)

Includes548 million in property plant and equipment related to the Spreads business.

(b)

Includes247 million of freehold land.


11. OTHERNON-CURRENT ASSETS


Joint ventures are undertakings in which the Group has an interest and which are jointly controlled by the Group and one or more other parties. Associates are undertakings where the Group has an investment in which it does not have control or joint control but can exercise significant influence.

Interests in joint ventures and associates are accounted for using the equity method and are stated in the consolidated balance sheet at cost, adjusted for the movement in the Group’s share of their net assets and liabilities. The Group’s share of the profit or loss after tax of joint ventures and associates is included in the Group’s consolidated profit before taxation.

Where the Group’s share of losses exceeds its interest in the equity accounted investee, the carrying amount of the investment is reduced to zero and the recognition of further losses is discontinued, except to the extent that the Group has an obligation to make payments on behalf of the investee.

Biological assets are measured at fair value less costs to sell with any changes recognised in the income statement.


            € million              million             € million              million 
  2017   2016   2018   2017 

Interest in net assets of joint ventures

   32    36    14    32 

Interest in net assets of associates

   44    51    40    44 

Long-term trade and other receivables(a)

   265    306    307    265 

Operating lease prepayments for land

   116    115    118    116 

Fair value of biological assets

   17    51    18    17 

Othernon-current assets(b)

   83    159    151    83 
   557    718 
   648    557 


(a) 

Mainly relaterelates to indirect tax receivables where we do not have the contractual right to receive payment within 12 months.

(b) 2017 mainly

Mainly relates to tax assets (2016: assets held in escrow for the UK pension fund and tax assets).assets.


112Annual Report on Form 20-F 2018 Financial Statements Annual Report on Form 20-F 2017101


NOTES TO THE CONSOLIDATED FINANCIAL STATEMENTS

UNILEVER GROUPCONTINUED


11. OTHERNON-CURRENT ASSETSCONTINUED


Movements during 2017 and 2016            €million
2017
           million
2016
 
Movements during 2018 and 2017            € million
2018
            million
2017
 

Joint ventures(a)


1 January

   36  48    32  36 

Additions

   -  24    5    

Dividends received/reductions

   (155 (151

Dividends received/reductions(b)

   (216 (155

Share of net profit/(loss)

   155  130    190  155 

Currency retranslation

   (4 (15   3  (4

31 December

   32  36    14  32 

Associates(b)


Associates(c)


1 January

   51  59    44  51 

Additions

   5  7    3  5 

Dividend received/reductions

   (10 (8     (10

Share of net profit/(loss)

   -  (3   (5   

Currency retranslation

   (2 (4   (2 (2

31 December

   44  51    40  44 


(a) 

Our principal joint ventures are Unilever Jerónimo MartinsFIMA LDA for Portugal, the Pepsi/Lipton Partnership for the US and Pepsi Lipton International for the rest of the world.

(b) 

In 2018, includes capital reduction in joint venture of Unilever FIMA LDA for64 million.

(c)

Associates as at 31 December 20172018 primarily comprise our investments in Langholm Capital Partners. Other Unilever Ventures assets are included under ‘Othernon-currentnon-financial assets’.

The joint ventures and associates have no significant contingent liabilities to which the Group is exposed, and the Group has no significant contingent liabilities in relation to its interests in the joint ventures and associates.

The Group has no outstanding capital commitments to joint ventures.

Outstanding balances with joint ventures and associates are shown in note 23 on page 136.126.


12. INVENTORIES


Inventories are valued at the lower of weighted average cost and net realisable value. Cost comprises direct costs and, where appropriate, a proportion of attributable production overheads. Net realisable value is the estimated selling price less the estimated costs necessary to make the sale.


Inventories            € million
2017
              million
2016
             € million
2018
              million
2017
 

Raw materials and consumables

   1,274    1,385    1,365    1,274 

Finished goods and goods for resale

   2,688    2,893    2,936    2,688 
   3,962    4,278 
   4,301    3,962 

Inventories with a value of92124 million (2016:(2017:11092 million) are carried at net realisable value, this being lower than cost. During 2017,201892 million (2017:109 million (2016:113 million) was charged to the income statement for damaged, obsolete and lost inventories. In 2017,201872 million (2017:90 million (2016:113 million) was utilised or released to the income statement from inventory provisions taken in earlier years.

In 2017 inventory of129 million related to the Spreads business has been reclassified to assets held for sale, refer to note 22 on page 136.


13. TRADE AND OTHER CURRENT RECEIVABLES


Trade and other current receivables are initially recognised at fair value plus any directly attributable transaction costs. Subsequently these assets are held at amortised cost, using the effective interest method and net of any impairment losses.

We do not consider the fair values of trade and other current receivables to be significantly different from their carrying values. Concentrations of credit risk with respect to trade receivables are limited, due to the Group’s customer base being large and diverse. Our historical experience of collecting receivables, supported by the level of default, is that credit risk is low across territories and so trade receivables are considered to be a single class of financial assets. Impairment for trade receivables are calculated for specific receivables with known or anticipated issues affecting the likelihood of recovery and for balances past due with a probability of default based on historical data as well as relevant forward-looking information.


Annual Report on Form 20-F 2017102 Financial Statements  113Annual Report on Form 20-F 2018


NOTES TO THE CONSOLIDATED FINANCIAL STATEMENTS

UNILEVER GROUPCONTINUED


13. TRADE AND OTHER CURRENT RECEIVABLESCONTINUED


Trade and other current receivables            € million
2017
              million
2016
 

Due within one year


Trade receivables

   3,439    3,329 

Prepayments and accrued income

   452    504 

Other receivables

   1,331    1,269 
    5,222    5,102 

Trade and other current receivables            € million
2018
                million
2017
 

Due within one year


Trade receivables(a)

   4,350    3,439 

Prepayments and accrued income

   693    452 

Other receivables

   1,442    1,331 
    6,485    5,222 

(a)

2018 includes677 million due from KKR as a result of an arrangement following the sale of the global spreads business (excluding Southern Africa). Unilever will provide services to KKR including IT infrastructure, bookkeeping, payroll, marketing and co-packing for up to two years from completion of the disposal and KKR pays Unilever for materials sourced on its behalf. See also trade payables on page 104.

Included within trade receivables are rebates payable to customers of3,062 million (2017:2,766 million). Other receivables comprise financial assets of281299 million (2016:(2017:396281 million), andnon-financial assets of1,0501,142 million (2016:(2017:8731,050 million). Financial assets include supplier and customer deposits, employee advances and certain derivatives.Non-financial assets mainly consist of reclaimable sales tax.


            € million            million 
Ageing of trade receivables  2017 2016             € million
2018
            million
2017
 

Total trade receivables

   3,599  3,472    4,538  3,599 

Less impairment provision for trade receivables

   (160 (143   (188 (160
   3,439  3,329 
   4,350  3,439 

Of which:


Not overdue

   2,714  2,537    3,440  2,714 

Past due less than three months

   621  666    747  621 

Past due more than three months but less than six months

   95  102    132  95 

Past due more than six months but less than one year

   59  69    74  59 

Past due more than one year

   110  98    145  110 

Impairment provision for trade receivables

   (160 (143   (188 (160
   3,439  3,329 
   4,350  3,439 
  € million  million 
Impairment provision for total trade and other receivables  2017 2016   

€ million

2018

  million
2017
 

1 January

   166  155    184  166 

Charge to income statement

   51  42    65  51 

Reduction/releases

   (21 (35   (29 (21

Currency translations

   (12 4    (6 (12

31 December

   184  166    214  184 

The total impairment provision includes160188 million (2016:(2017:143160 million) for current trade receivables,1013 million (2016:(2017:10 million) for other current receivables and1413 million (2016:(2017:1314 million) fornon-current trade and other receivables, refer to note 11.receivables.


14. TRADE PAYABLES AND OTHER LIABILITIES


TRADE PAYABLES

Trade payables are initially recognised at fair value less any directly attributable transaction costs. Trade payables are subsequently measured at amortised cost, using the effective interest method.

OTHER LIABILITIES

Other liabilities are initially recognised at fair value less any directly attributable transaction costs. Subsequent measurement depends on the type of liability:

Accruals are subsequently measured at amortised cost, using the effective interest method.

Social security and sundry taxes are subsequently measured at amortised cost, using the effective interest method.

Deferred consideration is subsequently measured at fair value with changes in the income statement as explained below.

Others are subsequently measured either at amortised cost, using the effective interest method or at fair value, with changes being recognised in the income statement.

Deferred Consideration

Deferred consideration represents any payments to the sellers of a business that occur after the acquisition date. These typically comprise of contingent consideration and fixed deferred consideration:

Fixed deferred consideration is a payment with a due date after acquisition that is not dependent on future conditions

Contingent consideration is a payment which is dependent on certain conditions being met in the future and is often variable

All deferred consideration is initially recognised at fair value as at the acquisition date, which includes a present value discount. Subsequently, deferred consideration is measured to reflect the unwinding of discount on the liability, with changes recognised in finance cost within the income statement. In the balance sheet it isre-measured remeasured to reflect the latest estimate of the achievement of the conditions on which the consideration is based; changes in value other than the discount unwind are recognised as acquisition and disposal-related costs withinnon-underlying items in the income statement.

We do not consider the fair values of trade payables and other liabilities to be significantly different from their carrying values.


114Annual Report on Form 20-F 2018 Financial Statements Annual Report on Form 20-F 2017103


NOTES TO THE CONSOLIDATED FINANCIAL STATEMENTS

UNILEVER GROUPCONTINUED


14. TRADE PAYABLES AND OTHER LIABILITIESCONTINUED


Trade payables and other liabilities            € million
2017
              million
2016
 

Current: due within one year


Trade payables

   8,217    8,591 

Accruals

   3,666    3,655 

Social security and sundry taxes

   539    468 

Deferred consideration

   26    151 

Others

   978    1,006 
   13,426    13,871 

Non-current: due after more than one year


Accruals

   146    159 

Deferred consideration

   485    443 

Others

   69    65 
   700    667 

Total trade

   14,126    14,538 

Trade payables and other liabilities            € million
2018
              million
2017
 

Current: due within one year


Trade payables(a)

   9,121    8,217 

Accruals

   3,724    3,666 

Social security and sundry taxes

   498    539 

Deferred consideration

   14    26 

Others

   1,100    978 
   14,457    13,426 

Non-current: due after more than one year


Accruals

   121    146 

Deferred consideration

   173    485 

Others

   52    69 
   346    700 

Total trade

   14,803    14,126 

(a)

2018 includes311 million due to KKR as a result of an arrangement following the sale of the global spreads business (excluding Southern Africa). Unilever will provide certain services for up to two years from completion of the disposal and pays KKR for amounts collected on its behalf. See also trade receivables on page 103.

Included in others are third party royalties, certain derivatives, withholding tax on dividends and dividendsthird-party payables related tonon-controlling interests. audit and agency fees.

Deferred Consideration

At 31 December 2017,2018 the total balance of deferred consideration for acquisitions is511187 million (2016:(2017:594511 million), of which contingent consideration is445142 million (2016:(2017:380445 million). These contingent consideration payments fall due up until 20222024 with a maximum possible total payment of2,2311,082 million. The movement during 2018 is mainly due to release of contingent consideration relating to Blueair which arose from early settlement through cash payment of122 million and anon-cash credit to operating profit of277 million.


15. CAPITAL AND FUNDING


ORDINARY SHARES

Ordinary shares are classified as equity. Incremental costs directly attributable to the issue of ordinary shares are recognised as a deduction from equity, net of any tax effects.

INTERNAL HOLDINGS

The ordinary shares numbered 1 to 2,400 (inclusive) in NV (‘Special Shares’) and deferred stock of PLC are held as to one half of each class by N.V. Elma – a subsidiary of NV – and one half by United Holdings Limited – a subsidiary of PLC. This capital is eliminated on consolidation.

SHARE-BASED COMPENSATION

The Group operates a number of share-based compensation plans involving options and awards of ordinary shares of NV and PLC. Full details of these plans are given in note 4C on pages 103 to 104.92 and 93.

OTHER RESERVES

Other reserves include the fair value reserve, the foreign currency translation reserve, the capital redemption reserve and treasury shares.

SHARES HELD BY EMPLOYEE SHARE TRUSTS AND GROUP COMPANIES

Certain PLC trusts, NV and group companies purchase and hold NV and PLC shares to satisfy performance shares granted, share options granted and other share awards (see note 4C). The assets and liabilities of these trusts and shares held by group companies are included in the consolidated financial statements. The book value of shares held is deducted from other reserves, and trusts’ borrowings are included in the Group’s liabilities. The costs of the trusts are included in the results of the Group. These shares are excluded from the calculation of earnings per share.

FINANCIAL LIABILITIES

Financial liabilities are initially recognised at fair value, less any directly related transaction costs. Certain bonds are designated as being part of a fair value hedge relationship. In these cases, the bonds are carried at amortised cost, adjusted for the fair value of the risk being hedged, with changes in value shown in profit and loss. Other financial liabilities, excluding derivatives, are subsequently carried at amortised cost.cost, with the exception of:

DERIVATIVE FINANCIAL INSTRUMENTSFinancial liabilities which the group has elected to measure at fair value through profit or loss;

The Group’s use of, and accounting for, derivative instruments is explained inDerivative financial liabilities – see note 16 on page 121 and on pages 125 to 126.110

The Group’s Treasury activities are designed to:

maintain a competitive balance sheet in line with at least A/A2 rating (see below);

secure funding at lowest costs for the Group’s operations, M&A activity and external dividend payments (see below);

protect the Group’s financial results and position from financial risks (see note 16);

maintain market risks within acceptable parameters, while optimising returns (see note 16); and

protect the Group’s financial investments, while maximising returns (see note 17).

The Treasury department provides central deposit taking, funding and foreign exchange management services for the Group’s operations. The department is governed by standards and processes which are approved by Unilever Leadership Executive (ULE). In addition to guidelines and exposure limits, a system of authorities and extensive independent reporting covers all major areas of activity. Performance is monitored closely by senior management. Reviews are undertaken periodically by corporate audit.


Annual Report on Form 20-F 2017104 Financial Statements  115Annual Report on Form 20-F 2018


NOTES TO THE CONSOLIDATED FINANCIAL STATEMENTS

UNILEVER GROUPCONTINUED


15. CAPITAL AND FUNDINGCONTINUED


Key instruments used by the treasury department are:

short-term and long-term borrowings;

cash and cash equivalents; and

plain vanilla derivatives, including interest rate swaps and foreign exchange contracts.

The Treasury department maintains a list of approved financial instruments. The use of any new instrument must be approved by the Chief Financial Officer. The use of leveraged instruments is not permitted.

Unilever considers the following components of its balance sheet to be managed capital:

total equity – retained profit, other reserves, share capital, share premium,non-controlling interests (notes 15A and 15B);

short-term debt – current financial liabilities (note 15C); and

long-term debt –non-current bank loans, bonds and other loansfinancial liabilities (note 15C).

The Group manages its capital so as to safeguard its ability to continue as a going concern and to optimise returns to our shareholders through an appropriate balance of debt and equity. The capital structure of the Group is based on management’s judgement of the appropriate balance of key elements in order to meet its strategic andday-to-day needs. We consider the amount of capital in proportion to risk and manage the capital structure in light of changes in economic conditions and the risk characteristics of the underlying assets.

Our current long-term credit rating is A+/A1 and our short-term credit rating is A1/P1. We aim to maintain a competitive balance sheet which we consider to be the equivalent of a credit rating of at least A/A2 in the long-term.long term. This provides us with:

appropriate access to the debt and equity markets;

sufficient flexibility for acquisitions;

sufficient resilience against economic and financial uncertainty while ensuring ample liquidity; and

optimal weighted average cost of capital, given the above constraints.

Unilever monitors the qualitative and quantitative factors utilised by the rating agencies. This information is publicly available and is updated by the credit rating agencies on a regular basis.

15A. SHARE CAPITAL

       Authorised(a)     

Issued,
    called up and
fully paid
 
 
(b) 
 
       Authorised(a)     

Issued,
    called up and
fully paid
 
 
(b)  
  2018 2018 2017 2017 

Unilever N.V.

   € million   € million   million   million 

NV ordinary shares of0.16 each

   480   274  480  274 

NV ordinary shares of428.57 each (shares numbered 1 to 2,400 – Special Shares’)

   1   1  1  1 

Internal holdings eliminated on consolidation (428.57 shares)

      (1    (1
   481   274  481  274 

Unilever PLC

    £ million    million 

PLC ordinary shares of 31/9p each

    40.8   40.8 

PLC deferred stock of £1 each

    0.1   0.1 

Internal holding eliminated on consolidation (£1 stock)

    (0.1  (0.1

Cancellation of treasury shares(c)

    (3.8    
      Issued,          Issued,        37.0   40.8 
      called up          called up    
      and          and        € million    million 

Euro equivalent in millions (at £1.00 =5.143)(d)

     190    210 

Unilever Group

    € million    million 

Ordinary share capital of NV

    274   274 

Ordinary share capital of PLC

    190   210 
         Authorised(a)            fully paid(b)          Authorised(a)            fully paid(b) 
  2017      2017      2016      2016         464    484 
Unilever N.V.  € million      € million       million       million    

NV ordinary shares of0.16 each

   480       274       480       274    

NV ordinary shares of428.57 each (shares numbered 1 to 2,400 – ‘Special Shares’)

   1       1       1       1    

Internal holdings eliminated on consolidation (428.57 shares)

   -       (1)      -       (1)   
   481       274       481       274    
Unilever PLC      £ million          £ million    

PLC ordinary shares of 31/9p each

     40.8         40.8    

PLC deferred stock of £1 each

     0.1         0.1    

Internal holding eliminated on consolidation (£1 stock)

     (0.1)        (0.1)   
     40.8         40.8    
      € million           million    

Euro equivalent in millions (at £1.00 =5.143)(c)

      210          210    
Unilever Group      € million           million    

Ordinary share capital of NV

     274         274    

Ordinary share capital of PLC

     210         210    
      484          484    


(a) 

At 31 December 2017,2018 Unilever N.V. had 3,000,000,000 (2016:(2017: 3,000,000,000) authorised ordinary shares. The requirement for a UK company to have an authorised share capital was abolished by the UK Companies Act 2006. In May 2010 Unilever PLC shareholders approved new Articles of Association to reflect this.

(b)

At 31 December 2017,2018 the following quantities of shares were in issue: 1,714,727,700 of NV ordinary shares; 2,400 of NV Special Shares; 1,187,191,284 of PLC ordinary shares and 100,000 of PLC deferred stock. At 31 December 2017, 1,714,727,700 of NV ordinary shares; 2,400 of NV Special Shares; 1,310,156,361 of PLC ordinary shares and 100,000 of PLC deferred stock. The same quantitiesstock were in issue at 31 December 2016.issue.

(c)

At 31 December 2018 122,965,077 of PLC ordinary shares that were repurchased as part of the share buyback programme in 2018 and prior years, were cancelled. And 24,334,848 shares have not been cancelled and are recognised as treasury shares.

(d)

Conversion rate for PLC ordinary shares nominal value to euros is £1 =5.143 (which is calculated by dividing the nominal value of NV ordinary shares by the nominal value of PLC ordinary shares).

For information on the rights of shareholders of NV and PLC and the operation of the Equalisation Agreement, see the Corporate Governance report on pages 3436 to 40.42.

A nominal dividend of 6% per annum is paid on the deferred stock of PLC.


116Annual Report on Form 20-F 2018 Financial Statements Annual Report on Form 20-F 2017105


NOTES TO THE CONSOLIDATED FINANCIAL STATEMENTS

UNILEVER GROUPCONTINUED


15B. EQUITY

BASIS OF CONSOLIDATION

Unilever is the majority shareholder of all material subsidiaries and has control in all cases. Information in relation to group companiessignificant subsidiaries is provided on pages 138 to 145.page 127.

SUBSIDIARIES WITH SIGNIFICANTNON-CONTROLLING INTERESTS

Unilever has one subsidiary company which has a materialnon-controlling interest, Hindustan Unilever Limited (HUL). Summary financial information in relation to HUL is shown below.


            € million            million             € million            million 
HUL Balance sheet as at 31 December  2017 2016 
HUL balance sheet as at 31 December  2018 2017 

Non-current assets

   819  791    881  819 

Current assets

   1,274  1,160    1,333  1,274 

Current liabilities

   (1,030 (980   (1,130 (1,030

Non-current liabilities

   (135 (110   (190 (135
HUL Comprehensive income for the year ended 31 December        
HUL comprehensive income for the year ended 31 December        

Turnover

   4,464  4,084    4,527  4,464 

Profit after tax

   595  475    617  595 

Total comprehensive income

   529  484    576  529 
HUL Cash flow for the year ended 31 December        
HUL cash flow for the year ended 31 December        

Net increase/(decrease) in cash and cash-equivalents

   (71 14    14  (71
HULNon-controlling interest        
HULnon-controlling interest        

1 January

   (282 (271   (288 (282

Share of (profit)/loss for the year ended 31 December

   (195 (157   (203 (195

Other comprehensive income

   (3 (8   (4 (3

Dividend paid to thenon-controlling interest

   172  157    183  172 

Other changes in equity

   -   -        

Currency translation

   20  (3   13  20 

31 December

   (288 (282   (299 (288

CONSOLIDATED STATEMENT OF CHANGES IN EQUITY: ANALYSIS OF OTHER RESERVES


            € million��            million            million             € million            million            million 
  Total Total Total   Total Total Total 
  2017 2016 2015   2018 2017 2016 

Fair value reserves

   (189 (113 (98   (194 (189 (113
    

Equity instruments(a)

   98       
  

Cash flow hedges

   (236 (168 (174   (292 (236 (168
  

Available-for-sale financial assets

   47  55  76      47  55 

Currency retranslation of group companies - see following table

   (3,927 (3,034 (3,285

Adjustment on translation of PLC’s ordinary capital at 31/9p =0.16

   (164 (164 (164

Currency retranslation of group companies – see following table

   (4,764 (3,927 (3,034

Adjustment on translation of PLC’s ordinary capital at 31/9p =0.16

   (150 (164 (164

Capital redemption reserve

   32  32  32    32  32  32 

Book value of treasury shares - see following table

   (9,208 (4,164 (4,119

Other(a)

   (177  -  (182
   (13,633 (7,443 (7,816

Book value of treasury shares – see following table

   (10,181 (9,208 (4,164

Hedging gains/(losses) transferred tonon-financial assets(a)

   71       

Other(b)

   (100 (177   
   (15,286 (13,633 (7,443


(a)

Classification has changed following adoption of IFRS 9. See note 1 for further details.

(b)

Relates to option on purchase of subsidiary fornon-controlling interest.interest and hyperinflation adjustment arising on current year profit translated at closing exchange rate.

Unilever acquired 53,003,099 (2016: 3,902,584)66,202,168 (2017: 53,003,099) NV ordinary shares and 53,359,284 (2016: 2,268,600)65,458,433 (2017: 53,359,284) PLC shares through purchases on the stock exchanges during the year, which includes the share buyback programme as explained in note 24. These122,965,077 of PLC ordinary shares arewere cancelled and the remaining shares were held as treasury shares as a separate component of other reserves.

The total number of treasury shares held at 31 December 20172018 was 201,538,909 (2016: 151,953,411)263,349,111 (2017: 201,538,909) NV shares and 84,463,561 (2016: 33,241,009)24,334,848 (2017: 84,463,561) PLC shares. Of these, 9,728,1819,336,215 NV shares and 6,074,2835,674,214 PLC shares were held in connection with share-based compensation plans (see note 4C on pages 10392 to 104)93).

106Financial StatementsAnnual Report on Form 20-F 2018


15B. EQUITYCONTINUED

             € million              million 
Treasury shares – movements during the year  2018   2017 

1 January

   (9,208   (4,164

Repurchase of shares (see note 24)

   (6,020   (5,014

Cancellation of NV and PLC shares

   5,055     

Other purchases and utilisations

   (8   (30

31 December

   (10,181   (9,208
             € million              million 
Currency retranslation reserve – movements during the year  2018   2017 

1 January

   (3,927   (3,034

Currency retranslation during the year

   (843   (50

Movement in net investment hedges and exchange differences in net investments in foreign operations

   77    (909

Recycled to income statement

   (71   66 

31 December

   (4,764   (3,927
STATEMENT OF COMPREHENSIVE INCOME: OTHER COMPREHENSIVE INCOME RECONCILIATION


             € million              million 
Fair value gains/(losses) on financial instruments – movement during the year  2018   2017 

1 January

   (189   (113

Equity instruments

   51     

Cash flow hedges

   (55   (68

Available for sale financial assets

       (8

31 December

   (193   (189

Refer to the consolidated statement of comprehensive income on page 75, the consolidated statement of changes in equity on page 76, and note 6C on page 96.


             € million              million 
Remeasurement of defined benefit pension plans net of tax  2018   2017 

1 January

   (1,171   (2,453

Movement during the year

   (328   1,282 

31 December

   (1,499   (1,171

Refer to the consolidated statement of comprehensive income on page 75, the consolidated statement of changes in equity on page 76, note 4B from page 87 to 92 and note 6C on page 96.


             € million              million 
Currency retranslation gains/(losses) – movement during the year  2018   2017 

1 January

   (4,278   (3,295

Currency retranslation during the year:


Other reserves

   (836   (903

Retained profit

   (10   (27

Non-controlling interest

   (15   (53

31 December

   (5,139   (4,278


Annual Report on Form 20-F 20172018 Financial Statements 117107


NOTES TO THE CONSOLIDATED FINANCIAL STATEMENTS

UNILEVER GROUPCONTINUED


15B. EQUITYCONTINUED

             € million             million 
Treasury shares – movements during the year  2017  2016 

1 January

   (4,164  (4,119

Repurchase of shares (see note 24)

   (5,014  - 

Other purchases and utilisations

   (30  (45

31 December

   (9,208  (4,164
   € million   million 
Currency retranslation reserve – movements during the year  2017  2016 

1 January

   (3,034  (3,285

Currency retranslation during the year

   (50  599 

Movement in net investment hedges and exchange differences in net investments in foreign operations

   (909  (365

Recycled to income statement

   66   17 

31 December

   (3,927  (3,034
STATEMENT OF COMPREHENSIVE INCOME: OTHER COMPREHENSIVE INCOME RECONCILIATION   
             € million             million 
Fair value gains/(losses) on financial instruments – movement during the year  2017  2016 

1 January

   (113  (98

Cash flow hedges

   (68  6 

Available for sale financial assets

   (8  (21

31 December

   (189  (113

Refer to the consolidated statement of comprehensive income on page 86, the consolidated statement of changes in equity on page 87, and note 6C on page 107.

             € million             million 
Remeasurement of defined benefit pension plans net of tax  2017  2016 

1 January

   (2,453  (1,473

Movement during the year

   1,282   (980

31 December

   (1,171  (2,453

Refer to the consolidated statement of comprehensive income on page 86, the consolidated statement of changes in equity on page 87, note 4B from page 98 to 103 and note 6C on page 107.

             € million             million 
Currency retranslation gains/(losses) – movement during the year  2017  2016 

1 January

   (3,295  (3,512

Currency retranslation during the year:


Other reserves

   (903  189 

Retained profit

   (27  17 

Non-controlling interest

   (53  11 

31 December

   (4,278  (3,295

118Financial StatementsAnnual Report on Form 20-F 2017


15C. FINANCIAL LIABILITIES


                  € million   € million           € million            million    million            million                 € million       € million       € million        million        million        million 
          Current     Non-current   Total   Current     Non-current   Total       Current   

Non-

current

   Total   Current   

Non-

current

   Total 
Financial liabilities(a)  Notes        2017   2017   2017   2016   2016   2016   Note     2018   2018   2018   2017   2017   2017 

Preference shares

       -    -    -    -    68    68 

Bank loans and overdrafts(b)

       513    479    992    899    247    1,146      525    289    814    513    479    992 

Bonds and other loans

       7,181    15,528    22,709    4,367    10,686    15,053      2,422    20,969    23,391    7,181    15,528    22,709 

Finance lease creditors

   20      11    120    131    9    134    143    20      13    115    128    11    120    131 

Derivatives

       86    335    421    175    10    185      126    276    402    86    335    421 

Other financial liabilities(c)

       177    -    177    -    -    -      149    1    150    177        177 
         7,968    16,462    24,430    5,450    11,145    16,595 
      3,235    21,650    24,885    7,968    16,462    24,430 


(a)

For the purposes of this note and note 17A, financial assets and liabilities exclude trade and other current receivables and trade payables and other liabilities which are covered in notes 13 and 14 respectively.

(b)

Financial liabilities include15 million (2016:(2017:21 million) of secured liabilities.

(c)

Includes options and other financial liabilities to acquirenon-controlling interests in Carver Korea and EAC Myanmar, refer to note 21.

RECONCILIATION OF LIABILITIES ARISING FROM FINANCING ACTIVITIES


       Non -Cash Movement           Non-cash movement    
      Business           Opening Cash Business Foreign Fair Other Closing 
  Opening Cash         Acquisitions/ Foreign Fair Other Closing       balance at     movement     acquisitions/     exchange value     movements balance at 
          balance at         Movement Disposals         exchange value         movements balance at   1 January   disposals changes         changes       31 December 
Movements in 2018 and 2017  € million € million € million € million € million € million € million 

2018

        
  1 January     changes         changes           31 December 

Bank loans and overdrafts(a)

   (992  158   (10  17      13   (814

Bonds and other loans(a)

   (22,709  (135     (543     (4  (23,391

Finance lease creditors

   (131  10      1      (8  (128

Derivatives

   (421           19      (402

Other financial liabilities

   (177  51      10   (4  (30  (150

Total

   (24,430  84   (10  (515  15   (29  (24,885
  € million € million € million € million € million € million € million 

2017


Preference shares

   (68  68   -   -   -   -   -    (68 68                

Bank loans and overdrafts(a)

   (1,146  66   (3  98   -   (7  (992   (1,146 66  (3 98     (7 (992

Bonds and other loans(a)

   (15,053  (9,008  -   1,346   (2  8   (22,709   (15,053 (9,008    1,346  (2 8  (22,709

Finance lease creditors

   (143  14   -   6   -   (8  (131   (143 14     6     (8 (131

Derivatives

   (185  -   -   -   (236  -   (421   (185          (236    (421

Other financial liabilities

   -   -   -   -   -   (177  (177

Other financial liabilities(a)

                 (177 (177

Total

   (16,595  (8,860  (3  1,450   (238  (184  (24,430   (16,595 (8,860 (3 1,450  (238 (184 (24,430

2016


Preference shares

   (68  -   -   -   -   -  (68

Bank loans and overdrafts(a)

   (1,064 (23  -  (42  -  (17 (1,146

Bonds and other loans(a)

   (12,703 (2,089  -  (190 (3 (68 (15,053

Finance lease creditors

   (195 35   -  21   -  (4 (143

Derivatives

   (124  -   -   -  (61  -  (185

Other financial liabilities(a)

   (489 289        200   - 

Total

   (14,643 (1,788  -  (211 (64 111  (16,595


(a)

These cash movements are included within the following lines in the consolidated cash flow statement: net change in short-term liabilities, additional financial liabilities and repayment of financial liabilities. The difference of12 million (2016:(2017:171 million) represents cash movements in overdrafts that are not included in financing cash flows.


Annual Report on Form 20-F 2017108 Financial Statements  119Annual Report on Form 20-F 2018


NOTES TO THE CONSOLIDATED FINANCIAL STATEMENTS

UNILEVER GROUPCONTINUED


15C. FINANCIAL LIABILITIESCONTINUED


ANALYSIS OF BONDS AND OTHER LOANS


             € million       million 
   Total  Total 
    2017  2016 
Unilever N.V.       

Floating Rate Notes 2018 ()

   750   749 

1.750% Bonds 2020 ()

   748   748 

0.500% Notes 2022 ()

   744   743 

1.375% Notes 2029 ()

   742   - 

1.125% Bonds 2028 ()

   693   692 

0.875% Notes 2025 ()

   646   - 

0.375% Notes 2023 ()

   598   - 

1.000% Notes 2027 ()

   597   - 

1.000% Notes 2023 ()

   497   496 

0.000% Notes 2021 ()

   496   - 

0.500% Notes 2024 ()

   493   492 

0.000% Notes 2020 ()

   299   299 

2.950% Notes 2017 (Renminbi)

   -   41 

Commercial paper

   3,655   819 

Total NV

   10,958   5,079 

Unilever PLC


4.750% Bonds 2017 (£)

   -   466 

1.125% Notes 2022 (£)

   390   - 

2.000% Notes 2018 (£)

   283(a)   294(a) 

1.375% Notes 2024 (£)

   280   - 

1.875% Notes 2029 (£)

   278   - 

Commercial paper

   -   373 

Total PLC

   1,231   1,133 

Other group companies


Switzerland


Other

   6   - 

United States


4.250% Notes 2021 (US$)

   834   950 

5.900% Bonds 2032 (US$)

   826   942 

2.900% Notes 2027 (US$)

   821   - 

2.200% Notes 2022 (US$)

   704   - 

1.800% Notes 2020 (US$)

   666   - 

4.800% Bonds 2019 (US$)

   627   714 

2.200% Notes 2019 (US$)

   625   711 

2.000% Notes 2026 (US$)

   575   655 

0.850% Notes 2017 (US$)

   -   524 

1.375% Notes 2021 (US$)

   456   519 

2.100% Notes 2020 (US$)

   416   474 

3.100% Notes 2025 (US$)

   413   470 

2.600% Notes 2024 (US$)

   413   - 

7.250% Bonds 2026 (US$)

   243   276 

6.625% Bonds 2028 (US$)

   190   216 

5.150% Notes 2020 (US$)

   129   149 

7.000% Bonds 2017 (US$)

   -   142 

5.600% Bonds 2097 (US$)

   76   87 

Commercial paper (US$)

   2,421   1,892 

Other countries

   79   120 

Total other group companies

   10,520   8,841 

Total bonds and other loans

   22,709   15,053 

             € million       million 
    Total 2018        Total 2017 
Unilever N.V.       

Floating Rate Notes 2018 ()

      750 

1.625% Notes 2033 ()

   791    

1.750% Bonds 2020 ()

   749   748 

0.500% Notes 2022 ()

   746   744 

1.375% Notes 2029 ()

   743   742 

1.125% Bonds 2027 ()

   696    

1.125% Bonds 2028 ()

   693   693 

0.875% Notes 2025 ()

   647   646 

0.500% Bonds 2025 ()

   642    

1.375% Notes 2030 ()

   642    

0.375% Notes 2023 ()

   599   598 

1.000% Notes 2027 ()

   598   597 

1.000% Notes 2023 ()

   497   497 

0.000% Notes 2021 ()

   497   496 

0.500% Notes 2023 ()

   497    

0.500% Notes 2024 ()

   494   493 

0.000% Notes 2020 ()

   300   299 

Commercial paper

      3,655 

Total NV

   9,831    10,958  

Unilever PLC


1.125% Notes 2022 (£)

   386   390 

2.000% Notes 2018 (£)(a)

      283 

1.375% Notes 2024 (£)

   276   280 

1.875% Notes 2029 (£)

   274   278 

Total PLC

   936   1,231 

Other group companies


Switzerland


Other

   10   6 

United States


4.250% Notes 2021 ($)

   873   834 

5.900% Bonds 2032 ($)

   865   826 

2.900% Notes 2027 ($)

   860   821 

2.200% Notes 2022 ($)

   738   704 

1.800% Notes 2020 ($)

   698   666 

3.500% Notes 2028 ($)

   687    

4.800% Bonds 2019 ($)

   656   627 

2.200% Notes 2019 ($)

   655   625 

2.000% Notes 2026 ($)

   602   575 

1.375% Notes 2021 ($)

   478   456 

3.125% Notes 2023 ($)

   477    

2.100% Notes 2020 ($)

   436   416 

3.000% Notes 2022 ($)

   434    

3.250% Notes 2024 ($)

   433    

3.100% Notes 2025 ($)

   432   413 

2.600% Notes 2024 ($)

   432   413 

3.500% Bonds 2028 ($)

   431    

2.750% Bonds 2021 ($)

   348    

3.375% Notes 2025 ($)

   302    

7.250% Bonds 2026 ($)

   254   243 

6.625% Bonds 2028 ($)

   200   190 

5.150% Notes 2020 ($)

   134   129 

5.600% Bonds 2097 ($)

   80   76 

Commercial paper ($)

   1,070   2,421 

Other countries

   39   79 

Total other group companies

   12,624   10,520 

Total bonds and other loans

   23,391   22,709 
(a) 

Of which2 million (2016:Nil (2017:32 million) relates to a fair value adjustment following the fair value hedge accounting of afixed-for-floating interest rate swap.

Information in relation to the derivatives used to hedge bonds and other loans within a fair value hedge relationship is shown in note 16.


120Annual Report on Form 20-F 2018 Financial Statements Annual Report on Form 20-F 2017109


NOTES TO THE CONSOLIDATED FINANCIAL STATEMENTS

UNILEVER GROUPCONTINUED


16. TREASURY RISK MANAGEMENT


DERIVATIVES AND HEDGE ACCOUNTING

Derivatives are measured at fair value with any related transaction costs expensed as incurred. The treatment of changes in the value of derivatives depends on their use as explained below.

(I) FAIR VALUE HEDGES(a)

Certain derivatives are held to hedge the risk of changes in value of a specific bond or other loan. In these situations, the Group designates the liability and related derivative to be part of a fair value hedge relationship. The carrying value of the bond is adjusted by the fair value of the risk being hedged, with changes going to the income statement. Gains and losses on the corresponding derivative are also recognised in the income statement. The amounts recognised are offset in the income statement to the extent that the hedge is effective. When the relationship no longer meets the criteria for hedge accounting, the fair value hedge adjustment made to the bond is amortised to the income statement using the effective interest method.

(II) CASH FLOW HEDGES(a)

Derivatives are also held to hedge the uncertainty in timing or amount of future forecast cash flows. Such derivatives are classified as being part of cash flow hedge relationships. For an effective hedge, gains and losses from changes in the fair value of derivatives are recognised in equity. Cost of hedging, where material and opted for, is recorded in a separate account within equity. Any ineffective elements of the hedge are recognised in the income statement. If the hedged cash flow relates to anon-financial asset, the amount accumulated in equity is subsequently included within the carrying value of that asset. For other cash flow hedges, amounts deferred in equity are taken to the income statement at the same time as the related cash flow.

When a derivative no longer qualifies for hedge accounting, any cumulative gain or loss remains in equity until the related cash flow occurs. When the cash flow takes place, the cumulative gain or loss is taken to the income statement. If the hedged cash flow is no longer expected to occur, the cumulative gain or loss is taken to the income statement immediately.

(III) NET INVESTMENT HEDGES(a)

Certain derivatives are designated as hedges of the currency risk on the Group’s investment in foreign subsidiaries. The accounting policy for these arrangements is set out in note 1.

(IV) DERIVATIVES FOR WHICH HEDGE ACCOUNTING IS NOT APPLIED

Derivatives not classified as hedges are held in order to hedge certain balance sheet items and commodity exposures. No hedge accounting is applied to these derivatives, which are carried at fair value with changes being recognised in the income statement.


(a) 

Applying hedge accounting has not led to material ineffectiveness being recognised in the income statement for both 20172018 and 2016.2017.

The Group is exposed to the following risks that arise from its use of financial instruments, the management of which is described in the following sections:

liquidity risk (see note 16A);

market risk (see note 16B); and

credit risk (see note 17B).

16A. MANAGEMENT OF LIQUIDITY RISK

Liquidity risk is the risk that the Group will face in meeting its obligations associated with its financial liabilities. The Group’s approach to managing liquidity is to ensure that it will have sufficient funds to meet its liabilities when due without incurring unacceptable losses. In doing this, management considers both normal and stressed conditions. A material and sustained shortfall in our cash flow could undermine the Group’s credit rating, impair investor confidence and also restrict the Group’s ability to raise funds.

The Group maintained a cautious funding strategy. This was the result of cash delivery from the business, coupled with the proceeds from bond issuances. This cash has been invested conservatively with low risk counter-parties at maturities of less than six months.

Cash flow from operating activities provides the funds to service the financing of financial liabilities on aday-to-day basis. The Group seeks to manage its liquidity requirements by maintaining access to global debt markets through short-term and long-term debt programmes. In addition, Unilever has committed credit facilities for general corporate use.

On 31 December 20172018 Unilever had undrawn revolving364-day bilateral credit facilities in aggregate of US$7,865$7,865 million (2016: US$6,550(2017: $7,865 million) with a364-day term out. As part of the regular annual process, the intention is that these facilities will again be renewed in 2018. In addition, Unilever had undrawn revolving364-day bilateral credit facilities in aggregate of4,000 million (2016: nil)2019.


Annual Report on Form 20-F 2017110 Financial Statements  121Annual Report on Form 20-F 2018


NOTES TO THE CONSOLIDATED FINANCIAL STATEMENTS

UNILEVER GROUPCONTINUED


16A. MANAGEMENT OF LIQUIDITY RISKCONTINUED


The following table shows Unilever’s contractually agreed undiscounted cash flows, including expected interest payments, which are payable under financial liabilities at the balance sheet date:


     € million   € million   € million   € million   € million   € million   € million   € million       € million   € million   € million   € million   € million   € million   € million   € million 
                                 Net                                   Net 
                                 carrying                                   carrying 
         Due   Due   Due   Due           amount as           Due   Due   Due   Due           amount as 
     Due   between   between   between   between   Due       shown in       Due   between   between   between   between   Due       shown in 
     within   1 and   2 and   3 and   4 and   after       balance       within   1 and   2 and   3 and   4 and   after       balance 
Undiscounted cash flows  Notes      1 year   2 years   3 years   4 years   5 years   5 years   Total   sheet   Note   1 year   2 years   3 years   4 years   5 years   5 years   Total   sheet 

2017


2018


Non-derivative financial liabilities:


Preference shares

     -    -    -    -    -    -    -    - 

Bank loans and overdrafts

     (522   (221   (1   (1   (260   -    (1,005   (992     (529   (12   (1   (278           (820   (814

Bonds and other loans

     (7,558   (1,577   (2,546   (2,026   (2,058   (9,953   (25,718   (22,709     (2,888   (2,748   (2,572   (2,646   (2,387   (14,090   (27,331   (23,391

Finance lease creditors

  20       (20   (18   (17   (16   (17   (118   (206   (131   20    (20   (19   (18   (17   (17   (96   (187   (128

Other financial liabilities

     (177   -    -    -    -    -    (177   (177     (149   (1                   (150   (150

Trade payables, accruals and other liabilities

  14       (12,861   (215           (13,076   (13,076   14      (13,945   (140   (10   (5   (4   (14   (14,118   (14,118

Deferred consideration

     (26   (36   (27   (515   (3   (9   (616   (511     (14   (79   (70   (6       (45   (214   (187
     (21,164   (2,067   (2,591   (2,558   (2,338   (10,080   (40,798   (37,596
     (17,545   (2,999   (2,671   (2,952   (2,408   (14,245   (42,820   (38,788

Derivative financial liabilities:


Interest rate derivatives:


Derivative contracts – receipts

     349    64    727    51    754    1,380    3,325        67    760    163    788    37    1,406    3,221   

Derivative contracts – payments

     (319   (19   (753   (19   (797   (1,440   (3,347  

Foreign exchange derivatives:


Derivative contracts – receipts

     24,935              24,935   

Derivative contracts – payments

     (25,258             (25,258  

Commodity derivatives:


Derivative contracts – receipts


Derivative contracts – payments

     (19                  (19        (23   (756   (138   (797   (17   (1,423   (3,154  
     (312   45    (26   32    (43   (60   (364   (534

Foreign exchange derivatives:


Derivative contracts – receipts

     17,108                        17,108   

Derivative contracts – payments

     (17,317                       (17,317  

Commodity derivatives:


Derivative contracts – receipts


Derivative contracts – payments

     (74                       (74   
     (239   4    25    (9   20    (17   (216   (542

Total

      (21,476   (2,022   (2,617   (2,526   (2,381   (10,140   (41,162   (38,130      (17,784   (2,995   (2,646   (2,961   (2,388   (14,262   (43,036   (39,330

2016


2017


Non-derivative financial liabilities:


Preference shares

     (4   (4   (4   (4   (4   (72   (92   (68                                  

Bank loans and overdrafts

     (909   (4   (243   -    -    -    (1,156   (1,146     (522   (221   (1   (1   (260       (1,005   (992

Bonds and other loans

     (4,700   (1,335   (1,669   (1,882   (1,634   (6,733   (17,953   (15,053     (7,558   (1,577   (2,546   (2,026   (2,058   (9,953   (25,718   (22,709

Finance lease creditors

  20       (24   (18   (18   (17   (16   (127   (220   (143   20    (20   (18   (17   (16   (17   (118   (206   (131

Other financial liabilities

     -    -    -    -    -    -    -    -      (177                       (177   (177

Trade payables, accruals and other liabilities

  14       (13,252   (224   -    -    -    -    (13,476   (13,476   14    (12,861   (215                   (13,076   (13,076

Deferred consideration

     (151   (114   (24   -    (490   (10   (789   (594     (26   (36   (27   (515   (3   (9   (616   (511
     (19,040   (1,699   (1,958   (1,903   (2,144   (6,942   (33,686   (30,480
     (21,164   (2,067   (2,591   (2,558   (2,338   (10,080   (40,798   (37,596

Derivative financial liabilities:


Interest rate derivatives:


Derivative contracts – receipts

     56    420    -    -    -    -    476        349    64    727    51    754    1,380    3,325   

Derivative contracts – payments

     (70   (429   -    -    -    -    (499  

Foreign exchange derivatives:


Derivative contracts – receipts

     9,263    -    -    -    -    -    9,263   

Derivative contracts – payments

     (9,580   -    -    -    -    -    (9,580  

Commodity derivatives:


Derivative contracts – receipts

     -    -    -    -    -    -    -   

Derivative contracts – payments

     (3   -    -    -    -    -    (3        (319   (19   (753   (19   (797   (1,440   (3,347  
     (334   (9   -    -    -    -    (343   (331

Foreign exchange derivatives:


Derivative contracts – receipts

     24,935                        24,935   

Derivative contracts – payments

     (25,258                       (25,258  

Commodity derivatives:


Derivative contracts – receipts


Derivative contracts – payments

     (19                       (19   
     (312   45    (26   32    (43   (60   (364   (534

Total

      (19,374   (1,708   (1,958   (1,903   (2,144   (6,942   (34,029   (30,811      (21,476   (2,022   (2,617   (2,526   (2,381   (10,140   (41,162   (38,130


122Annual Report on Form 20–F 2018 Financial Statements Annual Report on Form 20-F 2017111


NOTES TO THE CONSOLIDATED FINANCIAL STATEMENTS

UNILEVER GROUPCONTINUED


16A. MANAGEMENT OF LIQUIDITY RISKCONTINUED


The following table shows cash flows for which cash flow hedge accounting is applied. The derivatives in the cash flow hedge relationships are expected to have an impact on profit and loss in the same periods as the cash flows occur.


  € million   € million   € million   € million     € million   € million   € million € million   € million   € million   € million �� € million   € million   € million   € million   € million 
                  Net     Due Due Due Due     Net carrying 
    Due Due Due   Due     carrying   Due between between between between Due   amount of 
  Due between between between   between Due   amount of   within 1 and 2 and 3 and 4 and after   related 
  within 1 and 2 2 and 3 3 and 4   4 and 5 after   related    1 year  2 years  3 years  4 years  5 years  5 years  Total   derivatives(a)  

2018


Foreign exchange cash inflows

   3,426                 3,426    

Foreign exchange cash outflows

   (3,435                (3,435 14 

Interest rate swaps cash inflows

   103  795  433  1,158  525  1,406  4,420    

Interest rate swaps cash outflows

   (23 (756 (347 (1,147 (464 (1,423 (4,160 (199

Commodity contracts cash flows

   (74                (74 (74
   1 year   years   years   years    years   5 years   Total   derivatives(a) 

2017


Foreign exchange cash inflows

   3,510   -   -   -    -   -   3,510     3,510                  3,510    

Foreign exchange cash outflows

   (3,536  -   -   -    -   -   (3,536  (8   (3,536                 (3,536  (8

Interest rate cash flows

   30   45   (26  31    (44  (60  (24  (351

Interest rate swaps cash inflows

   349   64   727   50   753   1,380   3.323    

Interest rate swaps cash outflows

   (319  (19  (753  (19  (797  (1,440  (3,347  (351

Commodity contracts cash flows

   (19  -   -   -    -   -   (19  (7   (19                 (19  (7

2016


Foreign exchange cash inflows

   2,863   -   -   -    -   -  2,863  

Foreign exchange cash outflows

   (2,905  -   -   -    -   -  (2,905 (40

Interest rate cash flows

   4  (6  -   -    -   -  (2  - 

Commodity contracts cash flows

   (3  -   -   -    -   -  (3 18 


(a)

See note 16C.

16B. MANAGEMENT OF MARKET RISK

Unilever’s size and operations result in it being exposed to the following market risks that arise from its use of financial instruments:

commodity price risk;

currency risk; and

interest rate risk.

The above risks may affect the Group’s income and expenses, or the value of its financial instruments. The objective of the Group’s management of market risk is to maintain this risk within acceptable parameters, while optimising returns. Generally, the Group applies hedge accounting to manage the volatility in profit and loss arising from market risk.

The Group’s exposure to, and management of, these risks is explained below. It often includes derivative financial instruments, the uses of which are described in note 16C.


POTENTIAL IMPACT OF RISK


MANAGEMENT POLICY AND

HEDGING STRATEGY


SENSITIVITY TO THE RISK


(I) COMMODITY PRICE RISK

The Group is exposed to the risk of changes in commodity prices in relation to its purchase of certain raw materials.


At 31 December 2017,2018, the Group had hedged its exposure to future commodity purchases with commodity derivatives valued at382580 million (2016:(2017:441382 million).


The Group uses commodity forward contracts to hedge against this risk. All commodity forward contracts hedge future purchases of raw materials and the contracts are settled either in cash or by physical delivery.


Commodity derivatives are generally designated as hedging instruments in cash flow hedge accounting relations. All commodity forward contracts are done in line with approvals from the Global Commodity Executive which is chaired by the Unilever Chief Supply Chain Officer (CSCO).


A 10% increase in commodity prices as at 31 December 20172018 would have led to a3851 million gain on the commodity derivatives in the cash flow hedge reserve (2016:(2017:4638 million gain in the cash flow hedge reserve). A decrease of 10% in commodity prices on a full-yearfull–year basis would have the equal but opposite effect.


(II) CURRENCY RISK

Currency risk on sales, purchases andborrowings

Because of Unilever’s global reach, it is subject to the risk that changes in foreign currency values impact the Group’s sales, purchases and borrowings.


At 31 December 2017,2018, the exposure to the Group from companies holding financial assets and liabilities other than in their functional currency amounted to45105 million (2016:(2017:7645 million).


The Group manages currency exposures within prescribed limits, mainly through the use of forward foreign currency exchange contracts.


Operating companies manage foreign exchange exposures within prescribed limits. Local compliance is monitored centrally.


Exchange risks related to the principal amounts of the US$and Swiss franc denominated debt either form part of hedging relationships themselves, or are hedged through forward contracts.


The aim of the Group’s approach to management of currency risk is to leave the Group with no material residual risk. This aim has been achieved in all years presented.


As an estimation of the approximate impact of the residual risk, with respect to financial instruments, the Group has calculated the impact of a 10% change in exchange rates.


Impact on income statement

A 10% strengthening of the euro against key currencies to which the Group is exposed would have led to approximately an additional511 million gain in the income statement (2016:(2017:75 million gain). A 10% weakening of the euro against these currencies would have led to an equal but opposite effect.


Annual Report on Form 20-F 2017112 Financial Statements  123Annual Report on Form 20-F 2018


NOTES TO THE CONSOLIDATED FINANCIAL STATEMENTS

UNILEVER GROUPCONTINUED


16B. MANAGEMENT OF MARKET RISKCONTINUED


POTENTIAL IMPACT OF RISK


MANAGEMENT POLICY AND

HEDGING STRATEGY


SENSITIVITY TO THE RISK


Currency risk on the Group’s net investments

The Group is also subject to exchange risk in relation to the translation of the net investments of its foreign operations into euros for inclusion in its consolidated financial statements.


These net investments include Group financial loans, which are monetary items that form part of our net investment in foreign operations, of7.37.5 billion (2016:(2017:7.97.3 billion), of which3.43.3 billion (2016:(2017:3.53.4 billion) is denominated in GBP. In accordance with IAS 21, the exchange differences on these financial loans are booked through reserves.


Part of the currency exposure on the Group’s investments is also managed using US$ and Swiss franc net investment hedges with a nominal value of3.94.4 billion (2016:(2017:3.53.9 billion) for US$ and(1.1)(1.3) billion (2016:(2017:(0.9))(1.1) billion) for Swiss francs.


At 31 December 2017,2018, the net exposure of the net investments in foreign currencies amounts to16.214.5 billion (2016:(2017:11.116.2 billion).


Unilever aims to minimise this foreign investment exchange exposure by borrowing in local currency in the operating companies themselves. In some locations, however, the Group’s ability to do this is inhibited by local regulations, lack of local liquidity or by local market conditions.


Where the residual risk from these countries exceeds prescribed limits, Treasury may decide on acase-by-case basis to actively hedge the exposure. This is done either through additional borrowings in the related currency, or through the use of forward foreign exchange contracts.


Where local currency borrowings, or forward contracts, are used to hedge the currency risk in relation to the Group’s net investment in foreign subsidiaries, these relationships are designated as net investment hedges for accounting purposes.


Impact on equity – trade-related cash flow hedges

A 10% strengthening of the euro against other currencies would have led to a191146 million (2016:17 million) loss (of(out of which13993 million loss would relate to strengthening against US Dollar (2016:Dollar) [2017:51210 million (out of which152 million loss would relate to strengthening against sterling)US Dollar)] on hedges used to cover future trade cash flows to which cash flow hedge accounting is applied.

A 10% weakening of the euro against other currencies would have led to a210 million (2016:19 million) gain (out of which152 million gain would relate to strengthening against US Dollar (2016:56 million gain would relate to strengthening against sterling) on hedges used to cover future trade cash flows to which cash flow hedge accounting is applied.an equal but opposite effect.


Impact on equity – net investment hedges

A 10% strengthening of the euro against other currencies would have led to a251312 million (2016:(2017:242277 million) loss on the net investment hedges used to manage the currency exposure on the Group’s investments.

A 10% weakening of the euro against other currencies would have led to a277 million (2016:295 million) gain on the net investment hedges used to manage the currency exposure on the Group’s investments.an equal but opposite effect.


Impact on equity – net investments in group companies

A 10% strengthening of the euro against all other currencies would have led to a1,4721,455 million negative retranslation effect (2016:(2017:1,0081,619 million negative retranslation effect). A 10% weakening of the euro against those currencies would have led to a1,619 million positive retranslation effect (2016:1,232 million positive retranslation effect).an equal but opposite effect. In line with accepted hedge accounting treatment and our accounting policy for financial loans, the retranslation differences would be recognised in equity.


(III) INTEREST RATE RISK(a)

The Group is exposed to market interest rate fluctuations on its floating rate debt. Increases in benchmark interest rates could increase the interest cost of our floating-rate debt and increase the cost of future borrowings. The Group’s ability to manage interest costs also has an impact on reported results.


Taking into account the impact of interest rate swaps, at 31 December 2017,2018, interest rates were fixed on approximately 76%99% of the expected net debt for 2019, and 85% for 2020 (76% for 2018 and 63% for 2019 (81% for 2017 and 71% for 2018 at 31 December 2016)2017).


For interest management purposes, transactions with a maturity shorter than six months from inception date are not included as fixed interest transactions.


The average interest rate on short-term borrowings in 20172018 was 0.9% (2016:(2017: 0.9%).


Unilever’s interest rate management approach aims for an optimal balance between fixed and floating-rate interest rate exposures on expected net debt. The objective of this approach is to minimise annual interest costs after tax and to reduce volatility.


This is achieved either by issuing fixed or floating-rate long-term debt, or by modifying interest rate exposure through the use of interest rate swaps.


Furthermore, Unilever has interest rate swaps for which cash flow hedge accounting is applied.


Impact on income statement

Assuming that all other variables remain constant, a 1.01 percentage point increase in floating interest rates on a full-year basis as at 31 December 20172018 would have led to an additional41million8 million of finance costs (2016:income (2017:1141 million additional finance costs).

A 1.01 percentage point decrease in floating interest rates on a full-year basis would have an equal but opposite effect.


Impact on equity – cash flow hedges

Assuming that all other variables remain constant, a 1.01 percentage point increase in floating interest rates on a full-year basis as at 31 December 20172018 would have led to an additional2317 million credit in equity from derivatives in cash flow hedge relationships (2016:(2017:123 million debit)credit).

A 1.01 percentage point decrease in floating interest rates on a full-year basis would have led to an additional2819 million debit in equity from derivatives in cash flow hedge relationships (2016:(2017:128 million credit)debit).


(a) 

See the weighted average amount of net debt with fixed rate interest shown in the following table.


124Annual Report on Form 20-F 2018 Financial Statements Annual Report on Form 20-F 2017113


NOTES TO THE CONSOLIDATED FINANCIAL STATEMENTS

UNILEVER GROUPCONTINUED


16B. MANAGEMENT OF MARKET RISKCONTINUED


The following table shows the split in fixed and floating-rate interest exposures, taking into account the impact of interest rate swaps and cross-currency swaps:


          € million
2017
          million
2016
           € million
2018
          million
2017
 

Cash and cash equivalents

   3,317  3,382    3,230  3,317 

Current other financial assets

   770  599    874  770 

Current financial liabilities

   (7,968 (5,450   (3,235 (7,968

Non-current financial liabilities

   (16,462 (11,145   (21,650 (16,462

Net debt

   (20,343 (12,614   (20,781 (20,343

Of which:


Fixed rate (weighted average amount of fixing for the following year)

   (16,216 (11,539   (21,586 (16,216

16C. DERIVATIVES AND HEDGING

The Group does not use derivative financial instruments for speculative purposes. The uses of derivatives and the related values of derivatives are summarised in the following table. Derivatives used to hedge:


  € million         € million € million         € million € million € million 
  

Trade      

and other      
receivables      

   Financial
assets
 

Trade      
payables      

and other      
liabilities      

   Current
financial
liabilities
 Non-
current
financial
liabilities
 Total 

31 December 2018


Foreign exchange derivatives


Fair value hedges

   –             –                 
     

Cash flow hedges

   39             (25)              14 
     

Hedges of net investments in foreign operations

   –          58(a)    –          (21)(a)      37 
     

Hedge accounting not applied

   42          67(a)    (41)        (105)(a)      (37
     

Cross-currency Interest rate swaps


Fair value hedges

   –             –                 
     

Cash flow hedges

   –          69   –             (268  (199
     

Hedge accounting not applied

   –             –             (8  (8
     

Commodity contracts


Cash flow hedges

   –             (74)              (74
     

Hedge accounting not applied

   1             –                1 
     
   82          194   (140)        (126  (276  (266
  € million   € million   € million   € million € million   € million      
  

Trade

and other
receivables

   Financial
assets
   

Trade

Payables

and other
liabilities

   Current
financial
liabilities
 

Non-

current
financial
liabilities

   Total    Total assets    276   Total liabilities   (542  (266
                   

31 December 2017


Foreign exchange derivatives including cross currency swaps


Foreign exchange derivatives


Fair value hedges

   -          -     -          -   -     -    –             –                 
     

Cash flow hedges

   32          -     (40)        -   -     (8   32             (40)              (8
     

Hedges of net investments in foreign operations

   -          9     -          (103)(a)   -     (94   –          9(a)    –          (103)(a)      (94
     

Hedge accounting not applied

   13          73     (54)        35(a)   -     67    13          73(a)    (54)        35(a)       67 

Interest rate swaps


Cross-currency Interest rate swaps


Fair value hedges

   -          2     -          -   -     2    –          2   –                2 
     

Cash flow hedges

   -          2     -          (18 (335    (351   –          2   –          (18 (335  (351
     

Hedge accounting not applied

   -          30     -          -   -     30    –          30   –                30 
     

Commodity contracts


Cash flow hedges

   12          -     (19)        -   -     (7   12             (19)              (7
     

Hedge accounting not applied

   -          -      -          -   -      -    –             –                 
   57          116      (113)        (86 (335     (361      
   Total assets    173     Total liabilities (534    (361   57          116   (113)        (86 (335  (361
                     
                Total assets    173   Total liabilities     (534  (361

31 December 2016


Foreign exchange derivatives including cross currency swaps


Fair value hedges

   -          -     -          -   -     - 

Cash flow hedges

   36          -     (76)        -   -     (40

Hedges of net investments in foreign operations

   -          174(a)     -          (27  -     147 

Hedge accounting not applied

   79          (133)(a)     (67)        (134  -     (255

Interest rate swaps


Fair value hedges

   -          3     -          -   -     3 

Cash flow hedges

   -          4     -          -   (4    - 

Hedge accounting not applied

   -          43     -          (14  (6    23 

Commodity contracts


Cash flow hedges

   21          -     (3)        -   -     18 

Hedge accounting not applied

   (1)         -      -          -   -      (1
   135          91      (146)        (175  (10     (105
   Total assets    226     Total liabilities   (331    (105


(a) 

Swaps that hedge the currency risk on intra-group loans and offset(103) million of financial assets (2016:174 million) within ‘Hedges of net investments in foreign operations’ are included within ‘Hedge accounting not applied’. See below for further details.


Annual Report on Form 20-F 2017114 Financial Statements  125Annual Report on Form 20-F 2018


NOTES TO THE CONSOLIDATED FINANCIAL STATEMENTS

UNILEVER GROUPCONTINUED


16C. DERIVATIVES AND HEDGINGCONTINUED


MASTER NETTING OR SIMILAR AGREEMENTS

A number of legal entities within our Group enter into derivative transactions under International Swap and Derivatives Association (ISDA) master netting agreements. In general, under such agreements the amounts owed by each counter-party on a single day in respect of all transactions outstanding in the same currency are aggregated into a single net amount that is payable by one party to the other. In certain circumstances, such as when a credit event such as a default occurs, all outstanding transactions under the agreement are terminated, the termination value is assessed and only a single net amount is payable in settlement of all transactions.

The ISDA agreements do not meet the criteria for offsetting the positive and negative values in the consolidated balance sheet. This is because the Group does not have any currently legally enforceable right to offset recognised amounts, between various Group and bank affiliates, because the right to offset is enforceable only on the occurrence of future credit events such as a default.

The column ‘Related amounts not set off in the balance sheet – Financial instruments’ shows the netting impact of our ISDA agreements, assuming the agreements are respected in the relevant jurisdiction.

(A)(I) FINANCIAL ASSETS

The following financial assets are subject to offsetting, enforceable master netting arrangements and similar agreements.


       Related amounts not set          Related amounts not set   
        off in the balance sheet            off in the balance sheet    
 € million € million € million € million € million € million  € million € million € million € million € million € million 
   Gross amounts of          

Gross

amounts of
recognised


Gross

amounts of
recognised
financial

assets set

off in the


Net amounts
of financial
assets

presented

in the

   Cash   
As at 31 December 2018 

financial

assets


balance

sheet


balance

sheet


Financial

instruments

 collateral
received
 Net amount 

Derivative financial assets

  339   (63  276   (164  (10  102 

As at 31 December 2017


Derivative financial assets

 276  (103 173  (108 (6 59 

(II) FINANCIAL LIABILITIES

The following financial liabilities are subject to offsetting, enforceable master netting arrangements and similar agreements.

(II) FINANCIAL LIABILITIES

The following financial liabilities are subject to offsetting, enforceable master netting arrangements and similar agreements.


   recognised Net amounts of              Related amounts not set   
 Gross amounts financial assets financial assets   Cash           off in the balance sheet    
 of recognised set off in the presented in the Financial collateral    € million € million € million € million € million € million 
As at 31 December 2017 financial assets balance sheet balance sheet instruments received Net amount 

Derivative financial assets

  276   (103  173   (108  (6  59 

As at 31 December 2016


Derivative financial assets

 400  (174 226  (147  -  79 

(B) FINANCIAL LIABILITIES

 
The following financial liabilities are subject to offsetting, enforceable master netting arrangements and similar agreements. 


Related amounts not set

   
        off in the balance sheet    
 € million € million € million € million € million € million 
   Gross amounts of         
   recognised Net amounts of       
 Gross amounts financial liabilities financial liabilities   Cash   
As at 31 December 2018 

Gross

amounts of
recognised
financial

liabilities


Gross

amounts of
recognised
financial

liabilities set
off in the
balance
sheet


Net amounts

of financial

liabilities
presented

in the
balance
sheet

 Financial
instruments
 Cash
collateral
pledged
 Net amount 

Derivative financial liabilities

  (605  63   (542  164      (378
 of recognised set off in the presented in the Financial collateral   
As at 31 December 2017 financial liabilities balance sheet balance sheet instruments pledged Net amount             

Derivative financial liabilities

  637   (103  534   (108  -   426  (637 103  (534 108     (426

As at 31 December 2016


Derivative financial liabilities

 505  (174 331  (147  -  184 

Annual Report on Form 20-F 2018Financial Statements115


NOTES TO THE CONSOLIDATED FINANCIAL STATEMENTS

UNILEVER GROUPCONTINUED


17. INVESTMENT AND RETURN


CASH AND CASH EQUIVALENTS

Cash and cash equivalents in the balance sheet include deposits, investments in money market funds and highly liquid investments.

To be classified as cash and cash equivalents, an asset must:


be readily convertible into cash;


have an insignificant risk of changes in value; and


have a maturity period of three months or less at acquisition.


Cash and cash equivalents in the cash flow statement also include bank overdrafts and are recorded at amortised cost.

OTHER FINANCIAL ASSETS

OtherThe Group classifies its financial assets into the following measurement categories:

those to be measured subsequently at fair value (either through other comprehensive income, or through profit or loss), and

those to be measured at amortised cost.

This classification depends on our business model for managing the financial asset and the contractual terms of the cash flows.

At initial recognition, the Group measures a financial asset at its fair value plus, in the case of a financial asset not at fair value through profit or loss, transaction costs that are directly attributable to the acquisition of the financial asset. Transaction costs of financial assets carried at fair value through profit or loss are expensed in profit or loss.

All financial assets are first recognisedeither debt instruments or equity instruments. Debt instruments are those that provide the Group with a contractual right to receive cash or another asset. Equity instruments are those where the Group has no contractual right to receive cash or another asset.

Debt instruments

The subsequent measurement of debt instruments depends on the trade date. AtGroups business model for managing the asset and the cash flow characteristics of the asset. There are three measurement categories that point, theydebt instruments are classified as:

  held-to-maturity investments;

amortised cost;

 
  loans and receivables;

financial assets at fair value through other comprehensive income; or

 
  available-for-sale financial assets; or

financial assets at fair value through profit or loss.


126Financial StatementsAnnual Report on Form 20-F 2017


17. INVESTMENT AND RETURNCONTINUED(I) Amortised cost

(I)HELD-TO-MATURITY INVESTMENTS

TheseAssets measured at amortised cost are assets with setthose which are held to collect cash flows and fixed maturities which Unilever intends to hold to maturity. They are heldon the repayment of principal or interest. A gain or loss on a debt investment recognised at amortised cost plus interestonde-recognition or impairment is recognised in profit or loss. Interest income is recognised within finance income using the effective interest method, less any impairment.rate method.

(II) LOANS AND RECEIVABLESFair value through other comprehensive income

TheseAssets that are assets with an established payment profile and which are not listed on a recognised stock exchange. They are initially recognisedheld at fair value through other comprehensive income are those that are held to collect cash flows on the repayment of principal and interest or which are held to recognise a capital gain through the sale of the asset. Movements in the carrying amount are recognised in other comprehensive income except for the recognition of impairment, interest income and foreign exchange gains or losses which are recognised in profit or loss. Onde-recognition, the cumulative gain or loss recognised in other comprehensive income is usuallyreclassified from equity to profit or loss. Interest income is included in finance income using the original invoice amount plus any directly related transaction costs. Afterwards, loans and receivables are carried ateffective interest rate method.

(III) Fair value through profit or loss

Assets that do not meet the criteria for either amortised cost less any impairment.

(III)AVAILABLE-FOR-SALE FINANCIAL ASSETS

Any financial assets not classifiedor fair value through other comprehensive income are measured as either loans and receivables or financial assets at fair value through profit or loss orheld-to-maturity investments are designated asavailable-for-sale. They are initially recognised at fair value, usually the original invoice amount plus any directly related transaction costs. Afterwards, they are measured at fair value with changes being recognised in equity. When the investment is sold or impaired, the accumulated gains and losses are moved from equity to the income statement. Interest and dividends from these assets are recognised in the income statement.

(IV) FINANCIAL ASSETS AT FAIR VALUE THROUGH PROFIT OR LOSS

These are derivatives and assets that are held for trading.loss. Related transaction costs are expensed as incurred. Unless they form part of a hedging relationship, these assets are held at fair value, with changes being recognised in the income statement. Interest income from these assets is included within finance income.

Equity instruments

The Group subsequently measures all equity instruments at fair value. Where the Group has elected to present fair value gains and losses on equity investments in other comprehensive income, there is no subsequent reclassification of fair value gains or losses to profit or loss. Dividends from these investments continue to be recognised in profit or loss.

IMPAIRMENT OF FINANCIAL ASSETS

Each year,Financial instruments classified as amortised cost and debt instruments classified as fair value through other comprehensive income are assessed for impairment. The Group assesses the Group assessesprobability of default of an asset at initial recognition and then whether there has been a significant increase in credit risk on an ongoing basis.

To assess whether there is evidence that financial assets are impaired. Aa significant increase in credit risk the Group compares the risk of a default occurring on the asset as at the reporting date with the risk of default as at the date of initial recognition. It considers available reasonable and supportive forwarding-looking information. Macroeconomic information (such as market interest rates or prolonged fall in value below the cost of an asset generally indicates that an asset may be impaired. If impaired, financialgrowth rates) is also considered

Financial assets are written downoff when there is no reasonable expectation of recovery, such as a debtor failing to their estimated recoverable amount.engage in a repayment plan with the company. Impairment losses on assets classified as loans and receivablesamortised cost are recognised in profit andor loss. When a later event causes the impairment losses to decrease, the reduction in impairment loss is also recognised in profit andor loss. ImpairmentPermanent impairment losses on assetsdebt instruments classified asavailable-for-sale fair value through other comprehensive income are recognised by moving the loss accumulated in equity to the income statement. Any subsequent recovery in value of anavailable-for-sale debt security is recognised within profit andor loss. However, any subsequent recovery in value of an equity security is recognised within equity, and is recorded at amortised cost.

116Financial StatementsAnnual Report on Form 20-F 2018


17. INVESTMENT AND RETURNCONTINUED

17A. FINANCIAL ASSETS

The Group’s Treasury function aims to protect the Group’s financial investments, while maximising returns. The fair value of financial assets is the same as the carrying amount for 20172018 and 2016.2017. The Group’s cash resources and other financial assets are shown below.


          € million       € million       € million        million        million        million           € million       € million       € million        million        million        million 
      Non-           Non-           Non-           Non-     
  Current   current   Total   Current   current   Total   Current   current   Total   Current   current   Total 
Financial assets(a)  2017   2017   2017   2016   2016   2016   2018   2018   2018   2017   2017   2017 

Cash and cash equivalents


Cash at bank and in hand

   1,904    -    1,904    1,779    -    1,779    2,174        2,174    1,904        1,904 

Short-term deposits with maturity of less than three months

   1,333    -    1,333    1,513    -    1,513    1,024        1,024    1,333        1,333 

Other cash equivalents

   80    -    80    90    -    90    32        32    80        80 
   3,317    -    3,317    3,382    -    3,382 
   3,230        3,230    3,317        3,317 

Other financial assets


Amortised cost(b)

   382    247    629             

Financial assets at fair value through other comprehensive income(c)

   154    175    329             

Financial assets at fair value through profit or loss:


Derivatives

   194        194    116        116 

Other(d)

   144    220    364    137    2    139 

Held-to-maturity investments

   38    125    163    43    99    142                38    125    163 

Loans and receivables(b)

   277    186    463    208    190    398 

Available-for-sale financial assets(c)

   202    362    564    126    383    509 

Financial assets at fair value through profit or loss:


Derivatives

   116    -    116    91    -    91 

Other

   137    2    139    131    1    132 

Loans and receivables

               277    186    463 

Available-for-sale financial assets

               202    362    564 
   770    675    1,445    599    673    1,272    874    642    1,516    770    675    1,445 
                  

Total

   4,087    675    4,762    3,981    673    4,654    4,104    642    4,746    4,087    675    4,762 


(a)

For the purposes of this note and note 15C, financial assets and liabilities exclude trade and other current receivables and trade payables and other liabilities which are covered in notes 13 and 14 respectively.

(b)

Current loans and receivablesamortised cost assets include short-term deposits with banks with maturities of longer than three months. These are reclassified from loans and receivables under IAS 39, on adoption of IFRS9.

(c)

Current financial assets at fair value through other comprehensive income include Indian government securities. Included withinnon-current financial assets at fair value through other comprehensive income are equity investments of148 million. These investments are not held by Unilever for trading purposes and hence the Group has opted to recognise fair value movements through other comprehensive income. These assets are reclassified fromavailable-for-sale financial assets on adoption of IFRS 9. The fair value movement in 2018 of these equity investments was(9) million.

(d)

Current other financial assets at fair value through profit or loss include government securities andA- or higher rated money and capital market instruments. Included withinNon-currentavailable-for-salenon-current financial assets predominantly consist of investments in a number of companies and financial institutions in Europe, India and the US, including63 million (2016:79 million) ofat fair value through profit or loss are assets in a trust to fund benefit obligations in the US (see also note 4B). of59 million (2017:63 million) and investments in a number of companies and financial institutions in Europe, Australia, India and the US.

Other than changes arising on adoption of IFRS 9, there were no significant changes on account of change in business model in classification of financial assets since 31 December 2017.

Annual Report on Form 20-F 2017Financial Statements127


NOTES TO THE CONSOLIDATEDADOPTION OF IFRS 9 – IMPACT ON MEASUREMENT OF OTHER FINANCIAL STATEMENTSASSETS

UNILEVER GROUPOn the date of initial application of IFRS 9, 1 January 2018, financial assets ofCONTINUED207 million previously measured at fair value through equity were reclassified as fair value through profit or loss. Fair value gains or losses on these financial assets were immaterial in 2017 and 2018. Financial assets of6 million previously measured at fair value through profit or loss were reclassified to amortised cost under IFRS 9.

Cash and cash equivalents and trade receivables, which were classified as loans and other receivables under IAS 39, are classified as amortised cost under IFRS 9.


17A. FINANCIAL ASSETSCONTINUED

          € million          million           € million          million 
Cash and cash equivalents reconciliation to the cash flow statement  2017 2016   2018 2017 

Cash and cash equivalents per balance sheet

   3,317  3,382    3,230  3,317 

Less: bank overdrafts

   (167 (184   (140 (167

Add: cash and cash equivalents included in assets held for sale

   19   -      19 

Cash and cash equivalents per cash flow statement

       3,169      3,198        3,090      3,169 

Approximately10.8 billion (or 31%26%) of the Group’s cash and cash equivalents are held in the parent and central finance companies, for maximum flexibility. These companies provide loans to our subsidiaries that are also funded through retained earnings and third party borrowings. We maintain access to global debt markets through an infrastructure of short and long-term debt programmes. We make use of plain vanilla derivatives, such as interest rate swaps and foreign exchange contracts, to help mitigate risks. More detail is provided in notes 16, 16A, 16B and 16C on pages 121110 to 126.115.

The remaining2.32.4 billion (69%(74%) of the Group’s cash and cash equivalents are held in foreign subsidiaries which repatriate distributable reserves on a regular basis. For most countries, this is done through dividends which are in some cases subject to withholding or distribution tax. This balance includes154 million (2017:206 million, (2016:2016:240 million, 2015:284 million) of cash that is held in a few countries where we face cross-border foreign exchange controls and/or other legal restrictions that inhibit our ability to make these balances available for general use by the wider business. The cash will generally be invested or held in the relevant country and, given the other capital resources available to the Group, does not significantly affect the ability of the Group to meet its cash obligations.

Annual Report on Form 20-F 2018Financial Statements117


NOTES TO THE CONSOLIDATED FINANCIAL STATEMENTS

UNILEVER GROUPCONTINUED

17. INVESTMENT AND RETURNCONTINUED

17B. CREDIT RISK

Credit risk is the risk of financial loss to the Group if a customer or counter-party fails to meet its contractual obligations. Additional information in relation to credit risk on trade receivables is given in note 13. These risks are generally managed by local controllers. Credit risk related to the use of treasury instruments, including those held at amortised cost and at fair value through other comprehensive income, is managed on a Group basis. This risk arises from transactions with financial institutions involving cash and cash equivalents, deposits and derivative financial instruments. The maximum exposure to credit risk at the reporting date is the carrying value of each class of financial assets. To reduce this risk, Unilever has concentrated its main activities with a limited number of counter-parties which have secure credit ratings. Individual risk limits are set for each counter-party based on financial position, credit rating and past experience. Credit limits and concentration of exposures are actively monitored by the Group’s treasury department. Netting agreements are also put in place with Unilever’s principal counter-parties. In the case of a default, these arrangements would allow Unilever to net assets and liabilities across transactions with that counter-party. To further reduce the Group’s credit exposures on derivative financial instruments, Unilever has collateral agreements with Unilever’s principal counter-parties in relation to derivative financial instruments. Under these arrangements, counter-parties are required to deposit securities and/or cash as a collateral for their obligations in respect of derivative financial instruments. At 31 December 20172018 the collateral held by Unilever under such arrangements amounted to610 million (2016:(2017:36 million), of which6 (2016:10 million (2017:Nil)6 million] was in cash, andNil million (2016:(2017:3)Nil) was in the form of bond securities. Thenon-cash collateral has not been recognised as an asset in the Group’s balance sheet.

Further details in relation to the Group’s exposure to credit risk are shown in note 13 and note 16A.


18. FINANCIAL INSTRUMENTS FAIR VALUE RISK

The Group is exposed to the risks of changes in fair value of its financial assets and liabilities. The following table summarises the fair values and carrying amounts of financial instruments.


  € million  million € million  million   € million  million € million  million 
Fair values of financial assets and financial liabilities          Fair value
2017
         Fair value
2016
         Carrying
amount
2017
         Carrying
amount
2016
           Fair value
2018
         Fair value
2017
         Carrying
amount
2018
         Carrying
amount
2017
 

Financial assets


Cash and cash equivalents

   3,317  3,382   3,317  3,382    3,230  3,317   3,230  3,317 

Held-to-maturity investments

   163  142   163  142 

Loans and receivables

   463  398   463  398 

Available-for-sale financial assets

   564  509   564  509 

Held-to-maturity investments(a)

     163     163 

Loans and receivables(a)

     463     463 

Available-for-sale financial assets(a)

     564     564 

Amortised cost(a)

   629      629    

Financial assets at fair value through other comprehensive income(a)

   329      329    

Financial assets at fair value through profit or loss:


Derivatives

   116  91   116  91    194  116   194  116 

Other

   139  132   139  132    364  139   364  139 
       4,762      4,654       4,762      4,654 
       4,746      4,762       4,746      4,762 

Financial liabilities


Preference shares

   -  (125  -  (68

Bank loans and overdrafts

   (995 (1,147  (992 (1,146   (816 (995  (814 (992

Bonds and other loans

   (23,368 (15,844  (22,709 (15,053   (23,691 (23,368  (23,391 (22,709

Finance lease creditors

   (147 (165  (131 (143   (141 (147  (128 (131

Derivatives

   (421 (185  (421 (185   (402 (421  (402 (421

Other financial liabilities

   (177  -   (177  -    (150 (177  (150 (177
   (25,108 (17,466  (24,430 (16,595
   (25,200 (25,108  (24,885 (24,430


(a)
128Financial StatementsAnnual Report on Form 20-F 2017

Classification has changed following adoption of IFRS 9. See page 117 and note 1 for further details.


18. FINANCIAL INSTRUMENTS FAIR VALUE RISKCONTINUED

The fair value of trade receivables and payables is considered to be equal to the carrying amount of these items due to their short-term nature.

The instruments that have a fair value that is different from the carrying amount are classified as Level 2 for both 20162017 and 2017 with exception of preference shares which are classified as Level 1 for both years.2018.

FAIR VALUE HIERARCHY

The fair values shown in notes 15C and 17A have been classified into three categories depending on the inputs used in the valuation technique. The categories used are as follows:

Level 1: quoted prices for identical instruments;

Level 2: directly or indirectly observable market inputs, other than Level 1 inputs; and

Level 3: inputs which are not based on observable market data.

118Financial StatementsAnnual Report on Form 20-F 2018


18. FINANCIAL INSTRUMENTS FAIR VALUE RISKCONTINUED

For assets and liabilities which are carried at fair value, the classification of fair value calculations by category is summarised below:


      € million    million   € million  million € million  million € million  million           € million        million       € million      million     € million      million     € million      million 
  Notes   Level 1
2017
   Level 1
2016
   Level 2
2017
 Level 2
2016
 Level 3
2017
 Level 3
2016
 Total fair
value
2017
 Total fair
value
2016
   Notes   Level 1
2018
   Level 1
2017
   Level 2
2018
 Level 2
2017
 Level 3
2018
 Level 3
2017
 Total fair
value
2018
 Total fair
value
2017
 

Assets at fair value


Other cash equivalents

   17A    -    -    80  90   -   -   80  90 

Financial assets at fair value through other comprehensive income

   17A    160        5      164      329    

Available-for-sale financial assets

   17A    215    138    7  98   342  273   564  509    17A        215      7     342     564 

Financial assets at fair value through profit or loss:


Derivatives(a)

   16C    -    -    173  226   -   -   173  226 

Derivatives(b)(a)

   16C            276  173         276  173 

Other

   17A    137    -    -  131   2  1   139  132    17A    145    137          219  2   364  139 

Liabilities at fair value


Derivatives(b)(a)

   16C    -    -    (534 (331  -   -   (534 (331

Derivatives(b)

   16C            (542 (534        (542 (534

Contingent consideration

   14    -    -    -   -   (445 (380  (445 (380   14                  (142 (445  (142 (445


(a)

Includes5782 million (2016:(2017:13557 million) derivatives, reported within trade receivables, that hedge trading activities.

(b)

Includes(113)(140) million (2016:(2017:(146)(113) million) derivatives, reported within trade payables, that hedge trading activities.

ThereOther than changes arising on adoption of IFRS 9, there were no significant changes in classification of fair value of financial assets and financial liabilities since 31 December 2016.2017. There were also no significant movements between the fair value hierarchy classificationslevels since 31 December 2016.2017.

The impact in the 20172018 income statement due to Levellevel 3 instruments is a gain of26272 million (2016:(2017: gain of9426 million).

Reconciliation of Level 3 fair value measurements of financial assets and financial liabilities is given below:


Reconciliation of movements in Level 3 valuations  € million
2017
  million
2016
           € million
2018
          million
2017
 

1 January

   (106 346    (101 (106

Gains and losses recognised in profit and loss

   26  94    272  26 

Gains and losses recognised in other comprehensive income

   2  (12   (9 2 

Purchases and new issues

   (89 (247   4  (89

Sales and settlements

   (17 (187   75  (17

Transfers into Level 3

   83   -      83 

Transfers out of Level 3

   -  (100

31 December

   (101 (106   241  (101

SIGNIFICANT UNOBSERVABLE INPUTS USED IN LEVEL 3 FAIR VALUES

The largest asset valued using Level 3 techniques is an executive Life Insurance of2217 million (2016:(2017:2522 million).

A change in one or more of the inputs to reasonably possible alternative assumptions would not change the value significantly.

During the year 2017,The gains and losses recognised in profit and loss includes a Split-Dollar life insurance asset with a carrying valuecredit from early settlement of43 million as at 31 December 2016 (2015:41 million) was derecognised. The asset was previously valued using Level 3 techniques and related to an unlisted investment recognised as an available contingent consideration for sale financial asset. The asset was disposed for a total consideration of45 million and the carrying value at the time of disposal was36 million. The 2017 impact on profit or loss was9 million gain.Blueair.

CALCULATION OF FAIR VALUES

The fair values of the financial assets and liabilities are defined as the price that would be received to sell an asset or paid to transfer a liability in an orderly transaction between market participants at the measurement date. Methods and assumptions used to estimate the fair values are consistent with those used in the year ended 31 December 2016.

Annual Report on Form 20-F 2017Financial Statements129


NOTES TO THE CONSOLIDATED FINANCIAL STATEMENTS

UNILEVER GROUPCONTINUED

18. FINANCIAL INSTRUMENTS FAIR VALUE RISKCONTINUED

2017.

ASSETS AND LIABILITIES CARRIED AT FAIR VALUE

The fair values of quoted investments falling into Level 1 are based on current bid prices.

The fair values of unquotedavailable-for-sale financial assets at fair value through other comprehensive income and at fair value through profit or loss are based on recent trades in liquid markets, observable market rates, discounted cash flow analysis and statistical modelling techniques such as the Monte Carlo simulation. If all significant inputs required to fair value an instrument are observable, the instrument is included in Level 2. If one or more of the significant inputs is not based on observable market data, the instrument is included in Level 3.

Derivatives are valued using valuation techniques with market observable inputs. The models incorporate various inputs including the credit quality of counter-parties, foreign exchange spot and forward rates, interest rate curves and forward rate curves of the underlying commodities.

For listed securities where the market is not liquid, and for unlisted securities, valuation techniques are used. These include the use of recent arm’s length transactions, reference to other instruments that are substantially the same and discounted cash flow calculations.

Annual Report on Form 20-F 2018Financial Statements119


NOTES TO THE CONSOLIDATED FINANCIAL STATEMENTS

UNILEVER GROUPCONTINUED

18. FINANCIAL INSTRUMENTS FAIR VALUE RISKCONTINUED

OTHER FINANCIAL ASSETS AND LIABILITIES (FAIR VALUES FOR DISCLOSURE PURPOSES ONLY)

Cash and cash equivalents, trade and other current receivables, bank loans and overdrafts, trade payables and other current liabilities have fair values that approximate to their carrying amounts due to their short-term nature.

The fair values of preference shares and listed bonds are based on their market value.

Non-listed bonds, other loans, bank loans andnon-current receivables and payables are based on the net present value of the anticipated future cash flows associated with these instruments using rates currently available for debt on similar terms, credit risk and remaining maturities.

Fair values for finance lease creditors have been assessed by reference to current market rates for comparable leasing arrangements.

POLICIES AND PROCESSES USED IN RELATION TO THE CALCULATION OF LEVEL 3 FAIR VALUES

Assets valued using Level 3 valuation techniques are primarily made up of long-term cash receivables and unlisted investments. Valuation techniques used are specific to the circumstances involved. Unlisted investments include195254 million (2016:(2017:172195 million) of investments within Unilever Ventures companies.


19. PROVISIONS


Provisions are recognised where a legal or constructive obligation exists at the balance sheet date, as a result of a past event, where the amount of the obligation can be reliably estimated and where the outflow of economic benefit is probable.


                € million          million                 € million          million 
Provisions           2017 2016            2018 2017 

Due within one year

      525  390       624  525 

Due after one year

      794  1,033       697  794 

Total provisions

         1,319  1,423          1,321  1,319 
  € million     € million € million         € million         € million   € million     € million € million         € million         € million 
Movements during 2017          Restructuring Legal Brazil
indirect taxes
 Other Total 

1 January 2017

   291   125   672   335   1,423 
Movements during 2018          Restructuring Legal Brazil
indirect taxes
 Other Total 

1 January 2018

   352   192   356   419   1,319 

Income Statement:


Charges

   318   139   43   143   643    320   90   26   164   600 

Releases

   (79  (16  (75  (21  (191   (51  (10  (55  (116  (232

Utilisation

   (161  (43  (206  (4  (414   (161  (130  (10  (26  (327

Reclassification(a)

   (7  16   (85  76    

Currency translation

   (17  (13  (78  (34  (142   (8  (15  (29  (13  (39

31 December 2017

   352   192   356   419   1,319 

31 December 2018

   445   143   203   530   1,321 

(a)

Includes amounts transferred between classes of provisions.

Restructuring provisions primarily include people costs such as redundancy costs and cost of compensation where manufacturing, distribution, service or selling agreements are to be terminated. The group expects these provisions to be substantially utilised within the next few years.

The Group is involved from time to time in legal and arbitration proceedings arising in the ordinary course of business. As previously disclosed, along with other consumer products companies and retail customers, Unilever is involved in a number of ongoing investigations by national competition authorities. These proceedings and investigations are at various stages and concern a variety of product markets. Where specific issues arise, provisions are made to the extent appropriate. Due to the nature of the legal cases, the timing of utilisation of these provisions is uncertain.

In 2017,2018 the group recognised a provision ofpaid80104 million for legal cases in relation to investigations by national competition authorities, including those within Italy and South Africa.of which76 million was provided in previous years.

Provisions for Brazil indirect taxes are comprised of disputes with Brazilian authorities, in particular relating to tax credits that can be taken for the PIS and COFINS indirect taxes. These provisions are separate from the matters listed as contingent liabilities in note 20; Unilever does not have provisions and contingent liabilities for the same matters. Due to the nature of disputed indirect taxes the timing of utilisation of these provisions is uncertain.

In 2017, the Group successfully applied for federal tax amnesty in relation to 31 cases in Brazil. This resulted in a261 million reduction in the provision for disputed indirect taxes, of which193 million was utilised and68 million was credited into the income statement.

130Financial StatementsAnnual Report on Form 20-F 2017


20. COMMITMENTS AND CONTINGENT LIABILITIES


Leases are classified as finance leases whenever the terms of the lease transfer substantially all the risks and rewards of ownership. All other leases are classified as operating leases.

Assets held under finance leases are initially recognised at the lower of fair value at the date of commencement of the lease and the present value of the minimum lease payments. Subsequent to initial recognition, these assets are accounted for in accordance with the accounting policy relating to that specific asset. The corresponding liability is included in the balance sheet as a finance lease obligation. Lease payments are apportioned between finance costs in the income statement and reduction of the lease obligation so as to achieve a constant rate of interest on the remaining balance of the liability.

Lease payments under operating leases are charged to the income statement on a straight-line basis over the term of the lease.

Contingent liabilities are either possible obligations that will probably not require a transfer of economic benefits, or present obligations that may, but probably will not, require a transfer of economic benefits. It is not appropriate to make provisions for contingent liabilities, but there is a chance that they will result in an obligation in the future. Assessing the amount of liabilities that are not probable is highly judgemental so contingent liabilities are disclosed on the basis of the known maximum exposure.


           € million           € million           € million            million           million           million 
Long-term finance lease commitments  Future
minimum
lease
payments
2017
   

Finance
Cost

2017


Present

value

2017

   Future
minimum
lease
payments
2016
  

Finance

cost

2016


Present

value

2016


Buildings(a)

   195    75    120    202   75   127 

Plant and machinery

   11    -    11    18   2   16 
   206    75    131    220   77   143 

The commitments fall due as follows:


Within 1 year

   20    9    11    24   15   9 

Later than 1 year but not later than 5 years

   68    23    45    69   28   41 

Later than 5 years

   118    43    75    127   34   93 
    206    75    131    220   77   143 


(a) All leased land is classified as operating leases.


The table below shows the net book value of property, plant and equipment under a number of finance lease agreements.


                       € million          € million          € million 
Net book value                 Buildings  

Plant and

equipment

  Total 

Cost

         206   125   331 

Accumulated depreciation


   (84  (108  (192

31 December 2017

                  122   17   139 

Cost

         211   134   345 

Accumulated depreciation


   (79  (115  (194

31 December 2016

                  132   19   151 


The Group has sublet part of the leased properties under finance leases. Future minimum sublease payments of29 million (2016:31 million) are
expected to be received.


                  € million   million 
Long-term operating lease commitments       2017  2016 

Land and buildings

          1,885   2,149 

Plant and machinery

          569   692 
                       2,454   2,841 
           € million    million  € million   million 
Operating lease and other commitments fall due as follows:        

Operating
leases

2017


Operating
leases

2016

  Other
commitments
2017
  

Other
commitments

2016


Within 1 year

       418    457   1,274   1,204 

Later than 1 year but not later than 5 years


   1,250    1,393   935   1,231 

Later than 5 years

       786    991   31   30 
              2,454    2,841   2,240   2,465 
120Financial StatementsAnnual Report on Form 20-F 2018


20. COMMITMENTS AND CONTINGENT LIABILITIESCONTINUED

       € million       € million       € million        million        million        million 
Long-term finance lease commitments  Future
minimum
lease
payments
2018
   

Finance
Cost

2018


Present
value

2018

   Future
minimum
lease
payments
2017
   

Finance

cost

2017


Present
value

2017


Buildings(a)

   174    57    117    195    75    120 

Plant and machinery

   13    2    11    11        11 
   187    59    128    206    75    131 

The commitments fall due as follows:


Within 1 year

   20    7    13    20    9    11 

Later than 1 year but not later than 5 years

   71    20    51    68    23    45 

Later than 5 years

   96    32    64    118    43    75 
    187    59    128    206    75    131 

(a)

All leased land is classified as operating leases.

The table below shows the net book value of property, plant and equipment under a number of finance lease agreements.

                € million      € million      € million 
Net book value              Buildings  Plant and
equipment
  Total 

Cost

         216   106   322 

Accumulated depreciation

   (94  (95  (189

31 December 2018

            122   11   133 

Cost

         206   125   331 

Accumulated depreciation

   (84  (108  (192

31 December 2017

            122   17   139 

The Group has sublet part of the leased properties under finance leases. Future minimum sublease payments of26 million (2017:29 million) are expected to be received.

                       € million                million 
Long-term operating lease commitments        2018   2017 

Land and buildings

         1,803    1,885 

Plant and machinery

         661    569 
                  2,464    2,454 
       € million    million   € million    million 
Operating lease and other commitments fall due as follows:     

      Operating
leases

2018


      Operating
leases

2017

   Other
    commitments
2018
   Other
    commitments
2017
 

Within 1 year

     481    418    1,099    1,274 

Later than 1 year but not later than 5 years

   1,259    1,250    780    935 

Later than 5 years

     724    786    31    31 
        2,464    2,454    1,910    2,240 

The Group has sublet part of the leased properties under operating leases. Future minimum sublease payments of1210 million (2016:(2017:1712 million) are expected to be received.

Other commitments principally comprise commitments under contracts to purchase materials and services. They do not include commitments to purchase property, plant and equipment, which are reported in note 10 on page 111pages 100 and 112.

Annual Report on Form 20-F 2017Financial Statements131


NOTES TO THE CONSOLIDATED FINANCIAL STATEMENTS

UNILEVER GROUPCONTINUED

20. COMMITMENTS AND CONTINGENT LIABILITIESCONTINUED

101.

CONTINGENT LIABILITIES

Contingent liabilities are possible obligations that are not probable. They arise in respect of litigation against group companies, investigations by competition, regulatory and fiscal authorities and obligations arising under environmental legislation. In many markets, there is a high degree of complexity involved in the local tax regimes. The majority of contingent liabilities are in respect of fiscal matters in Brazil.

Assessing the amount of liabilities that are not probable is highly judgemental. During 2017 we have reviewed our approach and now contingentContingent liabilities are disclosed on the basis of the known maximum exposure. In the case of Brazil fiscal matters the known maximum exposure is the amount included on a tax assessment.

Annual Report on Form 20-F 2018Financial Statements121


NOTES TO THE CONSOLIDATED FINANCIAL STATEMENTS

UNILEVER GROUPCONTINUED

20. COMMITMENTS AND CONTINGENT LIABILITIESCONTINUED

A summary of our contingent liabilities is shown in the table below.below:


          € million
2017
            million
2016
           € million
2018
           € million
2017
 

Corporate reorganisation – IPI, PIS and COFINS taxes and penalties(a)

   2,092    1,464    2,032    2,092 

Inclusion of ICMS in the tax base for PIS and COFINS taxes(b)

   -    655 

Inputs for PIS and COFINS taxes

   16    113    52    16 

Goodwill amortisation

   121    36    177    121 

Other tax assessments – over 600 cases

   1,095    1,093 

Other tax assessments – approximately 600 cases

   916    1,095 

Total Brazil Tax

   3,324    3,361    3,177    3,324 

Brazil other

   19    42    67    19 

Contingent liabilities outside Brazil

   324    224    414    324 

Total contingent liabilities

   3,667    3,627    3,658    3,667 


(a)

During 2004, and in common with many other businesses operating in Brazil, one of our Brazilian subsidiaries received a notice of infringement from the Federal Revenue Service in respect of indirect taxes. The notice alleges that a 2001 reorganisation of our local corporate structure was undertaken without valid business purpose. The 2001 reorganisation was comparable with restructurings done by many companies in Brazil. The original dispute was resolved in the courts in the Group’s favour. However, in 2013 a new assessment was raised in respect of a similar matter. Additionally, during the course of 2014 and again in December 2017 and in 2018 other notices of infringement were issued based on the same grounds argued in the previous assessments. The total amount of the tax assessments in respect of this matter is2,0922,032 million (2016:(2017:1,4642,092 million). The judicial process in Brazil is likely to take a number of years to conclude.

(b)During 2006, Unilever filed a judicial measure to obtain the right to exclude the Brazilian ICMS indirect tax from the taxable base for the Brazilian PIS and COFINS indirect taxes, and obtained a favourable decision in 2007. In November 2016, this favourable decision was reversed on appeal to a higher court, and the Group lodged a further appeal. In 2017, the Supreme Court published a favourable decision on the leading case, which we expect to be applied to the Group’s case. As such, we have assessed the risk of outflow in relation to this case to now be remote and therefore is not a contingent liability.

The Group believes that the likelihood that the tax authorities will ultimately prevail is low, however there can be no guarantee of success in court. In each case we believe our position is strong so they have not been provided for and are considered to be contingent liabilities. Due to the fiscal environment in Brazil the possibility of further tax assessments related to the same matters cannot be ruled out.

The contingent liabilities reported for indirect taxes relating to disputes with the Brazilian authorities are separate from the provisions listed in note 19; Unilever does not have provision and contingent liabilities for the same matters.


21. ACQUISITIONS AND DISPOSALS


Business combinations are accounted for using the acquisition accounting method as at the acquisition date, which is the date at which control is transferred to the Group.

Goodwill is measured at the acquisition date as the fair value of consideration transferred, plusnon-controlling interests and the fair value of any previously-held equity interests less the net recognised amount (which is generally fair value) of the identifiable assets and liabilities assumed. Goodwill is subject to an annual review for impairment (or more frequently if necessary) in accordance with our accounting policies. Any impairment is charged to the income statement as it arises. Detailed information relating to goodwill is provided in note 9 on pages 10897 to 110.99.

Transaction costs are expensed as incurred, withinnon-underlying items.

Changes in ownership that do not result in a change of control are accounted for as equity transactions and therefore do not have any impact on goodwill. The difference between consideration and thenon-controlling share of net assets acquired is recognised within equity.

132Financial StatementsAnnual Report on Form 20-F 2017


21. ACQUISITIONS AND DISPOSALSCONTINUED

20172018

In 2017,2018 the Group completed the following business acquisitions and disposals as listed below. In each case 100% of the businesses were acquired unless stated otherwise. Total considerationpayment for 20172018 acquisitions is4,9121,294 million (2016:(2017:2,0694,912 million for acquisitions completed during that year). More information related to the 20172018 acquisitions is provided on page 134pages 123 and 135.124.


DEAL COMPLETION

DATE


ACQUIRED/DISPOSED BUSINESS

1 February 2017

Acquired Living Proof, an innovative premium hair care business, using patented technology and breakthrough science. Living Proof forms part of our prestige Personal Care business.


15 January 2018 Acquired the remaining 2%non-controlling interest of Carver Korea bringing the Group’s ownership to 100%.

28 March 2017

February 2018
 

Sold the AdeS soy beverageAcquired Quala beauty & personal and home care business in Latin America to Coca-Cola FEMSA and The Coca-Cola Company.

America.


1 May 2017

2 July 2018
 

Acquired Kensington’s, a condiment maker. Kensington’s is a mission-driven company with a leading brand sold inSold the organic and naturals marketplace.

global Spreads business (excluding Southern Africa) to KKR.


1 August 2017

2 July 2018
 

Acquired 60%Sold the Spreads business in Southern Africa to Remgro plus a cash consideration of EAC Myanmar, a home care business to form306 million in exchange for Remgro’s 25.75% shareholding in Unilever EAC Myanmar Company Limited.

South Africa.


1 August 2017

27 September 2018
 

Acquired Hourglass, a luxury colour cosmeticsAdityaa Milk, an ice cream business known for innovation and exceptional product. Hourglass forms part of our prestige Personal Care business.

in India. The acquisition strengthens Unilever front end distribution reach in India.


7 September 2017

1 October 2018
 

Acquired Pukka Herbs, an organic herbal tea business, that enhances our75% of Equilibra, the Italian personal care and wellbeing business. The acquisition complements Unilever’s product range through its presence in the Naturals segment of Refreshment.

‘natural’ personal care segment.


1 November 2018 Acquired Betty Ice, a leading ice cream business in Romania. The acquisition enriches Unilever product range through local offerings and price tiers.

9 September 2017

3 December 2018 

Acquired Weis,Denny Ice, an ice cream business. Weis is a second-generation Australian ice cream and frozen dessert manufacturer with the original iconic Fruito Bar and aimsbusiness in Bulgaria to increase our market position in Refreshment.

strengthen local product knowledge.


1 November 2017

31 December 2018
 

Acquired 98% of Carver Korea,Vegetarian Butcher, a leading skincarevegetarian meat replacement, foods business in North Asia from Bain Capital Private Equitythe Netherlands. The acquisition fits with Unilever’s strategy to expand its portfolio into plant-based foods responding to the growing trend of vegetarian and Goldman Sachs. The brands acquired provide Unilever a presence in South Korea. Further details are provided below.

vegan meals.


1 December 2017

122
 

Acquired Mãe Terra, a Brazilian naturals and organic food business. Mãe Terra is a fast-growing and well-loved brand in Brazil and adds to the Foods business by providing health-conscious consumers with organic and nutritious food products.

11 December 2017

Financial Statements
  

Acquired TAZO, the leading brand in the speciality tea category, which enhances our presence in the Black, Green and Herbal tea segments of Refreshment.Annual Report on Form 20-F 2018


21. ACQUISITIONS AND DISPOSALSCONTINUED


18 December 2017

Acquired Sundial Brands, a leading haircare and skincare company recognised for its innovative use of high-quality and culturally authentic ingredients.

31 December 2017

Acquired Schmidt’s Naturals, a personal care company. Schmidt’s Naturals is a strong, innovative brand in the fast-growing naturals category, that will complement our existing portfolio of US deodorants.

In addition to the completed deals in the table above:

On 15 May 2017,3 December 2018 the Group announced that it had signed an agreement to purchaseacquire the homehealth food drinks portfolio of GlaxoSmithKline in India and personal care business20 other predominantly Asian markets. The consideration is payable via a combination of Quala in Latin America. Thiscash and shares of Hindustan Unilever Limited and estimated to be approximately3.3 billion based on the share price of Hindustan Unilever Limited and exchange rates at the time of the agreement. The transaction is expected to complete duringin Q4 2019. In 2018 the first quarterhealth food drinks portfolio of 2018.GlaxoSmithKline delivered turnover of around550 million primarily from products under the Horlicks and Boost brands.

On 22 September 2017,27 January 2019 the Group announcedcompleted the disposalacquisition of The Laundress, a premiumeco-friendly laundry care business in the South African spreads business plus a cash consideration of331m in exchange for Remgro’s 25.75% shareholding in Unilever South Africa. Subject to regulatory approval, this transaction is expected to complete during 2018.US. The acquisition expands Unilever’s portfolio into the home care premium market and fits with Unilever’s Sustainable Living Plan.

On 15 December 2017,5 February 2019 the Group announced that it had signed an agreement with KKR to sell its global spreadscompleted the acquisition of Graze, a healthy snacking business (excluding South Africa).in the UK. The sale includesacquisition accelerates Unilever’s presence in the disposalhealthy snacking and out of home markets.

On 1 March 2019 the Baking, Cooking and Spreads entities in North America and Europe as well as brands such as Rama, Becel, Blue Band, Country Crock, Flora, I Can’t believe It’s Not Butter and Pro Activ. Subject to regulatory approval,Group completed the sale is expectedof its Alsa baking and dessert business to complete during 2018.Dr. Oetker.

Information on assets and liabilities held for sale in relation to the spreads business is provided in note 22.

Annual Report on Form 20-F 2017Financial Statements133


NOTES TO THEEFFECT ON CONSOLIDATED FINANCIAL STATEMENTS

UNILEVER GROUPCONTINUEDINCOME STATEMENT

21. ACQUISITIONS AND DISPOSALSCONTINUED

Carver Korea

The Group acquired 98% equity of Carver Korea for a cash consideration of2,284 million. This acquisition adds the AHC brand to Unilever’s portfolio.

The provisional fair value of net assets for the acquisition that is recognised on the balance sheet is1,281 million; the provisional fair valuesdeals completed in 2018 have been determined pending the completion of valuations in 2018. The intangible assets are principally brands. No contingent liabilities were acquired. Further details of the provisional fair values of net assets acquired are provided on page 135.

The provisional estimate of goodwill is1,030 million. It represents the future value which the Group believes it will obtain through operational synergies and the market position.

Total acquisition-related costs incurred to date for Carver Korea are1 million which have been recorded withinnon-underlying items in the income statement for the year ended 31 December 2017.

Since acquisition, Carver Korea has contributed75253 million to Group revenue and23 million to Group operating profit. If the acquisition had taken place at the beginning of the year, Group revenue would have been53,984 million and Group operating profit would have been8,982 million.

Effect on Consolidated Income Statement

The acquisition deals completed in 2017 have contributed230 million to Group revenue and3255 million to Group operating profit since the relevant acquisition dates.

If the acquisition deals completed in 20172018 had all taken place at the beginning of the year, Group revenue would have been54,44051,140 million and Group operating profit would have been9,06012,551 million.

20162017

In 2016,2017 the Group completed the following business acquisitions and disposals listed below. For the businesses acquired, the acquisition accounting has been finalised and subsequent changes to the provisional numbers published last year were immaterial.


DEAL COMPLETION DATE


ACQUIRED/DISPOSED BUSINESS

31 March 20161 February 2017


Sold the breadAcquired Living Proof, an innovative premium hair care business, using patented technology and bakery business under the brand ‘Modern’ in India to Nimman Foods Private Limited,breakthrough science. Living Proof forms part of the Everstone Group.

our prestige Personal Care business.


28 March 2017 Sold the AdeS soy beverage business in Latin America to Coca-Cola FEMSA and The Coca-Cola Company.

7 April 2016

1 May 2017


Acquired IndulekhaKensington’s, a condiment maker. Kensington’s is a mission-driven company with a leading brand sold in the organic and Vayodha brands from Mosons Group.

naturals marketplace.


6 May 20161 August 2017


Sold local Alberto Culver brands Antiall, Farmaco, Veritas, the rights for VO5 in Argentina andAcquired 60% of EAC Myanmar, a manufacturing planthome care business to Santiago Saenz.

form Unilever EAC Myanmar Company Limited.


31 July 20161 August 2017


Sold the Rice ExportsAcquired Hourglass, a luxury colour cosmetics business, in India to LT Foods Middle East DMCC, a Group companyknown for innovation and exceptional product. Hourglass forms part of LT Foods Limited.

our prestige Personal Care business.


10 August 20167 September 2017


Acquired Dollar Shave Club, a subscription-baseddirect-to-consumer male grooming business.

Pukka Herbs, an organic herbal tea business, that enhances our presence in the Naturals segment of Refreshment.


20 October 20169 September 2017


Acquired Seventh Generation,Weis, an ice cream business. Weis is a North American homesecond-generation Australian ice cream and personal careeco-friendly naturals business.

frozen dessert manufacturer with the original iconic Fruito Bar and aims to increase our market position in Refreshment.


1 November 2017

 Acquired 98% of Carver Korea, a leading skincare business in North Asia from Bain Capital Private Equity and Goldman Sachs. The brands acquired provide Unilever a presence in South Korea. Further details are provided below.

1 December 20162017


Acquired Blueair,Mãe Terra, a supplier of innovative mobile indoor air purification technologiesBrazilian naturals and solutions.organic food business. Mãe Terra is a fast-growing and well- loved brand in Brazil and adds to the Foods business by providing health-conscious consumers with organic and nutritious food products.

11 December 2017


Acquired TAZO, the leading brand in the speciality tea category, which enhances our presence in the Black, Green and Herbal tea segments of Refreshment.
134

18 December 2017

 Financial StatementsAcquired Sundial Brands, a leading haircare and skincare company recognised for its innovative use of high-quality and culturally authentic ingredients.

31 December 2017

 Annual Report on Form 20-F 2017Acquired Schmidt’s Naturals, a personal care company. Schmidt’s Naturals is a strong, innovative brand in the fast-growing naturals category, that will complement our existing portfolio of US deodorants.


21. ACQUISITIONS AND DISPOSALSCONTINUED

EFFECT ON CONSOLIDATED BALANCE SHEET

ACQUISITIONS

The following table sets out the effect of the acquisitions in 2018, 2017 2016 and 20152016 on the consolidated balance sheet. The fair values currently used for opening balances of all acquisitions made in 20172018 are provisional, with the exception of Living Proof, Inc.Quala, whose opening balance sheet was finalised within 2017.2018. Balances remain provisional due to missing relevant information about facts and circumstances that existed as of the acquisition date and where valuation work is still ongoing, notably for acquisitions which completed in the second half of 2017.2018.

Annual Report on Form 20-F 2018Financial Statements123


NOTES TO THE CONSOLIDATED FINANCIAL STATEMENTS

UNILEVER GROUPCONTINUED

21. ACQUISITIONS AND DISPOSALSCONTINUED

Detailed information relating to goodwill is provided in note 9 on pages 10897 to 110.99. The value of goodwill which is expected to be tax deductible is5685 million.


           € million           million           million 
    2017  2016  2015 

Net assets acquired

   2,423   929   999 

Non-controlling interest

   (50  -   - 

Goodwill

   2,539   1,140   1,012 

Total consideration

   4,912   2,069   2,011 


In 2017 the net assets acquired and total consideration consist of:

    
    Carver
Korea
  Other
acquisitions
  € million
2017
 

Intangible assets

   1,520   1,090   2,610 

Othernon-current assets

   14   79   93 

Trade and other receivables

   18   78   96 

Other current assets

   150   99   249 

Non-current liabilities

   (369  (119  (488

Current liabilities

   (52  (85  (137

Net assets acquired

   1,281   1,142   2,423 

Non-controlling interest

   (27  (23  (50

Goodwill

   1,030   1,509   2,539 

Cash consideration

   2,284   2,541   4,825 

Deferred consideration

   -   87   87 

Total consideration

   2,284   2,628   4,912 
           € million           million           million 
    2018  2017  2016 

Net assets acquired

   815   2,423   929 

Non-controlling interest

   (17  (50   

Goodwill

   496   2,539   1,140 

Total payment for acquisition

   1,294   4,912   2,069 

Exchange rate gain/(loss) on cash flow hedge

   (100  51   14 

Total consideration

   1,194   4,963   2,083 

In 2018 the net assets acquired and total payment for acquisition consist of:
        € million
2018

Intangible assets

859

Othernon-current assets

45

Trade and other receivables

25

Other current assets

45

Non-current liabilities

(134

Current liabilities

(25

Net assets acquired

815

Non-controlling interest

(17

Goodwill

496

Exchange rate gain/(loss) on cash flow hedges(a)

(100

Cash consideration

1,172

Deferred consideration

22

Total consideration

1,194
(a)

Exchange rate gain/(loss) on the cash flow hedge in relation to the acquisition of Quala.

No contingent liabilities were acquired in the other acquisitions described above. In 2018 a credit to acquisition and disposal related costs of277 million was recognised as a result of the early settlement of the contingent consideration for Blueair. This credit more than offset an impairment charge of208 million related to a Blueair intangible asset.

Goodwill represents the future value which the Group believes it will obtain through operational synergies and the application of acquired company ideas to existing Unilever channels and businesses.

DISPOSALS

The following table sets out the effect of the disposals in 2018, 2017 2016 and 20152016 on the consolidated balance sheet. The results of disposed businesses are included in the consolidated financial statements up to their date of disposal.


          € million          million          million           € million          million          million 
  2017 2016 2015   2018 2017 2016 

Goodwill and intangible assets

   71  85  47    2,510  71  85 

Othernon-current assets

   92  29  2    666  92  29 

Current assets

   10  5  23    261  10  5 

Trade creditors and other payables

   (8  -  (2   (107 (8   

Net assets sold

   165  119  70    3,330  165  119 

(Gain)/loss on recycling of currency retranslation on disposal

   66   -   -    (71 66    

Profit/(loss) on sale attributable to Unilever

   332  (95 (9   4,331  332  (95

Consideration

   563  24  61    7,590  563  24 

Cash

   560  16  62    7,135  560  16 

Cash balances of businesses sold

   -  8  (1   321     8 

Non-cash items and deferred consideration

   3   -   -    134  3    
   563  24  61 
   7,590  563  24 

On 2 July 2018 Unilever sold the global Spreads business (excluding Southern Africa) to KKR for7,144 million cash consideration and the Southern Africa Spreads business to Remgro for anon-cash consideration of446 million. The intangible assets sold include brands such as Becel, Flora, Country Crock, Blue Brand, I Can’t Believe It’s Not Butter, Rama, andPro-Activ. Goodwill of2,429 million was allocated from the Foods CGUs. Manufacturing assets in 28 countries were disposed. Profit on these disposals was4,331 million, recognised as anon-underlying item (see note 3).


Annual Report on Form 20-F 2017124 Financial Statements  135Annual Report on Form 20-F 2018


NOTES TO THE CONSOLIDATED FINANCIAL STATEMENTS

UNILEVER GROUPCONTINUED


22. ASSETS AND LIABILITIES HELD FOR SALE


Non-current assets and groups of assets and liabilities which comprise disposal groups are classified as ‘held for sale’ when all of the following criteria are met: a decision has been made to sell; the assets are available for sale immediately; the assets are being actively marketed; and a sale has been agreed or is expected to be concluded within 12 months of the balance sheet date.

Immediately prior to classification as held for sale, the assets or groups of assets are remeasured in accordance with the Group’s accounting policies. Subsequently, assets and disposal groups classified as held for sale are valued at the lower of book value or fair value less disposal costs. Assets held for sale are neither depreciated nor amortised.


          € million           € million            million           € million            million 
  2017
Spreads(a)
   

2017

Total


2016

Total(b)


2018

Total


2017

Total


Property, plant and equipment held for sale

   -    30    22    4    30 

Disposal groups held for sale(b)


Non-current assets


Goodwill and intangibles

   2,311    2,311    98    82    2,311 

Property, plant and equipment

   548    552    46    19    552 

Deferred tax assets

   145    145    -        145 

Othernon-current assets

   1    1    -        1 
   3,005    3,009    144   
   101    3,009 

Current assets


Inventories

   130    130    34    8    130 

Trade and other receivables

   17    18    1    2    18 

Current tax assets

   13    13    -        13 

Cash and cash equivalents

   19    19    -        19 

Other

   -    5    5    4    5 
  
   14    185 
   179    185    40   

Assets held for sale

   3,184    3,224    206    119    3,224 

Current liabilities


Trade payables and other current liabilities

   106    106    1    5    106 

Current tax liabilities

   11    11    -        11 

Provisions

   1    1    -        1 
   118    118    1 
   5    118 

Non-current liabilities


Pensions and post-retirement healthcare liabilities

   9    9    -    2    9 

Provisions

   1    1    -        1 

Financial liabilities

   1     

Deferred tax liabilities

   42    42    -    3    42 
   52    52    - 
   6    52 

Liabilities held for sale

   170    170    1    11    170 


(a(a))Refer

In 2018, disposal groups held for sale consists of assets mainly relating to note 21 for an explanation of this disposal.Alsa baking and dessert business.

(b)

In 2016,2017, disposal groups held for sale were primarily related to the AdeS soy beverageSpreads business in Latin America.which was disposed during the year.

Annual Report on Form 20-F 2018Financial Statements125


NOTES TO THE CONSOLIDATED FINANCIAL STATEMENTS

UNILEVER GROUPCONTINUED


23. RELATED PARTY TRANSACTIONS


A related party is a person or entity that is related to the Group. These include both people and entities that have, or are subject to, the influence or control of the Group.

The following related party balances existed with associate or joint venture businesses at 31 December:


Related party balances          € million
2017


         million 

2016 

          € million
2018
   

         million

2017

Trading and other balances due from joint ventures

   124     115    121   124

Trading and other balances due from/(to) associates

   -            

JOINT VENTURES

Sales by Unilever group companies to Unilever FIMA, LDA (formerly known as Unilever Jerónimo MartinsMartins) and Pepsi Lipton joint ventures were117107 million and65 million in 2017 (2016:2018 (2017:118117 million and6965 million) respectively. Sales from Unilever Jerónimo MartinsFIMA, LDA and from Pepsi Lipton joint ventures to Unilever group companies were83 million and51 million in 2018 (2017:68 million and65 million in 2017 (2016:million) respectively. Royalties and service fee paid by Unilever FIMA LDA to Unilever group companies were6616 million and(2017:5117 million) respectively.. Balances owed by/(to) Unilever Jerónimo MartinsFIMA, LDA and Pepsi Lipton joint ventures at 31 December 20172018 were127 million and(6) million (2017:130 million and(6) million (2016:119 million and(4) million) respectively.

136Financial StatementsAnnual Report on Form 20-F 2017


23. RELATED PARTY TRANSACTIONSCONTINUED

ASSOCIATES

Langholm Capital Partners invests in private European companies with above-average longer-term growth prospects.

Langholm Capital II was launched in 2009. Unilever has invested5862 million in Langholm Capital II, with an outstanding commitment at the end of 20172018 of1713 million (2016:(2017:1817 million). During 2017,2018, Unilever received0.3 million (2017:10 million (2016: nil)million) from its investment in Langholm Capital II.


24. SHARE BUYBACK PROGRAMME

On 6 April 2017, Unilever announced a share buyback programme of5 billion in 2017. As at 31 December 2017,During 2018 the group has repurchased 101,942,38362,202,168 Unilever N.V. ordinary shares as part of the programme which are held by Unilever as treasury shares. Consideration paid for the repurchase of shares including transaction costs was5,014 million which is recorded within other reserves.

25. PURCHASE OF PREFERENCE SHARES

On 11 October 2017 Unilever Corporate Holdings Nederland B.V., a wholly owned subsidiary of(2017: 50,250,099) and 63,236,433 Unilever PLC launched an unconditional and irrevocable offer for the purchase of the issued and outstanding 6% and 7% preferenceordinary shares in the capital of Unilever N.V. On 3 November 2017, the offer period ended with 99% of the preference shares having been tendered.

(2017: 51,692,284). Consideration paid for the repurchase of these shares in 2017including transaction costs was4486,020 million and a liability of(2017:2 million is5,014 million) which was initially recorded in other financial liabilities for the remaining 1% as statutory buy out proceedings have been initiated. As the preference shares were classified as debt in the balance sheet, the difference between consideration paid and carrying value of the shares of382 million is recorded within finance costs in the consolidated income statement.reserves.


26.25. REMUNERATION OF AUDITORS

This note includes all amounts paid to the Group’s auditors, whether in relation to their audit of the Group or otherwise. During the year the Group (including its subsidiaries) obtained the following services from the Group auditors and its associates:


          € million
2017
          million
2016
          million
2015
           € million
2018
          million
2017
          million
2016
 

Fees payable to the Group’s auditors for the audit of the consolidated and parent company accounts of Unilever N.V. and Unilever PLC(a)

   4   4   5    6   4   4 

Fees payable to the Group’s auditors for the audit of accounts of subsidiaries of Unilever N.V. and Unilever PLC pursuant to legislation(b)

   10   10   9    10   10   10 

Total statutory audit fees(c)

   14  14  14    16  14  14 

Audit-related assurance services

   (d)   (d)   (d)    (d)   (d)   (d)  
  

Other taxation advisory services

   (d)   (d)   (d)    (d)   (d)   (d)  
  

Services relating to corporate finance transactions


Other assurance services

   5(e)   (d)   (d)    5(e)   5(e)   (d)  
  

All othernon-audit services

   (d)   (d)   (d)    (d)   (d)   (d)  


(a(a))

Of which1 million was payable to KPMG Accountants N.V. (2016:(2017:1 million; 2015:2016:1 million) and45 million was payable to KPMG LLP (2016:(2017:4 million; 2016:3 million; 2015:4 million).

(b(b))

Comprises fees payable to the KPMG network of independent member firms affiliated with KPMG International Cooperative for audit work on statutory financial statements and Group reporting returns of subsidiary companies.

(c(c))

Amount payable to KPMG in respect of services supplied to associated pension schemes was less than1 million individually and in aggregate (2016:(2017: less than1 million individually and in aggregate; 2015:2016: less than1 million individually and in aggregate).

(d)

Amounts paid in relation to each type of service are individually less than1 million. In aggregate the fees paid were less than1 million (2016:(2017:1 million; 2015:2016:1 million).

(e)Includes

2018 includes4 million (2017:5 millionmillion) for audits and reviews ofcarve-out financial statements of the Spreads business.business and1 million (2017:Nil) for assurance work on Simplification.

126Financial StatementsAnnual Report on Form 20-F 2018


27.

26. EVENTS AFTER THE BALANCE SHEET DATE


Where events occurring after the balance sheet date provide evidence of conditions that existed at the end of the reporting period, the impact of these events is adjusted within the financial statements. Otherwise, events after the balance sheet date of a material size or nature are disclosed below.

On 1 February 201831 January 2019 Unilever announced a quarterly dividend with the 20172018 fourth quarter results of0.35850.3872 per NV ordinary share and £0.3155£0.3361 per PLC ordinary share.

On 5 February

27. SIGNIFICANT SUBSIDIARIES

The following represents the significant subsidiaries of the Group as 31 December 2018, that principally affect the turnover, profit, and net assets of the Group. The percentage of share capital is shown below represents the aggregate percentage of equity capital directly or indirectly held by NV or PLC in the company. The companies are incorporated and principally operated in the countries under which they are shown except where stated otherwise.

Country  Name of company  NV %   PLC % 

Argentina

  Unilever de Argentina S.A.   64.55    35.45 

Australia

  Unilever Australia Limited       100 

Brazil

  Unilever Brasil Ltda.   64.55    35.45 

Canada

  Unilever Canada Inc.   64.55    35.45 

China

  Walls (China) Co. Ltd.   100.00     

China

  Unilever Services (Hefei) Co Ltd   100.00     

England and Wales

  Unilever UK & CN Holdings Limited       100 

England and Wales

  Unilever U.K. Holdings Limited       100 

England and Wales

  Unilever UK Limited   5.61    94.39 

France

  Unilever France S.A.S   64.54    35.45 

Germany

  Maizena Grundstücksverwaltung GmbH & Co. OHG   63.61    36.39 

Germany

  Pfanni GmbH & Co. OHG Stavenhagen   64.55    35.45 

Germany

  Unilever Deutschland GmbH   64.55    35.45 

Germany

  Unilever Deutschland Holding GmbH   64.55    35.45 

Germany

  Unilever Deutschland Produktions GmbH & Co. OHG   64.55    35.45 

India

  Hindustan Unilever Limited       67.19 

Indonesia

  PT Unilever Indonesia, Tbk.   54.86    30.13 

Italy

  Unilever Italia Mkt Operations S.R.L   100.00     

Japan

  Unilever Japan Customer Marketing K.K.   100.00     

Mexico

  Unilever de Mexico, S. de R.I. de C.V.   64.55    35.45 

Netherlands

  Mixhold B.V.   64.55    35.45 

Netherlands

  Unilever Finance International B.V.   100.00     

Netherlands

  Unilever Nederland B.V.   100.00     

Netherlands

  UNUS Holding B.V.   55.40    44.60 

Pakistan

  Unilever Pakistan Limited       99.23 

Philippines

  Unilever Philippines, Inc.   64.55    35.45 

Poland

  Unilever Polska Sp. z o.o.       100.00 

Russia

  OOO Unilever Rus   11.89    88.11 

Singapore

  Unilever Asia Private Limited   100.00     

South Africa

  Unilever South Africa (Pty) Limited   8.98    91.02 

Spain

  Unilever Espana S.A.   100.00     

Switzerland

  Unilever ASCC AG   100.00     

Switzerland

  Unilever Finance International AG   100.00     

Switzerland

  Unilever Supply Chain Company AG   100.00     

Thailand

  Unilever Thai Trading Limited   64.55    35.45 

Turkey

  Unilever Sanayi ve Ticaret Turk A.S   64.54    35.44 

USA

  Conopco, Inc.   55.40    44.60 

USA

  Unilever Capital Corporation   55.40    44.60 

USA

  Unilever United States, Inc.   55.40            44.60 

Vietnam

  Unilever Vietnam International Company Limited   100.00     

Due to the inclusion of certain partnerships in the consolidated group financial statements of Unilever, issued a triple tranche2.0 billion bond, comprisingpara 264(b) of fixed rate notes of500 million at 0.5% due August 2023,700 million at 1.125% due February 2027the German trade law grants an exemption from the duty to prepare individual statutory financial statements and800 million at 1.625% due February 2033. management reports in accordance with the requirements for limited liability companies and to have these audited and published.


Annual Report on Form 20-F 20172018Financial Statements127


THIS PAGE INTENTIONALLY

LEFT BLANK

128Financial StatementsAnnual Report on Form 20-F 2018


THIS PAGE INTENTIONALLY

LEFT BLANK

Annual Report on Form 20-F 2018Financial Statements129


THIS PAGE INTENTIONALLY

LEFT BLANK

130Financial StatementsAnnual Report on Form 20-F 2018


THIS PAGE INTENTIONALLY

LEFT BLANK

Annual Report on Form 20-F 2018Financial Statements131


THIS PAGE INTENTIONALLY

LEFT BLANK

132Financial StatementsAnnual Report on Form 20-F 2018


THIS PAGE INTENTIONALLY

LEFT BLANK

Annual Report on Form 20-F 2018Financial Statements133


THIS PAGE INTENTIONALLY

LEFT BLANK

134Financial StatementsAnnual Report on Form 20-F 2018


THIS PAGE INTENTIONALLY

LEFT BLANK

Annual Report on Form 20-F 2018Financial Statements135


THIS PAGE INTENTIONALLY

LEFT BLANK

136Financial StatementsAnnual Report on Form 20-F 2018


THIS PAGE INTENTIONALLY

LEFT BLANK

Annual Report on Form 20-F 2018 Financial Statements 137


NOTES TO THE CONSOLIDATED FINANCIAL STATEMENTS

UNILEVER GROUPCONTINUED COMPANIES


28. GROUP COMPANIES

AS AT 31 DECEMBER 20172018

In accordance with sectionArticles 2:379 and 2:414 of the Dutch Civil Code and Section 409 of the Companies Act 2006 a list of subsidiaries, partnerships, associates, and joint ventures as at 31 December 20172018 is set out below. All subsidiary undertakings are subsidiary undertakings of their immediate parent undertaking(s) pursuant to section 1162 (2) (a) of the Companies Act 2006 unless otherwise indicated – see the notes on page 145. All subsidiary undertakings not included in the consolidation are not included because they are not material for such purposes. All associated undertakings are included in the Unilever Group’s financial statements using the equity method of accounting unless otherwise indicated – see the notes on page 145. See page 127 of the Annual Report and Accounts for a list of the significant subsidiaries.

Companies are listed by country and under their registered office address. Principal group companies are identified inbold CAPS. These companies are incorporated and principally operate in the countries under which they are shown.

The aggregate percentage of capital held by the Unilever Group is shown after the subsidiary company name, except where it is 100%. If the Nominal Value field is blank, then the Share Class Note will identify the type of interest held in the entity.

SUBSIDIARY UNDERTAKINGS INCLUDED IN THE CONSOLIDATION


 Name of
 Undertaking


% holding

as between

NV /PLC


Nominal Value


Share 

Class 

Note 


Algeria - Zone Industrielle Hassi Ameur Oran 31000 

Unilever Algérie SPA (72.50)

 72.50/0 DZD 1,000.00 

Argentina - Tucumán 1, Piso 4°, Cdad. de Buenos Aires


Arisco S.A.

 64.55/35.45 ARA 1.00 

UNILEVER DE ARGENTINA S.A.

 64.55/35.45 ARA 1.00 

S.A.G.R.A. S.A. (98)

 63.26/34.74 ARA 1.00 

Argentina - Mendoza km 7/8 – Pocitos, San Juan


Helket S.A.

 64.55/35.45 ARA 1.00 

Australia - Level 17,2-26 Park Street, Sydney, NSW 2000


Ben & Jerry’s Franchising Australia Limited

 0/100 AUD 1.00 

Tea Too Pty Limited

 0/100 AUD 1.00 

TIGI Australia Pty Limited

 0/100 AUD 1.00 
 0/100 AUD 1.00 

Unilever Australia (Holdings) Pty Limited

 0/100 AUD 1.00 

Unilever Australia Group Partnership

 0/100   

Unilever Australia Group Pty Limited

 0/100 AUD 2.00 

Unilever Australia Limited

 0/100 AUD 1.00 

Unilever Australia Supply Services Limited

 0/100 AUD 1.00 

Unilever Australia Trading Limited

 0/100 AUD 1.00 

Australia - 111 Chandos Street, Crows Nest, NSW 2065


Dermalogica Holdings Pty Limited

 0/100 AUD 1.00 

Dermalogica Pty Limited

 0/100 AUD 2.00 

DLA Piper Australia, Level 38, 201 Elizabeth Street, Sydney, NSW 2000


Dollar Shave Club Australia Pty Limited

 55.40/44.60 AUD 1.00 

Austria-Stella-Klein-Löw Weg 13, 1023 Wien


Delico Handels GmbH

 100/0 EUR 36,337.00 

Kuner Nahrungsmittel GmbH

 100/0 EUR 36,336.00 

TIGI Handels GmbH

 100/0 EUR 36,336.00 

ULPC Handels GmbH

 100/0 EUR 218,019.00 

Unilever Austria GmbH

 100/0 EUR 10,000,000.00 

Unilever BCS Austria GmbH

 55.40/44.60 EUR 35,000.00 

Bangladesh - 51 Kalurghat Heavy Industrial Area, Kalurghat, Chittagong


Unilever Bangladesh Limited (60.75)

 0/60.75 BDT 100.00 

Belgium - Rond-Point Schuman, 6 Box 5, 1040 Ettebeek


Intuiskin SPRL

 100/0 EUR 185.50 

Belgium - Humaniteitslaan 292, 1190 Brussels


Unilever BCS Belgium NV /SA

 55.40/44.60                 No Par Value 

UNILEVER BELGIUM NV/SA

 100/0                 No Par Value 

Unilever Belgium Services SA/NV

 100/0                 No Par Value 

Unilever Lipton Tea NV/SA

 100/0                 No Par Value 

Bolivia - Av. Blanco Galindo Km. 10.4 Cochabamba


Unilever Andina Bolivia S.A.

 100/0 BOB 10.00 

Brazil - Rua Caio Prado, 267 – Room 13, São Paulo/SP


Alberto-Culver do Brasil Cosmeticos Limitada

 55.40/44.60 BRL 1.00 

Brazil - São Paulo, Estado de São Paulo, na Rua Pedroso Alvarenga, 1046, sala 147, ItaimBibi, CEP04531-004


Euphoria Ice Cream Comercio de Alimentos Limitada

 64.55/35.45 BRL 1.00 

Brazil - Rod. BR101-Norte, s/n, km. 43,6 – Room 4, Igarassu /PE


Cicanorte Industria de Conservas Alimenticas S.A.

 64.55/35.45 BRL 2.80 

Brazil - Av. Presidente Juscelino Kubitschek, 1.309 –13º floor – Room 19 – São Paulo/SP


RGG – Comércio E Representações

 64.55/35.45 BRL 1.00 

De Produtos De Higiene Pessoal Limitada


Brazil - Rua Pedroso Alvarenga, 1046, Suit 146, Itaim Bibi, Sao Paulo


Sorvete Escola Comercio de Alimentos Limitada

 64.55/35.45 BRL 1.00 

Brazil - Av. Dr. Cardoso de Melo, nº 1855, Room A, Suite 152, 15th floor, Vila Olímpia, São Paulo/SP CEP04548-005.


E-UB Comércio Ltda

 64.55/35.45 BRL 1.00 

Brazil - Av. Presidente Juscelino Kubitschek, 1.309 –13º floor – Room 21 – São Paulo/SP


UBA 2 – Comércio e Representação de Alimentos Limitada

 64.55/35.45 BRL 1.00 

Name of

Undertaking


% holding

as between

NV /PLC


Nominal Value


Share 

Class 

Note 


Brazil - Av. Presidente Juscelino Kubitschek, 1.309 –13º floor – Room 24 – São Paulo/SP  
UBI 2 – Comercio de Alimentos Limitada 64.55/35.45 BRL 1.00 
Brazil - Av. Presidente Juscelino Kubitschek, 1.309 –13º floor – Room 28 – São Paulo/SP  
UBI 4 – Comércio de Alimentos Limitada 64.55/35.45 BRL 1.00 
Brazil - Rod. BR 232, s/n, km. 13 – Jaboatão dos Guararapes/PE  
Unilever Brasil Gelados do Nordeste S.A. 64.55/35.45                 No Par Value 
 64.55/35.45                 No Par Value 
Brazil - Av. Presidente Juscelino Kubitschek, 1.309 – 9th floor, Zip Code04543-011, São Paulo/SP  
Unilever Brasil Gelados Limitada 64.55/35.45 BRL 1.00 
Brazil - Av. Presidente Juscelino Kubitschek, 1.309, 1stE 2ndFloors from 4thFloor to 8thFloor and from 10thFloor to 14thFloor, Vila Nova Conceicão, São Paulo/SP  
UNILEVER BRASIL LIMITADA 64.55/35.45 BRL 1.00 
Brazil - Av. Presidente Juscelino Kubitschek, 1.309 – 3rdFloor, São Paulo/SP  
Unilever Brasil Industrial Limitada 64.55/35.45 BRL 1.00 
Brazil - Av. Escola Politécnica, 760, 2º Floor – Room 6 – São Paulo/SP  
UP! Alimentos Limitada (50) 32.28/17.72 BRL 1.00 
Brazil - Av. Marechal Floriano, 19 – Room 1001 Part – Rio de Janeiro/RJ  
Veritas do Brazil Limitada (99) 63.90/35.10 BRL 1.00 
Brazil – Rua Sabiá, 45, Jardim Marieta, Osasco/SP  
SOLO ATS Participações do Brasil S.A 64.55/35.45                 No Par Value 
Mãe Terra Produtos Naturais Ltda. 64.55/35.45 BRL 1.00 
Bulgaria - City of Sofia, Borough Mladost, 1, Business Park, Building 3, Floor 1  
Unilever BCS Bulgaria EOOD 55.40/44.60 BGN 1,000.00 
Unilever Bulgaria EOOD 100/0 BGN 1,000.00 
Cambodia - No. 443A Street 105, Sangkat Boeung Pralit, Khan 7 Makara Phnom Penh Capital  
Unilever (Cambodia) Limited 100/0 KHR 20,000.00 
Canada - 3081, 3rd Avenue, Whitehorse, Yukon Territory, Y1A 4Z7  
Dermalogica Canada Limited 0/100                 No Par Value 
Canada - P.O. Box 49130, 2900 – 595 Burrard Street, Vancouver BC V7X 1J5  
Dollar Shave Club Canada, Inc 55.40/44.60 CAD 0.01 
Canada-195 Belfield Road, Rexdale, Toronto, Ontario M9W 1G9  
Rexdale Property Inc. 55.40/44.60                 No Par Value 
Unilever BCS Canada Inc. 55.40/44.60                 No Par Value 
Canada-800-885 West Georgia Street, Vancouver BC V6C 3H1  
Seventh Generation Family & Home ULC 55.40/44.60                 No Par Value 
Canada - 1000 rue de la Gauchetière Ouest, Bureau 2500, Montreal H3B 0A2  
4012208 Canada Inc. 64.54/35.46 No Par Value  
Canada - 160 Bloor Street East, Suite 1400, Toronto ON M4W 3R2  
Unilever Canada Inc. 64.54/35.46                 No Par Value 
 64.54/35.46                 No Par Value 
 0/100                 No Par Value 10 
 64.54/35.46                 No Par Value 11 
 64.54/35.46                 No Par Value 12 
Canada - Lawson Lundell LLP, 925 W Georgia St, Vancouver, BC V6C 3L2  
Hourglass Cosmetics Canada Limited 55.40/44.60                 No Par Value 
Cayman Islands - Walker Nominees Limited, 190 Elgin Ave, Georgetown, GCKY1-9001  
Personal Care Marketing & Technology Inc 55.40/44.60 KYD 1.00 
Chile- Av. Carrascal N°3351, Quinta Normal, Santiago  
UNILEVER CHILE LIMITADA 64.55/35.45   13 
Unilever Chile SCC Limitada 64.55/35.45   13 
China – 10th floor No.398, North Cao Xi Road, Xuhui District, Shanghai  
Blueair Shanghai Sales Co. Limited 100/0 RMB 1,000,000 
China - 298, Seaside Avenue, Hangzhou Bay New Zone  
Ningbo Qinyuan Marketing Services Co. Limited (67.71) 67.71/0 CNY 1.00 
China - 358, Ci Yi Road, Hangzhou Bay New Zone  
Ningbo Qinyuan Water Equipment Co. Limited (67.71) 67.71/0 CNY 1.00 
China - Seaside Avenue, Cixi Econimce and Technical Development Zone (Hangzhou Bay New Zone)  
Qinyuan Group Co. Limited (67.71) 67.71/0 CNY 1.00 

138Financial StatementsAnnual Report on Form 20-F 2017


 Name of
 Undertaking


% holding

as between

NV /PLC


Nominal Value


Share 

Class 

Note 


China - Room 23, Hall 5, No. 38, Lane 168, Xing Fu Li Road, Fenjing Town, Jinsham District, Shanghai 201100


Shanghai Qinyuan Environment Protection Technology Co. Limited (67.71)

 67.71/0 CNY 1.00 

China - No.33 North Fuquan Road, Shanghai, 200335


Unilever (China) Investing Company Limited

 100/0 USD 1.00 

China-88 Jinxiu Avenue, Hefei Economic and Technology Development Zone, Hefei, 230601


Unilever (China) Limited

 100/0 USD 1.00 

UNILEVER SERVICES (HEFEI) CO. LIMITED

 100/0 CNY 1.00 

China – No. 225 Jingyi Road, Tianjin Airport Economic Area, Tianjin


Unilever (Tianjin) Company Limited

 100/0 USD 1.00 

China - 1068 Ting Wei Road, Jinshanzui Industrial Region, Jinshan District, Shanghai


Unilever Foods (China) Co. Limited

 100/0 USD 1.00 

China - No. 1 Unilever Avenue, Pengshan Country, Sichuan Province 610016


Unilever (Sichuan) Company Limited

 100/0 USD 1.00 

China - No.16 Wanyuan Road, Beijing E&T Development, Beijing 100076


Walls (China) Co. Limited

 100/0 USD 1.00 

China - 358, Ci Yi Road, Hangzhou Bay New Zone


Zhejiang Qinyuan Water Treatment Technology Co. Limited (67.71)

 67.71/0 CNY 1.00 

China - Unit 1A, Building B5, Zhaoshangju Guangming Science and Technology Park, Guanguang Road, Guangming New District, Shenzhen City


Blueair Technology (Shenzen) Co. Limited

 100/0 CNY 1.00 

China – Room 306, Xinmao Building, No.2 South Tainana Road, Shanghai Free Trade Zone


Unilever Trading (Shanghai) Co. Ltd

 100/0 RMB 2,000,000 

Colombia - Av. El Dorado, No.69B-45. Bogota Corporate Center Piso 7, Bogotá


Unilever Colombia SCC S.A.S.

 100/0 COP 100.00 

Unilever Andina Colombia Limitada

 100/0 COP 100.00 

Costa Rica - La Asunción de Belén, Planta Industrial Lizano, Autopista Bernardo Soto


Unilever de Centroamerica S.A.

 100/0 CRC 1.00 

Costa Rica - Provincia de Heredia, Cantón Belén, Distrito de la Asunción, de la intersección Cariari- Belén, 400 Mts. Oeste, 800 Mts., al Norte


UL Costa Rica SCC S.A.

 100/0 CRC 1000.00 

Cote D’Ivoire-01 BP 1751 Abidjan 01, Boulevard de Vridi


Unilever-Cote D’Ivoire (89.98)

 0/ 89.98 XOF 5,000.00 

Cote D’Ivoire - Abidjan-Marcory, Boulevard Valery Giscard d’Estaing, Immeuble Plein Ciel, Business Center, 26 BP 1377, Abidjan 26


Unilever Afrique de l’Ouest

 0/100 XOF 10,000.00 

Croatia - Strojarska cesta 20, 10000 Zagreb


Unilever Hrvatska d.o.o.

 100/0 HRK 1.00 

Cuba - Zona Especial de Desarrollo Mariel, Provincia Artemisa


Unilever Suchel, S.A. (60)

 60/0 USD 1,000.00 

Cyprus - Head Offices, 195C Old Road Nicosia Limassol,CY-2540 Idalion Industrial Zone – Nicosia


Unilever Tseriotis Cyprus Limited (84)

 0/ 84 EUR 1.00 

Czech Republic - Rohanské nábřeží 670/17, Karlín, Praha 8, 186 00


Unilever BCS ČR, spol. s r.o.

 55.40/44.60 CZK 100,000.00 

Unilever ČR, spol. s r.o.

 0/100 CZK 210,000.00 

Denmark - Ørestads Boulevard 73, 2300 København S


Unilever BCS Danmark A/S

 55.40/44.60 DKK 1,000.00 

Unilever Danmark A/S

 100/0 DKK 1,000.00 

Denmark - Petersmindevej 30, 5000 Odense C


Unilever Produktion ApS

 100/0 DKK 100.00 

Djibouti-Haramous, BP 169


Unilever Djibouti FZCO Limited

 0/100 USD 20.00 

Dominican Republic - Ave. Winston Churchill, Torre Acrópolis Piso 17, Santo Domingo


Unilever Caribe, S.A.

 100/0 DOP 1,000.00 

Ecuador - Km 25 Vía a Daule, Guayaquil


Unilever Andina Ecuador S.A.

 100/0 USD 1.00 

Egypt- BourgEl-Arab City, Alexandria1


Fine Tea Co (SAE)

 0/100 EGP 2.00 

Unilever Mashreq – Foods (SAE)

 0/100 EGP 20.00 

Egypt - 6th of October City, 4th Industrial Zone, Piece Number 68, Giza


Unilever Mashreq – Home Care (SAE)

 0/100 EGP 2.00 

Unilever Mashreq – Personal Care (SAE)

 0/100 EGP 10.00 

Egypt - 14th May Bridge, Ezbet Hegazy, Alexandria


Unilever Mashreq International Company

 0/100 USD 1,000.00 

Egypt - Industrial Zone – 14th May Bridge, Smouha, Alexandria


Unilever Mashreq Trading LLC (60)

 0/60 EGP 10.00 

Egypt - BourgEl-Arab City, 1st Industrial Zone, Block 11, Piece Number 5, Alexandria


Unilever Mashreq – Tea (SAE)

 0/100 EGP 100.00 

Egypt – Flat no.4, third floor, building no. 78, Tereat Al Mariouteyya street, Faisal Al Haram, Gizah


Unilever Mashreq for Import and Export LLC

 0/100 EGP 100.00 

El Salvador - Nivel 19 Edificio Torre Futura, 87 av. Norte y calle El Mirador, Colonia Escalón, San Salvador


Unilever El Salvador SCC S.A. de C.V.

 100/0 USD 1.00 

Unilever de Centro America S.A.

 100/0 USD 1.00 

England and Wales - Unilever House, 100 Victoria Embankment, London, EC4Y 0DY


Accantia Group Holdings

 5.61/94.39 GBP 0.01 

(unlimited company)


Alberto-Culver (Europe) Limited

 55.40/44.60 GBP 1.00 
 Name of
 Undertaking


% holding

as between

NV /PLC


Nominal Value


Share 

Class 

Note 


Alberto-Culver Group Limited

 55.40/44.60 GBP 1.00 

Alberto-Culver UK Holdings Limited

 55.40/44.60 GBP 1.00 

Alberto-Culver UK Products Limited

 55.40/44.60 GBP 1.00 
 55.40/44.60 GBP 5.00 14 

Associated Enterprises Limited°

 0/100 GBP 1.00 

BBG Investments (France) Limited

 0/100 GBP 1.00 

Brooke Bond Assam Estates Limited

 0/100 GBP 1.00 

Brooke Bond Group Limited°

 0/100 GBP 0.25 

Brooke Bond South India Estates Limited°

 0/100 GBP 1.00 
 0/100 GBP 1.00 15 

CPC (UK) Pension Trust Limited

 0/100   16 

Hourglass Cosmetics UK Limited

 55.40/44.60 GBP 1.00 

Margarine Union (1930) Limited°

 0/100 GBP 1.00 
 0/100 GBP 0.01 17 
 0/100 GBP 1.00 18 
 0/100 GBP 1.00 68 
 0/100 GBP 1.00 69 

MBUK Trading Limited

 0/100 GBP 1.00 

Mixhold Investments Limited

 0/100 GBP 1.00 

Murad Europe Limited

 0/100 GBP 1.00 

Pukka Herbs Limited

 0/100 GBP 0.01 
 0/100 GBP 0.01 

TIGI Limited

 0/100 GBP 1.00 

Toni & Guy Products Limited°

 0/100 GBP 0.001 

UAC International Limited

 0/100 GBP 1.00 

UML Limited

 0/100 GBP 1.00 

Unidis Forty Nine Limited

 0/100 GBP 1.00 

Unilever Australia Investments Limited

 0/100 AUD 10.00 
 0/100 GBP 1.00 

Unilever Australia Partnership Limited

 0/100 AUD 10.00 
 0/100 GBP 1.00 

Unilever Australia Services Limited

 0/100 AUD 10.00 
 0/100 GBP 1.00 

UNILEVER BCS LIMITED

 55.40/44.60 GBP 1.00 

Unilever BCS UK Limited°

 55.40/44.60 GBP 1.00 
 0/100 GBP 1.00 19 

Unilever BCS UK Services Limited°

 55.40/44.60 GBP 1.00 
 0/100 GBP 1.00 19 

Unilever Company for Industrial Development Limited

 0/100 GBP 1.00 

Unilever Company for Regional Marketing and Research Limited

 0/100 GBP 1.00 

Unilever Corporate Holdings Limited°

 0/100 GBP 1.00 

Unilever Employee Benefit Trustees Limited

 0/100 GBP 1.00 

Unilever S.K. Holdings Limited

 0/100 GBP 1.00 

Unilever Innovations Limited

 0/100 GBP 0.10 
 0/100 GBP 1.00 20 

Unilever Overseas Holdings Limited°

 0/100 GBP 1.00 

Unilever Superannuation Trustees Limited

 0/100 GBP 1.00 

Unilever U.K. Central Resources Limited

 0/100 GBP 1.00 

UNILEVER U.K. HOLDINGS LIMITED°

 0/100 GBP 1.00 

UNILEVER UK & CN HOLDINGS LIMITED

 0/100 GBP 1.00 
 0/100 GBP 1.00 
 0/100 GBP 10.00 23 
 0/100 GBP 10.00 24 

Unilever UK Group Limited

 49.86/50.14 GBP 1.00 
 1.67/98.33 GBP 1.00 
 5.61/94.39 GBP 1.00 21 

Unilever US Investments Limited°

 0/100 GBP 1.00 

United Holdings Limited°

 0/100 GBP 1.00 
 99.67/0.33 GBP 500.00 22 

England and Wales - Unilever House, Springfield Drive, Leatherhead, KT22 7GR


Alberto-Culver Company (U.K.) Limited

 5.61/94.39 GBP 1.00 

TIGI International Limited

 0/100 GBP 1.00 

Unilever Pension Trust Limited

 0/100 GBP 1.00 

UNILEVER UK LIMITED

 5.61/94.39 GBP 1.00 

Unilever UK Pension Fund Trustees Limited

 0/100 GBP 1.00 

USF Nominees Limited

 0/100 GBP 1.00 

England and Wales - The Manser Building, Thorncroft Manor, Thorncroft Drive, Dorking, KT22 8JB


Dermalogica (UK) Limited

 0/100 GBP 1.00 

England and Wales - 16 Great Queen Street, Covent Garden, London, WC2B 5AH


Intuiskin Limited (In Liquidation)

 100/0 GBP 1.00 

England and Wales - 1st Floor, 16 Charles II Street, London, SW1Y 4QU


REN Limited

 0/100 GBP 1.00 

Unilever Ventures III Limited Partnership (86.25)

 57.50/28.75   

England and Wales – The Edison,223-231 Old Marylebone Road, London, NW1 5QT


REN Skincare Limited

 0/100 GBP 1.00 

England and Wales – 1 More Place, London, SE1 2AF


Accantia Health and Beauty Limited (In Liquidation)

 0/100 GBP 0.25 

Simple Toiletries Limited (In Liquidation)

 0/100 GBP 1.00 

Unidis Nineteen Limited (In Liquidation)

 0/100 GBP 1.00 

Annual Report on Form 20-F 2017Financial Statements139


NOTES TO THE CONSOLIDATED FINANCIAL STATEMENTS

UNILEVER GROUPCONTINUED

  Name of
  Undertaking


% holding

as

between

NV /PLC


Nominal

Value


Share  


Class  


Note  


Unilever Bestfoods UK Limited (In Liquidation) Algeria – Zone Industrielle Hassi Ameur Oran 31000

 0/100

Unilever Algérie SPA (72.50)

 GBP72.50/0 1.00DZD1,000.001  

Argentina – Tucumán 1, Piso 4°, Cdad. de Buenos Aires

Arisco S.A.

64.55/35.45ARA1.001  

Unilever De Argentina S.A.

64.55/35.45ARA1.001  

S.A.G.R.A. S.A. (98)

63.26/34.74ARA1.001  

Argentina – Mendoza km 7/8 – Pocitos, San Juan

Helket S.A.

64.55/35.45ARA1.00 1  

England and WalesAustralia5th floor, 6 St AndrewLevel 17,2-26 Park Street, London, EC4A 3AE,Sydney, NSW 2000

Unilever VenturesBen & Jerry’s Franchising Australia Limited

 0/100 GBP1.00AUD1.00 1  

Estonia - Kalmistu tee 28a, Tallinna linn, Harju maakond, 11216

Unilever Eesti AS

100/0EUR6.30

Ethiopia - Bole Sub City, Kebele 03/05, Lidiya Building, Addis Ababa

Unilever Manufacturing PLCTea Too Pty Limited

 0/100 ETB1,000.00AUD1.00 1  

Finland - Post Box 254, 00101 HelsinkiTIGI Australia Pty Limited

 0/100 AUD1.002  
 0/100 AUD1.003  

Unilever Finland OyAustralia (Holdings) Pty Limited

 100/00/100 EUR16.82AUD1.00 1  

Unilever Ingman Production OyAustralia Group Partnership

0/1004  

Unilever Australia Group Pty Limited

0/100AUD2.001  
0/100AUD1.002  
0/100AUD1.003  

Unilever Australia Limited

0/100AUD1.001  

Unilever Australia Supply Services Limited

0/100AUD1.001  

Unilever Australia Trading Limited

0/100AUD1.001  

Australia – 111 Chandos Street, Crows Nest, NSW 2065

Dermalogica Holdings Pty Limited

0/100AUD1.001  

Dermalogica Pty Limited

0/100AUD2.001  

Australia – DLA Piper - Australia. Level 22, No. 1 Martin Place, Sydney NSW 2000

Dollar Shave Club Australia Pty Limited

55.40/44.60AUD1.001  

Austria-Stella-Klein-Löw Weg 13, 1023 Wien

Delico Handels GmbH

 100/0 EUR1.00EUR36,337.00 1  

Finland - Roineentie 10, 00510 HelsinkiKuner Nahrungsmittel GmbH

 100/0 EUR36,336.00 1  

TIGI Handels GmbH

100/0EUR36,336.001  

ULPC Handels GmbH

100/0EUR218,019.001  

Unilever Austria GmbH

100/0EUR10,000,000.001  

Bangladesh – 51 Kalurghat Heavy Industrial Area, Kalurghat, Chittagong


Unilever Spreads Finland OyBangladesh Limited (60.75)

 55.40/44.600/60.75 EUR1,250.00BDT100.00 1  

France - 20, rue des Deux Gares, 92500, Rueil-MalmaisonBelgium – Rond-Point Schuman, 6 Box 5, 1040 Ettebeek


Alsa France S.A.S. (99.99)Intuiskin SPRL

 64.54/35.45100/0 No Par ValueEUR185.50 1  

Bestfoods France Industries S.A.S. (99.99)Belgium – Humaniteitslaan 292, 1190 Brussels

 64.54/35.45No Par Value

Cogesal-Miko S.A.S. (99.99)Unilever Belgium NV/SA

 64.54/35.45No Par Value

Fralib Sourcing Unit S.A.S. (99.99)

64.54/35.45No Par Value

Saphir S.A.S. (99.99)

64.54/35.45EUR1.00

Sfejer S.A.S. (99.99)

64.54/35.45No Par Value

Tigi Services France S.A.S. (99.99)

64.54/35.45100/0 No Par Value 1  

Unilever BCS France S.A.S.Belgium Services SA/NV

 55.40/44.60No Par Value

UNILEVER FRANCE S.A.S.(99.99)

64.54/35.45100/0 No Par Value 1  

Unilever France Holdings S.A.S. (99.99)Lipton Tea NV/SA

 64.54/35.45EUR1.00

Unilever France HPC Industries S.A.S. (99.99)

64.54/35.45EUR1.00

Unilever Retail Operations France (99.99)

64.54/35.45100/0 No Par Value 1  

France - 81 Rue De Seine, 75006 ParisBolivia – Av. Blanco Galindo Km. 10.4 Cochabamba


Unilever Andina Bolivia S.A.

100/0BOB10.001  

Brazil – Rua Caio Prado, 267 – Room 13, São Paulo/SP

Alberto-Culver do Brasil Cosmeticos Limitada

55.40/44.60BRL1.005  

Brazil – Rua Oscar Freire, n. 957, mezanino, room 1, Cerqueira Cesar, Zip Code01426-003, São Paulo/SP

Euphoria Ice Cream Comercio de Alimentos Limitada

64.55/35.45BRL1.005  

Brazil – Rod. BR101-Norte, s/n, km. 43,6 – Room 4, Igarassu /PE

Cicanorte Industria de Conservas Alimenticas S.A.

64.55/35.45BRL2.801  

Brazil – Av. das Nações Unidas, n. 14.261, 8th floor, qd 10, Wing B, Vila Gertrudes, ZIP Code04794-000 – São Paulo/SP

RGG – Comércio E Representações

64.55/35.45BRL1.005  

De Produtos De Higiene Pessoal Limitada


Grom France S.a.r.lBrazil – Rua Pedroso Alvarenga, 1046, Suit 146, Itaim Bibi, Sao Paulo

 100/

Sorvete Escola Comercio de Alimentos Limitada

64.55/35.45BRL1.005  

Brazil – Av. Dr. Cardoso de Melo, nº 1855, Room A, Suite 152, 15th floor, Vila Olímpia, SãoPaulo/SP CEP04548-005.

E-UB Comércio Ltda

64.55/35.45BRL1.005  

Brazil – Av. das Nações Unidas, n. 14.261, 8th floor, qd 7, Wing B, Vila Gertrudes, ZIP Code04794-000 – São Paulo/SP

UBA 2 – Comércio e Representação de

Alimentos Limitada

64.55/35.45BRL1.005  

Brazil – Av. das Nações Unidas, n. 14.261, 8th floor, qd 8, Wing B, Vila Gertrudes, ZIP Code04794-000 – São Paulo/SP

  Name of
  Undertaking


% holding

as

between

NV /PLC


Nominal

Value


Share  
Class  
Note  


UBI 2 – Comercio de Alimentos Limitada

 64.55/35.45 BRL1.00 5  

Brazil – Av. das Nações Unidas, n. 14.261, 8th floor, qd 9, Wing B, Vila Gertrudes, ZIP Code04794-000 – São Paulo/SP


UBI 4 – Comércio de Alimentos Limitada

 64.55/35.45 BRL1.00 5  

Brazil – Rod. BR 232, s/n, km. 13 – Jaboatão dosGuararapes/PE


Unilever Brasil Gelados do Nordeste S.A.

 64.55/35.45 No Par Value 2  
 64.55/35.45 No Par Value 3  

Brazil – Av. das Nações Unidas, n. 14.261, 7th floor, Wing B, Vila Gertrudes, Zip Code 04794-000, São Paulo/SP


Unilever Brasil Gelados Limitada

 64.55/35.45 BRL1.00 5  

Brazil – Av. das Nações Unidas, n. 14.261, 3rd to 6th and 8th to 10th floors, Wing B VilaGertrudes, Zip Code04794-000, São Paulo/SP


Unilever Brasil Limitada

 64.55/35.45 BRL1.00 5  

Brazil – Av. das Nações Unidas, n. 14.261, 3rd floor, Wing A, Vila Gertrudes, ZIP Code 04794-000, São Paulo/SP


Unilever Brasil Industrial Limitada

 64.55/35.45 BRL1.00 5  

Brazil – Rua Hungria, n. 1400, 5th floor, room 5C, Jardim Europa, Zip Code03178-200 São Paulo/SP


UP1 Alimentos Limitada (50) (In Liquidation)

 32.28/17.72 BRL1.00 5  

Brazil – Av. Marechal Floriano, 19 – Room 1001 Part – Rio de Janeiro/RJ


Veritas do Brazil Limitada (99)

 63.90/35.10 BRL1.00 5  

Brazil – Rua Sabiá, 45, Jardim Marieta, Osasco/SP


SOLO ATS Participações do Brasil S.A

 64.55/35.45 No Par Value 1  

Mãe Terra Produtos Naturais Ltda.

 64.55/35.45 BRL1.00 5  

British Virgin Islands – Pasea Estate, Road Town, Tortola


Aromatel Brands Inc.

 100/0 USD1.00 1  

Aromatel South Inc.

 100/0 USD1.00 1  

Ego Brands Inc.

 100/0 USD1.00 1  

Ego South Inc.

 100/0 USD1.00 1  

Savital Brands Inc.

 100/0 USD1.00 1  

Savital South Inc.

 100/0 USD1.00 1  

Fortident Brands Inc.

 100/0 USD1.00 1  

Fortident South Inc.

 100/0 USD1.00 1  

Bulgaria -City of Sofia, Borough Mladost, 1, Business Park, Building 3, Floor 1


Unilever Bulgaria EOOD

 100/0 BGN1,000.00 1  

Cambodia – No. 443A Street 105, Sangkat Boeung Pralit, Khan 7 Makara Phnom Penh Capital


Unilever (Cambodia) Limited

 100/0 KHR20,000.00 1  

Canada – 3081, 3rd Avenue, Whitehorse, Yukon Territory, Y1A 4Z7


Dermalogica Canada Limited

 0/100 No Par Value 6  

Canada – P.O. Box 49130, 2900 – 595 Burrard Street, Vancouver BC V7X 1J5


Dollar Shave Club Canada, Inc

 55.40/44.60 CAD0.01 7  

Canada-195 Belfield Road, Rexdale, Toronto, Ontario M9W 1G9


Rexdale Property Inc.

 55.40/44.60 No Par Value 7  

Canada-800-885 West Georgia Street, Vancouver BC V6C 3H1


Seventh Generation Family & Home ULC

 55.40/44.60 No Par Value 7  

Canada – 1000 rue de la Gauchetière Ouest, Bureau 2500, Montreal H3B 0A2


4012208 Canada Inc.

 64.55/35.45 No Par Value 7  

Canada – 160 Bloor Street East, Suite 1400, Toronto ON M4W 3R2


Unilever Canada Inc.

 64.55/35.45 No Par Value 8  
 64.55/35.45 No Par Value 9  
 0/100 No Par Value 10  
 64.55/35.45 No Par Value 11  
 64.55/35.45 No Par Value 12  

Canada – Lawson Lundell LLP, 925 W Georgia St, Vancouver, BC V6C 3L2


Hourglass Cosmetics Canada Limited

 55.40/44.60 No Par Value 7  

Chile- Av. Carrascal N°3351, Quinta Normal, Santiago


Unilever Chile Limitada

 64.55/35.45  13  

Unilever Chile SCC Limitada

 64.55/35.45  13  

China – 10th floor No.398, North Cao Xi Road, Xuhui District, Shanghai


Blueair Shanghai Sales Co. Limited

 100/0 CNY1.00 1  

China – 1st Floor, No. 78 Binhai 2nd Road, Hangzhou Bay, New District, Ningbo City, Zhejiang Province


Ningbo Hengjing Inspection Technology Co., Ltd

(67.71)

 67.71/0 CNY1.00 1  

China – 358, Ci Yi Road, Hangzhou Bay New Zone

138Group CompaniesAnnual Report on Form 20-F 2018


  Name of
  Undertaking

% holding
as

between

NV /PLC

Nominal

Value

Share  
Class  
Note  

Ningbo Qinyuan Water Equipment Co. Limited (67.71)

67.71/0 EUR10.00CNY1.00 1  

France - Parc Activillage des FontainesChinaBernin 38926 Crolles CedexSeaside Avenue, Cixi Econimce and Technical Development Zone (Hangzhou Bay New Zone)

Qinyuan Group Co. Limited (67.71)

67.71/0CNY1.001  

China – Room 23, Hall 5, No. 38, Lane 168, Xing Fu Li Road, Fenjing Town, Jinsham District, Shanghai 201100

Shanghai Qinyuan Environment Protection Technology Co. Limited (67.71)

67.71/0CNY1.001  

China – No.33 North Fuquan Road, Shanghai, 200335


Intuiskin S.A.S.Unilever (China) Investing Company Limited

 100/0 EUR1.00USD1.00 1  

France - ZI de la NorgeChina-88 Jinxiu Avenue, Hefei Economic and Technology Development Zone, Hefei, 230601

Unilever (China) Limited

100/0USD1.001  

Unilever Services (Hefei) Co. Limited

100/0CNY1.001  

ChinaChevigny Saint-Sauveur, 21800 QuetignyNo. 225 Jingyi Road, Tianjin Airport Economic Area, Tianjin


Amora Maille Societe Industrielle S.A.S.

64.54/35.45No Par Value

Germany - Gerresheimer Landstraße 71, 40627 Düsseldorf

Dermalogica GmbHUnilever (Tianjin) Company Limited

 100/0 EUR25,000.00USD1.00 1  

Germany - Am Strandkai 1, 20457 HamburgChina – 1068 Ting Wei Road, Jinshanzui Industrial Region, Jinshan District, Shanghai


DU Gesellschaft für ArbeitnehmerüberlassungUnilever Foods (China) Co. Limited

 64.54/35.45100/0 DEM50,000.00USD1.00 1  

mbHChina – No. 1 Unilever Avenue, Pengshan Country, Sichuan Province 610016


Unilever (Sichuan) Company Limited

100/0USD1.001  

China – No.16 Wanyuan Road, Beijing E&T Development, Beijing 100076

Walls (China) Co. Limited

100/0USD1.001  

China – 358, Ci Yi Road, Hangzhou Bay New Zone

Zhejiang Qinyuan Water Treatment Technology Co. Limited (67.71)

67.71/0CNY1.001  

China – Unit 1A, Building B5, Zhaoshangju Guangming Science and Technology Park, Guanguang Road, Guangming New District, Shenzhen City

Blueair Technology (Shenzen) Co. Limited

100/0USD 1.001  

China – Room 326, Xinmao Building, No.2 South Tainana Road, Shanghai Free Trade Zone

Unilever Trading (Shanghai) Co. Ltd

100/0RMB2,000,0001  

China – Seaside Avenue, Cixi Economic and Technological Development Zone (Hangzhou Bay New Zone)

Ningbo Hengjing Inspection Technology Co. Ltd

100/0CNY 1.001  

China – Floor 1, Building 2, No.33 North Fuquan Road, Shanghai, 200335

Shanghai CarverKorea Limited

0/100USD1.001  

Colombia – Av. El Dorado, No.69B-45. Bogota Corporate Center Piso 7, Bogotá

Unilever Colombia SCC S.A.S.

100/0COP100.001  

Unilever Andina Colombia Limitada

100/0COP100.001  

Costa Rica – La Asunción de Belén, Planta Industrial Lizano, Autopista Bernardo Soto

Unilever de Centroamerica S.A.

100/0CRC1.001  

Costa Rica – Provincia de Heredia, Cantón Belén, Distrito de la Asunción, de la intersección Cariari- Belén, 400 Mts. Oeste, 800 Mts., al Norte

UL Costa Rica SCC S.A.

100/0CRC1.001  

Cote D’Ivoire-01 BP 1751 Abidjan 01, Boulevard de Vridi

Unilever-Cote D’Ivoire (89.98)

0/89.98XOF5,000.001  

Cote D’Ivoire – Abidjan-Marcory, Boulevard Valery Giscard d’Estaing, Immeuble Plein Ciel, Business Center, 26 BP 1377, Abidjan 26

Unilever Afrique de l’Ouest

0/100XOF 10,000.001  

Croatia – Strojarska cesta 20, 10000 Zagreb


Unilever BCS Deutschland GmbHHrvatska d.o.o.

 55.40/44.60100/0 EUR25,000.00HRK1.00 1  

Unilever BCS Deutschland Immobilien LeasingCuba – Zona Especial de Desarrollo Mariel, Provincia Artemisa

 66.22/33.78

Unilever Suchel, S.A. (60)

60/0USD1,000.001  

Cyprus – Head Offices, 195C Old Road Nicosia Limassol,CY-2540 Idalion Industrial Zone – Nicosia


GmbH & Co. OHGLOGOUnilever Tseriotis Cyprus Limited (84)

 0/ 84EUR1.001  

Czech Republic – Rohanské nábřeží 670/17, Karlín, Praha 8, 186 00

Unilever ČR, spol. s r.o.

0/100CZK210,000.001  

Denmark – Ørestads Boulevard 73, 2300 København S

Unilever Danmark A/S

100/0DKK1,000.001  

Denmark – Petersmindevej 30, 5000 Odense C

Unilever Produktion ApS

100/0DKK100.001  

Djibouti-Haramous, BP 169


Unilever BCS IP Deutschland GmbH & Co.Djibouti FZCO Limited

 64.45/35.550/100USD20.001  

Dominican Republic – Ave. Winston Churchill, Torre Acrópolis Piso 17, Santo Domingo


OHGLOGOUnilever Caribe, S.A.

 100/0DOP1,000.001  

Ecuador – Km 25 Vía a Daule, Guayaquil


Unilever BCS Sourcing Deutschland GmbH &Andina Ecuador S.A.

 64.45/35.55100/0 USD1.00 41  

Co. OHGLOGOEgypt- BourgEl-Arab City, Alexandria1


Unilever BCS Verwaltungs GmbHFine Tea Co (SAE)

 55.40/44.600/100 EUR25.000,00EGP2.00 1  

UNILEVER DEUTSCHLAND GMBHUnilever Mashreq – Foods (SAE)

 64.55/35.450/100 EUR90,000,000.00
64.55/35.45EUR2,000,000.00
64.55/35.45EUR1,000,000.00EGP20.00 1  

UNILEVER DEUTSCHLAND HOLDING GMBHEgypt – 6th of October City, 4th Industrial Zone, Piece Number 68, Giza

 64.55/35.45

Unilever Mashreq – Home Care (SAE)

 EUR0/100 39,000.00
64.55/35.45EUR18,000.00
64.55/35.45EUR14,300.00
64.55/35.45EUR5.200.00
64.55/35.45EUR6,500.00EGP2.00 1  

UNILEVER DEUTSCHLAND PRODUKTIONSUnilever Mashreq – Personal Care (SAE)

 64.55/35.450/100EGP10.001  

Egypt – 14th May Bridge, Ezbet Hegazy, Alexandria


Unilever Mashreq International Company

 40/100USD1,000.001  

GMBH & CO. OHGLOGOEgypt – Industrial Zone – 14th May Bridge, Smouha, Alexandria


Unilever Mashreq Trading LLC (60)

0/60EGP10.001  

Egypt – BourgEl-Arab City, 1st Industrial Zone, Block 11, Piece Number 5, Alexandria

Unilever Mashreq – Tea (SAE)

0/100EGP100.001  

Egypt – Flat no.4, third floor, building no. 78, Tereat Al Mariouteyya street, Faisal Al Haram, Gizah

Unilever Mashreq for Import and Export LLC

0/100EGP100.001  
  Name of
  Undertaking

% holding
as

between

NV /PLC

Nominal

Value

Share  
Class  
Note  

El Salvador – Nivel 19 Edificio Torre Futura, 87 av. Norte y calle El Mirador, Colonia Escalón, San Salvador

Unilever El Salvador SCC S.A. de C.V.

100/0USD1.001  

Unilever de Centro America S.A. de C.V

100/0USD1.001  

England and Wales – Unilever House, 100 Victoria Embankment, London, EC4Y 0DY

Accantia Group Holdings

5.61/94.39GBP0.011  

(unlimited company)


Unilever Deutschland Produktions VerwaltungsAlberto-Culver (Europe) Limited

 64.55/35.4555.40/44.60 EUR179,000.00GBP1.00 1  

GmbHAlberto-Culver Group Limited

 55.40/44.60GBP1.001  

Alberto-Culver UK Holdings Limited

55.40/44.60GBP1.001  

Alberto-Culver UK Products Limited

55.40/44.60GBP1.001  
55.40/44.60GBP5.0014  

Associated Enterprises Limited°

0/100GBP1.001  

BBG Investments (France) Limited

0/100GBP1.001  

Brooke Bond Assam Estates Limited

0/100GBP1.001  

Brooke Bond Group Limited°

0/100GBP0.251  

Brooke Bond South India Estates Limited°

0/100GBP1.001  
0/100GBP1.0015  

CPC (UK) Pension Trust Limited

0/10016  

Hourglass Cosmetics UK Limited

55.40/44.60GBP1.001  

Margarine Union (1930) Limited°

0/100GBP1.001  
0/100GBP1.0018  
0/100GBP1.0068  
0/100GBP1.0069  

MBUK Trading Limited

0/100GBP1.001  

Mixhold Investments Limited

0/100GBP1.001  

Pukka Herbs Limited

0/100GBP0.012  
0/100GBP0.013  

T2 Tea (UK) Limited

0/100GBP1.001  

TIGI Limited

0/100GBP1.001  

TIGI Holdings Limited

0/100GBP1.001  

Toni & Guy Products Limited°

0/100GBP0.0011  

UAC International Limited

0/100GBP1.001  

UML Limited

0/100GBP1.001  

Unidis Forty Nine Limited

0/100GBP1.001  

Unilever Australia Investments Limited

0/100AUD10.002  
0/100GBP1.001  

Unilever Australia Partnership Limited

0/100AUD10.002  
0/100GBP1.001  

Unilever Australia Services Limited

0/100AUD10.002  
0/100GBP1.001  

Unilever Company for Industrial Development


Unilever Deutschland Supply Chain ServicesLimited

 64.55/35.450/100 EUR51,150.00GBP1.00 1  

GmbHUnilever Company for Regional Marketing and Research Limited

 0/100 GBP1.001  

Unilever Corporate Holdings Limited°

0/100GBP1.001  

Unilever Employee Benefit Trustees Limited

0/100GBP1.001  

Unilever S.K. Holdings Limited

0/100GBP1.001  

Unilever Innovations Limited

0/100GBP0.101  
 0/100GBP1.0020  

Unilever Overseas Holdings Limited°

0/100GBP1.001  

Unilever Superannuation Trustees Limited

0/100GBP1.001  

Unilever U.K. Central Resources Limited

0/100GBP1.001  

Unilever U.K. Holdings Limited°

0/100GBP1.001  

Unilever UK & CN Holdings Limited

0/100GBP1.002  
0/100GBP1.003  
0/100GBP10.0023  
0/100GBP10.0024  

Unilever UK Group Limited

49.86/50.14GBP1.002  
1.67/98.33GBP1.003  
5.61/94.39GBP1.0021  

Unilever US Investments Limited°

0/100GBP1.001  

United Holdings Limited°

0/100GBP1.001  
99.67/0.33GBP500.0022  

England and Wales – Unilever House, Springfield Drive, Leatherhead, KT22 7GR


Germany - Schultetusstraße 37, 17153 StavenhagenAlberto-Culver Company (U.K.) Limited

 5.61/94.39GBP1.001  

TIGI International Limited

0/100GBP1.001  

Unilever Pension Trust Limited

0/100��GBP1.001  

Unilever UK Limited

5.61/94.39GBP1.001  

Unilever UK Pension Fund Trustees Limited

0/100GBP1.001  

USF Nominees Limited

0/100GBP1.001  

England and Wales – The Manser Building, Thorncroft Manor, Thorncroft Drive, Dorking, KT22 8JB

Dermalogica (UK) Limited

0/100GBP1.001  

England and Wales – 1st Floor, 16 Charles II Street, London, SW1Y 4QU


MAIZENA GRUNDSTÜCKSVERWALTUNG GMBH& CO. OHGLOGO  (99.99)Unilever Ventures III Limited Partnership (86.25)

 63.60/36.3957.50/28.75  4  

PFANNI GMBHEngland and Wales – Union House,182-194 Union Street, London, England, England, SE1 0LH & CO. OHG STAVENHAGENLOGO

64.54/35.45

(99.99)


Rizofoor Gesellschaft mit beschränkter Haftung

96.45/3.55EUR15,350.00
100/0EUR138,150.00

Schafft GmbH

64.55/35.45EUR63,920.00
64.55/35.45EUR100,000.00

UBG Vermietungs GmbH

64.74/35.26EUR136,377,489.00

Unilever Deutschland Immobilien Leasing

66.33/33.67

GmbH & Co. OHGLOGO

Unilever Deutschland IPR GmbH & Co. OHGLOGO

64.55/35.45

Germany - Hertzstraße 6, 71083Herrenberg-Gülstein

TIGI Eurologistic GmbH

PLC 100EUR100.00

TIGI Haircare GmbH

PLC 100EUR25,600.00

Ghana -Swanmill, Kwame Nkrumah Avenue, Accra

Millers Swanzy (Ghana)REN Skincare Limited

 0/100 GHC1.00GBP1.00 1  

Ghana - Plot No.Ind/A/3A-4, Heavy Industrial Area, Tema

Unilever Ghana InvestmentsREN Limited (66.56)

 0/66.56100 GHC10.00GBP1.00 1  

Unilever GhanaMurad Europe Limited (66.56)

 0/66.56100 GHC0.0192GBP1.00 1  

Greece - Kymis ave & 10, Seneka str.GR-145 64 KifissiaEngland and Wales – 1 More Place, London, SE1 2AF


ELAIS UNILEVER HELLAS SA

100/0EUR10.00

Elanthi SA

100/0EUR10.001 

 Name of

 Undertaking


% holding

as between

NV /PLC


Nominal Value


Share 

Class 
Note 


Unilever Knorr SA 100/0 EUR 10.00 
UL BCS Logistics Consulting SA 100/0 EUR 10.00 
Unilever Logistics SA 100/0 EUR 10.00 
Guatemala - Diagonal 6.10-50 zona 10, Ciudad de Guatemala. Nivel 17 Torre Norte Ed. Interamericas World Financial Center
Unilever de Centroamerica S.A. Guatemala 100/0 GTQ 60.00 
Guatemala - 24 Avenida, Calzada Atanacio Tzul,35-87 Zona 12 Ciudad de Guatemala  
Unilever Guatemala SCC S.A. 100/0 GTQ 100.00 
Honduras - Anillo Periférico 600 metros después de la colonia, Residencial, Las Uvas contigua acceso de residencial Roble Oeste,Tegucigalpa M.D.C.
Unilever de Centroamerica S.A. Honduras 100/0 HNL 10.00 
Hong Kong -Suite1106-8, 11/F, Tai Yau Building, 181 Johnston Road, Wanchai
Blueair Asia Limited 100/0 HKD 0.01 
Hong Kong - Room 1505, Wheelock House, 20 Pedder Street, Central
Kate Somerville Skincare, Hong Kong Limited 100/0 HKD 1.00 
(In liquidation)    
Hong Kong - 6 Dai Fu Street, Tai Po Industrial Estate, N.T.  
Unilever Hong Kong Limited 64.55/35.45 HKD 0.10 
Hong Kong - Suite 907, 9/F, Silvercord Tower 2, 30 Canton Road, Tsim Sha Tsui, Kowloon
Hourglass Cosmetics Hong Kong Limited 55.40/44.60 No Par Value 
Hungary - 1138-Budapest, Váci u. 182  
Multifrozen Kereskedelmi Kft 0/100 HUF 1.00 
Unilever BCS Hungary Kft 55.40/44.60 HUF 1.00 
Unilever Magyarország Kft 0/100 HUF 1.00 
India - Unilever House, B. D. Sawant Marg, Chakala, Andheri (E), Mumbai 400 099 
Daverashola Estates Private Limited (67.20) 0/67.20 INR 10.00 
Hindlever Trust Limited (67.20) 0/67.20 INR 10.00 
HINDUSTAN UNILEVER LIMITED°(67.20) 0/67.20 INR 1.00 
Jamnagar Properties Private Limited (67.20) 0/67.20 INR 10.00 
Levers Associated Trust Limited (67.20) 0/67.20 INR 10.00 
Levindra Trust Limited 0/67.20 INR 10.00 
Pond’s Exports Limited (67.20) 0/67.20 INR 1.00 
Unilever India Exports Limited (67.20) 0/67.20 INR 10.00 
Unilever Industries Private Limited° 0/100 INR 10.00 
Unilever Ventures India Advisory Private Limited 0/100 INR 1.00 
India -S-327, Greater Kailash – II, New Delhi – 110048, Delhi
Blueair India Pvt. Limited 99.98/0.02 INR 10. 00 
India - 1st Floor, Shreeniwas House, H. Somani Marg, (behind Bombay Gymkhana) Fort, Mumbai 40001
Lakme Lever Private Limited (67.20) 0/67.20 INR 10.00 
Indonesia - Grha Unilever, Green Office Park Kav 3, Jalan BSD Boulevard Barat, BSD City, Tangerang, 15345
PT UNILEVER INDONESIA TBK(84.99) 54.86/30.13 IDR 10.00 
PT Unilever Enterprises Indonesia (99.26) 64.07/35.19 IDR 1,000.00 
PT Unilever Trading Indonesia 100/0 IDR 1,003,875.00 
Indonesia - KEK Sei Mangkei, Nagori Sei Mangkei, Kecamatan Bosar Maligas, Kabupaten Simalungun 21183, Sumatera Utara
PT Unilever Oleochemical Indonesia 100/0 IDR 1,000,000.00 
Iran - 137 Shiraz Building, Corner of the 21st Street, Khaled Eslamboli Ave, Tehran
Unilever Iran (Private Joint Stock Company) 99.35/0 IRR 1,000,000.00 
(99.35)    
Ireland - 20 Riverwalk, National Digital Park, Citywest Business Campus Dublin 24
Lipton Soft Drinks (Ireland) Limited 0/100 EUR 1.26 
Unilever BCS Ireland Limited   55.40/44.60 EUR 1.00 
Unilever Ireland (Holdings) Limited  0/100 EUR 1.26 
Unilever Ireland Limited  0/100 EUR 1.26 
Isle of Man - Bridge Chambers, West Quay, Ramsey, Isle of Man, IM8 1DL
Rational International Enterprises Limited 0/100 USD 1.00 
Israel - 3 Gilboa St. Airport City, Ben Gurion Airport  
Beigel & Beigel Mazon (1985) Limited 12.80/87.20 ILS 1.00 
Israel - 52 Julius Simon Street, Haifa, 3296279  
Bestfoods TAMI Holdings Ltd 25.11/74.89 ILS 0.001 
Israel Vegetable Oil Company Ltd 25.11/74.89 ILS 0.0001 
Unilever Israel Foods Ltd 25.10/74.90 ILS 0.10 
 25.10/74.90 ILS 0.10 
 25.10/74.90 ILS 0.10 10 
 25.10/74.90 ILS 0.0002 25 
Unilever Israel Home and Personal Care Limited 0/100 ILS 1.00 
Unilever Israel Marketing Ltd 25.11/74.89 ILS 0.0001 
Unilever Shefa Israel Ltd 25.11/74.89 ILS 1.00 
Israel - Haharoshet 1, PO Box 2288, Akko, 2451704  
Glidat Strauss Limited 0/100 ILS 1.00 30 
 0/100 ILS 1.00 
 0/0 ILS 1.00 31 
Italy - Piazza Paleocapa 1/D, 10100, Torino  
Gromart S.R.L. 100/0 EUR 1,815,800.00 
Italy - Via Crea 10, 10095, Grugliasco  
G.L.L. S.R.L. (51) 51/0 EUR 40,000.00 
Italy - Via Roma 101, 35122, Padova  
Grom-PD S.R.L. 100/0 EUR 40,000.00 
Italy - Via Tortona 25, cap 20144 – Milano  

140Financial StatementsAnnual Report on Form 20-F 2017


 Name of
 Undertaking


% holding
as between
NV /PLC


Nominal Value


Share
Class
Note


Intuiskin S.R.L.

 100/0 EUR  10,000.00  5

Italy - Piazzale Biancamano n.8, 20121, Milano


Unilever Italia Administrative Services S.R.L.

 100/0 EUR  70,000.00  5

Italy - Via Paolo di Dono 3/A 00142 Roma


Unilever BCS Italia S.R.L.

 55.40/44.60 EUR  10,000.00  5

Unilever Italia Logistics S.R.L.

 100/0 EUR  600,000.00  5

Unilever Italia Manufacturing S.R.L.

 100/0 EUR  10,000,000.00  5

Unilever Italia Mkt Operations S.R.L.

 100/0 EUR  25,000,000.00  5

UNILEVER ITALY HOLDINGS S.R.L.

 100/0 EUR  200,000.00  5

Japan -2-1-1, Kamimeguro, Meguro-ku, Tokyo153-8578


Unilever Japan Beverage K.K.

 100/0 JPY  50,000.00  1

Unilever Japan Customer Marketing K.K.

 100/0 JPY  50,000.00  1

Unilever Japan Holdings K.K.

 100/0 JPY  10,000.00  1

UNILEVER JAPAN K.K.

 100/0 JPY  50,000.00  1

Unilever Japan Service K.K.

 100/0 JPY  50,000.00  1

Jersey - 13 Castle Street, St Helier, Jersey, JE4 5UT


Unilever Chile Investments Limited

 64.55/35.45 GBP  1.00  1

Jordan - Amman


Unilever Jordan LLC

 100/0 JOD  10.00  1

Kazakhstan - Raimbek, Avenue 160 A, Office 401, Almaty


Unilever Kazakhstan LLP

 100/0     4

Kenya - Head Office, Kericho-Nakuru Road, P.O. BOX 20, 20200, Kericho


Brooke Bond Mombasa Limited (98.19)

 0/98.19 KES  1.00  1

Mabroukie Tea & Coffee Estates Limited (98.19

 0/98.19 KES  1.00  1

The Limuru Tea Company Limited (51.08)

 0/51.08 KES  20.00  1

Unilever Tea Kenya Limited (98.20)

 0/98.20 KES  1.00  1

Kenya - Commercial Street, Industrial Area, P.O. BOX 30062-00100, Nairobi


Unilever Kenya Limited°

 0/100 KES  20.00  1

Korea - 443Taeheran-ro, Samsung-dong,Kangnam-gu, Seoul


Unilever Korea Chusik Hoesa

 100/0 KRW  10,000.00  1
 100/0 KRW  10,000.00  14

Laos - Viengvang Tower, 4th Floor, Room no. 402A, Boulichan Road, Dongpalan ThongVillage, Sisattanak District, Vientiane Capital

Unilever Services (Lao) Sole Co Limited

 100/0 LAK  800,000.00  1

Latvia - Kronvalda bulvāris3-10, Rīga,LV-1010


Unilever Baltic LLC

 100/0 EUR  1.00  1

Lebanon - Sin El Fil, Zakher Building, Floor 4, Beirut


Unilever Levant s.a.r.l.

 100/0 LBP  1,000,000.00  1

Lithuania - Skuodo st. 28, Mazeikiai,LT-89100


UAB Unilever Lietuva distribucija

 100/0 EUR  3,620.25  1

UAB Unilever Lietuva ledu gamyba

 100/0 EUR  3,620.25  1

Malawi - Abdul Majid Motor City, Chipembere Highway, Ginnery Corner, Blantyre

Unilever South East Africa (Private) Limited

 0/100 MWK  2.00  1

Malaysia - Level 34, Menara TM, Jalan Pantai Baru, 59200 Kuala Lumpur


Unilever (Malaysia) Holdings Sdn. Bhd. (70)

 0/70 RM  1.00  1

Unilever (Malaysia) Services Sdn. Bhd. (70)

 0/70 RM  1.00  1

Unilever Foods (Malaysia) Sdn. Bhd.

 0/100 RM  75.00  1

Unilever Malaysia Aviance Sdn. Bhd.

 0/100 RM  1.00  1

Mexico - Av. Tepalcapa No.2, Col. Rancho Santo Domingo, C.P. 54900 Tultitlán, Estado de

México


UNILEVER DE MEXICO S.DE R.L. DE C.V.

 64.55/35.45     4

Unilever Holding Mexico S.de R.L. de C.V.

 64.55/35.45     4

Unilever Manufacturera S.de R.L. de C.V.

 64.55/35.45     4

Servicios Professionales Unilever S.de R.L. de C.V.

 64.55/35.45     4

Unilever Mexicana S.de R.L. de C.V.

 64.55/35.45     4

Unilever Real Estate Mexico S.de R.L. de C.V.

 64.55/35.45     4

Unilever Servicios de Promotoria, S.de R.L. de C.V.

 64.55/35.45     4

Morocco - Km 10, Route Cotiere, Ain Sebaa, Casablanca


Unilever Maghreb S.A. (99.98)

 99.98/0 MAD  100.00  1

Mozambique - Avenida 24 de Julho, Edifício 24, nº 1097, 4º andar, Maputo


Unilever Mocambique Limitada

 100/0 USD  0.01  1

Myanmar – No (40,41,47), Min Thate Di Kyaw Swar Street, Shwe Pyi Thar Industrial Zone (2), Shwe Pyi Thar Township, Yangon

Unilever (Myanmar) Limited

 100/0 MMK  8,200.00  1

Myanmar – No (196), West Shwe Gone Dine 5thStreet, Bahan Township, Yangon

Unilever (Myanmar) Services Limited

 100/0 USD  10.00  1

Myanmar - Lot No.28,30,31, Hlaing Thar Yar Industrial Zone (3), Hlaing Thar Yar Township,

Yangon


Unilever EAC Myanmar Company Limited (60)

 60/0 MAMK  1,000,000.00  1

Nepal - Basamadi V.D.C. – 5, P.O.Box-11, Hetauda, Dist. Makwanpur


Unilever Nepal Limited (53.76)

 0/53.76 NPR  100.00  1

Netherlands- Weena 455, 3013 AL Rotterdam


Alberto-Culver Netherlands B.V.*

 55.40/44.60 EUR  1.00  2
 55.40/44.60 EUR  1.00  3

Argentina Investments B.V.*

 64.55/35.45 EUR  454.00  1

BFO Holdings B.V.*

 64.55/35.45 EUR  1.00  1

BFO TWO B.V.*

 55.40/44.60 EUR  1.00  1

BrazH1 B.V.*

 64.55/35.45 EUR  1.00  1

BrazH2 B.V.*

 64.55/35.45 EUR  1.00  1

Brazinvest B.V.*

 64.55/35.45 EUR  1.00  1

Brazinvestee B.V.*

 64.55/35.45 EUR  1.00  1

Chico-invest B.V.*

 64.55/35.45 EUR  455.00  1

 Name of

 Undertaking


% holding

as between NV /PLC


Nominal Value


Share Class Note


Dollar Shave Club B.V.*

 100/0 EUR  1.00  1

Doma B.V.*

 100/0 NLG  1,000.00  1

Handelmaatschappij Noorda B.V.°*

 100/0 NLG  1,000.00  1

Unilever Foods & Refreshment Global B.V.*

 100/0 NLG  1,000.00  1

Itaho B.V.*

 100/0 EUR  1.00  1

Lipoma B.V.°*

 100/0 NLG  1,000.00  1

Marga B.V.°*

 100/0 EUR  1.00  1

Mavibel (Maatschappij voor Internationale

 100/0 EUR  1.00  1

Beleggingen) B.V.°*


Mexinvest B.V.*

 64.55/35.45 EUR  1.00  1

MIXHOLD B.V.*

 100/0 EUR  1.00  2
 0/100 EUR  1.00  1
 55.40/44.60 EUR  1.00  26

Naamlooze Vennootschap Elma°*†

 100/0 NLG  1,000.00  1
 0.25/99.75 NLG  1,000.00  27

New Asia B.V.*

 64.55/35.45 EUR  1.00  1

Nommexar B.V.*

 64.55/35.45 EUR  1.00  1

Ortiz Finance B.V.*

 64.55/35.45 NLG  100.00  1

Pabulum B.V.*

 100/0 NLG  1,000.00  1

Rizofoor B.V.*

 0/100 NLG  1,000.00  1

Rolf von den Baumen’s Vetsmelterij B.V.*

 100/0 EUR  454.00  1

Rolon B.V.*

 64.55/35.45 NLG  1,000.00  1

Saponia B.V.°*

 100/0 NLG  1,000.00  1

ThaiB1 B.V.*

 64.55/35.45 NLG  1,000.00  1

ThaiB2 B.V.*

 64.55/35.45 NLG  1,000.00  1

Unilever Administration Centre B.V.*

 100/0 EUR  1.00  1

Unilever Alser B.V.*

 100/0 EUR  1.00  1

Unilever BCS Europe B.V.*

 55.40/44.60 EUR  1.00  1

Unilever BCS Holdings B.V.*

 55.40/44.60 EUR  1.00  1

Unilever BCS NL Holdings Two B.V.*

 55.40/44.60 EUR  1.00  1

Unilever Berran B.V.*

 100/0 EUR  1.00  1

Unilever Canada Investments B.V.*

 64.55/35.45 EUR  1.00  1

Unilever Caribbean Holdings B.V.*

 100/0 EUR  1,800.00  1

Unilever Corporate Holdings B.V.

 100/0 EUR  0.01  1

Unilever Employee Benefits Management B.V.*

 0/100 NLG  1,000.00  1

Unilever Employment Services B.V.*

 100/0 NLG  1,000.00  1

Unilever Europe B.V.*

 100/0 EUR  1.00  1

Unilever Europe Business Center B.V.*

 100/0 EUR  454.00  1

UNILEVER FINANCE INTERNATIONAL B.V.°*

 100/0 EUR  1.00  1

Unilever Foodsolutions B.V.*

 100/0 EUR  1.00  1

Unilever Global Services B.V.*

 100/0 EUR  1.00  1

Unilever Holdings B.V.*

 100/0 EUR  454.00  1

Unilever Home & Personal Care Nederland

 100/0 EUR  100.00  1

B.V.*


Unilever Indonesia Holding B.V.*

 64.55/35.45 EUR  1.00  1

Unilever Insurances N.V.

 100/0 EUR  454.00  1

Unilever Netherlands Retail Operations B.V.*

 100/0 EUR  1.00  1

Unilever Nederland Holdings B.V.°*

 100/0 EUR  454.00  1

Unilever Turkey Holdings B.V.*

 64.55/35.45 EUR  1.00  1

Unilever US Investments B.V.°*

 100/0 EUR  1.00  1

Unilever Ventures Holdings B.V.

 100/0 EUR  453.79  1

Univest Company B.V.

 100/0 EUR  1.00  1

UNUS HOLDING B.V.*

 100/0 EUR  0.10  2
 0/100 EUR  0.10  3

 0/0 EUR  0.10  28
  Non-voting†  

Verenigde Zeepfabrieken B.V.*

 100/0 NLG  1,000.00  1

Wemado B.V.°*

 100/0 NLG  1,000.00  1

Netherlands - Nassaukade 5, 3071 JL Rotterdam


Tessa B.V.*

 100/0 EUR  1.00  1

Unilever BCS Nederland B.V.*

 55.40/44.60 EUR  1.00  1

UNILEVER NEDERLAND B.V.*

 100/0 EUR  454.00  1

Unilever Nederland Foods Factories B.V.*

 100/0 EUR  46.00  1

Netherlands - Reggeweg 15, 7447 AN Hellendoorn


Ben en Jerry’s Hellendoorn B.V.*

 100/0 EUR  453.78  1

Netherlands - Deltaweg 150, 3133 KM Vlaardingen


Lever Faberge Europe-Sourcing Unit

 100/0 NLG  1,000.00  1

Vlaardingen B.V.*


Netherlands - Olivier van Noortlaan 120, 3133 AT Vlaardingen


Unilever BCS Research and Development B.V.*

 55.40/44.60 EUR  1.00  1

Unilever Research and Development

 100/0 EUR  460.00  1

Vlaardingen B.V.*


Netherlands - Nassaukade 3, 3071 JL Rotterdam


Unilever BCS Sourcing Nederland B.V.*

 55.40/44.60 EUR  1.00  1

Unilever Nederland Services B.V.*

 100/0 EUR  460.00  1

Netherlands - Unilever House, 100 Victoria Embankment, London, EC4Y 0DY (Registered

Seat: Rotterdam)


Unilever Overseas Holdings B.V.*

 0/100 NLG  1,000.00  1

New Zealand - Level 4, 103 Carlton Gore Rd, Newmarket, Auckland 1023


T2 NZ Limited

 0/100 NZD  1.00  1

Unilever New Zealand Limited

 0/100 NZD  2.00  1

Unilever New Zealand Superannuation Trustee

 0/100 NZD  1.00  1


Annual Report on Form 20-F 20172018 Group Companies139


GROUP COMPANIESCONTINUED

  Name of
  Undertaking

% holding

as

between

NV /PLC

Nominal

Value

    Share  

    Class  

    Note  

Accantia Health and Beauty Limited (In Liquidation)

0/100GBP0.251  

Simple Toiletries Limited (In Liquidation)

0/100GBP1.001  

Unidis Nineteen Limited (In Liquidation)

0/100GBP1.001  

Unilever Bestfoods UK Limited (In Liquidation)

5.61/94.39GBP1.001  

England and Wales – 5th floor, 6 St Andrew Street, London, EC4A 3AE,

Unilever Ventures Limited

0/100GBP1.001  

Estonia – Kalmistu tee 28a, Tallinna linn, Harju maakond, 11216

Unilever Eesti AS

100/0EUR6.301  

Ethiopia – Bole Sub City, Kebele 03/05, Lidiya Building, Addis Ababa

Unilever Manufacturing PLC

0/100ETB1,000.001  

Finland – Post Box 254, 00101 Helsinki

Unilever Finland Oy

100/0EUR16.821  

Unilever Ingman Production Oy

100/0EUR1.001  

France – 20, rue des Deux Gares, 92500, Rueil-Malmaison

Alsa France S.A.S. (99.99)

64.54/35.45No Par Value1  

Bestfoods France Industries S.A.S. (99.99)

64.54/35.45No Par Value1  

Cogesal-Miko S.A.S. (99.99)

64.54/35.45No Par Value1  

Fralib Sourcing Unit S.A.S. (99.99)

64.54/35.45No Par Value1  

Saphir S.A.S. (99.99)

64.54/35.45EUR1.001  

Sfejer S.A.S. (99.99)

64.54/35.45No Par Value1  

Tigi Services France S.A.S. (99.99)

64.54/35.45No Par Value1  

Unilever France S.A.S. (99.99)

64.54/35.45No Par Value1  

Unilever France Holdings S.A.S. (99.99)

64.54/35.45EUR1.001  

Unilever France HPC Industries S.A.S. (99.99)

64.54/35.45EUR1.001  

Unilever Retail Operations France (99.99)

64.54/35.45No Par Value1  

France – 81 Rue De Seine, 75006 Paris

Grom France S.a.r.l

100/0EUR10.001  

France – Parc Activillage des Fontaines – Bernin 38926 Crolles Cedex

Intuiskin S.A.S.

100/0EUR1.001  

France – ZI de la Norge – Chevigny Saint-Sauveur, 21800 Quetigny

Amora Maille Societe Industrielle S.A.S. (99.99)

64.54/35.45No Par Value1  

Germany – Wiesenstraße 21. 40549 Düsseldorf

Dermalogica GmbH

100/0EUR25,000.001  

Germany – Am Strandkai 1, 20457 Hamburg

DU Gesellschaft für Arbeitnehmerüberlassung mbH (99.99)

64.54/35.45DEM50,000.001  

Unilever Deutschland Gmbh

64.55/35.45EUR90,000,000.001  
64.55/35.45EUR2,000,000.001  
64.55/35.45EUR1,000,000.001  

Unilever Deutschland Holding Gmbh

64.55/35.45EUR39,000.001  
64.55/35.45EUR18,000.001  
64.55/35.45EUR14,300.001  
64.55/35.45EUR5.200.001  
64.55/35.45EUR6,500.001  

Unilever Deutschland Produktions Gmbh & Co. Ohg¥

64.55/35.454  

Unilever Deutschland Produktions Verwaltungs GmbH

64.55/35.45EUR179,000.001  

Unilever Deutschland Supply Chain Services GmbH

64.55/35.45EUR51,150.001  

Unilever BCS IP Deutschland GmbH & Co. OHG¥

64.45/35.554  

Unilever BCS Deutschland Immobilien Leasing GmbH & Co. OHG¥

66.22/33.784  

Dollar Shave Club GmbH

100/0EUR25,000.001  

T2 Germany GmbH

100/0EUR1.001  

Germany – Schultetusstraße 37, 17153 Stavenhagen

Maizena Grundstücksverwaltung Gmbh & Co.

63.61/36.394  

Ohg¥

Pfanni Gmbh & Co. Ohg Stavenhagen¥

64.55/35.454  

Rizofoor Gesellschaft mit beschränkter Haftung

96.45/3.55EUR15,350.001  
100/0EUR138,150.001  

Schafft GmbH

64.55/35.45EUR63,920.001  
64.55/35.45EUR100,000.001  

UBG Vermietungs GmbH

64.74/35.26EUR8,090,190.001  

Unilever Deutschland Immobilien Leasing GmbH & Co. OHG¥

66.33/33.674  

Unilever Deutschland IPR GmbH & Co. OHG¥

64.55/35.454  

Germany – Hertzstraße 6, 71083 Herrenberg- Gülstein

TIGI Eurologistic GmbH

0/100EUR100.001  

TIGI Haircare GmbH

0/100EUR25,600.001  

Ghana -Swanmill, Kwame Nkrumah Avenue, Accra

Millers Swanzy (Ghana) Limited

0/100GHC1.001  

Ghana – Plot No.Ind/A/3A-4, Heavy Industrial Area, Tema

Unilever Ghana Limited (66.56)

0/66.56GHC0.01921  

Ghana - Plot No.Ind/A/3A-4, P O Box 721, Tema

Unilever Oleo Ghana Limited

0/100No Par Value

Greece – Kymis ave & 10, Seneka str.GR-145 64 Kifissia

Elais Unilever Hellas SA

100/0EUR10.001  

Unilever Knorr SA

100/0EUR10.001  

Unilever Logistics SA

100/0EUR10.001  
  Name of
  Undertaking

% holding

as

between

NV /PLC

Nominal

Value

    Share  

    Class  

    Note  

Guatemala – Diagonal 6.10-50 zona 10, Ciudad de Guatemala. Nivel 17 Torre Norte Ed. Interamericas World Financial StatementsCenter

Unilever de Centroamerica S.A.

100/0GTQ60.001  

Guatemala – 24 Avenida, Calzada Atanacio Tzul,35-87 Zona 12 Ciudad de Guatemala

Unilever Guatemala SCC S.A.

100/0GTQ100.001  

Honduras – Anillo Periférico 600 metros después de la colonia, Residencial, Las Uvas contigua acceso de residencial Roble Oeste, Tegucigalpa M.D.C.

Unilever de Centroamerica S.A.

100/0HNL10.001  

Hong Kong -Suite1106-8, 11/F, Tai Yau Building, 181 Johnston Road, Wanchai

Blueair Asia Limited

100/0HKD0.011  

Hong Kong – 6/F Alexandra House, 18 Charter Road, Central

T2 Hong Kong

100/0HKD1.001  

Hong Kong – 6 Dai Fu Street, Tai Po Industrial Estate, N.T.

Unilever Hong Kong Limited

64.55/35.45HKD0.101  

Hong Kong – Suite 907, 9/F, Silvercord Tower 2, 30 Canton Road, Tsim Sha Tsui, Kowloon

Hourglass Cosmetics Hong Kong Limited

55.40/44.60No Par Value7  

Hong Kong – Room 1808, 18/F, Tower II Admiralty Centre, 18 Harcourt Road, Admiralty

Hong Kong CarverKorea Limited

0/100HKD1.007  

Hungary – 1138-Budapest, Váci u. 182 út121-127.

Unilever Magyarország Kft

0/100HUF1.001  

India – Unilever House, B. D. Sawant Marg, Chakala, Andheri (E), Mumbai 400 099

Daverashola Estates Private Limited (67.19)

0/67.19INR10.001  

Hindlever Trust Limited (67.19)

0/67.19INR10.001  

Hindustan Unilever Limited° (67.19)

0/67.19INR1.001  

Jamnagar Properties Private Limited (67.19)

0/67.19INR10.001  

Levers Associated Trust Limited (67.19)

0/67.19INR10.001  

Levindra Trust Limited (67.19)

0/67.19INR10.001  

Pond’s Exports Limited (67.19)

0/67.19INR1.001  

Unilever India Exports Limited (67.19)

0/67.19INR10.001  

Unilever Industries Private Limited°

0/100INR10.001  

Unilever Ventures India Advisory Private Limited

0/100INR1.001  

India –S-327, Greater Kailash – II, New Delhi – 110048, Delhi

Blueair India Pvt. Limited

99.99/0.01INR10. 001  

India – 1st Floor, Shreeniwas House, H. Somani Marg, (behind Bombay Gymkhana) Fort, Mumbai 40001

Lakme Lever Private Limited (67.19)

0/67.19INR10.001  

Indonesia – Grha Unilever, Green Office Park Kav 3, Jalan BSD Boulevard Barat, BSD City, Tangerang, 15345

PT Unilever Indonesia Tbk (84.99)

54.86/30.13IDR10.001  

PT Unilever Enterprises Indonesia (99.26)

64.07/35.19IDR1,000.001  

PT Unilever Trading Indonesia

100/0IDR1,003,875.001  

Indonesia – KEK Sei Mangkei, Nagori Sei Mangkei, Kecamatan Bosar Maligas, Kabupaten

Simalungun 21183, Sumatera Utara

PT Unilever Oleochemical Indonesia

100/0IDR1,000,000.001  

Iran – No. 23, Corner of 3rd Street, Zagros Street, Argentina Square, Tehran

Unilever Iran (Private Joint Stock Company) (99.35)

99.35/0IRR1,000,000.001  

Ireland – 20 Riverwalk, National Digital Park, Citywest Business Campus Dublin 24

Lipton Soft Drinks (Ireland) Limited

0/100EUR1.261  

Unilever Ireland (Holdings) Limited

0/100EUR1.261  

Unilever Ireland Limited

0/100EUR1.261  

Isle of Man – Bridge Chambers, West Quay, Ramsey, Isle of Man, IM8 1DL

Rational International Enterprises Limited

0/100USD1001  

Israel – 3 Gilboa St. Airport City, Ben Gurion Airport

Beigel & Beigel Mazon (1985) Limited

12.80/87.20ILS1.001  

Israel – 52 Julius Simon Street, Haifa, 3296279

Bestfoods TAMI Holdings Ltd

25.11/74.89ILS0.0011  

Israel Vegetable Oil Company Ltd

25.11/74.89ILS0.00011  

Unilever Israel Foods Ltd

25.11/74.89ILS0.1035  
25.11/74.89ILS0.1079  
25.11/74.89ILS0.1017  
25.11/74.89ILS0.000225  

Unilever Israel Home and Personal Care Limited

0/100ILS1.001  

Unilever Israel Marketing Ltd

25.11/74.89ILS0.00011  

Unilever Shefa Israel Ltd

25.11/74.89ILS1.001  

Israel – Haharoshet 1, PO Box 2288, Akko, 2451704

Glidat Strauss Limited

0/100ILS1.0030  
0/100ILS1.001  
0/0ILS1.0031  

Italy – Piazza Paleocapa 1/D, 10100, Torino

Gromart S.R.L.

100/0EUR1,815,800.005  

Italy – Via Crea 10, 10095, Grugliasco

G.L.L. S.R.L. (51)

51/0EUR40,000.005  

Italy – Via Roma 101, 35122, Padova

Grom-PD S.R.L.

100/0EUR40,000.005  

Italy - Via Tortona 25, cap 20144 – Milano

Intuiskin S.R.L.

100/0EUR10,000.001  

Italy – Piazzale Biancamano n.8, 20121, Milano

Unilever Italia Administrative Services S.R.L.

100/0EUR70,000.005  

Italy – Via Paolo di Dono 3/A 00142 Roma

Unilever Italia Logistics S.R.L.

100/0EUR600,000.005

140Group CompaniesAnnual Report on Form 20-F 2018


  Name of
  Undertaking

% holding

as

between

NV /PLC

Nominal

Value

    Share

    Class

    Note

Unilever Italia Manufacturing S.R.L.

100/0EUR10,000,000.005

Unilever Italia Mkt Operations S.R.L.

100/0EUR25,000,000.005

Unilever Italy Holdings S.R.L.

100/0EUR200,000.005

Italy – Business Center Monte Napoleone, Via Monte Napoleone 8, 20121 – Milano

UPD Italia

100/0EUR 10,000.005

Japan –2-1-1, Kamimeguro,Meguro-ku, Tokyo153-8578

Unilever Japan Beverage K.K.

100/0JPY50,000.001

Unilever Japan Customer Marketing K.K.

100/0JPY50,000.001

Unilever Japan Holdings K.K.

100/0JPY10,000.001

Unilever Japan K.K.

100/0JPY50,000.001

Unilever Japan Service K.K.

100/0JPY50,000.001

Jersey – 13 Castle Street, St Helier, Jersey, JE4 5UT

Unilever Chile Investments Limited

64.55/35.45GBP1.001

Jordan – Amman

Unilever Jordan LLC

100/0JOD10.001

Kazakhstan – Raimbek, Avenue 160 A, Office 401, Almaty

Unilever Kazakhstan LLP

100/04

Kenya – Head Office, Kericho-Nakuru Road, P.O. BOX 20, 20200, Kericho

Brooke Bond Mombasa Limited (98.20)

0/98.20KES1.001

Mabroukie Tea & Coffee Estates Limited (98.20)

0/98.20KES1.001

The Limuru Tea Company Limited (51.08)

0/51.08KES20.001

Unilever Tea Kenya Limited (98.20)

0/98.20KES1.001

Kenya – Commercial Street, Industrial Area, P.O. BOX 30062-00100, Nairobi

Unilever Kenya Limited°

0/100KES20.001

Korea – 443Taeheran-ro, Samsung-dong,Kangnam-gu, Seoul

Unilever Korea Chusik Hoesa

100/0KRW10,000.001
100/0KRW10,000.0014

Korea – 81, Tojeong31-gil,Mapo-gu, Seoul

Carver Korea Co., Ltd

0/100KRW500.007

Laos – Viengvang Tower, 4th Floor, Room no. 402A, Boulichan Road, Dongpalan Thong Village, Sisattanak District, Vientiane Capital

Unilever Services (Lao) Sole Co Limited

100/0LAK800,000.001

Latvia – Kronvalda bulvāris3-10, Rīga,LV-1010

Unilever Baltic LLC

100/0EUR1.001

Lebanon – Sin El Fil, Zakher Building, Floor 4, Beirut

Unilever Levant s.a.r.l.

100/0LBP1,000,000.001

Lithuania – Skuodo st. 28, Mazeikiai,LT-89100

UAB Unilever Lietuva distribucija

100/0EUR3,620.251

UAB Unilever Lietuva ledu gamyba

100/0EUR3,620.251

Malawi – Room 33, Gateway Mall, Area 47, Lilongwe Malawi

Unilever South East Africa (Private) Limited

0/100MWK2.001

Malaysia – Level 34, Menara TM, Jalan Pantai Baru, 59200 Kuala Lumpur

Unilever (Malaysia) Holdings Sdn. Bhd. (70)

0/70No Par Value1

Unilever (Malaysia) Services Sdn. Bhd. (70)

0/70No Par Value1

Unilever Foods (Malaysia) Sdn. Bhd.

0/100No Par Value1

Unilever Malaysia Aviance Sdn. Bhd.

0/100No Par ValueB1

Mexico – Av. Tepalcapa No.2, Col. Rancho Santo Domingo, C.P. 54900 Tultitlán, Estado de México

Unilever de Mexico S.de R.l. de C.V.

64.55/35.454

Unilever Holding Mexico S.de R.L. de C.V.

64.55/35.454

Unilever Manufacturera S.de R.L. de C.V.

64.55/35.454

Servicios Professionales Unilever S.de R.L. de C.V. 64.55/35.45

4

Unilever Mexicana S.de R.L. de C.V.

64.55/35.454

Unilever Real Estate Mexico S.de R.L. de C.V.

64.55/35.454

Unilever Servicios de Promotoria, S.de R.L. de C.V. 64.55/35.45

4

Morocco – Km 10, Route Cotiere, Ain Sebaa, Casablanca

Unilever Maghreb S.A. (99.98)

99.98/0MAD100.001

Mozambique – Avenida 24 de Julho, Edifício 24, nº 1097, 4º andar, Maputo

Unilever Mocambique Limitada

100/0USD0.011

Myanmar – No (40,41,47), Min Thate Hti Kyaw Swar Street, 39 Ward, Shwe Pyi Thar Industrial Zone (2), Shwe Pyi Thar Township, Yangon

Unilever (Myanmar) Limited

100/0MMK8,200.001

Myanmar – No (196), West Shwe Gone Dine 5th Street, Bahan Township, Yangon

Unilever (Myanmar) Services Limited

100/0USD10.001

Myanmar – Lot No.28,30,31, Hlaing Thar Yar Industrial Zone (3), Hlaing Thar Yar Township, Yangon

Unilever EAC Myanmar Company Limited (60)

60/0MAMK1,000,000.001

Nepal – Basamadi, Hetanda – 3, Makwanpur

Unilever Nepal Limited (53.75)

0/53.75NPR100.001

Netherlands- Weena 455, 3013 AL Rotterdam

Alberto-Culver Netherlands B.V.*

55.40/44.60EUR1.002
55.40/44.60EUR1.003

Argentina Investments B.V.*

64.55/35.45EUR454.001

BFO Holdings B.V.*

64.55/35.45EUR1.001

BFO TWO B.V.*

55.40/44.60EUR1.001

BrazH1 B.V.*

64.55/35.45EUR1.001

BrazH2 B.V.*

64.55/35.45EUR1.001

Brazinvest B.V.*

64.55/35.45EUR1.001

Brazinvestee B.V.*

64.55/35.45EUR1.001

Chico-invest B.V.*

64.55/35.45EUR455.001

Dollar Shave Club B.V.*

100/0EUR1.001
  Name of
  Undertaking

% holding

as

between

NV /PLC

Nominal

Value

    Share

    Class

    Note

Doma B.V.*

100/0NLG1,000.001

Handelmaatschappij Noorda B.V.°*

100/0NLG1,000.001

Unilever Foods & Refreshments Global B.V.*

100/0EUR453.781

Itaho B.V.*

100/0EUR1.001

Lipoma B.V.°*

100/0NLG1,000.001

Marga B.V.°*

100/0EUR1.001

Mavibel (Maatschappij voor Internationale Beleggingen) B.V.°*

100/0EUR1.001

Mexinvest B.V.*

64.55/35.45EUR1.001

Mixhold B.V.*

100/0EUR1.002
0/100EUR1.003
55.40/44.60EUR1.0026

Naamlooze Vennootschap Elma°*†

100/0NLG1,000.001
0.25/99.75NLG1,000.0027

New Asia B.V.*

64.55/35.45EUR1.001

Nommexar B.V.*

64.55/35.45EUR1.001

Ortiz Finance B.V.*

64.55/35.45NLG100.001

Pabulum B.V.*

100/0NLG1,000.001

Rizofoor B.V.*

0/100NLG1,000.001

Rolf von den Baumen’s Vetsmelterij B.V.*

100/0EUR454.001

Rolon B.V.*

64.55/35.45NLG1,000.001

Saponia B.V.°*

100/0NLG1,000.001

ThaiB1 B.V.*

64.55/35.45NLG1,000.001

ThaiB2 B.V.*

64.55/35.45NLG1,000.001

Unilever Administration Centre B.V.*

100/0EUR1.001

Unilever Alser B.V.*

100/0EUR1.001

Unilever Berran B.V.*

100/0EUR1.001

Unilever Canada Investments B.V.*

64.55/35.45EUR1.001

Unilever Caribbean Holdings B.V.*

100/0EUR1,800.001

Unilever Corporate Holdings Nederland B.V.

100/0EUR0.011

Unilever Employee Benefits Management B.V.*

0/100NLG1,000.001

Unilever Employment Services B.V.*

100/0NLG1,000.001

Unilever Europe B.V.*

100/0EUR1.001

Unilever Europe Business Center B.V.*

100/0EUR454.001
100/0EUR454.0014

Unilever Finance International B.V.°*

100/0EUR1.001

Unilever Foodsolutions B.V.*

100/0EUR1.001

Unilever Global Services B.V.*

100/0EUR1.001

Unilever Holdings B.V.*

100/0EUR454.001

Unilever Home & Personal Care Nederland B.V.*

100/0EUR100.001

Unilever Indonesia Holding B.V.*

64.55/35.45EUR1.001

Unilever Netherlands Retail Operations B.V.*

100/0EUR1.001

Unilever Nederland Holdings B.V.°*

100/0EUR454.001

Unilever Pilot B.V.

100/0EUR1.001

Unilever Turkey Holdings B.V.*

64.55/35.45EUR1.001

Unilever US Investments B.V.°*

100/0EUR1.001

Unilever Ventures Holdings B.V.

100/0EUR453.791

Unilever UK Holdings B.V.*

100/0EUR1.001

Unilever International Holdings B.V.*

100/0EUR1.001

Unilever UK Holdings N.V.°*

100/0EUR1.001

Unilever International Holdings N.V.°*

100/0EUR1.001

Univest Company B.V.

100/0EUR1.001

UNUS Holding B.V.*

100/0EUR0.102
0/100EUR0.103
0/0EUR0.1028
Non-voting†

Verenigde Zeepfabrieken B.V.*

100/0NLG1,000.001

Wemado B.V.°*

100/0NLG1,000.001

Netherlands – Nassaukade 5, 3071 JL Rotterdam

Tessa B.V.*

100/0EUR1.001

Unilever Nederland B.V.*

100/0EUR454.001

Unilever Nederland Foods Factories B.V.*

100/0EUR46.001

Netherlands – Reggeweg 15, 7447 AN Hellendoorn

Ben en Jerry’s Hellendoorn B.V.*

100/0EUR453.781

Netherlands – Deltaweg 150, 3133 KM Vlaardingen

Lever Faberge Europe-Sourcing Unit Vlaardingen B.V.*

100/0NLG1,000.001

Netherlands – Olivier van Noortlaan 120, 3133 AT Vlaardingen

Unilever Research and Development Vlaardingen

100/0EUR460.001

B.V.*

Netherlands – Nassaukade 3, 3071 JL Rotterdam

Unilever Nederland Services B.V.*

100/0EUR460.001

Netherlands – Unilever House, 100 Victoria Embankment, London, EC4Y 0DY (Registered Seat: Rotterdam)

Unilever Overseas Holdings B.V.*

0/100NLG1,000.001

New Zealand – Level 4, 103 Carlton Gore Rd, Newmarket, Auckland 1023

T2 NZ Limited

0/100NZD1.001

Unilever New Zealand Limited

0/100NZD2.001

Unilever New Zealand Superannuation Trustee

Limited

0/100NZD1.001

Unilever New Zealand Trading Limited

0/100NZD1.001

Annual Report on Form 20-F 2018Group Companies 141


NOTES TO THE CONSOLIDATED FINANCIAL STATEMENTS

UNILEVER GROUP COMPANIESCONTINUED


 Name of
 Undertaking


% holding
as between

NV /PLC


Nominal Value


Share

Class

Note


Limited


Unilever New Zealand Trading Limited

 0/100 NZD 1.00 1 

Ben & Jerry’s Franchising New Zealand Limited

 0/100 NZD 1.00 1 

Nicaragua - Km 11.5, Carretera Vieja a León, 800 Mts Norte, 100 Mts Este, 300 Mts Norte, Managua


Unilever de Centroamerica S.A. Nicaragua

 100/0 NIC 50.00 1 

Niger - BP 10272 Niamey


Unilever Niger S.A. (56.27)

 0/56.27 XOF 10,000.00 1 

Nigeria - 1 Billings Way, Oregun, Ikeja, Lagos


Unilever Nigeria Plc (67.70)

 0/67.70 NGN 0.50 1 

West Africa Popular Foods Nigeria Limited (51)

 0/51 NGN 1.00 1 

Norway - Martin Linges vei 25, Postbox 1, 1331 Fornebu


Unilever Norge AS

 100/0 NOK 100.00 1 

Pakistan - Avari Plaza, Fatima Jinnah Road, Karachi – 75530


Lever Associated Pakistan Trust (Private) Limited

 0/100 PKR 10.00 1 

Lever Chemicals (Private) Limited

 0/100 PKR 10.00 1 

Sadiq (Private) Limited

 0/100 PKR 10.00 1 

Unilever Birds Eye Foods Pakistan (Private) Limited

 0/100 PKR 10.00 1 

Unilever Pakistan Foods Limited (75.85)

 42.02/33.83 PKR 10.00 1 

Unilever Pakistan Limited (99.19)

 0/ 99.19 PKR 50.00 1 

(71.78)

 0/ 71.78 PKR 100.00 14 

Palestine - Ersal St. Awad Center P.O.B 3801 Al-Beireh, Ramallah


Unilever Market Development Company

 0/100 ILS 1.00 1 

Panama - Punta Pacífica, Calle Isaac Hanono Missri, P.H. Torre de las Américas, Torre C, Oficina 32, corregimiento de San Francisco, Distrito y Provincia de Panamá


Unilever Regional Services Panama S.A.

 100/0 USD 1.00 1 

Panama - Calle Isaac Honoro, Torre de las Americas, torre C, piso 32, corregimiento de San Francisco, distrito y provincia de Panamá


Unilever de Centroamerica S.A. Panama

 100/0                 No Nominal Value  

Paraguay - 4544 Roque Centurión Miranda N° 1635 casi San Martin. Edificio Aymac II, Asunción


Unilever de Paraguay S.A.

 100/0 PYG 1,000,000.00 1 

Peru - Av. Paseo de la Republica 5895 OF. 401, Miraflores, Lima 18


Unilever Andina Perú S.A.

 100/0 PEN 1.00 1 

Philippines - Linares Road, Gateway Business Park, Gen. Trias, Cavite


Metrolab Industries, Inc.

 64.55/35.45 PHP 1.00 7 
 64.55/35.45 PHP 10.00 14 

Philippines - 7th Floor, Bonifacio Stopover Corporate Center, 31st Street corner 2nd Avenue, Bonifacio Global City, Taguig City


Unilever Philippines, Inc.

 64.55/35.45 PHP 50.00 7 

Philippines - 11th Avenue corner 39th Street, Bonifacio Triangle, Bonifacio Global City, Taguig City


Unilever Philippines Body Care, Inc.

 64.55/35.45 PHP 100.00 7 

Philippines - Manggahan Light Industrial Compound, A. Rodriguez Avenue, Bo. Manggahan, Pasig City


Unilever RFM Ice Cream, Inc. (50)

 32.28/17.72 PHP 1.00 29 

Poland - Jerozolimskie 134,02-305, Warszawa


Unilever Polska Sp. z o.o.

 0/100 PLN 50.00 1 

Unilever Poland Services Sp. z o.o.

 0/100 PLN 50.00 1 

UNILEVER POLSKA S.A.

 0/100 PLN 10.00 1 

Unilever BCS Polska Sp. z o.o.

 55.40/44.60 PLN 50.00 1 

Unilever BCS Polska Holding Sp. z o.o.

 0/100 PLN 50.00 1 

Puerto Rico - Professional Services Park 997, San Roberto St., Suite 7, San Juan


Unilever de Puerto Rico, Inc°

 100/0 USD 100.00 1 

Rwanda - Nyarugenge, Nyarungenge, Umujyi wa Kigali, Rwanda, P.O. BOX 6428 Kigali


Unilever Tea Rwanda Limited

 0/100 RWF 4270.00 1 

Romania - Ploiesti, 291 Republicii Avenue, Prahova County


Unilever Romania S.A. (99)

 99/0 ROL 0.10 1 

Unilever Distribution SRL

 100/0 ROL 20.00 1 

Unilever BCS SCE SRL

 55.40/44.60 ROL 10.00 1 

Unilever South Central Europe S.A.

 100/0 ROL 260.50 1 

Russia - 644031, 205, 10 let Oktyabrya, Omsk


Inmarko Trade LLC

 7.12/92.88   13 

Russia - 300016, 78, Ostrovskogo Street, Tula


JLLC Tulskiy Khladokombinat (98.29)

 6.99/91.29 RUR 1.00 1 

Russia - 123022, 13, Sergeya Makeeva Street, Moscow


OOO UNILEVER RUS

 7.12/92.88   13 

Saudi Arabia - P.O. Box 5694, Jeddah 21432


Binzagr Unilever Limitedx (49)

 0/49 SAR 1,000.00 1 

Serbia - Belgrade, Serbia, Omladinskih brigada 90b – Novi Beograd


Unilever Beograd d.o.o.

 100/0   13 

Singapore - 20E Pasir Panjang Road,#06-22 Mapletree Business City, 117439


T2 Singapore PTE Limited

 0/100 SGD 1.00 1 

Singapore - 20 Pasir Panjang Road,#06-22 Mapletree Business City, 117439


UNILEVER ASIA PRIVATE LIMITED

 100/0 SGD 1.00 1 

Unilever Singapore Pte. Limited

 0/100 SGD 1.00 1 

Slovakia - Karadzicova 10, 821 08 Bratislava


Unilever BCS Slovensko, spol. s r.o.

 55.40/44.60 EUR 1.00 1 

Unilever Slovensko spol. s r.o.

 100/0 EUR 1.00 1 

South Africa-15 Nollsworth Crescent, Nollsworth Park, La Lucia Ridge Office Estate, La Lucia, 4051


Nollsworth Park Properties (Pty) Limited (74.25)

 11.21/63.04 ZAR 2.00 1 
  Name of
  Undertaking


% holding

as

between

NV /PLC


Nominal

Value


    Share

    Class

    Note


Ben & Jerry’s Franchising New Zealand Limited

 0/100     No Par Value  1   

Nicaragua – Km 11.5, Carretera Vieja a León, 800 Mts Norte, 100 Mts Este, 300 Mts Norte, Managua


Unilever de Centroamerica S.A.

 100/0     NIC50.00  1 

Niger – BP 10272 Niamey


Unilever Niger S.A. (56.27)

 0/56.27     XOF10,000.00  1 

Nigeria – 1 Billings Way, Oregun, Ikeja, Lagos


Unilever Nigeria Plc (67.90)

 0/67.90     NGN0.50  1 

West Africa Popular Foods Nigeria Limited (51)

 0/51     NGN1.00  1 

Norway – Martin Linges vei 25, Postbox 1, 1331 Fornebu


Unilever Norge AS

 100/0     NOK100.00  1 

Pakistan – Avari Plaza, Fatima Jinnah Road, Karachi – 75530


Lever Associated Pakistan Trust (Private) Limited

 0/100     PKR10.00  1 

Lever Chemicals (Private) Limited

 0/100     PKR10.00  1 

Sadiq (Private) Limited

 0/100     PKR10.00  1 

Unilever Birds Eye Foods Pakistan (Private) Limited

 0/100     PKR10.00  1 

Unilever Pakistan Foods Limited (76.50)

 42.38/34.12     PKR10.00  1 

Unilever Pakistan Limited (99.23)

 0/99.23     PKR50.00  1 

(71.78)

 0/71.78     PKR100.00  14 

Palestine – Ersal St. Awad Center P.O.B 3801Al-Beireh, Ramallah


Unilever Market Development Company

 0/100     ILS1.00  1 

Panama – Punta Pacífica, Calle Isaac Hanoro Missri, P.H. Torre de las Américas, Torre C, Oficina 32, corregimiento de San Francisco, Distrito y Provincia de Panamá


Unilever Regional Services Panama S.A.

 100/0     USD1.00  1 

Panama – Calle Isaac Honoro, Torre de las Americas, torre C, piso 32, corregimiento de San Francisco, distrito y provincia de Panamá


Unilever de Centroamerica S.A.

 100/0     No Par Value  1 

Paraguay – 4544 Roque Centurión Miranda N° 1635 casi San Martin. Edificio Aymac II, Asunción


Unilever de Paraguay S.A.

 100/0     PYG1,000,000.00  1 

Peru – Av. Paseo de la Republica 5895 OF. 401, Miraflores, Lima 18


Unilever Andina Perú S.A.

 100/0     PEN1.00  1 

Philippines – Linares Road, Gateway Business Park, Gen. Trias, Cavite


Metrolab Industries, Inc.

 64.55/35.45     PHP1.00  7 
 64.55/35.45     PHP10.00  14 

Philippines – 7th Floor, Bonifacio Stopover Corporate Center, 31st Street corner 2nd Avenue, Bonifacio Global City, Taguig City


Unilever Philippines, Inc.

 64.55/35.45     PHP50.00  7 

Philippines – 11th Avenue corner 39th Street, Bonifacio Triangle, Bonifacio Global City, Taguig City


Unilever Philippines Body Care, Inc.

 64.55/35.45     PHP100.00  7 

Philippines – Manggahan Light Industrial Compound, A. Rodriguez Avenue, Bo. Manggahan, Pasig City


Unilever RFM Ice Cream, Inc. (50)

 32.28/17.72     PHP1.00  29 

Poland – Jerozolimskie 134,02-305, Warszawa


Unilever Polska Sp. z o.o.

 0/100     PLN50.00  1 

Unilever Poland Services Sp. z o.o.

 0/100     PLN50.00  1 

Unilever Polska S.A.

 0/100     PLN10.00  1 

Puerto Rico – Professional Services Park 997, San Roberto St., Suite 7, San Juan


Unilever de Puerto Rico, Inc°

 100/0     USD100.00  1 

Rwanda – Nyarugenge, Nyarungenge, Umujyi wa Kigali, Rwanda, P.O. BOX 6428 Kigali


Unilever Tea Rwanda Limited

 0/100     RWF4270.00  1 

Romania – Ploiesti, 291 Republicii Avenue, Prahova County


Unilever Romania S.A. (99)

 99/0     ROL0.10  1 

Unilever Distribution SRL

 100/0     ROL20.00  1 

Unilever South Central Europe S.A.

 100/0     ROL260.50  1 

Betty Ice SRL

 100/0     RON10.00  1 

Russia – 644031, 205, 10 let Oktyabrya, Omsk


Inmarko Trade LLC

 11.89/88.11       13 

Russia – 123022, 13, Sergeya Makeeva Street, Moscow


OOO Unilever Rus

 11.89/88.11       13 

Saudi Arabia – P.O. Box 5694, Jeddah 21432


Binzagr Unilever LimitedX(49)

 0/49     SAR1,000.00  1 

Saudi Arabia – 8770 King Abudlaziz Branch Road, Ash Shati, Jeddah 23514-3261


Binzagr Unilever Distribution (73.50)

 24.50/49     SAR1,000.00  1 

Serbia – Belgrade, Serbia, Omladinskih brigada 90b – Novi Beograd


Unilever Beograd d.o.o.

 100/0       13 

Singapore – 20E Pasir Panjang Road,#06-22 Mapletree Business City, 117439


T2 Singapore PTE Limited

 0/100     SGD1.00  1 

Singapore – 20 Pasir Panjang Road,#06-22 Mapletree Business City, 117439


Unilever Asia Private Limited

 100/0     SGD1.00  1 

Unilever Singapore Pte. Limited

 0/100     SGD1.00  1 

UPD Singapore Private Limited

 100/0     SGD1.00  1 

Slovakia – Karadzicova 10, 821 08 Bratislava


Unilever Slovensko spol. s r.o.

 100/0     EUR1.00  1 

South Africa-15 Nollsworth Crescent, Nollsworth Park, La Lucia Ridge Office Estate, La Lucia, 4051


Nollsworth Park Properties (Pty) Limited

 8.98/91.02     ZAR2.00  1 

Unilever Market Development (Pty) Limited

 0/100     ZAR1.00  1 

Unilever South Africa (Pty) Limited

 8.98/91.02     ZAR2.00  1 

Unilever South Africa Holdings (Pty) Limited

 13.53/86.47     ZAR1.00  1 
 Name of
 Undertaking


% holding
as between

NV /PLC


Nominal Value


Share

Class

Note


Unilever Market Development (Pty) Limited

 0/100 ZAR 1.00 1 

UNILEVER SOUTH AFRICA (PTY) LIMITED

 11.21/63.04 ZAR 2.00 1 

(74.25)


Unilever South Africa Holdings (Pty) Limitedr

 11.21/63.04 ZAR 1.00 1 

(74.25)


(0.02)

 0.005/0.015 ZAR 1.00 2 

(0.009)

 0.002/0.007 ZAR 1.00 3 

South Africa – 4 Merchant Place, CNR Fredman Drive and Rivonia Road Sandton, 2196


Aconcagua 14 Investments (RF) (Pty) Limited (74.25)

 11.21/63.04 ZAR 1.00 1 

Spain - PA / Reding, 43, Izda 1, 29016 Malaga


Intuiskin S.L.U.

 100/0 EUR 1.00 1 

Spain - C/ Tecnología 19, 08840 Viladecans


Unilever BCS Spain, S.L.U.

 55.40/44.60 EUR 1.00 1 

UNILEVER ESPANA S.A.

 100/0 EUR 48.00 1 

Unilever Services Espana S.A.

 100/0 EUR 60.00 1 

Spain - C/ Felipe del Río, 14 – 48940 Leioa


Unilever Foods Industrial Espana, S.L.U.

 100/0 EUR 600.00 1 

Spain - C/Condesa de Venadito 1, planta 4, 28028 Madrid


Unilever HPC Industrial Espana S.L.U.

 100/0 EUR 600.00 1 

Sri Lanka - 258 M Vincent Perera Mawatha, Colombo 14


Brooke Bond Ceylon Limited

 0/100 LKR 100.00 1 

Ceytea Limited

 0/100 LKR 10.00 1 

Lever Brothers (Exports and Marketing) Limited°

 0/100 LKR 2.00 1 

Maddema Trading Co. Limited

 0/100 LKR 10.00 1 

Premium Exports Ceylon (Pvt) Limited

 0/100 LKR 10.00 1 

R.O. Mennell & Co. (Ceylon) Limited

 0/100 LKR 10.00 1 

Tea Estates Ceylon Limited

 0/100 LKR 100.00 1 

Unilever Ceylon Services Limited

 0/100 LKR 10.00 1 

Unilever Ceylon Marketing Limited

 0/100 LKR 10.00 1 

Unilever Lipton Ceylon Limited

 0/100 LKR 10.00 1 

Unilever Sri Lanka Limited°

 0/100 LKR 10.00 1 

Sweden - Box 1056, Svetsarevaegen15, 17122, Solna


Alberto Culver AB

 55.40/44.60 SEK 100.00 1 

Unilever BCS Sourcing Sweden AB

 55.40/44.60 SEK 1.00 1 

Unilever BCS Sweden AB

 55.40/44.60 SEK 1.00 1 

Unilever Holding AB

 100/0 SEK 100.00 1 

Unilever Produktion AB

 100/0 SEK 50.00 1 

UNILEVER SVERIGE AB

 100/0 SEK 100.00 1 

Sweden -Karlavagen 108, 115 26 Stockholm


Blueair AB

 100/0 SEK 100.00 1 

Sweden - Box 24275, 10451, Stockholm


Blueair Cabin Air AB

 100/0 SEK 100.00 1 

Sweden - Karlavagen 108, 115 26, Stockholm


Jonborsten AB

 100/0 SEK 1.00 1 

Switzerland - Chemin Frank-Thomas 34, 1208 Genève


Intuiskin SARL (In Liquidation)

 100/0 CHF 100.00 1 

Switzerland - Bahnhofstrasse 19, CH 8240 Thayngen


Knorr-Nährmittel Aktiengesellschaft

 100/0 CHF 1,000.00 1 

UNILEVER SCHWEIZ GMBH

 100/0 CHF 100,000.00 1 

Unilever BCS Schweiz GmbH

 55.40/44.60 CHF 100.00 1 

Switzerland - Spitalstrasse 5, 8201, Schaffhausen


UNILEVER SUPPLY CHAIN COMPANY AG

 100/0 CHF 1,000.00 1 

Switzerland - Spitalstrasse 5, 8200, Schaffhausen


UNILEVER ASCC AG

 100/0 CHF 1,000.00 1 

UNILEVER FINANCE INTERNATIONAL AG

 100/0 CHF 1,000.00 1 

Unilever Business and Marketing Support AG

 100/0 CHF 1,000.00 1 

Unilever Overseas Holdings AG

 0/100 CHF 1,000.00 1 

Unilever Schaffhausen Service AG

 100/0 CHF 1,000.00 1 

Unilever Swiss Holdings AG

 100/0 CHF 1,000.00 1 

Switzerland - Hinterbergstr. 30,CH-6312 Steinhausen


Oswald Nahrungsmittel GmbH

 100/0 CHF 800,000.00 1 

Switzerland - Schochenmühlestrasse 2, 6340 Baar


Unilever Reinsurance AG

 100/0 CHF 1,000.00 1 

Taiwan - 3F., No. 550, Sec. 4, Zhongxiao East Rd., Xinyi District, Taipei City


Unilever Taiwan Limited (99.92)

 64.50/35.42 TWD 10.00 1 

Tanzania - Plot No.4A Pugu Road, Dar Es Salaam


Distan Limited

 0/100 TZS 20.00 1 

UAC of Tanzania Limited

 0/100 TZS 20.00 1 

Uniafric Trust Tanzania Limited

 0/100 TZS 20.00 1 

Unilever Tanzania Limited

 0/100 TZS 20.00 1 

Tanzania - P.O. Box 40, Mufindi


Unilever Tea Tanzania Limited

 0/100 TZS 20.00 1 

Thailand - 161 Rama 9 Road, Huay Kwang, Bangkok 10310


Unilever Thai Holdings Limited

 64.55/35.45 THB 100.00 1 

Unilever Thai Services Limited

 64.55/35.45 THB 100.00 1 

UNILEVER THAI TRADING LIMITED

 64.55/35.45 THB 100.00 1 

Trinidad & Tobago - Eastern Main Road, Champs Fleurs


Unilever Caribbean Limited (50.01)

 0/50.01 TTD 1.00 1 

Tunisia - Z.I. VoieZ4-2014 Mégrine Erriadh – Tunis


Unilever Tunisia S.A. (97.61)

 97.61/0 TND 6.00 1 
  Name of
  Undertaking

% holding

as

between

NV /PLC

Nominal

Value

    Share

    Class

    Note

25.10/74.90ZAR1.002
0/100ZAR1.003

South Africa – 4 Merchant Place, CNR Fredman Drive and Rivonia Road Sandton, 2196

Aconcagua 14 Investments (RF) (Pty) Limited (74.25)

8.98/91.02ZAR1.001

Spain – PA / Reding, 43, Izda 1, 29016 Malaga

Intuiskin S.L.U.

100/0EUR1.001

Spain – C/ Tecnología 19, 08840 Viladecans

Unilever Espana S.A.

100/0EUR48.001

Unilever Services Espana S.A.

100/0EUR60.001

Spain – C/ Felipe del Río, 14 – 48940 Leioa

Unilever Foods Industrial Espana, S.L.U.

100/0EUR600.001

Spain – C/Condesa de Venadito 1, planta 4, 28028 Madrid

Unilever HPC Industrial Espana S.L.U.

100/0EUR600.001

Sri Lanka – 258 M Vincent Perera Mawatha, Colombo 14

Brooke Bond Ceylon Limited

0/100LKR100.001

Ceytea Limited

0/100LKR10.001

Lever Brothers (Exports and Marketing) Limited°

0/100LKR2.001

Maddema Trading Co. Limited

0/100LKR10.001

Premium Exports Ceylon (Pvt) Limited

0/100LKR10.001

R.O. Mennell & Co. (Ceylon) Limited

0/100LKR10.001

Unilever Ceylon Services Limited

0/100LKR10.001

Unilever Lipton Ceylon Limited

0/100LKR10.001

Unilever Sri Lanka Limited°

0/100LKR10.001

Sweden – Box 1056, Svetsarevägen 15, 171 22, Solna Stockholm

Alberto Culver AB

55.40/44.60SEK100.001

Unilever Holding AB

100/0SEK100.001

Unilever Produktion AB

100/0SEK50.001

Unilever Sverige AB

100/0SEK100.001

Sweden -Karlavagen 108, 115 26 Stockholm

Blueair AB

100/0SEK100.001

Blueair Cabin Air AB

100/0SEK100.001

Sweden – Karlavagen 108, 115 26, Stockholm

Jonborsten AB

100/0SEK1.001

Switzerland – Chemin Frank-Thomas 34, 1208 Genève

Intuiskin SARL (In Liquidation)

100/0CHF100.001

Switzerland – Bahnhofstrasse 19, CH 8240 Thayngen

Knorr-Nährmittel Aktiengesellschaft

100/0CHF1,000.001

Unilever Schweiz Gmbh

100/0CHF100,000.001

Switzerland – Spitalstrasse 5, 8200, Schaffhausen

Helmsman Capital AG

100/0CHF1,000.001

Unilever Supply Chain Company AG

100/0CHF1,000.001

Unilever ASCC AG

100/0CHF1,000.001

Unilever Finance International AG

100/0CHF1,000.001

Unilever Business and Marketing Support AG

100/0CHF1,000.001

Unilever Overseas Holdings AG

0/100CHF1,000.001

Unilever Schaffhausen Service AG

100/0CHF1,000.001

Unilever Swiss Holdings AG

100/0CHF1,000.001

Switzerland – Hinterbergstr. 30,CH-6312 Steinhausen

Oswald Nahrungsmittel GmbH

100/0CHF800,000.001

Switzerland – Schochenmühlestrasse 2, 6340 Baar

Unilever Reinsurance AG

100/0CHF1,000.001

Taiwan – 3F., No. 550, Sec. 4, Zhongxiao East Rd., Xinyi District, Taipei City

Unilever Taiwan Limited (99.92)

64.50/35.42TWD10.001

Tanzania – Plot No.4A Pugu Road, Dar Es Salaam

Distan Limited

0/100TZS20.001

UAC of Tanzania Limited

0/100TZS20.001

Uniafric Trust Tanzania Limited

0/100TZS20.001

Unilever Tanzania Limited

0/100TZS20.001

Tanzania – P.O. Box 40, Mufindi

Unilever Tea Tanzania Limited

0/100TZS20.001

Thailand – 161 Rama 9 Road, Huay Kwang, Bangkok 10310

Unilever Thai Holdings Limited

64.55/35.45THB100.001

Unilever Thai Services Limited

64.55/35.45THB100.001

Unilever Thai Trading Limited

64.55/35.45THB100.001

UPD (Thailand) Co., Ltd

100/0USD1.001

Trinidad & Tobago – Eastern Main Road, Champs Fleurs

Unilever Caribbean Limited (50.01)

0/50.01TTD1.001

Tunisia – Z.I. VoieZ4-2014 Mégrine Erriadh – Tunis

Unilever Tunisia S.A. (97.61)

97.61/0TND6.001

Unilever Maghreb Export S.A. (97.59)

97.59/0TND5.001

Tunisia – Z.I. Voie Z4, Megrine Riadh, Tunis, 2014

UTIC Distribution S.A.X(47.82)

47.82/0TND10.001

Turkey – Saray Mahallesi Dr. Adnan Büyükdeniz Cad. No.13 34768 Ümraniye – İstanbul

Unilever Gida Sanayi ve Ticaret AŞ° (99.98)

0.05/99.93TRY0.011

Unilever Sanayi Ve Ticaret Türk AŞ° (99.98)

64.54/35.44TRY0.011

Besan Besin Sanayi ve Ticaret AŞ (99.99)

64.55/35.44TRY0.011

Dosan Konserve Sanayi ve Ticaret AŞ (99.64)

64.32/35.32TRY0.011

Uganda – Plot 10/12 Nyondo Close, Industrial Area, P.O. Box 3515 Kampala

Unilever Uganda Limited

0/100UGX20.001

Ukraine – 04119,27-T, Dehtyarivska Str., Kyiv


142 Financial StatementsGroup Companies  Annual Report on Form 20-F 20172018


 Name of
 Undertaking
 

% holding

as between

NV /PLC

 Nominal Value Share
Class
Note
  

Unilever Maghreb Export S.A. (97.59)

 97.59/0 TND 5.00 1 

Tunisia - Z.I. Voie Z4, Megrine Riadh, Tunis, 2014


UTIC Distribution S.A.x (47.82)

 47.82/0 TND 10.00 1 

Turkey - Saray Mahallesi Dr. Adnan Büyükdeniz Cad. No.13 34768 Ümraniye – İstanbul


Unilever Gida Sanayi ve Ticaret AŞ° (99.98)

 0.05/99.93 TRY 0.01 1 

UNILEVER SANAYI VE TICARET TÜRK AŞ°

 64.54/35.44 TRY 0.01 1 

(99.98)


Besan Besin Sanayi ve Ticaret AŞ (99.99)

 64.55/35.44 TRY 0.01 1 

Dosan Konserve Sanayi ve Ticaret AŞ (99.64)

 64.32/35.32 TRY 0.01 1 

Uganda - Plot 10/12 Nyondo Close, Industrial Area, P.O. Box 3515 Kampala


Unilever Uganda Limited

 0/100 UGX 20.00 1 

Ukraine - 04119,27-T, Dehtyarivska Str., Kyiv


Pallada Ukraine LLC

 100/0   13 

Unilever Ukraine LLC

 100/0   13 

United Arab Emirates - PO Box 17053, Jebel Ali, Dubai


Severn Gulf FZCOx (50)

 50/0 AED 100,000.00 1 

Unilever Gulf FZE

 0/100 AED 1,000.00 1 

United Arab Emirates - Parcel ID 598633, German Emarati Business Centre, Dubai


Unilever General Trading LLCx (49)

 0/49 AED 1,000.00 1 

United Araba Emirates - P.O. Box 18221 European Business Center Dubai Investments Park

 1 

Unilever Home & Personal Care Products

 0/49 AED 1,000.00 1 

Manufacturing LLCx(49)


United States - 700 Sylvan Avenue, Englewood Cliffs, New Jersey 07632-3201


ACI Brazil Holdings, LLC

 55.40/44.60   13 

ACUSA Brazil Holdings, LLC

 55.40/44.60   13 

Alberto Share Holdings, LLC

 55.40/44.60   13 

Alberto-Culver Company

 55.40/44.60 No Par Value 1 

Alberto-Culver International, Inc

 55.40/44.60 USD 1.00 1 

Alberto-Culver (P.R.), Inc

 55.40/44.60 USD 1.00 1 

ALBERTO-CULVER USA, INC

 55.40/44.60 No Par Value 1 

Ben & Jerry’s Franchising, Inc

 55.40/44.60 USD 1.00 7 

Ben & Jerry’s Gift Card, LLC

 55.40/44.60   13 

Ben & Jerry’s Homemade, Inc

 55.40/44.60 USD 0.01 7 

Bestfoods International (Holdings) Inc

 55.40/44.60 USD 100.00 7 

Chesebrough-Pond’s Manufacturing Company

 55.40/44.60 No Par Value 1 

CONOPCO, INC

 55.40/44.60 USD 1.00 7 

Dermalogica, LLC

 55.40/44.60   13 

DTJJS, LLC

 55.40/44.60   13 

Kate Somerville Holdings, LLC

 55.40/44.60   13 

Kate Somerville Skincare LLC

 55.40/44.60   13 

Lipton Industries, Inc

 55.40/44.60 USD 1.00 1 

Murad LLC

 55.40/44.60   13 

Pantresse, Inc

 55.40/44.60 USD 120.00 1 

REN USA Inc

 0/100 No Par Value 7 

Skin Health Experts, LLC

 55.40/44.60   13 

Kensington & Sons, LLC

 55.40/44.60   13 

St. Ives Laboratories, Inc

 55.40/44.60 USD 0.01 1 

T2 US LLC

 55.40/44.60   13 

Talenti Gelato, LLC

 55.40/44.60   13 

Talenti Holdings, LLC

 55.40/44.60   13 

TIGI Linea Corp

 55.40/44.60 No Par Value 1 

Unilever AC Canada Holding, Inc

 55.40/44.60 USD 10.00 1 

Unilever BCS Sourcing US Inc

 55.40/44.60 USD 1.00 1 

Unilever BCS US Inc

 55.40/44.60 USD 1.00 1 

Unilever Bestfoods (Holdings) LLC

 25.10/74.90   13 

UNILEVER CAPITAL CORPORATION

 55.40/44.60 USD 1.00 1 

Unilever Illinois Manufacturing, LLC

 55.40/44.60   13 

Unilever Manufacturing (US), Inc

 55.40/44.60 USD 1.00 1 

Unilever Trumbull Holdings, Inc

 42.54/57.46 USD 1.00 7 

Unilever Trumbull Research Services, Inc

 55.40/44.60 USD 1.00 1 
 55.40/44.60 USD 1.00 34 

Unilever United States Foundation, Inc

 55.40/44.60   13 

UNILEVER UNITED STATES, INC

 55.40/44.60 USD 0.3333 7 

Unilever Ventures Advisory LLC

 55.40/44.60   13 

United States – 100 N LaSalle, Ste 1900, Chicago IL, 60602


Blueair Inc.

 100/0 No Par Value 1 

United States - 233 Bleecker Street, New York, 10014


Carapina LLC

 100/0   13 

Grom Columbus LLC

 100/0   13 

Grom Malibu LLC

 100/0   13 

Grom USA LLC

 100/0   13 

Hollywood LLC

 100/0   13 

Spatula LLC

 100/0   13 

United States - 60 Lake Street, Suite 3N, Burlington, VT 05401


Seventh Generation Canada, Inc.

 55.40/44.60 No Par Value 7 

Seventh Generation, Inc.

 55.40/44.60 USD .001 7 

Seventh Generation Ventures, Inc.

 55.40/44.60 USD .001 7 

United States - 13335 Maxella Ave. Marina del Rey, CA 90292


Dollar Shave Club, Inc.

 55.40/44.60   13 

United States - 2711 Centerville Road, Suite 400, Wilmington, Delaware


Grom Franchising LLC

 100/0   13 
  Name of
  Undertaking

% holding

as

between

NV /PLC

Nominal

Value

    Share

    Class

    Note

Pallada Ukraine LLC100/013
Unilever Ukraine LLC100/013
United Arab Emirates – PO Box 17053, Jebel Ali, Dubai

Severn Gulf FZCOX(50)50/0AED100,000.001
Unilever Gulf FZE0/100AED1,000.001
United Arab Emirates – Easa Saleh Al Gurg Building, Karama, Office M01, P.O. Box 17055, Dubai

Unilever General Trading LLCX(49)0/49AED1,000.001
United Araba Emirates – Warehouse No. 1.2, Dubai Industrial Park – Seeh Shwaib 2

Unilever Home & Personal Care Products0/49AED1,000.001
Manufacturing LLCX(49)

United States – 700 Sylvan Avenue, Englewood Cliffs, New Jersey 07632-3201

Alberto-Culver Company55.40/44.60No Par Value1
Alberto-Culver International, Inc55.40/44.60USD1.001
Alberto-Culver (P.R.), Inc55.40/44.60No Par Value1
Alberto-Culver Usa, Inc55.40/44.60No Par Value1
Ben & Jerry’s Franchising, Inc55.40/44.60USD1.007
Ben & Jerry’s Gift Card, LLC55.40/44.6013
Ben & Jerry’s Homemade, Inc55.40/44.60USD0.017
Bestfoods International (Holdings) Inc55.40/44.60USD100.007
Chesebrough-Pond’s Manufacturing Company55.40/44.60No Par Value1
Conopco, Inc55.40/44.60USD1.007
Dermalogica, LLC55.40/44.6013
Food Service Direct Logistics, LLC55.40/44.6013
Kate Somerville Holdings, LLC55.40/44.6013
Kate Somerville Skincare LLC55.40/44.6013
Lipton Industries, Inc55.40/44.60USD1.001
Murad LLC55.40/44.6013
Pantresse, Inc55.40/44.60USD120.001
REN USA Inc0/100No Par Value7
Skin Health Experts, LLC55.40/44.6013
Kensington & Sons, LLC55.40/44.6013
St. Ives Laboratories, Inc55.40/44.60USD0.011
T2 US LLC55.40/44.6013
TIGI Linea Corp55.40/44.60No Par Value1
Unilever AC Canada Holding, Inc55.40/44.60USD10.001
Unilever Bestfoods (Holdings) LLC25.10/74.9013
Unilever Capital Corporation55.40/44.60USD1.001
Unilever Illinois Manufacturing, LLC55.40/44.6013
Unilever Manufacturing (US), Inc55.40/44.60USD1.001
Unilever Trumbull Holdings, Inc42.54/57.46USD1.007
Unilever Trumbull Research Services, Inc55.40/44.60USD1.001
55.40/44.60USD1.0034
Unilever United States Foundation, Inc55.40/44.6013
Unilever United States, Inc55.40/44.60USD0.33337
Unilever Ventures Advisory LLC55.40/44.6013
United States – 125 S Clark, Suite 2000, Chicago, IL 60603

Blueair Inc.100/0No Par Value1
United States – 233 Bleecker Street, New York, 10014

Carapina LLC100/013
Grom Columbus LLC100/013
Grom Malibu LLC100/013
Grom USA LLC100/013
Hollywood LLC100/013
Spatula LLC100/013
United States – 60 Lake Street, Suite 3N, Burlington, VT 05401

Seventh Generation Canada, Inc.55.40/44.60No Par Value7
Seventh Generation, Inc.55.40/44.60USD.0017
Seventh Generation Ventures, Inc.55.40/44.60USD.0017
United States – 13335 Maxella Ave. Marina del Rey, CA 90292

Dollar Shave Club, Inc.55.40/44.60USD.00113
Personal Care Marketing & Research Inc55.40/44.60USD 1.007
United States – 2711 Centerville Road, Suite 400, Wilmington, Delaware

Grom Franchising LLC100/013
United States – 55 East 59th Street, New York, 10022

Intuiskin Inc100/0No Par Value1
United States – CTC 1209 Orange Street Wilmington, DE19801

Living Proof, Inc.55.40/44.60USD0.011
United States – 1241 Electric Avenue, Venice CA 90291
Kingdom Animalia, LLC55.40/44.6013
United States – 2711 Centreville Road, Suite 400, Wilmington, New Castle County, Delaware 19808

Pukka Herbs Inc0/100USD0.0017
United States – 251 Little Falls Drive, Wilmington, DE, New Castle 19808

Cocotier, Inc100/0USD 0.0017
United States – 11 Ranick Drive South, Amityville, NY 11701

BC Cadence Holdings, Inc55.40/44.60USD0.017
Sundial Brands LLC55.40/44.60No Par Value66
Madam C.J. Walker Enterprises, LLC55.40/44.6013
Nyakio LLC55.40/44.6013
Uruguay – Camino Carrasco 5975, Montevideu

Unilever Uruguay SCC S.A.100/0UYU1.001
 Name of
 Undertaking
 

% holding

as between

NV /PLC

 Nominal Value Share
Class
Note
  

United States - 55 East 59th Street, New York, 10022


Intuiskin Inc

 100/0 No Par Value 1 

United States - 420 South Robertson Dr., #260, Beverly Hills, CA 90212


Personal Care Marketing & Research Inc

 55.40/44.60 USD 1.00 7 

United States – CTC 1209 Orange Street Wilmington, DE19801


Living Proof, Inc.

 55.40/44.60 USD 0.01 1 

United States – CSC Lawyers Incorporating Service, 2710 Getaway Oaks Drive, 150N Sacramento, CA 95833


Kingdom Animalia, LLC

 55.40/44.60   13 

United States - 2711 Centreville Road, Suite 400, Wilmington, New Castle County, Delaware 19808


Pukka Herbs Inc

 0/100 USD 0.001 7 

Uruguay - Camino Carrasco 5975, Montevideu


Unilever Uruguay SCC S.A.

 100/0 UYU 1.00 1 

Lever S.A.

 100/0 UYP 0.10 1 

Arisco Productos Alimenticios Uruguay S.A.

 64.55/35.45 UYP 1.00 1 

Unilever del Uruguay S.R.L.

 100 /0 UYU 1.00 1 

Venezuela -Edificio Torre Corp Banca, Piso 15, entre Avenidas Blandín y Los Chaguaramos, Urbanización La Castellana, Caracas


Unilever Andina Venezuela S.A.

 100/0 VEB 1,000.00 1 

Vietnam - LotA2-3, Tay Bac Cu Chi Industry Zone, Tan An Hoi Ward, Cu Chi District, Ho Chi Minh City


Unilever Vietnam International Company Limited

 100/0   13 

Zambia - Stand No. 7136, Mwembeshi Road, P.O. Box 31953 Lusaka


Unilever South East Africa Zambia Limited

 0/100 ZMK 2.00 34 
 0/100 ZMK 2.00 1 

Zimbabwe - Box 950 Harare


Unilever – Zimbabwe (Pvt) Limitedr

 0/100 ZWD 2.00 1 

SUBSIDIARY UNDERTAKINGS NOT INCLUDED IN THE CONSOLIDATION


Brazil- Pouso Alegre, Minas Gerais, Brazil Av, Prefeito Olavo Gomes, 3701, Suite Repensar, Jardim Mariosa,37550-000


UBI 3 Participacoes Ltda

 64.55/35.45 BRL 1.00 5 

China - Room 01, 24/F, Office Building, No. 93 Middle Huaihai Road, Shanghai


Shanghai CarverKorea Limited

 0/100 USD 1.00 7 

Ecuador - Km 25 Vía a Daule, Guayaquil


Visanuasa S.A.

 100/0 USD 1.00 1 

England and Wales - 5th Floor, 6 St Andrew Street, London, EC4A 3AE


Big Sync Music Limitedr (67.39)

 67.39/0 GBP 0.001 35 
 100/0 GBP 1.00 36 

Catexel Limitedr (97.67)

 0/97.67 GBP 0.01 2 

(45.25)

 0/45.25 GBP 0.01 36 

(96.67)

 0/96.67 GBP 0.01 14 

Catexel Technologies Limitedr (79.52)

 0/79.52 GBP 0.001 35 

Catexel Cellulosics Limitedr (80.27)

 0/80.27 GBP 0.001 35 

Unilever Ventures General Partner Limited

 0/100 GBP 1.00 1 

England and Wales – 100 Victoria Embankment, Blackfriars, London, EC4Y 0DY


Dollar Shave Club Limited

 0/100 GBP 1.00 1 

England and Wales – 1 More London Place, London, SE1 2AF


Brooke Bond Foods Limited (In Liquidation)

 0/100 GBP 1.00 1 

Unidis Twenty Six Limited (In Liquidation)

 0/100 GBP 1.00 1 

Ghana - Plot No. Ind/A/3A–4, Heavy Industrial Area, Tema


United Africa Trust Limited

 0/100 GHC 10.00 1 

Greece - Kymis ave & 10, Seneka str.GR-145 64 Kifissia


Lipoma Management Consulting SA

 100/0 EUR 10.00 1 

Haiti –Port-au-Prince


Unilever Haiti S.A.

 100/0 HTG 500,000 56 

Hong Kong – 6th Floor, Alexandra House, 18 Chater Road, Central


T2 Hong Kong Limited

 100/0 HK 1 1 

Hong Kong - Room 1808, 18/F, Tower II Admiralty Centre, 18 Harcourt Road, Admiralty


Hong Kong CarverKorea Limited

 0/100 HKD 1.00 7 

India - Unilever House, B. D. Sawant Marg, Chakala, Andheri (E), Mumbai 400 099


Bhavishya Alliance Child Nutrition Initiatives

 0/67.20 INR 10.00 1 

(67.20)


Hindustan Unilever Foundation (67.21)

 0/67.21 INR 10.00 1 

Israel - 3 Daniel Fisch St., Tel Aviv, 6473104


PCMR International Limited

 55.40/44.60 NIS 0.10 1 

Iran – No.32, Mokhberb Blvd, Ashrafi Esfashani Exo,.Tehran, Iran Postal Code: 1476785475


Golestan Co.

 50.66/0   1 

Jamaica - White Marl Street, Spanish Town, PO Box 809, Parish Saint Catherine


Unilever Jamaica Limited

 0/100 JMD 1.00 1 

Kenya - Commercial Street, P.O. BOX 40592-00100, Nairobi


Union East African Trust Limited*

 0/100 KES 20.00 1 

Korea – 81, Tojeong31-gil,Mapo-gu, Seoul


Carver Korea Co., Ltd

 0/100 KRW 500.00 7 

Morocco - Km 10, Route Cotiere, Ain Sebaa, Casablanca


Societe Commerciale du Rif

 0/100 MAD 50.00 1 

Societe Tangeroise de Parfumerie et d’Hygiene S.A.R.L.

 0/100 MAD 50.00 1 

Netherlands - Wassenaarseweg 72, 2333 AL Leiden


Chemsenti B.V. (79.52)

 0/79.52 EUR 1.00 1 

Weena 455, 3013 AL Rotterdam


Unilever UK Holdings B.V.

 100/0 EUR 1.00 1 
  Name of
  Undertaking


% holding

as

between

NV /PLC


Nominal

Value


    Share  

    Class  

    Note  


Lever S.A. 100/0     UYP0.10  1   
Arisco Productos Alimenticios Uruguay S.A. 64.55/35.45     UYP1.00  1   
Unilever del Uruguay S.R.L. 100 /0     UYU1.00  1   
Venezuela-Edificio Torre Corp Banca, Piso 15, entre Avenidas Blandín y Los Chaguaramos, Urbanización La Castellana, Caracas


Unilever Andina Venezuela S.A. 100/0     VEB1,000.00  1   
Vietnam – LotA2-3, Tay Bac Cu Chi Industry Zone, Tan An Hoi Ward, Cu Chi District, Ho Chi Minh City


Unilever Vietnam International Company Limited 100/0       13   
Zambia – Stand 2375, Corner Addis Ababa Drive & Great East Road, Show Grounds, Lusaka


Unilever South East Africa Zambia Limited 0/100     ZMK2.00  34   
 0/100     ZMK2.00  1   
Zimbabwe – 2 Stirling Road, Workington, Harare


Unilever – Zimbabwe (Pvt) LimitedD 0/100     ZWD2.00  1   
SUBSIDIARY UNDERTAKINGS NOT INCLUDED IN THE CONSOLIDATION


Brazil- Pouso Alegre, Minas Gerais, Brazil Av, Prefeito Olavo Gomes, 3701, Suite Repensar, Jardim Mariosa,37550-000


UBI 3 Participacoes Ltda 64.55/35.45     BRL1.00  5   
Bulgaria – 3 Ulitsa Na Uslugite ST, 5000 Veliko Tarnovo


Sladoledena Fabrika EOOD 100/0     BGN 50.00  1   
Bulgaria – Ilyu Voyvoda No. 10, Veliko Tarnovo district, 5000 Veliko Tarnovo


Slimfood EOOD 100/0     BGN 100.00  1   
Ecuador – Km 25 Vía a Daule, Guayaquil


Visanuasa S.A. 100/0     USD1.00  1   
England and Wales – 5th Floor, 6 St Andrew Street, London, EC4A 3AE


Big Sync Music LimitedDà (67.39) 67.39/0     GBP0.001  35   
(99.47) 99.47/0     GBP1.00  36   
Catexel LimitedDà (97.67) 0/97.67     GBP0.01  2   
(45.25) 0/45.25     GBP0.01  37   
(96.67) 0/96.67     GBP0.01  14   
Unilever Ventures General Partner Limitedà 0/100     GBP1.00  1   
England and Wales – 100 Victoria Embankment, Blackfriars, London, EC4Y 0DY


Dollar Shave Club Limited 0/100     GBP1.00  1   
England and Wales – 1 More London Place, London, SE1 2AF


Unidis Twenty Six Limited (In Liquidation) 0/100     GBP1.00  1   
Lever Brothers Port Sunlight Limited 0/100     GBP1.00  1   
(in liquidation)


Greece – Kymis ave & 10, Seneka str.GR-145 64 Kifissia


Lipoma Management Consulting SA 100/0     EUR10.00  1   
Haiti –Port-au-Prince


Unilever Haiti S.A. 100/0     HTG500,000  56   
India – Unilever House, B. D. Sawant Marg, Chakala, Andheri (E), Mumbai 400 099


Bhavishya Alliance Child Nutrition Initiatives (67.19) 0/67.19     INR10.00  1   
Hindustan Unilever Foundation (67.21) 0/67.21     INR10.00  1   
Israel – Park Zvaim Industrial Area, Beit Shean / Correspondance: P.O.B. 787, Beit Shean, 1090000


PCMR International Limited 55.40/44.60     NIS0.10  1   
Iran – No.32, Mokhberb Blvd, Ashrafi Esfashani Exo,.Tehran, Iran Postal Code: 1476785475


Golestan Co. (50.66) 50.66/0       1   
Italy – Via Plava, 74 10135 Torino


Equilibra S.R.L. 100/0     EUR 7.80  5   
Jamaica – White Marl Street, Spanish Town, PO Box 809, Parish Saint Catherine


Unilever Jamaica Limited 0/100     JMD1.00  1   
Kenya – Commercial Street, P.O. BOX 40592-00100, Nairobi


Union East African Trust Limited* 0/100     KES20.00  1   
Moldova – 6A Uzinelor Street, Kishinev, MD -2023


Betty Ice Moldova 100/0     MDL 7,809,036.00  1   
Morocco – Km 10, Route Cotiere, Ain Sebaa, Casablanca


Societe Commerciale du Rif 0/100     MAD50.00  1   
Societe Tangeroise de Parfumerie et d’Hygiene S.A.R.L. 0/100     MAD50.00  1   
Netherlands – Weena 455, 3013 AL Rotterdam


Unilever International Holding B.V.* 100/0     EUR1.00  1   
Unilever Insurances N.V. 100/0     EUR454.00  1   
Netherlands – Jagerskade 17,3552 TL Utrecht


De Korte Weg B.V. 100/0     EUR1.00  1   
 100/0     EUR1.00  26   
Scotland – 15 Atholl Crescent, Edinburgh, EH3 8HA


Unilever Ventures (SLP) General Partner Limited 0/100     GBP1.00  1   
Singapore – 50 Raffles Place#06-00 Singapore Land Tower, Singapore 048623


Big Sync Music Pte. Limitedà (67.39) 67.39/0     USD1.00  1   
Sudan – Kafoury, Area (4), Industrial Zone, Khartoum


Unilever Sudanese Investment Company 0/100     SDF10.00  1   
United States – 13335 Maxella Ave. Marina del Rey, CA 90292


DSC Distribution, Inc. 55.40/44.60       13   
United States – 233 Bleecker Street, New York, 10014


Grom WTC LLC 100/0       13   
Grom Century City LLC 100/0       13   
United States – Harvard Business Services, Inc. 16192 Coastal Highway, Lewes DE, USA


Big Sync Music Inc.à (67.39) 67.39/0     USD0.01  1   


Annual Report on Form 20-F 20172018 Financial StatementsGroup Companies 143


NOTES TO THE CONSOLIDATED FINANCIAL STATEMENTS

UNILEVER GROUP COMPANIESCONTINUED


 Name of

 Undertaking


% holding

as between

NV /PLC


Nominal Value


Share 
Class 
Note 


Unilever International Holdings B.V.

 100/0 EUR 1.00 1

Unilever UK Holdings N.V.°

 100/0 EUR 1.00 1

Unilever International Holdings N.V.°

 100/0 EUR 1.00 1

Scotland - 15 Atholl Crescent, Edinburgh, EH3 8HA

Unilever Ventures (SLP) General Partner Limited

 0/100 GBP 1.00 1

United States - 13335 Maxella Ave. Marina del Rey, CA 90292

DSC Distribution, Inc.

 55.40/44.60   13

United States - 233 Bleecker Street, New York, 10014

Grom WTC LLC

 100/0   13

Grom Century City LLC

 100/0   13

United States - 200 Clarendon Street, Boston, MA 02116

BC Cadence Holdings, Inc

 55.40/44.60 USD 0.01 7

United States - 11 Ranick Drive South, Amityville, NY 11701

Sundial Group LLC

 55.40/44.60   22
 55.40/44.60   64
 55.40/44.60   65

Sundial Group Holdings LLC

 55.40/44.60   13

BTWalls LLC

 55.40/44.60   13

Sundial Brands LLC

 55.40/44.60   66

Sundial Creations LLC

 55.40/44.60   13

Madam C.J. Walker Enterprises, LLC

 55.40/44.60   13

Nyakio LLC

 55.40/44.60   13

Sundial Digital LLC

 55.40/44.60   13

ASSOCIATED UNDERTAKINGS

Australia –1-3 Newton Street, Cremorne, VIC 3121

SNDR PTY LTDr

 100/0 No Par Value 58

Bahrain - 161, Road 328, Block 358, Zinj, Manama

Unilever Bahrain Co. W.L.L. (49)

 0/49 BHD 50.00 1

Brazil - Rod. Dom Gabriel Paulino Bueno Couto, km. 66 – Part

ITB Ice Tea do Brazil Limitada (50) 32.28/17.72 BRL 1.00 5
Brazil - Avenue Engenheiro Luiz Carlos Berrini, 105, 16º andar, Ed. Berrini One, Itaim Bibi,
CEP0471/001-00, City of São Paulo, State of São Paulo   
Gallo Brasil Distribuição e comércio Limitada (55) 0/55 BRL 1.00 5
Canada - Suite300-171 West Esplanade, North Vancouver, British Columbia Canada V7M 3K9
A&W Root Beer Beverages Canada Inc. (40) 25.82/14.18 No Par Value 38
Cyprus - 2 Marcou Dracou str., Engomi Industrial Estate, 2409 Nicosia
Unilever PMT Limitedr (49) 0/49 EUR 1.71 3
England and Wales - Chesterford Research Park, Little Chesterford, Saffron, Waldon CB10 1XL
Arecor Limitedr (24.22) 0/24.22 GBP 0.01 1
(35.72) 0/35.72 GBP 0.01 35
England and Wales - 3rd Floor, 101 New Cavendish Street, London W1W 6XH
Blis Media Limitedr (30.11) 30.11/0 GBP 0.00001 39
England and Wales - Cambridge House, 16 High Street, Saffron Walden, Essex CB10 1AX
Blow Limited (6.97) 6.97/0 GBP 0.001 1
(49.77) 49.77/0 GBP 0.001 57
England and Wales - First Floor,59-61 High Street West, Glossop SK13 8AZ
CDDM Technology Limitedr (49.53) 0/49.53 GBP 0.01 36
England and Wales - 1st Floor, Charles House,5-11 Regent Street, London SW1Y 4LR
Langholm Capital II L.P. 46.30/0   4
England and Wales - Unit 3 Morris House, Swainson Road, London W3 7UP
SCA Investments Limitedr (5.98) 5.98/0 GBP 0.001 35
(74.60) 74.60/0 GBP 0.001 40
(25.19) 25.19/0 GBP 0.001 41
(9.52) 9.52/0 GBP 0.001 42
England and Wales – 167 Wimbledon Park Road, London SW18 5RH
THENUDECO LIMITEDr (38.95) 38.95/0 GBP 0.001 35
England and Wales - Cambridge House, 16 High Street, Saffron Walden, Essex CB10 1AX
Trinny London Limitedr (64.22) 64.22/0 GBP 0.01 43
England and Wales - 5th Floor, 6 St Andrew Street, London EC4A 3AE
Voltea Limitedr (35.58) 0/35.58 EUR 0.10 35
(66.83) 0/66.83 EUR 0.10 44
(12.44) 0/12.44 EUR 0.10 46
(18.14) 0/18.14 EUR 0.10 52
(3.56) 0/3.56 EUR 0.10 50
France - 7 rue Armand Peugeot, 92500 Rueil-Malmaison
Relais D’or Centrale S.A.S. (49.99) 32.27/17.72 No Par Value 1
Germany - Beerbachstraße 19, 91183 Abenberg
Hans Henglein & Sohn GmbH (50) 32.78/17.22 EUR 100,000.00 1
Henglein & Co. Handels-und Beteiligungs 32/18   4
GmbH & Co. KG (50)    
Henglein Geschäftsführungs GmbH (50) 32/18 DEM 50,000.00 1
Nürnberger Kloßteig NK GmbH & Co. KG (50) 32/18   4
Germany - Bad Bribaer Straße, 06647 Klosterhäseler
Henglein GmbH (50) 32/18 DEM 50,000.00 1
Beerbachstruße 37, 17153 Stavenhagen    
  Name of
  Undertaking


% holding

as

between

NV /PLC


Nominal

Value


    Share

    Class

    Note


ASSOCIATED UNDERTAKINGS 
Australia –1-3 Newton Street, Cremorne, VIC 3121


SNDR PTY LTDDà 100/0     No Par Value  58   
Australia – 3 Moss Place, North Melbourne, Victoria 3051


Group 14 Holdings Limited 100/0     No Par Value  71 
Bahrain – 161, Road 328, Block 358, Zinj, Manama


Unilever Bahrain Co. W.L.L. (49) 0/49     BHD50.00  1 
Brazil – Rod. Dom Gabriel Paulino Bueno Couto, km. 66 – Part


ITB Ice Tea do Brazil Limitada (50) 32.28/17.72     BRL1.00  5 
Brazil – Avenue Engenheiro Luiz Carlos Berrini, 105, 16º andar, Ed. Berrini One, Itaim Bibi, CEP0471/001-00, City of São Paulo, State of São Paulo


Gallo Brasil Distribuição e comércio Limitada (55) 0/55     BRL 1.00  5 
Canada – Suite300-171 West Esplanade, North Vancouver, British Columbia Canada V7M 3K9


A&W Root Beer Beverages Canada Inc. (40) 25.82/14.18     No Par Value  38 
Cyprus – 2 Marcou Dracou str., Engomi Industrial Estate, 2409 Nicosia


Unilever PMT LimitedD (49) 0/49     EUR1.71  3 
England and Wales – Chesterford Research Park, Little Chesterford, Saffron, Waldon CB10 1XL


Arecor LimitedDà (24.22) 0/24.22     GBP0.01  1 
(36.23) 0/36.23     GBP0.01  35 
England and Wales – 10 Bloomsbury Way, London, WC1A 2SL


Blis Media LimitedDà (30.67) 30.67/0     GBP0.00001  39 
(0.20) 0.20/0     GBP0.00001  1 
England and Wales – 81 Farringdon Street, London, EC4A 4BL


Blow LimitedD (6.97) 6.97/0     GBP0.001  1 
(49.77) 49.77/0     GBP0.001  57 
England and Wales – First Floor,59-61 High Street West, Glossop SK13 8AZ


CDDM Technology LimitedDà (49.53) 0/49.53     GBP0.01  36 
England and Wales – 2nd Floor, 17 Waterloo Place, London, SW1Y 4AR


Langholm Capital II L.P. 46.30/0       4 
England and Wales – Unit 1.8 & 1.9 The Shepherds Building, Charecroft Way, London, England, W14 0EE


SCA Investments LimitedDà (5.98) 5.98/0     GBP0.001  35 
(74.60) 74.60/0     GBP0.001  40 
(25.19) 25.19/0     GBP0.001  41 
(5.78) 5.78/0     GBP0.001  42 
England and Wales – 167 Wimbledon Park Road, London SW18 5RH


THENUDECO LIMITEDDà (38.95) 38.95/0     GBP0.001  35 
England and Wales – Cambridge House, 16 High Street, Saffron Walden, Essex CB10 1AX


Trinny London LimitedDà (59.43) 59.43/0     GBP0.01  43 
(35.82) 35.82/0     GBP0.01  77 
England and Wales – 5th Floor, 6 St Andrew Street, London EC4A 3AE


Voltea LimitedDà (35.58) 0/35.58     EUR0.10  35 
(66.83) 0/66.83     EUR0.10  44 
(12.44) 0/12.44     EUR0.10  46 
(18.14) 0/18.14     EUR0.10  52 
(3.56) 0/3.56     EUR0.10  50 
England and Wales – Chiswick Green, 610 Chiswick High Road, London W4 5RU


Brand Evanglist for Beauty LimitedDà 100/0     GBP1.00  43 
England and Wales – 127 North Milton Park, Abingdon, Oxfordshire OX14 4SA


P2i LimitedDà (12.89) 12.89/0     GBP0.0001  1 
(5.47) 5.47/0     GBP0.0001  44 
(5.47) 5.47/0     GBP0.0001  46 
(50) 50/0     GBP1.00  80 
England and Wales –1-2 Hatfields, London, England, SE1 9PG


Limitless Technology LimitedDà (9.69) 9.69/0     GBP0.001  1 
(28.88) 28.88/0     GBP0.001  35 
England and Wales – Studio 311, Record Hall,16-16a Baldwin’s Gardens, London, EC1N 7RJ


Clean Beauty Co LtdDà (38.75) 38.75/0     GBP0.0001  22 
England and Wales – 170 Finchley Road, London, NW3 6BP


GALLINEE LTDDà (85.11) 85.11/0     GBP0.01  44 
France – 7 rue Armand Peugeot, 92500 Rueil-Malmaison


Relais D’or Centrale S.A.S. (49.99) 32.27/17.72     No Par Value  1 
Germany – Beerbachstraße 19, 91183 Abenberg


Hans Henglein & Sohn GmbH (50) 32.78/17.22     EUR100,000.00  1 
Henglein & Co.Handels-und Beteiligungs GmbH 32/18       4 
& Co. KGà (50)


Henglein Geschäftsführungs GmbHà (50) 32/18     DEM 50,000.00  1 
Nürnberger Kloßteig NK GmbH & Co. KGà (50) 32/18       4 
Germany – Bad Bribaer Straße, 06647 Klosterhäseler


Henglein GmbHà (50) 32/18     DEM 50,000.00  1 
Germany – Beerbachstruße 37, 17153 Stavenhagen


Hochreiter Frischteigwaren GmbH (50) 32.78/17.22     DEM250,000.00  1 
Indonesia - Wisma Bango Lt.05, Jl.Sulaiman No.32 Sukabumi Utara Kec. Kebon Jeruk, Jakarta Barat 11540


PT Anugrah Mutu Bersama (40) 26.22/13.78     IDR1,000,000.00  1 
India – Plot NoB-9-10 - Near Huda Market, Sector 32, Gurugram, Gurgaon HR 122001


AAIDEA Solutions Private LimitedDà (1.08) 1.08/0     INR100.00  75 
 100/0     INR100.00  72 
(5.72) 5.72/0     INR100.00  73 
(8.19) 8.19/0     INR100.00  74 
India – 7th Floor, 703/704, Marathon Icon, Off Ganpatrao Kadam Marg, Vir Santaji Marg, Lower Parel, Mumbai-400013


 Name of

 Undertaking


% holding

as between

NV /PLC


Nominal Value


Share 
Class 
Note 


Hochreiter Frischteigwaren GmbH (50)

 32.78/17.22 DEM 250,000.00 1

Indonesia - Wisma Bango Lt.05, Jl.Sulaiman No.32, Jakarta Barat 11540

PT Anugrah Mutu Bersama (40)

 26.22/13.78 IDR 1,000,000.00 1

Ireland - 70 Sir John Rogersons Quay, Dublin 2

Pepsi Lipton International Limitedr

 100/0 EUR 1.00 52
 100/0 EUR 1.00 53
 100/0 EUR 1.00 54
 100/0 EUR 1.00 55

India – 101, Tower 5, Orchid Petals, Sector 49, Gurgaon

AAIDEA Solutions Private Limitedr

 100/0 INR 100.00 67

India - 7th Floor, 703/704, Marathon Icon, Off Ganpatrao Kadam Marg, Vir Santaji Marg,

Lower Parel, Mumbai-400013

Peel-Works Private Limitedr (48.15)

 48.15/0 INR 30.00 63

Israel - Kochav Yokneam Building, 4th Floor, P.O. Box 14, Yokneam Illit 20692

Iluminage Beauty Limitedr (99.74)

 99.74/0 ILS 1.00 14

Japan - #308, 5–4–1, Minami Azabu, Tokyo

Grom Japan K.K (34)

 34/0 JPY 50,000.00 1

Luxembourg - 5 Heienhaff,L-1736 Senningerberg

Helpling Group Holding S.à r.l.r

 98.57/0 EUR 1.00 60

Mauritius – c/o Equinoxe Alternative Investment services (Mauritius Limited); 12thFloor,

Standard Chartered Tower. Ebene 72201

Capvent Asia Consumer Fund Limitedr (41.00)

 41.00/0 USD 0.01 8

Oman - Po Box 1711, Ruwi, Postal code 112

Towell Unilever LLC

 0/49 OMR 10.00 1

Philippines - 11th Avenue corner 39th Street, Bonifacio Triangle, Bonifacio Global City,

Taguig City, M.M

Sto Tomas Paco Land Corpr

 64.55/35.45 PHP 1.00 7

Paco Platform 7.5 Inc.r

 64.55/35.45 PHP 1.00 7

Cavite Horizons Land, Inc.

 22.66/12.44 PHP 1.00 7
 64.55/35.45 PHP 10,000.00 14

Industrial Realties, Inc.

 29.30/16.1 PHP 1.00 7

Philippines - Manggahan Light Industrial Compound, A. Rodriguez Avenue, Bo. Manggahan,

Pasig City

WS Holdings Inc.r

 64.55/35.45 PHP 1.00 29

Selecta Walls Land Corpr

 64.55/35.45 PHP 10.00 29

Portugal - Largo Monterroio Mascarenhas, 1,1099–081 Lisboa

Fima Ola – Produtos Alimentares, S.A. (55)

 0/55 EUR 500.00 1

Gallo Worldwide, Limitada (55)

 0/55 EUR 1,000,000.00 5

Transportadora Central do Infante, Limitada (54)

 0/54 EUR 1.00 1

Unilever Fima, Limitada (55)

 0/55 EUR 26,295,157.00 5

Victor Guedes – Industria e Comercio, S.A. (55)

 0/55 EUR 5.00 1

Sweden - No 18 Office & Lounge, Briger Jarlsgatan 18,114 34 Stockholm

SachaJuan Haircare ABr (99.50)

 99.50/0 SEK 1.00 9

United Arab Emirates - P.O. Box 49, Dubai


Al Gurg Unilever LLC (49)

 0/49 AED 1,000.00 1

United Arab Emirates - Po Box 49, Abu Dhabi


Thani Murshid Unilever LLC (49)

 49/ 0 AED 1,000.00 1

United States -1679 South Dupont Highway, Suite 100, Dover, Kent County, Delaware 19901

Beauty Bakerie Cosmetics Brand Incr (50.05)

 50.05/0 USD 0.001 58

United States - 2600 Tenth St #101, Berkeley CA 94710


Machine Vantage (9.86)

 9.86/0   7

(55.19)

 55.19/0   58

United States - c/o Law Traders Inc., 300 Delaware Ave., Suite 210, in the City of Wilmington, County of New Castle

Quantbiome Inc. (dba Thryve)r (23.26)

 23.26/0 USD 0.00001 59

United States - C/O National Registered Agents, Inc.160 Green Tree Drive, Suite 101, Dover, Delaware 19904

Discuss.io Incr (8.30)

 8.30/0 USD 0.0001 7

(15.36)

 15.36/0 USD 0.0001 55

(53.91)

 53.91/0 USD 0.0001 43

United States - 700 Sylvan Avenue, Englewood Cliffs, New Jersey 07632-3201


Pepsi Lipton Tea Partnership (50)

 27.70/22.30   4

United States – 548 Market St #70998, San Francisco, CA 94104-5401


Physic Ventures L.P. (57.27)

 57.27/0   4

United States - 1170 Olinder Court, San Jose, CA 95122


Sunbasket Incr (2.51)

 2.51/0 USD 0.0001 7

(89.03)

 89.03/0 USD 0.0001 60

(1.92)

 1.92/0 USD 0.0001 61

United States - 2711 Centerville Road, 400 Wilmington, 19808 New Castle


Nutraceutical Wellness Inc (dba Nutrafol)r

 41.70/0 USD 0.0001 62

(41.70)


(56.82)

 56.82/0 USD 0.0001 51
  Name of
  Undertaking


% holding

as

between

NV /PLC


Nominal

Value


    Share

    Class

    Note


Peel-Works Private LimitedDà (48.15) 48.15/0     INR30.00  63   
(16.67) 16.67/0     INR30.00  70 
India – 403 Valentina, Hiranandani Estate Thane, Thane West, 400607, Maharashtra


Pureplay Skin Sciences (India) Private Limited 0.10/0     INR100.00  75 
(0.10)


(100) 100/0     INR100.00  73 
India – 135 Hubtown Solaris, N.S. Phadke Marg, Andheri East-West Flyover Junction, Andheri (East) Mumbai 400069


O(1) India Private Limited (dba Shop101) (0.001) 0.001/0     INR10.00  75 
(29.15) 29.15/0     INR100.00  76 
Ireland – 70 Sir John Rogersons Quay, Dublin 2


Pepsi Lipton International LimitedD 100/0     EUR1.00  52 
 100/0     EUR1.00  53 
 100/0     EUR1.00  54 
 100/0     EUR1.00  55 
Israel – Kochav Yokneam Building, 4th Floor, P.O. Box 14, Yokneam Illit 20692


IB Ventures LimitedD (99.74) 99.74/0     ILS1.00  14 
Japan – #308, 5–4–1, Minami Azabu, Tokyo


Grom Japan K.KD (34) 34/0     JPY50,000.00  1 
Luxembourg – 5 Heienhaff,L-1736 Senningerberg


Helpling Group Holding S.à r.l.Dà (98.57) 98.57/0     EUR1.00  60 
Mauritius – c/o Apex Fund Services (Mauritius) Ltd, 4th Floor, 19 Bank Street, Cyber City, Ebene 72201


Capvent Asia Consumer Fund LimitedD (40.47) 40.47/0     USD0.01  78 
Oman – Po Box 1711, Ruwi, Postal code 112


Towell Unilever LLC (49) 0/49     OMR10.00  1 
Philippines – 11th Avenue corner 39th Street, Bonifacio Triangle, Bonifacio Global City, Taguig City, M.M


Sto Tomas Paco Land CorpDà 64.55/35.45     PHP1.00  7 
Paco Platform 7.5 Inc.Dà 64.55/35.45     PHP1.00  7 
Cavite Horizons Land, Inc.à (35.10) 22.66/12.44     PHP1.00  7 
 64.55/35.45     PHP10,000.00  14 
Industrial Realties, Inc.à (45.40) 29.30/16.1     PHP1.00  7 
Philippines – Manggahan Light Industrial Compound, A. Rodriguez Avenue, Bo. Manggahan, Pasig City


WS Holdings Inc.Dà 64.55/35.45     PHP1.00  29 
Selecta Walls Land CorpDà 64.55/35.45     PHP10.00  29 
Portugal – Largo Monterroio Mascarenhas, 1,1099–081 Lisboa


Fima Ola – Produtos Alimentares, S.A. (55) 0/55     EUR4,125,000  1 
Gallo Worldwide, Limitada(55) 0/55     EUR550,000  5 
Grop – Gelado Retail Operation Portugal,       
Unipessoal, LDA (55) 0/55     EUR27,500  5 
Transportadora Central do Infante, Limitada (54) 0/54     EUR27,000  1 
Unilever Fima, Limitada (55) 0/55     EUR14,462,336.00  5 
Victor Guedes – Industria e Comercio, S.A. (55) 0/55     EUR275.00  1 
Sweden – No 18 Office & Lounge, Briger Jarlsgatan 18,114 34 Stockholm


SachaJuan Haircare ABDà (76.51) 76.51/0     SEK1.00  9 
United Arab Emirates – P.O. Box 49, Dubai


Al Gurg Unilever LLC (49) 0/49     AED1,000.00  1 
United Arab Emirates – Po Box 49, Abu Dhabi


Thani Murshid Unilever LLC (49) 0/49     AED1,000.00  1 
United States -1679 South Dupont Highway, Suite 100, Dover, Kent County, Delaware 19901


Beauty Bakerie Cosmetics Brand IncDà (64.69) 64.69/0     USD0.001  58 
United States – 2600 Tenth St #101, Berkeley CA 94710


Machine Vantageà (9.86) 9.86/0       7 
(49.93) 49.93/0       58 
United States – c/o Law Traders Inc., 300 Delaware Ave., Suite 210, in the City of Wilmington, County of New Castle


Quantbiome Inc. (dba Thryve)Dà (23.26) 23.26/0     USD0.00001  59 
United States – C/O National Registered Agents, Inc.160 Green Tree Drive, Suite 101, Dover, Delaware 19904


Discuss.io IncDà (8.76) 8.76/0     USD0.0001  7 
(15.36) 15.36/0     USD0.0001  55 
(56.59) 43.64/12.95     USD0.0001  58 
United States – 700 Sylvan Avenue, Englewood Cliffs, New Jersey 07632-3201


Pepsi Lipton Tea Partnership (50) 27.70/22.30       4 
United States – 548 Market St #70998, San Francisco, CA 94104-5401


Physic Ventures L.P.à (57.27) 57.27/0       4 
United States – 1170 Olinder Court, San Jose, CA 95122


Sunbasket IncDà (2.93) 2.93/0     USD0.0001  7 
(89.03) 89.03/0     USD0.0001  60 
(1.92) 1.92/0     USD0.0001  61 
United States – 251 Little Falls Drive, Wilmington, Delaware, New Castle 19808


Nutraceutical Wellness Inc (dba Nutrafol)Dà 41.70/0     USD0.0001�� 62 
(41.70)


(56.82) 56.82/0     USD0.0001  51 
True Botanicals, IncDà (37.17) 37.17/0     USD0.0001  81 
(12.27) 12.27/0     USD0.0001  82 
(25.59) 0/25.59     USD0.0001  83 
United – States 850 New Burton Road, in the City of Dover, County of Kent, Delovare, USA


Volition Beauty IncDà (66.44) 66.44/0     USD0.0001  44 


144 Financial StatementsGroup Companies  Annual Report on Form 20-F 20172018


Notes:

1: Ordinary, 2:Ordinary-A, 3:Ordinary-B, 4: Partnership, 5: Quotas, 6: Class- A Common, 7: Common, 8: Class A, 9: Class B, 10: Class C, 11: Class II Common, 12: Class III Common, 13: Membership Interest, 14: Preference, 15: Redeemable Preference, 16: Limited by Guarantee, 17: Estate,C Ordinary Shares, 18: Viscountcy, 19: Redeemable Golden Share, 20: Deferred, 21:Ordinary-C, 22: Preferred, 23: Redeemable Preference Class A, 24: Redeemable Preference Class B, 25: Special, 26: Cumulative Preference, 27: 5% Cumulative Preference, 28:Non-Voting Ordinary B, 29: Common B, 30:Management, 31: Dormant, 32: A, 33: B, 34: Cumulative Redeemable Preference, 35:A-Ordinary, 36: Preferred Ordinary, 37:Ordinary-G, 38:Class Common-B, 39: Series A Participating Preference, 40:H-Ordinary, 41:I-Ordinary, 42:J-Ordinary, 43: Series A Preferred Convertible, 44: A Preferred, 45: A1 Preferred, 46: B Preferred, 47: Series 2 Preferred, 48: Series 3 Preferred, 49:Series A2 Convertible Redeemable Preference, 50: D Preferred, 51: SeriesA-3 Preferred, 52: C Preferred, 53:E Ordinary, 54: G Preferred, 55: Series Seed, 56: Nominal, 57: Preferred A, 58: Series A Preferred, 59: SeriesSeed-2 Preferred, 60: SeriesC-2, 61: Series D, 62: Series A1 Preferred, 63: SeriesB-2 Preference, 64: Class A Interests, 65: Class B Interests, 66. Ownership Units, 67. Seed B CCPS, 68. Office Holders, 69. Security, 70. SeriesB-3 Preference, 71. Series B Preferred, 72. Series Seed B CPPS, 73. Series A CPPS, 74. Series A2 CPPS, 75. Equity, 76. Series B CPPS, 77. Series B Preferred Convertible, 78. Class A Ordinary Redeemable Non Voting Ordinary, 79. B Ordinary Shares, 80. N Preferred, 81.A-1 Com, 82.A-2 Com, 83.A-3 Com.

*

Indicates an undertaking for which Unilever N.V. has issued a declaration of assumption of liability in accordance with section Article 2:403 Book 2,of the Dutch Civil Code.

o

Indicates an undertaking directly held by N.V. or PLC. All other undertakings are indirectly held. In the case of Hindustan Unilever Limited 51.50%51.48% is directly held and the remainder of 15.70% is indirectly held. In the case of Unilever Kenya Limited 39.13% is directly held and the remainder of 60.87% is indirectly held. In the case of Unilever Sri Lanka Limited 5.49% is directly held and the remainder of 94.51% is indirectly held. In the cases of each of Unilever BCS UK Services Limited and Unilever BCS UK Limited the ordinary shares are indirectly held and the redeemable golden share is directly held. In the case of Mixhold B.V. 27.71% is directly held and the remainder of 72.29% is indirectly held. In the cases of each of Unilever Gida Sarayi ve Ticaret A.Ş. and Unilever Sarayi ve Ticaret Turk A.Ş. a fractional amount is directly held and the remainder is indirectly held. In the case of United Holdings Limited, the ordinary shares are directly held and the preferred shares are indirectly held. In the case of Mixhold N.V., 55.37% of the ordinary – A shares are directly held, the remainder of 44.63% are indirectly held and the other share classes are indirectly held. In the case of Naamlooze Vernootschap Elma the ordinary shares are directly held and the cumulative preference shares are indirectly held.

Shares the undertaking holds in itself.

D

Denotes an undertaking where other classes of shares are held by a third party.

X

Unilever Trading LLC, Binzagr Unilever Limited, Unilever Home and Personal Care Products Manufacturing LLC and UTIC Distribution S.A. are subsidiary undertakings pursuant to section 1162(2)(b) Companies Act 2006. Servern Gulf FZCO is a subsidiary undertaking pursuant to section 1162(4)(a) Companies Act 2006. The Unilever Group is entitled to 50% of the profits made by Binzagr Unilever Limited. The Unilever Group is entitled to 80% of the profits made by Unilever Trading LLC, Unilever Home and Personal Care Products Manufacturing LLC and Unilever General Trading LLC.

Accounted for asnon-current investments withinnon-current financial assets.

LOGO¥

Exemption pursuant to Section 264b German Commercial Code.

Further to the above disclosures (1) due to the unified board of Unilever N.V. and Unilever PLC, Unilever N.V. and Unilever PLC are each considered to be a subsidiary undertaking of the other in accordance with section 1162 (4) (b) of the Companies Act 2006 and (2) details of holdings of subsidiary undertakings in the share capitals of Unilever N.V. and Unilever PLC are given under the heading Our Shares on pages 3638 to 38.40.

In addition, we have revenues either from our own operations or otherwise in the following locations: Afghanistan, Albania, Andorra, Angola, Antigua, Armenia, Azerbaijan, Bahamas, Barbados, Belarus, Belize, Benin, Bhutan, Bosnia and Herzegovina, Botswana, Brunei Darussalam, Burkina Faso, Burundi, Cameroon, Cape Verde, Central African Republic, Chad, Comoros, Congo, Democratic Republic of Congo, Dominica, Equatorial Guinea, Eritrea, Fiji, French Guiana, Gabon, Gambia, Georgia, Grenada, Guadeloupe, Guinea, Guinea-Bissau, Guyana, Haiti, Iceland, Iraq, Kiribati, Kuwait, Kyrgyzstan, Lesotho, Liberia, Libya, Liechtenstein, Luxembourg, Macao, Macedonia, Madagascar, Maldives, Mali, Malta, Marshall Islands, Martinique, Mauritania, Mauritius, Micronesia (Federated States of), Moldova (Republic of), Monaco, Mongolia, Montenegro, Namibia, Nauru, Palau, Papua New Guinea, Qatar, Saint Kitts and Nevis, Saint Lucia, Saint Vincent and the Grenadines, Samoa, San Marino, Senegal, Seychelles, Sierra Leone, Slovenia, Solomon Islands, Somalia, South Sudan, Sudan, Suriname, Swaziland, Syrian Arab Republic, Tajikistan, Timor Leste, Togo, Tonga, Turkmenistan, Tuvalu, Uzbekistan, Vanuatu and Yemen.

The Group has established branches in Argentina, Azerbaijan, Belarus,Bosnia-Herzegovina,Cote d’Ivoire, Cuba, the Dominican Republic, Kazakhstan, Moldova, the Netherlands, the Philippines, Rwanda, Saudi Arabia, Slovenia, Turkey and United Kingdom.


Annual Report on Form 20-F 2017Financial Statements145


THIS PAGE INTENTIONALLY

LEFT BLANK

146Financial StatementsAnnual Report on Form 20-F 2017


THIS PAGE INTENTIONALLY

LEFT BLANK


Annual Report on Form 20-F 20172018 Financial StatementsGroup Companies 147


THIS PAGE INTENTIONALLY

LEFT BLANK

148Financial StatementsAnnual Report on Form 20-F 2017


THIS PAGE INTENTIONALLY

LEFT BLANK

Annual Report on Form 20-F 2017Financial Statements149


THIS PAGE INTENTIONALLY

LEFT BLANK

150Financial StatementsAnnual Report on Form 20-F 2017


THIS PAGE INTENTIONALLY

LEFT BLANK

Annual Report on Form 20-F 2017Financial Statements151


THIS PAGE INTENTIONALLY

LEFT BLANK

152Financial StatementsAnnual Report on Form 20-F 2017


THIS PAGE INTENTIONALLY

LEFT BLANK

Annual Report on Form 20-F 2017Financial Statements153


THIS PAGE INTENTIONALLY

LEFT BLANK

154Financial StatementsAnnual Report on Form 20-F 2017


THIS PAGE INTENTIONALLY

LEFT BLANK

Annual Report on Form 20-F 2017Financial Statements155145


SHAREHOLDER INFORMATION

FINANCIAL CALENDAR


ANNUAL GENERAL MEETINGS

    Date    Voting Record date    

Voting and  

Registration date

NV

1 May 20193 April 201924 April 2019  

PLC

  2 May 20182019        30 April 2018    

NV

3 May 201826 April 20185 April 20182019  

QUARTERLY DIVIDENDS

Dates listed below are applicable to all four Unilever listings (NV ordinary shares, PLC ordinary shares, NV New York shares, and PLC ADRs).


                                             AnnouncedAnnouncement date NV, PLC, NV NY and
PLC ADR ex-dividend
Ex-dividend date
 Record date Payment date    

Quarterly dividend announced
with the Q4 20172018 results

  131 January 201914 February 20182019 15 February 20182019 16 February 20182120 March 2018    
2019    

Quarterly dividend announced
with the Q1 20182019 results

  1918 April 201820192 May 2019 3 May 20182019 4 May 201865 June 2018    
2019    

Quarterly dividend announced
with the Q2 20182019 results

  1925 July 20182019 28 August 20182019 39 August 20182019       511 September 2018    
2019    

Quarterly dividend announced
with the Q3 20182019 results

         1817 October 20182019      31 October 2019       1 November 20182019       2 November 201854 December 20182019    


CONTACT DETAILS

Unilever N.V. and Unilever PLC

100 Victoria Embankment

London EC4Y 0DY

United Kingdom

Institutional Investors telephone +44 (0)20 7822 6830

Any queries can also be sent to us electronically via

Contact Us

Private Shareholders telephone +44 (0)20 7822 5500

Private Shareholders can email us at

shareholder.services@unilever.com

SHARE REGISTRATION

THE NETHERLANDS

SGG Financial Services B.V.
Hoogoorddreef 15  
1101 BA Amsterdam  
Telephone  +31 (0)20 522 25 10
Telefax  +31 (0)20 522 25 3500
Website  www.sgggroup.com
Email  registerunilever@sgggroup.com
UK  
Computershare Investor Services PLC
The Pavilions  
Bridgwater Road  
Bristol BS99 6ZZ  
Telephone  +44 (0)370 600 3977
Telefax  +44 (0)370 703 6101
Website  www.investorcentre.co.uk
FAQ and Contact Form  computershare.co.uk/contactus
US  
American Stock Transfer & Trust Company
Operations Center  
6201 15th Avenue  
Brooklyn, NY 11219  
Toll-free number  +1 866 249 2593
Direct dial  +1 718 921 8124
Email  db@astfinancial.com

WEBSITE

Shareholders are encouraged to visit our website which has a wealth of information about Unilever.

There is a section on our website designed specifically for investors. It includes detailed coverage of the Unilever share price, our quarterly and annual results, performance charts, financial news and investor relations speeches and presentations. It also includes details of the 20172018 Share Buy BackBuyback programme and conference and investor/analyst presentations.

You can also view the Unilever Annual Report and Accounts 20172018 (and the Additional Information for US Listing Purposes) on our website, and those for prior years.

LOGOLOGO www.unilever.com
LOGOLOGO www.unilever.com/investorrelations
LOGOLOGO www.unilever.com/investor-relations/annual-report-and-accounts/

PUBLICATIONS

Copies of the Unilever Annual Report and Accounts 20172018 (and the Additional Information for US Listing Purposes) and the Annual Report on Form20-F 20172018 can be accessed directly or ordered via the website.


LOGOLOGO www.unilever.com/investorrelations

UNILEVER ANNUAL REPORT AND ACCOUNTS 20172018

The Unilever Annual Report and Accounts 20172018 (and the Additional Information for US Listing Purposes) forms the basis for the Annual Report on Form20-F that is filed with the United States Securities and Exchange Commission, which is also available free of charge from their website.


LOGOLOGO www.sec.gov

QUARTERLY RESULTS ANNOUNCEMENTS

Are in English with figures in euros.


156146 Shareholder informationInformation  Annual Report on Form 20-F 20172018


INDEX


Accounting policies

   83-8679-82,130-131, 135 

Acquisitions

   102-112,125-28,168-74122-124 

Americas, The

   88,90,103,15484, 86,98-99 

Annual General Meetings

   149,156146 

Asia/AMET/RUB

   90,10384, 86, 99 

Associates

   82,87-88,105-106,129-13183-84,101-102, 126, 144 

Audit Committee

   40-45,71-72,1523,43-45 

Auditors

   38,41-42,77-78,130,144,148,16120, 44,66-74 

Balance sheet

   21,81,93,110,119-131,140-14822, 77, 129, 134,160-161 

Beauty & Personal Care

6, 11, 21, 24, 26, 82-83, 164-165

Biographies

   343, 5 

Board committees

   31,34,3836,43-65 

Boards

   26-32,34-463,36-51 

Bonds and other loans

109

Brands

   1,4,5,8-2210-18, 23,122-123, 164, 166 

Capital expenditure

   33,17122,100-101, 166 

Cash

   81-82,95,9722, 25, 77-78, 116-117, 157, 166 

Cash flow statement

   82-83,98,121,162,16778, 162 

Categories

17-19,23-28,101,120-122

Cautionary statement /safe harbour

   Inside back cover 

Chairman

   2-5,34-382-3 

Chief Executive Officer

   4-5,47-76,1454-5, 36, 50-65 

Commitments

   124-12523, 100, 120-122, 133, 137 

Company accounts statutory and other information

   139-148128-137 

Compensation Committee

   47-76,1533,50-65 

Comprehensive income

   75, 128,78-81,91-92,139-142158-159 

Connected 4 Growth

   1-12,38,41,16816 

Constant underlying earnings per share

   22,24,17025, 165 

Contingent liabilities

   123-128,144,148120-122, 133, 137 

Corporate governance

   34-76,10936-49 

Corporate responsibility

   3546-48 

Corporate Responsibility Committee

   43-4446-48 

Deferred tax

   129,140-146,165-16695, 130, 132 

Depreciation

   24,82,87-90,99,104-105,124,17183, 85,100-101 

Directors’ responsibilities

   7766 

Directors’ remuneration

   47-7650-65 

Disposals

   125-12820-25,122-124 

Diversity

   5,8,16,18,40-4616, 19 

Dividends

   18,31-36,73,75,80,82,84,97-9818, 97, 146, 151 

Divisions

11-12, 21, 24, 83, 99

Earnings per share

   22-24,100,168-17018, 20, 75, 96, 157, 163 

Employees

   16,29-32,40-44,90-91,100-14416, 31, 40, 86, 133, 150 

Equalisation Agreement

   34,38,83,109,14436, 105, 133,151-152 

Equity

   21-27,77-158,160-17076-77, 96, 105-107, 134 

Europe

   88,108-17084, 86, 99 

Exchange rates

   22-24,146,162,167-17123, 79, 112 

Executive Directors

   2,34-40,47-763,50-65, 86, 150 

Finance and liquidity

   21,17022,100-115, 165 

Finance costs and finance income

   97,14193 

Financial assets

   81-97,106-12377,116-117 

Financial calendar

   149146 

Financial instruments

   80,27,31,77-100,108-121,142-171104-120, 166 

Financial liabilities

   22,35,81-85,108-122,140-47104-109 

Financial review

   19-25,16820-26,163-166 

Foods & Refreshment

   12-25,101,125-129,165-1726, 11, 21, 24, 26, 82-83, 164-165 

Free cash flow

   21-24,58,66,17118, 22, 25, 166 

Geographies

   8884 

Goodwill

   25,81,88-89,101-103,125-12997-99, 130 

Gross profit

   8985 

Group companies

138-145

Home Care

  12-25,101,125-129,165-1726, 12, 21, 24, 26, 82-83, 164

Impairment

  21-24,82-89,101-107,120,125,141-143
97-99, 116

Income statement

  19,79,89-92,96-98,139-144,162-164
20, 75, 128, 157

Innovation

  10-20,27-28
10

Intangible assets

  79-130,139-147,165-166
97-99

International Financial Reporting Standards

  77-7866, 79, 130, 135

Inventories

  106,129
102

Joint ventures

  79,82,87-88,105-10683-84, 101-102, 126

Key management

  90,96,144,153
86, 92

Key Performance Indicators

  162
6-7

Leases

  123-124
120-122

Market capitalisation

  21
22

Net debt

  31,117-118,16826, 113-114, 166

Nominating and Corporate Governance Committee

  45-47
48-49

Non-underlying items

  79-130,169,171
24, 85

Non-Executive Directors

  3, 37,2-3,34-36,41-4650-65,
86

Non-GAAP measures

  6,19-23,170
23-26,165-166

Operating costs

  89-9085-86

Operating profit

  19-25,79-130,139-171
20-22, 75, 128, 159

Organisational Structure

  26
36

Outlook

  171
166

Payables

  107-108
103-104

Pensions and similar obligations

  90-99

Personal Care

12-25,101,125-129,165-172

Principal group companies

131
87-92

Property, plant and equipment

  104-105
100-101, 167

Provisions

  81-106,123-129
120

Receivables

  105-107,118-123,128

Refreshment

12-25,101,125-129,165-172102-103,
132, 136

Related party transactions

  129-130,151,154
126, 151

Research and development

  28,34,8985

Reserves

  81-83,108-121,129-147
76, 104, 106, 128, 133, 136

Restructuring

  85, 120
123,125,168

Return on assets

  26

Return on invested capital

26

Revenue

  85-89,125,127,138,172
43,81-82

Risk management and control

  26,35,39-40,42,77
27, 44

Risks

  26-33
27-35

Segment information

  86-88
82-84

Share-based payments

  99,141,146
92-93

Share buyback programme

  130
38-39, 105, 126, 133, 137, 156

Share capital

  36-38,109,138-147,162
38-39,76-77, 105, 132, 136

Shareholders

  21-27,34-40
18,38-39, 151

Share registration

  146
149

Significant subsidiaries

  127

Simplification

18

Staff costs

  89-90,172
86

Strategy

  10

Taxation

  98-100
94-96

Total shareholder return

  73,96
62

Treasury

  108-121,130,139
32,110-115

Turnover

  86-89,110,139-142
20-21, 75,82-84, 128, 157, 160

Underlying earnings per share

  22-24,52,55-58
24, 96, 163

Underlying effective tax rate

  22,24-25,98
25, 94, 165

Underlying operating margin

  18-24,52,54,58,86,168-171
25, 165

Underlying operating profit

  25,4,19-25,83,86-88,168-17182-84,163-164

Underlying sales growth

  18-23,54-55,58,66-67,168-169
23-24,163-165

Underlying volume growth

  19-23,169-170
23-24,163-165

Unilever Leadership Executive

  5

Voting

  38-39
34

Website

  
146

Zero based budgeting

  10-12

Website

14910, 18


Annual Report on Form 20-F 20172018 Index 157147


ADDITIONAL INFORMATION FOR US LISTING PURPOSESCONTINUED


FORM20-F REFERENCES


FORM20-F REFERENCES

Item 1 Identity of Directors, Senior Management and Advisers n/a
Item 2 Offer Statistics and Expected Timetable n/a
Item 3 Key Information
 A.    Selected Financial Data 116, 163, 169 - 170105, 151, 157 – 158
 B.    Capitalisation and Indebtedness n/a
 C.    Reasons for the offer and use of proceeds n/a
 D.    Risk factors 26 - 3127 – 33
Item 4 Information on the Company
 A.    History and development of the company 2, 4, 11 – 18, 20 – 25, 34,26, 36, 38 – 37, 39, 42, 78, 100 – 40, 89, 111101, 122 – 112, 132124, 146, 163  – 135, 156, 175 - 178166
 B.    Business overview 1, 8 – 25,18, 20 – 26, 31, 34, 9336, 9595, 175 - 17997, 163 – 167
 C.    Organisational structure 34,36, 127, 138 - 145
 D.    Property, plant and equipment 111100112, 179101, 167
Item 4A Unresolved Staff Comments n/a
Item 5 Operating and Financial Review and Prospects
 A.    Operating results 4 – 6, 8, 18, 192025,26, 31, 123112124, 175 - 178119, 163 – 166
 B.    Liquidity and capital resources 2122, 27, 66, 78, 10022, 26101, 104, 10827, 77, 89, 111 – 112, 115 – 116, 119 – 132, 178122, 166
 C.    Research and development, patents and licences, etc. 9, 96 - 9711 – 14, 85 – 86
 D.    Trend information 4 – 5, 8, 192025, 2726, 2831, 175 - 17833, 166
 E.    Off-balance sheet arrangements 121110126, 128 - 132115, 118 – 122
 F.    Tabular disclosure of contractual obligations 22, 111 – 112, 119 – 120, 131 - 13223
 G.    Safe harbour inside back cover
Item 6 Directors, Senior Management and Employees
 A.    Directors and senior management 3, 34, 160150
 B.    Compensation 47, 61, 975010464, 86 – 93
 C.    Board practices 3, 5, 343635, 4137, 4346, 61, 71, 73, 75, 16045, 48, 50, 60, 62, 150
 D.    Employees 97, 16086, 150
 E.    Share ownership 635270, 10359, 92-104,-93, 160150
Item 7 Major Shareholders and Related Party Transactions
 A,A.    Major shareholders 34, 37 - 38 161– 40, 151
 B.    Related party transactions 136 – 137, 161126 , 151
 C.    Interest of experts and counsel n/a
Item 8 Financial Information
 A.    Consolidated statements and other financial information 77 - 78, 8666145, 156, 163, 170 - 174137, 146, 151, 158 – 162
 B.    Significant changes 137127
Item 9 The Offer and Listing
 A.    Offer and listing details 161 - 16238 – 39
 B.    Plan of distribution n/a
 C.    Markets 36 - 3738 – 39
 D.    Selling shareholders n/a
 E.    Dilution n/a
 F.    Expenses of the issue n/a
Item 10 Additional Information
 A.    Share capital n/a
 B.    Articles of association 343640, 45, 69, 116, 16442, 48, 58, 152
 C.    Material contracts 34, 39, 16436, 41
 D.    Exchange controls 164152
 E.    Taxation 165 - 166153 – 154
 F.    Dividends and paying agents n/a
 G.    Statement by experts n/a
 H.    Documents on display 156, 164146, 152
 I.    Subsidiary information n/a


158148 Additional Information for US Listing Purposes  Annual Report on Form 20-F 20172018


ADDITIONAL INFORMATION FOR US LISTING PURPOSES


Item 11 Quantitative and Qualitative Disclosures About Market Risk 9887103, 11392, 102116, 121 – 130, 178120, 166
Item 12 Description of Securities Other than Equity Securities
 A.  Description of debt securities n/a
 B.  Description of warrants and rights n/a
 C.  Description of other securities n/a
 D.1  Name of depositary and address of principal executive n/a
 D.2  Title of ADRS and brief description of provisions n/a
 D.3  Transfer agent fees and charges 167155
 D.4  Transfer agent payments – fiscal year 2016 167155
Item 13 Defaults, Dividend Arrearages and Delinquencies
 A.  Defaults  167155
 B.  Dividend arrearages and delinquencies 167155
Item 14 Material Modifications to the Rights of Security Holders and Use of Proceeds n/a
Item 15 Controls and Procedures 26, 40, 42, 78, 16867 – 74, 156
Item 16 Reserved n/a
Item 16AA.  Audit Committee Financial Expert 35, 4137, 43
Item 16BB.  Code of Ethics 26, 40, 4327, 42, 46
Item 16CC.  Principal Accountant Fees and Services 41 – 42, 16845, 156
Item 16DD.  Exemptions From The Listing Standards For Audit Committees n/a
Item 16EE.  Purchases Of Equity Securities By The Issuer and Affiliated Purchasers 363837, 16839, 126, 156
Item 16FF.  Change in Registrant’s Certifying Accountant n/a
Item 16GG.  Corporate Governance 34 – 4042
Item 16H      H.  Mine Safety Disclosures n/a
Item 17 Financial Statements 77, 78, 8667, 75145, 170- 174127, 158 – 162
Item 18 Financial Statements 77, 78, 8667, 75145, 170- 174127, 158 – 162
Item 19 Exhibits 

Please refer to the Exhibit list located immediately following

the signature

page for this document as filed with the SEC.


Annual Report on Form 20-F 20172018 Additional Information for US Listing Purposes 159149


ADDITIONAL INFORMATION FOR US LISTING PURPOSESCONTINUED


DIRECTORS, SENIOR MANAGEMENT AND EMPLOYEES

EMPLOYEES

The average number of employees for the last three years is provided in note 4A on page 97.86. The average number of employees during 20172018 included 7,1797,996 seasonal workers. We believe our relationship with our employees and any labour unions of which they may be part is satisfactory in all material respects.

GLOBAL EMPLOYEE SHARE PLANS (SHARES)

In November 2014, Unilever’s global employee plan ‘SHARES’ was launched in 17 countries. SHARES gives eligible Unilever employees below senior management level the opportunity to invest between25 and200 per month from their net salary in Unilever shares. For every three shares our employees buy (Investment Shares), Unilever will give them one free Matching Share, which will vest if employees hold their Investment Shares for at least three years. The Matching Shares are not subject to any performance conditions. In 2015, SHARES was rolled out globally and is now offered in more than 100 countries. Executive Directors are not eligible to participate in SHARES. As of 21 February 2018,2019, awards for 269,644291,657 NV and 196,817219,423 PLC shares were outstanding under SHARES.

NORTH AMERICAN SHARE PLANS

Unilever also maintains share plans for its North American employees that are governed by an umbrella plan referred to as the Unilever North America Omnibus Equity Compensation Plan. These plans are the North American equivalents of the Unilever Share Plan 2017 and the GSIP, MCIP and SHARES plans. The rules governing these share plans are materially the same as the rules governing the Unilever Share Plan 2017, GSIP, MCIP and SHARES plans, respectively. However, the plans containnon-competition andnon-solicitation covenants and they are subject to US and Canadian employment and tax laws. The plans are administered by the North America Compensation Committee of Unilever United States Inc. and they are governed by New York law.

The foregoing description of the Unilever North America Omnibus Equity Compensation Plan does not purport to be complete and is qualified in its entirety by reference to the Unilever North America Omnibus Equity Compensation Plan, including all amendments thereto, filed as Exhibit 99.1 to the FormS-8 (FileNo. 333-185299) filed with the SEC on 6 December 2012, which is incorporated herein by reference.

COMPENSATION COMMITTEE

The Committee is concerned with the remuneration of the Executive andNon-Executive Directors and the tier of management directly below the Boards. It also has responsibility for the cash and executive and all employee share-based incentive plans, the Remuneration Policy and performance evaluation of the Unilever Leadership Executive.

DIRECTORS AND SENIOR MANAGEMENT

FAMILY RELATIONSHIP

There are no family relationships between any of our Executive Directors, members of the ULE orNon-Executive Directors.

OTHER ARRANGEMENTS

None of ourNon-Executive Directors, Executive Directors or other key management personnel are elected or appointed under any arrangement or understanding with any major shareholder, customer, supplier or others.


160150 Additional Information for US Listing Purposes  Annual Report on Form 20-F 20172018


MAJOR SHAREHOLDERS AND RELATED PARTY TRANSACTIONS

MAJOR SHAREHOLDERS

The voting rights of the significant shareholders of NV and PLC are the same as for other holders of the class of share held by such significant shareholder.

The principal trading markets upon which Unilever shares are listed are Euronext Amsterdam for NV ordinary and 6% and 7% cumulative preference shares and the depositary receipts of these NV ordinary and 7% cumulative preference shares,thereof, and the London Stock Exchange for PLC ordinary shares. NV ordinary shares mainly trade in the form of depositary receipts for shares.

In the United States, NV New York Registry Shares and PLC American Depositary Receipts are traded on the New York Stock Exchange. Deutsche Bank Trust Company Americas (Deutsche Bank) acts for NV and PLC as issuer, transfer agent and, in respect of the PLC American Depositary Receipts, depositary.

At 21 February 20182019 (the latest practicable date for inclusion in this report), there were 4,4144,134 registered holders of NV New York Registry Shares and 924841 registered holders of PLC American Depositary Receipts in the United States. We estimate that approximately 11%10% of NV’s ordinary shares (including shares underlying NV New York Registry shares) were held in the United States (approximately 11% in 2016)2017) and approximately 10%11% of PLC’s ordinary shares (including shares underlying PLC American Depositary Receipts) were held in the United States (approximately 13%10% in 2016)2017).

NV and PLC are separate companies with separate stock exchange listings and different shareholders. Shareholders cannot convert or exchange the shares of one for shares of the other and the relative share prices on the various markets can, and do, fluctuate. Each NV ordinary share represents the same underlying economic interest in the Unilever Group as each PLC ordinary share (save for exchange rate fluctuations).

If you are a shareholder of NV, you have an interest in a Dutch legal entity, your dividends will be paid in euros (converted into US dollars if you have shares registered in the United States) and you may be subject to tax in the Netherlands. If you are a shareholder of PLC, your interest is in a UK legal entity, your dividends will be paid in sterling (converted into US dollars if you have American Depositary Receipts) and you may be subject to UK tax. Nevertheless, the Equalisation Agreement means that as a shareholder of either company you effectively have an interest in the whole of Unilever. On a going concern basis, you have largely equal rights over our combined net profit and capital reserves as shown in the consolidated accounts.

To Unilever’s knowledge, the Unilever Group is not owned or controlled, directly or indirectly, by another corporation, any foreign government or by any other legal or natural person, severally or jointly. The Group is not aware of any arrangements the operation of which may at any subsequent date result in a change of control of Unilever.

RELATED PARTY TRANSACTIONS

Transactions with related parties are conducted in accordance with agreed transfer pricing policies and include sales to joint ventures and associates. Other than those disclosed in Notes 23 to 2524 to the consolidated financial statements (and incorporated herein as above), there were no related party transactions that were material to the Group or to the related parties concerned that are required to be reported in 20172018 up to 21 February 20182019 (the latest practicable date for inclusion in this report).

THE OFFER AND LISTING

SHARE PRICES AT 31 DECEMBER 2017

The share prices of the ordinary shares at the end of the year were as follows:

 NV per0.16 ordinary share in Amsterdam

46.96

 NV per0.16 ordinary share in New York

US$56.32

 PLC per 3 19p ordinary share in London

£41.26

 PLC per 3 19p ordinary share in New York

        US$55.34

Annual Report on Form 20-F 2017161


ADDITIONAL INFORMATION FOR US LISTING PURPOSESCONTINUED

MONTHLY HIGH AND LOW PRICES FOR THE MOST RECENT SIX MONTHS

                                                                                                
           August   September       October   November   December       January   February 
         2017   2017   2017   2017   2017   2018   2018 

NV per0.16 ordinary share in Amsterdam

   High    50.20    50.79    52.25    49.59    48.97    47.24    46.99 

(in)

   Low    49.07    49.13    47.23    47.59    46.96    45.72    43.20 

NV per0.16 ordinary share in New York

   High    59.50    60.81    61.39    58.61    57.69    58.24    58.54 

(in US$)

   Low    57.94    58.11    55.74    56.22    56.29    54.98    52.78 

PLC per 3 19p ordinary share in London

   High    45.19    45.30    45.49    43.30    42.10    41.08    40.39 

(in £)

   Low    43.04    42.62    40.89    41.50    41.15    39.65    37.31 

PLC per 3 19p ordinary share in New York

   High    58.21    59.63    59.92    57.54    56.36    57.66    57.44 

(in US$)

   Low    56.61    56.99    54.11    55.00    55.15    54.02    51.64 

(a)Through 21 February 2018 (the latest practicable date for inclusion in this report).

QUARTERLY HIGH AND LOW PRICES FOR 2017 AND 2016

                                                                                    
           1st   2nd   3rd   4th 
                  Quarter        Quarter         Quarter        Quarter 
              2017   2017   2017   2017 

NV per0.16 ordinary share in Amsterdam (in)

     High    46.80    51.09    50.79    52.25 
         Low    37.40    46.46    47.88    46.96 

NV per0.16 ordinary share in New York (in US$)

     High    50.60    57.70    60.81    61.39 
         Low    40.27    49.57    54.66    55.74 

PLC per 3 19p ordinary share in London (in £)

     High    40.68    43.73    45.30    45.49 
         Low    31.91    39.22    41.28    40.89 

PLC per 3 19p ordinary share in New York (in US$)

     High    50.30    56.44    59.63    59.92 
         Low    40.51    49.11    53.47    54.11 
           1st   2nd   3rd   4th 
           Quarter   Quarter   Quarter   Quarter 
              2016   2016   2016   2016 

NV per0.16 ordinary share in Amsterdam (in)

     High    40.89    41.91    42.94    41.79 
         Low    36.69    38.15    40.23    36.39 

NV per0.16 ordinary share in New York (in US$)

     High    45.52    47.05    47.88    46.43 
         Low    40.27    42.87    44.93    38.66 

PLC per 3 19p ordinary share in London (in £)

     High    31.90    35.79    36.79    37.64 
         Low    27.63    30.42    34.78    30.92 

PLC per 3 19p ordinary share in New York (in US$)

     High    45.77    47.91    48.63    47.75 
         Low    40.09    43.62    45.86    38.78 
ANNUAL HIGH AND LOW PRICES            
                   2017   2016   2015   2014   2013 

NV per0.16 ordinary share in Amsterdam (in)

   High    52.25    42.94    42.48    33.49    32.89 
    Low    37.40    36.39    31.55    27.16    27.50 

NV per0.16 ordinary share in New York (in US $)

   High    61.39    47.88    46.51    44.31    42.78 
    Low    40.27    38.66    37.64    36.72    37.27 

PLC per 3 19p ordinary share in London (in £)

   High    45.49    37.64    30.15    27.29    28.85 
    Low    31.91    27.63    25.24    23.06    23.19 

PLC per 3 19p ordinary share in New York (in US $)

   High    59.92    48.63    46.07    45.85    43.54 
    Low    40.51    38.78    39.03    37.85    37.67 

There have not been any significant suspensions in the past three years.

162Annual Report on Form 20-F 2017


DIVIDEND RECORD

The following tables show the dividends declared and dividends paid by NV and PLC for the last five years, expressed in terms of the revised share denominations which became effective from 22 May 2006. Differences between the amounts ultimately received by US holders of NV and PLC shares are the result of changes in exchange rates between the equalisation of the dividends and the date of payment.

Following agreement at the 2009 Annual General Meetings (AGMs) and separate meetings of ordinary shareholders, the Equalisation Agreement was modified to facilitate the payment of quarterly dividends from 2010 onwards.


    2017   2016   2015   2014   2013 

Dividends declared for the year


NV dividends


Dividend per0.16

   €1.43    1.28    1.21    1.14    1.08 

Dividend per0.16 (US Registry)

   US$1.66    US$1.42    US$1.32    US$1.47    US$1.44 

PLC dividends


Dividend per 3 19p

   £1.26    1.09    £0.88    £0.90    £0.91 

Dividend per 3 19p (US Registry)

   US$1.66    US$1.42    US$1.32    US$1.47    US$1.44 

Dividends paid during the year


NV dividends


Dividend per0.16

   €1.40    1.26    1.19    1.12    1.05 

Dividend per0.16 (US Registry)

   US$1.56    US$1.40    US$1.32    US$1.51    US$1.40 

PLC dividends


Dividend per 3 19p

   £1.22    1.04    £0.87    £0.91    £0.89 

Dividend per 3 19p (US Registry)

     US$1.56      US$1.40      US$1.32      US$1.51      US$1.40 

EXCHANGE RATES

Unilever reports its financial results and balance sheet position in euros. Other currencies which may significantly impact our financial statements are sterling and US dollars. Average andyear-end exchange rates for these two currencies for the last five years are given below.

    2017   2016   2015   2014   2013 

Year end


1 = US$

   1.196    1.049    1.092    1.215    1.378 

1 = £

   0.889    0.857    0.736    0.781    0.833 

Average


1 = US$

   1.123    1.111    1.111    1.334    1.325 

1 = £

           0.876            0.815            0.725            0.807            0.849 

On 21 February 2018 (the latest practicable date for inclusion in this report), the exchange rates between euros and US dollars and between euros and sterling as published in the Financial Times in London were as follows:1 = US$1.234 and1 = £0.881.

Noon Buying Rates in New York for cable transfers in foreign currencies as certified for customs purposes by the Federal Reserve Bank of New York were as follows:

    2017   2016   2015   2014   2013 

Year end


1 = US$

   1.202    1.055    1.086    1.210    1.378 

Average


1 = US$

   1.130    1.103    1.110    1.330    1.328 

High


1 = US$

           1.204            1.152            1.202            1.393            1.382 

Low


1 = US$

   1.042    1.038    1.052    1.210    1.277 

On 16 February 2018 (the latest available data for inclusion in this report), the Noon buying rate was1 = US$1.244.

High and low exchange rate values for each of the last six months:

   August   September   October   November   December   January   February 
    2017   2017   2017   2017   2017   2017   2018(a) 

High


1 = US $

   1.203    1.204    1.185    1.194    1.202    1.249    1.248 

Low


1 = US $

           1.170            1.175            1.158            1.158            1.173            1.192    1.223 

(a)Through 16 February 2018 (the latest available data for inclusion in this report).
    2018   2017   2016   2015   2014   

Dividends declared for the year


NV dividends


Dividend per0.16

   €1.55    1.43    1.28    1.21    1.14   

Dividend per0.16 (US Registry)

   $1.82    $1.66    $1.42    $1.32    $1.47   

PLC dividends


Dividend per 31/9p

   £1.35    £1.26    1.09    £0.88    £0.90   

Dividend per 31/9p (US Registry)

   $1.82    $1.66    $1.42    $1.32    $1.47   

Dividends paid during the year


NV dividends


Dividend per0.16

   €1.52    1.40    1.26    1.19    1.12   

Dividend per0.16 (US Registry)

   $1.83    $1.56    $1.40    $1.32    $1.51   

PLC dividends


Dividend per 31/9p

   £1.33    £1.22    1.04    £0.87    £0.91   

Dividend per 31/9p (US Registry)

   $1.83      $1.56      $1.40      $1.32      $1.51   


Annual Report on Form 20-F 20172018 Additional Information for US Listing Purposes 163151


ADDITIONAL INFORMATION FOR US LISTING PURPOSESCONTINUED


ARTICLES OF ASSOCIATION

NV’s Articles of Association contain, among other things, the objects clause, which sets out the scope of activities that NV is authorised to undertake. They are drafted to give a wide scope and provide that the primary objectives are: to carry on business as a holding company, to manage any companies in which it has an interest and to operate and carry into effect the Equalisation Agreement. At the 2010 PLC AGM, the shareholders agreed that the objects clause be removed from PLC’s Articles of Association so that there are no restrictions on its objects.

DIRECTORS’ BORROWING POWERS

The borrowing powers of NV Directors on behalf of NV are not limited by NV’s Articles of Association. PLC Directors have the power to borrow on behalf of PLC up to three times the PLC proportion of the adjusted capital and reserves of the Unilever Group, as defined in PLC’s Articles of Association, without the approval of shareholders (by way of an ordinary resolution).

ALLOCATION OF PROFITS

Under NV’s Articles of Association, available profits after reserves have been provided for by virtue of law, the Equalisation Agreement or deemed necessary by the Board, are distributed first to 7% and 6% cumulative preference shareholders by a dividend of 7% and 6%, respectively, calculated on the basis of the original nominal value of 1,000 Dutch guilders converted to euros at the official conversion rate. The remaining profits are distributed to ordinary shareholders in proportion to the nominal value of their holdings.

Distributable profits of PLC are paid first at the rate of 5% per year on thepaid-up nominal capital of 319p of the ordinary shares, in a further such dividend at a rate of 5% per year on thepaid-up nominal capital of 319p of the ordinary shares and then at the rate of 6% per year on thepaid-up nominal capital of the deferred stock of £100,000. The surplus is paid by way of a dividend on the ordinary shares.

LAPSE OF DISTRIBUTIONS

The right to cash and the proceeds of share distributions by NV lapses five and 20 years, respectively, after the first day the distribution was obtainable. Unclaimed amounts revert to NV. Any PLC dividend unclaimed after 12 years from the date of the declaration of the dividend reverts to PLC.

REDEMPTION PROVISIONS AND CAPITAL CALL

Under Dutch law, NV may only redeem treasury shares (including shares underlying depositary receipts) or shares whose terms permit redemption. Outstanding PLC ordinary shares and deferred shares cannot be redeemed. NV and PLC may make capital calls on money unpaid on shares and not payable on a fixed date. NV and PLC only issue fully paid shares.

MODIFICATION OF RIGHTS

Modifications to NV’s or PLC’s Articles of Association must be approved by a general meeting of shareholders. Any modification of the NV Articles of Association that prejudices the rights of 7% or 6% cumulative

preference shareholders of NV must be approved by three quarters of votes cast (excluding treasury shares) at a meeting of affected holders.

Modifications that prejudicially affect the rights and privileges of a class of PLC shareholders require the written consent of three quarters of the affected holders (excluding treasury shares) or a special resolution passed at a general meeting of the class at which at least two persons holding or representing at least one third of thepaid-up capital (excluding treasury shares) must be present. Every shareholder is entitled to one vote per share held on a poll and may demand a poll vote. At any adjourned general meeting, present affected class holders may establish a quorum.

MATERIAL CONTRACTS

The descriptions of the foundation agreements set forth in the Unilever Annual Report and Accounts 20172018 do not purport to be complete and are qualified in their entirety by reference to the Equalisation Agreement between NV and PLC, the Deed of Mutual Covenants and the Agreement for Mutual Guarantees of Borrowing, including all amendments thereto, filed as Exhibits 4.1(a), 4.1(b) and 4.1(c), respectively, to this report, which are incorporated herein by reference.

EXCHANGE CONTROLS

Under the Dutch External Financial Relations Act of 25 March 1994, the Minister of Finance is authorised to issue regulations relating to financial transactions concerning the movement of capital to or from other countries with respect to direct investments, establishment, the performing of financial services, the admission of negotiable instruments or goods with respect to which regulations have been issued under the Import and Export Act in the interest of the international legal system or an arrangement relevant thereto. These regulations may contain a prohibition to perform any of the actions indicated in those regulations without a licence. To date, no regulations of this type, have been issued which are applicable to NV.

Other than certain economic sanctions which may be in place from time to time, there are currently no UK laws, decrees or regulations restricting the import or export of capital or affecting the remittance of dividends or other payments to holders of the PLC’s shares who arenon-residents of the UK. Similarly, other than certain economic sanctions which may be in force from time to time, there are no limitations relating only tonon-residents of the UK under English law or the PLC’s Articles of Association on the right to be a holder of, and to vote in respect of, the company’s shares.

UNILEVER ANNUAL REPORT ON FORM20-F 20172018

Filed with the SEC on the SEC’s website. Printed copies are available, free of charge, upon request to Unilever PLC, Investor Relations department, 100 Victoria Embankment, London, EC4Y 0DY United Kingdom.

DOCUMENTS ON DISPLAY IN THE UNITED STATES

Unilever files and furnishes reports and information with the United States SEC. Such reports and information can be inspected and copied at the SEC’s public reference facilities in Washington DC, Chicago and New York. Certain of our reports and other information that we file or furnish to the SEC are also available to the public over the internet on the SEC’s website.


164152 Additional Information for US Listing Purposes  Annual Report on Form 20-F 20172018


TAXATION

TAXATION FOR US PERSONS HOLDING SHARES IN NV

The following notes are provided for guidance. US persons should consult their local tax advisers, particularly in connection with potential liability to pay US taxes on disposal, lifetime gift or bequest of their shares. A US person is a US individual citizen or resident, a corporation organised under the laws of the United States, or any other legal person subject to United States Federal Income Tax on its worldwide income.

TAXATION ON DIVIDENDS IN THE NETHERLANDS

As of 1 January 2007, dividends paid by companies in the Netherlands are in principle subject to dividend withholding tax of 15%. Where a shareholder is entitled to the benefits of the current Income Tax Convention (the Convention) concluded on 18 December 1992 between the United States and the Netherlands, when dividends are paid by NV to:

a corporation organised under the laws of the United States (or any territory of it) having no permanent establishment in the Netherlands of which such shares form a part of the business property; or
any other legal person subject to United States Federal Income Tax with respect to its worldwide income, having no permanent establishment in the Netherlands of which such shares form a part of the business property, these dividends qualify for a reduction of withholding tax on dividends in the Netherlands from 15% to 5%, if the beneficial owner is a company which directly holds at least 10% of the voting power of NV shares.

Where a United States person has a permanent establishment in the Netherlands, which has shares in NV forming part of its business property, dividends it receives on those shares are included in that establishment’s profit. They are subject to income tax or corporation tax in the Netherlands, as appropriate, and tax on dividends in the Netherlands will generally be applied at the full rate of 15% with, as appropriate, the possibility to claim a credit for that tax on dividends in the Netherlands against the income tax or corporation tax in the Netherlands. The net tax suffered may be treated as foreign income tax eligible for credit against shareholders’ United States income taxes.

The Convention provides, subject to certain conditions, for a complete exemption from, or refund of, Dutch dividend withholding tax if the beneficial owner is a qualified ‘Exempt Pension Trust’ as defined in Article 35 of the Convention or a qualified ‘Exempt Organisation’ as defined in Article 36 of the Convention. It is noted that, subject to certain conditions, foreign(non-Dutch) tax exempt entities may also be entitled to a full refund of any Dutch dividend withholding tax suffered based on specific provisions in the Dividend Tax Act in the Netherlands. This tax refund opportunity under Dutch domestic tax law already applied to European Union and European Economic Area entities as of 1 January 2007 and has been extended as of 1 January 2012 to all foreign tax exempt entities including, if appropriate, United States tax exempt entities.

Under the Convention, qualifying United States organisations that are generally exempt from United States taxes and that are constituted and operated exclusively to administer or provide pension, retirement or other employee benefits may be exempt at source from withholding tax on dividends received from a Dutch corporation. A Competent Authority Agreement between the US and Dutch tax authorities on 6 August 2007, published in the US as Announcement2007-75,2007-2 Cumulative Bulletin 540, as amended by a Competent Authority Agreement published in the United States as Announcement2010-26,2010-1 Cumulative Bulletin 604, describes the eligibility of these US organisations for benefits under the Convention and procedures for claiming these benefits.

Under the Convention, a United States trust, company or organisation that is operated exclusively for religious, charitable, scientific, educational or public purposes is subject to an initial 15% withholding tax rate. Such an exempt organisation may be entitled to reclaim from tax authorities in the Netherlands a refund of the Dutch dividend tax, if and to the extent that it is exempt from United States Federal Income Tax and it would be exempt from tax in the Netherlands if it were organised and carried on all its activities there. If you are an NV shareholder resident in any country other than the United States or the Netherlands, any exemption from, or reduction or refund of, dividend withholding tax in the Netherlands may be governed by specific provisions in Dutch tax law, the ‘Tax Regulation for the Kingdom of the Netherlands’, or by the tax convention or any other agreement for the avoidance of double taxation, if any, between the Netherlands and your country of residence.

UNITED STATES TAXATION ON DIVIDENDS

If you are a United States person, the dividend (including the withheld amount) up to the amount of NV earnings and profits for United States Federal Income Tax purposes will be ordinary dividend income. Dividends received by an individual will be taxed at a maximum rate of 15% or 20%, depending on the income level of the individual, provided the individual has held the shares for more than 60 days during the121-day period beginning 60 days before theex-dividend date, that NV is a qualified foreign corporation and that certain other conditions are satisfied. NV is a qualified foreign corporation for this purpose. In addition, an additional tax of 3.8% will apply to dividends and other investment income received by individuals with incomes exceeding certain thresholds. The dividends are not eligible for the dividends received deduction allowed to corporations.

For US foreign tax credit purposes, the dividend is foreign source income, and withholding tax in the Netherlands is a foreign income tax that is eligible for credit against the shareholder’s United States income taxes. However, the rules governing the US foreign tax credit are complex, and additional limitations on the credit apply to individuals receiving dividends eligible for the maximum tax rate on dividends described above.

Any portion of the dividend that exceeds NV’s United States earnings and profits is subject to different rules. This portion is atax-free return of capital to the extent of your basis in NV’s shares, and thereafter is treated as a gain on a disposition of the shares.

Under a provision of the Dividend Tax Act in the Netherlands and provided certain conditions are satisfied, NV is entitled to a credit (up to a maximum of 3% of the gross dividend from which dividend tax is withheld) against the amount of dividend tax withheld before remittance to tax authorities in the Netherlands. The United States tax authority may take the position that withholding tax in the Netherlands eligible for credit should be limited accordingly.

DISCLOSURE REQUIREMENTS FOR US INDIVIDUAL HOLDERS

US individuals that hold certain specified foreign financial assets, including stock in a foreign corporation, with values in excess of certain thresholds are required to file Form 8938 with their United States Federal Income Tax return. Such Form requires disclosure of information concerning such foreign assets, including the value of the assets. Failure to file the form when required is subject to penalties. An exemption from reporting applies to foreign assets held through a US financial institution, generally including anon-US branch or subsidiary of a US institution and a US branch of anon-US institution. Investors are encouraged to consult with their own tax advisers regarding the possible application of this disclosure requirement to their investment in the shares.


Annual Report on Form 20-F 20172018 Additional Information for US Listing Purposes 165153


ADDITIONAL INFORMATION FOR US LISTING PURPOSESCONTINUED


TAXATION ON CAPITAL GAINS IN THE NETHERLANDS

Under the Convention, if you are a United States person and you have capital gains on the sale of shares of a Dutch company, these are generally not subject to taxation by the Netherlands. An exception to this rule generally applies if you have a permanent establishment in the Netherlands and the capital gain is derived from the sale of shares which form part of that permanent establishment’s business property.

SUCCESSION DUTY AND GIFT TAXES IN THE NETHERLANDS

Under the Estate and Inheritance Tax Convention between the United States and the Netherlands of 15 July 1969, individual US persons who are not Dutch citizens who have shares will generally not be subject to succession duty in the Netherlands on the individual’s death, unless the shares are part of the business property of a permanent establishment situated in the Netherlands.

A gift of shares of a Dutch company by a person who is not a resident or a deemed resident of the Netherlands is generally not subject to gift tax in the Netherlands. Anon-resident Netherlands citizen, however, is still treated as a resident of the Netherlands for gift tax purposes for ten years and any othernon-resident person for one year after leaving the Netherlands.

TAXATION FOR US PERSONS HOLDING SHARES OR AMERICAN DEPOSITARY SHARES IN PLC

The following notes are provided for guidance. US persons should consult their local tax advisers, particularly in connection with potential liability to pay US taxes on disposal, lifetime gift or bequest of their shares or American Depositary Shares (ADSs). A US person is a US individual citizen or resident, a corporation organised under the laws of the United States, or any other legal person subject to United States Federal Income Tax on its worldwide income.

UNITED KINGDOM TAXATION ON DIVIDENDS

Under United Kingdom law, income tax is not withheld from dividends paid by United Kingdom companies. Shareholders, whether resident in the United Kingdom or not, receive the full amount of the dividend actually declared.

UNITED STATES TAXATION ON DIVIDENDS

If you are a US person, the dividend up to the amount of PLC’s earnings and profits for United States Federal Income Tax purposes will be ordinary dividend income. Dividends received by an individual will be taxed at a maximum rate of 15% or 20%, depending on the income level of the individual, provided the individual has held the shares or ADSs for more than 60 days during the121-day period beginning 60 days before theex-dividend date, that PLC is a qualified foreign corporation and certain other conditions are satisfied. PLC is a qualified foreign corporation for this purpose. In addition, an additional tax of 3.8% will apply to dividends and other investment income received by individuals with incomes exceeding certain thresholds. The dividend is not eligible for the dividends received deduction allowable to corporations. The dividend is foreign source income for US foreign tax credit purposes.

Any portion of the dividend that exceeds PLC’s United States earnings and profits is subject to different rules. This portion is atax-free return of capital to the extent of your basis in PLC’s shares or ADSs, and thereafter is treated as a gain on a disposition of the shares or ADSs.

DISCLOSURE REQUIREMENTS FOR US INDIVIDUAL HOLDERS

US individuals that hold certain specified foreign financial assets, including stock in a foreign corporation, with values in excess of certain thresholds are required to file Form 8938 with their United States Federal Income Tax return. Such Form requires disclosure of information concerning such foreign assets, including the value of the assets. Failure to file the form when required is subject to penalties. An exemption from reporting applies to foreign assets held through a US financial institution, generally including anon-US branch or subsidiary of a US institution and a US branch of anon-US institution. Investors are encouraged to consult with their own tax advisers regarding the possible application of this disclosure requirement to their investment in the shares or ADSs.

UK TAXATION ON CAPITAL GAINS

Under United Kingdom law, when you dispose of shares you may be liable to pay United Kingdom tax in respect of any gain accruing on the disposal. However, if you are either:

an individual who is not resident in the United Kingdom for the year in question; or
a company which is not resident in the United Kingdom when the gain accrues

you will generally not be liable to United Kingdom tax on any capital gains made on disposal of your shares.

Two exceptions are: if the shares are held in connection with a trade or business which is conducted in the United Kingdom through a branch, agency or permanent establishment; or if the shares are held by an individual who becomes resident in the UK having left the UK for a period ofnon-residence of five years or less and who was resident for at least four of the seven tax years prior to leaving the UK.

UK INHERITANCE TAX

Under the current estate and gift tax convention between the United States and the United Kingdom, ordinary shares held by an individual shareholder who is:

domiciled for the purposes of the convention in the United States; and
is not for the purposes of the convention a national of the United Kingdom

will generally not be subject to United Kingdom inheritance tax:

on the individual’s death; or
on a gift of the shares during the individual’s lifetime.

Where ordinary shares are held on trust, they will generally not be subject to United Kingdom inheritance tax where the settlor at the time of the settlement:

was domiciled for the purposes of the convention in the United States; and
was not for the purposes of the convention a national of the United Kingdom.

An exception is if the shares are part of the business property of a permanent establishment of the shareholder in the United Kingdom or, in the case of a shareholder who performs independent personal services, pertain to a fixed base situated in the United Kingdom.

Where ordinary shares are subject to United Kingdom inheritance tax and United States federal gift or federal estate tax, the amount of the tax paid in one jurisdiction can generally be credited against the tax due in the other jurisdiction.

Where a United Kingdom inheritance tax liability is prima facie not payable by virtue of the convention, that tax can become payable if any applicable federal gift or federal estate tax on the shares in the United States is not paid.


166154 Additional Information for US Listing Purposes  Annual Report on Form 20-F 20172018


DESCRIPTION OF SECURITIES OTHER THAN EQUITY SECURITIES

Deutsche Bank serves as both the transfer agent and registrar pursuant to the NV New York Registered Share Program and the depositary (Depositary) for PLC’s American Depositary Receipt Program.

TRANSFER AGENT FEES AND CHARGES FOR NV

Although Items 12.D.3 and 12.D.4 are not applicable to NV the following fees, charges and transfer agent payments are listed, as any fee arrangement with Deutsche Bank will cover both programs.

Under the terms of the Transfer Agent Agreement for the NV New York Registered Share program, a New York Registry Share (NYRS) holder may have to pay the following service fees to the transfer agent:

Issuance of NYRSs: up to US 5¢ per NYRS issued.
Cancellation of NYRSs: up to US 5¢ per NYRS cancelled.

An NYRS holder will also be responsible to pay certain fees and expenses incurred by the transfer agent and certain taxes and governmental charges such as:

fees for the transfer and registration of shares charged by the registrar and transfer agent for the shares in the Netherlands (ie upon deposit and withdrawal of shares);
expenses incurred for converting foreign currency into US dollars;
expenses for cable, telex and fax transmissions and for delivery of securities;
taxes and duties upon the transfer of securities (ie when shares are deposited or withdrawn from deposit); and
fees and expenses incurred in connection with the delivery or servicing of shares on deposit.

Transfer agent fees payable upon the issuance and cancellation of NYRSs are typically paid to the transfer agent by the brokers (on behalf of their clients) receiving the newly-issued NYRSs from the transfer agent and by the brokers (on behalf of their clients) delivering the NYRSs to the transfer agent for cancellation.

The brokers in turn charge these transaction fees to their clients.

Note that the fees and charges an investor may be required to pay may vary over time and may be changed by us and by the transfer agent. Notice of any changes will be given to investors.

DEPOSITARY FEES AND CHARGES FOR PLC

Under the terms of the Deposit Agreement for the PLC American Depositary Shares (ADSs), an ADS holder may have to pay the following service fees to the depositary bank:

Issuance of ADSs: up to US 5¢ per ADS issued.
Cancellation of ADSs: up to US 5¢ per ADS cancelled.
Processing of dividend and other cash distributions not made pursuant to a cancellation or withdrawal: up to US 5¢ per ADS held.

An ADS holder will also be responsible for paying certain fees and expenses incurred by the depositary bank and certain taxes and governmental charges such as:

fees for the transfer and registration of shares charged by the registrar and transfer agent for the shares in the United Kingdom (ie upon deposit and withdrawal of shares);
expenses incurred for converting foreign currency into US dollars;
expenses for cable, telex and fax transmissions and for delivery of securities;
taxes and duties upon the transfer of securities (ie when shares are deposited or withdrawn from deposit);
fees and expenses incurred in connection with the delivery or servicing of shares on deposit; and
fees incurred in connection with the distribution of dividends.

Depositary fees payable upon the issuance and cancellation of ADSs are typically paid to the depositary bank by the brokers (on behalf of their clients) receiving the newly-issued ADSs from the depositary bank and by the brokers (on behalf of their clients) delivering the ADSs to the depositary bank for cancellation. The brokers in turn charge these transaction fees to their clients.

Note that the fees and charges an investor may be required to pay may vary over time and may be changed by us and by the depositary bank. Notice of any changes will be given to investors.

TRANSFER AGENT PAYMENTS – FISCAL YEAR 20172018 FOR NV

In relation to 2017,2018, NV received $1,225,000.00$612,500.00 from Deutsche Bank, the transfer agent and registrar for its New York Registered Share program since 1 July 2014, including the reimbursement of listing fees (NYSE), reimbursement of settlement infrastructure fees (including DTC feeds), reimbursement of proxy process expenses (printing, postage and distribution), tax reclaim services and program-related expenses (that include expenses incurred from the requirements of the Sarbanes-Oxley Act of 2002).

DEPOSITARY PAYMENTS – FISCAL YEAR 20172018 FOR PLC

In relation to 2017,2018, PLC received $3,842,059.35$1,774,188.02 from Deutsche Bank, the depositary bank for its American Depositary Receipt Program since 1 July 2014, including processing of cash distributions, reimbursement of listing fees (NYSE), reimbursement of settlement infrastructure fees (including DTC feeds), reimbursement of proxy process expenses (printing, postage and distribution), dividend fees and program-related expenses (that include expenses incurred from the requirements of the Sarbanes-Oxley Act of 2002).

DEFAULTS, DIVIDEND ARREARAGES AND DELINQUENCIES

DEFAULTS

There has been no material default in the payment of principal, interest, a sinking or purchase fund instalment or any other material default relating to indebtedness of the Group.

DIVIDEND ARREARAGES AND DELINQUENCIES

There have been no arrears in payment of dividends on, and material delinquency with respect to, any class of preferred stock of any significant subsidiary of the Group.


Annual Report on Form 20-F 20172018 Additional Information for US Listing Purposes 167155


ADDITIONAL INFORMATION FOR US LISTING PURPOSESCONTINUED


PURCHASES OF EQUITY SECURITIES

SHARE PURCHASES DURING 20172018

Please also refer to ‘Our shares’ section on pages 3638 to 38.39.


              € million               € million 
              Of which, number of   Maximum value that 
              Of which, number of   Maximum value that           shares purchased       may yet be purchased 
          shares purchased       may yet be purchased   Total number of   Average price   as part of publicly   as part of publicly 
  Total number of   Average price   as part of publicly   as part of publicly               shares purchased               paid per share (€)   announced plans(b)   announced plans 
              shares purchased               paid per share (€)   announced plans   announced plans 

January


February


March


April


May(a)(b)

   11,067,842    49.41    6,647,842   

April(a)

   6,222,000    45.63       

May

   26,547,961    47.62    26,547,961   

June

   20,889,728    49.63    20,889,728      26,492,822    47.16    26,492,822   

July

   17,508,982    48.63    17,508,982      20,461,397    48.41    20,461,397   

August

   14,240,920    49.46    14,240,920      20,971,789    49.50    20,971,789   

September

   19,427,617    49.44    19,427,617      15,866,919    48.16    15,866,919   

October

   11,639,717    49.20    11,639,717      8,591,175    46.67    8,591,175   

November

   11,359,677    48.04    11,359,677      6,506,538    47.75    6,506,538   

December

   227,900    47.41    227,900                

Total

   106,362,383       101,942,383       131,660,601       125,438,601    


(a) 4,420,000

6,222,000 shares were purchased to satisfy commitments to deliver shares under our share-based plans as described in note 4C ‘Share-based compensation plans’ on pages 10392 and 104.93.

(b) 

On 18 May 2017,19 April 2018 Unilever announced a share buyback programme of56 billion in 2017.2018.

Between 31 December 20172018 and 21 February 20182019 (the latest practicable date for inclusion in this report) neither NV or PLC conducted any share repurchases.


MANAGEMENT’S REPORT ON INTERNAL CONTROL OVER FINANCIAL REPORTING

In accordance with the requirements of Section 404 of the US Sarbanes-Oxley Act of 2002, the following report is provided by management in respect of the Group’s internal control over financial reporting (as defined in rule 13a–15(f) or rule 15d–15(f) under the US Securities Exchange Act of 1934):

Unilever’s management is responsible for establishing and maintaining adequate internal control over financial reporting for the Group;

Unilever’s management has used the Committee of Sponsoring Organizations of the Treadway Commission (COSO) framework (2013) to evaluate the effectiveness of our internal control over financial reporting. Management believes that the COSO framework (2013) is a suitable framework for its evaluation of our internal control over financial reporting because it is free from bias, permits reasonably consistent qualitative and quantitative measurements of internal controls, is sufficiently complete so that those relevant factors that would alter a conclusion about the effectiveness of internal controls are not omitted and is relevant to an evaluation of internal control over financial reporting;

Management has assessed the effectiveness of internal control over financial reporting as of 31 December 2017,2018, and has concluded that such internal control over financial reporting is effective. Management’s assessment and conclusion excludes Carver Korea Co, Ltd, Mae Terra, TAZO, Sundial,Adityaa Milk, Equilibra, Betty Ice, Denny Ice, and Schmidt’s NaturalsVegetarian Butcher from this assessment, as they were acquired on 27 September 2018, 1 October 2018, 1 November 2017, 12018, 3 December 2017, 11 December 2017, 18 December 20172018, and 31 December 20172018 respectively. These entities are included in our 20172018 consolidated financial statements, and together they constituted approximately 7.8%0.5% of our total assets as at 31 December 20172018 and approximately 0.17%0.02% of total turnover for the year ended 31 December 2017;2018; and

KPMG LLP and KPMG Accountants N.V., who have audited the consolidated financial statements of the Group for the year ended 31 December 2017,2018, have also audited the effectiveness of internal control over financial reporting as at 31 December 20172018 and have issued an attestation report on internal control over financial reporting.


PRINCIPAL ACCOUNTANT FEES AND SERVICES


          € million
2018
          million
2017
          million
2016
 
          € million
2017
            million
2016
            million
2015
 

Audit fees(a)

   14    14    14    16  14  14 

Audit-related fees(b)

   5(d)    (c)    (c)    5(d)   5(d)   (c)  
  

Tax fees

   (c)    (c)    (c)    (c)   (c)   (c)  
  

All other fees

   (c)    (c)    (c)    (c)   (c)   (c)  


(a) 

Amount payable to KPMG in respect of services supplied to associated pension schemes was less than1 million individually and in aggregate (2016:(2017: less than1 million individually and in aggregate; 2015:2016: less than1 million individually and in aggregate).

(b) 

Includes other audit services which comprise audit and similar work that regulations or agreements with third parties require the auditors to undertake.

(c) 

Amounts paid in relation to each type of service are individually less than1 million. In aggregate the fees paid were1 million (2016:1 million, 2015: less thanmillion (2017:1 million, 2016:1 million).

(d) Includes

2018 includes4 million (2017:5 millionmillion) for audits and reviews ofcarve-out financial statements of the Spreads business.business and1 million (2017:Nil) for assurance work on Simplification.


168156 Additional Information for US Listing Purposes  Annual Report on Form 20-F 20172018


SELECTED FINANCIAL DATA

The schedules below provide the Group’s selected financial data for the five most recent financial years.


  € million  million  million  million  million   € million  million  million  million  million 
Consolidated income statement  2017 2016 2015 2014 2013   2018 2017 2016 2015 2014 

Turnover

   53,715  52,713  53,272  48,436  49,797    50,982  53,715  52,713  53,272  48,436 

Operating profit

   8,857  7,801  7,515  7,980  7,517    12,535  8,857  7,801  7,515  7,980 

Net finance costs

   (877 (563 (493 (477 (530   (481 (877 (563 (493 (477
Net monetary gain arising from hyperinflationary economies   122             
Share of net profit/(loss) of joint ventures and associates and other income/(loss) fromnon-current investments   173  231  198  143  127    207  173  231  198  143 

Profit before taxation

   8,153  7,469  7,220  7,646  7,114    12,383  8,153  7,469  7,220  7,646 

Taxation

   (1,667 (1,922 (1,961 (2,131 (1,851   (2,575 (1,667 (1,922 (1,961 (2,131

Net profit

   6,486  5,547  5,259  5,515  5,263    9,808  6,486  5,547  5,259  5,515 

Attributable to:


Non-controlling interests

   433  363  350  344  421    419  433  363  350  344 

Shareholders’ equity

   6,053  5,184  4,909  5,171  4,842    9,389  6,053  5,184  4,909  5,171 
        € million        million        million        million        million   € million  million  million  million  million 
Combined earnings per share(a)  2017 2016 2015 2014 2013   2018 2017 2016 2015 2014 

Basic earnings per share

   2.16  1.83  1.73  1.82  1.71    3.50  2.16  1.83  1.73  1.82 

Diluted earnings per share

   2.15  1.82  1.72  1.79  1.66    3.48  2.15  1.82  1.72  1.79 

(a) For the basis of the calculations of combined earnings per share see note 7 ‘Combined earnings per share’ on page 107.


(a) For the basis of the calculations of combined earnings per share see note 7 ‘Combined earnings per share’ on page 96.

(a) For the basis of the calculations of combined earnings per share see note 7 ‘Combined earnings per share’ on page 96.


  € million  million  million  million  million   € million  million  million  million  million 
Consolidated balance sheet  2017 2016 2015 2014 2013   2018 2017 2016 2015 2014 

Non-current assets

   43,302  42,545  39,612  35,680  33,391    43,975  43,302  42,545  39,612  35,680 

Current assets

   16,983  13,884  12,686  12,347  12,122    15,481  16,983  13,884  12,686  12,347 

Total assets

   60,285  56,429  52,298  48,027  45,513    59,456  60,285  56,429  52,298  48,027 

Current liabilities

   23,177  20,556  20,019  19,642  17,382    19,772  23,177  20,556  20,019  19,642 

Non-current liabilities

   22,721  18,893  16,197  14,122  13,316    27,392  22,721  18,893  16,197  14,122 

Total liabilities

   45,898  39,449  36,216  33,764  30,698    47,164  45,898  39,449  36,216  33,764 

Share Capital

   484  484  484  484  484    464  484  484  484  484 

Reserves

   13,145  15,870  14,955  13,167  13,860    11,108  13,145  15,870  14,955  13,167 

Non-controlling interests

   758  626  643  612  471    720  758  626  643  612 

Total equity

   14,387  16,980  16,082  14,263  14,815    12,292  14,387  16,980  16,082  14,263 

Total liabilities and equity

   60,285  56,429  52,298  48,027  45,513    59,456  60,285  56,429  52,298  48,027 
  € million  million  million  million  million     € million    million    million    million    million 
Consolidated cash flow statement  2017 2016 2015 2014 2013   2018 2017 2016 2015 2014 

Net cash flow from operating activities

   7,292  7,047  7,330  5,543  6,294    6,753  7,292  7,047  7,330  5,543 

Net cash flow from/(used in) investing activities

   (5,879 (3,188 (3,539 (341 (1,161   4,644  (5,879 (3,188 (3,539 (341

Net cash flow from/(used in) financing activities

   (1,433 (3,073 (3,032 (5,190 (5,390   (11,548 (1,433 (3,073 (3,032 (5,190

Net increase/(decrease) in cash and cash equivalents

   (20 786  759  12  (257   (151 (20 786  759  12 

Cash and cash equivalents at the beginning of the year

   3,198  2,128  1,910  2,044  2,217    3,169  3,198  2,128  1,910  2,044 

Effect of foreign exchange rates

   (9 284  (541 (146 84    72  (9 284  (541 (146

Cash and cash equivalents at the end of the year

   3,169  3,198  2,128  1,910  2,044    3,090  3,169  3,198  2,128  1,910 


Annual Report on Form 20-F 20172018 Additional Information for US Listing Purposes 169157


ADDITIONAL INFORMATION FOR US LISTING PURPOSESCONTINUED


Ratios and other metrics        2017         2016         2015         2014         2013         2018         2017         2016         2015         2014 

Operating margin (%)

   16.5    14.8    14.1    16.5    15.1    24.6    16.5    14.8    14.1    16.5 

Net profit margin (%)(b)(a)

   11.3    9.8    9.2    10.7    9.7    18.4    11.3    9.8    9.2    10.7 

Ratio of earnings to fixed charges (times)(c)

   12.0    10.8    11.4    12.3    11.7 

Number of Shares issued


Unilever N.V. ordinary shares (Millions of units)

   1,715    1,715    1,715    1,715    1,715    1,715    1,715    1,715    1,715    1,715 

Unilever N.V. special shares (units)

   2,400    2,400    2,400    2,400    2,400    2,400    2,400    2,400    2,400    2,400 

Unilever PLC ordinary shares (Millions of units)

   1,310    1,310    1,310    1,310    1,310    1,187    1,310    1,310    1,310    1,310 

Unilever PLC deferred stock (units)

   100,000    100,000    100,000    100,000    100,000    100,000    100,000    100,000    100,000    100,000 


(b)(a) 

Net profit margin is expressed as net profit attributable to shareholders’ equity as a percentage of turnover.

(c)In the ratio of earnings to fixed charges, earnings consist of net profit from continuing operations excluding net profit or loss of joint ventures and associates increased by fixed charges, income taxes and dividends received from joint ventures and associates. Fixed charges consist of interest payable on debt and a portion of lease costs determined to be representative of interest. This ratio takes no account of interest receivable although Unilever’s treasury operations involve both borrowing and depositing funds.


GUARANTOR STATEMENTS(AUDITED)

On 27 July 2017, Unilever N.V. and Unilever Capital Corporation (UCC) filed a US Shelf registration, which is unconditionally and fully guaranteed, jointly and severally, by Unilever N.V., Unilever PLC and Unilever United States, Inc. (UNUS) and that superseded the NV and UCC US Shelf registration filed on 30 September 2014, which was unconditionally and fully guaranteed, jointly and severally, by NV, PLC and UNUS. UCC and UNUS are each indirectly 100% owned by the Unilever parent entities (as defined below). Of the US Shelf registration, US$8.9$12.5 billion of Notes were outstanding at 31 December 2017 (2016: US$6.32018 (2017: $8.9 billion; 2015: US$5.62016: $6.3 billion) with coupons ranging from 1.375% to 5.9%. These Notes are repayable between 15 February 2019 and 15 November 2032.

Provided below are the income statements, cash flow statements and balance sheets of each of the companies discussed above, together with the income statement, cash flow statement and balance sheet ofnon-guarantor subsidiaries. These have been prepared under the historical cost convention and, aside from the basis of accounting for investments at net asset value (equity accounting), comply in all material respects with International Financial Reporting Standards. The financial information in respect of NV, PLC and UNUS has been prepared with all subsidiaries accounted for on an equity basis. Information on NV and PLC is shown collectively as Unilever parent entities. The financial information in respect of thenon-guarantor non–guarantor subsidiaries has been prepared on a consolidated basis.


  € million   € million € million € million € million   € million   € million   € million € million € million € million   € million 

Income statement

for the year ended 31 December 2017


Unilever
Capital
Corporation
subsidiary
issuer


Unileve

parent
entities

r(a) 


Unilever
United

States Inc.
subsidiary
guarantor


Non-
guarantor
subsidiaries


  Eliminations    
Unilever
Group
 
 
  Unilever
Capital
     Unilever
United
         
   Corporation    Unilever(a)    States Inc.   Non-    

Income statement

for the year ended 31 December 2018

   
subsidiary
issuer


parent
entities


subsidiary
guarantor


guarantor
subsidiaries
 
 
  Eliminations    
Unilever
Group


Turnover

   -    -   -   53,715   -    53,715              50,982       50,982 

Operating profit

   -    997   (4  7,864   -    8,857        1,985   (4  10,554       12,535 

Net finance income/(costs)

   1    (109  (379  88   -    (399       (104  (426  74       (456

Pensions and similar obligations

   -    (2  (24  (70  -    (96       (2  (19  (4      (25

Other income/(losses)

   -    -   -   173   -    173              207       207 

Premium paid on buy back of preference shares

   -    -   -   (382  -    (382

Premium paid on buyback of preference shares

       (382     382        

Net monetary gain arising from hyperinflationary economies

             122       122 

Profit before taxation

   1    886   (407  7,673   -    8,153        1,497   (449  11,335       12,383 

Taxation

   -    (165  -   (1,502  -    (1,667       (199     (2,376      (2,575

Net profit before subsidiaries

   1    721   (407  6,171   -    6,486        1,298   (449  8,959     9,808 

Equity earnings of subsidiaries

   -    5,332   1,721   (10,298  3,245    -        8,091   1,787   (20,326  10,448     
 

Net profit

   1    6,053   1,314   (4,127  3,245    6,486        9,389   1,338   (11,367  10,448    9,808 

Attributable to:


Non-controlling interests

   -    -   -   433   -    433              419       419 

Shareholders’ equity

   1    6,053   1,314   (4,560  3,245    6,053        9,389   1,338   (11,786  10,448    9,389 

Other comprehensive income

       (24  25   (1,194      (1,193

Total comprehensive income

   1    5,978   1,158   (3,672  3,245    6,710        9,365   1,363   (12,561  10,448    8,615 


(a) 

The term ‘Unilever parent entities’ includes Unilever N.V. and Unilever PLC. Though Unilever N.V. and Unilever PLC are separate legal entities, with different shareholder constituencies and separate stock exchange listings, they operate as nearly as practicable as a single economic entity. Debt securities issued by entities in the Unilever Group are fully and unconditionally guaranteed by both Unilever N.V. and Unilever PLC.


170158 Additional Information for US Listing Purposes  Annual Report on Form 20-F 20172018


   million    million  million  million  million  million 
  Unilever     Unilever       
  Capital     United       
   Corporation    Unilever(a)   States Inc.  Non-   
Income statement  subsidiary   parent subsidiary guarantor   Unilever 
for the year ended 31 December 2017  issuer   entities guarantor subsidiaries Eliminations Group 

Turnover

            53,715     53,715 

Operating profit

       997  (4 7,864     8,857 

Net finance income/(costs)

   1    (109 (379 88     (399

Pensions and similar obligations

       (2 (24 (70    (96

Other income/(losses)

            173     173 

Premium paid on buyback of preference shares

            (382    (382

Profit before taxation

   1    886  (407 7,673     8,153 

Taxation

       (165    (1,502    (1,667

Net profit before subsidiaries

   1    721  (407 6,171     6,486 

Equity earnings of subsidiaries

       5,332  1,721  (10,298 3,245    
 

Net profit

   1    6,053  1,314  (4,127 3,245  6,486 

Attributable to:


Non-controlling interests

            433     433 

Shareholders’ equity

   1    6,053  1,314  (4,560 3,245  6,053 

Other comprehensive income

       (75 (156 455     224 

Total comprehensive income

   1    5,978  1,158  (3,672 3,245  6,710 
   million  million  million  million  million  million    million    million  million  million  million  million 
  Unilever   Unilever         Unilever     Unilever       
  Capital   United         Capital     United       
   Corporation   Unilever(a)  States Inc.  Non-      Corporation    Unilever(a)   States Inc.  Non-   
Income statement  subsidiary parent subsidiary guarantor   Unilever   subsidiary   parent subsidiary guarantor   Unilever 
for the year ended 31 December 2016  issuer entities guarantor subsidiaries Eliminations Group   issuer   entities guarantor subsidiaries Eliminations Group 

Turnover

   -   -   -  52,713   -  52,713             52,713     52,713 

Operating profit

   -  269  (5 7,537   -  7,801        269  (5 7,537     7,801 

Net finance income/(costs)

   1  (110 (331 (29  -  (469   1    (110 (331 (29    (469

Pensions and similar obligations

   -  (3 (27 (64  -  (94       (3 (27 (64    (94

Other income/(losses)

   -   -   -  231   -  231             231     231 

Premium paid on buy back of preference shares

   -   -   -   -   -   - 

Premium paid on buyback of preference shares


Profit before taxation

   1  156  (363 7,675   -  7,469    1    156  (363 7,675     7,469 

Taxation

   -  (114  -  (1,808  -  (1,922       (114    (1,808    (1,922

Net profit before subsidiaries

   1  42  (363 5,867   -  5,547    1    42  (363 5,867     5,547 

Equity earnings of subsidiaries

   -  5,142  804  (4,559 (1,387  -        5,142  804  (4,559 (1,387   
 

Net profit

   1  5,184  441  1,308  (1,387 5,547    1    5,184  441  1,308  (1,387 5,547 

Attributable to:


Non-controlling interests

   -   -   -  363   -  363             363     363 

Shareholders’ equity

   1  5,184  441  945  (1,387 5,184    1    5,184  441  945  (1,387 5,184 

Other comprehensive income

       (14 27  (791    (778

Total comprehensive income

   1  5,170  468  517  (1,387 4,769    1    5,170  468  517  (1,387 4,769 
   million  million  million  million  million  million 
  Unilever   Unilever       
  Capital   United       
   Corporation   Unilever(a)  States Inc.  Non-   
Income statement  subsidiary parent subsidiary guarantor   Unilever 
for the year ended 31 December 2015  issuer entities guarantor subsidiaries Eliminations Group 

Turnover

   -   -   -  53,272   -  53,272 

Operating profit

   -  990  (5 6,530   -  7,515 

Net finance costs

   -  (103 (327 58   -  (372

Pensions and similar obligations

   -  (3 (29 (89  -  (121

Other income

   -  439   -  (241  -  198 

Premium paid on buy back of preference shares

   -   -   -   -   -   - 

Profit before taxation

   -  1,323  (361 6,258   -  7,220 

Taxation

   -  (461 (87 (1,413  -  (1,961

Net profit before subsidiaries

   -  862  (448 4,845   -  5,259 

Equity earnings of subsidiaries

   -  4,047  690  (9,408 4,671   - 

Net profit

   -  4,909  242  (4,563 4,671  5,259 

Attributable to:


Non-controlling interests

   -   -   -  350   -  350 

Shareholders’ equity

   -  4,909  242  (4,913 4,671  4,909 

Total comprehensive income

   (1 4,922  332  (4,162 4,671  5,762 


(a) 

The term ‘Unilever parent entities’ includes Unilever N.V. and Unilever PLC. Though Unilever N.V. and Unilever PLC are separate legal entities, with different shareholder constituencies and separate stock exchange listings, they operate as nearly as practicable as a single economic entity. Debt securities issued by entities in the Unilever Group are fully and unconditionally guaranteed by both Unilever N.V. and Unilever PLC.


Annual Report on Form 20-F 20172018 Additional Information for US Listing Purposes 171159


ADDITIONAL INFORMATION FOR US LISTING PURPOSESCONTINUED


  € million         € million € million   € million   € million       € million   € million         € million € million   € million   € million       € million 
  Unilever     Unilever             Unilever     Unilever           
  Capital     United             Capital     United           
   Corporation    Unilever(a)   States Inc.    Non-       Corporation    Unilever(a)    States Inc.    Non-    
Balance sheet  subsidiary   parent subsidiary   guarantor     Unilever 
at 31 December 2018  issuer   entities guarantor   subsidiaries   Eliminations Group 
  subsidiary   parent subsidiary   guarantor     Unilever 
Balance sheetat 31 December 2017  issuer   entities guarantor   subsidiaries   Eliminations Group 

Assets


Non-current assets


Goodwill and intangible assets

   -    2,143   -    26,258    -   28,401        3,058       26,435       29,493 

Deferred tax assets

   -    90   48    947    -   1,085           4    1,113       1,117 

Othernon-current assets

   -    6   2    13,808    -   13,816        20   2    13,343       13,365 

Amounts due from group companies

   17,132    7,099   -    -    (24,231  -    17,211    10,379           (27,590   

Net assets of subsidiaries (equity accounted)

   -    35,933   21,568    -    (57,501  -        22,299   22,463        (44,762   
   17,132    45,271   21,618    41,013    (81,732  43,302  
   17,211    35,756   22,469    40,891    (72,352  43,975 

Current assets


Amounts due from group companies

   -    6,119   5,318    32,445    (43,882  -        11,883   5,413    33,032    (50,328   

Trade and other current receivables

   -    51   3    5,168    -   5,222        155   4    6,326       6,485 

Current tax assets

   -    57   9    422    -   488        15       457       472 

Other current assets

   -    39   -    11,234    -   11,273    6    7       8,511       8,524 
 
   6    12,060   5,417    48,326    (50,328  15,481 
   -    6,266   5,330    49,269    (43,882  16,983 

Total assets

   17,132    51,537   26,948    90,282    (125,614  60,285    17,217    47,816   27,886    89,217    (122,680  59,456 

Liabilities


Current liabilities


Financial liabilities

   2,420    4,685   1    862    -   7,968    2,381    30   2    822       3,235 

Amounts due to group companies

   6,964    25,457   24    11,437    (43,882  -    4,895    25,010   3,127    17,296    (50,328   

Trade payables and other current liabilities

   65    215   11    13,135    -   13,426    96    327   15    14,019       14,457 

Current tax liabilities

   -    -   -    1,088    -   1,088           72    1,373       1,445 

Other current liabilities

   -    5   -    690    -   695        2       633       635 
   9,449    30,362   36    27,212    (43,882  23,177  
   7,372    25,369   3,216    34,143    (50,328  19,772 

Non-current liabilities


Financial liabilities

   7,377    7,571   -    1,514    -   16,462    9,525    10,767       1,358       21,650 

Amounts due to group companies

   -    -   14,517    9,714    (24,231  -           13,290    14,300    (27,590   

Pensions and post-retirement healthcare liabilities:


Funded schemes in deficit

   -    8   103    1,114    -   1,225        7   136    1,066       1,209 

Unfunded schemes

   -    93   439    977    -   1,509        87   388    918       1,393 

Othernon-current liabilities

   -    5   1    3,519    -   3,525        141   1    2,998       3,140 
 
   9,525    11,002   13,815    20,640    (27,590  27,392 
   7,377    7,677   15,060    16,838    (24,231  22,721  

Total liabilities

   16,826    38,039   15,096    44,050    (68,113  45,898    16,897    36,371   17,031    54,783    (77,918  47,164 
  

Shareholders’ equity

   306    13,498   11,852    45,474    (57,501  13,629    320    11,445   10,855    33,714    (44,762  11,572 
 

Non-controlling interests

   -    -   -    758    -   758               720       720 
  

Total equity

   306    13,498   11,852    46,232    (57,501  14,387    320    11,445   10,855    34,434    (44,762  12,292 
  

Total liabilities and equity

   17,132    51,537   26,948    90,282    (125,614  60,285    17,217    47,816   27,886    89,217    (122,680  59,456 


(a) 

The term ‘Unilever parent entities’ includes Unilever N.V. and Unilever PLC. Though Unilever N.V. and Unilever PLC are separate legal entities, with different shareholder constituencies and separate stock exchange listings, they operate as nearly as practicable as a single economic entity. Debt securities issued by entities in the Unilever Group are fully and unconditionally guaranteed by both Unilever N.V. and Unilever PLC.


172160 Additional Information for US Listing Purposes  Annual Report on Form 20-F 20172018


   million          million  million    million    million        million    million          million  million    million    million        million 
  Unilever     Unilever             Unilever     Unilever           
  Capital     United             Capital     United           
   Corporation    Unilever(a)  States Inc.    Non-       Corporation    Unilever(a)   States Inc.    Non-    
Balance sheet  subsidiary   parent subsidiary   guarantor     Unilever 
at 31 December 2017  issuer   entities guarantor   subsidiaries   Eliminations Group 
  subsidiary   parent subsidiary   guarantor     Unilever 
Balance sheetat 31 December 2016  issuer   entities guarantor   subsidiaries   Eliminations Group 

Assets


Non-current assets


Goodwill and intangible assets

   -    2,202   -    25,231    -  27,433        2,143       26,258      28,401 

Deferred tax assets

   -    86   -    1,268    -  1,354        90  48    947      1,085 

Othernon-current assets

   -    70  2    13,686    -  13,758        6  2    13,808      13,816 

Amounts due from group companies

   14,931    4,569   -    -    (19,500  -    17,132    7,099       ��    (24,231   

Net assets of subsidiaries (equity accounted)

   -    39,676  20,052    -    (59,728  -        35,933  21,568        (57,501   
   14,931    46,603  20,054    40,185    (79,228 42,545  
   17,132    45,271  21,618    41,013    (81,732 43,302 

Current assets


Amounts due from group companies

   14    2,539  5,293    33,211    (41,057  -        6,119  5,318    32,445    (43,882   

Trade and other current receivables

   -    70  4    5,028    -  5,102        51  3    5,168      5,222 

Current tax assets

   -    90   -    227    -  317        57  9    422      488 

Other current assets

   -    6   -    8,459    -  8,465        39       11,234      11,273 
 
       6,266  5,330    49,269    (43,882 16,983 
   14    2,705  5,297    46,925    (41,057 13,884 

Total assets

   14,945    49,308  25,351    87,110    (120,285 56,429    17,132    51,537  26,948    90,282    (125,614 60,285 

Liabilities


Current liabilities


Financial liabilities

   2,415    1,700  1    1,334    -  5,450    2,420    4,685  1    862      7,968 

Amounts due to group companies

   6,682    26,514  15    7,846    (41,057  -    6,964    25,457  24    11,437    (43,882   

Trade payables and other current liabilities

   63    193  18    13,597    -  13,871    65    215  11    13,135      13,426 

Current tax liabilities

   -    -  21    823    -  844               1,088      1,088 

Other current liabilities

   -    4   -    387    -  391        5       690      695 
   9,160    28,411  55    23,987    (41,057 20,556  
   9,449    30,362  36    27,212    (43,882 23,177 

Non-current liabilities


Financial liabilities

   5,437    4,577   -    1,131    -  11,145    7,377    7,571       1,514      16,462 

Amounts due to group companies

   -    -  14,925    4,575    (19,500  -          14,517    9,714    (24,231   

Pensions and post-retirement healthcare liabilities:


Funded schemes in deficit

   -    7  101    2,055    -  2,163        8  103    1,114      1,225 

Unfunded schemes

   -    96  513    1,095    -  1,704        93  439    977      1,509 

Othernon-current liabilities

   -    -  46    3,835    -  3,881        5  1    3,519      3,525 
 
   7,377    7,677  15,060    16,838    (24,231 22,721 
   5,437    4,680  15,585    12,691    (19,500 18,893  

Total liabilities

   14,597    33,091  15,640    36,678    (60,557 39,449    16,826    38,039  15,096    44,050    (68,113 45,898 
  

Shareholders’ equity

   348    16,217  9,711    49,806    (59,728 16,354    306    13,498  11,852    45,474    (57,501 13,629 
 

Non-controlling interests

   -    -   -    626    -  626               758      758 
  

Total equity

   348    16,217  9,711    50,432    (59,728 16,980    306    13,498  11,852    46,232    (57,501 14,387 
  

Total liabilities and equity

   14,945    49,308  25,351    87,110    (120,285 56,429    17,132    51,537  26,948    90,282    (125,614 60,285 


(a) 

The term ‘Unilever parent entities’ includes Unilever N.V. and Unilever PLC. Though Unilever N.V. and Unilever PLC are separate legal entities, with different shareholder constituencies and separate stock exchange listings, they operate as nearly as practicable as a single economic entity. Debt securities issued by entities in the Unilever Group are fully and unconditionally guaranteed by both Unilever N.V. and Unilever PLC.


Annual Report on Form 20-F 20172018 Additional Information for US Listing Purposes 173161


ADDITIONAL INFORMATION FOR US LISTING PURPOSESCONTINUED


  € million € million € million € million € million € million 
  Unilever   Unilever       
  Capital   United       
   Corporation         Unilever(a)      States Inc.   Non-   
Cash flow statement  subsidiary parent subsidiary guarantor         Unilever 
for the year ended 31 December 2018  issuer entities guarantor subsidiaries Eliminations Group 

Net cash flow from/(used in) operating activities

      945   (6  5,814      6,753 
 

Net cash flow from/(used in) investing activities

   1,088   1,196   (63  4,619   (2,196  4,644 

Net cash flow from/(used in) financing activities

   (1,097  (2,183  69   (10,533  2,196   (11,548

Net increase/(decrease) in cash and cash equivalents

   (9  (42     (100     (151

Cash and cash equivalents at beginning of year

      23   (1  3,147      3,169 

Effect of foreign exchange rates

   15   26      31      72 

Cash and cash equivalents at end of year

   6   7   (1  3,078      3,090 
  € million € million € million € million € million € million    million  million  million  million  million  million 
  Unilever   Unilever         Unilever   Unilever       
  Capital   United          Capital   United    
   Corporation         Unilever(a)     States Inc.   Non-      Corporation  Unilever(a)   States Inc.  Non-   
Cash flow statement  subsidiary parent subsidiary guarantor         Unilever   subsidiary parent subsidiary guarantor   Unilever 
for the year ended 31 December 2017  issuer entities guarantor subsidiaries Eliminations Group   issuer entities guarantor subsidiaries Eliminations Group 
 

Net cash flow from/(used in) operating activities

   -   941   (40  6,391   -   7,292       941   (40  6,391      7,292 
 

Net cash flow from/(used in) investing activities

   (3,884  (7,123  (1,062  5,136   1,054   (5,879   (3,884  (7,123  (1,062  5,136   1,054   (5,879

Net cash flow from/(used in) financing activities

   3,873   6,261   1,103   (11,616  (1,054  (1,433   3,873   6,261   1,103   (11,616  (1,054  (1,433

Net increase/(decrease) in cash and cash equivalents

   (11  79   1   (89  -   (20   (11  79   1   (89     (20

Cash and cash equivalents at beginning of year

   -   5   (2  3,195   -   3,198       5   (2  3,195      3,198 

Effect of foreign exchange rates

   11   (61  -   41   -   (9   11   (61     41      (9

Cash and cash equivalents at end of year

   -   23   (1  3,147   -   3,169      23  (1 3,147     3,169 
   million  million  million  million  million  million    million  million  million  million  million  million 
  Unilever   Unilever         Unilever   Unilever       
   Capital   United       Capital   United    
   Corporation   Unilever(a)  States Inc.  Non-      Corporation  Unilever(a)   States Inc.  Non-   
Cash flow statement  subsidiary parent subsidiary guarantor   Unilever   subsidiary parent subsidiary guarantor   Unilever 
for the year ended 31 December 2016  issuer entities guarantor subsidiaries Eliminations Group   issuer entities guarantor subsidiaries Eliminations Group 
  

Net cash flow from/(used in) operating activities

   -   45   (177  7,179   -   7,047       45   (177  7,179      7,047 

Net cash flow from/(used in) investing activities

   (1,053  (679  (783  (1,712  1,039   (3,188   (1,053  (679  (783  (1,712  1,039   (3,188

Net cash flow from/(used in) financing activities

   1,048   621   959   (4,662  (1,039  (3,073   1,048   621   959   (4,662  (1,039  (3,073

Net increase/(decrease) in cash and cash equivalents

   (5  (13  (1  805   -   786    (5  (13  (1  805      786 

Cash and cash equivalents at beginning of year

   -   3   (1  2,126   -   2,128       3   (1  2,126      2,128 

Effect of foreign exchange rates

   5   15   -   264   -   284    5   15      264      284 

Cash and cash equivalents at end of year

   -  5  (2 3,195   -  3,198       5   (2  3,195      3,198 
   million  million  million  million  million  million 
  Unilever   Unilever       
   Capital   United    
   Corporation   Unilever(a)  States Inc.  Non-   
Cash flow statement  subsidiary parent subsidiary guarantor   Unilever 
for the year ended 31 December 2015  issuer entities guarantor subsidiaries Eliminations Group 
 

Net cash flow from/(used in) operating activities

   (1  (699  (140  8,170   -   7,330 

Net cash flow from/(used in) investing activities

   (1,005  231   (729  (2,955  919   (3,539

Net cash flow from/(used in) financing activities

   1,000   558   871   (4,542  (919  (3,032

Net increase/(decrease) in cash and cash equivalents

   (6  90   2   673   -   759 

Cash and cash equivalents at beginning of year

   -   5   (3  1,908   -   1,910 

Effect of foreign exchange rates

   6   (91  -   (456  -   (541

Cash and cash equivalents at end of year

   -   4   (1  2,125   -   2,128 


(a) 

The term ‘Unilever parent entities’ includes Unilever N.V. and Unilever PLC. Though Unilever N.V. and Unilever PLC are separate legal entities, with different shareholder constituencies and separate stock exchange listings, they operate as nearly as practicable as a single economic entity. Debt securities issued by entities in the Unilever Group are fully and unconditionally guaranteed by both Unilever N.V. and Unilever PLC.


174162 Additional Information for US Listing Purposes  Annual Report on Form 20-F 20172018


OPERATING AND FINANCIAL REVIEW AND PROSPECTS

FINANCIAL REVIEW 20162017

GROUP RESULTS AND EARNINGS PER SHARE

The following discussion summarises the results of the Group during the years 20162017 and 2015.2016. The figures quoted are in euros, at current rates of exchange, being the average rates applying in each period as applicable, unless otherwise stated. Information about exchange rates between the euro, pound sterling and US dollar is given on page 163.

In 20162017 and 2015,2016, no disposals qualified to be disclosed as discontinued operations for purposes of reporting.


  2017   2016       % change 
  2016   2015   % change 

Turnover ( million)

           52,713            53,272    (1           53,715            52,713    2 

Operating profit ( million)

   7,801    7,515    4    8,857    7,801    14 

Underlying operating profit ( million)

   8,624    8,311    4    9,400    8,624    9 

Profit before tax ( million)

   7,469    7,220    3    8,153    7,469    9 

Net profit ( million)

   5,547    5,259    6    6,486    5,547    17 

Diluted earnings per share ()

   1.82    1.72    6    2.15    1.82    18 

Underlying earnings per share ()

   2.03    1.93    5    2.24    2.03    11 

Turnover declined 1.0%increased by 1.9% to52.753.7 billion including a negativean unfavourable currency impact of 2.1% (2016: 5.1% (2015: 5.9% favourableunfavourable currency impact) primarily from Latin America andmainly due to strengthening of the UK.euro. Underlying sales growth was 3.1% (2016: 3.7% (2015: 4.1%) coming, with a positive contribution from all categories. Underlying volume growth ofwas 0.8% (2016: 0.9% (2015: 2.1%) and underlying price growth ofwas 2.3% (2016: 2.8% (2015: 1.9%). Acquisitions and disposals had a positive impactfavourable contribution of 0.9% (2016: 0.6% (2015: negative 0.1%) coming from the businesses acquired in 2015reflecting acquisitions including Blueair, Living Proof and 2016 including Dermalogica, Murad, Dollar Shave Club, Zest & Camay and Seventh Generation.Carver Korea. Emerging markets contributed 57%58% of total turnover (2016: 57%) with underlying sales growth of 5.9% (2016: 6.5% (2015: 7.1%) driven bycoming from price growth of 5.4% (2015: 4.3%)4.2% and volume growth of 1.6%. Developed markets underlying sales growth declined by 0.2% with volume growth in North America offset by negative pricing in Europe.0.6% evenly balanced between price and volume.

Underlying operating margin improved 0.8by 1.1 percentage points to 16.4%17.5%. Gross margin improved 0.5by 0.4 percentage points driven by margin-accretive innovation, acquisitionspositive mix and theroll-out of the‘5-S’savings programmes. Brandprogramme that more than offset increases in commodity costs. The absolute level of brand and marketing investment was flat in local currencies versus 2016, as savings from advertising production werere-invested in increased media spend. As a percentage of turnover, was down 0.4 percentage points due to sales leverage and efficiencies from Zero Based Budgeting. Higher gross margin and lower brand and marketing investment werewas down by 0.6 percentage points. Overheads reduced by 0.1 percentage points, driven by a further reduction in the cost base partially offset by a 0.1 percentage points increaseinvestment in overheads driven by the higher overheads ratio of acquired businesses.capabilities including new business models ande-commerce.

Operating profit was up 3.8% at13.5% to8.9 billion (2016:7.8 billion (2015:7.5 billion) including823543 million (2015:796 million) ofnon-underlying charges mainly beingitems.Non-underlying items within operating profit are638 million restructuring costs, acquisition and disposal-related costs of159 million and lossesone-off costs of80 million partly offset by gain on business disposals.disposal of group companies of334 million.

Net finance costs increased by314 million to877 million (2016:563 million) as they included aone-off finance charge of382 million relating to the book premium paid on the buyback of preference shares in Unilever N.V. The net cost of financing borrowings was469399 million, compared with37270 million in 2015.lower than 2016. The increasedecrease was driven by higher borrowing levels and reduced interest on cash deposits. Thedue to a lower average interest rate on net debt increasedof 2.7% compared to 3.5% compared with 3.0% in 2015. The2016, and to lower other interest costs fromone-off credits in Brazil. Pension financing was a charge for pension financing decreased byof2796 million compared to94 million (2015:121 million) as a result of a lower net deficit at the beginning ofin 2016.

The effective tax rate was 20.8% versus 26.2% compared with 27.6% in 2015. This included2016. The change was mainly due to the impact of favourableUS tax audit settlements.reform that led to aone-off tax benefit coming from restating deferred tax balances at the new lower federal tax rate, partially offset by the tax impact of the AdeS business disposal.

Net profit from joint ventures and associates contributedwas up 22% at127155 million, compared with107 millionan increase coming from growth in 2015 due to higher profits from the Pepsi Lipton joint venture.venture and profit from disposal of an investment in a joint venture in India. Other income fromnon-current investment and associates increasedinvestments was18 million compared to104 million compared with91 million in 2015, primarily driven bythe prior year which included a gain of107 million from the sale of financial assets.

Diluted earnings per share increased by 5.7%18.4% to1.82 largely due to2.15 reflecting improved margin.operating margins,578 million US tax reform and a309 million gain on disposal of the AdeS business. Underlying earnings per share increased by 5.0%10.7% to2.03 including an adverse currency2.24. This measure excludes the post tax impact of 4.0%.non-underlying items.

ADDITIONAL COMMENTS ON 20162017 EXPENSES AND OPERATING PROFIT

Underlying operating profit increased by0.30.8 billion compared to 2015,2016 driven by an improvement across most categories,all divisions, with an increase in Beauty & Personal Care by0.4 billion and Home Care ofand Foods and Refreshment by0.2 billion Personal Care of0.1 billion, and Refreshment of0.1 billion offset by a decrease in Foods of0.1 billion.each. Operating profit increased by1.1 billion, including a gain on disposal of AdeS Soy beverage business in Latin America of0.3 billion, in line with the increase in underlying operating profit.billion.

Cost of raw and packing material and goods purchased for resale (material costs) decreasedincreased by0.4 billion, driven primarily by0.5 billion. This included a favourable exchange rate appreciationimpact of1.20.4 billion; at constant exchange rates it was up by0.80.9 billion. At constant exchange rates, gross total input costs (including material costs, distribution and supply chain indirects) increase of1.9 billion was more than offset by favourable price changes of1.51.2 billion, and material costs savings of1.11.4 billion during the year, resulting in gross margin improvement of 0.30.5 percentage points to 42.5%43.1%.

Staff costs increased by0.2 billion despite a decrease in the average number of employees, primarily due to share based compensation and bonuses, which were in line with 2015. Ourhigher due to stronger performance against targets as compared to 2016. There were also higher redundancy costs incurred during the year. These were partially offset by savings delivered through the C4G programme. The absolute level of our brand and marketing investment decreasedin local currencies was flat versus 2016. At current rates, the brand and marketing investment as a percentage of turnover was down by0.3 billion (decrease of 0.4 0.6 percentage points to 14.7%), reflecting the impact of efficiencies from ourzero-based budgeting initiative.14.1%.

The impact of input costs and investment in our brands is discussed further in our segmental disclosures, which also provide additional details of the impact of brands, products and sub categories on drivingtop-line growth.


Annual Report on Form 20-F 20172018 Additional Information for US Listing Purposes 175163


ADDITIONAL INFORMATION FOR US LISTING PURPOSESCONTINUED


BEAUTY & PERSONAL CARE


  2017   2016       % change 
  2016   2015   %
  change
 

Turnover ( million)

       20,172        20,074    0.5        20,697        20,172    2.6 

Operating profit ( million)

   3,704    3,637    1.8    4,103    3,704    10.8 

Underlying operating profit ( million)

   4,033    3,951    2.1    4,375    4,033    8.5 

Operating margin (%)

   18.4    18.1    0.3    19.8    18.4    1.4 

Underlying operating margin (%)

   20.0    19.7    0.3    21.1    20.0    1.1 

Underlying sales growth (%)

   4.2    4.1      2.9    4.2   

Underlying volume growth (%)

   1.6    2.3      1.4    1.6   

Underlying price growth (%)

   2.6    1.8       1.5    2.6    

KEY DEVELOPMENTS


Turnover growth was 0.5% including an adverseof 2.6% included a negative currency impact of 4.9%1.9%. Acquisitions and disposals contributed 1.4% which included brands such as Dollar Shave Club acquired in 20161.7% and the Prestige skin care brands acquired in 2015. Underlyingunderlying sales growth was 4.2%, in line with 4.1% in 2015.2.9%. Beauty & Personal Care benefited from a strong set of innovations that included five new brand launches. The portfolio continued to grow organically and extendingthrough acquisitions in attractive segments and channels. Acquisitions of 2017 included Living Proof, Hourglass, Carver Korea, Sundial Brands and Schmidt’s Naturals. Previous acquisitions of Dollar Shave Club and Kate Somerville grew in double digits, while Dermalogica grew 5%. Growth was negatively impacted by difficult market conditions particularly in Brazil and Indonesia. Skin cleansing delivered good growth helped by Dove shower foam, and Baby Dove which wasrolled-out to 26 countries. In hair care, the global expansion into more premium brands through acquisitions. Deodorants performed well following the success of dry sprays in North America and Rexona Antibacterial with 10x more odour protection. Hair benefited from the successful Sunsilknatural propositions contributed tore-launchvolume-led and from innovations such as TRESemmé Beauty-Full Volume range. Lifebuoy demonstrated strong growth across emerging markets while Dove had a good year in 2016 supported by strong growth of the premium and Men+Care ranges.growth.

Underlying operating profit increased by82342 million. Underlying operating margin and underlying sales growth improvement added237 million includingand116 million respectively, offset by a15911 million adverse impact from exchange rate movement.movements. Acquisition and disposal related activities contributed12 million while underlying sales growth and underlying operating margin improvement added166 million and63 million respectively.had no net impact. Underlying operating margin improvement was principally driven by higher gross margins and brand and marketing efficiencies partly offset by a higher overheads ratio.from zero based budgeting.

FOODS & REFRESHMENT


        %   2017 2016       % change 
  2016 2015     Change 

Turnover ( million)

       12,524      12,919    (3.1       22,444      22,532    (0.4

Operating profit ( million)

   2,180  2,298    (5.1   3,616  3,148    14.8 

Underlying operating profit ( million)

   2,394  2,468    (3.0   3,737  3,505    6.6 

Operating profit ( million)

   17.4  17.8    (0.4

Operating margin (%)

   16.1  14.0    2.1 

Underlying operating margin (%)

   19.1  19.1    -    16.7  15.6    0.3 

Underlying sales growth (%)

   2.1  1.5      2.7  2.7   

Underlying volume growth (%)

   (0.5 0.8      (0.2 0.1   

Effect of price changes (%)

   2.6  0.8    

Underlying price growth (%)

   3.0  2.6    

KEY DEVELOPMENTS


Turnover declined by 3.1%0.4% including a 4.7%an adverse currency impact and 0.3% negative impact from acquisitions and disposals.of 2.4%. Underlying sales growth was 2.1%,2.7% after an improvementadverse effect from a 2.4% underlying sales decline of 0.6 percentage points from 2015 led by 2.6% price growth.the spreads business which was divested in 2018. The category sustained its returndivision continued to positivemodernise the portfolio through innovations and acquisitions such as Mae Terra. Innovations behind premium ice cream brands performed well, including Magnum pints that deliver the ultimate chocolate and ice cream experience in a tub. T2 continued to show double-digit growth helped by strong performances from Hellmann’swhile Pure Leaf was introduced to Canada and Knorr. The two brands successfully modernised their ranges with extension into organic variants and with packaging that highlights the naturalness of their ingredients. SalesUnited Kingdom after successful launch in spreads declined as modest growth in emerging markets was offset by the continued but slowing decline in developed markets.United States.

Underlying operating profit declined bywas74232 million higher, mainly from underlying operating margin improvement, which contributed242 million. Underlying sales growth added51 million and exchange rates had an adverse impact of123 million. Underlying operating margin had a contribution of180 million, while acquisition and disposal related activities and exchange rate movements had a negative impact of3 million.

HOME CARE

           % 
    2016   2015     Change 

Turnover ( million)

       10,009        10,159    (1.5

Operating profit ( million)

   949    740    28.2 

Underlying operating profit ( million)

   1,086    855    27.0 

Operating margin (%)

   9.5    7.3    2.2 

Underlying operating margin (%)

   10.9    8.4    2.5��

Underlying sales growth (%)

   4.9    5.9   

Underlying volume growth (%)

   1.3    4.0   

Underlying price growth (%)

   3.6    1.9      

KEY DEVELOPMENTS

Turnover for Home Care declined by 1.5% which includes an adverse currency impact of 6.5%. Acquisitions23 million and disposals contributed a positive 0.4%. Underlying sales growth was 4.9% split between volume growth of 1.3% and price growth of 3.6%. Surf grew double- digit helped by the launch of Surf Sensations. Other innovations, including Omo with enhanced formulation, Comfort Intense and Domestos toilet blocks, were rolled out to new markets contributing volume growth. The Brilhante brand contributed to good volume growth in Latin America.

Underlying operating profit increased by231 including a5667 million decrease from exchange rate movements. Underlying sales growth contributed42 million while improved underlying operating margin added244 million. Acquisition and disposal activities contributed2 million. Gross margin improved as a result of improved mix and cost savings.

REFRESHMENT

           % 
    2016   2015     Change 

Turnover ( million)

       10,008        10,120    (1.1

Operating profit ( million)

   968    840    15.2 

Underlying operating profit ( million)

   1,111    1,037    7.1 

Operating profit ( million)

   9.7    8.3    1.4 

Underlying operating margin (%)

   11.1    10.2    0.9 

Underlying sales growth (%)

   3.5    5.4   

Underlying volume growth (%)

   1.0    1.5   

Effect of price changes (%)

   2.6    3.9      

KEY DEVELOPMENTS

Refreshment turnover declined by 1.1% including a 4.6% adverse impact from currency and a 0.1% positive contribution from acquisitions and disposals. Underlying sales growth was 3.5%, a drop of 1.9 percentage points from 2015. Growth in ice cream was driven by margin-accretive innovations behind premium brands including the Magnum Double range, the Ben & Jerry’s ‘Wich sandwich and dairy free range as well as new variants of Talenti.Leaf tea growth improved in emerging markets but was held back by the black tea business in developed markets. Tea continued to build its presence in more premium segments with good growth from T2 specialty teas.

Underlying operating profit was74 million higher coming from underlying sales growth which contributed37 million, underlying operating margin improvement of85 million and a11 million increase acquisition and disposal activities net of adverse exchange rate movement of59 million.respectively. Underlying operating margin was up primarily due to improvements in gross margin improvement and efficiencies in ice cream.brand and marketing investment and overheads.

HOME CARE

    2017   2016       % change 

Turnover ( million)

       10,574        10,009    5.6 

Operating profit ( million)

   1,138    949    19.9 

Underlying operating profit ( million)

   1,288    1,086    18.6 

Operating margin (%)

   10.8    9.5    1.3 

Underlying operating margin (%)

   12.2    10.9    1.3 

Underlying sales growth (%)

   4.4    4.9   

Underlying volume growth (%)

   2.1    1.3   

Underlying price growth (%)

   2.3    3.6      

KEY DEVELOPMENTS

Turnover grew 5.6% including a negative currency impact of 1.7%. Underlying sales growth was 4.4% coming from volume growth of 2.1% and price growth of 2.3%. Acquisitions and disposals contributed a favourable 2.9%. The roll-outs of Surf into Central and Eastern Europe and Omo into Iran performed well. In laundry, growth was driven by strong performances of the fabric conditioner Comfort in Asia and Europe, and the value brand Brilhante in Latin America. In 2017, the portfolio benefited from the acquisition of EAC Myanmar.
The acquisition of Seventh Generation in 2016 with its natural proposition performed well and started to contribute to underlying sales growth towards the end of the year.
Underlying operating profit increased by202 million including a56 million adverse contribution from exchange rate movements. Underlying operating margin added141 million and underlying sales growth contributed48 million. Acquisition and disposal related activities contributed70 million. Underlying operating margin improvement reflects strong delivery of the5-S programme andzero-based budgeting.


176164 Additional Information for US Listing Purposes  Annual Report on Form 20-F 20172018


FINANCE AND LIQUIDITY

Approximately1.51.0 billion (or 43%31%) of the Group’s cash and cash equivalents arewere held in the parent and central finance companies, for ensuring maximum flexibility. These companies provide loans to our subsidiaries that are also funded through retained earnings and third party borrowings. We maintain access to global debt markets through an infrastructure of short and long-term debt programmes. We make use of plain vanilla derivatives, such as interest rate swaps and foreign exchange contracts, to help mitigate risks. More detail is provided in notes 16, 16A, 16B and 16C on pages 121 to 126.

The remaining1.92.3 billion (57%(69%) of the Group’s cash and cash equivalents arewere held in foreign subsidiaries which repatriate distributable reserves on a regular basis. For most countries, this is done through dividends which are in some cases subject to withholding or distributionfree of tax. This balance includesincluded206 million (2016:240 million, (2015:2015:284 million, 2014:452 million) of cash that iswas held in a few countries where we face cross-border foreign exchange controls and/or other legal restrictions that inhibit our ability to make these balances available in any means for general use by the wider business. The cash willis generally be invested or held in the relevant country and, given the other capital resources available to the Group, does not significantly affect the ability of the Group to meet its cash obligations.

We closely monitor all our exposures and counter-party limits. Unilever has committed credit facilities in place for general corporate purposes. The undrawn bilateral committed credit facilities in place on 31 December 20162017 were US$6,550$7,865 million. In addition, Unilever had undrawn revolving364-day bilateral credit facilities in aggregate of4,000 million.

NON-GAAP MEASURES

UNDERLYING SALES GROWTH (USG)

The reconciliation of USG to changes in the GAAP measure turnover is as follows:


TOTAL GROUP

   
   2016  2015 
    vs 2015      vs 2014 

Turnover growth (%)(a)

   (1.0  10.0 

Effect of acquisitions (%)

   0.8   0.7 

Effect of disposals (%)

   (0.2  (0.8

Effect of exchange rates (%)

   (5.1  5.9 

Underlying sales growth (%)

   3.7   4.1 

PERSONAL CARE

   
   2016  2015 
    vs 2015  vs 2014 

Turnover growth (%)(a)

   0.5   13.2 

Effect of acquisitions (%)

   1.7   1.0 

Effect of disposals (%)

   (0.3  - 

Effect of exchange rates (%)

   (4.9  7.6 

Underlying sales growth (%)

   4.2   4.1 

FOODS

   
   2016  2015 
    vs 2015  vs 2014 

Turnover growth (%)(a)

   (3.1  4.5 

Effect of acquisitions (%)

   -   - 

Effect of disposals (%)

   (0.3  (2.5

Effect of exchange rates (%)

   (4.7  5.6 

Underlying sales growth (%)

   2.1   1.5 

HOME CARE

   
   2016  2015 
    vs 2015  vs 2014 

Turnover growth (%)(a)

   (1.5  10.9 

Effect of acquisitions (%)

   0.6   0.2 

Effect of disposals (%)

   (0.2  (0.1

Effect of exchange rates (%)

   (6.5  4.5 

Underlying sales growth (%)

   4.9   5.9 

REFRESHMENT

   
TOTAL GROUP   2017  2016 
  2016 2015   vs 2016     vs 2015 
  vs 2015     vs 2014 

Turnover growth (%)(a)

   (1.1 10.3 

Turnover growth (%)(a)

   1.9  (1.0

Effect of acquisitions (%)

   0.2  1.3    1.3  0.8 

Effect of disposals (%)

   (0.1 (0.7   (0.4 (0.2

Effect of exchange rates (%)(b)

   (2.1 (5.1

Underlying sales growth (%)(b)

   3.1  3.7 
BEAUTY & PERSONAL CARE   2017  2016 
  vs 2016 vs 2015 

Turnover growth (%)(a)

   2.6  0.5 

Effect of acquisitions (%)

   1.8  1.7 

Effect of disposals (%)

   (0.1 (0.3

Effect of exchange rates (%)

   (4.6 4.1    (1.9 (4.9

Underlying sales growth (%)

   3.5  5.4    2.9  4.2 
FOODS & REFRESHMENT   2017  2016 
  vs 2016 vs 2015 

Turnover growth (%)(a)

   (0.4 (2.2

Effect of acquisitions (%)

   0.2  0.1 

Effect of disposals (%)

   (0.8 (0.2

Effect of exchange rates (%)

   (2.4 (4.7

Underlying sales growth (%)

   2.7  2.7 
HOME CARE   2017  2016 
  vs 2016 vs 2015 

Turnover growth (%)(a)

   5.6  (1.5

Effect of acquisitions (%)

   3.1  0.6 

Effect of disposals (%)

   (0.2 (0.2

Effect of exchange rates (%)

   (1.7 (6.5

Underlying sales growth (%)

   4.4  4.9 


(a) 

Turnover growth is made up of distinct individual growth components, namely underlying sales, currency impact, acquisitions and disposals. Turnover growth is arrived at by multiplying these individual components on a compounded basis as there is a currency impact on each of the other components. Accordingly, turnover growth is more than just the sum of the individual components.

UNDERLYING VOLUME GROWTH (UVG)

The relationship between UVG and USG is set out below:


  2017   2016 
  2016   2015   vs 2016       vs 2015 
  vs 2015       vs 2014 

Underlying volume growth (%)

   0.9    2.1    0.8    0.9 

Underlying price growth (%)

   2.8    1.9    2.3    2.8 

Underlying sales growth (%)

   3.7    4.1    3.1    3.7 

UNDERLYING EFFECTIVE TAX RATE

The reconciliation of taxation to taxation before tax impact ofnon-underlying items is as follows:


   million    million 
   million    million   2017 2016 
  2016 2015 

Taxation

   1,922  1,961    1,667  1,922 

Tax impact of:


Non-underlying items within operating profit

   213  180    77  213 

Non-underlying items not in operating profit but within net profit

   -   -    578    

Taxation before tax impact ofnon-underlying items

   2,135  2,141    2,322  2,135 

Profit before taxation

   7,469  7,220    8,153  7,469 

Non-underlying items within operating profit before tax

   823  796    543  823 

Non-underlying items not in operating profit but within


Net profit before tax

   -   - 

Non-underlying items not in operating profit but within Net profit before tax

   382   

Share of net (profit)/loss of joint ventures and associates

   (127 (107   (155 (127
Profit before tax excludingnon-underlying items before tax and share of net profit/(loss) of joint ventures and associates   


8,165


7,909


8,923


8,165


Underlying effective tax rate

   26.1%  27.1%    26.0%  26.1% 

CONSTANT UNDERLYING EARNINGS PER SHARE

The reconciliation of underlying profit attributable to shareholders’ equity to constant underlying earnings attributable to shareholders’ equity and the calculation of constant underlying EPS is as follows:


   million    million 
   million      million   2017 2016 
  2016   2015 

Underlying profit attributable to shareholders’ equity

   5,785    5,514    6,315  5,785 

Impact of translation of earnings between constant and current exchange rates and translational hedges

   194    (140

Constant underlying earnings attributable to shareholders’ equtiy

   5,979    5,374 

Impact of translation from current to constant exchange rates and translational hedges

   310  128 

Impact of Q4 Venezuela price inflation

   (153   
 

Constant underlying earnings attributable to shareholders’ equity

   6,472  5,913 

Diluted combined average number of share units (millions of units)

   2,853.9    2,855.4    2,814.0  2,853.9 
 

Constant underlying EPS (€)

   2.10    1.88    2.30   2.07(a)(b) 

(a)

Represents 2016 underlying EPS as adjusted for translational hedges and the impact of translation of earnings using annual average 2016 exchange rates

(b)

From 2018, in our reporting of growth in constant underlying EPS, we translate the prior period using an annual average exchange rate rather than monthly averages. This change has been made to align with the prior period constant exchange rate used for calculating USG. The impact of this is0.00 per share in 2016 constant underlying EPS.


Annual Report on Form 20-F 20172018 Additional Information for US Listing Purposes 177165


ADDITIONAL INFORMATION FOR US LISTING PURPOSESCONTINUED


FREE CASH FLOW (FCF)

The reconciliation of FCF to net profit is as follows:


    million     million 
    2016  2015 

Net profit

   5,547   5,259 

Taxation

   1,922   1,961 

Share of net profit of joint ventures/associates and other income fromnon-current investments

   (231  (198

Net finance cost

   563   493 

Depreciation, amortisation and impairment

   1,464   1,370 

Changes in working capital

   51   720 

Pensions and similar obligations less payments

   (327  (385

Provisions less payments

   65   (94

Elimination of (profits)/losses on disposals

   127   26 

Non-cash charge for share-based compensation

   198   150 

Other adjustments

   (81  49 

Cash flow from operating activities

   9,298   9,351 

Income tax paid

   (2,251  (2,021

Net capital expenditure

   (1,878  (2,074

Net interest and preference dividends paid

   (367  (460

Free cash flow

   4,802   4,796 

Net cash flow (used in)/from investing activities

   (3,188  (3,539

Net cash flow (used in)/from financing activities

   (3,073  (3,032

NET DEBT

The reconciliation of net debt to the GAAP measure total financial liabilities is as follows:

    million     million   
    2016  2015   

Total financial liabilities


(16,595


(14,643


Current financial liabilities

   (5,450  (4,789 

Non-current financial liabilities

   (11,145  (9,854 

Cash and cash equivalents as per balance sheet

   3,382   2,302  

Cash and cash equivalents as per cash flow

   3,198   2,128  

Bank overdrafts deducted therein

   184   174  

Current financial assets

   599   836  

Net debt

   (12,614  (11,505 

UNDERLYING OPERATING PROFIT AND UNDERLYING OPERATING MARGIN

The reconciliation of underlying operating profit to operating profit is as follows:

    million      million 
    2016   2015 

Operating profit

   7,801    7,515 

Non-underlying items within operating profit

   823    796 

Underlying operating profit

   8,624    8,311 

Turnover

   52,713    53,272 

Operating margin

   14.8%    14.1% 

Underlying operating margin

   16.4%    15.6% 
    million     million 
    2017  2016 

Net profit

   6,486   5,547 

Taxation

   1,667   1,922 

Share of net profit of joint ventures/associates and other income fromnon-current investments

   (173  (231

Net finance costs

   877   563 

Depreciation, amortisation and impairment

   1,538   1,464 

Changes in working capital

   (68  51 

Pensions and similar obligations less payments

   (904  (327

Provisions less payments

   200   65 

Elimination of (profits)/losses on disposals

   (298  127 

Non-cash charge for share-based compensation

   284   198 

Other adjustments

   (153  (81

Cash flow from operating activities

   9,456   9,298 

Income tax paid

   (2,164  (2,251

Net capital expenditure

   (1,621  (1,878

Net interest and preference dividends paid

   (316  (367
   

Free cash flow

   5,355   4,802 

Net cash flow (used in)/from investing activities

   (5,879  (3,188

Net cash flow (used in)/from financing activities

   (1,433  (3,073

NET DEBT

The reconciliation of net debt to the GAAP measure total financial liabilities is as follows:

    million   million 
    2017  2016 

Total financial liabilities


(24,430


(16,595


Current financial liabilities

   (7,968  (5,450
  

Non-current financial liabilities

   (16,462  (11,145

Cash and cash equivalents as per balance sheet

   3,317   3,382 
  

Cash and cash equivalents as per cash flow statement

   3,169   3,198 
  

Bank overdrafts deducted therein

   167   184 
  

Less cash and cash equivalents held for sale

   (19   

Current financial assets

   770   599 

Net debt

   (20,343  (12,614

UNDERLYING OPERATING PROFIT AND UNDERLYING OPERATING MARGIN

The reconciliation of underlying operating profit to operating profit is as follows:

    million      million 
    2017   2016 

Operating profit

   8,857    7,801 

Non-underlying items within operating profit

   543    823 
   

Underlying operating profit

   9,400    8,624 

Turnover

   53,715    52,713 

Operating margin

   16.5%    14.8% 

Underlying operating margin

   17.5%    16.4% 

20152016 ACQUISITIONS AND DISPOSALS

On 1 May 201531 March 2016 the Group sold the bread and bakery business under the brand ‘Modern’ in India to Nimman Foods Private Limited, part of the Everstone Group.

On 7 April 2016 the Group acquired REN Skincare, a prestige Personal Care business with an iconic British skin care brand.

On 1 March 2015 the Group also acquired the CamayIndulekha and ZestVayodha brands from The Proctor & Gamble Company. In addition a manufacturing site was acquired.Mosons Group.

On 6 May 20152016 the Group sold local Alberto Culver brands Antiall, Farmaco, Veritas, the rights for VO5 in Argentina and a manufacturing plant to Santiago Saenz.

On 31 July 2016 the Group sold the Rice Exports business in India to LT Foods Middle East DMCC, a Group company of LT Foods Limited.

On 10 August 2016 the Group acquired Kate Somerville Skincare,Dollar Shave Club, a prestige Personal Care business with a leading independent skin care brand.subscription-baseddirect-to-consumer male grooming business.

On 1 August 201520 October 2016 the Group acquired Dermalogica,Seventh Generation, a prestige Personal Care business with the leading skinNorth American home and personal care brand in professional salons and spas. The assets acquired were principally the Dermalogica brand.eco-friendly naturals business.

On September 2015December 2016 the Group acquired Murad, the leading clinical skin care brand, partBlueair, a supplier of our prestige Personal Care business.innovative mobile indoor air purification technologies and solutions.

On 30 September 2015 the Group acquired Grom, a premium Italian gelato business.

FINANCIAL INSTRUMENTS AND RISK

The key financial instruments used by Unilever are short-term and long-term borrowings, cash and cash equivalents, and certain plain vanilla derivative instruments, principally comprising interest rate swaps and foreign exchange contracts. Treasury processes are governed by standards approved by the Unilever Leadership Executive. Unilever manages a variety of market risks, including the effects of changes in foreign exchange rates, interest rates, commodity costs and liquidity.

OUTLOOK

Our priorities for 2018 areLooking forward, our priority is to grow volumes ahead ofaccelerate quality growth. That means an investment-led approach based on delivering our markets, maintain strong delivery from our savings programmes4G growth strategy – consistent growth, competitive growth, profitable growth and responsible growth, with an equal focus on each. In 2019 we expect market conditions to complete the integration of Foods & Refreshment as well as the exit from spreads.remain challenging. We expect this will translate into another year ofanticipate underlying sales growth will be in the 3% – lower half of our multi-year 3–5% range, and anwith continued improvement in underlying operating margin and another year of strong free cash flow, that keeps usflow. We remain on track for theour 2020 targets.goals.


OTHER INFORMATION ON THE COMPANY

RAW MATERIALS

Our products use a wide variety of raw and packaging materials which we source internationally and which may be subject to price volatility either directly or as a result of movements in foreign exchange rates. In 20172018 we saw higher market inflation at modest levels,than in 2017 with price rises in tropical oils, some chemicalscrude-derived materials including plastic packaging and butter and other dairy products.surfactants. Foreign exchange rates were more benign than in previous years, although there was some inflation notably in Egypt, Turkeydeteriorated over the second half of the year across most emerging markets, with significant impact from Argentina, India, Brazil and Argentina.Turkey. Looking ahead to 20182019 we remain watchful for continued turbulencevolatility in commodity and foreign exchange markets and for steadily increasing rates of inflation in key commodities, particularly crude oil.markets.

SEASONALITY

Certain of our businesses, such as ice cream, are subject to significant seasonal fluctuations in sales. However, Unilever operates globally in many different markets and product categories, and no individual element of seasonality is likely to be material to the results of the Group as a whole.

INTELLECTUAL PROPERTY

We have a large portfolio of patents and trademarks, and we conduct some of our operations under licences that are based on patents or trademarks owned or controlled by others. We are not dependent on any one patent or group of patents. We use all appropriate efforts to protect our brands and technology.


178166 Additional Information for US Listing Purposes  Annual Report on Form 20-F 20172018


COMPETITION

As a fast-moving consumer goods (FMCG) company, we are competing with a diverse set of competitors. Some of these operate on an international scale like ourselves, while others have a more regional or local focus. Our business model centres on building brands which consumers know, trust, like and buy in conscious preference to competitors’. Our brands command loyalty and affinity and deliver superior performance.

INFORMATION PRESENTED

Unless otherwise stated, share refers to value share. The market data and competitive set classifications are taken from independent industry sources in the markets in which Unilever operates.

IRAN-RELATED REQUIRED DISCLOSURE

Unilever operates in Iran through anon-US subsidiary. In 2017,2018, sales in Iran were significantly less than one percent of Unilever’s worldwide turnover. During the year, thisnon-US subsidiary had approximately2,9741,528 in gross revenues and less than565382 in net profits attributable to the sale of food, personal care and home care products to the Hotel Homa Group, which is owned by the Social Security Organization of Iran, and IRR Mohammad Rasoullah Pharmacy, which is affiliated with the Islamic Revolutionary Guard Corps. We advertised our products on television networks that are owned by the Government of Iran or affiliated entities. Income, payroll and other taxes, duties and fees (including for utilities) were payable to the Government of Iran and affiliated entities in connection with our operations. Ournon-US subsidiary maintains bank accounts in Iran with various banks to facilitate our business in the country and make any required payments to the Government of Iran and affiliated entities. Our activities in Iran comply in all material respects with applicable laws and regulations, including US and other international trade sanctions, and we plan to continue these activities.

PROPERTY, PLANT AND EQUIPMENT

We have interests in properties in most of the countries where there are Unilever operations. However, none are material in the context of the Group as a whole. The properties are used predominantly to house production and distribution activities and as offices. There is a mixture of leased and owned property throughout the Group. We are not aware of any environmental issues affecting the properties which would have a material impact upon the Group, and there are no material encumbrances on our properties. Any difference between the market value of properties held by the Group and the amount at which they are included in the balance sheet is not significant. We believe our existing facilities are satisfactory for our current business and we currently have no plans to construct new facilities or expand or improve our current facilities in a manner that is material to the Group.


Annual Report on Form 20-F 20172018 Additional Information for US Listing Purposes 179167


NOTES

168NotesAnnual Report on Form 20-F 2018


CAUTIONARY STATEMENT

This document may contain forward-looking statements, including ‘forward-looking statements’ within the meaning of the United States Private Securities Litigation Reform Act of 1995. Words such as ‘will’, ‘aim’, ‘expects’, ‘anticipates’, ‘intends’, ‘looks’, ‘believes’, ‘vision’, or the negative of these terms and other similar expressions of future performance or results, and their negatives, are intended to identify such forward-looking statements. These forward-looking statements are based upon current expectations and assumptions regarding anticipated developments and other factors affecting the Unilever Group (the ‘Group’). They are not historical facts, nor are they guarantees of future performance.

Because these forward-looking statements involve risks and uncertainties, there are important factors that could cause actual results to differ materially from those expressed or implied by these forward-looking statements. Among other risks and uncertainties, the material or principal factors which could cause actual results to differ materially are: Unilever’s global brands not meeting consumer preferences; Unilever’s ability to innovate and remain competitive; Unilever’s investment choices in its portfolio management; inability to find sustainable solutions to support long-term growth;growth including to plastic packaging; the effect of climate change on Unilever’s business; significant changes or deterioration in customer relationships; the recruitment and retention of talented employees; disruptions in our supply chain;chain and distribution; increases or volatility in the cost of raw materials and commodities; the production of safe and high quality products; secure and reliable IT infrastructure; successful execution of acquisitions, divestitures and business transformation projects; economic, social and political risks and natural disasters; financial risks; failure to meet high and ethical standards; and managing regulatory, tax and legal matters.

These forward-looking statements speak only as of the date of this document. Except as required by any applicable law or regulation, the Group expressly disclaims any obligation or undertaking to release publicly any updates or revisions to any forward-looking statements contained herein to reflect any change in the Group’s expectations with regard thereto or any change in events, conditions or circumstances on which any such statement is based.

Further details of potential risks and uncertainties affecting the Group are described in the Group’s filings with the London Stock Exchange, Euronext Amsterdam and the US Securities and Exchange Commission, including in the Unilever Annual Report and Accounts 2017.2018.

This document is not prepared in accordance with US GAAP and should not therefore be relied upon by readers as such.

In addition, a printed copy of the Annual Report on Form20-F 20172018 is available, free of charge, upon request to Unilever, Investor Relations Department, 100 Victoria Embankment, London EC4Y 0DY, United Kingdom.

This document comprises regulated information within the meaning of Sections 1:1 and 5:25c of the Act on Financial Supervision (‘Wet op het financieel toezicht (Wft)’) in the Netherlands.

The brand names shown in this report are trademarks owned by or licensed to companies within the Group.

References in this document to information on websites (and/or social media sites) are included as an aid to their location and such information is not incorporated in, and does not form part of, the Annual Report on Form20-F 2017.2018.

Designed and produced by Unilever Communications.

Printed at Pureprint Group, ISO 14001. FSC®FSC® certified and CarbonNeutral®CarbonNeutral®.

This document is printed on Revive 100% Recycled Silk. These papers have been exclusively supplied by Denmaur Independent Papers which has offset the carbon produced by the production and delivery of them to the printer.

These papers are 100% recycled and manufactured usingde-inked post-consumer waste. All the pulp is bleached using an elemental chlorine free process (ECF). Printed in the UK by Pureprint using its pureprint®pureprint® environmental printing technology. Vegetable inks were used throughout. Pureprint is a CarbonNeutral®CarbonNeutral® company. Both the manufacturing mill and the printer are registered to the Environmental Management System ISO 14001 and are Forest Stewardship Council®Council® (FSC)chain-of-custody certified.

If you have finished with this document and no longer wish to retain it, please pass it on to other interested readers or dispose of it in your recycled paper waste. Thank you.


UNILEVER N.V. UNILEVER PLC
Head Office and Registered Office Head Office
Weena 455, PO Box 760 100 Victoria Embankment
3000 DK Rotterdam London EC4Y 0DY
The Netherlands United Kingdom
T +31 (0)10 217 4000 T +44 (0)20 7822 5252

Commercial Register Rotterdam

Number: 24051830


Registered Office

Number: 24051830

Unilever PLC

 Port Sunlight
 Wirral
 Merseyside CH62 4ZD
 United Kingdom


Registered in England and Wales

Company Number: 41424

FOR FURTHER INFORMATION ABOUT

UNILEVER PLEASE VISIT OUR WEBSITE:

WWW.UNILEVER.COM

FOR FURTHER INFORMATION ABOUT

UNILEVER PLEASE VISIT OUR WEBSITE:    


WWW.UNILEVER.COM


UNILEVER N.V. —20-F EXHIBIT LIST


Exhibit

Number

 Description of Exhibit
    1.1 Articles of Association of Unilever N.V. 1
    2.1 Trust Deed dated as of July  22, 1994, among Unilever N.V., Unilever PLC, Unilever Capital Corporation, Unilever United States, Inc. and The Law Debenture Trust Corporation p.l.c., relating to Guaranteed Debt Securities 2
    2.2 Twenty-first Supplemental Trust Deed as of April 22, 2016, incorporating the Trust Deed as of July  22, 1994, as Amended and Restated on April 22, 2016 3
    2.3 Amended and Restated Indenture as of September  22, 2014, among Unilever Capital Corporation, Unilever N.V., Unilever PLC, Unilever United States, Inc. and The Bank of New York Mellon, as Trustee, relating to Guaranteed Debt Securities 4
    2.4 Amended and Restated Transfer, Registration, Paying Agent and Shareholder Services Agreement dated as of July  1, 2014 by and among Unilever N.V. and Deutsche Bank Trust Company Americas as U.S. Registrar, Transfer Agent, Paying Agent and Shareholder Services Agent 5
    4.1(a) Equalisation Agreement between Unilever N.V. and Unilever PLC 6
    4.1(b) Deed of Mutual Covenants 7
    4.1(c) Agreement for Mutual Guarantees of Borrowing 8
    4.2 Service Contracts of the Executive Directors of Unilever N.V.
    4.3 Letters regarding compensation of Executive Directors of Unilever N.V.
    4.4 Unilever North America 2002 Omnibus Equity Compensation Plan as Amended and Restated as of November 1, 2012 9
    4.5 The Unilever N.V. International 1997 Executive Share Option Scheme 10
    4.6 The Unilever Long Term Incentive Plan 11
    4.7 Global Share Incentive Plan 2007 12
    4.8 The ManagementCo-Investment Plan 13
    4.9 Unilever Share Plan 2017
  7.1Calculation of Ratio of Earnings to Fixed Charges 14
    8.1 List of Subsidiaries 1415
12.1 Certifications of the Chief Executive Officer and Financial Director/Chief Financial Officer pursuant to Section 302 of the Sarbanes-Oxley Act of 2002
13.1 Certifications of the Chief Executive Officer and Financial Director/Chief Financial Officer pursuant to Section 906 of the Sarbanes-Oxley Act of 2002
15.1 Consent of KPMG LLP and KPMG Accountants N.V.
101.INSXBRL Instance Document
101.SCHXBRL Taxonomy Extension Schema Linkbase Document
101.CALXBRL Taxonomy Extension Calculation Linkbase Document
101.DEFXBRL Taxonomy Extension Definition Linkbase Document
101.LABXBRL Taxonomy Extension Label Linkbase Document
101.PREXBRL Taxonomy Extension Presentation Linkbase Document


Certain instruments which define rights of holders of long-term debt of the Company and its subsidiaries are not being filed because the total amount of securities authorized under each such instrument does not exceed 10% of the total consolidated assets of the Company and its subsidiaries. The Company and its subsidiaries hereby agree to furnish a copy of each such instrument to the Securities and Exchange Commission upon request.


  11.  Incorporated by reference to Exhibit 1.1 of Form20-F (File No:001-04547) filed with the SEC on March 8, 2013.
  22.  Incorporated by reference to Exhibit 2.2 of Form20-F (File No:001-04547) filed with the SEC on February 27, 2003.
  33.  Incorporated by reference to Exhibit 2.2 of Form20-F (File no:001-04547) filed with the SEC on February 18, 2017
  44.  Incorporated by reference to Exhibit 2.3 of Form20-F (File No:001-04547) filed with the SEC on March 6, 2015.
  55.  Incorporated by reference to Exhibit 2.4 of Form20-F (File No:001-04547) filed with the SEC on March 6, 2015.
  66.  Incorporated by reference to Exhibit 4.1 of Form20-F (File No:001-04547) filed with the SEC on March 5, 2010.
  77.  Incorporated by reference to Exhibit 4.1(b) of Form20-F (File No:001-04547) filed with the SEC on March 6, 2015.
  88.  Incorporated by reference to Exhibit 4.1(c) of Form20-F (File No:001-04547) filed with the SEC on March 6, 2015
  99.  Incorporated by reference to Exhibit 99.1 of FormS-8 (File No:333-185299) filed with the SEC on December 6, 2012.


1010.  Incorporated by reference to Exhibit 4.5 of Form20-F (File No:001-04547) filed with the SEC on March 28, 2002.
1111.  Incorporated by reference to Exhibit 4.7 of Form20-F (File No:001-04547) filed with the SEC on March 28, 2002.


12
12.  Incorporated by reference to Exhibit 4.7 of Form20-F (File No:001-04547) filed with the SEC on March 26, 2008.
1313.  Incorporated by reference to Exhibit 4.8 of Form20-F (File No:001-04547) filed with the SEC on March 4, 2011.
1414.Incorporated by reference to Exhibit 4.9 of Form20-F (File No:001-04547) filed with the SEC on February 28, 2018.
15.  The required information is set forth on pages 138 to 145 of the Annual Report on Form20-F 2017. 2018.


SIGNATURES

The registrant hereby certifies that it meets all of the requirements for filing on Form20-F and that it has duly caused and authorised the undersigned to sign this Annual Report on its behalf.

Unilever N.V.

(Registrant)


/s/ R.SotamaaR. Sotamaa

R SOTAMAA,
Chief Legal Officer and Group Secretary

Date: 28 February 201811 March 2019