The following table summarizes information concerning our investment assets as of December 31, 2015, 20162017, 2018 and 2017.2019.
| As of December 31, | As of December 31, | |||||||||||||||||||||||||||||||||||||||||||||||
| 2015 | 2016 | 2017 | 2017 | 2018 | 2019 | |||||||||||||||||||||||||||||||||||||||||||
| Carrying value | % of total | Carrying value | % of total | Carrying value | % of total | Carrying value | % of total | Carrying value | % of total | Carrying value | % of total | |||||||||||||||||||||||||||||||||||||
| (RMB in millions, except as otherwise indicated) | (RMB in millions, except as otherwise indicated) | |||||||||||||||||||||||||||||||||||||||||||||||
Cash and cash equivalents | 76,096 | 3.3 | % | 67,046 | 2.7 | % | 48,586 | 1.9 | % | 48,586 | 1.8 | % | 50,809 | 1.6 | % | 53,306 | 1.5 | % | ||||||||||||||||||||||||||||||
Term deposits | 562,622 | 24.6 | % | 538,325 | 21.9 | % | 449,400 | 17.3 | % | 449,400 | 16.3 | % | 559,341 | 18.0 | % | 535,260 | 15.0 | % | ||||||||||||||||||||||||||||||
Statutory deposits—restricted | 6,333 | 0.3 | % | 6,333 | 0.3 | % | 6,333 | 0.2 | % | 6,333 | 0.2 | % | 6,333 | 0.2 | % | 6,333 | 0.2 | % | ||||||||||||||||||||||||||||||
Debt securities,held-to-maturity | 504,075 | 22.0 | % | 594,730 | 24.2 | % | 717,037 | 27.7 | % | 717,037 | 26.1 | % | 806,717 | 26.1 | % | 928,751 | 26.0 | % | ||||||||||||||||||||||||||||||
Debt securities,available-for-sale | 401,899 | 17.6 | % | 399,758 | 16.3 | % | 455,124 | 17.6 | % | 455,124 | 16.5 | % | 496,590 | 16.0 | % | 509,791 | 14.3 | % | ||||||||||||||||||||||||||||||
Debt securities, securities at fair value through profit or loss | 94,984 | 4.2 | % | 154,406 | 6.3 | % | 82,891 | 3.2 | % | 82,891 | 3.0 | % | 88,003 | 2.8 | % | 85,206 | 2.4 | % | ||||||||||||||||||||||||||||||
Debt securities | 1,000,958 | 43.8 | % | 1,148,894 | 46.8 | % | 1,255,052 | 48.5 | % | 1,255,052 | 45.6 | % | 1,391,310 | 44.9 | % | 1,523,748 | 42.7 | % | ||||||||||||||||||||||||||||||
|
|
|
|
|
|
|
|
|
|
|
| |||||||||||||||||||||||||||||||||||||
Loans | 207,267 | 9.0 | % | 226,573 | 9.3 | % | 383,504 | 14.8 | % | 383,504 | 13.9 | % | 450,251 | 14.5 | % | 608,920 | 17.0 | % | ||||||||||||||||||||||||||||||
Equity securities, available for sale | 368,617 | 16.1 | % | 366,665 | 14.9 | % | 355,610 | �� | 13.7 | % | 355,610 | 12.9 | % | 373,943 | 12.1 | % | 549,166 | 15.4 | % | |||||||||||||||||||||||||||||
Equity securities, securities at fair value through profit or loss | 43,006 | 1.9 | % | 54,718 | 2.2 | % | 53,918 | 2.1 | % | 53,918 | 2.0 | % | 50,714 | 1.6 | % | 56,402 | 1.6 | % | ||||||||||||||||||||||||||||||
Equity securities | 411,623 | 18.0 | % | 421,383 | 17.2 | % | 409,528 | 15.8 | % | 409,528 | 14.9 | % | 424,657 | 13.7 | % | 605,568 | 17.0 | % | ||||||||||||||||||||||||||||||
|
|
|
|
|
|
|
|
|
|
|
| |||||||||||||||||||||||||||||||||||||
Derivative financial assets | — | — | — | — | 428 | 0.0 | % | |||||||||||||||||||||||||||||||||||||||||
Resale agreements | 21,503 | 0.9 | % | 43,538 | 1.8 | % | 36,185 | 1.4 | % | 36,185 | 1.3 | % | 9,905 | 0.3 | % | 4,467 | 0.1 | % | ||||||||||||||||||||||||||||||
Investment properties | 1,237 | 0.1 | % | 1,191 | 0.0 | % | 3,064 | 0.1 | % | 3,064 | 0.1 | % | 9,747 | 0.3 | % | 12,141 | 0.3 | % | ||||||||||||||||||||||||||||||
Investments in associates and joint ventures | 161,472 | 5.9 | % | 201,661 | 6.5 | % | 222,983 | 6.2 | % | |||||||||||||||||||||||||||||||||||||||
|
|
|
|
|
|
|
|
|
|
|
| |||||||||||||||||||||||||||||||||||||
Total investment assets | 2,287,639 | 100 | % | 2,453,283 | 100.0 | % | 2,591,652 | 100.0 | % | 2,753,124 | 100.0 | % | 3,104,014 | 100.0 | % | 3,573,154 | 100.0 | % | ||||||||||||||||||||||||||||||
|
|
|
|
|
|
|
|
|
|
|
| |||||||||||||||||||||||||||||||||||||
Average investment assets balance | 2,194,255 | 2,370,461 | 2,522,468 | 2,633,087 | 2,928,569 | 3,338,584 | ||||||||||||||||||||||||||||||||||||||||||
Risk management
Our primary investment objective is to pursue optimal investment yields while considering macroeconomic factors, risk control and regulatory requirements. We are exposed to five primary sources of investment risk:
interest rate risk, relating to the market price and cash flow variability associated with changes in interest rates;
credit risk, relating to the uncertainty associated with the continued ability of a given obligor to make timely payments of principal and interest;
market valuation risk, relating to the changes in market value for our investments, particularly our securities investment fund holdings and shares listed on the Chinese securities exchanges, which are denominated and traded in Renminbi;
currency exchange risk, relating to the impact of changes in the value of the Renminbi against the U.S. dollar and other currencies on the value of our investments.
Our investment assets are principally comprised of fixed income securities and term deposits, and therefore changes in interest rates have a significant impact on the rate of our investment return.We manage interest rate risk through adjustments to our portfolio mix and terms, and by managing, to the extent possible, the average duration and maturity of our assets and liabilities. However, because of the general lack of long-term fixed income securities in the Chinese financial markets, the duration of some of our assets is lower than our liabilities. We believe that with the development of China’s financial markets and the gradual easing of our investment restrictions, our ability to match our assets to our liabilities will improve. Although we have been approved to enter into interest rate swaps, it is still not an effective means for us to hedge our interest rate risk as the Chinese interest rate swap market is still in the early stages of development.
We believe we have a relatively low credit risk, because we mainly invest in fixed income products with high credit ratings. We monitor our credit risk throughin-house fundamental analysis of the Chinese economy and the underlying obligors and transaction structures.
We are subject to market valuation risk, particularly because of the relative lack of stability of China’s bond and stock markets are more volatile than developed markets. We manage valuation risk through industry and issuer diversification and asset allocation.
Since substantially all of our investments are made in China, we are exposed to the effect of changes in the Chinese economy and other factors which affect the Chinese banking industry and securities markets.
We are also subject to market liquidity risk for many of the debt securities investments we make, due to the size of our investments in relation to the overall market. We manage liquidity risk through selection of liquid assets and through asset diversification. In addition, we view fundraising through repurchase agreements as a way of managing our short-term liquidity risk.
Our ability to manage our investment risks is limited by the investment restrictions placed on us and the lack of sophisticated investment vehicles for risk management in China’s capital markets.The CBIRC (formerly CIRC) allows insurance companies to invest in financial derivative products with the aim to hedge and reduce investment risks. We are considering these alternative ways of investing to further improve our risk management.
Our assets held in foreign currencies are subject to foreign exchange risks resulting from the fluctuations of the value of the Renminbi against the U.S. dollar and other foreign currencies. Our overseas investments are denominated in U.S. dollar, and we have hedged a portion of our investments held innon-US currencies to reduce our foreign exchange risks.
As we are approved by the CIRC to invest our assets held in foreign currencies in overseas financial markets, the return from overseas investments could, to a certain extent, reduce the foreign exchange risks we are exposed to.
For further information on our management of interest rate risk and market valuation risk, see “Item 11. Quantitative and Qualitative Disclosures about Market Risk”.
Investment results
Our investment yields for the years ended December 31, 2019, 2018 and 2017 2016were 5.24%,3.29%, and 2015 were 5.16%, 4.61% and 6.47%, respectively.Beginning in 2017,2018, we revised the formula to calculate our investment yield has been revised to consider the impact of repurchase transactionsinvestments in associates and joint ventures on our investment yield, and thereforeyield. The investment yieldsyield for the fiscal years ended December 31, 2016 and December 31, 2015 have2017 has also been revised to conform to the revised formula.
The following table sets forth the yields on average assets for each major component of our investment portfolios for the periods indicated.
| As of or for the years ended December 31, | ||||||||||||||||||||||||
| 2015 | 2016 | 2017 | ||||||||||||||||||||||
| Yield (1) | Amount | Yield (1) | Amount | Yield (1) | Amount | |||||||||||||||||||
| (RMB in millions, except as otherwise indicated) | ||||||||||||||||||||||||
Cash, cash equivalents, statutory deposits and term deposits: | ||||||||||||||||||||||||
Investment income | 4.7 | % | 32,285 | 4.4 | % | 27,851 | 4.3 | % | 23,827 | |||||||||||||||
Ending assets: cash and cash equivalents | 76,096 | 67,046 | 48,586 | |||||||||||||||||||||
Ending assets: statutory deposits—restricted | 6,333 | 6,333 | 6,333 | |||||||||||||||||||||
Ending assets: term deposits | 562,622 | 538,325 | 449,400 | |||||||||||||||||||||
|
|
|
|
|
| |||||||||||||||||||
Ending assets | 645,051 | 611,704 | 504,319 | |||||||||||||||||||||
Debt securities: | ||||||||||||||||||||||||
Investment income | 44,449 | 48,036 | 53,895 | |||||||||||||||||||||
Net realized gains on financial assets | (4 | ) | 46 | (123 | ) | |||||||||||||||||||
Net fair value gains through profit or loss | 766 | (918 | ) | (1,542 | ) | |||||||||||||||||||
|
|
|
|
|
| |||||||||||||||||||
Total | 4.7 | % | 45,211 | 4.4 | % | 47,164 | 4.3 | % | 52,230 | |||||||||||||||
Ending assets | 1,000,958 | 1,148,894 | 1,255,052 | |||||||||||||||||||||
Loans: | ||||||||||||||||||||||||
Investment income | 5.9 | % | 11,115 | 5.5 | % | 12,018 | 5.4 | % | 16,320 | |||||||||||||||
Ending assets | 207,267 | 226,573 | 383,504 | |||||||||||||||||||||
Equity securities: | ||||||||||||||||||||||||
Investment income | 9,276 | 20,271 | 27,939 | |||||||||||||||||||||
Net realized gains on financial assets | 32,301 | 5,992 | 165 | |||||||||||||||||||||
Net fair value gains through profit or loss | 9,324 | (6,319 | ) | 8,179 | ||||||||||||||||||||
|
|
|
|
|
| |||||||||||||||||||
Total | 15.7 | % | 50,901 | 4.8 | % | 19,944 | 8.7 | % | 36,283 | |||||||||||||||
Ending assets | 411,623 | 421,383 | 409,528 | |||||||||||||||||||||
Resale agreements: | ||||||||||||||||||||||||
Investment income | 2.2 | % | 368 | 3.0 | % | 971 | 1.9 | % | 746 | |||||||||||||||
Ending assets | 21,503 | 43,538 | 36,185 | |||||||||||||||||||||
Investments properties: | ||||||||||||||||||||||||
Investment income | 5.7 | % | 72 | 4.9 | % | 60 | 3.2 | % | 69 | |||||||||||||||
Ending assets | 1,237 | 1,191 | 3,064 | |||||||||||||||||||||
Securities sold under agreements to repurchase: | ||||||||||||||||||||||||
Interest expense | (2.0 | %) | (784 | ) | (2.6 | %) | (1,460 | ) | (3.7 | %) | (3,144 | ) | ||||||||||||
Ending liabilities | 31,354 | 81,088 | 87,309 | |||||||||||||||||||||
Total investments: | ||||||||||||||||||||||||
Investment income | 97,582 | 109,147 | 122,727 | |||||||||||||||||||||
Net realized gains on financial assets | 32,297 | 6,038 | 42 | |||||||||||||||||||||
Net fair value gains through profit or loss | 10,209 | (7,094 | ) | 6,183 | ||||||||||||||||||||
| As of or for the years ended December 31, | As of or for the years ended December 31, | |||||||||||||||||||||||||||||||||||||||||||||||
| 2015 | 2016 | 2017 | 2017 | 2018 | 2019 | |||||||||||||||||||||||||||||||||||||||||||
| Yield (1) | Amount | Yield (1) | Amount | Yield (1) | Amount | Yield (1) | Amount | Yield (1) | Amount | Yield (1) | Amount | |||||||||||||||||||||||||||||||||||||
| (RMB in millions, except as otherwise indicated) | ||||||||||||||||||||||||||||||||||||||||||||||||
Cash, cash equivalents, statutory deposits and term deposits: | Cash, cash equivalents, statutory deposits and term deposits: |
| ||||||||||||||||||||||||||||||||||||||||||||||
Investment income | 4.3 | % | 23,827 | 4.1 | % | 22,699 | 4.4 | % | 26,695 | |||||||||||||||||||||||||||||||||||||||
Ending assets: cash and cash equivalents | 48,586 | 50,809 | 53,306 | |||||||||||||||||||||||||||||||||||||||||||||
Ending assets: statutory deposits—restricted | 6,333 | 6,333 | 6,333 | |||||||||||||||||||||||||||||||||||||||||||||
Ending assets: term deposits | 449,400 | 559,341 | 535,260 | |||||||||||||||||||||||||||||||||||||||||||||
|
|
| ||||||||||||||||||||||||||||||||||||||||||||||
Ending assets | 504,319 | 616,483 | 594,899 | |||||||||||||||||||||||||||||||||||||||||||||
Debt securities: | ||||||||||||||||||||||||||||||||||||||||||||||||
Investment income | 53,895 | 61,517 | 63,148 | |||||||||||||||||||||||||||||||||||||||||||||
Net realized gains on financial assets | (123 | ) | 357 | (35 | ) | |||||||||||||||||||||||||||||||||||||||||||
Net fair value gains through profit or loss | (1,542 | ) | 2,006 | 778 | ||||||||||||||||||||||||||||||||||||||||||||
|
|
| ||||||||||||||||||||||||||||||||||||||||||||||
Total | 4.3 | % | 52,230 | 4.8 | % | 63,880 | 4.4 | % | 63,891 | |||||||||||||||||||||||||||||||||||||||
Ending assets | 1,255,052 | 1,391,310 | 1,523,748 | |||||||||||||||||||||||||||||||||||||||||||||
Loans: | ||||||||||||||||||||||||||||||||||||||||||||||||
Investment income | 5.4 | % | 16,320 | 5.5 | % | 22,894 | 5.1 | % | 27,111 | |||||||||||||||||||||||||||||||||||||||
Ending assets | 383,504 | 450,251 | 608,920 | |||||||||||||||||||||||||||||||||||||||||||||
Equity securities: | ||||||||||||||||||||||||||||||||||||||||||||||||
Investment income | 27,939 | 17,776 | 22,804 | |||||||||||||||||||||||||||||||||||||||||||||
Net realized gains on financial assets | 165 | (19,948 | ) | 1,866 | ||||||||||||||||||||||||||||||||||||||||||||
Net fair value gains through profit or loss | 8,179 | (18,938 | ) | 18,279 | ||||||||||||||||||||||||||||||||||||||||||||
|
|
| ||||||||||||||||||||||||||||||||||||||||||||||
Total | 8.7 | % | 36,283 | (5.1 | %) | (21,110 | ) | 8.3 | % | 42,949 | ||||||||||||||||||||||||||||||||||||||
Ending assets | 409,528 | 424,657 | 605,568 | |||||||||||||||||||||||||||||||||||||||||||||
Resale agreements: | ||||||||||||||||||||||||||||||||||||||||||||||||
Investment income | 1.9 | % | 746 | 1.2 | % | 281 | 2.2 | % | 161 | |||||||||||||||||||||||||||||||||||||||
Ending assets | 36,185 | 9,905 | 4,467 | |||||||||||||||||||||||||||||||||||||||||||||
Investments properties: | ||||||||||||||||||||||||||||||||||||||||||||||||
Income of investments properties | 3.2 | % | 69 | 1.6 | % | 105 | 0.3 | % | 31 | |||||||||||||||||||||||||||||||||||||||
Ending assets | 3,064 | 9,747 | 12,141 | |||||||||||||||||||||||||||||||||||||||||||||
Investments in associates and joint ventures: | ||||||||||||||||||||||||||||||||||||||||||||||||
Net gains on investments of associates and joint ventures | 5.1 | % | 7,143 | 4.3 | % | 7,745 | 3.8 | % | 8,011 | |||||||||||||||||||||||||||||||||||||||
Ending assets | 161,472 | 201,661 | 222,983 | |||||||||||||||||||||||||||||||||||||||||||||
Securities sold under agreements to repurchase: | ||||||||||||||||||||||||||||||||||||||||||||||||
Interest expense | (3.7 | %) | (3,144 | ) | (2.6 | %) | (3,565 | ) | (1.5 | %) | (2,392 | ) | ||||||||||||||||||||||||||||||||||||
Ending liabilities | 87,309 | 192,141 | 118,088 | |||||||||||||||||||||||||||||||||||||||||||||
Total investments: | ||||||||||||||||||||||||||||||||||||||||||||||||
Investment income | 122,727 | 125,167 | 139,919 | |||||||||||||||||||||||||||||||||||||||||||||
Net realized gains on financial assets | 42 | (19,591 | ) | 1,831 | ||||||||||||||||||||||||||||||||||||||||||||
Net fair value gains through profit or loss | 6,183 | (18,278 | ) | 19,251 | ||||||||||||||||||||||||||||||||||||||||||||
Income of Investments properties | 72 | 60 | 69 | 69 | 105 | 31 | ||||||||||||||||||||||||||||||||||||||||||
Net gains on investments of associates and joint ventures | 7,143 | 7,745 | 8,011 | |||||||||||||||||||||||||||||||||||||||||||||
Interest expense of securities sold under agreements to repurchase | (784 | ) | (1,460 | ) | (3,144 | ) | (3,144 | ) | (3,565 | ) | (2,392 | ) | ||||||||||||||||||||||||||||||||||||
Total | 6.47 | % | 139,376 | 4.61 | % | 106,691 | 5.16 | % | 125,877 | 5.16 | % | 133,020 | 3.29 | % | 91,583 | 5.24 | % | 166,651 | ||||||||||||||||||||||||||||||
Ending assets excluding securities sold under agreements to repurchase | 2,256,285 | 2,372,195 | 2,504,343 | 2,665,815 | 2,911,873 | 3,455,066 | ||||||||||||||||||||||||||||||||||||||||||
| (1) | Yields for |
Term deposits
Term deposits consist principally of term deposits with Chinese commercial banking institutions and represented 17.3%15.0% of our total investment assets as of December 31, 2017, 21.9%2019, 18.0% of our total investment assets as of December 31, 20162018 and 24.6%16.3% of our total investment assets as of December 31, 2015.2017.
We generally makeplace term deposits with state-owned commercial banks and large joint stock commercial banks. The terms of the term deposits vary. They typically allow us to renegotiate terms with the banks upon prepayment, including the methods for the calculation of accrued interest, if any. We make large term deposits to obtain higher yields than can ordinarily be obtained with regular deposits.
The following table sets forth term deposits by contractual maturity dates, as of the dates indicated.
| As of December 31, | As of December 31, | |||||||||||||||||||||||
| 2015 | 2016 | 2017 | 2017 | 2018 | 2019 | |||||||||||||||||||
| Amortized cost | Amortized cost | Amortized cost | Amortized cost | Amortized cost | Amortized cost | |||||||||||||||||||
| (RMB in millions) | (RMB in millions) | |||||||||||||||||||||||
Due in one year or less | 181,780 | 185,835 | 97,076 | 97,076 | 158,920 | 107,039 | ||||||||||||||||||
Due after one year and through five years | 380,842 | 344,790 | 349,524 | 349,524 | 323,021 | 420,191 | ||||||||||||||||||
Due after five years and through ten years | — | 7,700 | 2,800 | 2,800 | 77,400 | 8,030 | ||||||||||||||||||
|
|
|
|
|
| |||||||||||||||||||
Total term deposits | 562,622 | 538,325 | 449,400 | 449,400 | 559,341 | 535,260 | ||||||||||||||||||
|
|
|
|
|
| |||||||||||||||||||
The following table sets forth term deposits outstanding to Chinese banking institutions as of the dates indicated.
| As of December 31, | As of December 31, | |||||||||||||||||||||||
| 2015 | 2016 | 2017 | 2017 | 2018 | 2019 | |||||||||||||||||||
| Amortized cost | Amortized cost | Amortized cost | Amortized cost | Amortized cost | Amortized cost | |||||||||||||||||||
| (RMB in millions) | (RMB in millions) | |||||||||||||||||||||||
Industrial & Commercial Bank of China | 21,341 | 21,210 | 10,819 | 10,819 | 5,378 | 3,205 | ||||||||||||||||||
Agriculture Bank of China | 133,409 | 110,242 | 50,819 | 50,819 | 42,264 | 49,089 | ||||||||||||||||||
Bank of China | 118,931 | 70,792 | 43,625 | 43,625 | 40,000 | 40,000 | ||||||||||||||||||
China Construction Bank | 24,212 | 42,750 | 26,070 | 26,070 | 25,200 | 5,200 | ||||||||||||||||||
Bank of Communications | 100,432 | 121,142 | 132,922 | 132,922 | 200,534 | 135,950 | ||||||||||||||||||
Other banks | 164,297 | 172,189 | 185,145 | 185,145 | 245,965 | 301,816 | ||||||||||||||||||
|
|
|
|
|
| |||||||||||||||||||
Total term deposits | 562,622 | 538,325 | 449,400 | 449,400 | 559,341 | 535,260 | ||||||||||||||||||
|
|
|
|
|
| |||||||||||||||||||
Debt securities
Debt securities in which we are permitted to invest mainly consist of the following categories:
Chinese government bonds;
government agency bonds (including local government bonds issued and repaid by the MOF as agent, central bank notes, financial bonds issued by Chinese state-owned policy banks of the Chinese government, andRMB-denominated bonds issued by international development institutions);
corporate bonds (including financial bonds issued by commercial banks, corporate bonds, convertible corporate bonds, short-term financing bonds and medium-term notes); and
subordinated bonds and debt (including subordinated bonds issued by Chinese state-owned policy banks, of the Chinese government, subordinated bonds issued by commercial banks, subordinated debt with fixed terms issued by commercial banks and subordinated debt with fixed terms issued by insurance companies); and
tier 2 capital bonds and perpetual capital bonds (including tier 2 capital bonds and perpetual capital bonds issued by Chinese state-owned policy banks, and tier 2 capital bonds and perpetual capital bonds issued by qualified commercial banks).
Debt securities represented 48.5%42.7% of our total investment assets as of December 31, 2017, 46.8%2019, 44.9% of our total investment assets as of December 31, 20162018 and 43.8%45.6% of our total investment assets as of December 31, 2015.2017.
Based on estimated fair value, Chinese government bonds, Chinese government agency bonds, corporate bonds, subordinated bonds and debt and other debt securities comprised 5.4%4.7%, 34.7%33.6%, 43.3%29.1%, 3.0%10.6% and 13.6% of our total available–for-sale debt securities as of December 31, 2017, 5.4%, 36.6%, 47.1%, 4.2% and 6.7%22.0% of our totalavailable-for-sale debt securities as of December 31, 20162019, 5.7%, 36.3%,37.5%,4.3% and 6.4%, 36.2%, 51.4%, 4.8% and 1.2% 16.2%of our totalavailable-for-sale debt securities as of December 31, 2015.2018 and 5.4%, 34.7%, 43.3%, 3.0% and 13.6% of our totalavailable-for-sale debt securities as of December 31, 2017. Except for a small number of debt securities, which collectively had a carrying value of RMB 45,35241,650 million (US$ 6,970million)5,983 million) as of December 31, 2017,2019, most of our debt securities are traded on security exchanges or in the unlisted interbank market in China.
We mainly invest in secured bonds and unsecured bonds rated AA or above by the rating agencies recognized by the CIRC,CBIRC, such as China Chengxin International Credit Rating Co., Ltd,Ltd., or Chengxin International, and Dagong GlobalChina Lianhe Credit Rating Agency,Co., Ltd., or Dagong.Lianhe Credit. We also invest in short-term financing bonds ratedA-2 or above.
Chengxin International is a member of Moody’s Investors Service Inc., with Moody’s owning 30% equity interest in Chengxin International. Chengxin International created its own rating structures by making reference to the rating structures and experience of Moody’s and Fitch Ratings. AAA is the highest rating. Other approved rating agencies, such as Dagong,Lianhe Credit, have similar rating structures. Ratings given by these entities are not directly comparable to ratings given by U.S. rating agencies.
The following table sets forth the amortized cost and estimated fair value of debt securities, as of the dates indicated.
| As of December 31, | As of December 31, | |||||||||||||||||||||||||||||||||||||||||||||||||||||||||||||||||||||||||||||||||||||||||||||||
| 2015 | 2016 | 2017 | 2017 | 2018 | 2019 | |||||||||||||||||||||||||||||||||||||||||||||||||||||||||||||||||||||||||||||||||||||||||||
| Amortized cost | % of total | Estimated fair value | % of total | Amortized cost | % of total | Estimated fair value | % of total | Amortized cost | % of total | Estimated fair value | % of total | Amortized cost | % of total | Estimated fair value | % of total | Amortized cost | % of total | Estimated fair value | % of total | Amortized cost | % of total | Estimated fair value | % of total | |||||||||||||||||||||||||||||||||||||||||||||||||||||||||||||||||||||||||
| (RMB in millions) | (RMB in millions) | |||||||||||||||||||||||||||||||||||||||||||||||||||||||||||||||||||||||||||||||||||||||||||||||
Debt securities,available-for-sale: | Debt securities,available-for-sale: |
| ||||||||||||||||||||||||||||||||||||||||||||||||||||||||||||||||||||||||||||||||||||||||||||||
Government bonds | 23,750 | 2.5 | % | 25,713 | 2.5 | % | 20,173 | 1.8 | % | 21,653 | 1.8 | % | 24,818 | 2.0 | % | 24,632 | 2.0 | % | 24,818 | 2.0 | % | 24,632 | 2.0 | % | 26,759 | 1.9 | % | 28,440 | 2.0 | % | 22,500 | 1.5 | % | 23,758 | 1.5 | % | ||||||||||||||||||||||||||||||||||||||||||||||||||||||||||||
Government agency bonds | 164,331 | 13.0 | % | 157,765 | 12.8 | % | 172,250 | 12.5 | % | 180,273 | 12.6 | % | 163,678 | 10.9 | % | 171,189 | 10.9 | % | ||||||||||||||||||||||||||||||||||||||||||||||||||||||||||||||||||||||||||||||
Corporate bonds | 199,613 | 15.7 | % | 197,133 | 16.1 | % | 181,178 | 13.2 | % | 185,720 | 13.1 | % | 145,033 | 9.6 | % | 148,455 | 9.5 | % | ||||||||||||||||||||||||||||||||||||||||||||||||||||||||||||||||||||||||||||||
Subordinated bonds/debt | 13,588 | 1.1 | % | 13,495 | 1.1 | % | 20,953 | 1.5 | % | 21,514 | 1.5 | % | 53,062 | 3.5 | % | 53,922 | 3.4 | % | ||||||||||||||||||||||||||||||||||||||||||||||||||||||||||||||||||||||||||||||
Others | 62,651 | 4.9 | % | 62,099 | 5.0 | % | 78,136 | 5.8 | % | 80,643 | 5.6 | % | 109,729 | 7.3 | % | 112,467 | 7.3 | % | ||||||||||||||||||||||||||||||||||||||||||||||||||||||||||||||||||||||||||||||
|
|
|
|
|
|
|
|
|
|
|
| |||||||||||||||||||||||||||||||||||||||||||||||||||||||||||||||||||||||||||||||||||||
Total debt securities,available-for-sale | 465,001 | 36.7 | % | 455,124 | 37.0 | % | 479,276 | 34.9 | % | 496,590 | 34.8 | % | 494,002 | 32.8 | % | 509,791 | 32.6 | % | ||||||||||||||||||||||||||||||||||||||||||||||||||||||||||||||||||||||||||||||
|
|
|
|
|
|
|
|
|
|
|
| |||||||||||||||||||||||||||||||||||||||||||||||||||||||||||||||||||||||||||||||||||||
Debt securities, held to maturity: | ||||||||||||||||||||||||||||||||||||||||||||||||||||||||||||||||||||||||||||||||||||||||||||||||
Government bonds | 125,866 | 9.9 | % | 123,712 | 10.0 | % | 179,943 | 13.1 | % | 191,009 | 13.4 | % | 215,928 | 14.3 | % | 228,198 | 14.6 | % | ||||||||||||||||||||||||||||||||||||||||||||||||||||||||||||||||||||||||||||||
Government agency bonds | 241,808 | 19.1 | % | 223,313 | 18.2 | % | 266,986 | 19.4 | % | 276,484 | 19.3 | % | 401,799 | 26.6 | % | 415,013 | 26.6 | % | ||||||||||||||||||||||||||||||||||||||||||||||||||||||||||||||||||||||||||||||
Corporate bonds | 200,869 | 15.9 | % | 196,536 | 16.0 | % | 212,709 | 15.5 | % | 220,267 | 15.4 | % | 198,322 | 13.2 | % | 206,793 | 13.2 | % | ||||||||||||||||||||||||||||||||||||||||||||||||||||||||||||||||||||||||||||||
Subordinated bonds/debt | 148,494 | 11.7 | % | 149,423 | 12.1 | % | 147,079 | 10.7 | % | 155,783 | 10.9 | % | 112,702 | 7.5 | % | 118,571 | 7.6 | % | ||||||||||||||||||||||||||||||||||||||||||||||||||||||||||||||||||||||||||||||
|
|
|
|
|
|
|
|
|
|
|
| |||||||||||||||||||||||||||||||||||||||||||||||||||||||||||||||||||||||||||||||||||||
Total debt securities, held to maturity | 717,037 | 56.6 | % | 692,984 | 56.3 | % | 806,717 | 58.7 | % | 843,543 | 59.0 | % | 928,751 | 61.6 | % | 968,575 | 62.0 | % | ||||||||||||||||||||||||||||||||||||||||||||||||||||||||||||||||||||||||||||||
|
|
|
|
|
|
|
|
|
|
|
| |||||||||||||||||||||||||||||||||||||||||||||||||||||||||||||||||||||||||||||||||||||
Debt securities, securities at fair value through profit or loss | ||||||||||||||||||||||||||||||||||||||||||||||||||||||||||||||||||||||||||||||||||||||||||||||||
Government bonds | 2,139 | 0.2 | % | 2,081 | 0.2 | % | 118 | 0.0 | % | 118 | 0.0 | % | 41 | 0.0 | % | 41 | 0.0 | % | ||||||||||||||||||||||||||||||||||||||||||||||||||||||||||||||||||||||||||||||
Government agency bonds | 9,463 | 0.7 | % | 9,084 | 0.7 | % | 6,639 | 0.5 | % | 6,760 | 0.5 | % | 6,829 | 0.5 | % | 6,859 | 0.4 | % | ||||||||||||||||||||||||||||||||||||||||||||||||||||||||||||||||||||||||||||||
Corporate bonds | 68,401 | 5.4 | % | 66,915 | 5.4 | % | 79,390 | 5.8 | % | 79,774 | 5.6 | % | 76,395 | 5.0 | % | 77,215 | 4.9 | % | ||||||||||||||||||||||||||||||||||||||||||||||||||||||||||||||||||||||||||||||
Others | 4,819 | 0.4 | % | 4,811 | 0.4 | % | 1,346 | 0.1 | % | 1,351 | 0.1 | % | 1,083 | 0.1 | % | 1,091 | 0.1 | % | ||||||||||||||||||||||||||||||||||||||||||||||||||||||||||||||||||||||||||||||
Total debt securities, securities at fair value through profit or loss | 84,822 | 6.7 | % | 82,891 | 6.7 | % | 87,493 | 6.4 | % | 88,003 | 6.2 | % | 84,348 | 5.6 | % | 85,206 | 5.4 | % | ||||||||||||||||||||||||||||||||||||||||||||||||||||||||||||||||||||||||||||||
|
|
|
|
|
|
|
|
|
|
|
| |||||||||||||||||||||||||||||||||||||||||||||||||||||||||||||||||||||||||||||||||||||
Total debt securities | 1,266,860 | 100.0 | % | 1,230,999 | 100.0 | % | 1,373,486 | 100.0 | % | 1,428,136 | 100.0 | % | 1,507,101 | 100.0 | % | 1,563,572 | 100.0 | % | ||||||||||||||||||||||||||||||||||||||||||||||||||||||||||||||||||||||||||||||
|
|
|
|
|
|
|
|
|
|
|
| |||||||||||||||||||||||||||||||||||||||||||||||||||||||||||||||||||||||||||||||||||||
Government agency bonds Corporate bonds Subordinated bonds/debt Others Total debt securities,available-for-sale Debt securities, held to maturity: Government bonds Government agency bonds Corporate bonds Subordinated bonds/debt Total debt securities, held to maturity Debt securities, securities at fair value through profit or loss Government bonds Government agency bonds Corporate bonds Others Total debt securities, securities at fair value through profit or loss Total debt securities As of December 31, 2015 2016 2017 Amortized
cost % of
total Estimated
fair value % of
total Amortized
cost % of
total Estimated
fair value % of
total Amortized
cost % of
total Estimated
fair value % of
total (RMB in millions) 134,021 13.9 % 145,399 13.9 % 140,444 12.4 % 146,310 12.5 % 164,331 13.0 % 157,765 12.8 % 196,408 20.4 % 206,767 19.7 % 183,408 16.1 % 188,337 16.1 % 199,613 15.7 % 197,133 16.1 % 17,771 1.9 % 19,298 1.8 % 15,948 1.4 % 16,708 1.4 % 13,588 1.1 % 13,495 1.1 % 4,723 0.5 % 4,722 0.5 % 26,773 2.3 % 26,750 2.3 % 62,651 4.9 % 62,099 5.0 % 376,673 39.2 % 401,899 38.4 % 386,746 34.0 % 399,758 34.1 % 465,001 36.7 % 455,124 37.0 % 79,438 8.3 % 87,340 8.3 % 97,196 8.6 % 102,595 8.7 % 125,866 9.9 % 123,712 10.0 % 126,097 13.1 % 136,927 13.1 % 169,001 14.9 % 173,036 14.7 % 241,808 19.1 % 223,313 18.2 % 146,405 15.2 % 159,223 15.2 % 178,444 15.7 % 184,461 15.7 % 200,869 15.9 % 196,536 16.0 % 152,135 15.8 % 167,354 16.0 % 150,089 13.2 % 159,060 13.6 % 148,494 11.7 % 149,423 12.1 % 504,075 52.4 % 550,844 52.6 % 594,730 52.4 % 619,152 52.7 % 717,037 56.6 % 692,984 56.3 % 401 0.0 % 603 0.1 % 381 0.0 % 380 0.0 % 2,139 0.2 % 2,081 0.2 % 5,262 0.6 % 5,689 0.5 % 6,800 0.6 % 6,762 0.6 % 9,463 0.7 % 9,084 0.7 % 74,359 7.8 % 88,291 8.4 % 144,596 12.7 % 144,131 12.3 % 68,401 5.4 % 66,915 5.4 % 394 0.0 % 401 0.0 % 3,133 0.3 % 3,133 0.3 % 4,819 0.4 % 4,811 0.4 % 80,416 8.4 % 94,984 9.0 % 154,910 13.6 % 154,406 13.2 % 84,822 6.7 % 82,891 6.7 % 961,164 100.0 % 1,047,727 100.0 %�� 1,136,386 100.0 % 1,173,316 100.0 % 1,266,860 100.0 % 1,230,999 100.0 %
The following table shows the amortized cost and estimated fair value of debt securities excluding securities at fair value through profit or loss by contractual maturity dates, as of the dates indicated.
| As of December 31, | As of December 31, | |||||||||||||||||||||||||||||||||||||||||||||||
| 2015 | 2016 | 2017 | 2017 | 2018 | 2019 | |||||||||||||||||||||||||||||||||||||||||||
| Amortized cost | Estimated fair value | Amortized cost | Estimated fair value | Amortized cost | Estimated fair value | Amortized cost | Estimated fair value | Amortized cost | Estimated fair value | Amortized cost | Estimated fair value | |||||||||||||||||||||||||||||||||||||
| (RMB in millions) | (RMB in millions) | |||||||||||||||||||||||||||||||||||||||||||||||
Due in one year or less | 34,378 | 34,628 | 63,665 | 64,119 | 64,919 | 64,884 | 64,919 | 64,884 | 28,371 | 28,529 | 51,097 | 50,715 | ||||||||||||||||||||||||||||||||||||
Due after one year and through five years | 216,313 | 226,112 | 213,167 | 218,608 | 268,090 | 265,832 | 268,090 | 265,832 | 304,467 | 313,067 | 279,248 | 288,711 | ||||||||||||||||||||||||||||||||||||
Due after five years and through ten years | 271,887 | 294,941 | 341,479 | 355,984 | 460,372 | 452,122 | 460,372 | 452,122 | 485,722 | 506,005 | 457,940 | 478,297 | ||||||||||||||||||||||||||||||||||||
Due after ten years | 358,170 | 397,062 | 363,165 | 380,199 | 388,657 | 365,270 | 388,657 | 365,270 | 467,433 | 492,532 | 634,468 | 660,643 | ||||||||||||||||||||||||||||||||||||
|
|
|
|
|
|
|
|
|
|
|
| |||||||||||||||||||||||||||||||||||||
Total debt securities, excluding those at fair value through profit or loss | 880,748 | 952,743 | 981,476 | 1,018,910 | 1,182,038 | 1,148,108 | 1,182,038 | 1,148,108 | 1,285,993 | 1,340,133 | 1,422,753 | 1,478,366 | ||||||||||||||||||||||||||||||||||||
|
|
|
|
|
|
|
|
|
|
|
| |||||||||||||||||||||||||||||||||||||
Our investments in debt securities are subject to strict restrictions under relevant Chinese regulation. See “—Regulatory and Related Matters—Regulation of investments”. We diversify our corporate bonds by industry and issuer. Ourissuer to effectively manage and control concentration risks. As of the date of this annual report, we believe that our corporate bond portfolio does not have significant exposure to a single industry or issuer.
Loans
We offer interest-bearing policy loans to our policyholders, who may borrow from us in amounts up to the total cash values of their policies. In general, the loans are secured by the policyholders’ rights under the policies. As of December 31, 2017,2019, the total amount of our policy loans was RMB 107,957174,872 million (US$ 16,593million)25,119 million), and represented 4.17%4.89% of our total investment assets as of that date.
In addition to policy loans, our other loans mainly consist of our investment in debt investment plans and trust schemes. As of and for the year ended December 31, 2015, the total amount of our investment in debt investment plans was RMB 65,118 million, and we had total investment proceeds from such plans of approximately RMB 3,572 million. As of and for the year ended December 31, 2016, the total amount of our investment in debt investment plans was RMB 63,028 million, and we had total investment proceeds from such plans of approximately RMB 3,532 million. As of and for the year ended December 31, 2017, the total amount of our investment in debt investment plans was RMB 73,668 million, and we had total investment proceeds from such plans of approximately RMB 3,605 million. As of and for the year ended December 31, 2018, the total amount of our investment in debt investment plans was RMB 75,717 million, and we had total investment proceeds from such plans of approximately RMB 4,295 million. As of and for the year ended December 31, 2019, the total amount of our investment in debt investment plans was RMB 83,924 million (US$ 11,32312,055 million), and we had total investment proceeds from such plans of approximately RMB 3,6054,489 million (US$ 554645 million). As of and for the year ended December 31, 2015, the total amount of our investment in trust schemes was RMB 45,460 million, and we had total investment proceeds from such schemes of approximately RMB 2,692 million. As of and for the year ended December 31, 2016, the total amount of our investment in trust schemes was RMB 47,864 million, and we had total investment proceeds from such schemes of approximately RMB 3,066 million. As of and for the year ended December 31, 2017, the total amount of our investment in trust schemes was RMB 163,764 million, and we had total investment proceeds from such schemes of approximately RMB 6,343 million. As of and for the year ended December 31, 2018, the total amount of our investment in trust schemes was RMB 185,105 million, and we had total investment proceeds from such schemes of approximately RMB 9,276 million. As of and for the year ended December 31, 2019, the total amount of our investment in trust schemes was RMB 215,306 million (US$ 25,17030,927 million), and we had total investment proceeds from such schemes of approximately RMB 6,34311,077 million (US$ 9751,591 million).
Securities investment funds
Securities investment funds consist of Chinese domestic investment funds and overseas investment funds that primarily invest in securities. As of December 31, 2017,2019, our investment in securities investment funds was RMB 101,236118,450 million (US$ 15,56017,014 million) and represented 3.91%3.31% of our total investment assets as of that date. Our investment in securities investment funds mainly consists of investment in Chinese domestic investment funds.
We invest in both“closed-end” securities investment funds, in which the number of shares is fixed and the share value depends on the trading prices, and“open-end” securities investment funds, in which the number of shares issued by the fund fluctuates and the share value is set by the value of the assets held by the fund. Our investments in securities investment funds are subject to strict restrictions under relevant Chinese regulations. See “—Regulatory and Related Matters—Insurance Company Regulation—Regulation of investments”. Our holdings in securities investment funds comply with those restrictions.
The following table presents the carrying values of investments inopen-end andclosed-end securities investment funds as of the dates indicated.
| As of December 31, | As of December 31, | |||||||||||||||||||||||||||||||||||||||||||||||
| 2015 | 2016 | 2017 | 2017 | 2018 | 2019 | |||||||||||||||||||||||||||||||||||||||||||
| Carrying value | % of total | Carrying value | % of total | Carrying value | % of total | Carrying value | % of total | Carrying value | % of total | Carrying value | % of total | |||||||||||||||||||||||||||||||||||||
| (RMB in millions, except as otherwise indicated) | (RMB in millions, except as otherwise indicated) | |||||||||||||||||||||||||||||||||||||||||||||||
Open-end | 167,900 | 99.1 | % | 117,027 | 97.5 | % | 99,012 | 97.8 | % | 99,012 | 97.8 | % | 104,107 | 98.0 | % | 118,450 | 100.0 | % | ||||||||||||||||||||||||||||||
Closed-end | 1,585 | 0.9 | % | 2,946 | 2.5 | % | 2,224 | 2.2 | % | 2,224 | 2.2 | % | 2,164 | 2.0 | % | — | — | |||||||||||||||||||||||||||||||
|
|
|
|
|
|
|
|
|
|
|
| |||||||||||||||||||||||||||||||||||||
Total | 169,485 | 100.0 | % | 119,973 | 100.0 | % | 101,236 | 100.0 | % | 101,236 | 100.0 | % | 106,271 | 100.0 | % | 118,450 | 100.0 | % | ||||||||||||||||||||||||||||||
|
|
|
|
|
|
|
|
|
|
|
| |||||||||||||||||||||||||||||||||||||
Stocks
Investments in stocks consist of investment in publicly offered and listed equity securities that are denominated and traded in Renminbi and investment in stocks listed on specified overseas stock exchanges that are permitted by the CIRC. Our investments in stocks are subject to strict restrictions under relevant Chinese regulations. See “—Regulatory and Related Matters—Insurance Company Regulation—Regulation of investments”. As of December 31, 2019, the total amount of our investment in common stocks was RMB 276,604 million (US$ 39,732 million), and represented 7.7% of our total investment assets as of that date. As of December 31, 2018, the total amount of our investment in common stocks was RMB 178,710 million , and represented 5.8 % of our total investment assets as of that date. As of December 31, 2017, the total amount of our investment in common stocks was RMB 173,450 million, (US$ 26,659 million), and represented 6.7%6.3% of our total investment assets as of that date. As of December 31, 2016, the total amount of our investment in common stocks was RMB 140,166 million, and represented 5.7% of our total investment assets as of that date. As of December 31, 2015, the total amount of our investment in common stocks was RMB 111,516 million, and represented 4.9% of our total investment assets as of that date.
Resale agreements
We enter into resale agreements, which consist of securities resell activities in resell markets.
The securities purchased under agreements to resell were RMB 36,185 million(US$ 5,562million)4,467 million (US$ 642 million) as of December 31, 2017,2019, RMB 43,5389,905 million as of December 31, 20162018, and RMB 21,50336,185 million as of December 31, 2015.2017.
Equity interests innon-listed enterprises and related financial products
Insurance companies are allowed to invest, directly or indirectly, in equity interests innon-listed enterprises. These investments are categorized either as “direct investments”, for investments by an insurance company in its name, or as “indirect investments”, for investments through equity investment funds and other related financial products sponsored and established by an investment management institution. Our investments in equity interests innon-listed enterprises and related financial products are subject to strict restrictions under relevant Chinese regulations. See “—Regulatory and Related Matters—Insurance Company Regulation—Regulation of investments”.
We started to make investments in equity interests innon-listed enterprises in 2006. In2006.In November 2017, we entrusted IHC to invest in Ningbo Meishan Bonded Port Area Baishan Investment Management Partnership, or Baidu Fund Partnership. The total capital commitment in the Baidu Fund Partnership is RMB 7.011 billion, of which RMB 5.6 billion was subscribed by us and RMB 1.4 billion was subscribed by Ningbo Meishan Bonded Port Area Baidu Zhixin Asset Management Company, each as a limited partner. The Baidu Fund Partnership will primarily make middle-late-stagemakes mid-to-late stage investments in the private equity dealstransactions in the Internet sector, including Internet, mobile Internet, artificial intelligence, Internet finance, consumption upgrade, and Internet+. As
In 2018, we subscribed for additional shares of CLPCIC by contributing RMB 1.52 billion undistributed profits of CLPCIC. In December 2018, we subscribed for an additional 1,871,875,329 shares of China Guangfa Bank, or CGB, for RMB 13.012 billion. Upon closing, we hold 8,600,631,426 shares of CGB, and our shareholding in CGB remains at 43.686%. We are still the endlargest shareholder of 2017,CGB.
In 2018, we invested RMB 1.688 billion of our investment commitment had been paid by us.in equity interests in China Power Investment Nuclear Power Co., Ltd.
In 2019, we invested RMB 9 billion in equity interests in Qinghai Huanghe Hydropower Development Co., Ltd.
The following table presents the carrying values of our major investments in equity interests innon-listed enterprises as of the dates indicated.
| As of December 31, | ||||||||||||
| 2015 | 2016 | 2017 | ||||||||||
| Carrying value | Carrying value | Carrying value | ||||||||||
| (RMB in millions, except as otherwise indicated) | ||||||||||||
China Life Property and Casualty Insurance Company Limited | 7,812 | 7,929 | 8,185 | |||||||||
China Guangfa Bank Co., Ltd. | 22,553 | 50,299 | 53,459 | |||||||||
Sinopec Sales Co., Ltd. | 10,055 | 10,522 | 10,172 | |||||||||
Sinopec Sichuan to East China Gas Pipeline Co., Ltd. | — | 20,000 | 21,347 | |||||||||
Ningbo Meishan Bonded Port Area Baishan Investment Management Partnership | — | — | 1,680 | |||||||||
China Life Property and Casualty Insurance Company Limited China Guangfa Bank Co., Ltd. Sinopec Sales Co., Ltd. Sinopec Sichuan to East China Gas Pipeline Co., Ltd. Ningbo Meishan Bonded Port Area Baishan Investment Management Partnership China Power Investment Nuclear Power Co., Ltd. Qinghai Huanghe Hydropower Development Co., Ltd. As of December 31, 2017 2018 2019 Carrying
value Carrying
value Carrying
value (RMB in millions, except as otherwise indicated) 8,185 7,963 9,332 53,459 72,655 75,180 10,172 10,219 10,232 21,347 21,387 21,433 1,680 1,698 1,751 — 8,036 8,607 — — 9,007
Asset Management Business
On November 23, 2003, in connection with the restructuring, we established an asset management company, AMC, with CLIC, in connection with the restructuring for the purpose of operating the asset management business more professionally in a separate entity and to better attract and retain qualified investment management professionals. AMC manages our investment assets and, separately, substantially all of those of CLIC. For a description of our investment assets, see “—Investments”.
We own 60% and CLIC owns 40% of AMC. Directors of AMC are appointed by the shareholders at a general meeting. As the controlling shareholder, we effectively control the composition of AMC’s board of directors. In 2014, the registered capital of AMC was increased from RMB 3 billion to RMB 4 billion. The proportionate shareholding between CLIC and us remains unchanged.
As of and for the year ended December 31, 2017,2019, AMC had total assets of RMB 9,23711,914 million (US$ 1,4201,711 million), net assets of RMB 8,33910,354 million (US$ 1,2821,487 million) and net profit of RMB 1,1261,286 million (US$ 173185 million).
Property and Casualty Business
In December 2006, we and CLIC established a property and casualty company, CLPCIC, with us owning 40% and CLIC owning the remaining 60%. In 2014,2018, the registered capital of CLPCIC was increased from RMB 815 billion to RMB 1518.8 billion, with us and CLIC contributing RMB 2.81.52 billion and 4.22.28 billion undistributed profits of CLPCIC, respectively. The proportionate shareholding between CLIC and us remains unchanged.
As of and for the year ended December 31, 2017,2019, CLPCIC had total assets of RMB 79,60191,167 million (US$ 12,23413,095 million), net assets of RMB 20,46323,330 million (US$ 3,1453,351 million) and net profit of RMB 8202,123 million (US$ 126305 million).
Pension Insurance Business
In January 2007, we, CLIC and AMC established a pension insurance company, China Life Pension, with us owning 55%, CLIC owning 25% and AMC owning the remaining 20%. In January 2015, the registered capital of China Life Pension was increased from RMB 2.5 billion to RMB 3.4 billion. China Life Pension is currently held 70.74%,4.41%, 3.53%, 1.33%, and 19.99% by us, CLIC, AMC, China Credit Trust Company Limited and AMP Life Limited, respectively.
China Life Pension has obtained qualifications to serve as investment manager, trustee and account manager of enterprise annuity funds.
As of and for the year ended December 31, 2017,2019, China Life Pension had total assets of RMB 3,9225,644 million (US$ 603811 million), net assets of RMB 3,0864,084 million (US$ 474587 million) and net profit of RMB 14635 million (US$ 291 million).
Information Technology
Our computer systems provide support for many aspects of our businesses, including product development, sales and marketing, business management, cost control and risk control.We have approximately 2,000experienced1,981experienced engineers, technicians and specialists providing professional and flexible support for our business operations in various aspects, including the design, research and development and operation of our computer systems.
In 2017,During 2019, we continued to develop a new generation comprehensive business management systemactively applied advanced technologies and pushed forward digital transformation. We took the following steps:
Upgrade of sales model. We adopted an advanced three-tier cloud architecture, and believe we are among the first in the domestic financial industry to implement a hierarchical cloud computing practice to support the needs of business transformation and development;
Upgrade of field offices and equipment. We used the “Internet of Things” technology, which accelerated the real-time interconnection between different field offices and networks as well as the intelligent upgrade of daily office operations. In 2019, we builtadded 88,000 sets of intelligent platformsequipment and deployed more than 2,000 self-service terminals at our service counters nationwide and set up demonstrative 5G digital field offices in multiple cities.
Upgrade of service and customer experience. We continued to use AI technology in underwriting, policy administration, claims settlement, services and risk control. In 2019, the approval rate of individual insurance policies by automatic underwriting was 89.4%, and the number of claims settled through complete automatic process reached more than 11.3 million. We introduced a short-term risk identification model for critical illness insurance with a 91% accuracy rate in identifying risks. We also developed a platform to utilize intelligent technologies to discover and verify suspected money-laundering activities, which enhanced our ability to control sales risks.
Establishment of cloud-based infrastructure. We utilized industry-leading hybrid clouds to achieve the rapid deployment of our front office applications and secure storage of back office data, which effectively improved the stability, smoothness and security of our systems. Specifically, resource allocation efficiency and overall access speed increased by nine-times andtwo-times, respectively. While substantially expanding the resources of our basic platform, we also managed to reduce the costs of resources.
Roll-out of new digital applications and establishment of digital ecosystem. We introduced component-basedplug-in professional service modules and efficiently launched various types of flexibly-combined “light” applications suited for different market application scenarios for their users. We also introduced a series of innovative applications such as cloud video and cloud desktop, and provided readily available, mobile, convenient live-streaming and smart voice, face recognitionoffice services for our salespersons and deep learning, which support our intelligentemployees nationwide. In addition, during 2019, we developed more than 1,000 innovative applications based on the platform and cooperated with more than 6,000 institutions to carry out various services and operations and enhance customer experience.over 40,000 activities, which enhanced our insurance-centered ecosystem services.
We also continue to attach importance to financial data security and have implemented projects, including the separation of internal and external network,networks, cloud desktops, providing different levels of protection fitting to the various application systems, intelligent security monitoring and supervision platforms and anti-intrusion system.systems. User access information obtained through front office applications is gathered and managed at a back office platform. We have built a security protection system to cover assessment, protection, detection, response, recovery and other aspects of data protection. We have aan intelligent visualization system to provide real-time monitoring on cyber attacks. We also have internal rules on the procedures for reporting and handling material accidents, including cybersecurity incidents, occuringoccurring during business operations.
Trademarks
We conduct our business under the “China Life” brand name (in English and Chinese), the “ball” logos, the “C” mark and other business related slogans and logos. CLIC owns these trademarks and has registered them with the Trademark Office of the SAIC.SAMR. CLIC has entered into a trademark license agreement with us, under which CLIC has agreed to grant us a royalty-free license to use the “China Life” brand name, the “ball” logos and the “C” mark. See “Item 7. Major Shareholders and Related Party Transactions—Related Party Transactions—Continuing Related Party Transactions with CLIC”.
Disclosure of Certain Activities Under Section 13(r) of the Securities Exchange Act of 1934
Under Section 13(r) of the Exchange Act, which was added by the Iran Threat Reduction and Syrian Human Rights Act of 2012, we are required to disclose in our annual report filed with the SEC if we or any of our affiliates knowingly engaged in certain Iran-related activities, including transactions or dealings with the Government of Iran or relating to Iran during the period covered by the annual report, no matter whether these activities are material or not. Disclosure is required even when the activities were conducted outside of the U.S. bynon-U.S. entities and even when such activities were conducted in compliance with applicable law.
In June 2017, CLPCIC, a casualty and property insurance company in which we own 40% interest, provided marine hull insurance for a fleet of vessels managed by the National Iranian Tanker Company (“NITC”) as aco-insurer for the period from July 1, 2017 to June 30, 2018, and the lead insurer is Assuranceforeningen Skuld. These transactions were entered into in compliance with laws and regulations applicable to CLPCIC. We understand that NITC is affiliated with the Government of Iran and it is on the List of Persons Identified as Blocked Solely Pursuant to Executive Order 13599. The total premiums that CLPCIC received from these transactions are approximately RMB 530,000 (US$ 81,460). We are unable to determine the net profits from these transactions prior to the expiration of the insurance coverage.
CLPCIC does not intend to continue providing insurance coverage to NITC upon the expiration of the insurance coverage.
Regulatory and Related Matters
Overview
The insurance industry is heavily regulated in the PRC. The applicable laws and regulations governing insurance activities undertaken within the territories of the PRC consist principally of the PRC Insurance Law and rules and regulations promulgated under that law. The CBIRC (formerly CIRC) is the authority authorized by the PRC State Council to regulate and supervise the insurance industry in the PRC. The CBIRC has been the principal regulatory authority over the PRC insurance industry since 2018, when its predecessor, the CIRC, was merged with China’s banking regulator, the CBRC.
The PRC Insurance Law, which provided the initial framework for regulating the PRC insurance industry, was enacted in 1995, and significantly amended on October 28, 2002, February 28, 2009, August 31, 2014 and April 24, 2015. Among other things, the major provisions of the PRC Insurance Law include: (1) licensing of insurance companies and insurance intermediaries, such as agents and brokers; (2) separation of property and casualty business and life insurance business; (3) regulation of market conduct by participants; (4) substantive regulation of insurance products; (5) regulation of the financial condition and performance of insurance companies; and (6) supervisory and enforcement powers of the CIRC.CBIRC.
The CIRC, the predecessor to the CBIRC, was established in 1998. ItThe CBIRC has extensive supervisory authority over the PRC insurance industry, including: (1) promulgation of regulations applicable to the insurance industry; (2) approval for establishment of insurance companies and their subsidiaries; (3) review of qualifications of senior management of insurance companies; (4) supervision of insurance companies and their solvency and market activities; (5) establishment of investment regulations; (6) approving the policy terms and premium rates for certain insurance products; (7) setting standards for measuring the financial soundness of insurance companies; (8) requiring insurance companies to submit reports concerning their business operations and condition of assets; and (9) ordering the suspension of all or part of an insurance company’s business. Since their establishment, CBIRC and its establishment, thepredecessor CIRC hashave promulgated a series of regulations indicating a gradual shift in the regulatory approach to a more transparent regulatory process and a convergent movement toward international standards.
In March 2018, the National People’s Congress of the PRC approved the merger of China’s long-existing regulatory commissions of banking and insurance into a new administration called the China Banking and Insurance Regulatory Commission, or CBIRC. On April 8, 2018, the official sign of CBIRC was unveiled at what was previously the site of CBRC, which we understand marked the merger of CIRC and CBRC. The official website of CBIRC was formally launched on the same day. Guo Shuqing, formerly the head of CBRC, has been appointed as the chairman of CBIRC. The CIRC and the CBRC no longer exist after the completion of the merger. Some of their authorities, including drafting certain regulations to govern the insurance and banking industries, have been ceded to PBOC, China’s central bank. As of the date of this annual report, the regulations, rules and guidance previously issued by the CIRC still remain effective. This merger is intended to improve the efficiency and coordination of Chinese financial regulation.
Insurance Company Regulation
Licensing requirements
An insurance company is required to obtain a license from the CBIRC (formerly CIRC) in order to engage in an insurance business. In general, a license will be granted only if the company can meet prescribed registered capital requirements and other specified requirements, including requirements relating to its form of organization, the qualifications of its senior management and actuarial staff, the adequacy of its information systems and specifications relating to the insurance products to be offered.
The CBIRC (formerly CIRC) may grant a life insurer a license to offer all or part of the following products: accident insurance, term life insurance, whole life insurance, annuities, short-term and long-term health insurance, endowment insurance (for individuals only) and other personal insurance approved by the CBIRC, (formerly CIRC), as well as reinsurance relating to any of the foregoing.
An insurance company may seek approval for establishing branch offices to meet its business needs so long as it meets minimum capital and other requirements. Our headquarters and all of our branch offices have obtained the requisite insurance licenses.
Minimum capital requirements
The minimumpaid-in capital for an insurance company is RMB 200 million. For an insurance company whose registered capital is RMB 200 million, the minimum incremental capital for each first branch office in a province other than the province where its headquarter is located is RMB 20 million. No additional capital will be required when thepaid-in capital has reached RMB 500 million, and the insurer’s solvency is sound.
Restriction of ownership in joint stock insurance companies
Any acquisition of shares which results in the acquirer owning 5% or more of the registered capital of a joint stock insurance company, whether or not listed, requires the approval of the CBIRC (formerly CIRC).CBIRC. A filing with the CBIRC (formerly CIRC) is required with respect to a change of equity interest of less than 5% in an insurance company, unless it is a listed insurance company. Equity interests held by a single shareholder, including its related parties and persons acting in concert, must not exceedone-third of the registered capital of a single insurance company. An exception to theone-third cap applies to insurance companies establishing or investing in other insurance companies for the purposes of innovation and specialization of their business, or consolidating their operations under a single group management. Equity interests held by a single domestic limited partnership must not exceed 5% of the registered capital of a single insurance company. The combined equity interests held by several domestic limited partnerships must not exceed 15% of the registered capital of a single insurance company, and the combined equity interests held by foreign investors may not exceed 50%51% of the total equity of a single life insurance company.
On November 10, 2017, ChinaDecember 6, 2019, CBIRC announced that it will substantially relax foreign ownership limits in life insurance companies. On April 11, 2018, the Governor of the PBOC further clarified that regulations would be introduced within the next several months increasing the limitstarting from January 1, 2020, restrictions on foreign ownership in Chinese life insurance companies to 51% from the current 50%, and all foreign ownership restrictions in the Chinese life insurance sectorinsurers will be removed and foreign investors will be allowed to own 100% in three years. Detailed implementation rules have not yet been issued.Chinese life insurers.
Fundamental changes
Prior approval must be obtained from the CBIRC (formerly CIRC) before specified fundamental changes relating to a Chinese insurance company may occur. These include: a change of company name, registered capital or address of executive offices of companies or their subsidiaries; an expansion of business scope; an amendment to articles of association; a merger orspin-off; a change in a shareholder whose capital contribution accounts for 5% or more of the total capital of the company or a change in shareholding of 5% or more of the shares of the company; and a termination of a branch office. In addition, certain other changes relating to the insurance company must be reviewed by or filed with the CBIRC (formerly CIRC).CBIRC.
Regulation of products
Regulation of ordinary personal insurance products.An ordinary personal insurance product is one whose insurance premiums and policy benefits are definite upon issuance of the insurance policy. Beginning from August 5, 2013, the CIRC removed the original 2.50% cap on the guaranteed interest rates of ordinary personal insurance products, and such guaranteed interest rates can be decided by insurance companies at their discretion in accordance with the principle of prudence. Meanwhile, the statutory valuation rates of ordinary personal insurance policies issued on and after August 5, 2013 have been increased from 2.50% to 3.50%. In addition, beginning from August 5, 2013, if the guaranteed interest rate of an ordinary personal insurance product developed by an insurance company is not higher than the maximum valuation rate set by the CIRCCBIRC which varies depending on product, the insurance company must file the relevant information of the product with the CBIRC (formerly CIRC).CBIRC. If such rate is higher than the maximum valuation rate set by the CIRC,CBIRC, the insurance company is required to obtain the approval of the CBRIC (formerly CIRC)CBIRC on the product in advance, and during the approval process, the insurance company is not allowed to submit new insurance clauses and premium rates to the CBIRC (formerly CIRC) for approval. On September 2, 2016, the CIRC further required that policy loans provided by an insurer may not exceed 80% of the cash value or account value of the policy. From October 1, 2017, the first payment of survival insurance benefits for the ordinary endowment products and annuity products must occur only after five years since the policy becomes effective and the annual payment or partial payment must not exceed 20% of the paid premiums. Beginning from August 30, 2019, the cap on the valuation rate of premium reserves of ordinary pension annuity products or ordinary long-term annuity products with a term more than ten years issued on and after August 5, 2013 is equal the lower of 3.50% or the guaranteed interest rate.
Regulation of participating products. A participating product is one which the policyholder or annuitant is entitled to share in the distributable earnings of the insurer through “policy dividends”. The participation dividend may be in the form of a cash payment or an increase in the insured amount. At least 70% of the distributable earnings is required to be distributed as dividends. In September 2015, the CIRC removed the original 2.50% cap on the guaranteed interest rate of participating products. From October 1, 2015, the guaranteed interest rate is to be decided by insurance companies at their discretion in accordance with the principle of prudence. If the guaranteed interest rate of a participating product developed by an insurance company is not higher than 3.50%, the insurance company must file the specific information of such product with the CBIRC (formerly CIRC) for record. If such rate is higher than 3.50%, the insurance company is required to obtain the approval of the CBIRC (formerly CIRC) for the product. In addition, the valuation rate of unearned premium reserves of participating products equals to either the guaranteed interest rate or 3.00%, whichever is lower. Beginning from September 2, 2016, if the guaranteed interest rate of a life insurance product newly developed by an insurance company is lower than the maximum valuation rate set by the CIRC, which is 3.00% for participating products, the insurance company is only required to file specified information relating to the product with the CBIRC, (formerly CIRC), and if such rates are higher than 3.00%, the insurance company is required to obtain the = approval of the CBIRC (formerly CIRC) for such products. From October 1, 2017, the first payment of survival insurance benefits for the participating endowment products and annuity products must occur only after five years since the policy becomes effective and the annual payment or partial payment must not exceed 20% of the paid premiums.
Regulation of universal products. A universal product is one which offers the typical protection of life insurance with investment accounts providing a minimum yield. The premium payments and coverage of universal products are flexible, usually with a minimum guaranteed interest rate, and the investment yields are settled periodically. Beginning from February 16, 2015, the CIRC removed the original 2.50% cap on the minimum guaranteed interest rate of universal products, with the guaranteed interest rate to be decided by insurance companies at their discretion in accordance with the principle of prudence. Meanwhile, the maximum valuation rate of a universal product has been increased from a compound annual rate of 2.50% to a compound annual rate of 3.50%. Beginning from September 2, 2016, the CIRC changed the maximum valuation rate of a universal product from a compound annual rate of 3.50% to a compound annual rate of 3.00%. If the minimum guaranteed interest rate of a universal product developed by an insurance company is not higher than the maximum valuation rate set by the CIRCCBIRC (i.e., a compound annual rate of 3.00%), the insurance company must file specified information relating to the product with the CBIRC (formerly CIRC).CBIRC. If such rate is higher than the maximum valuation rate set by the CIRC,CBIRC, the insurance company is required to obtain the approval of the CBIRC (formerly CIRC) for the product. Any amendment to the insurance clauses, premium rates, insurance liabilities, types of insurance or pricing methods of universal products must be filed with or approved by the CIRC.CBIRC. From October 1, 2017, universal products must be designed to allow the flexibility to pay additional premiums from time to time and to adjust the insured amount. Insurance companies may not design the universal products in the form of riders.
Regulation of investment-linked products. An investment-linked product is one which insures the policyholder or annuitant against one or more separate risks and at the same time gives the policyholder or annuitant an interest in one or more separate investment accounts. Insurance companies must complete the establishment of investment accounts before submitting the required information regarding their investment-linked products to the CBIRC (formerly CIRC) for approval or filing. Insurance companies must report on the establishment, change, consolidation, division, close or settlement of the investment accounts to the CBIRC (formerly CIRC) within 10 business days after occurrence of these events. Transactions between a separate investment account and any other account of the insurance company, other than a transfer of cash to establish the investment account, are prohibited. From October 1, 2017,prohibited, and, investment-linked products must be designed to allow the flexibility to pay additional premiums from time to time and to adjust the insured amount. Insurance companies may not design investment-linked products in the form of riders. Other CIRC regulations govern the sale and disclosure terms of investment-linked products.
Regulation ofshort-to-medium term products. Beginning from March 21, 2016, CIRC’s new regulations on personal insurance products withshort-to-medium terms became effective. Under the new CIRC regulations, personal insurance products withshort-to-medium terms are defined as follows:
Under the CIRC regulations, an insurer’s annual premium income from personal insurance products withshort-to-medium terms may not exceed two times the amount of capital invested by or the net assets of such insurer at the end of the latest quarter, whichever is larger. Insurers are also required to immediately cease developing and selling personal insurance products with a term of less than one year. An insurer’s annual premium income from personal insurance products with a term more than one year but less than three years may not exceed 90% of the overall regulatory limitation in 2016, 70% of the overall regulatory limitation in 2017 and 50% of the overall regulatory limitation in 2018 and thereafter. Furthermore, the CIRC issued a new notice in September 2016, requiring that beginning from January 1, 2019, an insurer’s annual premium income from personal insurance products withshort-to-medium terms may not exceed 50% of its total premiums for 2019, 40% of its total premiums for 2020 and 30% of its total premiums for 2021 and thereafter.
Investment-linked products and variable annuity insurance must also be evaluated and reported according to the above requirements applicable to products withshort-to-medium terms. Whole life insurance products, annuity products and healthcare insurance products may not be designed as products withshort-to-medium terms. Supplementary insurance products, such as supplementary universal products and supplementary investment-linked products, must also be evaluated separately to determine whether they are products withshort-to-medium terms.
Regulation of variable annuity insurance. Variable annuity insurance is a type of insurance where the policy benefits are associated with the price of the investment unit in the linked investment account, and a minimum amount of policy benefits is guaranteed as stipulated in the insurance agreement. Under variable annuity insurance, the insurance company is obliged to pay an annuity or offer an option for the conversion of the insurance proceeds to be annuitized upon maturity. Variable annuity products may not be sold or amended without the prior approval of the CBIRC (formerly CIRC).CBIRC. Variable annuity products must be sold and disclosed in accordance with the requirements of the CIRC.
Regulation of pension insurance. A life insurance company or a pension insurance company, as approved by the CIRC, may engage in individual and group pension insurance business. The pension insurance terms and premium rates determined by an insurance company must be filed with or approved by the CBIRC (formerly CIRC) in accordance with its regulatory provisions. Other CIRC regulations govern the sale and disclosure terms of pension insurance, as well as the investments by pension insurance funds.
Regulation of enterprise annuity funds. Subject to the approval of the PRC Ministry of Human Resources and Social Security, insurance companies may serve as the trustee, account manager and investment manager for enterprise annuity funds. China Life Pension has obtained qualifications to serve as investment manager, trustee and account manager of enterprise annuity fund.
Regulation of health insurance. Subject to approval by the CBIRC, (formerly CIRC), life insurance companies may engage in health insurance business. Other insurance companies may, subject to approval by the CBIRC, (formerly CIRC), engage in short-term health insurance business. Insurance companies engaged in health insurance business are required to submit an actuarial report or reserves assessment report for the preceding year in accordance with the relevant provisions of the CIRC. Insurance companies must also submit a pricing review report to the CBIRC (formerly CIRC) before March 15 of each year regarding the short-term health insurance products. Beginning on January 1, 2016, insuranceInsurance companies maywere permitted to sell health insurance products eligible for preferential individual income tax policies in accordance with the CIRC’s relevant requirements in 31 pilot cities, including Beijing, Shanghai, Tianjin and Chongqing.Chongqing beginning in 2016 and, from July 1, 2017, nationwide in China. The health insurance products may be offered to taxpayers who have reached the age of 16 but have not reached the statutory retirement age. The expenses incurred by individuals in the pilot cities for purchasing such health insurance products will be deductible from their individual income tax up to RMB 2,400 per year. From October 1, 2017, the survivalyear or RMB 200 per month. Survival benefits paid before the expiry of the policy term of a care insurance product may only be paid under the condition that the care required by the insured is caused by disability in activities of daily living as agreed in the insurance contract. Survival benefits paid before the expiry of the policy term of a disability income insurance product may only be paid under the condition that the loss of working ability of the insured is caused by a disease or an accidental injury as agreed in the insurance contract. AllOn December 1, 2019, the new Measures for the Administration of Health Insurance came into effect, pursuant to which sales of products that are not in compliance with the medical insurance premiums collected by insurance companies from their group medical insurance productsrequirements under the new measure must be used for the payment of insurance benefits under the medical insurance coverage, and the interest rates of products used for pricing must satisfy relevant regulatory requirements.ceased before April 1, 2020.
Regulation of short-term accidental injury insurance. Short-term accidental injury insurance is a type of insurance that uses death or disability caused by accidents or physical injuries stipulated in the insurance agreement as a condition for paying insurance proceeds. Short-term accidental injury insurance products must be developed and managed by the headquarters of the insurance company and filed with the CBIRC (formerly CIRC).CBIRC. Insurance companies must also submit a pricing review report to the CBIRC (formerly CIRC) before March 15 of each year regarding the short-term accident insurance products they offer.
Regulation of foreign exchange denominated insurance. Insurance companies may seek approval from the CBIRC (formerly CIRC) and the SAFE to engage in foreign exchange denominated insurance and reinsurance businesses, allowing them to offer products tonon-Chinese policyholders or fornon-Chinese beneficiaries, as well as policies covering accidents and illnesses which occur outside China, together with related reinsurance.
Regulation of supplementary major medical insurance. As part of the Chinese government’s overall medical insurance scheme, supplementary major medical insurance reimburses policyholders for a specified percentage of their medical expenses which are in excess of the maximum amounts covered by the basic social medical insurance as long as such medical expenses are caused by the diseases covered by the basic social medical insurance. The Chinese government has launched pilot supplementary major medical insurance programs have now been launched nationwide in China. Local governments in these pilot areas use a portion of the basic medical insurance funds to purchase supplementary major medical insurance service from qualified insurance companies through a government tender. Insurance companies are required to apply to the CBIRC (formerly CIRC) for the qualification to engage in such business. Supplementary major medical insurance products must be filed with the CBIRC (formerly CIRC).CBIRC.
Regulation of investments
Permitted investments.As a Chinese life insurance company, we are subject to restrictions under the PRC Insurance Law, the Measures for the Administration of the Utilization of Insurance Funds and other related rules and regulations on the asset categories and percentages in which we are permitted to invest. On January 23, 2014, the CIRC issued a notice classifying the assetsAssets that insurance companies may invest in are classified into five broad categories: current assets, fixed-income assets, equity assets, property assets and other financial assets. The notice further specifies the amounts in percentages that may be invested in each asset category and the percentages that correspond to concentration risks for investing in a single item and counter-party are limited to specified amounts, and insurance companies are subject to risk monitoring requirements and early warning mechanisms with respect to liquidity, financing scale and asset classes.
Asset categories, investment and concentration risk regulatory percentages. Currently, Chinese life insurance companies are allowed to invest their funds in the following asset categories, subject to the satisfaction of conditions prescribed for each form of investment.
| Regulatory Percentage(1) | ||||||||
| Asset Category | Definition | Specific Items Included | Investment Regulatory Percentage | Concentration Risk Regulatory Percentage | ||||
| Current assets | Current assets refer to cash reserves, deposits payable on demand, and highly-liquid assets with shorter terms and less risk of changes in value that can be readily converted into a definite amount of cash. | Domestic items mainly include cash, current deposits, bank call deposits, insurance asset management products on the monetary market, and government bonds, quasi-government bonds and reverse repurchase agreements with residual maturities of one year or less. Overseas items mainly include bank current deposits, monetary market funds, overnight lending, commercial bills, bank bills, negotiable certificates of deposit, reverse repurchase agreements, short-term government bonds, government-backed bonds, bonds of international financial organizations, corporate bonds and convertible bonds with residual maturities of one year or less, as well as other tools or products recognized by the | None. | The total outstanding investments by an insurance company in a single legal person(2) must not exceed 20% of the total assets(3) of the insurance company as at the end of the last quarter (excluding, among others, investments in domestic central government bonds, quasi-government bonds, and equity investments in insurance enterprises with proprietary funds). | ||||
| Regulatory Percentage(1) | ||||||||
| Asset Category | Definition | Specific Items Included | ||||||
| Investment Regulatory Percentage | Concentration Risk Regulatory Percentage | |||||||
| Fixed-income assets | Fixed-income assets refer to assets characterized by a definite maturity date and payments of interest and principal according topre-determined interest rates and payment methods, as well as other assets whose main value is dependent on the changes in the value of the aforesaid assets. | Domestic items mainly include term deposits, negotiated deposits, bond funds, fixed-income insurance asset management products, financial institution (company) bonds,non-financial institution (company) bonds and government bonds and quasi-government bonds with residual maturities of more than one year. Overseas items mainly include term deposits, structured deposits with bank guaranteed commitments, securities investment funds with fixed-income commitments, government bonds, government-backed bonds, bonds of international financial organizations, corporate bonds and convertible bonds with residual maturities of more than one year, as well as other tools or products recognized by the | None. | The book balance of investment by an insurance company in a single fixed-income asset(4) must not exceed 5% of the total assets of the insurance company as at the end of the last quarter, excluding investments in domestic central government bonds, quasi-government bonds and bank deposits.
The total outstanding investment by an insurance company in a single legal person must not exceed 20% of the total assets of the insurance company as at the end of the last quarter (excluding, among others, investments in domestic central government bonds, quasi-government bonds and equity investments in insurance enterprises with proprietary funds). | ||||
| Equity assets | Equity assets include both listed and unlisted equity assets.
Listed equity assets refer to the ownership certificate representing the equity or other residual income rights of enterprises that are publicly listed and traded on stock exchanges or financial asset markets, as well as other assets whose main value depends on the changes in the value of the aforesaid assets.
Unlisted equity assets refer to the equity or other residual income rights of enterprises that are established and registered but are not publicly listed on exchanges, as well as other assets whose main value depends on the changes in the value of the aforesaid assets. | Domestic items of listed equity assets mainly include shares(6), equity funds, hybrid funds and equity insurance asset management products. Overseas items of listed equity assets mainly include ordinary shares, preferred shares, global depositary receipts, American depositary receipts and equity securities investment funds, as well as other tools or products recognized by the
Domestic and overseas items of unlisted equity assets mainly include equities of unlisted companies, equity investment funds (including venture capital funds), asset backed securities, insurance private equity funds and other related financial products, as well as other tools or products recognized by the | The total book balance of investments by an insurance company in equity assets must not exceed 30%(5) of the total assets of the insurance company as at the end of the last quarter, and the book balance of significant equity investments must not be higher than the net assets of the insurance company as at the end of the last quarter. The book balance does not include the equity of any insurance enterprise as invested by the insurance company with its proprietary funds. | The book balance of investments by an insurance company in a single equity asset must not exceed 5%(5) of the total assets of the insurance company as at the end of the last quarter, except as otherwise provided for significant equity investments, investments in equities of insurance enterprises with self-owned funds and acquisitions of listed companies and investments in shares of listed commercial banks.
The total outstanding investments by an insurance company in a single legal person must not exceed 20% of the total assets of the insurance company as at the end of the last quarter (excluding, among others, investments in domestic central government bonds, quasi-government bonds, and equity investments in insurance enterprises with proprietary funds). | ||||
| Regulatory Percentage(1) | ||||||||
| Asset Category | Definition | Specific Items Included | ||||||
| Investment Regulatory Percentage | Concentration Risk Regulatory Percentage | |||||||
| Property assets | Property assets refer to purchased or invested land, structures and other land attachments, as well as other assets whose main value depends on the changes in the value of the aforesaid assets. | Domestic items mainly include real estate, infrastructure investment schemes, property investment schemes, property insurance asset management products and other property related financial products. Overseas items mainly include commercial properties, office properties and real estate investment trusts (REITs), as well as other tools or products recognized by the | The total book balance of investments by an insurance company in property assets must not exceed 30%(5)of the total assets of the insurance company as at the end of the last quarter. The book balance does not include the properties purchased by the insurance company for its own use.
The book balance of the properties purchased by an insurance company for its own use must not exceed 50% of the net assets of the insurance company as at the end of the last quarter. | The book balance of investments by an insurance company in a single property asset must not exceed 5%(6) of the total assets of the insurance company as at the end of the last quarter, excluding properties purchased for its own use.
The total outstanding investments by an insurance company in a single legal person must not exceed 20% of the total assets of the insurance company as at the end of the last quarter (excluding, among others, investments in domestic central government bonds, quasi-government bonds and equity investments in insurance enterprises with proprietary funds). | ||||
| Regulatory Percentage(1) | ||||||||
| Asset Category | Definition | Specific Items Included | ||||||
| Investment Regulatory Percentage | Concentration Risk Regulatory Percentage | |||||||
| Other financial assets | Other financial assets refer to other kinds of assets that are distinctively different from all the foregoing categories of assets, including in terms of risk-return characteristics, liquidity and other characteristics, and cannot be classified into any of the foregoing categories. | Domestic items mainly include financial products by commercial banks, asset-backed securities offered by banking financial institutions, trust schemes of collective funds offered by trust companies, special asset management schemes offered by securities companies, project asset-backed schemes offered by insurance asset management companies and other insurance asset management products. Overseas items mainly include structured deposits without bank guaranteed commitments, as well as other tools or products recognized by the | The total book balance of investments by an insurance company in other financial assets must not exceed 25% of the total assets of the insurance company as at the end of the last quarter. | The book balance of investments by an insurance company in a single other financial asset must not exceed 5% of the total assets of the insurance company as at the end of the last quarter, excluding purchase of insurance asset management products within its group.
The total outstanding investments by an insurance company in a single legal person must not exceed 20% of the total assets of the insurance company as at the end of the last quarter (excluding, among others, investments in domestic central government bonds, quasi-government bonds, and equity investments in insurance enterprises with proprietary funds). | ||||
| Overseas investment | An insurance company is allowed to participate in overseas investments in 25 developed markets, | As referred to in the investable overseas items listed in each of the above asset categories. | The total outstanding overseas investments by an insurance company must not exceed 15% of the total assets of the insurance company as at the end of the last quarter. | The total outstanding investments by an insurance company in a single legal person must not exceed 20% of the total assets of the insurance company as at the end of the last quarter (excluding, among others, equity investments in insurance enterprises with proprietary funds). | ||||
| (1) | When calculating the regulatory percentages for each asset category, an insurance company is required to combine its domestic and overseas investments in assets of the category on a consolidated basis. |
| (2) | A single legal person refers to a single fund-raising party with legal person status that establishes a direct creditor-debtor or shareholder relationship with an insurance company due to the latter’s investment therein. |
| (3) | Total assets exclude the balance of the funds raised from bond repurchases and the amount of assets under independent accounts (including investment-linked life insurance products, variable annuity products, health care entrusted management products, pension insurance entrusted management products and investment-orientednon-life insurance products withoutpre-agreed returns). |
| (4) | Single asset investments refer to the investments in a single specific item under any category of investment assets. Where an investment product is issued in several phases, the book balance of the investment in a single asset is the sum of the investments in each phase. |
| (5) | An insurance institution that has already taken advantage of relevant policies to increase its holdings of blue-chip stocks must adjust the percentage of investments within two years from January 24, 2017 or within the time limit otherwise provided by relevant regulatory authorities until the percentage requirements under applicable regulatory requirements are met, i.e., the total book balance of investments by an insurance company in equity assets must not exceed 30% of the total assets of the insurance company as at the end of the last quarter, and the book balance of investments by an insurance company in a single equity asset must not exceed 5% of the total assets of the insurance company as at the end of the last quarter. |
| (6) | The |
Investment risk monitoring percentages.To alleviate the risks associated with liquidity and high volatility of assets, an insurance company that experiences any of the following circumstances is required to report to the CBIRC (formerly CIRC) in a timely manner, and the CBIRC (formerly CIRC) will closely monitor the operation of the insurance company and disclose the related information to the public when necessary:
Liquidity monitoring. The total book balance of investments by an insurance company in current assets and government bonds and quasi-government bonds with residual maturities of one year or longer is lower than 5% of the total assets of the insurance company as at the end of the last quarter.
Financing leverage monitoring. The total outstanding borrowings (including inter-industry lending and bond repurchases) of an insurance company exceed 20% of the total assets of the insurance company as at the end of the last quarter.
Monitoring of different categories of assets. The total book balance of investments by an insurance company in domestic bonds with a long-term credit rating of AA or lower as rated by domestic credit rating agencies exceeds 10% of the total assets of the insurance company as at the end of the last quarter, or the total book balance of investments in equity assets exceeds 20% of the total assets of the insurance company as at the end of the last quarter, or the total book balance of investments in property assets exceeds 20% of the total assets of the insurance company as at the end of the last quarter, or the total book balance of investments in other financial assets exceeds 15% of the total assets of the insurance company as at the end of the last quarter, or the total book balance of outstanding overseas investments exceeds 10% of the total assets of the insurance company as at the end of the last quarter.
The book balance of a single inter-group insurance asset management product purchased by an insurance company exceeds 5% of the total assets of such insurance company as at the end of the last quarter.
Risk Classification of Insurance Assets.An insurance company must evaluate, at least once every half year, the quality of its insurance assets falling within the categories of fixed-income assets, equity assets and property assets, and divide such assets into five categories based on risk, namely “pass”, “special mention”, “substandard”, “doubtful” and “loss”, with the last three categories collectively referred to as“non-performing assets”. Insurance assets that require risk classification include assets invested by the insurance company other than those subject to fair value measurement and changes to these assets are counted as gains or losses for the period in question or owners’ equity. An insurance company must establish and improve risk classification systems and working processes for its assets and file reports on such systems and processes with the CBIRC (formerly CIRC).CBIRC. In addition, an insurance company is required to semiannually report to the CBIRC (formerly CIRC) the relevant information on the classification of its assets. An insurance company must also establish feasible plans for annual asset loss provisions and write-offs, as well as plans for the disposal ofnon-performing assets based on its actual operations and the quality of its assets. These plans must be approved by its board of directors and be filed with the CBIRC (formerly CIRC).CBIRC.
Insurance private equity funds. Insurance companies are allowed to establish private equity funds that comply with the requirements of the CIRC,CBIRC, including growth funds, buyout funds, funds for strategic emerging industries, mezzanine funds, real estate funds, venture capital funds, and funds of funds (FoF) primarily investing in the aforementioned funds. Insurance companies must register the establishment of private equity funds with the CBIRC, (formerly CIRC), and periodically submit quarterly reports, annual reports and other related information to the CBIRC (formerly CIRC) during the term of private equity funds.
Financial derivative products. Apart from the regulations on the five asset categories described above, the CIRC has separately issued a series of rules governing the operation of domestic and overseas trading of derivative products by an insurance company. Financial derivative products are financial contracts whose value is determined by one or more types of underlying assets, indices or certain events. Typical financial derivative products include forwards, futures, options and swaps.
Bank capital replenishment bonds. On January 25, 2019, the CBIRC issued separate rules allowing insurance companies to invest in Tier 2 capital bonds andnon-fixed term capital bonds issued by banks. Investment in Tier 2 capital bonds andnon-fixed term capital bonds issued by policy banks is regulated in accordance with requirements on investment in quasi-government bonds. Investment in Tier 2 capital bonds andnon-fixed term capital bonds issued by commercial banks is regulated in accordance with requirements on investment in unsecurednon-financial institution (company) bonds.
Insurance companies may participate in derivatives transactions only for the purpose of hedging or averting risks, and not for the purpose of speculation. Legitimate purposes include hedging or averting risks of current assets and liabilities, or the company as a whole, and hedging the risk of assets scheduled to be bought within the next month, or locking in future transaction prices.
“Assets scheduled to be bought”, as used above, refers to assets that an insurance institution has decided to buy after going through its investment decision-making process. If the assets are not bought within one month of the decision date, or the plan was aborted within the aforementioned period, the insurance institution must terminate, liquidate or unwind the relevant derivative upon the expiration of the prescribed period or within five trading days of such decision.
For an insurer carrying out interest rate swaps, the notional principal may not exceed 10% of its fixed-income assets (including bank deposits, bonds and other debt instruments) as of the end of the previous quarter. The notional principal swapped with the same counterparty may not exceed 3% of such counterparty’s fixed-income assets as of the end of the previous quarter.
Solvency requirements
Solvency I requirements
From March 2003 to December 31, 2015, we were required to calculate and report our solvency ratio, a standard developed by the CIRC to measure the financial soundness of life insurance companies to provide better policyholder protection under a system of corrective regulatory action. The standard for calculation of solvency ratio was further revised by the CIRC in September 2008. The solvency ratio of an insurance company under this standard was a measure of capital adequacy calculated by dividing the actual capital of the company (which is the admitted assets less admitted liabilities, determined in accordance with relevant CIRC rules) by the minimum capital it is required to meet.
Under this standard, the minimum capital of a life insurance company was the sum of its minimum capital for its short-term business (policies having a term of one year or less from the date of issuance) and the minimum capital for its long-term business (policies having a term of more than one year from the date of issuance). The standard for calculation of the minimum capital was further revised by the CIRC in January 2010. In January 2013, the CIRC issued the standard for calculation of the minimum capital for supplementary major medical insurance. In August 2013, the standard for calculation of the minimum capital with respect to the total sums at risk under long term life insurance policies was revised by the CIRC. In April 2014, the CIRC issued the standard for calculation of the minimum capital for high cash value products.
The minimum capital for a life insurance company’s short-term business was the sum of the minimum capital for supplementary major medical insurance and the higher of:
The minimum capital for its long-term business was the sum of:
An insurance company with a solvency ratio below 100% could be subject to a range of regulatory actions by the CBIRC (formerly CIRC). The CBIRC (formerly CIRC) may in such situations require the insurance company to, among other things, raise additional share capital, limit paying dividends on its shares, limit the remuneration and expense accounts of its directors and senior management, restrict its advertising activities, restrict the establishment of branch offices and business operations, cease any new business development, transfer its insurance business to others or seek reinsurance of its insurance obligations, sell its assets or restrict the acquisition of fixed assets, limit the channels for using its capital, change its management team or put the insurer into receivership.
C-ROSS requirements
On January 1, 2016, the CIRC implemented a new set of solvency regulations, the “China Risk Oriented Solvency System”, orC-ROSS, which replaced Solvency I.its previous solvency requirements known as “Solvency I”.
C-ROSS adopts the internationally accepted “three-pillar” regulatory system while its regulatory concept, models, methods and parameters are based on Chinese insurance market conditions. The three pillars are:
Pillar I: quantitative capital requirements which aim to prevent quantifiable risks, and include quantifying capital requirements, criteria for assessment and recognition of actual assets and liabilities, capital classification, stress tests and regulatory measures to be imposed on the insurers which fail to meet the quantitative capital requirements.
Pillar II: qualitative regulatory requirements which aim to prevent unquantifiable risks, and which include an integrated risk rating, requirements on assessment and management of risks by the insurers, and regulatory inspection and analysis and regulatory measures to be imposed on the insurers which fail to meet the qualitative regulatory requirements.
Pillar III: market discipline mechanisms which aim to involve, through sufficient information disclosure systems and other means, market players including the public, customers, rating agencies and industry analysts by introducing mechanisms through which they will play an important role in the solvency supervision process.
UnderC-ROSS, the three indicators to measure the solvency ratio of an insurer include the following:
the core solvency adequacy ratio, which is calculated by dividing the core capital of an insurer by the minimum capital it is required to meet;
the comprehensive solvency adequacy ratio, which is calculated by dividing the sum of core capital and supplementary capital of an insurer by the minimum capital it is required to meet; and
an integrated risk rating, which is a comprehensive rating system that the CIRC uses to evaluate an insurer’s overall solvency based on both quantitative assessments on quantifiable risks in Pillar I and qualitative risk assessments on unquantifiable risks in Pillar II.
The core solvency adequacy ratio and comprehensive solvency adequacy ratio of an insurer reflect the capital adequacy for quantifiable risks of such insurer, and the integrated risk rating reflects the overall solvency risks of such insurer.
The actual capital of an insurer is admitted assets less admitted liabilities, determined in accordance with relevant rules underC-ROSS. The actual capital is classified into core capital and supplementary capital, depending on the loss absorbing capacity and features of such capital. The minimum capital of an insurer is the capital that the CIRC requires it to meet.
UnderC-ROSS, solvency risks are classified into inherent risk and control risk. Inherent risk refers to the risks that are unavoidable in the writing of insurance business. Control risk refers to the risks of failure to identify, evaluate and manage control inherent risk timely due to imperfections in the internal management and control process. Inherent risk includes both quantifiable risks and unquantifiable risks.
Quantifiable risks include the following:
Insurance risk, which includes life insurance risk andnon-life insurance risk;
Market risk, which includes interest rate risk, equity price risk, property price risk, overseas assets price risk and foreign exchange risk; and
Credit risk, which includes spread risk and default risk.
Unquantifiable risks include the following:
Operation risk;
Reputation risk;
Strategy risk; and
Liquidity risk.
The minimum capital requirement for quantifiable risks is determined using a value at risk approach. The minimum capital requirement for control risk is determined based on solvency aligned risk management requirements and assessment, or SARMRA.
The CIRC comprehensively evaluates the inherent risk and control risk of an insurer and determines an integrated risk rating of solvency risks. Insurers will then be classified into the following four supervision categories:
Category A: an insurer’s solvency adequacy ratio meets the CIRC requirement, and its risk level is very low for the four unquantifiable risks;
Category B: an insurer’s solvency adequacy ratio meets the CIRC requirement, and its risk level is low for the four unquantifiable risks;
Category C: an insurer’s solvency adequacy ratio does not meet the CIRC requirement, or an insurer’s solvency adequacy ratio meets the CIRC requirement but its risk level is high for one or more of the four unquantifiable risks; or
Category D: an insurer’s solvency adequacy ratio does not meet the CIRC requirement, or an insurer’s solvency adequacy ratio meets the CIRC requirement but its risk level is serious for one or more of the four unquantifiable risks.
The CIRC applies different regulatory policies to each of the four supervision categories with respect to, among others, market access, product management, use of insurance funds andon-site inspection.
Category B insurer may be subject to a range of regulatory actions by the CBIRC, (formerly CIRC), including, among others, risk alert, supervisory conversation, rectification of identified problems within a specified deadline,on-site inspection or request to submit and implement plans to prevent insolvency or improve risk management.
If a Category C insurer does not meet the solvency adequacy ratio required by the CBIRC, (formerly CIRC), the CBIRC (formerly CIRC) may in such situations require the insurer to, in addition to the regulatory actions for category B, adjust its business structure, restrict business expansion and increase in assets, restrict the establishment of branch offices, restrict its commercial advertising activities, limit its business scope, transfer its insurance business to others or seek reinsurance of its insurance obligations, adjust investment portfolios or counterparties, limit its channels or percentages of investment, raise additional share capital, limit paying dividends on its shares, limit the remuneration of its directors and senior management or change its management team. If an insurer of category C meets the solvency adequacy ratio as required by the CBIRC (formerly CIRC) but its risk level is high for one or more of the four unquantifiable risks, the CBIRC (formerly CIRC) may take specific regulatory actions that target on the respective issues of each insurer.
For a Category D insurer the CBIRC (formerly CIRC) may, in addition to the regulatory actions for category C, require such insurer to rectify or cease part or all new business, put the insurer into receivership or take other regulatory actions as determined by the CBIRC (formerly CIRC).CBIRC.
Prior to the filing of this annual report, we became aware that, basedBased on the latest comprehensive rating results regarding the solvency risks of insurers released by the CBIRC for the fourth quarter of 2017,2019, we had been classified as a Category B insurer. Previously we were classified as a Category A insurer. It remains unclear whether the CBIRC will take any regulatory action with respect to our company or how these regulatory actions (if any) will affect our business or financial condition.
Our core solvency adequacy ratio as of December 31, 20172019 was 277.61 %,266.71%, and our comprehensive solvency adequacy ratio as of December 31, 20172019 was 277.65%276.53%.
Statutory deposits
Insurance companies in China are required to deposit an amount equal to 20% of their registered capital with at least two qualified commercial banks, each of which must, among other things, have net assets of no less than RMB 20 billion as of the end of the previous year and have no affiliated relationship with the insurance company. These funds may not be used for any purpose other than to pay off debts during a liquidation proceeding. Insurance companies must choose more than two qualified commercial banks as statutory deposit banks and the statutory deposit period must be for a minimum of one year. In addition, when an insurance company deposits the statutory funds for a business opening or capital increase, renews the deposit upon maturity or transfers the deposit to another bank, changes the nature of the deposit upon maturity or withdraws the deposit before maturity, the insurance company must file with the CBIRC (formerly CIRC) within 10 business days after these funds are duly deposited.
Statutory insurance fund
Chinese life insurance companies are required to contribute to a statutory insurance fund 0.15% of the premiums for life insurance with guaranteed earnings and 0.05% of the premiums for life insurance without guaranteed benefits; 0.8% of insurance premiums for short-term health insurance and 0.15% of insurance premiums for long-term health insurance; 0.8% of the premiums fornon-investment accident insurance, 0.08% of the premiums for investment accident insurance with guaranteed benefits, and 0.05% of premiums for investment accident insurance without guaranteed benefits. Contributions are not required once the balance of the statutory insurance fund of a life insurance company reaches 1% of the company’s total assets.
Statutory reinsurance
Insurance companies are required to reinsure, for any single risk, the excess of the maximum potential liability over an amount equal to 10% of the sum ofpaid-in capital and capital reserves.
Actuaries
Insurance companies are required to employ actuarial professionals and establish a system for actuarial reporting.
Regulation of corporate governance
Directors and senior management qualification and remuneration management requirements. Directors, supervisors and senior management of an insurance company are subject to qualification requirements implemented by the CBIRC (formerly CIRC).CBIRC. An insurance company must have at least three independent directors and the number of independent directors shall be no less than one third of the number of all the directors. In addition, if any of the cash benefits, subsidies and allowances thatshareholders of an insurance company paysholds more than 50% of the registered capital or equity of the company, then the number of independent directors must be no less than one half of the number of all the directors, unless such 50% or greater shareholder is an insurance group company or an insurance company. An insurance company must reasonably determine the remuneration paid to its directors, supervisors and senior management annually must not exceed 10% of their respective base remuneration.based on the company’s financial conditions, operating results, risk control and other factors. Where an insurance company has inadequate solvency, the CBIRC (formerly CIRC) will place restrictions on the remuneration of its directors, supervisors and senior management in accordance with relevant regulatory rules on solvency. The senior management of an insurance company receivein-office audits once every three years. If any member of the senior management leaves due to a job change, promotion or any other reasons, a departure audit must be conducted.
Risk management. Insurance companies must establish and adopt procedures, organizational structures, systems and measures to identify, evaluate and control the risks involved in its insurance operation. Insurance companies must report to the regulatory authorities in a timely manner any major risks, and submit an annual risk management report reviewed by the board of directors. In addition, as required by the CBIRC, (formerly CIRC), an insurance company that conducts certain activities, such as direct share investments, equity investments, real estate investments, investments in unsecured bonds, development of infrastructure investment schemes and real estate investment schemes and use of derivatives, must have at least two qualified risk officers. Where an insurance company decides to change a risk officer, impose disciplinary sanctions on a risk officer, dismiss a risk officer or terminate the employment of a risk officer, the insurance company must replace such risk officer within 10 business days from the date of the decision, and report to the CBIRC (formerly CIRC) the reasons for such replacement.
Asset-liability management. On March 1, 2018,July 24, 2019, the CIRCCBIRC released interim measures for the supervision and regulation of insurance asset-liability management. The new interim measures, as well as the other regulatory requirements including the previously issued rules on insurance asset-liability management, set forth a set of specific technical criteria and rules on the quantitative and competency assessments on insurers’ asset-liability management, as well as requirements on preparing and submitting asset-liability management reports. The new rules have been implemented on a pilot basis since their date of issue. Under the new rules,interim measures, the CBIRC will adopt differential regulation and supervision standards for insurance companies must file quarterly reportsdepending on asset-liability management with the CBIRC (formerly CIRC) within 30 days after the end of each quarter, and file annual reports on asset-liability management with the CBIRC (formerly CIRC) no later than May 31 of each year. Both the quarterly reports and the annual reports must be prepared in accordance with specified guidelines. In addition, insurance companies must completetheir respective asset-liability management competency assessments and file such assessments with the CBIRC (formerly CIRC) by August 31, 2018. During the pilot period, the CBIRC (formerly CIRC) will review the reports andquantitative assessment results submitted by the insurers but it will not take regulatory action.scores.
Compliance management. Insurance companies must prevent, identify, evaluate, report and manage compliance risks by taking measures such as setting up a compliance department, formulating and implementing compliance policies (which are required to be filed with the CBIRC (formerly CIRC))CBIRC), exercising compliance monitoring and providing compliance trainings, so as to ensure compliance by the company, its staff and sales agents with the relevant laws and regulations, rules of regulatory authorities, industrial self-regulatory rules, internal management systems and codes of ethics. An annual compliance report must be submitted to the CBIRC (formerly CIRC) by April 30 each year. Each insurance company is required by the CBIRC (formerly CIRC) to appoint a compliance officer and establish a compliance management department in its head office. Starting from June 1, 2016, whereWhere the proposed compliance head of an insurance company for whom the insurance company has applied for CBIRC approval of post-holding qualifications also serves in other senior management positions, the insurance company must submit a statement that the proposed compliance head will not also manage a business or financial department during his or her term of office. Beginning from July 1, 2017, the headquarter and provincial branches of an insurance company must each set up a compliance management department. Where the proposed compliance head of an insurance company for whom the insurance company has applied for approval of post-holding qualifications is to be served by a senior management person other than the general manager, the insurance company must submit a statement that the proposed compliance head will not also manage departments that may be in conflict with his or her responsibilities for compliance management, such as those for business, finance, fund use and internal audit during his or her term of office. As of the date of this annual report, we have set up a compliance management department, established compliance standards and appointed a compliance officer whose qualification has been approved by the CIRC.CBIRC.
Related party transactions.Insurance companies are required to establish a related party transaction control committee or designate their audit committee to be responsible for identifying related parties, managing, reviewing and approving related party transactions and controlling risks,risks. The related party transaction control committee must be composed of at least three directors, with an independent director acting as the person in charge. The related party transaction control committee should focus on the compliance, fairness and must update the recordsnecessity of related parties at least once every six months.party transactions. According to applicable CIRCCBIRC regulations, related party transactions between an insurance company and any of its related parties are classified as either “material related party transactions” or “ordinary related party transactions”. The term “material related party transactions” refers to any single transaction or a series of transactions within any given year between an insurance company or any of its controlled subsidiaries and a related party in which the trading volume exceeds RMB30 million and accounts for 1% or more of the insurance company’s net assets as of the end of the previous year or has a value of more than RMB 30 million, or transactions between an insurance company and a related party in which the accumulative trading volume within one fiscal year accounts for 5% or more of the insurance company’saudited net assets as of the end of the previous year. The term “ordinary related party transactions” refers to all related party transactions other than “material related party transactions”. A material related party transaction is subject to approvalmust be first reviewed by the insurer’srelated party transaction control committee, and then be approved by the board of directors, (the related board resolutions must be adopted by at leasttwo-thirdsvote of allmore than two thirds ofnon-affiliated directors, except for any related party transactions between an insurance group (holding) company and its insurance subsidiaries, as well as between and among its insurance subsidiaries themselves) or shareholders, while anby shareholders. An ordinary related party transaction is subject to reviewmust be reviewed in accordance with the internal management system and authorization process of the insurance company.company, and then be filed with or approved by the related party transaction control committee. An insurance company is required to maintain a system to manage related party transactions and file them with the CBIRC (formerly CIRC).CBIRC. Companies must take effective measures to prevent their shareholders, directors, supervisors, senior management and other related parties from taking advantage of their positions and acting against the interests of the company or the insured through related party transactions. In addition, an insurance company is required, within 10 business days after the conclusion of the transaction agreements (or within 10 business days from the occurrence of the relevant event if no transaction agreement is concluded), tomust report to the CBIRC (formerly CIRC) and make an announcement oneach of its website and the website of the Insurance Association of China if it conducts certainmaterial related party transactions, including, among others, transactions relating to investments of insurance funds and related party transactions that involve transfers of assetsthe execution, renewal or interests above a specified amount. In respectsubstantive change of any information that could not be publicly disclosedframework transaction agreement, as it involves state secrets or due towell as any other reasons, the insurance company must, at least five business days prior to the prescribed date of information disclosure, report this fact to the CBIRC (formerly CIRC) and refrain from disclosing such informationtransaction as required by law.the CBIRC.
Internal audit. Insurance companies are required to establish an independent department for internal audit purposes, staffed with sufficient internal audit personnel (the number of full-time internal audit personnel generally must not be less than 5‰ of the total number of the company’s employees), establish an audit committee, and designate an audit controller whose appointment and replacement must be filed with the CBIRC (formerly CIRC).CBIRC. An internal audit report must be submitted to the CBIRC (formerly CIRC) by April 30 of each year and any major risk identified during the internal audit process must be reported to the CBIRC (formerly CIRC) in a timely manner.
Reporting and disclosure requirements. An insurance company must submitdisclose to the CBIRC (formerly CIRC) an operating report, an actuarial report,public various information regarding its operations and business, including financial statements, aand accounting information, information on its insurance liabilities and reserves, risk management, its insurance products, solvency, reportmaterial related transactions and a compliance report, each prepared in accordance with applicable rules. Bymajor events, as well as other information required by the CBIRC. An insurance company must disclose this information on its website, and by April 30 of each year, an insurance company must also disclose an annual report on its website and a newspaperin media designated by the CBIRC (formerly CIRC) an annual report including, among other things, financial statements and solvency data for the previous year.CBIRC. In addition, within 10 business days after the occurrence of a material related party transaction or other material events, an insurance company must disclose information about such transactions and events on its website.
Internal control assessment. In January 2006, the CIRC issued tentative rules on internal control assessment of life insurance companies to facilitate and supervise the companies and improve their awareness of, and strengthen their controls over, matters such as corporate governance in management, internal controls and regulatory compliance in operations and risk management. Life insurance companies are required to submit to the CBIRC (formerly CIRC) an internal control assessment form and an annual internal control assessment report each year. The CBIRC (formerly CIRC) assesses the internal control of life insurance companies at least every three years, covering at least one third of all life insurance companies each year. Under the Basic Guidelines for Internal Controls in Insurance Companies issued by the CIRC in August 2010 and the Measures for Compliance Management of Insurance Companies issued by the CIRC in December 2016, which are effective from July 1, 2017, an insurance company must establish an internal control evaluation system in various operations including sales, operation, basic management and fund use, and by April 30 of each year, submit to the CBIRC (formerly CIRC) an evaluation report on its internal control. In addition, where the CBIRC (formerly CIRC) deems necessary, the CBIRC (formerly CIRC) may collect information reflecting the corporate governance of insurance companies, establish an information database of insurance companies’ governance, and conduct governance ratings for insurance companies throughon-site oroff-site investigations, media reports, assessments of independent rating agencies and public disclosure by insurance companies. The CBIRC (formerly CIRC) may take regulatory measures against insurance companies based on the rating results, including interviews, a risk warning in writing and rectifications within a specified period.
Custody of insurance assets. In October 2014, the CIRC and CBRC jointly issued a notice on regulating the insurance assets custody business. Under this notice, insuranceInsurance companies are required to establish and improve mechanisms for the custody of insurance assets, select qualified commercial banks and other professional institutions, place various assets generated by the investment of insurance funds under third-party custody and oversight, and ensure that the revenue and expenditure concerning the use of insurance funds (except for expenditure of daily expenses) are primarily processed through the custody fund accounts. Insurance companies are required to submit implementing plans relating to the custody of their insurance assets to the CBIRC (formerly CIRC).CBIRC.
Market conduct
Insurance companies are required to take steps to ensure that sales promotional materials used by their sales representatives and agents are objective, true and correct, with no material omissions or misleading information, contain no forecasts of benefits that are not guaranteed under the insurance or annuity product and do not exaggerate the benefits provided under the insurance or annuity product. The sales promotional materials must also highlight in an appropriate fashion any exclusions of coverage or liability in their products, as well as terms providing for policy or annuity surrenders and return of premiums. If any insurance policy or consulting service is provided through telephone sales, requisite office space, staff, facilities and adequate supervisingsupervision must be furnished. In addition, the telephone sale must be conducted directly by the insurance company, and the terms and rates of the premiums of the insurance policy and geographic business area must be submitted to the CBIRC (formerly CIRC) for approval.
Insurance companies which conduct marketing and promotional activities throughwe-media platforms (such as websites, apps, blogs, microblogs, corporate accounts and WeChat) are required to establish an appropriate management system. The management criteria of such system should be no less strict than the criteria provided in existing regulations in relation to the insurance promotional materials foroff-line channels.
Insurance companies are subject to extensive regulation against any anti-competitive behavior or unfair dealing conduct. They may not pay insurance agents, the insured or the beneficiary any rebates or other illegal payments, nor may they pay their agents commissions over and above the industry norm.
Insurance companies are required to establish internal rules and procedures to protect the personal data of policyholders and insureds. Insurance companies are prohibited from illegalillegally obtaining, using or selling of the personal data of policyholders and insureds.
Insurance companies are also required to comply with anti-money laundering regulations and establish internal operational procedures and anti-money laundering control systems. No insurance activity can be conducted for the purpose of illegal fundraising.
Regulation of issuance of subordinated debt
Beginning in September 2004, insuranceInsurance companies that meet a series of qualification tests and are approved by the CBIRC (formerly CIRC) may issue subordinated debt with a fixed term of at least five years to certain qualified Chinese legal persons and foreign investors. The audited net asset value of the issuer must be at least RMB 500 million as of the end of the prior year and the total amount of unpaid debt at any given point after the issuance, including both principal and interest, must not exceed the issuer’s net asset value as of the end of the prior year. Proceeds from the issuance of subordinated debt may be recorded as supplementary capital of an issuance company, provided that the total amount that has been recorded as supplementary capital may not exceed 50% of the net assets of an insurance company. Proceeds from the issuance of subordinated debt may not be used to offset daily operating losses of an insurance company. The issuer must comply with certain disclosure obligations both at the time of the issuance and during the term of the debt. The issuer may repay the debt only if its solvency ratio would remain at least 100% after the repayment of both principal and the interest. Since March 15, 2013, a qualifiedQualified insurance group (or holding) company isgroups or holding companies are also allowed to issue subordinated debt in accordance with the relevant requirements of the CIRC.requirements.
Beginning in MaySince 2012, publicly listed insurance companies that meet a series of qualification tests and are approved by the CBIRC (formerly CIRC) mayhave also been permitted to issue subordinated convertible bonds. Subordinated convertible bonds refer to bonds issued by an insurance company in accordance with statutory procedures that satisfy the following conditions: the bonds have a maturity of five years or longer; the principal and interest of the bonds shall be repaid and paid after insurance policy liabilities and other general liabilities in the event of bankruptcy liquidation; and the bonds can be converted into shares of the insurance company in accordance with the agreed conditions within a certain period of time. An insurance company must submit an issuance application to the relevant securities regulatory authority within six months after the CBIRC (formerly CIRC) has approved the issuance of subordinated convertible bonds. Anbonds, and an issuer must report the issuance information to the CBIRC (formerly CIRC) within ten working days after completion of the issuance of subordinated convertible bonds.
Regulation of issuance of capital replenishment bonds by insurance companies
Since January 2015, insurance companies including insurance group companies that meet a series of qualification tests and are approved by the CBIRC and PBOC may issue bonds for capital replenishment in the national inter-bank bond market. The capital replenishment bonds issued by an insurance company must have a maturity of at least five years and be repaid after insurance policy liabilities and other general liabilities, but prior to payment related to the equity capital of such insurance company. The audited net asset value of the issuer as of the end of the prior year and its net asset value in the latest quarterly financial statements must be no less than RMB 1 billion, and the total amount of its issued capital replenishment bonds and fixed-term subordinated debts pursuant to CBIRC requirements must not exceed 100% of the issuer’s net asset value. The issuer must comply with certain disclosure obligations both at the time of the issuance and during the term of the bonds. The issuer has the right to redeem the capital replenishment bonds after five years of its issuance provided that its solvency ratio is at least 100% after the redemption.
Regulation of merger and acquisition of insurance companies
An insurance company may apply to the CBIRC (formerly CIRC) for approval of the acquisition of control of another insurance company through the acquisition of equity or shares of the other insurance company. Except under special circumstances, such as a transfer between affiliated parties under common control or risk disposition, the acquiring party is not allowed to transfer the acquired equity or shares in the target insurance company within threefive years from the completion of the acquisition. Upon approval by the CBIRC, (formerly CIRC), the acquiring party may control two insurance companies engaging in the same type of business after the completion of acquisition. In addition, an insurance company may apply to the CBIRC (formerly CIRC) for approval for the merger with other insurance companies by absorption or establishing a new insurance company. The business scope of the insurance company subsequent to the merger is subject to there-approval by the CBIRC (formerly CIRC).CBIRC. An insurance company must, during the twelve-month period after the completion of merger or acquisition, report the following information in writing to the CBIRC (formerly CIRC) within the first 30 days of each quarter: the making of investments in and purchases or sales of material assets, related party transactions, business transfers, notifications to insurance consumers, public announcements, changes of senior management personnel and employee placements.
Regulation of establishment and management ofnon-insurance subsidiaries
An insurance company may apply to the CBIRC (formerly CIRC) for approval for the direct or indirect establishment of domestic or overseasnon-insurance subsidiaries (excluding insurance companies, insurance asset management institutions, dedicated insurance agencies, insurance brokerage institutions and insurance assessment institutions), primarily including: (1) financial institutions that engage innon-insurance financial services; (2) service firms that provide various supporting services to insurance companies; (3) investment platform companies with a strong connection with an insurance business, project companies established for managing the investment of insurance funds in real properties, and companies formed as a result of the investment of insurance funds in the upstream and downstream industry chain of an insurance business; and (4) other types of companies. Unless otherwise prescribed by laws, administrative regulations and the CBIRC, (formerly CIRC), an insurance company is not allowed to guarantee the debts of itsnon-insurance subsidiaries, or lend funds to itsnon-insurance subsidiaries. An insurance company must build firewalls between itsnon-insurance subsidiaries in terms of personnel, capital, business and information to prevent risks spreading from itsnon-insurance subsidiaries. An insurance company must also cause itsnon-insurance subsidiaries to establish and improve their respective information disclosure systems, and submit to the CBIRC (formerly CIRC) an annual report on itsnon-insurance subsidiaries by April 30 of each year.
Regulation of establishment of overseas insurance institutions
An insurance company may apply to the CBIRC (formerly CIRC) for approval for the establishment of overseas branches, overseas insurance companies and overseas insurance intermediaries, or the acquisition of overseas insurance companies or intermediaries. In order to submit such an application, an insurance company must have an operating history of no less than two years, total assets of no less than RMB 5 billion as at the end of the prior year and foreign exchange funds of no less than US$ 15 million or its equivalent in other freely convertible currencies as at the end of the preceding year. The applicant insurance company must also comply with applicable solvency, risk management and other requirements as stipulated by the CBIRC (formerly CIRC).CBIRC.
Compliance with regulatory requirements
Our management confirms that we have complied in all material respects with all applicable regulatory requirements set out above.
Regulation of Foreign-Invested Insurance Companies
China acceded to the WTO on December 11, 2001. As a result of China’s commitments in connection with the accession, the Chinese insurance market is gradually opening up to foreign insurers and insurance-related service providers. A foreign life insurer with total assets of no less than US$ 5,000 million and 30 years of industry experience in any WTO member country, and which has had a representative office for two years in China, is permitted to form a life insurance joint venture with a domestic partner of its choice. Foreign life insurers may own up toone-half of the joint venture. In addition, theThe geographic limitation on foreign life insurers, which were permitted to operate only in specified cities, has been lifted since December 11, 2004. Accordingly, foreign life insurers have been permitted to provide group life insurance, health insurance and annuity and other pension-like products since December 11, 2004. In addition, sinceSince December 11, 2006, foreign insurance brokers have been permitted to set up wholly owned subsidiaries in China. In December 2019, the CBIRC announced that starting from January 1, 2020, the 51% cap on foreign ownership in Chinese life insurers will be removed and foreign investors will be allowed to own 100% in Chinese life insurers, and the CBIRC also removed the requirements that a foreign insurance company must have engaged in insurance business for more than 30 years and have maintained a representative office in China for at least two years before it can establish a foreign invested insurance company in China.
Foreign-invested insurance companies, including Sino-foreign equity joint ventures, wholly foreign-owned insurance companies and branches of foreign insurance companies, are generally regulated in the same manner as domestic insurance companies. Without the approval of the CBIRC, (formerly CIRC), foreign-invested insurance companies may not engage in asset purchases and sales or other transactions with their affiliates, but may engage in outward and inward reinsurance with their affiliates. In addition, where the foreign-invested insurance company is a branch of a foreign insurance company, it is required to notify the CBIRC (formerly CIRC) of fundamental events relating to the foreign insurance company within ten days following the occurrence of the event. Reportable events include: (1) a change of name, senior management or jurisdiction of incorporation of the foreign insurance company, (2) a change in the foreign insurance company’s share capital, (3) a change in any person beneficially owning 10% or more of the foreign insurance company’s shares, (4) a change in business scope, (5) the imposition of administrative sanctions by any applicable regulatory authority, (6) a material loss incurred by the foreign insurance company, (7) aspin-off, merger, dissolution, revocation of corporate franchise or bankruptcy involving the foreign insurance company and (8) other events specified by the CBIRC (formerly CIRC).CBIRC. If the foreign insurance company is dissolved, or its corporate franchise is revoked or it is declared bankrupt, the Chinese branch of the foreign insurance company will be prohibited from conducting any new business.
Beginning in June 2012, the CIRC has delegatedThe CBIRC delegates certain authorities with respect to foreign-invested insurance companies to its provincial and local branch offices: approving the change of place of business of branches and subsidiaries of foreign-invested insurance companies; approving the establishment of subsidiary agencies of foreign-invested insurance companies below the branch-office level; approving the opening of subsidiary agencies of foreign-invested insurance companies below the branch-office level; and approving the qualification of senior management personnel of subsidiary agencies of foreign-invested insurance companies below the branch-office level.
Regulation of Insurance Asset Management Companies
An insurance asset management company is a limited liability company or joint stock company that manages insurance funds on behalf of others. Insurance asset management companies are regulated by the CBIRC (formerly CIRC).CBIRC.
Minimum capital requirements
The registered capital of an insurance asset management company may not be lower than RMB 100 million or the equivalent amount of other freely convertible currencies.
Business operations
An insurance asset management company may conduct the following businesses: (1) managing funds in Renminbi or other foreign currencies entrusted to it, including insurance funds, funds of pension, annuity and housing provident institutions, as well as funds of other qualified investors that are capable of identifying and undertaking corresponding risks; (2) managing and operating its own insurance funds in Renminbi or foreign currencies; (3) as trustee, carrying out asset management business appointed by and on behalf of the trustor, or developing asset management products for the interest of the beneficiary or for specific purposes and carrying out asset management business; (4) applying to relevant financial regulatory authorities to carry out publicly-raised asset management business in accordance with the law, provided that relevant conditions are met; (5) as approved by the CBIRC, (formerly CIRC), issuing relevant asset management products to domestic insurance groups or holding companies, insurance companies, insurance asset management companies and other qualified investors capable of identifying and bearing the applicable risk; and (6) other businesses approved by the CBIRC (formerly CIRC) or other departments of the State Council.
The investments of the insurance funds by insurance asset management companies are subject to the same requirements and limitations applicable to the investments by the insurance companies themselves. With the regulatory expansion of insurance company investment channels, the investment channels of insurance asset management companies over their own funds have been expanded as well to cover subordinated bonds issued by banks and insurance companies, bank subordinated bonds and stock investments.
Insurance asset management companies are also subject to the governance of regulations which generally apply to the asset management businesses of financial institutions. Starting from April 27, 2018, the asset management businesses of financial institutions are subject to new supervision rules, which apply to the participation of insurance funds in publicly-offered funds, private equity funds, trust schemes, equity investment schemes, debt investment schemes and portfolio insurance asset management products through the asset management products of insurance asset management companies.
In connection with the funds being managed by an insurance asset management company, a custodian is required to be appointed. The custodian must be an independent commercial bank or financial institution satisfying applicable CIRCCBIRC requirements.
Shareholding restrictions
At least 75% of the shares of an insurance asset management company must be owned by domestic insurance companies, and at least one of the shareholders of an insurance asset management company must be an insurance company or insurance holding company satisfying specified requirements.
Investment risk control
Both insurance companies and asset management companies must establish structures, arrangements and measures to recognize, assess, manage and control investment risks. Members of senior management may not be responsible for the management of departments in charge of investment decisions, investment transactions and risk controls at the same time. Branches of insurance companies may not manage insurance funds. Insurance asset management companies must arrange for separate investment managers to manage their own funds and the insurance funds from other insurance companies, as well as insurance funds from an insurance company that are of a different nature.
Major emergency response management
An insurance asset management company is required to establish a monitoring and precaution mechanism for major emergencies.
Regulation of Insurance Agencies, Insurance Brokers and Other Intermediaries
Insurance agents are business entities or individuals which or who act on behalf of an insurance company in respect of insurance matters. An insurance company is responsible for the acts of its agents when the acts are within the scope of their agency. Licensed insurance agencies fall into two groups: dedicated agencies andnon-dedicated agencies.
A dedicated agency is a company (and its branches) organized under the PRC company law whose principal business is to act as an agent of insurance companies. Dedicated agencies are subject to minimum capital and other requirements, and their business is generally limited to insurance-related activities.
Anon-dedicated agency is a business entity whose principal business is other than as an insurance agency. To receive a license, the agency business must have a direct relationship with its principal business, which the CIRCCBIRC has interpreted as permitting commercial banks to act asnon-dedicated insurance agencies. Sales representatives of insurance companies are prohibited from selling insurance products at commercial bank outlets. The bancassurance management personnel of insurance companies are responsible for providing services (including training and the exchange of documents) to commercial banks and assisting commercial banks to provide related customer services, such as the payment of maturity benefits and handling of renewal fee after selling insurance products.
Prior to August 3, 2015, individual insurance agents, representatives of insurance agencies and insurance brokers were required to obtain qualification certificates issued by the CIRC. Under such CIRC regulations, we were subject to sanctions if we retained exclusive agents without CIRC qualification certificates, and policyholders who bought insurance policies through our unqualified agents were allowed to cancel the policies under some circumstances. On August 3, 2015, the CIRC issued a Notice on the Administration of Insurance Intermediary Personnel, effective on the same day. Under the new regulations, the CIRC canceled the requirements on qualification certificates or practice certificates for individual insurance agents, representatives of insurance agencies and insurance brokers, with the effect that insurance companies are now only required to complete registration for their individual insurance agents in the insurance intermediary regulatory information system maintained by the CIRC. In addition, insurance companies are required to take adequate measures to ensure the good conduct and professional competence of their individual insurance agents, representatives of insurance agencies and insurance brokers.
All insurance agencies and agents are required to enter into agency agreements that specify the duration of the agency; the amount of the agency fee and the method of payment; the scope of the agency, including the insurance products to be marketed; and other relevant matters. Absent specific CBIRC (formerly CIRC) approval, insurance agents are prohibited from signing insurance and annuity products on behalf of the insurance companies they represent. None of our agents is authorized to sign insurance policies or annuity contracts for us.
Insurance agencies are required to open special accounts for the handling of funds that they hold or collect for the insurance companies they represent. They may not engage in the following activities: dealing with unauthorized insurers or insurance intermediaries, engaging in activities beyond their authorized business scope or geographical area, causing injury to the rights of the insurance companies they represent, spreading rumors or otherwise injuring the reputation of others in the insurance industry, misappropriating the funds of the insurance companies they represent, defrauding insurance customers through false or misleading representations or material omissions, using undue influence to induce insurance customers to purchase insurance, or defrauding the insurance companies they represent through collusion with the insured or the insurance beneficiary. In addition, dedicated insurance agencies are subject to various reporting requirements, including submission of annual financial reports, and are subject to supervision and examination by the CBIRC (formerly CIRC).CBIRC.
Insurance brokers who represent individuals and companies purchasing insurance and other intermediaries are subject to similar regulatory requirements regarding their activities. Among other things, they are subject to supervision and examination by the CBIRC, (formerly CIRC), and fundamental corporate changes must be approved by the CBIRC (formerly CIRC).CBIRC. Only companies organized under the PRC company law and meeting requirements set by the CBIRC (formerly CIRC) are authorized to act as insurance brokers. Insurance brokers are required to comply with standards prescribed by the CBIRC (formerly CIRC).CBIRC. Insurance brokerage agencies must provide training to their brokerage personnel regarding insurance laws and provide education on ethics and other matters.
Regulation of Internet Insurance Businesses
Insurance companies and intermediaries are allowed to carry out an Internet-based insurance business, including sales, underwriting, claims settlement, policy surrender, complaint handling, customer services and other insurance business activities, through proprietary network platforms or third-party network platforms that meet the relevant requirements prescribed by the CBIRC (formerly CIRC).CBIRC. Insurance companies and intermediaries that carry out an internet-based insurance business must set up an information disclosure column on their official websites, disclosing the related website names and addresses, internet insurance products, existing branches, customer services and ways for consumers to make complaints. The CBIRC (formerly CIRC) is required to carry out regulation andon-site inspection of an internet insurance business, and may take rectification measures against insurance companies and intermediaries that conduct operations in violation of the regulations. Insurance companies engaging in internet-based guaranteed insurance businesses, which use internet credit lending platforms as intermediaries to provide both the borrowers (i.e., insurance applicants) and the lenders (i.e., the insured) on such platforms with guaranteed insurance services, must comply with regulatory requirements on solvency, verify the qualifications of insurance applicants in a prudent manner, clarify the information disclosure obligations of the internet platforms, enhance product management and adhere to other compliance requirements stipulated by the CBIRC (formerly CIRC).CBIRC.
No.2 Interpretation of Accounting Standard for Business Enterprises
On August 7, 2008, the MOF issued the No.2 Interpretation of Accounting Standard for Business Enterprises, requiring listed companies which issue both H shares and A shares to adopt consistent accounting policies to recognize, calculate and report a particular transaction in their H share financial statements and A share financial statements, except for certain differences in relation to the reversal of impairment losses of long-term assets and disclosures in relation to related party transactions.
On January 5, 2009, the CIRC issued the Notification on the Implementation of the No.2 Interpretation of Accounting Standards for Business Enterprises in the Insurance Sector (No.1 [2009] of CIRC), which requires insurance companies to make appropriate changes to their accounting policies that cause differences between onshore and offshore financial statements when preparing their 2009 annual financial statements, such that the same accounting policies and estimates will apply to a particular transaction.
On December 22, 2009, the MOF issued the Notification on the Promulgation of the Regulations regarding the Accounting Treatment of Insurance Contracts, which regulates issues relating to, among other things, the unbundling of mixed insurance contracts, tests for significant insurance risks and the calculation of reserves for insurance contracts, and requires insurance companies to comply with these requirements beginning with the preparation of their financial statements for the year ended December 31, 2009. The accounting treatment of any transaction item adopted in previous year which differs from those set out in the MOF’s regulations must be retrospectively adjusted, unless any such adjustment is not practicable under the circumstances.
Implementation of VAT
Following the decision of the PRC State Council, the Value Added Tax, or VAT, has applied to the financial and insurance sector since May 1, 2016. Therefore, our primary business has been subject to 6% VAT from May 1, 2016 instead of the 5% business tax, or BT, which previously had applied to our business.
Policy onpre-tax deduction of underwriting and policy acquisition costs
In May 2019, the MOF and SAT issued a policy onpre-tax deduction of underwriting and policy acquisition costs of insurance companies. Under the policy, from January 1, 2019, the underwriting and policy acquisition costs incurred by insurance companies in connection with their operating activities that do not exceed 18% of the balance of total premium income for the year, after deducting surrender payments and other expenses, can be deducted when calculating taxable income, and the portion that exceeds 18% can be carried forward and deducted in following years. The implementationpolicy applies to the final settlement of VAT has had an effectenterprise income tax of insurance companies for the 2018 tax year. Therefore, thepre-tax deduction percentage for enterprise income tax on our businessunderwriting and operations, including, among other things,policy acquisition costs has been adjusted to 18% from the previous 10%, which will result in a reduction in our product developmentincome tax in 2019 and pricing, finance management, managementfuture years.
Administrative Penalty by the PBOC
In July 2018, the PBOC imposed a fine of receiptsRMB 700,000 on us fornon-compliance with anti-money laundering laws and IT systems. However,regulations during the period from July 1, 2015 to June 30, 2016. Thenon-compliance issues identified by the PBOC include failure to preserve clients’ identity information and transaction records and failure to submit reports on transactions of large payments and suspicious transactions to the PBOC. We have taken corrective measures and improved our management believes thatanti-money laundering system by refining the implementation of VAT hasprocess for identifying customers’ data, retaining transaction records and reporting large payment transactions and suspicious transactions. The fine imposed by the PBOC did not had any knownhave a material impact on our overall operating resultsthe business operations and financial conditions.results of our company.
Audit by the PRC National Audit Office
In 2015, the National Audit Office of the People’s Republic of China, or the NAO, conducted a routine audit on the assets, liabilities and profits and losses of CLIC and its subsidiaries (including China Life) for the year of 2014. On June 29, 2016, the NAO released on its website the audit results. We believe that the issues identified in the audit have no material impact on our overall operating results, financial statements and internal control over financial reporting. We disclosed the audit results on Form6-K filed with the SEC on June 29, 2016.
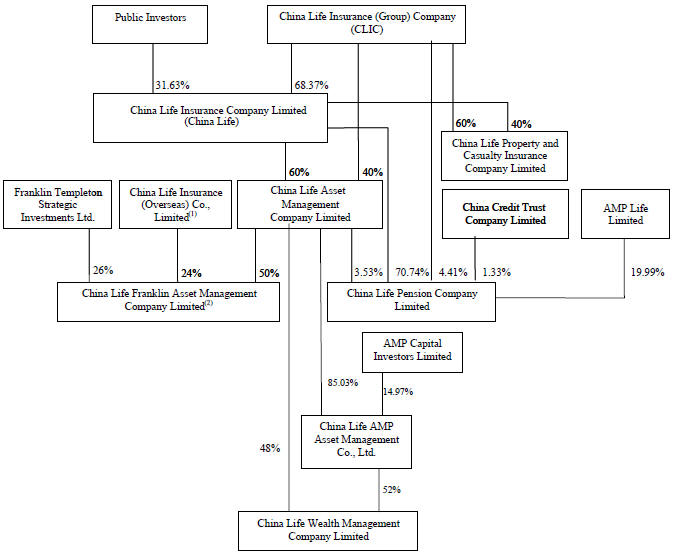
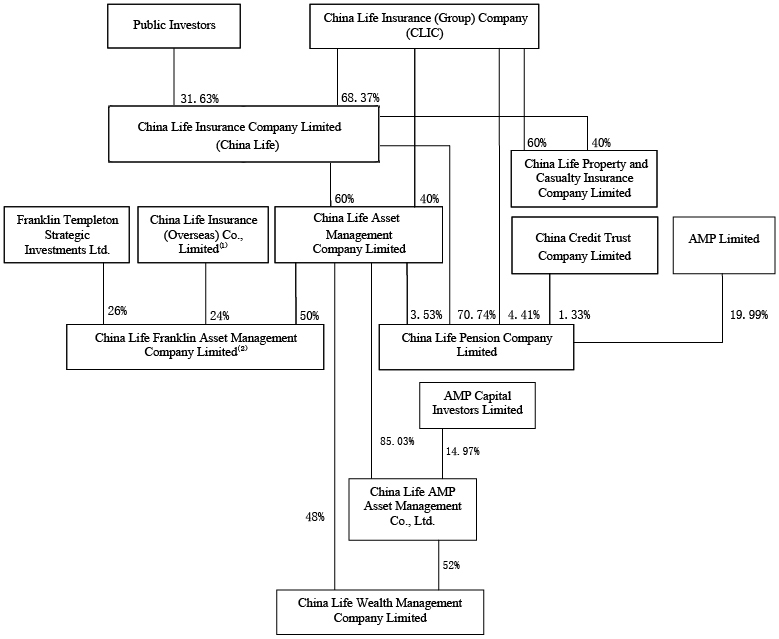
List of Significant Subsidiaries
Name of Subsidiary | Jurisdiction of Incorporation | Proportion of Ownership Interest Owned by China Life | ||
中国人寿资产管理有限公司 China Life Asset Management Company Limited | The People’s Republic of China | 60% (directly) | ||
中国人寿富兰克林资产管理有限公 司 China Life Franklin Asset Management Company Limited(1) | Hong Kong | 50%(2) (indirectly through affiliate) | ||
中国人寿养老保险股份有限公司 China Life Pension Company Limited | The People’s Republic of China | 74.27%(3) (directly and indirectly through affiliate) | ||
国寿安保基金管理有限公司 China Life AMP Asset Management Co., Ltd. | The People’s Republic of China | 85.03%(4) (indirectly through affiliate) | ||
国寿财富管理有限公司 China Life Wealth Management Company Limited | The People’s Republic of China | 100%(5) (indirectly through affiliate) | ||
| (1) | Formerly known as China Life Asset Management (Hong Kong) Company |
| (2) | AMC, which is 60% owned by us, owns 50%. |
| (3) | We own 70.74% and AMC, which is 60% owned by us, owns 3.53%. |
| (4) | AMC, which is 60% owned by us, owns 85.03%. |
| (5) | AMC, which is 60% owned by us, owns 48%, and China Life AMP, which is 85.03% owned by AMC, owns 52%. |
D. PROPERTY, PLANTS AND EQUIPMENT
As of December 31, 2017,2019, we owned and leased 4,0964,171 and 13,19411,887 properties, respectively, and had 305307 properties under construction. Among the 4,0964,171 properties owned by us, 2,3901,639 properties are leased to third parties (including partial leasing) while the remaining properties are mainly occupied by us as office premises. Nine properties are recognized as investment properties.
On December 29, 2017, we entered into a new property leasing agreement with China Life Investment Holding Company Limited, or IHC. Under this property leasing agreement, which will expire on December 31, 2020, IHC agreed to lease to us 1,893 properties owned by it. The annual rent is determined by reference to market rent or, where there is no available comparison, by reference to the costs incurred by IHC in holding and maintaining the properties, plus a margin of approximately 5%.
ITEM 4A. UNRESOLVED STAFF COMMENTS.
None.
ITEM 5. OPERATING AND FINANCIAL REVIEW AND PROSPECTS.
You should read the following discussion and analysis in conjunction with the audited consolidated financial statements and accompanying notes included elsewhere in this annual report.
Overview of Our Business
We are the leading life insurance company in China. We provide a broad range of insurance products, including individual and group life insurance, annuity contracts, health insurance and accident insurance products. We had nearly 268303 million insurance policies in force as of December 31, 2017,2019, including individual and group life insurance policies, annuity contracts, health insurance and accident insurance policies.
We report our financial results according to the following three principal business segments:
| • | Life insurance, which offers participating andnon-participating life insurance and annuities to individuals and groups. |
| • | Health insurance, which offers short-term and long-term health insurance to individuals and groups. The financial results of our supplementary major medical insurance are also reflected in our health insurance business segment. |
| • | Accident insurance, which offers short-term and long-term accident insurance to individuals and groups. |
In addition, we have an “other” reporting segment, in which we primarily report the income and cost of the agency business in respect of transactions with CLIC and other companies, net share of profit of associates and joint ventures, income and expenses of subsidiaries, and unallocated income and expenditure of our company.SeeNotecompany.See Note 5 to our consolidated financial statements included elsewhere in this annual report.
Financial Overview of Our Business
We had total gross written premiums of RMB 511,966567,086 million (US$ 78,68881,457 million) and net profit of RMB 32,75259,014 million (US$ 5,0348,477 million) for the year ended December 31, 2017.2019. Our principal business segments had the following results:
| • | Life insurance had total gross written premiums of RMB |
| • | Health insurance had total gross written premiums of RMB |
| • | Accident insurance had total gross written premiums of RMB |
Our business has been characterized by growth of premium income over the past several years, together with a move towards an improved business structure which has been evidenced by a rapid increase in first-year regular premiums, with the percentage of first-year regular premiums for products with regular premiums of ten years or more in first-year regular premiums being above 50% since 2013. At the same time, our business has also been affected by certain unfavorable factors, including the increasing cross-industry competition from companies in other financial industries, and the rapid development of the insurance companies owned or controlled by commercial banks and some other small andmedium-sized insurance companies, which have secured an increasing market share, as well as the changing economic and investment environment within China, including slowing economic growth and fluctuations in interest rates.
Factors Affecting Our Results of Operations
Revenues, Expenses and Profitability
We earn our revenues primarily from:
insurance premiums from the sale of life insurance policies and annuity contracts, including participating andnon-participating policies and annuity contracts with life contingencies, as well as accident and health insurance products. Net premiums earned accounted for 78.79%76.81% of total revenues in 2017.2019.
investment income and net realized gains on financial assets, net fair value gains through profit or loss. Investment income and net realized gains on financial assets, net fair value gains through profit or loss accounted for 20.04%22.07% of total revenues in 2017.2019.
In addition, following the restructuring, we receive service fees for policy management services we provide to CLIC. AMC also receives asset management fees for asset management services provided to CLIC. See “Item 7. Major Shareholders and Related Party Transactions—Related Party Transactions”.
Our operating expenses primarily include:
insurance benefits provided to our policyholders, accident and health claims and claim adjustment expenses;
investment contract benefits;
policyholder dividends resulting from participation in profits;
underwriting and policy acquisition costs; and
administrative and other expenses.
We also pay rent to IHC on the properties we lease from it.
Our profitability depends principally on our ability to price and manage risk on insurance and annuity products, our ability to maximize the return on investment assets, our ability to attract and retain customers, and our ability to manage expenses. In particular, factors affecting our profitability include:
our ability to design and distribute products and services and to introduce new products which gain market acceptance on a timely basis;
our ability to price our insurance and investment products at levels that enable us to earn a margin over the costs of providing benefits and the expense of acquiring customers and administering those products;
our returns on investment assets;
our mortality and morbidity experience, which affects our insurance reserves;
our lapse experience, which affects our ability to recover the cost of acquiring new business over the lives of the contracts;
our cost of administering insurance contracts and providing customer services;
our ability to manage liquidity, market and credit risk in our investment portfolio and to manage duration risk in our asset and policy portfolios through asset-liability management; and
changes in regulations.
In addition, other factors, such as competition, securities market conditions, taxes and general economic conditions, affect our profitability.
Interest Rates
For our long-term life insurance products including annuity products, we are obligated to pay contractual benefits to our policyholders or the beneficiaries based on a guaranteed interest rate,which is established when the product is priced. These products expose us to the risk that changes in interest rates may change our “spread”, or the difference between the amount of return we are able to earn on our investments and the amount of return we are required to pay under the policies. In August 2013, February 2015 and September 2015, the CIRC removed the 2.50% cap on the guaranteed interest rates for the traditional participating insurance policies, universal life insurance policies, and participating life insurance policies, respectively. From October 1, 2015, the guaranteed interest rates of all long-term life insurance products are to be decided by insurance companies at their discretion in accordance with the principle of prudence, but CBIRC (formerly CIRC) approval is required for products with guaranteed interest rates above the maximum valuation rate set by the CIRC,CBIRC, which varies by product. If the rates of return on our investments fall below the rates we guarantee, our profitability would be adversely affected. In November 2014, the interest rate onone-year term deposits, a key benchmark rate, was reduced from 3.00% to 2.75%, and in 2015, the interest rate was further reduced five times from 2.75% to 1.50%.As of the date of this annual report, this interest rate remained unchanged.Ifunchanged. If economic conditions change in the future, the Chinese government may adjust the interest rates accordingly. As of December 31, 2017,2019, the average guaranteed rate of return for all of our long-term insurance policies in force was 2.62%2.71%, while our investment yields for the years ended December 31, 2017, 20162019, 2018 and 2015 were2017were 5.24%, 3.29% and 5.16%, 4.61% and6.47%, respectively.However, if the rates of return on our investments were to fall below the rates we guarantee, our profitability would be materially and adversely affected. If the interest rates were to be increased, but we did not raise the guaranteed rates of our products, sales of some of our products could be adversely impacted.
Interest rates also affect our returns on investment assets, a large proportion of which is held in negotiated bankterm deposits and debt securities. In a declining interest rate environment, interest rate changes expose us to reinvestment risks. In a rising interest rate environment, higher rates may yield greater interest income but also may generate unrealized capital losses forresult in a decline in the fair value of debt securities designated as trading, causing us to incur realized capital losses for securities we reinvest or requiring us to take an impairment if the market value of debt securities declines for an extended period.trading.
For further information on our exposure to interest rate risk, see “Item 11 Quantitative and Qualitative Disclosure about Market Risk—Interest Rate Risk” andNoteand Note 4 to our consolidated financial statements included elsewhere in this annual report.
Investments
As an insurance company, we have beenare permitted to invest in five categories of investment assets, including liquidity assets, fixed income assets, equity assets, real properties and other financial assets. However, we are limited by Chinese laws and regulations in the maximum amount that we may invest in each type of assets. See “Item 4. Information on the Company—Business Overview—Investments” and “Item 4. Information on the Company—Business Overview—Regulatory and Related Matters—Insurance Company Regulation—Regulation of investments”. Our material concentration risks relate to our investments in bank deposits and Chinese government securities.
Our investments are subject to risks. Volatility or declines in Chinese and international financial markets may expose us to higher market and credit risks, such as when domestic and international economic conditions differ from market expectations. We may also invest in new investment channels, use new investment tools or engage new investment managers, which may expose us to new risks. These factors could affect our investment income and the book value of our investment assets. In addition, as a portion of our investment assets are held in foreign currencies, our investment results may also be subject to foreign exchange gains and losses due to changes in exchange rates. Furthermore, our investments in associates are also affected by the operational conditions, financial risks and volatility in profits of these associates, which, in turn, will affect our profitability. See “Item 3. Key Information—Risk Factors—Risks Relating to Our Business—Our investments are subject to risks”.
Our results can be materially affected by investment impairments. The following table sets forth impairment charges and reversal of impairment charges, which are included in net realized gains on financial assets and net gains on investments of associates and joint ventures, for the years ended December 31, 2015, 20162017, 2018 and 2017.
| Impairment | For the year ended December 31, | For the year ended December 31, | ||||||||||||||||||||||||||||||
| 2015 | 2016 | 2017 | 2017 | 2017 | 2018 | 2019 | 2019 | |||||||||||||||||||||||||
| (RMB in millions) | US$ | (RMB in millions) | US$ | |||||||||||||||||||||||||||||
Debt securities | — | (143 | ) | (114 | ) | (17.52 | ) | (114 | ) | (42 | ) | (3,749 | ) | (539 | ) | |||||||||||||||||
Equity securities | (321 | ) | (2,513 | ) | (2,643 | ) | (406.22 | ) | (2,643 | ) | (8,163 | ) | (2,638 | ) | (379 | ) | ||||||||||||||||
Associates and joint ventures | — | — | (1,500 | ) | (215 | ) | ||||||||||||||||||||||||||
|
|
|
|
|
|
|
| |||||||||||||||||||||||||
Total | (321 | ) | (2,656 | ) | (2,757 | ) | (423.74 | ) | (2,757 | ) | (8,205 | ) | (7,887 | ) | (1,133 | ) | ||||||||||||||||
|
|
|
|
|
|
|
| |||||||||||||||||||||||||
During the year ended December 31, 2017,2019, we recognized an impairment expense of RMB 2,6432,638 million (US$ 406million)379 million) foravailable-for-sale equity securities for which we determined that objective evidence of impairment existed. During the year ended December 31, 2016,2018, we recognized an impairment expense of RMB 2,5138,163 million foravailable-for-sale equity securities for which we determined that objective evidence of impairment existed. During the year ended December 31, 2015,2017, we recognized an impairment expense of RMB 3212,643 million foravailable-for-sale equity securities for which we determined that objective evidence of impairment existed. Our rationale for the impairment is based on a severe or prolonged decline in value. These securities were not impaired due to company-specific events such as bankruptcies.
During the year ended December 31, 2019, we recognized an impairment expense of RMB 3,749 million (US$ 539 million) in debt securities. During the year ended December 31, 2018, we recognized an impairment expense of RMB 42 million in debt securities. During the year ended December 31, 2017, we recognized an impairment expense of RMB 114 million (US$ 18 million) in debt securities.
During the year ended December 31, 2016,2019, we recognized an impairment expense of RMB 1431,500 million (US$ 215 million) in debt securities.associates and joint ventures. During the yearyears ended December 31, 2015,2018 and December 31, 2017, we did not recognize anyrecognized no impairment expense in debt securities,associates and no previously recognized impairment losses in debt securities were reversed.joint ventures.
Available-for-sale securities comprised of the following asset classes as of December 31, 2015, 20162017, 2018 and 2017.
| As of December 31, | As of December 31, | |||||||||||||||||||||||||||||||||||||||||||||||
| 2015 | 2016 | 2017 | 2017 | 2018 | 2019 | |||||||||||||||||||||||||||||||||||||||||||
| Cost or amortized cost | Estimated fair value | Cost or amortized cost | Estimated fair value | Cost or amortized cost | Estimated fair value | Cost or amortized cost | Estimated fair value | Cost or amortized cost | Estimated fair value | Cost or amortized cost | Estimated fair value | |||||||||||||||||||||||||||||||||||||
| (RMB in millions) | (RMB in millions) | |||||||||||||||||||||||||||||||||||||||||||||||
Debt securities | ||||||||||||||||||||||||||||||||||||||||||||||||
Government bonds | 23,750 | 25,713 | 20,173 | 21,653 | 24,818 | 24,632 | 24,818 | 24,632 | 26,759 | 28,440 | 22,500 | 23,758 | ||||||||||||||||||||||||||||||||||||
Government agency bonds | 134,021 | 145,399 | 140,444 | 146,310 | 164,331 | 157,765 | 164,331 | 157,765 | 172,250 | 180,273 | 163,678 | 171,189 | ||||||||||||||||||||||||||||||||||||
Corporate bonds | 196,408 | 206,766 | 183,408 | 188,337 | 199,613 | 197,133 | 199,613 | 197,133 | 181,178 | 185,720 | 145,033 | 148,455 | ||||||||||||||||||||||||||||||||||||
Subordinated bonds/debt | 17,771 | 19,298 | 15,948 | 16,708 | 13,588 | 13,495 | 13,588 | 13,495 | 20,953 | 21,514 | 53,062 | 53,922 | ||||||||||||||||||||||||||||||||||||
Other | 4,723 | 4,722 | 26,773 | 26,750 | 62,651 | 62,099 | 62,651 | 62,099 | 78,136 | 80,643 | 109,729 | 112,467 | ||||||||||||||||||||||||||||||||||||
|
|
|
|
|
|
|
|
|
|
|
| |||||||||||||||||||||||||||||||||||||
Subtotal | 376,673 | 401,898 | 386,746 | 399,758 | 465,001 | 455,124 | 465,001 | 455,124 | 479,276 | 496,590 | 494,002 | 509,791 | ||||||||||||||||||||||||||||||||||||
|
|
|
|
|
|
|
|
|
|
|
| |||||||||||||||||||||||||||||||||||||
Equity securities | ||||||||||||||||||||||||||||||||||||||||||||||||
Funds | 150,199 | 163,366 | 114,373 | 105,290 | 97,516 | 91,344 | 97,516 | 91,344 | 115,949 | 92,304 | 97,208 | 102,349 | ||||||||||||||||||||||||||||||||||||
Common stocks | 57,110 | 74,629 | 110,774 | 110,653 | 124,090 | 129,424 | 124,090 | 129,424 | 160,231 | 143,469 | 217,564 | 236,323 | ||||||||||||||||||||||||||||||||||||
Other | 124,016 | 130,623 | 143,161 | 150,722 | 127,689 | 134,842 | 127,689 | 134,842 | 126,253 | 138,170 | 195,360 | 210,494 | ||||||||||||||||||||||||||||||||||||
|
|
|
|
|
| |||||||||||||||||||||||||||||||||||||||||||
Subtotal | 331,325 | 368,618 | 368,308 | 366,665 | 349,295 | 355,610 | 349,295 | 355,610 | 402,433 | 373,943 | 510,132 | 549,166 | ||||||||||||||||||||||||||||||||||||
|
|
|
|
|
|
|
|
|
|
|
| |||||||||||||||||||||||||||||||||||||
Total | 707,998 | 770,516 | 755,054 | 766,423 | 814,296 | 810,734 | 814,296 | 810,734 | 881,709 | 870,533 | 1,004,134 | 1,058,957 | ||||||||||||||||||||||||||||||||||||
|
|
|
|
|
|
|
|
|
|
|
| |||||||||||||||||||||||||||||||||||||
WeThe difference between the aggregate cost/amortized cost and the aggregate estimated fair value reflects the amount of the unrealized gains and losses, and provision for impairment losses. As of December 31, 2019, we had gross unrealized gains of RMB 63,261 million (US$ 9,087 million) and gross unrealized losses of RMB 5,055 million (US$ 726 million), and made a provision for impairment losses of RMB 3,383 million (US$ 486 million). As of December 31, 2018, we had gross unrealized gains of RMB 37,125 million and gross unrealized losses of RMB 43,884 million, and made a provision for impairment losses of RMB 4,417 million. As of December 31, 2017, we had gross unrealized gains of RMB 25,120 million (US$ 3,861 million) and gross unrealized losses of RMB 26,837 million, (US$ 4,125 million) as of December 31, 2017.We had gross unrealized gains of RMB 31,391 million and gross unrealizedmade a provision for impairment losses of RMB 18,064 million as of December 31, 2016. We had gross unrealized gains of RMB 67,434 million and gross unrealized losses of RMB 3,559 million as of December 31, 2015.1,845 million. The unrealized losses as of December 31, 20172019 related primarily to the unrealized losses ofavailable-for-sale bonds.stocks and funds.
The following tables set forth the length of time that each class ofavailable-for-sale securities has continuously been in an unrealized loss position as of December 31, 2019, 2018 and 2017. For the year ended December 31, 2019, the decrease of our unrealized losses on equity securities, mainly resulting from the overall upturn of the Chinese stock market, constituted a significant component of the movement of the total unrealized losses compared to the prior year.For the year ended December 31, 2018, unrealized losses on equity securities, mainly resulting from the overall volatility and downturn of the Chinese stock market, constituted a significant component of the movement of the total unrealized losses compared to the prior year. For the year ended December 31, 2017, 2016 and 2015.unrealized losses on debt securities, mainly resulting from the increase in interest rates in the Chinese market, constituted a significant component of the movement of the total unrealized losses compared to the prior year.
As of December 31, 2017 | 0-6 months | 7-12 months | More than 12 months | Total | ||||||||||||
| (RMB in millions) | ||||||||||||||||
Debt securities | ||||||||||||||||
Unrealized losses | 3,670 | 2,128 | 5,274 | 11,072 | ||||||||||||
Carrying amounts | 181,504 | 52,795 | 45,788 | 280,087 | ||||||||||||
Unrealized losses as a percentage of carrying amounts | 2.02 | % | 4.03 | % | 11.52 | % | 3.95 | % | ||||||||
Equity securities | ||||||||||||||||
Unrealized losses | 12,342 | 3,391 | 32 | 15,765 | ||||||||||||
Carrying amounts | 132,893 | 25,982 | 786 | 159,661 | ||||||||||||
Unrealized losses as a percentage of carrying amounts | 9.29 | % | 13.05 | % | 4.07 | % | 9.87 | % | ||||||||
Total | ||||||||||||||||
Total unrealized losses | 16,012 | 5,519 | 5,306 | 26,837 | ||||||||||||
Total carrying amounts | 314,397 | 78,777 | 46,574 | 439,748 | ||||||||||||
Unrealized losses as a percentage of carrying amounts | 5.09 | % | 7.01 | % | 11.39 | % | 6.10 | % | ||||||||
As of December 31, 2016 Debt securities Unrealized losses Carrying amounts Unrealized losses as a percentage of carrying amounts Equity securities Unrealized losses Carrying amounts Unrealized losses as a percentage of carrying amounts Total Total unrealized losses Total carrying amounts Unrealized losses as a percentage of carrying amounts As of December 31, 2015 Debt securities Unrealized losses Carrying amounts Unrealized losses as a percentage of carrying amounts Equity securities Unrealized losses Carrying amounts Unrealized losses as a percentage of carrying amounts Total Total unrealized losses Total carrying amounts Unrealized losses as a percentage of carrying amounts 0-6
months 7-12
months More than 12
months Total (RMB in millions) 1,222 40 200 1,462 48,144 1,040 3,104 52,288 2.54 % 3.85 % 6.44 % 2.80 % 12,023 4,579 — 16,602 121,106 23,443 1 144,550 9.93 % 19.53 % — 11.49 % 13,245 4,619 200 18,064 169,250 24,483 3,105 196,838 7.83 % 18.87 % 6.44 % 9.18 % 0-6
months 7-12
months More than 12
months Total (RMB in millions) 49 5 242 296 4,110 290 16,186 20,586 1.19 % 1.72 % 1.50 % 1.44 % 1,885 1,378 — 3,263 28,275 9,810 — 38,085 6.67 % 14.05 % — 8.57 % 1,934 1,383 242 3,559 32,385 10,100 16,186 58,671 5.97 % 13.69 % 1.50 % 6.07 %
As of December 31, 2019 | 0-6 months | 7-12 months | More than 12 months | Total | ||||||||||||
| (RMB in millions) | ||||||||||||||||
Debt securities | ||||||||||||||||
Unrealized losses | 374 | 141 | 531 | 1,046 | ||||||||||||
Carrying amounts | 28,298 | 2,794 | 25,884 | 56,976 | ||||||||||||
Unrealized losses as a percentage of carrying amounts | 1.32 | % | 5.05 | % | 2.05 | % | 1.84 | % | ||||||||
Equity securities | ||||||||||||||||
Unrealized losses | 2,084 | 1,029 | 896 | 4,009 | ||||||||||||
Carrying amounts | 50,291 | 26,006 | 3,175 | 79,472 | ||||||||||||
Unrealized losses as a percentage of carrying amounts | 4.14 | % | 3.96 | % | 28.22 | % | 5.04 | % | ||||||||
Total | ||||||||||||||||
Total unrealized losses | 2,458 | 1,170 | 1,427 | 5,055 | ||||||||||||
Total carrying amounts | 78,589 | 28,800 | 29,059 | 136,448 | ||||||||||||
Unrealized losses as a percentage of carrying amounts | 3.13 | % | 4.06 | % | 4.91 | % | 3.70 | % | ||||||||
As of December 31, 2018 | 0-6 months | 7-12 months | More than 12 months | Total | ||||||||||||
| (RMB in millions) | ||||||||||||||||
Debt securities | ||||||||||||||||
Unrealized losses | 126 | 473 | 1,046 | 1,645 | ||||||||||||
Carrying amounts | 9,665 | 11,075 | 41,365 | 62,105 | ||||||||||||
Unrealized losses as a percentage of carrying amounts | 1.30 | % | 4.27 | % | 2.53 | % | 2.65 | % | ||||||||
Equity securities | ||||||||||||||||
Unrealized losses | 7,445 | 21,813 | 12,981 | 42,239 | ||||||||||||
Carrying amounts | 50,073 | 92,845 | 52,549 | 195,467 | ||||||||||||
Unrealized losses as a percentage of carrying amounts | 14.87 | % | 23.49 | % | 24.70 | % | 21.61 | % | ||||||||
Total | ||||||||||||||||
Total unrealized losses | 7,571 | 22,286 | 14,027 | 43,884 | ||||||||||||
Total carrying amounts | 59,738 | 103,920 | 93,914 | 257,572 | ||||||||||||
Unrealized losses as a percentage of carrying amounts | 12.67 | % | 21.45 | % | 14.94 | % | 17.04 | % | ||||||||
As of December 31, 2017 | 0-6 months | 7-12 months | More than 12 months | Total | ||||||||||||
| (RMB in millions) | ||||||||||||||||
Debt securities | ||||||||||||||||
Unrealized losses | 3,670 | 2,128 | 5,274 | 11,072 | ||||||||||||
Carrying amounts | 181,504 | 52,795 | 45,788 | 280,087 | ||||||||||||
Unrealized losses as a percentage of carrying amounts | 2.02 | % | 4.03 | % | 11.52 | % | 3.95 | % | ||||||||
Equity securities | ||||||||||||||||
Unrealized losses | 12,342 | 3,391 | 32 | 15,765 | ||||||||||||
Carrying amounts | 132,893 | 25,982 | 786 | 159,661 | ||||||||||||
Unrealized losses as a percentage of carrying amounts | 9.29 | % | 13.05 | % | 4.07 | % | 9.87 | % | ||||||||
Total | ||||||||||||||||
Total unrealized losses | 16,012 | 5,519 | 5,306 | 26,837 | ||||||||||||
Total carrying amounts | 314,397 | 78,777 | 46,574 | 439,748 | ||||||||||||
Unrealized losses as a percentage of carrying amounts | 5.09 | % | 7.01 | % | 11.39 | % | 6.10 | % | ||||||||
Financial assets other than those accounted for as at fair value through profit or loss are adjusted for impairments, where these are declinesimpairments.
In evaluating whether a decline in value that are considered to be other than temporary.
Our rationaleis an impairment for an other-than-temporary impairment is based on a severe or prolonged decline in value. We determine a severe or prolonged decline after considering both quantitative and qualitative factors.
The qualitativethese financial assets, we consider several factors include specific information on the financial status and performance of the investee, including, but not limited to:to, the following:
significant financial difficulty of major contracts;the issuer or debtor;
a breach of debt covenants; andcontract, such as a default or delinquency in payments;
it becomes probable that the issuer or debtor will enter into bankruptcy or other financial reorganization; and
the disappearance of an active market for that financial asset because of financial difficulties.
In evaluating whether a decline in value is impairment for equity securities, we also consider the extent or the duration of the decline. The quantitative factors include the following:
the market price of the equity securities was more than 50% below itstheir cost at the balance sheetreporting date;
the market price of the equity securities was more than 20% below itstheir cost for a period of at least six months at the balance sheetreporting date; and
the market price of the equity securities was below itstheir cost for a period of more than one year.year (including one year) at the reporting date.
When the decline in value is considered an impairment,held-to-maturity debt securities are written down to their present value of estimated future cash flows discounted at the securities’ effective interest rates, andavailable-for-sale debt securities and equity securities are written down to their fair value, and the change is recorded in net realized gains on financial assets in the period the impairment is recognized. The impairment loss is reversed through the net profit if in a subsequent period the fair value of a debt security increases and the increase can be objectively related to an event occurring after the impairment loss was recognized through net profit. The impairment losses recognized in net profit on equity investments are not reversed. See “—Critical Accounting Policies”.
As of December 31, 2019, our total investment assets were RMB 3,573,154 million (US$ 513,251million) and the investment yield for the year ended December 31, 2019 was 5.24%. The investment yield primarily reflected the increase in spread income and fair value through profit or loss of equity investments we have invested in. As of December 31, 2018, our total investment assets were RMB 3,104,014 million and the investment yield for the year ended December 31, 2018 was 3.29%. As of December 31, 2017, our total investment assets were RMB 2,591,6522,753,124 million (US$ 398,330 million) and the investment yield for the year ended December 31, 2017 was 5.16%. The investment yield primarily reflected the increase in interest income and fair value of stocks we have invested in. As of December 31, 2016, our total investment assets were RMB 2,453,283 million and the investment yield for the year ended December 31, 2016 was 4.61%.The investment yield primarily reflected the increase in interest income and the decrease in spread income. As of December 31, 2015, our total investment assets were RMB 2,287,639 million and the investment yield for the year ended December 31, 2015 was 6.47%. The investment yield primarily reflected the increase in spread income and interest income.
We calculate the investment yields for a given year by dividing the totalgross investment income for that year by the average of the ending balance of investment assets of that year and the previous year. Beginning in 2017,2018, we revised the formula to calculate our investment yield has been revised to consider the impact of securities sold under agreements to repurchaseinvestments in associates and joint ventures on our investment yield, and thereforeyield. The investment yieldsyield for the fiscal yearsyear ended December 31, 2016 and December 31, 20152017 has also been revised to conform to the revised formula.
Mix of Products
The following table sets forth premium information as of or for the years ended December 31, 2017, 20162019, 2018 and 20152017 by type of product in our life insurance business, health insurance business and accident insurance business.
| As of or for the year ended December 31, | Compound annual growth rate | As of or for the year ended December 31, | Compound annual growth rate | |||||||||||||||||||||||||||||||||||||
| 2015 | 2016 | 2017 | 2017 | (2015-2017) | 2017 | 2018 | 2019 | 2019 | (2017-2019) | |||||||||||||||||||||||||||||||
| RMB | RMB | RMB | USD | RMB | RMB | RMB | USD | |||||||||||||||||||||||||||||||||
Life insurance business | ||||||||||||||||||||||||||||||||||||||||
Whole life and term life insurance: | ||||||||||||||||||||||||||||||||||||||||
Gross written premiums | 31,595 | 33,395 | 40,606 | 6,241.03 | 13.37 | % | 40,606 | 49,520 | 64,196 | 9,221 | 25.74 | % | ||||||||||||||||||||||||||||
Endowment: | ||||||||||||||||||||||||||||||||||||||||
Gross written premiums | 177,871 | 188,415 | 198,418 | 30,496.29 | 5.62 | % | 198,418 | 126,318 | 113,950 | 16,368 | (24.22 | %) | ||||||||||||||||||||||||||||
Annuities: | ||||||||||||||||||||||||||||||||||||||||
Gross written premiums | 98,703 | 140,095 | 190,798 | 29,325.12 | 39.03 | % | 190,798 | 261,702 | 268,416 | 38,556 | 18.61 | % | ||||||||||||||||||||||||||||
Health insurance business(1) | ||||||||||||||||||||||||||||||||||||||||
Gross written insurance premiums | 42,041 | 54,010 | 67,708 | 10,406.53 | 26.91 | % | 67,708 | 83,614 | 105,581 | 15,166 | 24.87 | % | ||||||||||||||||||||||||||||
Accident insurance business(2) | ||||||||||||||||||||||||||||||||||||||||
Gross written insurance premiums | 13,761 | 14,583 | 14,436 | 2,218.77 | 2.42 | % | 14,436 | 14,672 | 14,943 | 2,146 | 1.74 | % | ||||||||||||||||||||||||||||
| (1) | Including long-term and short-term health products. |
| (2) | Including long-term and short-term accident products. |
Under the guidelines issued by the CIRC,CBIRC, we are required to pay to our participating policyholders dividends which are no less than 70% of the distributable earnings on participating products. Participating products tend to present us with less market risk, since we have more flexibility to set the level of dividends and participating products are subject to guaranteed interest rates which are generally lower than those ofnon-participating products. In addition, changes in interest rates have less of impact on their lapse rates than on those ofnon-participating policies. Conversely, participating products tend to be less profitable for us thannon-participating products, largely because the terms of these contracts effectively commit us to sharing a portion of our earnings from participating products with our policyholders. However, participating products still provide us with attractive profit contributions given the growing level of sales volume they produce.
Products classified as investment contracts also affect our revenues, since only a portion of the payments we received under such products are recorded in our consolidated income statement as policy fees, and the majority of such payments are recorded as investment contracts under financial liabilities on our balance sheet.
Another factor affecting our revenue is the fact that a substantial amount of the premiums we receive on many individual and group life insurance products are made in single payments, rather than over the course of the policy. We believe that the popularity of single premium products is in line with purchasing patterns and demand in China. We have however, adjusted our premium structure to focus more on sales of products with regular premiums, especially products with regular premiums for ten years or more, which has reduced the proportion of single written premiums of our total first-year gross written premiums. We believe that this strategy could contribute to a more steady development of our business and enhance the loyalty of our customers and the retention rate of our sales agent force.
Regulation
We operate in a highly regulated industry. Changes in regulation can have a significant impact on our revenues, expenses and profitability. China’s insurance regulatory regime is undergoing significant changes toward a more transparent regulatory process and a convergent movement toward international standards.Among other things, recent changes to permitted investment channels for insurance companies have impacted our investment portfolio and returns.Seereturns. See “Item 4. Information on the Company—Business Overview—Regulatory and Related Matters”.
Critical Accounting Policies
We prepared the consolidated financial statements under the historical cost convention, except for financial assets and financial liabilities at fair value through profit or loss,available-for-sale financial assets, insurance contract liabilities and certain property, plant and equipment at deemed cost during restructuring process. The preparation of financial statements in conformity with IFRS requires the use of certain critical accounting estimates. It also requires our management to exercise its judgments in the process of applying our accounting policies. Many of these policies, estimates and related judgments are common in the insurance and financial services industries; others are specific to our businesses and operations. The following sections discuss the accounting policies applied in preparing our consolidated financial statements that we believe are most dependent on the application of these judgments and estimates. However, uncertainty about these judgments and estimates could result in outcomes that require a material adjustment to the carrying amounts of assets and liabilities in the future periods.
Liability for Long-term Insurance Contracts
Long-term insurance contracts include whole life insurance, term life insurance, endowment insurance and annuity policies with significant life contingency risk. Premiums are recognized as revenue when the insurance contracts are recognized and premiums are due from policyholders.
We use the discounted cash flow method to estimate the reserve of long-term insurance contracts. The reserve of long-term insurance contracts consists of a reasonable estimate of liability, a risk margin and a residual margin. The long-term insurance contracts liabilities are calculated using various assumptions, including assumptions on mortality rates, morbidity rates, lapse rates, discount rates and expense assumptions, and based on the following principles:
The reasonable estimate for liability of long-term insurance contracts is the present value of reasonable estimates of future cash outflows less future cash inflows. The expected future cash inflows include cash inflows of future premiums arising from the undertaking of insurance obligations, with consideration of decrement mostly from death and surrenders. The expected future cash outflows are cash outflows incurred to fulfill contractual obligations, consisting of the following:
| (i) | Guaranteed benefits based on contractual terms, including payments for deaths, disabilities, diseases, survivals, maturities and surrenders; |
| (ii) | Additionalnon-guaranteed benefits, such as policyholder dividends; and |
| (iii) | Reasonable expenses incurred to manage insurance contracts or to process claims, including maintenance expenses and claim settlement expenses. Future administration expenses are included in the maintenance expense. Expenses are determined based on expense analysis with consideration of future inflation and our expense management control. |
On each reporting date, we review the assumptions for reasonable estimates of liability and risk margins, with consideration of all available information, taking into account our historical experience and expectation of future events. Changes in assumptions are recognized in net profit. Assumptions for the amortization of residual margin are locked in at policy issuance date and are not adjusted at each reporting date. We incorporate the potential impact of future risk factors on our operating results in the determination of assumptions. The sensitivity analysis disclosed in theNotethe Note 4.1.3 on pageF-39onpage F-42 of this annual report provides a detailed analysis of impact of assumption changes on our operating results.
Margins have been taken into consideration while computing the reserves of insurance contracts, measured separately and recognized in net profit in each period over the life of the contracts. At the inception of the contracts, we do not recognize Day One gain, whereas on the other hand, Day One loss is recognized in profit immediately.
Margins comprise risk margin and residual margin. Risk margin is the reserve accrued to compensate for the uncertain amount and timing of future cash flows. At the inception of the contract, the residual margin is calculated net of certain acquisition costs, mainly consist of underwriting and policy acquisition costs, by us representing Day One gain and will be amortized over the life of contracts. For insurance contracts of which future returns are affected by investment yields of corresponding investment portfolios, their related residual margins are amortized based on estimated future participating dividends payable to the policyholders. For insurance contracts in which future returns are not affected by investment yields of corresponding investment portfolios, their related residual margins are amortized based on sum assured of outstanding policies. The subsequent measurement of residual margin is independent from the reasonable estimate of future discounted cash flows and risk margin. The assumption changes have no effect on the subsequent measurement of the residual margin.
We have considered the impact of time value on the reserve calculation for insurance contracts.
We establish liabilities for long-term traditional insurance contracts based on the following assumptions:
��
For the insurance contracts of which future insurance benefits are affected by investment yields of corresponding investment portfolios, the discount rate assumption is based on expected investment returns of the asset portfolio backing these liabilities, considering the impact of time value on liabilities. In developing discount rate assumptions, we consider investment experience, current investment portfolio and trend of the relevant yield curve. The assumed discount rates reflect the future economic outlook as well as our investment strategy. The assumed discount rates with risk margin ranged from 4.80% to 5.00% as at December 31, 2015, from 4.45% towas 4.85% as at December 31, 20162017, 2018 and 4.85% as at December 31, 2017,respectively.2019.
For the insurance contracts of which the future insurance benefits are not affected by the investment yields of the corresponding investment portfolios, the discount rate assumption is based on the “yield curve of reserve computation benchmark for insurance contracts”, published on the “China Bond” website, with consideration of liquidity spreads, taxation and other relevant factors. The assumed spot discount rates with risk margin ranged from 3.42% to 4.89% as at December 31, 2015, from 3.23% to 4.68% as at December 31, 2016, and from 3.31% to4.86%as at December 31, 2017, from 3.47% to 4.86% as at December 31, 2018 and from 3.52% to 4.83% as at December 31, 2019,respectively.
There is uncertainty onrelating to the discount rate assumption, which is affected by factors such as future macro-economy, monetary and foreign exchange policies, capital market and availability of investment channels of insurance funds. We determine the discount rate assumption based on the information obtained at the end of each reporting period, including consideration of risk margin.
The mortality and morbidity assumptions are based on the historical mortality and morbidity experience. The assumed mortality rates and morbidity rates vary by age of the insured and contract type.
We base our mortality assumptions on the China Life Insurance Mortality Table (2000-2003), adjusted where appropriate to reflect our recent historical mortality experience. The main source of uncertainty with life insurance contracts is that epidemics and wide-ranging lifestyle changes could result in deterioration in future mortality experience, thus leading to an inadequate reserve. Similarly, improvements in longevity due to continuing advancements in medical care and social conditions could expose us to longevity risk.
We base our morbidity assumptions for critical illness products on analysis of historical experience and expectations of future developments. There are two main sources of uncertainty. First, wide-ranging lifestyle changes could result in future deterioration in morbidity experience. Second, future development of medical technologies and improved coverage of medical facilities available to the policyholders may bring forward the timing of diagnosing critical illness, which demands earlier payment of the critical illness benefits. Both could ultimately result in an inadequate reserving of liability if current morbidity assumptions do not properly reflect such trends.
Risk margin is considered in our mortality and morbidity assumptions.
The expense assumptions are based on expected unit costs with the consideration of previous expenses study and future trends. Our expense assumptions are affected by certain factors, such as future inflation and market competition which bring uncertainty to these assumptions. We consider risk margin for expense assumptions based on the information obtained at the end of each reporting period. Components of expense assumptions include cost per policy and percentage of premium.Our expense assumptions for each of the past three years arewere as follows: the percentage of premiums costs to be 0.85% to 0.90% of premiums for individual life products and 0.90%for group life products as at December 31, 2015, 0.85% to 0.90% of premiums for individual life products and 0.90% for group life products, as at December 31, 2016 and 0.85% to 0.90% of premiums for individual life products and 0.90% for group life products as at December 31, 2017, respectively, in each case plus a fixedper-policy expense.
The method used to determine risk margin has been consistently applied. We consider risk margin for each of the discount rate, mortality and morbidity and expense assumptions to compensate for the uncertain amount and timing of future cash flow. When determining risk margin, we consider historical experience, future expectations and other factors. Risk margin is determined by us and does not include any elements imposed by regulators.
We adopted a consistent process to determine assumptions for the insurance contracts, which are detailed inNote 14in Note 15 to our consolidated financial statements included elsewhere in this annual report. On each reporting date, we review the assumptions for reasonable estimates of liability and risk margin, with consideration of all available information, and taking into account our historical experience and expectation of future events.
Universal Life Contracts and Unit-linked Contracts
Universal life contracts and unit-linked contracts are unbundled into the following components:
Insurance components; and
Non-insurance components.
The insurance components are accounted for as insurance contracts, and thenon-insurance components are accounted for as investment contracts, which are stated in the investment contract liabilities.
Investment Contracts
Revenue fromFor investment contracts with or without discretionary participating feature, is recognized asour policy fee income whichmainly consists of acquisition cost and various fee incomes including, among others, policy fees,(including handling fees and management fees,fees) over the period during which the period.service is provided. Policy fee income net of certain acquisition cost is deferred as unearned revenue and amortized over the expected life of the contracts.contracts by period and recognized in revenue.
Except for unit-linked contracts, of which the liabilities for transferred financial risks are carried at fair value, the liabilities of investment contracts are carried at amortized cost.
Valuation of Investments
We classify our financial assets into the following categories: securities at fair value through profit or loss,held-to-maturity securities, loans and receivables andavailable-for-sale securities. Management determines the classification of our financial assets at initial recognition, which dependswith the classification depending on the purpose for which the assets are acquired. The following are the policies used:
Securities at fair value through profit or loss. This category has twosub-categories: securities held for trading and those designated as at fair value through profit or loss at inception. Securities are classified as held for trading at inception if acquired principally for the purpose of selling in the short-term or if they form part of a portfolio of financial assets in which there is evidence of short term profit-taking. Other financial assets are classified as at fair value through profit or loss if they meet the criteria in IAS 39 and designated as such at inception by us.
Held-to-maturity securities.Held-to-maturity securities arenon-derivative financial assets with fixed or determinable payments and fixed maturities that we have the positive intention and ability to hold to maturity and do not meet the definition of loans and receivables nor designated asavailable-for-sale securities or securities at fair value through profit or loss. These investments are carried at amortized cost.
Loans and receivables. Loans and receivables arenon-derivative financial assets with fixed or determinable payments that are not quoted in an active market other than those that we intend to sell in the short term or held asavailable-for-sale. Loans and receivables mainly comprise term deposits, loans, securities purchased under agreements to resell, accrued investment income and premium receivables as presented separately in the statement of financial position. These investments are carried at amortized cost.
Available-for-sale securities.Available-for-sale securities arenon-derivative financial assets that are either designated in this category or not classified in any of the other categories.
Impairment of financial assets other than securities at fair value through profit or loss.Financial assets other than those accounted for as at fair value through profit or loss are adjusted for impairments, where there are declines in value that are considered to be impairment. In evaluating whether a decline in value is an impairment for these financial assets, we consider several factors including, but not limited to, the following:
significant financial difficulty of the issuer or debtor;
a breach of contract, such as a default or delinquency in payments;
it becomes probable that the issuer or debtor will enter into bankruptcy or other financial reorganization; and
the disappearance of an active market for that financial asset because of financial difficulties.
In evaluating whether a decline in value is impairment for equity securities, we also consider the extent or the duration of the decline. The quantitative factors include the following:
the market price of the equity securities was more than 50% below their cost at the reporting date;
the market price of the equity securities was more than 20% below their cost for a period of at least six months at the reporting date; and
the market price of the equity securities was below their cost for a period of more than one year (including one year) at the reporting date.
When the decline in value is considered impairment,held-to-maturity debt securities are written down to their present value of estimated future cash flows discounted at the securities effective interest rates;available-for-sale debt securities and equity securities are written down to their fair value, and the change is recorded in net realized gains on financial assets in the period the impairment is recognized. The impairment loss is reversed through net profit if in a subsequent period the fair value of a debt security increases and the increase can be objectively related to an event occurring after the impairment loss was recognized through net profit. The impairment losses recognized in net profit on equity instruments are not reversed through net profit.
As of December 31, 2017,2019, debt securities of RMB 219,285181,617 million (US$ 33,70326,088 million) containcontained guarantees issued by third parties and, of those, 85.05%86.49% were guaranteed by either the Chinese government or a Chinese government controlled financial institution. Of the guarantees issued by government or government controlled financial institutions, 88.26% relates92.90% related to debt securities issued by a government railway infrastructure entity. We monitor the credit worthiness of the third parties which have issued these guarantees using local Chinese credit ratings which are generally only utilized within China.
The methods and assumptions used by us in measuring the fair value of the financial instruments are as follows:
Debt securities. The fair values of debt securities are generally based on current bid prices. Where current bid prices are not readily available, fair values are estimated using either prices observed in recent transactions, values obtained from current bid prices of comparable investments or valuation techniques when the market is not active.
Equity securities. The fair values of equity securities are generally based on current bid prices. Where current bid prices are not readily available, fair values are estimated using either prices observed in recent transactions or commonly used market pricing model. Equity securities, for which fair values cannot be measured reliably, are recognized at cost less impairment.
Securities purchased under agreements to resell, policy loans, term deposits, interest-bearing loans and borrowings, and securities sold under agreements to repurchase.The carrying amounts of these assets in the consolidated statement of financial position approximate fair value. Fair values of other loans are obtained from valuation techniques.
Valuations are generally obtained from third party pricing services for identical or comparable assets, or through the use of valuation methodologies using observable market inputs, or recent quoted market prices. Valuation service providers typically gather, analyze and interpret information related to market transactions and other key valuation model inputs from multiple sources, and, through the use of widely accepted valuation models, provide a theoretical quote on various securities.
We utilize one pricing service for substantially all of our Chinese domestic debt securities. This pricing service provider is the only publicly-recognized pricing service provider in China, and its pricing information is used by the mutual fund industry and almost all companies in China. We utilize international pricing services for our overseas debt securities. These pricing service providers are internationally-recognized, and their pricing information is commonly used by international companies. The prices obtained from the pricing service arenon-binding. Our review and testing have shown the prices obtained from our pricing service to be appropriate. As such, during the year ended December 31, 2017,2019, we did not consider it necessary to adjust the prices obtained from our pricing service.
As at December 31, 2017,2019, RMB 695,420936,372 million of RMB 764,5731,025,989 million debt securities with prices obtained from our pricing service were issued by the Chinese government and government controlled organizations. This pricing service utilized a discounted cash flow valuation model using market observable inputs, mainly interest rates, to determine a fair value. There are no other significant market inputs. As such, we have classified these debt securities as Level 2 in the fair value hierarchy.
Management subjects the fair values provided by valuation service providers to a number of validation procedures. These procedures include a review of the valuation models utilized, as well as our own test recalculation of the prices obtained from the pricing service at each reporting date.
We consider a combination of many factors in determining whether we believe a market for a financial instrument is active or inactive. Among these factors include:
whether there has been any trades within past 30 days of the reporting date;
the volume of the trades within this 30 day period; and
the degree which the implied yields for a debt security for observed transactions differs from our understanding of the current relevant market rates and information.
Associates and joint ventures
Associates are entities on which we have significant influence, generally together with a shareholding of between 20% and 50% of the voting rights. Significant influence is the power to participate in the financial and operating policy decisions of such entities but without control or joint control over these decisions.
Joint ventures are joint arrangements whereby the parties have joint control of the arrangement and have rights to the net assets of the joint arrangement. Joint control is the contractually-agreed sharing of control of an arrangement, which exists only when decisions on relevant activities require unanimous consent of the parties sharing control.
We determine at each reporting date whether there is any objective evidence that the investments in associates and joint ventures are impaired. If this is the case, an impairment loss is recognized at the amount of the carrying amount of investment less its recoverable amount. The recoverable amount is the higher of the fair value of investment less costs of disposal and value in use. The impairment of investment in associates and joint ventures is reviewed for possible reversal at each reporting date.
Revenue Recognition
Premiums.Premiums from long-term insurance contracts are recognized as revenue when due from the policyholders.
Premiums from the sale of short-term accident and health insurance contracts are recorded when written and are accreted to earnings on apro-rata basis over the term of the related policy coverage.
Policy fee income.Revenue from investment contracts is recognized asThe policy fee income whichfor investment contracts mainly consists of acquisition costs and various fee incomeincomes (including handling fees and management fees) over the period during which service is provided. Policy fee income net of certain acquisition costcosts is deferred as unearned revenue and amortized over the expected life of the contracts. Policy fee income is presentedcontracts and recognized as other income.
Investment income. Investment income is comprised of interest income from term deposits, cash and cash equivalents, debt securities, securities purchased under agreements to resell, loans and dividend income from equity securities. Interest income is recorded on an accrual basis using the effective interest rate method. Dividend income is recognized when the right to receive a dividend payment is established.
Deferred taxation
Deferred income tax is recognized, using the liability method, on temporary differences arising between the tax bases of assets and liabilities and their carrying amounts in the consolidated financial statements. Substantively enacted tax rates are used in the determination of deferred income tax.
Deferred income tax assets are recognized to the extent that it is probable that future taxable profit will be available against which the reversal of temporary differences can be recognized.
Deferred income tax is provided on temporary differences arising on investments in subsidiaries, associates and joint ventures except where the timing of the reversal of the temporary difference can be controlled and it is probable that the temporary difference will not reverse in the foreseeable future.
Recently Issued Accounting Standards
The following standards and amendments are adopted by us for the first time for the financial year beginning on January 1, 2017.2019.
| Standards/Amendments | Content | Effective for annual periods beginning on or after | ||
| IFRS 16 | Leases | January 1, 2019 | ||
| IAS | January 1, | |||
| IAS | January 1, 2019 | |||
| IFRIC 23 | Uncertainty over Income Tax Treatments | January | ||
| Annual Improvements to IFRSs 2015-2017 Cycle | Amendments to IFRS 3, IFRS 11, IAS 12 and IAS 23 | January 1, 2019 |
IFRS 16 – Leases
IFRS 16 supersedes IAS 17 Leases, and related interpretations from International Financial Reporting Interpretation Committee and Standard Interpretation Committee. The standard sets out the principles for the recognition, measurement, presentation and disclosure of leases and requires lessees to account for all leases under a singleon-balance sheet model. Lessor accounting under IFRS 16 is substantially unchanged from IAS 17. Lessors continue to classify leases as either operating or finance leases using similar principles as in IAS 17. Therefore, IFRS 16 did not have any financial impact on leases where we are the lessor.
We have adopted IFRS 16 using the modified retrospective method of adoption with the date of initial application of January 1, 2019. Under this method, the standard has been applied retrospectively with the cumulative effect of initial adoption as an adjustment to the opening balance of retained earnings as at January 1, 2019, and the comparative information for 2018 was not restated and continues to be reported under IAS 17.
New definition of a lease
Under IFRS 16, at inception of a contract, an entity shall assess whether the contract is, or contains, a lease. A contract is, or contains, a lease if the contract conveys a right to control the use of an identified asset for a period of time in exchange for consideration. Control is conveyed where the customer has both the right to obtain substantially all of the economic benefits from use of the identified asset and the right to direct the use of the identified asset. We elected to use the transition practical expedient allowing the standard to be applied only to contracts that were previously identified as leases applying IAS 17 and IFRIC 4 at the date of initial application. Contracts that were not identified as leases under IAS 17 and IFRIC 4 were not reassessed. Therefore, the definition of a lease under IFRS 16 has been applied only to contracts entered or changed on or after January 1, 2019.
At inception or on reassessment of a contract that contains a lease component, we allocate the consideration in the contract to each lease andnon-lease component on the basis of their stand-alone prices. A practical expedient is available to a lessee, which we have adopted, not to separatenon-lease components and to account for the lease and the associatednon-lease components as a single lease component.
As a lessee – Leases previously classified as operating leases
As a lessee, we previously classified leases as either finance leases or operating leases based on the assessment of whether the lease transferred substantially all the rewards and risks of ownership of assets to us. Under IFRS 16, we apply a single approach to recognize and measureright-of-use assets and lease liabilities for all leases, except for two elective exemptions for leases oflow-value assets (elected on a lease by lease basis) and short-term leases (elected by class of underlying asset). We have elected not to recognizeright-of-use assets and lease liabilities for (i) leases oflow-value assets; and (ii) leases, that at the commencement date, have a lease term of 12 months or less. Instead, we recognize the lease payments associated with those leases as an expense on a straight-line basis over the lease term.
Lease liabilities as at January 1, 2019 were recognized based on the present value of the remaining lease payments, discounted using the incremental borrowing rate as at January 1, 2019.
Theright-of-use assets were measured at the amount of the lease liabilities, adjusted by the amount of any prepaid or accrued lease payments relating to the leases recognized in the statement of financial position immediately before January 1, 2019. All these assets were assessed for any impairment based on IAS 36 – Impairment of Assets on that date.
We have used the following elective practical expedients when applying IFRS 16 as at January 1, 2019:
Applied the recognition exemptions for leases of low value assets and leases with lease term that ends within 12 months from the date of initial application;
Applied a single discount rate to a portfolio of leases with reasonably similar characteristics on the measurement of the lease liability;
Excluded the initial direct costs from the measurement of theright-of-use asset at the date of initial application;
Used hindsight in determining the lease term where the contract contains options to extend or terminate the lease; and
Relied on its assessment of whether leases are onerous immediately before the date of initial application. We adjusted theright-of-use asset at the date of initial application by the amount of any provision for onerous leases recognized in the statement of financial position immediately before the date of initial application.
In addition to land use rights, we recognized otherright-of-use assets of RMB 2,555 million and lease liabilities of RMB2,185 million at the date of initial application. Compared to the end of 2018, after the relative adjustments, total assets and total liabilities at the group level as at January 1, 2019 both increased by RMB 2,194 million. The reconciliation between the minimum unpaid lease payments of the operating leases disclosed in our financial statements for the year ended December 31, 2018, and the lease liabilities recognized in the consolidated statement of financial position at the date of initial application are as follows:
| RMB million | ||||
| 2,474 | |||
Less: short-term leases, those leases with a remaining lease term less than 12 months from the date of | (132 | ) | ||
impact of discounting at the incremental borrowing rate as at January 1, 2019 | (157 | ) | ||
Lease liabilities as at January | 2,185 | |||
The weighted average incremental borrowing rate we adopted as at January 1, 2019 in calculating the lease liabilities in the consolidated statement of financial position was 3.76%.
Refer to Note 2.7 to our consolidated financial statements included elsewhere in this annual report for relevant accounting policies.
IAS 728 Amendments – Disclosure InitiativeLong-term interests in associates and joint ventures
TheIn October 2017, the IASB issued the amendments to IAS 7 Statement of Cash Flows require28 which indicates that an entity applies IFRS 9 to provide disclosureslong-term interests in an associate or joint venture to which the equity method is not applied but that, enable usersin substance, form part of the net investment in the associate or joint venture (long-term interests). The amendments also clarify that for the entity that applies the temporary exemption from IFRS 9, IAS 39 applies to the long-term interests, and those entities are not required to restate prior periods to reflect the application of amendments. The amendments are effective for annual periods beginning on or after January 1, 2019.
Our accounting treatment in the previous years is in line with the amendments, thus there has been no impact on our consolidated financial statements to evaluate changes in liabilities arising from financing activities, including both changes arising from cash flows andnon-cash changes.as a result of the amendments.
IAS 1219 Amendments – Recognition of Deferred Tax Assets for Unrealized Losses- Plan Amendment, Curtailment or Settlement
TheIn February 2018, the IASB issued the amendments to IAS 12 clarify that an entity, when assessing whether taxable profits will be available against19 which it can utilize a deductible temporary difference, needs to consider whether tax law restricts the sources of taxable profits against which it may make deductions on the reversal of that deductible temporary difference. Furthermore, the amendments provide guidance on how an entity should determine future taxable profits and explain the circumstances in which taxable profit may include the recovery of some assets for more than their carrying amount. The Group applied the amendments retrospectively. However, their application has no impact on the Group’s financial position and performance, asaddresses the accounting treatment of the Group for the previous period was consistent with the clarification in these amendments.
IFRS 12 Amendments – Disclosure of Interests in Other Entities
when a plan amendment, curtailment or settlement occurs during a reporting period. The amendments to IFRS 12 clarify that the disclosure requirements in IFRS 12, other than those disclosure requirements in paragraphs B10 to B16 of IFRS 12,are effective for annual periods beginning on or after January 1, 2019 and apply to an entity’s interest in a subsidiary, a joint venture or an associate, or a portion of its interest in a joint venture or an associate that is classified as held for sale or included in a disposal group classified as held for sale.retrospectively.
We have no defined benefit plans. The amendments under IAS 19 have had no impact on our consolidated financial statements. We will adopt the Group’samendments if such business occurs in the future.
IFRIC 23 - Uncertainty over Income Tax Treatments
In June 2017, the IASB issued IFRIC Interpretation 23, which clarifies application of the recognition and measurement requirements in IAS 12 Income Taxes when there is uncertainty over income tax treatments. The interpretation mainly addresses the following four areas: whether an entity separately considers the uncertainty of tax treatments; assumptions adopted by an entity to address the examination of tax treatments by taxation authorities; how an entity determines taxable profit/(tax loss), tax bases, unused tax losses, unused tax credits and tax rates; and how an entity considers changes in facts and circumstances. The interpretation is effective for annual reporting periods beginning on or after January 1, 2019.
Our accounting treatment in the previous years is in line with the clarification of the interpretation. The clarification has had no significant impact on our consolidated financial statements.
In addition, theAnnual Improvements 2015-2017 Cycle issued in December 2017 set out amendments to IFRS 3, IFRS 11, IAS 12 and IAS 23, which are effective for annual periods beginning on or after January 1, 2019. There has been no significant impact on our consolidated financial statements as a result of these amendments.
New accounting standards and amendments that are effective but a temporary exemption is applied by us for the Group has nofinancial year beginning on January 1, 2019:
| Standards/Amendments | Content | Effective for annual periods beginning on or after | ||
| IFRS 9 | Financial Instruments | January 1, 2018 |
IFRS 9 – Financial Instruments
In July 2014, the IASB issued the final version of IFRS 9, bringing together all phases of the financial instruments project to replace IAS 39 and all previous versions of IFRS 9. The standard introduces new requirements for classification and measurement, impairment and hedge accounting. IFRS 9 is effective for annual periods beginning on or after January 1, 2018, with early adoption permitted. Based on the current assessment, we expect the adoption of IFRS 9 will have a significant impact on our consolidated financial statements. We have adopted and will continue to adopt the temporary exemption permitted in Amendments to IFRS 4 Applying IFRS 9 Financial Instruments with IFRS 4 Insurance Contracts (“IFRS 4 Amendment”) to apply IAS 39 rather than IFRS 9, until the effective date of IFRS 17. Refer to Note 33 to our consolidated financial statements included elsewhere in this annual report for more details.
Classification and measurement
IFRS 9 requires that we classify debt instruments based on the combined effect of application of business models (hold to collect contractual cash flows, hold to collect contractual cash flows and sell financial assets or other business models) and contractual cash flow characteristics (solely payments of principal and interest on the principal amount outstanding or not). Debt instruments not giving rise to cash flows that are solely payments of principal and interest on the principal amount outstanding are to be measured at fair value through profit or loss. Other debt instruments giving rise to cash flows that are solely payments of principal and interest on the principal amount outstanding are to be measured at amortized cost, fair value through other comprehensive income or fair value through profit or loss, based on their respective business models. We analyzed the contractual cash flow characteristics of financial assets as at December 31, 2019 and made relevant disclosures in a subsidiary, a joint ventureNote 33 to our consolidated financial statements included elsewhere in this annual report in accordance with the IFRS 4 Amendments.
Equity instruments would generally be measured at fair value through profit or an associate that isloss unless we elect to measure at fair value through other comprehensive income for certain equity investments not held for trading. This will result in unrealized gains and losses on equity instruments currently classified as heldavailable-for-sale securities being recorded in income going forward. Currently, these unrealized gains and losses are recognized in other comprehensive income. If we elect to record equity investments at fair value through other comprehensive income, gains and losses would never be recognized in income except for sale.
Impairment
IFRS 9 replaces the “incurred loss” model with the “expected credit loss” model which is designed to include forward-looking information. We are in the process of developing and testing the key models required under IFRS 9 and analyzing the impact on the expected loss provision; we believe that the provision for our debt instruments under the “expected credit loss” model would be larger than that under the previous “incurred loss” model.
Hedge accounting
We do not apply the hedge accounting currently, so we expect that the new hedge accounting model under IFRS 9 will have no impact on our consolidated financial statements.
The following standards and amendments are not yet effective and have not been early adopted by the Groupus for the financial year beginning on January 1, 2017.2019.
| Standards/Amendments | Content | Effective for annual
or after | ||
| IFRS |
| January 1, 2020 | ||
| IAS 1 and IAS 8 Amendments | Definition of Material | January | ||
| IFRS 9, | ||||
| IAS 39 and IFRS |
| |||
| ||||
| January 1, | ||||
| IFRS 17 | Insurance Contracts | January 1, | ||
| IFRS 10 and IAS 28 Amendments | Sale or Contribution of Assets between an Investor and its Associate or Joint Venture | No mandatory effective date yet determined but available for adoption |
For a detailed discussion of the recently issued accounting standards, see Note 2.1.1, Note 2.1.2 and Note 2.1.2to2.1.3 to our consolidated financial statements included elsewhere in this annual report.
Inflation
According to the National Statistics Bureau of China, China’s overall national inflation rates, as represented by the general consumer price index, were approximately 1.6%2.9%,2.1%, 2.0%, 1.4%1.6%, 2.0% and 2.6%1.4% in 2019, 2018, 2017, 2016 2015, 2014 and 2013,2015, respectively.Inflation has not had a significant effect on our business during the past three years.
Foreign Currency Fluctuation
See “Item 3. Key Information—Risk Factors—Risks Relating to the People’s Republic of China—Government control of currency conversion and the fluctuation of the Renminbi may materially and adversely affect our operations and financial results” and “Item 11. Quantitative and Qualitative Disclosures about Market Risk—Foreign Exchange Risk”.
Year Ended December 31, 20172019 Compared with Year Ended December 31, 20162018
| Total Revenues | For the year ended December 31, | |||||||
| 2016 | 2017 | |||||||
| RMB | RMB | |||||||
| (in millions) | ||||||||
Net premiums earned | 426,230 | 506,910 | ||||||
Life insurance business | 361,649 | 429,267 | ||||||
Health insurance business | 50,590 | 63,323 | ||||||
Accident insurance business | 13,991 | 14,320 | ||||||
Investment income | 109,147 | 122,727 | ||||||
Investment income from securities at fair value through profit or loss | 6,210 | 4,538 | ||||||
Investment income fromavailable-for-sale securities | 37,243 | 46,627 | ||||||
Investment income fromheld-to-maturity securities | 24,854 | 30,669 | ||||||
Investment income from bank deposits | 27,851 | 23,827 | ||||||
Investment income from loans | 12,018 | 16,320 | ||||||
Other investment income | 971 | 746 | ||||||
Net realized gains on financial assets | 6,038 | 42 | ||||||
Net fair value gains through profit or loss | (7,094 | ) | 6,183 | |||||
Other income | 6,460 | 7,493 | ||||||
|
|
|
| |||||
Total | 540,781 | 643,355 | ||||||
|
|
|
| |||||
Net premiums earned Life insurance business Health insurance business Accident insurance business Investment income Investment income from securities at fair value through profit or loss Investment income fromavailable-for-sale securities Investment income fromheld-to-maturity securities Investment income from bank deposits Investment income from loans Other investment income Net realized gains on financial assets Net fair value gains through profit or loss Other income Total Total Revenues For the year ended December 31, 2018 2019 RMB RMB (in millions) 532,023 560,278 436,863 445,719 80,279 99,575 14,881 14,984 125,167 139,919 5,153 4,527 39,483 43,196 34,657 38,229 22,699 26,695 22,894 27,111 281 161 (19,591 ) 1,831 (18,278 ) 19,251 8,098 8,195 627,419 729,474
Net Premiums Earned
Net premiums earned increased by RMB 80,68028,255 million, or 18.9%5.3%, to RMB 506,910560,278 million in 20172019 from RMB 426,230532,023 million in 2016.2018.
Life Insurance Business
Net premiums earned from life insurance business increased by RMB 67,6188,856 million, or 18.7%2.0%, to RMB 429,267445,719 million in 20172019 from RMB 361,649436,863 million in 2016.2018. This was primarily due to a rapid increase in renewals and first-year regular premiums.the steady growth of our life insurance business.
Health Insurance Business
Net premiums earned from health insurance business increased by RMB 12,73319,296 million, or 25.2 %,24.0%, to RMB 63,32399,575 million in 20172019 from RMB 50,59080,279 million in 2016.2018. This was primarily due to rapid development in protection-oriented businesses.our increased efforts to develop our health insurance business.
Accident Insurance Business
Net premiums earned from accident insurance business increased by RMB 329103 million, or 2.4%0.7%, to RMB 14,32014,984 million in 20172019 from RMB 13,99114,881 million in 2016.2018. This was primarily due to the steady growth of our accident insurance business.
Investment Income
Investment income increased by RMB 13,58014,752 million, or 12.4%11.8%, from RMB 109,147125,167 million in 20162018 to RMB 122,727139,919 million in 2017.2019.
Investment Income from Securities at Fair Value through Profit or Loss
Investment income from securities at fair value through profit or loss decreased by RMB 1,672626 million, or 26.9%12.1%, to RMB 4,5384,527 million in 20172019 from RMB 6,2105,153 million in 2016.2018. This was primarily due to a decrease in interest income resulting from a decrease in investments in commercial papers in bondspaper at fair value through profit or loss.
Investment Income fromAvailable-for-Sale Securities
Investment income fromavailable-for-sale securities increased by RMB 9,384million,3,713 million, or 25.2%9.4%, to RMB 46,62743,196 million in 20172019 from RMB 37,24339,483 million in 2016.2018. This was primarily due to an increase in dividend incomedividends fromavailable-for-sale equity investments.securities investment stocks.
Investment Income fromHeld-to-Maturity Securities
Investment income fromheld-to-maturity securities increased by RMB 5,8153,572 million, or 23.4%10.3%, to RMB 30,66938,229 million in 20172019 from RMB 24,854million34,657 million in 2016.2018. This was primarily due to an increase in interest income resulting from the increase in the allocation in financialgovernment agency bonds.
Investment Income from Bank Deposits
Investment income from bank deposits decreasedincreased by RMB 4,0243,996 million, or 14.4%17.6%, to RMB 23,82726,695 million in 20172019 from RMB 27,85122,699 million in 2016.2018. This was primarily due to a decreasean increase in interest income resulting from the decreaseincrease in the allocation in negotiated deposits.
Investment Income from Loans
Investment income from loans increased by RMB 4,3024,217 million, or 35.8%18.4%, to RMB 16,32027,111 million in 20172019 from RMB 12,01822,894 million in 2016.2018. This was primarily due to an increase in interest income from the increase in the allocation in trust schemes.
Net Realized Gains on Financial Assets
Net realized gains on financial assets decreasedincreased by RMB 5,99621,422 million or 99.3%, to gains of RMB 421,831 million in 20172019 from gainslosses of RMB 6,03819,591 million in 2016.2018. This was primarily due to a decreasean increase in spread income of stocks and funds inavailable-for-sale securities.
Net Fair Value Gains through Profit or Loss
Net fair value gains through profit or loss increased by RMB 13,27737,529 million to gains of RMB 6,18319,251 million in 20172019 from losses of RMB 7,09418,278 million in 2016.2018. This was primarily due to an increase in spread income and fair value of stocks in securities at fair value through profit or loss.
Other Income
Other income increased by RMB 1,033million,97 million, or 16.0%1.2%, to RMB 7,493million8,195 million in 20172019 from RMB 6,460million8,098 million in 2016.2018. This was primarily due to an increase in the commission fees earned from CLPCIC.business growth of China Life Pension.
| Benefits, Claims and Expenses | For the year ended December 31, | |||||||
| 2016 | 2017 | |||||||
| RMB | RMB | |||||||
| (in millions) | ||||||||
Insurance benefits and claims expenses | ||||||||
Life insurance death and other benefits | 253,157 | 259,708 | ||||||
Accident and health claims and claim adjustment expenses | 27,269 | 33,818 | ||||||
Increase in insurance contracts liabilities | 126,619 | 172,517 | ||||||
Investment contracts benefits | 5,316 | 8,076 | ||||||
Policyholder dividends resulting from participation in profits | 15,883 | 21,871 | ||||||
Underwriting and policy acquisition costs | 52,022 | 64,789 | ||||||
Finance costs | 4,767 | 4,601 | ||||||
Administrative expenses | 31,854 | 35,953 | ||||||
Other expenses | 4,859 | 6,426 | ||||||
Statutory insurance fund contribution | 1,048 | 1,068 | ||||||
|
|
|
| |||||
Total | 522,794 | 608,827 | ||||||
|
|
|
| |||||
Segment information of insurance benefits and claims expenses | ||||||||
Life insurance business | 360,922 | 409,410 | ||||||
Health insurance business | 40,513 | 50,624 | ||||||
Accident insurance business | 5,610 | 6,009 | ||||||
|
|
|
| |||||
Total | 407,045 | 466,043 | ||||||
|
|
|
| |||||
Insurance benefits and claims expenses Life insurance death and other benefits Accident and health claims and claim adjustment expenses Increase in insurance contracts liabilities Investment contracts benefits Policyholder dividends resulting from participation in profits Underwriting and policy acquisition costs Finance costs Administrative expenses Other expenses Statutory insurance fund contribution Total Segment information of insurance benefits and claims expenses Life insurance business Health insurance business Accident insurance business Total Benefits, Claims and Expenses For the year ended December 31, 2018 2019 RMB RMB (in millions) 248,736 127,877 40,552 50,783 189,931 330,807 9,332 9,157 19,646 22,375 62,705 81,396 4,116 4,255 37,486 40,275 7,642 9,602 1,097 1,163 621,243 677,690 412,876 427,673 59,689 75,471 6,654 6,323 479,219 509,467
Insurance Benefits and Claims Expenses
Insurance benefits and claims, net of amounts ceded through reinsurance, increased by RMB 58,99830,248 million, or 14.5%6.3%, to RMB 466,043509,467 million in 20172019 from RMB 407,045479,219 million in 2016.2018.
Life insurance death and other benefits payouts increaseddecreased by RMB 6,551120,859 million, or 2.6%48.6%, to RMB 259,708127,877 million in 20172019 from RMB 253,157248,736 million in 2016.2018. This was primarily due toan increaseto a decrease in surrenders.maturities payable. Accident and health claims and claim adjustment expenses increased by RMB 6,54910,231 million, or 24.0%25.2%, to RMB 33,81850,783 million in 20172019 from RMB 27,26940,552 million in 2016.2018. This was primarily due toanto an increase in the volume of short-term health insurance and accident insurance business. Increase in insurance contracts liabilities increased by RMB 45,898140,876 million, or 36.2%74.2%, to RMB 172,517million330,807 million in 20172019 from RMB 126,619189,931 million in 2016.2018. This was primarily due toanto an increase in the scale of insurance business.
Life Insurance Business
Insurance benefits and claims expenses attributable to life insurance business increased by RMB 48,48814,797 million, or 13.4%3.6%, to RMB 409,410427,673 million in 20172019 from RMB 360,922412,876 million in 2016.2018. This was primarily due to an increase in the scale of life insurance business.
Health Insurance Business
Insurance benefits and claims expenses attributable to health insurance business increased by RMB 10,11115,782 million, or 25.0%26.4%, to RMB 50,62475,471 million in 20172019 from RMB 40,51359,689 million in 2016.2018. This was primarily due to an increasethe growth in the scale ofour health insurance business.
Accident Insurance Business
Insurance benefits and claims expenses attributable to accident insurance business increaseddecreased by RMB 399331 million, or 7.1%5.0%, to RMB 6,0096,323 million in 20172019 from RMB 5,6106,654 million in 2016.2018. This was primarily due to fluctuationa decrease in claims expenses of certain businesses.
Investment Contract Benefits
Investment contract benefits increaseddecreased by RMB 2,760175 million, or 51.9%1.9%, to RMB 8,0769,157 million in 20172019 from RMB 5,3169,332 million in 2016.2018. This was primarily due to an increasea decrease in the scalesettlement interest rate of investment contracts.universal insurance accounts.
Policyholder Dividends Resulting from Participation in Profits
Policyholder dividends resulting from participation in profits increased by RMB 5,9882,729 million, or 37.7%13.9%, to RMB 21,87122,375 million in 2017 to2019 from RMB 15,88319,646 million in 2016.2018. This was primarily due to an increase in investment yields from participating accounts.
Underwriting and Policy Acquisition Costs
Underwriting and policy acquisition costs increased by RMB 12,76718,691 million, or 24.5%29.8%, to RMB 64,78981,396 million in 20172019 from RMB 52,02262,705 million in 2016.2018. This was primarily due to an increase in underwriting costs forcommissions of regular premium business due to the growth of our business and the optimization of our business structure.
Finance Costs
Finance costs decreasedincreased by RMB 166139 million, or 3.5%3.4%, to RMB 4,6014,255 million in 20172019 from RMB 4,7674,116 million in 2016.2018. This was primarily due to a decreasean increase in interest paid due to redemptions of subordinated debts.for bonds payable.
Administrative Expenses
Administrative expenses include employees’ remuneration and other administrative expenses. Administrative expenses increased by RMB 4,0992,789 million, or 12.9%7.4%, to RMB 35,95340,275 million in 20172019 from RMB 31,85437,486 million in 2016.2018. This was primarily due to the growth of our business.
Other Expenses
Other expenses increased by RMB 1,5671,960 million, or 32.2%25.6%, to RMB 6,4269,602 million in 20172019 from RMB 4,8597,642 million in 2016.2018. This was primarily due to payables to third party holders of consolidated structured entities and the change of foreign exchange rates applicable to the currency for foreign assets and liabilities.increase in interest from dividends.
| Profit | For the year ended December 31, | For the year ended December 31, | ||||||||||||||
| 2016 | 2017 | 2018 | 2019 | |||||||||||||
| RMB | RMB | RMB | RMB | |||||||||||||
| (in millions) | (in millions) | |||||||||||||||
Profit before income tax | 23,842 | 41,671 | 13,921 | 59,795 | ||||||||||||
Life insurance business | 14,732 | 29,315 | 1,630 | 42,418 | ||||||||||||
Health insurance business | 2,093 | 3,246 | 4,100 | 5,875 | ||||||||||||
Accident insurance business | 852 | 528 | 495 | 489 | ||||||||||||
Other businesses | 6,165 | 8,582 | 7,696 | 11,013 | ||||||||||||
Income tax | 4,257 | 8,919 | 1,985 | 781 | ||||||||||||
Net profit attributable to equity holders of the company | 19,127 | 32,253 | 11,395 | 58,287 | ||||||||||||
Profit before Income Tax
Our profit before income tax increased by RMB 17,82945,874 million, or 74.8%329.5%, to RMB 41,67159,795 million in 20172019 from RMB 23,84213,921 million in 2016.2018.
Life Insurance Business
Profit before income tax in the life insurance business increased by RMB 14,58340,788 million, or 99.0%2,502.3%, to RMB 29,31542,418 million in 20172019 from RMB 14,7321,630 million in 2016.2018. This was primarily due to a relatively rapidan increase in our gross investment income and the impact of the update of discount rate assumptions for reserves for traditional insurance contracts.income.
Health Insurance Business
Profit before income tax in the health insurance business increased by RMB 1,1531,775 million, or 55.1%43.3%, to RMB 3,2465,875 million in 20172019 from RMB 2,0934,100 million in 2016.2018. This was primarily due to an increase in our gross investment income.
Accident Insurance Business
Profit before income tax in the accident insurance business decreased by RMB 3246 million, or 38.0%1.2%, to RMB 528489 million in 20172019 from RMB 852495 million in 2016.2018. This was primarily due to fluctuationan increase in claims expensesunderwriting and policy acquisition costs resulting from structure adjustment of certain of our businesses.
Other BusinessBusinesses
Profit before income tax in other businessbusinesses increased by RMB 2,4173,317 million, or 39.2%43.1%, to RMB 8,58211,013 million in 20172019 from RMB 6,1657,696 million in 2016.2018. This was primarily due to an increase in net share of profit of associates and joint ventures.our gross investment income.
Income Tax
We pay income tax according to applicable Chinese enterprise income tax regulations and rules. Income tax increaseddecreased by RMB 4,6621,204 million, or 109.5%60.7%, to RMB 8,919781 million in 20172019 from RMB 4,2571,985 million in 2016.2018. This was primarily due to the combined impact of taxable incomethe new policy onpre-tax deduction of underwriting and deferred tax.policy acquisition costs. See “Item 4. Information on the Company—Business Overview—Regulatory and Related Matters—Policy on pre-tax deduction of underwriting and policy acquisition costs”.
Net Profit Attributable to Equity Holders of the Company
For the reasons set forth above, net profit attributable to equity holders of the Company increased by RMB 13,12646,892 million, or 68.6%411.5%, to RMB 32,25358,287 million in 20172019 from RMB 19,12711,395 million in 2016.2018. This was primarily due to an increase in theour gross investment income and the impact of the updatenew policy onpre-tax deduction of discount rate assumptions for reserves of traditional insurance contracts.underwriting and policy acquisition costs.
| Major Assets | As of December 31, | As of December 31, | ||||||||||||||
| 2016 | 2017 | 2018 | 2019 | |||||||||||||
| RMB | RMB | RMB | RMB | |||||||||||||
| (in millions) | (in millions) | |||||||||||||||
Investment assets | 2,453,283 | 2,591,652 | ||||||||||||||
Investment assets1 | 3,104,014 | 3,573,154 | ||||||||||||||
Term deposits | 538,325 | 449,400 | 559,341 | 535,260 | ||||||||||||
Held-to-maturity securities | 594,730 | 717,037 | 806,717 | 928,751 | ||||||||||||
Available-for-sale securities | 766,423 | 810,734 | 870,533 | 1,058,957 | ||||||||||||
Securities at fair value through profit or loss | 209,124 | 136,809 | 138,717 | 141,608 | ||||||||||||
Derivative financial assets | — | 428 | ||||||||||||||
Securities purchased under agreements to resell | 43,538 | 36,185 | 9,905 | 4,467 | ||||||||||||
Cash and cash equivalents | 67,046 | 48,586 | 50,809 | 53,306 | ||||||||||||
Loans | 226,573 | 383,504 | 450,251 | 608,920 | ||||||||||||
Statutory deposits—restricted | 6,333 | 6,333 | 6,333 | 6,333 | ||||||||||||
Investment properties | 1,191 | 3,064 | 9,747 | 12,141 | ||||||||||||
Investment in associates and joint ventures | 119,766 | 161,472 | 201,661 | 222,983 | ||||||||||||
Other assets | 123,902 | 144,467 | 150,389 | 153,580 | ||||||||||||
|
|
|
| |||||||||||||
Total | 2,696,951 | 2,897,591 | 3,254,403 | 3,726,734 | ||||||||||||
|
|
|
| |||||||||||||
| 1. | Beginning in 2018, the scope of investment assets has been revised to include investments in associates and joint ventures. |
Investment Assets
Our total investment assets increased by RMB 138,369469,140 million, or 5.6%15.1%, to RMB 2,591,6523,573,154 million as of December 31, 20172019 from RMB 2,453,2833,104,014 million as of December 31, 2016.2018.
Term Deposits
Term deposits decreased by RMB 88,92524,081 million, or 16.5%4.3%, to RMB 449,400535,260 million as of December 31, 20172019 from RMB 538,325559,341 million as of December 31, 2016.2018. This was primarily due to the maturity of certain term deposits.
Held-to-Maturity Securities
Held-to-maturity securities increased by RMB 122,307122,034 million, or 20.6%15.1%, to RMB 717,037928,751 million as of December 31, 20172019 from RMB 594,730806,717 million as of December 31, 2016.2018. This was primarily due to an increase in the allocation in financialof government agency bonds.
Available-for-Sale Securities
Available-for-sale securities increased by RMB 44,311million,188,424 million, or 5.8%21.6%, to RMB 810,7341,058,957 million as of December 31, 20172019 from RMB 766,423870,533 million as of December 31, 2016.2018. This was primarily due to an increase in the allocation inof stocks inavailable-for-sale securities.
Securities at Fair Value Through Profit or Loss
Securities at fair value through profit or loss decreasedincreased by RMB 72,3152,891 million, or 34.6%2.1%, to RMB 136,809141,608 million as of December 31, 20172019 from RMB 209,124138,717 million as of December 31, 2016.2018. This was primarily due to a decreasean increase in the allocationfair value of stocks in commercial papers in bondssecurities at fair value through profit or loss.
Securities Purchased under Agreements to Resell
Securities purchased under agreements to resell decreased by RMB 5,438 million, or 54.9%, to RMB 4,467 million as of December 31, 2019 from RMB 9,905 million as of December 31, 2018. This was primarily due to the needs for liquidity management.
Cash and Cash Equivalents
Cash and cash equivalents decreasedincreased by RMB 18,4602,497 million, or 27.5%4.9%, to RMB 48,58653,306 million as of December 31, 20172019 from RMB 67,04650,809 million as of December 31, 2016.2018. This was primarily due to the needs for liquidity management.
Loans
Loans increased by RMB 156,931158,669 million, or 69.3%35.2%, to RMB 383,504608,920 million as of December 31, 20172019 from RMB 226,573450,251 million as of December 31, 2016.2018. This was primarily due to an increase in the allocation in trust schemes in loans.policy loans and certificates of deposit.
Investment Properties
Investment properties increased by RMB 1,8732,394 million, or 157.3%24.6%, to RMB 3,06412,141 million as of December 31, 20172019 from RMB 1,1919,747 million as of December 31, 2016.2018. This was primarily due to an increasenew investments in investment properties.
Investments in associates and joint ventures
Our investments in associates and joint ventures increased by RMB 41,70621,322 million, or 34.8%10.6%, to RMB 161,472222,983 million as of December 31, 20172019 from RMB 119,766201,661 million as of December 31, 2016.2018. This was primarily reflected ourdue to new investments in associates and joint ventures.
| Major Liabilities | As of December 31, | |||||||
| 2016 | 2017 | |||||||
| RMB | RMB | |||||||
| (in millions) | ||||||||
Liabilities | ||||||||
Insurance contracts | 1,847,986 | 2,025,133 | ||||||
Investment contracts | 195,706 | 232,500 | ||||||
Securities sold under agreements to repurchase | 81,088 | 87,309 | ||||||
Policyholder dividends payable | 87,725 | 83,910 | ||||||
Annuity and other insurance balances payable | 39,038 | 44,820 | ||||||
Interest-bearing loans and borrowings | 16,170 | 18,794 | ||||||
Bonds payable | 37,998 | — | ||||||
Deferred tax liabilities | 7,768 | 4,871 | ||||||
Other liabilities | 75,824 | 74,944 | ||||||
|
|
|
| |||||
Total | 2,389,303 | 2,572,281 | ||||||
|
|
|
| |||||
| Major Liabilities | As of December 31, | |||||||
| 2018 | 2019 | |||||||
| RMB | RMB | |||||||
| (in millions) | ||||||||
Liabilities | ||||||||
Insurance contracts | 2,216,031 | 2,552,736 | ||||||
Investment contracts | 255,434 | 267,804 | ||||||
Securities sold under agreements to repurchase | 192,141 | 118,088 | ||||||
Policyholder dividends payable | 85,071 | 112,593 | ||||||
Annuity and other insurance balances payable | 49,465 | 51,019 | ||||||
Interest-bearing loans and borrowings | 20,150 | 20,045 | ||||||
Deferred tax liabilities | – | 10,330 | ||||||
Other liabilities | 112,821 | 184,777 | ||||||
|
|
|
| |||||
Total | 2,931,113 | 3,317,392 | ||||||
|
|
|
| |||||
Liabilities
Our total liabilities increased by RMB 182,978386,279 million, or 7.7%13.2%, to RMB 2,572,2813,317,392 million as of December 31, 20172019 from RMB 2,389,3032,931,113 million as of December 31, 2016.2018.
Insurance Contracts
Liabilities of insurance contracts increased by RMB 177,147336,705 million, or 9.6%15.2%, to RMB 2,025,1332,552,736 million as of December 31, 20172019 from RMB 1,847,9862,216,031 million as of December 31, 2016.2018 . This was primarily due to the accumulation of insurance liabilities from new insurance business and renewal business. As at the date of the statement of financial position, our insurance contracts reserves passed liability adequacy testing.
Investment Contracts
The account balance of investment contracts increased by RMB 36,79412,370 million, or 18.8%4.8%, to RMB 232,500267,804 million as of December 31, 20172019 from RMB 195,706255,434 million as of December 31, 2016.2018. This was primarily due to an increase in the scale of certain investment contracts.universal insurance accounts.
Securities Sold under Agreements to Repurchase
Securities sold under agreements to repurchase increaseddecreased by RMB 6,22174,053 million, or 7.7%38.5%, to RMB 87,309118,088 million as of December 31, 20172019 from RMB 81,088192,141 million as of December 31, 2016.2018. This was primarily due to the needs for liquidity management.
Policyholder Dividends Payable
Policyholder dividends payable increased by RMB 27,522 million, or 32.4%, to RMB 112,593 million as of December 31, 2019 from RMB 85,071 million as of December 31, 2018. This was primarily due to an increase in investment yields from participating accounts.
Annuity and Other Insurance Balances Payable
Annuity and other insurance balances payable increased by RMB 1,554 million, or 3.1%, to RMB 51,019 million as of December 31, 2019 from RMB 49,465 million as of December 31, 2018. This was primarily due to an increase in maturities and annuities payable.
Interest-bearing Loans and Borrowings
Our borrowings in foreign currency decreased in 2019. Interest-bearing loans and other borrowings include a three-year bank loan of EUR 67 million with a maturity date on January 18, 2021, a five-year bank loan of GBP 275 million with a maturity date on June 25, 2024, a five-year bank loan of US$ 860 million with a maturity date on September 16, 2024, and asix-month bank loan of EUR 127 million with a maturity date on January 11, 2020 which is automatically renewed upon maturity pursuant to the terms of the agreement, all of which are fixed rate loans, and a five-year bank loan of US$ 970 million with a maturity date on September 27, 2024, a three-year loan of EUR 400 million with a maturity date on December 6, 2020, and aone-year bank loan of US$ 18 million with a maturity date on November 6, 2020, all of which are floating rate loans.
Deferred Tax Liabilities
Deferred tax liabilities as of December 31, 2019 were RMB 10,330 million, and there were no deferred tax liabilities as of December 31, 2018. This change was primarily due to the increase in the fair value ofavailable-for-sale securities.
Equity Attributable to Equity Holders of the Company
As of December 31, 2019, equity attributable to our equity holders was RMB 403,764 million, an increase of RMB 85,393 million, or 26.8%, from RMB 318,371 million as of December 31, 2018. This was primarily due to the combined impact of total comprehensive income and profit distributions during 2019.
Year Ended December 31, 2018 Compared with Year Ended December 31, 2017
| Total Revenues | For the year ended December 31, | |||||||
| 2017 | 2018 | |||||||
| RMB | RMB | |||||||
| (in millions) | ||||||||
Net premiums earned | 506,910 | 532,023 | ||||||
Life insurance business | 429,267 | 436,863 | ||||||
Health insurance business | 63,323 | 80,279 | ||||||
Accident insurance business | 14,320 | 14,881 | ||||||
Investment income | 122,727 | 125,167 | ||||||
Investment income from securities at fair value through profit or loss | 4,538 | 5,153 | ||||||
Investment income fromavailable-for-sale securities | 46,627 | 39,483 | ||||||
Investment income fromheld-to-maturity securities | 30,669 | 34,657 | ||||||
Investment income from bank deposits | 23,827 | 22,699 | ||||||
Investment income from loans | 16,320 | 22,894 | ||||||
Other investment income | 746 | 281 | ||||||
Net realized gains on financial assets | 42 | (19,591 | ) | |||||
Net fair value gains through profit or loss | 6,183 | (18,278 | ) | |||||
Other income | 7,493 | 8,098 | ||||||
|
|
|
| |||||
Total | 643,355 | 627,419 | ||||||
|
|
|
| |||||
Net Premiums Earned
Net premiums earned increased by RMB 25,113 million, or 5.0%, to RMB 532,023 million in 2018 from RMB 506,910 million in 2017.
Life Insurance Business
Net premiums earned from life insurance business increased by RMB 7,596 million, or 1.8%, to RMB 436,863 million in 2018 from RMB 429,267 in 2017. This was primarily due to the steady growth of our life insurance business.
Health Insurance Business
Net premiums earned from health insurance business increased by RMB 16,956 million, or 26.8%, to RMB 80,279 million in 2018 from RMB 63,323 million in 2017. This was primarily due to the expansion of our health insurance business.
Accident Insurance Business
Net premiums earned from accident insurance business increased by RMB 561 million, or 3.9%, to RMB 14,881 million in 2018 from RMB 14,320 million in 2017. This was primarily due to the steady growth of our accident insurance business.
Investment Income
Investment income increased by RMB 2,440 million, or 2.0%, from RMB 122,727 million in 2017 to RMB 125,167 million in 2018.
Investment Income from Securities at Fair Value through Profit or Loss
Investment income from securities at fair value through profit or loss increased by RMB 615 million, or 13.6%, to RMB 5,153 million in 2018 from RMB 4,538 million in 2017. This was primarily due to an increase in interest income resulting from an increase in investments in corporate bonds at fair value through profit or loss.
Investment Income fromAvailable-for-Sale Securities
Investment income fromavailable-for-sale securities decreased by RMB 3,8157,144 million, or 15.3%, to RMB 39,483 million in 2018 from RMB 46,627 million in 2017. This was primarily due to a decrease in dividends fromavailable-for-sale equity securities investment funds.
Investment Income fromHeld-to-Maturity Securities
Investment income fromheld-to-maturity securities increased by RMB 3,988 million, or 13.0%, to RMB 34,657 million in 2018 from RMB 30,669 million in 2017. This was primarily due to an increase in interest income resulting from the increase in the allocation in government bonds.
Investment Income from Bank Deposits
Investment income from bank deposits decreased by RMB 1,128 million, or 4.7%, to RMB 22,699 million in 2018 from RMB 23,827 million in 2017. This was primarily due to a decrease in interest income resulting from the fact that new negotiated deposits were mainly made toward the end of 2018 and the decrease in the allocation in deposits other than negotiated deposits.
Investment Income from Loans
Investment income from loans increased by RMB 6,574 million, or 40.3%, to RMB 22,894 million in 2018 from RMB 16,320 million in 2017. This was primarily due to an increase in interest income from trust schemes.
Net Realized Gains on Financial Assets
Net realized gains on financial assets decreased by RMB 19,633 million to losses of RMB 19,591 million in 2018 from gains of RMB 42 million in 2017. This was primarily due to a decrease in spread income of stocks inavailable-for-sale securities and an increase in equity investment assets qualified for impairment.
Net Fair Value Gains through Profit or Loss
Net fair value gains through profit or loss decreased by RMB 24,461 million to losses of RMB 18,278 million in 2018 from gains of RMB 6,183 million in 2017. This was primarily due to a decrease in spread income and fair value of stocks in securities at fair value through profit or loss.
Other Income
Other income increased by RMB 605 million, or 8.1%, to RMB 8,098 million in 2018 from RMB 7,493 million in 2017. This was primarily due to the business growth of China Life Pension.
| Benefits, Claims and Expenses | For the year ended December 31, | |||||||
| 2017 | 2018 | |||||||
| RMB | RMB | |||||||
| (in millions) | ||||||||
Insurance benefits and claims expenses | ||||||||
Life insurance death and other benefits | 259,708 | 248,736 | ||||||
Accident and health claims and claim adjustment expenses | 33,818 | 40,552 | ||||||
Increase in insurance contracts liabilities | 172,517 | 189,931 | ||||||
Investment contracts benefits | 8,076 | 9,332 | ||||||
Policyholder dividends resulting from participation in profits | 21,871 | 19,646 | ||||||
Underwriting and policy acquisition costs | 64,789 | 62,705 | ||||||
Finance costs | 4,601 | 4,116 | ||||||
Administrative expenses | 35,953 | 37,486 | ||||||
Other expenses | 6,426 | 7,642 | ||||||
Statutory insurance fund contribution | 1,068 | 1,097 | ||||||
|
|
|
| |||||
Total | 608,827 | 621,243 | ||||||
|
|
|
| |||||
Segment information of insurance benefits and claims expenses | ||||||||
Life insurance business | 409,410 | 412,876 | ||||||
Health insurance business | 50,624 | 59,689 | ||||||
Accident insurance business | 6,009 | 6,654 | ||||||
|
|
|
| |||||
Total | 466,043 | 479,219 | ||||||
|
|
|
| |||||
Insurance Benefits and Claims Expenses
Insurance benefits and claims, net of amounts ceded through reinsurance, increased by RMB 13,176 million, or 2.8%, to RMB 479,219 million in 2018 from RMB 466,043 million in 2017.
Life insurance death and other benefits payouts decreased by RMB 10,972 million, or 4.2%, to RMB 248,736 million in 2018 from RMB 259,708 million in 2017. This was primarily due to a decrease in maturities payable. Accident and health claims and claim adjustment expenses increased by RMB 6,734 million, or 19.9%, to RMB 40,552 million in 2018 from RMB 33,818 million in 2017. This was primarily due to an increase in the volume of short-term health insurance and accident insurance business. Increase in insurance contracts liabilities increased by RMB 17,414 million, or 10.1%, to RMB 189,931 million in 2018 from RMB 172,517million in 2017. This was primarily due to an increase in the scale of insurance business.
Life Insurance Business
Insurance benefits and claims expenses attributable to life insurance business increased by RMB 3,466 million, or 0.8%, to RMB 412,876 million in 2018 from RMB 409,410 million in 2017. This was primarily due to an increase in the scale of life insurance business.
Health Insurance Business
Insurance benefits and claims expenses attributable to health insurance business increased by RMB 9,065 million, or 17.9%, to RMB 59,689 million in 2018 from RMB 50,624 million in 2017. This was primarily due to the growth in our health insurance business.
Accident Insurance Business
Insurance benefits and claims expenses attributable to accident insurance business increased by RMB 645 million, or 10.7%, to RMB 6,654 million in 2018 from RMB 6,009 million in 2017. This was primarily due to an increase in claims expenses of certain businesses.
Investment Contract Benefits
Investment contract benefits increased by RMB 1,256 million, or 15.6%, to RMB 9,332 million in 2018 from RMB 8,076 million in 2017. This was primarily due to an increase in the scale of universal insurance accounts.
Policyholder Dividends Resulting from Participation in Profits
Policyholder dividends resulting from participation in profits decreased by RMB 2,225 million, or 10.2%, to RMB 19,646 million in 2018 from RMB 21,871 million in 2017. This was primarily due to a decrease in investment yields from participating accounts.
Underwriting and Policy Acquisition Costs
Underwriting and policy acquisition costs decreased by RMB 2,084 million, or 3.2%, to RMB 62,705 million in 2018 from RMB 64,789 million in 2017. This was primarily due to the increase in the percentage of renewal premiums in gross written premiums as a result of our enhanced efforts in the adjustment of our business structure.
Finance Costs
Finance costs decreased by RMB 485 million, or 10.5%, to RMB 4,116 million in 2018 from RMB 4,601 million in 2017. This was primarily due to a decrease in interest paid due to redemptions of subordinated debts.
Administrative Expenses
Administrative expenses include employees’ remuneration and other administrative expenses. Administrative expenses increased by RMB 1,533 million, or 4.3%, to RMB 37,486 million in 2018 from RMB 35,953 million in 2017. This was primarily due to the growth of our business.
Other Expenses
Other expenses increased by RMB 1,216 million, or 18.9%, to RMB 7,642 million in 2018 from RMB 6,426 million in 2017. This was primarily due to the change in foreign exchange rates applicable to our assets and liabilities held in foreign currencies and interest from dividends.
| Profit | For the year ended December 31, | |||||||
| 2017 | 2018 | |||||||
| RMB | RMB | |||||||
| (in millions) | ||||||||
Profit before income tax | 41,671 | 13,921 | ||||||
Life insurance business | 29,315 | 1,630 | ||||||
Health insurance business | 3,246 | 4,100 | ||||||
Accident insurance business | 528 | 495 | ||||||
Other businesses | 8,582 | 7,696 | ||||||
Income tax | 8,919 | 1,985 | ||||||
Net profit attributable to equity holders of the company | 32,253 | 11,395 | ||||||
Profit before Income Tax
Our profit before income tax decreased by RMB 27,750 million, or 66.6%, to RMB 13,921 million in 2018 from RMB 41,671 million in 2017.
Life Insurance Business
Profit before income tax in the life insurance business decreased by RMB 27,685 million, or 94.4%, to RMB 1,630 million in 2018 from RMB 29,315 million in 2017. This was primarily due to a significant decrease in the gross investment income from public market equity investments due to the overall volatility and downward trend in equity markets.
Health Insurance Business
Profit before income tax in the health insurance business increased by RMB 854 million, or 26.3%, to RMB 4,100 million in 2018 from RMB 3,246 million in 2017. This was primarily due to the growth and quality improvement in the short-term health insurance business.
Accident Insurance Business
Profit before income tax in the accident insurance business decreased by RMB 33 million, or 6.3%, to RMB 495 million in 2018 from RMB 528 million in 2017. This was primarily due to fluctuation in claims expenses of certain accident insurance businesses.
Other Business
Profit before income tax in other business decreased by RMB 886 million, or 10.3%, to RMB 7,696 million in 2018 from RMB 8,582 million in 2017. This was primarily due to fluctuation in exchange rates for liabilities of our subsidiaries held in foreign currencies.
Income Tax
We pay income tax according to applicable Chinese enterprise income tax regulations and rules. Income tax decreased by RMB 6,934 million, or 77.7%, to RMB 1,985 million in 2018 from RMB 8,919 million in 2017. This was primarily due to the combined impact of taxable income and deferred income tax.
Net Profit Attributable to Equity Holders of the Company
For the reasons set forth above, net profit attributable to equity holders of the Company decreased by RMB 20,858 million, or 64.7%, to RMB 11,395 million in 2018 from RMB 32,253 million in 2017. This was primarily due to a significant decrease in the gross investment income from public market equity investments due to the overall volatility and downward trend in equity markets.
| Major Assets | As of December 31, | |||||||
| 2017 | 2018 | |||||||
| RMB | RMB | |||||||
| (in millions) | ||||||||
Investment assets1 | 2,753,124 | 3,104,014 | ||||||
Term deposits | 449,400 | 559,341 | ||||||
Held-to-maturity securities | 717,037 | 806,717 | ||||||
Available-for-sale securities | 810,734 | 870,533 | ||||||
Securities at fair value through profit or loss | 136,809 | 138,717 | ||||||
Securities purchased under agreements to resell | 36,185 | 9,905 | ||||||
Cash and cash equivalents | 48,586 | 50,809 | ||||||
Loans | 383,504 | 450,251 | ||||||
Statutory deposits—restricted | 6,333 | 6,333 | ||||||
Investment properties | 3,064 | 9,747 | ||||||
Investment in associates and joint ventures | 161,472 | 201,661 | ||||||
Other assets | 144,467 | 150,389 | ||||||
|
|
|
| |||||
Total | 2,897,591 | 3,254,403 | ||||||
|
|
|
| |||||
| 1. | Beginning in 2018, the scope of investment assets has been revised to include investments in associates and joint ventures, and the amounts of investment assets for 2017 and 2016 have also been revised to conform to this revised scope. |
Investment Assets
Our total investment assets increased by RMB 350,890 million, or 12.7%, to RMB 3,104,014 million as of December 31, 2018 from RMB 2,753,124 million as of December 31, 2017.
Term Deposits
Term deposits increased by RMB 109,941 million, or 24.5%, to RMB 559,341 million as of December 31, 2018 from RMB 449,400 million as of December 31, 2017. This was primarily due to an increase in the scale of the negotiated deposits.
Held-to-Maturity Securities
Held-to-maturity securities increased by RMB 89,680 million, or 12.5%, to RMB 806,717 million as of December 31, 2018 from RMB 717,037 million as of December 31, 2017. This was primarily due to an increase in the allocation of government bonds.
Available-for-Sale Securities
Available-for-sale securities increased by RMB 59,799 million, or 7.4%, to RMB 870,533 million as of December 31, 2018 from RMB 810,734 million as of December 31, 2017. This was primarily due to an increase in the allocation of financial bonds inavailable-for-sale securities.
Securities at Fair Value Through Profit or Loss
Securities at fair value through profit or loss increased by RMB 1,908 million, or 1.4%, to RMB 138,717 million as of December 31, 2018 from RMB 136,809 million as of December 31, 2017. This was primarily due to an increase in the scale of corporate bonds in securities at fair value through profit or loss.
Cash and Cash Equivalents
Cash and cash equivalents increased by RMB 2,223 million, or 4.6%, to RMB 50,809 million as of December 31, 2018 from RMB 48,586 million as of December 31, 2017. This was primarily due to the needs for liquidity management.
Loans
Loans increased by RMB 66,747 million, or 17.4%, to RMB 450,251 million as of December 31, 2018 from RMB 383,504 million as of December 31, 2017. This was primarily due to an increase in the scale of policy loans.
Investment Properties
Investment properties increased by RMB 6,683 million, or 218.1%, to RMB 9,747 million as of December 31, 2018 from RMB 3,064 million as of December 31, 2017. This was primarily due to new investments in investment properties.
Investments in associates and joint ventures
Our investments in associates and joint ventures increased by RMB 40,189 million, or 24.9%, to RMB 201,661 million as of December 31, 2018 from RMB 161,472 million as of December 31, 2017. This was primarily due to the fact that we increased our allocation in investments in associates and joint ventures, and that the equity of investments in associates and joint ventures increased.
| Major Liabilities | As of December 31, | |||||||
| 2017 | 2018 | |||||||
| RMB | RMB | |||||||
| (in millions) | ||||||||
Liabilities | ||||||||
Insurance contracts | 2,025,133 | 2,216,031 | ||||||
Investment contracts | 232,500 | 255,434 | ||||||
Securities sold under agreements to repurchase | 87,309 | 192,141 | ||||||
Policyholder dividends payable | 83,910 | 85,071 | ||||||
Annuity and other insurance balances payable | 44,820 | 49,465 | ||||||
Interest-bearing loans and borrowings | 18,794 | 20,150 | ||||||
Deferred tax liabilities | 4,871 | — | ||||||
Other liabilities | 74,944 | 112,821 | ||||||
|
|
|
| |||||
Total | 2,572,281 | 2,931,113 | ||||||
|
|
|
| |||||
Liabilities
Our total liabilities increased by RMB 358,832 million, or 13.9%, to RMB 2,931,113 million as of December 31, 2018 from RMB 2,572,281 million as of December 31, 2017.
Insurance Contracts
Liabilities of insurance contracts increased by RMB 190,898 million, or 9.4%, to RMB 2,216,031 million as of December 31, 2018 from RMB 2,025,133 million as of December 31, 2017. This was primarily due to the accumulation of insurance liabilities from new policies and renewal business. As at the date of the statement of financial position, our insurance contracts reserves passed liability adequacy testing.
Investment Contracts
The account balance of investment contracts increased by RMB 22,934 million, or 9.9%, to RMB 255,434 million as of December 31, 2018 from RMB 232,500 million as of December 31, 2017. This was primarily due to an increase in the scale of universal insurance accounts.
Securities Sold under Agreements to Repurchase
Securities sold under agreements to repurchase increased by RMB 104,832 million, or 120.1%, to RMB 192,141 million as of December 31, 2018 from RMB 87,309 million as of December 31, 2017. This was primarily due to the needs for liquidity management.
Policyholder Dividends Payable
Policyholder dividends payable increased by RMB 1,161 million, or 1.4%, to RMB 85,071 million as of December 31, 2018 from RMB 83,910 million as of December 31, 2017 from RMB 87,725 million as of December 31, 2016.2017. This was primarily due to dividends paid to policyholders.the increase of dividend on deposit.
Annuity and Other Insurance Balances Payable
Annuity and other insurance balances payable increased by RMB 5,7824,645 million, or 14.8%10.4%, to RMB 49,465 million as of December 31, 2018 from RMB 44,820 million as of December 31, 2017 from RMB 39,038 million as of December 31, 2016.2017. This was primarily due to an increase in maturities payable.
Interest-bearing Loans and Borrowings
Our borrowings in foreign currency increased in 2017.2018. Interest-bearing loans and other borrowings include a five-year bank loan of GBP275GBP 275 million with a maturity date on June 17, 2019, a three-year bank loan of US$ 970 million with a maturity date on September 27, 2019, a three-year bank loan of US$ 940 million with a maturity date on September 30, 2019, anda three-year bank loan of EUR 67 million with a maturity date on January 18, 2021, aone-monthsix-month bank loan of EUR100EUR 127 million with a maturity date on January 11, 2018,2019 and to be automatically renewed upon maturity, all of which are fixed rate loans, and a three-year loan of EUR400EUR 400 million with a maturity date on December 6, 2020, which is a floating rate loan.
Bonds Payable
Bonds payable as of December 31, 2016 were RMB 37,998 million, and there were no bonds payable as of December 31, 2017.The reduction in bonds payable was primarily due to redemption of subordinated debts.
Deferred Tax Liabilities
Deferred tax liabilities decreased by RMB 2,897 million, or 37.3%, to RMB 4,871million as of December 31, 2017 fromwere RMB 7,7684,871 million, and there were no deferred tax liabilities as of December 31, 2016.2018. This change was primarily due to the decrease in the fair value ofavailable-for-sale securities.
Equity Attributable to Equity Holders of the Company
As of December 31, 2017,2018, equity attributable to our equity holders was RMB 320,933318,371 million, an increasea decrease of RMB 17,3122,562 million, or 5.7%0.8%, from RMB 303,621320,933 million as of December 31, 2016. This was primarily due to the combined effect of an increase in total comprehensive income and profit distributions during 2017.
Year Ended December 31, 2016 Compared with Year Ended December 31, 2015
| Total Revenues | For the year ended December 31, | |||||||
| 2015 | 2016 | |||||||
| RMB | RMB | |||||||
| (in millions) | ||||||||
Net premiums earned | 362,301 | 426,230 | ||||||
Life insurance business | 308,081 | 361,649 | ||||||
Health insurance business | 40,855 | 50,590 | ||||||
Accident insurance business | 13,365 | 13,991 | ||||||
Investment income | 97,582 | 109,147 | ||||||
Investment income from securities at fair value through profit or loss | 1,708 | 6,210 | ||||||
Investment income fromavailable-for-sale securities | 27,476 | 37,243 | ||||||
Investment income fromheld-to-maturity securities | 24,541 | 24,854 | ||||||
Investment income from bank deposits | 32,285 | 27,851 | ||||||
Investment income from loans | 11,115 | 12,018 | ||||||
Other investment income | 457 | 971 | ||||||
Net realized gains on financial assets | 32,297 | 6,038 | ||||||
Net fair value gains through profit or loss | 10,209 | (7,094 | ) | |||||
Other income | 5,060 | 6,460 | ||||||
|
|
|
| |||||
Total | 507,449 | 540,781 | ||||||
|
|
|
| |||||
Net Premiums Earned
Net premiums earned increased by RMB 63,929 million, or 17.6%, to RMB 426,230 million in 2016 from RMB 362,301 million in 2015.
Life Insurance Business
Net premiums earned from life insurance business increased by RMB 53,568 million, or 17.4%, to RMB 361,649 million in 2016 from RMB 308,081 million in 2015. This was primarily due to an increase in first-year regular premiums and renewals.
Health Insurance Business
Net premiums earned from health insurance business increased by RMB 9,735 million, or 23.8 %, to RMB 50,590 million in 2016 from RMB 40,855 million in 2015. This was primarily due to our increased efforts in developing the health insurance business to meet market demand.
Accident Insurance Business
Net premiums earned from accident insurance business increased by RMB 626 million, or 4.7%, to RMB 13,991 million in 2016 from RMB 13,365 million in 2015. This was primarily due to further optimization of our business structure and a decrease in sales of certain products with high claim settlement ratios.
Investment Income
Investment income increased by RMB 11,565 million, or 11.9%, to RMB 109,147 million in 2016 from RMB 97,582 million in 2015.
Investment Income from Securities at Fair Value through Profit or Loss
Investment income from securities at fair value through profit or loss increased by RMB 4,502 million, or 263.6%, to RMB 6,210 million in 2016 from RMB 1,708 million in 2015. This was primarily due to an increase in interest income resulting from increased investments in trading bonds, principally commercial paper and corporate bonds.
Investment Income fromAvailable-for-Sale Securities
Investment income fromavailable-for-sale securities increased by RMB 9,767 million, or 35.5%, to RMB 37,243 million in 2016 from RMB 27,476 million in 2015. This was primarily due to an increase in dividend income fromavailable-for-sale equity investments.
Investment Income fromHeld-to-Maturity Securities
Investment income fromheld-to-maturity securities increased by RMB 313 million, or 1.3%, to RMB 24,854 million in 2016 from RMB 24,541 million in 2015. This was primarily due to an increase in the allocation in bonds offset in part by a decrease in the rate of return on reinvested funds and new investments in the low interest rate environment.
Investment Income from Bank Deposits
Investment income from bank deposits decreased by RMB 4,434 million, or 13.7%, to RMB 27,851 million in 2016 from RMB 32,285 million in 2015. This was primarily due to a decrease in the allocation of negotiated deposits, and a decrease in the rate of return for new investments in the low interest rate environment.
Investment Income from Loans
Investment income from loans increased by RMB 903 million, or 8.1%, to RMB 12,018 million in 2016 from RMB 11,115 million in 2015. This was primarily due to an increase in investments in other loans,which mainly consist of our investments in different types of asset management products.
Net Realized Gains on Financial Assets
Net realized gains on financial assets decreased by RMB 26,259 million, or 81.3%, to gains of RMB 6,038 million in 2016 from gains of RMB 32,297 million in 2015. This was primarily due to a significant decrease in spread income of stocks and securities investment funds resulting from fluctuations in the capital markets.
Net Fair Value Gains through Profit or Loss
Net fair value gains through profit or loss decreased by RMB 17,303 million to losses of RMB 7,094 million in 2016 from gains of RMB 10,209 million in 2015. This was primarily due to a significant decrease in spread income of stocks resulting from fluctuations in the capital markets.
Other Income
Other income increased by RMB 1,400 million, or 27.7%, to RMB 6,460 million in 2016 from RMB 5,060 million in 2015. This was primarily due to an increase in the commission fees earned from CLPCIC.
| Benefits, Claims and Expenses | For the year ended December 31, | |||||||
| 2015 | 2016 | |||||||
| RMB | RMB | |||||||
| (in millions) | ||||||||
Insurance benefits and claims expenses | ||||||||
Life insurance death and other benefits | 221,701 | 253,157 | ||||||
Accident and health claims and claim adjustment expenses | 21,009 | 27,269 | ||||||
Increase in insurance contracts liabilities | 109,509 | 126,619 | ||||||
Investment contracts benefits | 2,264 | 5,316 | ||||||
Policyholder dividends resulting from participation in profits | 33,491 | 15,883 | ||||||
Underwriting and policy acquisition costs | 35,569 | 52,022 | ||||||
Finance costs | 4,320 | 4,767 | ||||||
Administrative expenses | 27,458 | 31,854 | ||||||
Other expenses | 7,428 | 4,859 | ||||||
Statutory insurance fund contribution | 743 | 1,048 | ||||||
|
|
|
| |||||
Total | 463,492 | 522,794 | ||||||
|
|
|
| |||||
Segment information of insurance benefits and claims expenses | ||||||||
Life insurance business | 313,612 | 360,922 | ||||||
Health insurance business | 34,398 | 40,513 | ||||||
Accident insurance business | 4,209 | 5,610 | ||||||
|
|
|
| |||||
Total | 352,219 | 407,045 | ||||||
|
|
|
| |||||
Insurance Benefits and Claims Expenses
Insurance benefits and claims, net of amounts ceded through reinsurance, increased by RMB 54,826 million, or 15.6%, to RMB 407,045 million in 2016 from RMB 352,219 million in 2015.
Life insurance death and other benefits payouts increased by RMB 31,456 million, or 14.2%, to RMB 253,157 million in 2016 from RMB 221,701 million in 2015. This was primarily due toan increase in maturities payable of life insurance business and annuity benefits. Accident and health claims and claim adjustment expenses increased by RMB 6,260 million, or 29.8%, to RMB 27,269 million in 2016 from RMB 21,009 million in 2015. This was primarily due to an increase in the volume of short-term health insurance and accident insurance business. Increase in insurance contracts liabilities increased by RMB 17,110 million, or 15.6%, to RMB 126,619 million in 2016 from RMB 109,509 million in 2015. This was primarily due to an increase in the scale of insurance business.
Life Insurance Business
Insurance benefits and claims expenses attributable to life insurance business increased by RMB 47,310 million, or 15.1%, to 360,922 million in 2016 from RMB 313,612 million in 2015. This was primarily due to an increase in maturities payable and annuity payments in our life insurance business.
Health Insurance Business
Insurance benefits and claims expenses attributable to health insurance business increased by RMB 6,115 million, or 17.8%, to RMB 40,513 million in 2016 from RMB 34,398 million in 2015. This was primarily due to an increase in the scale of health insurance business.
Accident Insurance Business
Insurance benefits and claims expenses attributable to accident insurance business increased by RMB 1,401 million, or 33.3%, to RMB 5,610 million in 2016 from RMB 4,209 million in 2015. This was primarily due to the increase of claims expenses for certain businesses.
Investment Contract Benefits
Investment contract benefits increased by RMB 3,052 million, or 134.8%, to RMB 5,316 million in 2016 from RMB 2,264 million in 2015. This was primarily due to an increase in the scale of investment contracts.
Policyholder Dividends Resulting from Participation in Profits
Policyholder dividends resulting from participation in profits decreased by RMB 17,608 million, or 52.6%, to RMB 15,883 million in 2016 to RMB 33,491 million in 2015. This was primarily due to a decrease in investment yields for participating products.
Underwriting and Policy Acquisition Costs
Underwriting and policy acquisition costs increased by RMB 16,453 million, or 46.3%, to RMB 52,022 million in 2016 from RMB 35,569 million in 2015. This was primarily due to an increase in underwriting costs for first-year regular premium business resulting from the growth of our business and the optimization of our business structure.
Finance Costs
Finance costs increased by RMB 447 million, or 10.3%, to RMB 4,767 million in 2016 from RMB 4,320 million in 2015. This was primarily due to an increase in interest income from securities sold under agreements to repurchase.
Administrative Expenses
Administrative expenses include employees’ remuneration and other administrative expenses. Administrative expenses increased by RMB 4,396 million, or 16%, to RMB 31,854 million in 2016 from RMB 27,458 million in 2015. This was primarily due to the growth of our business.
Other Expenses
Other expenses decreased by RMB 2,569 million, or 34.6%, to RMB 4,859 million in 2016 from RMB 7,428 million in 2015. This was primarily due to the fact that our income from financial and insurance services has been subject to value-added tax instead of business taxes since May 1, 2016.
| Profit | For the year ended December 31, | |||||||
| 2015 | 2016 | |||||||
| RMB | RMB | |||||||
| (in millions) | ||||||||
Profit before income tax | 45,931 | 23,842 | ||||||
Life insurance business | 40,921 | 14,732 | ||||||
Health insurance business | 557 | 2,093 | ||||||
Accident insurance business | 1,753 | 852 | ||||||
Other businesses | 2,700 | 6,165 | ||||||
Income tax | 10,744 | 4,257 | ||||||
Net profit attributable to equity holders of the company | 34,699 | 19,127 | ||||||
Profit before Income Tax
Our profit before income tax decreased by RMB 22,089 million, or 48.1%, to RMB 23,842 million in 2016 from RMB 45,931 million in 2015.
Life Insurance Business
Profit before income tax in the life insurance business decreased by RMB 26,189 million, or 64.0%, to RMB 14,732 million in 2016 from RMB 40,921 million in 2015. This was primarily due to a decrease in gross investment income and the impact of the update of discount rate assumptions for reserves for traditional insurance contracts.
Health Insurance Business
Profit before income tax in the health insurance business increased by RMB 1,536 million, or 275.8%, to RMB 2,093 million in 2016 from RMB 557 million in 2015. This was primarily due to the improvement of the business structure of our health insurance.
Accident Insurance Business
Profit before income tax in the accident insurance business decreased by RMB 901 million, or 51.4%, to RMB 852 million in 2016 from RMB 1,753 million in 2015. This was primarily due to an increase in claims expenses.
Other Business
Profit before income tax in other business increased by RMB 3,465 million, or 128.3%, to RMB 6,165 million in 2016 from RMB 2,700 million in 2015. This was primarily due to an increase in net share of profit of associates and joint ventures.
Income Tax
We pay income tax according to applicable Chinese enterprise income tax regulations and rules. Income tax decreased by RMB 6,487 million or 60.4%, to RMB 4,257 million in 2016 from RMB 10,744 million in 2015. This was primarily due to the combined impact of taxable income and deferred tax.
Net Profit Attributable to Equity Holders of the Company
For the reasons set forth above, net profit attributable to equity holders of the Company decreased by RMB 15,572million, or 44.9%, to RMB 19,127 million in 2016 from RMB 34,699 million in 2015. This was primarily due to the decrease in gross investment income and the impact of the update of discount rate assumptions for reserves for traditional insurance contracts.
| Major Assets | As of December 31, | |||||||
| 2015 | 2016 | |||||||
| RMB | RMB | |||||||
| (in millions) | ||||||||
Investment assets | 2,287,639 | 2,453,283 | ||||||
Term deposits | 562,622 | 538,325 | ||||||
Held-to-maturity securities | 504,075 | 594,730 | ||||||
Available-for-sale securities | 770,516 | 766,423 | ||||||
Securities at fair value through profit or loss | 137,990 | 209,124 | ||||||
Securities purchased under agreements to resell | 21,503 | 43,538 | ||||||
Cash and cash equivalents | 76,096 | 67,046 | ||||||
Loans | 207,267 | 226,573 | ||||||
Statutory deposits—restricted | 6,333 | 6,333 | ||||||
Investment properties | 1,237 | 1,191 | ||||||
Investment in associates and joint ventures | 47,175 | 119,766 | ||||||
Other assets | 113,501 | 123,902 | ||||||
|
|
|
| |||||
Total | 2,448,315 | 2,696,951 | ||||||
|
|
|
| |||||
Investment Assets
Our total investment assets increased by RMB 165,644 million, or 7.2%, to RMB 2,453,283 million as of December 31, 2016 from RMB 2,287,639 million as of December 31, 2015.
Term Deposits
Term deposits decreased by RMB 24,297 million, or 4.3%, to RMB 538,325 million as of December 31, 2016 from RMB 562,622 million as of December 31, 2015. This was primarily due to a decrease in the scale of negotiated deposits.
Held-to-Maturity Securities
Held-to-maturity securities increased by RMB 90,655 million, or 18.0%, to RMB 594,730 million as of December 31, 2016 from RMB 504,075 million as of December 31, 2015. This was primarily due to an increase in the allocation in bonds.
Available-for-Sale Securities
Available-for-sale securities decreased by RMB 4,093 million, or 0.5%, to RMB 766,423 million as of December 31, 2016 from RMB 770,516 million as of December 31, 2015.
Securities at Fair Value Through Profit or Loss
Securities at fair value through profit or loss increased by RMB 71,134 million, or 51.6%, to RMB 209,124 million as of December 31, 2016 from RMB 137,990 million as of December 31, 2015. This was primarily due to increased investments in listed bonds, principally commercial paper and corporate bonds.
Cash and Cash Equivalents
Cash and cash equivalents decreased by RMB 9,050 million, or 11.9%, to RMB 67,046 million as of December 31, 2016 from RMB 76,096 million as of December 31, 2015. This was primarily due to the needs for liquidity management.
Loans
Loans increased by RMB 19,306 million, or 9.3%, to RMB 226,573 million as of December 31, 2016 from RMB 207,267 million as of December 31, 2015. This was primarily due to an increase in investments in policy loans and other loans, which mainly consist of our investments in different types of asset management products.
Investment Properties
Investment properties decreased by RMB 46 million, or 3.7%, to RMB 1,191 million as of December 31, 2016 from RMB 1,237 million as of December 31, 2015. This was primarily due to depreciation of investment properties.
Investments in associates and joint ventures
Our investments in associates and joint ventures increased by RMB 72,591 million, or 153.9%, to RMB 119,766 million as of December 31, 2016 from RMB 47,175 million as of December 31, 2015. This primarily reflected our new investments in associates and joint ventures and an increase in interests in associates.
Liabilities Insurance contracts Investment contracts Securities sold under agreements to repurchase Policyholder dividends payable Annuity and other insurance balances payable Interest-bearing loans and borrowings Bonds payable Deferred tax liabilities Other liabilities Total Major Liabilities As of December 31, 2015 2016 RMB RMB (in millions) 1,715,985 1,847,986 84,106 195,706 31,354 81,088 107,774 87,725 30,092 39,038 2,643 16,170 67,994 37,998 16,953 7,768 65,200 75,824 2,122,101 2,389,303
Liabilities
Our total liabilities increased by RMB 267,202 million, or 12.6%, to RMB 2,389,303 million as of December 31, 2016 from RMB 2,122,101 million as of December 31, 2015.
Insurance Contracts
Liabilities of insurance contracts increased by RMB 132,001 million, or 7.7%, to RMB 1,847,986 million as of December 31, 2016 from RMB 1,715,985 million as of December 31, 2015. This was primarily due to the accumulation of insurance liabilities from new insurance business and renewal business. As at the date of the statement of financial position, our insurance contracts reserves passed liability adequacy testing.
Investment Contracts
The account balance of investment contracts increased by RMB 111,600 million, or 132.7%, to RMB 195,706 million as of December 31, 2016 from RMB 84,106 million as of December 31, 2015. This was primarily due to an increase in the scale of certain investment contracts.
Securities Sold under Agreements to Repurchase
Securities sold under agreements to repurchase increased by RMB 49,734 million, or 158.6%, to RMB 81,088 million as of December 31, 2016 from RMB 31,354 million as of December 31, 2015. This was primarily due to the needs for liquidity management.
Policyholder Dividends Payable
Policyholder dividends payable decreased by RMB 20,049 million, or 18.6%, to RMB 87,725 million as of December 31, 2016 from RMB 107,774 million as of December 31, 2015. This was primarily due to a decrease in investment yields of participating products.
Annuity and Other Insurance Balances Payable
Annuity and other insurance balances payable increased by RMB 8,946 million, or 29.7%, to RMB 39,038 million as of December 31, 2016 from RMB 30,092 million as of December 31, 2015. This was primarily due to an increase in maturities payable.
Interest-bearing Loans and Borrowings
Our borrowings in foreign currency increased in 2016. Interest-bearing loans and other borrowings include a five-year bank loan of GBP 275 million with a maturity date of June 17, 2019, a three-year bank loan of US$948 million with a maturity date of September 27, 2019, a three-year bank loan of US$940 million with a maturity date of September 30, 2019 and asix-month bank loan of EUR100 million with a maturity date of June 9, 2017. All these loans are fixed rate loans.
Bonds Payable
Bonds payable decreased by RMB 29,996 million, or 44.1%, to RMB 37,998 million as of December 31, 2016 from RMB 67,994 million as of December 31, 2015. This was primarily due to redemption of some of our subordinated term debts.
Deferred Tax Liabilities
Deferred tax liabilities decreased by RMB 9,185 million, or 54.2%, to RMB 7,768 million as of December 31, 2016 from RMB 16,953 million as of December 31, 2015. This was primarily due to the decrease in the fair value ofavailable-for-sale securities.
Equity Attributable to Equity Holders of the Company
As of December 31, 2016, equity attributable to our equity holders was RMB 303,621 million, a decrease of RMB 18,871million, or 5.9%, from RMB 322,492 million as of December 31, 2015. This was primarily due to profit distributions and the decrease in total comprehensive income and profit distributions during 2016.2018.
B. LIQUIDITY AND CAPITAL RESOURCES
Liquidity Sources
Our principal cash inflows come from insurance premiums, deposits from investment contracts, proceeds from sales and maturity of investment assets and investment income. The primary liquidity risks with respect to these cash inflows are the risk of surrenders by contract holders and policyholders, as well as the risks of default by debtors, interest rate changes and other market volatilities. We closely monitor and manage these risks. See “Item 4. Information on the Company—Business Overview—Investments”.
Our cash and bank deposits provide us with a source of liquidity to meet normal cash outflows. As of December 31, 2017,2019, the amount of cash and cash equivalents was RMB 48,58653,306 million. In addition, substantially all of our term deposits with banks allow us to withdraw funds on deposit, subject to a penalty interest charge. As of December 31, 2017,2019, the amount of term deposits was RMB 449,400535,260 million.
Our investment portfolio also provides us with a source of liquidity to meet unexpected cash outflows. We are also subject to market liquidity risk due to the large size of our investments in some of the markets in which we invest. In some circumstances, some of our holdings of investment securities may be large enough to have an influence on the market value. These factors may adversely affect our ability to sell these investments at an adequate price, or at all.
Liquidity Uses
Our principal cash outflows primarily relate to the payables for the liabilities associated with our various life insurance, annuity, accident insurance and health insurance products, operating expenses, income taxes and dividends that may be declared and paid to our shareholders. Cash outflows arising from our insurance activities primarily relate to benefit payments under these insurance products, as well as payments for policy surrenders, policy withdrawals and policy loans.
We believe that our sources of liquidity are sufficient to meet our current cash requirements.
Consolidated Cash Flows
We have established a cash flow testing system and conduct regular tests to monitor the cash inflows and outflows under various changing circumstances and adjust accordingly the asset portfolio to ensure sufficient sources of liquidity.
Net cash flow from operating activities amounted to a net inflow of RMB 200,990286,032 million (US$ 30,89241,086 million) in 2017.2019. Net cash flow from operating activities amounted to a net inflow of RMB 89,098147,552 million in 2016.2018. The change was primarily due to the changea decrease in the scale of securities at fair value through profit or loss.surrender payments and maturity payments.
Net cash flow from investing activities amounted to a net outflow of RMB 173,676247,515 million (US$ 26,69435,553 million) in 2017.2019. Net cash flow from investing activities amounted to a net outflow of RMB 104,703238,373 million in 2016.2018. This change was primarily due to the adjustment ofneeds for investment asset structure and an increase in the allocation of bonds with long duration and debt-type financial products.management.
Net cash flow from financing activities amounted to net outflow of RMB 45,59536,075 million (US$ 7,0085,182 million) in 2017.2019. Net cash flow from financing activities amounted to a net inflow of RMB 6,27092,963 million in 2016.2018. This change was primarily due to the change in account balance of securities sold under agreements to repurchase from time to time as a result ofneeds for liquidity management activities.management.
Our global share offering in December 2003 provided cash proceeds of approximately RMB 24,707 million (US$ 3,062 million).which are held in Hong Kong dollars or U.S dollars. As of the date of this annual report, a part of the cash proceeds from our global offering was held in bank deposit accounts denominated in foreign currencies in China, and part of the cash proceeds was invested in securities listed on overseas stock exchanges, multi-asset portfolios and private equity funds. We invested approximately US$ 433 million, in addition to RMB 2,282 million, in Guangdong Development Bank in December 2006. We used a total of approximately HK$ 12 billion for investments in Sino-Ocean Land HoldingsGroup Holding Limited in 2009, 2010 and 2013.As of December 31, 2017,2019, we had engaged 1310 third party overseas investment managers to manage US$ 1,6001,363 million for investment in overseas public markets.
Our A share offering in December 2006 provided cash proceeds of approximately RMB 27,810 million. As at the end of 2017,2019, the cash proceeds from our A share offering were used to increase our share capital.
Our issuance of Core Tier 2 Capital Securities in July 2015 provided cash proceeds of approximately US$ 1,274 million. As at the end of 2017,2019, cash proceeds from the issuance of Core Tier 2 Capital Securities were used to replenish our capital and raise our solvency ratio in accordance with applicable laws and approvals by regulatory authorities.
In March 2019, we issued bonds in the principal amount of RMB 35 billion in the national inter-bank bond market. The bonds have a10-year maturity and a fixed coupon rate of 4.28% per annum. We have a conditional right to redeem the bonds on the fifth anniversary of issuance. The proceeds from the issuance of the bonds will be used to replenish our capital so as to enhance our solvency according to applicable laws and approvals from regulatory authorities.
Ratio of Assets and Liabilities
Our ratio of assets and liabilities (total liabilities divided by total assets) as at December 31, 2017, 20162019, 2018 and 20152017 are as follows:
| As at December 31, 2015 | As at December 31, 2016 | As at December 31, 2017 | ||||||||||
Ratio of assets and liabilities | 86.68 | % | 88.59 | % | 88.77 | % | ||||||
| As at December 31, 2017 | As at December 31, 2018 | As at December 31, 2019 | ||||||||||
Ratio of assets and liabilities | 88.77 | % | 90.07 | % | 89.02 | % | ||||||
Insurance Solvency Requirements
We are required by CIRC regulation to maintain our solvency at a level in excess of minimum solvency levels. Onlevels underC-ROSS solvency regulations, which have been effective from January 1, 2016, the CIRC implemented a new set of solvency regulations, orC-ROSS, which replaced Solvency I.2016. UnderC-ROSS, the core solvency adequacy ratio of an insurer is calculated by dividing the core capital of an insurer by the minimum capital it is required to meet, and the comprehensive solvency adequacy ratio of an insurer is calculated by dividing the sum of core capital and supplementary capital of an insurer by the minimum capital it is required to meet. See “Item 4. Information on the Company—Business Overview—Regulatory and Related Matters—Insurance Company Regulation—Solvency requirements”. The following table shows our solvency as of December 31, 2015, 20162017 2018 and 2017:2019:
| As of December 31, 2017 | As of December 31, 2016 | As of December 31, 2015 | ||||||||||
| (RMB in millions, except percentage data) | ||||||||||||
Core capital | 706,516 | 639,396 | ||||||||||
Actual capital | 706,623 | 677,768 | 282,820 | (1) | ||||||||
Minimum capital | 254,503 | 228,080 | 85,676 | (1) | ||||||||
Core solvency ratio | 277.61 | % | 280.34 | % | ||||||||
Comprehensive solvency ratio | 277.65 | % | 297.16 | % | 330.10 | %(2) | ||||||
| As of December 31, 2019 | As of December 31, 2018 | As of December 31, 2017 | ||||||||||
| (RMB in millions, except percentage data) | ||||||||||||
Core capital | 952,030 | 761,353 | 706,516 | |||||||||
Actual capital | 987,067 | 761,367 | 706,623 | |||||||||
Minimum capital | 356,953 | 303,872 | 254,503 | |||||||||
Core solvency ratio | 266.71 | % | 250.55 | % | 277.61 | % | ||||||
Comprehensive solvency ratio | 276.53 | % | 250.56 | % | 277.65 | % | ||||||
The decreaseincrease in our solvency ratio in 20172019 was primarily due tothe growthto the increase of our insurancegross investment income, improvement of our business structure and the redemptionsissuance of our subordinated debts.the capital replenishment bonds in the principal amount of RMB 35 billion.
In 2018, the second half of 2016, the CIRCCBIRC conducted a regulatory review under the new Solvency Aligned Risk Management Requirements and Assessment framework, or SARMRA, on the solvency andaligned risk positionsmanagement of lifesome insurers, including ourselves, andnon-life insurers in China. We understand we received one of the highest scores among life insurers in China. In 2017, wethat were exempted from this regulatory review by the CIRC.reviewed. The SARMRA score links the risk management practicescapacity of insurers with capital requirements.
We issued Core Tier 2 Capital Securities of US$ 1,280 million in July 2015 by taking advantage of favorable market opportunities, which effectively improved our solvency ratio. The Core Tier 2 Capital Securities were issued In 2019, the CBIRC did not conduct such a review on us, and pursuant to qualified investors who meet applicable regulatory requirements, and have an initial distribution rate of 4.00%.we continued to determine our capital requirements based on the score we received in the 2018 review.
Contractual Obligations and Commitments
The following table sets out our contractual obligations and commitments as of December 31, 2017.2019.
| Not later than 1 year | Later than 1 year but not later than 3 years | Later than 3 years but not later than 5 years | Later than 5 years | Total | Not later than 1 year | Later than 1 year but not later than 3 years | Later than 3 years but not later than 5 years | Later than 5 years | Total | |||||||||||||||||||||||||||||||
As of December 31, 2017 | (RMB in millions) | |||||||||||||||||||||||||||||||||||||||
As of December 31, 2019 | (RMB in millions) | |||||||||||||||||||||||||||||||||||||||
Securities sold under agreements to repurchase | 87,309 | — | — | — | 87,309 | 118,088 | — | — | — | 118,088 | ||||||||||||||||||||||||||||||
Bonds payable | — | — | — | — | — | 332 | 2,996 | 37,996 | — | 41,324 | ||||||||||||||||||||||||||||||
Annuity and other insurance balances payable | 44,820 | — | — | — | 44,820 | 51,019 | — | — | — | 51,019 | ||||||||||||||||||||||||||||||
Insurance contracts | (16,319 | ) | (221,905 | ) | (47,109 | ) | 3,807,542 | 3,522,209 | (179,925 | ) | (209,603 | ) | 35,264 | 5,015,173 | 4,660,909 | |||||||||||||||||||||||||
Investment contracts | 15,308 | 29,981 | 26,892 | 388,320 | 460,501 | 24,020 | 29,900 | (23,462 | ) | 606,662 | 637,120 | |||||||||||||||||||||||||||||
Off balance sheet operating leases | 784 | 855 | 246 | 44 | 1,929 | |||||||||||||||||||||||||||||||||||
Interest bearing loans and borrowings | 4,776 | 1,572 | 16,111 | — | 22,459 | |||||||||||||||||||||||||||||||||||
Lease liabilities | 1,331 | 1,491 | 440 | 74 | 3,336 | |||||||||||||||||||||||||||||||||||
Capital commitments | 64,731 | 20,878 | 5,694 | 481 | 91,784 | 35,635 | 15,598 | 6,775 | 10,799 | 68,807 | ||||||||||||||||||||||||||||||
|
|
|
|
|
|
|
|
|
| |||||||||||||||||||||||||||||||
Total | 196,633 | (170,191 | ) | (14,277 | ) | 4,196,387 | 4,208,552 | 55,276 | (158,046 | ) | 73,124 | 5,632,708 | 5,603,062 | |||||||||||||||||||||||||||
|
|
|
|
|
|
|
|
|
| |||||||||||||||||||||||||||||||
Capital commitments mainly represent our commitments with respect to the acquisition of property, plant and equipment, and our investments.
The amounts set forth in the table above for insurance contracts and investment contracts in each column represent expected future cash inflows and outflows on policies in force as at December 31, 2017.2019. The estimate is affected by numerous assumptions, including assumptions related to mortality, morbidity, surrenders and other expense assumptions. Many of these estimates are inherently uncertain and the actual experience may differ from our estimates.
The expected net cash outflows for our insurance contracts are negative in the period not later than 1 year and later than 1 year but not later than 3 years in the above table. This is primarily because we have increased our sales of products with regular premiums, which has resulted in an increase in the proportion of insurance contracts that are in premium payment period. As premiums for products with regular premiums are paid by installments during the premium payment period, insurance future cash inflows occur at an earlier stage of the policy term, while benefits payments and other insurance future cash outflows occur gradually throughout the entire policy period.The expected net cash outflows for our investment contracts are negative in the period later than 3 years but not later than 5 years in the above table. This is primarily because under the terms of some of our insurance contracts, survival benefits payments under these contracts will be transferred to respective investment contracts during the next three to five years, and accordingly, there is expected to be a large amount of cash inflows for some of our investment contracts during the next three to five years. Furthermore, as the expected future cashflows reported in the table above are not discounted from the date of payment back to December 31, 2017,2019, the sum of the expected future cashflows are different from the amount of corresponding liabilities in our consolidated balance sheet as of December 31, 2017.2019. Policyholder dividends will not become a contractual obligation until the applicable policy anniversary is reached and the dividend amount is credited to the policy benefit liability or paid to the policyholder, and hence are not included in the table above. Reinsurance recoveries have not been taken into account.
Other than as set forth under capital commitments, we had no material, individually or in the aggregate, purchase obligations as of December 31, 2017.2019.
C. RESEARCH AND DEVELOPMENT, PATENTS AND LICENSES
None.
Please refer to our discussion in each section under “—Overview of Our Business”, “—Factors Affecting Our Results of Operations”, “—Critical Accounting Policies” and “—Operating Results”.
We review assumptions used in establishing reserves for long term insurance contracts and the impact of changes in these assumptions on our net profit. Changes in these assumptions mightmay have a significant impact on our operating results. Changes in these assumptions resulted ina decrease of RMB2,402 million in profit before income tax in 2019, an increase of RMB 3,074 million in profit before income tax in 2018 and a decrease of RMB 9,023 million in profit before income tax in 2017, a decrease of RMB 14,736 million in profit before income tax in 2016 and a decrease of RMB 9,497 million in profit before income tax in 2015.2017. The sensitivity analysis of these assumptions is as follows:
holding all other variables constant, if mortality rates and morbidity rates were to increase or decrease from the current best estimate by 10%,pre-tax profit for the year would have been RMB 19,73128,045 million lower or RMB 20,55929,286 million higher, respectively.
holding all other variables constant, if the discount rates were 50 basis points higher or lower than the current best estimate,pre-tax profit for the year would have been RMB 70,73296,131 million higher or RMB 80,152108,946 million lower, respectively.
See alsoNotealso Note 4.1.3 and Note 1415 to our consolidated financial statements included elsewhere in this annual report.
E.OFF-BALANCE SHEET ARRANGEMENTS
As of December 31, 2017,2019, there were nooff-balance sheet arrangements that have or are reasonably likely to have a current or future effect on our financial condition, changes in financial condition, revenues or expenses, results of operations, liquidity, capital expenditures or capital resources that is material to investors.
F. TABULAR DISCLOSURE OF CONTRACTUAL OBLIGATIONS
See “—Liquidity and Capital Resources—Contractual Obligations and Commitments”.
ITEM 6. DIRECTORS, SENIOR MANAGEMENT AND EMPLOYEES
A. DIRECTORS AND SENIOR MANAGEMENT
The following table sets forth information regarding our current directors and executive officers. Unless otherwise indicated, their business address is c/o China Life Insurance Company Limited, 16 Financial Street, Xicheng District, Beijing 100033, China.
Name | Date of Birth | Position | ||
| Chairman of the board of directors and executive director | ||||
| Executive director and president | ||||
| Executive director, | ||||
| Yuan Changqing | September 1961 | Non-executive director | ||
| Liu Huimin | June 1965 | Non-executive director | ||
| Yin Zhaojun | July 1965 | Non-executive director | ||
| Wang Junhui | July 1971 | Non-executive director | ||
| Chang Tso Tung Stephen | November 1948 | Independent director | ||
| Robinson Drake Pike | October 1951 | Independent director | ||
| Tang Xin | September 1971 | Independent director | ||
| LeungOi-Sie Elsie | April 1939 | Independent director | ||
| Ruan Qi | July 1966 | Vice president | ||
| Zhan Zhong | April 1968 | |||
| Huang Xiumei | June, 1967 | Vice president and person in charge of finance (subject to the approval of CBIRC) | ||
| Yang Hong | February 1967 | |||
| Zhao Guodong | November 1967 | Assistant president | ||
| Xu Chongmiao | October 1969 | Compliance officer | ||
Directors
Yang MingshengWang Binhas been our chairman andan executive director since May 2012. He has beenand the chairman of CLICthe board of directors of our company since December 2018, and CLPCIC since March 2012, the chairman of the board of directors and the secretary to the party committee of CLIC, the chairman of the board of directors of AMC, the chairman of the board of directors of China Life Insurance (Overseas) Company Limited since January 2013,and a director and the chairman of AMC since December 2013 and the chairmanboard of directors of China Guangfa Bank Co., Ltd. since September 2016. Mr. YangWang has manysuccessively been employed by government authorities and financial institutions with nearly 30 years of experience in financial industry.management. He served as a vice chairman ofhas worked at the CIRC from 2007 to 2012, and worked for the AgriculturalPeople’s Bank of China, from 1980 to 2007, where he held various positions such as vice presidentparticipating in the preparation and establishment of the Shenyang branch, head of the industrial credit department of the head office and president of the Tianjin branch. He was appointed as vice president of the Agricultural Development Bank of China in 1997 and was then promoted to presidentas an important member. Mr. Wang served as the general manager of theJiangxi Branch of Agricultural Development Bank of China, in 2003. Mr. Yang, a senior economist, graduated fromand the facultypresident of financeTianjin Branch and Beijing Branch of Nankai University with a master’s degree in economics, majoring in monetary banking.
Lin Dairen was appointed as our president by the boardBank of directors in March 2014 and has been our executive director since October 2008. Mr. LinCommunications Co., Ltd. (the “Bank of Communications”). He also acts as thenon-executive director of CLPCIC, China Life Pension and AMC. Mr. Lin served as the vice president of our companythe Bank of Communications from 20032005 to 2012 and concurrently served as an executive director of the Bank of Communications from 2010 to 2012. From March 2014, and2012 to August 2018, he served as the chairman of the board of directors and the secretary to the Party Committee of China Taiping Insurance Group Ltd. Mr. Wang holds a doctoral degree in economics. He is a researcher, a delegate to the 19th National Congress of the Communist Party of China and a member of the 12th and 13th National Committee of the Chinese People’s Political Consultative Conferences.
Su Hengxuan has been an executive director of our company since December 2018 and has been our president since April 2019. He has served as the vice president of CLIC since December 2017. He was the president of China Life Pension from November 2006March 2015 to March 2014.February 2018. Mr. Lin graduatedSu served various positions in 1982 with a bachelor’s degree in medicine from Shandong Province Changwei Medical Institute. Mr. Lin, who is a senior economist, has over 30 years of experience in the operation of life insurance businesses and insurance management, and was awarded special allowance by the State Council. He is currently the chairman of the China Life Foundation, the vice chairman of the Insurance Institute of China and the Insurance Association of China, anon-executive director of China Insurance Security Fund Co., Ltd., the deputy director of the Life Insurance Committee of the Insurance Association of China and the director of the Insurance Institutional Investors Professional Committee of the Insurance Asset Management Association of China.
Xu Hengping has been an executive director since July 2015 and a vice president of our company since November 2014. He has beenfrom 2000 to 2015, including the chief operating officer of our company since August 2010, the general manager of our Fujian branch since April 2007, deputy general manager of our Fujian branch from December 2002, assistant toHenan Branch, the general manager of our Fujian branch from September 1998, and chief of personalthe individual insurance divisiondepartment of our Fujian branch since July 1996. Mr. Xu previously served ascompany, the general manager of the individual insurance sales department of our company and general manageras an assistant to the president and the vice president of Longyan branch of Fuzhou Life Insurance Company Limited.our company. Mr. XuSu graduated from HunanWuhan University majoringand the University of Science and Technology of China and obtained a doctoral degree in finance.management science and engineering from the University of Science and Technology of China in 2011. Mr. Xu,Su, a senior economist, has over 35 years of experience in the operation and management of life insurance businesses and insurance management.businesses.
Xu HaifengLi Mingguang has been an executive director of our company since July 2015 andAugust 2019. He has been a vice president of our company since November 2014.2014 and our chief actuary since March 2012. He has been anon-executive directorthe chief actuary of AMCChina Life Pension since September 2015.May 2012. Mr. XuLi has been our board secretary since June 2017. Mr. Li joined our company in 1996 and subsequently served as deputy division chief, division chief, assistant to thenon-executive director general manager of China LifeE-commerce Company Limited from January 2015 to January 2017. He served as the business controllerproduct development department, responsible actuary of our company and general manager of our Hebei branch concurrently from February 2014 to November 2014.actuarial department. Mr. Xu served as the general manager of our Beijing branch and the general manager of our Hebei branch from 2006 to 2014. Prior to that, Mr. Xu served as the deputy general manager and general manager of our Linyi branch in Shandong Province and the general manager of the business management department in our Shandong branch, the general manager of our Jinan branch and the deputy general manager of our Beijing branch. Mr. XuLi graduated from Linyi Foreign Language NormalShanghai Jiao Tong University with a bachelor’s degree in 1982computer science in 1991, Central University of Finance and from Shandong Provincial Party SchoolEconomics majoring in economic managementmonetary banking (actuarial science) with a master’s degree in 1996 and obtained a master degreeTsinghua University with an EMBA in business administration from Zhongnan2010, and also studied at the University of Economics and Law in 2007. Mr. Xu, a senior economist, has over 30 years of experiencePennsylvania in the operationUnited States in 2011. Mr. Li is a fellow of life insurance businessesthe China Association of Actuaries (FCAA) and insurance management.
Yuan Changqing has been anon-executive director of our company since February 2018. He serves as the vice chairman and president of CLIC and the deputy secretary to the party committee of CLIC. Mr. Yuan served as the chairman of the supervisory committee and the deputy secretary to the party committee of Agricultural Bank of China Limited from April 2015 to May 2017. He served as the deputy general manager and the secretary to the discipline inspection committee of China Everbright Group Corporation Limited from November 2014 to April 2015, the secretary to the discipline inspection committee of China Everbright Group Limited from December 2008 to August 2012, and an executive director, the deputy general manager and the secretary to the discipline inspection committee of China Everbright Group Limited from August 2012 to November 2014, during which he concurrently acted as the chairman of Everbright Securities Company Limited. During the period from 1995 to 2008, he served as the vice president, president and secretary to the party committee of Xinjiang branch, the president and secretary to the party committee of Henan branch, and the director of the organization department of the party committee and the general manager of the human resources department of the head office of Industrial and Commercial Bank of China Limited. During the period from 1981 to 1995, he held various professional and management positions in branch offices of the People’s Bank of China and Industrial and Commercial Bank of China. Mr. Yuan, a senior economist, graduated from the University of Hong Kong, majoring in international business administration with a master’s degree in business administration.
Liu Huimin has been anon-executive director of our company since July 2017. He has been the vice president of CLIC since September 2013. He served as the vice president of AMC from 2004, and the president and director of the same company from 2006, during which he concurrently served as the chairman of China Life Franklin Asset Management Company Limited and the chairman of China Life AMP Asset Management Co., Ltd., etc. Mr. Liu graduated from Peking University with a doctoral degree in international law. Before that, he graduated from the School of Social Sciences of the University of Sussex in the United Kingdom with a master’s degree in development economics and the Peking University with a bachelor’s degree in national economic management.management, respectively.
Yin Zhaojun has been anon-executive director of our company since July 2017. He has been the president of CGB since September 2019 and the vice president of CLIC since October 2016. He joined the Bank of Communications in July 1990, and consecutively served as the assistant to the president of Beijing branch and the vice president of Shanxi branch of the Bank of Communications from 2005, and as the president of Shanxi branch, Hebei branch and Beijing branch of the Bank of Communications from 2011. Mr. Yin graduated from China University of Political Science and Law with a master’s degree in public administration. Before that, he graduated from the Faculty of Accounting of Beijing College of Finance and Commerce with a bachelor’s degree in economics.
Wang Junhui has been anon-executive director of our company since August 2019. He has been the chief investment officer of CLIC and president of China Life Asset Management Company Limited since August 2016, the chairman of China Life Franklin Asset Management Company Limited since September 2016, and the chairman of China Life AMP Asset Management Co., Ltd. since December 2016. From 2004 to 2016, he served as an assistant to the president and the vice president of China Life Asset Management Company Limited, and the president of China Life Investment Holding Company Limited. From 2002 to 2004, he served as the director of the investment department and an assistant to the general manager of Harvest Fund Management Co., Ltd. Mr. Wang graduated from the School of Computer Science of Beijing University of Technology with a bachelor’s degree in software in 1995, and Chinese Academy of Fiscal Sciences of the Ministry of Finance of the PRC with a doctoral degree in finance in 2008. He is a senior economist.
Chang Tso TungStephenhas been an independent director of our company since October 2014. He served as the vice chairman of the Greater China Region of Ernst & Young, the managing partner for professional services and the chairman of auditing and consulting service of Ernst & Young until his retirement in 2004. From 2007 to 2013, Mr. Chang was an independentnon-executive director of China Pacific Insurance (Group) Co., Ltd. Mr. Chang is currently an independentnon-executive director of China Cinda Asset Management Co., Ltd., Kerry Properties Limited and Hua Hong Semiconductor Limited, all of which are listed on the Hong Kong Stock Exchange. Mr. Chang has been practicing as a certified public accountant in Hong Kong for approximately 30 years and has extensive experience in accounting, auditing and financial management. Mr. Chang holds a bachelor’s degree of science from the University of London, and is a fellow member of the Institute of Chartered Accountants in England and Wales.
Robinson Drake Pike has been an independent director of our company since July 2015. Before his retirement from Goldman Sachs in 2014, Mr. Pike served as the managing director of Goldman Sachs and the chief representative of the Beijing Representative Office of Goldman Sachs International Bank UK from August 2011 to May 2014, and the managing director of Goldman Sachs and a senior advisor and project coordinator seconded to the Industrial and Commercial Bank of China by Goldman Sachs from January 2007 to August 2011. From July 2000 to December 2006, he was Lehman Brothers’ senior vice president, deputy head and head of Asia Credit Risk Management. He has over 30 years of experience in Asian financial industry with a focus on risk management and China’s banking industry. He holds a bachelor’s degree of arts in Chinese Language and Literature from Yale University and a master’s degree of public affairs in development economics from Princeton University’s Woodrow Wilson School.
Tang Xin has been an independent director of our company since March 2016. He is a professor of the School of Law of Tsinghua University, the deputy head of the commercial law research center of Tsinghua University, an associate editor of “Tsinghua Law Review”, a member of the listing committee of the Shanghai Stock Exchange, the chairman of the independent director committee of the China Association for Public Companies, and an independent director of each of Harvest Fund Management Co., Ltd., GF Securities Co., Ltd. and Oriza HoldingsBank of Guizhou Co., Ltd. Mr. Tang was elected as a member of the first and second sessions of the merger, acquisition and reorganization review committee of the China Securities Regulatory Commission from 2008 to 2010. He served as an independent director of China Spacesat Co., Ltd. from 2008 to 2014, an independent director of each of SDIC Power Holdings Co., Ltd. and Changjiang Securities Company Limited from 2009 to 2013, and an independent director of Beijing Rural Commercial Bank Co., Ltd. from 2009 to 2015. Mr. Tang graduated from Renmin University of China with bachelor’s, master’s and doctorate degrees in law.
LeungOi-Sie Elsie has been an independent director of our company since July 2016. She was previously the first Secretary for Justice of Hong Kong as well as a member of the Executive Council of Hong Kong. She is currentlyKong, the deputy director of the Hong Kong Basic Law Committee of the Standing Committee of the 2nd, 3rd and 4th National People’s Congress and a consultant of Iu, Lai & Li Solicitors & Notaries. Ms. Leung served as a member of the Social Welfare Advisory Committee and the Equal Opportunities Commission, an executive committee member and a council member of the Hong Kong Federation of Women, the Chairperson and President of the International Federation of Women Lawyers and the Honorary President of the Nanhai Worldwide Friendship Federation. She is a Justice of the Peace, a notary public and a China-appointed attesting officer. She has been awarded the “Grand Bauhinia Medal” and admitted as a solicitor by the Law Societies of Hong Kong and England. Ms. Leung graduated from the University of Hong Kong with a master’s degree in law, and is a fellow of the International Academy of Matrimonial Lawyers. She has been an independentnon-executive director of United Company RUSAL Plc since December 2009, an independentnon-executive director of China Resources Power Holdings Company Limited since April 2010. She has been an independentnon-executive director of PetroChina Company Limited since June 2017.
Supervisors
The following table sets forth information regarding our current supervisors.
Name | Date of Birth | Position | ||
| Chairperson of the board of supervisors | ||||
| Luo Zhaohui | March 1974 | Supervisor | ||
| Supervisor | ||||
| Cao Qingyang | May 1963 | Employee representative supervisor | ||
| Employee representative supervisor | ||||
Miao PingJia Yuzeng has been the chairperson of our board of supervisors since July 2015. He2018. During the period from 2006 to March 2018, he served as an executive director of our company from July 2014 to May 2015 and a vice president of our company from December 2009 to May 2015. He served as the general manager of our Jiangsu branch since September 2006, the general manager of our Jiangxi branch from September 2004 and the deputy general manager of our Jiangsu branch since April 2002. Mr. Miao graduated from the Correspondence College of Yangzhou University in 1996, majoring in economics and management. Mr. Miao, a senior economist, has over 30 years of experience in the operation of life insurance businesses and the management of insurance businesses.
Shi Xiangming has been a supervisor, of our company since May 2009 and the general manager of the supervisory department of our company since September 2008. Mr. Shi served as the deputy general manager of the human resources department, an assistant to the president, the vice president, the board secretary, an executive director and the office directorcompliance officer of our companyChina Life Pension Company Limited. During the period from September 20032004 to September 2008. From March 2002 to August 2003, Mr. Shi2006, he served as the deputy general manager of the supervisorywork department of China Life Insurance Company.the Trade Union, the executive deputy director of the Trade Union and a supervisor of the company. During the period from 1988 to 2004, he successively served as the division head of the General Office and a secretary (at the deputy director level) of the PRC Ministry of Supervision, the deputy director (responsible for daily operation) of the minister office of the general supervision office under the supervision department of the Central Commission for Discipline Inspection, and an inspector (at the director level), supervisor, inspector (at the deputy bureau chief level) and special supervisor of the general office of the Central Commission for Discipline Inspection. Mr. ShiJia graduated from the chemistry schoolOpen University of the first branch college of Beijing University, and receivedHong Kong in 2003, majoring in business administration with a bachelor’smaster’s degree in science.business administration.
Luo Zhaohui has been a supervisor of our company since February 2018. Mr. Luo worked at the risk management department of China Life Insurance Company and the general office of CLIC from August 2002 to August 2013, and was appointed as the senior manager of the comprehensive information division of the general office of CLIC in May 2009 and an assistant to the general manager of the strategic planning department of CLIC in August 2013. Mr. Luo was seconded to our Shijiazhuang branch in Hebei Province as the deputy general manager during the period from November 2013 to October 2015, and was then appointed as the deputy general manager of the strategic planning department of CLIC in July 2016. He has served as the general manager of the strategic planning department of CLIC since November 2019. Mr. Luo has been long been involved in strategic management related work, with considerable working experience in such aspects as risk management, market analysis and research and life insurance operations, as well as strategic planning and management. Mr. Luo, a senior economist, graduated from Peking University, majoring in finance with a doctoral degree.
Wang CuifeiHan Bing has been a supervisor of our company since July 2015, and2019. He has been serving as the general manager of the workhuman resources department of the trade union of our company since JanuaryDecember 2018. Ms. WangHe served as the general manager of the customer servicehuman resources department of our companyChina Life Pension Company Limited from SeptemberMarch 2016 to December 2018. During the period from 2014 to February 20182016, he successively served as the deputy general manager and the secretary to the discipline inspection committee of Ningbo branch, and the deputy general manager and the secretary to the discipline inspection committee of the sales inspection departmentTibet Autonomous Region branch of our companycompany. During the period from March 20092006 to August 2014. Ms. Wang joined our company in July 2001, and has2014, he served successively as theperson-in-charge (at the deputy division level) and the manager of the training management division of the brokerage agency department, the deputy general manager of the bancassurance department and the general manager of the sales inspectionhuman resources department of our company. Ms. WangMr. Han graduated from the Party SchoolBeijing College of the Central Committee of CPCEconomics in 1994, majoring in labor economy with a bachelor’s degree in economic management.economics.
Song PingCao Qingyanghas been a supervisor of our company since March 2018.July 2019. He has been servingthe general manager of the product development department of our company since February 2011. From 2008 to 2011, he successively served as the deputy general manager of Tianjin branch and the group leader of the statistics working group of our company. From 2004 to 2008, he successively served as the general manager of the administration officeinvestor relations department, the deputy secretary-general of the board secretariat and concurrently the general manager of the investor relations department, and the deputy secretary-general of the board secretariat of our company. Mr. Cao Qingyang graduated from Nankai University in 2004, majoring in finance with a doctoral degree in economics.
Wang Xiaoqinghas been a supervisor of our company since January 2017.December 2019. She has been serving as the deputy general manager of the risk management department of our company since April 2018. From 2006May 2016 to 2017, heApril 2018, she served as the secretary to the discipline inspection committee of our Tibet branch. From 2008 to 2016, she successively served as an assistant to the general manager of the development and reformindividual insurance sales department, the deputy general manager of No. 5 business management department in the Beijing branch, an assistant to the general manager of our Beijing branch,and the deputy general manager of the legalcounty insurance management department, and compliance department, the deputy general manager of the human resources department and the general manager of thee-commenceaudit department of our company. From 19992001 to 2006, he2008, she successively served as the deputy division chief of the agent training division and the deputy division chief of the sales inspection division, the division chief of the agentsagent management department,division, and the division chief of the comprehensive development division of the individual insurance department and the group insurancesales department of our company. Mr. SongMs. Wang Xiaoqing graduated from Peking UniversityNanjing Communication Engineering College in July 1987,1988, majoring in Chinese language and literatureradio communication engineering with a bachelor’s degree of arts.in engineering.
Senior Management
Lin Dairen,see “—Directors and Senior Management—Directors” for his profile.
Xu Hengping,see “—Directors and Senior Management—Directors” for his profile.
Xu HaifengSu Hengxuan,see “—Directors and Senior Management—Directors” for his profile.
Li Mingguang has been a vice president of our company since November 2014, our chief actuary since March 2012see “—Directors and our board secretary since June 2017. Mr. Li joined our company in 1996 and subsequently served as deputy division chief, division chief, assistant to the general manager of product development department, responsible actuary of our company and general manager of our actuarial department. Mr. Li graduated from Shanghai Jiao Tong University with a bachelor’s degree in computer science in 1991, Central University of Finance and Economics majoring in monetary banking (actuarial science) with a master’s degree in 1996 and Tsinghua University with an EMBA in 2010, and also studied at the University of Pennsylvania in the United States in 2011. Mr. Li is a fellow of the China Association of Actuaries (FCAA) and a fellow of the Institute and Faculty of Actuaries (FIA). He was the chairman of the first session of the China Actuarial Working Committee and the secretary-general of the first and the second session of the China Association of Actuaries. He is currently the executive director of the China Association of Actuaries, a special executive of the board of directors of the Insurance Institute of China and a member of the China National Master of Insurance Education Supervisory Committee.Senior Management—Directors” for his profile.
Zhao Lijun has been a vice president of our company since July 2016. He was the chief financial officer and general manager of the finance department of CLIC from May 2014 to April 2016. From 2012 to 2014, Mr. Zhao successively served as the deputy general manager (responsible for daily operations) and general manager of the data center of our company. From 2010 to 2012, Mr. Zhao served as the general manager of the legal and compliance department of our company. From 2008 to 2010, Mr. Zhao served as the deputy general manager of the Shandong branch of our company. From 2003 to 2008, Mr. Zhao successively served as an assistant to the general manager and the general manager of the finance department of our company. Prior to that, he served as a cadre in the finance and planning department of People’s Insurance Company of China, the director and deputy manager of the planning & finance department of China Reinsurance Corporation in Hong Kong, the deputy manager and manager of the planning and finance department of China Insurance H.K. (Holdings) Company Limited, the deputy division chief, the division chief and an assistant to the general manager of the planning and finance department of China Life Insurance Company. Mr. Zhao graduated from the Accounting Department of Anhui Finance & Trade College with a bachelor’s degree in industrial accounting and finance in 1987 and from Tsinghua University with an EMBA in 2010. Mr. Zhao is a senior accountant.
Xiao Jianyou has been a vice president of our company since October 2016. He has been an assistant to the president of our company since July 2015 and thenon-executive director of CLPCIC since September 2015. He served as the general manager of our Jiangsu branch from January 2014 and the deputy general manager (responsible for daily operations) of our Jiangsu branch from April 2013 to January 2014. From 2006 to 2013, he successively served as the deputy general manager, an assistant to the general manager and the marketing director of Jiangsu branch and the general manager and the deputy general manager of Taizhou branch in Jiangsu Province. Before that, Mr. Xiao held various other positions at the our Jiangsu branch, including the deputy manager of the marketing department and management department, an assistant to the general manager, the deputy general manager (responsible for daily operations) and the general manager of the personal insurance department. Mr. Xiao, a senior economist, graduated from Jiangxi Traditional Chinese Medicine College in 1991 with a bachelor’s degree, and received double bachelor’s degrees in medicine and law from Jiangxi Traditional Chinese Medicine College and Nanjing University, respectively.
Zhao PengRuan Qihas been a vice president of our company since March 2018. He served as an assistant to the president of our company since October 2017, and the general manager of our Zhejiang branch since January 2015. From 2014 to 2015, he successively served as the deputy general manager (at the general manager level of the provincial branches) and theperson-in-charge of our Zhejiang branch. From 2003 to 2014, he successively held various positions in CLIC, including the division chief of the capital management division of the finance department, an assistant to the general manager and the division chief of the capital management division of the finance department, an assistant to the general manager, the deputy general manager and the general manager of the finance and accounting department, and the general manager of the finance department. From 1995 to 2003, Mr. Zhao successively served as a staff member of the capital division, a staff member of the financial management division, the deputy division chief and the division chief of the capital division of the planning and finance department of China Life Insurance Company. Mr. Zhao graduated from Hunan College of Finance and Economics in July 1995, majoring in actuarial science with a bachelor’s degree in economics; from Central University of Finance and Economics in June 2002, majoring in finance with a master’s degree in economics; and from Tsinghua University in January 2007, majoring in business administration with a master’s degree in Business Administration.
Ruan Qiwas appointed as the vice president of our company (whose qualification is subject to the approval of the CBIRC) at the meeting of the board of directors of our company held in MarchApril 2018. He has been the chief information technology officer of our company since October 2016from January 2018 to April 2018. Mr. Ruan served as the chief information technology officer and the general manager (at the general manager level of the provincial branches) of the information technology department of our company sincefrom October 2016 to January 2018. He also served as the general manager (at the general manager level of the provincial branches) of the information technology department of our company from March 2016 to October 2016. He served as the general manager of China Life Data Center and the general manager (at the general manager level of the provincial branches) of the information technology department of our company from 2014 to 2016, and the deputy general manager and the general manager of the information technology department of our company from 2004 to 2014. He successively served as the deputy division chief of the computer division of our Fujian branch, and the deputy manager (responsible for daily operations) and the manager of the information technology department of our company from 2000 to 2004. Mr. Ruan is a senior engineer. He graduated from Beijing Institute of Posts and Telecommunications in August 1987, majoring in computer science and communications with a bachelor’s degree in engineering; and from Xiamen University with a master’s degree in business administration for senior management (EMBA) in December 2007.
Zhan Zhong has been a vice president of our company since July 2019. He has been the marketing director of our company since August 2017. He has been the general manager (at the general manager level of the provincial branches) of the individual insurance division of our company since July 2014.2014 and was an employee representative supervisor of our company from July 2015 to August 2017. Mr. Zhan served as the deputy general manager (responsible for daily operations) and the general manager of our Qinghai branch from 2013 to 2014. From 2009 to 2013, Mr. Zhan successively served as the deputy general manager (responsible for daily operations) and the general manager of the individual insurance division of our company. From 2005 to 2009, he successively served as the general manager of the individual insurance division of our Guangdong branch and an assistant to the general manager of our Guangdong branch. From 1996 to 2005, he successively served as the director of the marketing department of the Chengdu High-techhigh-techSub-branchsub-branch, of Zhongbao Life Insurance Company,and an assistant to the manager and the manager of the marketing department of the Chengdu branch of Zhongbao Life Insurance Company, and the deputy general manager of the Chengdu branch of Taikang Life Insurance Company. Mr. Zhan graduated from Kunming Institute of Technology in July 1989, majoring in industrial electric automation with a bachelor’s degree in engineering.
Huang Xiumeihas been appointed by our board of directors as our vice president and the person in charge of finance since April 23, 2020 (the qualification of her appointment is still subject to the approval of the CBIRC).Ms. Huang is currently the vice president, the board secretary and person in charge of finance of China Life Pension Company Limited. From 2014 to 2016, she served as the financial controller and the general manager of the financial management department of our company. From 2005 to 2014, Ms. Huang Xiumei held various positions at our Fujian branch, including the assistant to the general manager, the deputy general manager, the branch head, the deputy general manager (responsible for daily operations) and the general manager. From 1999 to 2005, she served as the deputy division chief of the planning and finance division, the manager of the planning and finance department and the manager of the finance department of our Fujian branch, and during the period from 2004 to 2005, she also served as the deputy general manager of our Fuzhou branch. Ms. Huang Xiumei graduated from Fuzhou University, majoring in accounting with a bachelor’s degree. She is a senior accountant.
Yang Hong has been a vice president of our company since July 2019. She has been the operating director of our company since March 2018. She has been the general manager of the operation service center of our company since January 2018. Ms. Yang successively served as the deputy general manager (responsible for daily operations) and general manager of the research and development center, the general manager (at the general manager level of the provincial branches) of the business management department and the general manager (at the general manager level of the provincial branches) of the business process management department of our company from 2011 to 2018. From 2002 to 2011, she successively served as an assistant to the general manager and the deputy general manager of the business management department, and the general manager of the customer service department of our company. Ms. Yang graduated from the Computer Science Department of Jilin University in 1989, majoring in system structure with a bachelor’s degree of science, and from the School of Economics and Management of Tsinghua University in 2013 with a master’s degree in business administration for senior management.
Zhao Guodong has been an assistant to the president of our company since October 2019. He served as the general manager of our Jiangsu branch from July 2018. During the period from 2016 to 2018, he successively served as the deputy general manager (responsible for daily operation) and the general manager of our Chongqing branch, and the general manager of our Hunan branch. From 2007 to 2016, he successively served as the deputy general manager of our Fujian branch and the deputy general manager of our Hunan branch. From 2001 to 2007, he was the deputy general manager of our Changde Branch in Hunan and the general manager of our Yiyang branch. Mr. Zhao graduated from Hunan College of Computer Science majoring in computer software in 1988, and from China Central Radio and TV University majoring in business administration in 2006.
Xu Chongmiao has been the compliance officer of our company since July 2018. He has been the general manager of the legal and compliance department and the legal officer of our company since September 2014. From 2006 to 2014, he successively served as the deputy general manager of the legal affair department, the deputy general manager of the legal and compliance department and the legal officer at the general manager level of our company. From 2000 to 2006, he successively served as the deputy division chief of the regulations division of the development and research department and a senior regulations researcher of the legal affairs department of our company. Mr. Xu graduated from Fudan University in August 1991, majoring in economic law with a bachelor’s degree in law, and from Renmin University of China in July 1996 and July 2005, respectively, majoring in economic law with master’s and doctorate degrees in law. Mr. Xu is admitted as a lawyer and certified public accountant in the PRC.
Compensation of Directors, Supervisors and Officers
Our directors, supervisors and executive officers receive compensation in the form of salaries, bonuses and otherbenefits-in-kind, including our contribution to the pension plan on behalf of our directors, supervisors and executive officers. As required by PRC regulations, we participate in various defined contribution retirement plans organized by provincial and municipal governments for our employees, including employees who are directors, supervisors and executive officers.
The following table sets forth the amounts of compensation paid to each of our directors and supervisors for the fiscal year ended December 31, 2017.The2019.The total compensation package for our executive directors and chairman of the board of supervisors for the year ended December 31, 20172019 has not yet been finalized in accordance with regulations of the relevant PRC authorities. The amount of the compensation not provided for is not expected to have a significant impact on our financial statements for the year ended December 31, 2017.We2019.We will make further disclosure of the amount of the final compensation when it is determined.
| Name | Salaries/Fees | Inducement Fees | Other (1) Benefits | Compensation for loss of office as director | Total | |||||||||||||||
| RMB in ten thousands | ||||||||||||||||||||
Yang Mingsheng | — | — | — | — | — | |||||||||||||||
Lin Dairen | 140.00 | — | 21.88 | — | 161.88 | |||||||||||||||
Miao Jianmin(2) | — | — | — | — | — | |||||||||||||||
Liu Jiade(3) | — | — | — | — | — | |||||||||||||||
Liu Huimin(4) | — | — | — | — | — | |||||||||||||||
Yin Zhaojun(5) | — | — | — | — | — | |||||||||||||||
Wang Sidong(6) | — | — | — | — | — | |||||||||||||||
Chang Tso Tung Stephen | 32.00 | — | — | — | 32.00 | |||||||||||||||
Xu Hengping | 113.40 | — | 21.66 | — | 135.06 | |||||||||||||||
Xu Haifeng | 113.40 | — | 21.66 | — | 135.06 | |||||||||||||||
Robinson Drake Pike | 32.00 | — | — | — | 32.00 | |||||||||||||||
Tang Xin | 32.00 | — | — | — | 32.00 | |||||||||||||||
LeungOi-Sie Elsie | 30.00 | — | — | — | 30.00 | |||||||||||||||
Miao Ping | 114.80 | — | 21.66 | — | 136.46 | |||||||||||||||
Shi Xiangming | 57.16 | 68.21 | 32.24 | — | 157.61 | |||||||||||||||
Xiong Junhong(7) | — | — | — | — | — | |||||||||||||||
Zhan Zhong(8) | 50.83 | 28.84 | 20.82 | — | 100.49 | |||||||||||||||
Wang Cuifei | 52.76 | 81.41 | 31.41 | — | 165.58 | |||||||||||||||
Li Guodong(9) | 21.07 | 16.85 | 11.47 | — | 49.39 | |||||||||||||||
|
|
|
|
|
|
|
|
|
| |||||||||||
Total | 789.42 | 195.31 | 182.80 | — | 1,167.53 | |||||||||||||||
|
|
|
|
|
|
|
|
|
| |||||||||||
Name | Salaries/Fees | Inducement Fees | Other (1) Benefits | Compensation for loss of office as director | Total | |||||||||||||||
| RMB in ten thousands | ||||||||||||||||||||
Wang Bin | 0 | — | 0 | — | 0 | |||||||||||||||
Su Hengxuan(2) | 0 | — | 0 | — | 0 | |||||||||||||||
Li Mingguang(3) | 143.20 | — | 23.00 | — | 166.20 | |||||||||||||||
Zhao Peng(4) | — | — | — | — | — | |||||||||||||||
Yuan Changqing | 0 | — | 0 | — | 0 | |||||||||||||||
Liu Huimin | 0 | — | 0 | — | 0 | |||||||||||||||
Yin Zhaojun | 0 | — | 0 | — | 0 | |||||||||||||||
Wang Junhui(5) | 0 | — | 0 | — | 0 | |||||||||||||||
Xu Hengping(6) | 0.85 | — | 1.79 | — | 2.64 | |||||||||||||||
Xu Haifeng(7) | 60.51 | — | 10.09 | — | 70.60 | |||||||||||||||
Chang Tso Tung Stephen | 32 | — | 0 | — | 32 | |||||||||||||||
Robinson Drake Pike | 32 | — | 0 | — | 32 | |||||||||||||||
Tang Xin | 32 | — | 0 | — | 32 | |||||||||||||||
LeungOi-Sie Elsie | 30 | — | 0 | — | 30 | |||||||||||||||
Jia Yuzeng | 125.30 | — | 22.95 | — | 148.25 | |||||||||||||||
Shi Xiangming(8) | 9.53 | — | 4.67 | — | 14.20 | |||||||||||||||
Luo Zhaohui | 0 | — | 0 | — | 0 | |||||||||||||||
Han Bing(9) | 25.28 | — | 16.94 | — | 42.22 | |||||||||||||||
Cao Qingyang(10) | 28.58 | — | 15.41 | — | 43.99 | |||||||||||||||
Wang Xiaoqing(11) | 3.96 | — | 2.82 | — | 6.78 | |||||||||||||||
Tang Yong(12) | 4.74 | — | 2.78 | — | 7.52 | |||||||||||||||
Song Ping(13) | 48.44 | — | 30.74 | — | 79.18 | |||||||||||||||
Huang Xin(14) | 0 | — | 0 | — | 0 | |||||||||||||||
|
|
|
|
|
|
|
|
|
| |||||||||||
Total | 576.39 | — | 131.19 | — | 707.58 | |||||||||||||||
|
|
|
|
|
|
|
|
|
| |||||||||||
| (1) | Includebenefits-in-kind, social insurance, housing fund and enterprise annuity to be paid by the employer. |
| (2) | Appointed as |
| (3) | Appointed as executive director on August 16, 2019. |
| (4) | Appointed as executive director in February 2020 and resigned as executive director in April 2020. During 2019, Mr. Zhao served as a senior executive officer of our company but did not serve as a director. As a result, for the year of 2019, he did not receive compensation paid to directors. For details of the compensation we paid to him for serving as our senior executive officer, please see the table below on compensation we paid to our senior executive officers. |
| (5) | Appointed asnon-executive director on August |
| (6) | Resigned as |
| (7) | Resigned as executive director on June 28, 2019. |
| (8) | Resigned as supervisor on February 18, 2019. |
| (9) | Appointed as supervisor on July 12, 2019. |
| (10) | Appointed as employee representative supervisor on July 12, 2019. |
| (11) | Appointed as employee representative supervisor on December 27, 2019. |
| (12) | Resigned as supervisor on July 22, 2019. |
| (13) | Resigned as employee representative supervisor on |
Resigned as employee representative supervisor on |
The following table sets forth the amounts of compensation paid to each of our executive officers other than those disclosed in the table above, including vice presidents who are not our directors, and our assistant president chief actuary, chief financialand our compliance officer, and board secretary, for the year ended December 31, 2017.The2019. The total compensation package for our executive officers for the year ended December 31, 20172019 has not yet been finalized in accordance with regulations of the relevant PRC authorities. The amount of the compensation not provided for is not expected to have a significant impact on our financial statements for the year ended December 31, 2017.2019. We will make further disclosure of the amount of the final compensation when it is determined.
| Name | Salaries/Fees | Inducement Fees | Other (1) Benefits | Compensation for loss of office as director | Total | |||||||||||||||
| RMB in ten thousands | ||||||||||||||||||||
Li Mingguang | 113.40 | — | 21.84 | — | 135.24 | |||||||||||||||
Zhao Lijun | 113.40 | — | 21.71 | — | 135.11 | |||||||||||||||
Xiao Jianyou | 112.00 | — | 21.71 | — | 133.71 | |||||||||||||||
Zhao Peng(2) | 26.25 | — | 5.54 | — | 31.79 | |||||||||||||||
Zheng Yong(3) | 35.00 | — | 10.39 | — | 45.39 | |||||||||||||||
Ruan Qi | 98.00 | — | 29.94 | — | 127.94 | |||||||||||||||
Zhan Zhong(4) | 32.67 | — | 10.33 | — | 43.00 | |||||||||||||||
Total | 530.72 | — | 121.46 | — | 652.18 | |||||||||||||||
|
|
|
|
|
|
|
|
|
| |||||||||||
Name | Salaries/Fees | Inducement Fees | Other (1) Benefits | Compensation for loss of office as director | Total | |||||||||||||||
| RMB in ten thousands | ||||||||||||||||||||
Ruan Qi | 125.30 | — | 22.95 | — | 148.25 | |||||||||||||||
Zhan Zhong | 119.33 | — | 26.48 | — | 145.81 | |||||||||||||||
Yang Hong | 119.33 | — | 26.52 | — | 145.85 | |||||||||||||||
Zhao Guodong(2) | 16.25 | — | 5.71 | — | 21.96 | |||||||||||||||
Xu Chongmiao | 52.80 | — | 31.89 | — | 84.69 | |||||||||||||||
Zhao Peng(3) | 93.98 | — | 17.38 | — | 111.36 | |||||||||||||||
Zhao Lijun(4) | 95.47 | — | 15.19 | — | 110.66 | |||||||||||||||
Xiao Jianyou(5) | 52.21 | — | 9.84 | — | 62.05 | |||||||||||||||
|
|
|
|
|
|
|
|
|
| |||||||||||
Total | 674.67 | — | 155.96 | — | 830.63 | |||||||||||||||
|
|
|
|
|
|
|
|
|
| |||||||||||
| (1) | Includebenefits-in-kind, social insurance, housing fund and enterprise annuity to be paid by the employer. |
| (2) | Appointed as assistant |
| (3) | Resigned as |
| (4) | Resigned as |
| (5) | Resigned as vice president in May 2019. |
The aggregate amount of compensation we paid to our five highest paid individual employees, including one director who is also our executive officer, one supervisor and four supervisorsthree members of senior management, during the year ended December 31, 2017,2019,was approximately RMB 7.56767.54 million (US$ 1.16million)1.08 million). The amount of compensation we paid to our highest paid individual employee, during the year ended December 31, 2017,2019, was approximately RMB 1.65581.66 million.
Senior Management Compensation
Our senior management’s compensation consists of four components, including basic salaries, performance-based salaries, fringe benefits and mid to long-term incentive compensation.
We have set upestablished a comprehensive performance management system. A performance appraisal method for our officers is used to appraise the performance of the officers annually. Measures for such appraisal include a business performance index based on our budget and targets as approved by our board of directors; as well as a management performance index based on the duties and functions of the office position,position; and a risk compliance index based on risk management and compliance management of our daily operation, establishing a connection between the achievement of our major business targets and the office performance appraisal.
In accordance with relevant policies of the PRC government, no stock appreciation rights of our company were granted or exercised in 2017.For2019.For other details of the stock appreciation rights which were previously granted by us, please refer toNote 30toto Note 31to our consolidated financial statements included elsewhere in this annual report.
General
Our board of directors consists of eleven members. Our directors are elected to serve a term of three years, which is renewable uponre-election. Our directors are elected at meetings of our shareholders, and, unless they resign at an earlier date, are deceased or removed, will serve three-year terms. The current term for our board of directors began in May 2015.June 2018. Our directors are not currently entitled to severance benefits other than benefits provided by law upon termination of employment. In the event our Company is acquired, including an acquisition of control by another person, and a director leaves employment or retires following the acquisition, the director may receive severance and other payments upon approval by the shareholders in general meeting.
We have identified various board members as being “independent”, in accordance with Hong Kong laws and regulations. These requirements vary in certain respects from independence requirements under U.S. law. The members of our audit committee are independent as defined by the rules of the Securities and Exchange Act and the New York Stock Exchange which are applicable to us.
The PRC company law requires a joint stock company with limited liability to establish a board of supervisors. Our board of supervisors is responsible for monitoring our financial matters and supervising the actions of our board of directors and our management personnel. Our board of supervisors consists of five members. At leastone-third of our board of supervisors must be elected by our employees. The remaining members must be elected by our shareholders in a general meeting. One member of our board of supervisors is designated as the chairman. Members of our board of supervisors may not serve as director or member of senior management. The term of office for our supervisors is three years, which is renewable uponre-election.The current term for our board of supervisors began in May 2015.June 2018.
Board Committees
We have established the following standing committees: an audit committee, a nomination and remuneration committee, a risk management and consumer rights protection committee, a strategy and investment decision committees.assets and liabilities management committee, and a connected transactions control committee.
The primary duties of the audit committee are to review and supervise the financial reporting process, to assess the effectiveness of our internal control system, to supervise our internal audit system and its implementation and to implement and recommend the engagement or replacement of external auditors. Our audit committee is also responsible for communications between our internal and external auditors and our internal reporting system. Our audit committee is currently comprised of Robinson Drake Pike, Chang Tso Tung Stephen and Tang Xin. Mr. Robinson Drake Pike serves as the chairman.
The primary duties of the nomination and remuneration committee are to review the structure and components of our board of directors, to formulate the appointment and successors to our board of directors and senior management, to review and recommend the nomination of our directors and senior officers, as well as to propose to our board of directors the remuneration policy for our directors, supervisors and senior management. Our nomination and remuneration committee is currently comprised of Chang Tso Tung Stephen,Tang Xin, Robinson Drake Pike and Yuan Changqing. Mr. Chang Tso Tung StephenTang Xin serves as the chairman.
The primary duties of the risk management and consumer rights protection committee are to formulate our risk control benchmark system, to discuss with and assist the management in establishing and improving our risk management and internal control system, to supervise the management and the department in charge of consumer rights protection, to review our risk preference and tolerance policy, to formulate our risk management policy, to review the assessment reports with respect to our risk management and internal control, to conduct research on important findings from internal investigations with respect to risk management and internal control and management’s responses to such findings and to coordinate and handle disagreements on risk management and sudden and significant risks or crises. Our risk management and consumer rights protection committee is currently comprised of LeungOi-Sie Elsie, Xu Hengping,Li Mingguang, Liu Huimin and Yin Zhaojun and Liu Huimin.Zhaojun.Ms. Leung-Oi-Sie Elsie serves as the chairman.
The primary duties of the strategy and investment decisionassets and liabilities management committee are to formulate our long-term development strategies, and significant investment and financing plans, to propose significant projects of capital operation and assets management, and to conduct research and to make recommendations on other importantsignificant matters that affect our development.and policies and systems in respect of the management of assets and liabilities, the management system for insurance fund usage and significant strategic investments. Our strategy and investment decisionassets and liabilities management committee is currently comprised of Chang Tso Tung Stephen, Su Hengxuan, Wang Junhui and LeungOi-Sie Elsie.Mr. Chang Tso Tung Stephen serves as the chairman.
The primary duties of the connected transactions control committee are to determine our connected persons, to administer, examine and approve connected transactions, to conduct risk control of connected transactions, with a particular focus on compliance and the fairness and necessity of connected transactions, so as to provide a basis for the decision-making by the board of directors in respect of the management of connected transactions. Our connected transactions control committee is currently comprised of four independent directors including Tang Xin, Lin Dairen, Xu HaifengRobinson Drake Pike, Chang Tso Tung Stephen and LeungOi-Sie Elsie.Mr. Tang Xin serves as the chairman.
As of December 31, 2015, 20162017, 2018 and 20172019, we had approximately 98,823, 99,739102,297, 102,817 and 102,297employees,103,826employees, respectively. The following table sets forth the number of our employees by their functions as of December 31, 2015, 20162017, 2018 and 2017.2019.
| As of December 31 | As of December 31 | |||||||||||||||||||||||||||||||||||||||||||||||
| 2015 | 2016 | 2017 | 2017 | 2018 | 2019 | |||||||||||||||||||||||||||||||||||||||||||
Number of | % of total | Number of employees | % of total | Number of employees | % of total | Number of employees | % of total | Number of employees | % of total | Number of employees | % of total | |||||||||||||||||||||||||||||||||||||
Management and administrative staff | 23,941 | 24.23 | % | 21,868 | 21.93 | % | 22,307 | 21.81 | % | 22,307 | 21.81 | % | 23,166 | 22.53 | % | 18,495 | 17.81 | % | ||||||||||||||||||||||||||||||
Financial and auditing staff | 5,373 | 5.44 | % | 5,225 | 5.24 | % | 5,122 | 5.01 | % | 5,122 | 5.01 | % | 5,140 | 5.00 | % | 4,911 | 4.73 | % | ||||||||||||||||||||||||||||||
Sales and sales management staff | 33,036 | 33.43 | % | 36,091 | 36.19 | % | 38,859 | 37.99 | % | 38,859 | 37.99 | % | 40,194 | 39.09 | % | 46,678 | 44.96 | % | ||||||||||||||||||||||||||||||
Underwriters, claim specialists and customer service staff | 29,330 | 29.68 | % | 28,420 | 28.49 | % | 27,960 | 27.33 | % | |||||||||||||||||||||||||||||||||||||||
Insurance verification, claims processing and customer service staff | 27,960 | 27.33 | % | 26,695 | 25.96 | % | 25,622 | 24.68 | % | |||||||||||||||||||||||||||||||||||||||
Other professional and technical staff(1) | 2,674 | 2.71 | % | 3,488 | 3.50 | % | 4,106 | 4.01 | % | 4,106 | 4.01 | % | 4,274 | 4.16 | % | 4,749 | 4.57 | % | ||||||||||||||||||||||||||||||
Other | 4,469 | 4.52 | % | 4,647 | 4.66 | % | 3,943 | 3.85 | % | 3,943 | 3.85 | % | 3,348 | 3.26 | % | 3,371 | 3.25 | % | ||||||||||||||||||||||||||||||
|
|
|
|
|
|
|
|
|
|
|
| |||||||||||||||||||||||||||||||||||||
Total(2) | 98,823 | 100 | % | 99,739 | 100 | % | 102,297 | 100 | % | 102,297 | 100 | % | 102,817 | 100.00 | % | 103,826 | 100 | % | ||||||||||||||||||||||||||||||
|
|
|
|
|
|
|
|
|
|
|
| |||||||||||||||||||||||||||||||||||||
| (1) | Includes actuaries, product development personnel, investment management personnel and information technology specialists. |
| (2) | Includes employees of our subsidiaries. |
As of December 31, 2015, 20162017, 2018 and 2017,2019, we had approximately979,000,approximately1,578,000and 1,439,000 and 1,495,000 and 1,578,000exclusive1,613,000exclusive agents, respectively. During 2017,2019, we attracted more new qualified agents by expanding our recruitment program, making further efforts in training new qualified agentscontinued to improve both the quantity and strengthening sales support. In addition, in August 2015, the CIRC cancelled the qualification certificates requirements for the individual insurance agents, which helped to facilitate our recruitment process. However, we still adhered to our own standards for recruitment to ensure the quality and productivity of our exclusive agent force.Seeforce by taking advantage of the online recruitment channel. Our agent force has been an important driver of our business growth.See “Item 4. Information on the Company—Business Overview—Regulatory and Related Matters—Regulation of Insurance Agencies, Insurance Brokers and Other Intermediaries” and “Item 3. Key Information—Risk Factors—Risks Relating to Our Business—Our growth is dependent on our ability to attract and retain productive agents”.agents.”
None of our employees is subject to collective bargaining agreements governing employment with us. We believe that our employee relations are satisfactory.
As of the date of this annual report, none of our directors, supervisors or senior managers is a legal or beneficial owner of any shares of our share capital.
ITEM 7. MAJOR SHAREHOLDERS AND RELATED PARTY TRANSACTIONS.
The table below sets forth information regarding the ownership of our share capital as of April 6, 201810, 2020 by all persons who are known to us to be the beneficial owners of 5% or more of each class of our share capital.
Title of Class | Identity of Person or Group | Amount Owned | Percentage of Class | Percentage of Total Share Capital | Identity of Person or Group | Amount Owned | Percentage of Class | Percentage of Total Share Capital | ||||||||||||||||
A Shares | China Life Insurance (Group) Company | 19,323,530,000 (Long position) | 92.80 | % | 68.37 | % | China Life Insurance (Group) Company | 19,323,530,000 (Long position) | 92.80 | % | 68.37 | % | ||||||||||||
H Shares | BlackRock, Inc(1) | 586,490,460 (Long position) 4,751,000 (Short position) | | 7.88 0.06 | % % | | 2.07 0.02 | % % | BlackRock, Inc.(1) | 659,561,395 (Long position) 644,000 (Short position) | | 8.86 0.01 | % % | | 2.33 0.00 | % % | ||||||||
H Shares | JPMorgan Chase & Co.(2) | 448,626,351 (Long position) 257,389,776 (Short position) 226,631,193 (Lending pool) | | 6.02 3.45 3.04 | % % % | | 1.59 0.91 0.80 | % % % | ||||||||||||||||
| Note (1): | BlackRock, Inc. was interested in a total of
BlackRock, Inc. held by way of attribution a short position as defined under Part XV of the SFO in
| |
|
|
Our A shares and H shares generally vote together as a single class, including in the election of directors. Each A share and each H share is entitled to one vote. In addition, in certain matters which affect the rights of the holders of H shares or A shares, the H shares or A shares, as the case may be, are entitled to vote as a separate class.
CLIC converted and sold 676,470,000 domestic shares in the form of H shares or ADSs in connection with our global offering in December 2003.
Based on the information provided by Deutsche Bank Trust Company Americas, our depositary bank, as of December 31, 20172019 and April 6, 2018,10, 2020, there were, respectively, 28,125,962ADRs25,347,810ADRs representing 140,629,810H126,739,050 H shares, with58with53 registered holders, and 27,632,340ADRs24,529,235 ADRs representing 138,161,700H122,646,175 H shares, with 58registered52 registered holders. Since certain of the ADSs are held by nominees, the above number may not be representative of the actual number of U.S. beneficial holders of ADSs or number of ADSs beneficially held by U.S. persons.
CLIC, our controlling shareholder, is a wholly state-owned enterprise controlled by the PRC government. See “Item 4. Information on the Company—History and Development of the Company”. None of our major shareholders has voting rights that differ from the voting rights of other shareholders, except that in certain matters which affect the rights of the holders of H shares or A shares, holders of H shares or A shares, as the case may be, are entitled to vote as a separate class. We are not aware of any arrangement which may at a subsequent date result in a change of control of our company.
As at the date of this annual report, CLIC owns approximately 68.37% of our issued share capital, a 40% equity interest in AMC, a 60% equity interest in CLPCIC, a 100% equity interest in China Life Overseas, a 100% equity interest in China Life Investment Holding Company Limited, or IHC, and a 100% equity interest in China LifeE-commerce Company Limited, or China LifeE-commerce. CLIC, AMC, CLPCIC, China Life Overseas, IHC and China LifeE-commerce are therefore considered as our connected persons under the HKSE Listing Rules. AMC owns a direct 48% equity interest and an indirect 52% equity interest in China Life Wealth Management Company Limited, or China Life Wealth, and approximately 85.03% equity interest in China Life AMP Asset Management Co., Ltd., or AMP. China Life Wealth and AMP are therefore also considered as our connected persons under the HKSE Listing Rules. Each of AMC, China Life Wealth and AMP is also a subsidiary of the Company. Chongqing International Trust Inc., or Chongqing Trust, is an associate of CLIC and CLPCIC by virtue of its acting as the trustee of a trust scheme of which CLPCIC is a beneficiary, and is therefore also a connected person of the Company under the HKSE Listing Rules. China Life Capital Investment Company Limited, or China Life Capital, an indirect wholly owned subsidiary of CLIC, is an associate of CLIC and also a connected person of the Company under the HKSE Listing Rules.
During the reporting period, we engaged inentered into the following new related party transactions with these companies:
On June 21, 2017,May 29, 2019, we and Chongqing Trust entered into a supplemental agreement to the insurance sales framework agreement in relation to the subscription and redemption of trust products and other daily transactions;with CLPCIC;
On December 26, 2017,2019, we and CLIC entered into a new policy management agreement;framework agreement for daily connected transaction with CGB;
On December 28, 2017,27, 2019, we entered into a new framework agreement with Chongqing Trust in relation to daily connected transactions; and
On December 27, 2017,31, 2019, September 6, 2019, December 29, 2017, March 26, 2018, December 29, 20173, 2019 and December 20, 2017,February 17, 2020, we, CLIC, CLPCIC China Life Pension, China LifeE-commerce and IHC each entered into a framework agreement with China Life Wealth in relation to certain daily transactions;
connected transactions with AMP.
We also continued to carry out certain other continuing related party transactions with CLIC, AMC, IHC, China Life Pension, CLPCIC, China Life Capital, China Life Wealth, AMP and AMPChongqing Trust in the reporting period. These transactions constitute connected transactions for us under the HKSE Listing Rules. Details of these transactions are set forth below.
As at the date of this annual report, we own a 43.686% equity interest in CGB and have becomeare the largest shareholder of CGB. Our chairman and executive director, Yang Mingsheng,Wang Bin, serves as the chairman of CGB. CGB is therefore considered as our related party under applicable PRC laws and regulations. On January 12, 2017,December 26, 2019, we entered into a new framework agreement with CGB for daily related party transactions. We also continued to carry out continuing related party transactions with CGB in the reporting period. These transactions are not regarded as connected transactions for us under the HKSE Listing Rules. Details of these transactions are set forth below.
As at the date of this annual report, we directly own a 70.74% equity interest in China Life Pension. China Life Pension is not considered as our related party under the HKSE Listing Rules or applicable PRC laws and regulations. As our subsidiary, China Life Pension also continued to carry out continuing related party transactions with CLIC, AMC, AMP and China Life Wealth in the reporting period. These transactions are regarded as connected transactions for us under the HKSE Listing Rules. Details of these transactions are set forth below.
Continuing Related Party Transactions with CLIC
During the reporting period, we engaged in continuing related party transactions with CLIC. These transactions are governed by several agreements between CLIC and us, including a restructuring agreement, a policy management agreement, a trademark license agreement and anon-competition agreement. A detailed discussion of these agreements is set forth in Note 3234 to our consolidated financial statements included elsewhere in this annual report and under the heading “Item 7. Major Shareholders and Related Party Transactions—Related Party Transactions” in our annual report on Form20-F filed with the Securities and Exchange Commission on April 28, 2009.
On December 29, 2014, we and CLIC entered into aOur policy management agreement for a term of three years. Pursuant to this policy management agreement, we accepted CLIC’s entrustment to provide policy administration services relating tonon-transferred policies, andwith CLIC will pay a service fee to us in cash on a semi-annual basis, which, for each semi-annual payment period, equals the sum of (1) the number ofnon-transferred policies in force as of the last day of the period, multiplied by RMB 8.00; and (2) 2.5% of the actual premiums in respect of thenon-transferred policies collected during the period. The service fee paid by CLIC to us under policy management agreement for the year ended on December 31, 2017 was RMB 739.56 million (US$ 113.7 million). This agreement expired on December 31, 2017.
On December 26, 2017, we and CLIC entered into a new policy management agreement for a term of three years ending on December 31, 2020. During its term, this new agreement may be terminated by either party giving to the other party not less than 90 days’ prior written notice. Pursuant to this new policy management agreement, we will continuecontinued to accept CLIC’s entrustment to provide policy administration services relating tonon-transferred policies, and CLIC will pay a service fee to us in cash on a semi-annual basis. The terms on the determination of services fees remain the same as in the previous policy management agreement discussed above. The annual cap in respect of the service fees to be paid by CLIC to us under the new policy management agreement for each of the three years ending on December 31, 2020 is RMB 708 million. The service fees paid by CLIC to us under the new policy management agreement for the year ended on December 31, 2019 were RMB 574.58 million (US$ 82.5 million).
Continuing Related Party Transactions with AMC
Asset Management Agreement between AMC and Us
On December 29, 2015,28, 2018, we and AMC entered into an asset management agreement with AMC for a three-year term of three years effective from January 1, 2019 and expiring on December 31, 2018.2021. Under the asset management agreement, AMC agreed to invest and manage assets entrusted to it by us, on a discretionary basis, within the scope granted by us and in accordance with our investment guidelines. We retain the title of the entrusted assets and AMC is authorized to operate the accounts associated with the entrusted assets for and on behalf of us. We may add to or withdraw from the assets managed by AMC pursuant to the agreement. We have the right to establish, amend and change the investment guidelines and also have the right to monitor the investment management activities of AMC.
In consideration of AMC’s service in respect of investing and managing assets entrusted to it by us under the agreement, we agreed to pay service fees to AMC, in cash, comprisedwhich consist of a fixed service fee and a variable service fee. The fixed service fee is payable monthlyon a quarterly basis and is calculated according to the net asset value of the assets under management and a fixed management fee rate of 0.05% per annum. The variable service fee is payable annuallyon an annual basis and is determined after an appraisal has been conducted by us with respect to the assets under management and the relevant services provided by AMC each year. The variable service fee is calculated on the basis of 20% of the fixed service fee per annum, by multiplying a payment ratio determined by us based on the results of its annual appraisal of AMC. The servicesmanagement fee rate for directive operation investments or special projects will be separately negotiated by the parties and specified in the investment guidelines. The service fees under the agreement were determined by us and AMC based on an analysis of the cost of service, market practice, the rate charged by AMC to us in previous years, the rates charged by independent third parties for the provision of similar services, and the size and composition of the asset pool to be managed.assets managed by AMC. The annual cap in respect of the service fees to be paid by us to AMC under the asset management agreement for each of the three years ending on December 31, 20182021 is RMB 1,5002,000 million.
The service fees paid by us to AMC under the asset management agreement for the year ended December 31, 20172019 were RMB 1,153.581,352.57 million (US$ 177.3 million)194.3million).
Asset Management Agreement between AMC and CLIC
On December 30, 2015,29, 2018, AMC and CLIC entered into an asset management agreement for a three-year term expiring on December 31, 2018, subject to a right of the parties to negotiate a renewal of this new agreement within 90 business days prior to its expiry.2021. Under the asset management agreement, AMC agreed to invest and manage assets entrusted to it by CLIC, on a discretionary basis, subject to the investment guidelines and instructions given by CLIC. CLIC retains the title of the entrusted assets and AMC is authorized to operate the accounts associated with the entrusted assets for and on behalf of CLIC. CLIC may add to or withdraw from the assets managed by AMC pursuant to the agreement. CLIC has the right to establish, amend and change the investment guidelines and also has the right to monitor the investment management activities of AMC.
In consideration of AMC’s service in respect of investing and managing assets entrusted to it by CLIC under the agreement, CLIC agreed to pay AMC a base service fee for asset management in cash at the rate of 0.05% per annum. Such service fee is calculated and payable on a monthly basis, by multiplying the average of book balance of the assets under management (after deducting the funds obtained and interests accrued from repurchase transactions, the principalprincipals and interest of debt investment plans, equity investment plans, project asset-backed plans and customizednon-standard products) at the beginning and at the end of any given month by the rate of 0.05%, divided by 12. After the end of each fiscal year, CLIC will evaluate the investment performance with respect to the assets entrusted to AMC in the previous year, and adjust the base service fee for asset management by reference to the actual and targeted investment returns. The service fees for debt investment plans, equity investment plans, project asset-backed plans and customizednon-standard products will be determined separately by the parties. The services fees under the agreement werewill be determined by CLIC and AMC based on an analysis of the cost of service, market practice, the rate charged by AMC to CLIC in previous years, the rates charged by independent third parties for the provision of similar services, and the size and composition of the asset pool to be managed.assets managed by AMC. The annual cap in respect of the service fees to be paid by CLIC to AMC under the asset management agreement for the three years ending on December 31, 20182021 is RMB 320 million, RMB 310 million and RMB 300 million, respectively.
The service fees paid by CLIC to AMC under the asset management agreement for the year ended on December 31, 20172019 were RMB 106.7989.27 million (US$ 16.412.8 million).
Continuing Related Party Transactions with IHC
Property Leasing Agreement with IHC
During the reporting period, we engaged in continuing related party transactions with IHC under a property leasing agreement between IHC and us. The property leasing agreement expired on December 31, 2017. A detailed discussion of the terms of this agreement is set forth in Note 32 to our consolidated financial statements included elsewhere in this annual report and under the heading “Item 7. Major Shareholders and Related Party Transactions—Related Party Transactions” in our annual report on Form20-F filed with the Securities and Exchange Commission on April 24, 2015. On December 29, 2017, we entered into a new property leasing agreement with IHC under substantially the same terms for a term from January 1, 2018 to December 31, 2020. Under the new property leasing agreement, IHC agreed to lease to us 1,893 properties1,893properties owned by it. The annual rent is determined by reference to market rent or, where there is no available comparison, by reference to the costs incurred by IHC in holding and maintaining the properties, plus a margin of approximately 5%.
The rent paid by us to IHC under the property leasing agreement for the year ended December 31, 20172019 was approximately RMB 7882.12 million (US$ 11.98811.8 million).
Asset Management Agreement with IHC
On February 3, 2016,December 31, 2018, we entered into an asset management agreement with IHC, for a term starting from January 1, 2016 and ending on June 30, 2017. On June 30, 2017, we entered into a new asset management agreement with IHC. The new agreementwhich took effect from January 1, 2017 retrospectively and2019 with a term of two years. Unless a party serves the other party a written notice fornon-renewal prior to 90 working days before the expiry date of the agreement, the agreement will remain effective until December 31, 2018.be automatically renewed for one year from the expiry date thereof. Pursuant to the asset management agreement, IHC continued towill invest, operate and manage the assets entrusted to it by us for investment in real property, equity interests of companies, related financial products and securitizationquasi-securitization financial products on a discretionary basis, subject to the investment guidelines and instructions given by us.
In consideration of the services provided by IHC under the asset management agreement, we agreed to pay IHC fees based on fixed return projects andnon-fixed return projects, respectively. With respect to the fixed return projects, we agreed to pay IHC a basic service fee which is determined based on the investment rate of return of the projects. With respect to thenon-fixed return projects, we agreed to pay IHC a basic service fee and also pay a performance-based fee at the time of exit from the projects with reference to the comprehensiveinternal rate of return of the projects. In addition, we will make adjustments to the basic service fee for fixed return projects andnon-fixed return projects based on the result of our annual business evaluation on IHC (such adjusted amount is referred to as floating management fee). In consideration of the management services for real estate operation provided by IHC or its subsidiaries, we agreed to pay IHC a real estate operation management service fee.
The basic service fee is paid on a quarterly basis, calculated separately for the projects invested prior to the execution of the agreement and those newly invested during the term of the agreement. With respect to the projects invested prior to the execution of the agreement, the basic service fee is calculated by multiplying the total amount of assets invested by the applicable management fee rate (which is set forth in the relevant entrusted investment and management agreements for alternative investments with insurance funds then in force when such projects were entrusted). With respect to the projects newly invested during the term of the agreement, the basic service fee is calculated by multiplying the total annual amount of assets newly invested by the applicable management fee rate stipulated in the new agreement and our investment guidelines (the management fee rate ranges from 0.05% to 0.6% for the fixed return projects; and the management fee rate is 0.3% for thenon-fixed return projects).guidelines. The floating management fee and the performance-based fee are calculated and confirmed by both parties annually, and then paid by us to IHC upon confirmation. The real estate operation management service fee is paid on a quarterly basis, calculated separately for the well-developed real estate projects and the new real estate projects. With respect to the well-developed real estate projects, the real estate operation management service fee is calculated by multiplying the earnings before interest, taxes, depreciation of fixed assets and amortization of intangible assets, long-term deferred assets and prepaid interest (“EBITDA”) derived from the relevant real estate project in a given year, by the fee rate of 3%. With respect to the new real estate projects, the real estate operation management service fee is calculated as follows: (i) the real estate operation management service fee for the first three years will be calculated by multiplying the estimated EBITDA derived from the relevant real estate project in the fourth year by the fee rate of 3%; and (ii) commencing from the fourth year, the real estate operation management service fee will be calculated in the same manner as the well-developed real estate projects as mentioned above. In addition, the assets entrusted by us to IHC will also be partially used for the subscription of the related financial products established and issued by IHC or of which IHC has participated in the establishment and issuance, and such related financial products will be limited to infrastructure investment schemesplans and project asset-backed schemes.plans. For each of the twothree years ending December 31, 2018,2021, the annual cap on the amount of the basic service fee, floating management fee, performance-based fee and performance-basedthe real estate operation management service fee payable by us to IHC is RMB 6301,391 million, RMB 1,982 million and RMB 9902,266 million, respectively. The contractual amount of assets entrusted by us to IHC for investment and management may not exceed RMB 550 billion or its equivalent in foreign currency as at the expiry of this agreement. For each of the twothree years ending December 31, 2018,2021, the annual cap on the contractual amount of assets newly entrusted by us to IHC for investment and management is RMB 200 billion200,000 million, RMB 200,000 million and RMB 200 billion,200,000 million, respectively. The basic service fee, floating management fee and performance-based fee paid by us to IHC under this new asset management agreement forFor the year endedending December 31, 2017 was RMB 395.82 million (US$ 60.8 million). As at December 31, 2017,2019, the contractual amount of the assets newly entrusted by us to IHC for investment and management was RMB 246,193.0013,110.00 million (US$ 37,839.21,883.1 million), among which, for and the year of 2017, the contractual amount of the assets newly entrusted by us was RMB 112,267.00 million (US$ 17,255.1 million).
Each of CLIC and CLPCIC has also entrusted IHC to invest and manage its assets, which may result in CLIC, CLPCIC and us investing in the same project. Pursuant to the asset management agreement, the targeted assets forco-investments to be made by IHC and on behalf of us, CLIC and CLPCIC are limited to newly launched related financial products and securitization financial products, excluding any products acquired from the secondary market. The contractual amount of theco-investmentfees paid by us to be entrusted during the term of this agreement will not exceedIHC were RMB 100 billion or its equivalent in foreign currency.652.75 million (US$ 93.8 million).
Continuing Related Party Transaction with China Life Pension
On July 27, 2009,March 22, 2014, we, CLIC and AMC entered into an agreement for the entrustment and management of enterprise annuity funds and account management with China Life Pension. TheThis agreement expired on December 1, 2012. On February 26, 2013, we, CLIC and AMC entered into a memorandum of understanding, which became effective retroactively on December 2, 2012, with China Life Pension to renew the agreementwill be automatically renewed for a successiveone-year three-year term, ended on December 1, 2013. On March 22, 2014, we, CLIC and AMC entered into a newprovided that no objection has been raised by any party within one month prior to the expiration of the agreement. The agreement for the entrustment of enterprise annuity funds and account management with China Life Pension, which became effective retroactively to December 2, 2013. The agreement2013 and expired on December 31, 2016 and2016. After that, the agreement has been renewed for atwo successive three-year term.terms in 2016 and 2019, respectively. Under the agreement, China Life Pension was entrusted to serve as the trustee and account manager and to provide entrusted management services and account management services for the enterprise annuity funds of the Company, CLIC and AMC. China Life Pension was further entrusted to serve as the investment manager and to provide investment management service for the enterprise annuity funds of the Company, CLIC and AMC. In consideration of the services provided by China Life Pension, we, CLIC and AMC agreed to pay China Life Pension entrusted management fee, account management fees and investment management fee.
Continuing Related Party Transactions with CLPCIC
On March 8, 2015, we entered into an insurance sales framework agreement with CLPCIC. This agreement expired on March 7, 2018. The service fees paid to us for the year ended December 31, 2017 was RMB 3,030.41 million (US$ 465.8 million).
On January 31, 2018, we entered into a newan insurance sales framework agreement with CLPCIC for a term of three years from March 8, 2018 to March 7, 2021. Under the new insurance sales framework agreement, CLPCIC continued to entrustentrusted us to act as its agent to sell selected insurance products within authorized regions, and agreed to pay us an agency service fee in cash on a monthly basis, which includes sales management fee and sales service fee. The sales management fee will be calculated by the parties on the basis of the principles of equality and fairness. The sales service fee will be determined according to the standard of service fees for specific insurance products as agreed by the branches of the parties based on market principles. The annual caps in respect of the agency service fees to be paid by CLPCIC to us under the new insurance sales framework agreement for the three years ending December 31, 2020 are RMB 4,260 million, RMB 5,540 million and RMB 7,050 million, respectively. On May 29, 2019, we and CLPCIC entered into a supplemental agreement to the insurance sales framework agreement to make certain changes to the definition of management fees paid by CLPCIC to us.
The service fees paid to us for the year ended December 31, 2019 were RMB 2,297.42 million (US$ 330.0 million).
Continuing Related Party Transactions with China Life Capital
On June 7, 2018, we and China Life Capital entered into a cooperation framework agreement which expired on December 31, 2019. On December 31, 2019, we and China Life Capital entered into a new cooperation framework agreement with a term ending on December 31, 2022. Under this new agreement, we continued to subscribe as limited partner for the fund products in which insurance funds are permitted for investment (“Fund Products”) and of which China Life Capital or any of its subsidiaries serves as the general partner, and/or Fund Products of which China Life Capital serves as the manager. We will enter into specific agreements with the counterparties including China Life Capital (or its subsidiaries) in respect of the subscription of specific Fund Products, and such specific agreements shall be subject to the principles set out in the new framework agreement. Upon execution of the specific agreements, we will make our capital contribution as required by the payment notice of the general partner. The capital contribution to be made by us will be funded by our internal resources. As the general partner or the manager of the Fund Products, China Life Capital (or its subsidiaries) will provide daily operation, investment management and consulting services to the Fund Products. The investment scope of the Fund Products includes real estate, warehousing logistics, apartments for long-term lease, urban renewal, infrastructure assets, corporate shareholdings in relation to the operation of such underlying assets and asset securitization products in relation to such assets (including, but not limited to, asset-backed securities, real estate investment trusts and quasi-real estate investment trusts). For the three years ending December 31, 2022, the annual caps for the subscription by us as limited partner of the Fund Products of which China Life Capital or any of its subsidiaries serves as the general partner are RMB 5,000 million, RMB 5,000 million and RMB 5,000 million, respectively, and the annual caps for the management fee charged by China Life Capital as the general partner or the manager of the Fund Products are RMB 200 million, RMB 200 million and RMB 200 million respectively.
For the year ended December 31, 2019, the subscription by us as limited partner of the Fund Products of which China Life Capital or any of its subsidiaries serves as the general partner were RMB 3,010.00 million (US$ 432.4 million) and the management fee charged by China Life Capital as the general partner or the manager of the Fund Products were RMB 38.51 million (US$ 5.5 million).
Framework Agreements with China Life Wealth
Framework Agreement between China Life Wealth and Us
On December 30, 2015, we entered into a framework agreement with China Life Wealth in relation to asset management services, sales agency services for asset management products and other daily transactions. The agreement expired on December 31, 2017. On December 28, 2017, we and China Life Wealth entered into a new framework agreement havingin relation to daily connected transactions, which has a term of three years ending on December 31, 2020. Under the agreement, we will continue to enter into certain daily transactions with China Life Wealth, including asset management services and sales agency services for asset management products. Pricing of the transactions under the agreement will be determined by the parties through arm’s length negotiations with reference to industry practices. For the three years ending December 31, 2020, the annual caps on the management fee payable by us for asset management services are RMB 240 million, RMB 240 million and RMB 240 million, respectively; the annual caps on the fees payable by China Life Wealth in connection with sales agency services (including the sales commission fee, client maintenance fee, handling fee and intermediary fee) are RMB 100 million, RMB 100 million and RMB 100 million, respectively, and the annual caps on the fees for other daily transactions are RMB 100 million, RMB 100 million and RMB 100 million, respectively.
For the year ended December 31, 2017,2019, the fee payable by us for the asset management services was RMB 1.803.60 million (US$ 0.30.5 million), the fees in connection with the sales agency services payable by China Life Wealth (including the sales commission fee, client maintenance fee, handling fee and intermediary fee) were RMB 0 million, and the fees for other daily transactions were RMB 5.4912.28 million (US$ 0.8million)1.8 million).
Framework Agreement between China Life Wealth and CLIC
On January 26, 2016, CLIC and China Life Wealth entered into a framework agreement for the subscription of asset management products. The agreement expired on December 31, 2017.On December 27, 2017, CLIC and China Life Wealth entered into a new framework agreement havingin relation to daily connected transactions, which has a term of three years ending on December 31, 2020. Under the new agreement, CLIC and China Life Wealth will conduct certain daily transactions, including asset management services and advisory services. Pricing of the transactions under the agreement will be determined by the parties through arm’s length negotiations with reference to industry practices. For the three years ending on December 31, 2020, the annual caps on the management fee payable by CLIC for asset management services are RMB 50 million, RMB 120 million and RMB 180 million, respectively, and the annual caps on the advisory fee payable by CLIC for the advisory services are RMB 50 million, RMB 80 million and RMB 120 million, respectively.
For the year ended December 31, 2017,2019, the management fee payable by CLIC for the asset management services was RMB 0.731.35 million (US$ 0.1million)0.2 million) and the advisory fee payable by CLIC was RMB 3.04 million (US$ 0.4million).
Framework Agreement between China Life Wealth and CLPCIC
On March 9, 2016, CLPCIC entered into a framework agreement with China Life Wealth in relation to asset management services, sales agency services for asset management products and other daily transactions with China Life Wealth. The agreement expired on December 31, 2017. On December 29, 2017, CLPCIC and China Life Wealth entered into a new framework agreement havingin relation to daily connected transactions, which has a term of three years ending on December 31, 2020. Under the new agreement, CLPCIC and China Life Wealth will conduct certain daily transactions, including asset management services, advisory services and other daily transactions permitted by laws and regulations. Pricing of the transactions under the agreement will be determined by the parties through arm’s length negotiations with reference to industry practices. For the three years ending December 31, 2020, the annual caps on the management fee payable by CLPCIC for asset management services are RMB 50 million, RMB 150 million and RMB 240 million, respectively; the annual caps on the advisory fee payable by CLPCIC for the advisory services are RMB 40 million, RMB 80 million and RMB 120 million, respectively; and the annual caps on the fees for other daily transactions are RMB 150 million, RMB 400 million and RMB 700 million, respectively.
For the year ended December 31, 2017,2019, the management fee payable by CLPCIC for the asset management services was RMB 5.830.56 million (US$ 0.9million)0.1 million), the fees in connection with the sales agency servicesadvisory fee payable by China Life Wealth (including the sales commission fee, client maintenance fee, handling fee and intermediary fee) wereCLPCIC for advisory services was RMB 05.88 million (US$ 0.8 million), and the fees for other daily transactions were RMB 40 thousand0.01 million (US$ 6 thousand)1,436).
Framework Agreement between China Life Wealth and China Life Overseas
On December 30, 2015, China Life Overseas entered into a framework agreement with China Life Wealth in relation to asset management services, sales agency services for asset management products and other daily transactions with China Life Wealth. Under the agreement, China Life Overseas will enter into certain daily transactions with China Life Wealth, including asset management services, sales agency services for asset management products and other daily transactions permitted by laws and regulations. Pricing of the transactions under the agreement will be determined by the parties through arm’s length negotiations with reference to industry practices. For the three years ending December 31, 2017, the annual caps on the management fee payable by China Life Overseas for the asset management services are RMB 10 million, RMB 30 million and RMB 50 million, respectively; the annual caps on fees payable by China Life Wealth in connection with sales agency services (including the sales commission fee, client maintenance fee, handling fee and intermediary fee) are RMB 5 million, RMB 5 million and RMB 10 million, respectively, and the annual caps on the fees for other daily transactions are RMB 5 million, RMB 5 million and RMB 10 million, respectively. The agreement expired on December 31, 2017.
For the year ended December 31, 2017, there were no payments made under the agreement.
Framework Agreement between China Life Wealth and IHC
On February 3, 2016, IHC entered into a framework agreement with China Life Wealth in relation to asset management services, sales agency services for asset management products and other daily transactions with China Life Wealth. The agreement expired on December 31, 2017. On December 20, 2017, IHC and China Life Wealth entered into a new framework agreement havingin relation to daily connected transactions, which has a term of three years ending on December 31, 2020. Under the new agreement, IHC and China Life Wealth will conduct certain daily transactions, including asset management services, advisory services and other daily transactions permitted by laws and regulations. Pricing of the transactions under the agreement will be determined by the parties through arm’s length negotiations with reference to industry practices. For the three years ending December 31, 2020, the annual caps on the management fee for the asset management services are RMB 40 million, RMB 80 million and RMB 120 million, respectively; the annual caps on the advisory fee for the advisory services are RMB 40 million, RMB 80 million and RMB 120 million, respectively; and the annual caps on the fees for other daily transactions are RMB 20 million, RMB 80 million and RMB 160 million, respectively.
For the year ended December 31, 2017,2019, the management fee payable by IHC for the asset management services was RMB 1.150.54 million (US$ 0.2million)77,566), the fees in connection withadvisory fee for the sales agencyadvisory services payable by China Life Wealth (including the sales commission fee, client maintenance fee, handling fee and intermediary fee) werewas RMB 0 million, and the fees for other daily transactions were RMB 0 million.
Framework Agreement between China Life Wealth and China LifeE-commerce
On December 29, 2017, China LifeE-commerce and China Life Wealth entered into a framework agreement in relation to asset management services, advisory services and other daily transactions permitted by laws and regulations. The agreement has a term from January 1, 2018 to December 31, 2020. Pricing of the transactions under the agreement will be determined by the parties through arm’s length negotiations with reference to industry practices. For the three years ending December 31, 2020, the annual caps on the management fee for the asset management services are RMB 5 million, RMB 10 million and RMB 15 million, respectively; the annual caps on the advisory fee for the advisory services payable by China LifeE-commerce for the advisory services are RMB 5 million, RMB 10 million and RMB 15 million, respectively; and the annual caps on the fees for other daily transactions are RMB 200 million, RMB 300 million and RMB 400 million, respectively.
For the year ended December 31, 2019, there was no payment made under the agreement.
Framework Agreement between China Life Wealth and China Life Pension
On March 26, 2018, China Life Pension and China Life Wealth entered into a framework agreement in relation to asset management services, advisory services and other daily transactions permitted by laws and regulations. The agreement has a term from January 1, 2018 to December 31, 2020. Pricing of the transactions under the agreement will be determined by the parties through arm’s length negotiations with reference to industry practices. For the three years ending December 31, 2020, the annual caps on the management fee payable by China Life Pension for asset management services are RMB 100 million, RMB 150 million and RMB 200 million, respectively; the annual caps on the advisory fee payable by China Life Pension for the advisory services are RMB 40 million, RMB 80 million and RMB 90 million, respectively; and the annual caps on the fees for other daily transactions are RMB 90 million, RMB 180 million and RMB 270 million, respectively.
For the year ended December 31, 2019, the fee payable by China Life Pension for asset management services was RMB 0 million, the advisory fee for the advisory services payable by China Life Pension was RMB 0.24 million (US$ 33,474), and the fees for other daily transactions payable by China Life Pension were RMB 0 million.
Framework Agreements with AMP
Framework Agreement between AMP and Us
On December 30, 2016, we and AMP entered into a framework agreement which expired on December 31, 2019. On December 31, 2019, we and AMP entered into a new framework agreement for a term starting fromcommencing on January 1, 20172020 and ending on December 31, 2019.2022 . Under the new agreement, we will continue to enter into certain daily transactions with AMP, including subscription and redemption of fund products, sales agency services, asset management for specific clients and other daily transactions permitted by laws and regulations. Pricing of the transactions under the agreement will be determined by the parties through arm’s length negotiations with reference to industry practices. For the three years ending December 31, 2019,2022, the annual caps on the subscription price and corresponding subscription fee for the subscription of fund products are RMB 72,600 million, RMB 72,600 million and RMB 72,600 million, respectively; the annual caps on the redemption price and corresponding redemption fee for the redemption of fund products are RMB 72,600 million, RMB 72,600 million and RMB 72,600 million, respectively; the annual caps on the sales commission fee and client maintenance fee payable by AMP are RMB 700 million, RMB 800 million and RMB 900 million, respectively; the annual caps on the management fee and(including performance-based feefee) payable by us for the asset management for specific clients are RMB 300 million, RMB 400 million and RMB 500 million, respectively; and the annual caps on the fees for other daily transactions are RMB 100 million, RMB 100 million and RMB 100 million, respectively.
For the year ended December 31, 2017,2019, the subscription price and corresponding subscription fee for the subscription of fund products was RMB 10,310.1220,475.00 million (US$ 1,584.6million)2,941.0 million), the redemption price and corresponding redemption fee for the redemption of fund products was RMB 12,017.207,951.54 million (US$ 1,847.0million)1,142.2 million), the sales commission fee and client maintenance fee paid by AMP was RMB 00.87 million (US$ 0.1 million), the management fee and(including performance-based feefee) paid by us for the asset management for specific clients was RMB 23.4531.20 million (US$ 3.6million)4.5 million) and the fees for other daily transactions were RMB 0.686.68 million (US$ 0.1million)1.0 million).
Framework Agreement between AMP and China Life Pension
On December 23, 2016, China Life Pension and AMP entered into a framework agreement for a term starting from January 1, 2017 and endingwhich expired on December 31, 2019. Under the agreement, China Life Pension will enter into certain daily transactions with AMP, including subscription and redemption of fund products, sales agency services, asset management for specific clients and other daily transactions permitted by laws and regulations. Pricing of the transactions under the agreement will be determined by the parties through arm’s length negotiations with reference to industry practices. For the three years endingended December 31, 2019, the annual caps on the subscription price and corresponding subscription fee for the subscription of fund products arewere RMB 10,000 million, RMB 10,000 million and RMB 10,000 million, respectively; the annual caps on the redemption price and corresponding redemption fee for the redemption of fund products arewere RMB 10,000 million, RMB 10,000 million and RMB 10,000 million, respectively; the annual caps on the sales commission fee and client maintenance fee payable by AMP arewere RMB 100 million, RMB 100RMB100 million and RMB 100 million, respectively; the annual caps on the management fee and performance-based fee payable by China Life Pension for the asset management for specific clients arewere RMB 100 million, RMB 100 million and RMB 100 million, respectively; and the annual caps on the fees for other daily transactions arewere RMB 100 million, RMB 100 million and RMB 100 million, respectively.
For the year ended December 31, 2017,2019, the subscription price and corresponding subscription fee for the subscription of fund products was RMB 534.071,426.49 million (US$ 82.1million)204.9 million), the redemption price and corresponding redemption fee for the redemption of fund products was RMB 1,750.701,403.22 million (US$ 269.1million)201.6 million), the sales commission fee and client maintenance fee paid by AMP was RMB 0 million, , the management fee and(including a performance-based feefee) paid by China Life Pension for the asset management for specific clients was RMB 0 million, and the fees for other daily transactions were RMB 0 million.
Framework Agreement between AMP and CLIC
On December 16, 2016,CLIC and AMP entered into a framework agreement which expired on December 31, 2019. On September 6, 2019, CLIC and AMP entered into a new framework agreement for a term starting fromcommencing on January 1, 20172020 and ending on December 31, 2019.2022. Under the new agreement, CLIC will continue to enter into certain daily transactions with AMP, including subscription and redemption of fund products and private asset management for specific clients.management. Pricing of the transactions under the agreement will be determined by the parties through arm’s length negotiations with reference to industry practices. For the three years ending December 31, 2019,2022, the annual caps on the subscription price and corresponding subscription fee for the subscription of fund products are RMB 10,000 million, RMB 10,000 million and RMB 10,000 million, respectively; the annual caps on the redemption price and corresponding redemption fee for the redemption of fund products are RMB 10,000 million, RMB 10,000 million and RMB 10,000 million, respectively; and the annual caps on the management fee and performance-based fee payable by CLIC for the private asset management for specific clients(including a performance-based fee) are RMB 100 million, RMB 100 million and RMB 100 million, respectively.
For the year ended December 31, 2017,2019, the subscription price and corresponding subscription fee for the subscription of fund products was RMB 4,082.231,100.00 million (US$ 627.4158.0 million), the redemption price and corresponding redemption fee for the redemption of fund products was RMB 7,617.19million1,430.66 million (US$ 1,170.7million)205.5 million) and the management fee and(including performance-based feefee) payable by CLIC for the asset management for specific clients were RMB 20.4122.96 million (US$ 3.13.3 million).
Framework Agreement between AMP and CLPCIC
On December 22, 2016, CLPCIC and AMP entered into a framework agreement which expired on December 31, 2019. On December 3, 2019, CLPCIC and AMP entered into a new framework agreement for a term starting fromcommencing on January 1, 20172020 and ending on December 31, 2019.2022. Under the new agreement, CLPCIC will continue to enter into certain daily transactions with AMP, including subscription and redemption of fund products, sales agency services, asset management for specific clients and other daily transactions permitted by laws and regulations. Pricing of the transactions under the agreement will be determined by the parties through arm’s length negotiations with reference to industry practices. For the three years ending December 31, 2019,2022, the annual caps on the subscription price for the fund products are RMB 10,000 million, RMB 10,000 million and RMB 10,000 million, respectively; the annual caps on the redemption price for the fund products are RMB 10,000 million, RMB 10,000 million and RMB 10,000 million, respectively; the annual caps for the subscription fee for the fund products are RMB 100 million, RMB 100 million and RMB 100 million, respectively; the annual caps for the redemption fee for the fund products are RMB 100 million, RMB 100 million and RMB 100 million, respectively; the annual caps on the sales commission fee and client maintenance fee payable by AMP are RMB 100 million, RMB 100 million and RMB 100 million, respectively; the annual caps on the management fee and(including a performance-based feefee) payable by CLPCIC for the asset management for specific clients are RMB 100 million, RMB 100 million and RMB 100 million, respectively; and the annual caps on the fees for other daily transactions are RMB 100 million, RMB 100 million and RMB 100 million, respectively.
For the year ended December 31, 2017,2019, the subscription price for the fund products, was RMB 0 million, the redemption price for the fund products, was RMB 66.61 million (US$ 10.2 million), the subscription fee for the fund products, was RMB 0 million, the redemption fee for the fund products was RMB 0.1 million (US$ 0.02 million),and the sales commission fee and client maintenance fee paid by AMP waswere RMB 0 million, ,and the management fee and(including a performance-based feefee) payable by CLPCIC for the asset management for specific clients was RMB 2.34.84 million (US$ 0.4 million)0.7million) and the fees for other daily transactions were RMB 0.070.09 million (US$ 0.01 million)12,928).
Framework Agreement between AMP and IHC
On December 20, 2017, AMP and IHC entered into a framework agreement which became effective upon signing and will endexpired on December 31, 2019. On February 17, 2020, IHC and AMP entered into a new framework agreement for a term commencing on January 1, 2020 and ending on December 31, 2022. Under this new agreement, IHC will continue to enter into certain daily transactions with AMP, including subscription and redemption of fund products, asset management for specific clients, advisory services and other daily transactions permitted by laws and regulations. Pricing of the transactions under the framework agreement will be determined by the parties through arm’s length negotiations with reference to industry practices. For each of the three years ending December 31, 2019,2022, the annual caps on the subscription price and corresponding subscription fee for the subscription of fund products are RMB 5 billion, RMB 7 billion and RMB 7 billion, respectively;10,000 million; the annual caps on the redemption price and corresponding redemption fee for the redemption of fund products are RMB 5 billion, RMB 7 billion and RMB 7 billion, respectively;10,000 million; the annual caps on the management fee and(including a performance-based feefee) payable by IHC and its subsidiaries for the asset management for specific clients are RMB 50150 million; the annual caps on the management fee (including performance-based fee) paid by subsidiaries of AMP for the asset management for specific clients are RMB 150 million; the annual caps on the advisory fee paid by IHC and its subsidiaries for the advisory services are RMB 150 million; the annual caps on the advisory fee paid by AMP and its subsidiaries for the advisory services are RMB 150 million, RMB 50 million and RMB 50 million, respectively; and the annual caps on the fees for other daily transactions are RMB 50 million, RMB 50 million and RMB 50 million, respectively.150 million.
For the year ended December 31, 2017,2019, the subscription price and corresponding subscription fee for the subscription of fund products was RMB 688.02104.34 million (US$ 105.7 million)15.0million), the redemption price and corresponding redemption fee for the redemption of fund products was RMB 0296.81 million (US$ 42.6 million), the management fee and(including a performance-based feefee) payable by IHC for the asset management for specific clients was RMB 0 million, and the fees for other daily transactions were RMB 0 million.
Agreements with Chongqing Trust
Framework Agreement between Chongqing Trust and Us
On June 21, 2017, we entered into a framework agreement with Chongqing Trust in relation to the subscription and redemption of trust products and other daily transactions. The framework agreement became effective upon signing by the parties and will expireexpired on December 31, 2019. On December 27, 2019, we entered into a new framework agreement with Chongqing Trust for a term commencing on January 1, 2020 and ending on December 31, 2022. Under the new framework agreement, we and Chongqing Trust will continue to enter into transactions including subscription and redemption of trust products and other daily transactions permitted by laws and regulations. Pricing of the transactions under the framework agreement will be determined by the parties through arm’s length negotiations with reference to industry practices. For each of the three years ending December 31, 2019,2022, the annual caps on the total amount of subscription amount for the subscriptionand redemption of trust products includingare RMB 30,000 million (including the trustee’s remuneration of no more than RMB500 million per year to be received by Chongqing Trust from the trust assets, are RMB 50 billion, RMB 50 billion and RMB 50 billion, respectively; the annual caps on the redemption amount for the redemption of trust products are RMB 4.5 billion, RMB 4.5billion and RMB 4.5 billion, respectively;assets); and the annual caps on the fees for other daily transactions are RMB 100 million, RMB 100 million and RMB 100 million, respectively.million.
For the year ended December 31, 2017,2019, the subscription amount for the subscription of trust products was RMB 8,174.0014,300.63 million (US$ 1,256.32,054.2 million) (including the trustee’s remuneration of RMB 20.52 million (US$ 2.9 million) received by Chongqing Trust from the trust assets), the redemption amount for the redemption of trust products was RMB 0 million and the fees for other daily transactions were RMB 0 million.
Framework Agreement between Chongqing Trust and AMC
On November 7, 2018, AMC entered into a framework agreement with Chongqing Trust, pursuant to which AMC and Chongqing Trust will conduct certain daily transactions, mainly including the subscription of trust products and asset management services. Pricing of the transactions under the framework agreement will be determined by the parties through arm’s length negotiations with reference to industry practices. For the two years ended December 31, 2019, the annual caps on the amount of subscription by AMC and the asset management products managed by it of the trust products issued by Chongqing Trust were RMB 1,200 million and RMB 1,800 million, respectively (including the trustee’s remuneration of no more than RMB100 million and RMB150 million, respectively, per year to be received by Chongqing Trust from the trust assets); the annual caps on the management fee for asset management services were RMB100 million and RMB 150 million, respectively, and the annual caps on the fees for other daily transactions were RMB 100 million and RMB 100 million, respectively. The framework agreement expired on December 31, 2019.
For the year ended December 31, 2019, there was no payment made under the agreement.
Framework Agreement between Chongqing Trust and China Life Wealth
On December 29, 2017, China Life Wealth entered into a framework agreement with Chongqing Trust, pursuant to which China Life Wealth and Chongqing Trust will conduct certain daily transactions, mainly including the subscription of trust products, asset management services, advisory services and other daily transactions. The framework agreement has a term from January 1, 2018 to December 31, 2019. Pricing of the transactions under the framework agreement will be determined by the parties through arm’s length negotiations with reference to industry practices. For the two years endingended December 31, 2019, the annual caps on the subscription amount of the trust products were RMB 10,000 million and RMB 10,000 million, respectively (including the trustee’s remuneration of no more than RMB150 million per year to be received by Chongqing Trust from the trust assets) are RMB 10 billion and RMB 10 billion, respectively;; the annual caps on the management fee for the asset management services arewere RMB 150 million and RMB 150 million, respectively, the annual caps on the advisory fee for advisory services arewere RMB 150 million and RMB 150 million, respectively; and the annual caps on the fees for other daily transactions arewere RMB 100 million and RMB 100 million, respectively. The framework agreement expired on December 31, 2019.
For the year ended December 31, 2019, there was no payment made under the agreement.
Continuing Related Party Transactions with CGB
During the reporting period, we engaged in continuing related party transactions with CGB pursuant to several negotiated deposit agreements between CGB and us. A detailed discussion of these agreements is set forth under the heading “Item 7. Major Shareholders and Related Party Transactions—Related Party Transactions” in our annual reports on Form20-F filed with the Securities and Exchange Commission on April 26, 2012 and April 26, 2013, respectively.
On August 12, 2016, we entered into an insurance products cooperation agreement with CGB, pursuant to which CGB will sell our individual insurance products suitable for sale through banks, as jointly selected by CGB and us. This agreement expired in August 2018. On October 19, 2018, we entered into a new insurance products cooperation agreement with CGB. This agreement has a term of two years. Under this agreement, CGB will act as an intermediary to sell such products and will also act on our behalf to receive premiums. In return, we will pay CGB a commission fee for each such product sold by it, calculated and paid on a monthly basis, by multiplying (a) total new premiums received in such month minus the premiums for the policies cancelled during thecooling-off period in such month and (b) a fixed commission rate, which ranges from 1.5%0.8% to 30%38%. This agreement has a term of two years. Upon expiration of thetwo-year term, this agreement will be automatically renewed for successiveone-year terms, provided that no objection has been raised by CGB or us.
On June 14, 2013, we entered into a related party transaction framework agreement with CGB. Under this agreement, which has a term of three years ending on December 31, 2015, we and CGB will carry out various deposit andnon-deposit related party transactions. On July 25, 2014, we entered into a revised agreement with CGB, which further increased the daily cap of deposits in respect of all the deposit transactions, increased the annual cap in respect of all thenon-deposit related party transactions and expanded the scope ofnon-deposit transactions. This agreement expired on December 31, 2016. A detailed discussion of this related party transaction framework agreement is set forth under the heading “Item 7. Major Shareholders and Related Party Transactions—Related Party Transactions” in our annual report on Form20-F filed with the Securities and Exchange Commission on April 25, 2014 and April 22, 2016, respectively. On January 12, 2017, we entered into a new framework agreement with CGB for daily related party transactions, for a term starting from January 1, 2017 and endingtransactions. This agreement expired on December 31, 2019. Compared to the original agreement, theOn December 26, 2019, we entered into a new framework agreement adjusted the scope of transactionsfor daily connected transaction with CGB. Pursuant to this new framework agreement, we and the classificationsubsidiaries controlled by us will, in the ordinary course of transaction types,business, carry out deposit, financial market and also increased the cap of the transaction amounts.peer, financing, investment and wealth management,co-investment, enterprise annuity, asset management and investment consultation, entrustment, agency and other daily connected transactions with CGB based on normal commercial terms. A detailed discussion of this new agreement is set forth in our report on Form6-K filed with the Securities and Exchange Commission on November 10, 2016.October 29, 2019.
As at December 31, 2017,2019, the amount of our deposit balance at CGB for deposit related party transactions was RMB 33,583.7459,419.89 million, and the interest incomesincome arising from these transactions werewas RMB 1,381.512,584.20 million, and the amount of the balance for financial market and peer related party transactions was RMB 0 million and the relevant fees or incomes arising from these transactions were RMB 101.000 million. For the year ended December 31, 2017,2019, the amount of the financing related party transactions was RMB 0 million, the amount of investment and wealth management related party transactions was RMB 4,330.003,844.25 million, the amount of theco-investment related party transactions was RMB 0 million, the scale of entrusted funds under enterprise annuity related party transactions was RMB 0 million, and the amount of transaction fees related to enterprise annuity related party transactions (including management fee, entrustment fee, account management fee and performance-based fee) incurred was RMB 0 million, the amount of transaction fees related to asset management related party transactions (including management fee, service fee and handling fee) incurred was RMB 0 million, the amount of transactionstransaction fees related to entrustment related party transactions (including entrustment fee, service fee and handling fee) incurred was RMB 0 million, the amount of transaction fees related to agency related party transactions (including agency fee, service fee and handling fee) incurred was RMB 91.96158.29 million and the amount of other daily related party transactions was RMB 56.92219.19 million.
Compliance with HKSE Listing Rules
The policy management agreement between CLIC and us, the asset management agreement between AMC and us, the insurance sales framework agreement between CLPCIC and us, the framework agreements between China Life Wealth and each of us, CLIC, CLPCIC, China Life Overseas, IHC, China Life Pension and China LifeE-commerce, the framework agreement entered into by AMP with IHC, the framework agreement respectively entered into by China Life Wealth and AMC with Chongqing Trust and the framework agreement entered into by us and China Life Wealth with Chongqing TrustCapital are only subject to reporting, announcement and annual review requirements under the HKSE Listing Rules and are exempt from independent shareholders’ approval requirements. In compliance with applicable HKSE Listing Rules requirements, we made announcements disclosing these transactions on December 19, 2014, December 22, 2015, August 25, 2016, October 26, 2017, December 19, 2017, April 26, 2018, October 25, 2018, December 20, 2018, August 22, 2019 and March 25, 2020, respectively.
The new asset management For the year ended December 31, 2019, the transaction under the framework agreement entered into between AMP and IHC is only subject to reporting, announcement and usannual review requirements under the HKSE Listing Rules and is exempt from independent shareholders’ approval requirements. AMP and IHC renewed the framework agreement on June 30, 2017February 17, 2020. For the three years ending December 31, 2022, the transaction under the renewed framework agreement is subject to reporting, announcement, annual review and independent shareholders’ approval requirements under the HKSE Listing Rules. We made an announcement disclosing this transaction on March 23, 2017August 22, 2019 and obtained the approval of the shareholders’ general meeting of our company on MayDecember 19, 2019.
The new asset management agreement entered into between IHC and us on December 31, 2017.2018 is subject to reporting, announcement, annual review and independent shareholders’ approval requirements under the HKSE Listing Rules. We made an announcement disclosing this transaction on April 26, 2018 and obtained the approval of the shareholders’ general meeting of our company on June 6, 2018.
The framework agreements entered into by AMP with us, China Life Pension, CLIC and CLPCIC, respectively, are subject to reporting, announcement, annual review and independent shareholders’ approval requirements under the HKSE Listing Rules. In compliance with applicable HKSE Listing Rules requirements, we made an announcementannouncements disclosing these transactions on October 27, 2016 and August 22, 2019 and obtained the approval of the shareholders’ general meeting of our company on December 27, 2016.
2016 and December 19, 2019. The framework agreement entered into between us and Chongqing Trust on June 21, 2017 in relation to the subscription and redemption of trust products and other daily transactions is subject to reporting, announcement, annual review and independent shareholders’ approval requirements under the HKSE Listing Rules. In compliance with applicable HKSE Listing Rules requirements, we made an announcement disclosing this transaction on March 23, 2017 and obtained the approval of the shareholders’ general meeting of our company on May 31, 2017. For the year ended December 31, 2019, the transaction under the framework agreement between us and Chongqing Trust is subject to reporting, announcement, annual review and independent shareholders’ approval requirements under the HKSE Listing Rules. We and Chongqing Trust renewed the framework agreement on December 27, 2019. For the three years ending December 31, 2022, the transaction under the renewed framework agreement is only subject to reporting, announcement and annual review requirements under the HKSE Listing Rules and is exempt from independent shareholders’ approval requirements. We made an announcement disclosing this transaction on December 19, 2019.
The remaining related party transactions discussed above, other than the transactions with CGB, are exempt from reporting, announcement and independent shareholders’ approval requirements under the HKSE Listing Rules. The related party transactions with CGB are not regarded as connected transactions for us under the HKSE Listing Rules.
Confirmation of IndependentNon-executive Directors:
Our independentnon-executive directors have reviewed the policy management agreement between CLIC and us, the asset management agreement between AMC and us, the insurance sales framework agreement between CLPCIC and us, the framework agreements between China Life Wealth and each of us, CLIC, CLPCIC, China Life Overseas, IHC, China Life Pension and China LifeE-commerce, the asset management agreement between us and IHC, and the framework agreements between AMP and each of us, China Life Pension, CLIC, CLPCIC, and IHC, the framework agreement between Chongqing Trust and us, and the framework agreement between China Life Wealth and Chongqing Trust, and whichabove continuing connected transactions that were subject to reporting, announcement, annual review and/or independent shareholders’ approval requirements under the HKSE Listing Rules and confirmed that:
| 1) | the transactions were entered into in the ordinary and usual course of our business; |
| 2) | the transactions were conducted on normal commercial terms or more preferential terms; |
| 3) | the transactions were conducted in accordance with the agreements governing those transactions and on the terms that are fair and reasonable and in the interest of the shareholders; and |
| 4) | the amounts of the transactions had not exceeded the relevant annual caps as announced by us. |
C. INTERESTS OF EXPERTS AND COUNSEL
Not applicable.
ITEM 8. FINANCIAL INFORMATION.
A.CONSOLIDATEDA. CONSOLIDATED FINANCIAL STATEMENTS AND OTHER FINANCIAL INFORMATION
Our audited consolidated financial statements are set forth beginning on pageF-1.
Legal and Regulatory Proceedings
We are involved in litigation and arbitration proceedings involving our insurance operations on an ongoing basis. In addition, the CBIRC, (formerly CIRC), as well as other PRC governmental agencies, including tax commerce and industrial administration and audit bureaus and the PBOC, from time to time make inquiries and conduct examinations, audits or investigations concerning our compliance with PRC laws and regulations. For example, in July 2018, the PBOC imposed a fine of RMB 700,000 on us fornon-compliance with the anti-money laundering law and regulations during the period from July 1, 2015 to June 30, 2016. Thenon-compliance issues identified by the PBOC include failure to preserve clients’ identity information and transaction records and failure to submit reports on transactions of large payments and suspicious transactions to the PBOC. These litigation, arbitration and administrative proceedings have in the past resulted in damage awards, settlements or administrative sanctions, including fines, which have not been material to us. While we cannot predict the outcome of any pending or future litigation, arbitration, examination or investigation, we do not believe that any pending legal matter will have a material adverse effect on our business, financial condition or results of operations. However, we cannot assure you that any future litigation, arbitration or regulatory proceeding will not have an adverse outcome, which could have a material adverse effect on our operating results or cash flows.
We currently have control procedures in place to monitor our litigation, arbitration and regulatory exposure. We have established a systematic prevention system whereby our management at each corporate level is responsible for compliance with laws, regulations and internal codes of conduct within their individual territories or departments. Our branches at the provincial level are required to report material litigation, arbitration and regulatory matters to our corporate headquarters on a timely basis. We plan to continue to improve our control and compliance policies in the future.
We may penalize or punish our employees or exclusive agents who commit misconduct or fraud, breach the terms of their employment or agency agreements, exceed their authorization limits or fail to follow prescribed procedures in delivering insurance policies and premium payments, in each case having regard to the severity of the offense. Employees or exclusive agents are required to reimburse us for any losses suffered by us resulting from their misconduct or fraud. In serious cases, we may terminate their employment or agency agreements. We report criminal offenses to the PRC authorities and may also bring concurrent civil actions against employees or exclusive agents. We have experienced agent and employee misconduct that has resulted in litigation, arbitration and administrative actions against us and these agents and employees, and in some cases criminal proceedings and convictions against the agent or employee in question. None of these actions has resulted in material losses, damages, fines or other sanctions against us. We cannot assure you, however, that agent or employee misconduct will not lead to a material adverse effect on our business, results of operations or financial condition.
Policy on Dividend Distributions
Our board of directors has passed a resolution on March 22, 201825, 2020 to propose for approval at the annual general meeting of the declaration of final dividends of RMB 0.40per0.73 per share, totaling approximately RMB 11,30620,633 million (US$ 1,738million)2,964 million), for the year ended December 31, 2017.2019. The proposed dividends have not been provided in our consolidated financial statements for the year ended December 31, 2017.2019.
The payment of any dividend by us must be approved by shareholders in a shareholders’ meeting. Our board of directors intends to make its recommendations regarding the declaration of cash dividends to the shareholders in general meeting.The decision to make a recommendation for the payment of any dividend and the amount of the dividend will depend on:depends on, among other things:
our results of operations and cash flows;
our financial position;
statutory solvency requirements as determined under CBIRC (formerly CIRC) rules;
our shareholders’ interests;
general business conditions;
our future prospects;
statutory and regulatory restrictions on the payment of dividends by us; and
other factors that our board of directors deems relevant.
We will pay dividends out of ourafter-tax profits only after we have made the following allowances and allocations:
recovery of accumulated losses, if any;
allocations to the general risks reserve fund equivalent to 10% of ourafter-tax profits, as determined under PRC GAAP; and
allocations to a discretionary common reserve fund as approved by the shareholders in a shareholders’ meeting.
When the statutory common reserve fund reaches and is maintained at or above 50% of our registered capital, as determined under PRC GAAP, no further allocations to this fund will be required.
Under Chinese law, dividends may be paid only out of distributable profits.Any distributable profits that are not distributed in a given year are retained and available for distribution in subsequent years. However, ordinarily we will not pay any dividends in a year in which we do not have any distributable profits.
Payment of dividends by us is also regulated by the PRC insurance law. If we do not meet the minimum solvency margin required by the CBIRC, (formerly CIRC), we may be prohibited from paying dividends. See “Item 4. Information on the Company—Business Overview—Regulatory and Related Matters—Insurance Company Regulation—Solvency requirements”.
We paid dividends of RMB 0.30per share in respect of 2013, RMB 0.40per share in respect of 2014, RMB 0.42 per share in respect of 2015, and RMB 0.24 per share in respect of 2016.2016, RMB 0.40 per share in respect of 2017 and RMB 0.16 per share in respect of 2018. Our board of directors has recommended the declaration of final dividends of RMB 0.40per0.73per share in respect of 2017.2019. We expect to continue to pay dividends in line with our financial performance thereafter. We will declare dividends, if any, in Renminbi with respect to the H shares on a per share basis and will pay such dividends in Hong Kong dollars.
B.SIGNIFICANTB. SIGNIFICANT CHANGES
As of the date of this annual report, there was no significant change since the date of the financial statements filed as part of this annual report that has or is reasonably likely to have a current or future effect on our financial condition, changes in financial condition, revenues or expenses, results of operations, liquidity, capital expenditures or capital resources that is material to investors.
Background
China Life prepares financial statements to public investors in accordance with the relevant accounting standards. An alternative measure of the value and profitability of a life insurance company can be provided by the embedded value method. Embedded value is an actuarially determined estimate of the economic value of the life insurance business of an insurance company based on a particular set of assumptions about future experience, excluding the economic value of future new business. In addition, the value of one year’s sales represents an actuarially determined estimate of the economic value arising from new life insurance business issued in one year based on a particular set of assumptions about future experience.
China Life believes that reporting our embedded value and value of one year’s sales provides useful information to investors in two respects. First, the value of ourin-force business represents the total amount of shareholders’ interest in distributable earnings, in present value terms, which can be expected to emerge over time, in accordance with the assumptions used. Second, the value of one year’s sales provides an indication of the value created for investors by new business activity based on the assumptions used and hence the potential of the business. However, the information on embedded value and value of one year’s sales should not be viewed as a substitute of financial measures under the relevant accounting basis. Investors should not make investment decisions based solely on embedded value information and the value of one year’s sales.
It is important to note that actuarial standards with respect to the calculation of embedded value are still evolving. There is still no universal standard which defines the form, calculation methodology or presentation format of the embedded value of an insurance company. Hence, differences in definition, methodology, assumptions, accounting basis and disclosures may cause inconsistency when comparing the results of different companies.
Also, the calculation of embedded value and value of one year’s sales involves substantial technical complexity and estimates can vary materially as key assumptions are changed. Therefore, special care is advised when interpreting embedded value results.
The values shown below do not consider the future financial impact of transactions between China Life and CLIC, IHC, AMC, China Life Pension, CLPCIC, and etc.
Definitions of Embedded Value and Value of One year’s salesYear’s Sales
The embedded value of a life insurer is defined as the sum of the adjusted net worth and the value ofin-force business allowing for the cost of required capitalcapital.
“Adjusted net worth” is equal to the sum of:
Net assets, defined as assets less corresponding policy liabilities and other liabilities valued; and
Net-of-tax adjustments for relevant differences between the market value and the book value of assets, together with relevantnet-of-tax adjustments to certain liabilities.
The market value of assets can fluctuate significantly over time due to the impact of the prevailing market environment. Hence the adjusted net worth can fluctuate significantly between valuation dates.
The “value ofin-force business” and the “value of one year’s sales” are defined here as the discounted value of the projected stream of future shareholders’ interest in distributable earnings for existingin-force business at the valuation date and for one year’s sales in the 12 months immediately preceding the valuation date.
The value ofin-force business and the value of one year’s sales have been determined using a traditional deterministic discounted cash flow methodology. This methodology makes implicit allowance for the cost of investment guarantees and policyholder options, asset/liability mismatch risk, credit risk, the risk of operating experience’s fluctuation and the economic cost of capital through the use of a risk-adjusted discount rate.
Preparation and Review
The embedded value and the value of one year’s sales were prepared by China Life in accordance with the “CAA Standards of Actuarial Practice: Appraisal of Embedded Value” issued by the China Association of Actuaries (“CAA”) in November 2016. Willis Towers Watson, an international firm of consultants, performed a review of China Life’s embedded value. The review statement from Willis Towers Watson is contained in the “Willis Towers Watson’s review opinion report on embedded value” section.
Assumptions
Economic assumptions: The calculations are based upon assumed corporate tax rate of 25% for all years. The investment return is assumed to be 5%. 13% per annum. 14% grading to 17%18% (remaining level thereafter) of the investment return is assumed to be exempt from income tax. TheseThe investment return and tax exempt assumptions are based on our strategic asset mix and expected future returns. The risk-adjusted discount rate used is 10%. per annum.
Other operating assumptions such as mortality, morbidity, lapses and expenses are based on our recent operating experience and expected future outlook.
Summary of Results
The embedded value as at December 31, December 2017 and2019, the value of one year’s sales for the 12 months ended December 31, December 2017,2019, and the corresponding results as at December 31, December 20162018 are shown below:
Table 1
| Components of Embedded Value and Value of One Year’s Sales | Components of Embedded Value and Value of One Year’s Sales | RMB million | Components of Embedded Value and Value of One Year’s Sales | RMB million | ||||||||||||||||
ITEM | ITEM | 31 December, 2017 | 31 December, 2016 | ITEM | December 31, 2019 | December 31, 2018 | ||||||||||||||
| A | Adjusted Net Worth | 370,500 | 349,528 | Adjusted Net Worth | 482,793 | 386,054 | ||||||||||||||
| B | Value ofIn-Force Business before Cost of Required Capital | 398,723 | 332,317 | Value ofIn-Force Business before Cost of Required Capital | 509,515 | 454,786 | ||||||||||||||
| C | Cost of Required Capital | (35,050 | ) | (29,787 | ) | Cost of Required Capital | (50,220 | ) | (45,788 | ) | ||||||||||
| D | Value ofIn-Force Business after Cost of Required Capital (B+C) | 363,673 | 302,530 | Value ofIn-Force Business after Cost of Required Capital (B + C) | 459,295 | 408,998 | ||||||||||||||
| E | Embedded Value (A + D) | 734,172 | 652,057 | Embedded Value (A + D) | 942,087 | 795,052 | ||||||||||||||
|
| |||||||||||||||||||
| F | Value of One Year’s Sales before Cost of Required Capital | 64,627 | 53,952 | Value of One Year’s Sales before Cost of Required Capital | 63,745 | 54,728 | ||||||||||||||
| G | Cost of Required Capital | (4,510 | ) | (4,641 | ) | Cost of Required Capital | (5,047 | ) | (5,218 | ) | ||||||||||
| H | Value of One Year’s Sales after Cost of Required Capital (F + G) | 60,117 | 49,311 | Value of One Year’s Sales after Cost of Required Capital (F + G) | 58,698 | 49,511 | ||||||||||||||
Note: Numbers may not be additive due to rounding.
Value of One Year’s Sales by Channel
The value of one year’s sales for the 12 months ended December 31, December 20172019 by channel is shown below:
Table 2
| Value of One Year’s Sales by Channel | RMB million | RMB million | ||||||||||||||
Channel | 31 December, 2017 | 31 December, 2016 | December 31, 2019 | December 31, 2018 | ||||||||||||
Exclusive Individual Agent Channel | 53,170 | 46,326 | 52,189 | 42,839 | ||||||||||||
Bancassurance Channel | 6,536 | 2,610 | 6,288 | 6,357 | ||||||||||||
Group Insurance Channel | 410 | 375 | 221 | 314 | ||||||||||||
|
| |||||||||||||||
Total | 60,117 | 49,311 | 58,698 | 49,511 | ||||||||||||
|
| |||||||||||||||
Note: Numbers may not be additive due to rounding.
The new business margin of one year’s sales for the 12 months ended December 31, December 20172019 by channel is shown below:
Table 3
| New Business Margin of One Year’s Sales by Channel | New Business Margin of One Year’s Sales by Channel | New Business Margin of One Year’s Sales by Channel | ||||||||||||||||||||||||||||||
| By FYP | By APE | By FYP | By APE | |||||||||||||||||||||||||||||
Channel | 31 December, 2017 | 31 December, 2016 | 31 December, 2017 | 31 December, 2016 | December 31, 2019 | December 31, 2018 | December 31, 2019 | December 31, 2018 | ||||||||||||||||||||||||
Exclusive Individual Agent Channel | 47.2 | % | 51.1 | % | 47.3 | % | 51.2 | % | 45.3 | % | 42.2 | % | 45.3 | % | 42.2 | % | ||||||||||||||||
Bancassurance Channel | 8.0 | % | 3.0 | % | 23.2 | % | 10.2 | % | 23.8 | % | 18.7 | % | 23.8 | % | 24.3 | % | ||||||||||||||||
Group Insurance Channel | 1.1 | % | 1.0 | % | 1.1 | % | 1.1 | % | 0.6 | % | 0.8 | % | 0.6 | % | 0.9 | % | ||||||||||||||||
Note: FYP (First Year Premium) is the written premium used for calculation of the value of one year’s sales and APE (Annual Premium Equivalent) is calculated as the sum of 100 percent of first year regular premiums and 10 percent of single premiums.
Movement analysisAnalysis
The following analysis tracks the movement of the embedded value from the start to the end of the reporting period:
Table 4
Analysis of Embedded Value Movement in | RMB million | |||||
ITEM | ||||||
A | Embedded Value at the Start of Year | |||||
B | Expected Return on Embedded Value | |||||
C | Value of New Business in the Period | |||||
D | Operating Experience Variance | |||||
E | Investment Experience Variance | |||||
F | Methodology, Model and Assumption Changes | ( | ) | |||
G | Market Value and Other Adjustments | |||||
H | Exchange Gains or Losses | |||||
I | Shareholder Dividend Distribution and Capital Injection | ( | ) | |||
J | Other | ( | ) | |||
K | Embedded Value as at December 31, | |||||
Notes:
| 1) | Numbers may not be additive due to rounding. |
| 2) | Items B through J are explained below: |
| B | Reflects expected impact of covered business, and the expected return on investments supporting the |
| C | Value of one year’s sales for the 12 months ended December 31, |
| D | Reflects the difference between actual operating experience in |
| E | Compares actual with expected investment returns during |
| F | Reflects the effects of appraisal methodology and model enhancement, and assumption changes. |
| G | Change in the market value adjustment from the beginning of year |
| H | Reflects the gains or losses due to changes in exchange rate. |
| I | Reflects dividends distributed to shareholders during |
| J | Other miscellaneous items. |
Sensitivity Results
Sensitivity tests were performed using a range of alternative assumptions. In each of the sensitivity tests, only the assumption referred to was changed, with all other assumptions remaining unchanged. The results are summarized below:
Table 5
| Sensitivity Results | Sensitivity Results | RMB million | Sensitivity Results | RMB million | ||||||||||||||||
| Value of In-Force Business after Cost of Required Capital | Value of One Year’s Sales after Cost of Required Capital | Value of In-Force Business after Cost of Required Capital | Value of One Year’s Sales after Cost of Required Capital | |||||||||||||||||
Base case scenario | 363,673 | 60,117 | ||||||||||||||||||
Base case scenario | Base case scenario | 459,295 | 58,698 | |||||||||||||||||
| 1. | Risk discount rate +50bps | 347,884 | 57,470 | Risk discount rate +50bps | 438,848 | 55,936 | ||||||||||||||
| 2. | Risk discount rate -50bps | 380,622 | 62,964 | Risk discount rate –50bps | 481,260 | 61,684 | ||||||||||||||
| 3. | Investment return +50bps | 425,453 | 68,690 | Investment return +50bps | 541,563 | 68,296 | ||||||||||||||
| 4. | Investment return -50bps | 302,186 | 51,558 | Investment return –50bps | 377,380 | 49,108 | ||||||||||||||
| 5. | 10% increase in expenses | 358,884 | 56,878 | 10% increase in expenses | 453,307 | 55,346 | ||||||||||||||
| 6. | 10% decrease in expenses | 368,460 | 63,356 | 10% decrease in expenses | 465,282 | 62,050 | ||||||||||||||
| 7. | 10% increase in mortality rate fornon-annuity products and 10% decrease in mortality rate for annuity products | 361,113 | 59,400 | 10% increase in mortality rate fornon-annuity products and 10% decrease in mortality rate for annuity products | 456,176 | 57,867 | ||||||||||||||
| 8. | 10% decrease in mortality rate fornon-annuity products and 10% increase in mortality rate for annuity products | 366,227 | 60,835 | 10% decrease in mortality rate fornon-annuity products and 10% increase in mortality rate for annuity products | 462,414 | 59,532 | ||||||||||||||
| 9. | 10% increase in lapse rates | 363,021 | 59,149 | 10% increase in lapse rates | 458,735 | 57,534 | ||||||||||||||
| 10. | 10% decrease in lapse rates | 364,137 | 61,030 | 10% decrease in lapse rates | 459,777 | 59,902 | ||||||||||||||
| 11. | 10% increase in morbidity rates | 358,936 | 58,997 | 10% increase in morbidity rates | 452,934 | 56,483 | ||||||||||||||
| 12. | 10% decrease in morbidity rates | 368,448 | 61,235 | 10% decrease in morbidity rates | 465,808 | 60,925 | ||||||||||||||
| 13. | Using 2016 EV appraisal assumptions | 357,052 | 60,114 | Using 2018 EV appraisal assumptions | 458,961 | 59,483 | ||||||||||||||
| 14. | Allowing for diversification in calculation of VIF | 492,975 | — | |||||||||||||||||
Willis Towers Watson’s Review Opinion Report on Embedded Value
To The Directors of China Life Insurance Company Limited
China Life Insurance Company Limited (“China Life”) has prepared embedded value results as at December 31, December 20172019 (“EV Results”). The disclosure of these EV Results, together with a description of the methodology and assumptions that have been used, are shown in the Embedded Value section.
China Life has engaged Towers Watson Management Consulting (Shenzhen) Co. Ltd. Beijing Branch (“Willis Towers Watson”) to review its EV Results. This report is addressed solely to China Life in accordance with the terms of our engagement letter, and sets out the scope of our work and our conclusions. To the fullest extent permitted by applicable law, we do not accept or assume any responsibility, duty of care or liability to anyone other than China Life for or in connection with our review work, the opinions we have formed, or for any statement set forth in this report.
Scope of work
Our scope of work covered:
a review of the methodology used to develop the embedded value and value of one year’s sales as at December 31, December 2017,2019, in accordance with the “CAA Standards of Actuarial Practice: Appraisal of Embedded Value” issued by the China Association of Actuaries (“CAA”) in November 2016;;
a review of the economic and operating assumptions used to develop the embedded value and value of one year’s sales as at December 31, December 2017;2019; and
a review of the results of China Life’s calculation of the EV Results.
In carrying out our review, we have relied on the accuracy of audited and unaudited data and information provided by China Life.
Opinion
Based on the scope of work above, we have concluded that:
the embedded value methodology used by China Life is in accordance with the “CAA Standards of Actuarial Practice: Appraisal of Embedded Value” issued by the CAA;
the economic assumptions used by China Life are internally consistent, have been set with regard to current economic conditions, and have made allowance for the company’s current and expected future asset mix and investment strategy;
the operating assumptions used by China Life have been set with appropriate regard to past, current and expected future experience; and
the EV Results have been prepared, in all material respects, in accordance with the methodology and assumptions set out in the Embedded Value section.
For and on behalf of Willis Towers Watson
Michael Freeman Benjamin ChenLingde Hong Victoria Xie
22 March 201825, 2020
ITEM 9. THE OFFER AND LISTING.
In connection with our initial public offering, our American depositary shares, or ADSs, each representing 40 H shares, were listed and commenced trading on New York Stock Exchange on December 17, 2003 under the symbol “LFC”. Our H shares were listed and commenced trading on the Hong Kong Stock Exchange on December 18, 2003 under the stock code “2628”. Prior to these listings, there was no public market for our equity securities. The New York Stock Exchange and the Hong Kong Stock Exchange are the principal trading markets for our ADSs and H shares, which are not listed on any other exchanges in or outside the United States.
On December 29, 2006, the ratio of ADSs to H shares was reduced from 40 H shares to 15 H shares. On May 26, 2015, the ratio of ADSs to H shares was further reduced from 15 H shares to 5 H shares. Our A shares were listed and commenced trading on the Shanghai Stock Exchange on January 9, 2007 under the stock code “601628”.
The high and low closing sale prices of the H shares on the HKSE, the ADSs on the NYSE and the A shares on the SSE for the periods indicated are as follows(1):
| Price per H Share (HK$) | Price per ADS (2) (US$) | Price per A share (RMB) | ||||||||||||||||||||||
| High | Low | High | Low | High | Low | |||||||||||||||||||
Annual | ||||||||||||||||||||||||
2013 | 27.2000 | 17.5000 | 52.62 | 34.27 | 21.9200 | 12.9100 | ||||||||||||||||||
2014 | 30.5000 | 19.7800 | 58.84 | 38.59 | 34.1500 | 13.0700 | ||||||||||||||||||
2015 | 40.0000 | 24.3000 | 78.53 | 15.14 | 41.1900 | 21.3500 | ||||||||||||||||||
2016 | 23.8000 | 16.2800 | 15.22 | 10.23 | 26.9200 | 19.6600 | ||||||||||||||||||
2017 | 27.7000 | 20.6000 | 17.76 | 13.29 | 34.7000 | 23.8100 | ||||||||||||||||||
Quarterly | ||||||||||||||||||||||||
First Quarter, 2016 | 23.8000 | 16.3200 | 15.22 | 10.33 | 26.9200 | 19.6600 | ||||||||||||||||||
Second Quarter, 2016 | 19.7400 | 16.2800 | 12.89 | 10.23 | 24.0400 | 20.2600 | ||||||||||||||||||
Third Quarter, 2016 | 21.5000 | 16.3200 | 13.83 | 10.51 | 22.4000 | 20.5700 | ||||||||||||||||||
Fourth Quarter, 2016 | 22.7000 | 19.0600 | 14.63 | 12.22 | 26.2200 | 21.3100 | ||||||||||||||||||
First Quarter, 2017 | 25.2000 | 20.6000 | 16.23 | 13.29 | 26.8600 | 24.4300 | ||||||||||||||||||
Second Quarter, 2017 | 25.6000 | 22.5000 | 16.51 | 14.33 | 29.0000 | 23.8100 | ||||||||||||||||||
Third Quarter, 2017 | 25.8000 | 23.1500 | 16.53 | 14.82 | 30.0100 | 26.7200 | ||||||||||||||||||
Fourth Quarter, 2017 | 27.7000 | 23.7500 | 17.76 | 15.08 | 34.7000 | 27.4000 | ||||||||||||||||||
First Quarter, 2018 | 26.9500 | 21.6000 | 17.21 | 13.83 | 31.9500 | 25.4100 | ||||||||||||||||||
Monthly | ||||||||||||||||||||||||
October 2017 | 25.8000 | 23.7500 | 16.67 | 15.08 | 31.4000 | 27.4000 | ||||||||||||||||||
November 2017 | 27.7000 | 25.3500 | 17.76 | 16.36 | 34.7000 | 30.9800 | ||||||||||||||||||
December 2017 | 25.4500 | 23.9500 | 16.12 | 15.38 | 32.1900 | 30.1400 | ||||||||||||||||||
January 2018 | 26.9500 | 24.3500 | 17.21 | 15.55 | 31.8300 | 29.6500 | ||||||||||||||||||
February 2018 | 26.5500 | 22.7500 | 16.65 | 14.60 | 31.9500 | 26.2300 | ||||||||||||||||||
March 2018 | 23.5000 | 21.6000 | 14.98 | 13.83 | 27.5600 | 25.4100 | ||||||||||||||||||
April 2018 (through April 18, 2018) | 22.0500 | 21.2500 | 14.04 | 13.55 | 25.7500 | 24.1100 | ||||||||||||||||||
ITEM 10. ADDITIONAL INFORMATION.
Not applicable.
The following is a brief summary of certain provisions of our current articles of association, the PRC company law and certain other laws and regulations applicable to us. Such summary is not purported to be complete. For further information, you should refer to the full text of our articles of association and to the texts of applicable laws and regulations.
Objects and Purposes
We are organized under the PRC company law as a joint stock company. We are registered with the SAIC in Beijing ChinaAdministration for Market Regulation and our business license carries theunified social credit registration number 100000000037965.is 9110000071092841XX.
Our business scope, set forth in Article 1012 of our articles of association, is to engage in life, accident and health insurance businesses; reinsurance business relating to the foregoing; fund investment businesses authorized by laws, regulations or the State Council; agency business, consulting business and provision of services, in each case relating to life insurance; securities investment fund sales business; and other business as approved by the insurance regulatory authority of the PRC.
Sources of Shareholders’ Rights
The primary sources of shareholders’ rights are the PRC company law, our articles of association, Special Rules applicable to overseas listed joint stock companies promulgated by the State Council, or Special Rules, relevant CSRC regulations, the Shanghai Stock Exchange Listing Rules,and the Hong Kong Stock Exchange Listing Rules that, among other things, impose certain standards of conduct, fairness and disclosure on us, our directors and CLIC, our controlling shareholder. The PRC company law was enacted in December 1993 and serves as the primary body of law regulating corporate actions of companies organized in the PRC and its directors and shareholders.
Our articles of association have incorporated the provisions set forth in the Mandatory Provisions for the Articles of Association of Companies Listed Overseas, or the Mandatory Provisions, adopted in 1994 pursuant to the requirements of the CSRC and the provisions set forth in the Guidelines on the Articles of Association of Listed Companies, or the Guidelines, as amended in 20142019 by the CSRC. Any amendment to the relevant mandatory provisions will only become effective after approval by the relevant governmental departments authorized by the State Council and the CSRC. The Hong Kong Stock Exchange Listing Rules require a number of provisions in addition to the Mandatory Provisions to be included in our articles of association.
According to the HKSE Listing Rules, we may not amend certain provisions of our articles of association that have been mandated by the Hong Kong Stock Exchange. These provisions include, among others:
varying the rights of existing classes of shares;
voting rights;
rights of minority shareholders; and
liquidation procedures.
In addition, upon the listing of the H shares and for so long as the H shares are listed on the Hong Kong Stock Exchange, we are subject to the relevant ordinances, rules and regulations applicable to companies listed on the Hong Kong Stock Exchange, including, among other things, the Hong Kong Stock Exchange Listing Rules, the Securities and Futures Ordinance and the Hong Kong Codes on Takeovers and Mergers and Share Repurchases.
Unless otherwise specified, all rights, obligations and protections discussed below are derived from our articles of association and the PRC company law.
Enforceability of Shareholders’ Rights
Enforceability of our shareholders’ rights may be limited.
In accordance with the rules applicable to Chinese overseas listed companies, our articles of association provide that, with certain limited exceptions, all disputes or claims based on our articles of association, the PRC company law or other relevant laws or administrative rules, and concerning matters between holders of H shares and holders of A shares, us, or our directors, supervisors, president, vice presidents or other senior officers, must be submitted for arbitration at either the China International Economic and Trade Arbitration Commission or the Hong Kong International Arbitration Center. If an applicant chooses to have the dispute arbitrated at the Hong Kong International Arbitration Center, either party may request that venue be changed to Shenzhen, a city in mainland China near Hong Kong. The governing law for the above-mentioned disputes or claims is Chinese law unless otherwise provided by Chinese law. Any such arbitration will be final and conclusive.
In June 1999, an arrangement was made between the People’s Courts of the PRC and the courts of Hong Kong for mutual enforcement of arbitration rewards rendered in the PRC and Hong Kong according to their respective laws. This arrangement was approved by the Supreme Court of the PRC and the Hong Kong Legislative Council and became effective on February 1, 2000.
There has not been any published report of judicial enforcement in the PRC by H shareholders of their rights under charter documents of PRC joint stock companies or the PRC company law or in the application or interpretation of the PRC or Hong Kong regulatory provisions applicable to PRC joint stock companies.
The PRC company law allows shareholders to sue, on behalf of the corporation, against persons, including corporate officers, directors, who have allegedly wronged the corporation, where the corporation itself has failed to enforce such claim against such persons directly. Class action lawsuits based on violations of securities laws are generally not available. In accordance with the amended PRC Securities Law which came into effect in March 2020, in civil lawsuits based on violations of securities law including making false statements, if the subject matter of the lawsuits is the same and there are a sufficient number of plaintiffs, a representative can be selected to sue on behalf of them.
We are subject to the Hong Kong Exchange Listing Rules, the Hong Kong Securities and Futures Ordinance, or Securities and Futures Ordinance, and the Hong Kong Codes on Takeovers and Mergers and Share Repurchases. However, holders of H shares will not be able to bring actions on the basis of violations of the Hong Kong Stock Exchange Listing Rules and must instead rely on the Hong Kong Stock Exchange to enforce its rules. The Hong Kong Codes on Takeovers and Mergers and Share Repurchases do not have the force of law and are only standards of commercial conduct considered acceptable for takeover and merger transactions and share repurchases in Hong Kong as established by the Securities and Futures Commission of Hong Kong and the securities and futures industry in Hong Kong. The Securities and Futures Ordinance establishes various obligations in relation to disclosure of shareholders’ interests in Hong Kong listed companies, the violation of which is subject to prosecution by the Securities and Futures Commission of Hong Kong.
See “Item 3. Key Information—Risk Factors—Risks Relating to the People’s Republic of China—The laws in China differ from the laws in the United States and may afford less protection to our minority shareholders” and “Item 3. Key Information—Risk Factors—Risks Relating to the People’s Republic of China—You may experience difficulties in effecting service of legal process, enforcing foreign judgments or bringing original actions in the PRC based on U.S. or other foreign laws against us, our management and some of the experts named in the annual report”.
Dividends
Our board of directors may propose dividend distributions. A distribution of dividends for any fiscal year is subject to shareholders’ approval. Dividends may be distributed in the form of cash or shares or a combination of both. The H shares rank equally with A shares with regard to dividend rights. A distribution of shares must be approved by special resolution of the shareholders’ meeting.
We may only distribute dividends after allowance has been made for:
recovery of accumulated losses, if any;
allocations to the statutory common reserve fund equivalent to 10% of ourafter-tax profits;
allocations to the general risks reserve fund equivalent to 10% of ourafter-tax profits, as determined under PRC GAAP; and
allocations to a discretionary common reserve fund as approved by the shareholders in a shareholders’ meeting.
Under Chinese law, dividends may be paid only out of distributable profits. Any distributable profits that are not distributed in a given year are retained and available for distribution in subsequent years. However, we will ordinarily not pay any dividends in a year when we do not have any distributable profits.
Payment of dividends by us is also regulated by the PRC insurance law. If we do not meet the solvency margin required by the CBIRC, (formerly CIRC), we will be prohibited from paying dividends. See “Item 4. Information on the Company—Business Overview—Regulation and Related Matters—Insurance Company Regulation—Solvency requirements”.
Our articles of association require us to appoint, on behalf of the holders of H shares, a receiving agent that is registered as a trust corporation under the Trustee Ordinance of Hong Kong to receive dividends declared by us in respect of the H shares on behalf of such shareholders. Our articles of association require that cash dividends in respect of H shares be declared in Renminbi and paid by us in Hong Kong dollars. The depositary will convert these proceeds into U.S. dollars and will remit the converted proceeds to holders of our ADSs.
Subject to the requirements under applicable PRC laws and rules of the securities regulatory authorities of the PRC, Hong Kong and United States, we may exercise the power to forfeit unclaimed dividends, provided that such power cannot be exercised until after the expiration of applicable limitation period.
We anticipate that our controlling shareholder, CLIC, may incur future operating losses arising in part from the runoff of policies retained by it in connection with the restructuring. Dividends received from us may become one of CLIC’s principal means of funding these losses.Although we believe that the reserves held by CLIC and other financial resources available to it will fund substantially all of any future operating shortfalls arising out of these policies, which should reduce CLIC’s reliance on dividends from us, subject to the relevant provisions of the PRC company law and our articles of association as described above and in “Item 8. Financial Information—Consolidated Financial Statements and Other Financial Information—Policy on Dividend Distributions”, CLIC may seek to increase the amount of dividends we pay in order to satisfy its cash flow requirements. See “Item 3. Key Information—Risk Factors—Risks Relating to the Restructuring”.
Dividend payments may be subject to Chinese withholding tax. See “—Taxation—The People’s Republic of China—Taxation of Dividends”.
Voting Rights and Shareholders’ Meetings
Our board of directors will convene a shareholders’ annual general meeting once every year within six months from the end of the preceding fiscal year. Our board of directors must convene an interim meeting within two months of the occurrence of any of the following events:
where the number of directors is less than the number stipulated in the PRC company law ortwo-thirds of the number specified in our articles of association;
where our unrecovered losses reachone-third of the total amount of our share capital;
where shareholders, individually or jointly, holding 10% or more of our issued and outstanding voting shares so request in writing;
whenever our board of directors deems necessary, or more than half of directors (including at least two independent directors) or our board of supervisors so requests; or
any other event as maybe provided by applicable laws, rules, regulations or our articles of association.
All shareholders’ meetings must be convened by our board of directors by written notice given to shareholders no less than 45 days before the meeting. Shareholders holding at leastone-half of our total voting shares will constitute a quorum for a shareholders’ meeting. If a quorum is not reached, we are required to notify our shareholders within five days by public announcement of the agenda, the date and the venue of the adjourned meeting. After the notice, we may conduct the shareholders’ meeting. The accidental omission by us to give notice of a meeting to, or thenon-receipt of notice of a meeting by, a shareholder will not invalidate the proceedings at that shareholders’ meeting.
Shareholders at meetings have the power, among other matters, to approve or reject our profit distribution plans, annual budget, financial statements, increases or decreases in share capital, issuances of debentures, mergers, liquidation, any equity-based incentive plan and any amendment to our articles of association. In addition, the rights of a class of shareholders may not be modified or abrogated, unless approved by a special resolution of shareholders at a general shareholders’ meeting and by a special resolution of shareholders of that class of shares at a separate meeting. Our articles of association enumerate various amendments which would be deemed to be a modification or abrogation of the rights of a class of shareholders, including, among others, increasing or decreasing the number of shares of a class disproportionate to increases or decreases of other classes of shares, removing or reducing rights to receive dividends in a particular currency or creating shares with voting or equity rights superior to those of shares of that class. There are no restrictions under PRC law or our articles of association on the ability of investors that are not Chinese residents to hold H shares and exercise voting rights, except that holders of H shares are unable to vote online and the prior approval of the CBIRC (formerly CIRC) is required in respect of any acquisition which results in the acquirer holding more than 5% of the outstanding share capital of our company and the other restrictions set out under “Item 4. Information on the Company—Business Overview—Regulatory and Related Matters—Insurance Company Regulation—Restriction of ownership in joint stock insurance companies”.
Each of our ordinary shares, whether it be an A share or an H share, is entitled to one vote on all matters submitted for vote at all shareholders’ meetings, except for meetings of a special class of shareholders where only holders of shares of the affected class are entitled to vote on the basis of one vote per share of the affected class.
Shareholders are entitled to attend and vote at meetings either in person or by proxy. Proxies must be in writing and deposited at our legal address or such other place as is specified in the meeting notice, no less than 24 hours before the time for holding the meeting at which the proxy proposes to vote or the time appointed for the passing of the relevant resolution.
Resolutions on any of the following matters must be approved by more thantwo-thirds of the voting rights held by shareholders who are present in person or by proxy:
an increase or decrease in our share capital or the issuance of shares, warrants, debentures and other similar securities;
our division, merger, dissolution or liquidation (shareholders who object to a proposed merger are entitled to demand that either we or the shareholders who approved the merger purchase their shares at a fair price);
amendments to our articles of association;
purchase or sale within any single year of any material assets exceeding 30% of our latest audited total assets;
any equity-based incentive plan; and
any other matters as provided under applicable laws or regulations or determined by a majority of shareholders at a general meeting to have a material impact on us and should be approved bytwo-thirds of the voting rights.
An amendment of shareholders’ rights of any class of shares must be approved by more thantwo-thirds of the voting rights held by holders of shares in the affected class who are present in person or by proxy.
All other actions taken by the shareholders will be approved by a majority of the voting rights held by shareholders who are present in person or by proxy at the shareholders’ meeting.
Any shareholder resolution that is in violation of any laws or regulations of China or the articles of association will be null and void.
Liquidation Rights
We are organized as a joint stock company with limited liability of indefinite duration, butand we must passsubmit our annual report to the annual inspection with the SAIC.SAMR. In the event of our liquidation, the H shares will rank equally with the A shares, and payment of debts out of our remaining assets is required to be made in the order of priority prescribed by applicable laws and regulations or, if no such standards exist, in accordance with such procedures as the liquidation committee that has been appointed either by us or the People’s Courts of China may consider to be fair and reasonable. After payment of debts, we are required to distribute the remaining property to shareholders in proportion to the number of shares they hold.
Information Rights
Our shareholders may, subject to reasonable fees and costs, obtain a copy of our articles of association and inspect and copy all parts of our register of shareholders, personal particulars of the directors, supervisors, president and other senior officers, reports on the state of our share capital, reports showing the aggregate par value, highest and lowest price paid in respect of each class of shares repurchased by us since the end of the last accounting year and the aggregate amount paid by us for this purpose, minutes of shareholders’ general meetings, and counterfoils of company debt securities, resolutions of board meetings, resolutions of board of supervisors.
Our fiscal year is the calendar year ending December 31. We must send to holders of H shares, no more than four months after the end of the relevant financial year, our annual report (including our annual accounts, together with a copy of the auditors’ report thereon). Further, we must publish a preliminary results announcement no later than three months after the end of the relevant fiscal year. The results announcement in respect of the relevant financial year is required to be published on the HKSE’s website no later than the time that is 30 minutes before the earlier of the commencement of the morning trading session or anypre-opening session on the next business day after approval by or on behalf of our board of directors. These and any interim financial statements must be prepared in accordance with HKFRS, IFRS or PRC GAAP in the case of a PRC issuer that has adopted PRC GAAP for the preparation of its annual financial statements. The annual financial statements must be approved by a majority of our shareholders who are present in person or by proxy at the annual general meeting.
The HKSE Listing Rules also require us to send to holders of H shares an interim report no later than three months after the end of the first six months of each fiscal year. Further, we must publish a preliminary results announcement no later than two months after the end of thesix-month period. The results announcement in respect of the relevantsix-month period is required to be published on the HKSE’s website no later than the time that is 30 minutes before the earlier of the commencement of the morning trading session or anypre-opening session on the next business day after approval by or on behalf of our board of directors.
According to the HKSE Listing Rules, where in the view of the HKSE there is or there is likely to be a false market in our securities, we must, as soon as reasonably practicable after consultation with the HKSE, announce the information necessary to avoid a false market in our securities. In addition, according to the provisions of inside information under the Securities and Futures Ordinance of Hong Kong, we must, as soon as reasonably practicable after any inside information has come to our knowledge, disclose the information to the public. Inside information, in relation to a listed corporation, means specific information that—
is not generally known to the persons who are accustomed or would be likely to deal in the listed securities of the corporation but would if generally known to them be likely to materially affect the price of the listed securities.
Depending on the size of the transaction, we may also be required to disclose to the public and our shareholders details of various acquisitions or disposals of assets and other transactions (including transactions with controlling shareholders).
Restrictions on Transferability and the Share Register
Unless otherwise permitted by relevant PRC rules or regulations or approved by relevant PRC authorities, H shares may be traded only among investors who are legal or natural persons resident outside of China, and may not be sold to investors resident within the PRC. There are no restrictions under PRC law or our articles of association on the ability of investors who are not PRC residents to hold H shares. However, under relevant PRC law, a legal person resident outside of China is only allowed to hold not more than 20% of our issued share capital and legal persons resident outside of China are only allowed to hold in aggregate not more than 25% of our issued share capital, unless otherwise approved by competent authorities.
We are required to keep a register of our shareholders comprised of various parts, including one part which is to be maintained in Hong Kong in relation to holders of H shares. Shareholders have the right to inspect and, for a reasonable charge, to copy the share register. No transfers of ordinary shares will be recorded in our share register within thirty days prior to the date of a shareholders’ general meeting or within five days prior to the record date established for the purpose of distributing a dividend.
We have appointed Computershare Hong Kong Investor Services Limited to act as the registrar of our H shares. This registrar maintains our register of holders of H shares and enters transfers of H shares in such register upon the presentation of the documents described above.
Increases in Share Capital
Under our articles of association, issuance of new securities, including ordinary shares, securities convertible into ordinary shares, options, warrants or similar rights to subscribe for any ordinary shares or convertible securities, must be approved by at leasttwo-thirds of the shareholders who attend the shareholders meeting in person or by proxy. In addition, the issuance of A shares or H shares must be approved bytwo-thirds of the class of domestic shares or H shares, as the case may be, unless the number of shares to be issued shall not exceed 20% of the number of shares of the same class then outstanding in any12-month period.
A special resolution was passed at the shareholders’ annual general meeting held on May 31, 201730, 2019 to authorize our board of directors to issue additional shares, and amend the articles of association accordingly, in a nominal amount of no more than 20% of the aggregate nominal amount of our H shares in issue as at the date of such resolution, by the conclusion of next shareholders’ annual general meeting, or the expiration of the12-month period following the passing of this resolution, or the date on which the resolution is otherwise revised or revoked by a special resolution of our shareholders, whichever is the earliest.
Shareholders are not liable to make any further contribution to the share capital other than according to the terms that were agreed upon by the subscriber of the relevant shares at the time of subscription. New issues of shares must also be approved by relevant Chinese authorities.
Decreases in Share Capital and Repurchases
We may reduce our registered share capital only upon obtaining the approval of at leasttwo-thirds of the shareholders who attend the shareholders meeting in person or by proxy and, in certain circumstances, of relevant Chinese authorities. The number of H shares that may be repurchased is subject to the Hong Kong Codes on Takeovers and Mergers and Share Repurchases.
Restrictions on Ownership
Equity interests held by a single shareholder, including its related parties and persons acting in concert, must not exceedone-third of the registered capital of a single insurance company. An exception to theone-third cap applies to insurance companies establishing or investing in other insurance companies for the purposes of innovation and specialization of their business, or consolidating their operations under a single group management. See “Item 4. Information on the Company—Business Overview—Regulation and Related Matters—Insurance Company Regulation—Restriction of ownership in joint stock insurance companies”.
Restrictions on Large or Controlling Shareholders
Our articles of association define a controlling shareholder as any person who acting alone or in concert with others:
is in a position to elect more thanone-half of the board of directors;
has the power to exercise, or to control the exercise of, 30% or more of our voting rights;
holds 30% or more of our issued and outstanding shares; or
has de facto control of us in any other way.
As of the date of this annual report, CLIC, a wholly state-owned enterprise, is our only controlling shareholder.
Our articles of association provide that, in addition to any obligation imposed by laws and administrative regulations or required by the Hong Kong Stock Exchange Listing Rules, a controlling shareholder shall not exercise its voting rights in a manner prejudicial to the interests of other shareholders:
to relieve a director or supervisor from his or her duty to act honestly in our best interests;
to approve the appropriation by a director or supervisor, for his or her own benefit or for the benefit of any other person, of our assets in any way, including without limitation opportunities which may be advantageous to us; or
to approve the appropriation by a director or supervisor, for his or her own benefit or for the benefit of another person, of the individual rights of other shareholders, including without limitation rights to distributions and voting rights (except in accordance with a restructuring of our company which has been approved by the shareholders at a general meeting in accordance with our articles of association).
Our articles of association also provide that a controlling shareholder or an actual controlling person shall not exploit its affiliated relation in a manner prejudicial to the interest of our company, and shall be liable for any losses suffered by us as a result thereof. The controlling shareholder or actual controlling person shall have fiduciary duties to both our company and our public shareholders. The controlling shareholder shall exercise its rights as a capital contributor of our company in strict compliance with the law. The controlling shareholder shall not cause any damage to the lawful rights and interest of our company and our public shareholders through, among others, any connected transactions, profit distribution, asset restructuring, external investment, fund appropriation and loan guarantee, or impair the interest of our company and our public shareholders through its controlling position.
Board of Directors
Ournon-employee directors are elected by our shareholders at shareholders’ general meetings, and employee directors are elected by our employees or other democratic means at the employee representative conference. Directors are elected for a term of three years and may serve consecutive terms ifre-elected.
Article 23 of Special Regulations on the Overseas Offering and Listing of Shares by Joint Stock Limited Companies provides that directors, supervisors, and senior officers of a company owe duties of honesty, care and diligence to their company.
Our articles of association provide that, in exercising their duties and powers, our directors, supervisors and senior officers will act with the care, diligence and skills that are expected of a reasonable person under similar circumstances, observe fiduciary principles and not place themselves in a situation where their interests conflict with the duties they are charged with performing. In addition to these fiduciary duties to our company, each director, supervisor and officer is obligated to each shareholder:
to act honestly in our company’s best interests;
not to exploit corporate assets for personal gains; and
not to expropriate the rights of our shareholders.
If directors, supervisors or officers are found to have misappropriated our company’s assets or misused their position for personal gain, the PRC company law provides that any misappropriated or misused property be returned and any illegal proceeds received by such director, supervisor or officer be confiscated, and allows us to impose punishment on them. In serious cases, criminal liability may also be imposed. According to our articles of association, our shareholders may bring a derivative suit against any director, supervisor or officer who has breached his fiduciary duties. Most disputes between H shareholders and directors, supervisors and officers are required to be resolved by final and binding arbitration.
Moreover, our articles of association provide that our directors, supervisors and senior officers must not enter into transactions or contracts with us or agree to make corporate loans to any persons or provide guarantees for loans of any shareholder or any other person with corporate assets. In particular, our directors, supervisors and senior officers have obligations to disclose to the board of directors any direct or indirect material interest they may have in any contracts or transactions with us. They may not vote on any contracts, transactions or arrangements in which they have any material interest. Further, we may not make loans or provide guarantees to directors, supervisors or senior officers, unless such loans or guarantees are approved at a shareholders’ meeting or made in the ordinary course of business and to the extent permitted by applicable laws. All decisions relating to the compensation of directors are made at shareholders’ meetings.
There are no provisions under our articles of association or PRC law which relate to:
the retirement ornon-retirement of directors under any age limit requirement;
directors’ borrowing power; or
number of shares required for directors’ qualification.
Subject to all relevant laws and administrative regulations, the shareholders may remove any director before the expiration of his or her term of office by a majority vote of the shareholders present in person or by proxy at shareholders’ general meetings. A director, supervisor, president, vice president or other senior officer may be relieved of liability for a specific breach of his or her duties by the consent of shareholders so long as specified conditions are met.
Board of Supervisors
Our board of supervisors consists of five supervisors. At leastone-third of our board of supervisors must be employee representatives elected by our employees. The remaining members must be elected by our shareholders in a general meeting. One member of our board of supervisors is designated as the chairman. Members of the board of supervisors may not serve as director, president, vice president or other senior management of our company. The term of office for our supervisors is three years, which is renewable uponre-election.
The primary duty of the board of supervisors is to monitor our financial matters and management. The board of supervisors’ powers are generally limited to carrying out investigations and reporting to shareholders, the China Securities Regulatory Commission and other relevant governmental authorities having jurisdiction over our affairs and to convening shareholders’ interim meetings. Reasonable expenses incurred by the board of supervisors in carrying out its duties will be paid by us.
Our supervisors owe fiduciary duties to our company and our shareholders. Please see the discussion of the duties and the nature of recourse our shareholders may have against supervisors in breach of these duties in the subsection entitled “—Board of Directors”.
The board of supervisors is accountable, and will report, to the shareholders at the shareholders’ general meetings.
Certain Differences Between PRC Company Law and Delaware Corporate Law
The PRC company law and other laws applicable to us differ in a number of respects from laws generally applicable to United States corporations and their shareholders. The description set forth below includes a summary of certain provisions of the PRC company law, Special Rules, Mandatory Provisions and the Guidelines applicable to companies listed both in the PRC and overseas, such as us, which differ from provisions of the corporate law of the State of Delaware.
General
We are a PRC joint stock company, which is a corporate entity organized under the PRC company law. Under the PRC company law, the registered capital of a joint stock company is divided into shares of equal par value. These shares are commonly called domestic ordinary shares. Each share of a joint stock company ranks equally with all other shares in its class as to voting rights (except for specified class voting rights) and rights to dividends and other distributions. Upon receiving approval from the relevant authorities, a joint stock company may offer its shares for sale to the public and seek to be listed on a stock exchange. The State Council may formulate separate regulations for the issuance of other classes of shares, including H shares. All of our issued shares are fully paid and nonassessable. Holders of H shares may transfer their shares without the approval of other shareholders. Among other things, a joint stock company must have (1) a board of directors of not fewer than five and not more than 19 members, and (2) a board of supervisors of not fewer than three members.
The shareholders’ meeting of a joint stock company is the highest authority of the company and exercises the powers of the company with respect to significant matters, subject to applicable law and the articles of association of the company. The business of a joint stock company is under the overall management of a board of directors, subject to the PRC company law, other applicable laws and regulations (which in our case include the PRC insurance law and regulations), the company’s articles of association and duly adopted resolutions of its shareholders. Theday-to-day operations of a joint stock company are under the direction of its general manager or president, subject to applicable laws and regulations, the company’s articles of association and duly adopted resolutions of the directors and shareholders. In addition, the PRC company law provides for the establishment of a board of supervisors for each joint stock company. The supervisors perform and exercise the functions and powers described below, including examination of the joint stock company’s affairs and monitoring the actions of the directors and officers of the company. The directors, supervisors and officers are not required to hold any qualifying shares in the joint stock company.
A joint stock company may be liquidated involuntarily due to insolvency or voluntarily in accordance with the terms of its articles of association or duly adopted shareholders’ resolutions. The property of a joint stock company remaining after full payment of its liquidation expenses, wages, labor insurance premiums of its employees and statutory compensations, outstanding taxes and debts, is distributed in proportion to the holdings of its shareholders.
Meetings of shareholders
Under PRC law, shareholders are given the power to approve specified matters. See “—Voting Rights and Shareholders’ Meetings”. In addition, the Mandatory Provisions provide that at shareholders’ meetings shareholders are entitled to consider any proposals made by shareholders holding in the aggregate at least 3% of voting power over the company’s shares. These proposals must fall within the scope of powers of the shareholder’s meeting, have a clear agenda and specific matters and comply with laws, administrative regulations and articles of association of the company.
Under Delaware law, the business and affairs of a Delaware corporation are, in general, managed by or under the direction of its board of directors. Only certain fundamental matters regarding the corporation are reserved by statute to be exercised by the shareholders. These matters include, in general, election or removal of directors, retention or dismissal of the corporation’s independent auditors, mergers or other business combinations involving the corporation, amendment of the corporation’s certificate of incorporation and liquidation or dissolution of the corporation.
Shareholders’ approval by written consent
PRC law does not provide shareholders of overseas listed joint stock companies with rights to approve corporate matters by written consent. Under Delaware law, unless otherwise provided in the certificate of incorporation, any action which is required or permitted to be taken at any shareholders’ meeting may be taken without a meeting, subject to various conditions.
Amendments of articles of association
Under PRC law, an amendment of the articles of association must be approved by an affirmative vote oftwo-thirds of shareholders attending a shareholders’ meeting. Amendments with respect to the Mandatory Provisions only become effective after approval by the relevant governmental department authorized by the State Council and the China Securities Regulatory Commission.
Under Delaware law, with certain exceptions, shareholder approvals must be obtained for any amendment to the certificate of incorporation. Board approvals are also required for any amendment to the certificate of incorporation, but no governmental approval is generally required.
Powers and responsibilities of directors
Under PRC law, the board of directors is responsible for specified actions, including the following functions and powers of a joint stock company:
convening shareholders’ meetings and reporting its work to shareholders at these meetings;
implementing shareholders’ resolutions;
determining the company’s business plans and investment proposals;
formulating the company’s annual financial budgets and final accounts;
formulating the company’s profit distribution plans and loss recovery plans;
formulating proposals for the increase or decrease in the company’s registered capital and the issue of debentures;
formulating major acquisition and disposal plans and plans for the merger, division or dissolution of the company;
to the extent authorized by the shareholders’ meeting, deciding on such matters as external investments, purchase or sale of assets, assets pledge and connected transactions of the company;
deciding on the company’s internal management structure and formulating its basic management system; and
appointing or removing the company’s principal executive officers; appointing and removing other senior officers based on the recommendation of the principal executive officer and deciding on the remuneration of the senior officers.
In addition, the Mandatory Provisions provide that the board has the authority to formulate any proposal to amend the articles of association and to exercise any other power conferred by a decision of the shareholders’ meeting.
Under Delaware law, the business and affairs of a Delaware corporation are managed by or under the direction of its board of directors. Their powers include fixing the remuneration of directors, except as otherwise provided by statute or in the certificate of incorporation orby-laws of the corporation.
Powers and responsibilities of supervisors
Under PRC law, a PRC joint stock company must have a board of supervisors consisting of shareholder representatives and one or more employee representatives. Supervisors attend board meetings asnon-voting observers. Directors, officers and company personnel in charge of financial matters may not serve as supervisors. The supervisors perform and exercise the following functions and powers:
examining the company’s financial affairs;
monitoring compliance with laws, regulations, the articles of association of the company and the shareholders resolutions by the directors and officers of the company; and suggesting removing the directors and officers who violate these laws and regulations;
requiring corrective action from directors and officers whose actions are contrary to the interests of the company;
examining the financial information, including financial statements, operation reports and plans for profit distribution, to be submitted by the board of directors to the shareholders’ meetings; and authorizing, in the company’s name, public certified accountants or licensed auditors to assist in there-examination of such information, should any doubt arise in respect thereof;
proposing the holding of extraordinary shareholders’ meetings;
proposing new items to be inserted in the agenda of the shareholders’ meeting;
bringing lawsuits against directors or members of senior management, if they violate laws, regulations or articles of association of the company; and
exercising and performing other powers and functions provided for in the company’s articles of association.
In addition, the Mandatory Provisions provide that supervisors of overseas listed joint stock companies are entitled to retain auditors in the name of the company to examine any financial or business reports or profit distribution proposals to be submitted by the directors to a meeting of the shareholders which the supervisors consider questionable, and negotiate or take legal action against any director or the directors in the name of the company. The fees and expenses of attorneys and other professionals incurred by the supervisors in connection with the discharge of their duties are to be paid by the company.
Delaware law makes no provision for a comparable corporate institution.
Duties of directors, supervisors and officers
Under PRC law, directors, supervisors and officers of a joint stock company are required to comply with relevant laws and regulations and the company’s articles of association. A director, supervisor or officer who contravenes any law, regulation or the company’s articles of association in the performance of his duties shall be personally liable to the company for any loss incurred by the company. Directors, supervisors and officers are required to carry out their duties honestly and diligently, and protect the interests of the company. They are also under a duty of confidentiality to the company and prohibited from divulging confidential information concerning the company, except as permitted by relevant laws and regulations or by a decision of a shareholders’ meeting. They may not use their position and authority in the company to seek personal gain. Directors and officers may not directly or indirectly engage in the same business as the company or in any other business detrimental to the interests of the company, and they are required to forfeit any profits from these activities to the company.
Under Delaware law, the business and affairs of a corporation are managed by or under the direction of its board of directors. In exercising their powers, directors are charged with a fiduciary duty of care to protect the interests of the corporation and a fiduciary duty of loyalty to act in the best interests of its shareholders.
Limitations on transactions with interested directors, supervisors and officers
Under PRC law, directors and officers of a joint stock company may not enter into any contracts or transactions with the company unless permitted by the articles of association or approved by the shareholders. A company may not provide any guarantees to shareholders or any de facto control person of the company unless such guarantees are approved by a majority of shareholders present at the shareholders’ meeting, excluding the shareholder who will be provided such guarantees. Under the Mandatory Provisions, a director, supervisor or officer is required to disclose to the board any transaction with the company in which he has a direct or indirect interest or in which there is a material conflict of interest between the company and himself. A director is not entitled to vote or be counted for quorum purposes in any board decision on any such transaction. A company may set aside any interested transaction which did not comply with these requirements, unless the other party to such transaction was honestly unaware of the breach of obligations by the interested director, supervisor or officer. A company may not loan or provide any guarantees to directors, supervisors or officers (including persons related to them), except for the loans made in accordance with employment contracts approved by the shareholders, or unless the company’s business scope allows for the provision of loans and guarantees and such loans or guarantees are made under regular commercial terms.
Under Delaware law, an interested transaction is not voidable if (1) the material facts as to the interested director’s relationship or interests are disclosed or are known to the board of directors and the board in good faith authorizes the transaction by the affirmative vote of a majority of the disinterested directors, (2) such material facts are disclosed or are known to the shareholders entitled to vote on such transaction and the transaction is specifically approved in good faith by vote of the majority of shares entitled to vote thereon or (3) the transaction is fair as to the corporation as of the time it is authorized, approved or ratified. Under Delaware law, the interested director could be held liable for a transaction in which such a director derived an improper personal benefit.
Election and removal of directors
Under PRC law, the term of office of directors of a joint stock company must be specified in the articles of association, but may not exceed three years. Directors may bere-elected. No director may be removed from office without cause by shareholders prior to the expiration of the director’s term. PRC law does not contemplate a classified board of directors.
Under Delaware law, directors of a Delaware corporation can be removed from office with or without cause by the holders of a majority of shares then entitled to vote at an election of directors, provided that except where the certificate of incorporation of the Delaware corporation otherwise provides, a member of a classified board may be removed by shareholders only for cause, and in a corporation with cumulative voting, if less than all of the directors are removed, no director may be removed if the votes cast against the director’s removal is sufficient to elect the director if cumulatively voted at an election of directors. The Court of Chancery may remove a director who has been convicted of a felony or found by a court to have committed a breach of the duty of loyalty in connection with his or her duties to the corporation following application by the corporation or derivatively in the right of the corporation by any shareholder. The court may order the removal only if it determines that the director did not act in good faith in performing the acts resulting in the prior conviction or judgment and that removal is necessary to avoid irreparable harm to the corporation.
Dividend payments
Under PRC law, proposals for distribution of profits are formulated by the board of directors and submitted for shareholder approval at a shareholders’ meeting. Dividends may be distributed in the form of cash or shares.
Under Delaware law, the board of directors of a Delaware corporation may declare dividends out of distributable earnings and profits without the approval of the shareholders.
Amalgamations and business combinations; appraisal rights
Under PRC law, amalgamations and divisions involving joint stock companies are required to be approved by shareholders voting at a shareholders’ meeting. The Mandatory Provisions require an amalgamation or division involving the company to be approved by an affirmative vote oftwo-thirds of the votes present at the shareholders’ meeting called to consider the transaction. Any opposing shareholder may request the company or the consenting shareholders to purchase its shares at a fair price. In addition, a sale of fixed assets having a value exceeding 33% of the fixed assets as shown on the company’s latest balance sheet most recently reviewed by the shareholders’ meeting requires the approval of at least one third of the shareholders’ meeting.
Under Delaware law, with certain exceptions, a merger, consolidation or sale of all or substantially all the assets of a corporation must be approved by the board of directors and holders of a majority of the outstanding shares entitled to vote. A shareholder objecting to the merger is entitled to appraisal rights pursuant to which the shareholder may receive cash in the amount of the fair value of the shares held by such shareholder (as determined by a court) in lieu of the consideration the shareholder would otherwise receive in the transaction.
Transactions with significant shareholders
Under Delaware law, a business combination between a Delaware corporation and an interested shareholder which takes place at any time during a period of three years commencing with the date the interested shareholder became an interested shareholder would need prior approval from the board of directors or a supermajority of the shareholders of the corporation, unless the corporation opted out of the relevant Delaware business combination statute. Under Delaware law, an interested shareholder of a corporation is someone who, together with its affiliates and associates, owns more than 15% of the outstanding common shares of the corporation. No such business combination statute or regulation applies to PRC joint stock companies.
Shareholders’ lawsuits
The PRC law provides that most disputes involving an H shareholder are to be resolved by final and binding arbitration.
Class actions and derivative actions generally are available to shareholders under Delaware law for, among other things, breach of fiduciary duty, corporate waste and actions not taken in accordance with applicable law.
Limitations on liability and indemnification of directors and officers
PRC law does not provide for any specific limitations on liability or indemnification of directors and officers.
Under Delaware law, a corporation may indemnify a current director or officer of the corporation against expenses (including attorneys’ fees), judgments, fines and amounts paid in settlement actually and reasonably incurred in defense of an action, suit or proceeding by reason of such position if (1) the director or officer acted in good faith and in a manner he reasonably believed to be in or not opposed to the best interests of the corporation and (2) with respect to any criminal action or proceeding, the director or officer had no reasonable cause to believe that his conduct was unlawful.Persons serving at the request of the corporation as directors, officers, employees or agents of another entity such as a subsidiary or an employee stock trust may receive advancement of expenses from the corporation.A corporation may not retroactively impair or eliminate indemnification or advancement rights by amending the corporation’s certificate of incorporation or bylaws after the occurrence of the act or omission that gives rise to indemnification or advancement rights, unless the provision contains, at the time of the act or omission, an explicit authorization of such elimination or limitation.
Shareholders’ rights of inspection of corporate records
Under PRC law, shareholders are entitled to inspect the articles of association, register of shareholders, corporate bond counter foils, minutes of shareholders’ meetings and board meetings and reports of the financial accounts of the company. In addition, the Mandatory Provisions provide that, after paying reasonable fees, shareholders are entitled to inspect the company’s shareholder list, certain personal information on the directors, supervisors and officers, the company’s capital position and certain information regarding share repurchases conducted by the company during the most recent fiscal year.
Delaware law permits any shareholder of a Delaware corporation to examine or obtain copies of or extracts from the corporation’s shareholder list and its other books and records for any purpose reasonably related to such person’s interest as a shareholder.
See “Item 7. Major Shareholders and Related Party Transactions—Related Party Transactions” for certain arrangements we have entered into with CLIC, AMC, China Life Pension, CLPCIC, IHC, China Life Capital, China Life Wealth, CGB, AMP and Chongqing Trust.
The Renminbi currently is not a freely convertible currency. The SAFE, under the authority of the PBOC, controls the conversion of Renminbi into foreign currency. Until July 20, 2005, the PBOC had been setting and publishing daily a base exchange rate with reference primarily to the supply and demand of Renminbi against the U.S. dollar in the market during the prior day. The PBOC also took into account other factors, such as the general conditions existing in the international foreign exchange markets. From 1994 to July 20, 2005, the official exchange rate for the conversion of Renminbi to U.S. dollars was generally stable. On July 21, 2005, the PRC government introduced a managed floating exchange rate system to allow the value of the Renminbi to fluctuate within a regulated band based on market supply and demand and by reference to a basket of currencies. Under this system, the PBOC announces the closing price of a foreign currency traded against the Renminbi in the inter-bank foreign exchange market after the closing of the market on each working day, and makes it the central parity for the trading against the Renminbi on the following working day. On August 11, 2015, the PBOC adjusted the quotation mechanism of the Renminbi central parity to also consider demand and supply in foreign exchange markets and price movements of major currencies, in addition to the closing price on the previous working day. On May 26, 2017, the PBOC introduced the “counter-cyclical factor” into its formula that determines a central parity of the Renminbi against the U.S. dollar. Under the current mechanism, the central parity of the Renminbi against the U.S. dollar is determined based on the closing price, changes in a basket of currencies and the counter-cyclical factor. See “Item 3. Key Information—Risk Factors—Risks Relating to the People’s Republic of China—Government control of currency conversion and the fluctuation of the Renminbi may materially and adversely affect our operations and financial results”.
Although PRC governmental policies were introduced in 1996 to reduce restrictions on the convertibility of Renminbi into foreign currency for current account items, conversion of Renminbi into foreign exchange for capital items, such as foreign direct investment, loans or securities, requires the approval of the SAFE and other relevant authorities.Although experimental policies were recently introduced in certain pilot areas such as the Shanghai free trade zone to reduce foreign exchange control, restrictions on the convertibility of Renminbi into foreign currency still remain in force in most parts of China.
In the event of shortages of foreign currencies, we may be unable to convert sufficient Renminbi into foreign currency to meet our foreign currency obligations or to pay dividends in foreign currency.
Our H shares are traded on the Hong Kong Stock Exchange. There are no limitations on the right ofnon-resident or foreign owners to remit dividends or capital including capital gains imposed by Hong Kong law.
The taxation of income and capital gains of holders of H shares or ADSs is subject to the laws and practices of China and of jurisdictions in which holders of H shares or ADSs are resident or otherwise subject to tax. The following summary of certain relevant taxation provisions is based on current law and practice, is subject to change and does not constitute legal or tax advice. The discussion does not deal with all possible tax consequences relating to an investment in the H shares or ADSs. In particular, the discussion does not address the tax consequences under state, local and other laws, such asnon-U.S. federal laws other than the laws of the PRC and Hong Kong. Accordingly, you should consult your own tax adviser regarding the tax consequences of an investment in the H shares and ADSs. The discussion is based upon laws and relevant interpretations in effect as of the date of this annual report, all of which are subject to change.
The People’s Republic of China
The following is a discussion of the material Chinese tax provisions relating to the ownership and disposition of H shares or ADSs held by the investors as capital assets. This discussion does not address all of the tax considerations that may be relevant to specific investors in light of their particular circumstances or to other investors subject to special treatment under the tax laws of the PRC. This discussion is based on the tax laws of China as in effect as of the date of this annual report, as well as on the Agreement between the United States of America and the People’s Republic of China for the Avoidance of Double Taxation, or the“China-U.S. Tax Treaty”, all of which are subject to change (or changes in interpretation), possibly with retroactive effect.
This discussion does not address any aspects of Chinese taxation other than income taxation, capital taxation, stamp taxation and estate taxation. Prospective investors are urged to consult their tax advisers regarding Chinese and other tax consequences of owning and disposing of H shares.
Taxation of Dividends
Individual investors. According to the PRC Individual Income Tax Law, as amended, dividends paid by Chinese companies are ordinarily subject to a Chinese withholding tax levied at a flat rate of 20%. For a foreign individual who is not a resident of China, the receipt of dividends from a company in China is normally subject to a withholding tax of 20% unless reduced pursuant to an applicable tax treaty. According to a notice issued by the Chinese State Administration of Taxation, or the SAT, on June 28, 2011, if the withholding tax rate under applicable tax treaties is 10% or less, the receipt of dividends will be subject to 10% withholding tax; and if the withholding tax rate under applicable tax treaties is between 10% and 20%, the receipt of dividends will be subject to the actual tax rate as agreed under such tax treaties.
Enterprises. According to the PRC Enterprise Income Tax Law and its implementation rules, effective on January 1, 2008, as well as any amendments from time to time and the Circular on Issues Relating to the Withholding of Enterprise Income Tax for Dividends Distributed by Resident Enterprises in China toNon-resident Enterprises HoldingH-shares of the Enterprises, issued by the SAT on November 6, 2008, resident enterprises in China are required to, in distributing dividends for 2008 or any year hereafter tonon-resident enterprises holding Overseas Shares includingH-shares and ADSs of the enterprises, withhold enterprise income tax for such dividends at a tax rate of 10%.Non-resident enterprises holding H shares of any resident enterprise can, after receiving dividends due to them, apply for preferential tax treatment with competent tax authorities in accordance with tax treaties.
Tax treaties.Investors who do not reside in China and reside in countries that have entered into treaties for the avoidance of double-taxation with China may be entitled to a reduction of the withholding tax imposed on the payment of dividends to our investors who do not reside in China. China currently has treaties for the avoidance of double-taxation with a number of other countries, which include Australia, Canada, France, Germany, Japan, Malaysia, the Netherlands, Singapore, the United Kingdom and the United States.
Under theChina-U.S. Tax Treaty, China may tax a dividend paid by us to an Eligible U.S. Holder up to a maximum of 10% of the gross amount of the dividend. For the purposes of this discussion, an “Eligible U.S. Holder” is a U.S. holder that (i) is a resident of the United States for the purposes of theChina-U.S. Tax Treaty, (ii) does not maintain a permanent establishment or fixed base in China to which H shares are attributable and through which the beneficial owner carries on or has carried on business (or, in the case of an individual, performs or has performed independent personal services) and (iii) is not otherwise ineligible for benefits under theChina-U.S. Tax Treaty with respect to income and gains derived in connection with the H shares.
Taxation of Capital Gains
According to the PRC Enterprise Income Tax Law and its implementation rules effective(effective on January 1, 2008,2008) as well as any amendments from time to time, capital gains realized by foreign enterprises which have no establishment or residence in China or whose capital gains from China do not relate to their establishment or residence in China, are ordinarily subject to enterprise income tax at the rate of 10% with respect to the gains realized within China, unless reduced pursuant to an applicable tax treaty.
According to the Interim Administrative MeasuresAnnouncement on Issues Concerning the Source Withholding of Income Tax ofNon-resident Enterprise Income Tax at Source issued by the SAT on January 9, 2009, where both parties to an equity transfer transaction arenon-resident enterprises and whereOctober 17, 2017, the balance of the income from the transfer occurs outside of China,equity less thenon-resident enterprise receiving income shall pay taxes net value of equity is taxable income. Income from transfer of equity refers to the tax authority inconsideration received by the localitytransferor of equity for transfer of equity, including various cash andnon-cash incomes. Net value of equity refers to the resident enterprise whosetaxable base for obtaining such equity. Taxable base is the cost of capital actually paid by the equity was transferred, either directly or by a representative. The resident enterprise whose equity was transferred shall assist the tax authority with the collection of taxes from thenon-resident enterprise.transferor when purchasing such equity.
According to the PRC Individual Income Tax Law, as amended, capital gains realized by individuals upon the transfer of shares, including Overseas Shares, are subject to capital gains tax levied at a flat rate of 20%; and relevant tax authorities are authorized to promulgate implementation rules in this regard. To date, the relevant tax authorities have not promulgated any implementation rules on the taxation of capital gains realized by individuals upon the transfer of shares, including Overseas Shares. If the relevant tax authorities promulgate such implementation rules in the future, a 20% tax may be levied on capital gains realized by foreign individuals in accordance with the PRC Individual Income Tax Law, as amended, unless reduced pursuant to an applicable tax treaty. To date, the relevant tax authorities have not collected capital gains tax on the income from the transfer of shares.
Additional Chinese Tax Considerations
Chinese stamp duty.Chinese stamp duty imposed on the transfer of shares of Chinese publicly traded companies under the Provisional Regulations of China Concerning Stamp Duty should not apply to the acquisition and disposal bynon-Chinese investors of H shares or ADSs outside of China by virtue of the Provisional Regulations of China Concerning Stamp Duty, which became effective on October 1, 1988 and which provide that Chinese stamp duty is imposed only on documents executed or received within China that are legally binding in China and are protected under Chinese law.
Estate tax.No liability for estate tax under Chinese law will arise fromnon-Chinese nationals holding H shares.
Investors under the Shanghai-Hong Kong Stock Connect Program. According to the Notice on Tax Policies for the Shanghai-Hong Kong Stock Connect Pilot Program, jointly issued by the MOF, SAT and CSRC which became effective on November 17, 2014, between November 17, 2014 to November 16, 2017, gains realized by Chinese individual investors upon a transfer of H shares through the Shanghai-Hong Kong Stock Connect program were exempted from individual income tax. Gains realized by Chinese enterprise investors upon a transfer of H shares through the Shanghai-Hong Kong Stock Connect program must be included in their gross income and subject to enterprise income tax. For dividends received by Chinese individual investors and securities investment funds from investing in H shares through the Shanghai-Hong Kong Stock Connect program, the Chinese issuer of such H shares must withhold income tax at a tax rate of 20%. Dividends received by Chinese enterprise investors from investing in H shares through the Shanghai-Hong Kong Stock Connect program must be included in their gross income and subject to enterprise income tax, and the Chinese issuer of such H shares will not withhold income tax for the dividends. The enterprise investors in these circumstances must make tax filings by themselves. According to the Notice on Continuation of the Tax Policies for the Shanghai-Hong Kong Stock Connect Pilot Program, which was jointly issued by the MOF, SAT and CSRC and became effective on November 17, 2017, gains realized by Chinese individual investors upon a transfer of H shares through the Shanghai-Hong Kong Stock Connect Program are further exempted from individual income tax for the period from November 17, 2017 to December 4, 2019. According to the Announcement on Continuation of the Individual Income Tax Policies for the Shanghai-Hong Kong Stock Connect Program andShenzhen-Hong Kong Stock Connect Program and for the Mainland-Hong Kong Mutual Recognition of Fund, which became effective on December 5, 2019, gains realized by Chinese individual investors from a transfer of shares listed on the Hong Kong Stock Exchange through the Shanghai-Hong Kong Stock Connect Program andShenzhen-Hong Kong Stock Connect Program, as well as from sale and purchase of interest in funds set up in Hong Kong through the mutual fund recognition, are further exempted from individual income tax for the period from December 5, 2019 to December 31, 2022.
Hong Kong
The following is a discussion of the material Hong Kong tax provisions relating to the ownership and disposition of H shares or ADSs held by the investors as capital assets. This discussion does not address all of the tax considerations that may be relevant to specific investors in light of their particular circumstances or to investors subject to special treatment under the tax laws of Hong Kong. This discussion is based on the tax laws of Hong Kong as in effect on the date of this annual report, which are subject to change (or changes in interpretation), possibly with retroactive effect. This discussion does not address any aspects of Hong Kong taxation other than income taxation, capital taxation, stamp taxation and estate taxation. Prospective investors are urged to consult their tax advisers regarding Hong Kong and other tax consequences of owning and disposing of H shares.
Tax on Dividends
Under current practice, no tax is payable in Hong Kong in respect of dividends paid by us.
Tax on Gains from Sale
No tax is imposed in Hong Kong in respect of capital gains from the sale of property. However, trading gains from the sale of property by persons carrying on a trade, profession or business in Hong Kong where the gains are derived from or arise in Hong Kong from such trade, profession or business will be chargeable to Hong Kong profits tax, which is imposed at the rate of 16.5% on corporations and at a rate of 15% on unincorporated businesses for the year of assessment 2008/09 onwards. Commencing from the year of assessment 2018/19 (i.e. on or after 1 April 2018), the profits tax rate for the first HK$2,000,000 of profits of corporations will be lowered to 8.25% while the remaining profits will continue to be taxed at the rate of 16.5%; and the profits tax rate for the first HK$2,000,000 of profits of unincorporated businesses will be lowered to 7.5%, while the remaining profits will continue to be taxed at the rate of 15%.
Trading gains from sales of H shares effected on the Hong Kong Stock Exchange will be considered to be derived from or arise in Hong Kong. Liability for Hong Kong profits tax would thus arise in respect of trading gains from sales of H shares effected on the Hong Kong Stock Exchange realized by persons carrying on a business of trading or dealing in securities in Hong Kong.
There will be no liability for Hong Kong profits tax in respect of profits from the sale of ADSs, where purchases and sales of ADSs are effected outside Hong Kong, for example, on the New York Stock Exchange.
Stamp Duty
Hong Kong stamp duty, currently charged at thead valorem rate of 0.1% on the higher of the consideration for, or the market value of, the H shares, will be payable by the purchaser on every purchase and by the seller on every sale of H shares (in other words, a total of 0.2% is currently payable on a typical sale and purchase transaction involving H shares). In addition, a fixed duty of HK$ 5.00 is currently payable on any instrument of transfer of H shares. If stamp duty is not paid on or before the due date, a penalty of up to ten times the duty payable may be imposed.
The withdrawal of H shares upon the surrender of ADRs, and the issuance of ADRs upon the deposit of H shares, will also attract stamp duty at the rate described above for sale and purchase transactions unless such withdrawal or deposit does not result in a passing of the beneficial interest in the H shares under Hong Kong law. The issuance of the ADRs upon the deposit of H shares issued directly to the depositary of the ADSs, or for the account of the depositary, will not be subject to any stamp duty. No Hong Kong stamp duty is payable upon the transfer of ADSs outside Hong Kong.
Estate Duty
The Revenue (Abolition of Estate Duty) Ordinance 2005 came into effect on February 11, 2006 in Hong Kong. No Hong Kong estate duty is payable and no estate duty clearance papers are needed for an application for a grant of representation in respect of holders of H shares whose deaths occur on or after February 11, 2006.
United States of America
The following is a discussion of the material United States federal income tax consequences relating to the purchase, ownership and disposition of H shares or ADSs by U.S. Holders (as defined below) that acquire H shares or ADSs for cash and hold them as capital assets. This discussion is based on the Internal Revenue Code of 1986, as amended, or “the Code”, Treasury regulations promulgated thereunder, and administrative and judicial interpretations thereof, all as in effect on the date hereof and all of which are subject to change, possibly with retroactive effect. This discussion does not address all of the tax considerations that may be relevant to specific U.S. Holders in light of their particular circumstances or to U.S. Holders subject to special treatment under U.S. federal income tax law (such as banks, insurance companies,tax-exempt entities, retirement plans, regulated investment companies, real estate investment trusts, partnerships, dealers in securities, or other U.S. Holders that generally mark their securities to market for U.S. federal income tax purposes, certain former citizens or residents of the United States, persons who have acquired our H shares or ADSs as part of a straddle, hedge, conversion, or other integrated investment, persons who own, directly or by attribution, 10% or more of the combined voting power or value of all classes of stock of China Life or persons that have a “functional currency” other than the U.S. dollar). This discussion does not address any U.S. state or local or any U.S. federal estate, gift or alternative minimum tax considerations.
As used in this discussion, the term “U.S. Holder” means a beneficial owner of H shares or ADSs that is, for U.S. federal income tax purposes, (i) an individual who is a citizen or resident of the United States, (ii) a corporation created or organized in or under the laws of the United States or of any state or political subdivision thereof, or therein, including the District of Columbia or (iii) an estate or trust the income of which is subject to U.S. federal income tax regardless of the source thereof.
Investors are urged to consult their own tax advisers as to the particular tax considerations applicable to them relating to the purchase, ownership and disposition of H shares or ADSs in their individual circumstances, including the applicability of U.S. federal, state and local tax laws, any changes in applicable tax laws and any pending or proposed legislation or regulations.
Taxation of Dividends
Subject to the discussion below under “—Special Rules”, cash distributions with respect to the H shares or ADSs owned by a U.S. Holder will, upon receipt, be includible in the gross income of such U.S. Holder as ordinary dividend income to the extent of our current and accumulated earnings and profits, as determined under U.S. federal income tax principles. To the extent that the amount of any such cash distribution exceeds our current and accumulated earnings and profits as so computed, it will be treated first as anon-taxable return of capital to the extent of the U.S. Holder’s adjusted tax basis in such H shares or ADSs and, to the extent the amount of such cash distribution exceeds adjusted tax basis, will be treated as gain from the sale of such H shares or ADSs. Dividends paid by us generally will constitute income from sources outside the United States for foreign tax credit limitation purposes and will not be eligible for the “dividends received” deduction.
Dividends received by individuals from “qualified foreign corporations” are generally subject to a maximum U.S. federal income tax rate of 20%, so long as certain holding period requirements are met. Anon-U.S. corporation (other than a passive foreign investment company) generally will be considered to be a qualified foreign corporation (i) if it is eligible for the benefits of a comprehensive income tax treaty with the United States which the Secretary of the Treasury determines is satisfactory for purposes of the relevant provision and which includes an exchange of information program or (ii) with respect to any dividend it pays on stock which is readily tradable on an established securities market in the United States. The Treasury Department has determined that theChina-U.S. Tax Treaty as currently in effect meets the requirements described in clause (i) above. In addition, the ADSs are readily tradable on the New York Stock Exchange, an established securities market in the United States. Each U.S. Holder that is an individual is urged to consult his or her tax adviser regarding the applicability of this reduced rate to dividends received with respect to the H shares or ADSs in his particular circumstance.
The U.S. dollar value of any distribution made by us in Hong Kong dollars (or other currency that is not the U.S. dollar, or a “foreign currency”), should be calculated by reference to the exchange rate in effect on the date of receipt of such distribution by Deutsche Bank Trust Company Americas, as depositary, in the case of ADSs, or by the U.S. Holder, in the case of H shares held directly by such U.S. Holder regardless of whether the Hong Kong dollars (or such other foreign currency) so received are converted into U.S. dollars on the date of receipt. If the Hong Kong dollars (or such other foreign currency) so received are converted into U.S. dollars on the date of receipt, such U.S. Holder generally should not recognize foreign currency gain or loss on such conversion. If the Hong Kong dollars (or such other foreign currency) are not converted into U.S. dollars on the date of receipt, such U.S. Holder will have a basis in the Hong Kong dollars (or such other foreign currency) equal to their U.S. dollar value on the date of receipt. Any gain or loss on a subsequent conversion or other disposition of the Hong Kong dollars (or such other foreign currency) generally will be treated as ordinary income or loss from sources within the United States for foreign tax credit limitation purposes.
Subject to certain limitations, the Chinese tax withheld from dividends paid with respect to H shares or ADSs and paid over to China, as described above under “—The People’s Republic of China—Taxation of Dividends,”Dividends”, may be creditable against a U.S. Holder’s U.S. federal income tax liability. Special rules apply in determining the foreign tax credit limitation with respect to dividends that are subject to the maximum 20% U.S. federal income tax rate. A U.S. Holder of H shares or ADSs that does not elect to claim a U.S. foreign tax credit may instead claim a deduction for such withheld tax, but only for a taxable year in which the U.S. Holder elects to do so with respect to allnon-U.S. income taxes paid or accrued in such taxable year. The availability of the foreign tax credit and the application of the limitations on the credit are fact specific and U.S. Holders are urged to consult their own U.S. tax advisers with respect to foreign tax credit considerations in their individual circumstances.
Sale or other Disposition of H Shares or ADSs
Subject to the discussion below under “—Special Rules”, a U.S. Holder generally will recognize gain or loss for U.S. federal income tax purposes upon a sale or other disposition of H shares or ADSs that it owns in an amount equal to the difference, if any, between the amount realized from the sale or disposition and such U.S. Holder’s adjusted tax basis in such H shares or ADSs. The gain or loss generally will be a capital gain or loss and will be long-term capital gain (taxable at a reduced rate for individuals) or loss if, on the date of sale or disposition, such H shares or ADSs were held by the U.S. Holder for more than one year and will generally be U.S. source gain or loss. The claim of a deduction in respect of a capital loss may be subject to limitations.
A U.S. Holder that receives Hong Kong dollars (or other foreign currency) from the sale or disposition generally will realize an amount equal to the U.S. dollar value of the Hong Kong dollars (or such other foreign currency) on the settlement date of the sale or disposition if (i) the U.S. Holder is a cash basis or electing accrual basis taxpayer and our H shares or ADSs, as the case may be, are treated as being “traded on an established securities market” for this purpose or (ii) the settlement date is the date of the sale or disposition. If the Hong Kong dollars (or such other foreign currency) so received are converted into U.S. dollars on the settlement date, the U.S. Holder should not recognize foreign currency gain or loss on the conversion. If the Hong Kong dollars (or such other foreign currency) so received are not converted into U.S. dollars on the settlement date, the U.S. Holder will have a basis in the Hong Kong dollars (or such other foreign currency) equal to the U.S. dollar value on the settlement date. Any gain or loss on a subsequent conversion or other disposition of the Hong Kong dollars (or such other foreign currency) generally will be treated as ordinary income or loss from sources within the United States for foreign tax credit limitation purposes. A U.S. Holder should consult its own tax adviser regarding the U.S. federal income tax consequences of receiving Hong Kong dollars (or other currency) from a sale or disposition of the H shares or ADSs in cases not described in this paragraph.
A U.S. Holder that is anon-resident enterprise may be subject to Chinese tax on the gain realized upon the sale or other disposition of H shares or ADS. See “—The People’s Republic of China—Taxation of Capital Gains” above. Holders should consult their own tax advisers concerning their ability to credit such Chinese taxes against their U.S. federal income tax liability in their particular situation.
Special Rules
Related Person Insurance Income. Certain adverse U.S. income and tax reporting rules may apply to U.S. shareholders who, directly or indirectly, own stock of anon-U.S. corporation that earns “related person insurance income” (“RPII”), if 25% or more of thenon-U.S. corporation’s direct or indirect shareholders are U.S. persons. RPII is generally defined as insurance income derived from the insurance (or reinsurance) of insureds who are U.S. shareholders in thenon-U.S. corporation or who are related to such U.S. shareholders. If applicable, these rules would require U.S. Holders to include in taxable income each year their pro rata share of any RPII incurred by us for the year, regardless of whether such income is distributed, and also to file IRS Form 5471, disclosing certain information regarding their direct or indirect ownership of China Life. Special rules apply for purposes of determining each U.S. shareholder’s pro rata share of any RPII. For organizations that are otherwise exempt from U.S. federal income tax under section 501(a) of the Code, any such income would constitute “unrelated business taxable income”. These rules could also apply to convert some or all of the gain recognized from the sale or disposition of H shares or ADSs from capital gain to ordinary income and to require such gain to be reported on IRS Form 5471.
Under a statutory exception, these rules do not apply if less than 20% of thenon-U.S. corporation’s insurance income is RPII or if less than 25% of thenon-U.S. corporation’s stock is owned by U.S. shareholders. Because CLIC holds approximately 68.37%of our share capital, and because we do not offer or intend to offer our products and services in the United States, it is highly unlikely that the RPII rules will apply. If more of our shares are sold to the public in the future, it is possible that such rules could apply at a later date.
Passive Foreign Investment Company. In general, anon-U.S. corporation will be a passive foreign investment company, or a “PFIC”,PFIC if 75% or more of its gross income constitutes “passive income” or 50% or more of its assets produce “passive income” or are held for the production of “passive income”. In determining whether we are a PFIC, we will be treated as if we directly owned our proportionate share of the assets and received our proportionate share of the income of any other corporation in which we own 25% or more of the shares by value.
For the purpose of determining whether anon-U.S. corporation is a PFIC, “passive income” is defined to include income of the kind which would be foreign personal holding company income under section 954(c) of the Code, and generally includes interest, dividends, annuities and other investment income. Passive income does not include interest income or dividends received from controlled subsidiaries or certain other related persons, to the extent properly allocable to income of such related person that is not passive income. The PFIC provisions, as modified by the TCJA, specifically exclude from the definition of “passive income” any income “derived in the active conduct of an insurance business by a corporation which is predominantly engaged in anqualifying insurance business and which would be subject to tax under subchapter L if it were a domestic corporation” (the “active insurance business exception”). The active insurance business exception is intended to ensure that income derived by a bona fide insurance company is not treated as passive income. Thus,Anon-U.S. corporation is a qualifying insurance corporation if it would be subject to the extent that income is attributable to financialtax as an insurance company if it were a domestic corporation and (i) loss and loss adjustment expenses and certain reserves, in excessor “applicable insurance liabilities”, constitute more than 25% of the reasonable needs ofnon-U.S. corporation’s gross assets for the relevant year or (ii) a U.S. Holder makes an election to apply an alternative facts and circumstances test that applies only in certain runoff-related or ratings-related circumstances involving the insurance business, it may be treated as passive income.business. The PFIC provisions also exclude from the definition of “passive income” any income derived in the active conduct of a banking trade or business.
No final or temporary Treasury regulations currently exist regarding the application of the PFIC rules to an insurance company. However, the IRS released proposed Treasury regulations regarding the application of the PFIC rules to insurance companies in July 2019. These regulations are not yet in force but are proposed to be effective for taxable years of U.S. Holders beginning on or after the date that final regulations are issued. The proposed Treasury regulations provide that whether a company is engaged in the active conduct of an insurance business is a facts and circumstances test, but also introduce a “bright-line” test providing that the active conduct requirement is met only if the insurance company’s “active conduct percentage” is at least 50%. In general, a company’s active conduct percentage is determined by dividing the company’s aggregate expenses for certain insurance-related services of its officers and employees (and the officers and employees of certain affiliates) by the company’s aggregate expenses for such insurance-related services (including those paid to unaffiliated persons). The proposed regulations would also expand the circumstances in which a shareholder of anon-U.S. corporation is treated as owning shares of a subsidiary that is treated as a PFIC even if the corporation is not treated as a PFIC. If these rules are finalized in proposed form, there is a risk that we would be treated as a PFIC.
We make various simplifying assumptions to estimate the asset composition and value of our subsidiaries in order to apply the PFIC tests to the income and assets of our 25% or greater owned subsidiaries. Based on our analysis of our assets and income, which takes into account these assumptions, we believe that we were not classified as a PFIC in 2017. However, there is little guidance on the circumstances under which anon-U.S. company will be treated as predominantly engaged in an insurance business or engaged in the active conduct of a banking trade or business for purposes of determining PFIC status. Accordingly,2019.However, there is no assurance that the IRS will not take a contrary position and assert that we are a PFIC. Furthermore, an actual determination of PFIC status is inherently factual in nature and cannot be made until the close of each applicable tax year and, accordingly, no assurances can be given that we will not become a PFIC at some point in the future. The IRS has issued proposed regulations regarding the application of the PFIC provisions to insurance companies and banks, and final regulations or pronouncements interpreting or clarifying these rules may be forthcoming. We cannot predict what impact, if any, such guidance would have on the determination of our status as a PFIC. In addition, the recently enacted “Tax Cuts and Jobs Act,” or the “TCJA”, modifies the active insurance business exception for taxable years beginning after December 31, 2017, such that it applies only to a foreign corporation if (i) loss and loss adjustment expenses and certain reserves constitute more than 25% of the foreign corporation’s gross assets for the relevant year or (ii) a U.S. Holder makes an election to apply an alternative facts and circumstances test that applies only in certain runoff-related or ratings-related circumstances involving the insurance business. There is significant uncertainty as to the interpretation of the active insurance business exception as modified by the TCJA. As a result, China Life cannot presently determine whether it will be a PFIC for taxable years beginning after December 31, 2017.
In general, a U.S. shareholder of a PFIC is subject to a special tax and an interest charge at the time of the sale of (or receipt of an “excess distribution” with respect to) its shares in the PFIC. In general, a shareholder is treated as having received an “excess distribution” if the amount of the distribution was more than 125% of the average distribution with respect to its shares during the three preceding taxable years (or shorter period during which the taxpayer held the shares). The special tax is computed by assuming that the excess distribution or, in the case of a sale, the gain with respect to the shares was earned in equal portions throughout the holder’s period of ownership. The portion allocable to each year prior to the year of sale is taxed at the maximum marginal tax rate applicable for each such period. The interest charge is determined based on the applicable rate imposed on underpayments of U.S. federal income tax for the period. The special tax and the interest charge generally will not apply to a U.S. shareholder that validly makes a “qualified electing fund” election under section 1295 of the Code with respect to the shares of the PFIC. We do not intend to comply with the requirements necessary to permit a U.S. Holder to make such an election with respect to H shares or ADSs.
The above results may also be avoided if a“mark-to-market” election is available and a U.S. Holder validly makes such an election. If the election is made, such U.S. Holder generally will be required to take into account the difference, if any, between the fair market value of, and its adjusted tax basis in, its H shares or ADSs at the end of each taxable year as ordinary income or ordinary loss (to the extent of any netmark-to-market gain previously included in income), and to make corresponding adjustments to the tax basis of such H shares or ADSs. In addition, any gain from a sale or other disposition of H shares or ADSs will be treated as ordinary income, and any loss will be treated as ordinary loss (to the extent of any netmark-to-market gain previously included in income). Amark-to-market election is available to a U.S. Holder only if our H shares or ADSs are considered “marketable stock” for these purposes. Generally, stock will be considered marketable stock if it is “regularly traded” on a “qualified exchange” within the meaning of applicable U.S. Treasury regulations. A class of stock is regularly traded during any calendar year during which such class of stock is traded, other than inde minimis quantities, on at least 15 days during each calendar quarter. Anon-U.S. securities exchange will constitute a qualified exchange if it is regulated or supervised by a governmental authority of the country in which the market is located and meets certain trading, listing, financial disclosure and other requirements set forth in the Treasury Regulations.regulations. We do not know whether our H shares or ADSs will be treated as marketable stock for these purposes.
If we are a PFIC in any taxable year during which a U.S. Holder owns H Shares or ADSs, such U.S. Holder (i) may also suffer adverse tax consequences under the PFIC rules described above with respect to any other PFIC in which we have a direct or indirect equity interest and (ii) generally will be required to file annually a statement with its U.S. federal income tax returns. U.S. Holders should consult their own tax advisers regarding the U.S. federal income tax consequences of a direct or indirect investment in a PFIC.
Medicare Taxes
Certain U.S. Holders that are individuals, estates or trusts are subject to an additional tax at the rate of 3.8% on all or a portion of their “net investment income”, which may include all or a portion of their income arising from a distribution with respect to an ADS or an H Share and gain upon the sale, exchange or other disposition of such ADS or H Share.
Information Reporting and Backup Withholding
Under certain circumstances, information reporting and/or backup withholding may apply to U.S. Holders with respect to payments made on or proceeds from the sale, exchange or other disposition of ADSs or H Shares, unless an applicable exemption is satisfied. Backup withholding is not an additional tax. Any amounts withheld under the backup withholding rules generally will be allowed as a refund or a credit against a U.S. Holder’s U.S. federal income tax liability if the required information is furnished by the U.S. Holder on a timely basis to the IRS.
Reportable Transactions
U.S. Holders that participate in “reportable transactions” (as defined in the Treasury Regulations)regulations) must attach to their federal income tax returns a disclosure statement on Form 8886. We urge U.S. Holders to consult their own tax advisers as to the possible obligation to file Form 8886 with respect to the ownership or disposition of any Hong Kong dollars (or other foreign currency) received as a dividend or as proceeds from the sale of H shares or ADSs, or any other aspect of the purchase, ownership or disposition of H shares or ADSs.
Disclosure Requirements for Specified Foreign Financial Assets
Individual U.S. Holders (and certain U.S. entities to the extent specified in future IRS guidance) who, during any taxable year, hold any interest in any “specified foreign financial asset” generally will be required to file with their U.S. federal income tax returns Form 8938, setting forth certain information with respect to such asset, if the aggregate value of all such assets exceeds the applicable reporting threshold. “Specified foreign financial asset” generally includes any financial account maintained with anon-U.S. financial institution and may also include H Shares or ADSs if they are not held in an account maintained with a U.S. financial institution. Substantial penalties may be imposed for a failure to comply. U.S. Holders should consult their own tax advisers as to the possible application to them of these filing requirements.
F. DIVIDENDS AND PAYING AGENTS
Not applicable.
Not applicable.
You may read and copy documents referred to in this annual report on Form20-F that have been filed with the U.S. Securities and Exchange Commission, or SEC, at its public reference room located at 100 F Street, NE, Washington, D.C. 20549. Please call the SEC at1-800-SEC-0330 for further information on the public reference rooms and their copy charges. The SEC also maintains a website athttp://www.sec.gov that contains reports, proxy statements and other information regarding the registrations that file electronically with the SEC.
The SEC allows us to “incorporate by reference” the information we filed with the SEC. This means that we can disclose important information to you by referring you to another document filed separately with the SEC. The information incorporated by reference is considered to be part of this annual report on Form20-F.
Not applicable.
ITEM 11. QUANTITATIVE AND QUALITATIVE DISCLOSURES ABOUT MARKET RISK.
Our exposure to financial market risks relates primarily to changes in interest rates, equity prices and exchange rates.
The following discussions and tables, which constitute “forward-looking statements” that involve risks and uncertainties, summarize our market-sensitive financial instruments including fair value and maturity. Such discussions address market risk only and do not present other risks which we face in the normal course of business.
For further information on our management of market risk, including the objectives and general strategies of risk management, see “Item 4 Information on the Company—Business Overview—Investments—Risk Management” andNoteand Note 4 to our consolidated financial statements included elsewhere in this annual report.
Interest Rate Risk
Our profitability is affected by changes in interest rates. Interest rates are highly sensitive to many factors, including economic growth rate, inflation, governmental monetary and tax policies, domestic and international economic and political conditions, financial regulatory requirements and other factors beyond our control. If interest rates were to increase in the future, surrenders and withdrawals of life insurance and annuity policies and contracts may increase as policy holders may seek other investments with higher perceived returns. This process may result in cash outflows requiring that we sell investment assets at a time when the prices of those assets are adversely affected by the increase in market interest rates, which may result in realized investment losses. However, if interest rates were to decline in the future, the income we realize from our investments may decrease, affecting our profitability. In addition, as instruments in our investment portfolio mature, we might have to reinvest the funds we receive in investments bearing low interest rates, which may also affect our profitability.
For the years ended December 31, 2017, 20162019, 2018 and 2015,2017, our investment yield was 5.24%, 3.29% and 5.16%, 4.61% and 6.47%,respectively. Investment contracts are generally priced with guaranteed interest rates.Dividends on participating policies are required to be at least 70% of distributable earnings attributable to such policies.
The following tables set forth selected assets and liabilities with exposure to interest rates as of December 31, 2017, 20162019, 2018 and 2015.2017.
| Expected Maturity Date | Expected Maturity Date | |||||||||||||||||||||||||||||||||||||||||||||||||||||||||||||||
| As of December 31, 2017 | 2018 | 2019 | 2020 | 2021 | 2022 | Thereafter | Total | Fair value | ||||||||||||||||||||||||||||||||||||||||||||||||||||||||
| As of December 31, 2019 | 2020 | 2021 | 2022 | 2023 | 2024 | Thereafter | Total | Fair value | ||||||||||||||||||||||||||||||||||||||||||||||||||||||||
| (RMB in millions, except as otherwise stated) | (RMB in millions, except as otherwise stated) | |||||||||||||||||||||||||||||||||||||||||||||||||||||||||||||||
Assets | ||||||||||||||||||||||||||||||||||||||||||||||||||||||||||||||||
Held-to-maturity andavailable-for-sale debt securities | ||||||||||||||||||||||||||||||||||||||||||||||||||||||||||||||||
Fixed rate bonds | ||||||||||||||||||||||||||||||||||||||||||||||||||||||||||||||||
in RMB | 59,591 | 52,756 | 59,967 | 56,044 | 93,085 | 786,998 | 1,108,441 | 1,084,377 | 37,262 | 64,853 | 84,960 | 57,526 | 35,163 | 1,038,319 | 1,318,083 | 1,357,890 | ||||||||||||||||||||||||||||||||||||||||||||||||
Average interest rate | 4.82% | 5.23% | 4.91% | 4.59% | 4.79% | 4.56% | 4.65% | 4.82% | 4.37% | 4.62% | 4.91% | 5.03% | 4.29% | 4.38% | ||||||||||||||||||||||||||||||||||||||||||||||||||
in US$ | 1,229 | — | 13 | 32 | — | 110 | 1,384 | 1,393 | 7,571 | 46 | — | 7 | 36 | 115 | 7,775 | 7,792 | ||||||||||||||||||||||||||||||||||||||||||||||||
Average interest rate | 0.98% | — | 5.50% | 6.15% | — | 5.25% | 1.48% | 2.36% | 5.50% | — | 5.97% | 5.44% | 4.53% | 2.43% | ||||||||||||||||||||||||||||||||||||||||||||||||||
Variable rate bonds | ||||||||||||||||||||||||||||||||||||||||||||||||||||||||||||||||
in RMB | 209 | — | 28 | — | — | — | 237 | 237 | 10 | — | — | — | — | 207 | 217 | 217 | ||||||||||||||||||||||||||||||||||||||||||||||||
Average interest rate | 4.66% | — | 5.35% | — | — | — | 4.74% | 2.78% | — | — | — | — | 4.54% | 4.46% | ||||||||||||||||||||||||||||||||||||||||||||||||||
Term deposits | ||||||||||||||||||||||||||||||||||||||||||||||||||||||||||||||||
in RMB | 89,332 | 149,833 | 77,441 | 33,300 | 88,950 | 2,800 | 441,656 | 441,656 | 98,981 | 33,830 | 111,661 | 122,800 | 151,900 | 8,030 | 527,202 | 527,202 | ||||||||||||||||||||||||||||||||||||||||||||||||
Average interest rate | 4.90% | 4.50% | 5.17% | 3.90% | 4.54% | 5.20% | 4.66% | 4.95% | 3.90% | 4.47% | 5.31% | 4.69% | 4.33% | 4.78% | ||||||||||||||||||||||||||||||||||||||||||||||||||
in US$ | 7,744 | — | — | — | — | — | 7,744 | 7,744 | 8,026 | — | — | — | — | — | 8,026 | 8,026 | ||||||||||||||||||||||||||||||||||||||||||||||||
Average interest rate | 3.21% | — | — | — | — | — | 3.21% | |||||||||||||||||||||||||||||||||||||||||||||||||||||||||
in HK$ | 32 | — | — | — | — | — | 32 | 32 | ||||||||||||||||||||||||||||||||||||||||||||||||||||||||
Average interest rate | 1.96% | — | — | — | — | — | 1.96% | 2.57% | — | — | — | — | — | 2.57% | ||||||||||||||||||||||||||||||||||||||||||||||||||
Liabilities | ||||||||||||||||||||||||||||||||||||||||||||||||||||||||||||||||
Securities sold under agreements to repurchase | 87,309 | — | — | — | — | — | 87,309 | 87,309 | 118,088 | — | — | — | — | — | 118,088 | 118,088 | ||||||||||||||||||||||||||||||||||||||||||||||||
Average interest rate | 5.39% | — | — | — | — | — | 5.39% | 1.51% | — | — | — | — | — | 1.51% | ||||||||||||||||||||||||||||||||||||||||||||||||||
Interest-bearing loans and other borrowings | ||||||||||||||||||||||||||||||||||||||||||||||||||||||||||||||||
in British pound | — | 2,413 | — | — | — | — | 2,413 | 2,413 | — | — | — | — | 2,515 | — | 2,515 | 2,515 | ||||||||||||||||||||||||||||||||||||||||||||||||
Average interest rate | — | 3.54% | — | — | — | — | 3.54% | — | — | — | — | 3.08% | — | 3.08% | ||||||||||||||||||||||||||||||||||||||||||||||||||
in US$ | — | 12,480 | — | — | — | — | 12,480 | 12,480 | 126 | — | — | — | 12,766 | — | 12,892 | 12,892 | ||||||||||||||||||||||||||||||||||||||||||||||||
Average interest rate | — | 2.35% | — | — | — | — | 2.35% | 2.70% | — | — | — | 3.18% | — | 3.18% | ||||||||||||||||||||||||||||||||||||||||||||||||||
in Euro | 780 | — | 3,121 | — | — | — | 3,901 | 3,901 | 4,115 | 523 | — | — | — | — | 4,638 | 4,638 | ||||||||||||||||||||||||||||||||||||||||||||||||
Average interest rate | 1.50% | — | 3.80% | — | — | — | 3.34% | 3.25% | 2.50% | — | — | — | — | 3.16% | ||||||||||||||||||||||||||||||||||||||||||||||||||
Investment contracts | 2,765 | 1,922 | 2,259 | 591 | 953 | 224,010 | 232,500 | 229,222 | 4,153 | 677 | 782 | 1,634 | 1,456 | 259,102 | 267,804 | 260,592 | ||||||||||||||||||||||||||||||||||||||||||||||||
Average guaranteed interest rate | 1.42% | 0.80% | 1.32% | 2.12% | 1.69% | 2.49% | 2.44% | 1.90% | 2.30% | 2.18% | 2.29% | 1.81% | 2.40% | 2.39% | ||||||||||||||||||||||||||||||||||||||||||||||||||
Long-term insurance contracts | 107,665 | 23,963 | 23,861 | 25,615 | 81,730 | 1,736,232 | 1,999,066 | 69,839 | 23,490 | 20,951 | 17,419 | 16,689 | 2,372,943 | 2,521,331 | ||||||||||||||||||||||||||||||||||||||||||||||||||
Average guaranteed interest rate | 2.52% | 2.58% | 2.57% | 2.68% | 3.24% | 2.61% | 2.63% | 2.64% | 2.64% | 2.51% | 2.49% | 2.52% | 2.75% | 2.74% | ||||||||||||||||||||||||||||||||||||||||||||||||||
Assets Held-to-maturity andavailable-for-sale debt securities Fixed rate bonds in RMB Average interest rate in US$ Average interest rate Variable rate bonds in RMB Average interest rate Term deposits in RMB Average interest rate in US$ Average interest rate Liabilities Securities sold under agreements to repurchase Average interest rate Interest-bearing loans and other borrowings in British pound Average interest rate in US$ Average interest rate in Euro Average interest rate Investment contracts Average guaranteed interest rate Long-term insurance contracts Average guaranteed interest rate Expected Maturity Date As of December 31, 2016 2017 2018 2019 2020 2021 Thereafter Total Fair
value (RMB in millions, except as otherwise stated) 63,466 71,709 53,115 44,127 46,853 714,000 993,270 1,017,685 4.87% 4.59% 5.25% 4.85% 4.58% 4.56% 4.64% — — — 13 34 117 164 170 — — — 5.50% 6.15% 5.25% 5.46% 409 207 10 28 — 400 1,054 1,055 5.66% 4.65% 3.80% 5.29% — 4.60% 5.03% 179,729 88,157 149,833 70,500 36,300 7,700 532,219 532,219 5.00% 4.94% 5.00% 5.29% 3.90% 3.80% 4.94% 6,106 — — — — — 6,106 6,106 1.51% — — — — — 1.51% 81,088 — — — — — 81,088 81,088 3.64% — — — — — 3.64% — — 2,339 — — — 2,339 2,339 — — 3.54% — — — 3.54% — — 13,100 — — — 13,100 13,100 — — 2.35% — — — 2.35% 731 — — — — — 731 731 1.50% — — — — — 1.50% 2,632 1,872 1,882 543 585 188,192 195,706 192,373 1.60% 1.24% 0.78% 2.30% 2.26% 2.37% 2.34% 143,140 72,636 24,073 25,257 58,264 1,502,586 1,825,956 2.53% 2.51% 2.60% 2.62% 3.17% 2.59% 2.60%
| Expected Maturity Date | ||||||||||||||||||||||||||||||||
| As of December 31, 2018 | 2019 | 2020 | 2021 | 2022 | 2023 | Thereafter | Total | Fair value | ||||||||||||||||||||||||
| (RMB in millions, except as otherwise stated) | ||||||||||||||||||||||||||||||||
Assets | ||||||||||||||||||||||||||||||||
Held-to-maturity and available-for-sale debt securities | ||||||||||||||||||||||||||||||||
Fixed rate bonds | ||||||||||||||||||||||||||||||||
in RMB | 25,976 | 56,949 | 72,536 | 97,279 | 60,894 | 906,409 | 1,220,043 | 1,256,866 | ||||||||||||||||||||||||
Average interest rate | 5.19% | 4.86% | 4.46% | 4.71% | 5.06% | 4.42% | 4.52% | |||||||||||||||||||||||||
in US$ | 2,241 | 13 | 21 | 6 | 35 | 74 | 2,390 | 2,393 | ||||||||||||||||||||||||
Average interest rate | 2.93% | 5.33% | 6.55% | 5.12% | 5.05% | 5.05% | 3.07% | |||||||||||||||||||||||||
Variable rate bonds | ||||||||||||||||||||||||||||||||
in RMB | — | 30 | — | — | — | 201 | 231 | 231 | ||||||||||||||||||||||||
Average interest rate | — | 5.23% | — | — | — | 4.66% | 4.73% | |||||||||||||||||||||||||
Term deposits | ||||||||||||||||||||||||||||||||
in RMB | 151,418 | 77,441 | 33,830 | 88,950 | 122,800 | 77,400 | 551,839 | 551,839 | ||||||||||||||||||||||||
Average interest rate | 4.48% | 5.17% | 3.90% | 4.58% | 5.31% | 4.78% | 4.78% | |||||||||||||||||||||||||
in US$ | 7,502 | — | — | — | — | — | 7,502 | 7,502 | ||||||||||||||||||||||||
Average interest rate | 2.21% | — | — | — | — | — | 2.21% | |||||||||||||||||||||||||
Liabilities | ||||||||||||||||||||||||||||||||
Securities sold under agreements to repurchase | 192,141 | — | — | — | — | — | 192,141 | 192,141 | ||||||||||||||||||||||||
Average interest rate | 1.86% | — | — | — | — | — | 1.86% | |||||||||||||||||||||||||
Interest-bearing loans and other borrowings | ||||||||||||||||||||||||||||||||
in British pound | 2,385 | — | — | — | — | — | 2,385 | 2,385 | ||||||||||||||||||||||||
Average interest rate | 3.54% | — | — | — | — | — | 3.54% | |||||||||||||||||||||||||
in US$ | 13,108 | — | — | — | — | — | 13,108 | 13,108 | ||||||||||||||||||||||||
Average interest rate | 2.35% | — | — | — | — | — | 2.35% | |||||||||||||||||||||||||
in Euro | 993 | 3,139 | 525 | — | — | — | 4,657 | 4,657 | ||||||||||||||||||||||||
Average interest rate | 1.50% | 3.80% | 2.50% | — | — | — | 3.16% | |||||||||||||||||||||||||
Investment contracts | 2,867 | 3,213 | 451 | 986 | 1,296 | 246,621 | 255,434 | 245,803 | ||||||||||||||||||||||||
Average guaranteed interest rate | 1.77% | 1.61% | 2.21% | 2.20% | 2.27% | 2.40% | 2.38% | |||||||||||||||||||||||||
Long-term insurance contracts | 62,349 | 24,371 | 22,294 | 26,533 | 16,696 | 2,037,551 | 2,189,794 | |||||||||||||||||||||||||
Average guaranteed interest rate | 2.59% | 2.56% | 2.61% | 2.68% | 2.49% | 2.67% | 2.67% | |||||||||||||||||||||||||
Assets Held-to-maturity andavailable-for-sale debt securities Fixed rate bonds in RMB Average interest rate in US$ Average interest rate Variable rate bonds in RMB Average interest rate Term deposits in RMB Average interest rate in US$ Average interest rate Liabilities Securities sold under agreements to repurchase Average interest rate Interest-bearing loans and other borrowings Average interest rate Investment contracts Average guaranteed interest rate Long-term insurance contracts Average guaranteed interest rate Expected Maturity Date As of December 31, 2015 2016 2017 2018 2019 2020 Thereafter Total Fair
value (RMB in millions, except as otherwise stated) 30,816 63,843 61,139 51,973 44,020 647,267 899,058 945,831 4.84% 4.94% 4.23% 5.26% 4.86% 4.79% 4.79% 266 — — — 12 57 335 340 10.25% — — — 6.47% 5.88% 9.36% 3,516 684 204 160 28 1,989 6,581 6,572 4.21% 5.62% 4.67% 6.52% 5.81% 4.09% 4.40% 176,350 173,684 88,157 48,500 70,500 — 557,191 557,191 4.54% 5.14% 4.94% 5.99% 4.63% — 4.93% 5,431 — — — — — 5,431 5,431 1.87% — — — — — 1.87% 31,354 — — — — — 31,354 31,354 2.34% — — — — — 2.34% — — — — 2,643 — 2,643 2,643 — — — — 3.54% — 3.54% 2,736 1,772 1,447 573 564 77,014 84,106 82,644 1.43% 1.17% 1.11% 2.16% 2.31% 2.20% 2.14% 164,129 112,595 117,163 23,291 20,247 1,261,348 1,698,773 2.49% 2.53% 2.88% 2.54% 2.50% 2.50% 2.53%
| Expected Maturity Date | ||||||||||||||||||||||||||||||||
| As of December 31, 2017 | 2018 | 2019 | 2020 | 2021 | 2022 | Thereafter | Total | Fair value | ||||||||||||||||||||||||
| (RMB in millions, except as otherwise stated) | ||||||||||||||||||||||||||||||||
Assets | ||||||||||||||||||||||||||||||||
Held-to-maturity andavailable-for-sale debt securities | ||||||||||||||||||||||||||||||||
Fixed rate bonds | ||||||||||||||||||||||||||||||||
in RMB | 59,591 | 52,756 | 59,967 | 56,044 | 93,085 | 786,998 | 1,108,441 | 1,084,377 | ||||||||||||||||||||||||
Average interest rate | 4.82% | 5.23% | 4.91% | 4.59% | 4.79% | 4.56% | 4.65% | |||||||||||||||||||||||||
in US$ | 1,229 | — | 13 | 32 | — | 110 | 1,384 | 1,393 | ||||||||||||||||||||||||
Average interest rate | 0.98% | — | 5.50% | 6.15% | — | 5.25% | 1.48% | |||||||||||||||||||||||||
Variable rate bonds | ||||||||||||||||||||||||||||||||
in RMB | 209 | — | 28 | — | — | — | 237 | 237 | ||||||||||||||||||||||||
Average interest rate | 4.66% | — | 5.35% | — | — | — | 4.74% | |||||||||||||||||||||||||
Term deposits | ||||||||||||||||||||||||||||||||
in RMB | 89,332 | 149,833 | 77,441 | 33,300 | 88,950 | 2,800 | 441,656 | 441,656 | ||||||||||||||||||||||||
Average interest rate | 4.90% | 4.50% | 5.17% | 3.90% | 4.54% | 5.20% | 4.66% | |||||||||||||||||||||||||
in US$ | 7,744 | — | — | — | — | — | 7,744 | 7,744 | ||||||||||||||||||||||||
Average interest rate | 1.96% | — | — | — | — | — | 1.96% | |||||||||||||||||||||||||
Liabilities | ||||||||||||||||||||||||||||||||
Securities sold under agreements to repurchase | 87,309 | — | — | — | — | — | 87,309 | 87,309 | ||||||||||||||||||||||||
Average interest rate | 5.39% | — | — | — | — | — | 5.39% | |||||||||||||||||||||||||
Interest-bearing loans and other borrowings | ||||||||||||||||||||||||||||||||
in British pound | — | 2,413 | — | — | — | — | 2,413 | 2,413 | ||||||||||||||||||||||||
Average interest rate | — | 3.54% | — | — | — | — | 3.54% | |||||||||||||||||||||||||
in US$ | — | 12,480 | — | — | — | — | 12,480 | 12,480 | ||||||||||||||||||||||||
Average interest rate | — | 2.35% | — | — | — | — | 2.35% | |||||||||||||||||||||||||
in Euro | 780 | — | 3,121 | — | — | — | 3,901 | 3,901 | ||||||||||||||||||||||||
Average interest rate | 1.50% | — | 3.80% | — | — | — | 3.34% | |||||||||||||||||||||||||
Investment contracts | 2,765 | 1,922 | 2,259 | 591 | 953 | 224,010 | 232,500 | 229,222 | ||||||||||||||||||||||||
Average guaranteed interest rate | 1.42% | 0.80% | 1.32% | 2.12% | 1.69% | 2.49% | 2.44% | |||||||||||||||||||||||||
Long-term insurance contracts | 107,665 | 23,963 | 23,861 | 25,615 | 81,730 | 1,736,232 | 1,999,066 | |||||||||||||||||||||||||
Average guaranteed interest rate | 2.52% | 2.58% | 2.57% | 2.68% | 3.24% | 2.61% | 2.63% | |||||||||||||||||||||||||
Equity Price Risk
Our investments in securities investment funds or equity securities expose us to changes in equity prices. We manage this risk on an integrated basis with other risks through our asset-liability management strategies. We also manage equity price risk through industry and issuer diversification and asset allocation techniques.
The following table sets forth our exposure to equity securities as of December 31, 2017, 20162019, 2018 and 2015.2017.
| As of December 31, | As of December 31, | |||||||||||||||||||||||||||||||||||||||||||||||
| 2015 | 2016 | 2017 | 2017 | 2018 | 2019 | |||||||||||||||||||||||||||||||||||||||||||
| Carrying amount | Fair value | Carrying amount | Fair value | Carrying amount | Fair value | Carrying amount | Fair value | Carrying amount | Fair value | Carrying amount | Fair value | |||||||||||||||||||||||||||||||||||||
| (RMB in millions) | ||||||||||||||||||||||||||||||||||||||||||||||||
Equity securities | 411,623 | 411,623 | 421,383 | 421,383 | 409,528 | 409,528 | 409,528 | 409,528 | 424,657 | 424,657 | 605,568 | 605,568 | ||||||||||||||||||||||||||||||||||||
Securities at fair value through profit or loss | 43,006 | 43,006 | 54,718 | 54,718 | 53,918 | 53,918 | 53,918 | 53,918 | 50,714 | 50,714 | 56,402 | 56,402 | ||||||||||||||||||||||||||||||||||||
Available-for-sale | 368,617 | 368,617 | 366,665 | 366,665 | 355,610 | 355,610 | 355,610 | 355,610 | 373,943 | 373,943 | 549,166 | 549,166 | ||||||||||||||||||||||||||||||||||||
A hypothetical 10% decline in the December 31, 2017, 20162019, 2018 and 20152017 value of the securities at fair value through profit or loss equity securities would result in an unrealized loss charged to the income statement of approximately RMB 5,3925,640 million, RMB 5,4725,071 million and RMB 4,3015,392 million, respectively.
A hypothetical 10% decline in the December 31, 2017, 20162019, 2018 and 20152017 value of theavailable-for-sale equity securities would result in an unrealized loss charged to the income statement of approximately RMB 35,56154,917 million, RMB 36,66737,394 million and RMB 36,86235,561 million, respectively.
The selection of a 10% immediate change in the value of equity securities should not be construed as a prediction by us of future market events but rather as an illustration of the potential impact of such an event.
Foreign Exchange Risk
Our exposure to fluctuations in foreign currency exchange rates against RMB results primarily from our holdings innon-RMB denominated term deposits and our foreign currency-denominated loans. Our debts and capital expenditures are predominantly denominated in RMB, and the principal currencies which create foreign currency exchange rate risk in our deposits are the U.S. dollar and Hong Kong dollar. The principal currencies which expose us to foreign currency exchange risk in our loans are the British pound, U.S. dollar and Euro.Our borrowings in foreign currencies include a three-year bank loan of EUR 67 million with a maturity date on January 18, 2021, a five-year bank loan of GBP275GBP 275 million with a maturity date on June 17, 2019,25, 2024, a three-yearfive-year bank loan of US$ 860 million with a maturity date on September 16, 2024, and asix-month bank loan of EUR 127 million with a maturity date on January 11, 2020 which is automatically renewed upon maturity pursuant to the terms of the agreement, all of which are fixed rate loans, and a five-year bank loan of US$ 970 million with a maturity date on September 27, 2019, a three-year bank loan of US$ 940 million with a maturity date on September 30, 2019 and aone-month bank loan of EUR100 million with a maturity date on January 11, 2018, all of which are fixed rate loans, and2024, a three-year loan of EUR400EUR 400 million with a maturity date on December 6, 2020, and aone-year bank loan of US$ 18 million with a maturity date on November 6, 2020, all of which is aare floating rate loan.Weloans.We recorded RMB 5267 million (US$ 810 million) in foreign exchange gainslosses for the year ended December 31, 2017,2019, resulting mainly from an increasethe change in foreign exchange rates applicable to our allocation in assestsassets and liabilities held in foreign currencies and the fluctuation of the Renminbi exchange rate.Futurecurrencies.Future movements in the exchange rate of RMB against the U.S. dollar and other foreign currencies may adversely affect our results of operations and financial condition.
The following tables set forth assets denominated in currencies other than RMB as of December 31, 2017, 20162019, 2018 and 2015.2017.
| Expected Maturity Date | Expected Maturity Date | |||||||||||||||||||||||||||||||||||||||||||||||||||||||||||||||
| As of December 31, 2017 | 2018 | 2019 | 2020 | 2021 | 2022 | Thereafter | Total | Fair value | ||||||||||||||||||||||||||||||||||||||||||||||||||||||||
| As of December 31, 2019 | 2020 | 2021 | 2022 | 2023 | 2024 | Thereafter | Total | Fair value | ||||||||||||||||||||||||||||||||||||||||||||||||||||||||
| (in millions) | (in millions) | |||||||||||||||||||||||||||||||||||||||||||||||||||||||||||||||
Debt securities | ||||||||||||||||||||||||||||||||||||||||||||||||||||||||||||||||
in US$ | 1,587 | 1 | 17 | 33 | — | 181 | 1,819 | 1,828 | 7,804 | 46 | 6 | 37 | 36 | 294 | 8,223 | 8,240 | ||||||||||||||||||||||||||||||||||||||||||||||||
Average interest rate | 0.77% | 0.13% | 4.12% | 5.95% | — | 3.79% | 1.20% | 2.29% | 5.50% | 0.12% | 3.75% | 5.44% | 3.67% | 2.38% | ||||||||||||||||||||||||||||||||||||||||||||||||||
Other | — | 1 | — | — | — | 26 | 27 | 27 | — | — | 1 | — | 3 | 55 | 59 | 59 | ||||||||||||||||||||||||||||||||||||||||||||||||
Average interest rate | — | 0.14% | — | — | — | 1.02% | 0.98% | — | — | 2.69% | — | 0.27% | 0.77% | 0.77% | ||||||||||||||||||||||||||||||||||||||||||||||||||
Term deposits | ||||||||||||||||||||||||||||||||||||||||||||||||||||||||||||||||
in US$ | 7,744 | — | — | — | — | — | 7,744 | 7,744 | 8,026 | — | — | — | — | — | 8,026 | 8,026 | ||||||||||||||||||||||||||||||||||||||||||||||||
Average interest rate | 3.21% | — | — | — | — | — | 3.21% | |||||||||||||||||||||||||||||||||||||||||||||||||||||||||
in HK$ | 32 | — | — | — | — | — | 32 | 32 | ||||||||||||||||||||||||||||||||||||||||||||||||||||||||
Average interest rate | 1.96% | — | — | — | — | — | 1.96% | 2.57% | — | — | — | — | — | 2.57% | ||||||||||||||||||||||||||||||||||||||||||||||||||
Loans | ||||||||||||||||||||||||||||||||||||||||||||||||||||||||||||||||
in US$ | — | — | — | — | — | 952 | 952 | 952 | — | — | — | — | — | 1,592 | 1,592 | 1,778 | ||||||||||||||||||||||||||||||||||||||||||||||||
Average interest rate | — | — | — | — | — | 4.00% | 4.00% | — | — | — | — | — | 4.12% | 4.12% | ||||||||||||||||||||||||||||||||||||||||||||||||||
Cash and cash equivalents | ||||||||||||||||||||||||||||||||||||||||||||||||||||||||||||||||
in US$ | 1,246 | — | — | — | — | — | 1,246 | 1,246 | 1,842 | — | — | — | — | — | 1,842 | 1,842 | ||||||||||||||||||||||||||||||||||||||||||||||||
Average interest rate | 0.09% | — | — | — | — | — | 0.09% | 0.05% | — | — | — | — | — | 0.05% | ||||||||||||||||||||||||||||||||||||||||||||||||||
in HK$ | 185 | — | — | — | — | — | 185 | 185 | 444 | — | — | — | — | — | 444 | 444 | ||||||||||||||||||||||||||||||||||||||||||||||||
Average interest rate | — | — | — | — | — | — | — | — | — | — | — | — | — | — | ||||||||||||||||||||||||||||||||||||||||||||||||||
in British pound | 282 | — | — | — | — | — | 282 | 282 | 406 | — | — | — | — | — | 406 | 406 | ||||||||||||||||||||||||||||||||||||||||||||||||
Average interest rate | — | — | — | — | — | — | — | — | — | — | — | — | — | — | ||||||||||||||||||||||||||||||||||||||||||||||||||
in Euro | 128 | 128 | 128 | 20 | — | — | — | — | — | 20 | 20 | |||||||||||||||||||||||||||||||||||||||||||||||||||||
Average interest rate | — | — | — | — | — | — | — | — | — | |||||||||||||||||||||||||||||||||||||||||||||||||||||||
Other | 3 | — | — | — | — | — | 3 | 3 | 3 | — | — | — | — | — | 3 | 3 | ||||||||||||||||||||||||||||||||||||||||||||||||
Average interest rate | — | — | — | — | — | — | — | — | — | — | — | — | — | — | ||||||||||||||||||||||||||||||||||||||||||||||||||
Liabilities | ||||||||||||||||||||||||||||||||||||||||||||||||||||||||||||||||
Interest-bearing loans and other borrowings | ||||||||||||||||||||||||||||||||||||||||||||||||||||||||||||||||
in British pound | — | 2,413 | — | — | — | — | 2,413 | 2,413 | — | — | — | — | 2,515 | — | 2,515 | 2,515 | ||||||||||||||||||||||||||||||||||||||||||||||||
Average interest rate | — | 3.54% | — | — | — | — | 3.54% | — | — | — | — | 3.08% | — | 3.08% | ||||||||||||||||||||||||||||||||||||||||||||||||||
in US$ | — | 12,480 | — | — | — | — | 12,480 | 12,480 | 126 | — | — | — | 12,766 | — | 12,892 | 12,892 | ||||||||||||||||||||||||||||||||||||||||||||||||
Average interest rate | — | 2.35% | — | — | — | — | 2.35% | 2.70% | — | — | — | 3.18% | — | 3.18% | ||||||||||||||||||||||||||||||||||||||||||||||||||
in Euro | 780 | — | 3,121 | — | — | — | 3,901 | 3,901 | 4,115 | 523 | — | — | — | — | 4,638 | 4,638 | ||||||||||||||||||||||||||||||||||||||||||||||||
Average interest rate | 1.50% | — | 3.80% | — | — | — | 3.34% | 3.25% | 2.50% | — | — | — | — | 3.16% | ||||||||||||||||||||||||||||||||||||||||||||||||||
Debt securities in US$ Average interest rate Other Average interest rate Term deposits in US$ Average interest rate Cash and cash equivalents in US$ Average interest rate in HK$ Average interest rate in British pound Average interest rate Other Average interest rate Liabilities Interest-bearing loans and other borrowings in British pound Average interest rate in US$ Average interest rate in Euro Average interest rate Expected Maturity Date As of December 31, 2016 2017 2018 2019 2020 2021 Thereafter Total Fair
value (in millions) 288 — 1 13 34 176 512 518 — — 0.12% 5.50% 6.15% 3.82% 1.87% — — 3 — — 26 29 29 — — 1.05% — — 1.26% 1.24% 6,106 — — — — — 6,106 6,106 1.51% — — — — — 1.51% 2,685 — — — — — 2,685 2,685 0.53% — — — — — 0.53% 2,083 — — — — — 2,083 2,083 — — — — — — — 145 — — — — — 145 145 — — — — — — — 15 — — — — — 15 15 — — — — — — — — — 2,339 — — — 2,339 2,339 — — 3.54% — — — 3.54% — — 13,100 — — — 13,100 13,100 — — 2.35% — — — 2.35% 731 — — — — — 731 731 1.50% — — — — — 1.50%
| Expected Maturity Date | ||||||||||||||||||||||||||||||||
| As of December 31, 2018 | 2019 | 2020 | 2021 | 2022 | 2023 | Thereafter | Total | Fair value | ||||||||||||||||||||||||
| (in millions) | ||||||||||||||||||||||||||||||||
Debt securities | ||||||||||||||||||||||||||||||||
in US$ | 2,814 | 17 | 25 | 12 | 35 | 114 | 3,017 | 3,019 | ||||||||||||||||||||||||
Average interest rate | 2.52% | 4.33% | 5.60% | 2.75% | 5.05% | 4.04% | 2.64% | |||||||||||||||||||||||||
Other | 3 | — | — | — | — | 28 | 31 | 31 | ||||||||||||||||||||||||
Average interest rate | 0.14% | — | — | — | — | 0.91% | 0.85% | |||||||||||||||||||||||||
Term deposits | ||||||||||||||||||||||||||||||||
in US$ | 7,502 | — | — | — | — | — | 7,502 | 7,502 | ||||||||||||||||||||||||
Average interest rate | 2.21% | — | — | — | — | — | 2.21% | |||||||||||||||||||||||||
Loans | ||||||||||||||||||||||||||||||||
in US$ | — | — | — | — | — | 1,766 | 1,766 | 1,835 | ||||||||||||||||||||||||
Average interest rate | — | — | — | — | — | 4.12% | 4.12% | |||||||||||||||||||||||||
Cash and cash equivalents | ||||||||||||||||||||||||||||||||
in US$ | 1,768 | — | — | — | — | — | 1,768 | 1,768 | ||||||||||||||||||||||||
Average interest rate | 0.01% | — | — | — | — | — | 0.01% | |||||||||||||||||||||||||
in HK$ | 261 | — | — | — | — | — | 261 | 261 | ||||||||||||||||||||||||
Average interest rate | — | — | — | — | — | — | — | |||||||||||||||||||||||||
in British pound | 286 | — | — | — | — | — | 286 | 286 | ||||||||||||||||||||||||
Average interest rate | — | — | — | — | — | — | — | |||||||||||||||||||||||||
in Euro | 43 | — | — | — | — | — | 43 | 43 | ||||||||||||||||||||||||
Average interest rate | — | — | — | — | — | — | — | |||||||||||||||||||||||||
Other | — | — | — | — | — | — | — | — | ||||||||||||||||||||||||
Average interest rate | — | — | — | — | — | — | — | |||||||||||||||||||||||||
Liabilities | ||||||||||||||||||||||||||||||||
Interest-bearing loans and other borrowings | ||||||||||||||||||||||||||||||||
in British pound | 2,385 | — | — | — | — | — | 2,385 | 2,385 | ||||||||||||||||||||||||
Average interest rate | 3.54% | — | — | — | — | — | 3.54% | |||||||||||||||||||||||||
in US$ | 13,108 | — | — | — | — | — | 13,108 | 13,108 | ||||||||||||||||||||||||
Average interest rate | 2.35% | — | — | — | — | — | 2.35% | |||||||||||||||||||||||||
in Euro | 993 | 3,139 | 525 | — | — | — | 4,657 | 4,657 | ||||||||||||||||||||||||
Average interest rate | 1.50% | 3.80% | 2.50% | — | — | — | 3.16% | |||||||||||||||||||||||||
Debt securities in US$ Average interest rate Term deposits in US$ Average interest rate Cash and cash equivalents in US$ Average interest rate in HK$ Average interest rate in British pound Average interest rate Liabilities Interest-bearing loans and other borrowings in British pound Average interest rate Expected Maturity Date As of December 31, 2015 2016 2017 2018 2019 2020 Thereafter Total Fair
value (in millions) 597 4 — — 12 92 705 711 4.51% 0.13% — — 6.47% 4.18% 4.48% 5,431 — — — — — 5,431 5,431 1.87% — — — — — 1.87% 3,743 — — — — — 3,743 3,743 0.03% — — — — — 0.03% 636 — — — — — 636 636 — — — — — — — 132 — — — — — 132 132 0.01% — — — — — 0.01% — — — 2,643 — — 2,643 2,643 — — — 4.02% — — 4.02%
| Expected Maturity Date | ||||||||||||||||||||||||||||||||
| As of December 31, 2017 | 2018 | 2019 | 2020 | 2021 | 2022 | Thereafter | Total | Fair value | ||||||||||||||||||||||||
| (in millions) | ||||||||||||||||||||||||||||||||
Debt securities | ||||||||||||||||||||||||||||||||
in US$ | 1,587 | 1 | 17 | 33 | — | 181 | 1,819 | 1,828 | ||||||||||||||||||||||||
Average interest rate | 0.77% | 0.13% | 4.12% | 5.95% | — | 3.79% | 1.20% | |||||||||||||||||||||||||
Other | — | 1 | — | — | — | 26 | 27 | 27 | ||||||||||||||||||||||||
Average interest rate | — | 0.14% | — | — | — | 1.02% | 0.98% | |||||||||||||||||||||||||
Term deposits | ||||||||||||||||||||||||||||||||
in US$ | 7,744 | — | — | — | — | — | 7,744 | 7,744 | ||||||||||||||||||||||||
Average interest rate | 1.96% | — | — | — | — | — | 1.96% | |||||||||||||||||||||||||
Loans | ||||||||||||||||||||||||||||||||
in US$ | — | — | — | — | — | 952 | 952 | 952 | ||||||||||||||||||||||||
Average interest rate | — | — | — | — | — | 4.00% | 4.00% | |||||||||||||||||||||||||
Cash and cash equivalents | ||||||||||||||||||||||||||||||||
in US$ | 1,246 | — | — | — | — | — | 1,246 | 1,246 | ||||||||||||||||||||||||
Average interest rate | 0.09% | — | — | — | — | — | 0.09% | |||||||||||||||||||||||||
in HK$ | 185 | — | — | — | — | — | 185 | 185 | ||||||||||||||||||||||||
Average interest rate | — | — | — | — | — | — | — | |||||||||||||||||||||||||
in British pound | 282 | — | — | — | — | — | 282 | 282 | ||||||||||||||||||||||||
Average interest rate | — | — | — | — | — | — | — | |||||||||||||||||||||||||
in Euro | 128 | — | — | — | — | — | 128 | 128 | ||||||||||||||||||||||||
Average interest rate | — | — | — | — | — | — | — | |||||||||||||||||||||||||
Other | 3 | — | — | — | — | — | 3 | 3 | ||||||||||||||||||||||||
Average interest rate | — | — | — | — | — | — | — | |||||||||||||||||||||||||
Liabilities | ||||||||||||||||||||||||||||||||
Interest-bearing loans and other borrowings | ||||||||||||||||||||||||||||||||
in British pound | — | 2,413 | — | — | — | — | 2,413 | 2,413 | ||||||||||||||||||||||||
Average interest rate | — | 3.54% | — | — | — | — | 3.54% | |||||||||||||||||||||||||
in US$ | — | 12,480 | — | — | — | — | 12,480 | 12,480 | ||||||||||||||||||||||||
Average interest rate | — | 2.35% | — | — | — | — | 2.35% | |||||||||||||||||||||||||
in Euro | 780 | — | 3,121 | — | — | — | 3,901 | 3,901 | ||||||||||||||||||||||||
Average interest rate | 1.50% | — | 3.80% | — | — | — | 3.34% | |||||||||||||||||||||||||
ITEM 12. DESCRIPTION OF SECURITIES OTHER THAN EQUITY SECURITIES.
Not applicable.
Not applicable.
Not applicable.
The table below sets forth all fees and charges that a holder of our ADRs may have to pay to the depositary bank of our ADR program, either directly or indirectly.
Category | Depositary Actions | Associated Fee | ||
| (a) Depositing or substituting the underlying shares | Each person to whom ADRs are issued against deposits of shares, including deposits and issuances in respect of:
share distributions, rights, merger
exchange of securities or any other transaction or event or other distribution affecting the ADSs or the deposited securities | US$ 5.00 for each 100 ADSs (or portion thereof) evidenced by the new ADRs delivered | ||
| (b) Receiving or distributing dividends | Distribution of dividends | US$ 0.02 or less per ADS | ||
| (c) Selling or exercising rights | Distribution or sale of securities, the fee being in an amount equal to the fee for the execution and delivery of ADSs which would have been charged as a result of the deposit of such securities | US$ 5.00 for each 100 ADSs (or portion thereof) | ||
| (d) Withdrawing an underlying security | Acceptance of ADRs surrendered for withdrawal of deposited securities | US$ 5.00 for each 100 ADSs (or portion thereof) evidenced by the ADRs surrendered | ||
| (e) Transferring, splitting or grouping receipts | Transfers, combining or grouping of depositary receipts | US$ 1.50 per ADS | ||
| (f) Expenses of the depositary | Expenses incurred on behalf of ADR holders in connection with:
compliance with foreign exchange control regulations or any law or regulation relating to foreign investment;
the depositary’s or its custodian’s compliance with applicable law, rule or regulation;
stock transfer or other taxes and other governmental charges;
cable, telex, facsimile transmission and delivery;
expenses of the depositary in connection with the conversion of foreign currency into U.S. dollars (which are paid out of such foreign currency); and
any other charge payable by depositary or its agents. | Expenses payable at the sole discretion of the depositary by billing ADR holders or by deducting charges from one or more cash dividends or other cash distributions. | ||
Deutsche Bank Trust Company Americas, or Deutsche Bank, has served as the depositary bank of our ADR program since January 4, 2010. Deutsche Bank has agreed to reimburse certain reasonable company expenses related to our ADR program and incurred by us in connection with our ADR program. The table below sets forth the amounts reimbursed from January 1, 20172019 to April 6, 2018.10, 2020.
Category of Expenses | Amount Reimbursed from January 1, to April | |||
NYSE listing fees | US$ | |||
Legal fees | US$ | |||
Investor relations(1) | US$ | |||
Broker reimbursements(2) | US$ | |||
|
| |||
Total | US$ | |||
|
| |||
| (1) | Includes expenses related to announcement of results, ADR training programs,non-deal roadshows and investor relations activities. |
| (2) | Broker reimbursements are fees payable to Broadridge and other service providers for the distribution of hard copy material to beneficial ADR holders holding in the Depositary Trust Company. Corporate material includes information related to shareholders’ meetings and related voting instruction cards. These fees are SEC approved. |
ITEM 13. DEFAULTS, DIVIDEND ARREARAGES AND DELINQUENCIES.
None.
ITEM 14. MATERIAL MODIFICATIONS TO THE RIGHTS OF SECURITY HOLDERS AND USE OF PROCEEDS.
A. MATERIAL MODIFICATION TO THE RIGHTS OF SECURITY HOLDERS
See “Item 10. Additional Information—Articles of Association”.
The following use of proceeds information relates to our registration statement on FormF-1 (FileNo. 333-110615), filed by us in connection with our initial public offering of H shares in the United States. In connection with the registration of the H shares, a registration statement on FormF-6 (FileNo.333-110622) was also filed for ADSs representing such H shares. Each of these two registration statements was declared effective by the SEC on December 11, 2003. Our H shares commenced trading on the Hong Kong Stock Exchange on December 18, 2003 and the ADSs on the New York Stock Exchange on December 17, 2003.
The net proceeds from the initial public offering of our shares, after deduction of fees and expenses, amounted to RMB 24,707 million and were held in either H.K. dollars or U.S. dollars.As of the date of this annual report, a part of the cash proceeds from our global offering was held in bank deposit accounts denominated in foreign currencies in China, and part of the cash proceeds was invested in securities listed on overseas stock exchanges, multi-asset portfolios and private equity funds. We invested approximately US$ 433 million, in addition to 2,282 million in Renminbi, in Guangdong Development Bank in December 2006. We used approximately HK$ 12 billion for investments in Sino-Ocean Land HoldingsGroup Holding Limited in 2009, 2010 and 2013. As of December 31, 2017,2019, we had engaged 1310 third party overseas investment managers to manage US$ 1,6001,363 million for investment in overseas public markets.
ITEM 15. CONTROLS AND PROCEDURES.
Disclosure Controls and Procedures
As required by Rule13a-15(b) of the Securities Exchange Act of 1934, we have carried out an evaluation, under the supervision and with the participation of our management, including our chief executive officer and our chief financial officer, of the effectiveness of our disclosure controls and procedures as of December 31, 2017,2019, the end of the period covered by this annual report. Based on that evaluation, our chief executive officer and our chief financial officer concluded that our disclosure controls and procedures were effective at a reasonable assurance level as of December 31, 2017.2019.
Management’s Report on Internal Control over Financial Reporting
Management of China Life Insurance Company Limited (together with its consolidated subsidiaries, the “Company”) is responsible for establishing and maintaining adequate internal control over financial reporting as defined in Rules13a-15(f) and15d-15(f) under the Securities Exchange Act of 1934, as amended. The Company’s internal control over financial reporting is a process designed to provide reasonable assurance regarding the reliability of financial reporting and the preparation of financial statements for external purposes in accordance with applicable generally accepted accounting principles. The Company’s internal control over financial reporting includes those policies and procedures that:
pertain to the maintenance of records that, in reasonable detail, accurately and fairly reflect the transactions and dispositions of the assets and liabilities of the Company;
provide reasonable assurance that transactions are recorded as necessary to permit preparation of financial statements in accordance with the applicable generally accepted accounting principles, and that receipts and expenditures of the Company are being made only in accordance with authorizations of management and directors of the Company; and
provide reasonable assurance regarding prevention or timely detection of unauthorized acquisition, use or disposition of the Company’s assets that could have a material effect on the financial statements.
Because of its inherent limitations, internal control over financial reporting may not prevent or detect misstatements. Also, projections of any evaluation of effectiveness to future periods are subject to the risk that controls may become inadequate because of changes in conditions, or that the degree of compliance with the policies or procedures may deteriorate.
Management assessed the effectiveness of the Company’s internal control over financial reporting as of December 31, 2017.2019. In making this assessment, management used the criteria set forth by the Committee of Sponsoring Organizations of the Treadway Commission (“COSO”) in Internal Control—Integrated Framework (2013 framework). Based on this assessment, management determined that the Company’s internal control over financial reporting was effective as of December 31, 2017.2019.
The Company’s internal control over financial reporting as of December 31, 20172019 has been audited by Ernst & Young Hua Ming LLP, an independent registered public accounting firm, as stated in their report which is on pagesF-3pagesF-6 andF-4 of F-7of this annual report, which expresses an unqualified opinion on the effectiveness of the Company’s internal control over financial reporting as of December 31, 2017.2019.
Changes in Internal Control over Financial Reporting
There were no changes to the Company’s internal control over financial reporting as defined in Exchange Act Rule13a-15(f) during the year ended December 31, 20172019 that have materially affected, or are reasonably likely to materially affect, the Company’s internal control over financial reporting.
ITEM 16A. AUDIT COMMITTEE FINANCIAL EXPERT.
Our board of directors has determined that Mr. Chang Tso Tung Stephenqualifies as an audit committee financial expert as defined in Item 16A of Form20-F. Mr. Chang Tso Tung Stephen is “independent” in accordance with the applicable requirements of Rule10A-3 of the Securities Exchange Act of 1934. Mr. Chang was appointed as an independentnon-executive director and a member of the audit committee of our Company in October 2014. For Mr. Chang’sbiographical information, see “Item 6. Directors, Senior Management and Employees”.
At the board of directors meeting held on June 29, 2004, we adopted a code of business conduct and ethics that applies to our chief executive officer, chief financial officer, controller and other senior officers of our company. We have filed the adopted code of business conduct and ethics as an exhibit to our annual report on Form20-F for the fiscal year ended December 31, 2004, as filed on May 27, 2005.
ITEM 16C. PRINCIPAL ACCOUNTANT FEES AND SERVICES.
The following table sets forth the aggregate audit fees, audit-related fees, tax fees and all other fees paid to our principal accountants for the fiscal years of 20172019 and 2016.2018.
| Audit Fees(1) | Audit-Related Fees | Tax Fees | All Other Fees(2) | |||||||||||||
| (RMB in millions) | ||||||||||||||||
2017 | 59 | — | — | 1 | ||||||||||||
2016 | 58 | — | — | 2 | ||||||||||||
| Audit Fees(1) | Audit-Related Fees | Tax Fees | All Other Fees(2) | |||||||||||||
| (RMB in millions) | ||||||||||||||||
2019 | 61 | — | — | 3 | ||||||||||||
2018 | 60 | — | — | 5 | ||||||||||||
| (1) | Audit fees include fees billed for professional services rendered for audits of the consolidated financial statements and review of interim financial statements of China Life and fees billed for performing agreed-upon procedures. |
| (2) | All other fees include fees billed for advisory services which do not affect the independence of our principal accountants. |
According to our current internal rules, before our principal accountants are engaged by us to render audit ornon-audit services, the engagement must be approved by our audit committee.
ITEM 16D. EXEMPTIONS FROM THE LISTING STANDARDS FOR AUDIT COMMITTEES.
Not applicable.
ITEM 16E. PURCHASES OF EQUITY SECURITIES BY THE ISSUER AND AFFILIATED PURCHASERS.
As of December 31, 2017,2019, China Life and its subsidiaries had not purchased, sold or redeemed any of China Life’s shares.
ITEM 16F. CHANGE IN REGISTRANT’S CERTIFYING ACCOUNTANT.
Not Applicable.
ITEM 16G. CORPORATE GOVERNANCE.GOVERNANCE
As a Chinese company with H shares, ADSs and A shares publicly traded on the HKSE, the NYSE and the SSE, respectively, we must comply with the corporate governance standards provided by PRC company law and other laws, as well as the securities laws and regulations in Hong Kong, United States and the listing requirements of the HKSE, the NYSE and the SSE that are applicable to us. The description set forth below includes, for purpose of Section 303A.11 of the NYSE Listed Company Manual, a summary of the significant ways in which our corporate governance practices differ from those followed by U.S. domestic companies under NYSE rules.
Board Independence
We identify our independentnon-executive directors in accordance with the qualifications provided by relevant PRC and Hong Kong regulations, which prohibit independent directors from having, among other things, specified interests in our securities or business, relationships with the management and financial dependence on us. These tests vary in certain respects with those set forth under Section 303A.02 of the NYSE Listed Company Manual.
Section 303A.02 of the NYSE Listed Company Manual also requires the board of directors to affirmatively determine that the director has no material relationship with the company (either directly or as a partner, shareholder or officer of an organization that has a relationship with the company). Under the HKSE Listing Rules, each independentnon-executive director must provide an annual confirmation of his independence to the listed company. Under the Tentative Guidelines on Corporate Governance of Insurance Companies issued by the CIRC in 2006 (the “Chinese Insurance Company Corporate Governance Guidelines”), each independent director must make a public announcement of the director’s independence and commitment to duties.
Section 303A.01 of the NYSE Listed Company Manual provides that a U.S. domestic issuer must have a majority of independent directors, unless more than 50% of such issuer’s voting power for the election of directors is controlled by an individual, a group or another company (a “controlled company”). Because more than 60% of our voting power is controlled by CLIC, we, as with controlled U.S. domestic companies, would not be required to comply with this independent board requirement. As of the date of this annual report, our board of directors comprised eleven directors, including fourthree executive directors, threefournon-executive directors and four independentnon-executive directors.
Section 303A.03 of the NYSE Listed Company Manual requires a U.S. domestic company to have itsnon-management directors meet at regularly scheduled executive sessions without management and hold an executive session including only independent directors at least once a year, or hold regular executive sessions of independent directors. Under the HKSE corporate governance rules, effective since Aprilfrom January 1, 2012,2019, the chairman of our board of directors is required to have a meeting with independentnon-executive directors (including independentnon-executive directors) only without the executiveother directors present at least once a year. On December 19, 2019, the chairman of our board convened a meeting with independentnon-executive directors only without the other directors present to discuss the operational management and development reform of our company.
Nominating/Corporate Governance Committee and Compensation Committee
Under Section 303A.04 of the NYSE Listed Company Manual, a U.S. domestic company must have a nominating/corporate governance committee composed entirely of independent directors with a written charter that addresses certain specified responsibilities, unless it is a “controlled company”. Section 303A.05 of the NYSE Listed Company Manual requires a U.S. domestic company to have a compensation committee composed entirely of independent directors with a written charter that addresses certain specified duties, unless it is a “controlled company”. We, as with controlled U.S. domestic companies, are not required under NYSE rules to have such a nominating/corporate governance committee or compensation committee. We have established a nominating and remuneration committee in accordance with the HKSE Listing Rules, comprised of a majority of independentnon-executive directors as required under those rules.The primary duties of the nomination and remuneration committee are to review the structure and components of our board of directors, to formulate the appointment and successors to our board of directors and senior management, to review and recommend the nomination of our directors and senior officers, as well as to propose to our board of directors the remuneration policy for our directors, supervisors and senior management.
The Guiding Opinions on Regulating Governance Structure of Insurance Companies require that nominating and remuneration committees of Chinese insurance companies be comprised entirely ofnon-executive directors with the independent directors as the Chairmen. In 2017,2019, our nominating and remuneration committee comprised two independentnon-executive directors and onenon-executive director with one of the independentnon-executive directors serving as the chairman. We have complied with the composition requirements of the nomination and remuneration committee as prescribed under the Chinese Insurance Company Corporate Governance Guidelines.
Audit Committee
The NYSE rules set forth two levels of audit committee standards for U.S. domestic companies and foreign private issuers.As a foreign private issuer, we are required to comply with the audit committee requirements under Section 303A.06 of the NYSE Listed Company Manual, such as audit committee independence and certain functions and powers, but are not subject to the additional qualifications, independence, function and other requirements for U.S. domestic companies provided under Section 303A.07 of the NYSE Listed Company Manual.
We have established an audit committee in accordance with the requirements of Section 303A.06 of the NYSE Listed Company Manual, the HKSE Listing Rules and the Chinese Insurance Company Corporate Governance Guidelines.In 2017,2019, our audit committee comprised three independentnon-executive directors with one of them serving as the chairman.The primary duties of the audit committee are to review and supervise the financial reporting process, to assess the effectiveness of our risk management and internal control system, to supervise our internal audit system and its implementation and to implement and recommend the engagement or replacement of external auditors. Our audit committee is also responsible for communications between our internal and external auditors and our internal reporting system.
Corporate Governance Guidelines
Under Section 303A.09 of the NYSE Listed Company Manual, a U.S. domestic company must adopt and disclose corporate governance guidelines that address specified key subjects. We are not required by Chinese or Hong Kong laws or requirements to, and currently do not, have such corporate governance guidelines. However, we address several of the key subjects required by the NYSE Listed Company Manual to be included in the corporate governance guidelines in our articles of association, Rules of Procedures for Board of Directors, Rules of Internal Control and other internal corporate documents.
In addition, under the HKSE Listing Rules, we are expected to comply with, but may choose to deviate from, the provisions of the Corporate Governance Code in the HKSE Listing Rules, which sets out the principles of good corporate governance for issuers. However, we are required to disclose the reasons for deviation, if any, in our interim and annual reports.
We are required by the CSRC to disclose in our annual report filed with the Shanghai Stock Exchange our actual corporate governance practice as compared with CSRC’s rules on corporate governance of listed companies. Under such rules, we are required to disclose whether there is any material difference between our actual practices and the requirements under such rules, and explain the details and reasons for such differences, if any. Accordingly, we have disclosed in our annual report for the year of 20172019 filed with the Shanghai Stock Exchange that we had established a corporate governance structure with well-defined duties and responsibilities strictly in accordance with the PRC Company Law and PRC Securities Law as well as relevant rules and regulations, and that our actual corporate governance practices are generally in compliance with the applicable regulatory rules and requirements of the jurisdictions where we are listed.
Code of Business Conduct and Ethics
Section 303A.10 of the NYSE Listed Company Manual requires U.S. domestic companies to adopt and disclose a code of business conduct and ethics for directors, officers and employees, and promptly disclose any waivers of the code for directors or executive officers. We have adopted a Code of Business Conduct and Ethics for Directors and Senior Officers and Code of Conduct for Employees. We have disclosed the Code of Business Conduct and Ethics for Directors and Senior Officers in our annual report under Form20-F for fiscal year ended December 31, 2004 and are required to disclose in the annual report under Form20-F any waivers of the code for directors or executive officers. In addition, according to the HKSE Listing Rules, all of our directors must comply with the Model Code for Securities Transactions by Directors of Listed Companies that sets forth the required standards with which the directors of a listed company must comply in securities transactions of the listed company. Under the Listing Rules of the Shanghai Stock Exchange, any of the directors, supervisors or senior management of the listed company may not transfer any shares of such company held by him/her within one year of the listing of the company or six months after leaving the company. During his/her tenure at the company, the number of shares transferred each year must not exceed 25% of the total number of shares of the company held by him/her, provided, however, if the directors, supervisors or senior management leave the company before the expiration of his/her tenure, during the term of his/her original tenure determined at the time of his/her appointment, the number of shares transferred each year must not exceed 25% of the total number of shares of the company held by him/her and may not transfer any shares within half a year after the expiration of the term of his/her original tenure determined at the time of his/her appointment. During his/her tenure at the company, he/she must file with the Shanghai Stock Exchange for record in advance any proposed transaction in the shares of the company in accordance with the relevant rules and regulations. In case of changes in shareholdings in the company, he/she shall report the changes on a timely basis to the company, which must then make relevant announcements on the website of the Shanghai Stock Exchange.
Certification Requirements
Under Section 303A.12(a) of the NYSE Listed Company Manual, each U.S. domestic company Chief Executive Officer must certify to the NYSE each year that he or she is not aware of any violation by the listed company of NYSE corporate governance listing standards. There are no similar requirements under PRC or Hong Kong laws or requirements.
| ITEM 16H. | MINE SAFETY DISCLOSURE. |
Not applicable.
ITEM 17. FINANCIAL STATEMENTS.
We have elected to provide the financial statements and related information specified in Item 18 in lieu of Item 17.
ITEM 18. FINANCIAL STATEMENTS.
See Index to Consolidated Financial Statements for a list of all financial statements filed as part of this annual report.
(a) See Item 18 for a list of the financial statements filed as part of this annual report.
(b) Exhibits to this annual report.
EXHIBIT INDEX
|
| |
8.1 | List of subsidiaries of the Registrant | |
11.1 | Code of Business Conduct and Ethics | |
12.1 | Certification pursuant to Rule13a-14(a) | |
12.2 | Certification pursuant to Rule13a-14(a) | |
13.1 | Certification pursuant to Rule13a-14(a) and Section 1350 of Chapter 63 of Title 18 of the United States Code | |
101 | ||
| (1) | Incorporated by reference to the Registration Statement on FormF-1 (FileNo. 333-110615), filed with the Commission on December 9, 2003. |
| (2) | Incorporated by reference to the Registration Statement on FormF-6 (FileNo. 333-164005), filed with the Commission on January 4, 2010. |
| (3) | Incorporated by reference to the Post-Effective Amendment No. 1 to FormF-6 (FileNo. 333-164005), filed with the Commission on January 27, 2015. |
| (4) | Incorporated by reference to the Post-Effective Amendment No. 2 to FormF-6 (FileNo. 333-164005), filed with the Commission on May 1, 2015. |
| (5) | Incorporated by reference to the Annual Report on Form20-F for the fiscal year ended December 31, 2017, filed with the Commission on April 25, 2018. |
| (6) | Incorporated by reference to the Annual Report on Form20-F for the fiscal year ended December 31, 2004, |
Incorporated by reference to the Annual Report on Form20-F for the fiscal year ended December 31, 2014, filed with the Commission on April 24, 2015. |
Incorporated by reference to the Annual Report on Form20-F for the fiscal year ended December 31, |
SIGNATURES
The registrant hereby certifies that it meets all of the requirements for filing on Form20-F and that it has duly caused and authorized the undersigned to sign this annual report on its behalf.
| China Life Insurance Company Limited | ||
| By: | /s/ | |
| Name: | ||
| Su Hengxuan | ||
| Title: President and Executive Director | ||
Date: April25, 2018April 29, 2020
CHINA LIFE INSURANCE COMPANY LIMITED
(Incorporated in the People’s Republic of China with limited liability)
Audited Consolidated Financial Statements
For the year ended 31 December 2017
CHINA LIFE INSURANCE COMPANY LIMITED
INDEX TO CONSOLIDATED FINANCIAL STATEMENTS
Historical Consolidated Financial StatementsContents
Report of Independent Registered Public Accounting FirmREPORT OF INDEPENDENT REGISTERED PUBLIC ACCOUNTING FIRM
To the Shareholders and the Board of Directors of China Life Insurance Company Limited
Opinion on the Financial Statements
We have audited the accompanying consolidated statements of financial position of China Life Insurance Company Limited (the “Company”)Company) as of 31 December 31, 20172019 and 2016,2018, the related consolidated statements of comprehensive income, changes in equity and cash flows for each of the twothree years in the period ended 31 December 31, 2017,2019, and the related notes (collectively referred to as the “consolidated financial statements”). In our opinion, the consolidated financial statements present fairly, in all material respects, the financial position of the Company at 31 December 31, 20172019 and 2016,2018, and the results of its operations and its cash flows for each of the twothree years in the period ended 31 December 31, 2017,2019, in conformity with International Financial Reporting Standards as issued by the International Accounting Standards Board.
We also have audited, in accordance with the standards of the Public Company Accounting Oversight Board (United States) (“PCAOB”)(PCAOB), the Company’s internal control over financial reporting as of 31 December 31, 2017,2019, based on criteria established in Internal Control-Integrated Framework issued by the Committee of Sponsoring Organizations of the Treadway Commission (2013 framework), and our report dated 29 April 25, 20182020 expressed an unqualified opinion thereon.
Adoption of New Accounting Standard
As discussed in Note 2.1.1 to the consolidated financial statements, the Company changed its method for accounting for leases using a modified retrospective approach during the year ended 31 December 2019.
Basis for Opinion
These financial statements are the responsibility of the Company’s management. Our responsibility is to express an opinion on the Company’s financial statements based on our audits. We are a public accounting firm registered with the PCAOB and are required to be independent with respect to the Company in accordance with the U.S. federal securities laws and the applicable rules and regulations of the Securities and Exchange Commission and the PCAOB.
We conducted our audits in accordance with the standards of the PCAOB. Those standards require that we plan and perform the audit to obtain reasonable assurance about whether the financial statements are free of material misstatement, whether due to error or fraud. Our audits included performing procedures to assess the risks of material misstatement of the financial statements, whether due to error or fraud, and performing procedures that respond to those risks. Such procedures included examining, on a test basis, evidence regarding the amounts and disclosures in the financial statements. Our audits also included evaluating the accounting principles used and significant estimates made by management, as well as evaluating the overall presentation of the financial statements. We believe that our audits provide a reasonable basis for our opinion.
Critical Audit Matters
The critical audit matters communicated below are matters arising from the current period audit of the financial statements that were communicated or required to be communicated to the audit committee and that: (1) relate to accounts or disclosures that are material to the financial statements and (2) involved our especially challenging, subjective or complex judgments. The communication of critical audit matters does not alter in any way our opinion on the financial statements, taken as a whole, and we are not, by communicating the critical audit matters below, providing separate opinions on the critical audit matters or on the accounts or disclosures to which they relate.
REPORT OF INDEPENDENT REGISTERED PUBLIC ACCOUNTING FIRM (CONTINUED)
Valuation of insurance contract liabilities | ||
Description of the Matter | At 31 December 2019, the Group had significant insurance contract liabilities in the amount of RMB2,552.74 billion. As disclosed in Notes 2.12 and 15 to the consolidated financial statements, the Group’s insurance contract liabilities are primarily comprised of long-term insurance contract liabilities. The Group uses the discounted cash flow method to estimate the reserve of long-term insurance contracts. Auditing the Group’s long-term insurance contract liabilities was complex and required the involvement of specialists due to the complexity of the actuarial models and highly judgemental nature of the actuarial assumptions used by management to estimate the liabilities. The actuarial assumptions include mortality, morbidity, lapse rates, discount rates, and expenses. Changes in these assumptions could have significant effects on the valuation of the long-term insurance contract liabilities. | |
How We Addressed the Matter in Our Audit | We obtained an understanding, evaluated the design and tested the operating effectiveness of controls over the Group’s long-term insurance contract liabilities valuation processes. For example, we tested controls over management’s review of the actuarial models, the actuarial assumptions, and the data inputs used. To test the valuation of long-term insurance contract liabilities, our audit procedures included, among others, comparing the methodology, actuarial models and actuarial assumptions used by the Group to recognised actuarial practices and testing the completeness and accuracy of the underlying insurance policy data used in the valuation. We involved our actuarial specialists to assist us with assessing the reasonableness of the assumptions by comparing them to industry data, historical experiences and expectations of the Group. For a sample of selected insurance products, our actuarial specialists performed an independent recalculation of the long-term insurance contract liabilities. In addition, our actuarial specialists assessed the reasonableness of the movement of long-term insurance contract liabilities considering changes in the actuarial assumptions in the reporting period. | |
REPORT OF INDEPENDENT REGISTERED PUBLIC ACCOUNTING FIRM (CONTINUED)
Theimpairmenttestforinvestmentin anassociate | ||
Description of the Matter | At 31 December 2019, the Group held a material investment in an associate, Sino-Ocean Group Holding Limited (“Sino-Ocean”), a company listed on the Stock Exchange of Hong Kong Limited, with a carrying value of RMB11.39 billion. As disclosed in Note 9 to the consolidated financial statements, as the quoted market price of this investment has been continuously below its carrying value, the Group performed an impairment test, and recognised an impairment loss of RMB1.50 billion in 2019. Auditing management’s impairment test of Sino-Ocean was complex due to the significant estimates and judgements involved in management’s assessment of its value in use, including the selling prices of development properties, rental prices of investment properties included in the projection of future cash flows and the discount rates used. These estimates and judgements may be affected by unexpected changes in the future market or economic conditions. | |
How We Addressed the Matter in Our Audit | We obtained an understanding, evaluated the design and tested the operating effectiveness of internal controls over the Group’s investment impairment test of Sino-Ocean. For example, we tested controls over management’s review of the impairment test methodology and the significant assumptions used in the valuation. To test the impairment test of Sino-Ocean, our audit procedures included, among others, evaluating the Group’s valuation methodology and testing the completeness and accuracy of the underlying data used in the cash flows projection. We compared the selling prices of development properties and rental prices of investment properties used in the cash flow projection to the historical business results of Sino-Ocean and industry data. We also involved our internal valuation specialists to assist us with assessing the reasonableness of the Group’s valuation methodology with reference to valuation guidelines and industry practice. In addition, we compared the discount rate used by the Group with the discount rate developed by our valuation specialists using information of comparable companies. | |
REPORT OF INDEPENDENT REGISTERED PUBLIC ACCOUNTING FIRM (CONTINUED)
FairvalueoflevelIIIfinancialassets | ||
Description of the Matter | At 31 December 2019, the Group held material investments in certain financial assets such as private equity funds, preference shares, other equity and debt investments, which are accounted for as available-for-sale securities at fair value or securities at fair value through profit or loss with a combined carrying value of RMB234.99 billion. As disclosed in Note 4.4 to the consolidated financial statements, these investments are classified as level III in the fair value hierarchy as their fair values are measured using valuation methodologies with significant unobservable inputs. Auditing the fair value measurement of the Group’s level III financial assets was complex due to the significant estimates and judgements involved in the assessment of valuation methodologies and significant unobservable inputs, including discount rates for factors such as lack of marketability and credit risk, among others. The use of different valuation methodologies and changes in significant unobservable inputs could result in significantly different fair value estimates. | |
How We Addressed the Matter in Our Audit | We obtained an understanding, evaluated the design and tested the operating effectiveness of internal controls over the Group’s fair value measurement of level III financial assets. For example, we tested management’s review controls over the valuation methodologies and the significant unobservable inputs used in the fair value measurements. To test the fair value measurement of level III financial assets, our audit procedures included, among others, evaluating the Group’s valuation methodologies, testing the significant unobservable inputs used by the Group in determining the fair values, and testing the mathematical accuracy of the Group’s valuation calculations. We involved our valuation specialists to assist us with evaluating the Group’s valuation methodologies and assessing the reasonableness of the significant unobservable inputs, including discount rates for factors such as lack of marketability and credit risk, among others used in the valuations by comparing them to information available from third-party sources and market data. For a sample of the Group’s level III financial assets, our valuation specialists also independently developed fair value estimates and compared them to the Group’s valuation results. | |
/s/ Ernst & Young Hua Ming LLP
We have served as the Company’s auditor since 2013.
Beijing, People’s Republic of China
Report of Independent Registered Public Accounting FirmREPORT OF INDEPENDENT REGISTERED PUBLIC ACCOUNTING FIRM
To the Shareholders and the Board of Directors of China Life Insurance Company Limited
Opinion on Internal Control over Financial Reporting
We have audited China Life Insurance Company Limited’s internal control over financial reporting as of 31 December 31, 2017,2019, based on criteria established in Internal Control—Control — Integrated Framework issued by the Committee of Sponsoring Organizations of the Treadway Commission (2013 framework) (the COSO criteria). In our opinion, China Life Insurance Company Limited (the Company) maintained, in all material respects, effective internal control over financial reporting as of 31 December 31, 2017,2019, based on the COSO criteria.
We also have audited, in accordance with the standards of the Public Company Accounting Oversight Board (United States) (PCAOB), the consolidated statements of financial position of the Company as of 31 December 31, 20172019 and 2016,2018, the related consolidated statements of comprehensive income, changes in equity and cash flows for each of the twothree years in the period ended 31 December 31, 2017,2019, and the related notes, and our report dated 29 April 25, 20182020 expressed an unqualified opinion thereon.
Basis for Opinion
The Company’s management is responsible for maintaining effective internal control over financial reporting and for its assessment of the effectiveness of internal control over financial reporting included in the accompanying Management’s Report on Internal Control over Financial Reporting. Our responsibility is to express an opinion on the Company’s internal control over financial reporting based on our audit. We are a public accounting firm registered with the PCAOB and are required to be independent with respect to the Company in accordance with the U.S. federal securities laws and the applicable rules and regulations of the Securities and Exchange Commission and the PCAOB.
We conducted our audit in accordance with the standards of the PCAOB. Those standards require that we plan and perform the audit to obtain reasonable assurance about whether effective internal control over financial reporting was maintained in all material respects.
Our audit included obtaining an understanding of internal control over financial reporting, assessing the risk that a material weakness exists, testing and evaluating the design and operating effectiveness of internal control based on the assessed risk, and performing such other procedures as we considered necessary in the circumstances. We believe that our audit provides a reasonable basis for our opinion.
Report of Independent Registered Public Accounting Firm (continued)
Definition and Limitations of Internal Control Over Financial Reporting
A company’s internal control over financial reporting is a process designed to provide reasonable assurance regarding the reliability of financial reporting and the preparation of financial statements for external purposes in accordance with generally accepted accounting principles. A company’s internal control over financial reporting includes those policies and procedures that (1) pertain to the maintenance of records that, in reasonable detail, accurately and fairly reflect the transactions and dispositions of the assets of the company; (2) provide reasonable assurance that transactions are recorded as necessary to permit preparation of financial statements in accordance with generally accepted accounting principles, and that receipts and expenditures of the company are being made only in accordance with authorizations of management and directors of the company; and (3) provide reasonable assurance regarding prevention or timely detection of unauthorized acquisition, use, or disposition of the company’s assets that could have a material effect on the financial statements.
Because of its inherent limitations, internal control over financial reporting may not prevent or detect misstatements. Also, projections of any evaluation of effectiveness to future periods are subject to the risk that controls may become inadequate because of changes in conditions, or that the degree of compliance with the policies or procedures may deteriorate.
/s/ Ernst & Young Hua Ming LLP
Beijing, People’s Republic of China
29 April 25, 20182020
Report of Independent Registered Public Accounting Firm
The Board of Directors and Shareholders of China Life Insurance Company Limited
We have audited the consolidated statements of comprehensive income, changes in equity and cash flows of China Life Insurance Company Limited (the “Company”) for the year ended December 31, 2015. These financial statements are the responsibility of the Company’s management. Our responsibility is to express an opinion on these financial statements based on our audits.
We conducted our audit in accordance with the standards of the Public Company Accounting Oversight Board (United States). Those standards require that we plan and perform the audit to obtain reasonable assurance about whether the financial statements are free of material misstatement. An audit includes examining, on a test basis, evidence supporting the amounts and disclosures in the financial statements. An audit also includes assessing the accounting principles used and significant estimates made by management, as well as evaluating the overall financial statement presentation. We believe that our audits provide a reasonable basis for our opinion.
In our opinion, the consolidated financial statements referred to above present fairly, in all material respects, the consolidated results of its operations and its cash flows for the year ended December 31, 2015, in conformity with International Financial Reporting Standards as issued by the International Accounting Standards Board.
/s/ Ernst & Young
Hong Kong
April 22, 2016
CHINA LIFE INSURANCE COMPANY LIMITED
Consolidated Statement of Financial Position
As at 31 December 20172019
| Notes | As at 31 December 2017 RMB million | As at 31 December 2016 RMB million | Notes | As at 31 December 2019 RMB million | As at 31 December 2018 RMB million | |||||||||||||||||
ASSETS | ||||||||||||||||||||||
Property, plant and equipment | 6 | 42,707 | 30,389 | 6 | 51,758 | 47,281 | ||||||||||||||||
Right-of-use assets | 7 | 3,520 | — | |||||||||||||||||||
Investment properties | 7 | 3,064 | 1,191 | 8 | 12,141 | 9,747 | ||||||||||||||||
Investments in associates and joint ventures | 8 | 161,472 | 119,766 | 9 | 222,983 | 201,661 | ||||||||||||||||
Held-to-maturity securities | 9.1 | 717,037 | 594,730 | 10.1 | 928,751 | 806,717 | ||||||||||||||||
Loans | 9.2 | 383,504 | 226,573 | 10.2 | 608,920 | 450,251 | ||||||||||||||||
Term deposits | 9.3 | 449,400 | 538,325 | 10.3 | 535,260 | 559,341 | ||||||||||||||||
Statutory deposits – restricted | 9.4 | 6,333 | 6,333 | |||||||||||||||||||
Statutory deposits - restricted | 10.4 | 6,333 | 6,333 | |||||||||||||||||||
Available-for-sale securities | 9.5 | 810,734 | 766,423 | 10.5 | 1,058,957 | 870,533 | ||||||||||||||||
Securities at fair value through profit or loss | 9.6 | 136,809 | 209,124 | 10.6 | 141,608 | 138,717 | ||||||||||||||||
Derivative financial assets | 10.7 | 428 | — | |||||||||||||||||||
Securities purchased under agreements to resell | 9.7 | 36,185 | 43,538 | 10.8 | 4,467 | 9,905 | ||||||||||||||||
Accrued investment income | 9.8 | 50,641 | 55,945 | 10.9 | 41,703 | 48,402 | ||||||||||||||||
Premiums receivable | 11 | 14,121 | 13,421 | 12 | 17,281 | 15,648 | ||||||||||||||||
Reinsurance assets | 12 | 3,046 | 2,134 | 13 | 5,161 | 4,364 | ||||||||||||||||
Other assets | 13 | 33,952 | 22,013 | 14 | 34,029 | 33,437 | ||||||||||||||||
Deferred tax assets | 29 | 128 | 1,257 | |||||||||||||||||||
Cash and cash equivalents | 48,586 | 67,046 | 53,306 | 50,809 | ||||||||||||||||||
|
|
|
| |||||||||||||||||||
Total assets | 2,897,591 | 2,696,951 | 3,726,734 | 3,254,403 | ||||||||||||||||||
|
|
|
| |||||||||||||||||||
The notes on pages 15 to 97110 form an integral part of these consolidated financial statements.
F-8
CHINA LIFE INSURANCE COMPANY LIMITED
Consolidated Statement of Financial Position (continued)
As at 31 December 2017
| Notes | As at 31 December 2017 RMB million | As at 31 December 2016 RMB million | Notes | As at 31 December 2019 RMB million | As at 31 December 2018 RMB million | |||||||||||||||||
LIABILITIES AND EQUITY | ||||||||||||||||||||||
Liabilities | ||||||||||||||||||||||
Insurance contracts | 14 | 2,025,133 | 1,847,986 | 15 | 2,552,736 | 2,216,031 | ||||||||||||||||
Investment contracts | 15 | 232,500 | 195,706 | 16 | 267,804 | 255,434 | ||||||||||||||||
Policyholder dividends payable | 83,910 | 87,725 | 112,593 | 85,071 | ||||||||||||||||||
Interest-bearing loans and borrowings | 16 | 18,794 | 16,170 | 17 | 20,045 | 20,150 | ||||||||||||||||
Lease liabilities | 3,091 | — | ||||||||||||||||||||
Bonds payable | 17 | — | 37,998 | 18 | 34,990 | — | ||||||||||||||||
Financial liabilities at fair value through profit or loss | 2,529 | 2,031 | 3,859 | 2,680 | ||||||||||||||||||
Derivative financial liabilities | 10.7 | — | 1,877 | |||||||||||||||||||
Securities sold under agreements to repurchase | 18 | 87,309 | 81,088 | 19 | 118,088 | 192,141 | ||||||||||||||||
Annuity and other insurance balances payable | 44,820 | 39,038 | 51,019 | 49,465 | ||||||||||||||||||
Premiums received in advance | 18,505 | 35,252 | 60,898 | 46,650 | ||||||||||||||||||
Other liabilities | 19 | 47,430 | 36,836 | 20 | 81,114 | 58,426 | ||||||||||||||||
Deferred tax liabilities | 28 | 4,871 | 7,768 | 29 | 10,330 | — | ||||||||||||||||
Current income tax liabilities | 6,198 | 1,214 | 223 | 2,630 | ||||||||||||||||||
Statutory insurance fund | 20 | 282 | 491 | 21 | 602 | 558 | ||||||||||||||||
|
|
|
| |||||||||||||||||||
Total liabilities | 2,572,281 | 2,389,303 | 3,317,392 | 2,931,113 | ||||||||||||||||||
|
|
|
| |||||||||||||||||||
Equity | ||||||||||||||||||||||
Share capital | 33 | 28,265 | 28,265 | 35 | 28,265 | 28,265 | ||||||||||||||||
Other equity instruments | 34 | 7,791 | 7,791 | 36 | 7,791 | 7,791 | ||||||||||||||||
Reserves | 35 | 145,675 | 145,007 | 37 | 197,221 | 149,293 | ||||||||||||||||
Retained earnings | 139,202 | 122,558 | 170,487 | 133,022 | ||||||||||||||||||
|
|
|
| |||||||||||||||||||
Attributable to equity holders of the Company | 320,933 | 303,621 | 403,764 | 318,371 | ||||||||||||||||||
|
|
|
| |||||||||||||||||||
Non-controlling interests | 4,377 | 4,027 | 5,578 | 4,919 | ||||||||||||||||||
|
|
|
| |||||||||||||||||||
Total equity | 325,310 | 307,648 | 409,342 | 323,290 | ||||||||||||||||||
|
|
|
| |||||||||||||||||||
Total liabilities and equity | 2,897,591 | 2,696,951 | 3,726,734 | 3,254,403 | ||||||||||||||||||
|
|
|
| |||||||||||||||||||
Approved and authorised for issue by the Board of Directors on 2225 March 2018.2020.
The notes on pages 15 to 97110 form an integral part of these consolidated financial statements.
CHINA LIFE INSURANCE COMPANY LIMITED
Consolidated Statement of Comprehensive Income
For the year ended 31 December 20172019
| 2017 | 2016 | 2015 | 2019 RMB million | 2018 RMB million | 2017 RMB million | |||||||||||||||||||||||||||
| Notes | RMB million | RMB million | RMB million | Notes | ||||||||||||||||||||||||||||
REVENUES | ||||||||||||||||||||||||||||||||
Gross written premiums | 511,966 | 430,498 | 363,971 | 567,086 | 535,826 | 511,966 | ||||||||||||||||||||||||||
Less: premiums ceded to reinsurers | (3,661 | ) | (1,758 | ) | (978 | ) | (5,238 | ) | (4,503 | ) | (3,661 | ) | ||||||||||||||||||||
|
|
|
|
|
| |||||||||||||||||||||||||||
Net written premiums | 508,305 | 428,740 | 362,993 | 561,848 | 531,323 | 508,305 | ||||||||||||||||||||||||||
Net change in unearned premium reserves | (1,395 | ) | (2,510 | ) | (692 | ) | (1,570 | ) | 700 | (1,395 | ) | |||||||||||||||||||||
|
|
|
|
|
| |||||||||||||||||||||||||||
Net premiums earned | 506,910 | 426,230 | 362,301 | 560,278 | 532,023 | 506,910 | ||||||||||||||||||||||||||
|
|
|
|
|
| |||||||||||||||||||||||||||
Investment income | 21 | 122,727 | 109,147 | 97,582 | 22 | 139,919 | 125,167 | 122,727 | ||||||||||||||||||||||||
Net realised gains on financial assets | 22 | 42 | 6,038 | 32,297 | 23 | 1,831 | (19,591 | ) | 42 | |||||||||||||||||||||||
Net fair value gains through profit or loss | 23 | 6,183 | (7,094 | ) | 10,209 | 24 | 19,251 | (18,278 | ) | 6,183 | ||||||||||||||||||||||
Other income | 7,493 | 6,460 | 5,060 | 8,195 | 8,098 | 7,493 | ||||||||||||||||||||||||||
|
|
|
|
|
| |||||||||||||||||||||||||||
Total revenues | 643,355 | 540,781 | 507,449 | 729,474 | 627,419 | 643,355 | ||||||||||||||||||||||||||
|
|
|
|
|
| |||||||||||||||||||||||||||
BENEFITS, CLAIMS AND EXPENSES | ||||||||||||||||||||||||||||||||
Insurance benefits and claims expenses | ||||||||||||||||||||||||||||||||
Life insurance death and other benefits | 24 | (259,708 | ) | (253,157 | ) | (221,701 | ) | 25 | (127,877 | ) | (248,736 | ) | (259,708 | ) | ||||||||||||||||||
Accident and health claims and claim adjustment expenses | 24 | (33,818 | ) | (27,269 | ) | (21,009 | ) | 25 | (50,783 | ) | (40,552 | ) | (33,818 | ) | ||||||||||||||||||
Increase in insurance contract liabilities | 24 | (172,517 | ) | (126,619 | ) | (109,509 | ) | 25 | (330,807 | ) | (189,931 | ) | (172,517 | ) | ||||||||||||||||||
Investment contract benefits | 25 | (8,076 | ) | (5,316 | ) | (2,264 | ) | 26 | (9,157 | ) | (9,332 | ) | (8,076 | ) | ||||||||||||||||||
Policyholder dividends resulting from participation in profits | (21,871 | ) | (15,883 | ) | (33,491 | ) | (22,375 | ) | (19,646 | ) | (21,871 | ) | ||||||||||||||||||||
Underwriting and policy acquisition costs | (64,789 | ) | (52,022 | ) | (35,569 | ) | (81,396 | ) | (62,705 | ) | (64,789 | ) | ||||||||||||||||||||
Finance costs | 26 | (4,601 | ) | (4,767 | ) | (4,320 | ) | 27 | (4,255 | ) | (4,116 | ) | (4,601 | ) | ||||||||||||||||||
Administrative expenses | (35,953 | ) | (31,854 | ) | (27,458 | ) | (40,275 | ) | (37,486 | ) | (35,953 | ) | ||||||||||||||||||||
Other expenses | (6,426 | ) | (4,859 | ) | (7,428 | ) | (9,602 | ) | (7,642 | ) | (6,426 | ) | ||||||||||||||||||||
Statutory insurance fund contribution | 20 | (1,068 | ) | (1,048 | ) | (743 | ) | 21 | (1,163 | ) | (1,097 | ) | (1,068 | ) | ||||||||||||||||||
|
|
|
|
|
| |||||||||||||||||||||||||||
Total benefits, claims and expenses | (608,827 | ) | (522,794 | ) | (463,492 | ) | (677,690 | ) | (621,243 | ) | (608,827 | ) | ||||||||||||||||||||
|
|
|
|
|
| |||||||||||||||||||||||||||
Share of profit of associates and joint ventures, net | 8 | 7,143 | 5,855 | 1,974 | ||||||||||||||||||||||||||||
Net gains on investments of associates and joint ventures | 9 | 8,011 | 7,745 | 7,143 | ||||||||||||||||||||||||||||
Including: share of profit of associates and joint ventures | 9,159 | 7,745 | 7,143 | |||||||||||||||||||||||||||||
|
|
|
|
|
| |||||||||||||||||||||||||||
Profit before income tax | 27 | 41,671 | 23,842 | 45,931 | 28 | 59,795 | 13,921 | 41,671 | ||||||||||||||||||||||||
Income tax | 28 | (8,919 | ) | (4,257 | ) | (10,744 | ) | 29 | (781 | ) | (1,985 | ) | (8,919 | ) | ||||||||||||||||||
|
|
|
|
|
| |||||||||||||||||||||||||||
Net profit | 32,752 | 19,585 | 35,187 | 59,014 | 11,936 | 32,752 | ||||||||||||||||||||||||||
|
|
|
|
|
| |||||||||||||||||||||||||||
Attributable to: | ||||||||||||||||||||||||||||||||
- Equity holders of the Company | 32,253 | 19,127 | 34,699 | 58,287 | 11,395 | 32,253 | ||||||||||||||||||||||||||
-Non-controlling interests | 499 | 458 | 488 | 727 | 541 | 499 | ||||||||||||||||||||||||||
Basic and diluted earnings per share | 29 | RMB1.13 | RMB0.66 | RMB1.22 | 30 | RMB2.05 | RMB0.39 | RMB1.13 | ||||||||||||||||||||||||
|
|
|
|
|
| |||||||||||||||||||||||||||
The notes on pages 15 to 97110 form an integral part of these consolidated financial statements.