UNITED STATES
SECURITIES AND EXCHANGE COMMISSION
Washington, D.C. 20549
FORM20-F
| ☐ | REGISTRATION STATEMENT PURSUANT TO SECTION 12(b) OR (g) OF THE SECURITIES EXCHANGE ACT OF 1934 |
OR
| ☒ | ANNUAL REPORT PURSUANT TO SECTION 13 OR 15(d) OF THE SECURITIES EXCHANGE ACT OF 1934 |
For the fiscal year ended December 31, 20182020
OR
| ☐ | TRANSITION REPORT PURSUANT TO SECTION 13 OR 15(d) OF THE SECURITIES EXCHANGE ACT OF 1934 |
OR
| ☐ | SHELL COMPANY REPORT PURSUANT TO SECTION 13 OR 15(d) OF THE SECURITIES EXCHANGE ACT OF 1934 |
Date of event requiring this shell company report
For the transition period from to
Commission file number001-35991
GRAÑA Y MONTEROAENZA S.A.A.
(Formerly “Graña y Montero S.A.A.”)
(Exact name of Registrant as specified in its charter)
N/A
(Translation of Registrant’s name into English)
Republic of Peru
(Jurisdiction of incorporation or organization)
Av. Paseo de la República 4667
Surquillo
Lima 34, Peru
(Address of principal executive offices)
Daniel Urbina Pérez, Chief Legal Officer
Tel.011-51-1-213-6565
relacion.inversionistas@gym.com.perelacion.inversionistas@aenza.com.pe
Av. Paseo de la República 4667
Surquillo
Lima 34, Peru
(Name, telephone,e-mail and/or facsimile number and address of company contact person)
Securities registered pursuant to Section 12(b) of the Act:
| | | | |
Title of each class | | Trading Symbol | | Name of each exchange on which registered |
Common Shares, par value s/.1.001.00 per share American Depositary Shares, each representing five Common Shares | | AENZ | | New York Stock Exchange* New York Stock Exchange |
| * | Not for trading purposes, but only in connection with the registration on the New York Stock Exchange of the American Depositary Shares representing those common shares. |
Securities registered pursuant to Section 12(g) of the Act:
None
Securities for which there is a reporting obligation
pursuant to Section 15(d) of the Act:
None
Indicate the number of outstanding shares of each of the issuer’s classes of capital or common stock as of the close of the period covered by the annual report:
| | |
At December 31, 20182020 | | 729,434,192871,917,855 shares of common stock |
Indicate by check mark if the Registrant is a well-known seasoned issuer, as defined in Rule 405 of the Securities Act. Yes ☐ No ☒
If this report is an annual or transition report, indicate by check mark if the registrant is not required to file reports pursuant to Section 13 or 15(d) of the Securities Exchange Act of 1934. Yes ☐ No ☒
Note –- Checking the box above will not relieve any registrant required to file reports pursuant to Section 13 or 15(d) of the Securities Exchange Act of 1934 from their obligations under those Sections.
Indicate by check mark whether the Registrant (1) has filed all reports required to be filed by Section 13 or 15(d) of the Securities Exchange Act of 1934 during the preceding 12 months (or for such shorter period that the Registrant was required to file such reports), and (2) has been subject to such filing requirements for the past 90 days. Yes ☐ No ☒
Indicate by check mark whether the Registrant has submitted electronically every Interactive Data File required to be submitted pursuant to Rule 405 of RegulationS-T (§232.405 of this chapter) during the preceding 12 months (or for such shorter period that the Registrant was required to submit such files). Yes ☒ No ☐
Indicate by check mark whether the Registrant is a large accelerated filer, an accelerated filer, anon-accelerated filer, or an emerging growth company. See definitions of “large accelerated filer,” “accelerated filer,” and “emerging growth company” in Rule12b-2 of the Exchange Act. (Check one):
| | | | | | | | | | |
Large accelerated filer ☒ | | ☐ | | Accelerated filer ☐ | | ☒ | | Non-accelerated filer | | ☐ |
| | | | | |
| | | | | | | | Emerging growth company | | ☐ |
If an emerging growth company that prepares its financial statements in accordance with U.S. GAAP, indicate by check mark if the registrant has elected not to use the extended transition period for complying with any new or revised financial accounting standards† provided pursuant to Section 13(a) of the Exchange Act. ☐
†The term “new or revised financial accounting standard” refers to any update issued by the Financial Accounting Standards Board to its Accounting Standards Codification after April 5, 2012.
Indicate by check mark whether the registrant has filed a report on and attestation to its management’s assessment of the effectiveness of its internal control over financial reporting under Section 404(b) of the Sarbanes-Oxley Act (15 U.S.C. 7262(b)) by the registered public accounting firm that prepared or issued its audit report. Yes ☒ No ☐
Indicate by check mark which basis of accounting the Registrant has used to prepare the financial statements included in this filing:
| | | | | | | | |
U.S. GAAP ☐ | | | | International Financial Reporting Standards as issued | | | | | | Other ☐ |
| | by the International Accounting Standards Board | | ☒ | | Other ☐ | | |
If “Other” has been checked in response to the previous question, indicate by check mark which financial statement item the Registrant has elected to follow. Item 17 ☐ Item 18 ☐
If this is an annual report, indicate by check mark whether the registrant is a shell company (as defined in Rule12b-2 of the Exchange Act). Yes ☐ No ☒
(APPLICABLE ONLY TO ISSUERS INVOLVED IN BANKRUPTCY PROCEEDINGS DURING THE PAST FIVE YEARS)
Indicate by check mark whether the registrant has filed all documents and reports required to be filed by Sections 12, 13 or 15(d) of the Securities Exchange Act of 1934 subsequent to the distribution of securities under a plan confirmed by a court. Yes ☐ No ☐
PART I.
PART I.INTRODUCTION
INTRODUCTION
Certain Definitions
All references to “we”, “us”, “our”,“we,” “us,” “our, company”,” “our company,” “the group” and “Graña y Montero”“AENZA” in this annual report are to GrañAENZA S.A.A. (formerly, “Graña y Montero S.A.A.,”) a publicly-held corporation (sociedad anónima abierta) organized under the laws of Peru.the Republic of Peru (“Peru”). In this annual report, we refer to our principal subsidiaries, joint operations, joint ventures and associated companies as follows: (i) in our Engineering and Construction (E&C)(“E&C”) segment: Cumbra Perú S.A. (formerly GyM S.A.) as “GyM”“Cumbra”; Vial y Vives—DSD S.A. as “Vial y Vives—DSD”; Cumbra Ingeniería S.A. (formerly GMI S.A.) as “GMI”“Cumbra Ingeniería”; Morelco S.A.S. as “Morelco”; (ii) in our Infrastructure segment: Norvial S.A. as “Norvial”; Survial S.A. as “Survial”; Concesión Canchaque S.A. as “Canchaque”; Tren Urbano de Lima S.A. (formerly, GyM Ferrovías S.A.) as “GyM Ferrovías”“Línea 1”; Concesionaria La Chira S.A. as “La Chira”; UNNA Energía S.A. (formerly GMP S.A.) as “UNNA Energía”; and Concar S.A. as “GMP”“Concar”; and (iii) in our Real Estate segment: Viva Negocio Inmobiliario S.A. (formerly Viva GyM S.A.) as “Viva GyM”;“Viva” and Inmobiliaria Almonte S.A.C. as “Almonte” and Concar S.A. as “Concar.”. For more information on our subsidiaries, joint operations, joint ventures or associated companies, see notes 6a, 6c and 1615 to our audited annual consolidated financial statements included in this annual report.
The gas pipeline concession of Gasoducto Sur Peruano S.A. (“GSP”) was terminated on January 24, 2017, and, as a result, we recognized impairments with respect to our investment in GSP and our participation in the related construction consortium (Consorcio Constructor Ductos del Sur, or “CCDS”). Both GSP and CCDS are in the process of being liquidated. Additionally, we have recently sold certain assets and businesses, including: on April 24, 2017, the sale of our interest in Compañía Operadora de Gas del Amazonas (“COGA”); on June 6, 2017, the sale of our interest in GMD S.A. (“GMD”); on April 11, 2018, the sale of our interest in Stracon GyM S.A. (“Stracon GyM”); and, on December 4, 2018, the sale of our interest in CAM Chile S.A. (“CAM”) and CAM Servicios del Perú S.A. (“CAM Servicios”). In addition, we are in the process of marketing for sale our subsidiary Adexus S.A. (“Adexus”). For more information, see “Item 5.A. Operating and Financial Review and Prospects—Operating Results—Recent Developments.”
The term “U.S. dollar” and the symbol “US$” refer to the legal currency of the United States; the term “sol” and the symbol “S/.” refer to the legal currency of Peru; the term “Chilean peso” and the symbol “CLP” refer to the legal currency of Chile; and the term “Colombian peso” and the symbol “COP” refer to the legal currency of Colombia.
Presentation of Financial Information
Our consolidated financial statements included in this annual report have been prepared in soles and in accordance with International Financial Reporting Standards (“IFRS”) issued by the International Accounting Standards Board (“IASB”). Our annual consolidated financial statements as of December 31, 20172019 and 20182020 and for the years ended December 31, 2016, 20172018, 2019 and 20182020 have been audited by Moore StephensAssurance S.A.S. (a member firm of Moore Global Network Limited) in accordance with the standards of the Public Company Accounting Oversight Board (United States).
Our consolidated financial statements for the year ended December 31, 2017 included in this annual report have been restated. In our consolidated financial statements included in our annual report on Form20-F for the year ended December 31, 2017, we inadvertently presented the gain on the sale of GMD under “Gain from the sale of investments” in error and, accordingly, we have restated our 2017 income statement and the related notes to reflect GMD as a discontinued operation. The previously issued consolidated financial statements of the company for the 2017 fiscal year (and the related audit opinion) included in the company’s annual report on Form20-F for the year ended December 31, 2017 should not be relied upon. For more information, see note 2.31 to our audited annual consolidated financial statements included in this annual report.
We manage our business in three segments: Engineering and Construction (E&C); Infrastructure; and Real Estate. Prior to December 31, 2017, in addition to the foregoing segments, we had a Technical Services segment. However, we transferred Concar from this segment to our Infrastructure segment beginning on April 1, 2017; on June 6, 2017, we sold our interest in our former technical services subsidiary, GMD; and we are in the process of marketing for sale Adexus, our other technical services subsidiary. The historical segment financial information included in this annual report has been adjusted accordingly. For information on our results of operations by business segment, see note 7 to our audited annual consolidated financial statements included in this annual report.
We previously accounted for Adexus S.A. (“Adexus”), our technical services subsidiary, which we are marketing for sale, as an investment held for sale. However, as of September 30, 2020, following restructuring proceedings in Chile, we reclassified Adexus as a continuing operation. As a result, our financial information included in this annual report has been adjusted accordingly. Our segment data presents Adexus as a parent company operation not part of the saleany of GMDour three business segments. See note 36 to our audited annual consolidated financial statements included in this annual report.
On December 4, 2018, we sold our interests in each of CAM Chile S.A. (“CAM”) and CAM Servicios del Perú S.A. (“CAM Servicios”) and on June 6, 2017,April 11, 2018, we sold our interest in Stracon GyM S.A. (“Stracon”). As a result, we present GMDCAM, CAM Servicios and Stracon as a discontinued operationoperations in our audited annual consolidated financial statements for the years ended December 31, 20172018, 2019 and 2018. We have reclassified our consolidated financial statements for the year ended December 31, 2016, and selected financial information for the years ended December 31, 2014 and 2015, included in this annual report, to show GMD as a discontinued operation. In addition, (i) on December 4, 2018, we sold our interests in each of CAM and CAM Servicios, (ii) on April 11, 2018, we sold our interest in Stracon GyM, and (iii) we are in the process of marketing for sale our subsidiary Adexus. As a result, we present CAM, CAM Servicios and Stracon GyM as discontinued operations, and Adexus as an investment held for sale, in our audited annual consolidated financial statements for the year ended December 31, 2018. We have reclassified our consolidated financial statements for the years ended December 31, 2016 and 2017, and the selected financial information for the years ended December 31, 2014 and 2015, included in this annual report to show CAM, CAM Servicios and Stracon GyM as discontinued operations and Adexus as an investment held for sale. We have also revised prior backlog data included in this annual report to exclude the presentation of entities that are presented as discontinued operations.
We requested that the staff of the U.S. Securities and Exchange Commission (the “SEC”) grant relief from the financial statement filing requirements of Rule3-09 of RegulationS-X (“Rule3-09”) pursuant to Section 2430 of the Division of Corporation Finance Financial Reporting Manual, with respect to our investment in GSP. The SEC has not granted our company’s waiver request and, as a result, our company is required to file with the SEC separate financial statements for GSP for 2015, 2016 and 2017, with 2016 being audited. However, it is currently impracticable for our company to comply with this requirement, because the audit opinion that was issued with respect to GSP’s 2016 financial statements included a disclaimer, our company’s loss of significant influence over GSP, and GSP’s limited management as the entity is in insolvency proceedings. We believe that GSP’s financial statements would not provide additional material information to investors. However, we cannot assure you that that the SEC will not take actions against our company relating to ournon-compliance, among other matters, in the event of a capital raise, our company may be temporarily unable to have a registration statement for a public offering of securities in the United States declared effective by the SEC. For more information, see “Item 3.D. Key Information—Risk Factors—Risks Related to our Company—we are not fully compliant with our reporting requirements under the Exchange Act because of our inability to provide audited financial statements for GSP in accordance with Rule3-09 . For more information on GSP, see notes 5(e), 5(f) and 16 to our audited annual consolidated financial statements included in this annual report.2020.
Non-IFRS Data
In this annual report, we present EBITDA, anon-GAAP financial measure. Anon-GAAP financial measure is generally defined as one that purports to measure financial performance, financial position or cash flows but excludes or includes amounts that would not be so adjusted in the most comparable IFRS measure. We present EBITDA because we believe it provides readers with a supplemental measure of the financial performance of our core operations that facilitatesperiod-to-period comparisons on a consistent basis. Furthermore, we regularly present EBITDA in our filings with the Lima Stock Exchange in Peru. Our management uses EBITDA,
among other measures, for internal planning and performance measurement purposes. We believe that EBITDA is useful in evaluating our operating performance compared to other companies operating in our sectors because the calculation of EBITDA generally eliminates the effects of financing and income taxes and the accounting effects of capital spending, which items may vary for different companies for reasons unrelated to overall operating performance. EBITDA should not be construed as an alternative to net profit or operating profit, as an indicator of operating performance, as an alternative to cash flow provided by operating activities or as a measure of liquidity (in each case, as determined in accordance with IFRS). EBITDA, as calculated by us, may not be comparable to similarly titled measures reported by other companies. For our definition of EBITDA and a reconciliation of EBITDA to the most directly comparable IFRS financial measure, see “Item 3.A. Key Information—Selected FinancialData—Non-GAAP Financial Measure and Reconciliation.”
Currency Translations
Our consolidated financial statements are prepared in soles. For a description of our translation of amounts in currencies other than soles in our consolidated financial statements, see note 2.4 to our audited annual consolidated financial statements included in this annual report.
We have translated some of the soles amounts contained in this annual report into U.S. dollars and some U.S. dollars amounts contained in this annual report into soles, for convenience purposes only. Unless otherwise indicated or the context otherwise requires, the rate used to translate soles amounts to U.S. dollars and U.S. dollars amounts into soles was S/.3.3793.624 to US$1.00, which was the exchange rate reported for December 31, 20182020 by the Peruvian Superintendency of Banks, Insurance and Private Pension Fund Administrators (Superintendencia de Banca, Seguros y AFPs, or “SBS”). We present our backlog in U.S. dollars. For contracts denominated in soles or other local currencies, amounts have been converted into U.S. dollars based on the exchange rate published by the SBS on December 31 of the corresponding year. When we present our ratios of backlog and revenues in this annual report, we similarly convert our revenues, which are reported in soles, into U.S. dollars based on the exchange rate reported for December 31 of the corresponding year. For conversions of macroeconomic indicators (particularly in “Item 5.D. Operating and Financial Review and Prospects—Trend Information” in this annual report), average annual exchange rates for the currencies of each of the countries addressed are used. The Federal Reserve Bank of New York does not report a noon buying rate for soles. The U.S. dollar equivalent information presented in this annual report is provided solely for convenience of the reader and should not be construed as implying that the soles or other currency amounts represent, or could have been or could be converted into, U.S. dollars at such rates or at any other rate.
Rounding
Certain figures included in this annual report have been subject to rounding adjustments. Accordingly, figures shown as totals in certain tables may not be arithmetic aggregations of the figures that precede them.
Backlog
This annual report includes our backlog for our Engineering and Construction (E&C), Infrastructure and Real Estate segments. We do not include backlog in this annual report in our Infrastructure segment for: (i) our Norvial toll road concession because its revenues from the concession are derived from toll fees charged to vehicles using the highway, and, as a result, such revenues are dependent on vehicular traffic levels; and (ii) our Energy line of business because: (a) our revenues from hydrocarbon extraction services are dependent on the amounts of oil and gas we produce and market prices, which fluctuate significantly; (b) our revenues from our gas processing plant are dependent on the amount of gas we process and market prices for natural gas liquids, which fluctuate significantly; and (c) our revenues from our fuel storage terminal operation partially depend on the volume of fuel stored and dispatched. When we present backlog on a segment basis, we do not include eliminations that are included in our consolidated backlog. Backlog is not a measure defined by IFRS, and our methodology for determining backlog may not be comparable to the methodology used by other companies in determining their backlog. Backlog is not audited. We have revised priorhistorical backlog data included in this annual report to exclude the presentation of entities that are presented as discontinued operations. For our definition of backlog, see “Item 4.B. Information on the Company—Business Overview—Backlog.” See also “Item 3.D. Key Information—Risk Factors—Risks Related to our Company—Our backlog and our ratio of historical backlog to revenues may not be reliable indicators of future revenues or profit.”
The GSP gas pipeline concession was terminated on January 24, 2017, which had a significant impact on our backlog for our E&C and our consolidated backlog. For more information, see “Item 5.A. Operating and Financial Review and Prospects—Operating Results—Recent Developments.”
Reserves Estimates
This annual report includes our estimates for proved reserves in Blocks I and V, where GMPUNNA Energía provides hydrocarbon extraction services to, and Blocks III and IV, where GMPUNNA Energía extracts hydrocarbon under license agreements with, Perupetro S.A. (“Perupetro”). These reserves estimates were prepared internally by our team of engineers and have not been audited or reviewed by any independent external engineers. For further information on these reserves estimates, see “Item 3.D. Key Information—Risks RelatingRelated to Our Company – Company—Additional Risks Related to our Infrastructure Business” and “Item 4.B. Information on the Company—Business Overview—Infrastructure—Principal Infrastructure Lines of Business—Energy—Oil and Gas Production.”
Market Information
We make estimates in this annual report regarding our competitive position and market share, as well as the market size and expected growth of the engineering and construction, infrastructure and real estate services industries in Peru and elsewhere in Latin America. We have made these estimates on the basis of our management’s knowledge and statistics and other information, which we believe to be the most recently available as of the date of this annual report, from government agencies, industry professional organizations, industry publications and other sources. While we believe these estimates to be accurate as of the date of this annual report, we have not independently verified the data from third-party sources and our internal data has not been verified by any independent source. We paid Great Place to Work® Institute, a human resources consulting, research and training firm, for our employees to participate in their market survey referenced in this annual report (Copyright© 2018 Great Place to Work® Institute, Inc. All rights reserved.). In this annual report we present gross domestic product (“GDP”) both on a nominal and real basis. Real GDP is nominal GDP adjusted to exclude the effect of inflation. Unless otherwise indicated, references to GDP are to real GDP.
Measurements and Other Data
In this annual report, we use the following measurements:
“m” means one meter, which equals approximately 3.28084 feet;
“m2” means one square meter, which equals approximately 10.7630 square feet;
“km” means one kilometer, which equals approximately 0.621371 miles;
“hectare” means one hectare, which equals approximately 2.47105 acres;
“tonne” means one metric ton, which equals approximately 2,204.6 pounds;
“bbl” or barrel of oil means one stock tank barrel, which is equivalent to approximately 0.15898 cubic meters;
“boe” means one barrel of oil equivalent, which equals approximately 160.2167 cubic meters, determined using the ratio of 5,658 cubic feet of natural gas to one barrel of oil;
“cf” means one cubic foot;
“M,” when used before bbl, boe or cf, means one thousand bbl, boe and cf, respectively;
“MM,” when used before bbl, boe or cf, means one million bbl, boe and cf, respectively;
“MW” means one megawatt, which equals one million watts; and
“Gwh” means one gigawatt hour, which equals one billion watt hours.
In this annual report, we use the term accident incident rate“accident incidence rate” with respect to our E&C segment, which is calculated as the number of injuries divided by the total number of hours worked by all full-time employees of our E&C segment during the relevant year divided by 200,000 (which reflects 40 hours worked per week in a50-week year by 100 equivalent full-time workers).
Forward-Looking Statements
This annual report contains forward-looking statements. Forward-looking statements convey our current expectations or forecasts of future events. These statements involve known and unknown risks, uncertainties and other factors, including those listed under “Item 3.D. Key Information—Risk Factors,” which may cause our actual results, performance or achievements to differ materially from the forward-looking statements that we make.
Forward-looking statements typically are identified by words or phrases such as “may,” “will,” “expect,” “anticipate,” “aim,” “estimate,” “intend,” “project,” “plan,” “believe,” “potential,” “continue,” “is/are likely to,” or other similar expressions. Any or all of our forward-looking statements in this annual report may turn out to be inaccurate. Our actual results could differ materially from those contained in forward-looking statements due to a number of factors, including, among others:
the impact that the ongoing Novel Coronavirus 2019 (“COVID-19”) pandemic, and governments’ extraordinary measures to limit the spread of the virus, will continue to have on economic activity and the industries in which we operate;
the impact on our business reputation from our past association with Odebrecht S.A. (“Odebrecht”) affiliates in Peru;
the potential effects of investigations of our company and certain of our former directors and executive officers,senior management, or any future investigations, regarding corruption or other illegal acts;acts, including the outcome from our ongoing settlement and cooperation agreement discussions with Peruvian authorities, which may include, among other restrictions, significant penalties, admissions of guilt and temporary debarment from entering into new contracts with the government of Peru;
the potential impact of the class action civil lawsuit against our company and certain of our former directors and former and current executive officers, including our ability to comply with the payment terms of the settlement agreement;
uncertainty with regards to the timing and amount of the governmentany payment we are entitled to receive as an equity investor and creditor of Gasoducto Sur Peruano S.A. (“GSP”) in connection with the government payment required as a result of the termination of the GSP pipeline concession;concession in January of 2017;
our ability to fund our working capital and other obligations, including resulting from investigations of our company or the class action civil lawsuit against our company, through cash flow from operating activities, financing sources or the sale of assets;
our ability to comply with the covenants in our debt instruments or obtain waivers in the event ofnon-compliance;
our ability to obtain financing on favorable terms, including our ability to obtain performance bonds and similar financings required in the ordinary course of our business;
our ability to consummate asset sales or other strategic transactions on favorable terms on a timely basis, or at all;
the potential impact of the class action civil suit against our company and certain of our former directors and our former and current executive officers;
global macroeconomic conditions, including commodity prices;
economic, political and social conditions in the markets in which we operate, particularlyincluding as a result of the upcoming presidential elections and political disputes between the executive branch and congress in Peru, including the resignation of former President Pedro Pablo Kuczynskiand widespread protests in March 2018 following corruption allegations;
political conflictsChile and, deadlocks in Peru between the Peruvian Congress and the executive branch;more recently, Colombia;
major changes in Peruvian government policies at the national, regional or municipal levels, including in connection with infrastructure concessions, investments in infrastructure and affordable housing subsidies;
social conflicts in Peru that disrupt infrastructure projects, particularly in the mining sector;
interest rate fluctuation, inflation and devaluation or appreciation of the sol or Chilean peso or Colombian peso in relation to the U.S. dollar (or other currencies in which we receive revenue);
our backlog may not be a reliable indicator of future revenues or profit;
the cyclical nature of some of our business segments;
the level of capital investments and financings available for infrastructure projects of the types that we perform, both in the private and public sectors;
competition in our markets, both from local and international companies;
performance under contracts, where a failure to meet schedules, cost estimates or performance targets on a timely basis could result in reduced profit margins or losses and impact our reputation;
developments, some of which may be beyond our control, that affect our reputation in our markets, including a deterioration in our safety record;
industry-specific operational risks, such as operator errors, mechanical failures and other accidents;
availability and costs of energy, raw materials, equipment and labor;
our ability to obtain financing on favorable terms, including our ability to obtain performance bonds and similar financings; required in the ordinary course of our business;
our ability to attract and retain qualified personnel;
our ability to enter into joint operations, and rules involved in operating under joint operation or similar arrangements;
our exposure to potential liability claims and contract disputes, including as a result of environmental damage alleged to have been caused by our operations;
our and our clients’ compliance with environmental, health and safety laws and regulations, and changes in government policies and regulations in the countries in which we operate;
negotiations of claims with our clients of cost and schedule variances and change orders on major projects;
delays in client payments, and increased financing costs for working capital resulting from those delays;
volatility in global prices of oil and gas;
the cyclical naturegas, including as a result of some of our business segments;
limitations on our ability to operate our concessions profitably, including changes in traffic patterns, and limitations on our ability to obtain new concessions;
our ability to accurately estimate the costs of our projects;disputes among OPEC members;
changes in real estate market prices, customer demand, preference and purchasing power, and financing availability and terms;
our ability to obtain zoning and other license requirements for our real estate development;
changes in tax, laws;environmental, health and safety, or other laws and regulations;
natural disasters, severe weather or other events that may adversely impact our business; and
other factors identified or discussed under “Item 3.D. Key Information—Risk Factors.”
The forward-looking statements in this annual report represent our expectations and forecasts as of the date of this annual report. These statements are intended to qualify for the safe harbors from liability provided by Section 27A of the Securities Act of 1933 and Section 21E of the Securities Exchange Act of 1934. Except as required by law, we undertake no obligation to update or revise publicly any forward-looking statements, whether as a result of new information, future events or otherwise, after the date of this annual report. In particular, the COVID-19 pandemic, and governments’ extraordinary measures to limit the spread of the virus, are disrupting economic activity and the industries in which we operate, and consequently adversely affecting our business, results of operation and financial condition and, as conditions are recent, uncertain and changing rapidly, it is difficult to predict the full extent of the impact that the pandemic will have on our company.
ITEM 1. IDENTITY OF DIRECTORS, SENIOR MANAGEMENT AND ADVISERS
Not applicable.
ITEM 2. OFFER STATISTICS AND EXPECTED TIMETABLE
Not applicable.
ITEM 1.ITEM 3. KEY INFORMATION | IDENTITY OF DIRECTORS, SENIOR MANAGEMENT AND ADVISERS
|
Not applicable.
ITEM 2. | OFFER STATISTICS AND EXPECTED TIMETABLE
|
Not applicable.
| A. | Selected Financial Data |
The following selected consolidated financial data should be read together with “Part I. Introduction. Presentation of Financial Information,” “Item 5. Operations and Financial Review and Prospects” and our audited annual consolidated financial statements included in this annual report.
The following selected financial data aspreviously required by Item 3.A of December 31, 2017 and 2018 and for the years ended December 31, 2016, 2017 and 2018 have been derived from our audited annual consolidated financial statements included in this annual report. The following selected financial data as of December 31, 2014, 2015 and 2016 and for the years ended December 31, 2014 and 2015 have been derived from our audited annual consolidated financial statements not included in this annual report. Our annual consolidated financial statements for the years ended December 31, 2016, 2017 and 2018 have been audited by Moore Stephens in accordance with the standards of the Public Company Accounting Oversight Board (United States). Our consolidated financial statements for the year ended December 31, 2017 included in this annual report have been restated. In our consolidated financial statements included in our annual report on Form20-F for the year ended December 31, 2017, we inadvertently presented the gainhas been omitted in reliance on the sale of GMD under “Gain from the sale of investments” in errorSEC Release No. 33-10890,Management’s Discussion and accordingly, we have restated our 2017 income statementAnalysis, Selected Financial Data and the related notes to reflect GMD as a discontinued operation. For more information, see note 2.31 to our audited annual consolidated financial statements included in this annual report.
| | | | | | | | | | | | | | | | | | | | | | | | |
| | | For the year ended December 31, | |
| | | 2014 | | | 2015 | | | 2016(1) | | | 2017
Restated | | | 2018 | | | 2018 | |
| | | | | | (in millions of S/.) | | | | | | | | | (in millions of
US$)(2) | |
Income Statement Data: | | | | | | | | | | | | | | | | | | | | | | | | |
Revenues | | | 4,861.0 | | | | 5,542.3 | | | | 4,137.3 | | | | 4,014.0 | | | | 3,899.5 | | | | 1,154.0 | |
Cost of sales | | | (4,212.5 | ) | | | (5,210.6 | ) | | | (3,821.2 | ) | | | (3,511.6 | ) | | | (3,225.0 | ) | | | (954.4 | ) |
| | | | | | | | | | | | | | | | | | | | | | | | |
Gross profit | | | 648.5 | | | | 331.7 | | | | 316.1 | | | | 502.5 | | | | 674.5 | | | | 199.6 | |
Administrative expenses | | | (298.4 | ) | | | (291.3 | ) | | | (278.3 | ) | | | (322.5 | ) | | | (278.4 | ) | | | (82.4 | ) |
Other income and expenses, net(3) | | | 5.2 | | | | 18.3 | | | | (21.9 | ) | | | (33.3 | ) | | | (61.2 | ) | | | (18.1 | ) |
Profit (losses) from sale of investments | | | 2.1 | | | | — | | | | 46.3 | | | | 34.5 | | | | — | | | | — | |
Other (expenses) income, net | | | (0.1 | ) | | | 0.3 | | | | (0.5 | ) | | | 0.5 | | | | — | | | | — | |
| | | | | | | | | | | | | | | | | | | | | | | | |
Operating profit | | | 357.3 | | | | 58.4 | | | | 61.8 | | | | 181.7 | | | | 334.7 | | | | 99.1 | |
Financial (expense) income, net(3) | | | (58.3 | ) | | | (97.7 | ) | | | (179.8 | ) | | | (137.0 | ) | | | (197.1 | ) | | | (58.3 | ) |
Share of the profit and loss obtained from associates and joint ventures under the equity method of accounting | | | 52.9 | | | | 24.4 | | | | (590.1 | ) | | | 0.5 | | | | (3.7 | ) | | | (1.1 | ) |
Profit before income tax | | | 351.9 | | | | (14.9 | ) | | | (708.1 | ) | | | 45.1 | | | | 133.9 | | | | 39.6 | |
Income tax | | | (104.3 | ) | | | (78.7 | ) | | | 152.2 | | | | (46.3 | ) | | | (113.3 | ) | | | (33.5 | ) |
Profit from continuing operations | | | 247.6 | | | | (93.5 | ) | | | (556.0 | ) | | | (1.2 | ) | | | 20.6 | | | | 6.1 | |
Profit from discontinued operations | | | 113.7 | | | | 149.1 | | | | 104.4 | | | | 210.4 | | | | 36.8 | | | | 10.9 | |
| | | | | | | | | | | | | | | | | | | | | | | | |
Net profit | | | 361.2 | | | | 55.6 | | | | (451.6 | ) | | | 209.2 | | | | 57.4 | | | | 17.0 | |
| | | | | | | | | | | | | | | | | | | | | | | | |
Net profit (loss) attributable to controlling interest(4) | | | 299.7 | | | | 7.1 | | | | (509.7 | ) | | | 148.7 | | | | (83.2 | ) | | | (24.6 | ) |
Net profit (loss) attributable tonon-controlling interest(4) | | | 61.5 | | | | 48.5 | | | | 58.1 | | | | 60.5 | | | | 140.6 | | | | 41.6 | |
(1) | For the effects on our results of operations for 2016 resulting from the termination of the GSP gas pipeline concession, see “Item 5.A. Operating and Financial Review and Prospects—Operating Results—Recent Developments” and notes 5(e), 5(f), and 16 to our audited annual consolidated financial statements included in this annual report. In particular, we recognized an impairment to our investment in GSP of S/.593.1 million in 2016, which is recorded in Share of the profit and loss obtained from associates and joint ventures under the equity method of accounting.
|
(2) | Calculated based on an exchange rate of S/.3.379 to US$1.00 as of December 31, 2018.
|
(3) | Reflects exchange losses due to the depreciation of the sol against the U.S. dollar and our U.S. dollar denominated liabilities. For more information, see note 28 to our audited annual consolidated financial statements included in this annual report.
|
(4) | We consolidate the results of our subsidiaries in our financial statements and we reflect the profit corresponding to the minority interests in our subsidiaries under “net profit attributable tonon-controlling interests” in our income statement. With respect to our joint operations, we recognize in our consolidated financial statements the revenue and expenses, including our share of any asset, liability, revenue or expense we hold jointly with partners. We reflect the results of our associated companies under the equity method of accounting in our consolidated financial statements under the line item “share of the profit and loss in associates” in our income statement. See “Item 5.A. Operating and Financial Review and Prospects—Operating Results—Factors Affecting Our Results of Operations—Acquisitions,” “—General—Accounting for Subsidiaries, Joint Operations, Joint Ventures and Associated Companies” and note 2.2 to our audited annual consolidated financial statements included in this annual report.
|
| | | | | | | | | | | | | | | | | | | | | | | | |
| | | As of December 31, | |
| | | 2014 | | | 2015 | | | 2016(1) | | | 2017 | | | 2018 | | | 2018 | |
| Balance Sheet Data: | | | | | (in millions of S/.) | | | | | | | | | (in millions of
US$)(2) | |
Total current assets | | | 4,635.7 | | | | 5,200.4 | | | | 4,328.7 | | | | 3,891.9 | | | | 2,985.5 | | | | 883.5 | |
Cash and cash equivalents | | | 818.4 | | | | 554.0 | | | | 607.0 | | | | 626.2 | | | | 801.1 | | | | 237.1 | |
Accounts receivables | | | 1,768.6 | | | | 2,143.3 | | | | 1,862.5 | | | | 2,381.9 | | | | 1,631.2 | | | | 482.7 | |
Outstanding work in progress | | | 1,152.8 | | | | 1,278.2 | | | | 680.9 | | | | 61.8 | | | | 28.5 | | | | 8.4 | |
Inventories(3) | | | 833.6 | | | | 1,159.2 | | | | 1,104.3 | | | | 770.7 | | | | 514.0 | | | | 152.1 | |
Totalnon-current assets | | | 3,094.2 | | | | 3,699.6 | | | | 4,718.0 | | | | 4,775.7 | | | | 4,197.1 | | | | 1,242.1 | |
Long-term accounts receivables(4) | | | 624.5 | | | | 687.8 | | | | 1,754.4 | | | | 2,180.8 | | | | 2,133.5 | | | | 631.4 | |
Investments in associates and joint ventures | | | 229.6 | | | | 637.0 | | | | 389.8 | | | | 268.7 | | | | 257.8 | | | | 76.3 | |
Property, plant and equipment | | | 1,148.7 | | | | 1,111.8 | | | | 1,113.6 | | | | 865.7 | | | | 470.6 | | | | 139.3 | |
Intangible assets(5) | | | 780.8 | | | | 878.3 | | | | 960.3 | | | | 940.1 | | | | 847.1 | | | | 250.7 | |
Total current liabilities | | | 3,796.1 | | | | 4,092.3 | | | | 4,537.0 | | | | 3,549.2 | | | | 2,665.8 | | | | 788.9 | |
Short-term borrowings | | | 1,425.5 | | | | 1,265.1 | | | | 2,007.1 | | | | 1,093.4 | | | | 865.6 | | | | 256.2 | |
Accounts payable(6) (7) | | | 2,151.4 | | | | 2,779.6 | | | | 2,453.1 | | | | 2,356.7 | | | | 1,768.1 | | | | 523.3 | |
Totalnon-current liabilities | | | 753.8 | | | | 1,725.8 | | | | 2,019.9 | | | | 2,529.4 | | | | 2,048.9 | | | | 606.3 | |
Long-term borrowings | | | 624.8 | | | | 1,310.3 | | | | 1,341.0 | | | | 1,544.2 | | | | 1,274.1 | | | | 377.1 | |
Capital stock | | | 660.1 | | | | 660.1 | | | | 660.1 | | | | 660.1 | | | | 729.4 | | | | 215.9 | |
Shareholders’ equity | | | 2,691.7 | | | | 2,558.8 | | | | 1,980.4 | | | | 2,123.3 | | | | 2,088.4 | | | | 618.0 | |
Non-controlling interest | | | 488.7 | | | | 523.1 | | | | 509.3 | | | | 465.7 | | | | 401.6 | | | | 118.8 | |
(1) | For the effects on our financial condition as of December 31, 2016 resulting from the termination of the GSP gas pipeline concession, see “Item 5.A. Operating and Financial Review and Prospects—Operating Results—Recent Developments” and notes 5(e), 5(f) and 26 to our audited annual consolidated financial statements included in this annual report.
|
(2) | Calculated based on an exchange rate of S/.3.379 to US$1.00 as of December 31, 2018.
|
(3) | Includes investments for the purchase of land by our Real Estate segment. These investments in land are recorded at acquisition cost and are notmarked-to-market for changes in fair value. See note 15 to our audited annual consolidated financial statements included in this annual report.
|
(4) | Includes payments required to be made by the Peruvian government for the amounts we invest to purchase trains and other infrastructure for the Lima Metro. See “Item 5.A. Operating and Financial Review and Prospects—Operating Results—Results of Operations—General—Infrastructure” and note 11 to our audited annual consolidated financial statements included in this annual report.
|
(5) | We recognize our investments in the construction of the highway of our Norvial concession as intangible assets. See note 18(c) to our audited annual consolidated financial statements included in this annual report.
|
(6) | Includes S/.684.3 million, S/.607.1 million, S/.810.8 million, S/.726.3 million and S/.496.5 million in advance payments made by our clients as of December 31, 2014, 2015, 2016, 2017 and 2018, respectively, in connection with our E&C segment and the operation and maintenance of infrastructure assets contracts. See “Item 5.A. Operating and Financial Review and Prospects—Operating Results—Results of Operations—General—Engineering and Construction” and note 22 to our audited annual consolidated financial statements included in this annual report.
|
(7) | Includes our payable to Chubb Insurance Company (US$52.5 million as of December 31, 2016 and US$15.6 million as of December 31, 2017) relating to the termination of the GSP gas pipeline concession, which was fully repaid as of December 31, 2018. For more information, see “Item 5.A. Operating and Financial Review and Prospects—Operating Results—Recent Developments” and “—Liquidity and Capital Resources—Indebtedness.”
|
| | | | | | | | | | | | | | | | | | | | | | | | |
| | | As of and for the year ended December 31, | |
| | | 2014 | | | 2015 | | | 2016(1) | | | 2017
Restated | | | 2018 | | | 2018 | |
| | | (in millions of S/.) | | | | | | (in millions of US$)(2) | |
Other Data: | | | | | | | | | | | | | | | | | | | | | | | | |
EBITDA(3) (in millions of S/. or US$) | | | 783.9 | | | | 538.4 | | | | (240.5 | ) | | | 572.3 | | | | 557.3 | | | | 164.9 | |
Gross margin | | | 13.3 | % | | | 6.0 | % | | | 7.6 | % | | | 12.5 | % | | | 17.3 | % | | | 17.3 | % |
EBITDA margin(4) | | | 16.13 | % | | | 9.7 | % | | | (5.8 | )% | | | 14.3 | % | | | 14.3 | % | | | 14.3 | % |
Outstanding shares (thousands) | | | 660,054 | | | | 660,054 | | | | 660,054 | | | | 660,054 | | | | 729,434 | | | | 215,873 | |
Profit per share (in S/.or US$) | | | 0.55 | | | | 0.08 | | | | (0.68 | ) | | | 0.31 | | | | 0.08 | | | | 0.02 | |
Profit attributable to controlling interest per share (in S/.or US$) | | | 0.45 | | | | 0.01 | | | | (0.77 | ) | | | 0.23 | | | | (0.13 | ) | | | (0.04 | ) |
Dividend per share (in S/.or US$)(5) | | | 0.16 | | | | 0.05 | | | | — | | | | — | | | | — | | | | — | |
Net debt(6)/ EBITDA ratio | | | 1.1 | x | | | 3.5 | x | | | (11.4 | )x | | | 3.5 | x | | | 2.4 | x | | | 2.4 | x |
Backlog (in millions of US$) (Unaudited)(7) | | | 3,765.4 | | | | 3,918.4 | | | | 3,011.6 | | | | 2,388.4 | | | | 1,257.2 | | | | 1,257.2 | |
Backlog/revenues ratio (Unaudited)(7) | | | 1.6 | x | | | 1.9 | x | | | 1.8 | x | | | 1.3 | x | | | 1.1 | x | | | 1.1 | x |
(1) | For the effects on our results of operations and backlog for 2016 resulting from the termination of the GSP gas pipeline concession, see “Item 5.A. Operating and Financial Review and Prospects—Operating Results—Recent Developments” and notes 5(e), 5(f) and 16 to our audited annual consolidated financial statements included in this annual report.
|
(2) | Calculated based on an exchange rate of S/.3.379 to US$1.00 as of December 31, 2018.
|
(3) | For further information on the definition of EBITDA, see“—Non-GAAP Financial Measure and Reconciliation.”
|
(4) | Reflects EBITDA as a percentage of revenues.
|
(5) | Payment of dividends for the year’s profit.
|
(6) | Net debt is calculated as total borrowings (including current andnon-current borrowings) less cash and cash equivalents.
|
(7) | For further information on our backlog, see “Item 4.B. Business Overview—Backlog.” Does not include, in our Infrastructure segment, our Norvial toll road concession and our Energy line of business. Backlog is calculated as of the last day of the applicable year. Revenues are calculated for that year and converted into U.S. dollars based on the exchange rate published by the SBS on December 31 of the corresponding year, which was S/.2.989 to US$1.00 as of December 31, 2014, S/.3.413 to US$1.00 as of December 31, 2015, S/.3.36 to US$1.00 as of December 31, 2016, S/.3.245 to US$1.00 as of December 31, 2017 and S/.3.379 to US$1.00 as of December 31, 2018. Includes revenues only for businesses included in our backlog.
|
The following tables set forth summary financial data for each of our business segments. For more information on the results of operations of our segments, see “Item 5.A. Operating andSupplementary Financial Review and Prospects—Operating Results—Results of Operations” and note 7 to our audited annual consolidated financial statements included in this annual report. The effects of the termination of the GSP gas pipeline concession on our results of operations and financial condition for 2016 are reflected in Corporate (the Parent Company Operations) and, with respect to CCDS, in our E&C segment.Information.
Beginning on April 1, 2017, we transferred Concar from our former Technical Services segment to our Infrastructure segment. For ease of comparison, the historical segment financial information included in this annual report presents Concar in the Infrastructure segment. This change does not impact our consolidated financial results.
1. Engineering & Construction
| | | | | | | | | | | | | | | | | | | | | | | | |
| | | For the year ended December 31, | |
| | | 2014 | | | 2015 | | | 2016 | | | 2017 | | | 2018 | | | 2018 | |
| | | (in millions of S/.) | | | (in millions of US$)(1) | |
Income Statement Data: | | | | | | | | | | | | | | | | | | | | | | | | |
Revenues | | | 3,718.0 | | | | 4,352.7 | | | | 2,936.8 | | | | 2,331.9 | | | | 1,960.9 | | | | 580.3 | |
Cost of sales | | | (3,354.1 | ) | | | (4,244.4 | ) | | | (2,876.6 | ) | | | (2,155.4 | ) | | | (1,898.8 | ) | | | (561.9 | ) |
| | | | | | | | | | | | | | | | | | | | | | | | |
Gross profit | | | 363.8 | | | | 108.3 | | | | 60.2 | | | | 176.5 | | | | 62.1 | | | | 18.4 | |
Administrative expenses | | | (219.7 | ) | | | (243.6 | ) | | | (212.0 | ) | | | (188.2 | ) | | | (136.1 | ) | | | (40.3 | ) |
Other income and (expenses), net | | | (12.5 | ) | | | 6.4 | | | | (14.2 | ) | | | (46.5 | ) | | | (13.5 | ) | | | (4.0 | ) |
Other (losses) gains, net | | | — | | | | (0.2 | ) | | | — | | | | — | | | | — | | | | — | |
| | | | | | | | | | | | | | | | | | | | | | | | |
Operating profit | | | 131.7 | | | | (129.2 | ) | | | (166.1 | ) | | | (58.1 | ) | | | (87.5 | ) | | | (25.9 | ) |
Financial (expense) income, net | | | (44.8 | ) | | | (96.8 | ) | | | (50.8 | ) | | | (38.2 | ) | | | (67.7 | ) | | | (20.0 | ) |
Share of the profit or loss in associates under the equity method of accounting | | | 48.2 | | | | 15.0 | | | | 16.5 | | | | 31.0 | | | | 11.4 | | | | 3.4 | |
| | | | | | | | | | | | | | | | | | | | | | | | |
Profit (loss) before income tax | | | 131.1 | | | | (210.9 | ) | | | (200.4 | ) | | | (65.3 | ) | | | (143.9 | ) | | | (42.6 | ) |
| | | | | | | | | | | | | | | | | | | | | | | | |
| | | For the year ended December 31, | |
| | | 2014 | | | 2015 | | | 2016 | | | 2017 | | | 2018 | | | 2018 | |
| | | (in millions of S/.) | | | (in millions of US$)(1) | |
Income tax | | | (24.4 | ) | | | (15.2 | ) | | | 19.7 | | | | 0.9 | | | | 14.4 | | | | 4.3 | |
Profit from discontinued operations | | | 82.9 | | | | 104.2 | | | | 87.2 | | | | 76.8 | | | | 44.1 | | | | 13.1 | |
| | | | | | | | | | | | | | | | | | | | | | | | |
Net profit (loss) | | | 193.6 | | | | (121.8 | ) | | | (93.4 | ) | | | 12.4 | | | | (85.4 | ) | | | (25.3 | ) |
Net profit attributable to controlling
interest | | | 164.1 | | | | (131.2 | ) | | | (87.2 | ) | | | 12.1 | | | | (86.9 | ) | | | (25.7 | ) |
Net profit (loss) attributable tonon-controlling interest | | | 29.5 | | | | 9.3 | | | | (5.7 | ) | | | 0.3 | | | | 1.5 | | | | 0.43 | |
| |
| | | As of December 31, | |
| | | 2014 | | | 2015 | | | 2016 | | | 2017 | | | 2018 | | | 2018 | |
| | | (in millions of S/.) | | | (in millions of US$)(1) | |
Balance Sheet Data: | | | | | | | | | | | | | | | | | | | | | | | | |
Total current assets | | | 2,676.6 | | | | 3,157.1 | | | | 1,910.9 | | | | 1,949.0 | | | | 1,408.0 | | | | 416.7 | |
Cash and cash equivalents | | | 285.4 | | | | 172.1 | | | | 93.5 | | | | 184.4 | | | | 177.5 | | | | 52.5 | |
Accounts receivables | | | 1,092.9 | | | | 1,526.4 | | | | 1,060.5 | | | | 1,640.0 | | | | 1,173.9 | | | | 347.4 | |
Outstanding work in progress | | | 1,145.4 | | | | 1,260.5 | | | | 648.9 | | | | 55.8 | | | | 25.0 | | | | 7.4 | |
Other current assets | | | 152.9 | | | | 198.1 | | | | 108.0 | | | | 68.9 | | | | 31.7 | | | | 9.4 | |
Totalnon-current assets | | | 1,250.0 | | | | 1,118.4 | | | | 1,328.0 | | | | 1,382.3 | | | | 993.2 | | | | 293.9 | |
Long-term accounts receivables | | | 6.2 | | | | 0.5 | | | | 214.4 | | | | 392.5 | | | | 346.1 | | | | 102.4 | |
Property, plant and equipment | | | 651.2 | | | | 606.2 | | | | 592.2 | | | | 509.7 | | | | 205.7 | | | | 60.9 | |
Othernon-current assets | | | 592.6 | | | | 511.7 | | | | 521.4 | | | | 480.1 | | | | 441.4 | | | | 130.6 | |
Total current liabilities | | | 2,500.2 | | | | 2,846.3 | | | | 2,101.5 | | | | 2,189.6 | | | | 1,585.2 | | | | 469.1 | |
Short-term borrowings | | | 629.6 | | | | 653.0 | | | | 582.3 | | | | 592.0 | | | | 232.4 | | | | 68.8 | |
Accounts payable(2) | | | 1,701.9 | | | | 2,174.0 | | | | 1,482.1 | | | | 1,561.6 | | | | 1,346.4 | | | | 398.5 | |
Totalnon-current liabilities | | | 445.2 | | | | 629.2 | | | | 471.8 | | | | 546.3 | | | | 413.0 | | | | 122.2 | |
Long-term borrowings | | | 144.1 | | | | 376.0 | | | | 246.3 | | | | 127.8 | | | | 9.3 | | | | 2.8 | |
Other long-term liabilities | | | 301.1 | | | | 253.3 | | | | 225.5 | | | | 418.6 | | | | 403.7 | | | | 119.5 | |
Shareholders’ equity | | | 817.8 | | | | 639.2 | | | | 551.7 | | | | 487.9 | | | | 331.2 | | | | 98.0 | |
Non-controlling interest | | | 163.4 | | | | 160.8 | | | | 113.9 | | | | 107.5 | | | | 71.8 | | | | 21.2 | |
| | | | | | |
| 2. Infrastructure | | | | | | | | | | | | | | | | | | | | | | | | |
| |
| | | For the year ended December 31, | |
| | | 2014 | | | 2015 | | | 2016 | | | 2017 | | | 2018 | | | 2018 | |
| | | (in millions of S/.) | | | | | | (in millions of US$)(1) | |
Income Statement Data: | | | | | | | | | | | | | | | | | | | | | | | | |
Revenues | | | 1,613.5 | | | | 1,353.1 | | | | 1,174.8 | | | | 1,447.9 | | | | 1,883.3 | | | | 557.3 | |
Cost of sales | | | (1,351.6 | ) | | | (1,107.2 | ) | | | (963.4 | ) | | | (1,187.8 | ) | | | (1,532.6 | ) | | | 453.6 | |
Gross profit | | | 261.9 | | | | 245.9 | | | | 211.4 | | | | 260.2 | | | | 350.6 | | | | 103.8 | |
Administrative expenses | | | (102.8 | ) | | | (67.0 | ) | | | (66.1 | ) | | | (63.9 | ) | | | (68.8 | ) | | | (20.4 | ) |
Other income and (expenses), net | | | (1.9 | ) | | | 2.0 | | | | 1.3 | | | | 5.8 | | | | 1.4 | | | | 0.4 | |
Other (losses) gains, net | | | (0.1 | ) | | | (0.1 | ) | | | (0.5 | ) | | | 0.4 | | | | — | | | | — | |
Operating profit | | | 157.1 | | | | 180.8 | | | | 146.1 | | | | 202.5 | | | | 283.0 | | | | 83.8 | |
Financial (expense) income, net | | | (35.2 | ) | | | (22.9 | ) | | | (9.6 | ) | | | (19.5 | ) | | | (20.1 | ) | | | (5.9 | ) |
Share of the profit or loss in associates under the equity method of accounting | | | — | | | | 0.9 | | | | 1.6 | | | | 1.6 | | | | 1.6 | | | | 0.5 | |
Profit before income tax | | | 121.9 | | | | 158.9 | | | | 138.1 | | | | 184.5 | | | | 264.6 | | | | 78.3 | |
Income tax | | | (55.8 | ) | | | (46.5 | ) | | | (39.9 | ) | | | (55.2 | ) | | | (80.5 | ) | | | (23.9 | ) |
Net profit | | | 66.1 | | | | 112.4 | | | | 98.3 | | | | 129.3 | | | | 184.0 | | | | 54.5 | |
Net profit attributable to controlling interest | | | 59.5 | | | | 93.0 | | | | 74.4 | | | | 103.8 | | | | 152.3 | | | | 45.1 | |
Net profit (loss) attributable tonon-controlling interest | | | 6.5 | | | | 19.4 | | | | 23.8 | | | | 25.5 | | | | 31.8 | | | | 9.4 | |
| | | | | | | | | | | | | | | | | | | | | | | | |
| |
| | | As of December 31, | |
| | | 2014 | | | 2015 | | | 2016 | | | 2017 | | | 2018 | | | 2018 | |
| | | (in millions of S/.) | | | (in millions of
US$)(1) | |
Balance Sheet Data: | | | | | | | | | | | | | | | | | | | | | | | | |
Total current assets | | | 614.1 | | | | 639.3 | | | | 806.5 | | | | 923.3 | | | | 969.1 | | | | 286.8 | |
Cash and cash equivalents | | | 173.4 | | | | 240.3 | | | | 303.9 | | | | 331.1 | | | | 401.2 | | | | 118.7 | |
Accounts receivables | | | 378.8 | | | | 331.9 | | | | 409.2 | | | | 535.0 | | | | 509.2 | | | | 150.7 | |
Outstanding work in progress | | | 16.4 | | | | 17.7 | | | | 32.1 | | | | — | | | | — | | | | — | |
Other current assets | | | 45.6 | | | | 49.5 | | | | 61.3 | | | | 57.2 | | | | 58.7 | | | | 17.4 | |
Totalnon-current assets | | | 1,297.9 | | | | 1,514.4 | | | | 1,801.6 | | | | 2,098.4 | | | | 2,111.3 | | | | 624.8 | |
Long-term accounts receivables(3) | | | 602.3 | | | | 670.7 | | | | 930.2 | | | | 1,164.0 | | | | 1,214.2 | | | | 359.3 | |
Property, plant and equipment | | | 236.3 | | | | 225.4 | | | | 200.2 | | | | 190.4 | | | | 187.7 | | | | 55.6 | |
Othernon-current assets | | | 412.8 | | | | 536.1 | | | | 623.5 | | | | 743.9 | | | | 709.5 | | | | 210.0 | |
Total current liabilities | | | 1,180.4 | | | | 458.4 | | | | 407.2 | | | | 580.2 | | | | 737.2 | | | | 218.2 | |
Short-term borrowings | | | 588.8 | | | | 197.2 | | | | 85.1 | | | | 86.2 | | | | 290.6 | | | | 86.0 | |
Accounts payable | | | 568.3 | | | | 241.3 | | | | 261.5 | | | | 486.2 | | | | 426.9 | | | | 126.3 | |
Totalnon-current liabilities | | | 154.5 | | | | 1,010.3 | | | | 1,444.7 | | | | 1,585.9 | | | | 1,368.3 | | | | 405.0 | |
Long-term borrowings | | | 103.3 | | | | 842.5 | | | | 1,004.6 | | | | 1,014.4 | | | | 985.6 | | | | 291.7 | |
Other long-term liabilities | | | 51.1 | | | | 167.8 | | | | 440.1 | | | | 571.4 | | | | 382.7 | | | | 113.3 | |
Shareholders’ equity | | | 497.1 | | | | 586.2 | | | | 643.3 | | | | 729.5 | | | | 828.3 | | | | 245.1 | |
Non-controlling interest | | | 80.0 | | | | 98.8 | | | | 112.9 | | | | 126.1 | | | | 146.6 | | | | 43.4 | |
| | | | | | |
| 3. Real Estate | | | | | | | | | | | | | | | | | | | | | | | | |
| |
| | | For the year ended December 31, | |
| | | 2014 | | | 2015 | | | 2016 | | | 2017 | | | 2018 | | | 2018 | |
| | | (in millions of S/.) | | | (in millions of
US$)(1) | |
Income Statement Data: | | | | | | | | | | | | | | | | | | | | | | | | |
Revenues | | | 224.6 | | | | 215.8 | | | | 411.5 | | | | 647.5 | | | | 630.1 | | | | 186.5 | |
Cost of sales | | | (162.1 | ) | | | (164.0 | ) | | | (275.0 | ) | | | (500.2 | ) | | | (342.2 | ) | | | (101.3 | ) |
| | | | | | | | | | | | | | | | | | | | | | | | |
Gross profit | | | 62.4 | | | | 51.8 | | | | 136.5 | | | | 147.4 | | | | 288.0 | | | | 85.2 | |
Administrative expenses | | | (21.1 | ) | | | (20.5 | ) | | | (28.4 | ) | | | (21.2 | ) | | | (50.7 | ) | | | (15.0 | ) |
Other income and (expenses), net | | | (0.8 | ) | | | 1.8 | | | | 0.8 | | | | (3.7 | ) | | | (2.0 | ) | | | (0.6 | ) |
Other (losses) gains, net | | | — | | | | — | | | | — | | | | 49.0 | | | | — | | | | — | |
Profit from the sale of investments | | | — | | | | — | | | | — | | | | — | | | | — | | | | — | |
| | | | | | | | | | | | | | | | | | | | | | | | |
Operating profit | | | 40.5 | | | | 33.0 | | | | 108.9 | | | | 171.5 | | | | 235.3 | | | | 69.6 | |
Financial (expense) income, net | | | (14.7 | ) | | | (10.9 | ) | | | (11.6 | ) | | | (18.3 | ) | | | (8.3 | ) | | | (2.5 | ) |
Share of the profit or loss in associates under the equity method of accounting | | | 12.2 | | | | 14.9 | | | | 6.8 | | | | 0.5 | | | | — | | | | — | |
| | | | | | | | | | | | | | | | | | | | | | | | |
Profit before income tax | | | 38.0 | | | | 37.0 | | | | 104.2 | | | | 153.6 | | | | 226.9 | | | | 67.2 | |
Income tax | | | (11.5 | ) | | | (7.6 | ) | | | (27.1 | ) | | | (35.9 | ) | | | (69.2 | ) | | | (20.5 | ) |
| | | | | | | | | | | | | | | | | | | | | | | | |
Net profit | | | 26.5 | | | | 29.3 | | | | 77.2 | | | | 117.7 | | | | 157.8 | | | | 46.7 | |
Net profit attributable to controlling interest(4) | | | 9.5 | | | | 12.4 | | | | 22.1 | | | | 48.6 | | | | 28.9 | | | | 8.6 | |
Net profit (loss) attributable tonon-controlling interest(4) | | | 17.0 | | | | 17.0 | | | | 55.1 | | | | 69.1 | | | | 128.9 | | | | 38.1 | |
| | | | | | | | | | | | | | | | | | | | | | | | |
| | | As of December 31, | |
| | | 2014 | | | 2015 | | | 2016 | | | 2017 | | | 2018 | | | 2018 | |
| | | (in millions of S/.) | | | (in millions of
US$)(1) | |
Balance Sheet Data: | | | | | | | | | | | | | | | | | | | | | | | | |
Total current assets | | | 760.8 | | | | 1,109.3 | | | | 1,117.1 | | | | 884.6 | | | | 721.0 | | | | 213.4 | |
Cash and cash equivalents | | | 54.3 | | | | 74.5 | | | | 58.9 | | | | 85.2 | | | | 93.3 | | | | 27.6 | |
Accounts receivables | | | 75.6 | | | | 114.4 | | | | 111.2 | | | | 155.3 | | | | 179.3 | | | | 53.1 | |
Outstanding work in progress | | | 631.0 | | | | 920.4 | | | | — | | | | — | | | | — | | | | — | |
Other current assets(5) | | | 117.4 | | | | 91.7 | | | | 947.0 | | | | 644.1 | | | | 448.4 | | | | 132.7 | |
Totalnon-current assets | | | 9.7 | | | | 14.7 | | | | 113.6 | | | | 78.5 | | | | 98.5 | | | | 29.2 | |
Long-term accounts receivables(3) | | | 7.3 | | | | 11.3 | | | | 17.9 | | | | 9.8 | | | | 36.3 | | | | 10.7 | |
Property, plant and equipment | | | 36.2 | | | | 34.7 | | | | 13.0 | | | | 11.6 | | | | 9.2 | | | | 2.7 | |
Othernon-current assets | | | 64.1 | | | | 30.9 | | | | 82.7 | | | | 57.0 | | | | 53.0 | | | | 15.7 | |
Total current liabilities | | | 266.6 | | | | 555.1 | | | | 515.8 | | | | 352.1 | | | | 310.1 | | | | 91.8 | |
Short-term borrowings | | | 144.3 | | | | 224.4 | | | | 206.5 | | | | 162.0 | | | | 133.1 | | | | 39.4 | |
Accounts payable | | | 120.1 | | | | 330.7 | | | | 291.2 | | | | 144.8 | | | | 172.5 | | | | 51.1 | |
Totalnon-current liabilities | | | 138.9 | | | | 159.6 | | | | 104.2 | | | | 44.1 | | | | 37.2 | | | | 11.0 | |
Long-term borrowings | | | 16.4 | | | | 27.6 | | | | 16.5 | | | | 12.0 | | | | 10.7 | | | | 3.2 | |
Other long-term liabilities | | | 122.5 | | | | 132.0 | | | | 87.6 | | | | 32.1 | | | | 26.5 | | | | 7.8 | |
Shareholders’ equity | | | 157.3 | | | | 158.6 | | | | 234.4 | | | | 217.3 | | | | 193.5 | | | | 57.3 | |
Non-controlling interest | | | 315.4 | | | | 327.6 | | | | 376.3 | | | | 349.6 | | | | 278.7 | | | | 82.5 | |
(1) | Calculated based on an exchange rate of S/.3.379 to US$1.00 as of December 31, 2018.
|
(2) | Includes advance payments, which reflects advance payments made by our clients in connection with our E&C and Operation and Maintenance of Infrastructure Assets contracts. See “Item 5.A. Operating and Financial Review and Prospects—Operating Results—Results of Operations—General—Engineering and Construction” and note 22 to our audited annual consolidated financial statements included in this annual report.
|
(3) | Includes payments required to be made by the Peruvian government for the amounts we invest to purchase trains and other infrastructure for the Lima Metro. See “Item 5.A. Operating and Financial Review and Prospects—Operating and Financial Review and Prospects—Operating Results—Results of Operations—General—Infrastructure” and note 11 to our audited annual consolidated financial statements included in this annual report.
|
(4) | The net profit attributable to controlling interests of our Real Estate segment is significantly affected by the financing and commercial arrangements we use to purchase land and to develop real estate projects. Depending on the level ofnon-controlling interests used to finance our real estate projects, our Real Estate segment tends to have significant net profit attributable tonon-controlling interests. See “Item 5.A. Operating and Financial Review and Prospects—Operating Results—Results of Operations—General—Real Estate.”
|
(5) | Includes inventories, which includes investments for the purchase of land by our Real Estate segment. These investments in land are recorded at book value and are not marked to market for changes in fair value. See note 15 to our audited annual consolidated financial statements included in this annual report.
|
Non-GAAP Financial Measure and Reconciliation
In this annual report, we present EBITDA, anon-GAAP financial measure. Anon-GAAP financial measure is generally defined as one that purports to measure financial performance, financial position or cash flows but excludes or includes amounts that would not be so adjusted in the most comparable IFRS measure. We define EBITDA as net profit plus: financial (expense) income, net; income tax; and depreciation and amortization.
We present EBITDA because we believe it provides readers with a supplemental measure of the financial performance of our core operations that facilitatesperiod-to-period comparisons on a consistent basis. Furthermore, we regularly present EBITDA in our filings with the Lima Stock Exchange in Peru. Our management uses EBITDA, among other measures, for internal planning and performance measurement purposes. We believe that EBITDA is useful in evaluating our operating performance compared to that of other companies operating in our sectors because the calculation of EBITDA and EBITDA generally eliminates the effects of financing and income taxes and the accounting effects of capital spending, which items may vary for different companies for reasons unrelated to overall operating performance. EBITDA should not be construed as an alternative to net profit or operating profit, as an indicator of operating performance, as an alternative to cash flow provided by operating activities or as a measure of liquidity (in each case, as determined in accordance with IFRS). EBITDA, as calculated by us, may not be comparable to similarly titled measures reported by other companies. The following table sets forth the reconciliation of our net profit to EBITDA on a consolidated basis.
| | | | | | | | | | | | | | | | | | | | | | | | |
| | | For the year ended December 31, | |
| | | 2014 | | | 2015 | | | 2016 | | | 2017
Restated | | | 2018 | | | 2018 | |
| | | (in millions of S/.) | | | (in millions of
US$)(1) | |
Net profit (loss) | | | 361.2 | | | | 55.6 | | | | (451.6 | ) | | | 209.2 | | | | 57.4 | | | | 17.0 | |
Financial expense | | | 381.8 | | | | 518.6 | | | | 942.5 | | | | 473.9 | | | | 630.1 | | | | 186.5 | |
Financial income | | | (323.6 | ) | | | (420.9 | ) | | | (762.7 | ) | | | (336.8 | ) | | | (433.0 | ) | | | (128.2 | ) |
Income tax | | | 104.6 | | | | 78.7 | | | | (152.2 | ) | | | 46.3 | | | | 113.3 | | | | 33.5 | |
Depreciation and amortization | | | 260.0 | | | | 306.4 | | | | 183.4 | | | | 179.7 | | | | 189.5 | | | | 56.1 | |
| | | | | | | | | | | | | | | | | | | | | | | | |
EBITDA | | | 783.9 | | | | 538.4 | | | | (240.5 | ) | | | 572.3 | | | | 557.3 | | | | 164.9 | |
(1) | Calculated based on an exchange rate of S/.3.379 to US$1.00 as of December 31, 2018.
|
The following table shows a reconciliation of the EBITDA for our three segments, Parent company operations and intercompany eliminations:
| | | | | | | | | | | | | | | | | | | | | | | | |
| | | For the year ended December 31, | |
| | | 2014 | | | 2015 | | | 2016 | | | 2017
Restated | | | 2018 | | | 2018 | |
| | | (in millions of S/.) | | | (in millions of
US$)(1) | |
Engineering and construction | | | 407.0 | | | | 158.3 | | | | 19.3 | | | | 120.0 | | | | 19.2 | | | | 5.69 | |
Infrastructure | | | 257.2 | | | | 272.2 | | | | 237.8 | | | | 300.9 | | | | 411.5 | | | | 121.8 | |
Real estate | | | 56.5 | | | | 52.8 | | | | 121.4 | | | | 177.3 | | | | 241.0 | | | | 71.3 | |
Parent company operations | | | 258.2 | | | | (34.1 | ) | | | (1,025.2 | ) | | | 125.9 | | | | (27.8 | ) | | | 8.2 | |
Intercompany eliminations | | | (245.4 | ) | | | 16.2 | | | | 406.2 | | | | (151.8 | ) | | | (86.6 | ) | | | (25.6 | ) |
| | | | | | | | | | | | | | | | | | | | | | | | |
EBITDA | | | 783.9 | | | | 538.4 | | | | (240.5 | ) | | | 572.3 | | | | 557.3 | | | | 164.9 | |
|
(1) Calculated based on an exchange rate of S/.3.379 to US$1.00 as of December 31, 2018. | |
|
The following tables set forth the reconciliation of our net profit to EBITDA for each of our business segments and certain of our lines of business or subsidiaries within these segments. The effects of the termination of the GSP gas pipeline concession on our results of operations and financial condition for 2016 are reflected in Corporate (the Parent Company Operations) and, with respect to the related construction consortium (CCDS), in our E&C segment. Beginning on April 1, 2017, we transferred Concar from our Technical Services segment to our former Infrastructure segment. This change does not impact our consolidated financial results. For more information, see note 7 to our audited annual consolidated financial statements included in this annual report. | |
|
| 1. Engineering & Construction | |
| |
| | | For the year ended December 31, | |
| | | 2014 | | | 2015 | | | 2016 | | | 2017 | | | 2018 | | | 2018 | |
| | | (in millions of S/.) | | | (in millions of
US$)(2) | |
Net profit (loss) | | | 193.6 | | | | (121.8 | ) | | | (93.5 | ) | | | 12.4 | | | | (85.4 | ) | | | (25.3 | ) |
Financial expense | | | 201.2 | | | | 375.8 | | | | 555.8 | | | | 212.3 | | | | 284.7 | | | | 84.3 | |
Financial income | | | (156.4 | ) | | | (279.0 | ) | | | (505.0 | ) | | | (174.1 | ) | | | (217.0 | ) | | | (64.2 | ) |
Income tax | | | 24.4 | | | | 15.2 | | | | (19.7 | ) | | | (0.9 | ) | | | (14.4 | ) | | | (4.3 | ) |
Depreciation and amortization | | | 144.2 | | | | 168.1 | | | | 81.6 | | | | 70.3 | | | | 51.3 | | | | 15.2 | |
| | | | | | | | | | | | | | | | | | | | | | | | |
EBITDA | | | 407.0 | | | | 158.3 | | | | 19.3 | | | | 120.0 | | | | 19.2 | | | | 5.7 | |
| | | | | | |
2. Infrastructure | | | | | | | | | | | | | | | | | | | | | | | | |
| | | | | | |
2.1 Full Segment | | | | | | | | | | | | | | | | | | | | | | | | |
| |
| | | For the year ended December 31, | |
| | | 2014 | | | 2015 | | | 2016 | | | 2017 | | | 2018 | | | 2018 | |
| | | (in millions of S/.) | | | (in millions of
US$)(2) | |
Net profit | | | 92.6 | | | | 112.4 | | | | 98.3 | | | | 129.3 | | | | 184.0 | | | | 54.5 | |
Financial expense | | | 101.6 | | | | 78.2 | | | | 101.7 | | | | 62.6 | | | | 143.1 | | | | 42.4 | |
Financial income | | | (71.2 | ) | | | (55.3 | ) | | | (92.0 | ) | | | (43.1 | ) | | | (123.1 | ) | | | (36.4 | ) |
Income tax | | | 56.6 | | | | 46.5 | | | | 39.9 | | | | 55.2 | | | | 80.5 | | | | 23.8 | |
Depreciation and amortization | | | 77.6 | | | | 90.5 | | | | 90.0 | | | | 96.9 | | | | 126.8 | | | | 37.5 | |
| | | | | | | | | | | | | | | | | | | | | | | | |
EBITDA | | | 257.2 | | | | 272.3 | | | | 237.8 | | | | 300.9 | | | | 411.5 | | | | 121.8 | |
| | | | | | | | | | | | | | | | | | | | | | | | |
| | | | | | |
2.2(a) All Toll Roads | | | | | | | | | | | | | | | | | | | | | | | | |
| |
| | | For the year ended December 31, | |
| | | 2014 | | | 2015 | | | 2016 | | | 2017 | | | 2018 | | | 2018 | |
| | | (in millions of S/.) | | | (in millions of
US$)(2) | |
Net profit | | | 43.0 | | | | 53.5 | | | | 44.9 | | | | 55.0 | | | | 29.2 | | | | 8.6 | |
Financial expense | | | 19.0 | | | | 10.8 | | | | 14.9 | | | | 7.7 | | | | 28.6 | | | | 8.5 | |
Financial income | | | (9.5 | ) | | | (14.8 | ) | | | (9.6 | ) | | | (3.5 | ) | | | (7.2 | ) | | | (2.1 | ) |
Income tax | | | 16.2 | | | | 18.8 | | | | 15.5 | | | | 20.9 | | | | 8.8 | | | | 2.6 | |
Depreciation and amortization | | | 11.4 | | | | 10.9 | | | | 11.1 | | | | 11.0 | | | | 42.9 | | | | 12.7 | |
| | | | | | | | | | | | | | | | | | | | | | | | |
EBITDA | | | 80.1 | | | | 79.2 | | | | 76.8 | | | | 91.1 | | | | 102.3 | | | | 30.3 | |
| | | | | | |
2.2(b) Norvial | | | | | | | | | | | | | | | | | | | | | | | | |
| |
| | | For the year ended December 31, | |
| | | 2014 | | | 2015 | | | 2016 | | | 2017 | | | 2018 | | | 2018 | |
| | | (in millions of S/.) | | | (in millions of
US$)(2) | |
Net profit | | | 31.1 | | | | 40.9 | | | | 47.3 | | | | 49.4 | | | | 17.2 | | | | 5.1 | |
Financial expense | | | 9.7 | | | | 4.1 | | | | 4.9 | | | | 3.4 | | | | 25.0 | | | | 7.4 | |
Financial income | | | (0.4 | ) | | | (0.4 | ) | | | (1.6 | ) | | | (0.9 | ) | | | (1.0 | ) | | | (0.3 | ) |
Income tax | | | 10.9 | | | | 13.6 | | | | 16.3 | | | | 18.7 | | | | 3.9 | | | | 1.1 | |
Depreciation and amortization | | | 11.0 | | | | 10.8 | | | | 10.9 | | | | 10.8 | | | | 42.7 | | | | 12.6 | |
| | | | | | | | | | | | | | | | | | | | | | | | |
EBITDA | | | 62.3 | | | | 68.9 | | | | 77.7 | | | | 81.4 | | | | 87.8 | | | | 26.0 | |
| | | | | | |
2.3 Mass Transit | | | | | | | | | | | | | | | | | | | | | | | | |
| |
| | | For the year ended December 31, | |
| | | 2014 | | | 2015 | | | 2016 | | | 2017 | | | 2018 | | | 2018 | |
| | | (in millions of S/.) | | | (in millions of
US$)(2) | |
Net profit (loss) | | | 12.1 | | | | 18.8 | | | | 23.9 | | | | 19.5 | | | | 87.1 | | | | 25.8 | |
Financial expense | | | 39.8 | | | | 7.9 | | | | 20.5 | | | | 18.4 | | | | 72.5 | | | | 21.4 | |
Financial income | | | (35.3 | ) | | | (4.9 | ) | | | (25.8 | ) | | | (14.0 | ) | | | (87.0 | ) | | | (25.8 | ) |
Income tax | | | 10.8 | | | | 8.1 | | | | 10.9 | | | | 9.5 | | | | 38.0 | | | | 11.3 | |
Depreciation and amortization | | | 0.9 | | | | 0.1 | | | | 0.1 | | | | 0.1 | | | | 0.2 | | | | 0.1 | |
| | | | | | | | | | | | | | | | | | | | | | | | |
EBITDA | | | 28.3 | | | | 30.0 | | | | 29.6 | | | | 33.5 | | | | 110.8 | | | | 32.8 | |
| | | | | | |
2.4 Energy | | | | | | | | | | | | | | | | | | | | | | | | |
| |
| | | For the year ended December 31, | |
| | | 2014 | | | 2015 | | | 2016 | | | 2017 | | | 2018 | | | 2018 | |
| | | (in millions of S/.) | | | (in millions of
US$)(2) | |
Net profit | | | 62.7 | | | | 20.2 | | | | 12.0 | | | | 38.1 | | | | 65.0 | | | | 19.2 | |
Financial expense | | | 30.6 | | | | 50.3 | | | | 61.7 | | | | 34.8 | | | | 37.9 | | | | 11.2 | |
Financial income | | | (19.2 | ) | | | (30.5 | ) | | | (52.0 | ) | | | (23.3 | ) | | | (26.9 | ) | | | (7.9 | ) |
Income tax | | | 29.8 | | | | 7.7 | | | | 5.3 | | | | 13.2 | | | | 26.3 | | | | 7.8 | |
Depreciation and amortization | | | 58.1 | | | | 74.2 | | | | 72.5 | | | | 79.4 | | | | 76.6 | | | | 22.7 | |
| | | | | | | | | | | | | | | | | | | | | | | | |
EBITDA | | | 162.0 | | | | 121.8 | | | | 99.5 | | | | 142.1 | | | | 178.9 | | | | 52.9 | |
2.5 Concar
| | | | | | | | | | | | | | | | | | | | | | | | |
| | | For the year ended December 31, | |
| | | 2014 | | | 2015 | | | 2016 | | | 2017 | | | 2018 | | | 2018 | |
| | | (in millions of S/.) | | | (in millions of
US$)(2) | |
Net profit (loss) | | | (26.5 | ) | | | 18.5 | | | | 14.0 | | | | 16.9 | | | | 2.4 | | | | 0.7 | |
Financial expense | | | 12.0 | | | | 9.1 | | | | 4.5 | | | | 1.7 | | | | 4.2 | | | | 1.2 | |
Financial income | | | (7.2 | ) | | | (5.0 | ) | | | (4.6 | ) | | | (2.3 | ) | | | (1.4 | ) | | | (0.4 | ) |
Income tax | | | (0.8 | ) | | | 11.4 | | | | 6.7 | | | | 11.4 | | | | 6.9 | | | | 2.0 | |
Depreciation and amortization | | | 7.1 | | | | 5.3 | | | | 6.4 | | | | 6.4 | | | | 7.1 | | | | 2.1 | |
| | | | | | | | | | | | | | | | | | | | | | | | |
EBITDA | | | (15.3 | ) | | | 39.3 | | | | 27.0 | | | | 34.1 | | | | 19.2 | | | | 5.7 | |
| | | | | | |
3. Real Estate | | | | | | | | | | | | | | | | | | | | | | | | |
| |
| | | For the year ended December 31, | |
| | | 2014 | | | 2015 | | | 2016 | | | 2017 | | | 2018 | | | 2018 | |
| | | (in millions of S/.) | | | (in millions of
US$)(2) | |
Net profit | | | 26.5 | | | | 29.3 | | | | 77.2 | | | | 117.7 | | | | 157.8 | | | | 46.7 | |
Financial expense | | | 30.4 | | | | 47.7 | | | | 65.1 | | | | 36.0 | | | | 25.2 | | | | 7.5 | |
Financial income | | | (15.6 | ) | | | (36.8 | ) | | | (53.5 | ) | | | (17.7 | ) | | | (16.9 | ) | | | (5.0 | ) |
Income tax | | | 11.5 | | | | 7.6 | | | | 27.1 | | | | 35.9 | | | | 69.2 | | | | 20.5 | |
Depreciation and amortization | | | 3.8 | | | | 4.9 | | | | 5.6 | | | | 5.3 | | | | 5.7 | | | | 1.7 | |
| | | | | | | | | | | | | | | | | | | | | | | | |
EBITDA | | | 56.5 | | | | 52.8 | | | | 121.4 | | | | 177.3 | | | | 241.0 | | | | 71.3 | |
(1) | For the effects on our results of operations for 2016 resulting from the termination of the GSP gas pipeline concession, see “Item. S.A. Operating and Financial Review and Prospects—Operating Results—Recent Developments” and notes 5(e) and 16 to our audited annual consolidated financial statements included in this annual report.
|
(2) | Calculated based on an exchange rate of S/.3.379 to US$1.00 as of December 31, 2018.
|
(3) | Our E&C segment EBITDA includes S/.48.2 million, S/.15.0 million,S/.16.5 million, S/.31.0 million and S/.11.4 in 2014, 2015, 2016, 2017 and 2018, respectively, which represents GyM’s 39.0% equity interest in Viva GyM’s net profit.
|
| B. | Capitalization and Indebtedness |
Not applicable.
| C. | Reasons for the Offer and Use of Proceeds |
Not applicable.
Risks Related to RecentKey Developments
The ongoing COVID-19 pandemic and government measures to contain the spread of the virus are disrupting economic activity in the countries where we operate and adversely affecting our business, results of operations and financial condition.
The outbreak of the Novel Coronavirus 2019 (COVID-19) pandemic, which has been declared by the World Health Organization to be a “public health emergency of international concern,” has spread across the world since the end of 2019. The virus has spread significantly in Latin America, and the countries where we operate have fewer resources to address the continued health care effects of the pandemic. In response, countries around the world—including Peru as well as Chile and Colombia—have adopted extraordinary measures to contain the spread of COVID-19, including imposing travel restrictions, requiring closures of non-essential businesses, establishing restrictions on public gatherings, instructing residents to practice social distancing, issuing stay-at-home orders, implementing quarantines and similar actions. Depending on how the spread of the virus continues to evolve, governments may continue to extend these measures.
The COVID-19 pandemic and these government measures caused a global recession which has resulted in a severe economic impact on the countries in which we operate. We cannot predict the full extent to which economies in the countries where we operate will ultimately be impacted. Even as initial outbreaks of COVID-19 subsided, subsequent outbreaks occurred, including reports of mutations of the virus. We cannot predict whether subsequent outbreaks of the virus or its mutations will not continue to reoccur, or whether governments will not implement longer-term measures that continue to affect economic activity and capital investment levels. As a result, the negative impact of COVID-19 may continue well beyond the containment of the virus. In response to the sudden decline in economic activity, governments around the world, including in Latin America, have announced large stimulus programs to assist families and businesses. However, we cannot assure you that these programs will be sufficient to reactivate economy activity; moreover, the governments in the countries where we operate have fewer resources to stimulate their local economies.
The COVID-19 pandemic is significantly and adversely affecting our business, results of operations and financial condition. Infections have caused halts and delays in our engineering and construction projects, which have caused us to renegotiate performance targets with certain clients. These interruptions and negotiations add costs with respect to our projects, and caused us to include additional allowances for certain accounts receivable and impairments to the group’s long-term assets. We cannot assure you that we will be able to transfer any of these additional costs to our clients. Moreover, from mid-March through the end of May 2020, substantially all of our engineering and construction and real estate projects were mandatorily shut down. Although since July 2020, these projects have resumed operations with COVID-19 protocols in place, we cannot assure you that work will not be halted again or that these projects will be completed on time or at all. Our
infrastructure operations, which have for the most part been declared essential businesses, have continued to operate during the pandemic; however, certain of our infrastructure businesses have been adversely affected, in particular, by the sharp decline in traffic volumes and fluctuations in oil and gas prices. Our results and operations for the 2020 year were adversely impacted by the pandemic, and we expect that our results of operations for the 2021 year will continue to be impacted as the pandemic persists. We continue to monitor the situation, and to evaluate and deploy measures to reduce our expenses and preserve liquidity. However, depending on how long current conditions persist and unless we are able to benefit from government stimulus programs, the pandemic may cause us to further modify our business plan and is likely to have a material adverse effect on our business, results of operation and financial condition.
Our reputation has been adversely affected by our association with Odebrecht’s affiliates in Peru
We have participated in consortiasix construction and operation of infrastructure projects in Peru with affiliates of Odebrecht affiliates in Peru.during the period from 2005 to 2017. Our reputation has been adversely affected as a result of the plea agreements and criminal convictions of Odebrecht and certain key persons related to Odebrecht in connection with corruption, money laundering and criminal organization. Peruvian authorities have initiated congressional inquiries and criminal investigations into the dealings of Odebrecht’s affiliates in Peru, the scope of which include certain consortia and companies in which we participated. Moreover, as a result, our company and certain of our former directors and senior management have beenare the subject of congressional and criminal investigations relating to corruption allegations. These investigations are ongoing.ongoing and relate primarily to conduct during the period from 2003 to 2015.
Recent news reports have indicated thatIn January 2019, Odebrecht has executed a settlement and cooperation agreement with the Peruvian government regarding several infrastructure projects in the country, including certain projects in which we have participated. According to news reports, underUnder the agreement, Odebrecht has agreed to pay compensation to the Peruvian government over the course of several years and to cooperate with, and provide evidence to, prosecutors in connection with ongoing investigations by thisthe Peruvian government. According to news reports, formerFormer senior officers of Odebrecht’s affiliate in Peru have indicated to Peruvian prospectors
(sometimes in apparent contradiction with prior statements)prosecutors that certain of our former directors and senior management were aware that Odebrecht had made corrupt payments to government officials in connection with certain projects in which we participated. We have undertaken an internal investigation
In December 2019, we entered into a preliminary settlement and we continuecooperation agreement with the Peruvian anticorruption prosecutor and the ad hoc Peruvian state counsel. The agreement related to review and assessinvestigations of substantially all of the past practicesprojects in which the company participated with Odebrecht (other than the Chavimochic project, which is not under investigation), as well as the company’s alleged participation in a “construction club” to receive public contracts (excluding INDECOPI’s separate administrative proceedings). Although the Peruvian government undertook to enter into a final settlement and cooperation agreement within sixty business days, we have not reached a final agreement. Since that time, the company has made significant progress in the negotiation of oura final settlement and cooperation agreement, the terms of which remain under discussion with Peruvian authorities and are confidential. Based on discussions with authorities, we currently expect that a final agreement would require the company to determine whether there has been anyadmit to wrongdoing onby the partcompany and certain of ourits former or current directors, officers and employees.directors. Although we are in advanced discussions with Peruvian authorities, we cannot assure you that an agreement will be reached in a timely manner, on expected terms or at all, and any agreement would be subject to further approval by the Peruvian court.
Our reputation is a key factor in our clients’ evaluation of whether to engage our services, key industry players’ willingness to partner with us, financial institutions’ willingness to provide us credit, and recruiting and retaining talented personnel to our company. The impact on our business reputation related to our association with Odebrecht and the alleged actions of our former board members and executive officerssenior management has had, and is likely to continue to have, a material adverse effect on our business, financial condition and results of operations. The outcome of the ongoing investigations and settlement discussions, any new charges or news reports containing new allegations against the company, or other similar developments, could further damage the reputation of the company.
Investigations regarding potential corruption or other illegal acts could have a material adverse effect on our business, financial condition and results of operations
TheLava Jato commission of the Peruvian Congress has undertaken congressional inquiries into our
Our company and other construction companies in Peru, which have included certain of our company’ssubsidiaries, and certain of our former directors and senior management.management, have been charged in connection with criminal and civil investigations relating to certain of our projects in connection with our association with Odebrecht and in connection with our alleged participation in what is referred to as the “construction club.”
In 2018, the Peruvian criminal prosecutor charged our company and our engineering and construction subsidiary, Cumbra, as criminal defendants in connection with the IIRSA South project concession (tranche II), and the Peruvian First National Preparatory Investigation Court (Primer Juzgado de Investigación Preparatoria Nacional) included our company and Cumbra in its criminal investigation. We appealed the court’s decision, but in October 2020, the court provided a formal indictment.
Separately, in connection with these investigations, in December 2018, the Peruvian First National Preparatory Investigation Court also resolved to include our company and Cumbra as civilly-responsible third parties in the investigations related to the IIRSA South project concession (tranche II) and Cumbra as a civilly-responsible third party in the investigations related to Tranches 1 and 2 of the Lima Metro. These proceedings are ongoing.
Peruvian prosecutors have included José Graña Miró Quesada, a shareholder and the former Chairman of our company, in an investigation for the crime of collusion, and Hernando Graña Acuña, a shareholder, a former board member of our company and former chairman of our subsidiary GyM,Cumbra, for the crime of money laundering against the Peruvian government, each in connection with the IIRSA South project concession (tranches II and III)(tranche II), in which we participated with Odebrecht. Gonzalo Ferraro Rey, the former Chief Infrastructure Officer of our company, has also been included in an investigation for the crime of money laundering in connection with the same project.
In connection with investigations relating toaddition, José Graña and Hernando Graña, as well as Juan Manuel Lambarri, the IIRSA South project concession (tranches II and III), the Peruvian criminal prosecutor moved to chargeformer chief executive officer of our company and our construction subsidiary GyM, as criminal defendantsCumbra, have been charged in connection with the project. In response, the Peruvian First National Preparatory Investigation Court (Primer Juzgado de Investigación Preparatoria Nacional) notified us of its decision to formally include our company and GyM in its criminal investigation. We appealed the court’s decision and, in June 2018, the First Court of Appeals of the Superior Court of Lima revoked the judicial order that indicted our company and GyM, among other corporate defendants, in the criminal investigation on charges of collusion and other crimes and rejected the petition, without prejudice, made by the prosecutor to incorporate both companies in the aforementioned process. Nevertheless, we cannot assure you that the criminal prosecutor will not file a new motion to charge our company and/or GyM or that our position will ultimately prevail if such motion is filed.
Separately, in December 2018, the Peruvian First National Preparatory Investigation Court resolved to include our company and GyM as civilly-responsible third parties in the investigations related to the IIRSA South project concession (tranches II and III) and GyM as a civilly-responsible third party in the investigations related to Tranches 1 and 2 of the Lima Metro. These proceedings are ongoing.José Graña indicated in public statements to the media that he and Hernando Graña had initiated a process of plea bargaining with Peruvian prosecutors in respect of multiple projects in which our company participated with Odebrecht and in respect of the alleged “construction club.” This may include providing information related to wrongdoing or knowledge of improper behavior while they were at the company. We cannot assure you what they will ultimately say to government authorities, or that their statements will not adversely affect the company’s business.
Recent news reports have indicated that Odebrecht has executedIn December 2019, we entered into a preliminary settlement and cooperation agreement with the Peruvian government regarding several infrastructure projects inanticorruption prosecutor and the country, including certainad hoc Peruvian state counsel. The agreement related to investigations of substantially all of the past projects in which we have participated. According to news reports,the company participated with Odebrecht (other than the Chavimochic project, which is not under investigation), as well as the agreement Odebrecht has agreed to pay compensation tocompany’s alleged participation in the “construction club” (excluding INDECOPI’s separate administrative proceedings). Although the Peruvian government undertook to enter into a final settlement and cooperation agreement within sixty business days, we have not reached a final agreement. Since that time, the company has made significant progress in the negotiation of a final settlement and cooperation agreement, the terms of which remain under discussion with Peruvian authorities and are confidential. Based on discussions with authorities, we currently expect that a final agreement would require the company to pay a significant penalty over a period of years to be agreed. We also currently expect that a final settlement and cooperation agreement would contain measures that temporarily restrict the courseability of several yearsthe company and certain of its subsidiaries to cooperateenter into contracts with and provide evidence to, prosecutors in connection with ongoing investigations by thisthe Peruvian government. According to news reports, former senior officers of Odebrecht’s affiliateAlthough we are in Peru have indicated toadvanced discussions with Peruvian prospectors (sometimes in apparent contradiction with prior statements) that certain of our former directors and senior management were aware that Odebrecht had made corrupt payments to government officials in connection with certain projects in whichauthorities, we participated. We have undertaken an internal investigation and we continue to review and assess the past practices of our company, to determine whether there has been any wrongdoing on the part of our former or current directors, officers and employees. In addition, a former secretary of the IIRSA South project recently asserted that a former executive of our company was present at a meeting in 2011 in which the need to reimburse illicit payments previously made by Odebrecht was mentioned. We continue to review and assess the past practices of our company to determine whether there has been any wrongdoing on the part of our former or current officers and employees.
We cannot assure you that other of our formeran agreement will be reached in a timely manner, on expected terms or current directorsat all, and senior management will notany agreement would be included insubject to further approval by the foregoing proceedings as well, or that our company will not be included in other investigations or proceedings as criminal defendants or civilly-responsible third parties.Peruvian court.
A conviction of corruption or settlements with government authorities could lead to criminal and civil fines as well as penalties, sanctions, injunctions against future conduct, profit disgorgement, disqualifications from directly and indirectly engaging in certain types of business, the loss of business licenses or permits, debarment from contracting or from participating in bidding processes with the Peruvian government, or other restrictions. Moreover, our alleged involvement in corruption
investigations, and any findings or admissions of wrongdoing in such investigations, could further damage our reputation and have a material adverse impact on our ability to compete for business. Such investigations may also adversely affect our ability to pursue strategic projects, and could potentially result in the termination or modification of certain existing contracts or relationships. In addition, such investigations may affect the company’s ability to secure financing in the future. Furthermore, investigations could continue to divert management’s attention and resources from other issues facing our business.
In May 2018, Peruvian Supreme Decree No.096-2018-EF set forth guidelines to determine the value of assets to be put in trust to guarantee eventual compensation to the Peruvian government that is required for companies that have been partners of companies that have been, or whose officers or representatives have been, convicted of, or have admitted to, corruption, money-laundering or similar crimes, which includes our company and our subsidiary GyM.Cumbra. Following discussions with the Peruvian government, during the fourth quarter of 2018,in February 2019, we established a trust in favor of the Peruvian government in respect of any liabilities arising from Tranches 1 and 2 of the Lima Metro and the IIRSA South project concession (tranche II), to which we funded in the amount of S/.79.1 million (US$23.4 million) by assigningassigned shares of our subsidiary GMICumbra Ingeniería, which is estimated to suchbe worth approximately US$20.4 million (S/72 million). Because the value of these shares have decreased, we have included more shares in the trust in order to cover the amount of the trust. We cannot assure you that the Peruvian government will not claim the assets set forth in this trust or require that our company place additional assets in trust, nor can we assure you that these assets will fully satisfy any eventual obligations we may have to the Peruvian government. government, including in connection with a final settlement and cooperation agreement.
Management has estimated that the value of the contingency forcompany’s contingencies to be approximately US$129.6 million (S/469.7 million), and taking into account the matters described above shouldnet present value, established a provision in the company’s financial statements in the amount of US$59.6 million (S/216 million). This includes amounts in respect of probable liabilities arising from the investigations of substantially all of the past projects in which the company participated with Odebrecht (other than the Chavimochic project, which is not under investigation) and investigations relating to an alleged participation in the “construction club” (excluding INDECOPI’s separate administrative proceedings). The company based its estimate on the formulas included in Law 30737 and on the negotiations with Peruvian authorities which, as of the date of this annual report, are ongoing. However, we cannot provide assurance that our liability will not exceed US$45.8 million (S/.148.4 million).the amount estimated by management and provisioned for in the financial statements of the company. Furthermore, if the company is investigated for further charges in connection with wrongdoing in respect of other projects, this contingent amount could increase significantly. For more information, see note 1 to our audited annual consolidated financial statements included in this annual report.
We cannot assure you that the scope of the foregoing proceedings will not be expanded to incorporate other projects in which we have been involved, that our company will not be included in other investigations or proceedings as a criminal defendant or civilly-responsible third party in Peru or elsewhere, or that other of our former or current directors and senior management will not be included in the foregoing proceedings. We continue to evaluate alternatives to resolving ongoing investigations against our company and our subsidiary GyM.Cumbra, including the negotiation of a settlement and cooperation agreement with Peruvian authorities. However, we cannot assure you that these investigations will be resolved in a manner that is favorable to our company.
INDECOPI and Peruvian prosecutors have initiated investigations in response to news reports alleging that certain construction companies in Peru, Brazil and Spain, including our company, colluded to receive public contracts
In July 2017, media reports alleged that certain construction companies in Peru, Brazil and Spain, including our company, colluded as a “construction club” to receive public contracts. As a result of these reports, theThe Peruvian National Institute for the Defense of Free Competition and the Protection of Intellectual Property (“INDECOPI”) has initiated an investigationin 2017 investigations regarding the anti-competitive activities ofallegations that certain construction companies in Peru, including our company. In July 2017,subsidiary Cumbra, colluded as a “construction club” to receive public contracts.
On February 11, 2020, INDECOPI conductedprovided notice that an administrative sanctions proceedings involving a searchtotal of 35 construction companies, including our facilitiessubsidiary Cumbra, and 28 natural persons, was moving forward. On March 9, 2021, we were informed that the Technical Secretariat of INDECOPI’s Commission for the Defense of Competition issued a lengthy opinion report that recommended to the commission the imposition of administrative fines in connection with the proceedings, including S/103 million (US$27.4 million) for Cumbra. We reviewed the report together with our advisors, and, on April 22, 2021, we filed a written reply with INDECOPI.
Management has estimated the value of the company’s contingencies related to these allegations.administrative proceedings, and established provisions in the company’s audited consolidated financial statements in the amount of S/24.5 million (US$6.76 million) as of December 31, 2020. See note 22 to our audited annual consolidated financial statements included in this annual report.
INDECOPI’s Commission for the Defense of Competition is expected to issue a decision in first instance between the second and third quarter of 2021. If a decision is reached, Cumbra may appeal before the INDECOPI’s internal tribunal, which tribunal would be the final arbiter of any administrative penalty. Although its decision may be judicially challenged, such challenge would not suspend the company’s obligation to pay any administrative fine imposed by INDECOPI or its tribunal.
Separately, in December 2018, GyMCumbra was formally included as a civilly-responsible third party, along with eleven other construction companies, in the criminal investigation conducted by a Peruvian public prosecutor based on facts similar to those under investigation by INDECOPI. In addition,December 2019, the prosecutor filed a motion to criminally charged Cumbra and another of our subsidiaries, Concar, and other companies in the construction sector in Peru, as well as a former employeedirector and senior management of GyM has been included in a criminal investigation forour company, with collusion and other alleged crimes. The ongoing discussions with the Peruvian authorities relating to a final settlement and cooperation agreement includes the “construction club” investigation, but excludes INDECOPI’s separate administrative proceedings.
We cannot provide assurance that our liability will not exceed the amounts estimated by management. Furthermore, if Cumbra, Concar or any other subsidiary of the company is further charged in connection with wrongdoing in respect of other projects, this contingent amount could increase significantly.
We cannot assure you that any of our company’s other current or former directors or senior management will not be included in these investigations or proceedings in the future, nor can we predict the outcome of any such investigations or proceedings, the timing thereof or how they may impact our business, financial condition and results of operations.
We continue to review and assessalso cannot predict whether prosecutors or INDECOPI will bring additional investigations or proceedings in the past practices of our company to determine whether there has been any wrongdoing on the part of our former or current directors, officers and employees in relation to this matter. In addition, wefuture. We continue to evaluate alternatives to resolve theresolving ongoing investigationinvestigations against our company.subsidiaries Cumbra and Concar, including the negotiation of a settlement and cooperation agreement with Peruvian authorities. However, we cannot assure you that this investigationthese investigations will be resolved in a manner that is favorable to our company.
A conviction of corruption or settlements with government authorities could lead to criminal and civil fines as well as penalties, sanctions, injunctions against future conduct, profit disgorgement, disqualifications from directly and indirectly engaging in certain types of business, the loss of business licenses or permits, debarment from contracting or from participating in bidding processes with the Peruvian government, or other restrictions.
Our inabilityWe are currently negotiating a settlement and cooperation agreement with Peruvian authorities in connection with the criminal investigations against our company
In December 2019, we entered into a preliminary settlement and cooperation agreement with the Peruvian anticorruption prosecutor and the ad hoc Peruvian state counsel. The agreement related to provide audited financial statements for GSPinvestigations of substantially all of the past projects in accordancewhich the company participated with Rule3-09 may resultOdebrecht (other than the Chavimochic project, which is not under investigation), as well as the company’s alleged participation in enforcement actionsthe “construction club” (excluding INDECOPI’s separate administrative proceedings). Although the Peruvian government undertook to enter into a final settlement and cooperation agreement within sixty business days, we have not reached a final agreement. Since that time, the company has made significant progress in the negotiation of a final settlement and cooperation agreement, the terms of which remain under discussion with Peruvian authorities and are confidential.
Although we are in advanced discussions with Peruvian authorities, we cannot assure you that an agreement will be reached in a timely manner, on expected terms or at all, and any agreement would be subject to further approval by the SEC orPeruvian court. In addition, we cannot guarantee that a final settlement and cooperation agreement would be executed on terms favorable to the company. We currently expect that the government will require significant penalty to be paid over a period of years to be agreed. In addition, based on discussions with authorities, we currently expect that a final settlement and cooperation agreement would contain measures that temporarily restrict the ability of the company and certain of its subsidiaries to enter into contracts with the Peruvian government. We also currently expect that a final agreement would require the company to admit to wrongdoing by the company and certain of its former officers and directors, which may among other matters, causeadversely affect our reputation. We cannot provide assurances that a final settlement and cooperation agreement will not require us to be unable to complete a public offeringmake payment in excess of our provisions or include additional restrictions on our business.
A class action civil lawsuit in the United States may adversely affect our company
We have been unableA class action civil lawsuit was filed in 2017 against our company and certain of our former directors and former and current executive officers in the United States. In February 2020, we executed a term sheet with the plaintiffs that provides the general terms and conditions for a final settlement agreement. On July 2, 2020, we executed a Stipulation and Agreement of Settlement formalizing the terms of the settlement. The settlement received preliminary approval from the U.S. court on August 18, 2020, but remains subject to provide certain financial statementsfinal approval of GSPthe court. The settlement terms stipulate that are required by Rule3-09 tothe civil lawsuit will be includedfully and finally dismissed in our company’s annual report. Under Rule3-09, we are required to present or generate financial statementsexchange for a total settlement amount of GSPUS$20 million, of which the company is responsible for US$15 million, and the company recorded provisions of US$15 million as of December 31, 2015 and for2020. The remaining US$5 million was paid by the periodcompany’s D&O insurers. The company made an initial payment of US$350,000 into the settlement fund escrow account in September 2020. The settlement terms stipulate that the remaining $14,650,000, plus interest of 5% per annum running from November 2, 2015 to December 31, 2015, as of and forSeptember 17, 2020, must be paid by the year ended December 31, 2016 and as of and for the year ended December 31, 2017,company by June 30, 2021. We have initiated discussions with the financial statementsplaintiffs regarding a deferral of GSP as of and for the year ended December 31, 2016 audited in accordance with the standardsthis payment, but we cannot assure you that an agreement will be reached. No members of the Public Company Accounting Oversight Board. It is currently impracticableplaintiff class filed objections to the settlement prior to the November 24, 2020 deadline for oursuch objections to be filed. On December 21, 2020, a magistrate judge held a hearing on the motion for final approval of the settlement, which final approval motion remains pending. If the court does not order final approval of the settlement, or the company fails to comply with this requirement, because the audit opinionterms of the settlement agreement, we would expect the lawsuit to resume.
If the lawsuit continues to be litigated, we cannot assure you that was issued with respect to GSP’s 2016 financial statements included a disclaimer, our company’s loss of significant influence over GSP, and GSP’s limited management asposition will prevail. If our position does not prevail, the entity is in insolvency proceedings.
We believe that the information presented by separate financial statements of GSP would not provide to our company’s investors additional material information not already included in our company’s own consolidated financial statements included in this annual report. As a result, we do not believe that the omission of those financial statements willlawsuit may have a material impactadverse effect on a reader’s understanding of our business, financial condition orand results of operations. Nevertheless, we requested a waiver from the SEC from the requirement to file the consolidated financial statements of GSP described above, and the SEC has not granted our waiver request.
As a result, we are currently not fully compliant with our reporting requirements with the U.S. Securities Exchange Act of 1934 (the “Exchange Act”). The SEC may impose penalties or otherwise take action against our company. In addition, the SEC may not declare effective any registration statement that we file that requires the financial statements under Rule3-09 to be included. If, as a result, we are unable to complete a registered offering, our ability to access the public capital markets in the United States would be impaired. Furthermore, the Rule 144 safe harbor for certain sales of our ADSs in the United States is currently unavailable.
There is substantial uncertainty with regard to the amount, timing and manner in which the payment for the termination of the GSP gas pipeline concession will be paid
There is substantial uncertainty with regards to the payment contemplated under the GSP gas pipeline concession contract as a result of the termination of the gas pipeline concession, including with respect to the amount, timing and manner in which the payment will be made, or if it will be made at all.
Although the concession contract provides that payment must be made within one year of termination, the Peruvian Ministry of Energy and Mines has not made any payment or, to our knowledge, initiated the payment process or the auction process for a new concessionaire. As a result, we expect to assert our rights againstafter the Peruvian government by filing arbitration proceedings in May 2019, after thesix-month period mandated by the concession contract for the parties to discuss the matter. This will place usmatter, in an adversarial position withOctober 2019, we asserted our rights against the Peruvian government. Wegovernment by filing a request for arbitration before the International Centre for Settlement of Investment Disputes. However, in December 2019 we withdrew our request for arbitration, as required by Peruvian authorities under the preliminary settlement and cooperation agreement we entered into with Peruvian anticorruption prosecutor and the ad hoc Peruvian state counsel.
As of the date of this annual report, we are analyzing available contractual and legal options to recover as a creditor of GSP. However, we cannot assure youguarantee that thisany of these options will be successful, or that we will be able to recover all or any other claims that we pursue in connection with the termination of the gas pipeline concession will ultimately prevail in a timely manner, or at all.
In 2016, in connection with efforts to restructure or sell Odebrecht’s participation in GSP, dueamounts owed to the corruption scandal surrounding Odebrecht, Odebrecht contractually agreed to subordinate its claims under the concession to other GSP shareholders, Enagás and ourselves. In January 2018, we receivedcompany as a notification that Odebrecht commenced arbitration proceedings against us and Enagás, seeking to invalidate the contractual subordination. While we believe that the subordination arrangement with respect to Odebrecht’s claims in connection with the anticipated payment is enforceable, we cannot assure you that our position will prevail.
In addition, we have made certain estimates in our consolidated financial statements with respect to the expected payment forresult of the termination of the GSP contract. In particular, after taking into account the S/.593.1 million impairment we recognized to our investment in GSP during 2016, we continued to record S/.218.3 million in connection with our investment in GSP as of December 31, 2016, 2017 and 2018. If our assumptions and estimates are incorrect, our actual results could differ significantly from those reflected in our consolidated financial statements.gas pipeline concession on a timely basis, or at all. Failure to receive the expected payment on a timely basis, or at all, would have a material adverse effect on our business, financial condition and results of operations.
We have made certain estimates in our consolidated financial statements with respect to the expected payment for the termination of the GSP contract. As of December 31, 2019, we fully impaired the remaining amount of our investment in GSP. However, we maintain S/620 million (US$171.1 million) in long-term account receivables as a creditor of GSP.
We arewere in default under onecertain of our debt instruments for which we have obtained waivers,during 2018, 2019 and historically we have been in default on other of our debt instruments,2020, and we cannot assure you that we will not be able to obtain additional waivers in the event of the existing default or future defaults
We are currently in default under one of our debt instruments and we cannot assure youin the future, or that we will be able to obtain additional waiver in the event of any future defaults
In 2020, due to the impact of the COVID-19 pandemic on the company’s results of operations, during the third and fourth quarters of 2020, the company was in default under the CS Peru Infrastructure Loan for failing to maintain its maximum Leverage Ratio (as defined therein). On December 23, 2020, the company and the initial lender signed a waiver.waiver and consent agreement in respect of this event of default. In addition, during the second quarter of 2020, our subsidiary Norvial was in default under its corporate bonds for failing to maintain its Debt Service Coverage Ratio (as defined therein). Norvial complied with the pastDebt Service Coverage Ratio for the third and fourth quarters of 2020. On August 5, 2020, the general assembly of bondholders granted a waiver in respect of the prior default.
We also have certain payment obligations in respect of our indebtedness that has become due. Our Financial Stability Framework Agreement matured in July 2020. We received a waiver with respect to the maturity date, most recently, until April 30, 2021, and we are currently negotiating an additional extension. As of the date of this annual report, US$30.2 million was outstanding under the agreement. In addition, as of the date of this annual report, US$23.7 million was outstanding under a short term loan from Banco Santander to our subsidiary Cumbra. We received a waiver with respect to the maturity date under the loan until March 30, 2021 and subsequently negotiated payment in installments, beginning in May 2021 and ending in September 2021.
In 2019, our subsidiary Adexus entered into Chilean bankruptcy proceedings to restructure its outstanding indebtedness and, as a result, we were in default under our loan agreement with CS Peru Infrastructure Holdings LLC. We received a waiver for the default on February 28, 2020. Also during 2019, our engineering and construction subsidiary, Cumbra, was in default under the Financial Stability Framework Agreement with respect to its failure to comply with certain ratios between Tranche A (client invoices) and Tranche B (client provisions). No event of default was formally notified to Cumbra by the lenders, and Cumbra procured a waiver from the lenders in July 2019. In addition, during the 2018 year we were in default under certain of our debt instruments, including due to: delays in delivering audited financial statements; defaults with respect to certain financial ratio and other covenants; and delays in paying certain amounts outstanding. We procured waivers from our creditors under such instruments.
We cannot assure you that we will not breach the covenants under these or other of our debt instruments in the future and, in such event, that we would be able to obtain the required waivers from our creditors. Failure to successfully obtain waivers could force us to precipitate the sale of assets, including on unfavorable terms, to repay these debt instruments. Moreover, if we are not able to renegotiate the terms of theseany debt instruments in which we are in default, or repay them promptly, our ability to obtain financings, including performance guarantees or similar financings required under many of our business contracts, would be impaired, which may have a material adverse effect on our business, financial condition and results of operations.
We may not be ablehave sufficient cash or access to sell assets on favorable terms or at allfunding to meet our extraordinary payment obligations
As part of our strategic action plan, our board of directors has approved the sale ofWe expect to have certainnon-strategic assets, in order to raise funds to make payments in respect of debt related to the termination of the GSP gas pipeline concession. In accordance with this plan, we have undertaken several divestitures. However, we cannot assure you that we will be able to continue to sell assets on favorable terms or at all. If we are not able to sell assets on a timely basis, our ability to address our liquidity needs could be adversely affected and we may breach our significant extraordinary payment obligations under our debt relatedin the future. With respect to the termination of the GSP gas pipeline concession.
Conversely, if we sell significant assets, our business and results of operations will be diminished.
A class action civil lawsuit in the United States may adversely affect our company
A securities class action civil lawsuit has been filed against our company and certain of our former directors and former and current executive officers, in the United States. The suit is in early stages, andsettlement terms stipulate that the remaining $14,650,000, plus interest of 5% per annum running from September 17, 2020, must be paid by the company by June 30, 2021. We have initiated discussions with the plaintiffs regarding a deferral of this payment, but we cannot assure you that an agreement will be reached. In addition, while the terms of a final settlement and cooperation agreement relating to investigations in Peru remain under discussion with Peruvian authorities and are confidential, we currently expect that any final settlement and cooperation will require that we make significant payments over a period of years to be agreed.
We also have certain payment obligations in respect of our positionindebtedness that has become due. Our Financial Stability Framework Agreement matured in July 2020. We received a waiver with respect to the maturity date, most recently, until April 30, 2021, and we are currently negotiating an additional extension. As of the date of this annual report, US$30.2 million was outstanding under the agreement. In addition, as of the date of this annual report, US$23.7 million was outstanding under a short term loan from Banco Santander to our subsidiary Cumbra. We received a waiver with respect to the maturity date under the loan until March 30, 2021 and subsequently negotiated payment in installments, beginning in May 2021 and ending in September 2021. See “Item 5.B. Operating and Financial Review and Prospects—Liquidity and Capital Resources—Indebtedness.”
We cannot assure you that we will prevail. Ifhave sufficient cash from operations, any sale of non-strategic assets, or access to equity or debt financing, to enable us to make those or other extraordinary payments in accordance with our position does not prevail, the case mayagreements, or that following any such payments, we will have substantial adverse effects onsufficient cash to continue to operate our business financial condition and results of operations.consistent with past practices.
We may be unable to access creditfinancing that we need to operate our business on favorable terms or at all
Due to uncertainty relating to the investigations of our company, our creditors and other banks operating in the Peruvian market have placed restrictions on our ability, and the ability of other construction companies, to acquire future credit lines or other financings. ThisIn particular, our failure to execute a final settlement and cooperation agreement with the Peruvian government within a reasonable time frame may affectmaterially impair our ability to remove these restrictions.
Our ability to obtain financings will also depend in part upon prevailing conditions in credit and capital markets, which are beyond our control. Emerging markets have been affected by changes in the U.S. monetary policy, resulting at times in a withdrawal of investments and increased volatility in the value of their currencies. If interest rates rise significantly in the United States, emerging market economies, including Peru, could find it more difficult and expensive to borrow capital and refinance existing debt. Higher interest rates globally or in Peru would in turn impact our costs of funding.
Currently, volatility and instability due to the ongoing COVID-19 pandemic and government measures to contain the spread of the virus also has, and may continue to, negatively affect the general willingness of lenders to extend credit. At the same time, the COVID-19 pandemic has also put further pressure on our liquidity needs, including for short-term working capital, including by adding costs arising from delays in our engineering and construction and other projects as a result of infections. We cannot assure you that work will not be halted again or that these projects will be completed on time or at all.
We cannot assure you that we will be able to obtain new financings in the future on favorable terms or at all. We may encounter difficulties in obtaining performance bonds or credit support that we require to secure, among other things, bids, advance payments and performance for our projects.
An inability to procure adequate financing for new or existing projectscredit on favorable terms or at all could have a material adverse effect on our business, financial condition and results of operation.
We may not be able to sell assets on favorable terms or at all
As part of our strategic action plan in response to the termination of the GSP gas pipeline concession, our board of directors approved the sale of certain non-strategic assets, in order to raise funds to make payments in respect of debt related to the termination of the GSP gas pipeline concession. In 2017 and 2018 we undertook multiple divestitures. In addition, we continue marketing for sale our subsidiary Adexus. Moreover, we are also evaluating the sale of additional assets, including part of our land bank, which we do not consider to be strategic to our business, to meet our liquidity needs. However, we cannot assure you that we will be able to continue to sell assets on favorable terms or at all. If we are not able to sell assets on a timely basis, our ability to address our liquidity needs may render us unablebe adversely affected. Conversely, if we sell significant assets, our business and results of operations will be diminished.
We may be subject to competetakeover transactions, and we cannot assure you that any such transaction, if it were to occur, would be favorable to our shareholders.
We may be increasingly subject to takeover actions, including as a result of uncertainties relating to the ongoing investigations and the effects of the COVID-19 pandemic. In November 2019, IG4 Investimentos Ltda, a Brazilian hedge fund, announced its intention to acquire a significant stake in our company, indicating that it had signed a memorandum of understanding with certain shareholders and that it was interested in undertaking a partial public tender offer. Since that announcement, we have received due diligence inquiries from IG4 Investimentos Ltda, which we have responded on the basis of public information.
In August 2020, affiliates of IG4 Investimentos Ltda filed a pre-commencement communication confirming their intention to launch a tender offer to purchase common shares and ADSs of the company. On August 27, 2020, IG4 Investimentos Ltda publicly disclosed that it had reached a binding agreement for the acquisition of Company shares with the same group of shareholders with whom it had executed a memorandum of understanding.
We cannot assure you that IG4 Investimentos Ltda, or winany other offeror, will launch (and if launched, consummate) a public tender offer or other acquisition of company securities. If IG4 Investimentos Ltda, or any other offeror, does launch a tender offer or other acquisition transaction, we cannot assure you that the consideration, or other terms and conditions offered to our shareholders pursuant to any tender offer or other acquisition transaction will be favorable to our shareholders. If IG4 Investimentos Ltda, or any other offeror, acquires a significant stake in, or control of, the company, we cannot assure you that the interests of such new projects.
controlling or significant shareholders will be unavailable for a certain periodaligned with those of time, which may make it harder to effect such sales.the company’s other shareholders.
Risks Related to Our Company
Global economic conditions could adversely affect our financial performance
The global financial crisis and ensuing global recession in 2008 and 2009 had a significant adverse effect on the development of large-scale infrastructure and real estate projects worldwide. Subsequently, global economic conditions, including slower growth in China, declines in global commodity, in particular oil and gas prices, the appreciation of the U.S. dollar against foreign currencies, the withdrawal of investments from emerging markets and continued concerns about the U.S. and European economies, generated economic uncertainty which affected private- and public-sector investments. The United Kingdom voted to exit the European Union on June 23, 2016. As of the date hereof, the actions to be taken by the United Kingdom to effectively exit the European Union and the duration of this process are uncertain. The results of the referendum in the United Kingdom have caused, and are expected to continue to cause, volatility in financial markets, which in turn could have substantial adverse effects on our business, financial condition and results of operations. On November 8, 2016, Mr. Donald J. Trump was elected president of the United States. President Trump has implemented greater restrictions on free trade and limitations on immigration. Changes in social, political, regulatory and economic conditions in the United States or in laws and policies governing foreign trade could create uncertainty in the international markets and could have a negative impact on emerging market economies, including the Peruvian economy, which in turn could have a negative impact on our operations. Future globalGlobal economic conditions, in particular fluctuations in commodity prices and financings costs, may impact our clients’ investment decisions. Should our clients choose to postpone or suspend new investments or delay or cancel the execution of existing projects as a result of global economic conditions, demand for our products and services including our backlog, would decline, which may result in a decline in revenues and in under-utilization of our capacity. Since mid-March of 2020, the ongoing COVID-19 pandemic has disrupted economic activity and has caused a global recession. In addition, our business may be impacted by adverse economic developments even after economic conditions have improved because of the lag time between when investments decisions are made and when the projects are executed. Furthermore, financial difficulties suffered by our clients, joint operation partners, subcontractors or suppliers due to global economic conditions could result in payment delays or defaults, or increase our costs or adversely impact our project execution. Accordingly, a global economic downturn could have a material adverse effect on our financial performance.
We face significant competition in each of our markets
Each of the markets in which we operate is competitive. We compete on the basis of, among other factors, price, performance, product and service quality, skill and execution capability, client relations, reputation and brand, and health, safety and environmental record. We face significant competition from both local and international players. Some of these competitors may have greater resources than us or specialized expertise in certain sectors. In addition, a portion of our business is derived from open bidding processes which can be highly competitive. Certain of our markets are highly fragmented with a large number of companies competing for market share. Our competitors may be more inclined to take greater or unusual risks or accept terms and conditions in a contract that we might not deem acceptable. Moreover, we cannot assure you that we will not face new competition from industry players entering or expanding their operations in our markets. If we are unable to compete effectively, our ability to continue to grow our business or maintain our market share would be affected. In addition, because one of the factors on which we generally compete is price, increased competition could impact our operating margins. Accordingly, our business and financial performance could be adversely affected by competition in our markets.
A major change in Peruvian government policies could affect our business
Our business is significantly affected by national, regional and municipal government policies and regulations in the countries where we operate, including with respect to infrastructure concessions or similar contracts to the private sector, public spending in infrastructure investment and government housing subsidies, among others. Any adverse change in government policies with respect to these matters could result in a material adverse effect on our business and financial performance. In March 2020, as a result of the ongoing COVID-19 pandemic, the Peruvian government temporarily shut down substantially all construction activity. Although all of our construction projects have for the most part resumed since July 2020, we cannot assure you that future halts will not occur, including as a result of the COVID-19 pandemic.
For example, in May 2020, the Peruvian Congress suspended the payment of tolls on roads during the initial period of quarantine. Although the Peruvian Constitutional Court struck down the statute effective June 30, 2020, we have yet to collect compensation for tolls which were suspended during that period.
Social conflicts may disrupt infrastructure projects
Despite Peru’s ongoing economic growth and stabilization, high levels of poverty and unemployment and social and political tensions continue to be pervasive problems in the country. Peru has, from time to time, experienced social and political turmoil, including riots, nationwide protests, strikes and street demonstrations. In recent years, certain regions experienced strikes and protests related mainly to the environmental impact of mining activities, which resulted in commercial disruptions, including in the departments of Cajamarca and Arequipa.disruptions. These protests may lead to the suspension of mining projects. Social conflicts may disrupt, delay or suspend infrastructure projects in the future, which could have a material adverse effect on our business and financial performance.
In addition, beginning in October 2019, Chile has suffered from widespread social unrest and vandalism that has had a significant economic and political impact on the country. As a result, the Chilean congress convened a plebiscite in March 2020, which was rescheduled to October 25, 2020 as a result of the COVID-19 pandemic, in which Chilean constituents voted to amend the Chilean Constitution. The new Chilean Constitution will be drafted by a political body whose members are expected to be elected in May 2021. As a result, a new plebiscite to approve or reject the new Chilean Constitutional text is expected to be held thereafter. This process may result in further social unrest and protest and could also result in substantial structural changes in Chile that could adversely impact the private sector, including our operations in the country.
Additionally, beginning in November 2019 and more recently in 2021 to date, Colombia experienced civil unrest in the form of a national strike and anti-government protests. As such, our Colombian operations could be adversely impacted by changing economic, political and social conditions in Colombia and by the Colombian government’s response to such conditions.
New projects may require the prior approval of local indigenous communities
In September 2011,The legislative branches of Colombia, Chile and Peru have enacted Law No. 29,785, regarding the Prior Consultation Right of Local Indigenous Communities,legislation in accordance with the International Labor Organization Convention No. 169 (Ley del Derecho a la Consulta Previa a los Pueblos Indígenas y Originarios, Reconocido en el Convenio 169 de la Organización Internacional del Trabajo). This law that establishes a priornon-binding consultation procedureprocedures (procedimiento de consulta previa) thatwith respect to indigenous communities.
Under these laws the Peruvian government must carry out consultation procedures with local indigenous communities, whose rights may be directly affected by new legislative or administrative measures, including the granting of certain permits or new concessions or similar contracts, such as for mining, energy and oil and gas projects. Local indigenous communities do not have a veto right; and therefore, upon completion of this prior consultation procedure, the Peruvian government retains the discretion to approve or reject the applicable legislative or administrative measure. However, we cannot assure you that these consultation procedures will not negatively influence a decision by Peruvian government to grant us a permit, concession or consent and, therefore, adversely affect new projects and concessions. Accordingly, our business and financial performance may be materially and adversely affected.
Our backlog and our ratio of historical backlog to revenues may not be reliable indicators of future revenues or profit
The amount of our backlog is not necessarily indicative of future revenues or profits related to the performance of the related contracts. Our backlog amount is subject to revision over time and our ability to realize revenues from our backlog is subject to a number of uncertainties. Cancellations, scope adjustments or deferrals may occur, from time to time, with respect to contracts reflected in our backlog and could reduce the amount of our backlog and the revenue and profits that we actually earn. For example, the termination of the GSP gas pipeline concession on January 24, 2017 reduced our backlog as of December 31, 2016 by US$855 million, 30.2% of our E&C backlog and 21.4% of our total backlog as of that date. Contracts may also remain in our backlog for an extended period of time and poor performance could also impact our profit from the contracts in our backlog. In addition, our backlog is expressed in U.S. dollars based onperiod-end exchange rates while a significant portion of our contracts are payable in soles or other local currencies. As a result, any depreciation of local currency would diminish the amount of revenues eventually earned relative to backlog. For more information, see “Item 5.A. Operating and Financial Review and Prospects—Operating Results—Recent Developments.” The amount of our backlog is not necessarily indicative of future revenues or profits related to the performance of the related contracts.
Our backlog may decline further.in the future. We cannot assure you that we will be able to obtain sufficient contracts in the future in number and magnitude to increase our backlog. Additionally, the amount of new contracts that we obtain can fluctuate significantly from period to period due to factors that are beyond our control.
TheMoreover, the ratio of our historical backlog to revenues earned in subsequent years is volatile and substantially affected by a number of factors, some of which are outside our control, including levels of contract scope adjustments and our ability to enter into new contracts (which are substantially influenced by general macroeconomic conditions), delays and cancellations, foreign exchange rate movements and our ability to increase the scale of our operations to expand the amount of work we carry out beyond that previously contracted. Accordingly, historical correlations between backlog and revenues may not recur in future periods.
Our success depends on key personnel
Our success depends, to a significant degree, upon the services of our senior management, board of directors and other key personnel. Members of our management team are not subject to long-term employment agreements ornon-competition agreements with us. We cannot assure you that we will be successful in retaining our current senior management or members of our board of directors, nor can we assure you that, in such event, we would be able to find suitable replacements. In addition, the success of our business depends on our ongoing ability to attract, train and retain qualified engineers and other personnel. In recent years, the availability in Peru of qualified personnel who have the necessary expertise and experience has been lower than demand and, therefore, competition for human resources has become intense. We cannot assure that we will be able to hire and retain the number of qualified personnel required to meet the needs of, or to grow, our business. If we are unable to attract, train and retain the qualified personnel that we require at reasonable cost, our business and financial performance could be adversely affected.
Our success depends, to a large extent, on our reputation for the quality, reliability, timely delivery and safety of our products and services
We believe our track record and reputation are key factors in our clients’ evaluation of whether to engage our services and purchase our products, encouraging key industry players to partner with us, and recruiting and retaining talented personnel to our company. Our reputation is based, to a large extent, on the quality, reliability, timeliness and safety of our products and services. If our products do not meet expected standards or we fail to meet our deadlines, our relationship with our clients and partners could suffer, the reputation of our company could be adversely affected, we may not be invited to new bidding processes and our ability to capture new business could be severely diminished.
The nature of our business exposes us to potential liability claims and contract disputes
We may be subject to a variety of legal or administrative proceedings, liability claims or contract disputes. The government, clients and other third parties may present claims against us for injury or damage caused, directly or indirectly, by our operations, for example for alleged failures in our engineering and construction, the operation of our infrastructure concessions (such as our toll roads or the Lima Metro), and real estate developments we sell. Although we have a range of insurance coverage policies and have adopted risk management and risk avoidance programs designed to reduce potential liabilities, a catastrophic event resulting from the services we have performed or products we have provided could result in significant professional or product liability, warranty or other claims against us as well as reputational harm, especially if public safety is impacted. We may in the future be named as a defendant in legal proceedings where our clients or third parties may make a claim for damages or other remedies with respect to our projects or other matters. Any liability not covered by our insurance, or in excess of our insurance limits, could result in a significant loss for us, which may affect our financial performance.
We are susceptible to operational risks that could affect our business and financial performance
Our business is subject to numerous industry-specific operational risks, including natural disasters, adverse weather conditions, operator error or other accidents, mechanical and technical failures, explosions and other events and accidents, many of which are beyond our control. Such occurrences could result in injury or loss of life, severe damage to and destruction of property and equipment, business interruption, pollution and other environmental damage,clean-up responsibilities, regulatory requirements, investigations and penalties, potential liability claims and contractual disputes. In addition, such occurrences could materially impact our reputation. Although we maintain comprehensive insurance covering our assets and operations at levels that our management believes to be adequate, our insurance coverage will not be sufficient in all circumstances or to protect against all hazards. The occurrence of such an operational risk could have a material adverse effect on our business and financial performance.
Deterioration in our safety record could adversely affect our business and financial performance
Our ability to retain existing clients and attract new business is dependent on our ability to safely operate our business. Existing and potential clients consider the safety record of their services providers to be of high importance in their decision to award service contracts. Some of our activities, in particular in our E&C segment, can be high risk by their nature. If one or more accidents were to occur at a site, the affected client may terminate or cancel our contract and may be less likely to continue to use our services. Although our track record on safety matters is consistent with industry standards, we cannot assure you that we will not experience accidents in the future, causing our safety record to deteriorate. Accidents may be more likely as we continue to grow, particularly if we are required to hire less experienced employees due to shortages of skilled labor. Moreover, often times we do not perform these activities by ourselves and accidents can happen due to errors committed by partners and subcontractors over whom we have no control. Because many of our clients require us to report our safety metrics to them as part of the bidding process and because a substantial part of our client base is comprised of major companies with high safety standards, a general deterioration in our safety record could have a material adverse impact on our business including our ability to bid for new contracts.
Any safety incidents or deterioration in our safety record could adversely impact our ability to attract and retain qualified employees. In addition, we could also be subject to liability for damages as a result of accidents and could incur penalties or fines for violations of applicable safety laws and regulations.
Increases in the prices of energy, raw materials, equipment or wages could increase our operating costs
Our business requires significant purchases of energy, raw materials and components, including, among others, large quantities of fuel, cement and steel, as well as purchases or leases of equipment. Certain inputs used in our operations are susceptible to significant fluctuations in prices, over which we may have little control. The prices of some of these inputs are affected to a significant extent by the prices of commodities, such as oil and iron. Global oil prices increased in 2016 and 2017 and they decreased in 2018, increased in 2019 but declined precipitously in March 2020 as a result of a dispute among OPEC members about global prediction levels and wethe effect on demand caused by the disruption of economic activity associated with the ongoing COVID-19 pandemic. Subsequently, global oil prices have slowly recovered, reaching pre-COVID-19 levels by the end of 2020. We cannot assure you that oil prices will not increasebe low in the future (although increased oil prices would benefit revenues in our Energy line of business). Substantial increases in the prices of such commodities generally result in increases in our suppliers’ operating costs and, consequently, lead to increases in the prices they charge for their products. Moreover, we do not have long-term contracts for the supply of our key inputs, and, as a result, if prices increase significantly or if we are required to find alternative suppliers, our costs to procure these inputs may increase significantly. In addition, growing demand for labor, especially when coupled with shortages of qualified employees in the countries where we operate, may result in significant wage inflation. To the extent that we are unable to pass along to our clients increases in the prices of our key inputs or increases in the wages that we must pay, our operating margins could be materially adversely impacted.
We may not be able to obtain financing on favorable terms
Our ability to undertake large investments (particularly in our Infrastructure and Real Estate segments) or consummate significant acquisitions will depend on the availability of equity and debt financing. We cannot assure you that we will be able to obtain new financings in the future on favorable terms or at all. Our ability to obtain financings will depend in part upon prevailing conditions in credit and capital markets, which are beyond our control. In 2008 and 2009, global markets suffered turmoil, which significantly constrained the availability of new financings. In addition, our ability to obtain new financing, or refinance existing debt, may at certain times be adversely affected by the cyclicality of our business, particularly our E&C segment, as has occurred in the past. Furthermore, in response to the ensuing global economic recession in 2009, many countries, in particular the United States as well as the countries where we operate, have maintained target interest rates at very low levels. However, more recently, the U.S. Federal Reserve has begun to increase target interest rates in the United States. Emerging markets have been affected by this change in the U.S. monetary policy, resulting in a withdrawal of investments and increased volatility in the value of their currencies. If interest rates rise significantly in the United States, emerging market economies, including Peru, could find it more difficult and expensive to borrow capital and refinance existing debt. Higher interest rates globally or in Peru would in turn impact our costs of funding. If adequate funds are not available, or are not available on favorable terms, we may not be able to make future investments or pursue acquisitions or other opportunities.
We may not be able to recover on claims against clients for payment
If a client fails to pay our invoices on time or defaults in making its payments to us, we could incur significant losses. We occasionally bring claims against clients for delayed payments, additional costs that exceed the contract price or for amounts not included in the original contract price, including change orders. These types of claims can occur due to matters such as owner-caused delays or changes from the initial project scope, and, occasionally, they can be the subject of lengthy proceedings. When these types of events occur and unresolved claims are pending, we may invest significant working capital in projects to cover cost overruns pending the resolution of the relevant claims. Moreover, we have recently encountered difficulties collecting on claims, even following successful arbitration awards, particularly against the government. A failure to promptly recover on these types of claims and change orders could have a material adverse effect on our financial performance.
If we are unable to enter into consortia or other strategic alliances, our ability to compete for new business may be adversely affected
We may join with other companies to form joint operations or other strategic alliances to compete for a specific concession or contract, including with partners that contribute expertise in a specific field. Because a consortium or alliance can often offer stronger combined qualifications than a company on a stand-alone basis, these arrangements can be important to the success of a particular bid. If we are unable to enter into consortia or other strategic alliances, our ability to compete for new business may be adversely affected.
Our consortia and other strategic alliances may be affected by disputes with, or the unsatisfactory performance by, our partners
Although we have a thorough partner selection process, consortia and other strategic alliances that we enter into as part of our business, including arrangements where operating control may be shared with unaffiliated third parties, may involve risks not otherwise present when we operate independently, including: sharing approval rights over major decisions; responsibility for our partners’ unpaid obligations or liabilities; ensuring ethical and compliance behavior; our partners’ capacity to contribute with their share of project capital expenditures and inconsistencies in our and our partners’ economic or business interests or goals. Any disputes between us and our partners may result in delays, litigation or operational impasses. We may also incur liabilities as a result of action taken by or against our partners. In addition, if we participate in consortia or other strategic alliances where we are
not the controlling party, we may have limited control over operational, financial and other management decisions and actions and the success of the consortium or other strategic alliance will depend largely on the performance of our partners. These risks could adversely affect our ability to transact the business that is the object of such consortium or other strategic alliance, and could result in the termination of the applicable concession or contract. Under these circumstances, we may be required to make additional investments and provide additional services to ensure adequate performance and delivery. These additional obligations could result in reduced profits or, in some cases, increased liabilities or significant losses for us. In addition, failure by a partner to comply with applicable laws or regulations could negatively impact our business and, in the case of government contracts, could result in fines, suspension or even debarment from participating in bidding processes. As a result, our business, reputation and financial performance could be adversely affected by disputes involving our consortia or other strategic alliances.
We are dependent upon third parties to complete many of our contractual obligations
We rely on third-party suppliers to provide a significant amount of the materials and equipment used in our businesses. A portion of the work performed under our infrastructure concessions and, to a lesser extent, other contracts is performed by third-party subcontractors. As a result, the timely completion and quality of our projects may depend on factors beyond our control, including the quality and timeliness of the delivery of materials supplied for use in the project and the technical skills of subcontractors hired for the project. If we are unable to find qualified suppliers or hire qualified subcontractors, our ability to meet our contractual obligations could be impaired. In addition, if the amount we are required to pay for supplies, equipment or subcontractors exceeds what we have estimated, we may suffer losses under our contract. If a supplier or a subcontractor fails to provide supplies, equipment or services as required under a negotiated arrangement for any reason, or provides supplies, equipment or services that are not of an acceptable quality, we may be required to source those supplies, equipment or services on a delayed basis or at a higher price than anticipated, which could impact our financial performance. In addition, faulty materials or equipment could result in claims against us for failure to meet contractual specifications, and failure by suppliers or subcontractors to comply with applicable laws and regulations could negatively impact our reputation and our business and, in the case of government contracts, could result in fines, suspension or even debarment from participating in bidding processes. These risks may be intensified during economic downturns if these suppliers or subcontractors experience financial difficulties. As a result, our business and financial performance may be adversely affected by our dependence on third-party providers.
Debarment from participating in government bidding processes would have a material adverse effect on our business and financial performance
We or one of our subsidiaries would face debarment from participating in government bidding processes for one to three years if, including potentially as a result of the ongoing investigations against our company and GyM, we or they were found to have violated certain provisions of the Peruvian State Contracting Law (Ley de Contrataciones del Estado). We and our subsidiaries are required to comply with a large number of contractual obligations with the government in our business, and we cannot assure you that we will be in full compliance at all times. Moreover, the imposition of a debarment on a subsidiary could affect the ability of our company or our other subsidiaries (not just the subsidiary that was debarred), to participate in government bids under the Peruvian State Contracting Law. Approximately 11.6% of our 2018 revenues came from public-sector contracts in Peru. As of December 31, 2018, 6.5% of our backlog is comprised of contracts with the public sector. As a result, if we are debarred from participating in government bidding processes, our business and financial performance would be materially and affected.
Failure to comply with, or changes in, laws or regulations could have a material adverse effect on our business and financial performance
We operate in highly regulated industries. Our business and financial performance depends on our ability and the ability of our clients’ abilityclients, suppliers, subcontractors and partners to comply on a timely and efficient basis with extensive national, regional and municipal laws and regulations relating to, among other matters, environmental, health and safety, building and zoning, labor, tax and other matters. The cost of complying with these laws and regulations can be substantial. In addition, compliance with these laws and regulations can cause scheduling delays. Although we believe we are in compliance with all applicable concessions, other similar contracts, laws and regulations in all material respects, including our concessions or similar contractual obligations, we cannot assure you we have been or will be at all times in full compliance. Failure by us or our clients, suppliers, subcontractors or partners to comply with our concessions, similar contracts or these laws and regulations, or our concessions or similar contractual obligations, could result in a range of adverse consequences for our business, including subjecting us to significant fines, civil liabilities and criminal sanctions, requiring us to comply with costly restorative orders, the shutdown of operations, and revocation of permits and termination of concessions or similar contracts. In addition, we cannot assure you that future changes to existing laws and regulations, or stricter interpretation or enforcement of existing laws and regulations, will not impair our ability to comply with such laws and regulations, or increase our compliance costs.costs or impair our ability to perform our obligations with our clients, suppliers, subcontractors or partners as agreed.
We may be held liable for environmental damage caused by our operations
The nature of certain of our operations requires us to assume risks of causing environmental and other damages. We may be held liable for the environmental damage we cause, including the incidental consequences of human exposure to hazardous substances or other environmental damage. We may be subject to clean up costs or penalties in the event of certain discharges into the environment and/or environmental contamination and damage. Our environmental liability insurance may not be sufficient or may not apply to certain types of environmental damage. Any substantial liability for environmental damage could have a material adverse effect on our financial performance.
New environmental regulation as a result of climate change could impact our business and financial performance
Growing concerns about climate change could result in the imposition of additional or more stringent environmental requirements or regulations. For example, there are ongoing international efforts to address greenhouse emissions, such as the Kyoto Protocol or the more recent Paris Agreement, which are in various stages of negotiation and implementation. If more stringent environmental regulation is adopted in the countries where we operate, we may be obliged to incur higher expenditures than anticipated, adversely affecting our financial performance. In addition, future remediation requirements in the event that we are found responsible for environmental damage may be substantial and could impact our financial condition. Moreover, more stringent environmental regulation could increase the costs of projects for our clients or, in some cases, prevent a project from going forward, thereby potentially reducing the demand for our services. Accordingly, new environmental regulation could have a material adverse effect on our business and financial performance.
We may not be able to effectively protect ourselves against financial market risks
Our operations are exposed to financial market risks, such as risks related to exchange rates, commodity prices and interest rates. Fluctuations in currency, commodity prices or interest rates could adversely affect our financial performance. We cannot assure you that derivative financial instruments, if any, will protect us from the adverse effects of financial market risks. While hedging transactions are intended to reduce market risks, such transactions may expose us to other risks, such as counterparty risk. We may not be able to adequately protect ourselves against financial market risks and may not ultimately achieve an economic benefit from our hedging strategy.
The loss of a key client in some of our lines of business may affect our business and financial performance
In some of our lines of business, such as our Infrastructure segment, a substantial amount of the revenue we receive is concentrated among a limited number of clients, including the Peruvian government. If one or more of these major clients fail or delay in paying our fees, or if there is a significant reduction or cancellation of business by one or more of these major clients, our business and financial performance may be adversely affected. If we are not able to capture new clients to replace the loss of business from existing key clients, our financial performance may be adversely affected.
Our use of thepercentage-of-completion method of accounting for our Engineering and Construction segment could result in a reduction of previously recorded profits
In accordance with IFRS, we measure and recognize a large portion of our revenues under thepercentage-of-completion accounting methodology. This methodology allowswhich required us to recognize revenues ratably overmake assumptions and estimates as of the lifedate of the company’s consolidated financial statements.
Revenues from engineering and construction contracts are recognized by the percentage-of-completion method, which requires estimating the contract revenue and contract costs that will be obtained at culmination of work. Accordingly, these projections are determined by management based on their estimated budgets and adjusted periodically to reflect actual performance as work is completed. When changes occur that were not approved in a contract, without regardproject’s original scope of work, income is recognized as equivalent to the timing of receipt of cash payments, by comparing the amount of the costs incurred (i.e., no profit is recognized) until such changes have been approved.
Contract revenue and contract costs related to date againstcontracts are recognized in the company’s consolidated statement of income for the accounting periods in which the relevant work was executed. However, any expected or likely cost overruns that would exceed total amount of costs expected to be incurred. The effect of revisions to estimated costs, and thus revenues,revenue under the contract is recorded as an expense at the time of incurrence. In addition, any change in management’s estimates are reflected in contract revenue and contract
cost for the period when the amountssuch estimates are known and canrevised. Such adjustments could be reasonably estimated. These revisions can occur at any timematerial and could be material. On a historical basis, we believe that we have made reasonably reliable estimatesresult in reduced profitability. In certain contracts, the terms of the progress towards completion onagreement allow our long-term contracts. However,customers to withhold certain amounts until construction is completed. Under these contracts, total collection from customers may not be realized until construction is completed.
While management believes that the estimates made pursuant to the percentage-of-completion method at the end of the 2020 year and prior years are reasonable and made in accordance with the above methodology, given the uncertainties associated with these types of contracts and inherent in the nature of some of the industries in which we operate, it is possible for actual costs to vary from estimates previously made, including due to changes in facts and circumstances, which may result in reductions or reversals of previously recorded profits.
Labor unrest could adversely affect our financial performance
All of our manual laborers and a portion of our employees are members of labor unions. Our practice is generally to extend benefits we offer our unionized employees tonon-unionized employees. In our E&C segment, collective bargaining agreements are negotiated at two levels, on an annual basis between the Peruvian National Federation of Civil Construction and the Peruvian Chamber of Construction, without our direct involvement, and on a per project basis directly between the unions and us in accordance with such annual agreement. We also have collective agreements with our employees in certain of our business segments, which are also negotiated periodically. Although we consider that our relationship with unions is currently positive, we cannot assure you that we will not experience work slowdowns, work stoppages, strikes or other labor disputes in the future, which could result in the interruption or delay of our operations. Such interruptions or delays could have an adverse impact on our business, including on the cost of our projects and our ability to make timely delivery. Moreover, our operations may also be affected by labor unrest in the workforces of our clients’clients, suppliers, sub-contractors or our partners’ workforce.partners.
The proceeds from our insurance policies may not be sufficient and we may not be insured against all risks
We maintain insurance coverage both as a corporate risk management strategy and in order to satisfy the requirements under certain regulations and contracts. We cannot assure you that proceeds from our insurance policies, however, will be sufficient to cover the damages resulting from any event covered by such policies. Certain risks are not covered under the terms of our insurance policies,
such as interruption of operations. In such event, we may incur significant expenses to rebuild our facilities, repair or replace our equipment, or cover other damages. In addition, if any of our third-party insurers fail, abruptly cancel our coverage or otherwise cannot satisfy their insurance requirements to us, then our overall risk exposure and operational expenses could be increased. Moreover, we may not be able to renew our insurance policies on favorable terms, or at all. Although in the past we have been generally able to cover our insurance needs, we cannot assure you that we will be able to secure all necessary insurance in the future.
An increase in import duties and controls, or other restrictions on our obtaining instruments and equipment, may have a material adverse effect on our financial performance
Our future success depends in part on our ability to select and purchase high quality mechanical instruments and equipment at attractive prices. While we have historically been able to do so, such instruments and equipment may become subject to higher import taxes than currently apply. We cannot assure you that there will not be further increases in import taxes, changes in laws related to imports or the imposition of quotas by countries from which we import mechanical instruments and equipment, any of which could have a material adverse effect on our business.
Furthermore, our and certain of our subsidiaries’ ability to pay our instrument or equipment suppliers could be affected by our failure to obtain, on a timely basis, authorization from the Ministry of Justice pursuant to Law 30,73730737 to make such payments. SuchLaw 30737 requires that companies such as our company and certain of our subsidiaries that have been partners of companies that have been, or whose officers or representatives have been, convicted of, or have admitted to, corruption, money-laundering or similar crimes, submit money transfers abroad to the Peruvian Ministry of Justice for pre-approval. We cannot assure you that any such approvals will be granted in a timely manner or at all, and such restrictions may limit our ability to purchase necessary instruments and equipment.
The government may declare the nullity of public bidding processes after we have been awarded a project or concession
Even if we win the public bidding for a project or concession, the government may subsequently declare the process void for political, budgetary or other reasons and may cancel or terminate the project or concession awarded to us. For example, in June 2014, we were determined the winner of a public bidding for a concession to operate the fare collection system of Lima’s integrated transportation system for a period of 16 years. However, in January 2015, the Municipality of Lima notified us that the board of directors of the Instituto Metropolitano Protransporte de Lima – Protransporte had declared the nullity of the public bidding process, based on a report issued by the Peruvian Ministry of Economy and Finance, which concluded that the Ministry should have pronounced itself with respect to the concession prior to the bidding process instead of afterwards. We initiated a judicial proceeding in July 2015 to challenge such declaration of nullity, which proceedings remain ongoing. If upheld by the courts, the declaration of nullity of projects or concessions awarded to us could affect our future results of operations. Moreover, thewe lost. The uncertainty that results from these type of decisions may adversely impact investor confidence in Peru and our business.
Debarment from participating in government bidding processes could have an adverse impact on our business and financial performance
As a result of the ongoing investigations against our company, Concar and Cumbra, we or one or more of our subsidiaries may temporarily face debarment from participating in government bidding processes or entering into new contracts with the Peruvian government. We and our subsidiaries are required to comply with a large number of contractual obligations with the government in our business, and we cannot assure you that we will be in full compliance at all times. Moreover, the imposition of a debarment on a subsidiary could affect the ability of our company or our other subsidiaries (not just the subsidiary that was debarred), to participate in government bids under the Peruvian State Contracting Law. Approximately 1.1%, 6.01% and 17.5% of our E&C revenues for the 2020, 2019 and 2018 years, respectively, came from public-sector contracts in Peru. As of December 31, 2020, 1% of our backlog is comprised of contracts with the public sector, excluding government concessions. As a result, if we are debarred from participating in government bidding processes, our business and financial performance could be affected. To extent that economic conditions reduce private sector investments, being debarred from contracting with the Peruvian or other governments could further impact our company.
We may not be able to successfully expand outside of Peru
One of our long term strategies has been to continue to expand our operations outside of Peru, particularly in Chile and Colombia, and we expect that our international operations could become a more significant part of our consolidated business in future.Colombia. We cannot assure you that we will be able to replicate our success in Peru in other countries. Our international expansion is subject to additional challenges, including: our ability to assimilate cultural differences and practices; our limited familiarity with local laws, regulators and contractors; our ability to attract and manage foreign personnel; the absence of a local workforce formed in our corporate values and familiar with our operations; competition in foreign markets, including from industry players with significantly greater local experience and reputation; and other risks specific to these countries. Moreover, we may not be able to make equity investments when needed by our foreign operations, due to restrictions imposed by Law 30,737 in30737 on our ability to transfer funds abroad. Section IIabroad without pre-approval of Law 30,737, promulgated in March 2018, imposes certain restrictions on companies, such as our company, that have been partners of groups that have been, or whose officers or representatives have been, convicted of, or have admitted to, corruption, money-laundering or similar crimes. Among other things, the law requires that these companies submit money transfers abroad to the Peruvian Ministry of Justice forpre-approval, and we cannot assure you that any such approvals will be granted in a timely manner or at all.Justice.
Many countries in Latin America have suffered significant economic, political and social crises in the past, and these events may occur again in the future. If we are unable to overcome these challenges, we may not be able to successfully expand internationally.
We may not be able to make successful acquisitions
PartIn the past, part of our long-term strategy has beenwas to evaluate strategic acquisition opportunities to expand our operations and geographic footprint, especially in Chile and Colombia. We may not be able to identify appropriate acquisition opportunities, or, if we do, we may overpay for these acquisitions or may not otherwise be able to negotiate terms and conditions that are acceptable to us. We may also face difficulties obtaining financing to pay for acquisitions. Law 30,73730737 currently requires that payments we make abroad be submitted to the Peruvian Ministry of Justice forpre-approval, and we cannot assure you that any such approvals will be granted in a timely manner or at all.
In addition, we may not be able to obtain regulatory approvals, including antitrust approvals, required to consummate acquisitions. Furthermore, even if we are able to successfully consummate an acquisition, we may encounter challenges in integrating the acquired business effectively and profitably into our operations. The integration of an acquisition involves a number of factors that may affect our operations, including diversion of management’s attention, difficulties in retaining personnel and entry into unfamiliar
markets. Acquired businesses may not achieve the levels of productivity anticipated or otherwise perform as expected. Acquisitions may bring us into businesses we have not previously conducted and expose us to additional business risks that are different from those we have traditionally experienced, including new geographic, market, operating and financial risks. Moreover, acquisitions involve special risks, including the potential assumption of unanticipated liabilities and contingencies. Even if such liabilities are assumed by the sellers, we may have difficulties enforcing our rights, contractual or otherwise. We cannot assure you that future acquisitions will meet our strategic objectives.
Our IT security measures may be breached or compromised and we may sustain system outages
We rely on encryption, authentication technologySecurity breaches, whether intentional or unintentional, may threaten the confidentiality, integrity or availability of our information resources and firewallsmay allow unauthorized access to provide security forour systems, disrupt our digital operations, corrupt data, or allow persons to misappropriate confidential information, including personal data, transmitted to and by us over the internet. Adata. Any breach of our network security measures could result in the misappropriation of proprietary or personal information or cause interruptions in our IT services or operations, could damage our reputation and harm our ability to deliver services tooperate our clients.business. This may result in client or supplier dissatisfaction and a loss of business. Our security measures may be inadequate to prevent security breaches, and we may be required to expandexpend significant capital and other resources to protect against the threat of security breaches and to alleviate problems caused by breaches as well as by any unplanned unavailability of our IT systems caused by other reasons, which may adversely affect our business and financial performance.
Our services may infringe upon the intellectual property rights of others
Our IT services or third-party products we offer our clients, may infringe the intellectual property rights of third parties, and we may have infringement claims asserted against us. These claims may harm our reputation, increase our costs and prevent us from offering certain services or products. Any claims or litigation relating to intellectual property, even if ultimately decided in our favor, could be time-consuming and costly, injure our reputation or require us to enter into royalty or licensing arrangements. Any limitation on our ability to provide a service or product could result in our loss of revenue-generating opportunities and require us to incur additional expenses to develop new or modified solutions for future projects, which may adversely affect our business and financial performance.
Additional Risks Related to our Engineering and Construction Business
We are vulnerable to the cyclical nature of theend-markets we serve
Demand for our engineering and construction services is dependent on conditions in theend-markets we serve, which include, among others, the mining, power, oil and gas, transportation, real estate and other infrastructure sectors in Peru, as well as the mining sector in Chile and the energy sector in Colombia. Consequently, our engineering and construction business is closely linked to the performance and growth of these sectors, and it is exposed to many of the risks faced by our clients operating in these sectors, over which we have no control. These industries tend to be cyclical in nature and, as a result, although downturns can impact our entire company, our engineering and construction business has historically been subject to periods of very high and low demand. For example, between 2000 and 2003, there was a significant decline in activity in the Peruvian real estate and construction sectors, which consequently affected our and our competitors’ business and financial performance during that time. Factors that can affect these sectors include, among others, macroeconomic conditions, climate conditions, the level of private and public investment, the availability of credit, changes in laws and regulations, and political and social stability. The mining and oil and gas sectors, in particular, are also driven by worldwide demand for the underlying commodities, including, among others, silver, gold, copper, oil and gas, which can be affected by such other factors as global economic conditions and geopolitical affairs. A decline in prices for minerals, oil and gas has had in the past, and could have in the future, a significant impact on our clients’ exploration and production activities and, as a result, on their demand for our engineering and construction services. Since mid-March 2020, many of these sectors have been adversely affected by the COVID-19 pandemic and governments’ extraordinary measures to limit the spread of the virus. Accordingly, continuing adverse developments in theend-markets served by our engineering and construction business could have a material adverse effect on our financial performance.
Decreases in capital investments by our clients may adversely affect the demand for our services
Our engineering and construction business is directly affected by changes in private-sector and, to a lesser extent, public-sector investments for large-scale infrastructure projects. In addition, our engineering and construction business is directly affected by the availability and cost of financings for these projects. In the markets where we operate, investments and financings for large-scale projects have historically been influenced by macroeconomic and other factors which are beyond our control, including in the case of public-sector investment, government spending levels. As a result, we cannot assure you that clients will not choose to limit or not undertake new projects or delay, suspend or cancel existing projects. Further reductionsIn 2018, Peru experienced a growth rate of 5.40% in private and public investment and, in 2019, Peru experienced a decline of 1.5%. In addition, since mid-March 2020, due to the COVID-19 pandemic and governments’ extraordinary measures to limit the spread of the virus, public and private sector investment in engineering and construction and infrastructure projects has stalled. Reductions in anticipated capital investments or available financing for large-scale projects could have a material adverse effect on our financial performance. Public and private investment in our markets slowed significantly during 2016, 2017 and 2018 as a result of market conditions. In the case of Peru, public and private investment slowed significantly during 2016 and 2017, as a result of corruption investigations and political uncertainty. In 2018, Peru experienced a growth rate of 5.20% in private and public investment, but we cannot assure you that such growth will continue in subsequent years.
Our revenues may fluctuate based on project cycles, which we may not control
The substantial majority of the revenues from our engineering and construction business is generated from project awards, the timing of which may be unpredictable and outside of our control, especially considering the highly competitive bidding processes and complex and lengthy negotiations they involve. These processes can be impacted by a wide variety of outside factors including governmental approvals, financing contingencies and overall market and economic conditions. Moreover, because a significant portion of our revenues is generated from large-scalelargescale projects, our results of operations can fluctuate quarterly or yearly depending on whether and when project awards occur and the commencement and progress of work under awarded contracts. As a result, we are subject to the risk that revenues may not be derived from awarded projects as quickly as anticipated.
Our business may be adversely affected if we incorrectly estimate the costs of our projects
We conduct our engineering and construction business under various types of contractual arrangements where costs are estimated in advance. In some of our contracts (i.e.,lump-sum, unit price and EPC), we bear the risk of some or all unanticipated cost overruns, including those due to inflation or certain unforeseen events. Risks under contracts which could result in cost overruns include: difficulties in performance of our subcontractors, suppliers, or other third parties; changes in laws and regulations or difficulties in obtaining permits or other approvals; unanticipated technical problems; unforeseen increases in the cost of inputs, components, equipment, labor, or the inability to obtain these on a timely basis; delays caused by weather conditions; incorrect assumptions related to productivity or scheduling estimates; and project modifications that create unanticipated costs or delays. These risks tend to be exacerbated for longer term contracts since there is increased risk that the circumstances under which we based our original bid could change. In many of our contracts, we may not be able to obtain compensation for additional work performed or expenses incurred. Our failure to estimate accurately the resources and time required to complete a project could adversely affect our profitability. Even under our cost-plus contracts, our inability to complete projects within the estimated budget could affect our relationship with our clients and negatively impact awards of future contracts. As a result, if we incorrectly estimate the costs of our projects, our business and financial performance could be adversely affected.
We may be unable to deliver our services in a timely manner
The success of our engineering and construction business depends on our ability to meet the standards and schedules required by our clients. Significant delays that prevent us from providing our services on agreed time frames could adversely affect our client relations and reputation. Delays may occur for a number of reasons, including: the COVID-19 pandemic and government measures to curb the spread of the virus; our inability to adequately foresee the needs of our clients; delays caused by our joint operation partners, subcontractors or suppliers; insufficient production capacity; equipment failure; shortage of qualified workers; changes to customs regulations; and natural disasters. Failure to finish construction by the contractual completion date set forth in the contract could result in costs that reduce our projected profit margins, including a requirement to pay daily penalties and damages. If we are unable to meet deadlines, either due to internal problems or as a result of events over which we have no control, we may lose the trust of our clients and, therefore, experience a decrease in the demand for our services. In such event, our business and financial performance could be adversely affected.
We may not be able to obtain compensation for additional work or expenses incurred as a result of client-requested change orders
Clients often determine, after commencement of the project, to change various elements of the project. Some of our contracts may also require that clients provide us with design or engineering information or with equipment or materials to be used on the project, and, in some cases, the client may provide us with deficient design or engineering information or equipment or materials or may provide the information or equipment or materials to us later than required by the project schedule. Our project contracts generally require the client to compensate us for additional work or expenses incurred due to client requested change orders or failure of the client to provide us with specified design or engineering information or equipment or materials. Under these circumstances, we generally negotiate with the client with respect to the amount of additional time required to make these changes and the compensation to be paid to us. We are subject to the risk that we are unable to obtain, through negotiation, arbitration, litigation or otherwise, adequate amounts to compensate us for the additional work or expenses incurred by us due to client-requested change orders or failure by the client to timely provide required items. A failure to obtain adequate compensation for these matters could require us to record an adjustment to amounts of revenue and gross profit that were recognized in prior periods. Any such adjustments, if substantial, could have a material adverse effect on our financial performance.
We may have difficulty obtaining performance bonds that we require in the normal course of our operations
In our engineering and construction business, it is industry practice for customers to require performance bonds or other forms of credit enhancementsupport to secure, among other things, bids, advance payments and performance. We cannot assure you that in the future we will not encounter difficulties in obtaining such performance bonds or credit enhancements.support. The Peruvian market for these types of credit instruments is small; moreover, under Peruvian banking regulations, lenders are required to impose limits on the amount of credit they extend to a group of affiliated companies. In addition, the ongoing COVID-19 pandemic may limit the availability of credit support that is available for engineering and construction businesses. Failure to provide performance bonds or credit enhancementssupport on terms required by clients may result in our inability to compete for or win new projects.
Moreover, under certain contracts, we may be obligated to maintain performance bonds during the course of litigation, significantly increasing the costs incurred as a result of a dispute. This also may expose us to the risk that a client may enforce the performance bond without regard to the merits of its claim which, in turn, may debilitate our negotiating position with the client and consequently impair our ability to favorably resolve the dispute.
Additional Risks Related to our Infrastructure Business
A substantial or extended decline in oil prices may adversely affect our financial performance
A substantial part of the revenues of our infrastructure business depends upon prevailing prices for oil. Historically, oil prices and markets have been volatile and are likely to continue to be volatile in the future. Moreover, global oil prices have fluctuated significantly in recent years, with the average Brent crude prices decliningincreasing from US$99.0253.80 per barrel in 20142018 to US$54.2066.00 per barrel in 2017. In 2018, average Brent crude prices increased2019. The price of oil dropped precipitously due in part to the COVID-19 pandemic as well as to disputes between OPEC members, to US$70.99 per barrel, but30.80 as of March 31, 2020 and US$18.83 as of April 30, 2020. The price of oil recovered slowly during the first quarter2020 and early 2021, reaching US$49.86 as of 2019, decreased toDecember 31, 2020 and US$63.23 per barrel.63.54 as of March 31, 2021. Oil is a commodity and its price is subject to wide fluctuations in response to relatively minor changes in supply and demand for oil, market uncertainty, and a variety of additional factors beyond our control. Those factors include, among others: global demand and supply; political developments in producing regions; weather conditions; governmental regulations; international conflicts and acts of terrorism; the price and availability of alternative sources of energy; and overall local and global economic conditions. Moreover, lower oil prices may not only decrease our revenues on a per unit basis, but may also reduce the amount of oil we can produce economically, if any, and, as such, may have a negative impact on the reserves of the fields in which we operate. As result, our financial performance could be materially and adversely affected by declines in oil prices.
Our reserves estimates depend on many assumptions that may turn out to be inaccurate and are not subject to review by independent reserve auditors
The process of estimating oil and gas reserves is complex, although the fields where we produce oil and gas are mature (Block I has been in production for over 100 years, Block III for approximately 100 years, Block IV for approximately 95 years and Block V for over 50 years). In order to prepare our reserves estimates presented in this annual report, we must project production rates and timing of development expenditures as well as analyze available geological, geophysical, production and engineering data, and the extent, quality and reliability of this data can vary. The process also requires economic assumptions about matters such as oil prices, drilling and operating expenses, capital expenditures, taxes, and availability of funds. Therefore, estimates of reserves are inherently imprecise. Moreover, our reserve estimates included in this annual report have been prepared internally by our team of engineers, and have not been audited or reviewed by independent engineers. Future real production, oil and gas prices, revenues, taxes, development expenditures, operating expenses and quantities of recoverable reserves will most likely vary from the estimates presented in this annual report, and those variances may be material. Any significant variance could materially affect the estimated reserves of the fields in which we operate.
Our service contracts with Perupetro for Block I and Block V are currently set to expire in December 2021 and October 2023, respectively, which may adversely affect our financial performance
We operate and extract oil and natural gas from Block I under a 20-year hydrocarbon extraction service contract with Perupetro S.A., which was extended for an additional 10-year term and expires in December 2021. Average daily production during 2019 was 647 barrels of crude oil. We operate 219 wells using various oil extraction systems and operate a network of production batteries and pipelines to collect, measure and deliver oil in fiscalization point close to the Talara refinery. Perupetro has announced that they will hold a tender for the operation of Block I during the second quarter of 2021, and we have initiated contact with Perupetro to participate in the public bid to maintain this block under operation. In addition, we operate and extract oil and natural gas from Block V under a 20-year hydrocarbon extraction service contract with Perupetro, which was extended for an additional 10-year term and expires in October 2023. Average daily production during 2020 in this field was 94 barrels of crude oil. We operate 34 wells in this field using various oil extraction systems. We cannot assure you that we will maintain these operations after the expiration of the contracts, on similar terms or at all.
Our return on our investment in our concessions may not meet estimated returns
Our return on any investment in a concession is based on the terms and conditions of the concession, its duration and the amount of capital invested as well as the amount of revenues collected, debt service costs, payment of penalties and other factors. For example, traffic volume at toll roads may be affected by a number of factors beyond our control, including security conditions; general economic conditions; demographic changes; fuel prices; reduction in commercial or industrial activities in the regions served by the roads; changes in laws regarding toll payments, including related to the effects of the COVID-19 pandemic; and natural disasters. Decreased traffic at Norvial could adversely affect our financial performance. Although some of our concessions allow for adjustments based on economic conditions, certain concessions provide that adjustment requests be approved only if certain limited events specified in our concession contracts have occurred. If a request of adjustment is not granted, our financial performance could be affected. Given these factors and the possibility that governmental authorities could implement policies that affect our contractual return on investment in a way that we did not anticipate, we cannot assure you that our return on any investment under any concession will meet our estimates.
Governmental entities may terminate prematurely our concessions and similar contracts under various circumstances, some of which are beyond our control
Our ability to continue operating our concessions and similar public-sector contracts depends on governmental authorities, which may terminate the concession or contract pursuant to the provisions set forth therein or in accordance with applicable legislation, including the failure to comply with any contractual terms (including the concessionaire’s default on debt) or applicable law.law, including after giving effect to changes in laws (including
any changes related to the effects of the COVID-19 pandemic). Moreover, the relevant governmental authority may terminate and/or repossess a concession at any time, if, in accordance with applicable law, the governmental authority determines that it is in the public interest to do so. The relevant governmental authority may also assume the operation of a concession in certain emergency situations, such as war, public disturbance or threat to national security. In addition, in the case offorce majeure,, the relevant governmental authority may require us to implement certain changes to our operations. If the government terminates any of our concessions, under Peruvian law, it is generally required to compensate us for the amount of our unrecovered investment, unless the concession is revoked pursuant to applicable law or the terms of the concession which would imply a serious breach of the concession’s terms by us. Such compensation process is likely to be time consuming and the amount paid to us may not fully compensate us. We cannot assure you that we would receive such compensation on a timely basis or in an amount equivalent to the value of our investment in a concession plus lost profits.
We are exposed to risks related to the operation and maintenance of our concessions and similar contracts
The operation and maintenance requirements under our concessions could encounter delays or cause us to exceed our budgeted costs for such projects, which could limit our ability to realize the expected return on these projects, increase our operating or capital expenses and adversely affect our business and financial performance. In addition, our operations may be adversely affected by interruptions or failures in the technology and infrastructure systems that we use to support our operations, including toll road collection and traffic measurement systems. The Lima Metro in particular may be susceptible to outages due to power loss, telecommunications failures and similar events. The failure of any of our technology systems may cause disruptions in our operations, adversely affecting our profitability. While we have business continuity plans in place to reduce the adverse impact of information technology system failures on our operations, we cannot assure you that these plans will be effective. Furthermore, accidents and natural disasters may also disrupt the construction, operation or maintenance of our projects and concessions, which could adversely affect our business and financial performance.
We may not be successful in obtaining new concessions
The market for infrastructure concessions in Peru is competitive. We compete with Peruvian and foreign companies for infrastructure concessions in Peru, some of whom may have greater financial and other resources or particular expertise pertinent to a specific concession. Additionally, our public-sector clients may face budget deficits that may prohibit the development of infrastructure concessions, which could affect our business. We may also not be able to obtain additional concessions if the government decides not to award new concessions, due to budget constraints or policy changes or because alternative financing mechanisms are used. Recently, the awarding of concessions and the use of public-private associations in Peru have stalled, due in part to concerns related to the corruption scandal surrounding Odebrecht and its potential effect on government officials in the country. In addition, we may be temporarily unable to bid for or participate in new government concessions due to the outcome of the corruption investigations and civil and criminal proceedings facing the company in Peru, or any final settlement and cooperation agreement that we execute with the Peruvian government. Our inability to bid for or obtain new concessions may adversely affect our business and financial performance.
Our contract with Petroperú S.A. (“Petroperú”) for fuel storage at the South terminal is currently scheduled to expire in August 2019. Moreover, cannot assure you whether or when we will undertake any of the projects that have been awarded to us but for which contract negotiations are ongoing or stalled, in particular the concessions for Via Expresa Sur, with respect to which we recently received a letter from the Municipality of Lima in which the Municipality communicated its desire to cease discussions to relaunch the project.
Additional Risks Related to our Real Estate Business
We are exposed to risks associated with the development of real estate
Our real estate business is subject to the risks that generally affect the real estate industry, such as availability and prices of suitable land, environmental and zoning regulations, interruptions in supply and volatility of the prices of construction materials and equipment, and changes in the demand for real estate. Our real estate business is specifically affected by the following risks: macroeconomic conditions in Peru that may impact the growth of the real estate sector as a whole, particularly in the residential market, including an increase in unemployment or a decrease in wage levels; an increase in prevailing interest rates or lack of available credit; changes in government subsidies for affordable housing; unfavorable real estate market conditions, such as an oversupply of residential units or scarcity of suitable land in particular areas; the level of customer interest in our new projects or the sales price per unit necessary to sell the unit may be lower than expected; customer perception of the security, convenience and attractiveness of our projects and the areas in which they are located; cost overruns, many of which may be beyond our control, that exceed our estimates and affect our profit margins, including the
price of labor, land, insurance, taxes and public charges; the construction and sale of units may not be completed on schedule; bankruptcy or significant financial difficulties of large industry players, which cause a loss of confidence in the industry; limitations when contracting with government entities; and restrictions on real estate development imposed by local, regional and national authorities which often render restrictive or higher bureaucratic laws and regulations. Recently, real estate sales have slowed significantly due to the COVID-19 pandemic. For example, governmental measures aimed at containing the spread of COVID-19 have imposed restrictions on the delivery of housing units to clients, which safety protocols have reduced productivity and delayed construction. To a lesser extent, the real estate business has also been negative impacted by modifications by the government to a program (Bono de Buen Pagador) that encourages social interest housing sales as well asand access to credit. The occurrence or continuation of anyAny of the above events may have a material adverse effect on our business and financial performance.
Real estate prices may not continue to rise and may decline
Real estate prices in Peru have risen significantly over the last decade. Wedecade, supported by a higher demand for housing and a better economic situation in the country. Although due to a shortage of housing, real estate prices are expected to continue to rise in the coming years, they are not expected to grow at the same rate, and we cannot assure you that this increase inthey will rise at all. In particular, real estate prices does not represent a bubble. Real estate prices in Peru may not continuedecline due to rise or may decline significantly, particularly if financing costs rise or consumer confidence in the real estate market erodes.ongoing COVID-19 pandemic and government measures to contain the spread of the virus. If real estate prices decline significantly, our business and financial performance could be materially and adversely affected.
Our business may be adversely affected if we are not able to obtain the necessary licenses and/or authorizations for our developments in due time
Real estate development requires obtaining certain licenses, authorizations and registrations. In Peru, municipal authorities are responsible for issuing most of the licenses that are required during the development stage, including zoning, demolition, construction and conformity (conformidad de obra) licenses, among others. Currently,As of March 31, 2021, we have approximately 2212 real estate projects in various stages of development. For some of these projects, we have not yet initiated administrative proceedings with the appropriate authorities, or such proceedings are pending approval. A denial or an extended delay in issuing licenses, authorizations or registrations, or an extended delay by municipal authorities in approving licensing procedures, may render land unsuitable for development, delay the completion of planned projects, increase our costs or otherwise negatively impact the pricing of projects and adversely affect our business and financial performance.
The current political situation in Peru, and the economic uncertainty that may result, could adversely affect the ability or willingness of prospective buyers to purchase real estate properties. The scarcity of financing, an increase in interest rates or an increase in the security required by financial institutions as collateral may adversely affect the ability or willingness of prospective buyers to purchase our real estate properties. In most cases, the purchasers of our residential or commercial properties finance at least part of the purchase price with mortgage loans. In 2016, 2017On the other hand, in 2018, 2019 and 2018,2020, approximately 95%92%, 88%93% and 92%,91% respectively, of our residential units were sold to purchasers who received government subsidies to finance the purchase of homes. An increase in interest rates, whether as a result of market conditions or government action, or otherwise, may cause a decrease in the demand for our residential and commercial properties and for land development. An increase in interest rates could also increase our own financing costs, which may, in turn, increase the sale price of our projects and adversely affect our business and financial performance.
We may experience difficulties in finding desirable land and increases in the price of land may increase our cost of sales and decrease our earnings
The continued growth of our real estate business depends in large part on our ability to continue to acquire land at a reasonable cost.cost, free of liens and encumbrances and in locations suitable for development. As more developers enter or expand their operations in the Peruvian real estate sector, land prices could rise significantly and suitable land could become scarce or overpriced due to increased demand or decreased supply. A resulting rise in land prices may increase our cost of sales and decrease our earnings. We may not be able to acquire suitable land at reasonable prices in the future, which may have a negative impact on our financial performance.
Changing market conditions may adversely affect our ability to sell home inventories in our land and at expected prices
There is a lag between the time we acquire land and the time that we can bring the developed properties to market. Lag time varies by sector and on aproject-by-project basis. As a result, we face the risk that demand for real estate may decline or that other developments may occur during this period that affect market conditions, and that we will not be able to dispose of developed properties or undeveloped land at expected prices or profit margins or within anticipated time frames or at all. Significant expenditures associated with investments in real estate, such as maintenance costs, architectural fees inhigh-end projects, construction costs and debt payments, cannot generally be reduced if changes in market conditions cause a decrease in expected revenues from our properties. Moreover, the market value of home inventories and undeveloped land can fluctuate significantly because of changing market conditions. As a result of these and other factors beyond our control, we may be forced to sell properties or land at a loss or for prices that generate lower profit margins than we anticipate.
Determinations by INDECOPI may adversely affect our ability to enforce binding contracts
In resolving consumer protection complaints in the real estate and insurance sectors,sector, INDECOPI has made determinations against real estate developers resulting in the modification of contractual provisions applicable to purchasers. Some purchasers of real estate properties have taken advantage of these INDECOPI determinations and filed complaints against developers before INDECOPI and/or made public claims through the media seeking to obtain compensation for alleged deficiencies in housing construction as well as the modification of the terms of their contracts, which may have a negative impact on our real estate business. Although we have a small number of such complaints in INDECOPI, an increase in consumer complaints and consumer protective measures, particularly those resulting in the modification of contractual terms, may affect our ability to enforce our contracts under their original terms if we are not able to counter such claims, which in turn may have a negative impact on our real estate business.
Risks Related to Peru
Economic, social and political developments in Peru could adversely affect our business and financial performance
The substantial majority of our operations are conducted in Peru and depend on economic and political developments in the country. As a result, our business may be materially and adversely affected by economic downturns, currency depreciation, inflation, interest rate fluctuation, government policies, regulation, taxation, social instability, political unrest, drug trafficking, terrorism and other developments in or affecting the country, over which we have no control. In the past, Peru has experienced periods of severe economic recession, large currency devaluation and high inflation. We cannot assure you that Peru will not experience similar adverse economic developments in the future. In addition, Peru has experienced periods of political instability that has included a succession of regimes with differing economic policies and programs. Previous governments have imposed controls on prices, exchange rates, local and foreign investments and international trade, restricted the ability of companies to dismiss employees, expropriated private-sector assets and prohibited the remittance of profits to foreign investors. We cannot assure you that the Peruvian government will continue to pursue open-market policies that stimulate economic growth and social stability.
Moreover, investigations against former or current government officials relating to bribery payments made by Odebrecht have, and may continue to, result in political uncertainty in Peru. OnIn March 22, 2018, President Pedro Pablo Kuczynski presented his resignation, due to allegations of corruption for vote-buying in connection with the impeachment proceeding against him. On March 23, 2018, the Congress accepted his resignationhim, and his first vice president, Martín Vizcarra, was sworn in as acting president. We cannot assure you whether President Vizcarra will remain in office forIn September 2019, the remainderexecutive branch, invoking article 134 of the constitution, dissolved congress and called for new legislative elections which were held in January 2020. Following these elections, the Peruvian executive and legislative branches have been at odds over several important economic and social measures, including initiatives to address the economic and social impact of the COVID-19 pandemic on Peru. In November 2020, Congress impeached and removed from power Mr. Vizcarra and appointed Manuel Merino as President, who in turn resigned five days after his appointment as was replaced by Francisco Sagasti. The term of the new legislature will end on the same date as the current presidential term which ends in July 2021. If President Vizcarra and the current second vice president both resign, the president of the Congress would become acting president and the Congress would call for new elections.
Criminal investigations have been initiated against former presidents Alejandro Toledo, Ollanta Humala, Alan García, and Pedro Pablo Kuczynski.Kuczynski and Martín Vizcarra. On April
17, 2019, former President Alan García committed suicide as prosecutors were preparing to detain him over matters relating to criminal investigations.
Several corruption scandals regarding authorities at municipal, regional and national ministry-levelsgovernment levels are also ongoing, and former and current government officials have been detained. These corruption investigations have resulted in lower investments in large projects.
In addition, the first round of presidential and legislative elections took place on April 11, 2021. Two candidates for president, Mr. Jose Pedro Castillo Terrones and Mrs. Keiko Sofia Fujimori Higuchi, obtained the highest number of votes but no outright majority, giving place to a presidential run-off scheduled on June 6, 2021. We cannot be certain whether the government to be elected in June 2021 will continue to pursue business-friendly and open-market economic policies that stimulate economic growth and stability. The new president will face challenges in aligning initiatives with, and obtaining support from, Congress, in which no political party has achieved clear majority and which will be highly fragmented.
Uncertainty derived from the potential outcome of this electoral process may cause clients to postpone investment decisions or may disrupt Peruvian markets by increasing volatility in commodity prices or interest or exchange rates which, in turn, could have a significant negative effect on our business. The political instability caused by these events could affect macroeconomic conditions in the country, including currency volatility, as well as have a negative effect on our business.
Fluctuations in the value of the sol could adversely affect financial performance
Fluctuations in the value of the sol relative to the U.S. dollar could adversely affect Peru’s economy. In addition, fluctuations in the value of the sol to the U.S. dollar can materially adversely affect our results of operations.
In 2018, 32.5% and 55.6% of our revenues were denominated in soles and U.S. dollars, respectively, whereas 63.0% and 23.1% of our costs of sales were denominated in soles and U.S. dollars, respectively. In 2019, 54% and 35% of our revenues were denominated in soles and U.S. dollars, respectively, whereas 64% and 21% of our costs of sales were denominated in soles and U.S. dollars, respectively. In 2020, 31.4% and 51.4% of our revenues were denominated in soles and U.S. dollars, respectively, whereas 49.2% and 31.5% of our costs of sales were denominated in soles and U.S. dollars, respectively. In the past the exchange rate between the sol and the U.S. dollar has fluctuated significantly. We cannot assure you that the value of sol against other currencies will not fluctuate significantly in the future, which could adversely affect the Peruvian economy and our business, financial condition and results of operations.
In addition, although Peruvian law currently imposes no restrictions on the ability to convert soles to foreign currency, and transfer foreign currency outside of the country, in the 1980s, and early 1990s, Peru imposed exchange controls, including controls affecting the remittance of dividends to foreign investors. We cannot assure you that exchange controls in Peru will not be implemented in the future. The imposition of exchange controls could have an adverse effect on the economy and on your ability to receive dividends from us as a holder of ADSs.
Inflation could adversely affect our financial performance
In the past, Peru has suffered through periods of hyperinflation, which have materially undermined the Peruvian economy and the government’s ability to create conditions that support economic growth. A return to a high inflation environment would also undermine Peru’s foreign competitiveness, with negative effects on the level of economic activity and employment.
As a result of reforms initiated in the 1990s, Peruvian inflation decreased significantly from four-digit inflation during the 1980s. The Peruvian economy experienced annual inflation of 3.2% in 2014, 4.4% in 2015, 3.2%3.3% in 2016, 1.4%1.5% in 2017, and 4.8%2.5% in 2018, 1.9% in 2019 and 2.2% in 2020, as measured by the Peruvian Consumer Price Index (Í(Índice de Precios al Consumidor del Perú).
If Peru experiences substantial inflation in the future, our costs of sales and administrative expenses could increase which could affect our operating margins. Inflationary pressures may lead to governmental intervention in the economy, including the introduction of government policies that may adversely affect the overall performance of the Peruvian economy. For example, in response to increased inflation, the Peruvian Central Bank, which sets the Peruvian basic interest rate, may increase or decrease the basic interest rate in an attempt to control inflation or foster economic growth.
Changes in tax laws may increase our tax burden and, as a result, negatively affect our financial performance
The Peruvian Congress and government regularly implement changes to tax laws that may increase our tax burden. These changes may include modifications in our tax rates and, on occasions, the enactment of temporary taxes that in some cases have become permanent taxes. Tax reforms related to the Peruvian income tax, value added tax and tax code have recently been approved, but we are unable to estimate the impacts that these reforms may have on our business. The effects of any tax reforms that could be proposed in the future and any other changes that result from the enactment of additional reforms have not been, and cannot be, quantified. However, any changes to our tax regime may result in increases in our overall costs and/or our overall compliance costs, which could negatively affect our financial performance.
Earthquakes, severe weather and other natural disasters could adversely affect our business and financial performance
Peru is located in an area that experiences seismic activity and occasionally is affected by earthquakes. For example, in 2007, an earthquake with a magnitude of 7.9 on the Richter scale struck the central coast of Peru, severally damaging the region south of Lima. Such conditions may result in physical damage to our properties and equipment, closure of one or more of our project sites and infrastructure concessions, inadequate work forces in our markets and temporary disruptions in the supply of construction materials. In addition, Peru has also experienced adverse climate conditions (due to climate change or otherwise) and adverse weather patterns, such as El Niño, an oceanic and atmospheric phenomenon that causes a warming of temperatures in the Pacific Ocean, resulting in heavy rains off the coast of Peru and potentially flooding.flooding in certain areas of Peru, on the one hand, and simultaneous draughts in the Andean region of the country, on the other hand. Poor weather conditions can have significant adverse effects on our engineering and construction activities as well as on our operation and maintenance of infrastructure assets business. Any of these factors may materially adversely affect the Peruvian economy and our business and financial performance.
A resurgence of terrorism in Peru could adversely affect the Peruvian economy and, as a result, our business and results of operations
In the past, Peru experienced severe terrorist activity that reached its peak of violence against the government and private sector in the late 1980s and early 1990s. In themid-1990s, terrorist groups suffered significant defeats, including the arrest of leaders, resulting in considerable limitations in their activities. Despite the suppression of terrorist activity, we cannot assure you that a resurgence of terrorism in Peru, or other organized criminal activity, including drug trafficking, will not occur, or if there is such a resurgence, it will not disrupt the economy of Peru and our business.
The Peruvian economy could be affected by adverse economic developments in regional or global markets
Financial and securities markets in Peru are influenced, to varying degrees, by economic and market conditions in regional or global markets. Although economic conditions vary from country to country, investors’ perceptions of events occurring in one country may adversely affect cash flows and securities from issuers in other countries, including Peru. For example, the Peruvian economy was adversely affected by the political and economic events that occurred in several emerging economies in the 1990s, including in Mexico in 1994, the Asian crisis in 1997, the economic crisis in Russia in 1998, the Brazilian currency devaluation in 1999 and the Argentine crisis in 2001, which affected the market value of securities issued by companies from markets throughout Latin America. In addition, Peru’s economy continues to be affected by events in the economies of its major regional partners and in developed economies that are trading partners or that affect the global economy. The 2008-2009 global economic recession, principally driven by the subprime mortgage market in the United States, substantially affected the international financial system, including Peru’s securities market and economy. More recently, global economic conditions, including slower growth in China, low global commodity prices, in particular oil and gas prices, and the appreciation of the U.S. dollar against foreign currencies generated economic uncertainty which may reduce the confidence of foreign investors, causing volatility in the securities markets and affecting the ability of companies to obtain financing globally. The United Kingdom voted to exit the European Union on June 23, 2016. As of the date hereof, the actions to be taken by the United Kingdom to effectively exit the European Union and the duration of this process are uncertain. The results of the referendum in the United Kingdom have caused, and are expected to continue to cause, volatility in financial markets, which in turn could have substantial adverse effects on our business, financial condition and results of operations. On November 8, 2016, Mr. Donald J. Trump was elected president of the United States. President Trump has implemented restrictions on free trade and limitations on immigration. Changes in social, political, regulatory and economic conditions in the United Stateslarge economies or in laws and policies governing foreign trade or affecting global financing conditions could create uncertainty in the international markets and could have a negative impact on emerging market economies, including the Peruvian economy, which in turn could have a negative impact on our operations. Since mid-March of 2020, the ongoing COVID-19 pandemic has disrupted economic activity and caused a global recession. The worsening of current global conditions or a new economic or financial crisis could affect Peru’s economy and, consequently, materially adversely affect our business and financial performance.
Risks Related to Chile, Colombia and other Latin American Countries
We face risks related to our operations outside of Peru
Latin American economic, political and social conditions may adversely affect our business. Our financial performance may be significantly affected not only by general economic, political and social conditions in Peru but also in other markets where we operate or intend to operate, including Chile and Colombia. During 2016, 20172018, 2019, and 2018,2020, approximately 26.5%14.2%, 28.0%15.4% and 14.2%20.1%, respectively, of our revenues on a consolidated basis derived from operations outside of Peru.
These countries have suffered significant economic, political and social crises in the past, and these events may occur again in the future. We cannot predict whether changes in current administrations will result in changes in governmental policy and whether such changes will affect our business. Instability in the region has been caused by many different factors, including: significant governmental influence over local economies; substantial fluctuations in economic growth; high levels of inflation; changes in currency values; exchange controls or restrictions on expatriation of earnings; high domestic interest rates; wage and price controls; changes in governmental economic or tax policies, including retroactive changes; imposition of trade barriers, including import duties on information technology equipment; electricity rationing; liquidity of domestic capital and lending markets; unexpected changes in regulation; expropriations; and high levels of organized crime, terrorism and social conflicts, as well as overall political, social and economic instability. Moreover, macroeconomic conditions in these countries are highly influenced by global commodity prices, including the price of copper for Chile and the price of oil and gas for Colombia.
In addition, beginning in October 2019, Chile has suffered from widespread social unrest and vandalism that has had a significant economic and political impact on the country. The protests began over the government’s announcement of an increase in subway fares in Santiago and quickly grew into broader unrest over economic inequality, including claims about transportation costs, funding for education, health care costs, and pension amounts, among others. The Chilean government imposed a state of emergency and nighttime curfews in Santiago and other cities; however, protests and violence continued. The Chilean government took a series of social and economic measures to tackle the issues at the heart of the unrest and the Chilean congress convened a plebiscite initially to be held in March 2020, which was rescheduled to October 25, 2020 as a result of the COVID-19 pandemic, to determine whether constitutional amendments should be implemented. By democratic majority, the Chilean constituents to the plebiscite voted to amend the Chilean Constitution. The new Chilean Constitution will be drafted by a political body whose members are expected to be elected in May 2021 and will then be submitted to a new plebiscite. This process may result in further social unrest and protest and could also result in substantial structural changes in Chile that could adversely impact the private sector, including our operations in the country.
Additionally, beginning in November 2019 and more recently in 2021 to date, Colombia has experienced civic unrest, including a national strike and anti-government protests. Demonstrators in the country, protesting for several reasons, including opposing certain economic and political reforms proposed by the administration of President Duque (including those intended to address the negative effects on the Colombian economy caused by the COVID-19 pandemic), public corruption, and the implementation of the peace agreement between Colombia and the guerrilla Fuerzas Armadas Revolucionarias de Colombia (FARC). In addition, protestors have demanded reforms related to pensions, access to education, environmental protection and inequality, among others. We cannot predict the policies that will be adopted by the Colombian government and whether those policies would have a negative impact on the Colombian economy or our business and financial performance. Our Colombian operations could be adversely impacted by rapidly changing economic, political and social conditions in Colombia and by the Colombian government’s response to such conditions. Additionally, any changes in the government administration, changing regulations or policies relating to the construction and infrastructure sectors, or shifts in political attitudes in Colombia could adversely affect our business.
Risks Related to our ADSs
We have identified a material weaknessesweakness in our internal control over financial reporting, and if we cannot maintain effective internal controls or provide reliable financial and other information in the future, investors may lose confidence in the reliability of our consolidated financial statements, which could result in a decrease in the value of our ADSs
Based on the assessment of our internal control over financial reporting as of December 31, 2018,2020, as required by Section 404 of the U.S. Sarbanes Oxley Act of 2002 (“SOX”), management has concluded that, as of
such date, our internal control over financial reporting was not effective at the reasonable assurance level due to control deficiencies that constituted a material weaknesses. Theseweakness. The material weaknesses consisted of:
of deficiencies in the operational effectiveness of controls over SOX compliance including those related to determiningto: (1) the subsidiaries to be included in the scopelack of SOX testing, the review and formal approval of risk and control matrices, the updating and approval of narratives and flowcharts, as well as the monitoring of detected control failures and thea procedure or implementation of our internal control system over financing reporting;
deficiency in formally having an established and documented processcontrols for enterprise and fraud risk management, including the implementation of a risk management system that includes a methodology, a process of identification, evaluation and quantificationassurance of the risks, a continuous improvement planintegrity and a monitoringcorrectness of key reports, and reporting process;
deficiencies in(2) the design and operational effectivenessabsence of self-assessment by controls over segregation of duties to help ensure that personnel with potential conflicts wereowners.
The material weakness described above did not involved in non-compatible activities;
deficiencies in the design and operational effectiveness of the controls established in the accounting closing process with respect to the: (1) preparation and review of the annual and interim consolidated financial statements, (2) review, approval and supporting documentation of certain accounting entries, (3) segregation of duties between preparation and approval of accounting entries, (4) access control to spreadsheets used for manual accounting records in compliance with IFRS disclosures, (5) disclosure of discontinued operations, and (6) complete, accurate and timely provision of information to the accounting department; and
deficiencies in the design and operational effectiveness of controls established in the revenue recognition process with respect to the criteria for, and the documentation supporting, the recognition of revenue and the determination of related provisions, including construction contract revenues and contingent revenues.
Certain of these material weaknesses resultedresult in adjustments to the accounting for revenue and accounts receivable. Additionally, theseour annual consolidated financial statements. However, this material weaknessesweakness could result in other misstatements in our financial results and disclosures, which could result in a material misstatement to our annual or interim consolidated financial statements not being prevented or detected. Because of thesethis material weaknesses,weakness, management concluded that we did not maintain effective internal control over financial reporting as of December 31, 2018,2020, based on criteria in Internal Control-Integrated Framework (2013) issued by the COSO.
For more information, see “Item 15. Controls and Procedures.” A “material weakness” is a deficiency, or combination of deficiencies, in internal controls such that there is a reasonable possibility that a material misstatement in financial statements will not be prevented or detected in a timely basis.
We are in the process of implementing measures to address thesethis material weaknesses.weakness. We may not be able to remediate thesethis identified material weaknesses.weakness. Moreover, we may in the future discover other areas of our internal controls that have material weaknesses or that need improvement, particularly with respect to businesses that we acquire.
Any failure to maintain an effective internal control over financial reporting, or implement required new or improved controls, could harm our operating results or cause us to fail to meet our reporting obligations. If we are unable to conclude that we have effective internal control over financial reporting, or if our independent registered public accounting firm is unable to provide us with an unqualified opinion regarding the effectiveness of our internal control over financial reporting, investors could lose confidence in the reliability of our consolidated financial statements, which could result in a decrease in the value of our ADSs.
The market price of our ADSs may fluctuate significantly, and you could lose all or part of your investment
Volatility in the market price of our ADSs may prevent you from being able to sell your ADSs at or above the price you paid for them. The market price and liquidity of the market for our ADSs may be significantly affected by numerous factors, some of which are beyond our control and may not be directly related to our operating performance. These factors include, among others: actual or anticipated changes in our results of operations, quarterly fluctuations, or failure to meet expectations of financial market analysts and investors; the impact of corruption allegations and investigations; investor perceptions of our prospects or our industries; operating performance of companies comparable to us and increased competition in our industries; new laws or regulations or new interpretations of laws and regulations applicable to our business; general economic trends in Peru; catastrophic events, such as earthquakes and other natural disasters; and developments and perceptions of risks in Peru and in other countries.
Substantial sales of ADSs or common shares could cause the price of our ADSs or common shares to decrease
Significant shareholders hold a large number of our common shares. These securities are eligible for sale. The market price of our ADSs could decline significantly if we or our significant shareholders sell securities in our company or the market perceives that we or our significant shareholders intend to do so.
We may raise additional capital in the future through the issuance of equity securities, which may result in dilution of the interests of our shareholders
We may need to raise additional capital and may opt for obtaining such capital through the public or private placement of common shares, debt securities or debt securities convertible into our common shares. In thesuch event of a public or private debtwe may seek to obtain financing or the financing through the issuance of securities convertible into our common shares, such additional funds may be obtained with the exclusion of the preemptive rights of our shareholders, including the investors in our common shares, which may dilute the percentage interests of investors in our common shares.
On November 2, 2020, the general shareholders’ meeting of the company approved a financial plan that included (i) the issuance by the company of convertible bonds in an amount up to US$90 million and (ii) the issuance of corporate bonds in an amount up to US$350 million. On January 13, 2021, the board of directors of the company approved the terms and conditions for the issuance of the convertible bonds in an amount up to US$90 million, to be placed by private offering, including preemptive subscription rights for existing investors. The convertible bonds will not be registered under the Securities Act or under the securities laws of any state or jurisdiction outside of Peru. The convertible bonds are expected to have the following characteristics: (i) a 1.50% upfront structuring fee, (ii) an 8.0% fixed annual interest rate, (iii) prepayment fees starting at 5.0% at any time between the issuance of the bonds and the sixth month, with an increase of 100% each 6 months, (iv) a conversion price of US$0.33 per share of the company, or 20% of the discount of the 30-day VWAP, as adjusted from time-to-time, and (v) a conversion right buyout fee, which amounts to 4.0% in addition to the prepayment fee. The first and second preemptive subscription rounds ended on February 23 and February 26, 2021, respectively, and US$32.7 million of the convertible bonds were subscribed. Bonds that were not subscribed during the preemptive subscription rounds may be placed to institutional investors through a private placement offering.
As of the date hereof, none of the convertible bonds have been issued, and we cannot guarantee that they will be issued on a timely basis or at all. If the convertible bonds are issued, and converted by bondholders, existing investors in our common shares may be diluted.
No shareholder or group of shareholders holds a majority of our common shares
As of the date of this annual report, our former chairman and members of his family beneficially own 13.48% of our outstanding share capital. No shareholder or group of shareholders currently owns a majority of our common shares. In addition, there is no shareholders’ agreement among any of our significant shareholders. Accordingly, no shareholder or group of shareholders may on its own determine the outcome of substantially all matters submitted for a vote to our shareholders. In addition, a new investor or group of investors may in the future seek to acquire a significant stake in, or control of, our company, subject to compliance with Peruvian tender offer requirements which require that a tender offer be made to all shareholders upon, among other matters, acquisition of 25%, 50% and 60% of our voting rights. If a new investor or group of investors acquires a significant stake in, or control of, our company, we cannot assure you that such investor or group of investors will not seek to change how our business is managed.
Holders of ADSs may be unable to exercise voting rights with respect to our common shares underlying the ADSs at our shareholders’ meetings
As a holder of ADSs representing common shares being held by the depositary in your name, you may exercise voting rights with respect to the common shares represented by the ADSs only in accordance with the deposit agreement relating to the ADSs. Holders of our common shares will receive notice of shareholders’ meetings through publication of a notice 25 days in advance, in accordance with Peruvian law, in the official gazette in Peru, a Peruvian newspaper of general circulation and the website of the Peruvian Securities Commission, and will be able to exercise their voting rights by either attending the meeting in person or voting by proxy. ADS holders will not receive notice directly from us. Instead, pursuant to the deposit agreement, we will notify the depositary, who will mail to holders of ADSs the notice of the meeting and a statement as to the manner in which voting instructions may be given. To exercise their voting rights, ADS holders must instruct the depositary how to exercise the voting rights for the common shares which underlie their ADSs. Due to these additional procedural steps involving the depositary, the process for exercising voting rights may take longer for ADS holders than for holders of our common shares.
Holders of ADSs also may not receive voting materials in time to instruct the depositary to vote the common shares underlying their ADSs. In addition, the depositary and its agents are not responsible for failing to carry out voting instructions of the holders of ADS or for the manner of carrying out such instructions, unless such failure can be attributed to gross negligence, bad faith or willful misconduct on the part of the depositary or its agents. Accordingly, holders of ADSs may not be able to exercise voting rights, and they will have little, if any, recourse if the underlying common shares are not voted as requested.
Our shareholders’ ability to receive cash dividends may be limited
Our shareholders’ ability to receive cash dividends may be limited by the ability of the depositary to convert cash dividends paid in soles into U.S. dollars. Under the terms of our deposit agreement with the depositary for the ADSs, the depositary will convert any cash dividend or other cash distribution we pay on the common shares underlying the ADSs into U.S. dollars, if it can do so on a reasonable basis and can transfer the U.S. dollars to the United States. If this conversion is not possible or if any government approval is needed and cannot be obtained, the deposit agreement allows the depositary to distribute the foreign currency only to those ADRADS holders to whom it is possible to do so. If the exchange rate fluctuates significantly during a time when the depositary cannot convert the foreign currency, you may lose some or all of the value of the dividend distribution.
Holders of ADSs may be unable to exercise preemptive or accretion rights with respect to the common shares underlying their ADSs
Under Peruvian corporate law, if we issue new common shares as part of a capital increase, unless otherwise agreed to by holders of 40% of our subscribed voting common shares and, provided that such capital increase does not favor, directly or indirectly, certain shareholders to the detriment of others, our shareholders will generally have the right to subscribe to a proportional number of common shares of the class held by them to maintain their existing ownership percentage, which is known as preemptive rights. In addition, shareholders are entitled to the right to subscribe for the unsubscribed common shares at the end of a preemptive rights offering, on a pro rata basis, which is known as accretion rights. You may not be able to exercise the preemptive or accretion rights relating to common shares underlying your ADSs unless a registration statement under the Securities Act is effective with respect to those rights or an exemption from the registration requirements of the Securities Act is available. We are not obligated to file a registration statement with respect to the common shares relating to these preemptive and accretion rights, and we cannot assure you that we will file any such registration statement. Unless we file a registration statement or an exemption from registration is available, you may receive only the net proceeds from the sale of your preemptive and accretion rights by the depositary or, if the preemptive and accretion rights cannot be sold, they will be allowed to lapse. As a result, U.S. holders of our ADSs may suffer dilution of their interest in our company upon future capital increases.
We are entitled to amend the deposit agreement and to change the rights of ADS holders under the terms of such agreement without the prior consent of the ADS holders
We are entitled to amend the deposit agreement and to change the rights of the ADS holders under the terms of such agreement without the prior consent of the ADS holders. Any change related to an increase in deposits or charges for book-entry securities services or any modification that might hinder the rights of the ADS holders will be effective within 30 days after the ADS holders have received notice of such change or modification and such holders will have no right to any compensation whatsoever.
Peru has different corporate disclosure and accounting standards than those you may be familiar with in the United States
Financial reporting and securities disclosure requirements in Peru differ in certain significant respects from those required in the United States. There are also material differences among IFRS, Peruvian GAAP and U.S. GAAP. Accordingly, the information about us available to you will not be the same as the information available to holders of shares issued by a U.S. company. In addition, the Peruvian Securities Market Law, which governs open or publicly listed companies, such as us, imposes disclosure requirements that are more limited than those in the U.S. in certain important respects. Although Peruvian law imposes restrictions on insider trading and price manipulation, applicable Peruvian laws are different from those in the United States, and the Peruvian securities markets are not as highly regulated and supervised as the U.S. securities markets.
Our status as a foreign private issuer allows us to follow alternate standards to the corporate governance standards of the New York Stock Exchange, which may limit the protections afforded to investors
We are a foreign private issuer within the meaning of the New York Stock Exchange (“NYSE”) corporate governance standards. Under NYSE rules, a foreign private issuer may elect to comply with the practices of its home country and not to comply with certain corporate governance requirements applicable to U.S. companies with securities listed on the exchange. We currently follow certain Peruvian practices concerning corporate governance and intend to continue to do so. Accordingly, holders of our ADSs will not have the same protections afforded to shareholders of companies that are subject to all NYSE corporate governance requirements.
For example, the NYSE listing standards provide that the board of directors of a U.S. listed company must have a majority of independent directors at the time our company ceases to be a “controlled company.” Under Peruvian corporate governance practices, a Peruvian company is not required to have a majority of independent members on its board of directors. The listing standards for the NYSE also require that U.S. listed companies, at the time they cease to be “controlled companies,” have a nominating/corporate governance committee and a compensation committee (in addition to an audit committee). Each of these committees must consist solely of independent directors and must have a written charter that addresses certain matters specified in the listing standards. Under Peruvian law, a Peruvian company may, but is not required to, form special governance committees, which may be composed partially or entirely ofnon-independent directors. In addition, NYSE rules require the independentnon-executive directors of U.S. listed companies to meet on a regular basis without management being present. There is no similar requirement under Peruvian law.
The NYSE’s listing standards also require U.S. listed companies to adopt and disclose corporate governance guidelines. In July 2002, the Peruvian Securities Commission and a committee comprised of regulatory agencies and associations prepared and published a list of suggestednon-mandatory corporate governance guidelines called the “Principles of Good Governance for Peruvian Companies.” Although we have implemented these measures, we are not legally required to comply with the corporate governance guidelines, only disclose whether or not we are in compliance.
Minority shareholders in Peru are not afforded equivalent protections as minority shareholders in other jurisdictions and investors may face difficulties in commencing judicial and arbitration proceedings against our company or the controlling shareholder
Our company is organized and existing under the laws of Peru. Accordingly, investors may face difficulties in serving process on our company, officers and directors or significant shareholders in the United States of certain other jurisdictions, and in enforcing decisions granted by courts located in other jurisdictions against our company, our officers and directors or significant shareholders that are based on securities laws of jurisdictions other than Peru.
In Peru, there are no proceedings to file class action suits or shareholder derivative actions with respect to issues arising between minority shareholders and an issuer, its controlling shareholders or directors and officers. Furthermore, the procedural requirements to file actions by shareholders differ from those of other jurisdictions, such as in the United States. As a result, it may be more difficult for our minority shareholders to enforce their rights against us, our directors, officers or significant shareholders as compared to the shareholders of a U.S. company. The deposit agreement provides that the depositary has no obligation to commence or become involved in any judicial proceedings and any other legal actions relating to the ADSs or the deposit agreement, either on behalf of the ADS holders or on behalf of any other person.
Judgments of Peruvian courts with respect to our common shares will be payable only in soles
If proceedings are brought in the courts of Peru seeking to enforce our obligations in respect of the common shares, we will not be required to discharge our obligations in a currency other than soles. Under Peruvian exchange control limitations, an obligation in Peru to pay amounts denominated in a currency other than soles may be satisfied in Peruvian currency only at the exchange rate, as determined by the Peruvian Central Bank, in effect on the date the judgment is obtained, and such amounts are then adjusted to reflect exchange rate variations through the effective payment date. The then prevailing exchange rate may not affordnon-Peruvian investors with full compensation for any claim arising out of or related to our obligations under the ADSs.
If securities or industry analysts publish unfavorable research about our business or if they cease to follow our business, the price and trading volume of the ADSs could decline
The trading market for the ADSs will depend, in part, on the research and reports that securities or industry analysts publish about us or our business. If one or more of the analysts who covers us downgrades the ADSs or publishes unfavorable research about our business, the price of the ADSs would likely decline. If one or more of these analysts ceases coverage of our company or fails to publish reports on us regularly, demand for the ADSs could decrease, which could cause the price and trading volume of the ADSs to decline.
ITEM 4. INFORMATION ON THE COMPANY
ITEM 4. | INFORMATION ON THE COMPANY
|
| A. | History and Development of the Company |
AENZA is a Peruvian company that specializes in engineering and construction services, infrastructure and energy concessions and real estate management. The company was formerly known as Graña y Montero has been operatingS.A.A.
The company’s purpose is to transform realities and living conditions by promoting sustainable and responsible development and facilitating citizen well-being. AENZA provides engineering solutions and services that enhance industries, develop cities and build countries. The company seeks to give life to the means, spaces and resources that facilitate urban life.
AENZA aspires to be recognized as an industry benchmark in Peru sinceLatin America, leveraged on three axes:
the distinctive contribution we make to the economic, social and environmental well-being of the region and its societies through development;
our status as a preferred partner of our clients because of the trust we inspire in them, the sustainability and innovation of our solutions and the commitment and talent of our people; and
an outstanding business management, framed by our renewed commitment to ethics, integrity and transparency.
The history of the company dates back to 1933, and it isthe company has been listed on the Lima Stock Exchange since 1997. Set forth below are key highlights in our company’s history:1997:
Graña y MonteroThe company traces its origins to its original predecessor, company GRAMONVEL, which was founded 85more than 88 years ago by, and named after, engineers Alejandro Graña Garland, Carlos Montero Bernales and Carlos Graña Elizalde. We began primarily as a construction company.ago.
We expanded our operations internationally in 1943 with our contract to build a Nestle factory in Venezuela.
In 1948, we began one of our largest projects since our founding—the construction of the city of Talara for the International Petroleum Company, which was completed in 1957.
In 1949, GRAMONVEL merged with Morris y Montero to form Graña y Montero Contratistas Generales S.A. (now GyM S.A.,Cumbra, our engineering and construction subsidiary), expanding its service offerings and increasing its capacity to undertake large-scale infrastructure projects.
In 1983, we began a diversification strategy by developing complementary lines of business. In 1984, we founded GMP,UNNA Energía, our oil and gas subsidiary. In 1985, we partnered with Sonda S.A. (a Chilean IT services company) to form GMD S.A. (“GMD”), our IT services subsidiary. Beginning in 1987, we founded our real estate development business, which currently operates under Viva, GyM.which was incorporated in 2008.
In 1996, we reorganized our subsidiaries and founded Graña y Montero S.A.A., which became the principal shareholder of all our subsidiaries. In 1997, we listed our company on the Lima Stock Exchange.
In 1998, our company built Larcomar, a landmark shopping center in Lima that has become a popular tourist destination, which we sold in 2010.
In 2003, 2006 and 2007, we were awarded the concessions for the construction, operation and maintenance of the Norvial, Canchaque and Survial toll roads, respectively.
In 2007, we also developed the first large-scale affordable housing project in Lima, consisting of 3,400 apartment units and located in the district of El Agustino.
In 2011, we acquired 75.0% of CAM, a leading company in the electricity sector based in Chile, and formerly part of the Latin American power generation and distribution company Enersis. In December 2018, our company sold its position in CAM to GDF Suez Energie Services Chile Holding SpA and ENGIE Services Perú S.A.
In 2012, we began operating the Lima Metro.
In July 2013, we listed our company on the NYSE.
In 2012 and 2013, we acquired 74.0% and 6.4%, respectively, of Ingeniería y Construcción Vial y Vives S.A. (“Vial y Vives”), an engineering and construction company specializing in the Chilean mining sector. In August 2013, we acquired 86.0% of DSD Construcciones y Montajes S.A. (“DSD Construcciones y Montajes”), a Chilean engineering and construction company specialized in providing services to the energy, oil and gas, cellulose and mining sectors in Chile and Latin America. In July 2014, our subsidiary Vial y Vives merged with DSD Construcciones y Montajes to form Vial yVives-DSD S.A. (“Vial yVives-DSD”), through our subsidiary GyM Chile SpA, we hold an 86.2% interest in Vial yVives-DSD. As of the date of this annual report, we hold a 94.5% interest in Vial yVives-DSD.
In September 2014, our subsidiary Norvial established its first bond program for a maximum amount of S/.380 million or its equivalent in U.S. dollars. Norvial undertook its first and second issuances under this program for amounts of S/.80 million and S/.285 million, respectively, in July 2015.
In December 2014, our subsidiary GyM S.A.Cumbra acquired 70% of the share capital of Morelco, S.A.S. (“Morelco”), a Colombian engineering and construction company specialized in the oil and gas and other energy sectors.
In April 2015, GMPUNNA Energía started operations of its hydrocarbon extraction services in Blocks III and IV for Perupetro, in the provinces of Talara and Paita in northern Peru.
In 2020, Lima Airport Partners awarded our company, as a member of the Inki Punku Consortium, with a contract for the construction of the second runway of the Jorge Chávez International Airport.
In 2020, Cumbra signed with Gases del Norte del Perú SAC (a subsidiary of PROMIGAS SA ESP), a contract for the engineering, procurement and construction of the Piura gas pipeline that will distribute gas in the provinces of Paita, Piura, Sechura, Sullana and Talara of Peru.
On November 2, 2020, the annual shareholders’ meeting of the Company approved the change of the Company’s name from Graña y Montero S.A.A. was incorporated in 1996to AENZA S.A.A. Effective November 12, 2020, our common shares and ADSs were tradeable on the Lima Stock Exchange and the NYSE, under the ticker symbols “AENZ” and “AENZAC1”, respectively. We have also re-named certain of our subsidiaries.
AENZA is a publicly-held corporation (sociedad anónima abierta) organized under the laws of Peru. Our principal executive office is located at Avenida Paseo de la República 4667, Lima 34, Peru, and our main telephone number is+511-213-6565. Our website address iswww.granaymontero.com.pe.www.aenza.com.pe. Information contained on, or accessible through, our website is not incorporated in this annual report, and you should not consider any such information part of this annual report. The SEC maintains a website (http://www.sec.gov) that contains reports, proxy and information statements, and other information regarding issuers that file electronically with the SEC.
For information on our organizational structure, see “Item 4.C. Information on the Company – Organizational Structure.”
For information on our capital expenditures and divestitures, see “Item 5.B. Operating and Financial Review and Prospects— Liquidity and Capital Resources—Capital Expenditures.”
For information on the availability of filings we make electronically with the SEC, see “Item 10H. Additional Information—Documents on Display.”
Overview
We are the largest engineering and construction company in Peru as measured by revenues during 2018,2020, and one of the largest publicly-traded engineering and construction companycompanies in Latin America as measured by market capitalization as of December 31, 2018,2020, with strong complementary businesses in infrastructure and real estate.
With more than 85 years of operations, we have a long track record of successfully completing the engineering and construction of many of Peru’s landmark private- and public-sector infrastructure projects, such as the Lima International Airport and the Peru LNGliquid natural gas liquefaction plant, and we believe we have a track record of operational excellence in our markets. We have developed a highly-experienced management team, a talented pool of more than 2,1002,000 engineers and a skilled work force that share our core corporate values of quality, professionalism, reliability and efficiency. As a company listed on the Lima Stock Exchange since 1997 and the NYSE since 2013, we also abide byendeavor to meet the highest corporate governance standards in Peru.
Beginning in themid-1980s, we leveraged our engineering and construction expertise into complementary lines of business, such as the development, ownership, operation and maintenance of infrastructure assets (including the Lima Metro, Peru’s only urban railway system), as well as real estate development, and the provision of technical services primarily to infrastructure-related assets.development. We believe our business mix creates significant opportunities across our lines of business, generates more stable revenues and earnings on a consolidated basis, and provides additional financial stability to our company.
As a result of our performance in Peru, we have been requested by clients to undertake the engineering and construction of large and complex projects outside our home market, such as the Pueblo Viejo gold mine for Barrick Gold in the Dominican Republic. Through the successful execution of those projects, we have developed operational experience in other Latin American countries. We have further expanded our activities in other key markets of the region through the acquisition of businesses with solid positions in those markets. In February 2011, we acquired a controlling interest in Compañía Americana de Multiservicios (CAM), which is headquartered in Chile and provides technical services to power utility companies in Chile, Peru and Colombia. In October 2012, we acquired a controlling interest in Vial y Vives, an engineering and construction company specializing in the Chilean mining sector, and in August 2013, we acquired a controlling interest in DSD Construcciones y Montajes, a Chilean engineering and construction
company specialized in providing services to the energy, oil and gas, cellulose and mining sectors in Chile and Latin America. In December 2014, we acquired a controlling interest in Morelco, an engineering and construction company specialized in the Colombian oil and gas and other energy sectors.
The tables below show our backlog, revenues and EBITDA from 20142018 to 2018.2020.
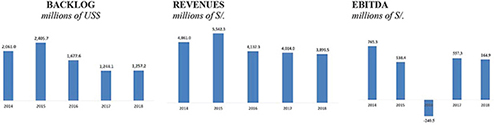
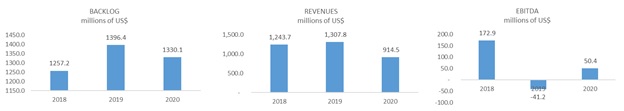
During 2018,2020, we generated revenues of S/.3,899.53,314.0 million (US$1,154914.5 million), EBITDA of S/.557.3182.7 million (US$164.950.4 million), and net profitloss of S/.57.4190.3 million (US$1752.5 million) including net loss attributable to controlling interest of S/.83.2217.9 million (US$24.6(US60.1 million).
Our Strengths
We believe our company’s strengths provide us with significant competitive advantages. Our principal strengths include the following:
Leader in growing markets
We are the largest engineering and construction company in Peru as measured by revenues during 2018,2020, and one of the largest publicly-traded engineering and construction companycompanies in Latin America as measured by market capitalization as of December 31, 2018.2020. Prior to the impact of the COVID-19 pandemic, Peru ishas been undergoing a period of development, with over 4.4%2.55% average annual real GDP growth between 20092011 and 20182020 and significant private and public investments in the mining, power, oil and gas, transportation, real estate and other infrastructure sectors. We have completed some of the most complex and large-scale infrastructure projects in the country, and we believe we are an integral part of Peru’s ongoing transformation with projects that contribute to the overall economic development of the country. We believe our expertise, track record, scale and operational capabilities in Peru position us to take advantage of the country’s favorable economic conditions and growth opportunities. We believe we are also a significant infrastructure concessionaire in Peru and a large apartment building developer in Peru.
Long-standing track record for operational excellence
During our more than 85-year history, we have focused on the successful andon-time execution of complex projects, through our “deliver before deadline” and “lean construction” initiatives. Our extensive experience has allowed us to gain deep market knowledge and expertise, which help us better serve our clients and manage risks in our contractual arrangements. We believe we have a track record of operational excellence. We believe that our track record of operational excellence are key factors in winning new and repeat business, as well as in partnering with strategic industry players and attracting top talent to our company.
Complementary lines of business which generate more stable cash flows and create additional business opportunities across our segments
We have expanded our company by developing complementary lines of business, many of which have become leaders in their respective markets. These lines of business create significant business opportunities across
our segments, enabling us to capture a greater share of infrastructure spending, and also generate cost synergies. One example is Norvial, a toll road concession operated within our Infrastructure segment. In addition to managing the concession, we used our E&C segment to design and construct the expansion of the highway and, once constructed, we are now using our Infrastructure segment to operate and maintain the highway. In addition to increasing our levels of consolidated activity, many of these lines of business enable us to achieve more stable cash flows through medium and long-term client service contracts and concessions, which counter in part the cyclicality of the engineering and construction business.
Significant backlog
Our backlog amounted to US$1,257.21,330.1 million as of December 31, 2018.2020. We believe that our backlog, which as of December 31, 20182020 represented approximately 1.09x1.45x of our related 20182020 revenues, provides visibility as to our potential for growth in the coming years, although backlog may not always be an accurate indicator of future revenues. See “Item 3.D. Key Information—Risk Factors—Risks Related to our Company—Our backlog and our ratio of historical backlog to revenues may not be reliable indicators of future revenues or profit.” Moreover, we believe our backlog is strategically targeted to our keyend-markets such as mining, infrastructure, power, energy and real estate. Approximately 64.9%73.7% of our backlog across our segments as of December 31, 20182020 is comprised of contracts with the private sector. Furthermore, we continuously evaluate bidding on contracts arising from the significant ongoing private and public investments in Latin America.
Proven ability to create and grow businesses organically and through acquisitions
We have proven our ability to extend our engineering and construction capabilities into complementary lines of business in a diverse range of industries, some of which began as innovativestart-ups in response to client needs. For example, in 1984, we created a new IT business division, which grew and evolved through the years to become the second largest IT company in Peru (we sold this business in June 2017). In October 2012, we acquired Vial y Vives, an engineering and construction company specializing in the Chilean mining sector which complements our leading E&C practice in the mining sector. In August 2013, we acquired a controlling interest in DSD Construcciones y Montajes, a Chilean engineering and construction company whose main focus is electromechanical works and assemblies in construction projects related to oil refineries, pulp and paper, power plants and mining plants. In December 2014, we acquired a controlling interest in Morelco, an engineering and construction company specialized in the Colombian oil and gas and other energy sectors. We believe that our proven ability to create new businesses, develop businesses organically and acquire and successfully integrate new businesses into our platform is a key competitive advantage to expand our operations in Latin America.
Highly experienced management, talented engineers and skilled workforce, with shared core corporate values
Our senior management team has an average tenure within our company of approximately 10 years. We motivate our management through performance-based compensation, which align their interests with those of our shareholders. In addition, through our efforts to attract, train and retain our workforce, we have built a talented team of employees, including more than 2,1002,000 engineers. We also have access to a network of approximately 132,000117,000 manual laborers throughout Peru that can supplement our workforce when required by our construction pipeline. Thanks to our extensive and talented team, we have the capability and scale to undertake large and complex projects in Peru and elsewhere.
We have developed a strong corporate culture based on principles of high quality, professionalism, reliability and efficiency, as well as compliance.compliance and risk management. We safeguard the health and safety of our collaborators and of all the persons participating in our operations and services. To that end, we provide safe work conditions, we manage risks in a timely manner and we promote a culture of prevention, starting from the leadership and commitment of our senior management. In 2018,2020, we had an accident incidence rate of 0.32,0.56%, calculated over 200,000 hours worked.
Our Strategies
In response to the impact of our association with Odebrecht in certain projects in Peru and the termination of the GSP pipeline concession, we are implementing a strategic action plan, as described in “Item 5.A. Operating and Financial Review and Prospects—Operating Results—Recent Developments.”
Our vision is to be “the most reliable engineering services company in Latin America.” Our key long-term strategies to achieve this vision include the following:
Bebeing the contractor of choice for large-scale and complex projects in Peru and other key Latin American markets, and continuing to foster our corporate values throughout the organization.
We intend to enhance our position as a contractor of choice for large-scale and complex infrastructure projects in Peru and other key Latin American markets, by (i) utilizing the scale, expertise and market knowledge we have accumulated during our more than80-year operating history to strengthen and expand our E&C segment; (ii) maintaining and further developing our long-standing client relationships based on our ongoing pursuit of operational excellence; (iii) continuing to strategically partner with global industry leaders, such as Bechtel and Fluor, with complementary capabilities for specific projects that we undertake; and (iv) leveraging our expertise in the mining sector with a view to becoming the premier mining services provider throughout Latin America.
Maintain highly capitalized balance sheet
We seek to maintain a prudent and sustainable capital structure and a strong financial position to allow us to capitalize on additional business opportunities as they arise. With the renegotiation and eventual repayment of debt related to GSP, we intend to regain our financially disciplined approach by significantly limiting our debt incurrence to identified projects with repayment sources.
Continue fostering our core corporate values throughout the organization
We will continue to instill our core corporate values throughout our organization, while also transmitting these values to surrounding communities. We will continue to attract and develop our human capital through various training, mentorship and reward programs in order to maintain our position as the best company in Peru to learn and work in the engineering and construction field. We also seek to promote social welfare by fostering relationships with the communities that surround our areas of operation. We strive to promote our corporate values to strengthen our organization and improve our performance as well as to have a positive impact on the markets where we operate.
Engineering and Construction
Our E&C segment has ana more than 85-year track record, and is one of the most well-known engineering and construction groups in Peru, undertaking a broad range of activities relating to:such as: engineering; civil construction; electromechanic constructionworks; electromechanics activities and building construction. We provide E&C services forto a diverse range ofend-markets, focusingmainly focused on the mining, power,industrial, oil and gas, transportation,infrastructure, and real estate, and other infrastructure sectors.among others. The following chart sets forth our 20182020 revenues byend-market.
20182020 E&C Revenues byEnd-Market
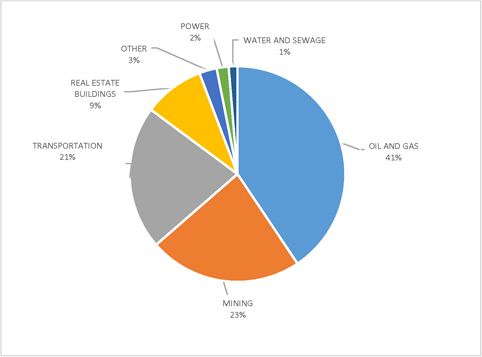
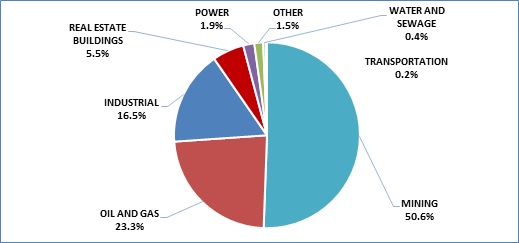
WeOur E&C segment mainly undertakeundertakes private-sector projects, particularly projectsthose with a high degree of complexity, which enable us to develop innovative and tailor-made solutions to our clients. We provide our clients with an integrala comprehensive service offering by leveraging our various areas of expertise and engaging in virtually all aspects of project execution, thereby capturing a larger share of investment projects.
In 1999, we began adoptingadopted the “lean construction” philosophy as a pillar in our design and construction projects. “Lean construction” aims to create value for customers by better understanding and considering clients’ needs to improve project design, functionality and cost optimization. “Lean construction” also provides techniques and tools that significantly reduce construction waste by improving planning reliability, process design, coordination and collaboration.
Although we primarily undertake engineering and construction projects in Peru, our clients often ask us to undertake the engineering and construction of large and complex projects in other countries, such as Mexico, the Dominican Republic, Bolivia, Panama and Chile. As a result, we have developed extensive experience executing projects throughout Latin America. To further capitalize on our capabilities and expertise, we have expanded our activities into other key markets, such as Chile and Colombia, which have been benefitting from high levels of investment and are aligned with our areas of strategic focus. In 2018,2020, approximately US$160.5184 million (S/.542.1667 million) of our E&C revenues were derived from international projects outside of Peru.
The acquisition of two companies, Vial y Vives –and DSD, which were later merged, has solidified our presence in Chile. While we have been undertaking projects in Chile since 1995, such as the construction of the transmission line and crusher of the Caserones mine for SCM Minera Lumina Copiapo, we believe we will benefitcontinue benefiting from the established and long-lasting presence in the country of both Vial y Vives and DSD Construcciones y Montajes. Moreover, through the acquisition of Morelco in December 2014, of Morelco, an engineering and construction company focused on the oil and gas and other energy sectors, we established our presence in the Colombian market.
Given the prevalence of mining operations in our principal markets—Peru has projected investment flows of approximately US$18.7 billion (S/.63.19 billion) between 2018 and 2021, according to the Peruvian Ministry of Energy and Mines and the Ministry of Economy and Finance—main markets, we have significant expertise with respect to specialized engineering and construction services for the mining sector. As a result, we believe we are one of the leading mining construction companies in Latin America and we leverage this expertise both within our principalmain markets as well as to selectively undertakeand in the undertaking of complex projects across the region.
The table below sets forth selected financial information for our E&C business segment.
| | | | | | | | | | | | | | | | |
| | | As of and for the year ended December 31, | |
| | | 2016(1) | | | 2017 | | | 2018 | | | 2018 | |
| | | (in millions of S/., except as indicated) | | | (in millions of
US$)(2) | |
Revenues | | | 2,936.8 | | | | 2,331.9 | | | | 1,960.9 | | | | 580.3 | |
Net profit | | | (93.4 | ) | | | 12.4 | | | | (85.4 | ) | | | (25.3 | ) |
Net profit (loss) attributable to controlling | | | (87.7 | ) | | | 12.1 | | | | (86.9 | ) | | | (25.7 | ) |
EBITDA | | | 19.3 | | | | 120.0 | | | | 19.2 | | | | 5.7 | |
EBITDA margin | | | 0.7 | % | | | 5.1 | % | | | 1.0 | % | | | 1.0 | % |
Backlog (in millions of US$)(3) | | | 1,157.6 | | | | 772.5 | | | | 782.6 | | | | 782.6 | |
Backlog/revenues ratio(3) | | | 1.3 | x | | | 1.1 | x | | | 1.3 | x | | | 1.3 | x |
| | | | | | | | | | | | | | | | |
| | | As of and for the year ended December 31, | |
| | | 2018 | | | 2019 | | | 2020 | | | 2020 | |
| | | (in millions of S/, except as indicated) | | | (in millions of US$)(1) | |
Revenues | | | 1,960.9 | | | | 2,797.3 | | | | 2,092.6 | | | | 577.4 | |
Net profit | | | (85.4 | ) | | | (140.7 | ) | | | (79.6 | ) | | | (22.0 | ) |
Net profit (loss) attributable to controlling | | | (86.9 | ) | | | (137.1 | ) | | | (76.6 | ) | | | (21.1 | ) |
EBITDA | | | 19.2 | | | | 2.9 | | | | 9.7 | | | | 2.7 | |
EBITDA margin | | | 0.98 | % | | | 0.10 | % | | | 0.5 | % | | | — | |
Backlog (in millions of US$)(2) | | | 782.6 | | | | 910.1 | | | | 852.9 | | | | — | |
Backlog/revenues ratio(2) | | | 1.3x | | | | 1.1x | | | | 1.5x | | | | — | |
| (1) | For the effects on our results of operations and backlog for 2016 resulting from the termination of the GSP gas pipeline concession, see “Item 5.A. Operating and Financial Review and Prospects—Operating Results—Recent Developments” and notes 5.1(e), 19(i),19(ii) and 16 to our audited annual financial statements included in this annual report.
|
(2) | Calculated based on an exchange rate of S/.3.3793.624 to US$1.00 as of December 31, 2018.2020. |
(3)(2) | For more information on our backlog, see “—Backlog.” Backlog is calculated as of the last day of the applicable year. Revenues are calculated for such year and converted into U.S. dollars based on the exchange rate published by the SBS on December 31 of the corresponding year. |
Principal Engineering and Construction Activities
The following chart sets forth our 20182020 revenues by E&C activity.
20182020 E&C Revenues by Activities
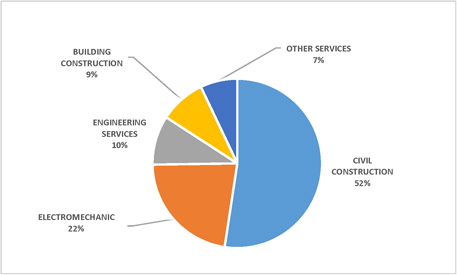
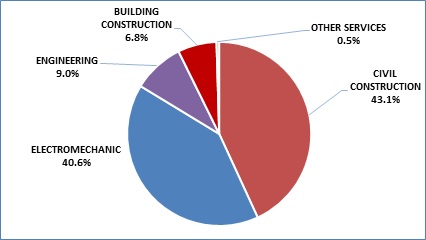
Civil ConstructionWorks
Our civil constructionworks activities focus on infrastructure projects, including earthworks, the construction of roads, highways, transportation facilities (e.g., mass transit systems such as the Lima Metro), dams, hydroelectric plants, water supply and sewage projects, excavation, structural concrete construction and tunneling. Our civil construction projects are generally large and complex, requiring the use of large construction equipment and sophisticated managerial and engineering techniques.
Electromechanic ConstructionElectromechanics
Our electromechanic constructionelectromechanics activities include the construction and assembly of concentrator plants, pipelines, transmission lines, gas and oil networks, and substations, predominantly for energy projects and industrial plants.
Engineering Services
Our engineering activities consist of a broad range of services relating to engineering, supervision, geometrics and environmental consultancy, includingpre-investment studies,pre-feasibility studies, process design, project development, supervision of executive designs and construction management, including construction site reviews.
Building Construction
Through our building construction activities, we respond to the demands of the Peruvian real estate market with a focus ondemand for the construction of hotels, affordable housing projects, residential buildings, office buildings, shopping centers, and industrial plants.
Other Services
The otherOther services we provide include procurement services, maintenance of plants and industrial facilities and rental of construction equipment.
Major Projects
We have playedThe company plays an active role in the development of the infrastructure sector in Peru, as well as other countries in Latin America, including the construction of roads, hotels, hospitals, shopping centers, housing developments, concentrator plants, hydroelectric power plants, thermal power plants and transmission lines as well as water supply and sewage projects, irrigation projects and dam building, among others. Throughout our history, we have participated, on our own or through minority or majority interests in joint operations, in a diverse range of landmark projects, including the following:
in 1948, Talara city in northern Peru for the International Petroleum Company, consisting of 2,000 homes, schools, churches, a movie theater and airport;
in 1950, a 430 km stretch of the Panamericana Sur highway;
in 1952, the Rebagliati hospital, the largest public hospital in Peru;
in 1960, the Cañón del Pato hydroelectric power plant, the second largest hydroelectric plant in Peru in terms of installed capacity;
in 1961, the Jorge Chavez International Airport, Peru’s first international airport, located in Lima;
in 1969, the Cuajone mining project, the largest copper mine and smelter complex in the world at that time and, in 1997, the Ilo smelter and refinery for Southern Copper Corporation;
in 1974, the Sheraton Hotel in Lima, and, in 1995, the Sheraton Hotel in Santiago, Chile;
in 1988, the Chavimochic irrigation project, the most significant irrigation project in Peru;
in 1992, the Four Seasons Hotel in Mexico City, Mexico;
in 1995, the U.S. Embassy in Peru;
in 1998, the Mantaro-Socobaya 605 km transmission line, which connected the country’s electrical grids;
in 2000, the Marriott Hotel in Lima;
in 2002, began providing open pit mining services, which are ongoing, to Brocal;
in 2004, the Ralco hydroelectric power plant in Chile;
in 2004, the gas fractionation plant and, in 2008, its expansion for Consorcio Camisea, Camisea project, the largest energy project in Peru’s history;
in 2005, the San Cristobal concentrator plant in Bolivia;
in 2005, the Cerro Verde mine concentrator plant for Phelps Dodge; in 2008, the Cerro Corona concentrator plant for GoldFields;
in 2008, the Parque Agustino real estate development project, the first major affordable housing project in Peru, which consists of 3,400 units;
in 2009, the Westin Lima Hotel, one of the tallest buildings in Peru;
in 2010, the Melchorita liquefaction plant for Peru LNG,liquified natural gas, Camisea project;
in 2010, the Bayóvar plant for Vale;
in 2010, the Gran Teatro Nacional, the most modern theater in Peru;
in 2011, the Pueblo Viejo Mine concentrator plant for Barrick Gold Corp. in the Dominican Republic;
in 2011, the first stretch of Line One of the Lima Metro for the Peruvian Ministry of Transport and Communications;
in 2012, for project manager Bechtel, the Antapaccay copper concentrator developed by Xstrata Copper, the world’s fourth largest copper producer;
in 2013, expansion of the plant for Cementos Lima, the largest cement producer in Peru;
in 2013, the Huanza hydroelectric plant for Compañía de Minas Buenaventura;
in 2013, the leaching pad La Quinua for the Yanacocha mine;
in 2014, the second stretch of Line One of the Lima Metro for the Peruvian Ministry of Transport and Communications;
in 2014, construction of a natural gas distribution network for Contugas, providing access to natural gas for five districts south of Lima;
in 2014, construction of the Nueva Fuerabamba city, an integral real estate development project for the population surrounding the Las Bambas mining project;
in 2014, construction of a concentrator plant for the Toromocho copper mine, developed by Chinalco Mining;
in 2014, construction of a primary crusher for Mina Caserones, developed by Minera Lumina Copiapo, which is expected to have a daily production capacity of 144,230 tonnes;
in 2015, construction of a copper concentrator plant for the Las Bambas mining project, managed by Bechtel and developed by Xstrata Copper;
in 2015, expansion of the process plant for the Cerro Verde mine, one of the biggest concentrator plants in Latin America;
in 2015, engineering, procurement and construction of Guyana Goldfields’ Aurora gold project in Guyana, with the scope of works including a 1.75 Mt/a processing plant, power station and integration management;
in 2015, design, engineering, procurement and construction of a new stock pile and 10,000 conveyor belts for the Escondida Mine, managed by Bechtel;
in 2016, engineering, procurement and construction of the 510 MW Cerro del Águila S.A. hydroelectric plant for IC Power, which is expected to representrepresents approximately 10% of Peru’s installed generation capacity;
in 2016, engineering, procurement and construction of La Chira, a waste water treatment plant for the city of Lima for which we also have the concession through a joint operation with Acciona Agua;
in 2016, engineering, procurement and construction of a concentrator plant for the La Inmaculada silver and gold project, developed by Hochschild Mining. This project is expected to haveMining, with a daily processing capacity of 3,500 tonnes;
in 2016, construction of an Open Plaza shopping center in the city of Huancayo, province of Junin;
in 2016, construction of civil works and electromechanical assembly of the combined cycle power plant in the Kelar combined cycle thermoelectric plant located in Mejillones, Antofagasta Region, Chile;
in 2017, prefabrication of certain products for the modernization of the Talara refinery in Peru;
in 2017, electromechanical assembly of certain infrastructure in connection with the Cuajone mine improvement project in Peru;
in 2017, various urban and industrial projects in the LurinLurín district of Lima, Peru, including moving earth for a road platform, a secondary network for potable waters and sewage, and electrical distribution networks;
in 2017, construction of a20-story residential building on the Pezet Avenue of Lima;
in 2017, construction of a pavillionpavilion at the Universidad del Pacifico, Peru;
in 2017, construction of amulti-use hall at the Universidad ESAN in Peru;
in 2018, construction and rehabilitation of an expressway known as Línea Amarilla for Vinci;
in 2018, construction and design of the Talbot project, a luxury business complex consisting of offices and a hotel withstate-of-the-art technology in Lima; and
in 2018, execution of civil works and assembly of structures for the wet area of the Toquepala mine in Southern Peru.Peru;
in 2019, execution of civil works in the Quellaveco mine for AngloAmerican in Peru;
in 2019, civil works for a modernization project in the Aceros Arequipa plant for Aceros Arequipa Corporation in Peru;
in 2019, rehabilitation of the runway of the Ayacucho airport;
in 2019, structural reinforcement project in Plaza del Sol office building in Lima;
in 2019, construction and rehabilitation of a highway that crosses Lima, Huacho and Pativilca;
in 2019, ball mill stator replacement in Antamina, located in Ancash, Peru;
in 2019, construction of a new water recirculation system and implementation of the north branch for the transfer of tailings in Antofagasta, Chile;
| • | | in 2020, construction of a hospital for INEN (Intituto Nacional de Enfermedades Neoplásicas) in Lima, Peru; and |
in 2020, crushing and transportation of material in Minera Spence in Chile.
We currently have a diversified portfolio of ongoing projects, onwhether through our ownsubsidiaries or through majority or minority interests in joint operations, in a wide range of sectors in Peru and the other countries wherein which we operate, including the following:
construction of the Vistamar hotel with two towers in Miraflores, which is scheduled to be completed in November 2021;
construction of a luxury Ibis Hotel in San Isidro with 9 floors and 2 basements, which was completed in April 2021;
execution of electromechanical and civil works in the construction of the Mina Justa mine for Marcobre, which was completed in April 2021;
assembly of equipmentmechanical and installation of pipelines, electricity and instrumentationelectrical equipment for the wet area of Toquepala mine’s unit expansion,modernization project in the Aceros Arequipa plant for Aceros Arequipa Corporation in Peru, which is scheduled to be completed in May 2019;2021;
executionconstruction of civil workstunnels to transport thick mineral and mineral waste in the Quellaveco mine for AngloAmerican,Moquegua, Peru, which is scheduled to be completed in July 2019;August 2021;
execution of complementary works for the auxiliary units of the Talara refinery for Cobra Perú (three contracts), which is scheduled to be completed during the second half of 2020;in November 2021;
expansion workselectromechanical civil assembly of the water treatment plant, cooling towers, turbogenerators and evaporators for the map project for Celulosa Arauco Constitución in Chile, which is scheduled to be completed in November 2021;
comprehensive solution for condensate recovery and power generation system at the Aceros Arequipa plant for Aceros Arequipa Corporation,Chichimene station in Colombia, which is scheduled to be completed in August 2019; and2021;
execution of electromechanical and civil works in the construction of the Mina Justa mine for Marcobre,Concentrator plant in Moquegua, Perú, which is scheduled to be completed in May 2020.2022;
engineering, procurement and construction of a 271 km long, high pressure gas distribution network in Piura, Peru, which is scheduled to be completed in February 2022;
earthworks and asphalt for the new Jorge Chavez Airport runway, auxiliary roads, aircraft parking area and electromechanical support facilities for landing in Callao, Peru, which is scheduled to be completed in April 2022;
pebble grinding and crushing construction of the Quebrada Blanca 2 concentrator for Minera Teck Quebrada Blanca in Chile, which is scheduled to be completed in July 2022;
construction of an offices and commercial storage building in Colombia, which is scheduled to be completed in August 2022;
construction of an overpasses for the integrity of hydrocarbon transport systems in Colombia, which is scheduled to be completed in December 2022; and
design, procurement, and construction of the electric reinforcement of La Guajira: Lines Riohacha-Maicao 110kv and Riohacha-Cuestecitas 110 kv in La Guajira, Colombia, which is scheduled to be completed in December 2023, and operation and maintenance which is scheduled to be completed in October 2030.
Clients
We believe that we have developed long-term relationships with many clients as a result of our performance over the years and are focused on the successful andon-time execution of complex projects, through our “deliver before deadline” and “lean construction” initiatives. Our extensive experience of operational excellence has allowed us to gain deep market knowledge and expertise, which help us better serve our clients. The principal clients of ourKey E&C segmentclients include renowned domestic and multinational mining, power, oil and gas, transportation and infrastructure development companies, such as AngloAmerican, Southern Peru, Cobra Perú, Marcobre and Corporación Aceros Arequipa, Compañía Minera TECK Quebrada Blanca S.A., Minera Spence S.A., ENAP Refinerías and Minera Escondida LTDA, among others.
Project Selection and Bidding
We win new engineering and construction contracts through private and public bidding processes or direct negotiation, from a variety of sources, including potential client requests, proposals from existing or former clients, opportunities sought by our commercial team and from requests by the Peruvian government. Approximately 93.6%, 99.9% and 82.5% of our 2020, 2019 and 2018 revenues in our E&C segment, respectively, came from private-sector contracts.contracts, particularly, in 2020, from projects in Colombia. The Peruvian government and its agencies typically award construction contracts through a public bidding process conducted in accordance with the Peruvian State Contracting Law (Ley de Contrataciones del Estado). In the private sector, in addition to obtaining new projects, another important source of revenue involves increases in the scope of work to be performed in connection with already existing projects. These arrangements are typically negotiated directly with the client, often during the course of the work we are already performing for that client.
We have a designated team that oversees the management of project proposals and a commercial team that reviews and evaluates potential projects in order to estimate costs. We also have a business development committee, which makes decisions about whether or not to apply for projects. In considering whether to bid for a potential project, we principally consider the following factors: competition and the probability of being awarded the project; project size; the client; our experience undertaking similar projects; and the availability of resources, including human resources. As part of the project selection process, our commercial team performs a detailed cost analysis utilizing sophisticated software we developed to assist in determining whether the project is viable and cost-effective. If we choose to pursue a project, a budget leader is assigned to prepare the offer that is eventually presented to our potential client.
Despite the budgeting risks generally associated with engineering and construction contracts, our management believes that our experience generally allows us to estimate our project costs accurately. Our project management teams also periodically review project budgets for inconsistencies between budgeted and actual costs in order to recover for cost variations through contract renegotiation. Budgeting risks are also mitigated through advance payments. Considering that we receive advance payments for most of our E&C contracts, our E&C projects typically do not require significant working capital investment. Our E&C segment secures financing primarily to purchase machinery and equipment for our construction services.
We are required, in the majority of our construction contracts, to provide a performance bond to guarantee project performance and completion, which remain in effect for the contract’s duration. We are also required to provide performance bonds to secure any advance payments provided to us by our clients. These bonds are periodically reduced during the project’s execution in accordance with project advancement. After the expiration of the contract term, we are typically required to provide an additional performance bond that remains valid for one year.
Contracts
We principally enter into four types of engineering and construction contracts:
| | • | | Cost-plus fee contracts. The contract price is based upon actual costs incurred for time and materials plus a fee, which may be a percentage of the costs incurred or apre-determined fee. Sometimes, cost-plus fee contracts include a target price, and a contractual arrangement that determines our responsibility in the event the total cost of the project exceeds the target price or the benefit we receive if the total contract price results in cost savings. Cost-plus fee contracts tend to involve the least budgeting risk for us. |
| | • | | Unit price contracts. The contract price is based upon a price per unit (i.e., variable quantities of work priced at defined unit rates). Each line item of the project budget, such as cubic meter of earth excavated or cubic meter of concrete poured, has a defined price, but the quantities of the units may vary. Our bid price reflects our estimate of the costs that we expect to incur for each work unit. These contracts typically include an “escalation” clause which is essentially an adjustment mechanism to account for Peruvian inflation. |
| | • | | Lump-sum contracts. The contract price is fixed. Our bid is meant to cover all costs and include a profit. The principal risk in these types of contracts are errors in calculating our costs, including those of raw materials; miscalculation of the number of units or workers needed to complete the project; unanticipated technical complexities; or other unexpected events or circumstances that may increase our costs. |
| | • | | Engineering, procurement and construction (EPC) contracts. EPC contracts, known as “single source” or“turn-key” contracts, are alsolump-sum contracts. Pursuant to EPC contracts, we provide a broad range of basic and detailed engineering services, including preparation of the technical project specifications, detailed drawings and construction specifications; technical studies; and identification of lists of materials and equipment necessary for the project. These contracts, which we utilize predominantly for our mining contracts, require a high-level of expertise and generally involve the most budgetary risks for us. |
For further information, see “Item 5.A. Operating and Financial Review and Prospects—Operating Results—Results of Operations.”
Raw Materials
The principalmain inputs we use in our E&C segment used are, among others, fuel, cement and steel. These and the other products we require in our E&C segment may be subject to the availability of raw materials, such as oil and iron, and commodity pricing fluctuations, which we monitor on a regular basis. We typicallyNormally, our aim is to enter into master supply agreements for a period ofperiods between six months toand one year. Although we obtain the majoritymost of our inputs needs in Peru, we believe we have access to numerous global supply sources. The availability of these inputs, however, may vary significantly from year to year due to various factors including client demand, producer capacity, market conditions, transport costs and specific material shortages, and we may incur additional costs in obtaining them.
We purchase and lease the equipment we require for our E&C segment business from several local and international suppliers, currently with no significant concentration with any particular suppliers. While we do not have difficulty obtaining therequired equipment, we need, we may face difficulties finding skilled personnel who are able to operate certain equipment and machinery.
Competition
We generally compete with some of the largest contractors in Peru and in the other countries where we operate. Because the E&C sector is highly competitive, the markets served by our business generally require substantial resources and experienced, highly-skilled and experienced technical personnel. The principalMain competitors of our E&C segment include local companies such as Besalco S.A., Cosapi S.A., San Martín Contratistas Generales, ICCGSA, JJC Contratistas Generales S.A., and international companies such as Techint S.A.C., SSK Montajes e Instalaciones S.A.C., Skanska del Perú S.A., Mota-Engil Peru S.A., Salfacorp S.A., OHL, Acciona, Astaldi, Grupo FCC, Ismocol, Termotecnica, Masa, Thiess and Redpath, among others. For certain projects, due to the size of the project, expertise required and other factors, we may choose to partner with our competitors, including the aforementioned companies.
Competition for ourwithin the E&C segment is driven by performance, skill and project execution capabilities for completing complex projects in a safe, timely and cost-efficient manner, as well as price.manner.
Infrastructure
We are an important toll road concessionaire in Peru, operating three toll roads. Moreover, we are the concessionaire for the Lima Metro, the largest mass-transit rail system in Peru, and a waste water treatment plant. Additionally, we operate ten multiple fuel storage facilities, four producing oil fields under long-term government contracts and we own a gas processing plant. Also, we provide services to maintain and operate different infrastructure projects.
The table below sets forth selected financial information for our Infrastructure business segment.
| | | | | | | | | | | | | | | | |
| | | As of and for the year ended December 31, | |
| | | 2016 | | | 2017 | | | 2018 | | | 2018 | |
| | | (in millions of S/., except as
indicated) | | | (in millions of
US$)(1) | |
Revenues | | | 1,174.8 | | | | 1,447.9 | | | | 1,883.3 | | | | 557.3 | |
Net profit | | | 98.3 | | | | 129.3 | | | | 184.0 | | | | 54.5 | |
Net profit attributable to controlling | | | 74.4 | | | | 103.8 | | | | 152.3 | | | | 45.1 | |
EBITDA | | | 237.8 | | | | 300.9 | | | | 411.5 | | | | 121.8 | |
EBITDA margin | | | 20.2 | % | | | 20.8 | % | | | 21.8 | % | | | 21.8 | % |
Backlog (in millions of US$)(2) | | | 519.0 | | | | 544.8 | | | | 520.8 | | | | 520.8 | |
Backlog/revenues ratio(2) | | | 1.5 | x | | | 1.2 | x | | | 0.9 | x | | | 0.9 | x |
| | | | | | | | | | | | | | | | |
| | | As of and for the year ended December 31, | |
| | | 2018 | | | 2019 | | | 2020 | | | 2020 | |
| | | (in millions of S/, except as
indicated) | | | (in millions of US$)(1) | |
Revenues | | | 1,883.3 | | | | 1,587.3 | | | | 1,185.2 | | | | 327.0 | |
Net profit | | | 184.0 | | | | 112.1 | | | | 23.0 | | | | 8.6 | |
Net profit attributable to controlling | | | 152.3 | | | | 81.3 | | | | 33.6 | | | | 5.6 | |
EBITDA | | | 409.6 | | | | 372.7 | | | | 208.7 | | | | 72.5 | |
EBITDA margin | | | 21.8 | % | | | 22.4 | % | | | 17.6 | % | | | — | |
Backlog (in millions of US$)(2) | | | 520.8 | | | | 553.9 | | | | 492.4 | | | | — | |
Backlog/revenues ratio(2) | | | 0.9x | | | | 1.2x | | | | 1.5x | | | | — | |
| (1) | Calculated based on an exchange rate of S/.3.3793.624 to US$1.00 as of December 31, 2018.2020. |
| (2) | For more information on our backlog, see “—Backlog.” Does not include our Norvial toll road concession or our Energy line of business and our jointly. Backlog is calculated as of the last day of the applicable year. Revenues are calculated for such year and converted into U.S. dollars based on the exchange rate published by the SBS on December 31 of the corresponding year. Includes revenues only for businesses included in backlog. |
Our strategy is to pursue concessions with the potential to generate business opportunities across our organization. Once we obtain a concession, our goal is to be involved virtually in all aspects of project execution through the participation of our different business segments, from the design and construction to the operation and maintenance of the infrastructure asset.
Through our Infrastructure segment we participate in a number of joint operations with the objective of bidding for government concessions or other long-term contracts. When bidding, we occasionally look for partners to reduce our risks and achieve the level of expertise needed to meet the demands of each particular project.
The following table shows selected information about our current concessions and long-term contracts as of December 31, 2018.2020.
| | | | | | | | | | | | | | | | | | | | | | | | |
Project | | Year
Granted | | | Initiated
Operations | | | Expiration | | | Characteristics | | | % Owned
by Us | | | Status | |
Toll Roads: | | | | | | | | | | | | | | | | | | | | | | | | |
Norvial(1) | | | 2003 | | | | 2003 | | | | 2028 | | | | 183 km | | | | 67.0 | % | | | Operating | |
Survial | | | 2007 | | | | 2008 | | | | 2032 | | | | 750 km | | | | 99.9 | % | | | Operating | |
Canchaque | | | 2006 | | | | 2010 | | | | 2025 | | | | 78 km | | | | 99.9 | % | | | Operating | |
Mass Transit: | | | | | | | | | | | | | | | | | | | | | | | | |
Lima Metro | | | 2011 | | | | 2012 | | | | 2041 | | | | 33.1 km | | | | 75.0 | % | | | Operating | |
| Project | | Year
Granted | | | Initiated
Operations | | | Expiration | | | Characteristics | | % Owned
by Us | | Status | | | Year
Granted | | | Initiated Operations | | | Expiration | | | Characteristics | | % Owned
by Us | | | Status |
Toll Roads: | | | | | | | | | | | | | |
Norvial(1) | | | | 2003 | | | | 2003 | | | | 2028 | | | 183 km | | | 67.0 | % | | Operating |
Survial | | | | 2007 | | | | 2008 | | | | 2032 | | | 750 km | | | 99.9 | % | | Operating |
Canchaque | | | | 2006 | | | | 2010 | | | | 2025 | | | 78 km | | | 99.9 | % | | Operating |
Mass Transit: | | | | | | | | | | | | | |
Lima Metro | | | | 2011 | | | | 2012 | | | | 2041 | | | 33.1 km | | | 75.0 | % | | Operating |
Water Treatment: | | | | | | | | | | | | | | | | | | | | | | | | |
La Chira | | | 2010 | | |
| June
2016 |
| | | 2037 | | | Avg. treatment capacity of 6.3 m3/sec (expected) | | | 50.0 | % | | Operating | | | | 2010 | | | | 2016 | | | | 2037 | | | Avg. treatment capacity of 6.3 m3/sec (expected) | | | 50.0 | % | | Operating |
Energy: | | | | | | | | | | | | | | | | | | | | | | | | |
Oil Production (2) Block I | | | 1995 | | | | 1995 | | | | 2021 | | | Avg. daily production of 727 bbl (2018) | | | 100.0 | % | | Operating | | | | 1995 | | | | 1995 | | | | 2021 | | | Avg. daily production of 600 bbl (2020) | | | 100.0 | % | | Operating |
Block V | | | 1993 | | | | 1993 | | | | 2023 | | | Avg. daily production of 107 bbl (2018) | | | 100.0 | % | | Operating | | | | 1993 | | | | 1993 | | | | 2023 | | | Avg. daily production of 94 bbl (2020) | | | 100.0 | % | | Operating |
Block III | | | 2015 | | | | 2015 | | | | 2045 | | | Avg. daily production of 712 bbl (2018) | | | 100.0 | % | | Operating | | | | 2015 | | | | 2015 | | | | 2045 | | | Avg. daily production of 677 bbl (2020) | | | 100.0 | % | | Operating |
Block IV | | | 2015 | | | | 2015 | | | | 2045 | | | Avg. daily production of 1,898 bbl (2018) | | | 100.0 | % | | Operating | | | | 2015 | | | | 2015 | | | | 2045 | | | Avg. daily production of 2,146 bbl (2020) | | | 100.0 | % | | Operating |
Gas Processing(3) | | | 2006 | | | | 2006 | | | | N/A | | | Avg. daily processing capacity of 44 MMcf (2018) | | | 100.0 | % | | Operating | | | | 2006 | | | | 2006 | | | | N/A | | | Avg. daily processing capacity of 44 MMcf (2020) | | | 100.0 | % | | Operating |
North and Central Fuel Terminals | | | 2014 | | | | 2014 | | | | 2034 | | | Aggregate storage capacity of 2.2 MMbbl | | | 50.0 | % | | Operating | | | | 2014 | | | | 2014 | | | | 2034 | | | Aggregate storage capacity of 2.7 MMbbl | | | 50.0 | % | | Operating |
South Fuel Terminals | | | 1997 | | | | 1998 | | |
| August
2019 |
| | Aggregate storage capacity of 1.4 MMbbl | | | 50.0 | % | | Operating | | |
| (1) | In June 2018, the company transferred economic rights over 48.8% of the share capital of Norvial to Inversiones en Autopistas S.A. by transferring its Class B shares. Our company continues to possess 67% of voting rights of Norvial and an economic interest of 18.2% of Norvial’s share capital. JJC Contratistas Generales S.A. owns the remaining 33.0%. |
| (2) | Percentages owned in Energy reflect GMP’sUNNA Energía’s ownership. We own 95% of GMP.UNNA Energía. |
| (3) | We own a gas processing plant and have a long-term delivery and gas processing contract with Enel Generación Piura S.A., which is in force until November 2023. |
A consortium including the company held a concession to operate the South Fuel Terminal beginning in 1997. The terminal had an aggregate storage capacity of 1.4 MMbbl, 50.0%. The concession was terminated on November 2, 2019, and the concession reverted to Petroperú.
Additionally, the Chavimochic concession was awarded in 2013 for the design, construction, operation and maintenance of major hydraulic works in northern Peru. Affiliates of Odebrecht own 73.5% of the Chavimochic consortium, with the remaining 26.5% stake held by us. The second phase of the hydraulic works project has not begun as a result of the government’s failure to deliver the required lands for the project. Chavimochic is currently in discussions with the government in relation to the future of the project.
On November 11, 2013, we entered into a memorandum of understanding with Canada Pension Plan Investment Board (“CPPIB”), to create an alliance regarding a partnership to invest in infrastructure projects in Latin America, mainly Peru, Chile and Colombia. This alliance isnon-exclusive and investments will be determined on acase-by-case basis. In December 2014, we undertook our first large investment with CPPIB, by formalizing an agreement with Enagás (as defined below) and CPPIB whereby we acquired 51% of Tecgas and owner of 100% of the shares of COGA, the current operator of TGP, while Enagás acquired 30% and CPPIB maintained 19% of the participation. COGA is dedicated to the management, operation, maintenance, and integrity management of transport and distribution hydrocarbon pipelines and installations as well as industrial plants and ancillary installations. COGA operates and maintains more than 1,430km of pipelines, one compression plant with 72,000 horse power and four pump stations with 19,200 horse power each. COGA operates two pipelines: one which is 730 km and transports natural gas (GN) with a 1,275 MM cubic feet per day capacity; and the other one which is 530 km and transports natural gas liquids (NGL) with a 130,000 barrels per day capacity. Both pipelines run from Cusco to Ayacucho and Huancavelica, with the GN pipeline extending to Lurin and the NGL pipeline continuing to the Pisco fractionation plant. As this is a joint operation, we do not include the results of our COGA venture in our consolidated results under our Infrastructure segment. On April 24, 2017, we sold our interest in COGA.
On September 29, 2015, we entered into a memorandum of understanding with Odebrecht Latinvest to participate with a 20% stake in the shareholder equity of Concesionaria Gasoducto Sur Peruano S.A., for an amount of US$215 million (S/.722.4722.4 million). On November 2, 2015, we acquired this 20% stake in GSP through a capital increase. The other shareholders are Odebrecht Latinvest with a 55% stake and EnagásEnagas with a 25% stake. Concesionaria Gasoducto Sur Peruano S.A. was responsible for the design, financing,
construction and operation of the southern gas pipeline, a project which would bring natural gas to the southern region of Peru, particularly to the provinces of Cuzco, Arequipa, Puno and Moquegua. The GSP gas pipeline concession was terminated by the Peruvian Ministry of Energy and Mines on January 24, 2017. For more information, see “Item 5.A. Operating and Financial Review and Prospects—Operating Results—Recent Developments.Key Developments—Termination of the Gasoducto Sur Peruano Concession.”
Principal Infrastructure Lines of Business
Toll Roads
Peru’s economic development is underpinned by a strong government commitment to infrastructure investment, with a particular focus on improving the country’s road system through the award of new concessions to the private sector. We believe this commitment offers significant opportunities to our Infrastructure segment. The following map shows the location of the Red Vial 5 road in Peru.
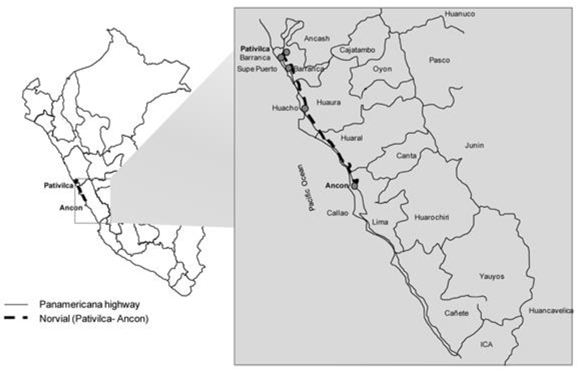
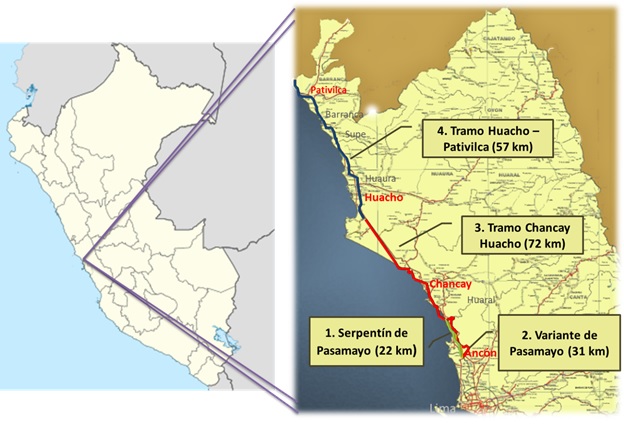
Our Infrastructure segment currently has three toll road concessions through our subsidiaries Norvial, Survial and Canchaque. All three toll roads are currently in operation and we have the authorizations, permits and licenses necessary to fulfill our obligations under each concession, including releases of rights of way. All of our toll road concessions have utilized the construction services of our E&C segment and the roads are currently operated and maintained by our subsidiary Concar. The table below sets forth selected financial information relating to our toll roads.
| | | | For the year ended December 31, | | | For the year ended December 31, | |
| | | 2016 | | 2017 | | 2018 | | 2018 | | | 2018 | | 2019 | | 2020 | | 2020 | |
| | | (in millions of S/.) | | (in millions of
US$)(1) | | | (in millions of S/) | | (in millions of US$)(1) | |
Revenues | | | 264.4 | | | 263.8 | | | 280.8 | | | 83.1 | | | | 280.8 | | | | 326.3 | | | | 206.4 | | | | 57.0 | |
EBITDA | | | 76.8 | | | 91.1 | | | 102.3 | | | 31.5 | | | | 102.3 | | | | 94.3 | | | | 78.0 | | | | 21.5 | |
EBITDA margin | | | 29.0 | % | | 34.5 | % | | 36.4 | % | | 36.4 | % | | | 36.4 | % | | | 28.9 | % | | | 37.8 | % | | | — | |
| (1) | Calculated based on an exchange rate of S/.3.3793.624 to US$1.00 as of December 31, 2018.2020. |
The charts below set forth the breakdown of our revenues and EBITDA from our toll road concessions for 2018.2020.
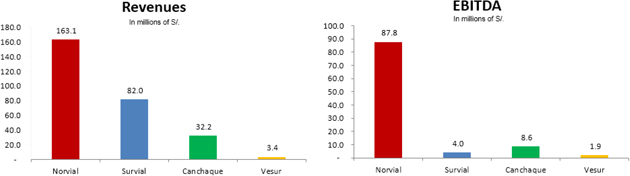
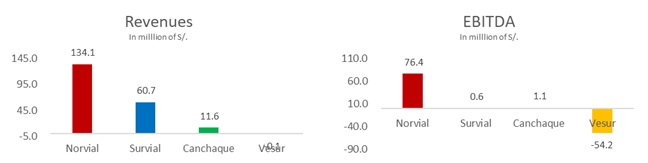
Norvial
Under our Norvial concession, we operate and maintain part of the only major highway that connects Lima to the northwest of Peru. This183-km road, known as Red Vial 5, runs from the cities of Ancón to Pativilca and has three toll stations. The concession was awarded to Norvial in 2003 for a25-year term. In June 2018, the company transferred economic rights over 48.8% of the share capital of Norvial to Inversiones en Autopistas S.A. by transferring its Class B shares. Our company continues to possess 67% of voting rights of Norvial and an economic interest of 18.2% of Norvial’s share capital. JJC Contratistas Generales S.A. owns the remaining 33.0%.
Norvial’s revenue derives from the collection of tolls. For the Norvial toll road, the toll rate is set out in the Norvial concession agreement and adjusted in accordance with a contractual formula that takes into account the sol/U.S. dollar exchange rate and Peruvian and U.S. inflation. We are required to transfer 5.5% of our monthly toll revenue to the Peruvian Ministry of Transport and Communications and pay a 1% regulatory fee to the Peruvian Supervisory Agency for Investment in Public Transportation Infrastructure.
Our obligations under the concession include expanding the already existing road by, among other things, adding two additional lanes. The first stage of construction was completed in 2008, and the second stage commenced in the second quarter of 2014 and is expected to bewas completed by Octoberthe end of 2019. We estimate that ourThe capital investment for the second stage will be approximatelywas US$9588.6 million (S/.319.2322.7 million).
Unlike other toll roads in Peru, Norvial charges toll fees in both directions. Our road is highly transited both by heavy vehicles, primarily for the purpose of transporting goods, and also by passenger vehicles, which typically use the road to access tourist destinations. In June 2018, we signed an investment agreement with BCI Perú to monetize future dividends of Norvial. The amount of the transaction was US$42.3 million, the proceeds of which were applied to the reduction of indebtedness related to GSP. In May 2020, the Peruvian Congress suspended the payment of tolls on roads during the initial period of COVID-19 quarantine. Although the Peruvian Constitutional Court struck down the statute effective June 30, 2020, we have yet to collect compensation for tolls which were suspended during that period. The following table sets forth average daily traffic volume and average toll fees charged for vehicle equivalents in respect to the Norvial toll road concession for 2016, 20172018, 2019 and 2018.2020.
| | | | For the year ended December 31, | | | For the year ended December 31, | |
| | | 2016 | | | 2017 | | | 2018 | | | 2018 | | | 2019 | | | 2020 | |
Average daily traffic by vehicle equivalents(1) | | | 24.140 | | | | 24.965 | | | | 26.095 | | |
Average toll fee charged for vehicle equivalents (in S/.) | | | 14.3 | | | | 14.76 | | | | 15.22 | | |
Average daily traffic by vehicle equivalents(1) | | | | 26.095 | | | | 26.835 | | | | 24.072 | |
Average toll fee charged for vehicle equivalents (in S/) | | | | 15.22 | | | | 15.45 | | | | 15.86 | |
| (1) | Each automobile is counted as one equivalent vehicle and commercial vehicles (such as trucks or buses) represent the number of equivalent vehicles equal to the ratio between the toll rate applicable to commercial vehicles and that which is applicable to one automobile. |
The table below sets forth selected financial information relating to Norvial.
| | | | | | | | | | | | | | | | |
| | | For the year ended December 31, | |
| | | 2016 | | | 2017 | | | 2018 | | | 2018 | |
| | | (in millions of S/.) | | | (in millions of
US$)(1) | |
Revenues | | | 216.3 | | | | 149.5 | | | | 163.1 | | | | 48.3 | |
Net profit | | | 47.3 | | | | 49.4 | | | | 17.2 | | | | 5.1 | |
EBITDA | | | 77.7 | | | | 81.4 | | | | 87.8 | | | | 26.0 | |
EBITDA margin | | | 35.9 | % | | | 54.5 | % | | | 53.8 | % | | | 53.8 | % |
(1) | Calculated based on an exchange rate of S/.3.379 to US$1.00 as of December 31, 2018.
|
Survial
Under our Survial concession, we operate and maintain a 750 km road from the San Juan de Marcona port to Urcos, Peru, which is connected to an interoceanic road that runs up to thePeruvian-Brazilian border. The road has five toll stations and three weigh stations. The concession was awarded to Survial in 2007 for a25-year term. We own 99.9% of Survial. The following map shows the location of the road in Peru.
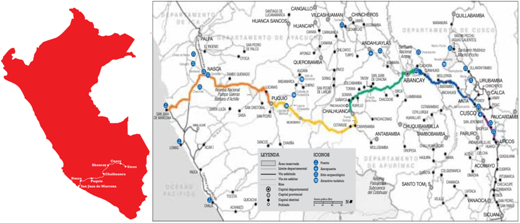
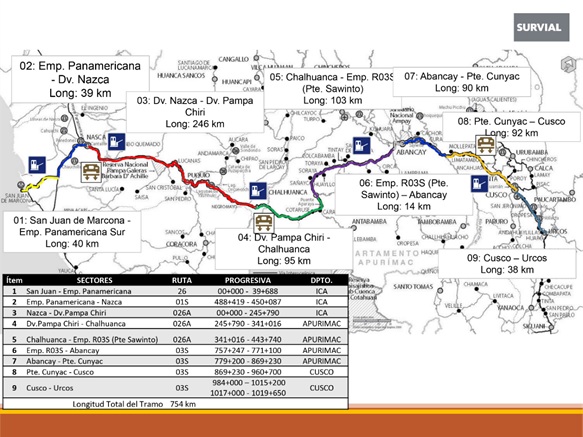
Our obligations under the concession include the construction of the road, which was completed in 2010.
Our revenue from this concession consists of an annual fee paid to Survial by the Peruvian Ministry of Transport and Communications in consideration for the operation and maintenance of the road, which fee can vary depending on the amount of maintenance required due to road damages. In 2016, 20172018, 2019 and 20182020, the fee amounted to US$8.18.4 million (S/.27.228.3 million), US$28.49.8 million (S/.92.232.4 million) and US$8.416.2 million (S/.28.358.6 million), respectively. Our revenue in this concession does not depend on traffic volume.
Additional revenues of the concession are generated from the execution of additional works, work we perform as a result of catastrophic events and emergency maintenance. These revenues are billed when approval is received from the grantor and/or the regulator of the work in progress. In 2016, 20172018, 2019 and 2018,2020, the additional revenues amounted to US$15.9 million (S/53.8 million), US$2.0 million (S/6.6 million) and US$0.6 million (S/.2.2 million), US$0.04 million (S/.0.1 million) and US$15.8 million (S/.53.62.1 million), respectively.
Canchaque
Under our Canchaque concession, we operate and maintain a 78 km road from the towns of Buenos Aires to Canchaque, in Peru. The road has one toll station. The concession was awarded to Canchaque in 2006 for a15- year term. We own 99.9%99.96% of Canchaque. Our obligations under the concession include the construction of the road, which was completed in 2009. Our revenue from this concession consists of an annual fee paid by the Peruvian Ministry of Transport and Communications in consideration for the operation and maintenance of the road, which fee can vary depending on the amount of road maintenance required due to road wear and tear. In 2016, 20172018, 2019 and 2018,2020, the fee amounted to US$2.57.8 million (S/.8.426.2 million), US$5.12.7 million (S/.16.58.8 million) and US$7.71.6 million (S/.26.15.6 million), respectively. Our revenue in this concession does not depend on traffic volume.
The significant variation in 2018 was due to an additional disbursement by the Ministry of Transport and Communications of US$5.4 million for maintenance.
Additional revenues of the concession are generated from the execution of additional works, work we perform as a result of catastrophic events and emergency maintenance. These revenues are billed when approval is received from the grantor and/or the regulator of the work in progress. In 2016, 20172018, 2019 and 2018,2020, the additional revenues amounted to US$0.091.8 million (S/.0.306.0 million), US$0.321.1 million (S/.1.03.7 million) and US$1.70.4 million (S/.6.01.6 million), respectively.
Additional Toll Road Projects
We continuously evaluate infrastructure projects and strategically present public-private partnership proposals and participate in bidding processes for road concessions. In 2012 we were awarded, and in 2013 we signed the contract for, a40-year concession for the 4.6 km Vía Expresa Sur, one of the main roads in Lima, which crosses the city from north to south. The road willis intended to connect downtown Lima to Panamericana Sur, a highway that runs from Ecuador to Chile. Our estimate of the total investment under the concession, as submitted in our bid, iswas approximately US$200 million (S/.672672 million). Such investment willis intended to be made during the construction phase, which was originally to be completed in 2018. Our revenue willwould derive from the collection of a toll fee upon completion of the construction. The concession iswas expected to generate a minimum annual revenue of US$18 million (S/.60.560.5 million) during the first two years of the concession term, US$19.6 million (S/.65.965.9 million) for the third year. If in a particular year, our annual revenue iswould be lower than the minimum guaranteed, we expect the government towould compensate us for the difference, up to an amount not to exceed US$10 million (S/.33.633.6 million). The beginning of the construction phase isremains subject to expropriation by the government of the land necessary for the construction of the road. Moreover, in
In June of 2017, we signed Initial and Additional Acts of Suspension of the Concession with the Municipality of Lima to freeze the responsibilities of the government, on the one hand, and the concessionaire, on the other hand, with respect to the concession until June 2019.concession. The concessionaire continues to act as custodian of certain assets of which it had taken possession and continues to maintain certain performance guaranties in connection with the concession. The government and the concessionaire havehad agreed to meet and coordinate aspects of the project, with the goal of resuming operations. However, with respect to the concession for Via Expresa Sur, we recently received a letter from the Municipality of Lima in which the Municipality communicated its desire to cease discussions to relaunch the project.project, and the suspension of the contract’s term has been extended until June 30, 2021. We cannot assure you that this concession contract will be resumed.
A joint operation in which we have a 50% interest has been awarded, and is in the process of negotiating the terms for, a37-year concession for Via Expresa Javier Prado, a 20 km toll road that crosses Lima from east to west, traversing through eight districts. According to estimates from the Municipality of Lima, the total investment in the concession is expected to amount to approximately US$700 million (S/.2,352 million). Such investment will be made during the construction phase which is expected to take between five to seven years. Our revenue will derive from the collection of a toll fee upon completion of the construction. This concession was awarded to the joint operation at the end of the 1990s and negotiations were discontinued but were resumed in 2012. A project contract was approved by the City of Lima’s Council in November 2013 and was submitted to the Peruvian Ministry of Economy and Finance, which requested additional studies prior to approving the project. Subsequently, on July 26, 2017, the Municipality of Lima signed an agreement that annulled the granting of the concession. Our company has initiated legal action in Peru against such decision, and the Municipality of Lima responded, but a decision remains pending. A preliminary injunction is pending that would prevent the Municipality of Lima from granting the concession to another party. We cannot assure you that our position in these proceedings will prevail, nor can we assure you if or when the concession contracts will be agreed or whether the contractual terms will be favorable to us.
These projects are not included in our backlog. See “Item 3.D. Key Information—Risk Factors—Risks Related to our Infrastructure Business.”
Mass Transit
In 2011, we were awarded a30-year concession for the operation of Line One of the Lima Metro, Peru’s only urban railway system. The concession was awarded to our subsidiary GyM Ferrovías,Línea 1, in which we hold a 75% ownership interest, with the other 25% being held by Ferrovías S.A.C. Our obligations under the contract include: (i) the operation and maintenance of the five trains provided by the government; (ii) the acquisition of 19 new trains on behalf of the Peruvian government, which will be the legal owner of such trains; (iii) the operation and maintenance of the 19 new trains (24 trains in the aggregate); and (iv) the design and construction of the railway maintenance and repair yard, which was built by our E&C segment. We currently have all 24 trains (including two backup trains) in operation. The construction of the second stretch of Line One was completed in July 2014, and started operations on July 25, 2014.
We entered into the fourth addendum to the Lima Metro concession contract on July 11, 2016, in order to expand the transportation capacity of Line One. In accordance with the fourth addendum, the expansion project involves: (i) the purchase of 20 new trains withfive-car from Alstom; (ii) the purchase of 39 new cars from Alstom, to be coupled with the 19 existing Alstom trains and the 20 new Alstom trains, resulting in a consolidated fleet of 39 Alstom trains with asix-car configuration; and (iii) the expansion and improvement of the existing infrastructure, including revamping and improvement of five stations, improvements in the electrical systems, a new access route to the maintenance workshop and new switches on the main track. The construction of the expansion of the infrastructure will bewas carried out by our E&C segment and it is scheduled to be completed by the end of 2018, with the additional trains and rail cars to be delivered by the end of 2019.
As compensation for the investments of the expansion project, we are entitled to receive from the Ministry of Transportation and Communication, an advance payment of 30% of each investment component as well as the balance of 70% of each investment component compensated through an annual payment for complementary investments (pago annual por inversiones complementarias), which represents the unconditional and irrevocable right to receive a series of 56 quarterly payments from the Ministry of Transportation and Communication. In 2016 we received the advance payment of the trains and cars, and in the third quarter of 2017 we received the advance payment corresponding to the infrastructure expansion.
The construction of the first and second stretches of Line One was carried out by our E&C segment. The operation and maintenance of the trains is carried out by our subsidiary Concar. The map below shows the route of Line One.

As of December 31, 2018, GyM Ferrovías2020, Línea 1 had spent a total of S/.8.332.2 million (US$2.58.9 million) in capital expenditures in connection with the Lima Metro.
Our revenue from this concession consists of a quarterly fee that we receive from the Ministry of Transport and Communications based on the kilometers travelled per train and adjusted for inflation, with the fee per kilometer, the number of trains required to be in operation and the number of kilometers that we are required to travel established by the terms of the concession. Our revenues do not depend on passenger traffic volume.
As of April 8, 2019,December 31, 2020, we operated 44 trains (including four backup trains), which we expect to enable us to travel 4,811,779.65 kilometers per year. The average frequency of the trains is 3 to 610 minutes, depending on the schedule and the fee per kilometer traveledtravelled is, for our original 24 trains, S/.81.43,83.96, and for our 20 newer trains, S/.53.19.54.84.
Pursuant to the concession, we must comply with certain requirements in the operation of the trains. According to the concession, at least 95% of our trains must be running and available for use and not less than 85% of our trains that are available for use must arrive to destination on scheduled time. The table below shows our monthly average results during 2018.

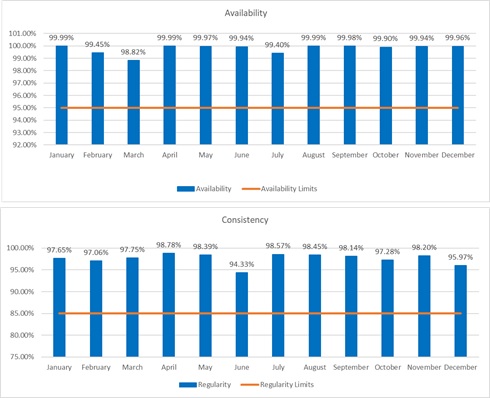
Water Treatment
In 2010, we were awarded a25-year concession for the construction, operation and maintenance of La Chira waste water treatment plant in the south of Lima. The project is aimed at addressing Lima’s environmental problems caused by sewage discharged directly into the sea. We hold a 50% share in this concession and our partner Acciona Agua holds the remaining 50%. The plant began operations in June 2016.
La Chira’s total investment in the concession was S/.250250 million (US$74.4 million). La Chira is entitled to collect (i) an annual payment for the investment made in the construction of the project for an amount of S/.24.224.2 million (approximately US$7.1 million), and (ii) and annual payment for the operation and maintenance of the project for an amount of S/.6.86.8 million. These fees are paid by Sedapal S.A., the public utility company responsible for the supervision of the water service in Lima, for a period of 25 years. We funded our construction costs related to La Chira through the sale of government certificates to financial institutions, and, as a result, will not receive future cash flows from item (i). See “Item 5.A. Operating and Financial Review and Prospects—Operating Results—Factors Affecting Our Results of Operations—Infrastructure.” A joint operation in which our E&C segment participates is undertaking the construction of the waste water treatment plant.
Energy
We currently operate three energy businesses within our Infrastructure segment: Exploration and Production; Natural Gas; and Transport and Distribution. We operate and extract oil from four onshore fields (Block I, Block III, Block IV and Block V) located in the provinces of Talara and Paita in northern Peru. We have two long-term hydrocarbon extraction service contracts with Perupetro, the Peruvian entity responsible for the administration and supervision of all exploration and production contracts in Peru, under which we operate two oil producing fields, Blocks I and V. In addition, we have two long-term license contracts with Perupetro, a state-owned oil and gas company, for two other blocks, Block III and IV, which started operations in April 2015; oil production from these blocks is sold to Petroperú. During 2018,2020, the oil production of our four blocks was approximately 3,6543,517 bbl per day. We also own and operate a natural gas processing plant located in northern Peru, which processes and fractions natural gas liquids and delivers dry gas to agas-fired power generation company under a long-term processing and fractionation agreement. In addition, we are a 50% partner in two consortiums named Consorcio Terminales (CT) and Terminales del Peru (TP) both ofPerú, a consortium which havehas a contract with Petroperú, to operate and maintain tenfive fuel storage terminals.terminals until 2034.
In addition, we are a 50% partner in Oil Tanking Andina Services S.A.C. (“OTAS”). This subsidiary operates a fuel terminal named Terminal Marino Pisco Camisea under a contract subscribed with Pluspetrol to operate an export terminal for gasoline, diesel, propane and butane.
Additionally, through OTAS, we are also a 25% partner in Logística Químicos del Sur S.A. (“LQS”), which operates the Terminal de Químicos de Matarani and which dispatched 53,656 tonnes of sodium hydrosulfide for international mining companies in 2018.
The table below sets forth selected financial information relating to our Energy line of business.
| | | | For the year ended December 31, | | | For the year ended December 31, | |
| | | 2016 | | 2017 | | 2018 | | 2018 | | | 2018 | | 2019 | | 2020 | | 2020 | |
| | | (in millions of S/.) | | (in millions of
US$)(1) | | | (in millions of S/) | | (in millions of US$)(1) | |
Revenues | | | 382.2 | | | 436.9 | | | 560.5 | | | 165.9 | | | | 560.5 | | | | 552.6 | | | | 369.8 | | | | 102.0 | |
Net Profit | | | 12.0 | | | 38.1 | | | 65.0 | | | 19.2 | | | | 65.0 | | | | 52.8 | | | | 12.6 | | | | 3.4 | |
EBITDA | | | 99.5 | | | 142.1 | | | 178.9 | | | 52.9 | | | | 178.9 | | | | 180.8 | | | | 109.4 | | | | 30.2 | |
EBITDA margin | | | 26.0 | % | | 32.5 | % | | 31.9 | % | | 31.9 | % | | | 31.9 | % | | | 32.7 | % | | | 29.6 | % | | | 29.6 | % |
| (1) | Calculated based on an exchange rate of S/.3.3793.624 to US$1.00 as of December 31, 2018.2020. |
The pie charts below set forth the breakdown of our revenues and EBITDA from our Energy line of business for 2018.2020.
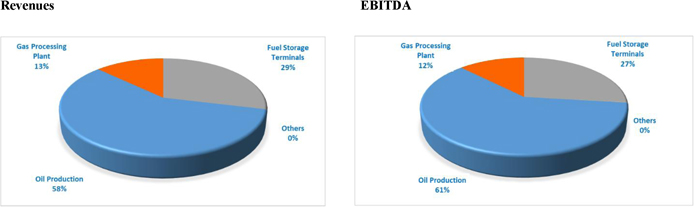
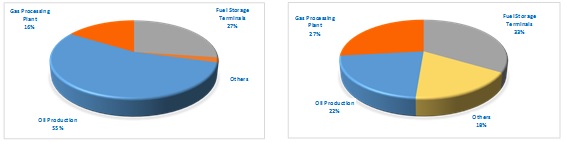
Oil and Gas Production
We operate and extract oil from four mature fields (Blocks I, III, IV and V) located in the provinces of Talara and Paita in northern Peru. Two of these fields, Blocks I and V, are operated under long-term service contracts under which we provide hydrocarbon extraction services to Perupetro. Hydrocarbons extracted from these two blocks belong to Perupetro, which in turn pays us, once a month, a variable fee per barrel of extracted hydrocarbons. This extraction fee is based on a basket of international crude prices and the level of production. The other two fields, Blocks III and IV, are operated under long-term license contracts with Perupetro. The hydrocarbons extracted are owned by our subsidiary GMP,UNNA Energía, which in turn pays royalties, on a fortnightly basis, to Perupetro, based on
the average prices of three international crude oil prices: Fortis, Suez Blend and Oman Blend crudes. Our activities are focused on proved reserves development and production and are conducted in mature oil fields, which have been producing oil for over 100 years in the case of Block I, approximately 96over 95 years in the case of Block III, approximatelyover 95 years in the case of Block IV, and over 50 years in the case of Block V. We believe our activities in these fields bear limited exploration risk.
The following table shows selected information about our fields.
| Property | | Basin | | | GMP’s
Ownership | | Expiration | | | Developed
Acres | | | Undeveloped
Acres | | | Basin | | | UNNA
Energía’s
Ownership | | Expiration | | | Developed
Acres | | | Undeveloped
Acres | |
Block I | | | Talara | | | | 100 | % | | 2021 | | | | 25,154 | | | | 4,110 | | | | Talara | | | | 100 | % | | | 2021 | | | | 25,154 | | | | 4,110 | |
Block III | | | Talara | | | | 100 | % | | 2045 | | | | 7,475 | | | | 80,986 | | | | Talara | | | | 100 | % | | | 2045 | | | | 7,475 | | | | 80,986 | |
Block IV | | | Talara | | | | 100 | % | | 2045 | | | | 8,400 | | | | 64,550 | | | | Talara | | | | 100 | % | | | 2045 | | | | 10,240 | | | | 47,776 | |
Block V | | | Talara | | | | 100 | % | | 2023 | | | | 6,320 | | | | 2,220 | | | | Talara | | | | 100 | % | | | 2023 | | | | 6,320 | | | | 2,220 | |
Block I:
We operate and extract oil and natural gas from Block I under a20-year hydrocarbon extraction service contract with Perupetro, which was extended for an additional10-year term and expires in December 2021. Average daily production during 20182020 was 720600 barrels of crude oil. We operate 212205 wells using various oil extraction systems and operate a network of production batteries and pipelines to collect, measure and deliver oil in fiscalization point close to the Talara refinery. The field is located in the province of Talara, department of Piura, in northern Peru, approximately five miles from the Talara refinery, the second largest refinery in the country. Block I is the oldest oil producing field in Peru and has been producing oil since around 1890. Perupetro has announced that they will hold a tender for the operation of Block I during the second quarter of 2021, and we have initiated contact with Perupetro to participate in the public bid to maintain this block under operation. We cannot assure you that we will maintain these operations after the expiration of the contract, on similar terms or at all.
Block III:
We operate and extract oil and natural gas from Block III under a30-year license agreement with Perupetro, which expires in April 2045. Average daily production during 20182020 was 756678 barrels of crude oil. We operate 166151 wells using various oil extraction systems and operate a network of production batteries and pipelines to collect, measure and deliver oil in a fiscalization point close to the Talara refinery, which purchases the oil according to a contract based on an average price of three international crude oil prices: Fortis Blend, Suez Blend and Oman crudes, as adjusted by certain factors. The field is located between the provinces of Talara and Paita, department of Piura, in northern Peru, approximately 21 miles from the Talara refinery.
Block IV:
We operate and extract oil and natural gas from Block IV under a30-year license agreement with Perupetro, which expires in April 2045. Average daily production during 20182020 was 2,0692,146 barrels of crude oil. We operate 284333 wells using various oil extraction systems and operate a network of production batteries and two pipelines to collect, measure and deliver oil in a fiscalization point close to the Talara refinery, which purchases the oil according to a contract based on an average price of three international crude oil prices: Fortis Blend, Suez Blend and Oman crudes, adjusted for costs related to hydrocarbon transportation. The field is located in the province of Talara, department of Piura, in northern Peru, approximately 21 miles from the Talara refinery.
Block V:
We operate and extract oil and natural gas from Block V under a20-year hydrocarbon extraction service contract with Perupetro, which was extended for an additional10-year term and expires in October 2023. Average daily production during 20182020 in this field was 10994 barrels of crude oil. We operate 4134 wells in this field using various oil extraction systems. The Block V field is located in the province of Los Órganos, department of Piura, Peru, close to the border with Ecuador. Block V has been producing oil since the 1950s. We cannot assure you that we will maintain these operations after the expiration of the contracts, on similar terms or at all.
The map below shows the geographic location of our oil producing blocks in northern Peru.
��
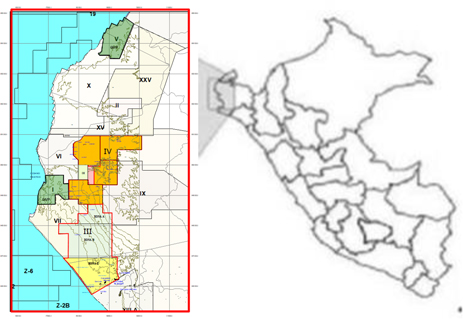
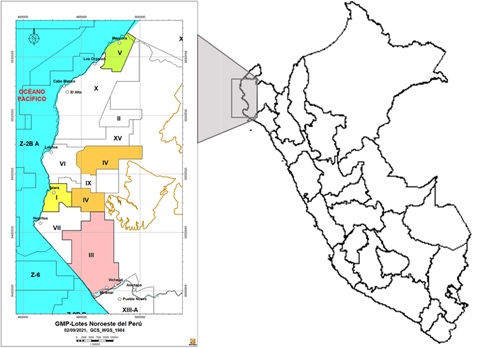
For Block I and Block V, we are entitled to a variable fee paid by Perupetro, which is based on the level of production of each field and a price formula that is based on an average price of three international crude oil prices: Fortis blend, Suez blend and Oman crudes, and a discount over this price of approximately of 72% per barrel. For Block III and Block IV, we pay royalties to Perupetro based on an average price of three international crude oil prices: Fortis blend, Suez blend and Oman crudes. The royalties paid to Perupetro were US$18.79 per barrel during 2017 and US$23.17 per barrel during 2018.2018, US$21.13 per barrel during 2019 and US$9.75 per barrel during 2020.
During 2016, 20172018, 2019 and 2018,2020, we received an average revenue (for all blocks) of US$38.55,52.38, US$49.1953.90 and US$52.38,38.06, respectively, per barrel of extracted oil, which was equivalent to approximately 88.52%73.72%, 91.84%86.11% and 73.72%91.29%, respectively, of average Brent crude oil prices in the same years. We are not committed to provide a fixed volume of oil or natural gas under our four contracts.
We produce natural gas as a byproduct of the production of crude oil (an average of 6,1966.37 MMcf per day during 2018)2020). In Block I, we provide natural gas to ENEL (formerly EEPSA) under a “take or pay” contract (an average of 5,3323.00 MMcf per day during 2018)2020), and we pay to Perupetro a fee which varies depending on market conditions. The additional volume of natural gas extracted is sent to our Pariñas plant to be processed and commercialized as liquid natural gas. In Block V, we reinject the natural gas produced back into the wells. In Block III, we use part of the produced gas as fuel to operate wells equipment (pumping units) and we are looking for a market to sell the excess. In Block IV, we also use a certain volume of gas as fuel, and the residual volume since November 2019 is burnt.also sent to our Pariñas plant to be processed and commercialized as liquid natural gas. Our revenues for the sale of natural gas are not material relative to our oil production revenues.
Estimated Proved Reserves:
The following table sets forth estimated proved crude oil and natural gas reserves in Blocks I, III, IV and V as of December 31, 2018.2020. We have only included estimates of proved and have not included any estimates of probable and possible reserves.
| | | | | | | | | | | | |
| | | Crude Oil
(Mbbl) | | | Natural Gas
(MMcf) | | | Crude Oil
Equivalents
(MBoe) | |
Block I: | | | | | | | | | | | | |
Proved developed producing | | | 722 | | | | 7,761 | | | | 2,101 | |
Proved developed non—producing | | | — | | | | — | | | | — | |
Proved undeveloped | | | — | | | | — | | | | — | |
Total proved reserves | | | 722 | | | | 7,761 | | | | 2,101 | |
Block III: | | | | | | | | | | | | |
Proved developed producing | | | 2,519 | | | | — | | | | 2,519 | |
Proved developed non—producing | | | 22 | | | | — | | | | 22 | |
Proved undeveloped | | | 11,795 | | | | — | | | | 11,795 | |
Total proved reserves | | | 14,337 | | | | — | | | | 14,337 | |
Block IV: | | | | | | | | | | | | |
Proved developed producing | | | 6,365 | | | | 12,008 | | | | 8,499 | |
| | | | Crude Oil
(Mbbl) | | | Natural Gas
(MMcf) | | | Crude Oil
Equivalents
(MBoe) | | | Crude Oil
(Mbbl) | | | Natural Gas
(MMcf) | | | Crude Oil
Equivalents
(MBoe) | |
Block I: | | | | | | | |
Proved developed producing | | | | 200.1 | | | | 1,895.5 | | | | 537.1 | |
Proved developed non—producing | | | | — | | | | — | | | | — | |
Proved undeveloped | | | | — | | | | — | | | | — | |
Total proved reserves | | | | 200.1 | | | | 1,895.5 | | | | 537.1 | |
Block III: | | | | | | | |
Proved developed producing | | | | 2,306.3 | | | | 5,816.6 | | | | 3,340.4 | |
Proved developed non—producing | | | | 25.3 | | | | 31.0 | | | | 30.8 | |
Proved undeveloped | | | | 9,431.2 | | | | 25,163.0 | | | | 13,904.6 | |
Total proved reserves | | | | 11,762.8 | | | | 31,010.7 | | | | 17,275.8 | |
Block IV: | | | | | | | |
Proved developed producing | | | | 6,361.0 | | | | 10,189.9 | | | | 8,172.5 | |
Proved developed non—producing | | | 70 | | | | 71 | | | | 82 | | | | 320.9 | | | | 596.0 | | | | 426.8 | |
Proved undeveloped | | | 5,787 | | | | 13,767 | | | | 8,234 | | | | 6,500.1 | | | | 12,723.7 | | | | 8,762.1 | |
Total proved reserves | | | 12,221 | | | | 25,845 | | | | 16,815 | | | | 13,182.0 | | | | 23,509.7 | | | | 17,361.5 | |
Block V: | | | | | | | | | | | | |
Proved developed producing | | | 213 | | | | — | | | | 213 | | | | 100.1 | | | | — | | | | 100.1 | |
Proved developed non—producing | | | — | | | | — | | | | — | | | | — | | | | — | | | |
Proved undeveloped | | | — | | | | — | | | | — | | | | — | | | | — | | | |
Total proved reserves | | | 213 | | | | — | | | | 213 | | | | 100.1 | | | | — | | | | 100.1 | |
Total: | | | | | | | | | | | | |
Proved developed producing | | | 9,820 | | | | 19,768 | | | | 13,333 | | | | 8.967.5 | | | | 17,902.1 | | | | 12,150.1 | |
Proved developed non—producing | | | 92 | | | | 71 | | | | 105 | | | | 346.2 | | | | 627.0 | | | | 457.6 | |
Proved undeveloped | | | 17,582 | | | | 13,767 | | | | 20,029 | | | | 15,931.3 | | | | 37,886.7 | | | | 22,666.8 | |
Total proved reserves | | | 27,494 | | | | 33,606 | | | | 33,467 | | | | 25,245.0 | | | | 56,415.8 | | | | 35,274.5 | |
Proved reserves are those quantities of oil and natural gas which, by analysis of geosciences and engineering data, can be estimated with reasonable certainty to be economically producible from a given date forward, from known reservoirs, and under existing economic conditions, operating methods, and government regulations. The term “reasonable certainty” implies a high degree of confidence that the quantities of oil and/or natural gas actually recovered will equal or exceed the estimate. To achieve reasonable certainty, we employed methodologies that have been demonstrated to yield results with consistency and repeatability. The methodologies and economic data used in the estimation of the proved reserves in the fields include, but are not limited to, well logs, geologic maps and available down hole and production data, seismic data, and well test data.
Reserve amounts were based on the12-month unweighted arithmetic average of thefirst-day-of-the-month Brent crude price for each month in the period January through December 2018,2020, which, pursuant to our contractual agreements, resulted in average oil and gas prices of US$69.6938.06 per barrel and US$3.733.27 MMcf, respectively, that for the purpose of reserve amount estimation were assumed to remain constant.
Proved undeveloped reserves in the fields as of December 31, 20182020 were 20,029 MBoe,22,666.8. Mboe, consisting of 17,58215,931.3 MBbl of crude oil and 2,4476,735.4 Mboe (13,767(37,886.7 MMcf) of natural gas. We estimate that during 20182020, proved undeveloped reserves increased by 1,3292,127.8 Mboe of crude oil, as a result of the reclassification of certain natural gas from contingent resources to proved developed and undeveloped reserves as a result of the natural gas supply contract that UNNA Energía signed with Gasnorp Company in January 2020 in respect of Block III.
In 2020, approximately 1,663878.7 Mboe of proved undeveloped reserves of crude oil were converted into proved developed reserves, and an additional 817 Mboeconsisting of 615.94 MBbl of crude oil and 262.73 Mboe (1,477.85 MMcf) of probable and possible reserves were converted into proved developed reserves. natural gas.
Capital expenditures made during 2018,2020, for both drilling activities and workovers, to convert undeveloped reserves to proved developed reserves, amounted to approximately US$21.412.4 million (S/.72.344.9 million).
The principal changes in proved undeveloped reserves during 20182020 were:
Crude oil reserves: provedProved undeveloped crude oil reserves decreased 2502,369.5 Mbbl during 2018,2020, as follows:
an increasea result of 1,189a decrease in the price of oil per barrel and a decrease of 615.9 MBbl that were converted to proved developed due to a drilling campaign in Block IVIV;
In Block III, 31,010.7 MMcf associated natural gas has been reclassified from contingent resources to proved developed and undeveloped reserves as a decreaseresult of 194 MBbl due to the natural gas supply contract that UNNA Energía revision of type curvesigned with Gasnorp Company in Block III;January 2020; and
a decrease of 1,246 MBblProved developed reserves decreased in 1,291 Mbbls due to proved undevelopeda mistake in the prior year reserves that were converted into proved developed reservesestimation in Block IV.
Associated natural gas reserves increased 4,594 Mboe (25,845 MMcf) during 2018, as follows:
recategorized from resources to reserves due to the development of a project to transport gas from Block IV to our gas processing plant, which remains in progress: 12,078 MMcf as proved developed and 13,767 MMcf as proved undeveloped reserves.V.
For changes in proved developed and undeveloped reserves from December 31, 20172019 to December 31, 2018,2020, see supplementary data (unaudited) annexed to our audited annual consolidated financial statements included in this annual report.
Qualifications of Technical Persons and Internal Controls Over Reserves Estimation Process:
The reserves estimates shown in this annual report have been prepared internally by our engineers in accordance with the definitions and guidelines of the SEC. Our reserves are estimated at the property level and compiled by our engineering staff. Our engineering staff interacts with our internal staff of operations engineers and geoscience professionals and with accounting employees to obtain the necessary data for the reserves estimation process. Our reservoir engineers and geoscience professionals have worked to ensure the integrity, accuracy and timeliness of the data, methods and assumptions used in the preparation of the reserves estimates. Mr. Luis Huaranga and Javier Portuguez areis our Reservoir Engineers.Engineer. The reserves estimate report was submitted to our Committee of Reserves, which is formed by Mr. Anthony Alfaro (Exploration and Production Manager), Mr. Iván Miranda (Exploration and Production Technical Manager), Mr. Jose Pisconte Lomas (Chief of Geology), and Mr. Manuel Gomez (Chief of Reservoir Engineering). Mr. Huaranga holds a Petroleum Engineering degree from Universidad Nacional de Ingeniería in Lima, Peru and has 22 years of experience, developed as a reservoir engineer at Pluspetrol, Petrobras, and Repsol. He has been working for GMP since September 2016. Mr. Portuguez holds a Petroleum Engineering degree from Universidad Nacional de Ingeniería in Lima, Peru and has 2527 years of experience, developed as a production and reservoir engineer at Mercantile and Interoil Peru. Mr. Gomez holds a Petroleum Engineering degree from Universidad Nacional de Ingeniería in Lima, Peru and has 1113 years of experience, most of it as drilling, completion, stimulation, and reservoir engineer. Mr. Pisconte Lomas, holds a Geologist Engineering degree and a Regional Geology Master’s degree from Universidad Nacional Mayor de San Marcos and has 2628 years of experience in the oil industry. Mr. Miranda holds a degree in Petroleum Engineering from Universidad Nacional de Ingeniería in Lima and a Petroleum Engineering Master’s degree from Texas A&M University of Texas—USA, and has 3436 years of experience in the oil industry developed at Petroperu,Petroperú, Unipetro ABC, and GMP. Mr. Alfaro holds a Petroleum Engineering degree from Universidad Nacional de Ingeniería in Lima, Peru, Master´s degree in Business Administration from Universidad Rafael Belloso Chacin in Maracaibo, Venezuela, a Master´s degree in Projects Management an Administration from Universidad de Ciencias Aplicadas in Lima, Peru and has 29 years of experience developed at Petroperu, Perez Companc Peru and Argentina, Petrobras Venezuela and Peru, Grupo Synergy E&P Ecuador, and GMP.UNNA Energía.
Production, Revenues, Prices and Costs:
The following table sets forth information regarding our production, revenues, prices and production costs for 2016, 20172018, 2019 and 2018.2020.
| | | | For the year ended December 31, | | | For the year ended December 31, | |
| | | 2016 | | | 2017 | | | 2018 | | | 2018 | | | 2019 | | | 2020 | |
Production volumes(1): | | | | | | | |
Production volumes(1): | | | | | | | |
Crude oil (Mbbl) | | | | | | | | | | | | |
Block I | | | 381.3 | | | | 310.9 | | | | 262.8 | | | | 262.8 | | | | 236.3 | | | | 219.6 | |
Block III | | | 347.7 | | | | 267.8 | | | | 275.8 | | | | 275.8 | | | | 264.3 | | | | 247.7 | |
Block IV | | | 232.7 | | | | 530.9 | | | | 755.9 | | | | 755.9 | | | | 946.8 | | | | 785.4 | |
Block V | | | 46.9 | | | | 3.2 | | | | 39.9 | | | | 39.9 | | | | 38.4 | | | | 34.6 | |
| | | | | | | | | | | | | | | | | | |
Total (crude oil Mbbl) | | | 1,008.60 | | | | 1,145.8 | | | | 1334.4 | | | | 1,334.4 | | | | 1,485.8 | | | | 1,287.4 | |
Natural gas (MMcf) | | | | | | | | | | | | |
Block I | | | 2,025.8 | | | | 2,979.0 | | | | 2,228.8 | | |
Block III | | | | | — | | | | — | | |
Block IV | | | | | — | | | | — | | |
Block V | | | | | — | | | | — | | |
| | | | | | | | | | |
Total (natural gas MMcf) | | | 2,025.8 | | | | 2,979.0 | | | | 2,228.8 | | |
Crude oil equivalents (Mboe) | | | 360.1 | | | | 529.5 | | | | 396.2 | | |
| | | | | | | | | | |
Total Company | | | 1,368.7 | | | | 1,675.3 | | | | 1,730.6 | | |
Average sales prices(2): | | | | | | | |
Crude oil (US$/bbl) | | | 38.48 | | | | 49.81 | | | | 64.72 | | |
Natural Gas (US$/Mcf) | | | 1.53 | | | | 4.07 | | | | 4.52 | | |
Crude oil equivalents (US$/boe) | | | 30.62 | | | | 41.95 | | | | 55.64 | | |
Costs and expenses(2): | | | | | | | |
Production expenses (US$/boe) | | | 10.08 | | | | 17.35 | | | | 18.11 | | |
Royalties (US$/boe) | | | 5.4 | | | | 9.27 | | | | 17.80 | | |
General and administrative expenses (US$/boe) | | | 2.09 | | | | 2.02 | | | | 2.37 | | |
Depreciation, depletion, amortization and accretion expenses (US$/boe) | | | 12.58 | | | | 8.99 | | | | 10.19 | | |
| | | | | | | | | | | | |
Block I | | | 2,228.8 | | | | 1770.7 | | | | 1,337.3 | |
Block III | | | — | | | | — | | | | | |
Block IV | | | — | | | | — | | | | 202.8 | |
| | | | | | | | | | | | |
Block V | | | — | | | | — | | | | | |
| | | | | | | | | | | | |
Total (natural gas MMcf) | | | 2,228.8 | | | | 1,770.7 | | | | 1,540.2 | |
Crude oil equivalents (Mboe) | | | 396.2 | | | | 314.8 | | | | 273.8 | |
| | | | | | | | | | | | |
Total Company | | | 1,730.6 | | | | 1,800.6 | | | | 1,561.2 | |
Average sales prices(2): | | | | | | | | | | | | |
Crude oil (US$/bbl) | | | 64.72 | | | | 61.19 | | | | 38.06 | |
Natural Gas (US$/Mcf) | | | 4.52 | | | | 4.29 | | | | 3.27 | |
Crude oil equivalents (US$/boe) | | | 55.64 | | | | 53.90 | | | | 31.79 | |
Costs and expenses(2): | | | | | | | | | | | | |
Production expenses (US$/boe) | | | 18.11 | | | | 17.66 | | | | 14.43 | |
Royalties (US$/boe) | | | 17.80 | | | | 16.99 | | | | 7.12 | |
General and administrative expenses (US$/boe) | | | 2.37 | | | | 2.69 | | | | 2.19 | |
Depreciation, depletion, amortization and accretion expenses (US$/boe) | | | 10.19 | | | | 10.47 | | | | 8.61 | |
| (1) | Hydrocarbons extracted from Blocks I and V belong to Perupetro, which in turns pays us a per barrel fee for extracted hydrocarbons. Hydrocarbons extracted from Blocks III and IV belong to GMP,UNNA Energía, which in turn pays Perupetro a royalty as perto Perupetro for the amount of extracted hydrocarbons. |
| (2) | Crude oil sales volume differs from total production volume due to operational circumstances such as the inventory of product stored in our field batteries at the end of each monthly measurement. “Average sales prices” refers to the fees received in consideration for our extraction services, which do not equal the sales prices of crude oil. Average sales prices have been calculated using a basket price formula according to the service and license contracts of each block. Such formulation is at a discount to global oil prices for Blocks I and V, and for Blocks III and IV we pay royalties on the oil extracted. Per unit costs have been calculated using sales volumes. |
Acreage, Productive and Development Wells, Drilling:
The following table sets forth certain information regarding the total developed and undeveloped acreage as of December 31, 2018.2020.
| Formation | | Developed Acreage | | | Undeveloped Acreage | | | Developed Acreage | | | Undeveloped Acreage | |
Block I | | | | | | | | |
Pariñas | | | 2,271 | | | | 70 | | | | 2,271 | | | | 70 | |
Mogollón | | | 2,583 | | | | 320 | | | | 2,583 | | | | 320 | |
Basal Salina | | | 1,850 | | | | 100 | | | | 1,850 | | | | 100 | |
Mesa | | | 1,485 | | | | 1,650 | | | | 1,485 | | | | 1,650 | |
| | | | | | | | | | | | |
Total Block I | | | 8,189 | | | | 2,140 | | | | 8,189 | | | | 2,140 | |
Block III | | | | | | | | |
Salina Mogollón | | | 7,475 | | | | 3,983 | | | | 7,475 | | | | 3,983 | |
Amotape | | | 1,750 | | | | 2,370 | | | | 1,750 | | | | 2,370 | |
| | | | | | | | | | | | |
Total Block III | | | 9,225 | | | | 6,353 | | | | 9,225 | | | | 6,353 | |
Block IV | | | | | | | | |
Pariñas | | | 4,155 | | | | 3,402 | | | | 4,155 | | | | 3,402 | |
Palegreda | | | 5,292 | | | | 3,951 | | | | 7,251 | | | | 2,835 | |
Mogollón | | | 1,470 | | | | 2,606 | | | | 1,490 | | | | 2,586 | |
| | | | | | | | | | | | |
Total Block IV | | | 10,917 | | | | 9,959 | | | | 12,896 | | | | 8,823 | |
Block V | | | | | | | | |
Verdún | | | 530 | | | | 650 | | | | 530 | | | | 650 | |
Ostrea | | | 175 | | | | 115 | | | | 175 | | | | 115 | |
Mogollón | | | 1,350 | | | | 120 | | | | 1,350 | | | | 120 | |
| | | | | | | | | | | | |
Total Block V | | | 2,055 | | | | 885 | | | | 2,055 | | | | 885 | |
| | | | | | | | | | | | |
Total | | | 30,386 | | | | 19,337 | | | | 30,386 | | | | 19,337 | |
As of December 31, 2018,2020, we had a total of 703723 producing wells. Our wells are oil wells, many of which also produce natural gas. We do not have interests in wells that only produce natural gasgas. The following table shows the number of development and exploratory wells drilled during 2016, 20172018, 2019 and 20182020 in Blocks I, III, IV and V.
| | | | For the year ended December 31, | | | For the year ended December 31, | |
| | | 2016 | | | 2017 | | | 2018 | | | 2018 | | | 2019 | | | 2020 | |
Development Wells | | | | | | | | | | | | |
Productive | | | 11 | | | | 22 | | | | 33 | | | | 33 | | | | 33 | | | | 18 | |
Dry | | | — | | | | — | | | | — | | | | — | | | | — | | | | — | |
| | | | | | | | | | | | | | | | | | |
Total | | | 11 | | | | 22 | | | | 33 | | | | 33 | | | | 33 | | | | 18 | |
Exploratory Wells | | | | | | | | | | | | |
Productive | | | — | | | | 1 | | | | — | | | | — | | | | — | | | | — | |
Dry | | | — | | | | — | | | | 1 | | | | 1 | | | | — | | | | — | |
| | | | | | | | | | | | | | | | | | |
Total | | | — | | | | 1 | | | | 1 | | | | 1 | | | | 0 | | | | 0 | |
During 2016, 20172018, 2019 and 20182020 we invested US$5.420.2 (S/68.4), US$23.8 million (S/.18.1 million), US$16.5 million (S/.53.678.95 million) and US$20.212.26 million (S/.68.4)44.44 million), respectively, in drilling activities. During 2018,2020, we drilled a total of 3318 wells in Block IV (all of them are productive wells) and one exploratory well in Block III (dry well).
Under the terms of our agreements with Perupetro, at the time the contract terminates, we are required to closenon-producing wells that we have drilled. As of December 31, 2018,2020, we estimated that we will be required to close 6274 wells in Block I in December 2021, and 616 wells in Block V in Octoberuntil the end 2023, 40 wells in Block III and 50 wells in Block IV in Decemberby April 2045. We have created a provision in our financial statements for the costs relating to those well closings. See notesnote 5.1(d) and 18(d) to our audited annual consolidated financial statements included in this annual report.
Gas Processing Plant
We own a gas processing plant located 7 km north of the city of Talara in Piura, Peru. We currently have under a long-term delivery and gas processing and fractioning contract with Enel Generación Piura (formerly known as EEPSA), according to which Enel Generación Piura delivers wet natural gas that it purchases from onshore and offshore gas operators in the area. We then process and fraction the gas into two products: (i) dry natural gas, which can be used as fuel in Enel Generación Piura’sgas-fired turbine; and (ii) natural gas liquids, which are sold in the Peruvian market. Under the terms of the agreement, we are responsible for all operating costs of the gas processing plant but are also entitled to keep revenues from the sale of the natural gas liquids to third parties after payment of a variable royalty, based on the volume of gas processed, to Enel Generación Piura. Our current gas processing and fractionation contract with Enel Generación Piura expires in 2023.
Our gas processing plant has the capacity to process up to 44 MMcf per day. We processed 33.19 MMcf per day during 2016, 30.57 MMcf per day during 2017 and 30.12 MMcf per day during 2018.2018, 30.52 MMcf per day during 2019 and 28.40 MMcf per day during 2020. Approximately 83%84% of the volume processed by our gas processing plant depends on the gas volumes provided by Enel Generación Piura for processing and use on itsgas-fired turbines. These volumes vary per month and depend upon the power dispatch curve of Enel Generación Piura among Peruvian power generation plants. In rainy months (December to April) where hydroelectric power generation in Peru is typically higher, gas volumes demanded by Enel Generación Piura are lower than in dryer months (May to November) in which activity of thermal generators tends to be higher. Approximately 10%2% of the volume processed by our gas processing plant depends on the volumes of gas extracted by GMPUNNA Energía in Block I, and 7%approximately 10% depends on the volumes of gas extracted by UNNA Energía in Block IV and approximately 4% depends on the volumes of gas provided by CNPC, which we process and commercialize as liquid natural gas.
Fuel Storage Terminals
We are a 50% partner in Consorcio Terminales with a Peruvian affiliate of Oiltanking GmbH, one of the world’s largest operators of independent terminals for bulk liquid storage. Consorcio Terminales hadwas first awarded a contract with Petroperú to operate the North and South Fuel Terminals in Peru, which expired in August 2014. In May 2014, there was a public biddingconcession for the operation of the North, Center and South Terminals.Fuel Terminal in 1997. In June 2014, Terminales del Perú, a new consortium also integrated bythat included our subsidiary GMP S.A.UNNA Energía and Oiltanking Peru, was awarded a concession for the operation of the North and Central Fuel Terminals for Petroperú. The contracts have a20-year termterms and consist of the operation of four terminals in the north and one terminal in the center of the country, providing storage and
dispatching bulk liquid fuel. The total amount of the committed investment for both projects is approximately US$37.2 million (S/.125125 million), while the total amount of the additional investment, which willis expected to be reimbursed to the company, is approximately US$186 million (S/.625625 million). There was no winner inOn November 2, 2019, the public bidding for the operation of the South Fuel Terminals, and the contract of Consorcio Terminales was extended through contract amendments: first, for an additional year until August 2015; subsequently, for two more years until August 2017; in July 2017 for an additional year until August 2018; and in July 2018 for an additional year until August 2019. The total amount of the additional investment required during the period from 2018-2019, which will be reimbursed, is approximately US$10 million (S/.33.7 million). In November 2018, Petroperú initiated a public bidding for the operation of the South Terminals, in which we expectconcession reverted to participate, that is expected to be awarded in June 2019.Petroperú.
Our open-access terminals offer our customers dependable and critical handling and storage services for refined petroleum liquid products, maintaining high quality, safety and environmental standards. We provide storage, handling and loading and uploading services for a broad range of refined petroleum liquid products, including gasoline, aircraft fuel, diesel and heavy fuel oil. We deliver the liquids into two types of transportation systems, railroad cars and cistern trucks. Because of the strategic location of our assets, our deep-water access, inland terminals and our aggregate storage capacity of 2.5 MMbbl in the North and Central Terminals, and of 1.6 MMbbl in the South Terminals, we believe that we are well-positioned to cover the needs of our clients, the two principal refineries in Peru. The map below shows the location of each of our fuel storage terminals in Peru.
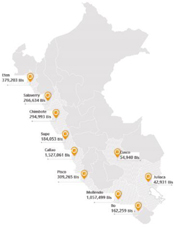
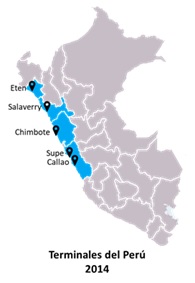
Under the current contracts, Consorcio Terminales and Terminales del Perú receivereceived revenues paid in connection with monthly reserved volume in tanks for refined crude products (storage fee) and for volumes loaded and delivered into railroad cars or cistern trucks to each terminal (throughput fee). The storage fee per barrel, is based upon reserved volumes whether they are received or not. The throughput fee is paid based on effective barrels delivered per month. During 2016, 20172018, 2019 and 2018,2020, Consorcio Terminales and Terminales del Perú generated revenues of US$74.182.5 (S/278.9 million), US$79.7 million (S/.249.0 million), US$78.84 million (S/.255.8264.3 million) and US$82.545.2 (S/.278.9 million)163.8) (we are entitled to 50% of the joint operation revenues), respectively. Under the contracts, Consorcio Terminales and Terminales del Perú are responsible for paying the fuel terminals operating and maintenance costs and also paying a royalty fee to Petroperú based on effective barrels delivered each month.
At the current stage of the contracts, any capital expenditure we invest in the fuel storage terminals can be recouped from any present and future royalties we owe to Petroperú.
The South Terminal operation agreement has been extended to August 1, 2019. With respect to the North Terminal operation agreement, the agreement with Consorcio Terminales expired on October 31, 2014, however, GMP and Oiltanking were granted a new operation agreement for the terminal, this time under the ‘Terminales del Perú’ Consortium, which provided for a 20 year extension that will end on November 1, 2034. Additionally, Terminales del Peru was granted with the operation agreement for the terminal del Centro-Callao, for 20 years commencing on September 2, 2014 until September 1, 2034. In executing their operations, both Consorcio Terminales and Terminales del Perú are committed to develop and follow a work program which must include an investment schedule. The work program performed included the installation of protection systems and loading systems, among others, and was secured by a performance bond.
Other Terminal Operations
We are a 50% partner in Oiltanking Andina Services S.A.C. (“OTAS”). This subsidiary operates a fuel terminal named “Terminal Marino Pisco Camisea” under a contract subscribed with Pluspetrol to operate an export terminal for gasoline, diesel, propane and butane. In 2018,2020, this terminal dispatched 23.9 million barrels and received 10.8 million barrels of natural gas liquids. liquids (GLP, Nafta, MDBS, B-100, ULSD, B5 S50 y Diesel 2). This contract term ended on June 30, 2020 and has been extended until July 31, 2021 while negotiations for the new contract are concluded.
Additionally, through OTAS, we are also a 25% partner in LQS, which operates the “Terminal de Químicos de Matarani,” which dispatched 53,65659,976 tonnes of sodium hydrosulfide for international mining companies in 2018.2020. During 2016, 20172018, 2019 and 20182020, these activities generated revenues in the aggregate of approximately US$6.3 million (S/.21.2 million), US$6.6 million (S/.21.422.3 million) US$6.9 million (S/22.9 million) and US$6.6 million6.7 (S/.22.323.3 million), respectively.
Operation and Maintenance of Infrastructure Assets
We began providing our operation and maintenance of infrastructure assets services in 1994 when we were awarded the concession for the Arequipa Matarani highway in southern Peru. With this experience, in 2003, we began providing operation and maintenance services to Norvial. In 2007, the Peruvian government initiated Proyecto Peru, a program aimed at maintaining roads not under concession to ensure their longevity. Proyecto Peru allowed us to develop new business opportunities providing maintenance services to more than 4,000 km of public roads in Peru. We believe the experience we have gained operating highway and transportation concessions positioned our company to capitalize on the Peruvian government’s initiatives to increase infrastructure development.
Our revenue in the operation and maintenance of infrastructure assets is generated either from fees we charge to Norvial, Survial, Canchaque, Pasco, Chinchaypujio, Chuquibambilla, CoraAtico and the Lima Metro to operate and maintain our concessions or from government payments through maintenance service contracts we have been awarded. As depicted in the chart below, we operate and maintain more than 2,936.302,189.7 km of Peruvian roads and highways, including our own highway concessions, in addition to the Lima Metro.
Operation and Maintenance of Infrastructure Assets
Total 2,936.302,189.7 KM
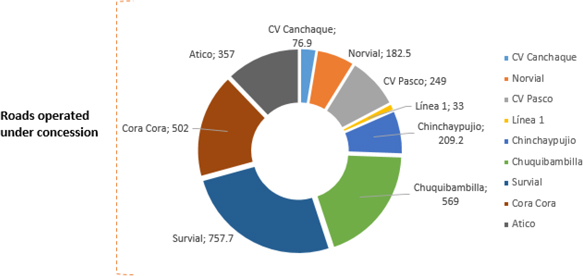
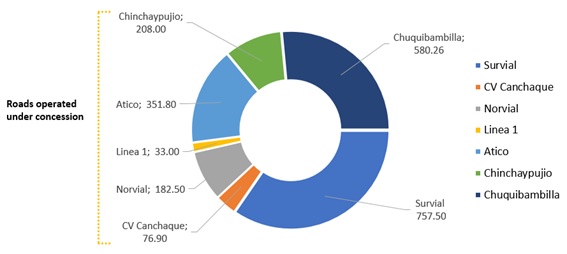
The table below sets forth selected financial information for our operation and maintenance of infrastructure assets activities.
| | | | | | | | | | | | | | | | |
| | | For the year ended December 31, | |
| | | 2016 | | | 2017 | | | 2018 | | | 2018 | |
| | | (in millions of S/.) | | | (in millions of US$)(1) | |
Revenues | | | 262.7 | | | | 378.3 | | | | 452.3 | | | | 133.9 | |
Net profit (loss) | | | 14.0 | | | | 16.9 | | | | 2.4 | | | | 0.7 | |
EBITDA | | | 27.0 | | | | 34.1 | | | | 19.2 | | | | 5.7 | |
EBITDA margin | | | 10.3 | % | | | 9.0 | % | | | 4.2 | % | | | 4.2 | % |
(1) | Calculated based on an exchange rate of S/.3.379 to US$1.00 as of December 31, 2018.
|
The below map illustrates the roads in Peru for which we currently provide operation and maintenance services.
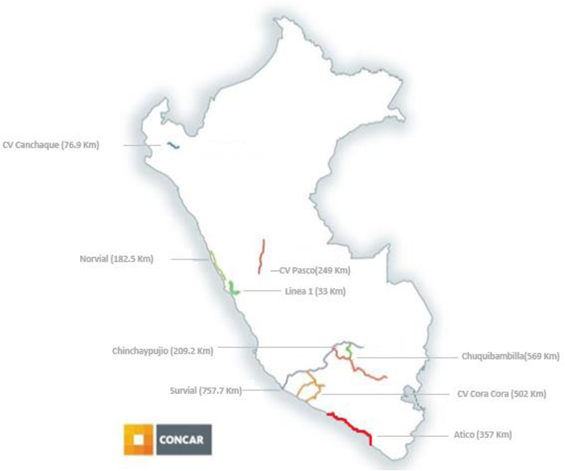
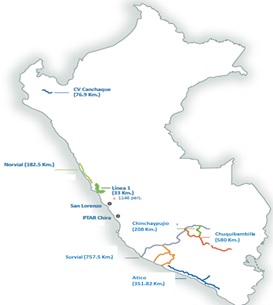
We provide the following road operation and maintenance services:
| | • | | Routine Maintenance.These services aim to preserve roads through ongoing maintenance, including: road demarcation; cleaning; drainage; road fissure treatment, which seals cracks in roads to prevent water infiltration; slurry sealing; and micro-paving, which seals asphalt to prevent aging and improve resistance to water and surface wear. |
| | • | | Periodic Maintenance.These services entail activities that are performed periodically, intended to prevent the occurrence or exacerbation of defects, conserve the structural integrity of roads and correct major defects. |
| | • | | Emergency maintenance.This maintenance work is performed whenever the need arises, such as when natural disasters damage road surfaces. |
We also administer toll stations and weighing stations; offer road patrolling services; operate assistance call centers; and provide emergency medical services.
The operation and maintenance services we provide to the Lima Metro aim to preserve the mass transit system through ongoing maintenance, including cleaning of the trains and stations and providing train operators, among other services.
With respect to operation and maintenance contracts with the Peruvian government, we obtain new contracts through public bidding. With respect to contracts with our Infrastructure segment, we participate in direct negotiation. Contract length typically ranges from three to five years.
Competition
Our ability to grow through successful bids for new infrastructure concessions or other long-term contracts could be affected as a result of competition. We view our competition as including both Peruvian and international infrastructure concession operators including joint operations with partners with specialized expertise in the relevant sector. Competition varies on acase-by-case basis, depending on the main purpose of the concession.
Real Estate
Our Real Estate segment is one of the largest apartment building developers in Peru, in terms of number of units sold and value of sales in 2018,2020, and is focused on the development and sale of affordable housing and housing as well as other real estate projects. Since commencing our operations in 1987, we have developed approximately 1,178,9701,319,106 m2 of affordable housing (approximately 18,56521,018 units); approximately 390,696392,598 m2 of housing (approximately 1,8711,888 units); approximately 170,075170.416 m2 of office space (approximately 902903 offices); and approximately 43,000 m2 of shopping centers (three shopping centers). Moreover, we are currently building approximately 328,83464,672 m2 of affordable housing (approximately 25311,128 units); and approximately 27,3049,600 m2 of housing (approximately 229128 units). Our Real Estate segment also owns significant land parcels in Lima, comprising approximately 78655 hectares as of December 31, 2018,2020, and we have sold undeveloped land in the past and intend to continue such sales in the future.
The table below sets forth selected financial information for our Real Estate business segment.
| | | | For the year ended December 31, | | | For the year ended December 31, | |
| | | 2016(1) | | 2017(1) | | 2018(1) | | 2018(1) | | | 2018 | | 2019 | | 2020 | | 2020 | |
| | | (in millions of S/., except as indicated) | | (in millions of
US$)(2) | | | (in millions of S/, except as indicated) | | (in millions of US$)(2) | |
Revenues | | | 411.5 | | | 647.5 | | | 630.1 | | | 186.5 | | | | 630.1 | | | | 264.4 | | | | 182.4 | | | | 50.3 | |
Net profit | | | 77.2 | | | 117.7 | | | 157.8 | | | 46.7 | | | | 157.8 | | | | 23.7 | | | | 15.0 | | | | 4.1 | |
Net profit attributable to controlling | | | 22.1 | | | 48.6 | | | 28.9 | | | 8.6 | | | | 28.9 | | | | (5.0 | ) | | | 1.4 | | | | 0.4 | |
EBITDA | | | 121.4 | | | 177.3 | | | 241.00 | | | 71.3 | | | | 241.00 | | | | 76.2 | | | | 32.6 | | | | 9.0 | |
EBITDA margin | | | 29.5 | % | | 27.4 | % | | 38.2 | % | | 38.2 | % | | | 38.2 | % | | | 28.8 | % | | | 17.9 | % | | | — | |
Backlog (in millions of US$)(3) | | | 95.9 | | | 25.9 | | | 57.9 | | | 57.9 | | | | 57.9 | | | | 209.9 | | | | 60.3 | | | | 60.3 | |
Backlog/revenues ratio(3) | | | 0.8 | x | | 0.1 | x | | 0.3 | x | | 0.3 | x | | | 0.3x | | | | 0.7x | | | | 1.2x | | | | — | |
| (1) | In 2016, 20172018, 2019 and 20182020 we recognized S/.9738.4 million (US$28.911.5 million), S/.163.137.4 million (US$50.311.2 million) and S/.38.47.3 million (US$11.52.0 million), respectively, in revenues from land sales. |
| (2) | Calculated based on an exchange rate of S/.3.3793.624 to US$1.00 as of December 31, 2018.2020. |
| (3) | For more information on our backlog, see “—Backlog.” Backlog is calculated as of the last day of the applicable period. Revenues are calculated for such period and converted into U.S. dollars based on the exchange rate published by the SBS at such period. |
We undertake a significant amount of the activities in our Real Estate segment with partners through financing and commercial arrangements we use to purchase land and to develop real estate projects. See “—Financing.” See also “Item 5.A. Operating and Financial Review and Prospects—Operating Results—Results of Operations—General—Real Estate.” As a result, a significant amount of our net profit in the Real Estate segment is attributable to thenon-controlling interest of our partners.
Principal Real Estate Activities
Our real estate developments include the following products:
We began developing affordable housing projects in 2001, following the Peruvian government’s efforts to address the country’s housing deficit, particularly forlow-income families. We launched the first major affordable housing project in Peru in 2007,2007; Parque Agustino, in Lima’s El Agustino neighborhood. Since 2001, we have completed 1618 affordable housing projects. As of December 31, 2018,2020, we are developing six affordable housing projects, which are in various stages of development, including three which are in the construction phase but also are still in the process of obtaining thedeveloping three affordable housing projects, including construction, presales and procuring required approvalsauthorizations and permits. Three of our ongoing affordable housingThese projects consist of expansions of projects previously completed by us. Affordable housing consists of apartments, usually ranging between 50 and 72 m2 in size, that are purchased through government subsidies.using government-sponsored support programs. The Peruvian government has adopted the Nuevo Crédito Mi ViviendaMiVivienda and Techo Propio programs, among others, which promote access to affordable housing in Peru by providing government subsidies to individuals for the purchase of homes. In order for a unit to qualify for the Nuevo Crédito MiVivienda program, its selling price must range between S/.58,80058,800 and S/.310,800.310,800. In order for a unit to qualify for the Techo Propio new housing purchase program, its selling price must be less than S/.84,10084,100 for a single family home or less than S/.105,000105,000 for a multi-family dwelling.
In order to be eligible for an affordable housing subsidy under the Nuevo Crédito MiVivienda program, a purchaser must not own any other home or have benefitted from a housing subsidy program in the past, among other requirements. A purchaser must also provide a down payment between 10% and 30% of the total purchase amount. Housing subsidies under this program fluctuate between S/.6,5006,400 and S/.17,50017,700 which incentivize purchasers with reduced monthly rates so long as they pay their mortgage loan payments on a timely basis. In order to be eligible for an affordable housing subsidy under the Techo Propio program, a purchaser must have a monthly income that does not exceed approximately S/.2,6173,538 and must not have received any other government-sponsored housing benefit in the past, among other requirements. A Techo Propio purchaser must also show proven savings equal to at least 10%5% of the total purchase amount. Housing subsidies under this program is S/.32,400.38,500. Purchasers of subsidized housing under both programs are also not required to pay a value-added tax normally applicable to residential purchases.
We develop substantially all of our affordable housing projects on land purchased from the private sector. To the extent these projects meet the requirements of a particular government subsidy program, purchasers can purchase units with government subsidies. Some of our affordable housing projects, however, such as Parque Agustino, are developed through government bidding processes. Government subsidy programs like Nuevo Crédito MiVivienda and Techo Propio have driven the demand for affordable housing in Peru, which has in turn increased our sales of affordable housing units.
Our housing developments consist of residential buildings comprised of apartments with amid- to high-price range that do not qualify for government subsidies. Since 1987, we have developed 38 housing developments. As of December 31, 2018,2020, we are developing four housing projects, one of which is in the construction stage, with the other three in the process of obtaining the required approvals and permits. Our housing units typically range between 130 and 400 m2 in size.
Substantially all of our affordable housing and housing development projects are located in Lima. We have also purchased land to develop four affordable housing projects in Piura, Chimbote and Huancayo, two cities north of Lima and one in the center of the country. We intend to develop affordable housing projects in other cities outside of Lima.
The table below sets forth number of units sold and not yet delivered and number of units delivered, as well as the value of units sold and our sales revenue for the periods indicated.
| | | | For the year ended December 31, | | | For the year ended December 31, | |
| | | 2016 | | | 2017 | | | 2018 | | | 2018 | | | 2019 | | | 2020 | |
Number of Units Delivered(1): | | | | | | | | | | | | |
Affordable Housing | | | 855 | | | | 1,353 | | | | 1,232 | | | | 1,232 | | | | 1,433 | | | | 1,123 | |
Housing | | | 79 | | | | 65 | | | | 44 | | | | 44 | | | | 17 | | | | 2 | |
| | | | | | | | | | | | | | | | | | |
Total | | | 934 | | | | 1,418 | | | | 1,276 | | | | 1,276 | | | | 1,450 | | | | 1,125 | |
Number of Units Sold and Not Yet Delivered(1): | | | | | | | | | | | | |
Affordable Housing | | | 1,620 | | | | 1,152 | | | | 1,810 | | | | 1,810 | | | | 1,925 | | | | 1,247 | |
Housing | | | 97 | | | | 43 | | | | 75 | | | | 75 | | | | 11 | | | | 59 | |
| | | | | | | | | | | | | | | | | | |
Total | | | 1,717 | | | | 1,195 | | | | 1,885 | | | | 1,885 | | | | 1,936 | | | | 1,306 | |
Total m2 Delivered: | | | | | | | | | | | | |
Affordable Housing | | | 48,460 | | | | 78,004 | | | | 70,986 | | | | 70,986 | | | | 83,880 | | | | 57,330 | |
Housing | | | 19,398 | | | | 20,978 | | | | 13,752 | | | | 13,752 | | | | 1,912 | | | | 1,588 | |
| | | | | | | | | | | | | | | | | | |
Total | | | 67,858 | | | | 98,982 | | | | 84,738 | | | | 84,738 | | | | 85,792 | | | | 72,918 | |
Total m2 Sold and Not Yet Delivered: | | | | | | | | | | | | |
Affordable Housing | | | 55,404 | | | | 66,878 | | | | 107,075 | | | | 107,075 | | | | 116,327 | | | | 68,949 | |
Housing | | | 21,825 | | | | 12,538 | | | | 15,440 | | | | 15,440 | | | | 2,593 | | | | 29,959 | |
| | | | | | | | | | | | | | | | | | |
Total | | | 77,229 | | | | 79,416 | | | | 122,515 | | | | 122,515 | | | | 118,920 | | | | 98,908 | |
Value of Units Delivered (in millions of S/.): | | | | | | | |
Affordable Housing | | | 138.0 | | | | 170 | | | | 137 | | |
Housing | | | 163.0 | | | | 221 | | | | 133 | | |
| | | | | | | | | | |
Total | | | 301.0 | | | | 391 | | | | 270 | | |
| | | | | | | | | | | | |
| | | For the year ended December 31, | |
| | | 2018 | | | 2019 | | | 2020 | |
Value of Units Delivered (in millions of S/): | | | | | | | | | | | | |
Affordable Housing | | | 137 | | | | 196 | | | | 157 | |
Housing | | | 133 | | | | 20 | | | | 12 | |
| | | | | | | | | | | | |
Total | | | 270 | | | | 216 | | | | 169 | |
| (1) | We typicallypre-sell our affordable housing and housing units before construction begins and continue to sell during construction, although we recognize revenues at the time of delivery of units. |
We develop and sell office and commercial buildings, such as shopping centers. On certain occasions, we have operated our commercial real estate and later sold it, such as Larcomar, a landmark shopping center which we built in 1998 and sold in 2010. We have also developed commercial real estate buildings in connection with our affordable housing and housing projects, such as the Parque Agustino shopping center. Since 1987, we have developed 16 office buildings, three shopping centers and one medical center. We are currently looking for a plot of land in order to develop a new office building.
Land Bank
We typically purchase land to develop real estate projects with the intention to begin construction within a12- to18-month period after the purchase of the land. We may also, from time to time, purchase land for subsequent resale. As of December 31, 2018,2020, we owned approximately 135,12028 hectares, of which 83%68% is located in Lima and 17%32% outside of Lima. We continually evaluate opportunities to purchase new land for our real estate development projects.
On February 24, 2017, we sold our interest in Project Espacio (formerly known as Cuartel San Martín) to Urbi Propiedades S.A., our partner in the project, for US$50 million (S/.168168 million). On April 28, 2017, we also sold our interest (approximately 20.8%) in Promoción Inmobiliaria del Sur S.A. (“PRINSUR”) of Inversiones Centenario, which owns approximately 937.7 hectares of undeveloped land also located in Lurin,Lurín, to itsour partner Inversiones Centenario S.A.A. for US$25 million (S/.8484 million). For more information, see “Item 5.A. Operating and Financial Review and Prospect— Operating Results—Recent Developments.Key Developments—Asset Sales.”
We have a 50.45% interest in Almonte, which owned approximately 291.2877 hectares as of December 31, 20182020 of undeveloped land in Lurin,Lurín, located 30 km south of Lima. We previously sold 27 hectares of the land for industrial use. On May 31, 2018, Almonte signed a purchase agreement with PRINSUR for the sale of 420.9 hectares of land by Almonte to PRINSUR for an aggregate amount of US$92.7 million, US$74.1 millionthe final installment of which has beenwas paid within February 2020 upon the remainder to be paid upon satisfaction of certain conditions precedent.
Financing
We generally fund land purchases for our housing and commercial real estate projects through cash from our operations. For our affordable housing projects, we generally partner with real estate investment funds and insurance companies that provide between 60% and 70% of the total capital required to purchase the land and cover certainpre-construction costs in exchange for equity in the project. Once we acquire land for a particular real estate development project, we obtain working capital through a credit line from a financial institution, which we utilize to finance additional project needs as they arise. We also obtain financing throughpre-construction sales for our affordable housing and housing projects and, to a lesser extent, our commercial real estate projects. Our affordable housing and housing projects generally require less outside financing because they are generally financed withpre-construction sales.
Sales and Marketing
We typicallypre-sell our affordable housing and housing units prior to and during construction, and use the related proceeds we receive to finance the construction of the units. Our commercial and sales processes differ depending on the type of development and market segment of the development. We primarily sell our real estate development projects through an internal sales force that is assigned to particular projects and, to a lesser extent, external brokers on anon-exclusive,commission-fee basis. Our marketing efforts primarily consist of newspaper advertisements, radio and television commercials, billboards and promotional offers for referrals. We also advertise our real estate projects on our website.
We believe our brand is associated with product quality, professional operations and reliable post-sale customer service. We provide customer service call centers through which residents can report complaints or defects. Engineers respond with site visits, and repairs are made as long as the property continues to be covered by the applicable warranty or guarantee.
For our affordable housing projects, we provide post-sale customer service through our Ayni program, which aims to preserve the long-term value of our affordable housing developments by promoting a cooperative community life. Through this program, we distribute manuals that teach best practices for living in communities, offer leadership workshops, budget workshops, promote small business development, facilitate conflict resolution and provide other services. These services are provided for asix- to eight-month period following project delivery. In 2012, we initiated the Ayni contest for residents of our affordable housing projects with the aim of stimulating the sustainability of their community. Participants present an enhancement project for their community, such as a recreation center, and a jury selects the best project, which we fund and construct.
Competition
The Peruvian real estate development industry is highly competitive. The market is fragmented and no single company has a significant share of the national market. The principal competitors for our Real Estate segment are Paz Centenario Global S.A., Paz Centenario Inmobiliaria, Corporación Líder Perú S.A., Urbana Perú, Los Portales, Imagina Grupo Inmobiliario, ENACORP, Besco S.A. and Gerpal. In the coming years, we expect more competition from domestic and foreign real estate development companies who recognize the growth potential in the Peruvian residential market. The main factors that drive competition are product design and amenities, price, location and post-sale service offerings.
Backlog
We define our backlog as the U.S. dollar equivalent value of revenue we expect to realize in the future as a result of performing work under multi-period contracts that we have entered into. Backlog is not a measure defined by IFRS, and our methodology for determining backlog may not be comparable to the methodology used by other companies in determining their backlog. For contracts denominated in soles or other local currencies, amounts have been converted into U.S. dollars based on the exchange rate published by the SBS, in the case of Peru, or other relevant authority, in the case of other jurisdictions, on December 31 of the corresponding year.
We do not include backlog in this annual report in our Infrastructure segment for: (i) our Norvial toll road concession because its revenues from the concession are derived from toll fees charged to vehicles using the highway, and, as a result, such revenues are dependent on vehicular traffic levels; and (ii) our Energy line of business because: (a) its revenues from hydrocarbon extraction services are dependent on the amounts of oil and gas we produce and market prices, which fluctuate significantly; (b) our revenues from our gas processing plant are dependent on the amount of gas we process and market prices for natural gas liquids, which fluctuate significantly; and (c) our revenues from our fuel storage terminal operation partially depend on the volume of fuel dispatched.
When we present backlog on a segment basis, we do not include eliminations that are included in our consolidated backlog. For a description of how we calculate our backlog, see our segment backlog presented below. We have revised prior backlog data included in this annual report to exclude the presentation of entities that are presented as discontinued operations.
Our consolidated backlog as of December 31, 20182020 was US$1,257.21,330.1 million. We expect to recognize as revenues 52.7%69.2% of our backlog by December 31, 2019, 31.9%2021, 21.2% by December 31, 20202022 and 15.4%9.6% thereafter. However, the ongoing COVID-19 pandemic and government measures to contain the spread of the virus, which have significantly increased economic uncertainty, may continue to impact our ability to perform our backlog in the short term. As conditions are uncertain and changing rapidly, it is difficult to predict the full extent of the impact of the pandemic on our backlog in the short term. The following table sets forth our consolidated backlog from December 31, 20142018 to December 31, 2018.2020.
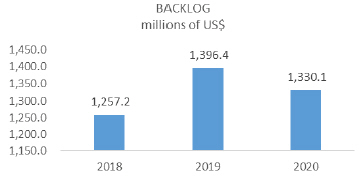
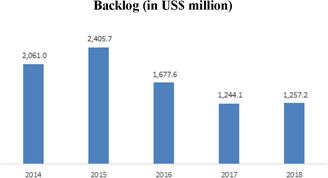
(1) | In the third quarter of 2015, we acquired a 29% participation in the construction consortium of the GSP gas pipeline project, and, as a result, we incorporated US$1.0 billion in backlog. Due to the termination of the GSP gas pipeline concession on January 24, 2017, we have removed US$855 million from the backlog, representing 33.8% of our total backlog as of December 31, 2016.
|
Our backlog decreased slightly increased in 2018, but2020, and may decline further in the future, including due to the potential sale of assets. We cannot assure you that we will be able to continue obtaining sufficient contracts in the future in number and magnitude to grow our backlog. Additionally, the number and amounts of new contracts signed can fluctuate significantly from period to period. For example, the third quarter of 2015, we acquired a 29% participation in the construction consortium of the GSP gas pipeline project, and, as a result, we incorporated US$1.0 billion in backlog. Due to the termination of the GSP gas pipeline concession on January 24, 2017, we have removed US$855 million from the backlog, representing 42.5% of our E&C backlog and 33.8% of our total backlog as of December 31, 2016. During 2017 we also removed US$87.5 million from our backlog related to the Chavimochic project. During 2018, we removed from our presentation of backlog CAM, CAM Servicios and Stracon GyM, which we account for as discontinued operations, and Adexus, which we account for as an investment held for sale. For more information, see “Item 5.A. Operating and Financial Review and Prospects—Operating Results—Recent Developments.”
The table below sets forth our ending backlog for 2016, 20172018, 2019 and 20182020 accounting for opening backlog for each year, annual contract bookings and adjustments, cancellations during the year and annual revenues recognized.
| | | | 2016 | | | 2017 | | | 2018 | | | 2018 | | | 2019 | | | 2020 | |
| | | (in millions of US$) | | | (in millions of US$) | |
Opening backlog (end of prior year) | | | 2,405.7 | | | | 1,677.6 | | | | 1,244.1 | | | | 1,321.3 | | | | 1,341.0 | | | | 1,449.0 | |
Contract bookings and adjustments during the year | | | 1,225.1 | | | | 719.9 | | | | 881.3 | | | | 975.8 | | | | 1,181.7 | | | | 677.1 | |
Cancellations during the year | | | (855.0 | ) | | | | | | | — | | | | — | | | | — | |
Revenues recognized during the year | | | (1,098.2 | ) | | | (1,153.4 | ) | | | (868.2 | ) | | | (956.1 | ) | | | (1,077.0 | ) | | | (796.0 | ) |
| | | | | | | | | | |
Ending backlog (end of current year) | | | 1,677.6 | | | | 1,244.1 | | | | 1,257.2 | | | | 1,341.0 | | | | 1,445.8 | | | | 1,330.1 | |
The chartcharts below sets forth our consolidated backlog breakdown byend-market, geography and client sector as of December 31, 2018.2020.
| | |
| Backlog by End-Market | | Backlog by Geography |
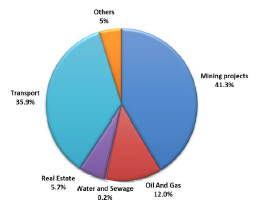 | | 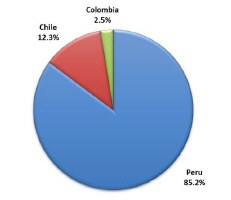 |
Backlog by Client Type
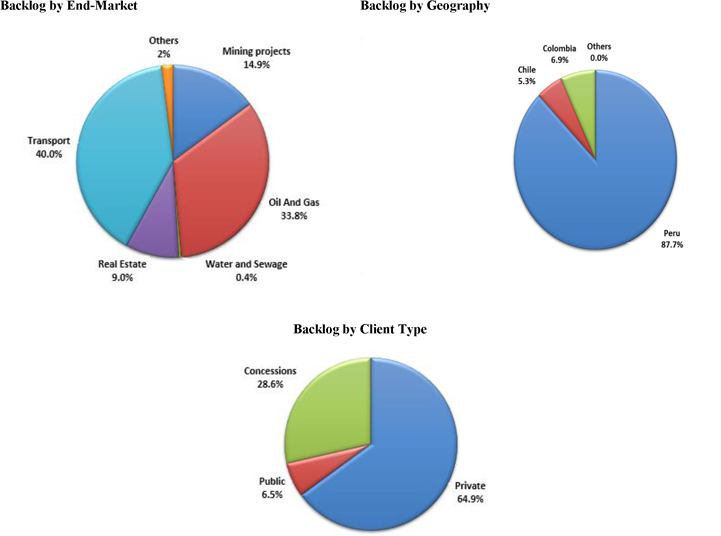
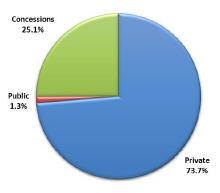
The chart below shows the effects on our backlog of our participation in the GSP pipeline concession and the subsequent termination of the concession.
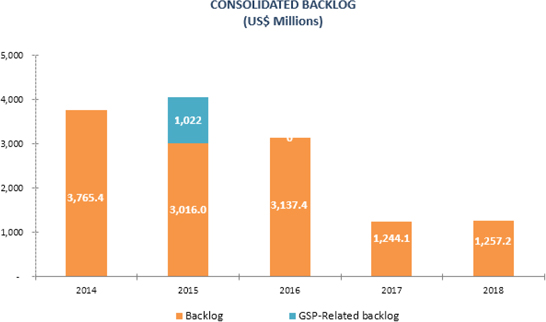
E & C Backlog
To include an engineering and construction contract in our backlog, we assume that each party will satisfy all of its respective obligations under the contract. We also make assumptions, in agreement with the client, regarding the total expected contract price in the case of unit price and cost-plus fee contracts and the amount of the contract that will be completed in each year. We adjust our backlog periodically to account for developments related to each project. For projects related to joint operations or equity investments, we only include our percentage ownership of the joint operation’s or equity investment’s backlog. Our E&C segment backlog does not include intersegment eliminations.
Our E&C backlog as of December 31, 20182020 was US$782.6852.9 million. We expect to recognize as revenues 66.4%83.7 % of such backlog by December 31, 20192021 and 33.6%16.3 % of such backlog thereafter. The following table sets forthHowever, the ongoing COVID-19 pandemic and government measures to contain the spread of the virus, which have significantly increased economic uncertainty, may continue to impact our ability to perform our E&C backlog from December 31, 2014in the short term. As conditions are uncertain and changing rapidly, it is difficult to December 31, 2018.predict the full extent of the impact of the pandemic on our backlog in the short term.
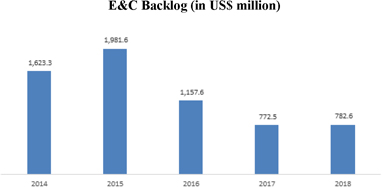
The following pie charts set forth our E&C backlog breakdown byend-market, geography, client sector and contract type as of December 31, 2018.2020.
| | |
| Backlog by End-Market | | Backlog by Geography |
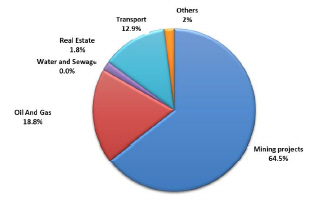 | | 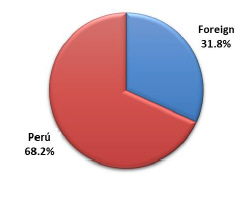 |
| |
| Backlog by Client Type | | Backlog by Client Contract |
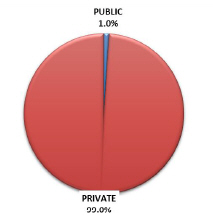 | | 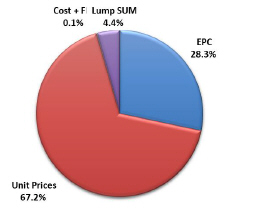 |
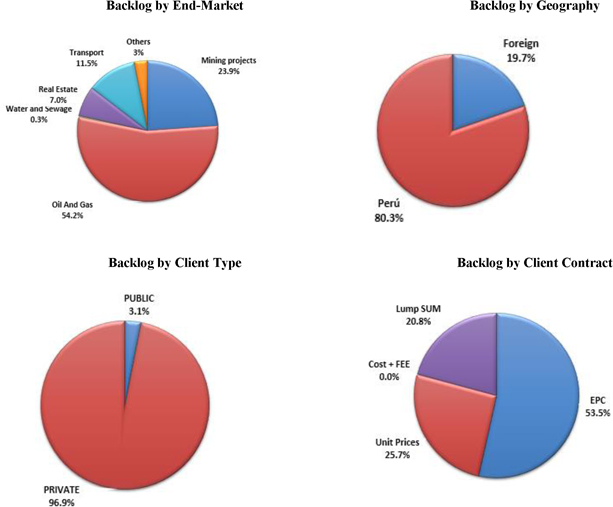
The table below sets forth our ending E&C backlog for 2016, 20172018, 2019 and 20182020, accounting for opening backlog for each year, annual contract bookings and adjustments, cancellations during the year and annual revenues recognized.
| | | | | | | | | | | | |
| | | 2016 | | | 2017 | | | 2018 | |
| | | (in millions of US$) | |
Opening backlog (end of prior year) | | | 1,981.6 | | | | 1,157.6 | | | | 772.5 | |
Contract bookings and adjustments during the year | | | 890.1 | | | | 357.7 | | | | 582.6 | |
Cancellations during the year(1) | | | (855.0 | ) | | | — | | | | — | |
Revenues recognized during the year | | | (859.0 | ) | | | (742.8 | ) | | | (572.5 | ) |
| | | | | | | | | | | | |
Ending backlog (end of current year) | | | 1,157.6 | | | | 772.5 | | | | 782.6 | |
(1) | In the third quarter of 2015, we acquired a 29% participation in the construction consortium of the GSP gas pipeline project, and, as a result, we incorporated US$1.0 billion in backlog. Due to the termination of the GSP gas pipeline concession on January 24, 2017, we have removed US$855 million from the backlog, representing 42.5% of our E&C backlog as of December 31, 2016.
|
| | | | | | | | | | | | |
| | | 2018 | | | 2019 | | | 2020 | |
| | | (in millions of US$) | |
Opening backlog (end of prior year) | | | 772.5 | | | | 782.6 | | | | 910.1 | |
Contract bookings and adjustments during the year | | | 582.6 | | | | 881.5 | | | | 493.8 | |
Cancellations during the year | | | — | | | | — | | | | — | |
Revenues recognized during the year | | | (572.5 | ) | | | (754.0 | ) | | | (550.9 | ) |
Ending backlog (end of current year) | | | 782.6 | | | | 910.1 | | | | 852.9 | |
Infrastructure Backlog
In reflecting an Infrastructure contract in our backlog, we assume that each party will satisfy all of its respective obligations under the contract. For our Infrastructure backlog, we only include contracted revenues expected to be paid during the next three years following the backlog calculation date. Infrastructure backlog in this annual report does not include our Norvial toll road concession or our Energy line of business.
Our Infrastructure segment backlog does not include intersegment eliminations. We calculate our Infrastructure backlog as follows:
for the Lima Metro, our Infrastructure backlog assumes that for 2019, we will operate 44 trains including 20 new trains, which in the aggregate will travel 4.8 million kilometers for that year. Our backlog also assumes that for 2019, 20202021, 2022 and 2021,2023, we will operate 44 trains at full operation, which in the aggregate will travel 4.8 million kilometers per year;
for our Survial and Canchaque concessions, we assume our contractually agreed upon annual fee, adjusted for inflation. For our 20172018, 2019 and 20182020 backlog, we utilize the same adjustment amount that was utilized for our 2016 fee, which has already been negotiated; and
for La Chira, for 2017our 2018, 2019 and 2018,2020, backlog is calculated to include the fees we will receive under the concession for our operation and maintenance, adjusted for inflation.
Our Infrastructure backlog as of December 31, 20182020 was US$520.8492.4 million. We expect to recognize as revenues 34.1%33.7% of our backlog by December 31, 20192021 and 65.9%66.3% of our backlog thereafter. The following chart sets forth the growth of our Infrastructure backlog from December 31, 2014 to December 31, 2018.
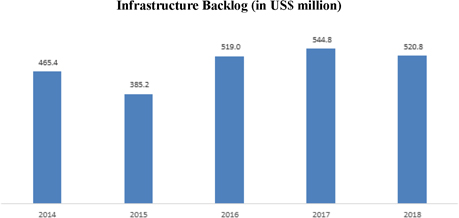
The following pie chart sets forth our Infrastructure backlog breakdown by line of business as of December 31, 2018.2020.
Backlog by Line of Business
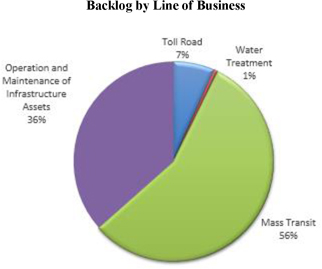
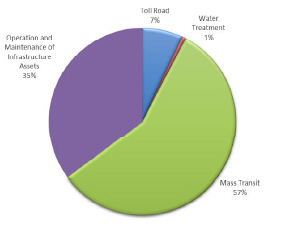
The table below sets forth our ending Infrastructure backlog for 2016, 20172018, 2019 and 2018,2020, accounting for opening backlog for each year, annual contract bookings, cancellations during the year and adjustments and annual revenues recognized.
| | | | 2016 | | | 2017 | | | 2018 | | | 2018 | | | 2019 | | | 2020 | |
| | | (in millions of S/.) | | | (in millions of S/) | |
Opening backlog (end of prior year) | | | 385.2 | | | | 519.0 | | | | 544.8 | | | | 544.8 | | | | 520.8 | | | | 553.9 | |
Contract bookings and adjustments during the year | | | 302.4 | | | | 288.6 | | | | 209.6 | | | | 209.6 | | | | 231.7 | | | | 117.8 | |
Cancellations during the year | | | | | | | | | — | | | | — | | | | — | |
Revenues recognized during the year | | | (168.7 | ) | | | (262.8 | ) | | | (233.6 | ) | | | (233.6 | ) | | | (198.6 | ) | | | (179.3 | ) |
| | | | | | | | | | | | | | | | | | |
Ending backlog (end of current year) | | | 519.0 | | | | 544.8 | | | | 520.8 | | | | 520.8 | | | | 553.9 | | | | 492.4 | |
Real Estate Backlog
Our Real Estate segment backlog reflects sales contracts with buyers for units that have not yet been delivered and will be recognized as revenues once they are delivered.
Our Real Estate segment backlog as of December 31, 20182020 was US$57.960.3 million. We expect to recognize as revenues 90.6%89.0% of our backlog by December 31, 2019,2021, and 9.4%11.0% thereafter. However, the ongoing COVID-19 pandemic and government measures to contain the spread of the virus, which have significantly increased economic uncertainty, may continue to impact our ability to perform our Real Estate backlog in the short term. As conditions are uncertain and changing rapidly, it is difficult to predict the full extent of the impact of the pandemic on our backlog in the short term.
The following pie chart sets forth our Real Estate backlog breakdown by type of real estate activities as of December 31, 2018.2020.

The table below sets forth our ending Real Estate backlog for 2018, 2019 and 2020, respectively, accounting for operning backlog for each year, annual contract bookings, cancellations during the year and adjustments and annual revenues recognized.
| | | | 2016 | | | 2017 | | | 2018 | | | 2018 | | | 2019 | | | 2020 | |
| | | (in millions of US$) | | | (in millions of US$) | |
Opening backlog (end of prior year) | | | 111.0 | | | | 95.9 | | | | 25.9 | | | | 25.9 | | | | 57.9 | | | | 63.3 | |
Contract bookings and adjustments during the year | | | 107.3 | | | | 129.6 | | | | 125.7 | | | | 125.7 | | | | 85.1 | | | | 47.4 | |
Cancellations during the year | | | — | | | | — | | | | — | | | | — | | | | — | | | | — | |
Revenues recognized during the year | | | (122.5 | ) | | | (199.5 | ) | | | (93.7 | ) | | | (93.7 | ) | | | (79.7 | ) | | | (50.3 | ) |
| | | | | | | | | | | | | | | | | | |
Ending backlog (end of current year) | | | 95.9 | | | | 25.9 | | | | 57.9 | | | | 57.9 | | | | 63.3 | | | | 60.3 | |
Warranties
For certain of our contracts, we are required to provide performance bonds to ensure compliance with contractual obligations such as construction works, operation and maintenance of infrastructure assets, among others. The amount of the performance bond varies on acase-by-case basis, depending on the value of the project. Performance bonds are usually renewed annually until the contractual obligation which they intend to guarantee is fully satisfied.
As part of our real estate sales contracts, we provide asix-months warranty for latent defects, which covers hidden flaws not discoverable through inspection. The warranty extends to a five-year term if the defects are caused by: (i) the use of materials below the requisite quality standards; (ii) poor execution; or (iii) faulty land. We also provide a five-year warranty for structural defects, and assume the terms and conditions of our finishes suppliers’ warranties.
Quality Assurance
In 2018,2020, our operations were certified according to the following international standards:
| | | | | | | | | | | | | | | | | | | | |
| | | | | | ISO
9001
(QUALITY) | | | ISO
14001
(ENVIRONMENTAL) | | | OHSAS
18001
(SECURITY
AND SAFETY) | | | OTHER | |
Engineering and
Construction | | GMI
| Cumbra
Ingeniería |
| | | x | | x | | x | | |
| | GyM
| | x | | x | | | |
| | | Cumbra | | | | x | | |
| | Morelco
| | x | | x | | x | | x | | | |
| | VyV - DSD
| Morelco | | | | x | | x | | x | | | | x | | | | x | |
| | | VyV - DSD | | | | x | | | | x | | | | x | | | | | |
Infrastructure | | GMP
| UNNA Energía | | | | x | | x | | x | | | | | | | | x | |
| | Ferrovias GyM
| Linea 1 | | | | x | | | | | | |
| | Concar
| | x | | x | | x | | |
| | Viva GyM
| | | | | | x | | | | |
Engineering and Construction:
GMI:Cumbra Ingeniería: ISO 14001, ISO 9001 and OHSAS 18001.
GyM:Cumbra: ISO 9001 in project management control processes; ISO 14001 and OHSAS 18001 in engineering, procurement and construction of electromechanical projects, civil works and buildings.
Morelco: ISO 14001, ISO 9001 and OHSAS 18001; in addition, ASME ESTAMPES U/S NATIONAL BOARD ESTAMPER.
Vial y Vives—DSD: ISO 14001, ISO 9001 and OHSAS 18001.
Infrastructure:
GMP:UNNA Energía: ISO 14001, ISO 9001 and OHSAS 18001:ISO 45001: certified for oil and gas production processes in lots I, III, IV I andy V; gas processing at the Pariñas plant;Talara Plant; reception, storage and dispatch of hydrocarbons-derived products derived from hydrocarbons in nine terminals (Pisco, Mollendo, Ilo, Cusco, Juliaca,Terminals Eten, Salaverry, Chimbote, Supe and Supe).Callao; and support processes.
Ferrovias GyM:Linea 1: ISO 9001 for the operation and conservation of railway infrastructure and rolling stock of the Transport System - Line 1.
Concar: ISO 9001, ISO 14001 and OHSAS 18001.
Viva GyM: OHSAS 18001 for its main office and the Los Parques de Comas project.
Corporate Social Responsibility
We are committed to the sustainable development of our operations. We seek to create long-term value and conduct business in a manner that is not only economically viable, but also beneficial to greater society and environmentally responsible.
Our Sustainability Policy was approved by our board of directors on January 28, 2016, and its guidelines allow us to focus on seven managerial priorities linked to our stakeholders: ethical conduct, development of people, operational excellence, health and safety, the environment, communication and dialogue and sharing wellbeing.
The focuses of our social investment projects include education and capacity building to foster job creation and the promotion of responsible citizen behavior, particularly among our users, suppliers and neighboring communities.
The following are key programs we perform for the benefit of society:
Metro Culture: We conduct workshops that transform trains and train stations into centers of social and cultural education to promote respect and tolerance. In 2018,2020, we carried out 5424 virtual artistic presentations and incorporated approximately 27,0001,110 people in health campaigns.
Road Safety Education: This program promotes our culture of safety and accident prevention by training communities surrounding roads and highways that we operate or maintain. In 2018, approximately 4,000 road users participated in these workshops.2020, we provided two virtual training courses, with the total participation of 13,916 members of the public.
Ayni: This social support program aims to improve the quality of life in urban areas by promoting respectful coexistence among new owners of our real estate projects. The initiative trains neighbors on several legal and managerial matters and on conflict management and leadership. In 2018,2020, the program trained approximately 2,0001,636 people.
Development of local suppliers: We build the capacities of our local suppliers and help them to develop their businesses by improving the quality of the goods and services they provide and encouraging the adoption of formal and responsible managerial styles. In this way, we make local economies more dynamic.
Labor Capabilities: This is a recruitment program where we share construction knowledge and train community members on building techniques, risk prevention and leadership skills. In this way, we increase the employability of members of local communities, generate formal jobs, reduce project risks, develop more efficient recruiting processes, and strengthen the trust with local communities. In 2018,2020, we trained approximately 750242 participants, 75%2% of whom joined the Group.group.
Cantera Program: This program is designed to attract and train young talents in engineering. In 2018,2020, we recruited 8four young people out of a total of 34approximately 1,500 participants.
Regulatory Matters
Set forth below is a description of the regulatory framework applicable to our company. We believe we are in compliance, in all material respects, with applicable laws and regulations in all of our business segments.
Measures regarding COVID-19
In November 2020, the Peruvian government declared a state of emergency (estado de emergencia) as a result of the COVID-19 pandemic and established a number of rules by Supreme Decree N° 184-2020-PCM (as amended).
As a result, the exercise of constitutional rights such as personal freedom and safety, domicile inviolability, free assembly and free transit have been suspended. Nevertheless, the engineering and construction, infrastructure (including the construction, operation and maintenance of infrastructure facilities) and real estate (including the construction and sale of properties) industries are operating in Peru, although subject to certain restrictions such as a curfew (which curfew varies by city).
Engineering and Construction
Regulatory Framework Applicable to Contracts with the Public Sector
As of the date of this annual report, Peru’s Public Procurement Law, approved by Supreme Decree No.°082-2019-EF (Texto Unico(Texto Único Ordenado de Ley de Contrataciones del Estado) and its Regulations which, in turn, was approved by Supreme Decree No.344-2018-EF, which entered into force on January 30th,30, 2019, governs services and construction agreements entered into with public entities. Article 29 of Supreme Decree No.344-2018-EF establishes that, at the beginning of the procurement process, the contracting public entity must prepare a technical file describing the characteristics of the services it intends to purchase and the selection process for its counterparts, among other specifications.
The selection processes are established in Article 53 of Supreme Decree No.344-2018-EF as follows:
public biddings (licitación pública), applicable to goods and works;
public tenders (concurso público), applicable to services, including consulting services;
| | • | | simplified award (adjudicación simplificada), applicable for the acquisition of any of the following: to (i) goods, if their value is greater thanexceeds S/33,20033,600 and less thanunder S/400,000; (ii) services, if their value is greater thanexceeds S/33,200336,200 and less thanunder S/400,000; and (iii) works, if their value is greater thanexceeds S/33,20033,600 and less thanunder S/1,800,000; |
| | • | | electronic reverse auction (subasta electronicaelectrónica inversa), applicable to goods and services with a value greater thanvalues exceeding S/33,200;33,600; |
| | • | | selection of individual consultants (selección de consultores individuales), applicable for the hiring of qualified consultants who do not need teams of personnel or additional professional support; |
| | • | | price comparison (comparación de precios), applicable to goods and services that are easy to obtain in the market and that are not manufactured, produced, supplied or provided under a particular description or set of instructions given by the contracting entity; and |
| | • | | direct contracting (contratación directa), applicable to goods and services, in emergency situations arising from catastrophic events, involvement of national security, shortages, among other similar reasons. |
As established in Article 70 ofIn addition, Supreme Decree No.344-2018-EF establishes that the selection processes include the following phases:
in the case of public biddings, public tenders and simplified award: notice; registration of participants; submission and reply of inquiries; submission and reply of comments; preparation of the terms and conditions of the selection process; submission of bids; evaluation and qualification of bids; and award;award (articles 70, 79 and 88);
in the case of the selection of individual consultants: notice; registration of participants; submission of bids; evaluation and qualification of bids;bids (article 92); and
in the case of price comparison: notice, submission of bids, and adjudication.adjudication (articles 98 and 99).
Article 46 of Peru’s Public Procurement Law establishes that any participants in a public procurement processes must be registered in the Peruvian National Suppliers Registry and must not be barredbanned from contracting with the state. Article 9 of Supreme Decree No.344-2018-EF establishes that this registration has an indefinite validity and that all contractors must maintain theirkeep information up to date.updated.
Bidders may participate in the selection process as part of a joint operation, in which case all members of the joint operation must be registered in the Peruvian National Registry of Suppliers and will be jointly liable for all consequences arising from the joint operation’s participation in the selection process and the execution of the agreement. Certain exceptions to the abovementioned joint liability for joint operations may apply, in cases where a contractor proves that only one party is liable to be sanctioned due to the nature of the infraction, the joint operation formal undertaking or the joint operation agreement.
GyM
Cumbra and GMICumbra Ingeniería are registered in the Peruvian National Suppliers Registry as a construction and a consulting company, respectively.
Article 35 of Supreme Decree No.344-2018-EF establishes the types of contracts that may be entered into by public entities:
| | • | | lump-sum (sistema a suma alzada), applicable when the amounts, scales and qualitytechnical specifications are determined in the terms and conditions of the selection process. The bidder submits its proposal indicating a fixed amount and a term for the completion of the agreement; |
| | • | | unit price, rates or percentages (sistema de precio unitario, tarifastarifa o porcentajes), applicable when the nature of the service to be provided does not allow an accurate determination of the required quantities;quantities or dedication time; |
| | • | | lump-sum and unit price, rates or percentages mix (esquema mixto de suma alzada y precios unitarios), applicable when accurate determination ofthe included items have known quantities or quantities which can be known with accuracy and precision, they can be contracted under the lump sum scheme, however when items where the quantities required for some of the components cannot be made;known have to be contracted under the unit price system; and |
| | • | | fixed amount plus success fee (honorario fijo y comisión de éxito), applicable in contracts for rendering services. The fixed amount and success fee may be estimated on the basis of percentages. |
Article 36 of Supreme Decree No.344-2018-EF establishes that, in the case of goods and works, the terms and conditions of the selection process must indicate the execution type of the agreement as follows:
| | • | | “turn-key” (llave en mano), when completion is subject to the construction, equipment assembly and, if applicable, the assisted operation of works. In case of goods procurement, the installation and commissioning of such goods are also included; and |
| | • | | bid contest (concurso oferta), when completion is subject to the submission of the technical file and the completion of the works. This completion type is only applicable tolump-sum contracts and public bidding selection process. |
Peru’s Supervisory Authority on Public Procurement (Organismo Supervisor de las Contrataciones del Estado, or OSCE, by its Spanish acronym) is a public-sector entity within the Peruvian Ministry of Economy and Finance, that oversees the selection processes carried out by public entities; manages the Peruvian National Registry; imposes penalties to suppliers that violate the provisions set forth in Peru’s Public Procurement Law, its Regulations and other related provisions; and informs the government’s General Comptroller Office (Contraloría General de la República) regarding violations to the regulations when damages are caused against the State.
Pursuant to the recent amendments to the Public Procurement Law, companies sentenced for corruption charges, among other criminal offences, or companies whose representatives have admitted committing corruption acts, will be prohibited from participating in public procurement processes.
Regulatory Framework Applicable to Contracts with the Private Sector
Parties to a private-sector agreement may freely determine the contract type and its contents as long as it complies with certain legal requirements, including the provisions set forth in Article 1353 of the Peruvian Civil Code (which states that all contracts, including innominate contracts, must comply with the rules of Section VIIIVII of the Peruvian Civil Code, absent a statute specific to said contract type that collides with said rules). GyMCumbra and GMICumbra Ingeniería participate in private-sector contracts for engineering and constructions.
Construction Activities in Peru
Legal Framework
Peru’s Law for the Promotion of Private Investment in Construction, approved by Legislative Decree No. 727 (Ley de Promoción de la Inversión Privada en Construcción), states that construction activities in Peru are in the public interest and a national priority. According to Section F of the Fourth review of the United Nations International Statistical Industrial Classification (ISIC), construction activities typically consist of the construction of dwellings, buildings and stores; and the construction of large scale infrastructure projects such as highways, bridges, tunnels, railways, irrigation systems, sewage systems, industrial facilities, pipelines and electric lines, among others. GyMCumbra has developed numerous projects in the construction sector. Currently, our company focuses on buildings (ISIC Division 41), civil works (ISIC Division 42) and specialized activities (ISIC Division 43).
Construction entities must comply with the National Building Regulations, approved by Supreme Decree No.011-2006-VIVIENDA (Reglamento Nacional de Edificaciones), which establishes that urban allotments and buildings must be developed in compliance with the rules governing safety, functionality, accessibility, habitability and environmental impact. According to Technical Regulation No. G.030 (Rights and Responsibilities) of the National Building Regulations, construction companies, such as GyMCumbra and GMI,Cumbra Ingeniería, are responsible for (i) executing works in accordance with project specifications and applicable regulations; (ii) possessing sufficient organization and infrastructure to guarantee the feasibility of the project; (iii) appointing the party responsible for the construction to assume its technical representation; (iv) providing the resources and materials to complete the project pursuant to the terms of the agreement and required standards and within the approved budget; (v) executing subcontracts within contractual limitations; and (vi) delivering to the client documented information regarding the executed works.
Notwithstanding any legal actions that the construction company may take against suppliers, manufacturers or subcontractors, the construction company may be responsible for all the works, including those executed by subcontractors, and for the use of defective materials or supplies.
Penalties for violating the National Building Regulation are determined by the municipal government in the jurisdiction where the project is developed and set forth in its corresponding regulations. In addition, they may also pursue criminal actions or civil claims if applicable.
Safety Regulation in Construction Projects
The Law on Safety and Health at Work (Law No. 29,783)29783) is intended to promote workplace accident prevention and applies to all business sectors. The principal safety rules applicable to construction projects include the following:
companies with 20 or more employees must establish a committee for the promotion of workplace safety and health that oversees the implementation of the required internal safety and health regulation policy;
all projects must have a safety and health plan consisting of all the technical and administrative mechanisms to guarantee the physical integrity and health of workers and third parties during project execution;
companies shall hire an occupational physician and establish an area of occupational medicine;
companies shall perform periodic audits to verify whether internal safety and health regulations are in accordance with law;
occupational diseases and work accidents detected during project execution must be recorded and the competent authority must be notified in accordance with the Regulations of the Law on Safety and Health at Work, approved by Supreme Decree No.005-2012-TR, and with Occupational Health Manual, approved by Ministerial Resolution No.510-2005-MINSA;
companies must provide for medical examinations of its employees prior to, during and at the termination of their employment (subject to certain terms and conditions depending on whether the employees were engaged in high-risk activities);
companies must show a safety and health plan; an index of frequency; and our company’s performance in safety and health in order to be awarded public and private projects;
use of individual protective equipment, including gloves, safety goggles, boots and helmets, is mandatory when risks to safety and health cannot be prevented by other means; and
personnel responsible for safety must comply with all requirements in Rule NTP 399.010.1 for fire prevention.
The Peruvian Ministry of Labor and Employment Promotion, the National Superintendence of Labor Inspection (the “SUNAFIL”) and the Peruvian Ministry of Health are the competent organisms in the safety and health fields, respectively.
Safety Regulations Applicable to Subsectors
In addition to the Law on Safety and Health at Work applicable to all our business sectors, our Engineering and ConstructionE&C segment must also comply with the regulations set forth below.
Power and Utilities
GyMCumbra must comply with the Rules of Safety and Health at Work with Electricity, approved by Ministerial Resolution No.111-2013-MEM-DM, for its activities relating to the construction of hydroelectric plants, transmission lines and substations. OSINERGMINThe Peruvian Supervisory Agency for Investment in Energy and Mining (Organismo Supervisor de la Inversión en Energía y Minería, or “OSINERGMIN”) is the authority responsible for supervising and enforcing compliance of the foregoing rules. The most relevant of the safety rules with which GyMCumbra must comply include: (i) providing employees with necessary information regarding safety measures related to the tasks they perform; (ii) providing employees with adequate safety equipment; and (iii) evaluating and remedying potential sources of danger.
Mining
GyMCumbra must comply with the Mining Occupational Health and Safety Regulation, approved by Supreme Decree No.024-2016-EM, and other related regulations for their mining-related construction activities including the construction of mineral processing plants and other mining-related buildings, among others. In developing mining projects, our subsidiaries’ personnel must follow the safety programs and be familiar with internal rules from their mining sector client. The SUNAFIL and OSINERGMIN are the authorities responsible for supervising and enforcing compliance of the foregoing rules. The most relevant of the safety rules with which GyMCumbra must comply include: (i) creating an internal safety and health regulation policy and selecting a manager responsible for its implementation; (ii) monitoring and recording workplace accidents and occupational diseases; (iii) providing information to employees regarding the safety risks related to their work; (iv) providing employees necessary first aid and medical attention in the event of a workplace accident; (v) providing employees the necessary tools, equipment or materials to perform their activities safely; and (vi) evaluating risks in order to establish accident prevention and mitigation plans.
Oil and Gas
GMPUNNA Energía must comply with the Hydrocarbons Safety Regulations, as approved by Supreme Decree No.043-2007-EM, which are enforced by the OSINERGMIN, while performing any hydrocarbon activities. The most relevant safety rules with which GMPUNNA Energía must comply include: (i) assuring that senior project managers are responsible for the safety and health of workers; (ii) assigning specialized personnel responsible for safety and health matters; and (iii) monitoring and recording workplace accidents on a monthly basis.
Industrial Construction
GyMCumbra must comply with the Industrial Safety Regulation, approved by Supreme Decree No.42-F (Reglamento de Seguridad Industrial), for its activities relating to the construction of industrial plants. The most relevant of the safety rules with which GyMCumbra must comply include: (i) overseeing that worksites are constructed, equipped and managed to provide security and protection to employees; (ii) instructing employees about risks to which they are exposed related to their work and adopting necessary measures to avoid accidents and damage to employee health; and (iii) overseeing inspections to verify the proper installation of safety equipment.
Registries and Permits
AccordingPursuant to Supreme Decree No.008-2013-TR,005-2020-TR civil contractors must be registered in the National Registry of Civil Construction Works Registry and comply– (the “RENOCC”), governed by the Administrative Labor Authority. Civil construction work companies register with the rulesRENOCC, which assigns them with a unique registration number with which the company is identified until completion of Ministerial Resolution No.195-2007-TR which sets out the requirements for registration, including registering throughrelevant project, regardless of the corresponding local agencynumber of contractors and filing an affidavit indicating compliance withsubcontractors that participate in the registration requirements beforeexecution of the effective date of registration. GyM is currentlywork. Cumbra has registered in the National Civil Construction Contractors and Subcontractor Registry.Registry in compliance with the Supreme Decree No. 008-2013-TR.
According to Supreme Decree No.005-2008-EM mining contractors must register with the National Mining Contractors and Specialized Companies Registry. GyMCumbra is currently registered. Proper registration requires the filing of a request with the Regional Agency of Energy and Mines with jurisdiction in the area where the mining activities will take place. In addition, within five days upon commencement of construction, GyMCumbra must provide in writing its employees with the following information: (i) the company’s legal name; (ii) the scope of the contract; (iii) the place of execution; (iv) the applicable health and safety regulations; (v) the Safe Work Written Procedures (PETS); and (vi) risk insurance policies.
Labor Law Requirements in Civil Construction
Labor law requirements in civil construction consist of the specific legal framework for civil construction workers and the general legal framework applicable to the administrative personnel in the civil construction sector set forth in the Single Revised Text of the Labor Productivity and Competitiveness Law, approved by Supreme Decree No.003-97-TR.
Seasonality of services is one of the main features in the specific legal framework due to the temporary nature of construction contracts. Consequently, certain general rules such as the trial period are not applicable to construction workers.
The principal terms and conditions relating to collective bargaining from our civil construction workers have been agreed upon and recorded in the 2018-2019 agreement, dated September 11, 2018, and entered into between the Peruvian Chamber of Construction and the Federation of Civil Construction Workers (Federación de Trabajadores en Construcción Civil). By means of the 2018-2019 agreement, the parties have, among other things, agreed on an increase in the daily wage of such employees.
Supreme Decree No.009-97-SA, Law No. 26,790 and Supreme Decree No.003-98-SA require construction companies to have complementary high-risk insurance for workers that perform high risk tasks. As of the date of this annual report, GyMCumbra has this insurance coverage.
The insurance coverage provides medical care for injured workers to allow them to achieve full recovery. Moreover, it provides pensions to workers or their beneficiaries in case the worker becomes handicapped or dies as a result of a work accident or occupational disease.
Environmental Regulations
Section 24 of the General Environmental Law, approved by Law No. 28,611 (the “General Environmental Law”), provides that all human activity that involves construction services, among others, likely to cause significant environmental impact is subject of regulation by the National System of Environmental Impact Assessment. The Peruvian Ministry of the Environment, through the Environmental Supervising and Enforcement Agency (Organismo de Evaluación y Supervisión Ambiental,or “OEFA”) supervises compliance with the law and enforces environmental rules related to mining, oil and gas and electricity.
In addition to being responsible for the impact that its activities, by action or omission, may have on the environment, GyMCumbra is also subject to an environmental impact assessment and must obtain an environmental certification necessary to obtain project permits or licenses. GyMCumbra must also adopt measures for the management of hazardous materials intrinsic to its activities to mitigate the negative environmental impact its activities may have.
Civil Construction
Supreme Decree No.015-2012-VIVIENDA (modified by the Supreme Decree No.°019-2014-VIVIENDA and Supreme Decree No. 0082016-VIVIENDA) regulates the environmental aspects of projects related to housing, urbanism, construction and sanitation activities in urban or rural areas. The National Directorate of Housing, Urbanism, Construction and Sanitation supervises the compliance and enforces the applicable rules. Projects are categorized according to their environmental impact during and after their execution and different rules are established for each category including compliance with the following environmental studies prior to starting construction works: (i) projects expected to cause minor environmental impacts require an environmental impact statement; (ii) projects expected to cause moderate environmental impacts require a semi-detailed environmental impact assessment; and (iii) projects expected to cause a major environmental impact require a detailed environmental impact assessment.
Other Subsectors
Depending on the subsector in which it operates, GyMCumbra is required to follow specific environmental provisions issued by the competent authorities. For example, with respect to hydrocarbon activities, the Ministry of Energy and Mines has enacted the Oil and Gas Environmental Regulations, by means of Supreme Decree No.039-2014-EM modified by Supreme Decree No.°023-2018-EM
Tax Legal Regime Applicable to Construction
Section 63 of the Peruvian Income Tax Law, approved by Supreme Decree No.179-2004-EF, establishes that construction companies engaged in construction contracts for a period longer than one fiscal year can choose to be taxed under any of the following systems:
allocate to each fiscal year the gross income resulting from applying the percentage of gross margin estimated for the workfull construction over the amounts collected for the same work;construction; or
allocate to each fiscal year the gross income calculated by deducting the costs corresponding to the tasks performed on each construction during that year from the amount collected or that is expected to be collected corresponding to that work.for such tasks.
In both situations, a special accounting registry must be kept for each project, which is meant to keep a record of the costs, expenses and income of each project in an account separate from the general analytical accounts (cuentas analíticas de gestión).
Until December 31, 2012, construction companies could defer revenues related to each individual project until the total completion of the project, provided the project was completed in three years or less. In such cases, the income was to be recognized in the fiscal year in which the project concluded or was delivered. In case the project was scheduled to conclude in a period exceeding three years, the results would be determined in the third year in accordance with the progress of the works over the three-year period. Beginning in the fourth year, results were determined following the foregoing methods.
Starting on January 1, 2013, in accordance with Legislative Decree No. 1112, which amended the Peruvian Income Tax Law, construction companies that adopted the deferral method are authorized to continue with the use of such method only with respect to income arising from the execution of work contracts initiated prior to January 1, 2013, until their completion, and for execution of work contracts initiated on or after January 1, 2013 the deferral method is no longer accepted.
The Peruvian Income Tax Law also provides that the difference that may result from a comparison between the real gross income and the income assessed pursuant to any of the methods described above shall be allocated to the fiscal year in which the work concluded. Additionally, the company must apply the same system to all its construction contracts and must receive prior authorization from tax authorities to change the applied system.
Prevention of Money Laundering and Financing of Terrorism
Regulations for money laundering and terrorism financing prevention, approved by SBS ResolutionNo. 789-2018 (which has replaced SBS ResolutionNo. 486-2008 as of March 15, 2018), require construction and real estate companies to implement a money laundering and terrorism financing prevention system, including, among others, the appointment of a compliance officer, setting up a registry of operations and notifying the Financial Intelligence Unit of the SBS, the entity responsible for supervising and enforcing compliance, of any suspicious activity.
Infrastructure
Infrastructure and Public Services through Public Private Partnership Contracts
In recent years, the Peruvian state has implemented a new regulatory framework (Single Supreme(Legislative Decree No.254-2017-EF, Legislative Decree No. 1224 1362 and its regulations, approved by Supreme Decree No.410-2015-EF) 240-2018) to set forth the procedures and mechanisms for enhancing private investment for the development of public infrastructure, public services, any ancillary services, applied research projects and/or technological innovation, through Public-Private Partnerships (PPP) and Projects with State Assets.
The main aspects of the new legal framework are the following:
| | 1. | The Ministry of Economy and Finance (Ministerio de Economía y Finanzas) is the governing authority of the National System for the Promotion of Private Investment (SNPIP), composed by ministries and public agencies of the national government, the Agency for the Promotion of Private Investment—ProInversión, and regional and local governments. |
| | 2. | Private investment projects will comprise the following stages: (i) planning and programming, (ii) formulation, (iii) structuring, (iv) transaction, and (v) contract execution. Great emphasis is given to the Evaluation Report (Informe de Evaluación), a document determining the economic, financial and legal viability of a potential Public Private Partnership applying, where appropriate, the national public investment system. Investors are entitled to receive from the Peruvian state: (a) in the case of self-financed projects, taxes and tolls to be collected from final consumers; (b) in the case ofco-financed projects, subsidies and payments from the public entity awarding the project; and (c) any other financing structure agreed between the parties. |
| | 3. | The management of Public Private Partnership contracts by the three levels of government (central, regional and local) is regulated. |
| | 4. | For projects in regulated sectors, the monitoring of Public Private Partnership contracts is subject to the provisions of the Law No. 27,332, Framework Law for Regulators on Regulators.Private Investment for Public Services. According to this law, OSIPTEL, OSITRAN, SUNASS and OSINERGMIN should primarily safeguard the compliance of service levels agreed in Public Private Partnership contracts. For this purpose, Public Private Partnership contracts must establish the necessary arrangements to ensure timely and efficient supervision during the contract execution stage. To this end, public entities are required to ensure timely participation of regulatory agencies in the arbitration, when decisions and matters related to the competence of those bodies are discussed. |
| | 5. | Favorable opinions for the Public Private Partnership Agreements from the General Comptroller Office of Peru are required. The General Comptroller will issue a report on any aspects that may jeopardize the financial capacity of the Peruvian state, according to Law No. 27,785, Organic Law of the National Control System and the General Comptroller of Peru. |
| | 6. | Investors interested in participating as bidders in private investment processes must review the list of restrictions and prohibitions established in the Public Procurement Law. Whether an investor is barred from participating shall be determined through administrative channels, and such restriction will apply to any expected strategic partners as well. Furthermore, it is stated that the restriction would extend to strategic partners and to companies who have exercised direct control over the investor, as indicated in the regulations approved by the Superintendence of the Stock Market. |
| | 7. | The development of projects related to assets owned by the Peruvian state (Legislative Decree No. 674, Law Promoting Private Investment in State Enterprises)Enterprises and its regulations enacted by Supreme Decree No. 070-92-PCM) can be carried out by private sector initiatives, without committing any public resources or transferring any risks to public entities, unless expressly required by law. |
Each of our subsidiaries Norvial, Survial, Canchaque and GyM FerrovíasLínea 1 has entered into a concession agreement with ProInversión and the Peruvian Ministry of Transportation and Communications. La Chira has entered into concession agreements with ProInversión and Sedapal S.A. The abovementioned agreements were entered into in accordance with the provisions in force at the time of their execution.
Infrastructure Construction and Safety
Infrastructure concessionaires must assure that the construction companies they hire to construct infrastructure projects comply with the foregoing rules relating to construction projects. In addition, companies engaged in road construction must comply with the guidelines issued by the Road and Railways General Directorate of the Peruvian Ministry of Transportation and Communications and with the National Road Infrastructure Management Regulation regarding road construction, maintenance and safety. These regulations establish procedures for authorizing road construction and approving work contracts, among others.
Environmental Regulations
Peruvian environmental laws and regulations have become increasingly stringent over the last decade. All industries and projects are subject to Peruvian laws and regulations concerning water, air and noise pollution, and the discharge of hazardous substances. The main legislation governing environmental matters is theLaw No. 28,611, General Environmental Law; Law No. 27,446, the Law of the National System of the Environmental Impact Evaluation approved by Law No. 27,446 (the “SEIA”); the regulations of the SEIA Law, approved by Supreme Decree No.019-2009-MINAM; and several environmental regulations that have been issued under the General Environmental Law, SEIA and other laws by the government with the collaboration of the Peruvian Ministry of the Environment.
Since the enactment of the General Environmental Law inon October 15, 2005, several technical environmental regulations have been issued and this environmental regulatory framework is generally revised and updated regularly. Some regulations apply generally to Peruvian industries and some technical regulations are issued for specific industries.
The main environmental rules applicable to infrastructure projects include those described above in “—Engineering and Construction—Environmental Regulation.”
Peruvian Hydrocarbon Regulation
Our hydrocarbon operations are subject to governmental regulations as described below.
Exploration and Production
GMPUNNA Energía is engaged in two major activities relating to the exploration and production of oil and gas: exploration and production of oil fields; and providing services to the oil industry.
Exploration and Production of Oil Fields
Peru’s hydrocarbon legislation regarding oil and gas exploration and production activities includes, among others, the Hydrocarbon Organic LawHydrocarbons law approved by Supreme Decree No. 42-2005-EM and the regulations governing the qualification of petroleum companies; the exploration and production of hydrocarbons; the transportation of hydrocarbons; hydrocarbons pipelines and safety requirements in such activities.
The foregoing regulations define the roles of Peruvian government agencies whichthat regulate the oil and gas industry; provide the framework for the promotion and development of hydrocarbon activities based on the principles of private-sector competition and access to all economic activities; and set the safety and security standards as well as the legal proceedings for carrying out operations.
The Peruvian Constitution establishes that the government is the sole proprietor of underground hydrocarbons within its national territory. However, the Peruvian government has granted Perupetro, a state-owned company authorized to negotiate and enter into agreements for the exploration and/or production of hydrocarbons, the ownership right over the hydrocarbons extracted which allows Perupetro to enter into such agreements. Furthermore, the Peruvian Ministry of Energy and Mines, the Environmental Evaluation and Supervision Agency (“OEFA”) and OSINERGMIN constitute publicare governmental entities that play an active role inentitled to oversee and supervise oil and gas regulation.activities.
The Peruvian Ministry of Energy and Mines is responsible for devising energy and mining policies; supervising activities in the energy and mining sectors; and promoting investments in those sectors. Within the Peruvian Ministry of Energy and Mines, the General Directorate of Hydrocarbons (“DGH”) is responsible for regulating the development of oil and gas fields and the General Directorate of Energy-Related Environmental Affairs (“DGAAE”DGAAH”) is responsible for reviewing and approving regulations related to environmental risks associated with hydrocarbon exploration and production activities.
OEFA is a public entity ascribed to the Peruvian Ministry of the Environment and is responsible for evaluating and ensuring compliance with applicable environmental rules covering hydrocarbon activities, as well as for initiating sanctioning proceedings when a breach of an environmental regulation occurs. OSINERGMIN is a public entity ascribed to the Presidency of the Council of Ministers’ (Presidencia del Consejo de Ministros) office and is responsible for ensuring compliance with safety and security standards in the hydrocarbon industry, as well as for sanctioning proceedings. GMPUNNA Energía is subject to the supervision, authority and regulations enacted by the foregoing agencies.
Regarding hydrocarbon exploration and production activities, companies are required to enter into either a licensing or a services agreement with Perupetro; other contractual arrangements are permitted with prior approval from the Peruvian Ministry of Energy and Mines. The foregoing agreements are governed by private law and must be approved by the Peruvian Ministry of Energy and Mines and the Peruvian Ministry of Economy and Finance. In licensing agreements, licensees obtain authorizations to explore and produce hydrocarbons in a determined area, are granted ownership over the extracted hydrocarbons and are subject to the payment of royalties. Licensees may trade the hydrocarbons with no limitations on sales prices, except in the event of a national emergency.
Services agreements grant contractors the right to perform hydrocarbon exploration and production activities in a determined area and receive compensation according to the production of hydrocarbons. The contractor is technically and financially responsible for the operations, but Perupetro maintains the ownership over the hydrocarbons extracted. GMPUNNA Energía is party to services agreements with respect to Blocks I and V, and to licensing agreements with respect to Blocks III and IV. Each block has an independent contract with Perupetro.
Services and licensing agreements are intended for the development, production and eventually transportation of hydrocarbons, as well as for certain storage activities. Services and licensing agreements commonly include a minimum performance schedule guaranteed by performance bonds and requirethe obligation to establish corporate guarantees to be issued to secure the contractor’s compliance towith the provisions established by the parties.terms of such agreements.
Additionally, a company must be qualified by Perupetro prior to entering into hydrocarbon exploration and production agreements. In order to qualify, a company must meet the standards under the Regulations on the Qualification of Petroleum Companies (approved by means of Supreme Decree No.030-2004-EM), requiring companies to demonstrate that they have the technical, legal and financial capacity to comply with all the obligations they will assume under the agreement with Perupetro. Such capacities are measured according to the characteristics of the area to be explored or produced, the expected investment required for the project, and the strict fulfillment of the rules regarding prior consultation (if applicable), citizen participation and environmental issues related to the operation’s performance. Upon a positive evaluation, the company is issued a qualification certificate from Perupetro that allows it to initiate the negotiations of the agreement. Notwithstanding the foregoing, the company remains responsible for obtaining all other licenses, permits and approvals required by applicable regulation.
Under the current regulation, 30 years is the maximum term of services and licensing agreements for the production of crude oil. On the other hand, natural gas and condensates-related services or licensing agreements have a maximum term of 40 years. Graña y MonteroAENZA acts as GMP’sUNNA Energía’s guarantor in all of the Block I, Block III, Block V and Block VI contracts.
GMPUNNA Energía must comply with Supreme Decree No.043-2007-EM for its activities relating to hydrocarbons in all phases. The OSINERGMIN is the authority responsible for the supervision and enforcement of the foregoing rules.
Services to the Petroleum Industry
Peruvian regulation provides that all companies that enter into a service agreement with any company that holds a licensing or services agreement must be registered as a subcontractor in the Hydrocarbons Public Registry in case they render any of the following services: (i) geological studies, geophysical studies, petroleum engineering related to drilling operations, production and well services; or (ii) construction of oil pipelines, gas pipelines, refineries and their maintenance, and specialized transportation by land, air, sea or river. In order to register a company as a subcontractor in the Hydrocarbons Public Registry, prior authorization from the General Directorate of Hydrocarbons (“DGH”) of the Peruvian Ministry of Energy and Mines is required.
On June 1, 2004, GMPUNNA Energía was included as a subcontractor for the petroleum industry in the Hydrocarbons Registry of Lima’s Public Registry of Legal Entities; such registry remains in force as of the date of this annual report.
Environmental Regulations
The Peruvian Ministry of Energy and Mines is responsible for enacting environmental regulation for the oil and gas sector. The Oil and Gas Environmental Protection Regulation, approved by Supreme Decree No.039-2014-EM and modified by Supreme Decree No.023-2018-EM, sets out the legal framework and specific rules applicable to the exploration, production, refinement, processing, transportation, commercialization, storage and distribution of hydrocarbons, with the aim of preventing, controlling and remedying the negative environmental impacts arising from the foregoing activities.
The Peruvian Ministry of the Environment establishes general rules applicable to different activities in several sectors, in contrast to the specific rules enacted by the Peruvian Ministry of Energy and Mines regarding the oil and gas sector. Environmental laws and regulations are enforced by the National Environmental Enforcement Agency, OEFA (Organismo de Evaluación y Fiscalización Ambiental) which was created in 2008. Sanctions range from warnings and fines to suspensions of activities and mitigation of environmental damages, among others. In this regard, a breach of the obligations contemplated in the Environmental Impact Assessments in the hydrocarbons sector may originate fines up to 30,000 Tax Units (approximately US$39 million or S/126 million)according to the applicable law.
The main environmental rules applicable to GMP’sUNNA Energía’s hydrocarbon projects include:
obtaining an environmental certification and adopting the necessary measures to prevent and/or mitigate environmental impacts resulting from their activities;
meeting minimum size, environmental and safety requirements applicable to worksites; handling and storing of hydrocarbons pursuant to safety and environmental requirements; establishing programs to monitor environmental issues; and
providing training on environmental matters related to employee and personnel activities and responsibilities, especially with respect to regulations and procedures established for environmental protection and the environmental and legal consequences ofnon-compliance.
Operation of Terminals
In accordance with the Glossary, Acronyms and Abbreviations for the Hydrocarbons Subsector approved by Supreme DecreeNo. 032-2002-EM, a terminal is a facility that includes storage tanks, submarine lines or docks for receiving or dispatching liquid hydrocarbons and facilities related to activities of storage and reception and/or dispatch of liquid hydrocarbon from/to vessels.
Consorcio Terminales and Terminales del Perú are two joint operations conducted by GMP and Oiltanking Peru S.A.C. which currently operates ten of Petroperú’s terminals in Peru: (i) the South Terminals of Pisco, Mollendo, Ilo, Juliaca and Cuzco; and (ii) the North Terminals of Eten, Salaverry, Chimbote and Supe; including Callao, respectively. Consorcio Terminales and Terminales del Perú provide hydrocarbons handling and storage services in Peru for gasoline, aviation fuel and diesel, among others.
The operation of both the South and North Terminals was granted through the “South Terminal Operation Agreement” and the “North Terminal Operation Agreement” (the “Operation Agreements”) dated February 2, 1998, by and among Petroperú and Consorcio Terminales. The Operation Agreements resulted from two tenders in accordance with Legislative Decree No. 674, and mandate that Consorcio Terminales, as operator of the terminals, be responsible for the storage, handling, additivation and dispatch of hydrocarbons in such facilities.
The initial term of the Operation Agreements was 15 years; however the parties agreed to extend the duration of the agreement to an additional 18 months ending in August 2014. The purpose of this extension was to undertake the additional investments that were necessary to satisfy the national demand increase and to perform operative and safety-related improvements to the facilities. In July of 2014, the operation agreements were extended for an additional four years ending in July of 2018.
The South Terminal operation agreement has been extended to August 1, 2019. With respect to the North Terminal operation agreement, the agreement with Consorcio Terminales expired on October 31, 2014, however, GMP and Oiltanking were granted a new operation agreement for the terminal, this time under the ‘Terminales del Perú’ Consortium, which provided for a 20 year extension that will end on November 1, 2034. Additionally, Terminales del Peru was granted with the operation agreement for the terminal del Centro-Callao, for 20 years commencing on September 2, 2014 until September 1, 2034. In executing their operations, both Consorcio Terminales and Terminales del Perú are committed to develop and follow a work program which must include an investment schedule. The work program performed included the installation of protection systems and loading systems, among others, and was secured by a performance bond.
GMP’sUNNA Energía’s activities as a part of Consorcio Terminales del Peru fall under the scope of the Hydrocarbons Storage Safety Regulation, approved by Supreme Decree No.052-93-EM. Consorcio Terminales del Peru is registered in the Hydrocarbon Registry of OSINERGMIN and is authorized to perform transportation activities such as loading and unloading hydrocarbons from vessels on the terminals. This regulation establishes the conditions under which GMPUNNA Energía can operate and maintain storage facilities for hydrocarbons. For instance, the regulation specifies the technical requirements for storage systems, which vary depending upon the kinds of hydrocarbons stored. Moreover, pursuant to this regulation, GMPUNNA Energía must establish procedures to minimize potential risks that these facilities present for employees, third parties and properties.
Gas Processing Plants
In accordance with the Glossary, Acronyms and Abbreviations for the Hydrocarbons Subsector, approved by Supreme DecreeNo. 032-2002-EM, a processing plant is a facility where the natural characteristics of hydrocarbons are changed to break them into the different compounds that comprise them, as well as the subsequent transformations to convert the hydrocarbons into fuel of specific qualities and suitable for transportation. This includes the facilities where the impurities, hydrogen sulfide, carbon dioxide, water and hazardous components are removed from natural gas.
OurThe processing and fractionationdividing activities fall under the scope of regulations governingUNNA Energía in Talara’s gas station are governed by hydrocarbons refinementrefining and processing regulations, including regulations on the design, construction, operation and maintenance of refineries and hydrocarbons processing plants, the oil refining process, the manufacture of natural asphalts, oil and lubricants, basic petrochemical activities and the processing of natural gas and condensates. In order to comply with these regulations, GMPUNNA Energía must take cautionary measures in order to protect the safety of its employees and its facilities, protect the environment, preserve energy resources and ensure the quality of the products or services it delivers. For instance, GMP’s plant operationsTalara’s gas station operation must be authorized by the General Direction of Hydrocarbons and comply with fire safety regulations. In the event of an accident, GMPUNNA Energía must notify OSINERGMIN, the Peruvian Ministry of Energy and Mines, the Peruvian Ministry of Labor and the Peruvian Social Security Administration.Administration, according to the seriousness and type of the accident.
Terms of our Concessions
Our concessions are subject to certain terms and conditions established in each concession agreement. During the term of the concessions, we are responsible for the construction and maintenance of the infrastructure necessary to their operation. The concession agreements establish minimum capital stock requirements for our concessionaire subsidiaries as follows: US$15 million (S/50 million), US$8 million (S/27 million), US$0.8 million (S/2.7 million), S/46 million and S/100 million for Norvial, Survial, Canchaque, La Chira and the Lima Metro, respectively.
The concession agreements establish grounds for termination including mutual agreement of the parties thereto, force majeure and breach of certain contractual obligations. Additionally, in the case of La Chira and the Lima Metro, the agreement can be terminated unilaterally by the grantor, with the payment of compensation. On the expiration date, all of the assets that are essential for the operation of the concession are considered the state’s property and no compensation is paid to the concessionaire.
In the event that changes in legislation or regulations that are exclusively related to the financial conditions of the earnings and/or costs associated with the investment, operation or conservation of the infrastructure, affect the economic terms of the contract by 10% or more, the concession agreements set forth economic terms adjustment mechanisms aimed at restoring the economic and financial equilibrium. See “—Infrastructure—Principal Infrastructure Lines of Business.”
Real Estate
Since 1987, we have been operating in the Peruvian real estate sector. In 2008, we incorporated Viva GyM to concentrate the group’s activities in this sector including promoting and managing real estate projects including affordable housing and housing and commercial real estate projects.
Zoning Regulations
Article 79 of the Municipalities Organic Law (Law No. 27,972) establishes that municipal governments are the exclusive authority responsible for approving urban and rural development plans, as well as the zoning of urban areas under their jurisdiction. Peruvian regulation states that urban zoning refers to the division of a municipal jurisdiction in zones for specific usage, such as residential, commercial, industrial ormixed-use.
The main zoning rules applicable to our real estate projects include the following: obtaining a construction license from the corresponding local municipality before commencing construction, reconstruction, conservation or repair of any property.
Environmental Regulations
The Environmental Protection Regulation for real estate, urbanism, construction and regularization related projects, approved by Supreme Decree No.015-2012-VIVIENDA (modified by the Supreme Decree No.°019-2014-VIVIENDA and Supreme Decree No. 0082016-VIVIENDA), sets out to prevent, mitigate, control and remedy negative environmental impacts that may arise from real estate developments. Prior to initiating construction works, companies are required to obtain an environmental authorization from the Housing, Urbanism, Regularization or Construction National Directorate of the Peruvian Ministry of Housing, Construction and Sanitation and to comply with the provisions set forth in the corresponding environmental impact assessment.
The main environmental rules applicable to our real estate projects include the following:
undertaking an environmental impact assessment; and
requesting the environmental classification of our projects, which depends on the environmental risks associated therewith.
Licenses
Article 10 of the Single Revised Text of the Urban Habilitation and Buildings Law No. 29090, approved by Supreme DecreeNo. 006-2017, establishes the license requirements for urban habilitation and construction, depending on land size, the dimensions of the work to be undertaken and the financial target.
Upon completion of the real estate development and construction stages, as the case may be, the following requirements must be met:
| | • | | for urban development, the reception of the works (recepción de la obra) must be requested to the corresponding municipal government in compliance with Article 19 of the Single Revised Text of the Urban Habilitation and Buildings Law; and |
| | • | | for construction, the conformity of the works (conformidad de obra) must be requested to the corresponding municipal government in compliance with Article 28 of the Single Revised Text of the Urban Habilitation and Buildings Law, accompanying the request with the construction plans and the construction statement (a description of the technical conditions and characteristics of the work performed). |
Exclusive and Common Property Real Estate Units Regimes
The Law on the Buildings Regularization, on the Factory Declaration Proceeding and on the Exclusive and Common Property Real Estate Units Regime, approved by Law No. 27,157,27157, establishes the legal regime applicable to real estate comprised of assets with exclusive and common property, including, among others, (i) apartment buildings; (ii) condominiums; (iii) units underco-ownership; and (iv) commercial spaces, such as galleries and malls. The foregoing construction projects must include internalby-laws prepared or approved by the sponsor or builder, or by the owners with the vote of the majority of participating owners, the content of which is regulated in Article 42 of the aforementioned law. Articles 40 and 41 of the foregoing law itemize the assets and services that qualify as common.
Owners of real estate units have the opportunity to choose between the exclusive and common property regime, and the independent andco-ownership regime. The internalby-laws, the owner’s assembly minutes, all construction plans, architectural division plans, perimetric boundaries and the construction statement must be registered in the Real Estate Registry of the corresponding jurisdiction. Upon completion of the proper registries, units are registered independently from one another.
Fondo Mivivienda
The acquisition of affordable housing units developed by Viva GyM is often financed by Fondo Mivivienda S.A., a publicly owned financial institution established in 1998 by Law No. 26,912,26912, with the purpose of (i) promoting and financing the acquisition, bettering and construction of houses, especially those of social interest; (ii) carrying out activities related to the fostering of capital flows to the housing financing market; (iii) participating in the primary and secondary markets of mortgage credits; and (iv) contributing to the development of the capital markets.
Prevention of Money Laundering and Financing of Terrorism
SBS ResolutionNo. 789-2018 (that has replaced SBS ResolutionNo. 486-2008 as of March 15, 2018), as amended from time to time, requires construction and real estate companies to implement a money laundering and terrorism financing prevention system, including, among others, appointing a compliance officer, setting a registry of operations and notifying the Financial Intelligence Unit of the SBS, the entity responsible for supervising and enforcing compliance to the resolution referred to herein, of any suspicious activity.
Public- and Private-Sector Contracts
Concar provides services in compliance with Peru’s Public Procurement Law and its Regulations, approved by Supreme Decree No.°082-2019-EF (Texto UnicoÚnico Ordenado de Ley de Contrataciones del Estado) and its Regulations, approved by Supreme DecreeNo. 344-2018, when dealing with public counterparties; and with the regulation set forth in the Civil Code when dealing with private counterparties. Such regulations establish the different types of selection processes which companies may undergo when contracting with the state, as well as the rules and conditions applicable to such processes. They also establish general rules applicable to contractual relationships among private parties. See “—Engineering and Construction” for more information on the applicable legal frameworks. Concar is registered with the Peruvian National Registry of Suppliers, required to act as supplier for public entities.
Intellectual Property
Certain operations of GMICumbra Ingeniería are protected by Peruvian Copyright Law, approved by Legislative Decree No. 822, specifically the engineering drawings registered in the INDECOPI Copyright Registry. However, the company’s business and profitability are not dependent on patents or licenses; industrial, commercial or financial contracts;contracts in connection to patents or licenses; or new manufacturing processes.
C. Organizational Structure
| C. | Organizational Structure |
The following organizational chart sets forth our principal operating subsidiaries within our three business segments.
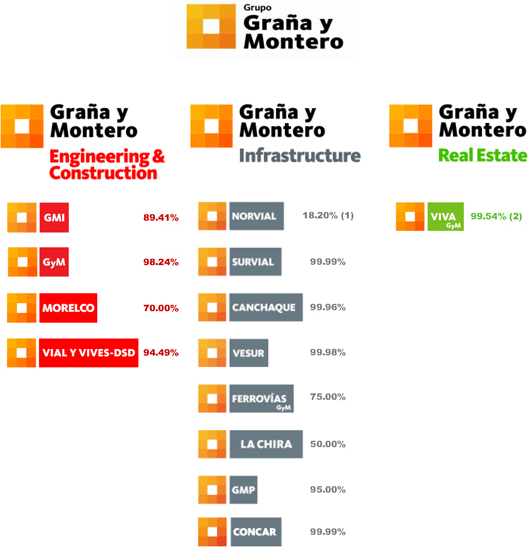
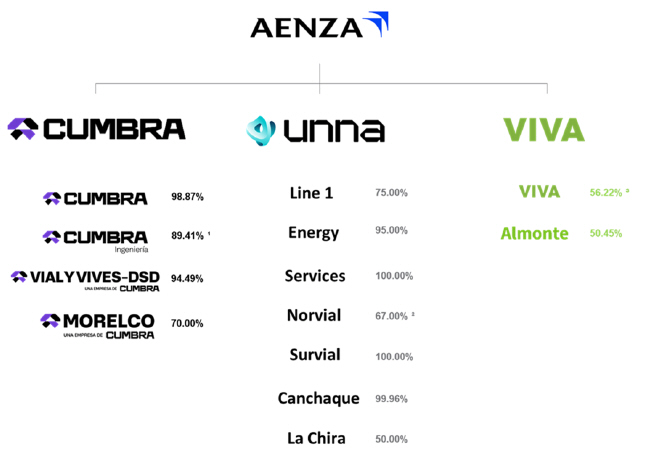
| (1) | 66.6% of Cumbra Ingeniería shares have been assigned to a trust formed to the benefit of the Peruvian state to secure the company’s contingent obligation to pay compensation resulting from the investigations of the company by the Peruvian state. See “Item 3.D. Key Information—Risk Factors—Risks Related to Key Developments—Investigations regarding potential corruption or other illegal acts could have a material adverse effect on our business, financial condition and results of operations”. |
| (2) | In June 2018, the company transferredassigned economic rights over 48.8% of the share capital of Norvial to Inversiones en Autopistas S.A. by transferring its Class B shares. Ourshares of Norvial. The company continues to possess 67% of the voting rights of Norvial and an economic interest of 18.2% of Norvial’s share capital. JJC Contratistas Generales S.A. owns the remaining 33.00%33.0%. |
(2)(3) | 36.10%43.3% of the share capital inof Viva GyM is held by our subsidiary GyM.Cumbra.
|
The following charts set forth the principal activities of each of our three business segments:

The following is a brief description of our principal operating subsidiaries:
Engineering and Construction:
GyM S.A. (“GyM”),Cumbra, incorporated in Peru, is one of the oldest and largest construction companies in Peru. Graña y MonteroAENZA owns 98.24%98.87% of GyM;Cumbra; the remaining 1.76%1.13% is held by former and current company executives.
Vial y Vives—DSD S.A. (“Vial y Vives—DSD”), incorporated in Chile, is an engineering and construction company specialized in the mining sector and in providing services to the energy, oil and gas, and cellulose sector. GyM,Cumbra, through GyM Chile SpA, owns 94.49% of Vial y Vives—DSD; Inversiones VyV S.A., a company controlled by the founders of Ingeniería y Construcción Vial y Vives S.A., (which merged to form Vial y Vives—DSD) owns 1.36%; and the remaining 4.15% is held by third parties.
GMI S.A. Ingenieros Consultores (“GMI”),Cumbra Ingeniería, incorporated in Peru, is primarily engaged in engineering consultancy for projects in the mining, hydrocarbons, electrical, agricultural, industrial, tourism and transportation sectors. Graña y MonteroAENZA owns 89.41% of GMI; 5.0% is heldCumbra Ingeniería (66.6% of Cumbra Ingeniería’s shares have been assigned to a trust created in benefit of the Peruvian state to secure the company’s contingent obligation to pay compensation to the Peruvian state in respect of investigations of the company by current and former company executives;the Peruvian state), and the remaining 5.59%10.59% is held by third parties.distributed among former company executives (5.27%) and successors thereof (5.32%).
Morelco, S.A.S. (“Morelco”), incorporated in Colombia, is a recognized specialist in electromechanical assemblies, civil works, and services for the oil and gas and other energy sectors. Our subsidiary GyM S.A.Cumbra owns 70.0% of Morelco, and the remaining 30% is held by the Serna family in trust.
Norvial, incorporated in Peru, is the concessionaire of the 183 km stretch between Ancón and Pativilca of the Panamerican Highway. Norvial is comprised of common shares (Class A), andnon-voting shares (Class B). In June 2018, the company transferred economic rights over 48.8% of the share capital of Norvial to Inversiones en Autopistas S.A. by transferring its Class B shares. The company continues to possess 67% of voting rights of Norvial and an economic interest of 18.2% of Norvial’s share capital. JJC Contratistas Generales S.A. owns the remaining 33.0%.
Survial, S.A. (“Survial”), incorporated in Peru, is the concessionaire of the 750 km highway between Marcona and Urcos in Peru. Graña y MonteroAENZA owns 99.995% of Survial, and the remaining 0.005% is held by Concar S.A.
Concesión Canchaque, S.A.C. (“Canchaque”), incorporated in Peru, is the concessionaire of the 78 km highway between the towns of Buenos Aires and Canchaque in Peru. Graña y MonteroAENZA owns 99.96% of Canchaque, and the remaining 0.04% is held by Concar S.A.
Concar, S.A., incorporated in Peru, is engaged in the operation and maintenance of infrastructure assets. Graña y Montero S.A.A.AENZA owns 99.9983% of Concar and the remaining 0.0017% is held by GyM S.A.Cumbra.
GyM Ferrovías S.A. (“GyM Ferrovías”),Línea 1, incorporated in Peru, is the concessionaire of Line One of the Lima Metro. Graña y MonteroAENZA owns 75.0%75% of GyM Ferrovías;Línea 1; the other 25.0%25% is held by Ferrovías Participaciones S.A., a railway infrastructure company.
Concesionaria La Chira, S.A. (“La Chira”), incorporated in Peru, is the concessionaire of La Chira waste water treatment plant in southern Lima, Peru. Graña y MonteroAENZA owns 50.0%50% of La Chira; the other 50.0%50% is held by Acciona Agua S.A,S.A., an affiliate of a waste water treatment and distribution company.
GMP S.A. (“GMP”),UNNA Energía, incorporated in Peru, is engaged in the oil and gas business and provides hydrocarbon extraction services to Perupetro, S.A., a Peruvian state oil company; owns a gas processing plant; and, through a joint operation with a Peruvian affiliate of Oiltanking GmbH, operates tenfive fuel terminals in Peru. Graña y MonteroAENZA owns 95.0%95% of GMP;UNNA Energía; the remaining 5.0%5% is held by a former company executive.
Viva, GyM S.A. (“Viva GyM”), incorporated in Peru, is focused on the development and sale of affordable housing and housing, as well as other real estate projects such as office buildings and shopping centers. Graña y MonteroAENZA directly owns 63.44%56.2% of Viva, GyM, with GyM owning an additional 36.10%Cumbra owns 43.3%; and the other 0.46% is owned by a company executive.
D. Property, Plant and Equipment
| D. | Property, Plant and Equipment |
Approximately 82.2%90% of our assets are located in Peru, with the remaining balance located in Chile and Colombia. At December 31, 2018,2020, the net book value of the company was US$139.3111.9 million (S/.470.6405.5 million). We currently lease certain machinery and equipment from vendors. The term of our leasing contracts ranges from two to five years, depending on the nature of the equipment. Leased machinery and equipment are capitalized for accounting purposes. Our principal executive offices, which we lease, are located at Av. Paseo de la República 4667, Surquillo, Lima 34, Peru and Av. Petit Thouars 4957, Miraflores, Lima 18, Perú.
Insurance and Contingency Planning
We have insurance coverage for fire; strike, riot, malicious damage, vandalism and terrorism; loses or damages to construction machinery and equipment; destruction or disappearance of property; civil liability, including physical harm to third parties; professional liability; transportation; vehicle theft, collision, rollover, fire and accidents; and directors and officersofficers’ liability. Additionally, we carry different policies for specific risks related to our business segments. Our management considers this coverage to be sufficient to cover probable losses and damages, taking into consideration the nature of our activities, the risks involved in our transactions and the advice of our insurance brokers.
We also have contingency plans in place in order to protect our company and the interests of our clients. In the event of an emergency, we have procedures in place designed to minimize any resulting interruption in service to our most critical business processes.
ITEM 4A. UNRESOLVED STAFF COMMENTS
ITEM 4A. | UNRESOLVED STAFF COMMENTS
|
Not applicable.
ITEM 5. OPERATING AND FINANCIAL REVIEW AND PROSPECTS
ITEM 5. | OPERATING AND FINANCIAL REVIEW AND PROSPECTS
|
The following discussion should be read in conjunction with our consolidated financial statements included in this annual report, which have been prepared in accordance with IFRS issued by the IASB. The following discussion contains forward-looking statements that involve risks and uncertainties. Our actual results may differ materially from those discussed in the forward-looking statements as a result of various factors, including, without limitation, those set forth under “Part I. Introduction. Forward-Looking Statements” and “Item 3.D. Key Information—Risk Factors.”
Overview
We are the largest engineering and construction company in Peru as measured by revenues during 2018,2020, and one of the largest publicly traded engineering and construction companies in Latin America as measured by market capitalization as of December 31, 2018,2020, with strong complementary businesses in infrastructure and real estate services. With more than 85 years of operations, we have a long track record of successfully completing the engineering and construction of many of the country’s landmark private and public sector infrastructure projects. Beginning in themid-1980s, we decided to leverage our engineering and construction expertise into complementary lines of business. We have also undertaken the engineering and construction of large and complex projects outside our home market throughout our history. More recently,In addition, we have expanded our activities into other key markets of the Latin American region through the acquisition of businesses with solid positions in those markets.
RecentThe Impact of the Ongoing Novel Coronavirus (COVID-19) Pandemic
The ongoing COVID-19 pandemic and government measures to contain the spread of the virus are disrupting economic activity, and consequently adversely affecting our business, results of operations and financial condition. As conditions are uncertain and changing rapidly, it is difficult to predict the full extent of the impact of the pandemic. If conditions persist, however, it is likely that the pandemic and the related government measures will continue to have a material adverse effect on the company.
Countries around the world—including Peru as well as Chile and Colombia—have adopted extraordinary measures to contain the spread of COVID-19, including imposing travel restrictions, requiring closures of non-essential businesses, establishing restrictions on public gatherings, instructing residents to practice social distancing, issuing stay-at-home orders, implementing quarantines and similar actions. Depending on how the spread of the virus evolves, governments may extend these measures for longer periods. As of the date of this annual report, Peru has extended certain extraordinary measures until May 31, 2021, including curfews and limitations on public gatherings and travel. Chile and Colombia have extended certain extraordinary measures until June 30, 2021 and May 31, 2021, respectively.
The COVID-19 pandemic and the related government measures have significantly increased economic uncertainty and caused a global recession. According to the International Monetary Fund, during 2020, the global economy contracted by 3.3%, with Latin America contracting 7.0% and Peru, Chile and Colombia, in particular, contracted 11.1%, 5.8% and 6.8%, respectively. Moreover, the impact of the pandemic on economic activity has been severe, and we cannot predict the extent to which the economies in the countries where we operate will ultimately be impacted.
The COVID-19 pandemic adversely affected our results of operations during the 2020 year, and continues to significantly and adversely affect our business, results of operations and financial condition. Infections have caused halts and delays in our engineering and construction projects, which have caused us to renegotiate performance targets with certain clients. These interruptions and negotiations add costs with respect to our projects, and caused us to include additional allowances for certain accounts receivable and impairments to the group’s long-term assets. We cannot assure you that we will be able to transfer any of these additional costs to our clients. Moreover, from mid-March until the end of May 2020, substantially all of our engineering and construction projects, particularly in Peru, and real estate projects, were mandatorily shut down. Although since July 2020, these projects have resumed operations with COVID-19 protocols in place, we cannot assure you that work will not be halted again or that these projects will be completed on time or at all. Our infrastructure operations, which have for the most part been declared essential businesses, have continued; however, certain of our infrastructure businesses have been adversely affected, in particular, by the sharp decline in traffic volumes and fluctuations in oil and gas prices. Additionally, the Peruvian Congress suspended the payment of tolls on roads between May and June of 2020.
Because the extent of the COVID-19 pandemic and its impact on the industries in which we operate cannot be predicted at this time, the full extent to which COVID-19 will impact our business, results of operations and financial condition is currently unknown. We believe that the severity of the impact on the company will depend, to a large extent, on how long the crisis continues. We expect that our results of operations for the 2021 year will continue to be impacted, as adverse conditions have persisted. We do not expect our financial performance to improve until current restrictions designed to confront COVID-19 are lifted and economic activity and, eventually, capital investment resume, which will depend, to a large degree, on health concerns from the pandemic subsiding and on the recovery of economic conditions. For more information, see note 37 to our audited annual consolidated financial statements included in this annual report.
We are taking significant measures to mitigate the impact of the crisis on the company. Among other measures, we are prioritizing the health and safety of our employees, as well as the medium-term sustainability of their employment. Certain actions we are taking include: the design and implementation of protocols to return to project sites, the creation of new office layouts to be compliant with social distancing guidelines, the development of telecommuting schemes, and other cost-saving initiatives. For more information on measures we are evaluating to reduce expenses, see “—Liquidity and Capital Resources.”
Key Developments
Overview
We have participated in six consortia with affiliates of Odebrecht related to the construction and operation of infrastructure projects in Peru with affiliates of Odebrecht during the period from 2005 to 2017 (known as: IIRSA South (tranches II and III); IIRSA North; Tranches 1 and 2 of the Lima Metro; Gasoducto Sur Peruano; and Chavimochic). Our stakes in these projects ranged from 17% to 33%. None of these projects have been operating since February 2017. On
In December 21, 2016, Odebrecht entered into a plea agreement with U.S., Brazilian and other authorities in which they admitted to making illegal bribery payments in connection with projects in various countries, including Peru. These projects include certain consortia and companies in which we participated. As a result of the plea agreement, Peruvian authorities have initiated congressional inquiries and criminal investigations against our company and certain of our former directors and senior management.
Additionally, on January 24, 2017, the Peruvian government terminated the gas pipeline concession held by GSP, a consortium in which we participated with Odebrecht affiliates, due to failure of GSP to obtain the required project financing by the stipulated deadline. The termination of the GSP gas pipeline concession, despite the government payment contemplated under the concession contract, has had a material impact on our consolidated financial results and backlog.
In response to these events, we have instituted a multi-step strategic action plan. This strategic action plan includes: (i) monitoring the process for government payment resulting from the termination of the GSP gas pipeline concession; (ii) renegotiations with creditors of certain debts that became due upon termination of the GSP gas pipeline concession contract; (iii) board approval of the sale of certainnon-strategic assets to repay debt related to GSP; (iv) an internal investigation relating to our participation in consortia with Odebrecht; (v) an assessment to strengthen our anti-corruption compliance program; and (vi) changes to our board of directors and senior management.
See “Item 3.D. Key Information—Risk Factors —Risks Related to RecentKey Developments.”
Our Association with Odebrecht
We have participated in six construction and operation of infrastructure projects in Peru with affiliates of Odebrecht during the period from 2005 to 2017 (known as: IIRSA South Tranche II; IIRSA South Tranche III; IIRSA North; Electric Train Platform; Gasoducto Sur Peruano; and Concesionaria Chavimochic S.A.C. (“Chavimochic”). Our stakes in these projects ranged from 17% to 33%. During 2018, none of these projects (including Chavimochic) were currently ongoing. During the period from January 1, 2005 to December 31, 2018, 84% of the projects carried out by our company, in terms of consolidated revenues, involved the private sector, while projects with Odebrecht accounted for less than 4% of our consolidated revenues during this period. In its plea agreement, Odebrecht admitted to paying bribes in connection with the IRSA South Tranche II, the IRSA South Tranche III and the Electric Train Platform.
Recent news reports have indicated that Odebrecht has executed a settlement and cooperation agreement with the Peruvian government regarding several infrastructure projects in the country, including certain projects in which we have participated. According to news reports, under the agreement Odebrecht has agreed to pay compensation to the Peruvian government over the course of several years and to cooperate with, and provide evidence to, prosecutors in connection with ongoing investigations by this Peruvian government. According to news reports, former senior officers of Odebrecht’s affiliate in Peru have indicated to Peruvian prospectors (sometimes in apparent contradiction with prior statements) that certain of our former directors and senior management were aware that Odebrecht had made corrupt payments to government officials in connection with certain projects in which we participated. We have undertaken an internal investigation and we continue to review and assess the past practices of our company, to determine whether there has been any wrongdoing on the part of our former or current directors, officers and employees.
The Chavimochic concession, awarded in 2013 for the design, construction, operation and maintenance of major hydraulic works in northern Peru, is the only project with a contract in effect in which we are currently associated with Odebrecht. Affiliates of Odebrecht own 73.5% of the Chavimochic-related concessionaire company and construction consortium, and we hold the remaining 26.5% stake. As a result of the government’s failure to deliver land required for the project, the project’s first phase, hydraulic works, cannot be concluded, and the project’s second phase cannot begin. Since February 2017, the Chavimochic consortium has requested the termination of the concession in light of the government’s breach, and the parties are currently in discussions, including for a potential sale of the project. As of December 31, 2018, our investment in this project amounted to US$6.1 million (S/.20.5 million) and our portion of the performance guarantee amounted to US$9.5 million (S/.32.1 million).
Termination of the Gasoducto Sur Peruano Concession
In September 2015, we entered into a memorandum of understanding to invest US$215 million (S/.722722 million) for a 20% stake in GSP, a company that had previously been awarded the concession for the design, construction and operation of the southern gas pipeline, a project to deliver natural gas to the southern region of Peru, particularly to the provinces of Cuzco, Arequipa, Puno and Moquegua. With our 20% investment commitment made on November 2, 2015, an affiliate of Odebrecht owned a 55% interest and an affiliate of Enagás International, S.L. (“Enagas”) owned a 25% interest in GSP. As of the date of this annual report, we have made total investments in the project in an amount of US$243 million (S/.811 million).
On January 24, 2017, the Peruvian government terminated the concession due to GSP’s failure to obtain the required project financing by the stipulated deadline. As a result, we recognized impairments with respect to our investment in and long term account receivables from GSP and our participation in CCDS.
In accordance withPursuant to the concession contract, the Peruvian government is required to carry out an auction process to sell GSP’s assets and obtain a new concessionaire within one year of the contract termination, with the funds raised in the sale to be used to pay the existing concessionaire for its investment in the project. The amount of the termination payment is required to be no more than 100% and no less than 72.25% of the net carrying amount (valor contable neto), as defined in the concession contract. Consequently, the auction process should initiate with a base price equivalent to 100% of the net carrying amount. If the auction is unsuccessful in the first round, the government is required to undertake a second round, with a base price equal to 85% of the net carrying amount; and, if the second round is unsuccessful, the government is required to undertake a third round, with a base price equal to 72.25% of the net carrying amount. If a successful bidder is not obtained from such auction processes within one year of the termination of the contract, the government shall pay the concessionaire a termination payment equal to the existing concessionaire would be 72.25%100% of the net carrying amount.
The Peruvian Ministry of Energy and Mines announced onin April 18, 2017 that the auction process for the new concessionaire of the project assets would be carried out during the first quarter of 2018, notwithstanding the requirements under the concession contract. On April 28, 2017, a2018. A third party was appointed, through an adjudication process, as temporary custodian and administrator of the gas pipeline assets until the new bidder is awarded the concession. SinceHowever, since that time, the Peruvian government has not indicated an intention to commence the auction process. Although the concession contract provides that payment be made within one year of termination, the Peruvian Ministry of Energy and Mines has not made payment or, to our knowledge, initiated the auction or payment process. Because this payment has not been made, GSP’s right to compensation pursuant to the concession contract should be 100% of the net carrying amount.
In 2016, in connection with efforts to restructure or sell Odebrecht’s participation in GSP, due to the corruption scandal surrounding Odebrecht, Odebrecht contractually agreed to subordinate its claims under the concession to the other project partners, EnagásEnagas and ourselves. As a result, we and Enagas may be entitled to repayment of our percentage payment under the concession contract prior to Odebrecht. However, onIn January 3, 2018, Odebrecht commenced arbitration proceedings against us, our subsidiary GyMCumbra and Enagás,Enagas, seeking to invalidate the contractual subordination.subordination, but Odebrecht subsequently withdrew the claim.
On December 4, 2017, GSP voluntarily commenced bankruptcy proceedings in Peru. GSP’s assets will be liquidated purusantpursuant to Peruvian law. GSP’s only substantiallysubstantial asset is the claim for government payment described above, as contemplated under the concession contract in the event of termination.
On December 21, 2018, we formallyAlthough the concession contract provides that payment must be made within one year of termination, the Peruvian Ministry of Energy and Mines has not made any payment or, to our knowledge, initiated the procedurepayment process or the auction process for direct negotiations witha new concessionaire. As a result, after the six-month period mandated by the concession contract for the parties to discuss the matter, in October 2019, we asserted our rights against the Peruvian government by filing a request for arbitration before the International Centre for Settlement of Investment Disputes. However, in December 2019 we withdrew our request for arbitration, as required by Peruvian authorities under the preliminary settlement and cooperation agreement we entered into with Peruvian anticorruption prosecutor and the ad hoc Peruvian state regarding the termination payment used by the government to GSP. This decision was taken considering that GSP had not taken any legal action to demand the payment despite efforts by G&M at the general shareholders meeting of GSP. As a minority equity partner in GSP, G&M is entitled to initiate direct negotiations under numeral 4 of Article 1219 of the Peruvian Civil Code which authorizes creditors to exercise the rights of its debtor, either by way of initiating our action or assuming defense.counsel.
As of the date of this annual report, we haveWe made total investments in the GSP project of US$243 million (S/.811811 million), which we financed in part with borrowings. We have also assumed our proportional obligation to repay the project’s bridge loan in an amount of US$129 million (S/.436436 million) and the project’s performance guarantee in amount of US$52.5 million (S/.177177 million) and recorded them as other financial liabilities and other accounts payable, respectively, in our consolidated financial statements as of December 31,
2018.statements. We also recorded an account receivable for the same amounts, since we have the right to
collect these amounts from GSP. According to our estimates, under the terms of the concession contract, taking into account the subordination arrangement, and based on receiving payment equal to 72.25% of the net carrying amount, in accordance with IFRS, in 2016 we recorded an impairment to our equity investment in GSP in the amount of S/.593.1593.1 million (approximately US$175.5 million) to reflect awrite-off of equity value in GSP. Although GSP’s right to compensation pursuant to the concession contract, due to the Peruvian government’s failure to pay, is 100% of the net carrying amount, our company hashad accounted for 72.25% due to political uncertainty, GSP’s bankruptcy process with INDECOPI, and disagreements with the other GSP shareholders. In addition, during 2016 our gross profit decreased by S/.15.215.2 million (US$4.5 million) due to the impact of the early termination of the construction consortium (Consorcio Ductos del Sur), in accordance with IFRS. Also during 2016, we registered a discount of the related long term account receivable in financial expenses of S/.77.477.4 million (US$22.9 million). Adding these effects, plus and wrote off S/180 million (US$54 million) in respect of the deferred income tax effect, we had a net impact of S/.498.0 (US$147.3 million) on our income statement for the year ended December 31, 2016.
asset. In addition, the termination of the GSP gas pipeline concession had reduced our backlog as of December 31, 2016 by US$855 million (S/.2,889.02,889.0 million), representing 30.2% of our E&C backlog and 33.8% of our total backlog. After taking into account these effects, we recorded, S/654.8 million (US$197.3 million) in connection with our investment in GSP, and S/2,079.2 million (US$627.6 million) in related receivables, as of each of December 31, 2016, 2017 and 2018.
As of December 31, 2019, as a result of the withdrawal of our request for arbitration against the Peruvian government in December 2019, we impaired the remaining amount of our investment in GSP. Also in 2019, taking into account that a meeting of GSP creditors has yet to occur and that GSP’s bankruptcy proceedings remain in the debt recognition stage, we recognized an impairment of US$81.5 million (S/276 million) to our long-term account receivable from GSP, based on our estimate that GSP is likely to recover 50% (rather than the previous estimate of 72.25%) of the net carrying amount; we adjusted the net present value of the remaining account receivables by US$17 million (S/58 million) pursuant to IFRS rules; and we wrote-off US$54 million (S/180 million) over the deferred income tax asset associated with the company’s investment in GSP. As of December 31, 2020, after taking into account these effects, we continue to maintain S/620 million (US$171.1 million) in long-term receivables as a creditor of GSP.
In connection with the termination of the GSP gas pipeline concession, we renegotiated and subsequently repaid in full certain of our debt instruments. The principal amount of our syndicated loan as of the termination of the concession in January 2017 was US$150 million (S/504 million). As a result of the termination of the concession, the loan became due. On June 26, 2018, the loan was repaid in full. Also as a result of the termination of the GSP gas pipeline concession, our proportional guarantee of the GSP bridge loan became due. On June 27, 2017 we entered in a new US$78.7 million (S/264.8 million) term loan with Natixis, BBVA, SMBC and MUFJ, the proceeds of which were used to repay the GSP bridge loan. On June 28, 2019, the term loan was repaid in full. In addition, our proportional repayment obligations under the GSP performance guarantee from Chubb Insurance Company in the amount of US$52.5 million (S/177.4 million) became due. On December 6, 2018, we paid the final installment with respect to our obligations to Chubb Insurance Company.
The effects of the termination of the GSP gas pipeline concession recorded in our consolidated financial statements as of and for the year ended December 31, 2016 are based on our estimates, based on the terms of the concession contract taking into account the subordination arrangement, receiving payment equal to 72.25% of the net carrying amount and with the information that we have available to date. The actual impact on our results, however, could change materially from our estimates. Moreover, we cannot assure you that we will receive any benefit from the government payment provided for under the GSP gas pipeline concession contract on a timely basis, or at all. For more information, see notes 5(e) and 5(f)note 5.1(e) to our audited annual consolidated financial statements included in this annual report.
With respect to our investment in GSP, we requested that the staff of the U.S. Securities and Exchange Commission (the “SEC”) grant relief from the financial statement filing requirements of Rule 3-09 of Regulation S-X (“Rule 3-09”) pursuant to Section 2430 of the Division of Corporation Finance Financial Reporting Manual, with respect to our investment in GSP. The SEC has not granted our company’s waiver request and, as a result, our company was required to file with the SEC separate financial statements for GSP for 2015, 2016 and 2017, with 2016 being audited. However, it has been impracticable for our company to comply with this requirement, because the audit opinion that was issued with respect to GSP’s 2016 financial statements included a disclaimer; our company’s loss of significant influence over GSP; and GSP’s limited management as the entity is in insolvency proceedings. We believe that GSP’s financial statements would not provide additional material information to investors. However, we cannot assure you that the SEC will not take actions against our company relating to our non-compliance, and, among other matters, in the event of a capital raise, our company may be temporarily unable to have a registration statement for a public offering of securities in the United States declared effective by the SEC. Separate financial statements for GSP for 2018, 2019 and 2020 are not required under Rule 3-09. For more information on GSP, see notes 5.1(e) and 15 to our audited annual consolidated financial statements included in this annual report.
Ongoing Investigations and Settlement Processes
TheLava Jato commissionOur company and certain of our subsidiaries, and certain of our former directors and senior management, have been charged in connection with criminal and civil investigations relating to certain of our projects in connection with our association with Odebrecht and in connection with our alleged participation in what is referred to as the “construction club.”
In 2018, the Peruvian Congress, which was formed in November 2016 to investigate alleged bribes made by Brazilian companies to Peruvian public officials, conducted congressional inquiries intocriminal prosecutor charged our company and otherour engineering and construction companiessubsidiary, Cumbra, as criminal defendants in Peru.connection with the IIRSA South project concession (tranche II), and the Peruvian First National Preparatory Investigation Court (Primer Juzgado de Investigación Preparatoria Nacional) included our company and Cumbra in its criminal investigation. We appealed the court’s decision, but in October 2020, the court provided a formal indictment.
Separately, in connection with these investigations, in December 2018, the Peruvian First National Preparatory Investigation Court also resolved to include our company and Cumbra as civilly-responsible third parties in the investigations related to the IIRSA South project concession (tranche II) and Cumbra as a civilly-responsible third party in the investigations related to Tranches 1 and 2 of the Lima Metro. These investigations have required certain of our company’s former board members and senior management to provide testimony at hearings before the commission.proceedings are ongoing.
Peruvian prosecutors have included José Graña Miró Quesada, a shareholder and the former Chairman of our company, in an investigation for the crime of collusion, and Hernando Graña Acuña, a shareholder, a former board member of our company and former chairman of our subsidiary GyM,Cumbra, for the crime of money laundering against the Peruvian government, each in connection with the IIRSA South project concession (tranches II and III)(tranche II), in which we participated with Odebrecht. Gonzalo Ferraro Rey, the former Chief Infrastructure Officer of our company, has also been included in an investigation for the crime of money laundering in connection with the same project.
In connection with investigations relating toaddition, José Graña and Hernando Graña, as well as Juan Manuel Lambarri, the IIRSA South project concession (tranches II and III), the Peruvian criminal prosecutor moved to chargeformer chief executive officer of our company and our construction subsidiary GyM, as criminal defendantsCumbra, have been charged in connection with the projects. In response, the Peruvian First National Preparatory Investigation Court (Primer Juzgado de Investigación Preparatoria Nacional) notified us of its decision to formally include our company and GyM in its criminal investigation. We appealed the court’s decision and, in June 2018, the First Court of Appeals of the Superior Court of Lima revoked the judicial order that indicted our company and GyM, among other corporate defendants, in the criminal investigation on charges of collusion and other crimes and rejected the petition, without prejudice, made by the prosecutor to incorporate both companies in the aforementioned process. Nevertheless, we cannot assure you that the criminal prosecutor will not file a new motion to charge our company and/or GyM or that our position will ultimately prevail if such motion is filed.
Separately, in December 2018, the Peruvian First National Preparatory Investigation Court resolved to include our company and GyM as civilly-responsible third parties in the investigations related to the IIRSA South project concession (tranches II and III) and GyM as a civilly-responsible third party in the investigations related to Tranches 1 and 2 of the Lima Metro. TheseJosé Graña indicated in public statements to the media that he and Hernando Graña had initiated a process of plea bargaining with Peruvian prosecutors in respect of multiple projects in which our company participated with Odebrecht and in respect of the alleged “construction club.” This may include providing information related to wrongdoing or knowledge of improper behavior while they were at the company. We cannot assure you what they will ultimately say to government authorities, or that their statements will not adversely affect the company’s business.
INDECOPI initiated in 2017 investigations are ongoing.
In July 2017, media reports allegedregarding allegations that certain construction companies in Peru, Brazil and Spain, including our company,subsidiary Cumbra, colluded as a “construction club” to receive public contracts. AsOn February 11, 2020, INDECOPI provided notice that an administrative sanctions proceedings involving a resulttotal of these reports, INDECOPI has initiated an investigation regarding the anti-competitive activities of35 construction companies, in Peru, including our company. In July 2017,subsidiary Cumbra, and 28 natural persons, was moving forward. On March 9, 2021, we were informed that the Peruvian government conductedTechnical Secretariat of INDECOPI’s Commission for the Defense of Competition issued a searchlengthy opinion report that recommended to the commission the imposition of administrative fines in connection with the proceedings, including S/103 million (US$27.4 million) for Cumbra. We reviewed the report together with our facilitiesadvisors, and on April 22, 2021, we filed a written reply with INDECOPI. Management has estimated the value of the company’s contingencies related to these allegations. In January 2018 criminal prosecutors conducted a searchadministrative proceedings, and established provisions in the company’s audited consolidated financial statements in the amount of S/24.5 million (US$6.76 million) as of December 31, 2020. See note 22 to our facilities regarding the “construction club” investigation. We have provided the information requested by the Peruvian criminal prosecutors. A former employee of GyM has beenaudited annual consolidated financial statements included in this annual report. INDECOPI’s Commission for the investigation for collusionDefense of Competition is expected to issue a decision in first instance between the second and other alleged crimes. GyM has been included as civilly-responsible third partyquarter of 2021. If a decision is reached, Cumbra may appeal before the INDECOPI’s internal tribunal, which tribunal would be the final arbiter of any administrative penalty. Although its decision may be judicially challenged, such challenge would not suspend the company’s obligation to pay any administrative fine imposed by INDECOPI or its tribunal.
Separately, in the mentioned investigation along with eleven other construction companies. In December 2018, GyMCumbra was formally included in this criminal investigation as a civilly-responsible third party, along with eleven other construction companies.
In December 2019, we entered into a preliminary settlement and cooperation agreement with the Peruvian anticorruption prosecutor and the ad hoc Peruvian state counsel. The agreement related to investigations of substantially all of the past projects in which the company participated with Odebrecht (other than the Chavimochic project, which is not under investigation), as well as the company’s alleged participation in the “construction club” (excluding INDECOPI’s separate administrative proceedings). Although the Peruvian government undertook to enter into a final settlement and cooperation agreement within sixty business days, we have not reached a final agreement. Since that time, the company has made significant progress in the negotiation of a final settlement and cooperation agreement, the terms of which remain under discussion with Peruvian authorities and are confidential. Based on discussions with authorities, we currently expect that a final agreement would require the company to admit to wrongdoing by the company and certain of its former officers and directors. We ce annotalso currently expect that a final agreement would require the company to pay a significant penalty over a period of years to be agreed. In addition, based on discussions with authorities, we currently expect that a final settlement and cooperation agreement would contain measures that temporarily restrict the ability of the company and certain of its subsidiaries to enter into contracts with the Peruvian government. Although we are in advanced discussions with Peruvian authorities, we cannot assure you that other of our formeran agreement will be reached in a timely manner, on expected terms or current board membersat all, and executive officers will notany agreement would be included insubject to further approval by the foregoing proceedings as civilly-responsible third parties or criminal defendants as well.Peruvian court.
A conviction of corruption or resolutionssettlements with government authorities maycould lead to criminal and civil fines as well as penalties, sanctions, injunctions against future conduct, profit disgorgement, disqualifications from directly and indirectly engaging in certain types of business, the loss of business licenses or permits, debarment from contracting or from participating in bidding processes with the Peruvian government, or other restrictions. Moreover, our alleged involvement in corruption investigations, and any findings or admissions of wrongdoing in such investigations, could further damage our reputation and have a material adverse impact on our ability to compete for business. Such investigations may also adversely affect our ability to pursue strategic projects, and could potentially result in the termination or modification of certain existing contracts or relationships. Also,In addition, such investigations may affect ourthe company’s ability to secure financing in the future. Furthermore, investigations could continue to divert management’s attention and resources from other issues facing our business.
Emergency Decree and Subsequent Legislation
OnIn February 13, 2017, the President of Peru issued an emergency decree (decretoDecreto de urgenciaUrgencia No. N°003-2017), prohibiting groups that have been, or whose officers or representatives have been convicted of, or have admitted to, corruption, money-laundering or similar crimes (whether in Peru or elsewhere) from, among other things, transferring or selling any assets related to investments in Peru, including the proceeds of asset or equity sales, or sending money abroad without a governmental authorization. Section II of Law 30737, promulgatedpassed in March 2018 to replace the aforementioned emergency decree, includes companies that have been consortium partners of groups that have been, or whose officers or representatives have been, convicted of, or have admitted to, corruption, money-laundering or similar crimes. Our company and our subsidiary GyMCumbra are two such companies. The law requires that they: suspend money transfers abroad; implement a compliance program and disclose information to competent authorities; and create a trust of assets to guarantee eventual compensation in favor of the Peruvian government. The Peruvian government is required to determine the amount of such guarantee pursuant to Law 30,737.30737. On May 9, 2018, Supreme Decree No.096-2018-EF was passed, which provides guidelines for such determination.
Following discussions with the Peruvian government, in MarchFebruary 2019, we established thea trust in favor of the Peruvian government in respect of any liabilities arising from Tranches 1 and funded2 of the trust inLima Metro and the amount of S/.79.1 million (US$23.4 million) by assigningIIRSA South project concession (tranche II), to which we assigned shares of our subsidiary GMICumbra Ingeniería, which is estimated to suchbe worth approximately US$20.4 million (S/72 million). Because the value of these shares have decreased, we have included more shares in the trust in order to cover the amount of the trust. We cannot assure you that the Peruvian government will not claim the assets set forth in this trust or require that our company place additional assets in trust. Furthermore,trust, nor can we cannot assure you that these lawsassets will not be expanded, or that subsequent laws will not be passed, that impose furtherfully satisfy any eventual obligations or restrictions on our companywe may have to the Peruvian government, including in connection with a final settlement and our subsidiaries. cooperation agreement.
Management has estimated that the value of the contingency forcompany’s contingencies to be approximately US$129.6 million (S/469.7 million), and taking into account the matters described above shouldnet present value, established a provision in the company’s financial statements in the amount of US$59.6 million (S/216 million). This includes amounts in respect of probable liabilities arising from investigations of substantially all of the past projects in which the company participated with Odebrecht (other than the Chavimochic project, which is not exceed US$45.8 million (S/.148.4 million).
Strategic Action Plan
In response tounder investigation), as well as the events described above, we have instituted a multi-step strategic action.
Negotiationcompany’s alleged participation in the “construction club” (excluding INDECOPI’s separate administrative proceedings). The company based its estimate on the formulas included in Law 30737 and on the negotiations with Creditors
We have renegotiated three debt instruments related to GSPPeruvian authorities which, as follows:
| • | | Syndicated Loan Related to our Equity Investment in GSP: As a result of the termination of the GSP gas pipeline concession, our syndicated loan used to finance our equity investment in GSP became due. The principal amount outstanding under our syndicated loan was US$37.50 million (S/126.70 million) as of December 31, 2018, and is US$31.45 million (S/103.95 million) as of the date of this annual report. On June 27, 2017, we entered into an amendment to the credit agreement. According to the terms of the amendment our syndicated loan matures on 2020, with required prepayments to be made with the proceeds of asset sales of 40% in the first year and an additional 30% in the second year of the amendment. The syndicated loan continues to accrue interest at LIBOR plus 4.90% per year. In addition, we are prohibited from paying dividends until the loan is repaid in full. Also, we have provided additional security interests, including: (i) a first lien on our shares of GyM and Concar; (ii) a second priority lien on our shares of Almonte; (iii) a first lien on certain real estate properties in Surquillo; (iv) liens on certain related amounts; (v) a second priority lien on our shares of CAM and CAM Servicios; and (vi) a first lien on cash flows from the sale of certain assets. For additional information on our syndicated loan, see “Item 5.B. Operating and Financial Review and Prospects—Liquidity and Capital Resources”;
|
| • | | Proportional guarantee of the GSP Bridge Loan: As a result of the termination of the GSP gas pipeline concession, our proportional guarantee of the GSP bridge loan became due. On June 27, 2017 we entered in a new, US$78.7 million (S/.264.8 million) term loan with Natixis, BBVA, SMBC and MUFJ, the proceeds of which were used to repay the GSP bridge loan. The new term loan matures on 2020, with required prepayments to be made with the proceeds of asset sales of 40% in the first year and an additional 30% in the second year of the closing date. The term loan accrues interest at
|
| LIBOR plus 4.50% per year, which will increase to 5.00% during the second year and to 5.50% during the third year. In addition, we will be prohibited from paying dividends until our guarantee is repaid in full. Also, we have provided the following security interests to secure repayment of the term loan: (i) a first lien on our rights to receive the termination payment derived from the GSP termination, (ii) a second priority lien on our shares of GyM and Concar; (iii) a second priority lien on our shares of Almonte; (iv) a second priority lien on certain real estate properties in Miraflores and Surquillo; (v) a second priority lien on our shares of CAM and CAM Servicios; and (vi) a first lien on cash flows from the sale of certain assets. The principal amount outstanding under the new term loan was US$63.47 million (S/.214.46 million) as of December 31, 2018, and as of the date of this annual report, there is US$47.25 million (S/.156.16) outstanding on the term loan.
|
| • | | Proportional Repayment Obligations under the GSP Performance Guarantee:Upon the termination of the GSP gas pipeline concession, our proportional repayment obligations under the GSP performance guarantee from Chubb Insurance Company in the amount of US$52.5 milllion (S/.177.4 million) became due. On December 6, 2018, we paid the final installment with respect to our our obligations to Chubb Insurance Company.
|
In addition, in July 2017, we entered into a financial stability framework agreement with certain banks providing for new lines of credit to support our financial stability and liquidity. As of December 31, 2018 and the date of this annual report, thereare ongoing. However, we cannot provide assurance that our liability will not exceed the amount estimated by management and provisioned for in the financial statements of the company. Furthermore, if the company is US$59.44 million (S/200.83 million) outstanding.
investigated for further charges in connection with wrongdoing in respect of other projects, this contingent amount could increase significantly. For more information, see “—Liquidity and Capital Resources—Indebtedness.” We are currentlynote 1 to our audited annual consolidated financial statements included in default under the financial stability framework agreement. For more information, see “Item 13. Default. Dividend Arrearages and Delinquencies.this annual report.
Asset Sales
In order to strengthen our liquidity and financial flexibility, particularly in the event of potential delays in receiving the government payment contemplated under the GSP gas pipeline concession contract, and make payments on our debt related to the GSP project, our board has approved the sale ofnon-strategic assets in the amount of up to US$350 million (S/.1,176 million) in proceeds.
As of the date of this annual report, we have entered intosold the following transactions:assets:
| | • | | Sale of Cuartel San Martín: On February 3, 2017, our subsidiary Viva GyM sold all of its interests in the Cuartel San Martín real estate project, which represented a 50% stake in the project, to its partner Urbi Propiedades S.A. for US$50 million (S/.163163 million); |
| | • | | Sale of Promoción Inmobiliaria del Sur:Sur: On February 24, 2017, our subsidiary Viva GyM sold all of its interests in PRINSUR, which owns undeveloped land located in Lurin,Lurín, representing 22.5% of the share capital, to its partner Inversiones Centenario S.A.A. for US$25 million (S/.8181 million); |
| | • | | Sale of Shares in Red Eagle Mining Corporation: In February and March 2017, our subsidiary Stracon GyM sold shares of Red Eagle Mining Corporation, representing 9.97% of the share capital, in a stock exchange transaction for US$13.3 million (S/.43.043.0 million); |
| | • | | Sale of our Interest in COGA: On April 24, 2017, we sold our 51% interest in COGACompañía Operadora de Gas del Amazonas (“COGA”) to our partners Enagas and Carmen Corporation for a price of US$21.5 million (S/.69.869.8 million). COGA is in charge of the operation and maintenance of TGP, the trans-Andean gas pipeline from Camisea to the Pacific coast in Peru; |
| | • | | Sale of our Interest in GMD: On June 6, 2017, we sold our 89.19% interest in GMD, our IT services subsidiary, to Advent International for a price of US$84.7 million (S/.269.9269.9 million); |
| | • | | Sale of the building Petit Thouars: On September 29, 2017, we sold a building located in block 49 of Petit Thouars Avenue to VOLCOMCAPITAL Deuda Perú for a price of US$20.5 million (S/.68.968.9 million); |
| | • | | Sale of Almonte properties. On May 31, 2018, Almonte signed an agreement to sell 4,208,769 square meters of land for an aggregate price of US$92.7 million. The amount of the sale proceeds corresponding to our company is proportional to its 50.45% ownership stake; and |
| | • | | Sale of our interest in CAM Chile and CAM Servicios:Servicios: On December 4, 2018, we sold our 73.16% interest in CAM Chile and CAM Servicios, our subsidiaries engaged in the operation and maintenance of electric utilities, to GDF Suez Energie Services Chile Holding SpA and ENGIE Services Perú S.A., for a price of US$18.75 million (S/63.34 million). |
| • | | Investment Agreement for Norvial Dividends: On June 11, 2018, we signed an investment agreement with BCI Perú, to monetize future dividends of Norvial. The amount of the transaction is US$42.3 million, the proceeds of which were applied to the reduction of indebtedness related to GSP. |
| • | | Sale of Stracon: On April 11, 2018, we sold our 88% interest in Stracon for a price of US$77 million (S/249 million). |
In addition, we are in the process of marketing for sale our subsidiary Adexus, which entered into Chilean bankruptcy proceedings on November 19, 2019, although we currently account for Adexus as a continuing operation. We are also evaluating the sale of certain additional assets, including part of our land bank, which we do not consider to be strategic to our business, to meet our liquidity needs as a result of the transaction is US$42.3 million,impact of the proceedsCOVID-19 pandemic and government measures to contain the spread of which were applied to the reductionvirus.
New CEO and New Board of indebtedness related to GSP.Directors
Additionally,On February 27, 2017, our former chairman of the board, our former CEO and board member, and our board member and the former chairman of the board of our subsidiary Cumbra resigned from their positions. Effective March 2, 2017, we appointed a new CEO. On March 31, 2017, our shareholders at the annual shareholders’ meeting appointed a new board of directors, replacing seven of our nine existing directors. The new baord of directors that took office was focused on April 11, 2018, we sold our 88% interest in Stracon GyMaccountability, transparency and cooperation with authorities. On December 9, 2020, an extraordinary shareholders’ meeting of the company elected a new board of directors for a pricethe 2020-2023 term, consisting of US$77 million (S/.249 million).nine directors. For more information, see “Item 6. Directors, Senior Management and Employees.”
Internal Investigation
In light of the events described above, weWe conducted an internal investigation led by externalU.S. counsel with the assistance of forensic accountants with respect to our participation in consortia with Odebrecht. The Risk Compliance and SustainabilityCompliance Committee of our board of directors was charged with monitoring the progress ofoverseeing the internal investigation. TheThis internal investigation, which concluded on November 1, 2017, identified no evidence to conclude that any company personnel engaged in bribery in connection with any of our company’s public projects in Peru with Odebrecht or its subsidiaries, or that any company personnel was aware of, or knowingly participated in, any corrupt payments made in relation to such projects.
As new information about the various Peruvian criminal investigations of the company emerged, and news that the company’s former chairman and director were plea bargaining with Peruvian authorities, the company’s board of directors continued to investigate the allegations that were the subject of the investigations, including matters relating to the “construction club,” which was beyond the scope of the internal investigation conducted by U.S. counsel. After an extensive and detailed review process, in line with its commitment to transparency and integrity, the company shared information relevant to the investigations with the Peruvian authorities within the framework of a plea bargain process.
In December 2019, we entered into a preliminary settlement and cooperation agreement with the Peruvian anticorruption prosecutor and the ad hoc Peruvian state counsel. The agreement related to investigations of substantially all of the past projects in which the company participated with Odebrecht (other than the Chavimochic project, which is not under investigation), as well as the company’s alleged participation in the “construction club” (excluding INDECOPI’s separate administrative proceedings). Although the Peruvian government undertook to enter into a final settlement and cooperation agreement within sixty business days, we have not reached a final agreement. Since that time, the company has made significant progress in the negotiation of a final settlement and cooperation agreement, the terms of which remain under discussion with Peruvian authorities and are confidential. Based on discussions with authorities, we currently expect that a final agreement, if executed, would require the company to admit to wrongdoing by the company and certain of its former officers and directors.
Any admission or other evidence of wrongdoing or knowledge of improper behavior by José Graña or Hernando Graña or other of our former officers or directors in respect of our participation in consortia with Odebrecht would be inconsistent with information gathered during the internal investigation and would have a material impact on the findings of the internal investigation.
Strengthening of Anti-Corruption Program
In 2017, we approved a plan to continue strengthening our anti-corruption compliance program. This has included the creation of a Risk, Compliance and Sustainability Committee of ourcompany’s new board of directors created the creation of aRisk & Compliance Committee, the Corporate Risk and Compliance Function the hiring of aand hired an internationally experienced Chief Risk and Compliance Officer and the reinforcement of our procedures relatedreporting directly to the third-party risk evaluation and mitigation.
New CEO, New Board of Directors and Board Committee
On February 27, 2017, our former chairman of the board, our former CEO and board member, and our board member and the former chairman of the board of our subsidiary GyM resigned from their positions. Effective March 2, 2017, we appointed a new CEO. On March 31, 2017, our shareholders at the annual shareholders’ meeting appointed adirectors. The new board of directors replacing sevenalso provided this new corporate function with additional resources, such that the Corporate Risk and Compliance Function currently includes nine officers.
The Risk & Compliance Committee approved a plan and resources to continue strengthening our anticorruption compliance program, an integral part of our nine existing directors. For more information, see “Item 6. Directors, Senior Managementlarger Corporate Risk and Employees.”Compliance Program. The plan launched focused on cultural changes and four strategic elements to re-shape the way we do business: (i) corporate governance, (ii) ethics and compliance, (iii) risk management, and (iv) regulatory compliance and monitoring.
In parallel, the new board of directors launched an integrity manifesto and conducted an internal investigation, led by U.S. counsel with the assistance of forensic accountants, with respect to our participation in consortia with Odebrecht. The board of directors also engaged international advisors and consulting firms that provided specialized anticorruption training to the board of directors, senior management and middle management. These actions served as the foundation for a cultural change; the strengthening of governance; the enhancement of the tone at the top; and the transformation and enhancement of anti-corruption practices across the group.
In 2018, we re-launched key aspects of the Corporate Risk and Compliance Program focused on ethics and anticorruption compliance. The first accomplishment was the approval, implementation and training of the company’s new Code of Business Conduct, which was rewritten by senior management. Another key achievement was the whistleblower mechanism, which we re-vamped and re-launched. Together with the business operations functions, we also reviewed and modernized our policy on third party due diligence (focused on anticorruption, crime prevention and international sanctions), which included building a robust process using international best practices and modern web-based tools for name search and case management.
Risk was the program’s focus in 2019, while we continued to implement other aspects of the program. The board of directors formalized the company’s risk management methodology and risk appetite and approved the risk manual. Business operations redesigned key business processes and developed risk matrices, guided by the professional opinion of business line experts, as additional foundation for a modern risk management function. This included the use of an enhanced method to measure and mitigate corruption risk. In 2019, the company also introduced revised policies on donations, gifts and entertainment, on dealing with conflicts of interests, and on managing relationships with government officials.
In 2020, we applied the Corporate Risk and Compliance Program to identify, prioritize and mitigate certain impacts of the COVID-19 pandemic, including corruption and regulatory-related risks. We also developed a risk analysis on free competition and we issued our antitrust policy, a key enhancement to our Regulatory Compliance Program.
An independent consulting firm performed in 2020 a specialized review of our Anticorruption Compliance Program. Their review identified no material weaknesses and concluded that our program was suited for the nature of our businesses, needs, risks and characteristics. In this year, three of our subsidiaries achieved ISO 37001 Certification (Cumbra, Ecotec and Morelco).
In 2021, we expect to focus further on our Regulatory Compliance Program, enhance the risk assessment and monitoring models behind our Third Party Due Diligence Program, further develop incentives for ethical behavior, and innovate our training means and content related to ethical conduct and values aligned with our business code of conduct.
Securities Class Action
Two securitiesA class action complaints have beencivil lawsuit was filed in 2017 against usour company and certain of our former directors and currentformer and formercurrent executive officers in the Eastern DistrictUnited States. In February 2020, we executed a term sheet with the plaintiffs that provides the general terms and conditions for a final settlement agreement. On July 2, 2020, we executed a Stipulation and Agreement of New York duringSettlement formalizing the first quarterterms of 2017. These complaints were consolidatedthe settlement. The settlement received preliminary approval from the court on August 18, 2020, but remains subject to final approval of the court. The settlement terms stipulate that the civil lawsuit will be fully and finally dismissed in exchange for a total settlement amount of US$20 million, of which the company is responsible for US$15 million, and the company recorded provisions of US$15 million as of December 31, 2020. The remaining US$5 million was paid by the company’s D&O insurers. The company made an initial payment of US$350,000 into the settlement fund escrow account in September 2020. The settlement terms stipulate that the remaining $14,650,000, plus interest of 5% per annum running from September 17, 2020, must be paid by the company by June 30, 2021. We have initiated discussions with the plaintiffs regarding a singledeferral of this payment, but we cannot assure you that an agreement will be reached. No members of the plaintiff class action. The plaintiffs filed a consolidated amended compliant on May 29, 2018. We moved to dismiss the complaint during the fourth quarter of 2018. The court has not yet ruled on that motion, but has granted plaintiffs leave to file a further amended complaint. We continue to believe that we have meritorious defensesobjections to the claims asserted,settlement prior to the November 24, 2020 deadline for such objections to be filed. On December 21, 2020, a magistrate judge held a hearing on the motion for final approval of the settlement, which final approval motion remains pending. If the court does not order final approval of the settlement, or the company fails to comply with the terms of the settlement agreement, we would expect the lawsuit to resume.
Presentation of Certain Financial Information
On December 4, 2018, we sold our interests in each of CAM and CAM Servicios and on April 11, 2018, we intend to defend ourselves vigorouslysold our interest in these matters.
Restatement of Financial Results for Fiscal Year 2017
OurStracon. As a result, we present CAM, CAM Servicios and Stracon as discontinued operations in our audited annual consolidated financial statements for the yearyears ended December 31, 20172018, 2019 and 2020.
In addition, we previously accounted for Adexus, our technical services subsidiary, as an investment held for sale. However, as of September 30, 2020, following restructuring proceedings in Chile, we reclassified Adexus as a continuing operation. Our segment data presents Adexus as a parent company operation not part of any of our three business segments. As a result, the historical segment financial information included in this annual report havehas been restated. In our consolidated financial statements included in our annual report on Form20-F for the year ended December 31, 2017, we inadverently presented the gain on the sale of GMD under “Gain from the sale of investments” in erroradjusted accordingly. See notes 7 and accordingly, we have restated our 2017 income statement and the related notes to reflect GMD as a discontinued operation. The previously issued consolidated financial statements of the company for the 2017 fiscal year (and the related audit opinion) included in the company’s annual report on Form20-F for the year ended December 31, 2017 should not be relied upon. For more information, see note 2.3128 to our audited annual consolidated financial statements included in this annual report.
Reclassification
On June 6, 2017, we sold our 89.19% interest in our former subsidiary, GMD. As a result, we present GMD as a discontinued operation in our audited annual consolidated financial statements for the years ended December 31, 2017 and 2018. We have reclassified our consolidated financial for the year ended December 31, 2016, and selected financial information for the years ended December 31, 2014 and 2015, included in this annual report, to show GMD as a discontinued operation. In addition: (i) on December 4, 2018, we sold our 73.16% interests in each of CAM and CAM Servicios, (ii) on April 11, 2018, we sold our interest in Stracon GyM, and (iii) we are in the process of marketing our subsidiary Adexus for sale. As a result, we present CAM, CAM Servicios and Stracon GyM as discontinued operations, and Adexus as an investment held for sale, in our audited annual consolidated financial statements for the year ended December 31, 2018. We have reclassified our consolidated financial information for the years ended December 31, 2016 and 2017, and the selected financial information for the years ended December 31, 2014 and 2015 included in this annual report, to show CAM, CAM Servicios and Stracon GyM as discontinued operations as Adexus as an investment held for sale.
Internal Control over Financial Reporting
In 2018,2020, we identified a material weaknessesweakness regarding our internal control over financial reporting. For more information, see “Item 3. Key Information—D. Risk Factors—We have identified material weaknesses in our internal control over financial reporting, and if we cannot maintain effective internal control or provide reliable financial and other information in the future, investors may lose confidence in the reliability of our consolidated financial statements, which could result in a decrease in the value of our ADSs” and “Item 15. Controls and Procedures.”
Factors Affecting Our Results of Operations
General
Peruvian, Chilean and Colombian Economic Conditions
73.5%86.1%, 72.0%84.6% and 86.1%79.9% of our revenues in 2016, 20172018, 2019 and 20182020 were derived from activities in Peru. Accordingly, our results of operations are substantially affected by economic conditions in the country and our growth is driven in significant part by growth in the Peruvian economy. In addition, 11.4%5.8%, 17.3%9.5% and 5.8%15.5% of our revenues in 2016, 20172018, 2019 and 20182020 were derived from activities in Chile and 9.2%8.1%, 4.7%5.9% and 8.1%4.6% of our revenues in 2016, 20172018, 2019 and 20182020 were derived from activities in Colombia.
The
Peruvian real GDP has grown at an average rateincreased 4.0% in 2018 and 2.2% in 2019, and decreased 11.1% in 2020. As a result of 3.5% during the three years from 2016 to 2018. With increasing disposable income and an expanding middle class,COVID-19 pandemic, private consumption grewfell at an average annual rate of 3.2%0.63% in real terms from 20162018 to 2018.2020. In 2016, 20172018 and 20182019, private investment increased 2.1% and 0.9%, respectively, and in 2020, private investment decreased at an average rate of 5.9% and increased 0.1% and 4.4%8.7%, respectively,each in real terms, primarily due to lower investment in mining.terms. Inflation in Peru, as measured by the change in the consumer price index, was 3.2%2.5% in 2016, 1.4%2018, 1.9% in 20172019 and 2.2% in 2018.2020. The sol appreciateddepreciated versus the U.S. dollar by 1.5%4.0% in 20162018, 1.8% in 2019 and 3.3%9.0% in 2017 and depreciated by 16.9% in 2018.2020. Peru’s sovereign debt has been rated investment grade by S&P, Fitch and Moody’s. At the end of 2018,2020, Peruvian sovereign debt had one of the highest credit ratings in the South American region, rated BBB+ by S&P (August 2013) and Fitch (March 2019),(December 2020) and A3 by Moody’s (August 2018)(June 2019).
The Chilean economy grew at an average annual rate of 2.3%4.0% during the three years from 2016 to 2018 in real terms.and 1.1% during 2019, and contracted 5.8% during 2020. Total fixed investment increaseddecreased at an annual average rate of 2.5%10.6% in real terms during the three years from 20162018 to 2018.2020. Inflation in Chile, as measured by the change in the consumer price index, was 2.7% in 2016, 2.3% in 2017 and 2.6% in 2018.2018, 3.0% in 2019 and 3.0% in 2020. The Chilean peso appreciateddepreciated versus the U.S. dollar by 5.7% in 2016 and 7.8% in 2017 and depreciated by 12.8% in 2018.2018 and 5.5% in 2019 and appreciated 2.9% in 2020. Chilean sovereign debt has the highest rating in the South America region, rated A+A by S&P (July 2017)(March 2021), A1 by Moody’s (July 2018)(August 2020) and AA- by Fitch (February 2019)(October 2020).
The Colombian real GDP grew at an average annual rate of 2.2%2.5% during the three years from 2016 to 2018.2018 and 3.3% during 2019, and contracted 6.8% during 2020. Inflation has decreased during recent years, with inflation of 5.8% in 2016, 4.1% in 2017 andColombia was 3.1% in 2018.2018, 3.8% in 2019 and 1.6% in 2020. The Colombian peso apreciateddepreciated against the U.S. dollar by 7.5% in 2018, 0.8% in 2019 and 4.7% in 2016 and 0.6% in 2017 and depreciated by 7.5% in 2018.2020. Colombia’s sovereign debt was rated BBB by Fitch in November 2018,BBB- by Fitch (November 2020), BBB- from S&P in December 2017,(March 2020), and Baa2 byfrom Moody’s in February 2018.(December 2020).
From 20142018 to 20182020 our revenues declined at a compound annual growth rate (CAGR) of 4.3%5.1%, excluding acquisitions and asset sales).sales. Our organic revenues decreased 2.9%18.9% in 20182020 from 2017,2019, principally as a result of lower activity levels(i) in our E&C Segment, lower production volume in ongoing projects as a result of restrictions established in response to the COVID-19 pandemic, mainly in Peru, which was partially offset by an increase in sales of Vial and Vives—DSD, (ii) in our Infrastructure segment, lower revenues of UNNA Energía related to a lower price of oil and fewer wells drilled, as well as a substantial decrease in 2018.traffic at Norvial and lower revenues at Concar due to less maintenance work performed.
Fluctuations in Exchanges Rates
We estimate that in 2018, 32.5%2020, 31.4%, 55.6%51.4% and 11.8%17.2% of our revenues were denominated in soles, U.S. dollars and other currencies respectively, while 63.2%49.2%, 23.1%31.5% and 13.7%19.3% of our cost of sales during the year were denominated in soles, U.S. dollars and other currencies. In addition, as of December 31, 2018, 56%2020, 61%, 41%30% and 3%9% of our total debt was denominated in soles, U.S. dollars and other currencies, respectively. Accordingly, fluctuations in the value of these currencies can materially affect our results of operations. When the sol appreciates against the
U.S. dollar, our operating margins tend to decrease; when the sol depreciates against the U.S. dollar, our operating margins tend to increase (if everything else were held equal). Conversely, the appreciation of the sol against the U.S. dollar tends to decrease our indebtedness and financial expenses as expressed in soles; and the depreciation of the sol against the U.S. dollar tends to increase our indebtedness and financial expenses as expressed in soles. We enter into derivatives, from time to time, to hedge part of our financial exposure to currency fluctuations. The value of the sol to the U.S. dollar appreciated in 2016 and 2017, and depreciated in 2018, 2019 and 2020, which impacted our results of operations.
We have included estimates of the approximate effects of fluctuations in exchange rates on our consolidated and segment revenues and costs of sales in “—Results of Operations.” These estimates were calculated based on daily average exchange rates and estimated aggregate revenues and cost of sales denominated in U.S. dollars, Chilean pesos and Colombian pesos, and were not calculated on a transaction by transaction basis. For additional information on the effect of exchange rate fluctuations on our results of operations, see “Item 11. Quantitative and Qualitative Disclosures about Market Risk—Exchange Rate Risk.”
Cost of Labor, Third-Party Services and Inputs
The largest components of our costs are: labor, which represented 25.3%33.7% of our cost of sales and 37.9%56.9% of our administrative expenses in 2018;2020; services provided by third parties, which represented 33.0% of our cost of sales and 35.2%25.5% of our administrative expenses in 2018;2020; and inputs (including raw materials), which represented 23.4%20.3% of our cost of sales in 2018.2020. For a breakdown of our cost of sales and administrative expenses, see note 2726 to our audited annual consolidated financial statements included in this annual report.
Our cost of labor is influenced by, among other factors, the number of our employees, as well as inflation, competition we face for personnel in each of our business segments and the availability of qualified candidates. From 20162018 to 20172019 our personnel charges increased by 13.5%15.8%, and from 20172019 to 20182020 our personnel charges decreased by 15.2%7.3%. Services provided by third parties include: subcontracting in our E&C segment, such as carpentry work; advisory and consultancy work, including external audit and legal services; and renting of equipment. From 20162018 to 20172019 costs related to services provided by third parties increased by 29.8%, and from 2019 to 2020 our costs related to services provided by third parties decreased by 27.7% and from 2017 to 2018 our costs related to services provided by third parties decreased by 15.4%34.8%. The principal inputs we use are fuel, cement and steel, which in the aggregate represented 20%34% of our total input costs in 2018.2020. Our costs for these inputs are affected by, among other factors, the growth or decline of our operations, market prices, including global prices in the case of fuel, and transportation costs. We do not have long-term contracts for the supply of our key inputs. From 20162018 to 2017,2019, our input costs increased by 26.1%13.3%, and from 20172019 to 2018,2020, our input costs decreased by 40%35.4%. Our cost of labor, third party services and inputs decreased in 20182020 primarily due to lower activity levels in our E&C segment.and Real Estate segments and due to the reduction of non-essential expenses and personnel costs.
Acquisitions and Dispositions
In September 2015, we acquired a 20% participation in the shareholder’s equity of Gasoducto Sur Peruano, the concessionaire of the southern gas pipeline project for a total of US$215 million (S/.722722 million). In addition, our subsidiary GyMCumbra participated with a 29% stake in the construction consortium for this project (Consorcio Ductos del Sur), which represented approximately US$1.0 billion of our backlog as of December 31, 2015. The GSP gas pipeline concession was terminated on January 24, 2017, and as a result, we recognized impairments with respect to our investment in GSP and our participationaccount receivables owed to us from GSP in CCDS.2016 and 2019. For more information, see “Item 5.A. Operating and Financial Review and Prospects—Operating Results—Recent Developments.“—Key Developments— Termination of the Gasoducto Sur Peruano Concession.”
In order to strengthen our liquidity and financial flexibility, particularly in the event of potential delays in receiving the government payment contemplated under the GSP gas pipeline concession contract, and make payments on our debt related to the GSP project and strengthen our board approved the sale ofnon-strategicliquidity and financial flexibility, we sold several assets in the amount of up to US$350 million (S/.1,176 million) in proceeds.between 2017 and 2018. For a detailed description of the sale of thesenon-strategic assets, see “Item 5.A. Operating and Financial Review and Prospects—Operating Results—Recent“—Key Developments—Strategic Action Plan. Asset Sales.”
Cyclicality
Our Engineering and ConstructionE&C segment is cyclical as a result of being closely linked to the conditions, performance and growth of theend-markets we serve, which include, among others, the mining, power, oil and gas, transportation, real estate and other infrastructure sectors in Peru, as well as the mining sector in Chile and, the energy sector in Colombia. These industries tend to be cyclical in nature and tend to be affected by factors such as macroeconomic conditions, climate conditions, the level of private and public investment, the availability of credit, changes in laws and regulations and political and social stability. As a result, although downturns impact our entire company, our Engineering and ConstructionE&C segment has historically been subject to periods of very high and low demand. The mining and oil and gas sectors, in particular, are also driven by worldwide demand for the underlying commodities, including, among others, silver, gold, copper, oil and gas, which can be affected by such other factors as global economic conditions and geopolitical affairs. Furthermore, prevailing prices and expectations about future prices for minerals or oil and gas, costs of exploration, production and delivery of product and similar factors can have a significant impact on our clients’ exploration and production activities and, as a result, on their demand for our engineering and construction services.
Our Real Estate segment is also cyclical and is significantly affected by changes in general and local economic conditions, such as employment levels and job growth, availability of financing for home buyers, interest rates, foreclosure rates, inflation, consumer confidence and housing demand. In addition, in our Infrastructure segment, our Energy line of business is cyclical and affected by global supply and demand for oil.
Seasonality
Our business, on a consolidated basis, has not historically experienced seasonality. In our Infrastructure segment, we have experienced moderate seasonality at (i) Norvial, due to heightened vehicular traffic activity during the summer season in the first quarter of the year, and (ii) GMP’sUNNA Energía’s gas processing plant, which typically closes for maintenance during the rainy season in the first quarter of the year, as demand for gas is lower during this time.
Engineering and Construction
The principalmain driver of our E&C results is economic growth in Peru, particularly private and public investment in the country’s mining, power, oil and gas, transportation, real estate and other infrastructure sectors. See “—Peruvian—Peruvian and Chilean Economic Conditions.”Conditions.
Appropriate pricing and budgeting of our engineering and construction projects isare also key to our project results, of operations in our E&C segment andwhich can be affected by factors such factors as competition, direct negotiations with clients as(as opposed to competitive bidding processes,processes), the accuracy of our estimationestimations of project costs and any unexpected cost overruns. The types of
Our most common E&C contracts in this segment consist ofare cost-plus fee, unit price,lump-sum and EPC contracts. For a description of our E&C contracts, see “Item 4.B. Information on the Company—Company—Business Overview—Engineering and Construction—Contracts.” The nature of our contractual arrangements can affect our margins both because, depending on where the type of contract, thecost burden of cost overruns may beis placed, onwhether with the client or onwith us, and because certain contractual arrangements tend to have lower gross margins. For the years 2017 and 2018, our E&C segment has trended towards more contractual arrangements based on cost—pluscost-plus fee and EPC contracts. The types of contractual arrangements we enter into incontracts while for 2019, our E&C segment varytrended towards more contractual arrangements based on unit prices. For 2020, our focus was based on unit prices. The type of contractual arrangement the E&C segment enters varies significantly from period to period.
During 2016, we suffered2018, activity levels decreased as a result of divestment plan executed by the company. In April 2018, our subsidiary, GyM sold its 87.59% stake in Stracon GyM, our subsidiary focused on the mining services industry in Peru. The company also experienced lower activity levels in our E&C segment due to the completion of two large mining projects at the end of 2015 (Las Bambasbusinesses units engaged in electromechanical and Cerro Verde). These lowercivil works.
During 2019, activity levels were not fully compensated by new works at the GSP gas pipeline project in Peru and, to a lesser extent, works in Chile and Colombia. The 2016 presidential elections in Peru and the subsequent change in administration also contributed to lower activity levels in our E&C segment during 2016.
During 2017, activity levels in our E&C segment remained lowincreased as a result of the cancellationexecution of the GSPconstruction contracts for mining and Chavimochic projects,oil and also due to the ending of the bioenergy Zona Franca projectgas sectors, primarily in Colombia. ThePeru accompanied by incremental activity levels in 2017 in the E&C segment have been affected by politicalbuilding and other issues related to the investigations described in “Item 5.A. Operating and Financial Review and Prospects—Recent Developments.”infrastructure units.
During 2018,2020, activity levels in our E&C segment decreased as a result of the divestment plan executed by our company. In April 2018, our subsidiary GyM sold its 87.59% interestCOVID-19 pandemic and government measures adopted in Stracon GyM, our subsidiary that engaged contracts mining servicesresponse to the virus in Perú. We also experienced lower activity levels in our business units engaged in electromechanicalPeru, Chile and civil works.Colombia including, among other things, social distancing and sanitary protocols.
Infrastructure
Traffic and Fees for Toll Roads
The majority of our toll roads revenues derive from the Norvial concession. Unlike our other toll road concessions, our revenues from the Norvial concession depend on traffic volume. Traffic volume on the Norvial road increased 3.2%1.75% from 20162018 to 20172019 and 6.3%decreased 12.3% from 20172019 to 20182020 as a result of the COVID-19 pandemic (based on vehicle equivalents, as defined in “Item 4.B. Information on the Company—Business Overview—Infrastructure—Principal Infrastructure Activities—Toll Roads—Norvial”) due to the lower traffic resulting from the climactic phenomenon “El Niño,” which generated floods and mudslides in northern Peru, during the first quarter of 2017.. For the Norvial toll road, the toll rate is set out in the Norvial concession agreement and adjusted in accordance with a contractual formula that takes into account the sol/U.S. dollar exchange rate and Peruvian and United States inflation. Under our Survial and Canchaque road concessions, our revenues consist of annual fees paid by the Peruvian Ministry of Transport and Communications in consideration for the operation and maintenance of the roads, which can vary depending on the amount of road maintenance required due to road wear and tear.
Under the Norvial concession, we are required to expand certain stretches of the highway by, among other things, adding two additional lanes. The first stage of construction was completed in 2008 and the second stage started on April 2014 and is expected to bewas completed by October 2019 due to delays in the government’s delivery of lands required for the project. We estimate thatDecember 2019. Norvial’s capital investment for the second stage will bewas approximately US$9596 million (S/.319.2347.9 million). In June 2018, we signed an investment agreement with BCI Perú to monetize future dividends of Norvial. The amount of the transaction was US$42.3 million, the proceeds of which were applied to the reduction of indebtedness related to GSP.
Mass Transit
We generate revenue from our Lima Metro concession based on kilometers travelled per train, with the fee per kilometer, the number of trains required to be in operation and the number of kilometers that we are required to travel established by the terms of the concession. Our revenues do not depend on passenger traffic volume. Our results in this concession between 20162018 and 20182020 were influenced by the timely acquisition, set up, reliability and proper operation of our trains. We currently have all 44 trains in operation (including three backup trains).
On July 11, 2016, we entered into the fourth addendum to the Lima Metro concession contract in order to expand the transportation capacity of Line One. In accordance with the fourth addendum, the expansion project involves: (i) the purchase of 20 new trains withfive-car from Alstom; (ii) the purchase of 39 new cars from Alstom, to be coupled with the 19 existing Alstom trains and 20 new Alstom trains, resulting in a consolidated fleet of 39 Alstom trains with asix-car configuration; and (iii) the expansion and improvement of the existing infrastructure, including revamping and improvement of five stations, improvements in the electrical systems, a new access route to the maintenance workshop and new switches on the main track.
Energy
A part of the revenues in our Infrastructure segment depends on global prices for oil. Under our hydrocarbon extraction service contracts, we are entitled to a variable fee, which is based on the level of production of each field and a basket of international crude oil prices. Under our contracts, we acquire the extracted hydrocarbons and pay royalties, which are also based on a basket of international crude prices and the level of production. Historically, oil prices have been volatile and are likely to be volatile again in the future. During 2016, 20172018, 2019 and 2018,2020, average Brent crude prices were approximately US$43.55,69.69, US$53.0264.26 and US$69.6941.76 per barrel, and the average fee we received in these years was US$38.54,64.72, US$49.1963.11 and US$64.7241.29 per barrel of extracted oil, respectively. During the first quarter of 2019,2021, the Brent crude price was approximately US$63.0858.53 per barrel and our fee was approximately US$58.8357.20 per barrel of extracted oil. Because our activities are conducted in mature oil fields, which have been producing oil for over 100 years in the case of Block I, approximately 100 years in the case of Block III, approximately 95 years in the case of Block IV and for over 50 in the case of years Block V, our oil production depends primarily on the level of our drilling and production activities.
Our Pariñas gas processing plant has a long-term delivery and gas processing and fractionation contract with Empresa Eléctrica de Piura S.A. (ENEL), a thermal power generation subsidiary of the Endesa group. Under this contract, ENEL delivers natural gas that it purchases from onshore and offshore gas producers in the Talara area. We are responsible for all operating costs of the gas processing plant but are entitled to keep revenues from the sale of all resulting natural gas liquids to third parties after delivery of all dry gas and payment of a variable royalty to ENEL. Approximately 75% of the total volume of natural gas processed by our Pariñas gas processing plant depend upon gas volumes demanded by ENEL for itsgas-fired turbines, which can vary significantly. 15% of the volume of natural gas is extracted from our Block I. Prices for natural gas liquids can also fluctuate significantly and are affected by market prices for crude oil. We processed 33.2 MMcf per day during 2016, 30.57 MMcf per day during 2017 and 30.12 MMcf per day during 2018,. 30.52 MMcf per day during 2019 and 28.40 MMcf per day during 2020. These volumes vary per month and depend upon the power dispatch curve of ENEL among Peruvian power generation plants. In rainy months (December to April) where hydroelectric power generation in Peru is typically higher, gas volumes demanded by ENEL are lower than in dryer months (May to November) in which activity of thermal generators tends to be higher.
In connection with our fuel storage terminal business, under three operation contracts with Petroperu,Petroperú, we receive revenues related to monthly reserved volume in storage tanks for refined crude products (storage fee) and for volumes loaded and delivered into railroad cars or cistern trucks to each terminal (throughput fee). These fees are adjusted annually to account for U.S. inflation. Our fuel storage activities in the North and Central terminalsTerminals are carried out under20-year contracts, which expire in 2034. Our contract for the operation of the South terminals was to expire in August 2017 but was extended for an additional year until August 2018 and again in July 2018 until AugustTerminal expired on November 2, 2019.
Awarding and Timing of Infrastructure Concessions and Government Contracts
The results of operations of our Infrastructure segment are affected by our ability to win new concessions and government contracts, which depend in part on government policies and our ability to compete effectively. As of December 31, 2018, we had six concessions as well as long-term government contracts
We are a 50% partner in this segment. These include theConsorcio Terminales, which held a concession for Via Expresa Sur, with respect to which we recently received a letter from the Municipalityoperation of Lima in which the Municipality communicated its desire to terminate the concession,South Terminal. On November 2, 2019, and the concession for Chavimochic, for which Chavimochic has requested the termination of the concession in light of the government’s failurereverted to deliver the required lands for the project. Joint operations in which we participate have been awarded one additional concession for Via Expresa Javier Prado for the expansion of another major highway within the city of Lima. We cannot assure you that we will be able to negotiate the pending concessions on favorable terms or at all. A consortium led by Odebrecht Latinvest, in which we acquired a 20% stake in September 2015, was awarded the concession for the southern gas pipeline project in July 2014, however, the GSP gas pipeline concession was terminated by the Peruvian Ministry of Energy and Mines on January 24, 2017. For more information, see “Item 5.A. Operating and Financial Review and Prospects—Operating Results—Recent Developments.”
OurMoreover, our results in the operation and maintenance of infrastructure assets depend on our ability to obtain contracts from the government or infrastructure concessionaires, such as those in our Infrastructure segment, which depend on government policies and our ability to compete effectively. In 2016, we received two new contracts (Chiquibambilla and Chincaypuijio, each with Provías Nacional); and in 2017, we were awarded two new contracts (Cora Cora and C.V. Pasco, also with Provías Nacional). We typically obtain higher revenues from these contracts during the commencement of services as we bring the road to proper operating condition, and lower revenues at the end of the contract term as services wind down.
Our results in our Infrastructure segment are also affected by the timing of the commencement of operations under our concessions, as well as when we were required to undertake significant capital investments or major construction works under the terms of our concessions. Under our Norvial and Lima Metro concessions, we are required to undertake capital investments during the initial years of the concessions for which we are compensated throughout the term of the concessions by our toll rate in the case of the Norvial concession and tariffs in the case of the Lima Metro concession. Under our Survial, Canchaque and La Chira concessions, we generate revenues in our Infrastructure segment from our construction activities during thepre-operational phase, and once operations commence we generate revenues from fees related to operation and maintenance. Survial, Canchaque and La Chira have financed their construction costs through the sale of government certificates of construction to financial institutions at a discount from face value. Certificates of construction are negotiable instruments that the Peruvian government typically delivers upon completion of each stage of a project and which entitle the holder to receive payment from the government equal to the capital investment made in the corresponding stage upon completion of the entire project. Accordingly, the results of our Infrastructure segment may be affected by the discount rates obtained on the sale of government certificates of construction. For more information on our obligations and compensation under our concessions, see “Item 4.B. Information on the Company—Business Overview—Infrastructure.”
Real Estate
The results of operations of our Real Estate segment are driven by the number of units we develop and deliver in a reporting period, our mix of unit sales (affordable housing versus housing), unit prices, land purchase prices and our costs of construction. These results are also affected by a number of factors that may impact the Peruvian real estate sector as a whole, including: the availability of government subsidies for affordable housing; prices of suitable land in particular areas; regulation of real estate development imposed by national, regional and local laws and regulators, and the time required to obtain applicable construction permits and licenses; the unemployment rate and wage levels; prevailing interest rates and availability of financing; the supply in the market; the level of customer interest in our new projects; and our costs, such as the price of labor, materials, insurance, taxes and other public charges. We delivered 934, 1,418 and 1,276 units, 1,452 units and 1,125 units in 2016, 20172018, 2019 and 2018,2020, respectively.
The results of operations of our Real Estate segment are also significantly affected by our sales of land parcels. Due to the appreciation of land prices in Peru, and because we record our land holdings at book value (i.e., without marking to market), our recent land sales have resulted in high margins. Our board has approved the sale ofnon-strategic assets and, consequently, we have sold our interests in certain real estate projects as fully described in “Item 5.A. Operating and Financial Review and Prospects—Operating Results—Recent Developments.See “—Key Developments— Asset Sales.”
In addition, the net profit attributable to controlling interests of our Real Estate segment is significantly affected by the financing and commercial arrangements we use to purchase land and to develop real estate projects. Depending on the level ofnon-controlling interests used to finance our real estate projects, our Real Estate segment tends to have significant net profit attributable tonon-controlling interests. See “—Results of Operations—General—Real Estate.”
Critical Accounting Estimates and Judgments
For information on critical accounting estimates and judgments, see note 5 to our audited annual consolidated financial statements included in this annual report.
New Accounting Pronouncements, Amendments and Interpretations
For information on new accounting pronouncements, amendments and interpretations, see note 3.13 to our audited annual consolidated financial statements included in this annual report.
Non-GAAP Financial Measure and Reconciliation
In this annual report, we present EBITDA, a non-GAAP financial measure. A non-GAAP financial measure is generally defined as one that purports to measure financial performance, financial position or cash flows but excludes or includes amounts that would not be so adjusted in the most comparable IFRS measure. We define EBITDA as net profit plus: financial (expense) income, net; income tax; and depreciation and amortization.
We present EBITDA because we believe it provides readers with a supplemental measure of the financial performance of our core operations that facilitates period-to-period comparisons on a consistent basis. Our management uses EBITDA, among other measures, for internal planning and performance measurement purposes. We believe that EBITDA is useful in evaluating our operating performance compared to that of other companies operating in our sectors because EBITDA eliminates the effects of financing and income taxes and the accounting effects of capital spending, which items may vary for different companies for reasons unrelated to overall operating performance. EBITDA should not be construed as an alternative to net profit or operating profit, as an indicator of operating performance, as an alternative to cash flow provided by operating activities or as a measure of liquidity (in each case, as determined in accordance with IFRS). EBITDA, as calculated by us, may not be comparable to similarly titled measures reported by other companies. The following table sets forth the reconciliation of our net profit to EBITDA on a consolidated basis.
| | | | | | | | | | | | | | | | |
| | | For the year ended December 31, | |
| | | 2018 | | | 2019 | | | 2020 | | | 2020 | |
| | | (in millions of S/) | | | (in millions
of US$)(1) | |
Net profit (loss) | | | 57.4 | | | | (838.6 | ) | | | (190.3 | ) | | | (52.5 | ) |
Financial expense | | | 643.9 | | | | 646.1 | | | | 583.8 | | | | 161.1 | |
Financial income | | | (434.6 | ) | | | (467.3 | ) | | | (466.3 | ) | | | (128.7 | ) |
Income tax | | | 111.0 | | | | 303.4 | | | | 58.4 | | | | 16.1 | |
Depreciation and amortization | | | 206.5 | | | | 219.8 | | | | 197.1 | | | | 54.4 | |
| | | | | | | | | | | | | | | | |
EBITDA | | | 584.2 | | | | (136.7 | ) | | | 182.7 | | | | 50.4 | |
| (1) | Calculated based on an exchange rate of S/3.624 to US$1.00 as of December 31, 2020. |
The following table shows a reconciliation of the EBITDA for our three segments, Parent company operations and intercompany eliminations:
| | | | | | | | | | | | | | | | |
| | | For the year ended December 31, | |
| | | 2018 | | | 2019 | | | 2020 | | | 2020 | |
| | | (in millions of S/) | | | (in millions
of US$)(1) | |
Engineering and construction | | | 19.2 | | | | 2.9 | | | | 9.7 | | | | 2.7 | |
Infrastructure | | | 411.5 | | | | 372.7 | | | | 262.8 | | | | 72.5 | |
Real estate | | | 241.0 | | | | 76.2 | | | | 32.6 | | | | 9.0 | |
Parent company operations | | | (0.1 | ) | | | (1,073.2 | ) | | | (219.0 | ) | | | (60.4 | ) |
Intercompany eliminations | | | (86.6 | ) | | | 484.7 | | | | 96.7 | | | | 26.7 | |
| | | | | | | | | | | | | | | | |
EBITDA | | | 584.2 | | | | (136.7 | ) | | | 182.7 | | | | 50.4 | |
| (1) | Calculated based on an exchange rate of S/3.624 to US$1.00 as of December 31, 2020. |
The following tables set forth the reconciliation of our net profit to EBITDA for each of our business segments and certain of our lines of business or subsidiaries within these segments. The effects of the termination of the GSP gas pipeline concession on our results of operations and financial condition are reflected in Corporate (the Parent Company Operations) and, with respect to the related construction consortium (CCDS), in our E&C segment. For more information, see note 7 to our audited annual consolidated financial statements included in this annual report.
| 1. | Engineering and Construction |
| | | | | | | | | | | | | | | | |
| | | For the year ended December 31, | |
| | | 2018 | | | 2019 | | | 2020 | | | 2020 | |
| | | (in millions of S/) | | | (in millions
of US$)(1) | |
Net profit (loss) | | | (85.4 | ) | | | (140.7 | ) | | | (79.6 | ) | | | (22.0 | ) |
Financial expense | | | 284.7 | | | | 252.2 | | | | 250.3 | | | | 69.1 | |
Financial income | | | (217.0 | ) | | | (183.7 | ) | | | (204.9 | ) | | | (56.5 | ) |
Income tax | | | (14.4 | ) | | | 35.5 | | | | 3.6 | | | | 1.0 | |
Depreciation and amortization | | | 51.3 | | | | 39.6 | | | | 40.2 | | | | 11.1 | |
| | | | | | | | | | | | | | | | |
EBITDA | | | 19.2 | | | | 2.9 | | | | 9.7 | | | | 2.7 | |
| | | | | | | | | | | | | | | | |
| | | For the year ended December 31, | |
| | | 2018 | | | 2019 | | | 2020 | | | 2020 | |
| | | (in millions of S/) | | | (in millions
of US$) | |
Net profit | | | 184.0 | | | | 112.1 | | | | 23.0 | | | | 6.3 | |
Financial expense | | | 143.1 | | | | 127.0 | | | | 101.5 | | | | 28.0 | |
Financial income | | | (123.1 | ) | | | (113.8 | ) | | | (51.0 | ) | | | (14.1 | ) |
Income tax | | | 80.5 | | | | 80.2 | | | | 47.9 | | | | 13.2 | |
Depreciation and amortization | | | 126.8 | | | | 150.0 | | | | 133.3 | | | | 36.8 | |
| | | | | | | | | | | | | | | | |
EBITDA | | | 411.5 | | | | 355.5 | | | | 208.7 | | | | 57.6 | |
| | | | | | | | | | | | | | | | |
| | | For the year ended December 31, | |
| | | 2018 | | | 2019 | | | 2020 | | | 2020 | |
| | | (in millions of S/) | | | (in millions
of US$) | |
Net profit | | | 29.2 | | | | (0.8 | ) | | | (0.6 | ) | | | (0.2 | ) |
Financial expense | | | 28.6 | | | | 34.8 | | | | 32.0 | | | | 8.8 | |
Financial income | | | (7.2 | ) | | | (10.3 | ) | | | (4.1 | ) | | | (1.1 | ) |
Income tax | | | 8.8 | | | | 6.9 | | | | 0.4 | | | | 0.1 | |
Depreciation and amortization | | | 42.9 | | | | 46.6 | | | | 51.1 | | | | 14.1 | |
| | | | | | | | | | | | | | | | |
EBITDA | | | 102.3 | | | | 77.4 | | | | 78.0 | | | | 21.5 | |
| | | | | | | | | | | | | | | | |
| | | For the year ended December 31, | |
| | | 2018 | | | 2019 | | | 2020 | | | 2020 | |
| | | (in millions of S/) | | | (in millions
of US$) | |
Net profit | | | 87.1 | | | | 81.4 | | | | 60.8 | | | | 16.8 | |
Financial expense | | | 72.5 | | | | 43.6 | | | | 13.8 | | | | 3.8 | |
Financial income | | | (87.0 | ) | | | (65.9 | ) | | | (6.1 | ) | | | (1.7 | ) |
Income tax | | | 38.0 | | | | 39.6 | | | | 26.7 | | | | 7.4 | |
Depreciation and amortization | | | 0.2 | | | | 0.3 | | | | 0.3 | | | | 0.1 | |
| | | | | | | | | | | | | | | | |
EBITDA | | | 110.8 | | | | 99.2 | | | | 95.6 | | | | 26.4 | |
| | | | | | | | | | | | | | | | |
| | | For the year ended December 31, | |
| | | 2018 | | | 2019 | | | 2020 | | | 2020 | |
| | | (in millions of S/) | | | (in millions
of US$) | |
Net profit | | | 65.0 | | | | 52.8 | | | | 12.6 | | | | 3.5 | |
Financial expense | | | 37.9 | | | | 46.1 | | | | 49.7 | | | | 13.7 | |
Financial income | | | (26.9 | ) | | | (34.9 | ) | | | (34.4 | ) | | | (9.5 | ) |
Income tax | | | 26.3 | | | | 22.9 | | | | 7.5 | | | | 2.1 | |
Depreciation and amortization | | | 76.6 | | | | 93.8 | | | | 74.1 | | | | 20.4 | |
| | | | | | | | | | | | | | | | |
EBITDA | | | 178.9 | | | | 180.8 | | | | 109.4 | | | | 30.2 | |
| | | | | | | | | | | | | | | | |
| | | For the year ended December 31, | |
| | | 2018 | | | 2019 | | | 2020 | | | 2020 | |
| | | (in millions of S/) | | | (in millions of
US$)(1) | |
Net profit | | | 157.8 | | | | 23.74 | | | | 15.0 | | | | 4.1 | |
Financial expense | | | 25.2 | | | | 58.8 | | | | 26.6 | | | | 7.3 | |
Financial income | | | (16.9 | ) | | | (20.3 | ) | | | (18.5 | ) | | | (5.1 | ) |
Income tax | | | 69.2 | | | | 7.0 | | | | 2.9 | | | | 0.8 | |
Depreciation and amortization | | | 5.7 | | | | 7.0 | | | | 6.7 | | | | 1.8 | |
| | | | | | | | | | | | | | | | |
EBITDA | | | 241.0 | | | | 76.2 | | | | 32.6 | | | | 9.0 | |
| (1) | Calculated based on an exchange rate of S/3.624 to US$1.00 as of December 31, 2020. |
| (2) | Our E&C segment EBITDA includes S/16.5 million, S/(2.5) million and S/1.1 million in 2018, 2019 and 2020, respectively, which represents Cumbra’s 43.3% equity interest in Viva’s net profit. |
Results of Operations
General
Accounting for Subsidiaries, Joint Operations, Joint Ventures and Associated Companies
Results of our subsidiaries, joint operations, joint ventures and associated companies are reflected in our financial results. We refer to our subsidiaries as those entities over which we exercise control. We consolidate the results of our subsidiaries in our financial statements and we reflect the profit corresponding to the minority interests in our subsidiaries under “profit attributable tonon-controlling interests” in our income statement. Our consolidation of the results of our subsidiaries include subsidiaries in which we have less than 50% of the equity. We refer to business activities in which we share control with unrelated entities as joint arrangements, including joint operations and joint ventures, which are typically conducted through an agreement with a third party to carry out specific projects. We contribute our assets to these projects and derive revenue from their use. In our financial statements we recognize, in relation to our interest in a joint operation, our assets and liabilities, including our share of any asset or liability we hold jointly with our partner, as well as our share of revenue and expense from the joint operation. We refer to our associated companies as those entities over which we have significant influence but do not control. We reflect the results of our associated companies and joint ventures under the equity method of accounting in our financial statements under the line item “share of the profit and loss in associates” in our income statement. For further information, including a list of our subsidiaries, joint operations, joint ventures and associated companies, see notes 6a, 6c and 1615 to our audited annual consolidated financial statements included in this annual report.
Intersegment Transactions
SomeFrom time to time, certain of our segments from time to time provide services to our other segments.between each other. In 2018, we obtained 16.7%2020, 0.2% of the revenues in our E&C segment came from the construction of the expansion works of Line 1 at GyM Ferrovias; and 30%services for AENZA’s Infrastructure companies (Concar, Norvial, Survival, Consorcio Terminales and Canchaque). Also, less than 1% of the revenues in our operationE&C segment came from additional construction services for AENZA’s real estate company, Viva, and maintenance of infrastructure assets line of business derived from services provided to Norvial, Survial, Canchaque and the Lima Metro.its subsidiaries. Accordingly, in such circumstances, the segment providing services recognizes revenues, and the segment receiving such services recognizes costs of sales, relating to the services provided. For example, in the case of La Chira, in which our E&C segment provides services to our Infrastructure segment, our E&C segment recognizes revenues and our Infrastructure segment recognizes costs of sales with respect to the fees charged by our E&C segment for those services. In consolidation, theseThese intersegment revenues and cost of sales are eliminated in the consolidation of our financial results. Nonetheless,Nevertheless, our Infrastructure segment in particular, may recognize gross profits or losses based on the difference between the fees the segment charges in accordance with concession terms and costs it incurs relating to services provided by our other segments. For more information on our segments, see note 7 to our audited annual consolidated financial statements included in this annual report.
Engineering and Construction
We obtain revenuesRevenues in our E&C segment are obtained from the engineering and construction services provided to clients and are we provide to our clients, which we recognizerecognized under thepercentage-of-completion method of accounting. For further information, see note 2.26 to2.27 on our audited annual consolidated financial statements included in this annual report. We receive unrestricted client advances in a substantial majority of our E&C projects, on average equal to approximately 10%11% of the contract price in 2018,2020, which we record as an account payable. We typically invoice our clients on a periodic basis as each project progresses, deducting from the related advances on a proportional basis. For further information, see note 21 to our audited annual consolidated financial statements included in this annual report. Our costCost of sales in our E&C segment includes labor, subcontractor expenses, materials, equipment, and project-specific general expenses.
Infrastructure
In our Infrastructure segment, we recognize revenues and cost of sales as follows:
(1) Toll Roads:
For Norvial, we obtain revenues for toll fees collected, minus deductions required to be transferred to the government as described in “Item 4.B. Information on the Company—Business Overview—Infrastructure—Principal Infrastructure Activities—Toll Roads—Norvial,” which we recognize upon receipt. In June 2018, we signed an investment agreement with BCI Perú, to monetize future dividends of Norvial. The amount of the transaction was US$42.3 million, the proceeds of which were applied to the reduction of indebtedness related to GSP. Cost of sales for Norvial include fees paid to third parties (primarily our subsidiary Concar) for operation and maintenance services as well as the amortization of the road concession registered as an intangible asset in our financial statements; and
For Survial and Canchaque, we obtain revenues for routine and periodic maintenance services, which we recognize in the period in which the services are performed. Cost of sales for Survial and Canchaque include fees paid to third parties (primarily our subsidiary Concar) for operation and maintenance services. We do not recognize the Survial and Canchaque concessions as intangible assets and therefore do not amortize the concessions.
For further information, see notes 2.15(iii)2.27, 2.28 and 1817 to our audited annual consolidated financial statements included in this annual report.
(2) Mass Transit: We obtain revenues from our Lima Metro concession based on a tariff per kilometer traveledtravelled by our trains in operation in accordance with a schedule established in our concession agreement, which we recognize in the period in which the services are performed. Under the concession, the tariff is comprised of three components: (i) fees related to our operation and maintenance services; (ii) fees related to the Peruvian government’s repayment of the amounts we invest to purchase trains, ongoing capital expenditures and other infrastructure for the Peruvian government; and (iii) fees related to interest we charge to the Peruvian government in connection with the amounts we invest to purchase such trains, ongoing capital expenditures and other infrastructure. In 2018,2020, the fees related to items (i), (ii) and (iii) were S/.224 million, S/.10.9 million and S/.43 million, respectively.354.4 million. We only recognize in our income statement the portion of the tariff that relates to items (i) and (iii). We record the amounts paid by us that relate to item (ii) as long-term accounts receivables from the Peruvian government. Accordingly, tariff payments received relating to item (ii) reduce our accounts receivables but do not impact our income statement, and we do not amortize our investments in our income statement as our investment in the concession is recorded as an account receivable with the government rather than a depreciable investment.
We entered into the fourth addendum to the Lima Metro concession contract on July 11, 2016, in order to expand transportation capacity. In accordance with the fourth addendum, the expansion project will involve: (i) the purchase of 20 new trains; (ii) the purchase of 39 new cars; and (iii) the improvement and expansion of the existing infrastructure. As compensation for the investments of the expansion project, we will be entitled to receive the following: (i) an advance payment of 30% of each investment component; and (ii) the balance of 70% of each investment component, compensated through the annual payment for additional investments (pago(pago anual por inversiones complementarias)complementarias). We register the estimated compensation related to the direct cost in the income statement, plus a margin in the same period. In 2018, the2020, there was no income related to the investment components was S/.278 million.components.
For further information, see note 1110 to our audited annual consolidated financial statements included in this annual report. Cost of sales for the Lima Metro include fees paid to third parties (primarily our E&C segment, our subsidiary Concar and other subcontractors) for construction and operation and maintenance services, energy, and our financing costs related to the purchase of trains.
(3) Water Treatment: We obtained revenues from the engineering design and construction of La Chira waste water treatment plant, which we recognize based on thepercentage-of-completion method of accounting. Since the plant began operating in August 2016, we obtain revenues only for operation and maintenance services, which we recognize in the period in which the services are performed. During the construction phase in 2015 and 2016, cost of sales for La Chira included fees paid to third parties, primarily our E&C segment, for engineering and construction services. During the operation phase, cost of sales for La Chira include personnel charges and maintenance of infrastructure.
(4) Energy: We obtain revenues from extraction services and license contracts related to oil and gas production, fuel storage services, and the sale of natural gas liquids derived from our gas processing and fractionation services, which we recognize in the period in which the services are performed and, in the case of sale of natural gas liquids, when the sale is made. Cost of sales for our energy line of business includes labor, materials, amortization of oil wells, depreciation of the gas plant, maintenance and general expenses.
(5) Operation and Maintenance of Infrastructure Assets: We obtain revenues from our operation and maintenance of infrastructure assets line of business for the operation and maintenance services we provide to the government and concessionaires (currently concessions within our Infrastructure segment), which we recognize in the period in which the services are performed. We receive unrestricted advances with respect to our service contracts with the government, that vary from approximately 10% to 30% of the contract price, which we record as an account payable. We typically invoice our clients on a periodic basis as the project progresses, deducting from the related advances on a proportional basis. For further information, see note 2220 to our audited annual consolidated financial statements included in this annual report. Our cost of sales in this line of business includes personnel costs, services provided by third parties, machinery and other materials (primarily trucks), and depreciation of equipment utilized to provide services.
Real Estate
We obtain revenues in our Real Estate segment from sales of affordable housing and housing units, commercial buildings and land parcels, which we recognize at the time of delivery of the unit or building and, in the case of land parcels, at the time of the sale. We typicallypre-sell our affordable housing and housing units prior to and during construction, and use the related proceeds we receive to finance the construction of the units. Thesepre-sale funds are restricted and released from escrow to us periodically as construction
progresses. Our Real Estate cost of sales includes the cost to purchase land, costs of architectural design and construction (which usually includes payments to third parties, primarily our E&C segment), licensing and permit costs, personnel costs, and fees to third parties related to sanitation or electrical engineering. In 2018,2020, our cost of land that is allocated to units delivered during these periods amounted to S/.40.817.8 million. We recognize land purchases as inventory, and, accordingly, do notmark-to-market the value of our land for changes in fair value. For further information, see note 1514 to our audited annual consolidated financial statements included in this annual report.
In our Real Estate segment, we have significant net profit attributable tonon-controlling interests. We hold a significant portion of our land bank through Almonte in which we have a 50.45% interest, and we consolidate Almonte’s results in our financial statements. In addition, we undertake a significant number of our real estate projects through entities in which we may have a majority interest,co-equal interest or minority interest; when we have control over these entities, we consolidate their results in our financial statements regardless of whether we own a majority of the capital. Furthermore, in connection with our affordable housing projects, we generally partner with real estate investment funds and insurance companies that provide between 60% and 70% of the total capital required to purchase the land and cover certainpre-construction costs in exchange for equity in the project. Although we typically own a minority interest in these projects, we consolidate their results in our financial statements because we exercise control over the project. Accordingly, we reflect the profit corresponding to our real estate partners under net profit attributable tonon-controlling interests in our income statement. See “—Accounting for Subsidiaries, Joint Operations, Joint Ventures and Associated Companies.”
Comparison of Results of Operations of 20172019 and 20182020
The following table sets forth the components of our consolidated income statement for 20172019 and 2018.2020.
| | | | Year ended December 31, | | | | | | Year ended December 31, | |
| | | 2017
Restated | | | 2018 | | | Variation | | | 2019 | | | 2020 | | | Variation | |
| | | (in millions of S/.) | | | % | | | (in millions of S/) | |
Revenues | | | 4,014.0 | | | | 3,899.5 | | | | (2.9 | )% | | | 4,337.9 | | | | 3,314.0 | | | | (23.6 | )% |
Cost of sales | | | (3,511.6 | ) | | | (3,225.0 | ) | | | (8.2 | )% | | | (3,887.4 | ) | | | (2,993.4 | ) | | | (23.0 | )% |
| | | | | | | | | | | | | | | | | |
Gross profit | | | 502.4 | | | | 674.5 | | | | 34.3 | % | | | 450.5 | | | | 320.6 | | | | (28.8 | )% |
Administrative expenses | | | (322.5 | ) | | | (278.4 | ) | | | (13.7 | )% | | | (248.7 | ) | | | (152.9 | ) | | | (38.5 | ) |
Other income (expenses) | | | (33.3 | ) | | | (61.2 | ) | | | (83.8 | )% | | | (337.6 | ) | | | (182.8 | ) | | | (45.9 | )% |
Other (losses) gains, net | | | 0.5 | | | | (0.1 | ) | | | (120.0 | )% | | | (1.9 | ) | | | — | | | | — | |
Profit from sale of investments | | | 34.5 | | | | – | | | | NM | | |
| | | | | | | | | | | | | | | | | |
Operating profit | | | 181.6 | | | | 334.8 | | | | 84.4 | % | |
Operating profit (loss) | | | | (137.7 | ) | | | (15.1 | ) | | | 89.0 | % |
Financial (expense) income, net | | | (137.0 | ) | | | (197.1 | ) | | | 43.9 | % | | | (178.8 | ) | | | (117.5 | ) | | | (34.3 | )% |
Share of profit and loss in associates | | | 0.5 | | | | (3.7 | ) | | | NM | | | | (218.8 | ) | | | 0.1 | | | | (100.4 | )% |
| | | | | | | | | | | | | | | | | |
Profit (loss) before income tax | | | 45.1 | | | | 134.0 | | | | 197.1 | % | | | (535.3 | ) | | | (131.9 | ) | | | (75.4 | )% |
Income tax | | | (46.3 | ) | | | (113.3 | ) | | | 144.7 | % | | | (303.4 | ) | | | (58.4 | ) | | | (80.8 | )% |
| | | | | | | | | | | | | | | | | |
Net profit from continuing operations | | | (1.2 | ) | | | 20.7 | | | | NM | | |
Profit from discontinued operations | | | 210.4 | | | | 36.8 | | | | (82.5 | )% | |
Net profit (loss) from continuing operations | | | | (838.7 | ) | | | (190.3 | ) | | | (77.3 | )% |
Net profit (loss) | | | 209.2 | | | | 57.5 | | | | (72.5 | )% | | | (838.7 | ) | | | (190.3 | ) | | | (77.3 | )% |
Net profit (loss) attributable to controlling interest | | | 148.7 | | | | (83.2 | ) | | | (156.0 | )% | | | (884.7 | ) | | | (217.9 | ) | | | (75.4 | )% |
Net profit attributable tonon-controlling interest | | | 60.5 | | | | 140.6 | | | | 132.4 | % | | | 46.1 | | | | 27.5 | | | | (40.3 | )% |
Revenues
Our total revenues decreased by 2.9%23.6%, or S/.114.51,023.9 million, from S/.4,0144,337.9 million for 20172019 to S/.3,899.53,314.0 million for 2018.2020. Revenues decreased principally due to, in our E&C segment, a decrease in the lower numbervolume of projects under execution, in the E&C segment. This was offset,our Infrastructure segment, to a decrease in part, by the increase of revenuesoil prices, and in the Mass Transit business, which increased due to expansion works and the operation of new trains. In addition, there was an increase in maintenance of works at Concar, an increase in crude oil production (barrels per day) and higher oil prices. Revenues in theour Real Estate segment, reflected proceeds from the sale of land by Almonte and were adversely impacted byto fewer units being delivered during the year.2020 year, each as a result of the COVID-19 pandemic.
The following table sets forth a breakdown of our revenues by segment for 20172019 and 2018.2020.
| | | | Year ended December 31, | | | | | Year ended December 31, | | | |
| | | 2017 | | 2018 | | Variation | | | 2019 | | 2020 | | Variation | |
| | | (in millions of S/.) | | % of Total | | (in millions of S/.) | | % of Total | | % | | | (in
millions
of S/) | | % of Total | | (in
millions
of S/) | | % of Total | | % | |
Engineering and Construction | | | 2,331.9 | | | 58.1 | % | | 1,960.9 | | | 50.3 | % | | (15.9 | )% | | | 2,797.3 | | | | 64.5 | % | | | 2,092.6 | | | | 63.1 | % | | | (25.2 | )% |
Infrastructure | | | 1,447.9 | | | 36.1 | % | | 1,883.3 | | | 48.3 | % | | 30.1 | % | | | 1,587.3 | | | | 36.6 | % | | | 1,185.2 | | | | 35.8 | % | | | (25.3 | )% |
Real Estate | | | 647.5 | | | 16.1 | % | | 630.1 | | | 16.2 | % | | (2.7 | )% | | | 264.4 | | | | 6.1 | % | | | 182.4 | | | | 5.5 | % | | | (31.0 | )% |
Corporate | | | 70.0 | | | 1.7 | % | | 62.1 | | | 1.6 | % | | (11.3 | )% | | | 342.6 | | | | 7.9 | % | | | 240.8 | | | | 7.3 | % | | | (29.7 | )% |
Eliminations | | | (483.4 | ) | | (12.0 | )% | | (636.9 | ) | | (16.3 | )% | | 31.8 | % | | | (653.8 | ) | | | (15.1 | )% | | | (387.0 | ) | | | (11.7 | )% | | | (40.8 | )% |
| | | | | | | | | | | | | | | | |
Total | | | 4,014.0 | | | | 100.0 | % | | | 3,899.5 | | | | 100.0 | % | | | (2.9 | )% | | | 4,337.9 | | | | 100 | % | | | 3,314.0 | | | | 100 | % | | (23.6 | )% |
| | | | | | | | | | | | | | | | |
Cost of Sales
Our total cost of sales decreased by 8.2%23.0%, or S/.286.6894.0 million, from S/.3,511.63,887.4 million for 20172019 to S/.3,255.0 million2,993.4 for 2018.2020. This decrease is mainly due to a reduction in revenues.
Gross Profit
Our gross profit increaseddecreased by 34.3%28.8%, or S/.172.1129.9 million, from S/.502.4450.5 million for 20172019 to S/.674.5 million320.6 for 2018.2020. Our gross margin (i.e., gross profit as a percentage of revenues) for 20182020 was 17.3%9.7%, compared to 12.5%10.4% for 2017. In 2017, gross profit was impacted in our E&C segment by efficiencies in the projects under execution, in our Infrastructure segment by an increase in oil prices, and in our Real Estate segment by the sale of Cuartel San Martín in February 2017. During 2018, gross profit was impacted in our Infrastructure segment by expansion works and the operation of new trains, in our E&C segment by an increase in oil prices, and in our Real Estate segment by the sale of land by Almonte. In our E&C Segment gross profit was also impacted by works we performed, but which were not accepted by the client and costs not recognized in the Talara refinery project.2019.
The following table sets forth a breakdown of our gross profit by segment for 20172019 and 2018.2020.
| | | | Year ended December 31, | | | | | Year ended December 31, | | | |
| | | 2017 | | 2018 | | Variation | | | 2019 | | 2020 | | Variation | |
| | | (in millions of S/.) | | % of Total | | (in millions of S/.) | | % of Total | | % | | | (in
millions
of S/) | | % of Total | | (in
millions
of S/) | | % of Total | | % | |
Engineering and Construction | | | 176.5 | | | 35.1 | % | | 62.1 | | | 9.2 | % | | (64.8 | )% | | | 98.4 | | | | 21.8 | % | | | 116.0 | | | | 36.2 | % | | | 17.9 | % |
Infrastructure | | | 260.2 | | | 51.8 | % | | 350.6 | | | 52.0 | % | | 34.7 | % | | | 324.4 | | | | 72.0 | % | | | 202.4 | | | | 63.1 | % | | | (37.6 | )% |
Real Estate | | | 147.4 | | | 29.3 | % | | 288.0 | | | 42.7 | % | | 95.4 | % | | | 70.8 | | | | 15.7 | % | | | 40.3 | | | | 12.6 | % | | | (43.1 | )% |
Corporate | | | (37.8 | ) | | (7.5 | )% | | (10.6 | ) | | (1.6 | )% | | 72.0 | % | | | (6.6 | ) | | | 1.5 | % | | | 8.2 | | | | 2.6 | % | | | (24.2 | )% |
Eliminations | | | (43.8 | ) | | (8.7 | )% | | (15.6 | ) | | (2.3 | )% | | (64.4 | )% | | | (49.6 | ) | | | (11.0 | )% | | | (46.3 | ) | | | (14.4 | )% | | | (6.8 | )% |
| | | | | | | | | | | | | | | | |
Total | | | 502.4 | | | | 100.0 | % | | | 674.5 | | | | 100.0 | % | | | 34.3 | % | | | 450.5 | | | | 100 | % | | | 320.6 | | | | 100.0 | % | | | (28.8 | )% |
| | | | | | | | | | | | | | | | |
Administrative Expenses
Our administrative expenses decreased by 13.7%38.5%, or S/.44.196.3 million, from S/.322.5248.7 million for 20172019 to S/.278.4 million152.9 for 2018.2020. This decrease is mainly due to a reduction of personnel in the E&C Segment andlegal services provided by third parties principally relating to legal, accounting and tax consultancy.a reduction of personnel expenses. As a percentage of revenues, our administrative expenses decreased to 7.1%4.6% in 20182020, from 8.0%5.7% in 2017.2019.
Other Income (Expenses)
Our other income (expenses) decreased by 83.8%45.9%, or S/.27.9154.8 million, from S/.33.3337.6 million in expenses for 20172019 to S/.61.2 million182.8 in expenses for 2018. 2020.
In 2017,2019, our other income included(expenses) included: (i) impairments with respect to our investment in GSP in the saleamount of machineryS/501.7 million (US$151.3 million) with respect to our investment in GSP and equipment,our accounts receivable from GSP as well asa result of the termination of the GSP gas pipeline concession; (ii) an impairment of S/33.1 million (US$10.0 million) with respect to goodwill we recognized in connection with our acquisition of Morelco; (iii) a re-valuation of the Vial & Vives-DSD brand by S/10.7 million due to the increased backlog of Vial & Vives-DSD during 2019; (iv) impairments of certain minor investments of S/35.2 million (US$10.6 million), (v) a reversal of S/19.4 million (US$5.8 million) of the impairment of the Vial y Vives DSD brand. In 2018, our other income includedinvestment in the Ancon project that was registered at the end of 2018; (vi) a provision related tothe potentialof an additional S/77.4 million (US$23.3 million) for civil compensation in favor of the Peruvian state that may be requiredpursuant to payLaw 30737 in connection with ongoing corruption investigations in respect of the investigations relatedcompany; (vii) provisions of S/49.8 million (US$15 million) made in respect of the class action civil lawsuit against the company; and (viii) other minor adjustments of S/57.9 million (US$14.5 million).
In 2020, our income (expenses) included: (i) the impairment of accounts receivable generated by our subsidiary Concesionaria Vía Expresa Sur S.A. by S/55.9 million (see note 11 to our audited annual consolidated financial statements included in this annual report); (ii) the impairment of S/12.5 million in accounts receivable as a result of negotiations with the buyer of CAM Chile regarding certain items included the escrow account established at the time of the sale in 2018; (iii) the impairment of commercial accounts receivable generated by our subsidiary Concar for S/33.7 million to the IIRSA South project concession (tranches IIregional government of Cusco, Peru and III) and Tranches 1 and 2(iv) an impairment of the Lima Metro in whichintangibles of S/10.1 million by our company and GyM have been included as civilly-responsible third parties as described under “Item 8A. Financial Information—Consolidated Financial Statements and Other Information—Legal and Administrative Proceedings.”
Profit from Sale of Investments
In 2018, there was no profit from the sale of investments, compared to S/.34.5 million from the sale of the certain investments in 2017.subsidiary Adexus.
Operating Profit
Our operating profit increased 8.4%89.0%, or S/.153.2122.6 million, from operating loss of S/.181.6(137.7) million for 20172019 to an operating loss of S/.334.8(15.1) million for 2018.2020. Our operating margin (i.e., operating profit as a percentage of revenues) was 8.6%(0.5)% for 2018,2020, compared to 4.5%(3.2)% for 2017.2019. The increase in operating margin is primarily due toa result of the increase in gross profit and the reduction of administrative expensesOther income (expenses) explained above.
The following table sets forth a breakdown of our operating profit by segment for 20172019 and 2018.2020.
| | | | | | | | | | | | | | | | | | | | |
| | | Year ended December 31, | | | | |
| | | 2017 | | | 2018 | | | 2018 | |
| | | (in millions
of S/.) | | | Percentage
of Total | | | (in millions
of S/.) | | | Percentage
of Total | | | Variation
% | |
Engineering and Construction | | | (58.1 | ) | | | (32.0 | )% | | | (87.5 | ) | | | (26.1 | )% | | | (50.6 | )% |
Infrastructure | | | 202.5 | | | | 111.5 | % | | | 283.0 | | | | 84.5 | % | | | 39.8 | % |
Real Estate | | | 171.5 | | | | 94.4 | % | | | 235.3 | | | | 70.3 | % | | | 37.2 | % |
Corporate | | | (146.9 | ) | | | (80.9 | )% | | | (1.9 | ) | | | (0.6 | )% | | | (98.7 | )% |
Eliminations | | | 12.7 | | | | 7.0 | % | | | 25.1 | | | | 7.5 | % | | | 97.6 | % |
Total | | | 181.6 | | | | 100.0 | % | | | 334.8 | | | | 100.0 | % | | | 84.4 | % |
| | | | | | | | | | | | | | | | | | | | |
| | | Year ended December 31, | | | | |
| | | 2019 | | | 2020 | | | Variation | |
| | | (in
millions
of S/) | | | % of Total | | | (in
millions
of S/) | | | % of Total | | | % | |
Engineering and Construction | | | (33.1 | ) | | | 24.1 | % | | | (30.6 | ) | | | 200.0 | % | | | 7.6 | % |
Infrastructure | | | 220.4 | | | | (160.1 | )% | | | 73.0 | | | | (477.1 | )% | | | (66.9 | )% |
Real Estate | | | 68.8 | | | | (50.0 | )% | | | 25.8 | | | | (168.6 | )% | | | (62.5 | )% |
Corporate | | | (404.3 | ) | | | 293.6 | % | | | (92.1 | ) | | | 602.0 | % | | | (77.2 | )% |
Eliminations | | | 10.6 | | | | (7.7 | )% | | | 8.6 | | | | (56.2 | )% | | | (18.9 | )% |
| | | | | | | | | | | | | | | | | | | | |
Total | | | (137.7 | ) | | | 100 | % | | | (15.1 | ) | | | 100.0 | % | | | (89.0 | )% |
| | | | | | | | | | | | | | | | | | | | |
The following discussion analyzes our key results of operations on a segment basis. For further information on our business segments, see note 7 to our audited annual consolidated financial statements included in this annual report.
Engineering and Construction
The table below sets forth selected financial information related to our E&C segment.
| | | | Year ended December 31, | | | | | | Year ended December 31, | | | | |
| | | 2017 | | | 2018 | | | Variation | | | 2019 | | | 2020 | | | Variation | |
| | | (in millions of S/.) | | | % | | | (in millions of S/) | | | % | |
Revenues | | | 2,331.9 | | | | 1,960.9 | | | | (15.9 | )% | | | 2,797.3 | | | | 2,092.6 | | | | (25.2 | )% |
Gross profit | | | 176.5 | | | | 62.1 | | | | (64.8 | )% | | | 98.4 | | | | 116.0 | | | | 17.9 | % |
Operating profit (loss) | | | (58.1 | ) | | | (87.5 | ) | | | (50.6 | )% | | | (33.1 | ) | | | (30.6 | ) | | | (7.7 | )% |
Revenues. Our E&C revenues decreased 15.9%25.2%, or S/.371.0704.7 million, from S/.2,331.92,797.3 million for 20172019 to S/.1,960.92,092.6 for 2018.
2020. The decrease is due to fewera decrease in the volume of projects under execution resulting from lower levelsand project delays due to the effects of private investment in Peru. the COVID-19 pandemic.
The following tables set forth variations inpercentages of our E&C revenues by business activities, types of contracts andend-markets:
| | | | Year ended December 31, | | | Year ended December 31, | |
| | | 2017 | | | 2018 | | | 2019 | | | 2020 | |
| | | % | | | % | | | % | | | % | |
Engineering services | | | 8.4 | | | | 9.4 | | | | 11.5 | | | | 9.0 | |
Electromechanic construction | | | 31.2 | | | | 22.4 | | | | 29.6 | | | | 40.6 | |
Civil construction | | | 49.8 | | | | 52.4 | | | | 48.1 | | | | 43.1 | |
Building construction activities | | | 10.6 | | | | 8.8 | | | | 10.2 | | | | 6.8 | |
Other Services | | | — | | | | 7.1 | | |
Other services | | | | 0.5 | | | | 0.5 | |
| | | | | | | | | | | | |
Total | | | 100.0 | | | | 100.0 | | | | 100.0 | | | | 100.0 | |
| | | | | | | | |
| | | Year ended December 31, | |
| | | 2019 | | | 2020 | |
| | | % | | | % | |
Cost + fee | | | 6.2 | | | | 1.9 | |
Unit price | | | 46.7 | | | | 63.6 | |
Lump sum | | | 9.1 | | | | 7.9 | |
EPC contracts | | | 38.0 | | | | 26.6 | |
| | | | | | | | |
Total | | | 100.0 | | | | 100.0 | |
| | | | Year ended December 31, | | |
| | | 2017 | | | 2018 | | |
| | | % | | | % | | |
Cost + fee | | | 1.6 | | | | 1.0 | | |
Unit price | | | 42.9 | | | | 41.0 | | |
Lump sum | | | 47.3 | | | | 38.9 | | |
EPC contracts | | | 8.2 | | | | 19.1 | | |
| | | | | | | |
Total | | | 100.0 | | | | 100.0 | | |
| | | | Year ended December 31, | | | Year ended December 31, | |
| | | 2017 | | | 2018 | | | 2019 | | | 2020 | |
| | | % | | | % | | | % | | | % | |
Mining | | | 24.1 | | | | 23.0 | | | | 43.8 | | | | 50.6 | |
Real estate buildings | | | 10.8 | | | | 9.1 | | | | 6.3 | | | | 5.5 | |
Power | | | — | | | | 1.8 | | | | 6.0 | | | | 1.9 | |
Oil and gas | | | 31.4 | | | | 40.6 | | | | 32.1 | | | | 23.3 | |
Transportation | | | 22.9 | | | | 21.6 | | | | 21.6 | | | | 0.2 | |
Water and sewage | | | 2.0 | | | | 1.3 | | | | 1.3 | | | | 0.4 | |
Other end markets | | | 8.7 | | | | 2.6 | | | | 2.6 | | | | 1.5 | |
| | | | | | | | | | | | |
Total | | | 100.0 | | | | 100.0 | | | | 100.0 | | | | 100.0 | |
| | | | | | | |
The breakdown of E&C revenues by different business activities, types of contracts andend-markets tends to vary from period to period due to a variety of factors, including the timing of the execution of larger projects in any particular period, which is typically outside of our control.
Gross Profit. Our E&C gross profit decreased 64.8%increased 17.9%, or S/.114.417.6 million, from S/.176.598.4 million for 20172019 to S/.62.1 million for 2018.116.0 to 2020, mainly due to the suspension of works as a result of the COVID-19 pandemic, a provision related to an arbitration initiated by a supplier of the Cerro del Águila project finalized during the first quarter of 2020 and a write-off of an account receivable of our subsidiary Morelco with respect to its client Bioenergy. Our E&C gross margin for 20182020 was 3.2%5.5%, compared to 7.6%3.5% for 2017. This reduction in our E&C gross profit was mainly due to works we performed, but which were not accepted by the client and additional costs and expenses not recognized in the Talara refinery project as well as the deterioration of accounts receivable.2019.
Other income (expenses). Other income (expenses) increaseddecreased in our E&C segment, from S/.46.5(9.9) million in expenses in 2017for 2019 to S/.13.5(43.6) in expenses for 2020. See note 28 to our audited annual consolidated financial statements included in this annual report.
Operating Profit (loss). Our E&C operating profit increased S/2.6 million, from a S/(33.1) million loss for 2019 to a S/(30.6) million profit for 2020. Our E&C operating margin was (1.5)% for 2020, compared to (1.2)% for 2019.
Infrastructure
The table below sets forth selected financial information related to our Infrastructure segment.
| | | | | | | | | | | | |
| | | Year ended December 31, | | | | |
| | | 2019 | | | 2020 | | | Variation | |
| | | (in millions of )/ | | | % | |
Revenues | | | 1,587.3 | | | | 1,185.2 | | | | (25.3 | )% |
Gross profit | | | 324.4 | | | | 202.4 | | | | (37.6 | )% |
Operating profit | | | 203.1 | | | | 73.0 | | | | (64.1 | )% |
Revenues. The table below sets forth the breakdown of our Infrastructure revenues by principal lines of business.
| | | | | | | | | | | | |
| | | Year ended December 31, | | | | |
| | | 2019 | | | 2020 | | | Variation | |
| | | (in millions of S/) | | | % | |
Toll Roads | | | 326.3 | | | | 206.4 | | | | (36.7 | )% |
Mass Transit | | | 397.9 | | | | 345.3 | | | | (13.2 | )% |
Water Treatment | | | 3.6 | | | | 3.4 | | | | (5.6 | )% |
Energy | | | 552.6 | | | | 369.8 | | | | (33.1 | )% |
Operation and Maintenance of Infrastructure Assets | | | 307.0 | | | | 260.5 | | | | (15.1 | )% |
| | | | | | | | | | | | |
Total | | | 1,587.3 | | | | 1,185.2 | | | | (25.3 | )% |
| | | | | | | | | | | | |
Our Infrastructure revenues decreased 25.3%, or S/402.1 million, from S/1,587.3 million for 2019 to S/1,185.2 million for 2020. The variation in our Infrastructure revenues principally reflected the following:
| • | | Toll Roads: a 36.7%, or S/119.9 million, decrease in revenues, from S/326.3 million for 2019 to S/206.4 million for 2020, primarily due S/102 million to the postponement of certain projects and S/17 million due to lower vehicle traffic; |
| • | | Mass Transit: a 13.2%, or S/52.6 million, decrease in revenues, from S/397.9 million for 2019 to S/345.3 million for 2020, primarily due to the completion of the fourth addendum to the Lima Metro concession contract in 2019, partially offset by S/7.4 million for additional mileage travelled; |
| • | | Energy: a 33.1%, or S/182.8 million, decrease in revenues, from S/552.6 for 2019 to S/369.8 for 2020, primarily due to (i) a decrease in the price of oil from US$63.11 in 2019 to US$41.2 in 2020 and (ii) a decrease in our oil production from 4,064 bbl per day 2019 to 3,518 bbl per day in 2020. Secondarily, this was also due to the effect the termination of the South Terminal operation agreement on November 2, 2019. Additionally, gas processing levels in our gas processing plant were slightly lower (28.4MMcf per day in 2020 versus 30.52 MMcf per day in 2019), and the prices of liquefied petroleum gas decreased from US$41.06 in 2019 to US$40.87 in 2020. The price of HAS (CGN) decreased from US$69.55 in 2019 to US$ 59.20 in 2020; |
| • | | Operation and Maintenance of Infrastructure Assets: a 15.1%, or S/46.5 million, decrease in revenues, from S/307 million for 2019 to S/260.5 million for 2020, due to fewer maintenance works during 2020; |
| • | | Water Treatment: a 5.6%, or S/0.2 million, decrease in revenues, from S/3.6 for 2019 to S/3.4 for 2020, primarily due to a reduction of flow treatments as a result of the COVID-19 pandemic (2019 average volume was 6.45 m3/s compared to 5.87 m3/s in 2020). |
Gross Profit. The table below sets forth the breakdown of our Infrastructure gross profit by principal lines of business.
| | | | | | | | | | | | |
| | | Year ended December 31, | | | | |
| | | 2019 | | | 2020 | | | Variation | |
| | | (in millions of S/) | | | % | |
Toll Roads | | | 58.7 | | | | 35.4 | | | | (39.7 | )% |
Mass Transit | | | 119.5 | | | | 107.9 | | | | (9.7 | )% |
Energy | | | 108.3 | | | | 53.3 | | | | (50.8 | )% |
Operation and Maintenance of Infrastructure Assets | | | 37.5 | | | | 5.4 | | | | (85.6 | )% |
Water Treatment | | | 0.5 | | | | 0.4 | | | | (20.0 | )% |
| | | | | | | | | | | | |
Total | | | 324.4 | | | | 202.4 | | | | (37.6 | )% |
| | | | | | | | | | | | |
Our Infrastructure gross profit decreased 37.6%, or S/122.0 million, from S/324.4 million for 2019 to S/202.4 in 2020. Our Infrastructure gross margin was 20.4% for 2019 and 17.1% for 2020. The variation in our Infrastructure gross profit principally reflected the following:
| • | | Toll Roads: a 39.7%, or S/23.3 million, decrease in gross profit, from S/58.7 million for 2019 to S/35.4 million for 2020. Our toll roads gross margin decreased from 18% for 2019 to 17.2% for 2020. Of this decrease in gross profit, approximately S/15 million was a consequence of lower vehicle traffic and approximately S/9 million was a consequence of the postponement of works; |
| • | | Mass Transit: a 9.7%, or S/11.6 million, decrease in gross profit, from S/119.5 million for 2019 to S/107.9 for 2020, primarily due to due to completion of the fourth addendum to the Lima Metro concession contract in 2019. Our gross margin in 2020 was 31.2%, compared to 30.0% in 2019. |
| • | | Energy: a 50.8%, or S/50.0 million, decrease in gross profit, from S/108.3 million for 2019 to S/53.3 million for 2020, primarily due to the decrease in the price of oil from US$63.11 in 2019 to US$41.20 in 2020, and the price of liquefied petroleum gas from US$41.06 in 2019 to US$40.87 in 2020. Our energy gross margin was 14.4% for 2020, compared to 19.6% for 2019; |
| • | | Operation and Maintenance of Infrastructure Assets: a 85.6%, or S/32.1 million, decrease in gross profit, from S/37.5 million for 2019 to S/5.4 million for 2020, due provisions for potential civil damages as a result of an impairment to certain accounts receivable of Concar arising from its contracts for networks 1 and 3 with the regional government of Cuzco, Peru. Our operation and maintenance of infrastructure assets gross margin was 2.1% for 2020, compared to 12.2% for 2019; and |
| • | | Water Treatment: a 20.0%, or S/0.1 million, decrease in gross profit for 2020, from a S/0.5 million gross profit for 2019 to a S/0.4 million gross profit for 2020, due to a reduction of flow treatments as a result of the COVID-19 pandemic. Our water treatment gross margin was 11.8% for 2020, compared to 13.9% for 2019. |
Operating Profit. The table below sets forth the breakdown of our Infrastructure operating profit by principal lines of business.
| | | | | | | | | | | | |
| | | Year ended December 31, | | | | |
| | | 2019 | | | 2020 | | | Variation | |
| | | (in millions of S/) | | | % | |
Toll Roads | | | 30.7 | | | | (27.2 | ) | | | (188.6 | )% |
Mass Transit | | | 98.8 | | | | 95.3 | | | | (3.5 | )% |
Energy | | | 84.7 | | | | 32.9 | | | | (61.2 | )% |
Operation and Maintenance of Infrastructure Assets | | | (11.2 | ) | | | (28.1 | ) | | | 150.9 | % |
Water Treatment | | | 0.1 | | | | 0.1 | | | | 0.0 | % |
| | | | | | | | | | | | |
Total | | | 203.1 | | | | 73.0 | | | | (64.1 | )% |
| | | | | | | | | | | | |
Our Infrastructure operating profit decreased 64.1%, or S/130.1 million, from S/203.1 million for 2019 to S/73.0 million for 2020. Our Infrastructure operating margin was 6.2% for 2020, compared to 12.8% for 2019. The variation in our Infrastructure operating profit principally reflected the following:
| • | | Toll Roads: a 188.6%, or S/57.9 million, decrease in operating profit, from S/30.7 million for 2019 to S/(27.2) million for 2020, primarily due to an additional impairment in the Via Expresa Sur project. Our toll roads operating margin was 6.2% for 2020, compared to 9.4% for 2019; |
| • | | Mass Transit: a 3.5%, or S/3.5 million, decrease in operating profit, from an operating profit of S/98.8 million for 2019 to an operating profit of S/95.3 million for 2020, primarily due to completion of the fourth addendum to the Lima Metro concession contract in 2019. Our mass transit operating margin for 2020 was 27.6%, compared to 24.8% in 2019; |
| • | | Energy: a 61.2%, or S/51.8 million, decrease in operating profit, from S/84.7 million for 2019 to S/32.9 million for 2020, primarily due to oil and liquid natural gas prices and the effect the end of the South Terminal contract. Our energy operating margin was 8.9% for 2020, compared to 15.3% for 2019; |
| • | | Operation and Maintenance of Infrastructure Assets: a 150.7%, or S/16.9 million, increase in operating loss, from a S/11.2 million loss for 2019 to an S/28.1 million loss for 2020, primarily due to provisions for potential civil damages as a result of an impairment to certain accounts receivable of Concar arising from its contracts for networks 1 and 3 with the regional government of Cuzco, Peru, partially offset by an additional income associated with a reduction of certain provisions of Concar related to settlement and cooperation discussions with the Peruvian government. Our Operation and Maintenance of Infrastructure Assets operating margin was (10.8)% for 2020, compared to (3.6)% for 2019; and |
| • | | Water Treatment: There is no variation in operating profit between 2019 and 2020. Our water treatment operating margin for 2020 was 2.8% for 2020, compared to 2.8% for 2019. |
Real Estate
The table below sets forth selected financial information related to our Real Estate segment.
| | | | | | | | | | | | |
| | | Year ended December 31, | | | | |
| | | 2019 | | | 2020 | | | Variation | |
| | | (in millions of S/) | | | % | |
Revenues | | | 264.4 | | | | 182.4 | | | | (31.0 | )% |
Gross profit | | | 70.8 | | | | 40.3 | | | | (43.1 | )% |
Operating profit | | | 68.8 | | | | 25.8 | | | | (62.5 | )% |
Revenues. Our Real Estate revenues decreased 31.0%, or S/82.0 million, from S/264.4 million for 2019 to S/182.4 million for 2020. The comparative decrease in sales in 2020 was primarily due to high sales in Almonte in 2019.
Gross Profit. Our Real Estate gross profit decreased 43.1%, or S/30.5 million, from S/70.8 million for 2019 to S/40.3 million for 2020, mainly as a result of lower gross margins of our subsidiary Almonte, as well as certain provisions related to the Comas project. Our Real Estate gross margin was 22.1% for 2020, compared to 26.8% for 2019.
Operating Profit. Our Real Estate operating profit decreased 62.5%, or S/43.0 million, from S/68.8 million for 2019 to S/25.8 million for 2020, primarily due to lower gross margins of our subsidiary Almonte, as well as certain provisions related to the Comas project.
Financial (Expense) Income, Net
Our net financial expense decreased 34.3%, or S/61.3 million, from net financial expenses of S/178.8 million in 2019 to net financial expenses of S/117.5 million in 2020. Excluding foreign exchange differences, our net financial expense decreased 23.5%, or S/34.3 million, from net financial expense of S/146.0 million for 2019 to net financial expense of S/111.7 million for 2020, mainly due to the repayment of working capital debt of the expansion works of Line 1 of the Lima Metro. Our net exchange difference decreased S/27.0 million, from a loss of S/32.8 million for 2019 to a loss of S/5.8 million for 2020. This decrease in losses is due to the composition of assets and liabilities in dollars.
Share of Profit and Loss in Associates
Our share of profit and loss in associates increased S/219.6 million, from a loss of S/218.8 million in 2019 to a profit of S/0.8 million in 2020. There is no variation in our share of profit and loss in associates between 2019 and 2020.
Income Tax
Our income tax decreased S/245.0 million, from S/303.4 million for 2019 to S/58.4 million for 2020. This decrease in income tax was primarily due to a decrease in loss before tax, from S/535.2 million for 2019 to S/131.9 million for 2020, and the non-registration of deferred income tax from certain temporary items for which there is no expectation of recovery in the future. Our effective tax rates for 2019 and 2020 were 56.7% and 44.3%, respectively. See note 29 to our audited annual consolidated financial statements included in this annual report.
Net Profit
Our net profit increased S/648.3 million, from a S/838.8 million loss for 2019 to a S/190.3 loss for 2020. Net profit attributable to controlling interests increased S/666.9 million, while net profit attributable to non-controlling interests decreased S/18.6 million. Net profit attributable to controlling interests increased primarily due to the impairment of our investment in GSP and the discount applied to GSP’s account receivable in respect of the termination of the GSP gas pipeline concession, as well as an additional provision made in respect of the class action civil lawsuit against the company, which were registered in 2019.
Comparison of Results of Operations of 2018 and 2019
The following table sets forth the components of our consolidated income statement for 2018 and 2019.
| | | | | | | | | | | | |
| | | Year ended December 31, | | | | |
| | | 2018 | | | 2019 | | | Variation | |
| | | (in millions of S/) | | | | |
Revenues | | | 4,202.4 | | | | 4,337.9 | | | | 3.2 | % |
Cost of sales | | | (3,488.4 | ) | | | (3,887.4 | ) | | | 11.4 | % |
| | | | | | | | | | | | |
Gross profit | | | 714.0 | | | | 450.5 | | | | (36.9 | %) |
Administrative expenses | | | (311.2 | ) | | | (248.7 | ) | | | 20.1 | % |
Other income (expenses) | | | (65.9 | ) | | | (337.6 | ) | | | 413.9 | % |
Other (losses) gains, net | | | (0.0 | ) | | | (1.9 | ) | | | NM | |
Profit from sale of investments | | | — | | | | — | | | | — | |
| | | | | | | | | | | | |
Operating profit | | | 336.9 | | | | (137.8 | ) | | | NM | |
Financial (expense) income, net | | | (209.2 | ) | | | (178.8 | ) | | | (14.5 | %) |
Share of profit and loss in associates | | | (3.7 | ) | | | (218.8 | ) | | | NM | |
| | | | | | | | | | | | |
Profit (loss) before income tax | | | 124.0 | | | | (535.3 | ) | | | NM | |
Income tax | | | (111.0 | ) | | | (303.4 | ) | | | 173.3 | % |
| | | | | | | | | | | | |
Net profit from continuing operations | | | 13.0 | | | | (838.6 | ) | | | NM | |
Profit from discontinued operations | | | 44.4 | | | | — | | | | NM | |
Net profit (loss) | | | 57.4 | | | | (838.7 | ) | | | NM | |
Net profit (loss) attributable to controlling interest | | | (83.2 | ) | | | (884.7 | ) | | | 963.3 | % |
Net profit attributable to non-controlling interest | | | 140.6 | | | | 46.1 | | | | (67.2 | %) |
Revenues
Our total revenues increased by 3.2%, or S/135.5 million, from S/4,202.4 million for 2018 to S/4,337.9 million for 2019. Revenues increased due to an increase in the volume of projects under execution in the E&C segment. This was partially offset by: a decrease in revenues from the Infrastructure segment due to the completion of the expansion works of Line One of the Lima Metro, and a reduction of maintenance works by Concar; a decrease of revenues in the Real Estate segment as a consequence of fewer units of traditional housing delivered during the year, and the absence of land sales from the Almonte property during 2019.
The following table sets forth a breakdown of our revenues by segment for 2018 and 2019.
| | | | | | | | | | | | | | | | | | | | |
| | | Year ended December 31, | | | | |
| | | 2018 | | | 2019 | | | Variation | |
| | | (in millions
of S/) | | | % of Total | | | (in millions
of S/) | | | % of Total | | | % | |
Engineering and Construction | | | 1,960.9 | | | | 46.7 | % | | | 2,797.3 | | | | 64.5 | % | | | 42.7 | % |
Infrastructure | | | 1,883.3 | | | | 44.8 | % | | | 1,587.3 | | | | 36.6 | % | | | (15.8 | )% |
Real Estate | | | 630.1 | | | | 15.0 | % | | | 264.4 | | | | 6.1 | % | | | (58.0 | )% |
Corporate | | | 367.6 | | | | 8.7 | % | | | 342.6 | | | | 7.9 | % | | | (6.8 | )% |
Eliminations | | | (639.5 | ) | | | (15.2 | )% | | | (653.8 | ) | | | (15.1 | )% | | | (2.2 | )% |
| | | | | | | | | | | | | | | | | | | | |
Total | | | 4,202.4 | | | | 100.0 | % | | | 4,337.8 | | | | 100 | % | | | 3.2 | % |
| | | | | | | | | | | | | | | | | | | | |
Cost of Sales
Our total cost of sales increased by 11.4%, or S/399.0 million, from S/3,488.4 million for 2018 to S/3,887.4 million for 2019. This increase is mainly due to revenue growth, plus other additional costs associated with one project in Peru in which we have an arbitration claim against the client, and cost overruns with respect to a project in Chile.
Gross Profit
Our gross profit decreased by 36.9%, or S/263.6 million, from S/714.0 million for 2018 to S/450.4 million for 2019. Our gross margin (i.e., gross profit as a percentage of revenues) for 2019 was 10.4%, compared to 17.0% for 2018.
The following table sets forth a breakdown of our gross profit by segment for 2018 and 2019.
| | | | | | | | | | | | | | | | | | | | |
| | | Year ended December 31, | | | | |
| | | 2018 | | | 2019 | | | Variation | |
| | | (in millions
of S/) | | | % of Total | | | (in millions
of S/) | | | % of Total | | | % | |
Engineering and Construction | | | 62.1 | | | | 8.7 | % | | | 98.4 | | | | 21.9 | % | | | 58.5 | % |
Infrastructure | | | 350.6 | | | | 49.1 | % | | | 324.4 | | | | 72.0 | % | | | (7.5 | )% |
Real Estate | | | 288.0 | | | | 40.3 | % | | | 70.8 | | | | 15.7 | % | | | (75.4 | )% |
Corporate | | | 29.3 | | | | 4.1 | % | | | 6.6 | | | | 1.5 | % | | | (77.5 | )% |
Eliminations | | | (15.9 | ) | | | (2.2 | )% | | | (49.7 | ) | | | (11.0 | )% | | | 212.6 | % |
| | | | | | | | | | | | | | | | | | | | |
Total | | | 714.1 | | | | 100.0 | % | | | 450.5 | | | | 100 | % | | | (36.9 | )% |
| | | | | | | | | | | | | | | | | | | | |
Administrative Expenses
Our administrative expenses decreased by 20.1%, or S/62.5 million, from S/311.2 million for 2018 to S/248.7 million for 2019. This decrease is mainly due to the reduction of legal services provided by third parties, and the reduction of expenses from the sale of assets. As a percentage of revenues, our administrative expenses decreased to 5.7% in 2019, from 7.4% in 2018.
Other Income (Expenses)
Our other income (expenses) decreased by 413.7%, or S/271.9 million, from S/65.7 million in expenses for 2018 mainly dueto S/337.6 million in expenses for 2019. In 2018, our other income (expenses) included a provision related to the sale of machinery and equipment, the sale of the stake in one consortium, partially offset by the provision for potential civil compensation in favor of the Peruvian state that may be required to pay in connection with the investigations related to the IIRSA South project concession (tranches II and III)(tranche II) and Tranches 1 and 2 of the Lima Metro in which our company and GyM have been included as civilly-responsible third parties as described under “Item 8A. Financial Information—Consolidated Financial Statements and Other Information—Legal and Administrative Proceedings”.
Operating Profit (loss). Our E&C operating profit decreased S/.29.4 million, from a S/.(58.1) million loss for 2017 to a S/.(87.5) million loss for 2018, due to the reduction of gross profit and partially offset by the reduction of administrative expenses as a consequences of the reduction of personnel. Our E&C operating margin was (4.5)% for 2018, compared to (2.5)% for 2017.
Infrastructure
The table below sets forth selected financial information relatedProceedings.” In 2019, our other income (expenses) included: (i) impairments with respect to our Infrastructure segment.
| | | | | | | | | | | | |
| | | Year ended December 31, | | | | |
| | | 2017 | | | 2018 | | | Variation | |
| | | (in millions of S/.) | | | % | |
Revenues | | | 1,447.9 | | | | 1,883.3 | | | | 30.1 | % |
Gross profit | | | 260.2 | | | | 350.6 | | | | 34.7 | % |
Operating profit | | | 202.5 | | | | 283.0 | | | | 39.8 | % |
Revenues. The table below sets forthinvestment in GSP in the breakdownamount of our Infrastructure revenues by principal lines of business.
| | | | | | | | | | | | |
| | | Year ended December 31, | | | | |
| | | 2017 | | | 2018 | | | Variation | |
| | | (in millions of S/.) | | | % | |
Toll Roads | | | 263.8 | | | | 280.8 | | | | 6.4 | % |
Mass Transit | | | 365.8 | | | | 586.3 | | | | 60.3 | % |
Water Treatment | | | 3.2 | | | | 3.3 | | | | 3.1 | % |
Energy | | | 436.9 | | | | 560.5 | | | | 28.3 | % |
Operation and Maintenance of Infrastructure Assets | | | 378.3 | | | | 452.3 | | | | 19.6 | % |
Total | | | 1,447.9 | | | | 1,883.3 | | | | 30.1 | % |
Our Infrastructure revenues increased 30.1% or S/.435.4501.7 million from S/.1,447.9 million for 2017 to S/.1883.3 million for 2018. The variation in our Infrastructure revenues principally reflected the following:
| • | | Toll Roads: a 6.4%, or S/.17 million, increase in revenues, from S/.263.8 million for 2017 to S/.280.8 for 2018, primarily due to the increase in traffic and more maintenance works;
|
| • | | Mass Transit: a 60.3%, or S/.220.5 million, increase in revenues, from S/.365.8 million for 2017 to S/.586.3 million for 2018, primarily due to the revenues recognized for the advance of the construction of the infrastructure expansion and the operation of new trains;
|
| • | | Water Treatment: a 3.1%, or S/.0.1 million, increase in revenues, from S/.3.2 million for 2017 to S/.3.3 million for 2018, primarily due to the larger volume of treated wastewater during 2018 compared to 2017;
|
| • | | Energy:a 28.3%, or S/.123.6 million, increase in revenues, from S/.436.9 million for 2017 to S/.560.5 million for 2018, primarily due to an increase in our barrel daily production (3,651 barrel daily production in 2018 versus 3,140 barrel daily production in 2017), and better results in our fuel terminals business (3.9 MM barrels in storage per month in 2018 versus 3.39 MM barrels in storage per month in 2017, and 3.35 MM barrels dispatched per month in 2018 versus 3.43 MM barrels dispatched per month in 2017). Additionally, gas processing levels in our gas processing plant were lower (30.12 MMcf per day in 2018 to 30.57 MMcf per day in 2017), and the prices of liquefied petroleum gas (“LPG”) increased from US$48.18/bbl in 2017 to US$59.36 in 2018. The price of HAS (CGN) went from US$49.44/bbl in 2017 to US$59.36 in 2018; and
|
| • | | Operation and Maintenance of Infrastructure Assets: a 19.6%, or S/.74.0 million, increase in revenues, from S/.378.3 million for 2017 to S/.452.3 million for 2018, due to new contracts awarded during 2017 that initiated works in 2018.
|
Gross Profit. The table below sets forth the breakdown of our Infrastructure gross profit by principal lines of business.
| | | | | | | | | | | | |
| | | Year ended December 31, | | | | |
| | | 2017 | | | 2018 | | | Variation | |
| | | (in millions of S/.) | | | % | |
Toll Roads | | | 89.9 | | | | 70.5 | | | | (21.6 | )% |
Mass Transit | | | 48.7 | | | | 122.6 | | | | 151.7 | % |
Water Treatment | | | 0.4 | | | | 0.6 | | | | 50.0 | % |
Energy | | | 71.8 | | | | 120.4 | | | | 67.7 | % |
Operation and Maintenance of Infrastructure Assets | | | 49.3 | | | | 36.6 | | | | (25.8 | )% |
Total | | | 260.2 | | | | 350.6 | | | | 34.7 | % |
Our Infrastructure gross profit increased 34.7%, or S/.90.4 million, from S/.260.2 for 2017 to S/.350.6 million for 2018. Our Infrastructure gross margin was 18.6% for 2018 and 18% for 2017 as well. The variation in our Infrastructure gross profit principally reflected the following:
| • | | Toll Roads: a 21.6%, or S/.19.4 million, decrease in gross profit, from S/.89.9 million for 2017 to S/.70.5 million for 2018. Our toll roads gross margin decreased from 34.1% for 2017 to 25.1% for 2018 as a consequence of the amortization of the investment made in the Norvial toll road during 2017;
|
| • | | Mass Transit: a 151.7%, or S/.73.9 million, increase in gross profit, from S/.48.7 million for 2017 to S/.122.6 million for 2018, primarily due to the expansion works and the operation of new trains. Our gross margin for 2018 was 20.9%, compared to 13.3% in 2017.
|
| • | | Water Treatment: a 50%, or S/.0.2 million, increase in gross profit for 2018, from S/.0.4 million gross profit for 2017 to S/.0.6 million gross profit for 2018, due to the larger volume of treated wastewater during 2018 compared 2017. Our water treatment gross margin was 18.2% for 2018, compared to 12.5% for 2017;
|
| • | | Energy: a 67.7%, or S/.48.6 million, increase in gross profit, from S/.71.8 million for 2017 to S/.120.4 million for 2018, primarily due to the increase in the price of oil from US$52.84 in 2017 to US$69.29 in 2018. Our energy gross margin was 21.5% for 2018, compared to 16.4% for 2017; and
|
| • | | Operation and Maintenance of Infrastructure Assets: a 25.8%, or S/.12.7 million, decrease in gross profit, from S/.49.3 million for 2017 to S/.36.6 million for 2018, due to the impairment of provisions as the result of the passage of time of the Red Vial 1 Road and the Red Vial 3 Road, two contracts(US$151.3 million) with the regional government of Cuzco, Peru. Our operation and maintenance of infrastructure assets gross margin was 8.1% for 2018, compared to 13.0% for 2017.
|
Operating Profit.The table below sets forth the breakdown of our Infrastructure operating profit by principal lines of business.
| | | | | | | | | | | | |
| | | Year ended December 31, | | | | |
| | | 2017 | | | 2018 | | | Variation | |
| | | (in millions of S/.) | | | % | |
Toll Roads | | | 80.1 | | | | 59.4 | | | | (25.8 | )% |
Mass Transit | | | 33.4 | | | | 110.6 | | | | 231.1 | % |
Water Treatment | | | 0.1 | | | | 0.3 | | | | 200.0 | % |
Energy | | | 61.1 | | | | 100.7 | | | | 64.8 | % |
Operation and Maintenance of Infrastructure Assets | | | 27.7 | | | | 12.1 | | | | (56.3 | )% |
Total | | | 202.5 | | | | 283.0 | | | | 39.8 | % |
Our Infrastructure operating profit increased 39.8%, or S/.80.5 million, from S/.202.5 million for 2017 to S/.283.0 million for 2018. Our Infrastructure operating margin was 15.0% for 2018, compared to 14.0% for 2017. The variation in our Infrastructure operating profit principally reflected the following:
| • | | Toll Roads: a 25.8%, or S/.20.7 million, decrease in operating profit, from S/.80.1 million for 2017 to S/.59.4 million for 2018, primarily due to the reduction of gross profit and an increase in administrative expenses due to extraordinary legal expenses in respect of a road accident. Our toll roads operating margin was 21.2% for 2018, compared to 30.4% for 2017;
|
| • | | Mass Transit: a 231.1%, or S/.77.2 million, increase in operating profit, from an operating profit of S/.33.4 million for 2017 to S/.110.6 million for 2018, primarily due to the increase in gross profit and the reduction of administrative expenses compared to 2017, including due to extraordinary legal expenses related to arbitrages and a fine from the Peruvian tax authority (SUNAT). Our mass transit operating margin for 2018 was 18.9%, compared to 9.1% for 2017;
|
| • | | Water Treatment: a 200%, or S/.0.2 million, increase in operating profit, from an operating profit of S/.0.1 million in 2017 to an operating profit of S/.0.3 in 2018, mainly due to the increase in gross profit and the reduction of administrative expenses as in 2017 there were extraordinary expenses for studies made for a potential expansion of the plant. Our water treatment operating margin for 2018 was 9.1%, compared to 3.1% for 2017;
|
| • | | Energy: a 64.8%, or S/.39.6 million, increase in operating profit, from S/.61.1 million for 2017 to S/.100.7 million for 2018, primarily due to the increase in gross profit partially offset by an increase in administrative expenses as a consequence of an increase in services provided by third parties related to IT, accounting and tax consultancy. Our Energy operating margin was 18.0% for 2018, compared to 14.0% for 2017; and
|
| • | | Operation and Maintenance of Infrastructure Assets: a S/.56.3%, or S/.15.6 million decrease in operating profit, from a S/.27.7 million profit in 2017 to a S/.12.1 million profit for 2018, primarily due to the amortization of an intangible assets that had resulted from the purchase of an asset. Our Operation and Maintenance of Infrastructure Assets operating margin was 2.7% for 2018, compared to 7.3% for 2017.
|
Real Estate
The table below sets forth selected financial information related to our Real Estate segment.
| | | | | | | | | | | | |
| | | Year ended December 31, | | | | |
| | | 2017 | | | 2018 | | | Variation | |
| | | (in millions of S/.) | | | % | |
Revenues | | | 647.5 | | | | 630.1 | | | | (2.7 | )% |
Gross profit | | | 147.4 | | | | 288.0 | | | | 95.4 | % |
Operating profit | | | 171.5 | | | | 235.3 | | | | 37.2 | % |
Revenues. Our Real Estate revenues decreased 2.7%, or S/.17.4 million,investment in GSP and our accounts receivable from S/.647.5 million for 2017 to S/.630.1 million for 2018. The decrease is primarily due to fewer units delivered in 2018 (1,278 units in 2018 and 1,418 units in 2017). In addition, revenues in 2017 and 2018 were impacted by the sale of Cuartel San Martin in February 2017 for US$50.0 milllion and the sale of land by Almonte in May 2018 for US$92.7 million, respectively.
Gross Profit. Our Real Estate gross profit increased 95.4%, or S/.140.6 million, from S/.147.4 million for 2017 to S/.288.0 million for 2018, mainlyGSP as a result of the saletermination of landthe GSP gas pipeline concession; (ii) an impairment of S/33.1 million (US$10.0 million) with respect to goodwill we recognized in connection with our acquisition of Morelco; (iii) a re-valuation of the Vial & Vives-DSD brand by Almonte. Our Real Estate gross marginS/10.7 million due to the increased backlog of Vial & Vives-DSD during 2019; (iv) impairments of certain minor investments of S/35.2 million (US$ 10.6 million), (v) a reversal of S/19.4 million (US$5.8 million) of the impairment of the investment in the Ancon project that was 45.7%registered at the end of 2018; (vi) a provision of an additional S/77.4 million (US$23.3 million) for 2018, comparedcivil compensation in favor of the Peruvian state pursuant to 22.8% for 2017.Law 30737 in connection with ongoing corruption investigations in respect of the company; (vii) provisions of S/49.8 million (US$15 million) made in respect of the class action civil lawsuit against the company; and (viii) other minor adjustments of S/57.9 million (US$14.5 million).
Operating Profit.
Our Real Estate operating profit increased 37.2%decreased 140.9%, or S/.63.8474.6 million, from operating profit of S/.171.5 million for 2017 to S/.235.3336.9 million for 2018 to operating loss of S/(137.7) million for 2019. Our operating margin (i.e., operating profit as a percentage of revenues) was (3.2)% for 2019, compared to 8.0% for 2018. The decrease in operating margin is primarily as a result of the increase in gross profit due to the sale of land by Almonte in May 2018.
Financial (Expense) Income, Net
Our net financial expense increased S/.60.0 million from net financial expense of S/.137.0 million in 2017 to net financial expenses of S/.197.1 million in 2018. Excluding foreign exchange differences, our net financial expense increased 21.8%, or S/.31.1 million, from net financial expense of S/.142.6 million for 2017 to net financial expense of S/.173.8 million for 2018, due to a financial discount applied to the long term account receivable of GSP (see “Item 5.A. Operating and Financial Review and Prospects—Operating Results—Recent Developments”), an increase in rates and bank commissions, and the accrual of interest for the beginning of the operations of the second road of Norvial, partially offset by the financialOther income from the sale of U.S. dollar-denominated obligations of the Peruvian government (CRPAOs) related to the financing of the expansion of Line One of the Lima Metro. Our net exchange difference decreased S/.28.9 million, from a profit of S/.5.6 million for 2017 to a loss of S/.23.3 million for 2018. This decrease is due to depreciation of the sol.
Share of Profit and Loss in Associates
Our share of profit and loss in associates decreased S/.4.2 million, from a profit of S/.0.5 million in 2017 to a loss of S/.3.7 million in 2018, primarily due to the profit from the sale of COGA for S/.4.4 million in 2017.
Income Tax
Our income tax increased S/.67.0 million, from S/.46.3 million for 2017 to S/.113.3 million for 2018. This increase in income tax was primarily due to an increase in profit before tax. Our effective tax rates for 2017 and 2018 were 84.6% and 102.6%, respectively, due to morenon-deductible expenses, such as the provision of certain civil compensation.
Net Profit
Our net profit decreased 72.5%, or S/.151.7 million, from a S/.209.2 million profit for 2017 to a S/.57.5 million profit in 2018. Net profit attributable to controlling interests decreased 156.0%, while net profit attributable tonon-controlling interests increased 132.4%. Net profit attributable tonon-controlling interests increased primarily due to the sale of land by Almonte in May 2018. See “—General—Accounting for Subsidiaries, Joint Operations, Joint Ventures and Associated Companies.”
Comparison of Results of Operations of 2016 and 2017
The following table sets forth the components of our consolidated income statement for 2016 and 2017.(expenses) explained above.
| | | | | | | | | | | | |
| | | Year ended December 31, | | | | |
| | | 2016 | | | 2017
Restated | | | Variation | |
| | | (in millions of S/.) | | | % | |
Revenues | | | 4,137.3 | | | | 4,014.0 | | | | (3.0 | )% |
Cost of sales | | | (3,821.2 | ) | | | (3,511.6 | ) | | | (8.1 | )% |
| | | | | | | | | | | | |
Gross profit | | | 316.1 | | | | 502.4 | | | | 58.9 | % |
Administrative expenses | | | (278.3 | ) | | | (322.5 | ) | | | 15.9 | % |
Other income (expenses) | | | (21.9 | ) | | | (33.3 | ) | | | 52.1 | % |
Other (losses) gains, net | | | (0.5 | ) | | | 0.5 | | | | (200.0 | )% |
Profit from sale of investments | | | 46.3 | | | | 34.5 | | | | (25.5 | )% |
| | | | | | | | | | | | |
Operating profit | | | 61.7 | | | | 181.6 | | | | 194.3 | % |
Financial (expense) income, net | | | (179.8 | ) | | | (137.0 | ) | | | (23.8 | )% |
Share of profit and loss in associates | | | (590.1 | ) | | | 0.5 | | | | (100.1 | )% |
| | | | | | | | | | | | |
Profit before income tax | | | (708.2 | ) | | | 45.1 | | | | (106.4 | )% |
Income tax | | | 152.2 | | | | (46.3 | ) | | | (130.4 | )% |
Net Profit from continuing operations | | | (556.0 | ) | | | (1.2 | ) | | | (99.8 | )% |
Profit from discontinued operation | | | 104.4 | | | | 210.4 | | | | 101.5 | % |
Net Profit (loss) | | | (451.6 | ) | | | 209.2 | | | | (146.3 | )% |
Net Profit attributable to controlling interest | | | (509.7 | ) | | | 148.7 | | | | (129.2 | )% |
Net Profit attributable tonon-controlling interest | | | 58.1 | | | | 60.5 | | | | 4.1 | % |
Revenues
Our total revenues decreased by 3.0 %, or S/.123.3 million, from S/.4,137.3 million for 2016 to S/.4,014.0 million for 2017. Revenues decreased due mainly to a reduction of revenues in the E&C segment as a consequence of fewer projects under execution. This was offset, in part, by an increase in revenues of GMP due to an increase in the average price of oil, as well as an increase in production. Revenues in the Mass Transit business increased due to expansion works, along with major maintenance works by Survial and new contracts awarded during 2016 that initiated works in 2017 for Concar. Revenues in the Real Estate segment increased due to the sale of Cuartel San Martín and also due to an increase in units delivered.
The following table sets forth a breakdown of our revenues by segment for 2016 and 2017.
| | | | | | | | | | | | | | | | | | | | |
| | | Year ended December 31, | | | | |
| | | 2016 | | | 2017 | | | Variation | |
| | | (in millions of S/.) | | | % of Total | | | (in millions of S/.) | | | % of Total | | | % | |
Engineering and Construction | | | 2,936.8 | | | | 71.0 | % | | | 2,331.9 | | | | 58.1 | % | | | (20.6 | )% |
Infrastructure | | | 1,174.8 | | | | 28.4 | % | | | 1,447.9 | | | | 36.1 | % | | | 23.2 | % |
Real Estate | | | 411.5 | | | | 9.9 | % | | | 647.5 | | | | 16.1 | % | | | 57.4 | % |
Corporate | | | 62.1 | | | | 1.5 | % | | | 70.0 | | | | 1.7 | % | | | 12.7 | % |
Eliminations | | | (447.9 | ) | | | (10.8 | )% | | | (483.4 | ) | | | (12.0 | )% | | | 7.9 | % |
| | | | | | | | | | | | | | | | | | | | |
Total | | | 4,137.3 | | | | 100.0 | % | | | 4,014.0 | | | | 100.0 | % | | | (3.0 | )% |
Cost of Sales
Our total cost of sales decreased by 8.1%, or S/. 309.6 million, from S/.3,821.2 million for 2016 to S/.3,511.6 million for 2017. This decrease is mainly due to the reduction of revenues.
Gross Profit
Our gross profit increased by 58.9% or S/.186.3 million, from S/.316.1 million for 2016 to S/.502.4 million for 2017. Our gross margin (i.e. gross profit as a percentage of revenues) for 2017 was 12.5% compared to 7.6 % for 2016. In 2016, gross profit was impacted by the early termination of GSP construction consortium in our E&C segment and partially offset by the profit generated by the sale of land of Almonte in our Real Estate segment. During 2016, gross profit was also impacted in our Infrastructure segment by the decrease in oil price. During 2017, gross profit was impacted in our E&C segment by efficiencies in the projects under execution, in our Infrastructure Segment by an increase in oil price, in our Real Estate segment by the sale of Cuartel San Martín.
The following table sets forth a breakdown of our gross profit by segment for 2016 and 2017.
| | | | | | | | | | | | | | | | | | | | |
| | | Year ended December 31, | | | | |
| | | 2016 | | | 2017 | | | Variation | |
| | | (in millions of S/.) | | | % of Total | | | (in millions of S/.) | | | % of Total | | | % | |
Engineering and Construction | | | 60.2 | | | | 19.0 | % | | | 176.5 | | | | 35.1 | % | | | 193.2 | % |
Infrastructure | | | 211.4 | | | | 66.9 | % | | | 260.2 | | | | 51.8 | % | | | 23.1 | % |
Real Estate | | | 136.5 | | | | 43.2 | % | | | 147.4 | | | | 29.3 | % | | | 8.0 | % |
Corporate | | | (0.2 | ) | | | (0.1 | )% | | | (37.8 | ) | | | (7.5 | )% | | | NM | |
Eliminations | | | (91.9 | ) | | | (29.1 | )% | | | (43.8 | ) | | | (8.7 | )% | | | (52.3 | )% |
| | | | | | | | | | | | | | | | | | | | |
Total | | | 316.1 | | | | 100.0 | % | | | 502.4 | | | | 100.0 | % | | | 58.9 | % |
Administrative Expenses
Our administrative expenses increased by 15.9 %, or S/.44.2 million, from S/.278.3 million for 2016 to S/.322.5 million for 2017. This increase is mainly due to an increase in services provided by third parties principally relating to legal, accounting and tax consultancy. As a percentage of revenues, our administrative expenses increased to 8 % in 2017 from 6.7% in 2016.
Other Income (Expenses)
Our other income (expenses) increased by 52.1%, or S/.11.4 million, from S/.21.9 million in expenses for 2016 to S/.33.3 million in expenses for 2017. In 2016, our other income included the sale of machinery and equipment, price adjustments as well as a reversion of legal and tax provisions in connection with the acquisition of Morelco, and extraordinary income from the settlement agreement reached in connection with the legal proceeding related to the Collahuasi project in Chile. In 2017, our other income included the sale of machinery and equipment, as well as the impairment of the Vial y Vives DSD brand.
Profit from Sale of Investments
We registered a profit of S/.34.5 million from the sale of the certain investments, mainly due to the sales of Red Eagle Mining, PRINSUR and COGA in 2017.
The following table sets forth a breakdown of our operating profit by segment for 20162018 and 2017.
Operating Profit
Our operating profit increased 194.3%, or S/.119.9 million, from S/.61.7 million for 2016 to S/.181.6 million for 2017. Our operating margin (i.e., operating profit as a percentage of revenues) was 4.5% for 2017 compared to 1.5% for 2016. The increase in operating margin is primarily due to the increase in profit from the sales of investments and, to a lesser extent, to the increase in gross profit.2019.
| | | | Year ended December 31, | | | | | Year ended December 31, | | | |
| | | 2016 | | 2017 | | Variation | | | 2018 | | 2019 | | 2019 | |
| | | (in millions of S/.) | | % of Total | | (in millions of S/.) | | % of Total | | % | | | (in millions
of S/) | | Percentage
of Total | | (in millions
of S/) | | Percentage
of Total | | Variation % | |
Engineering and Construction | | | (166.1 | ) | | (269.2 | )% | | (58.1 | ) | | (32.0 | )% | | (65.0 | )% | | | (87.5 | ) | | | (26.0 | )% | | | (33.1 | ) | | | 24.1 | % | | | (62.2 | )% |
Infrastructure | | | 146.1 | | | 236.8 | % | | 202.5 | | | 111.5 | % | | 38.6 | % | | | 283.0 | | | | 84.0 | % | | | 203.1 | | | | (147.5 | )% | | | (28.2 | )% |
Real Estate | | | 108.9 | | | 176.5 | % | | 171.5 | | | 94.4 | % | | 57.5 | % | | | 235.3 | | | | 69.8 | % | | | 68.8 | | | | (50.0 | )% | | | (70.8 | )% |
Corporate | | | 4.4 | | | 7.1 | % | | (146.9 | ) | | (80.9 | )% | | NM | | | | (118.7 | ) | | | (35.2 | )% | | | (387.1 | ) | | | 281.1 | % | | | (226.1 | ) |
Eliminations | | | (31.6 | ) | | (51.2 | )% | | 12.7 | | | 7.0 | % | | (140.2 | )% | | | 24.8 | | | | 7.4 | % | | | 10.6 | | | | (7.7 | )% | | | (57.3 | )% |
| | | | | | | | | | | | | | | | |
Total | | | 61.7 | | | | 100.0 | % | | | 181.6 | | | | 100.0 | % | | | 194.3 | % | | | 336.9 | | | | 100.0 | % | | | (137.7 | ) | | | 100.0 | % | | | (59.1 | )% |
| | | | | | | | | | | | | | | | |
The following discussion analyzes our key results of operations on a segment basis. For further information on our business segments, see note 7 to our audited annual consolidated financial statements included in this annual report.
Engineering and Construction
The table below sets forth selected financial information related to our E&C segment.
| | | | Year ended December 31, | | | | | | Year ended December 31, | | | | |
| | | 2016 | | | 2017 | | | Variation | | | 2018 | | | 2019 | | | Variation | |
| | | (in millions of S/.) | | | % | | | (in millions of S/) | | | % | |
Revenues | | | 2,936.8 | | | | 2,331.9 | | | | (20.6 | )% | | | 1,960.9 | | | | 2,797.3 | | | | 42.7 | % |
Gross profit | | | 60.2 | | | | 176.5 | | | | 193.2 | % | | | 62.1 | | | | 98.4 | | | | 58.5 | % |
Operating profit | | | (166.1 | ) | | | (58.1 | ) | | | (65.0 | )% | |
Operating profit (loss) | | | | (87.5 | ) | | | (33.1 | ) | | | 62.2 | % |
Revenues. Our E&C revenues decreased 20.6%increased 42.7%, or S/.604.9836.4 million, from S/.2,936.81,960.9 million for 20162018 to S/.2,331.92,797.3 million for 2017.
2019. The reductionincrease is due to fewerthe increase in the volume of projects under execution resulting from lower levels of private investment in Peru. execution.
The following tables set forth variations in our E&C revenues by business activities, types of contracts andend-markets:
| | | | | | | | |
| | | Year ended December 31, | |
| | | 2016 | | | 2017 | |
| | | % | | | % | |
Engineering services | | | 4.5 | | | | 8.4 | |
Electromechanic construction | | | 44.6 | | | | 31.2 | |
Civil construction | | | 35.5 | | | | 49.8 | |
Building construction activities | | | 15.3 | | | | 10.6 | |
Other Services | | | — | | | | — | |
| | | | | | | | |
Total | | | 100.0 | | | | 100.0 | |
| |
| | | Year ended December 31, | |
| | | 2016 | | | 2017 | |
| | | % | | | % | |
Cost + fee | | | 3.6 | | | | 1.6 | |
Unit price | | | 16.9 | | | | 42.9 | |
Lump sum | | | 79.5 | | | | 47.3 | |
EPC contracts | | | — | | | | 8.2 | |
| | | | | | | | |
Total | | | 100.0 | | | | 100.0 | |
| |
| | | Year ended December 31, | |
| | | 2016 | | | 2017 | |
| | | % | | | % | |
Mining | | | 10.7 | | | | 24.1 | |
Real estate buildings | | | 15.9 | | | | 10.8 | |
Power | | | 5.1 | | | | — | |
Oil and gas | | | 54.0 | | | | 31.4 | |
Transportation | | | 5.2 | | | | 22.9 | |
Water and sewage | | | 4.6 | | | | 2.0 | |
Other end markets | | | 4.6 | | | | 8.7 | |
| | | | | | | | |
Total | | | 100.0 | | | | 100.0 | |
| | | | | | | | |
| | | Year ended December 31, | |
| | | 2018 | | | 2019 | |
| | | % | | | % | |
Engineering services | | | 9.4 | | | | 11.5 | |
Electromechanic construction | | | 22.3 | | | | 29.6 | |
Civil construction | | | 52.4 | | | | 48.1 | |
Building construction activities | | | 8.8 | | | | 10.2 | |
Other services | | | 7.1 | | | | 0.6 | |
| | | | | | | | |
Total | | | 100.0 | | | | 100.0 | |
| | | | | | | | |
| | | Year ended December 31, | |
| | | 2018 | | | 2019 | |
| | | % | | | % | |
Cost + fee | | | 1.0 | | | | 6.2 | |
Unit price | | | 41.0 | | | | 46.7 | |
Lump sum | | | 38.9 | | | | 9.1 | |
EPC contracts | | | 19.1 | | | | 38.0 | |
| | | | | | | | |
Total | | | 100.0 | | | | 100.0 | |
| | | | | | | | |
| | | Year ended December 31, | |
| | | 2018 | | | 2019 | |
| | | % | | | % | |
Mining | | | 23.0 | | | | 6.2 | |
Real estate buildings | | | 9.1 | | | | 46.7 | |
Power | | | 1.8 | | | | 9.1 | |
Oil and gas | | | 40.6 | | | | 38.0 | |
| | | | | | | | |
| | | Year ended December 31, | |
| | | 2018 | | | 2019 | |
| | | % | | | % | |
Transportation | | | 21.6 | | | | 4.2 | |
Water and sewage | | | 1.3 | | | | 0.9 | |
Other end markets | | | 2.6 | | | | 6.7 | |
| | | | | | | | |
Total | | | 100.0 | | | | 100.0 | |
The breakdown of E&C revenues by different business activities, types of contracts andend-markets tends to vary from period to period due to a variety of factors, including the timing of the execution of larger projects in any particular period, which is typically outside of our control.
Gross Profit. Our E&C gross profit increased 193.2%58.5%, or S/.116.336.3 million, from S/.60.262.1 million for 20162018 to S/.176.598.4 million for 2017.2019. Our E&C gross margin for 20172019 was 7.6%3.5%, compared to 2.0%3.2% for 2016. This increase in our E&C gross profit was mainly due to efficiencies implemented in the different projects under execution.2018.
Other income (expenses). Other income (expenses) increased in our E&C segment, from S/.14.213.5 million in expenses for 20162018 to a S/.46.59.9 million in expenses in 2017, mainly because whilefor 2019. For 2019, this item usually includes salesthe sale of machinery and equipment, an impairment in 2017, it also includedrespect of goodwill in Morelco and the recovery of an impairment ofwith respect to the Vial y Vives DSD brand. See note 28 to our audited annual consolidated financial statements included in this annual report.
Operating Profit (loss). Our E&C operating profit increaseddecreased S/.108.054.4 million, from a S/.166.187.5 million loss for 20162018 to a S/.58.133.1 million loss for 2017, due to an increase of gross profit, a reduction of administrative expenses, related to a reduction of personnel and lower expenses relating to bid proposals, and the profit from the sale of the shares of Red Eagle Mining owned by Stracon GyM.2019. Our E&C operating margin was (2.5)(1.2)% for 20172019, compared to (5.7)(4.5)% for 2016.
In addition, our E&C segment had a S/.0.3 million profit in 2017, compared to a S/.5.7 million loss in 2016, relating to minority interests held by Vial y Vives in several of its projects undertaken in Chile, as well as the minority participation of GyM in Viva GyM reflected under “share of profit and loss in associates” in our audited annual consolidated financial statements.2018.
Infrastructure
The table below sets forth selected financial information related to our Infrastructure segment.
| | | | Year ended December 31, | | | | | | Year ended December 31, | | | | |
| | | 2016 | | | 2017 | | | Variation | | | 2018 | | | 2019 | | | Variation | |
| | | (in millions of S/.) | | | % | | | (in millions of S/) | | | % | |
Revenue | | | 1,174.8 | | | | 1,447.9 | | | | 23.2 | | |
Revenues | | | | 1,883.3 | | | | 1,587.3 | | | | (15.7 | )% |
Gross profit | | | 211.4 | | | | 260.2 | | | | 23.1 | | | | 350.6 | | | | 324.4 | | | | (7.5 | )% |
Operating profit | | | 146.1 | | | | 202.5 | | | | 38.6 | | | | 283.0 | | | | 203.1 | | | | (28.2 | )% |
Revenues. The table below sets forth the breakdown of our Infrastructure revenues by principal lines of business.
| | | | Year ended December 31, | | | | | | Year ended December 31, | | | | |
| | | 2016 | | | 2017 | | | Variation | | | 2018 | | | 2019 | | | Variation | |
| | | (in millions of S/.) | | | % | | | (in millions of S/) | | | % | |
Toll Roads | | | 264.4 | | | | 263.8 | | | | (0.2 | ) | | | 280.8 | | | | 326.3 | | | | 16.2 | % |
Mass Transit | | | 247.0 | | | | 365.8 | | | | 48.1 | | | | 586.3 | | | | 397.9 | | | | (32.1 | )% |
Water Treatment | | | 18.5 | | | | 3.2 | | | | (82.7 | ) | | | 3.3 | | | | 3.6 | | | | 9.1 | % |
Energy | | | 382.2 | | | | 436.9 | | | | 14.3 | | | | 560.5 | | | | 552.6 | | | | (1.4 | )% |
Operation and Maintenance of Infrastructure Assets | | | 262.7 | | | | 378.3 | | | | 44.0 | | | | 452.3 | | | | 307.0 | | | | (32.1 | )% |
| | | | | | | | | | | | | | | | | |
Total | | | 1,174.8 | | | | 1,447.9 | | | | 23.2 | | | | 1,883.2 | | | | 1,587.4 | | | | (15.7 | )% |
| | | | | | | | | | |
Our Infrastructure revenues increased 23.2%decreased 15.7%, or S/.273.1296.0 million, from S/.1,174.81,883.3 million for 20162018 to S/.1,447.91,587.3 million for 2017.2019. The variation in our Infrastructure revenues principally reflected the following:
| | • | | Toll Roads: a 0.2%16.2%, or S/.0.645.5 million, decreaseincrease in revenues, from S/.264.4280.8 million for 20162018 to S/.263.8326.3 million for 2017,2019, primarily due to the timingexpansion works completed in 2019 and increased amounts of the work for the second stage of the Norvial toll road andtraffic, partially offset by an increase in revenues in Survial due to morefewer maintenance works executed on the road;effected in other roads; |
| | • | | Mass Transit: a 48.1%32.1%, or S/.118.8 million, increase in revenues, from S/.247.0 million for 2016 to S/.365.8 million for 2017, primarily due to the revenues recognized for the advance of the construction of the infrastructure expansion; |
| • | | Water Treatment: a 82.7%, or S/.15.3188.4 million, decrease in revenues, from S/.18.5586.3 million for 20162018 to S/.3.2397.9 million for 2017,2019, primarily due to conclusionthe completion of the construction works of infrastructure expansion (which primarily impacted our results during 2018), partially offset by additional kilometers travelled by the La Chira waste water treatment plant. The operation of the plant started in the second quarter of 2016;new trains under operation;
|
| | • | | Energy:a 14.3%1.4%, or S/.54.77.9 million, increasedecrease in revenues, from S/.382.2560.5 million for 20162018 to S/.436.9 million552.6 for 2017,2019, primarily due to the decrease in the price of oil from US$69.29 in 2018 to US$63.11 in 2019 and the results in our fuel terminals business (3.57 MM barrels in storage per month in 2019 versus 3.9 MM barrels in storage per month in 2018, and 3.01 MM barrels dispatched per month in 2019 versus 3.35 MM barrels dispatched per month in 2018), partially offset by an increase in our barrel daily production (3,1404,064 barrel daily production in 20172019 versus 2,7563,651 barrel daily production in 2016), as well as an increase in international oil prices (average price per basket of oils of US$52.84 bbl in 2017 versus US$41.8 bbl in 2016), and better results in our fuel terminals business (3.39 MM barrels in storage per month in 2017 versus 3.18 MM barrels in storage per month in 2016, and 3.43 MM barrels dispatched per month in 2017 versus 3.34 MM barrels dispatched per month in 2016).2018. Additionally, even though gas processing levels in our gas processing plant were lower (33.2slightly higher at (30.52 MMcf per day in 2016 to 30.572019 versus 30.12 MMcf per day in 2017)2018), this was partially offset byand the increase in prices of liquefied petroleum gas (“LPG”). The price of LPG went decreased from US$41.87/bbl59.36 in 20162018 to US$48.18/bbl47.86 in 2017 and the2019. The price of HAS (CGN) wentincreased from US$35.64/bbl59.36 in 20162018 to US$49.44/bbl69.55 in 2017; and2019; |
| | • | | Operation and Maintenance of Infrastructure Assets: a 44.0%32.1%, or S/.115.6145.3 million, decrease in revenues, from S/452.3 million for 2018 to S/307 million for 2019, due to fewer maintenance works during 2019 as a result of the fulfillment of periodic maintenance of Chuquibambilla and Chinchaypujio roads in 2018; and |
| • | | Water Treatment: a 9.1%, or S/0.30 million, increase in revenues, from S/.262.73.3 million for 20162018 to S/.378.3 million,3.6 for 2019, primarily due to new contracts awardedthe larger volume of treated wastewater during 2016 that initiated works in 2017.2019 compared to 2018. |
Gross Profit. The table below sets forth the breakdown of our Infrastructure gross profit by principal lines of business.
| | | | Year ended December 31, | | | | | | Year ended December 31, | | | | |
| | | 2016 | | | 2017 | | | Variation | | | 2018 | | | 2019 | | | Variation | |
| | | (in millions of S/.) | | | % | | | (in millions of S/) | | | % | |
Toll Roads | | | 75.8 | | | | 89.9 | | | | 18.6 | | | | 70.5 | | | | 58.7 | | | | (16.7 | )% |
Mass Transit | | | 42.5 | | | | 48.7 | | | | 14.6 | | | | 122.6 | | | | 119.5 | | | | (2.5 | )% |
Water Treatment | | | 5.7 | | | | 0.4 | | | | (93.0 | ) | |
Energy | | | 42.1 | | | | 71.8 | | | | 70.5 | | | | 120.4 | | | | 108.3 | | | | (10.0 | )% |
Operation and Maintenance of Infrastructure Assets | | | 45.3 | | | | 49.3 | | | | 8.8 | | | | 36.6 | | | | 37.5 | | | | 2.5 | % |
Water Treatment | | | | 0.6 | | | | 0.5 | | | | (16.7 | )% |
| | | | | | | | | | | | | | | | | |
Total | | | 211.4 | | | | 260.2 | | | | 23.1 | | | | 350.7 | | | | 324.5 | | | | (7.5 | )% |
| | | | | | | | | | |
Our Infrastructure gross profit increased 23.1%decreased 7.5%, or S/.48.826.2 million, from S/.211.4350.6 million for 20162018 to S/.260.2324.4 million for 2017.2019. Our Infrastructure gross margin was 18%18.6% for 20172018 and 18%20.4% for 2016 as well.2019. The variation in our Infrastructure gross profit principally reflected the following:
| | • | | Toll Roads: a 18.6%16.7%, or S/.14.111.8 million, increasedecrease in gross profit, from S/.75.870.5 million for 20162018 to S/.89.958.7 million for 2017.2019. Our Toll Roadstoll roads gross margin increaseddecreased from 28.7%25.1% for 20162018 to 34.1%18% for 2017,2019, as a consequence of the fewer construction works that have lower margins during 2017;execution of periodic maintenance works; |
| | • | | Mass Transit: a 14.6%2.5%, or S/.6.23.1 million, increasedecrease in gross profit, from S/.42.5122.6 million for 20162018 to S/.48.7119.5 million for 2017,2019, primarily due to morethe completion of expansion works in 2017.works. Our gross margin for 2017in 2019 was 13.3%30.0%, compared to 17.2% for 2016, due to lower margins20.9% in those expansion works;2018. |
| • | | Water Treatment: a 93.0%, or S/.5.3 million, decrease in gross profit for 2017, from S/.5.7 million gross profit for 2016 to S/.0.4 million gross profit for 2017, due to the conclusion of construction works. Our Water Treatment gross margin was 12.5% for 2017 compared to 30.8% for 2016;
|
| | • | | Energy: a 70.5%10.0%, or S/.29.712.1 million, increasedecrease in gross profit, from S/.42.1120.4 million for 20162018 to S/.71.8108.3 million for 2017,2019, primarily due to the increasedecrease in the price of international oil prices.from US$69.29 in 2018 to US$63.11 in 2019, and the price of LPG from US$52.98 in 2018 to US$41.06 in 2019. Our Energyenergy gross margin was 16.4%19.6% for 20172019, compared to 11.0%21.5% for 2016; and2018; |
| | • | | Operation and Maintenance of Infrastructure Assets: a 8.8%2.5%, or S/.4.00.9 million, increase in gross profit, from S/.45.336.6 million for 20162018 to S/.49.3 million37.5 for 2017,2019, due to new contracts awarded during 2016 that initiated works.efficiencies implemented in Line One of the Lima Metro. Our Operationoperation and Maintenancemaintenance of Infrastructure Assetsinfrastructure assets gross margin was 13.0%12.2% for 20172019, compared to 17.2%8.1% for 2016, arising largely2018; and |
| • | | Water Treatment: a 16.7%, or S/0.1 million, decrease in gross profit for 2019, from certain high-costs delays in financing working capital.a S/0.6 million gross profit for 2018 to a S/0.5 gross profit for 2019, due to the replacement of minor equipment for the operation of our water treatment plant. Our water treatment gross margin was 13.9% for 2019, compared to 18.2% for 2018. |
Operating Profit.The table below sets forth the breakdown of our Infrastructure operating profit by principal lines of business.
| | | | Year ended December 31, | | | | | | Year ended December 31, | | | | |
| | | 2016 | | | 2017 | | | Variation | | | 2018 | | | 2019 | | | Variation | |
| | | (in millions of S/.) | | | % | | | (in millions of S/) | | | % | |
Toll Roads | | | 65.7 | | | | 80.1 | | | | 21.9 | | | | 59.4 | | | | 30.7 | | | | (48.3 | )% |
Mass Transit | | | 29.5 | | | | 33.4 | | | | 13.2 | | | | 110.6 | | | | 98.8 | | | | (10.7 | )% |
Water Treatment | | | 4.9 | | | | 0.1 | | | | (98.0 | ) | |
Energy | | | 25.4 | | | | 61.1 | | | | 140.6 | | | | 100.7 | | | | 84.7 | | | | (15.9 | )% |
Operation and Maintenance of Infrastructure Assets | | | 20.6 | | | | 27.7 | | | | 34.5 | | | | 12.1 | | | | (11.2 | ) | | | (192.6 | )% |
Water Treatment | | | | 0.3 | | | | 0.1 | | | | (66.7 | )% |
| | | | | | | | | | | | | | | | | |
Total | | | 146.1 | | | | 202.5 | | | | 38.6 | | | | 283.1 | | | | 203.1 | | | | (28.2 | )% |
| | | | | | | | | | |
Our Infrastructure operating profit increased 38.6%decreased 28.2%, or S/.56.479.9 million, from S/.146.1283.0 million for 20162018 to S/.202.5203.1 million for 2017.2019. Our Infrastructure operating margin was 14.0%12.8% for 20172019, compared to 12.4%15.0% for 2016.2018. The variation in our Infrastructure operating profit principally reflected the following:
| | • | | Toll Roads: a 21.9%48.3%, or S/.14.428.7 million, increasedecrease in operating profit, from S/.65.759.4 million for 20162018 to S/.80.130.7 million for 2017,2019, primarily due to the increaselower execution of periodic maintenance works and the impairment of our investment in gross profit given that administrative expenses remained at the same level.Vía Expresa Sur concession. Our Toll Roadstoll roads operating margin was 30.4%9.4% for 20172019, compared to 24.8%21.2% for 2016;2018; |
| | • | | Mass Transit: a 13.2%10.7%, or S/.3.9 million, increase in operating profit, from an operating profit of S/.29.5 million for 2016 to S/.33.4 million for 2017, primarily due to the increase of gross profit, partially offset by an increase in administrative expenses due to structuring fees and costs of the financing of the expansion. Our Mass Transit operating margin for 2017 was 9.1%, compared to 11.9% for 2016; |
| • | | Water Treatment: a 98.0%, or S/.4.811.8 million, decrease in operating profit, from an operating profit of S/.4.9110.6 million for 20162018 to an operating profit of S/.0.198.8 million in 2017, mainlyfor 2019, primarily due to the decrease in gross profit.profit and the increase in administrative expenses as a consequence of an increase in services provided by third parties, expenses associated with an extension of train service hours, and an administrative penalty due to a failure in the electric system of our trains in 2019. Our Water Treatmentmass transit operating margin for 20172019 was 3.1%14.8%, compared to 26.5% for 2016; and20.7% in 2018;
|
| | • | | Energy: a 140.6%15.9%, or S/.35.716.0 million, increasedecrease in operating profit, from S/.25.4100.7 million for 20162018 to S/.61.184.7 million for 2017,2019, primarily due to thean increase in gross profit given that the administrative expenses remained at the same level.as a consequence of an increase in services provided by third parties related to IT, accounting and tax consultancy. Our Energyenergy operating margin was 14.0%15.3% for 20172019, compared to 6.6%18.0% for 2016; and2018; |
| | • | | Operation and Maintenance of Infrastructure Assets: a S/.34.5%192.6%, or S/.7.123.3 million, increasedecrease in operating profit, from a S/.20.612.1 million profit for 20162018 to a S/.27.711.2 million profit in 2017,loss for 2019, primarily due to the increaseprovision in gross profit given that2019 for civil compensation in favor of the administrative expenses remained atPeruvian state under Law 30737 in connection with the same level as 2016. “construction club” investigation. See “Item 5.A.—Recent Developments (2017-2020)—Emergency Decree and Subsequent Legislation” and “Item 8A. Financial Information—Consolidated Financial Statements and Other Information—Legal and Administrative Proceedings”.Our Operation and Maintenance of Infrastructure Assets operating margin was 7.3%(3.6%) for 20172019, compared to 7.8%2.7% for 2016.2018; and |
| • | | Water Treatment: a 66.7%, or S/0.2 million, decrease in operating profit, from an operating profit of S/0.3 in 2018 to an operating profit of S/0.1 in 2019, mainly due to the decrease in gross profit and the increase of administrative expenses in 2019, as a consequence of extraordinary expenses for studies made for a potential expansion of the water treatment plant. Our water treatment operating margin for 2019 was 2.8%, compared to 9.1% for 2018. |
Real Estate
The table below sets forth selected financial information related to our Real Estate segment.
| | | | Year ended December 31, | | | | | | Year ended December 31, | | | | |
| | | 2016 | | | 2017 | | | Variation | | | 2018 | | | 2019 | | | Variation | |
| | | (in millions of S/.) | | | % | | | (in millions of S/) | | | % | |
Revenue | | | 411.5 | | | | 647.5 | | | | 57.4 | | |
Revenues | | | | 630.1 | | | | 264.4 | | | | (58.0 | )% |
Gross profit | | | 136.5 | | | | 147.4 | | | | 8.0 | | | | 288.0 | | | | 70.8 | | | | (75.4 | )% |
Operating profit | | | 108.9 | | | | 171.5 | | | | 57.5 | | | | 235.3 | | | | 68.8 | | | | (70.8 | )% |
Revenues. Our Real Estate revenues increased 57.4%decreased 58.0%, or S/.236.0365.7 million, from S/.411.5630.1 million for 20162018 to S/.647.5264.4 million for 2017.2019. The increasedecrease is primarily due to the sale of Cuartel San Martín in 2017 for S/.162.3 million, compared to the sale2018 of land of our subsidiary Almonte, which resulted in Almonte forreduced our sales from S/.97.0311 million in 2016, as well as2018 to S/35 million in 2019. On the other hand, there were more units delivered in 2017 (1,4182019 (1,450 units in 2017 and 9382019, compared to 1,278 units in 2016)2018).
Gross Profit. Our Real Estate gross profit increased 8.0%decreased 75.4%, or S/.10.9217.2 million, from S/.136.5288.0 million for 20162018 to S/.147.470.8 million for 2017,2019, mainly as a result of the sale of Cuartel San Martín and units delivered during 2017 with higher margins.land by Almonte in 2018. Our Real Estate gross margin was 22.8%26.8% for 20172019, compared to 33.2%45.7% for 2016, this is due to the fact that the sale of Almonte had larger margins than the sale of Cuartel San Martín.2018.
Operating Profit. Our Real Estate operating profit increased 57.7%decreased 70.8%, or S/.62.6166.5 million, from S/.108.9235.3 million for 20162018 to S/.171.5 million68.8 for 2017,2019, primarily as a result of the increase in our gross profit anddue to the sale of an investment, PRINSUR.land by Almonte in 2018.
Financial (Expense) Income, Net
Our net financial expense decreased 14.5%, or S/.42.830.4 million, from net financial expenses of S/.179.8209.2 million in 20162018 to net financial expenses of S/.137.0 million178.8 in 2017.2019. Excluding foreign exchange differences, our net financial expense decreased 14.6%21.3%, or S/.24.539.6 million, from net financial expensesexpense of S/.167.1185.5 million for 20162018 to net financial expensesexpense of S/.142.6145.9 million for 2017 due to a reduction of debt and2019, mainly due to the fact that no additional discounts in long term accounts receivablesrepayment of the debt associated to GSP beyond those registered in 2016 were registered in 2017.project and the working capital debt of the expansion works of Line One of the Lima Metro. Our net exchange difference increased S/.18.19.1 million, from a loss of S/.12.523.7 million for 20162018 to a profitloss of S/.5.6 million32.8 for 2017.2019. This increase in losses is due to the appreciation of the sol againstand the U.S. dollar from 2016 to 2017.composition of assets and liabilities in dollars.
Share of Profit and Loss in Associates
Our share of profit and loss in associates increaseddecreased S/.590.6215.1 million, from a loss of S/.590.13.7 million in 20162018 to a profitloss of S/.0.5218.8 million in 2017. In 2016 we registered2019, primarily due to the impairment of our investment in GSP as a consequence of the cancellation of the concession on January 24, 2017. There were no additional impairments in 2017. For more information, see “Item 5.A. Operating and Financial Review and Prospects—Operating Results—Recent Developments.”GSP.
Income Tax
Our income tax increased S/.198.5192.4 million, from a negative income tax of S/.152.2 million in 2016 to an income tax of S/.46.3111.0 million for 2017.2018 to S/303.4 million for 2019. This increase in income tax was primarily due to an increasea write-off of the deferred income tax asset associated with our investment in profit before tax.GSP. Our effective tax rates for 20172018 and 20162019 were 102.6%89.5% and 20.5%56.7%, respectively. See note 29 to our audited annual consolidated financial statements included in this annual report.
Net Profit
Our net profit increased 146.3%, ordecreased S/.660.8896.3 million, from a S/.451.657.5 million profit in 2018 to a S/838.8 million loss for 2016 to a S/.209.2 million profit for 2017.2019. Net profit attributable to controlling interests decreased, 129.2%, while net profit attributable tonon-controlling interests increased 4.1%.decreased S/ 94.5 million. Net profit attributable tonon-controlling controlling interests increaseddecreased primarily due to increases arising fromthe impairment of our Real Estate segment. See “—General—Accounting for Subsidiaries, Joint Operations, Joint Venturesinvestment in GSP and Associated Companies.”the discount applied to GSP’s account receivable in respect of the termination of the GSP gas pipeline concession and an additional provision made in respect of the class action civil lawsuit against the company.
B. Liquidity and Capital Resources
| B. | Liquidity and Capital Resources |
Our principal sources of liquidity have historically been cash flows from operating activities and, to a lesser extent, equity capitalization and indebtedness. Our principal uses of cash (other than in connection with our operating activities) have historically been:been capital expenditures in all our business segments, including acquisitions and investments in our infrastructure concessions;concessions, servicing of our debt;debt and other obligations, and payment of dividends.
We face significant liquidity constraints as a result of the COVID-19 pandemic. Infections have caused halts and delays in our engineering and construction projects, which have caused us to renegotiate performance targets with certain clients. These interruptions and negotiations add costs with respect to our projects, and caused us to include additional allowances for certain accounts receivable and impairments to the group’s long-term assets. We cannot assure you that we will be able to transfer any of these additional costs to our clients. Moreover, since mid-March of 2020, substantially all of our engineering and construction and real estate projects were mandatorily shut down. Although since July 2020, these projects have resumed operations with COVID-19 protocols in place, we cannot assure you that work will not be halted again or that these projects will be completed on time or at all. Our infrastructure operations, which have for the most part been declared essential businesses, have continued; however, certain of our infrastructure businesses have been adversely affected by the sharp decline in traffic volumes and oil and gas prices.
At December 31, 2020, our cash and cash equivalents totaled S/900.1 million (US$248.3 million), and at March 31, 2021, our cash and cash equivalents totaled approximately S/799.1 million (US$212.6 million), of which S/146.1 (US$38.8 million) constitutes reserved funds, which funds are held in trusts for purposes of the group’s engineering and construction, real estate and infrastructure projects and certain of the group’s outstanding bonds. For more information, see note 9 to our audited annual consolidated financial statements included in this annual report.
We are evaluating several measures to reduce expenses and preserve cash in response to the ongoing COVID-19 pandemic, including the following: (i) developing cash plan, project-by-project, to ensure that the company will continue to meet its critical obligations during that period, which plan is monitored and updated periodically; (ii) preparing a cash plan for the remainder of the 2021 fiscal year, to identify in advance key liquidity issues that may arise; (iii) identifying and renegotiating certain of the company’s obligations with respect to its suppliers, banks and other third parties; (iv) identifying and reducing non-essential general expenses across the group; (v) reducing headcount, and temporarily reducing salaries of senior management, across the company’s three segments; and (vi) reducing capital expenditures across the company’s subsidiaries.
As part of our strategy, we are exploring additional financing alternatives and evaluating potential asset sales. However, we cannot assure you that we will be able to obtain financing or sell assets on favorable terms or at all. If we are not able to postpone our payments to banks, to obtain additional financing, or to sell additional assets, the company’s financial condition could be materially adversely affected.
As a result of the termination of the GSP gas pipeline concession in January 2017, we have renegotiated three debt instruments as follows: (i) we amended the terms of our syndicated loan related to our equity investment in GSP; (ii) we repaid our proportional guarantee of the GSP bridge loan and entered a new term loan; and (iii) we amended the terms of our proportional repayment obligations under the GSP performance guarantee.
In order to strengthen our liquidity and financial flexibility, particularly in the event of potential delays in receiving the government payment contemplated under the GSP gas pipeline concession contract, and make payments on our debt related to the GSP project, our board has approved the sale ofnon-strategic assetsassets. These instruments were subsequently repaid in the amount of up to US$350 million (S/.1,176 million)full in proceeds. For more information, see “Item 5.A. Operating2018 and Financial Review and Prospects—Operating Results—Recent Developments.”2019.
On November 6, 2018, our company’s general meeting of shareholders and board of directors approved an offering and sale of our company’s common shares in a private placement. Accordingly, in December 2018, our company issued and sold a total of 69,380,402 common shares to certain of our company’s existing shareholders that exercised preemptive rights in accordance with Peruvian law.law and a private placement. Additionally, on April 2, 2019, our company issued and sold 142,483,633 common shares pursuant to the private placement, of which: (i) 55,291,877 shares were paid in full and (ii) 87,191,786 shares were paid 50% at the time, with 50% to be paid bysubsequently on July 1, 2019. In total, our company issued and sold 211,864,065 common shares, with the proceeds amounting to US$130 million to use to reduce debt, to pay our vendors and for working capital of one of our company’s subsidiaries.
We believe that our sources of cash will be sufficient to cover our working capital needs in the ordinary course of business. We believe that our cash from operations and our other sources of cash are sufficient to satisfy our current capital expenditures and debt service obligations through the next twelve months.
We are currently in default under one of our debt instruments. In addition, in the past we were in default under certain of our debt instruments and procured waivers from our creditors under such instruments. For more information, see “Item 13. Defaults, Divided Arrearages and Delinquencies.”
We hadhave outstanding credit lines with various financial institutions for a total amount of US$1,427.3 427.5 million as of December 31, 2017 and US$661.6 million as of December 31, 2018.2020 to secure performance under our contractual agreements. However, our banks have currently restricted us from taking out further lines of credit to finance new operations.operations, due to the financial circumstances of the company and overall limitations on credit availability in Peru.
On November 2, 2020, the general shareholders’ meeting of the company approved a financial plan that included (i) the issuance by the company of convertible bonds in an amount up to US$90 million and (ii) the issuance of corporate bonds in an amount up to US$350 million. On January 13, 2021, the board of directors of the company approved the terms and conditions for the issuance of the convertible bonds in an amount up to US$90 million, to be placed by private offering, including preemptive subscription rights for existing investors. The convertible bonds will not be registered under the Securities Act or under the securities laws of any state or jurisdiction outside of Peru. The convertible bonds are expected to have the following characteristics: (i) a 1.50% upfront structuring fee, (ii) an 8.0% fixed annual interest rate, (iii) prepayment fees starting at 5.0% at any time between the issuance of the bonds and the sixth month, with an increase of 100% each 6 months, (iv) a conversion price of US$0.33 per share of the company, or 20% of the discount of the 30-day VWAP, as adjusted from time-to-time, and (v) a conversion right buyout fee, which amounts to 4.0% in addition to the prepayment fee. The first and second preemptive subscription rounds ended on February 23 and February 26, 2021, respectively, and US$32.7 million of the convertible bonds were subscribed. Bonds that were not subscribed during the preemptive subscription rounds may be placed to institutional investors through a private placement offering. As of the date hereof, none of the convertible bonds have been issued, and we cannot guarantee that they will be issued on a timely basis or at all. If the convertible bonds are issued, and converted by bondholders, existing investors in our common shares may be diluted.
The settlement terms of the class action civil lawsuit was filed against our company and certain of our former directors and former and current executive officers stipulate that the remaining $14,650,000, plus interest of 5% per annum running from September 17, 2020, must be paid by the company by June 30, 2021. We have initiated discussions with the plaintiffs regarding a deferral of this payment, but we cannot assure you that an agreement will be reached. In addition, while the terms of a final settlement and cooperation agreement remain under discussion with Peruvian authorities and are confidential, we currently expect that a final agreement would require the company to pay a significant penalty over a period of years to be agreed. See “—A. Operating Results—RecentKey Developments—Emergency DecreeSecurities Class Action.” and Subsequent Legislation.”
At December 31, 2018, our cash and cash equivalents totaled S/.801.1 million (US$237.1 million), of which S/.76.3 million (US$22.6 million) was held by our foreign subsidiaries. We intend to distribute any excess cash“Item 3.D. Key Information—Risk Factors—Risks Related to our company.Company— We aremay not currentlyhave sufficient cash or funding to make extraordinary payments.”
The company may face additional liquidity constraints if the company is required to accruepay other civil or paycriminal penalties, or any material taxes associated withadditional settlement amounts, arising from current or future investigations or civil lawsuits facing the repatriationcompany, depending on the timing of these funds. In addition, our foreign subsidiaries have no contractual restrictions, and we are not aware of any material legal restrictions, on their ability to transfer funds to us in the form of cash dividends, loans or advances.those required payments.
Cash Flows
The table below sets forth certain components of our cash flows for 2016, 20172018, 2019 and 2018.2020.
| | | | | | | | | | | | |
| | | Year ended December 31, | |
| | | 2018 | | | 2019 | | | 2020 | |
| | | (in millions of S/) | |
Net cash provided by (used in) operating activities | | | 279.3 | | | | 607.8 | | | | 226.0 | |
Net cash provided by (used in) investing activities | | | 137.9 | | | | (150.6 | ) | | | (64.7 | ) |
Net cash provided by (used in) financing activities | | | (300 | ) | | | (287.2 | ) | | | (225.6 | ) |
Net increase (net decrease) in cash | | | 117.1 | | | | 169.9 | | | | (64.3 | ) |
| | | | | | | | | | | | |
| | | Year ended December 31, | |
| | | 2016 | | | 2017 | | | 2018 | |
| | | (in millions of S/.) | |
Net cash provided by (used in) operating activities | | | 333.7 | | | | 491.2 | | | | 279.3 | |
Net cash provided by (used in) investing activities | | | (373.7 | ) | | | 348.9 | | | | 137.9 | |
Net cash provided by (used in) financing activities | | | (85.8 | ) | | | (786.1 | ) | | | (300 | ) |
Net increase (net decrease) in cash | | | 45.8 | | | | 54.0 | | | | 117.1 | |
Cash Flow from Operating Activities
Net cash flow used in in operating activities in 20182020 was lower than in 2017. For 2018, this reflects2019, principally as a result of the reductioncompletion of accounts payable according to terms with our suppliers, and a decreasethe expansion work in accounts receivable due to a reductionLine 1 of the Lima Metro in accounts advanced to suppliers, taxes paid in advance and other accounts receivable.
Net cash flow used in operating activities in 2017 was greater than in 2016. For 2017, this reflects an increase in account payables during the year, due to the renegotiation of terms with our suppliers to pay in longer periods.2019.
Cash Flow from Investing Activities
Net cash flow provided by investing activities in 20182020 was lower than in 2017.2019. In 2018, we sold more property, plant and equipment than we did in 2017.
Net cash flow provided by investing activities in 2017 was higher than in 2016. In 2017,2020, there was more cash flow from the sale of assets than cash flow used in investments.were no divestments.
Cash Flow from Financing Activities
Net cash flow provided by financing activities in 20182020 was lower than in 2017. This is primarily duesimilar to lessthat of 2019. In 2020, we continued with the reduction of debt, during the course of the year compared to 2017, and the capital increase approved at the end of the year.
Net cash flow provided by financing activities in 2017 was higher than in 2016. This is primarilymainly due to the reductioncancelation of GSPworking capital debt used for the expansion work of Line 1 of the Lima Metro and the cancelation of the debt associated with the sale of assets.GSP project.
Indebtedness
As of December 31, 2018,2020, we had a total outstanding indebtedness of S/.2,139.71,780.9 million (US$633.2491.4 million) as set forth in the table below.
| Segment | | Type | | Debt Amount | | | Total in
millions
of S/. | | | Total in
millions
of US$ | | | Weighted
average
interest
rate | | | Range of Maturity
Dates | | | Type | | Debt Amount | | | Total in
millions
of S/ | | Total in
millions
of US$ | | Weighted
average
interest rate | | | Range of Maturity
Dates | |
| | (in
millions
of
US$) | | | (in
millions
of S/.) | | | (in
millions
of
CLP)(1) | | | (in
millions
of
COP) | | Minimum | | | Maximum | | | (in millions
of US$) | | (in millions
of S/) | | (in millions
of CLP)(1) | | (in millions
of COP) | | Minimum | | Maximum | |
E&C | | Leasing | | 2.4 | | | | — | | | | 1,901.4 | | | | 1,364.1 | | | | 18.8 | | | | 5.6 | | | | 3.9 | % | | 02/01/2019 | | | | 02/01/2023 | | | Leasing | | | 1.3 | | | | — | | | | 3,899.9 | | | | — | | | | 24.7 | | | | 6.8 | | | | 6.7 | % | | | 1/02/2021 | | | | 25/05/2022 | |
| | Promissory Note | | 18.6 | | | | 154.9 | | | | — | | | | 5,038.9 | | | | 222.9 | | | | 66.0 | | | | 7.1 | % | | 01/01/2019 | | | | 31/12/2020 | | | Promissory Note | | | 32.5 | | | | 107.1 | | | | 4,566.8 | | | | 2,264.6 | | | | 250.5 | | | | 69.1 | | | | 8.5 | % | | | 15/02/2021 | | | | 26/12/2027 | |
Infrastructure | | Leasing | | 0.7 | | | | 5.1 | | | | — | | | | — | | | | 7.6 | | | | 2.2 | | | | 6.1 | % | | 20/01/2019 | | | | 01/11/2021 | | | Leasing | | | 0.0 | | | | — | | | | — | | | | — | | | | 0.2 | | | | 0.0 | | | | 3.5 | % | | | 1/09/2021 | | | | 1/03/2022 | |
| | Long term loan | | 94.0 | | | | 937.0 | | | | — | | | | — | | | | 1,254.7 | | | | 371.3 | | | | 5.7 | % | | 25/07/2019 | | | | 25/11/2039 | | | Long term loan | | | — | | | | 905.3 | | | | — | | | | — | | | | 905.3 | | | | 249.8 | | | | 7.5 | % | | | 25/01/2027 | | | | 25/11/2039 | |
| | Promissory Note | | 4.1 | | | | — | | | | — | | | | — | | | | 13.9 | | | | 4.1 | | | | 15.8 | % | | 04/01/2019 | | | | 22/02/2019 | | | Promissory Note | | | 35.1 | | | | — | | | | — | | | | — | | | | 127.3 | | | | 35.1 | | | | 6.6 | % | | | 26/02/2021 | | | | 18/12/2027 | |
Real Estate | | Leasing | | | — | | | | 12.1 | | | | — | | | | — | | | | 12.1 | | | | 3.6 | | | | 7.8 | % | | 02/01/2019 | | | | 01/07/2022 | | | Leasing | | | 0.5 | | | | 7.3 | | | | — | | | | — | | | | 8.9 | | | | 2.5 | | | | 8.0 | % | | | 1/03/2022 | | | | 2/01/2023 | |
| | Promissory Note | | | — | | | | 131.7 | | | | — | | | | — | | | | 131.7 | | | | 39.0 | | | | 8.0 | % | | 18/01/2019 | | | | 26/01/2020 | | | Promissory Note | | | 1.0 | | | | 87.5 | | | | — | | | | — | | | | 91.2 | | | | 25.2 | | | | 10.1 | % | | | 4/01/2021 | | | | 31/05/2021 | |
Technical Services | | | Leasing | | | — | | | | — | | | | 7,534.6 | | | | — | | | | 38.4 | | | | 10.6 | | | | 0.6 | % | | | 30/09/2021 | | | | 30/06/2027 | |
| | | Promissory Note | | | — | | | | — | | | | 15,494.5 | | | | — | | | | 79.0 | | | | 21.8 | | | | 1.7 | % | | | 26/02/2021 | | | | 31/12/2026 | |
Corporate | | Long term loan(2) | | 141.5 | | | | — | | | | — | | | | — | | | | 478.0 | | | | 141.5 | | | | 8.4 | % | | 11/06/2019 | | | | 10/12/2020 | | | Long term loan | | | 67.4 | | | | — | | | | 2,214.4 | | | | — | | | | 255.4 | | | | 70.5 | | | | 10.0 | % | | | 24/07/2021 | | | | 14/01/2028 | |
| | Total | | | 261.3 | | | | 1,240.8 | | | | 1,901.4 | | | | 6,403.0 | | | | 2,139.7 | | | | 633.2 | | | | | | | | |
Total | | Total | | | 137.8 | | | | 1,107.2 | | | | 33,710.2 | | | | 2,264.6 | | | | 1,780.9 | | | | 491.4 | | | | | | | |
| (1) | Includes debt held by Vial y Vives—DSD that is denominated in Chilean pesos. |
(2) | Does not include our payable to Chubb Insurance Company related to our proportional repayment obligation under the GSP performance guarantee, which was repaid in full on December 6, 2018.
|
As of March 31, 2019,2021, S/.149.061.0 million (US$44.116.8 million) of our total indebtedness indicated in the table above has matured or been prepaid, of which S/.39.052.9 million (US$11.514.6 million) was repaid and S/.110.08.1 million (US$32.52.2 million) was renewed by extending the maturities. The weighted average interest rate of this renewed indebtedness and additional indebtedness was 7.7%is 6.3%, and the maturity dates range from AprilJanuary 4, 20192021 to June 26, 2019.November 25, 2039.
Set forth below is a description of our material outstanding indebtedness as of December 31, 2018.2020.
Leasing. As of December 31, 2018,2020, we were party to numerous leasing agreements with several financial institutions which in the aggregate amounted to approximately S/.42.9772.2 (US$12.6419.9 million).We entered into such agreements primarily for the purpose of leasing the equipment and other assets necessary to run our operations. Upon maturity of each leasing agreement, we have the option to purchase or return the equipment or assets to the lessor. The amounts owed under these leasing agreements are generally repaid in monthly installments, subject to a minimum guaranteed payment corresponding to the minimum amount for which the equipment or assets could be sold to a third-party.
Citibank, N.A. Secured Loan. Our subsidiary GMP hasUNNA Energía had a secured loan with Citibank, N.A. under a loan agreement dated September 19, 2008 and amended on August 27, 2012, with an outstanding principal amount of S/.20.708.7 million (US$6.132.6 million) as of December 31, 2018 and as of the date of this annual report. This2019. The loan accruesaccrued interest at an annual rate of three month LIBOR plus: (i) 1.70% if, at the installment payment date, the exchange rate between the sol and U.S. dollar remains between S/.2.602.60 to S/.2.752.75 per US$1.00 or (ii) 1.95%, if otherwise. The loan maturesmatured in August 2020.2020 and the maturity date was extended until February 26, 2021 and repaid on that date. The proceeds of the loan were used by our subsidiary GMPUNNA Energía to finance the construction, equipment and operation of the Gas Pariñas plant in Talara. The agreement iswas secured by certain land, equipment and accounts receivable of GMP.UNNA Energía. The agreement containscontained certain customary covenants, including restrictions on the ability of GMPUNNA Energía to pay dividends if it is in default under the loan and the obligation by GMPUNNA Energía to maintain the following financial covenants during the term of the agreement: (a) Leverage Ratio (as defined therein) shall not be greater than 1.50; (b) DebtService Coverage Ratio (as defined therein) shall not be less than 1.20; (c) Liquidity Ratio (as defined therein) shall not be less than 1.10; and (d) Debt Coverage Ratio (as defined therein) shall not be greater than 2.20. As of the date of this annual report, the loan was fully repaid.
Norvial Corporate Bonds.In July 2015, Norvial established its first corporate bond program on the Lima Stock Exchange, for a total amount of S/.365365 million (US$106.9 million). The first tranche under this program was issued for an amount of S/.8080 million, due 2020 with an annual interest rate of 6.75%. The second tranche was issued for an amount of S/.285285 million, due 2027 with an annual interest rate of 8.375%, structured in three disbursements. In July 2015 we received the first disbursement for S/.105105 million, in January 2016 we received the second disbursement for S/.100100 million and in July 2016 we received the third disbursement of S/.8080 million. These bonds are secured by: (i) certain cash flows; (ii) a mortgage on the Norvial concession; (iii) a lien over Norvial shares; (iv) the assignment of Norvial’s rights over a performance bond provided by GMP;Cumbra and JJC Contratistas Generales S.A.; and (v) any additional guarantees granted in favor of other secured creditors. The proceeds of these bonds were used to pay S/.8585 million of debt outstanding under a short-term loan agreement with Banco de Crédito del Perú (BCP) for a total S/.150150 million, and the rest was used to finance the construction of the second stage of Ancon – Huacho Pativilca highway and the value added tax linked to the implementation of the project expenses. As of December 31, 2018,2020, Norvial had S/.325.4280.8 million (US$96.377.5 million) outstanding under these bonds.
Linea 1Senior Secured Notes.On February 2015, GyM FerrovíasLínea 1 issued a total of S/.629629 million (US$184.3 million) Series A Senior SecuredVAC-Indexed Notes due 2039, with an annual interest rate of 4.75% plus adjustments for inflation. The bonds are secured by (i) a mortgage on the Lima Metro concession, (ii) a lien on GyM FerrovíasLínea 1 shares, (iii) certain collection rights, (iv) certain cash flows and (v) liens on certain accounts.The proceeds from the issuance were used to repay a short term loan provide by Banco de Crédito delPerú-BCP for S/.400400 million, funding of the reserve accounts, payment of the issuance expenses, and for the partial repayment of a subordinated loan provided by certain shareholders of GyM FerrovíasLínea 1 to GyM Ferrovías.Línea 1. According to the indenture, in order to make any payment of a subordinated loan or distribute any dividends, our Debt Service Coverage Ratio (as defined therein) should be at least 1.2x. Under the indenture GyM FerrovíasLínea 1 has to fund the debt service reserve account on a quarterly basis with the equivalent of the amounts due in the next two succeeding interest payment dates. Moreover, the operation and maintenance reserve account must be funded annually with an amount equal to twenty-five percent (25%) of operation and maintenance costs of the corresponding current annual budget. As of December 31, 2018, GyM Ferrovías2020, Línea 1 had S/.52.8624 million (US$15.7172 million) outstanding under these notes.
Financing of the Expansion Project of the Lima Metro Concession. On August 23, 2017, GyM Ferrovias entered into a US$396 million financing structure with Mizuho Bank, Ltd and Sumitomo Mitsui Banking Corporation. The particular structure for the expansion project of the Lima Metro involves the securitization of irrevocable and unconditional payment obligations of the Government of Peru (CPAOs), which have been sold by GyM Ferrovias to a borrower under a long-term loan facility. The expansion project includes the improvement of civil works and the purchase of additional rolling stock, including trains and cars that will be designed, built, operated and maintained by GyM Ferrovías, as concessionaire under the Lima Metro concession. The financing is structured as a long-term loan facility and a working capital facility. As of December 31, 2018, US$62.0 million was outstanding under this financing structure.
BCP Loan.In December 2015, our subsidiary GMP S.A.UNNA Energía and Oiltanking Peru S.A.C. subscribed in equal parts to a medium term loan credit agreement for up to US$100 million with Banco de Crédito del Peru, comprised of (i) a medium term tranche for up to US$70 million (for additional investments) with an annual interest rate of 6.04% and a term of five years, and (ii) a medium term tranche for up to US$30 million (for committed investments) with an annual interest rate of 6.32% and a term of eight years. The tranches of the loan mature in 2024 and 2027, respectively. The proceeds of this loan are to finance Terminales del Peru’sPerú’s obligations in the operation contracts that it maintains with PetroperuPetroperú in regards to the Central Terminal (corresponding to the Callao Port), and North Terminals (corresponding to the Etén, Salaverry, Chimbote and Supe Ports).On November 15, 2019, UNNA Energía and Oiltanking Perú S.A.C. entered into an additional medium term loan for up to US$46 million with Banco de Crédito del Perú. As of December 31, 2018, GMP S.A.2020, UNNA Energía had US$24.633.44 million (S/.83.0121.19 million) outstanding under this loan.
Syndicated Loan. In December 2015 we entered into a medium term loan credit agreement for up to US$200 million (S/.672 million) with Credit Suisse AG, Cayman Islands Branch, and Credit Suisse Securities (USA) LLC. The term of the loan is five years, with quarterly installments starting on the 18th month. The loan accrued interest at a rate of three months Libor plus 3.9% per year. The proceeds were used to finance our equity participation in GSP, which was the concessionaire of the southern gas pipeline project. As of December 31, 2018, the principal amount outstanding under this loan was US$37.5 million (S/.127 million) and, as of the date of this annual report, the principal amount outstanding under this loan is US$31.45 million (S/.103.45 million).
As a result of the termination of the GSP gas pipeline concession, in June 2017, we entered into an amendment to the credit agreement. According to the terms of the amendment, our syndicated loan matures in December 2020, with required prepayments to be made with the proceeds of asset sales of 40% in the first year and an additional 30% in the second year of the amendment. The syndicated loan continues to accrue interest at LIBOR plus 4.90% per year. In addition, we are prohibited from paying dividends until the loan is repaid in full. Also, we have provided additional security interests, so that the amended syndicated loan will be secured by: (i) a first lien on our shares of GyM and Concar; (ii) a first lien on our shares of Almonte; (iii) a first lien on certain real estate properties in Surquillo; (iv) liens on certain related accounts; (v) a second priority lien on our shares of CAM and CAM Servicios; and (vi) a first lien on cash flows from the sale of certain assets.
The amendment to the credit agreement contains certain covenants, including the obligation by us to maintain the following financial ratios during the term of the agreement: (i) the Consolidated EBITDA to Consolidated Interest Expense Ratio (as defined therein) shall not be less than 3.5:1.0 commencing on April 1, 2018 and thereafter; (ii) the Consolidated Leverage Ratio (as defined therein) shall not be greater than (a) 3.5:1.0 at any time during the period commencing on December 31, 2016 and ending on March 31, 2017; (b) 3.5:1.0 at any time during the period commencing on April 1, 2017 and ending on June 30, 2017; (c) 3.0:1.0 at any time during the period commencing on July 1, 2017 and ending on September 30, 2017; and (d) 2.5:1.0 at any time thereafter; and (iii) the Debt Service Coverage Ratio (as defined therein) as of the last day of any fiscal quarter of the borrower, falling on or after the first anniversary of the closing date, shall not be less than 1.5:1.0 commencing on April 1, 2018 and thereafter. Furthermore, the agreement contains a covenant restricting the CAM Chile Leverage Ratio (as defined therein) from exceeding 2.5:1.0 at any time. The agreement also imposes limitations, in an event of default, on ours and our subsidiaries’ ability to distribute dividends, including, among others, that we may only distribute cash dividends to our stockholders out of 40% of our net income available for distribution in accordance with IFRS, as reflected in our audited consolidated financial statements for the fiscal year most recently ended.
GSP Bridge Loan and New Term Loan.With the termination of the GSP gas pipeline concession, our proportional guarantee under the GSP bridge loan became due. As of December 31, 2016, there was US$129 million (S/.433.4 million) of principal amount outstanding under our corporate guarantee. The principal amount outstanding under the GSP bridge loan has been entirely paid. On June 27, 2017 we entered into a new US$78.7 million (S/.264.8 million) term loan with Natixis, BBVA, SMBC and MUFJ, the proceeds of which were used to prepay GSP bridge loan. The new term loan matures on 2020, with required prepayments to be made with the proceeds of asset sales of 40% in the first year and an additional 30% in the second year of the amendment. The agreement with respect to such term loan contains a covenant restricting the Consolidated Leverage Ratio (as defined therein) from exceeding 3.5:1.0 at any time and the CAM Chile Leverage Ratio (as defined therein) from exceeding 2.5:1.0 at any time. The term loan accrues interest at LIBOR plus 4.50% per year, which will increase to 5.00% during the second year and to 5.50% during the third year. In addition, we will be prohibited from paying dividends until the loan is repaid in full. Also, the term loan will be secured by: (i) a first lien on our rights to receive the termination payment derived from the GSP termination (the “VCN”), (ii) a second priority lien on our shares of GyM and Concar; (iii) a second priority lien on our shares of Almonte; (iv) a second priority lien on certain real estate properties in Surquillo; (v) a second priority lien on our shares of CAM; (vi) a second priority lien on our shares of CAM Servicios; and (vii) a first lien on cash flows from the sale of certain assets. The principal amount outstanding under the new term loan was US$63.47 million (S/.214.46 million) as of December 31, 2018, and as of the date of this annual report, there is US$47.25 million (S/.156.16) outstanding on the term loan.
GSP Performance Guarantee.Upon the termination of the GSP gas pipeline concession, our proportional repayment obligations under the GSP performance guarantee from Chubb Insurance Company in the amount of US$52.5 milllion (S/.177.4 million) became due. On December 6, 2018, we paid the final installment with respect to our our obligations to Chubb Insurance Company.these loans.
Financial Stability Framework Agreement.On July 31, 2017, we, and certain of our subsidiaries, GyM,Cumbra, Construyendo País S.A., Vial y Vives — DSD and Concesionaria Vía Expresa Sur S.A., entered into a Financial Stability Framework Agreement (together with certain complementary contracts, the “Framework Agreement”) with the following financial entities: Scotiabank Perú S.A., Banco Internacional del Perú S.A.A., BBVA Banco Continental, Banco de Crédito del Perú, Citibank del Peru SA and Citibank N.A. The Framework Agreement aims to: (i) grant GyM a syndicated revolving line of credit for working capital for up to US$1.6 million and S/.143.9143.9 million, which may be increased by an additional US$14 million subject to certain conditions; (ii) grant GyM a line of credit of up to US$51.6 million and S/.33.633.6 million; (iii) grant us, GyM, Construyendo País S.A., Vial y Vives – DSD and Concesionaria Vía Expresa Sur S.A. anon-revolving line of credit to finance reimbursement obligations under performance bonds; (iv) grant a syndicated line of credit in favor of us and GyM for the issuance of performance bonds up to an amount of US$100 million (which may be increased by an additional US$50 million subject to compliance with certain conditions); and (v) to commit to maintain existing standby letters of credit issued at the request of GyMCumbra and us, as well as the request of Construyendo País S.A., Vial y Vives – DSD and Concesionaria Vía Expresa Sur S.A. In April 2018, we repaid US$72.7 million of the facility with the proceeds of the sale of Stracon GyM and in July of 2018 we repaid an additional of US$ 15.4 million. As of December 31, 2018, there was US$59.44 million outstanding under this agreement.
As of December 31, 2018 and as of the date hereof, our construction subsidiary GyMof this annual report, US$30.2 million (S/110.0 million) is under a continuing defaultoutstanding under the Financial Stability Framework AgreementAgreement. The loan matured in July 2020, which maturity was extended, most recently, until April 30, 2021. We are currently negotiating an additional extension.
CS Peru Infrastructure Loan. On July 31, 2019, the company entered into a medium term loan credit agreement for US$35 million (equivalent to S/112.9 million) with CS Peru Infrastructure Holdings LLC, the proceeds of which were used as working capital for the company and its subsidiaries, GyM and Adexus. The term of the loan is three years, with quarterly installments of principal beginning on the 18th month. The loan accrues interest at the following rates per annum: (i) for the period from and including the July 31, 2019 to but excluding the date that is six months after the closing date, 9.10%; (ii) for the period from and including the date that is six months after the closing date to but excluding the date that is one year after the closing date, 9.35%; (iii) for the period from and including the date that is one year after the closing date to but excluding the date that is 30 months after the closing date, 9.60%; and (iv) for the period from and including the date that is 30 months after the closing date to the third anniversary of the loan, 10.10%. On February 28, 2020, the company and the initial lender signed an amendment, waiver and consent in respect to its failure to comply with certain ratios between Tranche A (client invoices) and Tranche B (client provisions). Noof this event of default, has been formally notified to GyMin consideration for a prepayment by the lenders,company of US$10 million, together with accrued interest and a make-whole premium. The principal amount outstanding under the new term loan is US$22.0 million (S/79.7 million) as of the date of this annual report.
Santander Loan. On December 30, 2020, Técnicas Reunidas enforced two letters of credit in the aggregate amount of US$23.7 million, which letters of credit had been issued by Santander on behalf of our subsidiary has requestedCumbra as security pursuant to a waiver fromconstruction contract. As a result, Cumbra subscribed to a short term loan with Banco Santander in the lenders,aggregate principal amount of US$23.7 million. The loan accrues interest at an annual rate of Libor + 8.0%. The term of the loan was 30 days, which is pending. If duly notified to GyM bymaturity was extended until March 30, 2021. We subsequently negotiated payment in installments, beginning in May 2021 and ending in September 2021. As of the lenders, the consequencedate of this default would be to transfer certain amounts due under Tranche A to Tranche B, for which payment is not due until July 2019. As of December 31, 2018, there was US$43.7 million (S/.147.8 million)annual report, the principal amount outstanding under Tranche A andthe note is US$15.7 million (S/.53.0 million) outstanding under Tranche B of the facility, for a total of US$59.423.7 million.
Derivative Financial Instruments
In August 2012, our subsidiary GMP entered into two interest rate swaps with Citibank, N.A. to hedge its exposure to fluctuations in LIBOR under its unsecured loan with Citibank, N.A. described above. These interest rate swaps establish a fixed annual rate of 5.05%, payable at each interest payment date under the loan.
We didThe company does not executecurrently have any derivative financial instruments from 2013 until the date hereof, other than as described above.outstanding. For additional information about our derivative financial instruments and borrowings, see notes 2.9 and 1918 to our audited annual consolidated financial statements included in this annual report.
Capital Expenditures
The table below provides our total capital expenditures incurred in 2016, 20172018, 2019 and 2018.2020.
| | | | | 2016 | | 2017 | | 2018 | | | | | 2018 | | 2019 | | | 2020 | |
| | | | (in millions
of S/.) | | (in millions
of US$) | | (in millions
of S/.) | | (in millions
of US$) | | (in millions
of S/.) | | (in millions
of US$) | | | | | (in
millions of S/) | | (in
millions of US$) | | (in
millions of S/) | | | (in
millions of US$) | | | (in
millions of S/) | | | (in
millions of US$) | |
E&C(2)(1) | | Capital expenditure | | 116.8 | | | 34.8 | | | 49.4 | | | 15.2 | | | (40.2 | ) | | (11.9 | ) | | Capital expenditure | | | (40.2 | ) | | | (11.9 | ) | | | 3.2 | | | | 1.0 | | | | 10.9 | | | | 3.0 | |
| | Divestitures | | | — | | | | — | | | (11.8 | ) | | (3.6 | ) | | (257.6 | ) | | (76.2 | ) | | Divestitures | | | (257.6 | ) | | | (76.2 | ) | | | — | | | | — | | | | — | | | | — | |
| | Total E&C | | | 116.8 | | | | 34.8 | | | | 37.6 | | | | 11.6 | | | | (297.8 | ) | | | (88.1 | ) | | Total E&C | | | (297.8 | ) | | | (88.1 | ) | | | 3.2 | | | | 1.0 | | | | 10.9 | | | | 3.0 | |
Infrastructure | | Capital expenditure | | 146.8 | | | 43.7 | | | 122.6 | | | 37.8 | | | 131.7 | | | 39.0 | | | Capital expenditure | | | 131.7 | | | | 39.0 | | | | 179.4 | | | | 54.1 | | | | 97.5 | | | | 26.9 | |
| | Divestitures | | | — | | | | — | | | | — | | | | — | | | | — | | | | — | | | Divestitures | | | — | | | | — | | | | — | | | | — | | | | — | | | | — | |
| | Total Infrastructure | | | 146.8 | | | | 43.7 | | | | 122.6 | | | | 37.8 | | | | 131.7 | | | | 39.0 | | | Total Infrastructure | | | 131.7 | | | | 39.0 | | | | 179.4 | | | | 54.1 | | | | 97.5 | | | | 26.9 | |
Real Estate(3) | | Capital expenditure | | 49.7 | | | 14.8 | | | 39.7 | | | 12.2 | | | (4.9 | ) | | (1.5 | ) | |
| | Divestitures | | | — | | | | — | | | (36.3 | ) | | (11.2 | ) | | | — | | | | — | | |
| | Total Real Estate | | | 49.7 | | | | 14.8 | | | | 3.4 | | | | 1.0 | | | | (4.9 | ) | | | (1.5 | ) | |
Corporate(2) | | Capital expenditure | | 529.5 | | | 157.6 | | | (-0.6 | ) | | (0.2 | ) | | 2.2 | | | 0.6 | | |
| | Divestitures | | (107.6 | ) | | (32.0 | ) | | (121.7 | ) | | (37.5 | ) | | (12.1 | ) | | (3.6 | ) | |
| | Total Corporate | | | 421.9 | | | | 125.6 | | | | (122.3 | ) | | | (37.7 | ) | | | (10.0 | ) | | | (3.0 | ) | |
| | TOTAL(4)(5) | | | 735.2 | | | | 218.8 | | | | 41.2 | | | | 12.7 | | | | (181.0 | ) | | | (53.6 | ) | |
| | | | | | | | | | | | | | | | | | | | | | | | | | |
| | | | | 2018 | | | 2019 | | | 2020 | |
| | | | | (in
millions of S/) | | | (in
millions of US$) | | | (in
millions of S/) | | | (in
millions of US$) | | | (in
millions of S/) | | | (in
millions of US$) | |
Real Estate(2) | | Capital expenditure | | | (4.9 | ) | | | (1.5 | ) | | | 5.7 | | | | 1.7 | | | | — | | | | — | |
| | Divestitures | | | — | | | | — | | | | — | | | | — | | | | — | | | | — | |
| | Total Real Estate | | | (4.9 | ) | | | (1.5 | ) | | | 5.7 | | | | 1.7 | | | | — | | | | — | |
Corporate | | Capital expenditure | | | 2.2 | | | | 0.6 | | | | -2.3 | | | | -0.7 | | | | 1.8 | | | | 0.5 | |
| | Divestitures | | | (12.1 | ) | | | (3.6 | ) | | | — | | | | — | | | | — | | | | — | |
| | Total Corporate | | | (10.0 | ) | | | (3.0 | ) | | | -2.3 | | | | -0.7 | | | | 1.8 | | | | 0.5 | |
| | TOTAL(3)(4) | | | (181.0 | ) | | | (53.6 | ) | | | 186.0 | | | | 56.1 | | | | 110.2 | | | | 30.4 | |
| (1) | In our consolidated financial statements, in accordance with IFRS, we record in “cash flow used in investing activities” with respect to equipment leases only the amounts paid during the period as opposed to the total amount of lease payments, which is included in the table above. |
| (2) | Includes S/.73.4 million, S/.0 million and S/.0 million of capital expenditures related to acquisitions in 2016, 2017 and 2018, respectively. |
(3) | Includes S/.13.9 million, S/.1.0 and S/.8.38.3 million in investments in 2016, 2017 and 2018 respectively, for the purchase of land by our Real Estate segment, which in accordance with IFRS are recorded in our consolidated financial statements as “inventory.”
|
(4)(3) | In our consolidated financial statements, in accordance with IFRS, we record as “cash flow used in investing activities” with respect to equipment leases only the amounts paid during the period as opposed to the total amount of lease payments which is included in the table above. |
(5)(4) | Divestitures are related to the sale ofnon-strategic assets, and minor divestitures are in capital expenditures. |
Capital expenditures for our E&C segment of approximately S/.116.840.2 million (US$34.811.9 million), S/.49.93.2 million (US$15.21.0 million) and S/.(40.2)10.9 million (US$(11.9)3.0 million), in 2016, 20172018, 2019 and 2018,2020, respectively, which amounts primarily correspond to the purchase and sale of equipment and machinery and, to a lesser extent, investments relating to mining services contracts. In 2016, capital investments in the E&C segment also included S/.51.1 million (US$15.2 million) with respect to an additional stake in Vial y Vives- DSD. In 2017, capital investments in the E&C segment only included the purchase and sale of equipment and machinery. In 2018, capital investments in the E&C segment only included the sale of equipment. In 2019, capital investments in the E&C segment included minor repositions of equipment and machinery. In 2020, capital investments in the E&C segment included minor repositions of equipment and machinery.
Capital expenditures for our Infrastructure segment of approximately S/.146.8131.7 million (US$43.739 million), S/.122.6179.4 million (US$37.854.1 million) and S/.131.797.5 million (US$3926.9 million) in 2016, 20172018, 2019 and 2018,2020, respectively, correspond to periodic maintenance and the construction of the second stage of our Norvial toll road concession and, in our Energy line of business, oil development drilling activities as well as improvements for our gas processing plant and investments in the Lima Metro. In 2016, capital expenditures mainly corresponded to the start of the campaign to drill wells in Block IV, the expansion of tanks at Terminales del Peru and the construction of the second stage of our Norvial toll road concession. In 2017,2018, capital expenditures for our Infrastructure segment continued with the construction and maintenance of second stage of Norvial toll road concession, and also investments incurred in drilling wells in Blocks IV. In 2018, capital expenditures for our infrastructure segment also included the continuation of drilling wells and, to a lesser extent, the maintenance of the Lima Metro and the second stage of our Norvial toll road concession. In 2019, capital expenditures for our Infrastructure segment included the drilling of additional wells of UNNA Energía and maintenance in respect of the second stage of the Norvial toll road concession. In 2020, capital expenditures for our Infrastructure segment included the drilling of 18 additional wells by UNNA Energía and certain investments in the Lima Metro project.
Capital expenditures for our Real Estate segment of approximately S/.49.74.9 million (US$14.81.5 million), S/.39.75.7 million (US$12.21.7 million) and S/.(4.9)0.0 million (US$(1.5)0.0 million) in 2016, 20172018, 2019 and 2018,2020, respectively, primarily correspond to the purchaseliquidation of land for real estate projects, including the Pezet and Paul Harris projects in 2016, an additional purchase for the Paul Harris project in 2017, and the liquidation of Panorama project and an additional purchase for the Paul Harris project in 2018.2018, and additional equipment and a new sales booth in the Parque de Comas Project in 2019.
In 2016, corporate segment investments were S/ 529.5 million, which mainly included S/426.4 million (US$127 million) for the acquisition of our 20% stake in GSP and S/.22.3 million (US$6.6 million) for an additional stake in Adexus. In 2017 and 2018, there were no relevant corporate segment investments, as the company initiated a divestment process ofnon-strategic assets.
Divestitures in 2016 consisted of S/.107.6 million (US$32.0 million) relating to the sale of our 1.64% stake in Transportadora de Gas del Perú S.A. (TGP). Divestitures in 2017 consisted of approximately S/.169.8 million (US$52.3 million) relating to the sale of our stake in Red Eagle of Stracon GyM, the sale of our 22.5% stake held in our associate, PRINSUR, the sale of our 89.19% interest in GMD, our IT services subsidiary, and the sale of our 51% interest in COGA to our partners, Enagas and Carmen Corporation. Divestitures in 2018 consisted of S/.269.7269.7 million (US$79.8 million) relating to the sale of our interests in Stracon, GyM, CAM Chile and CAM Servicios. There were no divestitures in 2019 or 2020.
We have budgeted S/.268.8241.0 million (US$79.666.5 million) in capital expenditures for 2019.2021. Our current plans for our E&C segment contemplate capital expenditures in 20192021 of approximately S/.11.520.0 million (US$3.4) million,5.5 million), mainly for the purchasereposition of equipment and machinery. Our current plans for our Infrastructure segment contemplate capital expenditures in 20192021 of approximately S/.230.4183.0 million (US$68.250.5 million), principally for investments in oil development drilling activities.activities for Line 1 of the Lima Metro. Our current plans for our Real Estate segment contemplate capital expenditures in 20192021 of approximately S/.59.9million36.2 million (US$17.710.0 million) for the purchase of land for real estate development projects.. Our current plans for our Corporatecorporate segment contemplatecontemplates no expenditures nor divestitures in 20192021. However, our capital expenditures during 2021 may change as a result of approximately S/.33 million (US$9.8 million).the impact of the COVID-19 pandemic.
These estimates are subject to change. We routinely evaluate acquisitions, new infrastructure concessions, land purchases and other investment or divestiture opportunities that are aligned with our strategic goals, particularly in Peru, Chile and Colombia. We cannot assure you that we will find opportunities on terms that we consider to be favorable to us, whether we will be able to take advantage of such opportunities should they arise, or the timing of and funds required by such opportunities. In addition, should we undertake any such investments, we expect to finance these opportunities with a combination of cash on hand, new borrowings and/or financial contributions from partners, depending on a variety of commercial considerations at such time. See “Part I. Forward-Looking Statements.”
C. Research and Development, Patents and Licenses, Etc.
Not applicable.
D. Trend Information
Our Main Market: Peru
The following sets forth key macroeconomic trends in our markets, Peru, Chile and Colombia. For additional information on trends in our business, see “Item 5.A. Operating and Financial Review and Prospects—Operating Results—Factors Affecting our Results of Operations” and “Item 4.B. Business Overview—Backlog.”
Overview of the Peruvian Economy
Our results are substantially affected by economic conditions prevailing in Peru. The Peruvian economy has been one of the fastest growing economies globally during the period from 2014 to 2018. According to the Peruvian Central Bank, Peruvian real GDP grew at an average rate of 3.24%0.32% during thatthe period one of2016 to 2020. The average rate was impacted by a decrease in the highest rates in South America.Peruvian economy during 2020 due to the COVID-19 pandemic. The economic expansion during this period was a result of robust domestic demand, increase in investment, price stability, increase in foreign direct investment, and an improvement in public finances, among other factors.
Nominal GDP per capita has increased from S/. 21,959.3195.3 in 20142016 to S/. 23,670.2194.8 in 2018,2020, a 7.79%% increase.0.26% decrease. Average annual inflation, measured by the change in the CPI index, was 2.9%2.3% in the period from 20142016 to 2018.2020. On the other hand, Peru’s Sol depreciated from an average of S/.2.843.38 per US$1.00 in 20142016 to an average of S/.3.293.50 per US$1.00 in 2018,2020, a depreciation of 14.3%3.55%. Peru’s sovereign debt has been granted investment grade rating by S&P, Fitch and Moody’s. At the end of 2018,2020, Peruvian sovereign debt had one of the highest credit ratings in the South American region, rated BBB+ by S&P (August 2013) and Fitch (March 2019)(December 2020) and A3 by Moody’s (August 2018)(June 2019).
The following table sets forth the main economic indicators of the Peruvian economy from 20142016 to 2018:2020:
| | | | 2014 | | 2015 | | 2016 | | 2017 | | 2018 | | | 2016 | | 2017 | | 2018 | | 2019 | | 2020 | |
Nominal GDP (US$ billions) | | | 202.8 | | | 192.3 | | | 195.3 | | | 215.1 | | | 225.3 | | | | 195.3 | | | | 215.1 | | | | 225.3 | | | | 230.4 | | | | 194.8 | |
Nominal GDP / capita (US$) | | | 6,455.0 | | | 6,172.7 | | | 6,204.5 | | | 6,756.7 | | | 7,005.1 | | | | 6,204.5 | | | | 6,756.7 | | | | 6,996.9 | | | | 7,089.2 | | | | 5,975.5 | |
Real GDP growth rates (% based on local currency GDP) | | | 2.4 | % | | 3.3 | % | | 4.0 | % | | 2.5 | % | | 4 | % | | | 4.0 | % | | | 2.5 | % | | | 4.0 | % | | | 2.2 | % | | | (11.1 | )% |
Private consumption growth rate | | | 3.9 | % | | 4.0 | % | | 3.3 | % | | 2.5 | % | | 3.8 | % | | | 3.3 | % | | | 2.5 | % | | | 3.8 | % | | | 3.0 | % | | | (8.7 | )% |
Private investment growth rate | | | (2.3 | %) | | (4.3 | %) | | (5.9 | %) | | 0.1 | % | | 4.4 | % | | | (5.9 | %) | | | 0.1 | % | | | 2.1 | % | | | 0.9 | % | | | (17.2 | )% |
Foreign direct investment growth rate | | | (15.2 | %) | | 4.9 | % | | (17.0 | %) | | (1.4 | %) | | (8.8 | %) | | | (17.0 | %) | | | (1.4 | %) | | | (8.8 | %) | | | (37.1 | %) | | | (64.7 | %) |
Public expenditure (consumption and investment) growth rate | | | 3.6 | % | | 3.6 | % | | (0.2 | %) | | 1.1 | % | | 4.3 | % | | | (12.2 | %) | | | 9.8 | % | | | 8.4 | % | | | 1.0 | % | | | 20.1 | % |
Total private and public fixed investment growth rate(1) | | | (2.1 | %) | | (5.3 | %) | | (4.6 | %) | | 0.0 | % | | 5.2 | % | | | (4.6 | %) | | | 0.0 | % | | | 5.2 | % | | | 1.3 | % | | | (23.4 | )% |
Exports growth rate | | | (0.9 | %) | | 4.0 | % | | 9.5 | % | | 8.5 | % | | 2.5 | % | | | 9.5 | % | | | 8.5 | % | | | 3.4 | % | | | -0.5 | % | | | (19.0 | )% |
Imports growth rate | | | (1.4 | %) | | 2.4 | % | | (2.2 | %) | | 4.0 | % | | 3.4 | % | | | (2.2 | %) | | | 4.0 | % | | | 3.5 | % | | | 1.7 | % | | | (14.9 | )% |
Inflation (measured by change in CPI) | | | 3.2 | % | | 4.4 | % | | 3.2 | % | | 1.4 | % | | 2.2 | % | | | 3.3 | % | | | 1.5 | % | | | 2.5 | % | | | 1.9 | % | | | 2.2 | % |
Average exchange rate (S/./US$) | | | 2.84 | | | 3.19 | | | 3.38 | | | 3.26 | | | 3.29 | | |
End of period exchange rate (S/./US$) | | | 2.99 | | | 3.41 | | | 3.36 | | | 3.25 | | | 3.38 | | |
Average exchange rate (S//US$) | | | | 3.38 | | | | 3.26 | | | | 3.29 | | | | 3.34 | | | | 3.50 | |
End of period exchange rate (S//US$) | | | | 3.36 | | | | 3.25 | | | | 3.38 | | | | 3.32 | | | | 3.62 | |
Central Bank interest rate (end of period) | | | 3.50 | % | | 3.75 | % | | 4.25 | % | | 3.25 | % | | 2.80 | % | | | 4.25 | % | | | 3.25 | % | | | 2.75 | % | | | 2.25 | % | | | 0.25 | % |
Population (million)(1) | | | 31.4 | | | 31.1 | | | 31.5 | | | 31.8 | | | 32.5 | | | | 31.5 | | | | 31.8 | | | | 32.2 | | | | 32.5 | | | | 32.6 | |
Unemployment rate(1) | | | 6.0 | % | | 6.4 | % | | 6.7 | % | | 6.7 | % | | 6.6 | % | | | 6.7 | % | | | 6.7 | % | | | 6.6 | % | | | 6.3 | % | | | 15.1 | % |
Total public debt (US$ billions) | | | 38.6 | | | 41.8 | | | 46.7 | | | 53.6 | | | 57.9 | | | | 46.7 | | | | 53.6 | | | | 57.9 | | | | 61.7 | | | | 68.2 | |
Public debt/nominal GDP (%) | | | 20.0 | % | | 23.3 | % | | 23.8 | % | | 24.8 | % | | 25.7 | % | | | 23.8 | % | | | 24.8 | % | | | 25.8 | % | | | 26.8 | % | | | 35.0 | % |
Net reserves (US$ billions) | | | 62.3 | | | 61.5 | | | 61.7 | | | 63.6 | | | 60.2 | | | | 61.7 | | | | 63.6 | | | | 60.2 | | | | 68.2 | | | | 74.7 | |
Net reserves/nominal GDP (%) | | | 30.7 | % | | 32.0 | % | | 31.6 | % | | 29.6 | % | | 26.7 | % | | | 31.6 | % | | | 29.6 | % | | | 26.7 | % | | | 29.6 | % | | | 36.7 | % |
Fiscal surplus (deficit)/nominal GDP (%) | | | (0.3 | %) | | (2.1 | %) | | (2.6 | %) | | (3.1 | %) | | (2.4 | %) | |
Fiscal surplus (deficit)/ nominal GDP (%) | | | | (2.6 | %) | | | (3.1 | %) | | | (2.4 | %) | | | (1.6 | %) | | | (8.9 | )% |
Source: Peruvian Central Bank, SBS, Ministry of Economy and Finance, National Statistical Institute of Peru (INEI), IMF.
| (1) | 20182020 projected by IMF.
|
The following table sets forth real gross domestic product by expenditure for the years indicated.
| | | | | | | | | | | | | | | | | | | | |
GDP by Expenditure (% of GDP unless otherwise stated) | | 2014 | | | 2015 | | | 2016 | | | 2017 | | | 2018 | |
Government consumption | | | 12.2 | | | | 12.6 | | | | 12.0 | | | | 11.8 | | | | 11.5 | |
Private consumption | | | 63.0 | | | | 65.5 | | | | 65.5 | | | | 64.8 | | | | 64.7 | |
Total fixed investment | | | 26.3 | | | | 24.6 | | | | 22.6 | | | | 21.1 | | | | 22.4 | |
Public sector | | | 5.6 | | | | 5.0 | | | | 4.8 | | | | 4.6 | | | | 4.8 | |
| GDP by Expenditure (% of GDP unless otherwise stated) | �� | 2014 | | 2015 | | 2016 | | 2017 | | 2018 | | | 2016 | | 2017 | | 2018 | | 2019 | | 2020 | |
Government consumption | | | | 12.0 | | | | 11.8 | | | | 13.8 | | | | 14.1 | | | | 13.3 | |
Private consumption | | | | 65.5 | | | | 64.8 | | | | 61.6 | | | | 62.2 | | | | 66.0 | |
Total fixed investment | | | | 22.6 | | | | 21.1 | | | | 25.4 | | | | 24.2 | | | | 18.8 | |
Public sector | | | | 4.8 | | | | 4.6 | | | | 7.3 | | | | 6.5 | | | | 4.2 | |
Private sector | | | 20.1 | | | 19.3 | | | 17.8 | | | 16.9 | | | 17.6 | | | | 17.8 | | | | 16.9 | | | | 18.1 | | | | 17.7 | | | | 16.7 | |
Change in inventories(1) | | | 0.6 | | | 0.3 | | | (0.0 | ) | | (0.5 | ) | | (0.6 | ) | | | (0.0 | ) | | | (0.5 | ) | | | (2.8 | ) | | | (2.8 | ) | | | (2.1 | ) |
Exports of goods and services | | | 22.4 | | | 21.0 | | | 22.1 | | | 24.3 | | | 25.0 | | | | 22.1 | | | | 24.3 | | | | 24.5 | | | | 24.2 | | | | 22.5 | |
Imports of goods and services | | | 24.0 | | | 23.7 | | | 22.2 | | | 22.0 | | | 23.0 | | | | 22.2 | | | | 22.0 | | | | 22.6 | | | | 21.9 | | | | 20.7 | |
Net exports | | | (1.6 | ) | | (2.7 | ) | | (0.1 | ) | | 2.3 | | | 2.0 | | | | (0.1 | ) | | | 2.3 | | | | 2.0 | | | | 2.3 | | | | 1.8 | |
GDP (in billions of US$) | | | 202.8 | | | 192.3 | | | 195.3 | | | 215.1 | | | 225.3 | | | | 195.3 | | | | 215.1 | | | | 225.3 | | | | 230.4 | | | | 194.8 | |
Source: Peruvian Central Bank
| (1) | Defined as the difference between the volume at the end of the period and the volume at the beginning of the period; valued at the average price over the period. |
Key Industry Sectors Relating to Our Business in Peru
Construction and Infrastructure
The Peruvian construction industry nominal GDP is estimated atto be US$13.310.9 billion and accounted for 5.9%5.6% of the country’s nominal GDP in 20182020, according to the Peruvian Central Bank. Construction GDP grew at an average of 0.5% annuallydid not grow in real terms during the five years from 20142016 to 2018.2020. The following table illustrates, from 20142016 to 2018,2020, the average real growth rate in both private investment and construction in Peruvis-à-vis the average real GDP growth rate.
Growth of Real Private Investment GDP and Real Construction Sector GDP vs. Real GDP
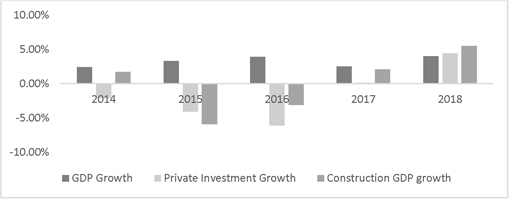
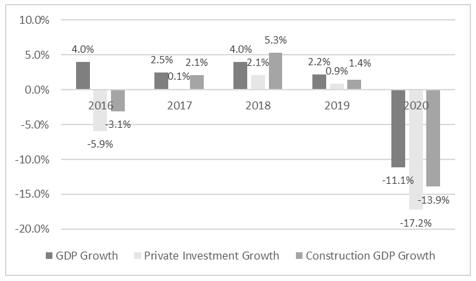
Source: Peruvian Central Bank.
Mining
Peru is a poly-metallic resources producer and exports several metals including silver, copper, zinc, gold and lead, among others. Peru is also a major contributor to global metal reserves. According to the U.S. Geological Survey of 2018,2021, as of January 2020, Peru holds 15.9%held 18.2% of global silver reserves, 12.3%8.0% of global zinc reserves, 11.4%10.57% of global copper reserves and 4.4%5.09% of global gold reserves, as of March 2019.reserves. According to the Peruvian Central Bank, mining exports reached approximately US$ 28.821.9 billion and represented 59%61% of total Peruvian exports in 2018.2020.
As of December 2017,October 2020, the Peruvian Ministry of Energy and Mines estimates 4846 mining projects at various stages of development involving an estimated investment of US$59.156.157 billion.
Mining Investment Projects by Level of Development
| | | | Number of
Projects | | | US$
billion | | | Number of Projects | | | US$ billion | |
Under construction | | | 7 | | | | 10.1 | | | | 5 | | | | 8,501 | |
Detailed Engineering | | | 5 | | | | 4.9 | | | | 4 | | | | 4,219 | |
Feasibility | | | 14 | | | | 14.6 | | | | 17 | | | | 16,590 | |
Pre-feasibility | | | 22 | | | | 29.4 | | | | 20 | | | | 26,847 | |
Total | | | 48 | | | | 59.1 | | | | 46 | | | | 56,157 | |
Source: Peruvian Ministry of Energy and Mines.
Oil and Gas
The oil and gas activity in Peru has decreased with a sector nominal GDP average annual growth rate of (3.0)%1% during the five years from 20142016 to 2018.2020. Oil and gas activity includes the exploration and production, and transportation and commercialization of hydrocarbon products and derivatives.
According to the Peruvian Ministry of Energy and Mines, during 2018,2020, local production of petroleum was approximately 48.539.7 Mbbl per day, 12.25% more25% less than 2017.2019. Peruvian gas production increased considerably since 2004, when the Camisea project, the largest gas project in Peruvian history, began operations. The Peruvian Ministry of Energy and Mines reportsreported that as of 2017, proven reserves of oil and gas amounted to 3,131 MMboe.proved reserves as of December 31, 2018 were 2,126 MMBOE. The oil and gas proved reserves as of December 31, 2019 and 2020 have not yet been published. The Peruvian government’s reserves methodology may differ materially from the one mandated by the SEC.
Hydrocarbons ProvenProved Reserves and Production Evolution in Peru (in MMboe)
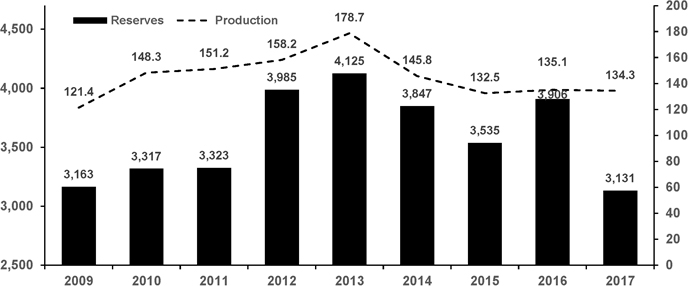
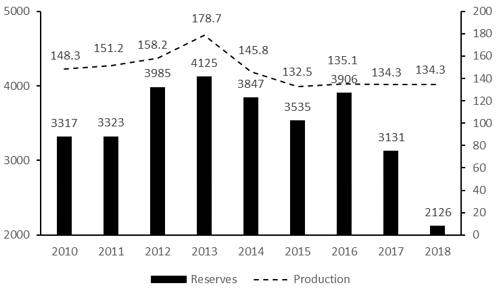
Source: Peruvian Ministry of Energy and Mines
Our Other Markets: Chile and Colombia
Chile
Overview of the Chilean Economy
Our activities in Chile span across the E&C and power services sectors. The following table sets forth the main economic indicators of the Chilean economy for the period from 20142016 to 2018.2020.
| | | | | | | | | | | | | | | | | | | | |
Values in nominal US$ billion unless otherwise stated | | 2014 | | | 2015 | | | 2016 | | | 2017 | | | 2018 | |
Nominal GDP | | | 261.1 | | | | 244.0 | | | | 250.1 | | | | 276.9 | | | | 298.8 | |
Nominal GDP / capita (US$) | | | 14,655.5 | | | | 13,548.4 | | | | 13,743.8 | | | | 15,057.6 | | | | 15,934.7 | |
Real GDP growth rate (%) | | | 1.9 | % | | | 2.2 | % | | | 1.3 | % | | | 1.5 | % | | | 4.0 | % |
Inflation (%, measured by change in CPI) | | | 4.6 | % | | | 4.4 | % | | | 2.7 | % | | | 2.3 | % | | | 2.6 | % |
Total private and public fixed investment | | | 58.4 | | | | 53.6 | | | | 57.8 | | | | 61.8 | | | | 58.7 | |
Average exchange rate (CLP/US$) | | | 570.0 | | | | 654.2 | | | | 676.8 | | | | 649.3 | | | | 640.29 | |
End of period exchange rate (CLP/US$) | | | 607.4 | | | | 707.3 | | | | 667.3 | | | | 615.2 | | | | 694.0 | |
Population (million)(1) | | | 17.8 | | | | 18.0 | | | | 18.2 | | | | 18.4 | | | | 18.8 | |
| Values in nominal US$ billion unless otherwise stated | | 2014 | | 2015 | | 2016 | | 2017 | | 2018 | | | 2016 | | 2017 | | 2018 | | 2019 | | 2020 | |
Nominal GDP | | | | 250.1 | | | | 276.9 | | | | 298.8 | | | | 279.8 | | | | 253.7 | |
Nominal GDP / capita (US$) | | | | 13,743.8 | | | | 15,057.6 | | | | 15,934.7 | | | | 14,797.2 | | | | 13,038.0 | |
Real GDP growth rate (%) | | | | 1.3 | % | | | 1.5 | % | | | 4.0 | % | | | 1.1 | % | | | (5.8 | )% |
Inflation (%, measured by change in CPI) | | | | 2.7 | % | | | 2.3 | % | | | 2.6 | % | | | 3.0 | % | | | 3.0 | % |
Total private and public fixed investment | | | | 57.8 | | | | 61.8 | | | | 58.7 | | | | 61.2 | | | | 52.5 | |
Average exchange rate (CLP/US$) | | | | 676.8 | | | | 649.3 | | | | 640.29 | | | | 702.63 | | | | 792.22 | |
End of period exchange rate (CLP/US$) | | | | 667.3 | | | | 615.2 | | | | 694.0 | | | | 732.2 | | | | 710.95 | |
Population (million)(1) | | | | 18.2 | | | | 18.4 | | | | 18.8 | | | | 19.1 | | | | 19.5 | |
Unemployment rate | | | 6.4 | % | | 6.2 | % | | 6.5 | % | | 7.0 | % | | 6.7 | % | | | 6.2 | % | | | 6.5 | % | | | 7.1 | % | | | 7.1 | % | | | 10.3 | % |
Public Debt / nominal GDP (%) | | | 14.0 | % | | 16.0 | % | | 21.3 | % | | 24.9 | % | | 25.6 | | |
Public Debt / nominal GDP (%)(2) | | | | 21.3 | % | | | 24.9 | % | | | 25.6 | % | | | 27.9 | % | | | 32.9 | % |
Net reserves / nominal GDP (%) | | | 15.5 | % | | 15.8 | % | | 16.2 | % | | 14.1 | % | | 14.5 | % | | | 16.2 | % | | | 14.1 | % | | | 14.5 | % | | | 15.4 | % | | | 13.9 | % |
Fiscal surplus (deficit) / nominal GDP (%) | | | (1.5 | %) | | (2.1 | %) | | (2.7 | %) | | (2.8 | %) | | (3.1 | %) | | | (2.7 | %) | | | (2.8 | %) | | | (3.1 | %) | | | (4.4 | %) | | | (7.4 | %) |
Source: Chilean Central Bank, Chilean Government Budget Office, IMF, Global Insight
| (1) | 20182019 and 2020 projected by the IMF
|
| (2) | 2020 data presented as of September 30, 2020. |
The Chilean real GDP grew at an average annual rate of 2.2%0.42% during the five years from 20142016 to 20182020 in real terms. The country’s nominal GDP per capita has increased 24.2%decreased 5.14% from CLP 8.9 millionUS$13,743.8 in 20142016 to CLP 11.1 millionUS$13,038.0 in 2018. This expansion was mainly driven by a strong domestic demand in real terms: total consumption grew on average at 3.2% per year during the five years from 2014 to 2018.2020. Inflation has remained stable since 2014,2016, averaging 3.3%2.7% between 20142016 and 2018,2020, in line with the Chilean Central Bank’s inflation target of 3% +/- 1%. Chilean sovereign debt has the highest rating in the South America region, rated A+A by S&P (July 2017)(March 2021), A1 by Moody’s (July 2018)(August 2020) and AA- by Fitch (February 2019)(October 2020).
Colombia
Overview of the Colombian Economy
Our current activities in Colombia involve technical services provided primarily to the power services sector. The following table sets forth the main economic indicators of the Colombian economy for the period from 20142016 to 2018.2020.
| Values in nominal US$ billion unless otherwise stated | | 2014 | | 2015 | | 2016 | | 2017 | | 2018 | | | 2016 | | 2017 | | 2018 | | 2019 | | 2020 | |
Nominal GDP | | | 377.9 | | | 288.4 | | | 280.4 | | | 309.2 | | | 266.4 | | | | 299.4 | | | | 303.5 | | | | 311.1 | | | | 321.5 | | | | 299.5 | |
Nominal GDP / capita (US$) | | | 7,928.1 | | | 5,983.0 | | | 5,751.6 | | | 6,272.4 | | | 5,349.1 | | | | 6,142.7 | | | | 6,157.5 | | | | 6,243.7 | | | | 6,381.9 | | | | 5,945.6 | |
Real GDP growth rate (%) | | | 4.6 | % | | 3.1 | % | | 2.0 | % | | 1.8 | % | | 2.7 | % | | | 2.1 | % | | | 1.4 | % | | | 2.5 | % | | | 3.3 | % | | | (6.8 | )% |
Inflation (%, measured by change in CPI) | | | 3.7 | % | | 6.8 | % | | 5.8 | % | | 4.1 | % | | 3.1 | % | | | 5.8 | % | | | 4.1 | % | | | 3.2 | % | | | 3.8 | % | | | 1.6 | % |
Total private and public fixed investment | | | 76.5 | | | 60.7 | | | 66.7 | | | 66.7 | | | 64.6 | | | | 66.7 | | | | 66.7 | | | | 64.6 | | | | 67.4 | | | | 58.7 | |
Average exchange rate (COP/US$) | | | 2,001.1 | | | 2,771.5 | | | 3,051.0 | | | 2,951.3 | | | 2,956.6 | | | | 3,051.0 | | | | 2,951.3 | | | | 2,956.6 | | | | 3,281.1 | | | | 3,693.3 | |
End of period exchange rate (COP/US$) | | | 2,392.5 | | | 3,149.5 | | | 3,000.7 | | | 2,984.0 | | | 3,208.6 | | | | 3,000.7 | | | | 2,984.0 | | | | 3,249.8 | | | | 3,277.1 | | | | 3,432.5 | |
Population (million)(1) | | | 47.7 | | | 48.2 | | | 48.7 | | | 49.3 | | | 49.8 | | | | 46.9 | | | | 47.4 | | | | 48.3 | | | | 49.4 | | | | 50.4 | |
Unemployment rate(1) | | | 8.7 | % | | 8.6 | % | | 8.7 | % | | 8.6 | % | | 9.7 | % | | | 8.7 | % | | | 8.6 | % | | | 9.7 | % | | | 9.5 | % | | | 13.4 | % |
Public Debt / nominal GDP (%) | | | 37.7 | % | | 41.4 | % | | 42.8 | % | | 45.3 | % | | 50.4 | % | | | 42.8 | % | | | 45.3 | % | | | 50.4 | % | | | 47.5 | % | | | 55.4 | % |
Net reserves / nominal GDP (%) | | | 12.5 | % | | 16.2 | % | | 16.6 | % | | 15.4 | % | | 14.2 | % | | | 16.6 | % | | | 15.4 | % | | | 14.2 | % | | | 16.5 | % | | | 19.7 | % |
Fiscal surplus (deficit) / nominal GDP (%) | | | (2.6 | %) | | (3.1 | %) | | (3.9 | %) | | (3.3 | %) | | (3.1 | %) | | | (3.9 | %) | | | (3.3 | %) | | | (3.1 | %) | | | (2.5 | %) | | | (2.9 | %) |
Source: Colombian National Department of Administration of Statistics (DANE), Colombian Central Bank, Colombian Treasury Department, IMF, Global Insight
| (1) | 20182019 projected by the IMF
|
Colombian real GDP grew at an average annual rate of 2.8%0.5% during the five years from 20142016 to 2018.2020. The country’s nominal GDP per capita has decreased 9.5%3.2% from COP 19.0 mmUS$ 6,142.7 in 20142016 to COP 17.2 mmUS$ 5,945.6 in 2018.2020. Inflation has increased in recent years, averaging 4.7%3.7% per year from 20142016 to 2018, higher than2020, in line with the Colombian Central Bank’s inflation target of 3% +/- 1%. On the other hand, the Colombian peso depreciated from an average of COP 2,001.13,051.0 per US$1.00 in 20142016 to an average of COP 2,956.63,693.3 per US$1.00 in 2018.2020. Colombia’s sovereign debt currently holds BBB rating fromBBB- by Fitch (November 2018)2020), BBB- from S&P (December 2017)(March 2020), and Baa2 from Moody’s (February 2018)(December 2020). Colombia is also recognized for its investor-friendly legal regime.
E.Off-BalanceE. Off-Balance Sheet Arrangements
As of December 31, 2018,2020, we did not haveoff-balance sheet arrangements that have or are reasonably likely to have a current or future effect on our company’s financial condition, changes in financial condition, revenues or expenses, results of operations, liquidity, capital expenditures or capital resources that is material to investors.
For information about performance guarantees and similar instruments that we obtained in the ordinary course of business, see note 3231 to our audited annual consolidated financial statements included in this annual report.
F. Tabular Disclosure of Contractual Obligations
The following table sets forth our contractual obligations with payment terms as of December 31, 2018.2020.
| | | | Payments Due By Period (in millions of S/.) | | | Payments Due By Period (in millions of S/) | |
| | | Less than
1 year | | | 1-2 years | | | 3-5 years | | | More
than 5
Years | | | Total | | | Less than
1 year | | | 1-2 years | | | 3-5 years | | | More than
5 Years | | | Total | |
Indebtedness(1) | | | 781,649 | | | | 403,565 | | | | 175,163 | | | | 813,495 | | | | 2,173,872 | �� | | | 477,745 | | | | 225,581 | | | | 292,954 | | | | 709,682 | | | | 1,705,962 | |
Capitalized Lease Obligations(1) | | | 17,321 | | | | 7,333 | | | | 12,998 | | | | — | | | | 37,652 | | | | 33,585 | | | | 39,321 | | | | 33,955 | | | | 18,256 | | | | 125,117 | |
Interest(2) | | | 5,022 | | | | 43,750 | | | | 41,391 | | | | 4,138 | | | | 94,302 | | | | 100,079 | | | | 134,492 | | | | 297,493 | | | | 287,204 | | | | 819,268 | |
| | | | | | | | | | | | | | | | | | | | | | | | | | | | | | |
Total(3) | | | 803,992 | | | | 454,648 | | | | 229,552 | | | | 817,633 | | | | 2,305,826 | | | | 611,409 | | | | 399,394 | | | | 624,402 | | | | 1,015,142 | | | | 2,650,347 | |
| | | | | | | | | | | | | | | | |
| (1) | Includes principal only of our indebtedness and capitalized lease obligations.obligations, other than interest payable on the corporate bonds of Norvial and Línea 1. |
| (2) | Includes the effect of our interest swap agreements described in “—Derivative Financial Instruments.” |
| (3) | Excludes building leases, which are not material. |
G. Safe Harbor
See “Part I. Forward-Looking Statements.”
ITEM 6. DIRECTORS, SENIOR MANAGEMENT AND EMPLOYEES
ITEM 6. | DIRECTORS, SENIOR MANAGEMENT AND EMPLOYEES
|
A. Directors and Senior Management
General
Our business and affairs are managed by our board of directors in accordance with ourby-laws, shareholdershareholder’s meeting rules of procedure, board of directors rules of procedure, internal rules of conduct and Peruvian Corporate Law No. 26,88726887 (“Peruvian Corporate Law”). Our bylaws provide for a board of directors of between five and nine members. Our shareholders may appoint an alternate director for each director to act on his or her behalf when absent from meetings or unable to exercise his or her duties. Alternate directors have the same responsibilities, duties and powers of directors to the extent they are called to replace them.
Directors are elected at a shareholders’ meeting and hold office for three years. Directors may be elected to multiple terms. Our current board of directors is composed of eightnine directors and no alternates. If a director resigns or otherwise becomes unable to continue with the duties, a majority of our directors may appoint one of the alternate directors, or in the absence of alternate directors, any other person, to serve as director for the remaining term of the board. In the first board meeting held after the annual shareholders’ meeting where members of the board are elected, the board of directors must elect among its members a chairman and a vice chairman if the shareholders’ meeting did not elect them. As of the date of this annual report, we have one vacancy in our board of directors. We expect to fill this vacancy in the near term.
The board of directors typically meets monthly, when called by any director or our Chief Executive Officer. Resolutions must be adopted by a majority of the directors present at the meeting and the chairman is entitled to cast the deciding vote in the event of a tie.
Duties and Liabilities of Directors
Pursuant to Article 177 of Peruvian Corporate Law, directors are jointly and severally liable to athe corporation, its shareholders and third parties for any damages caused by board decisions or acts that breach the law or the bylaws of the company, or for damages caused by abuse of power, fraud, willful misconduct or gross negligence.
In addition, pursuant to Article 3 of Law No. 29,720,29720, as amended, directors of companies with common shares listed on the Lima Stock Exchange are liable to the company and its shareholders for damages caused by resolutions which are favorable to their individual interest (or the interest of a related party) to the detriment of the company’s interest if: (i) the listed company is a party to the transaction; (ii) the controlling shareholder of the listed company controls the legal entity acting as counterparty; (iii) the transaction is not carried out on an arm’s length basis; and (iv) at least 10% of the listed company’s assets are involved in the transaction.
A director cannot be found liable for a board decision or act if he/shethey did not participate in the respective meeting where the corresponding decision was taken or if the director’s express disagreement is noted in the corresponding record.minutes of such meeting or evidenced by notarized notice.
Article 180 of the Peruvian Corporate Law requires a director with a conflicting interest on a specific matter to disclose suchabstain from: (i) adopting decisions that would not be in the corporation’s interest and abstain fromthat would benefit their interests or those of any related third party, (ii) using for themselves any commercial opportunity or business they became aware of as a result of the deliberationexercise of their duties as a director and decision-making process(iii) participating themselves in competition with respectthe company in any matter that would require disclosure and abstention due to such matter.a conflict of interest. A director who violates this requirementthese requirements is liable for any damages caused to usthe company and may be removed by a majority of the board of directors or, upon the request of any member of the board or of any shareholder, by a majority vote of the shareholders.
Pursuant to Article 181 of the Peruvian Corporate Law, shareholders are entitled to protect the interest of a company through derivative law suitsby bringing a claim of civil responsibility against any directors, in ordersubject to remedy or preventapproval of shareholders at a wrong to the corporation. In addition, pursuant toduly convened shareholders’ meeting. However, Article 4 of Law No. 29,720, with respect to companies listed on the Lima Stock Exchange, establishes that a shareholder holding shares which representthat owns at least 10% of the paid capital stock is entitled to file a claim of civil responsibility under Article 181 of the Peruvian Corporate Law without holding a prior shareholders’ meeting.
Additionally, Legal Decree No. 1121 and Legal Decree No. 1422 (both governing the application of Rule XVI of the Peruvian Tax Code regarding anti-evasion conduct) require the board of directors of Peruvian companies to review any tax planning strategy in respect of the prior fiscal year, and to re-authorize, amend or dissolve the same. If the board of directors do not comply with these rules, the Peruvian tax authority (SUNAT) may bring said action againsthold the directors.directors jointly liable with the company.
Sections 2 and 13 of article 16 of the Peruvian Taxation Code also establish that directors will be jointly liable with the company and with each other if the company does not pay its taxes due to willful misconduct (dolo), gross negligence (culpa grave) or abuse of power of attorney in breach of anti-tax evasion laws.
Board of Directors
The following sets forth our directors and their respective positions as of the date of this annual report.
On December 9, 2020, an extraordinary shareholders’ meeting of the company elected a new board of directors, consisting of nine directors, seven of whom were not previously directors of the company. The term of the current board of directors is three years and expires in March 2020, onDecember of 2023. Due to the third anniversary fromongoing effects of the dateCOVID-19 pandemic and government measures to limit the spread of election.the virus, our annual shareholders’ meeting was postponed and our prior board of directors continued to exercise their functions until the new board was elected.
| | | | | | | | | | |
Name | | Position | | Year of
Birth | | | Year of First
Appointment | |
Augusto Baertl Montori | | Chairman of the Board | | | 1945 | | | | 2017 | |
Rafael Venegas Vidaurre | | Vice Chairman of the Board (Independent)* | | | 1950 | | | | 2017 | |
Carlos Montero Graña | | Director | | | 1942 | | | | 1996 | |
Pedro Pablo Errazuriz Domínguez | | Director (Independent)* | | | 1961 | | | | 2014 | |
Roberto Abusada Salah | | Director | | | 1946 | | | | 2017 | |
Alfonso de Orbegoso Baraybar | | Director (Independent)* | | | 1962 | | | | 2017 | |
Manuel del Río Jiménez | | Director (Independent)* | | | 1952 | | | | 2017 | |
Ernesto Balarezo Valdez | | Director (Independent)* | | | 1967 | | | | 2018 | |
| | | | | | | | | | |
Name | | Position | | Year of
Birth | | | Year of First
Appointment | |
Christian Laub | | Chairman of the Board | | | 1970 | | | | 2019 | |
Nicolas Bañados Lyon | | Vice Chairman of the Board | | | 1976 | | | | 2020 | |
Juan Antonio Arrieta Ocampo | | Director (Independent)* | | | 1946 | | | | 2020 | |
Miguel Angel Bazan Garcia | | Director (Independent)* | | | 1954 | | | | 2020 | |
Miguel Grau Quinteros | | Director (Independent)* | | | 1971 | | | | 2020 | |
Santiago Hernando Perez | | Director (Independent)* | | | 1953 | | | | 2020 | |
Carlos Rojas Perla | | Director (Independent)* | | | 1971 | | | | 2020 | |
Antonio Carlos Valente Da Silva | | Director (Independent)* | | | 1952 | | | | 2020 | |
Esteban Viton Ramirez | | Director | | | 1952 | | | | 2019 | |
| * | Independent member under the Exchange Act independence standards. |
The following sets forth selected biographical information for each of the members of our board of directors. The business address of each of our current directors is Av. Paseo de la República 4667, Surquillo, Lima 34, Peru.
Augusto Baertl MontoriChristian Laub. Mr. BaertlLaub was appointed as a director of the company in May of 2019. He holds a degree as an economist from the Universidad del Pacífico (Peru) with a specialization in business economics and an MBA from Harvard University. He has been a director of the Lima Stock Exchange, serving as its president from 2013 to 2016. He was an executive of the Credicorp Group for more than 20 years, holding different positions. Among them, he served as CEO of Credicorp Capital from 2011 to 2018. He also served as division manager of corporate banking, manager of the corporate finance area, manager of the capital markets area and general manager of Credifondo.
Nicolas Bañados Lyon. Mr. Bañados was appointed as a director of the company in December of 2020. He has a degree in Commercial Engineering from the Pontificia Universidad de Chile with a Master’s degree in Economics from the same university and an MBA from the Wharton School of Business at the University of Pennsylvania. He currently holds the position of Managing Director Private Equity at Megeve Investments and is a minedirector of Termotasajero, Haldeman Mining Company, Serabi Gold and Enjoy, among other companies. He is also a member of the LP Council of the Emerging Markets Private Equity Association (EMPEA).
Juan Antonio Arrieta Ocampo. Mr. Arrieta was appointed as a director of the company in December of 2020. Mr. Arrieta holds a bachelor’s degree in Agricultural Engineering from the Universidad Agraria La Molina and an MBA from ESAN. He has assumed management and direction positions in Agroexportaciones Manuelita, Agrokasa, Backus & Johnston Trading, Shering Plough Corporation, AB Volvo del Perú and Cosapi, among others. He has served as a director in Agroindustrial Laredo and Agroexportaciones Manuelita and the Asociación Peruana de Agroindustrias del Azúcar y Derivados. He currently serves as a director of Sociedad Agrícola Saturna, Agrícola La Venta, Imecol/Perú and the Asociación de Graduados de la Universidad Agraria de La Molina.
Miguel Angel Bazán García. Mr. Bazán was appointed as a director of the company in December of 2020. He holds a bachelor’s degree in Mechanical Engineering from the Universidad Católica del Perú, a Master in Economics and Business Administration from IESE, University of Navarra, with several specialization courses at the University of Navarra, Harvard Business School and Stanford University. He is currently Director and Professor of the General Management Department of the Management School of the Universidad de Piura and Director of Compañía Industrial Nuevo Mundo, Ilender Peru, Laboratorios Hersil and Mibanco. He has more than 30 years of experience as a director and manager of companies.
Miguel Grau Quinteros. Mr. Grau was appointed as a director of the company in December of 2020. He graduated from Universidad de Lima and holds a Master of Laws with a major in Civil Law from Pontificia Universidad Católica del Perú. He has postgraduate studies in domestic and international arbitration at the Arbitration Center of the Lima Chamber of Commerce and at the High Specialization Program in International Arbitration of the Universidad de Lima, respectively. Mr. Grau is a litigator with more than twenty-four years of professional experience. He advises companies on arbitration and judicial litigation of a civil, commercial, contentious-administrative and constitutional nature, related to public and private contracting, property, corporate, infrastructure of large works, aeronautics, energy and civil liability issues. He was in charge of the litigation area of Edelnor S.A. (today ENEL). He worked as a litigator at various law firms before forming his own law firm. He is arbitrator for the Arbitration Center of the Lima Chamber of Commerce and the Arbitration Center of the Pontificia Universidad Católica del Perú. He has participated as an expert witness on Peruvian law in the United States District Court, District of Maryland (Federal Court of Maryland). He has been a professor of arbitration at the Centro Integral de Educación Continua de la Universidad de Lima (Postgraduate) in the arbitration course. His work has been highlighted by the international legal directories Chambers & Partners, Legal 500 and Leaders League.
Santiago Hernando Perez. Mr. Hernando was appointed as a director of the company in December of 2020. He holds a degree in chemical sciences, specializing in chemical engineering, from the University of Valladolid, Spain and an MBA from IEDE Business School. He has worked in the utilities and concessions sector as CEO of Aguas Nuevas S.A., New Business Manager at Aguas Andinas S.A., CEO of Concesionaria Intermodal de la Cisterna and director of several sanitary companies in Chile and Uruguay, as well as the urban public transport company Alsacia in Santiago de Chile. Currently, he is an independent consultant in management and administration of companies and business development and is a director of Empresa de Servicios Sanitarios de los Lagos, S.A. and Aguas Santiago Norte S.A.
Carlos Rojas Perla. Mr. Rojas was appointed as a director of the company in December of 2020. He holds a bachelor’s degree in business administration from the Universidad del Pacífico with specialization courses at Harvard University and the Instituto Tecnológico y Estudios Superiores de Monterrey. He was a founding partner of Capia and is currently the CEO of Capia SAFI and a director of Enel Generación Perú S.A.A. He was Chief Investment Officer and director of Compass Group SAFI between 2006 and 2011 and designed and managed Peru Special Investment Funds, the first Peruvian equity hedge fund.
Antonio Carlos Valente Da Silva. Mr. Valente was appointed as a director of the company in December of 2020. He is an engineer from the Pontifícia Universidade Católica do Rio de Janeiro with a post-graduate degree in management from the same institution. He served as CEO and Chairman of the Board of Directors of Telefonica Brazil and Telefonica del Peru. He has been a member of the Board of Directors of the National Telecommunications Agency in Brazil. He is currently a director of Padtec Holding, Dom Rock and Cinnecta.
Esteban Vitón Ramirez. Mr. Vitón was appointed as a director of the company in May 2019. He holds degrees as an economist engineer from the Universidad Nacional de Ingeniería with postgraduate programs(Peru), a Master’s degree from ESAN Graduate School of Business (Peru), a MsM from the Arthur D Little School of Management (now Hult International Business School), has completed the advanced management program at Harvard Business SchoolUniversity and has completed studies at Northwestern University.PAD, INSEAD and others. He has assumed important senior management positions in Peruvian and international mining and oil companies. For 30 years, Mr. Baertl held various positions inis the mining company Milpo, ranging from mine superintendent, assistantgeneral manager and COO, to CEO. From 1997 to 2003, he served as presidentdirector of Pacific Energy and CEO of Compañía Minera Antamina. Since 1997 he has been CEOa manager of Agrícola Chapi S.A.,Quimpac and since 2003, he has been the executive president of Gestora de Negocios e Inversiones.
Mr. Baertl is the former chairman of the board of directors of the National Society of Mining, Oil and Energy at the Institute of Mining Engineers of Peru,other local companies, as well as of the Latin American Business Council (CEAL) and of the Chamber of Commerce Canada- Peru. He has also been chairman of the board of Atlas Copco Peru, Downing Teal-Peru, and Petroperu. In addition, he has been member of the board of directors of differentother companies such as Milpo, Atacocha, Huarón, Chungar, Castrovirreyna Mining Corporation, Interbank, BISA, Graña y Montero S.A.A., Norsemont and of the Prospectors and Developers Association of Canada (PDAC). He is currently chairman of the board of Agrícola Chapi, as well as a member of the board of Alturas Minerals, Chinalco International, FIMA, Stevia One and Ligabue Catering Perú S.A.C. He is also an active member of the board of directors of the National Society of Mining, Petroleum and Energy and COMEX. He has also participated in the board of directors of variousnon-profit institutions.
Rafael Venegas Vidaurre. Mr. Venegas is an industrial and systems engineer from Universidad Nacional de Ingeniería and holds post-graduate specializations in administrative and finance processes at A. Andersen School in Chicago, and has completed the Management and CEO programs at the Graduate School Kellogg, as well as the strategic planning, human management and marketing program at Harvard University. He has been CEO of Banco Internacional de Colombia, Citibank Peru, BankBoston Peru, Banco Sudamericano, Hermes/Brinks and, from 2010 to 2016, of Rimac Seguros y Reaseguros.
In addition, Mr. Venegas has served as director of several institutions and companies such as Diners Peru, Profuturo AFP, Banco Financiero, Scotiabank Perú, Compass Group Peru and as chairman of the board of directors in Citileasing, Citicorp S.A.B., Clínica Internacional and Rímac EPS.
Carlos Montero Graña. Mr. Montero is a civil engineer from Universidad Nacional de Ingeniería, and completed postgraduate studies in the senior management program at the University of Piura. He has been director of Graña y Montero S.A.A. since August 1996 to date. Mr. Montero is also chairman of the board of our subsidiary Concar S.A. and director of our subsidiary GMP S.A. He previously served as managing director of our subsidiary GyM until 2007, and was director of IPAE, GMD, GMI and UNICON.
Pedro Pablo Errázuriz Domínguez.Mr. Errázuriz is a civil engineer from Universidad Católica de Chile, with a master’s degree in engineering sciences from the same university and a master’s degree in operational research (Finance) from the London School of Economics. He is currently a partner of Veta Tres and director of companies. Until March 2014, he served as Minister of Transport and
Telecommunications in the Chilean administration of president Sebastián Piñera, a position he assumed in 2011.region. He has been a director of several companies representing the Ontario Teachers’ Pension Plan HoldingKallpa and CEO of its investments’ subsidiary in Chile, AndesCan, between 2009 and 2011. At the same time, he served as chairman of the board of Biodiversa, Esval, AguasCerro del Valle and SAESA Group. He was CEO and president of the board of the health services company ESSBIO. He was also CEO of Lan Express between 2000 and 2006 and Vice President of corporate planning for Lan Chile between 1999 and 2000. Mr. Errázurriz has been a member of the Graña y Montero board from 2014 to date.Águila.
Roberto Abusada Salah.Mr. Abusada studied Economics at Universidad Católica del Perú and at Cornell and Harvard Universities in the USA. He holds a Bachelor’s degree in economics from Universidad Católica as well as a master’s and PhD in economics from Cornell University. He has been senior advisor to the Minister of Economy during the years of the Peruvian economic reform (1993 and 1997). In 1994 heco-founded the Peruvian Institute of Economics (IPE), which he presides over. Dr. Abusada has taught economics at Universidad Católica del Perú, Universidad del Pacífico, UPC, ESAN and Boston University. He was director of the program of graduates in economics of the Universidad Católica and in the 1980s he held the positions of vice minister of commerce, vice minister of economy and member of the board of directors of the Central Reserve Bank. He has been director of the Corporación Andina de Fomento, as well as of Graña y Montero S.A.A. and TECSUP. He has been a member of the Global Strategic Advisory Group (GSAG) of the Konrad Adenauer Foundation. He has been a consultant to the United Nations (UNIDO, Vienna) World Bank, Inter-American Development Bank and various governments. He is currently an Ad Honorem advisor of the Peruvian government for matters of the Pacific Alliance and representative of the presidency of the council of ministers to the board of the fiscal stabilization fund and chairman of the board of GMD, director in GMP S.A. and UNACEM S.A.A.
Dr. Abusada has written several books and academic articles in various economic areas and is currently writing a fortnightly opinion column at El Comercio newspaper in Lima, Peru.
Alfonso de Orbegoso Baraybar. Mr. de Orbegoso is a lawyer from Pontificia Universidad Católica del Perú. He holds a master’s degree from Duke University School of Law and has completed specialization courses at the London School of Economics, Georgetown University and The McDonough School of Business. During 1991 and 1998 was partner of the Ludowieg, Andrade & Associates law firm and during 1998 to 2013 he served as legal vice president and regulatory affairs at Nextel del Perú S.A. During 2014 and 2015 he served as vice president legal, regulatory and interconnection at Nextel Telecomunicações Ltda, Brazil.
Manuel del Río Jiménez. Mr. Del Río is a mechanical engineer from Pontificia Universidad Católica del Perú and holds a master’s degree in industrial management from the Krannert Graduate School of Management — Purdue University — Indiana, USA. From July 2013 to September 2016, he was partner in tax & legal at KPMG in Peru and responsible for transactions, transfer pricing, corporate finance and business development.
During 2010 and 2013, he was the lead partner in the practice of advisory at KPMG in Peru. Previously, and since joining KPMG in 2004 until 2010, he was the managing partner of the transfer pricing division of KPMG Tax & Legal in Peru. He has more than nine years as leader of the financial control area and CFO of Citibank Perú. He was vice president of Profuturo AFP as well as member of the executive committee and director for ten years. In addition to this, he has been in charge of the professional and medical equipment business unit at Philips for eight years. Moreover, for ten years he has held various positions in the industrial and internal consulting sectors of Philips Peruana. He has taught several courses and lectures at the Pontificia Universidad Católica del Perú, as well as in private companies.
Ernesto Balarezo Valdez. Mr. Balarezo has a Master´s Degree in Industrial Management and a Bachelor´s Degree in Industrial Engineering, both degrees obtained at the University of Texas A&M in United States. He holds post-graduate specializations in Management, Finance, Human Resources, at Institutions such as Institute of Directors (IoD), Harvard, Wharton, INSEAD, IESE, among others. He is currently working as a partner and director of Comunal Coworking. In the previous three years, he held the positions of Executive Vice President for the Americas at Gold Fields Limited, and CEO of Gold Fields La Cima S.A. He previously worked for sixteen years for the Hochschild Group. His last position was as Vice President of Operations at Hochschild Mining. He was also Chief Executive Officer of Hochschild Mining in Mexico and then in Peru, as well as Deputy Chief Executive Officer and Chief Financial Officer in Cementos Pacasmayo. He has also been Director of several companies related to the Hochschild Group and Gold Fields Ltd and Director—Founder of the Peruvian—South African Chamber. He has also contributed as Director of Peru 2021 and in IPAE Acción Empresarial.
Executive Officers
Our executive officers oversee our business and are responsible for the execution of the decisions of the board of directors. Our executive officers are appointed for an indefinite period of time and their term of office may be terminated by our board of directors at its discretion. The following table presents information concerning the current executive officers of our company and their respective positions:
| | | | | | | | | | | | | | |
Name | | Position | | Year of
Birth | | | Year of
Appointment | | | Year of First
Employment
at the
Company | |
Luis Díaz Olivero | | Chief Executive Officer | | | 1970 | | | | 2017 | | | | 1993 | |
Dennis Gray Febres | | Chief Financial Officer | | | 1975 | | | | 2020 | | | | 2011 | |
Daniel Urbina Pérez | | Chief Legal Officer | | | 1969 | | | | 2018 | | | | 2018 | |
Fernando Dyer Estrella | | Chief Risk and Compliance Officer and Interim Chief Audit Executive | | | 1962 | | | | 2017 | | | | 2017 | |
Carlos Ochoa Febres | | Chief Human Resources Officer (Interim) | | | 1978 | | | | 2021 | | | | 2019 | |
Javier Vaca Terron | | Chief Executive Officer of Cumbra | | | 1970 | | | | 2018 | | | | 2008 | |
Antonio Cueto Saco | | Chief Executive Officer of Infrastructure | | | 1966 | | | | 2017 | | | | 1996 | |
Rolando Ponce Vergara | | Chief Executive Officer of Viva | | | 1963 | | | | 2008 | | | | 1993 | |
Reynaldo Llosa Martinto | | Chief Executive Officer of UNNA Energía | | | 1960 | | | | 2014 | | | | 2014 | |
Manuel Wu Rocha | | Chief Executive Officer of Highway Concessions | | | 1977 | | | | 2018 | | | | 2001 | |
Mario Gálvez Abad | | Chief Executive Officer of Línea 1 | | | 1972 | | | | 2018 | | | | 2017 | |
Antonio Rodríguez Canales | | Chief Executive Officer of Morelco | | | 1963 | | | | 2018 | | | | 1999 | |
Alejandro Palma Jara | | Chief Executive Officer of Vial y Vives-DSD and Regional Manager of Cumbra Ingeniería | | | 1959 | | | | 2018 | | | | 2018 | |
Manuel Fernández Pollan | | Chief Executive Officer of Qualys S.A. and Adexus/Chief of Information Technology | | | 1958 | | | | 2019 | | | | 2016 | |
Ms. Mónica Miloslavich Hart tendered her resignation as chief financial officer of the company for personal reasons, effective June 30, 2020. Mr. Dennis Gray has served as the chief financial officer of the company since July 2020. In addition, Mr. Carlos Gómez Pinto tendered his resignation as chief audit executive of the company for personal reasons, effective May 15, 2020. Mr. Fernando Dyer Estrella currently serves as the interim chief audit executive of the company, as the company searches for a permanent chief audit executive. Mr. Dyer is currently also the chief risk and compliance officer of the company. Ms. Marlene Negreiros tendered her resignation as corporate human resources officer for personal reasons, effective February 15, 2021. Mr. Carlos Ochoa was appointed as interim corporate human resources officer on the same date.
| | | | | | | | | | | | | | |
Name | | Position | | Year of
Birth | | | Year of
Appointment | | | Year of First
Employment
at the
Company | |
Luis Díaz Olivero | | Chief Executive Officer | | | 1970 | | | | 2017 | | | | 1993 | |
Mónica Miloslavich Hart | | Chief Financial Officer | | | 1966 | | | | 2009 | | | | 1993 | |
Daniel Urbina Pérez | | Chief Legal Officer | | | 1969 | | | | 2018 | | | | 2018 | |
Marlene Negreiros Bardales | | Chief Human Resources Officer | | | 1972 | | | | 2019 | | | | 2019 | |
Antonio Cueto Saco | | Chief Operating Officer | | | 1966 | | | | 2017 | | | | 1996 | |
Rolando Ponce Vergara | | Chief Executive Officer of Viva GyM | | | 1963 | | | | 2008 | | | | 1993 | |
Renato Rojas Balta | | Chief Executive Officer of GyM | | | 1972 | | | | 2014 | | | | 1995 | |
Luis Fukunaga Mendoza | | Chief Executive Officer of GMI | | | 1970 | | | | 2018 | | | | 2002 | |
Reynaldo Llosa Martinto | | Chief Executive Officer of GMP | | | 1960 | | | | 2014 | | | | 2014 | |
Jorge Luis Izquierdo Ramirez | | Chief Executive Officer of CONCAR | | | 1973 | | | | 2019 | | | | 1999 | |
Manuel Wu Rocha | | Chief Executive Concessions Officer | | | 1977 | | | | 2018 | | | | 2001 | |
Mario Gálvez Abad | | Chief Executive Officer of GyM Ferrovías | | | 1972 | | | | 2018 | | | | 2017 | |
Antonio Rodríguez Canales | | Chief Executive Officer of Morelco | | | 1963 | | | | 2018 | | | | 1999 | |
Alejandro Palma Jara | | Chief Executive Officer of Vial yVives-DSD | | | 1959 | | | | 2018 | | | | 2018 | |
Carlos Gómez Pinto | | Chief Audit Executive | | | 1961 | | | | 2018 | | | | 2018 | |
Javier Vaca Terron | | Regional Manager of Engineering and Construction | | | 1970 | | | | 2018 | | | | 2008 | |
Fernando Dyer Estrella | | Chief Risk and Compliance Officer | | | 1962 | | | | 2017 | | | | 2017 | |
Manuel Fernández Pollan | | Chief Executive Officer of Qualys/Chief of Information Technology | | | 1958 | | | | 2019 | | | | 2016 | |
Julia Sobrevilla Perea | | Corporate Affairs Offer | | | 1969 | | | | 2018 | | | | 2018 | |
The following sets forth selected biographical information for each of our executive officers:
Luis Francisco Díaz Olivero. Mr. Díaz joined the group in 1993, and has been our chief executive officer since March 2, 2017 and was our deputy chief executive officer from February to March 2, 2017. Before that, he served as chief operating officer since 2015, as infrastructure officer between April 2013 and December 2014, and as the chief executive officer of our subsidiary GMPUNNA Energía between 2011 and April 2013. He holds a degree in industrial engineering, and an MBA from the University of Pittsburgh. He also served as the deputy chief executive officer of GMPUNNA Energía from 2009 to 2011; chief financial officer of Graña y MonteroAENZA from 2004 to 2009; and chief financial officer of our subsidiary GyMCumbra from 2001 to 2004. He is a member of the boards of directors of GyM, GMPCumbra, UNNA Energía and Viva GyM.Viva.
Mónica Miloslavich HartDennis Gray Febres. Mrs. MiloslavichMr. Febres joined the group in 19932011 and has served as our chief financial officer since 2009. SheJuly 2020. He served as the chief financial officer of our infrastructure business unit from 2018 to 2020, and our head of corporate finance and investor relations from 2011 to 2018. Prior joining the group, he was a vice president and head of local debt capital markets at Citibank del Perú, and general manager of Citicorp Perú S.A., Sociedad Agente de Bolsa. He holds a degree in economics from the Universidad de Lima. She worked as chief financial officerdel Pacífico with concentration in Finance. Mr. Gray is also member of Grañthe board of directors of the several group subsidiaries, including Línea 1, UNNA Energía, y Montero Edificaciones S.A.C. from 1998 to 2004,Norvial and as chief financial officer of our subsidiary GyM from 2004 to 2009.La Chira.
Daniel Urbina Pérez. Mr. Urbina joined the group in 2018 as Chief Legal Officer. Before that, he served as general counsel for Inkia Energy since 2008, as vice president for Standard Chartered Bank between July 2005 and October 2008, as head of legal and compliance for Banco Standard Chartered between March 2000 and July 2005, as director general of the legal department for the Ministry of the Presidency between June 1999 and March 2000, as advisor to the Minister for the Advancement of Women between July 1997 and July 1998 and as associate for Benites Mercado & Ugaz between July 1993 and July 1998. He holds a law degree from the Universidad de Lima (Peru) and an LLM from Columbia University, and is authorized to practice law in Peru and New York.
Marlene Negreiros BardalesFernando Dyer Estrella. Mr. Dyer is the Chief Risk and Compliance Officer and Interim Chief Audit Executive of AENZA, and is responsible for our company’s Corporate Risk and Compliance Program. Fernando has more than 30 years of international experience in audit, finance, internal controls, governance, ethics, compliance and management at leading multinationals. His experience includes the design, implementation, management and leading international programs on risk assessment, code of conduct, whistle blower, due diligence, anticorruption, anti-money-laundering and international sanctions aimed to deter, detect and protect companies from crimes (focused on FCPA and UK Bribery Act). Mr. Dyer holds an MBA form Université de Genève (Switzerland), specialized in International Management, and a BA in Accounting from the Universidad del Pacífico (Peru). He is a Certified Anti-Money Laundering Specialist (CAMS) by the Association of Certified Anti-Money Laundering Specialists (USA), a Certified Corporate Compliance & Ethics Professional (CCEP) by the Society of Corporate Compliance and Ethics (USA), and an International Faculty of the International Training Compliance and International Compliance Association – ICT/ICA – (United Kingdom). Mr. Dyer speaks English, French and Spanish fluently.
Carlos Ochoa Febres. Mr. Ochoa joined the group in FebruaryAugust 2019 as Corporate Human Resources Officer.Infrastructure HR Manager. Before that, shehe served as Corporate Human Resources Officer in Gloria Group,Komatsu-Mitsui, and prior to that, shehe served as a Global Human Resources DirectorCorporate Talent Manager also in AJE Group. SheKomatsu-Mitsui. He holds a degree in business administrationIndustrial Engineering from Universidad Peruana de Ciencias Aplicadas, a Human Resources Business Partneran Executive MBA from PAD-Universidad de Piura, and an Executive HR program certification from Human Resources Certification Institute (HRCI), and a postgraduate certification in Human Resources from INCAE Executive Education and the MCDonoughRoss Business School of the University of Michigan.
Javier Vaca Terron. Mr. Vaca graduated as a Civil Engineer, Channels and Ports from the Universidad Politécnica de Madrid in 1996. He joined the Spanish company, Ferrovial Agroman, participating in the study of international works and directing the execution of projects in Madrid. In 2004, he completed an Executive MBA at IESE and joined Grupo Assignia as Director of International Production at the construction company, developing his work mainly in Latin America. In 2007, he was assigned new responsibilities within the Assignia group, as CEO of another group company, Eductrade, dedicated to foreign trade in the field of Health and Education. In 2014, he returned to the construction industry, this time directing the Business from Georgetown University.Development and Studies, Hiring and Institutional Relations Areas of the Spanish FCC. In 2016, he joined the OHL company as Southern Cone Zone Director, based in Santiago, Chile. In February 2018, he joined AENZA as Regional Manager of the Engineering and Construction area and now serves as Chief Executive Officer of Cumbra.
Antonio Cueto SacoFernando Dyer Estrella. Mr. CuetoDyer is the Chief Risk and Compliance Officer and Interim Chief Audit Executive of AENZA, and is responsible for our company’s Corporate Risk and Compliance Program. Fernando has more than 30 years of international experience in audit, finance, internal controls, governance, ethics, compliance and management at leading multinationals. His experience includes the design, implementation, management and leading international programs on risk assessment, code of conduct, whistle blower, due diligence, anticorruption, anti-money-laundering and international sanctions aimed to deter, detect and protect companies from crimes (focused on FCPA and UK Bribery Act). Mr. Dyer holds an MBA form Université de Genève (Switzerland), specialized in International Management, and a BA in Accounting from the Universidad del Pacífico (Peru). He is a Certified Anti-Money Laundering Specialist (CAMS) by the Association of Certified Anti-Money Laundering Specialists (USA), a Certified Corporate Compliance & Ethics Professional (CCEP) by the Society of Corporate Compliance and Ethics (USA), and an International Faculty of the International Training Compliance and International Compliance Association – ICT/ICA – (United Kingdom). Mr. Dyer speaks English, French and Spanish fluently.
Carlos Ochoa Febres. Mr. Ochoa joined the group in 1996 and has been our chief operating officer since 2017. Previously,August 2019 as Infrastructure HR Manager. Before that, he was our infrastructure area officer since January 2015. He formerly served as country managerCorporate Human Resources Officer in ChileKomatsu-Mitsui, and held different management positionsprior to that, he served as Corporate Talent Manager also in the group.Komatsu-Mitsui. He holds a degree in economicsIndustrial Engineering from Universidad Católica del Perú and has a Masters degree in business administration from Universidad del Pacífico. He also has master’s in management and finance from HEC (France). He is a director of our subsidiaries GMP, GyM Ferrovías, Norvial, La Chira, Concesionaria Vía Expresa Sur, Survial and GMI.
Rolando Ponce Vergara. Mr. Ponce joined the group in 1993 and has served as the chief executive officer of our subsidiary Viva GyM since 2008, and as our chief real estate area officer since 2014. He holds a degree in civil engineering from Universidad Ricardo Palma. He also holds a master’s degree in construction and real estate business management from Pontificia Universidad CatólicaPeruana de Chile-Politécnica de Madrid, Spain. He previously served as manager of GyM’s real estate division. He is currently a member of the boards of directors of our subsidiaries Viva GyM and Almonte.
Renato Rojas Balta. Mr. Rojas joined the group in 1995, and he has served as the chief executive officer of GyM since February 2014. Prior to that, he held the position of manager of GyM’s civil works division from 2010 to 2014, and of assistant manager of that same division from 2002 to 2010. He holds a degree in civil engineering from Pontificia Universidad Católica del Perú. In addition, he pursued a master’s in company management at Universidad de Piura. He is currently the chief executive officer of our subsidiary GyM.
Luis Fukunaga Mendoza. Mr. Fukunaga joined the group in 2002 and has been our roads concessions manager in the infrastructure area since October 2012. He also served as director of our subsidiaries Survial, Norvial, Concesionaria Vía Expresa Sur and Concar. In addition, he has held several management positions, including chief executive officer of Survial S.A and Concesión Canchaque S.A.C. He is a civil engineer with a degree from Universidad de Piura. He also completedCiencias Aplicadas, an MBA at ESAN with studies at Kenan Flagler Business School–University of North Carolina at Chapel Hill, and completed a financial management Program at Universidad de Piura. He is currently a director of our subsidiary GMI.
Reynaldo Llosa Martinto. Mr. Llosa joined the group in 2014, and has served as the chief executive officer of GMP since February 2014. He holds a degree in mechanical engineering from University of Houston, as well as anExecutive MBA from UniversidadPAD-Universidad de Piura. He has completed several technicalPiura, and executive programs, including certificate programs at Rice University and Northeastern Kelloggan Executive HR program certification from Ross Business School of Management. He served as the chief executive officer of BPZ Energy from 2010 to 2013. Prior to that, he had worked in Schlumberger for 25 years, the last 15 of which he spent in management positions.
Jorge Luis Izquierdo Ramirez. Mr. Izquierdo joined the group in 1999 and was appointed chief human resources management officer in December 2015. Prior to that, he was our chief operational excellence officer between 2011 and 2015. In addition, from 2011 to 2013, he worked as chief officer of the Learning Center (currently known as Academia), and had previously served as project management officer. He holds a degree in civil engineering from Pontificia Universidad Católica del Perú, and a master’s degree in construction management from University of California, Berkeley. He is currently a director of our subsidiary Concar.
Manuel Wu Rocha. Mr. Wu is a civil engineer from the Pontificate Catholic University of Peru and holds a master’s degree in business administration from the University of Piura, Peru. He joined the group in 2001, and acted as chief technical officer for the oil and gas, electricity, infrastructure and sanitation areas of GyM S.A. from 2003 until 2007. He became manager of purchases and logistics of GyM S.A. in 2007, and general manager of the consortium Lima Actividades Comerciales comprised by GyM S.A. and Aguas de Barcelona from 2009 until 2011. Since 2011, he has worked as chief executive officer of GyM Ferrovias S.A. Mr. Wu is currently Chief Executive Concessions Officer.
Mario Gálvez Abad. Mr. Gálvez joined the group in January 2017, assuming the Deputy General Manager of our subsidiary GyM Ferrovías. He holds a bachelor’s degree in economics with complementary studies in negotiation, project evaluation and credit risk. He has more than 15 years of experience in commercial and consumer banking. He served as general manager at Aeropuertos del Perú and also held the position of Administration and Finance Manager at the same company. He is currently a director of our subsidiary GyM Ferrovías.
Antonio Rodriguez Canales.Mr. Rodríguez joined the group in 1999, and has been our chief commercial officer from 2015 to 2017. He previously served as chief investment officer, from 2010 to 2014. Before that, he was the chief executive officer of Larcomar from 1999 to 2010. He also served as director of our subsidiaries CAM and GMD and is currently a director of our subsidiary Morelco. He holds a degree in accounting from Universidad de Lima, a master’s in business administration from ESAN, and a master’s in business administration from Birmingham Business School in the UK.
Alejandro Palma Jara. Mr. Palma joined Vial y Vives – DSD in June 2018 as Mining Commercial Manager, and was appointed as Interim General Manager in January 2019. He is a Construction Engineer (Chile) and holds a Masters in Civil Engineering in Geotechnical Engineering and Infrastructure from the University of Hannover (Germany), and has been recognized as well as aDiplom-Bau Ingenieur in Germany. He has over 34 years of national and international professional experience in construction, mining consulting and engineering. He is also a Qualified Person at the Registro Público de Personas Competentes en Recursos y Reservas Mineras of Chile. He was general manager at SRK Consulting Chile for 15 years, Board Director in Chile for 13 years, Board Director of SRK Consulting (Global) for 10 years, Board Director and Vice President of SRK Consulting (Argentina) for 7 years and Board Director of SRK Consulting (North America(USA-Canada-Mexico)) for 3 years. He was also, from July 2016 until February 2018, Vice President Mining Consulting for South America and Vice President for Ausenco Chile & Argentina. He was a key player introducing successfully in Chile the first double shield Tunneling Boring Machine TBM for the 7.9 Km long Tunnel Sur Los Bronces from Anglo American and worked as project director until the excavation was completed. He led directly the Prefeasibility Study for the 95 ktpd iron ore project Dominga (US$2.4 Billion), with more than 130,000 manhours with a scope from mine to port (including R&R estimation), and also led most of the large projects carried out at SRK for 15 years.
Sergio Morales Contreras. Mr. Morales joined the group in 2016, and has served as the chief executive officer of Adexus S.A since April 2017. He holds a degree in civil industrial engineer from Santiago of Chile University. He has completed several technical and executive programs. He served as commercial manager of Adexus from June 2016 to April 2017. Prior to that, he worked at American Movil Group for nine years and also at Unisys Company for 11 years. He is currently a director of Adexus.Michigan.
Javier Vaca Terron. Mr. Vaca graduated as a Civil Engineer, Channels and Ports from the Polytechnic University ofUniversidad Politécnica de Madrid in 1996. He joined the Spanish company, Ferrovial Agroman, participating in the study of international works and directing the execution of projects in Madrid. In 2004, he completed an Executive MBA master’s degree at IESE and joined Grupo Assignia as Director of International Production at the construction company, developing his work mainly in Latin America. In 2007, he was assigned new responsibilities within the Assignia group, as CEO of another group company, Eductrade, dedicated to foreign trade in the field of Health and Education. In 2014, he returned to the construction industry, this time directing the Business Development and Studies, Hiring and Institutional Relations Areas of the Spanish FCC. In 2016, he joined the OHL company as Southern Cone Zone Director, based in Santiago, Chile. In February 2018, he joined Graña y MonteroAENZA as Regional Manager of the Engineering and Construction Area.area and now serves as Chief Executive Officer of Cumbra.
Carlos Gómez Pinto. Mr. Gómez has worked for Seagrams, Coca-Cola, Merril Lynch and Pacific Exploration & Production, in various leadership positions including as a CFO, Vice President of Internal Audit, Corporate Governance, Risks, Compliance, and Corporate Finance Manager. His experience includes responsibilities for implementingre-engineering processes, identifyingnon-value added activities and helping departments change their structure and improve work process efficiency. Currently, Mr. Gomez is a senior executive of Graña y Montero as Corporate Internal Auditor. Mr. Gomez is a Licensed International Financial Advisor and board member of certain companies andnon-profit organizations. Mr. Gomez earned a bachelor’s degree in Economics at Rosario University, a top private university in Colombia. He also obtained a MBA from Southern New Hampshire University in the USA.
Fernando Dyer Estrella. Mr. Dyer is the Chief Risk and Compliance Officer and Interim Chief Audit Executive of Graña y Montero,AENZA, and is responsible for our company’s Corporate Risk and Compliance Program. Fernando has more than 30 years of international experience in audit, finance, internal controls, governance, ethics, compliance and management at leading multinationals. His experience includes the design, implementation, management and leading international programs on risk assessment, code of conduct, whistle blower, due diligence, anti-corruption,anticorruption, anti-money-laundering and international sanctions aimed to deter, detect and protect companies from crimes (focused on FCPA and UK Bribery Act). Mr. Dyer holds an MBA form Université de Genève (Switzerland), specialized in International Management, and a BA in Accounting from the Universidad del Pacífico (Perú)(Peru). He is a Certified Anti-Money Laundering Specialist (CAMS) by the Association of Certified Anti-Money Laundering Specialists (USA), a Certified Corporate Compliance & Ethics Professional (CCEP) by the Society of Corporate Compliance and Ethics (USA), and an International Faculty of the International Training Compliance and International Compliance Association – ICT/ICA – (United Kingdom). Mr. Dyer speaks English, French and Spanish fluently.
ManuealCarlos Ochoa Febres. Mr. Ochoa joined the group in August 2019 as Infrastructure HR Manager. Before that, he served as Corporate Human Resources Officer in Komatsu-Mitsui, and prior to that, he served as Corporate Talent Manager also in Komatsu-Mitsui. He holds a degree in Industrial Engineering from Universidad Peruana de Ciencias Aplicadas, an Executive MBA from PAD-Universidad de Piura, and an Executive HR program certification from Ross Business School of the University of Michigan.
Javier Vaca Terron. Mr. Vaca graduated as a Civil Engineer, Channels and Ports from the Universidad Politécnica de Madrid in 1996. He joined the Spanish company, Ferrovial Agroman, participating in the study of international works and directing the execution of projects in Madrid. In 2004, he completed an Executive MBA at IESE and joined Grupo Assignia as Director of International Production at the construction company, developing his work mainly in Latin America. In 2007, he was assigned new responsibilities within the Assignia group, as CEO of another group company, Eductrade, dedicated to foreign trade in the field of Health and Education. In 2014, he returned to the construction industry, this time directing the Business Development and Studies, Hiring and Institutional Relations Areas of the Spanish FCC. In 2016, he joined the OHL company as Southern Cone Zone Director, based in Santiago, Chile. In February 2018, he joined AENZA as Regional Manager of the Engineering and Construction area and now serves as Chief Executive Officer of Cumbra.
Antonio Cueto Saco. Mr. Cueto joined the group in 1996 and is currently the general manager of infrastructure. Antonio has held various positions in the group as director of the infrastructure area, country manager in Chile and director of operations in 2017. He has a degree in Economics from the Universidad Católica del Perú and a Master’s degree in Business Administration from the Pontifica Universidad del Pacífico (Peru). He also has a master’s degree in administration and finance from HEC (France).
Rolando Ponce Vergara. Mr. Ponce joined the group in 1993 and has served as the chief executive officer of our subsidiary Viva since 2008, and as our chief real estate area officer since 2014. He holds a degree in civil engineering from Universidad Ricardo Palma (Peru). He also holds a Master’s degree in construction and real estate business management from the Pontificia Universidad Católica de Chile-Politécnica de Madrid, Spain. He previously served as manager of Cumbra’s real estate division. He is currently a member of the boards of directors of our subsidiaries Viva and Almonte.
Reynaldo Llosa Martinto. Mr. Llosa joined the group in 2014, and has served as the chief executive officer of UNNA Energía since February 2014. He holds a degree in mechanical engineering from the University of Houston, as well as an MBA from the Universidad de Piura (Peru). He has completed several technical and executive programs, including certificate programs at Rice University and Northeastern Kellogg School of Management. He served as the chief executive officer of BPZ Energy from 2010 to 2013. Prior to that, he had worked in Schlumberger for 25 years, the last 15 of which he spent in management positions.
Manuel Wu Rocha. Mr. Wu is a civil engineer from the Pontificia Universidad Católica del Perú and holds a Master’s degree in business administration from the Universidad de Piura (Peru). He joined the group in 2001, and acted as chief technical officer for the oil and gas, electricity, infrastructure and sanitation areas of Cumbra from 2003 until 2007. He became manager of purchases and logistics of Cumbra in 2007, and general manager of the consortium Lima Actividades Comerciales comprised by Cumbra and Aguas de Barcelona from 2009 until 2011. Since 2011, he has worked as chief executive officer of Línea 1 S.A. Mr. Wu is currently Chief Executive Officer of Highway Concessions.
Mario Gálvez Abad. Mr. Gálvez joined the group in January 2017, assuming the Deputy General Manager of our subsidiary Línea 1. He holds a bachelor’s degree in economics with complementary studies in negotiation, project evaluation and credit risk. He has more than 15 years of experience in commercial and consumer banking. He served as general manager at Aeropuertos del Perú and also held the position of Administration and Finance Manager at the same company. He is currently a director of our subsidiary Línea 1.
Antonio Rodriguez Canales. Mr. Rodríguez joined the group in 1999, and is the Chief Executive Officer of Morelco, our Colombian construction subsidiary, since August 2018. He previously served as Chief Investment Officer from 2017 to 2018, as chief commercial officer from 2015 to 2017, and as a chief investment officer, from 2010 to 2014. Before that, he was the chief executive officer of Larcomar from 1999 to 2010. He also served as director of our subsidiaries CAM, GMD and Morelco. He holds a degree in accounting from the Universidad de Lima (Peru), a Master’s in business administration from ESAN, and a MBA degree from The Birmingham Business School in the UK.
Alejandro Palma Jara. Mr. Palma joined Vial y Vives – DSD in June 2018 as Mining Commercial Manager, and was appointed as Interim General Manager in January 2019. He was subsequently appointed regional manager of Cumbra Ingeniería engineering, a position he currently holds. He is a Construction Engineer (Chile) and holds a Master’s degree in Civil Engineering in Geotechnical Engineering and Infrastructure from the University of Hannover (Germany), and has been recognized as well as a Diplom-Bau Ingenieur in Germany. He has over 34 years of national and international professional experience in construction, mining consulting and engineering. He is also a Qualified Person at the Registro Público de Personas Competentes en Recursos y Reservas Mineras of Chile. He was general manager at SRK Consulting Chile for 15 years, Board Director in Chile for 13 years, Board Director of SRK Consulting (Global) for 10 years, Board Director and Vice President of SRK Consulting (Argentina) for 7 years and Board Director of SRK Consulting (North America (USA-Canada-Mexico)) for 3 years. He was also, from July 2016 until February 2018, Vice President Mining Consulting for South America and Vice President for Ausenco Chile & Argentina. He was a key player introducing successfully in Chile the first double shield Tunneling Boring Machine TBM for the 7.9 Km long Tunnel Sur Los Bronces from Anglo American and worked as project director until the excavation was completed. He led directly the Prefeasibility Study for the 95 ktpd iron ore project Dominga (US$2.4 Billion), with more than 130,000 man-hours with a scope from mine to port (including R&R estimation), and also led most of the large projects carried out at SRK for 15 years.
Manuel Fernández Pollan. Mr. Fernández joined the Group in December 2015 as chief executive officer of Adexus in Chile. He also served as director the Corporate Management of Services of GyM,Cumbra, is the President of Adexus and a director of CAM. Mr. Fernández holds a Bachelor’s degree in Industrial Engineering from the Polytechnic University ofUniversidad Politécnica de Madrid, an MBA from CEPADE in Madrid and a Master’s degree in Strategic Planning and Finance from IDE in Madrid. He has worked for 10 years at Emerson Network Power, the last three years as Vice President of Sales and Regional Operations of Latin America. Before that he was chief executive officer for the Andean Countries (Colombia, Ecuador, Venezuela and Peru). Previously he worked in the Telefónica group, occupying different positions in Spain and Latin America, the last two years in Peru as chief executive officer of Telefónica Servicios Compartidos and Vice President of Resources of Telefónica del Perú. Mr. Fernandez is currently a director of our subsidiary QUALYSQualys S.A., Adexus and Chief Information Technology.
Julia Sobrevilla Perea. Ms. Sobrevilla joined Graña y Montero in April 2018 as Corporate Affairs Officer. She joins Graña y Montero most recently from Coca-Cola Perú, where she was Public Affairs Director from 2012 to 2018. Before joining Coca-Cola Ms. Sobrevilla was Institutional Relations Manager at Grupo ACP, a Peruvian group dedicated to microfinance in Latin America. Prior to that, from 2002 to 2010 she was Country Representative for Population Services International, a Washington,DC-based not for profit, serving in Rwanda, Mexico and Mozambique. Previously she held several positions in MTV Networks and Nickelodeon Latin America from 1994 to 2001, based in Miami, Florida. She holds a Bachelors in Linguistics and Literature from the Pontificia Universidad Católica del Perú and completed Masters Courses in Communication at Stanford University. She sits on the board of SERNANP (Servicio Nacional de Areas Naturales Protegidas), Kunan and Premio Protagonistas del Cambio UPC.
Executive Commission
The Executive Commission is currently comprised by our Chief Executive Officer, Chief Operating Officer, and the Business Segment Executive Officer for each of the three segments, our Chief Financial Officer, our Chief Legal Officer, Public Affairs Officer, our Chief Human Resources Officer, our Chief Audit Executive, our Chief Risk and Compliance Officer and Corporate Information Technology Officer. The Executive Commission evaluates, at the management level, among other matters, our strategic plan, annual budget and annual investment plan.
Business Segments Executive Commission
The Business Segments Executive Commissions are comprised by the Business Segment Executive Officer and the CEOs of the companies in each of the relevant business segments. Each Business Segment Executive Commission evaluates the applicable business segment’s annual budget, finances and operations as well as a summary of the information discussed in the Executive Commission.
Kinship
None.
B. Compensation
Compensation of Directors and Executive Officers
Director compensation must be approved by a majority of shareholders at our annual shareholders’ meeting.
In 2018,2020, total compensation paid to our board of directors amounted to S/.2.62.51 million, including compensation paid to directors that serve on our subsidiaries’ board of directors. In 2018,2020, total compensation paid to our executive officers amounted to S/.23.820.16 million. See “Item 4.B Information on the Company—Business Overview—Regulatory Matters—Labor Regulations” for additional information on profit sharing regulatory requirements.
Neither we nor any of our subsidiaries have entered into any agreement that provides for any benefit or compensation to any director or senior executive upon expiration of his or her term or termination of employment. Under Peruvian law, unless we dismiss someone for justified cause, we are required to pay the dismissed employee (but not directors) 1.5x annual salary for every year with our company for a period not to exceed 12 years. We are not required to make such payments in the event of voluntary termination. Although we have no ongoing obligation to do so, in the past we have provided, and in the future we may provide, such benefits to our executive officers upon their retirement. We have not set aside or reserved any amounts to provide for pension, retirement or other similar benefits.
Executive Compensation Plan
We establish and pay executive compensation in compliance with applicable labor and tax regulations and corporate governance standards and in accordance with market conditions.
We establish pay scales taking into consideration executives’ responsibilities, including the degree of complexity of those responsibilities, power of decision-making and scope of supervision entrusted.
The fixed salary component of compensation is established for each position based on a pay scale. Fixed salary includes family allowance and cost of living payments, if applicable. We evaluate executives at least once a year to develop action plans in furtherance of continuously improving management performance.
The variable component of compensation is paid to executives and other employees for meeting specific goals, and is related both to his or her performance and our financial results. Variable compensation is typically paid as an annual incentive.
In addition, labor regulation establishes a mandatory profit sharing provision of 5% of our total annual taxable income, to be distributed among all employees, calculated based on a formula established by law that considers the days worked in the year and remuneration.
Our executives also receive additional benefits, typicallynon-pecuniary. The benefits granted include: (i) a vehicle owned and maintained by our company, with the purpose of facilitating transportation of executives in the performance of their functions; (ii) a fuel allowance to offset transportation costs in the performance of their functions; and (iii) an insurance policy, including work accident and high risk coverage.
In addition, we have established a plan for certain executives effective March 2013 that awards cash bonuses for the exclusive use of purchasing shares of our company or of our subsidiaries. The executive must agree to hold the shares for a specific period. If the executive is no longer employed with our company during such period, we are entitled to repurchase the shares at the original purchase price. This benefit is awarded at the discretion and subject to the approval of the Human Resource Management Committee of our board of directors.
C. Board Practices
Board Committees
We have four board committees comprised of members of our board of directors.
Audit and Process Committee
Our Audit and Process Committee is comprised of three directors, all of which are independent under the Exchange Act. The current members of our Audit and Process Committee are Mr. Pedro Pablo Errazuriz Domínguez, Mr. Manuel del RíoCarlos Rojas Perla (chairman of the committee); Mr. Miguel Angel Bazán García and Mr. Alfonso de Orbegoso.Juan Antonio Arrieta Ocampo. These directors have extensive business and economic experience in Peru. Mr. Manuel del RíoMiguel Angel Bazán García qualifies as an “audit committee financial expert” in accordance with NYSE independence standards and applicable SEC rules. Our Audit and Process Committee oversees our corporate accounting and financial reporting process. The Audit and Process Committee is responsible for:
reviewing the integrity of our financial statements and financial reports;
reviewing our financial statements;
evaluating our internal controls and procedures, and identifying deficiencies;
recommendingadvising the board of directors of its recommendation to our annual shareholders’ meeting regarding the appointment of our external auditors, determining their compensation, retention and oversight, and resolving any disagreements that may arise between management and our external auditors;
supervising and evaluating the external and internal audit processes;
appointing or removing the corporate audit manager;
evaluating our company’s compliance with the Board of Director’s internal regulation, as well as with general principles of corporate governance;
informing our board of directors regarding any issues that arise with respect to the quality or integrity of our financial statements, our compliance with legal or regulatory requirements, the performance and independence of the external auditors, or the performance of the internal audit function;
establishing procedures for the reception, retention and treatment of complaints regarding accounting, internal controls or other auditing matters, including the confidential, anonymous submission by our employees of concerns regarding questionable accounting or auditing matters;
independently engaging its own counsel and any other advisers it deems necessary to fulfill its functions; and
establishing policies and procedures topre-approve audit and permissiblenon-audit services.
The chief audit executive reports to this committee. Our board of directors has adopted a written charter for our Audit and Process Committee that is included in the Charter of the Board of Directors, which is available on our website atwww.granaymontero.com.pe. www.aenza.com.pe.
Human Resource ManagementTalent Committee
Our Human Resource ManagementTalent Committee is comprised of three directors, all of which are independent in accordance with NYSE independence standards. The current members of the committee are Mr. Rafael VenegasJuan Antonio Arrieta Ocampo (chairman of the committee), Mr. Pedro Pablo ErrázurizSantiago Hernando Pérez and Mr. Ernesto Balarezo.Esteban Vitón Ramirez. The Human Resource ManagementTalent Committee is responsible for:
reporting to our board of directors on the appointment and dismissal of senior executives;
advising the board of directors of its recommendations to the shareholders’ meeting on director appointments, determination of the number of directors, director compensation and appointment of directors to substitute exiting directors;
proposing the size and members of board committees to the board of directors;
reviewing and approvingproposing to the board of directors corporate goals and objectives relevant to CEO compensation, evaluating the CEO’s performance in light of those goals and objectives, and determining and approving CEO compensation;
establishing compensation arrangements for senior executives in accordance with the financial results of our company; proposing measures to ensure transparency in the remuneration of directors and senior executives;
evaluating and approving our human resources policies, including succession plans;
approving the appointment and termination of managers that report directly to the chief executive officer (other than managers that report functionally to the Risk and Compliance Committee and to the Audit Committee);
approving corporate policies related to compensation, succession, selection and retention of talent and the exceptions to such corporate policies;
evaluating the performance of the board of directors and of management on an annual basis;
reporting to our board of directors on matters regarding related party transactions that could result in a conflict of interest; establishing our social responsibility policies; and
appointing third-party independent compensation consultants, and establishing the compensation of and overseeing the third-party independent compensation consultants;
proposing candidates for the position of chief executive officer to the board of directors;
monitoring the internal image of the company and proposing to the board of directors measures to protect such image; and
approving organizational structures and restructuring or redeployment measures of human capital.
As a foreign private issuer, we are not required to maintain a compensation committee that complies with all of the U.S. laws and regulations and NYSE requirements applicable to U.S. issuers.
Our board of directors has adopted a written charter for our Talent Committee that is included in the Charter of the Board of Directors, which is available on our website at www.aenza.com.pe.
Strategy and Investment Committee
Our Strategy and Investment Committee is comprised of fourthree directors, withone of which is independent members under the NYSE independence standard, currently comprising the majority of the committee.standards. The current members of the committee are Mr. Augusto Baertl, Mr. Rafael Venegas and Mr. Ernesto Balarezo ValdezNicolas Bañados Lyon (chairman of the committee). Once appointed, the new member of our board of directors is expected to be appointed to this committee., Mr. Christian Laub and Mr. Antonio Carlos Valente da Silva.
The Strategy and Investment Committee is responsible for:
establishing our investment policies;
assessing the profitability of the company’s investments;
proposing to the board of directors the approval of the annual budget and the strategic plan;
proposing to the board of directors the approval of strategic guidelines;
approving and monitoring the liquidity plan and the capitalization or indebtedness of the company;
proposing to the board of directors the approval of equity contributions, mergers or acquisitions and any purchase or sale of companies or businesses;
approving our annual investment plan; and
analyzing the projects that would require an investment greater than US$5 million.
Our board of directors has adopted a written charter for our Strategy and Investment Committee that is included in the Charter of the Board of Directors, which is available on our website at www.aenza.com.pe.
Risk Compliance and SustainabilityCompliance Committee
Our Risk, Compliance and Sustainability Committee is comprised of fourthree directors, withtwo of which are independent members under NYSE independence standard, currently comprising the majority of the committee.standards. The current members of the committee are Mr. Alfonso de Orbegoso BaraybarChristian Laub (chairman of the committee), Mr. Augusto BaertlCarlos Rojas Perla and Mr. Manuel del Río. Once appointed, the new member of our board of directros is expected to be appointed to this committee.Miguel Grau Quinteros. The Risk Compliance and SustainabilityCompliance Committee is responsible for:
approving the structure, and evaluating the performance of the organization, in matters of risks and compliance;
approving the policies and limits of exposure to risk, monitoring the risk profile of our company, and supervising the development of the risks and compliance area;
identifying and monitoring the indicators of the company’s main risks;
approving compliance policies;
appointing and removing the corporate risk and compliance manager;
reviewing the testing of the controls performed by external audit;
reporting to the board of directors on the risk caused by associations with third parties;
ensuring that the company and its subsidiaries adopt adequate risk mitigants and implement business continuity and recovery plans;
proposing to the board of directors the adoption of crime prevention plans and the promotion of ethical conduct within the company;
informing the board of directors of any inconsistency between the company’s business strategy and its policies, and proposing plans to remediate any such inconsistencies;
monitoring the implementation of risk and compliance training programs;
ensuring compliance with our company’s policies, in particular with the anti-corruptionanticorruption policy and the sustainability policy, as well as with applicable laws. This committee can also propose policies, directives and/or complementary procedures that contribute to strengthening the responsible management of our company; and
supervising and reporting to our board of directors on social responsibility practices and management.
The Chief Risk and Compliance Officer reports to this committee.
Our board of directors has adopted a written charter for our Risk and Compliance Committee that is included in the Charter of the Board of Directors, which is available on our website at www.aenza.com.pe.
Operating Board Committees
We also have twothree operating board committees that meet monthly and are comprised of members of our board of directors, including at least one independent member under NYSE independence standards per committee. These committees supervise the management of our three business segments.
Engineering and Construction Committee
Our Engineering and Construction Committee supervises the operations of our E&C segment. The current members of the committee are Mr. Augusto BaertlSantiago Hernando Perez (chairman of the committee), Mr. Christian Laub and Mr. Alfonso de Orbegoso. Once appointed, the new member of our board of directors is expected to be appointed to this committee.Juan Antonio Arrieta Ocampo.
Infrastructure Committee
Our Infrastructure Committee supervises the operations of our Infrastructure segment. The current members of the committee are Mr. Rafael Venegas,Antonio Carlos Valente da Silva (chairman of the committee), Mr. Manuel del RíoNicolás Bañados Lyon and Mr. Pedro Pablo Errazuriz.Carlos Rojas Perla.
Real Estate Committee
Our Real Estate Committee supervises the operations of our Real Estate segment. The current members of the committee are Mr. Miguel Grau Quinteros (chairman of the committee), Mr. Esteban Viton Ramirez and Mr. Miguel Angel Bazán García.
D. Employees
We have developed an extensive and talented team, including more than 1,7002,000 engineers, which gives us the capability and scale to undertake large and complex projects. We also have access to a network of approximately 132,000117,000 manual laborers throughout Peru that can supplement our workforce when required by our projects. Moreover, we have the flexibility to engage our own workers on projects outside Peru, avoiding the need to seek new employees in other countries.
As of December 31, 2018,2020, we had a total of 11,89118,204 full-time employees, including approximately 4,27912,000 manual laborers, a number that fluctuates depending on our project backlog. At such date, we also worked with 2,5062,682 employees of subcontractors. Occasionally, we employ subcontractors for particular aspects of our projects, such as carpenters, specialists in elevator installation and specialists in glassworks. We are not dependent upon any particular subcontractor or group of subcontractors. As of December 31, 2018, 69%2020, 25.2% of our employees worked outside Peru. The following table sets forth a breakdown of our employees by category as of December 31, 2018.2020.
| Salaried Employees | | E&C | | | Infrastructure | | | Real Estate | | | Corporate | | | TOTAL | | | E&C | | | Infrastructure | | | Real Estate | | | Corporate(3) | | | TOTAL | |
Engineers | | | 1,229 | | | | 434 | | | | 29 | | | | 37 | | | | 1,729 | | | | 1,297 | | | | 357 | | | | 55 | | | | 330 | | | | 2,039 | |
Other Professionals | | | 480 | | | | 260 | | | | 33 | | | | 130 | | | | 903 | | | | 455 | | | | 266 | | | | 50 | | | | 236 | | | | 1,007 | |
Technical specialists | | | 1,070 | | | | 2,081 | | | | 42 | | | | 26 | | | | 3,219 | | | | 1,317 | | | | 544 | | | | 35 | | | | 306 | | | | 2,202 | |
Manual Laborers(1) | | | 4,279 | | | | — | | | | — | | | | — | | | | 4,279 | | | | 10,199 | | | | 1,715 | | | | — | | | | — | | | | 11,914 | |
Joint operation employees(2) | | | 1,627 | | | | 134 | | | | — | | | | — | | | | 1,761 | | | | 934 | | | | 108 | | | | — | | | | — | | | | 1,042 | |
Subtotal | | | 8,685 | | | | 2,909 | | | | 104 | | | | 193 | | | | 11,891 | | | | 14,202 | | | | 2,990 | | | | 140 | | | | 872 | | | | 18,204 | |
Subcontracted employees | | | 1,166 | | | | 1,340 | | | | — | | | | — | | | | 2,506 | | | | 1,814 | | | | 662 | | | | — | | | | 61 | | | | 2,537 | |
| | | | | | | | | | | | | | | | |
Total | | | 9,851 | | | | 4,249 | | | | 104 | | | | 193 | | | | 14,397 | | | | 16,016 | | | | 3,652 | | | | 140 | | | | 933 | | | | 20,741 | |
| | | | | | | | | | | | | | | | |
| (1) | The number of manual laborers, who form part of our network of approximately 132,000117,000 manual laborers, varies in relation to the number and size of projects we have in process at any particular time. |
| (2) | Includes engineers, professionals, technical specialists and manual laborers employed by our joint operations. |
| (3) | Includes the company, Adexus and our subsidiary Qualys S.A. |
The following chart sets forth the changes of our total employees fromas of December 31, 2015 to December 31, 2018.2018, 2019 and 2020.
Total Employees
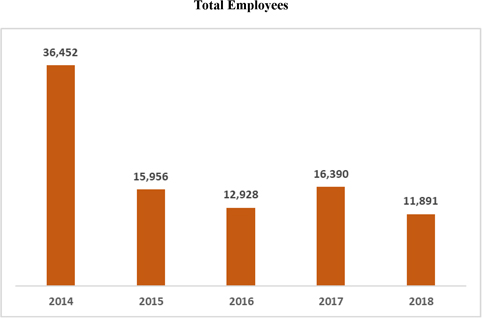
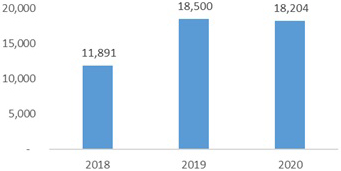
Our talent development system has allowed us to develop a team of professionals with the ability to design and implement sophisticated projects. Our talent management process broadly focuses on attracting, developing and training employees.
We have implemented programs to attract young and qualified candidates. Our “Cantera” Program offers various types of internships and training opportunities to engineering students and recent graduates, rewarding the most successful candidates with the opportunity to work as full-time, permanent employees. Our focus is not only to attract talented people but also to retain them.
Through our Graña y Montero Academy, we offer continuing education opportunities through a wide selection of courses and training programs targeted at each level. We believe the knowledge that our employees gain through these programs is reflected in the way they work and relate to our clients, adding value in every step. During 2018,2020, we invested more than US$0.36 million76,840 in continuing education, reaching approximately 341,802720,196 training hours for our employees.
We place significant emphasis on instilling our core corporate values of quality, professionalism, reliability and efficiency on our employees, and on promoting safety, environmental sustainability and social responsibility throughout the entire organization. Our Code of Conduct and Charter of Ethics regulate the conduct of our employees while promoting the foregoing values. In addition, our employees participate in ethics seminars on a periodic basis.
Substantially all of our manual laborers and some of our other employees are members of labor unions. Our practice is generally to extend the benefits we offer our unionized employees tonon-unionized employees. We consider our current relationship with unions to be positive.
In our E&C segment, collective bargaining agreements are negotiated at two levels: (i) on an annual basis between the National Federation of Civil Construction and the Peruvian Chamber of Construction, without our direct involvement; and (ii) on a per project basis directly between the unions and our project committees, in accordance with such annual agreement. In addition, some of our personnel in our gas processing plant belongs to the labor union Unicode Workers Union GMPUNNA Energía S.A. We currently have collective bargaining agreements with some of our gas processing plant workers. In the case of the operation and maintenance of our electricity infrastructure business, some of our personnel in CAM Perú are subject to a collective bargaining agreement. These collective bargaining agreements are negotiated on an annual basis.
Safety
We safeguard the health and safety of our employees and of all the persons present in our operations and services. To that end, we provide safe work conditions, we manage risks in a timely manner and we promote a culture of prevention, starting from the leadership and commitment of our senior management.
In 2018,2020, our company trained our top and middle management, collaborators and suppliers or subcontractors in security matters. During this period, we reported an accident incidence rate of 0.320.24 accidents for every 200,000 hours worked, remaining at a level similar to 2017.2019.
Our occupational health and safety management system in all of our subsidiaries (Chile, Peru and Colombia) areis certified by OHSAS 18001. We believe a safe job site contributes to our reputation and ability to gain new business while enhancing employee morale and reducing costs and exposure to liability.
Under our framework, we have provided over 143,00067,600 hours of training in risk prevention for managers and directors, more than 529,000361,600 hours of training for employees and nearly 326,000104,123 hours of training for subcontractors.] Additionally, to improve the leadership and commitment of our chain of command, these training sessions were complemented with periodic manager’s visits to projects, the establishment of annual safety goals based on the type of activity, the generation of opportunities to share lessons learned, and the monitoring of safety panels by our board of directors.
E. Share Ownership
As of March 31, 2019,2021, persons who are currently members of our board of directors and our executive officers held as a group 34,534,193 of our common shares. This amount represented 3.98% of our outstanding share capital as of such date.
Our directors and executive officers hold, in the aggregate, less than 1% of our outstanding share capital, with the exception of Carlos Montero, who owns 33,785,285 common shares, representing 3.87% of our outstanding share capital, through Bethel Enterprises.
shares. Our other directors and executive officers who in the aggregate hold less than 1% interest in our company are: Mr. Pedro Pablo Errázuriz,Christian Laub, Mr. Roberto Abusada,Nicolas Bañados, Mr. Luis Francisco Díaz Olivero, Mr. Antonio Rodríguez, Ms. Mónica MiloslavichCueto and Mr. Antonio Cueto.Rodríguez.
Our directors and executive officers do not have different voting rights.
We have established a plan for certain executives effective since March 2013 that awards cash bonuses for the exclusive use of purchasing shares of our company or of our subsidiaries. The executive must agree to hold the shares for a specific period. If the executive is no longer employed with our company during such period, we are entitled to repurchase the shares at the original purchase price. This benefit is awarded at the discretion and subject to the approval of the Human Resource ManagementTalent Committee of our board of directors.
ITEM 7. MAJOR SHAREHOLDERS AND RELATED PARTY TRANSACTIONS
ITEM 7. | MAJOR SHAREHOLDERS AND RELATED PARTY TRANSACTIONS
|
A. Major Shareholders
As of April 2, 2019,30, 2021, our issued and outstanding share capital was comprised of 871,917,855 common shares. The following table sets forth the beneficial ownership of our common shares as of April 2, 2019,30, 2021, based on information provided to us by CAVALI S.A. ICLV, the Peruvian clearing house (“CAVALI”) and The Bank of New York Mellon, as depositary for the holders of ADS, except as set forth below.
| | | | | | | | |
Shareholder | | Number of shares | | | Percentage owned | |
GH Holding Group(1) | | | 117,538,203 | | | | 13.48 | % |
Pacifico Corp S.A.C. | | | 87,191,786 | | | | 10.00 | % |
Fratelli Investment Limited(3) | | | 86,633,390 | | | | 9.94 | % |
AFP INTEGRA S.A. (Sura Group) | | | 72,296,726 | | | | 8.29 | % |
AFP PRIMA S.A. (Grupo Crédito) | | | 61,902,445 | | | | 7.10 | % |
Aberdeen Asset Management PLC(2) | | | 43,298,200 | | | | 4.97 | % |
AFP PROFUTURO S.A. (Grupo Scotiabank) | | | 38,751,338 | | | | 4.44 | % |
Bethel Enterprises Inc.(4) | | | 33,785,285 | | | | 3.87 | % |
The Bank of New York Mellon, as depositary for the holders of ADS(5) | | | 74,782,955 | | | | 8.58 | % |
Other Shareholders(6) | | | 255,737,527 | | | | 29.33 | % |
| | | | | | | | |
Total | | | 871,917,855 | | | | 100.00 | % |
| | | | | | | | |
| | | | | | | | |
| Shareholder | | Number of shares | | | Percentage owned | |
GH Holding Group(1) | | | 117,527,103 | | | | 13.48 | % |
AFP HABITAT | | | 94,648,278 | | | | 10.86 | % |
Pacifico Corp S.A.C.(2) | | | 87,191,786 | | | | 10.00 | % |
Fratelli Investment Limited(3) | | | 86,633,390 | | | | 9.94 | % |
AFP INTEGRA S.A. (Sura Group) | | | 67,265,514 | | | | 7.71 | % |
AFP PRIMA S.A. (Grupo Crédito) | | | 61,902,445 | | | | 7.10 | % |
The Bank of New York Mellon, as depositary for the holders of ADS(4) | | | 45,645,455 | | | | 5.24 | % |
Other Shareholders | | | 311,103,884 | | | | 35.68 | % |
| | | | | | | | |
Total | | | 871,917,855 | | | | 100.00 | % |
| (1) | GH Holding Group is owned by: (i) Enriqueta Graña Miró Quesada, with 30.0%; José Graña Miró Quesada, our former chairman, with 26.1%; Teresa Canepa Yori de Graña, with 26.1%; Maria Francisca Graña Canepa, with 6.0%; and Maria Teresa Graña Canepa, with 6.0%; and Luis Brahim, with 5.8%. |
| (2) | Based on filings on Schedule 13Fa Form 13G filed with the SEC on March 31, 2018.May 1, 2019. |
| (3) | Based on a Form 13G filed with the SEC on June 8, 2018.February 12, 2019. |
| (4) | Mr. Carlos Montero, through Bethel Enterprises Inc., indirectly owns 33,785,285 common shares, representing 3.87% of our outstanding share capital.
|
(5) | Excluding AFP PRIMA S.A., AFP INTEGRAPROFUTURO S.A., and Aberdeen Asset Management PLC, and Fratelli Investment Limited’sPLC’s beneficial ownership of our common shares as of DecemberMarch 31, 2018. |
(6) | Among other shareholders, the following directors and executive officers hold directly or indirectly common shares of our outstanding share capital: Mr. Roberto Abusada, a member of our board of directors, Mr. Pedro Pablo Errazuriz, a member of our board of directors, Mr. Luis Francisco Díaz Olivero, Chief Executive Officer, Ms. Mónica Miloslavich, our Chief Financial Officer, Mr. Antonio Rodríguez, Chief Investment Officer, and Mr. Antonio Cueto, Chief Operations Officer, hold in aggregate less than 1% of our outstanding share capital.2020.
|
As of December 31, 2018, 26April 30, 2021, 20 record holders of our common shares were located in the United States (including Bank of New York Mellon, as depositary for the holders of ADS), according to CAVALI.
Certain of our directors and executive officers directly or indirectly own shares of our subsidiaries:subsidiaries, none of which constitute 1% or more of the outstanding share capital of any such subsidiary: Mr. Renato Rojas, Chief Executive OfficerJose Luis Romero, Operations Manager of GyM,Cumbra, owns 108,854 common shares of GyM, representing 0.04% of its outstanding capital share;Cumbra and Mr. Rolando Ponce, Chief Executive Officer of Viva, GyM owns 1,111,690 shares of Viva GyM, representing 0.46% of its outstanding capital share; and Eduardo Villa Corta, chief executive officer of GMI, owns 108,854 shares of GyM, representing 0.0421% of its outstanding capital share, and 23,747 shares of GMI, representing 0.279%.
Additionally, on April 2, 2019, our company issued and sold 142,483,633 common shares pursuant to a private placement, of which: (i) 55,291,877 shares were paid in full and (ii) 87,191,786 shares were paid 50% with 50% to be paid by July 1, 2019. For more information, see “Item 5.—Liquidity and Capital Resources.”Viva.
The following table sets forth the changes in beneficial ownership of our common shares from December 31, 2016,2018, to December 31, 2018,2020, based on information provided to us by CAVALI and the depositary for the holders of ADS. ADS data as of December 31, 2016 and 2017 was provided by JPMorgan Chase Bank NA, as depositary. ADS data as of December 31, 2018 was provided by The Bank of New York Mellon, as depositary.depositary for the holders of ADSs.
| | | | | | | | | | | | | | | | | | | | | | | | |
| | | As of December 31, 2016 | | | As of December 31, 2017 | | | As of December 31, 2018 | |
| Shareholders | | No. of Shares | | | Percentage
Owned | | | No. of Shares | | | Percentage
Owned | | | No. of Shares | | | Percentage
Owned | |
GH Holding Group(1) | | | 117,538,203 | | | | 17.81 | | | | 117,538,203 | | | | 17.81 | | | | 117,538,203 | | | | 16.11 | |
AFP PRIMA S.A. | | | 4,387,824 | | | | 0.66 | | | | 74,011,175 | | | | 11.21 | | | | 61,902,445 | | | | 8.49 | |
IN-CARTADM (AFP Integra-Sura Group) | | | 38,384,976 | | | | 5.82 | | | | 72,223,691 | | | | 10.94 | | | | 72,296,726 | | | | 9.91 | |
PR-CARTADM (ProfuturoAFP-Grupo Scotiabank) | | | 36,968,166 | | | | 5.60 | | | | 23,136,533 | | | | 3.51 | | | | 38,751,338 | | | | 5.31 | |
Aberdeen Asset Management PLC(2) | | | 35,501,465 | | | | 5.38 | | | | 49,730,025 | | | | 7.53 | | | | 43,298,200 | | | | 5.94 | |
Bethel Enterprises Inc.(3) | | | 33,785,285 | | | | 5.12 | | | | 33,785,285 | | | | 5.12 | | | | 33,785,285 | | | | 4.63 | |
JPMorgan Chase Bank NA, as depositary for the holders of
ADS(4) | | | 229,683,570 | | | | 34.80 | | | | 96,482,855 | | | | 14.62 | | | | — | | | | — | |
The Bank of New York Mellon, as depositary for the holders of
ADS(5) | | | — | | | | — | | | | — | | | | — | | | | 75,050,020 | | | | 10.29 | |
| | | | | | | | | | | | | | | | | | | | | | | | |
| | | | | | | | | | | | | | | | | | | | | | | | |
| | | As of December 31, 2018 | | | As of December 31, 2019 | | | As of December 31, 2020 | |
Shareholders | | No. of Shares | | | Percentage
Owned | | | No. of Shares | | | Percentage
Owned | | | No. of Shares | | | Percentage
Owned | |
GH Holding Group(1) | | | 117,538,203 | | | | 16.11 | | | | 117,538,203 | | | | 13.48 | | | | 117,538,203 | | | | 13.48 | |
PACIFICO CORP S.A.C(2) | | | — | | | | — | | | | 87,191,786 | | | | 10.00 | | | | 87,191,786 | | | | 10.00 | |
FRATELLI INVESTMENTS LIMITED(3) | | | 72,454,772 | | | | 9.93 | | | | 86,633,390 | | | | 9.94 | | | | 86,633,390 | | | | 9.94 | |
IN-CARTADM (AFP Integra-Sura Group) | | | 72,296,726 | | | | 9.91 | | | | 72,296,726 | | | | 8.29 | | | | 68,357,336 | | | | 7.84 | |
AFP HABITAT S.A. | | | — | | | | — | | | | 30,581,677 | | | | 3.51 | | | | 65,795,596 | | | | 7.55 | |
AFP PRIMA S.A. | | | 61,902,445 | | | | 8.49 | | | | 61,902,445 | | | | 7.10 | | | | 61,902,445 | | | | 7.10 | |
The Bank of New York Mellon, as depositary for the holders of ADS(4)(5) | | | 75,050,020 | | | | 10.29 | | | | 88,254,945 | | | | 10.12 | | | | 62,943,030 | | | | 7.22 | |
| | | | | | | | | | | | | | | | | | | | | | | | |
| (1) | GH Holding Group is owned by: Enriqueta Graña Miró Quesada, with 30.0%; José Graña Miró Quesada, our former chairman, with 26.1%; Teresa Canepa Yori de Graña, with 26.1%; Maria Francisca Graña Canepa, with 6.0%; and Maria Teresa Graña Canepa, with 6.0%; and Luis Brahim, with 5.8%. |
| (2) | Based on filings on Schedule 13Fa Form 13G filed with the SEC on December 31, 2017.May 1, 2019. |
| (3) | Mr. Carlos Montero indirectly owns 33,785,285 common shares, representing 5.12% of our outstanding share capital, through Bethel Enterprises Inc.Based on Forms 13G filed with the SEC on February 12, 2019 and June 8, 2018.
|
| (4) | Excluding Aberdeen Asset Management PLC’s beneficial ownership of our common shares as of December 31, 2015 and December 31, 2016. As of December 31, 2017,2018, 2019 and 2020, excludes shares of Aberdeen Asset Management PLC, AFP PRIMA S.A. and AFP INTEGRA S.A.
|
| (5) | Depositary change reported through Form6-K filed on December 10, 2018. |
Our major shareholders do not have different voting rights.
In December 2018, our company issued and sold a total of 69,380,402 common shares through a combination of preemptive rights to the company’s existing shareholders and a private placement. On April 2, 2019 our company issued and sold 142,483,633 common shares pursuant to a private placement.
B. Related Party Transactions
Peruvian Law Concerning Related Party Transactions
Peruvian law sets forth certain restrictions and limitations on transactions with certain related parties.
Valuation: from a tax standpoint, the value of those transactions must be equal to the fair market value assessed under transfer pricing rules, i.e., the value agreed to bynon-related parties under the same or similar circumstances. Similarly, companies with securities registered in the Peruvian Public Registry of Securities (Registro Público del Mercado de Valores), such as us, are required to comply with the following rules:
The directors and managers of our company cannot, without the prior authorization of the board of directors, (i) receive in the form of a loan money or assets of our company; or (ii) use, for their own benefit or for the benefit of related parties, assets, services or credits of our company.
The execution of agreements that involve at least 5% of the assets of our company with persons or entities related to directors, managers or shareholders that own, directly or indirectly, 10% of the share capital, requires the prior authorization of the board of directors (with no participation of the director involved in the transaction, if any).
| | • | | The execution of agreements with a party controlled by our company’s controlling shareholder requires the prior authorization of the board of directors and an evaluation of the terms of the transaction by an external independent company (audit companies or other determined byResolución SMV N°N°029-2018-SMV-01). |
Independent review: the external independent company that reviews the transaction should not be related to the parties involved therein, nor to directors, managers or shareholders that own at least 10% of the share capital of such parties involved.
Terms and conditions: As a general policy, we do not enter into transactions with directors and executive officers on terms more favorable than what we would offer third parties. Any related party transaction we have entered into in the past has been in the ordinary course of business and on an arm’s length basis.
Approve and accounting: Article 30 of the internal regulations of our board of directors establishes a review procedure for identifying, approving and accounting for related party transactions. Related party transactions are defined as any transaction entered into by and among our company and any shareholder that owns 1% or more of our company’s or of our subsidiaries’ outstanding shares, directors, senior executives and persons related to them. The Risk, Compliance and Sustainability Committee is responsible for approving each such transaction considering market conditions and potential benefits for us and the related party. For ordinary course transactions carried out under market conditions, the authorization is delegated to the operations of the business line. For more information, see “Item 6. Directors Senior Management and Employees—Management.”
Related Party Transactions
We enter into certain related party transactions in the ordinary course of our business. No such transactions in effect during 2018 (other than the sale of Stracon GyM)2020 were material to our company or, to our knowledge, to any such related party, nor were any such transactions unusual in their nature or condition. Related party transactions with the following parties were in effect in 2018:
Our subsidiary Viva GyM paid a total of US$166,500 for advertising and publishing services to Editora El Comercio S.A., a company where Mr. José Graña Miró Quesada, the former Chairman of our Board of Directors and current shareholder, is a shareholder.
In April 2018, we sold our 87.59% interest in Stracon GyM for US$76.82 million to Stracon SAC, a company of which Steve Dixon, the former chief executive officer of Stracon GyM, holds 36.84%.
We signed a consulting agreement with Augusto Baertl, the Chairman of our Board of Directors, in the amount of US$124,000. The consulting agreement renews annually.
In September 2018, our subsidiary GyM signed loan agreements with Mr. Renato Eduardo Rojas Balta, chief executive officer of our subsidiary GyM, and members of his family, under which GyM borrowed an aggregate of US$319,820, at 10% interest, to pay tax debts of the company. In November 2018, GyM repaid these loans in full.
On January 30, 2019, an associated company of Viva GyM, Obratres SAC, sold to Antonio Rodriguez, chief executive officer of our subsidiary Morelco, three apartments in the JAUS—Barranco Project, for a total of US$696,000.
C. Interests of Experts and Counsel
Not applicable.
ITEM 8. FINANCIAL INFORMATION
ITEM 8. | FINANCIAL INFORMATION
|
A. Consolidated Statements and Other Financial Information.
See Item 18 of this annual report on Form20-F.
Legal and Administrative Proceedings
We may, from time to time, become subject to various legalOur company and administrative proceedings that are incidental to the ordinary conductcertain of our business. We are currently not party to any material legal or administrative proceedings, other than as described below. As of December 31, 2018, we had recorded provisions amounting to S/.84.7 million in connection with legal and administrative proceedings. See note 23 to our audited annual consolidated financial statements included in this annual report.
Two securities class action complaints have been filed against ussubsidiaries, and certain of our former directors and currentsenior management, have been charged in connection with criminal and former executive officerscivil investigations relating to certain of our projects in connection with our association with Odebrecht and in connection with our alleged participation in what is referred to as the Eastern District of New York during the first quarter of 2017. These complaints were consolidated into a single class action. The plaintiffs filed a consolidated amended compliant on May 29, 2018. We moved to dismiss the complaint during the fourth quarter of 2018. The court has not yet ruled on that motion, but has granted plaintiffs leave to file a further amended complaint. We continue to believe that we have meritorious defenses to the claims asserted, and we intend to defend ourselves vigorously in these matters.“construction club.”
TheLava Jato commission of
In 2018, the Peruvian Congress, which was formed in November 2016 and tasked with investigating the alleged bribes of Brazilian companies to Peruvian public officials, conducted congressional inquiries intocriminal prosecutor charged our company and otherour engineering and construction companiessubsidiary, Cumbra, as criminal defendants in Peru. Certain of our company’s former board membersconnection with the IIRSA South project concession (tranche II), and executive officers have been required to give testimony at hearings before the commission, during which they have affirmed thatPeruvian First National Preparatory Investigation Court (Primer Juzgado de Investigación Preparatoria Nacional) included our company was unawareand Cumbra in its criminal investigation. We appealed the court’s decision, but in October 2020, the court provided a formal indictment.
Separately, in connection with these investigations, in December 2018, the Peruvian First National Preparatory Investigation Court also resolved to include our company and Cumbra as civilly-responsible third parties in the investigations related to the IIRSA South project concession (tranche II) and Cumbra as a civilly-responsible third party in the investigations related to Tranches 1 and 2 of Odebrecht’s illicit activities.the Lima Metro. These proceedings are ongoing.
Peruvian prosecutors have included José Graña Miró Quesada, a shareholder and the former Chairman of our company, in an investigation for the crime of collusion, and Hernando Graña Acuña, a shareholder, a former board member of our company and former chairman of our subsidiary GyMCumbra, for the crime of money laundering against the Peruvian government, each in connection with the IIRSA South project concession (tranches II and III)(tranche II), in which we participated.participated with Odebrecht. Gonzalo Ferraro Rey, the former Chief Infrastructure Officer of our company, has also been included in an investigation for the crime of money laundering in connection with the same project.
In connection with investigations relating toaddition, José Graña and Hernando Graña, as well as Juan Manuel Lambarri, the IIRSA South project concession (tranches II and III), the Peruvian criminal prosecutor moved to chargeformer chief executive officer of our company and our construction subsidiary GyM, as criminal defendantsCumbra, have been charged in connection with the projects. In response, the Peruvian First National Preparatory Investigation Court (Primer Juzgado de Investigación Preparatoria Nacional) notified us of its decision to formally include our company and GyM in its criminal investigation. We appealed the court’s decision and, in June 2018, the First Court of Appeals of the Superior Court of Lima revoked the judicial order that indicted our company and GyM, among other corporate defendants, in the criminal investigation on charges of collusion and other crimes and rejected the petition, without prejudice, made by the prosecutor to incorporate both companies in the aforementioned process. Nevertheless, we cannot assure you that the criminal prosecutor will not file a new motion to charge our company and/or GyM or that our position will ultimately prevail if such motion is filed.
Separately, in December 2018, the Peruvian First National Preparatory Investigation Court resolved to include our company and GyM as civilly-responsible third parties in the investigations related to the IIRSA South project concession (tranches II and III) and GyM as a civilly-responsible third party in the investigations related to Tranches 1 and 2 of the Lima Metro. TheseMetro project. José Graña indicated in public statements to the media that he and Hernando Graña had initiated a process of plea bargaining with Peruvian prosecutors in respect of multiple projects in which our company participated with Odebrecht and in respect of the alleged “construction club.” This may include providing information related to wrongdoing or knowledge of improper behavior while they were at the company. We cannot assure you what they will ultimately say to government authorities, or that their statements will not adversely affect the company’s business.
INDECOPI initiated in 2017 investigations are ongoing.
In July 2017, media reports allegedregarding allegations that certain construction companies in Peru, Brazil and Spain, including our company,subsidiary Cumbra, colluded as a “construction club” to receive public contracts. AsOn February 11, 2020, INDECOPI provided notice that an administrative sanctions proceedings involving a resulttotal of these reports, INDECOPI initiated an investigation regarding the anti-competitive activities of35 construction companies, in Peru, including our company. In July 2017,subsidiary Cumbra, and 28 natural persons, was moving forward. On March 9, 2021, we were informed that the Peruvian government conductedTechnical Secretariat of INDECOPI’s Commission for the Defense of Competition issued a searchlengthy opinion report that recommended to the commission the imposition of administrative fines in connection with the proceedings, including S/103 million (US$27.4 million) for Cumbra. We reviewed the report together with our facilitiesadvisors, and on April 22, 2021, we filed a written reply with INDECOPI.
Management has estimated the value of the company’s contingencies related to these allegations. Separately,administrative proceedings may be approximately US$8 million (S/29 million), and established a former employeeprovision in this amount as of GyM has been included in a criminal investigation for collusion and other alleged crimes. In January 2018 criminal prosecutors conducted a search of our facilities regarding the “construction club” investigation. We have provided the information requested by the Peruvian criminal prosecutors. A former employee of GyM has been includedDecember 31, 2020 in the investigationcompany’s financial statements. INDECOPI’s Commission for collusionthe Defense of Competition is expected to issue a decision in first instance between the second and other alleged crimes. Inthird quarter of 2021. If a decision is reached, Cumbra may appeal before the INDECOPI’s internal tribunal, which tribunal would be the final arbiter of any administrative penalty. Although its decision may be judicially challenged, such challenge would not suspend the company’s obligation to pay any administrative fine imposed by INDECOPI or its tribunal.
Separately, in December 2018, GyMCumbra was formally included in this criminal investigation as a civilly-responsible third party, along with eleven other construction companies.
A convictioncompanies, in the criminal investigation conducted by a Peruvian public prosecutor based on facts similar to those under investigation by INDECOPI. In December 2019, the prosecutor criminally charged Cumbra and another of corruption or resolutions with government authorities may lead to criminalour subsidiaries, Concar, and civil finesother companies in the construction sector in Peru, as well as penalties, sanctions, injunctions against future conduct, profit disgorgement, disqualifications from directlya former director and indirectly engaging in certain typessenior management of business, the loss of business licenses or permitsour company, with collusion and other alleged crimes. For more information, see “Item 3.D. Key Information—Risk Factors—Risks Related to Key Developments— Investigations regarding potential corruption or other restrictions. Moreover, our involvement in corruption investigations, and any findings of wrongdoing in such investigations,illegal acts could further damage our reputation and have a material adverse impacteffect on our abilitybusiness, financial condition and results of operations.”
In December 2019, we entered into a preliminary settlement and cooperation agreement with the Peruvian anticorruption prosecutor and the ad hoc Peruvian state counsel. The agreement related to compete for business. Such investigations may also adversely affect our ability to pursue strategicof substantially all of the past projects and could potentially resultin which the company participated with Odebrecht (other than the Chavimochic project, which is not under investigation), as well as the company’s alleged participation in the termination or modification of certain existing contracts or relationships. Also, such investigations may affect our company’s ability“construction club” (excluding INDECOPI’s separate administrative proceedings). Although the Peruvian government undertook to secure financing in the future.enter into a final settlement and cooperation agreement within sixty business days, we have not reached a final agreement.
Since that time, the company has made significant progress in the negotiation of a final settlement and cooperation agreement, the terms of which remain under discussion with Peruvian authorities and are confidential. Although we are in advanced discussions with Peruvian authorities, we cannot assure you that an agreement will be reached in a timely manner, on expected terms or at all, and any agreement would be subject to further approval by the Peruvian court.
A class action civil lawsuit was filed in 2017 against our company and certain of our former directors and former and current executive officers in the United States. In February 2020, we executed a term sheet with the plaintiffs that provides the general terms and conditions for a final settlement agreement. On July 2, 2020, we executed a Stipulation and Agreement of Settlement formalizing the terms of the settlement. The settlement received preliminary approval from the court on August 18, 2020, but remains subject to final approval of the court. The settlement terms stipulate that the civil lawsuit will be fully and finally dismissed in exchange for a total settlement amount of US$20 million, of which the company is responsible for US$15 million, and the company recorded provisions of US$15 million as of December 31, 2020. The remaining US$5 million was paid by the company’s D&O insurers. The company made an initial payment of US$350,000 into the settlement fund escrow account in September 2020. The settlement terms stipulate that the remaining $14,650,000, plus interest of 5% per annum running from September 17, 2020, must be paid by the company by June 30, 2021. We have initiated discussions with the plaintiffs regarding a deferral of this payment, but we cannot assure you that an agreement will be reached. No members of the plaintiff class filed objections to the settlement prior to the November 24, 2020 deadline for such objections to be filed. On December 21, 2020, a magistrate judge held a hearing on the motion for final approval of the settlement, which final approval motion remains pending. If the court does not order final approval of the settlement, or the company fails to comply with the terms of the settlement, we would expect the lawsuit to resume.
In July 2020, our subsidiary Cumbra filed a complaint in Peru, in the amount of US$78 million, against Técnicas Reunidas for breach of contract in connection with the Talara refinery project. The complaint alleges, among other things, that Técnicas Reunidas failed to reimburse Cumbra for additional costs incurred as a result of an expanded scope of work. Técnicas Reunidas filed a counter-claim in the amount of US$81 million, claiming that Cumbra’s allegations lacked merit and that Cumbra breached its contract by abandoning work without cause. In addition, in connection with the proceedings, in December 2020, Técnica Reunidas enforced two letters of credit in the amount of approximately US$24 million that Banco Santander had issued on behalf of Cumbra, as security for an advance payment in connection with the project. Cumbra amended its claim to include the proceeds of those letters of credit, which amounts have been separately been converted into a loan payable from Cumbra to Banco Santander. See “—Indebtedness.”
Dividends and Dividend Policy
Dividend Policy
Our current dividend policy, adopted on March 29, 2016, is to distribute between 30% and 40% of the net profit from the preceding year, as long as we hold such net profit on a consolidated basis, subject to contractual restrictions on our indebtedness. Holders of our common shares are entitled to receive dividends on a pro rata basis in accordance with their respective number of shares held. Our dividend policy can be modified by a favorable vote of a majority of our shareholders and any changes become effective 30 days after approval. Dividends will not be distributed in advance.
Article 23 of ourby-laws establishes that dividends distribution must be approved by our shareholders during the annual shareholders’ meeting. The recommendation of our board of directors is required for the distribution of interim dividends, which must be subsequently ratified at a shareholders’ meeting.
Under Peruvian law, companies may distribute up to 100% of their profit (after payment of income tax) subject to a 10% legal reserve until the legal reserve equals 20% of the total value of their capital stock. According to Article 40 of the Peruvian Corporate Law, in order to distribute dividends, profits must be determined in accordance with the individual financial statements of our company.
Payment of Dividends
Dividends are paid to holders of our common shares as of a record date determined by us. In order to allow for the settlement of securities, under the rules of the Peruvian Securities Commission, investors who purchase shares of a publicly-held company three business days prior to a dividend payment date do not have the right to receive such dividend payment. Dividends on issued and outstanding common shares are distributed pro rata.
WeCertain of our debt or other contractual obligations may notrestrict our ability to pay any dividends until the common shares issued in our recent capital increase have been inscribed in the public registry and all such shares are paid in full. In addition,dividends. For example, we maywill not be able to make any dividend payments until all outstanding amounts under our syndicated loanthe Financial Stability Framework Agreement and our corporate guarantee of the GSP bridge loanCS Peru Infrastructure Loan have been repaid or discharged as the case may be, in full. For more information, see “Item 5.A. Operating and Financial Review and Prospects—Operating Results—Recent Developments.”
In addition, the indentures of the senior secured notes issued by GyM FerrovíasLínea 1 and the corporate bonds issued by Norvial contain respectively, certain customary covenants, including restrictions on our and our subsidiaries’ ability to pay dividends if we are in default under the agreement, and our medium term loan with Credit Suissethe corporate bonds of Cumbra imposes certain limitations in an event of default, on our abilitya limitation to Cumbra to distribute cash dividends. Seedividends to us. “Item 5.B. Operating and Financial Review and Prospects—Liquidity and Capital Resources—Indebtedness.”
Holders of common shares are not entitled to interest on accrued dividends. In addition, under Article 232 of the Peruvian Corporate Law, the right to collect accrued dividends declared by a publicly-held company expires ten years from the original dividend payment date.
Previous Dividend Payments
The following table sets forth the amounts of cashNo dividends were declared andor paid since 2015from 2018-2020 for our common shares.
| | | | | | | | |
| | | Dividends Paid | | | Per Share | |
| | | (in S/.) | |
2016 | | | 30,854,000 | | | | 0.046700000 | |
2017 | | | — | | | | — | |
2018 | | | — | | | | — | |
| B. | B. Significant Changes.
|
Except as disclosed in “Item 5. Operating and Financial Review and Prospects— Key Developments” and note 37 to our audited annual consolidated financial statements andincluded in this annual report, we have not experienced any significant changes since the date of our audited annual consolidated financial statements included in this annual report.
ITEM 9. THE OFFER AND LISTING
ITEM 9.A. | THE OFFER AND LISTINGOffer and Listing Details
|
A. Offer and Listing Details
Our ADSs
Our ADSs are listed on the NYSE under the symbol “AENZ.” On July 29, 2013, we completed our initial equity offering in the United States of 19,534,884 ADSs, representing 97,674,420 common shares. Our ADSs are listed on the NYSE under the symbol “GRAM.” On April 26, 2019,March 31, 2021, the closing price on the NYSE was US$3.52.31 per ADS. On May 17, 2018, the NYSE suspended the trading of our ADSs and commenced proceedings to delist our company. Our company appealed the decision. From May 21, 2018 until July 5, 2018, our ADSs were available for trading on theover-the-counter (OTC) market in the United States. On Friday, July 6, 2018, trading of our ADSs resumed on the NYSE.
On November 2, 2020, the annual shareholders’ meeting of the Company approved the change of the Company’s name from Graña y Montero S.A.A. to AENZA S.A.A. Effective November 12, 2020, our common shares and ADSs were tradeable on the Lima Stock Exchange and the NYSE, under the ticker symbols “AENZ” and “AENZAC1”, respectively.
Our Common Shares
Our common shares are registered in the Public Registry of Securities held with the Peruvian Securities Commission and are listed on the Lima Stock Exchange under the symbols “GRAMONC1”symbol “AENZAC1”. On April 26, 2018,March 31, 2021, the closing price on the Lima Stock Exchange was S/.2.201.80 per common share. As of DecemberMay 31, 2018, 282021, 20 record holders of our common shares were located in the United States, according to CAVALI.
B. Plan of Distribution
Not applicable.
C. Markets
Trading in the Peruvian Securities Market
Lima Stock Exchange
As of the day of this annual report, there were 271267 companies listed on the Lima Stock Exchange. Established in 1970, the Lima Stock Exchange is Peru’s only securities exchange. On November 19, 2003, the members of the Lima Stock Exchange approved to convert its corporate status to a publicly held corporation. As of March 31, 2021, the day of this annual report, Lima Stock Exchange had a share capital of S/.182,092,340,182,092,340, divided into 173,659,481 class “A” shares and 8,432,859 class “B” shares of par value S/.1.001.00 each. Class “A” shares are entitled to one vote per share while class “B” shares do not have voting rights.
Trading on the Lima Stock Exchange is primarily done on an electronic trading system that became operational in August 1995. From the second Sunday of March through the first Sunday of November of each year, trading hours are Monday through Friday (except holidays) as follows: 8:20a.m.-8:30 a.m.(pre-market ordering); 8:30a.m.-2:52 p.m. (trading); 2:52p.m.-3:00 p.m. (after-market sales); and 3:02p.m.-3:10 p.m. (after-market trading). At all other times, trading hours are from Monday to Friday (except holidays) as follows: 9:00a.m.-9:30 a.m.(pre-market ordering); 9:30a.m.-3:55 p.m. (trading); 3:55p.m.-4:00 p.m. (after-market sales); and 4:00p.m.-4:10 p.m. (after-market trading).
Substantially all of the transactions on the Lima Stock Exchange are traded on the electronic system. Transactions during the electronic sessions are executed through brokerage firms and stock brokers on behalf of their clients. Brokers submit orders in the order in which they are received. The orders must specify the type of security as well as the amount and price of the proposed sale or purchase. In order to control price volatility, the Lima Stock Exchange imposes a15-minute suspension on trading when the price of a security varies on a single day by more than 15% for Peruvian companies and 30% fornon-Peruvian companies.
Certain information regarding trading on the Lima Stock Exchange is set forth in the table below:
| | | | | | | | | | | | | | | | | | | | |
| | | 2014 | | | 2015 | | | 2016 | | | 2017 | | | 2018 | |
Market capitalization (in millions of soles)(1) | | | 360,960 | | | | 309,412 | | | | 416,787 | | | | 526,841 | | | | 481,081 | |
Volume (in millions of soles) | | | 17,301 | | | | 12,001 | | | | 15,342 | | | | 29,022 | | | | 20,975 | |
Average daily trading volume (in millions of soles) | | | 69 | | | | 48 | | | | 61 | | | | 116 | | | | 84 | |
| | | | | | | | | | | | | | | | | | | | |
| | | 2016 | | | 2017 | | | 2018 | | | 2019 | | | 2020 | |
Market capitalization (in millions of soles)(1) | | | 416,787 | | | | 526,841 | | | | 481,081 | | | | 537,389 | | | | 599,918 | |
Volume (in millions of soles) | | | 15,342 | | | | 29,022 | | | | 20,975 | | | | 18,154 | | | | 20,942 | |
Average daily trading volume (in millions of soles) | | | 61 | | | | 116 | | | | 84 | | | | 72 | | | | 82 | |
| (1) | End-of-period figures for trading on the Lima Stock Exchange. |
The stock market capitalization of companies listed on the Lima Stock Exchange was US$142.4165.5 billion at the end of 2018,2020, compared to US$120.8124.0 billion, US$90.7162.4 billion, US$124.0142.4 billion and US$162.4162.0 billion at the end of 2014, 2015, 20162017, 2018, 2019 and 20172020, respectively.
Total market volume in 20182020 was US$6.25.7 billion, reflecting a 30.59% decrease5.0% increase compared with 2017.2019. Equity market volume, which represented 54.7%65.25% of total market volume, ended the 2020 year at US$3.43.8 billion, 46.1% lower4.8% higher than the previous year. The repo market, which represented 11.2%8.60% of total market volume, reported volume of US$694.0496.7 million in 2018,2020, reflecting a decrease of 0.59%10.27%.
The total number of operations in the market in 2018 decreased2020 increased by 28.3%28.68%, closing the year at 113,828114,976 operations. The number of operations in the equity market in 2018 decreased2020 increased by 30.6%34.7% to 102,503107,883 operations.
In 2015,2020, the S&P/BVL Peru General Index (Índice S&P/BVL Peru General) reached 9,84920,822.15 points, decreasing 33.4%increasing 1.4% compared to 2014.2019. In 2016,2019, it reached 15,56720,526.13 points, increasing 58.1%6.1% compared to 2015.In 2017, it reached 19,974 points, increasing 28.3% compared to 2016. In2018, and in 2018, it reached 19,35019,350.40 points, decreasing 3.1% compared to 2017.
Regulation of the Peruvian Securities Market
The regulatory framework for the Peruvian securities market is established in the Securities Market Law approved by Legislative Decree No. 861, whose unified sole text was enacted by Supreme Decree No.093-2002-EF, as amended (Ley del Mercado de Valores), and the resolutions issued from time to time by the Peruvian Securities Commission. The purpose of the Securities Market Law is to promote the ordered development and transparency of the Peruvian securities markets and provide adequate protection for investors and the principles under which the Peruvian securities market is intended to operate. The Securities Market Law contains the general rules for: (i) primary and secondary public offerings of securities; (ii) public offering of securities for acquisitions and sales; (iii) local and international offerings, including simultaneous offerings; (iv) the Public Registry of Securities (Registro Público del Mercado de Valores); (v) reporting obligations of material information (hechos(hechos de importancia)importancia) by the issuers of securities recorded in the Public Registry of Securities and by the entities that are subject to the regulation and supervision of the Peruvian Securities Commission; (vi) the enforcement of insider trading; (vii) privileged information and confidentiality regulations and prohibitions against
price manipulation; (viii) the broker-dealers; (ix) the Lima Stock Exchange; (x) CAVALI (the settlement and registry entity for transactions executed on the Lima Stock Exchange); (xi) other entities that are required to be registered at the Peruvian securities market Public Registry of Securities; (xii) capital market instruments and operations, including securitizations; and (xiii) mutual funds and investments funds publicly placed and their respective management companies.
The Peruvian securities market is regulated and supervised by the Peruvian Securities Commission (Superintendencia dedel Mercado de Valores), a governmental entity reporting to the Peruvian Ministry of Economy and Finance, with functional, administrative, economic, technical and budgetary autonomy. The Peruvian Securities Commission is governed by the Superintendent, designated by the Peruvian Ministry of Economy and Finance, and by a five-member board of directors convened by the Superintendent (who acts as Chairman of the board). The other four members are appointed by the government under applicable legislation. The Peruvian Securities Commission issues from time to time resolutions which provide specific regulations or may impose sanctions in cases of violations of the Securities Market Law or the resolutions issued by the Peruvian Securities Commission.
The Peruvian Securities Commission, in order to achieve the Securities Market Law´sLaw’s purposes, has broad regulatory and supervisory powers, including (i) issuing general mandatory rules; (ii) supervision and oversight of compliance with applicable legislation (including the power to order inspections and require the submission of information and documentation by entities that are under its jurisdiction and summon and interrogate any person that may contribute to its investigations); (iii) imposing sanctions; (iv) managing the Peruvian securities market public registry; (v) verifying that public offerings meet filing requirements and that the securities subject to such offerings are duly recorded at the Peruvian securities market public registry of securities; (vi) authorizing the incorporation and functioning of entities under its scope of supervision; and (vii) monitoring the content and accuracy of the financial and other information that is filed with the Peruvian Securities Commission. The Peruvian Securities Commission is responsible for the enactment, interpretation and enforcement of rules and regulations issued under the Securities Market Law.
Disclosure Obligations
Issuers of securities registered with the Peruvian Securities Commission are required to disclose material information relating to the issuer. Pursuant to the Securities Market Law and relevant regulations enacted thereunder, all material information in connection with the issuer of registered securities (such as our common shares), its activities or securities issued or secured by such issuer which may influence the liquidity or price of such securities must be disclosed. Accordingly, issuers must file with the Peruvian Securities Commission mainly two types of information: (i) financial information, including unaudited interim financial statements on a quarterly basis (which are not required to be subject to limited review by external auditors), and audited annual consolidated financial statements on an annual basis, and (ii) material information relating to the issuer and its activities that may significantly affect the price, offering or trading of the issued securities, and in general, all the information that may be relevant for investors to be able to make investment decisions.
In order to comply with the foregoing disclosure obligations, issuers must disclose information to the Peruvian Securities Commission and, if the securities are listed, with the Lima Stock Exchange as soon as practicable but not later than the day on which the event took place or the issuer became aware of such information.
| D. | D. Selling Shareholders
Not applicable.
E. Dilution
Not applicable.
F. Expenses of the Issue
|
Not applicable.
ITEM 10.E. | ADDITIONAL INFORMATIONDilution
|
A. Share Capital
Not applicable.
B. Memorandum and Articles of Association
Set forth below is certain information relating to our share capital, including brief summaries of certain material provisions of our bylaws, Peruvian Corporate Law and certain other laws and regulations of Peru, all as in effect as of the date hereof.
General
We are a publicly-held corporation under Peruvian Corporate Law and registered with the Public Registry of Corporations in Lima. We are listed on the Lima Stock Exchange and the NYSE.
Ourby-laws provide that our principal corporate purposes are to engage in any and all activities related to the construction and real estate businesses; to provide services related to the mining and hydrocarbons industries; to participate in all stages of development of public services and other infrastructure concessions; and to provide management and corporate services to related and third parties. In addition, our company can realize investments and corporate transactions, including the acquisition, holding and transfer of securities of Peruvian and foreign companies.
Shareholders’ Liability
Under Peruvian Corporate Law, holders of our common shares cannot vote on matters with respect to which they have a conflict of interest.
Under Article 133 of the Peruvian Corporate Law, a shareholder must abstain from voting when faced with a conflict of interest. A resolution approved in disregard of this provision may be challenged under Article 139 of the Peruvian Corporate Law and the shareholders that participated in the determination in breach of this provision, if their vote was key in attaining the required majority, may be held jointly liable.
Redemption and Rights of Withdrawal
Under Article 200 of the Peruvian Corporate Law, holders of our common shares have redemption rights if: (i) we change our corporate purpose; (ii) a change occurs in the place of organization to a foreign country; or (iii) any transformation, merger or significantspin-off occurs with respect to our company.
Preemptive and Accretion Rights
If we increase our share capital, holders of our common shares have the right to subscribe to new common shares on a pro rata basis. Holders of common shares have preemptive rights in order to maintain their share interest in our share capital, unless the capital increase (i) results from a conversion of debt to common shares, (ii) is approved by shareholders representing at least 40% of the subscribed voting shares provided that the capital increase does not favor, directly or indirectly, certain shareholders to the detriment of others, or (iii) results from a corporate reorganization.
Shareholders who are in default of any payments relating to subscribed but unpaid shares may not exercise their preemptive rights.Not applicable.
Voting Rights and Dividends
Holders of common shares are entitled to one vote per share, with the exception of the election of the board of directors, where each holder is entitled to one vote per share per nominee. Each holder’s votes may be cast for a single nominee or distributed among the nominees at the holder’s discretion. To that effect, each of our common shares gives the holder the right to as many votes as there are directors to be elected. Shareholders may pool votes in favor of one person or distribute them among various persons. Those candidates for the board who receive the most votes are elected directors. Holders of common shares may attend and vote at shareholders’ meetings either in person or through a proxy.
Holders of common shares have the right to participate in the distribution of dividends and shareholder equity resulting from liquidation. Ourby-laws do not establish a maximum time limit for the payment of the dividends. However, according to Article 232 of the Peruvian Corporate Law, the right to collectpast-due dividends in the case of companies that are publicly held companies, such as ours, expires ten years after the date on which the dividend payment was due.
Our share capital may be increased by a decision of holders of common shares at a shareholders’ meeting. Capital reductions may be voluntary or mandatory and must be approved by holders of common shares at a shareholders’ meeting. Capital reductions are mandatory when accumulated losses exceed 50% of the capital and to the extent such accumulated losses are not offset by accumulated earnings and capital increases within the following fiscal year. Capital increases and reductions must be communicated to the Peruvian Securities Commission, the Lima Stock Exchange and the Peruvian tax authority (SUNAT). Voluntary capital reductions must also be published in the official gazette El Peruano and in a widely circulated newspaper in the city in which we are located.
Liquidation Rights
If we are liquidated, our shareholders have the right to receive net assets resulting from the liquidation, after we comply with our obligation to pay all our creditors and after discounting any existing dividend liabilities. For this reason, we cannot assure that we will be able to reimburse 100% of the book value of the common shares in case of bankruptcy or liquidation.
Ordinary and Extraordinary Meetings
Pursuant to Peruvian Corporate Law and ourby-laws, the annual shareholders’ meeting must be held during the three-month period after the end of each fiscal year. Additional shareholders’ meetings may be held during the year. Because we are a publicly-held corporation, we are subject to the special control of the Peruvian Securities Commission, as provided in Article 253 of the Peruvian Corporate Law. If we do not hold the annual shareholders’ meeting during the three-month period after the end of each fiscal year or any other shareholders’ meeting required by ourby-laws, a public notary or a competent judge shall call for such a meeting at the request of at least one shareholder of the common shares. Such meeting will take place within a reasonable period of time.
Pursuant to the Peruvian Corporate Law, other shareholders’ meetings are convened by the board of directors when deemed convenient by our company or when it is requested by notarized letter by the holders of at least 5% of our common shares which voting rights are not suspended according to Peruvian Law. Pursuant to section 255 of the Peruvian Corporate Law, if the board expressly or implicitly refuses to convene the shareholders’ meeting, a notary public or a competent judge will call for such meeting at the request of holders of at least 5% of our common shares. If a notary public or competent judge calls for a shareholders’ meeting, the place, date and hour of the meeting, the agenda, the person who will preside the meeting and the notary public who will certify the resolutions of the meeting shall be indicated in the meeting notice. If the meeting called is other than the annual shareholders’ meeting or a shareholders’ meeting required by the Peruvian Corporate Law or theby-laws, the agenda will contain those matters requested by the shareholders who requested the meeting.
Notices of Meetings
Since we are a publicly-held corporation, notice of shareholders’ meetings must be given by publication of a notice. The publication shall occur at least 25 days prior to any shareholders’ meeting in the Peruvian Official Gazette, El Peruano, and in a widely circulated newspaper in the city in which we are located.
Quorum and Voting Requirements
According to Article 33 of ourby-laws and Article 257 of the Peruvian Corporate Law, shareholders’ meetings called for the purpose of considering a capital increase or decrease, the issuance of obligations, a change in theby-laws, the sale in a single act of assets with an accounting value that exceeds 50% of our share capital, a merger, division, reorganization, transformation or dissolution, are subject to a first, second and third quorum call, with each of the second and third quorum call to occur upon the failure of the preceding one. A quorum for the first call requires the presence of shareholders holding 50% of our total common shares. For the second
call, the presence of shareholders holding at least 25% of our total common shares is adequate, while for the third call there is no quorum requirement. These decisions require the approval of the majority of the common shares represented at the shareholders’ meeting. Shareholders’ meetings convened to consider all other matters are subject to a first and second quorum call, with the second quorum call to occur upon the failure of the first quorum.
In accordance with Peruvian Corporate Law, only those holders of common shares whose names are registered in our company’s stock ledger not less than 10 days in advance of a meeting will be entitled to attend the shareholders’ meeting and to exercise their rights.
Limitations on the Rights ofNon-Residents or Foreign ShareholdersITEM 10. ADDITIONAL INFORMATION
There are no limitations under ourby-laws or Peruvian Corporate Law on the rights ofnon-residents or foreign shareholders to own securities or exercise voting rights with respect to our securities.
Not applicable.
Disclosure of Shareholdings and Tender Offer Regulations
| B. | Memorandum and Articles of Association |
Disclosure of Shareholdings
There are no provisions in ourby-laws governing the ownership threshold above which share ownership must be disclosed.
However, according to Article 10 of CONASEV Resolution Nº090-2005-EF-94.10, as amended, we must inform the Peruvian Securities Commission of the members of our economic group, comprised by our subsidiaries, and a list of our holders of common shares owning more than a 5% share interest, as well as any change to such information.
Tender Offer Regulations
Peruvian securities regulations include mandatory takeover rules applicable to the acquisition of control of a publicly held company.
Subject to certain conditions, such regulations generally establish the obligation to launch a tender offer when a person or group of persons acquires a significant interest in a publicly held company. According to the provisionsThe information set forth in CONASEV Resolution No.009-2006-EF-94.10, a person acquires a significant interest in a listed company when such person (i) holds or has the powerExhibit 10.05, “Description of Securities Registered Pursuant to exercise directly or indirectly 25%, 50% or 60%Section 12 of the voting rights in a listed company, or (ii) has the power to appoint or remove the majority of the board members or to amend itsby-laws.
A tender offer may be launched prior or following an acquisition of the significant interest. The tender offer may be launched after the “significant interest”Exchange Act” is acquired if it is acquired (i)incorporated herein by means of an indirect transaction, defined as a relevant acquisition or interest increase through the acquisition of securities issued by a company that in turn holds share capital of the target company; (ii) as a consequence of a public sale offer, or (iii) in no more than four transactions within a three-year period.
This mandatory procedure has the effect of alerting other shareholders and the market that an individual or financial group has acquired a significant percentage of a company’s voting shares, and gives other shareholders the opportunity to sell their shares at the price offered by the purchaser. The purchaser is required to launch a tender offer unless: (i) shareholders representing 100% of the voting rights consent in writing, (ii) voting shares are acquired by a depositary in order to subsequently issue ADSs, or (iii) voting shares are acquired pursuant to the exercise of preemptive rights.
Changes in Capital
Ourby-laws do not establish special conditions to increase or reduce our share capital beyond what is required under Peruvian Corporate Law.
Anti-Takeover Provisions
Ourby-laws do not contain any provision that would have the effect of delaying, deferring or preventing a change of control.
Board of Directors
For additional information regarding our board of directors, see “Item 6. Directors, Senior Management and Employees—Directors and Senior Management.”
Form and Transfer
Common shares may be either physical share certificates in registered form or book-entry securities in the CAVALI S.A. ICLV book-entry settlement system also in registered form. Furthermore, in the case of shares represented in book entries, the issuance of new shares which result from share splits or similar corporate events must also be represented in said form.
Furthermore, the Peruvian Corporate Law forbids publicly-held corporations, such as us, from including in theirby-laws stipulations limiting the transfer of their shares or restraining their trading in other ways. According to Article 18 of ourby-laws, we cannot recognize a shareholders’ agreement that contemplates limitations, restrictions or preferential rights on the transfer of shares, even if such an agreement is recorded in our stock ledger (matrícula de acciones) or in CAVALI. As of the date of this annual report, no shareholders’ agreement is recorded in our stock ledger.
Arbitration
Ourby-laws include an arbitration clause applicable to disputes arising from the interpretation of our bylaws or Peruvian Corporate Law and their complementary provisions, among our company, our management and our shareholders. Any such arbitration will be subject to the regulations of the Arbitration Center of the Lima Chamber of Commerce. The material terms of the arbitration clause are as follows:reference.
| C. | any dispute, controversy or claim arising out of the performance and the interpretation of theby-laws and any action or remedy set forth in the Peruvian Corporate Law (Ley General de Sociedades) among us, our current or former shareholders and/or our current or former management shall be settled by arbitration;
any dispute, controversy or claim between us and a third party shall be also settled by arbitration, if agreed upon by all parties either expressly or tacitly;
arbitrations shall be conducted before a panel of three arbitrators;
arbitrators shall consider only the applicable law for their award (arbitration in law and not arbitration in equity);
each party to a dispute shall appoint an arbitrator within 10 business days from receiving the notice of arbitration. The two selected arbitrators shall appoint the third arbitrator. If one of the parties fails to appoint its arbitrator within 10 business days, the Center of Arbitration of the Lima Chamber of Commerce shall appoint the arbitrator;
the rules of the Center of Arbitration of the Lima Chamber of Commerce shall apply to the arbitration; and
the arbitration clause is not applicable to the cases that must be submitted to the jurisdiction of the courts or of the Superintendencia del Mercado de Valores, such as when arbitration would present hardship to minority shareholders or when Peruvian law otherwise requires it.
The arbitration clause does not apply to claims based on violations of U.S. securities laws.
C. Material Contracts
|
SyndicatedCS Peru Infrastructure Loan
In December 2015 weOn July 31, 2019, the company entered into a medium term loan credit agreement for upUS$35 million (equivalent to US$200 million (S/.672S/112.9 million) with Credit Suisse AG, Cayman Islands Branch, and Credit Suisse Securities (USA) LLC. As a result of the termination of the GSP gas pipeline concession, in June 2017, we entered into an amendment to the credit agreement. See “Item 5. Operating and Financial Review and Prospects—Liquidity and Capital Resources—Indebtedness.” This agreement and the amendments thereto have been incorporated by reference as Exhibit 10.01 to this annual report.
Term Loan
As a result of the termination of the GSP gas pipeline concession, our proportional guarantee of the GSP bridge loan became due. On June 27, 2017 we entered into a new US$78.7 million (S/.264.8 million) term loan with Natixis, BBVA, SMBC and MUFJ,CS Peru Infrastructure Holdings LLC, the proceeds of which were used as working capital for the company and its subsidiaries, GyM and Adexus. The term of the loan is three years, with quarterly installments of principal beginning on the 18th month. The loan accrues interest at the following rates per annum: (i) for the period from and including the July 31, 2019 to prepay GSP bridgebut excluding the date that is six months after the closing date, 9.10%; (ii) for the period from and including the date that is six months after the closing date to but excluding the date that is one year after the closing date, 9.35%; (iii) for the period from and including the date that is one year after the closing date to but excluding the date that is 30 months after the closing date, 9.60%; and (iv) for the period from and including the date that is 30 months after the closing date to the third anniversary of the loan, 10.10%. On February 28, 2020, the company and the initial lender signed an amendment, waiver and consent in full.respect of this event of default, in consideration for a prepayment by the company of US$10 million, together with accrued interest and a make-whole premium. The principal amount outstanding under the new term loan was US$63.4722 million (S/.214.4679.7 million) as of December 31, 2018, and as of the date of this annual report, US$47.25 million (S/.156.16) is outstanding on the term loan. report.
For more information, see “Item 5. Operating and Financial Review and Prospects—Liquidity and Capital Resources—Indebtedness.” This agreement and the amendmentsamendment thereto have been incorporated by reference as Exhibit 10.0210.01 to this annual report.
Financial Stability Framework Agreement
On July 31, 2017, we, and certain of our subsidiaries, GyM,Cumbra, Construyendo País S.A., Vial y Vives—DSD and Concesionaria Vía Expresa Sur S.A., entered into a Financial Stability Framework Agreement with the following financial entities: Scotiabank Peru S.A.A., Banco Internacional del Perú S.A.A., BBVA Banco Continental,Peru, Banco de Crédito del Perú, Citibank del Perú S.A. and Citibank N.A. The loan matured in July 2020, which maturity was extended, most recently, until April 30, 2021. We are currently negotiating an additional extension. As of December 31, 2018 and the date of this annual report, US$59.4430.2 million (S/200.83110.0 million) was outstanding under the Financial Stability Framework Agreement. For more information, see “Item 5. Operating and Financial Review and Prospects—Liquidity and Capital Resources—Indebtedness.” This agreement and the amendmentsamendment thereto have been incorporated by reference as Exhibit 10.0310.02 to this annual report.
GSP Concession and Subordination Arrangements
In November 2015 we acquired a 20% interest in GSP, an entity which, on July 22, 2014, signed a concession agreement with the government of Peru to build, operate and maintain the natural gas pipeline transportation system to satisfy the demand of certain cities in the southern region of Peru.
On January 24, 2017, the government of Peru terminated the contract, due to the impossibility of obtaining financial closing. In accordance with the concession contract, the Peruvian government is required to carry out an auction process to sell GSP’s assets and obtain a new concessionaire within one year of the contract termination, with the funds raised in the sale to be used to pay the existing concessionaire for its investment in the project. Although the concession contract provides that payment must be made within one year of termination, the Peruvian Ministry of Energy and Mines has not made any payment or, to our knowledge, initiated the payment process. A summary of these provisions of the concession contract have been incorporated by reference as Exhibit 10.0410.03 to this annual report.
In 2016, in connection with efforts to restructure or sell Odebrecht’s participation in GSP, due to the corruption scandal surrounding Odebrecht, Odebrecht contractually agreed to subordinate its claims under the concession to the other project partners, EnagásEnagas and ourselves. As a result, we and Enagas may be entitled to repayment of our percentage payment under the concession contract prior to Odebrecht. However, onOn January 3, 2018, Odebrecht commenced arbitration proceedings against us, our subsidiary GyMCumbra and Enagás,Enagas, seeking to invalidate the contractual subordination.subordination, but Odebrecht subsequently withdrew the claim. This agreement and the amendments thereto have been incorporated by reference as Exhibit 10.0510.04 to this annual report.
On December 4, 2017, GSP voluntarily commenced bankruptcy proceedings in Peru. GSP’s assets will be liquidated pursuant to Peruvian law. GSP’s only substantial asset is the claim for government payment described above, as contemplated under the concession contract in the event of termination.
Although the concession contract provides that payment must be made within one year of termination, the Peruvian Ministry of Energy and Mines has not made any payment or, to our knowledge, initiated the payment process or the auction process for a new concessionaire. As a result, after the six-month period mandated by the concession contract for the parties to discuss the matter, in October 2019, we asserted our rights against the Peruvian government by filing a request for arbitration before the International Centre for Settlement of Investment Disputes. However, in December 2019 we withdrew our request for arbitration, as required by Peruvian authorities under the preliminary settlement and cooperation agreement we entered into with Peruvian anticorruption prosecutor and the ad hoc Peruvian state counsel. For more information, see “Item 5.A. Operating and Financial Review and Prospects—Operating Results—Recent Developments.Key Developments—Termination of the Gasoducto Sur Peruano Concession.”
D. Exchange Controls
Since August 1990, there have been no exchange controls in Peru and all foreign exchange transactions are based on free market exchange rates. Prior to August 1990, the Peruvian foreign market consisted of several alternative exchange rates. Additionally, during the 1990s, the Peruvian currency experienced a significant number of large devaluations, and Peru has consequently adopted, and operated under, various exchange rate control practices and exchange rate policies, ranging from strict control over exchange rates to market determination of rates. Current Peruvian regulations on foreign investment allow the foreign holders of equity shares of Peruvian companies to receive and repatriate 100 percent of the cash dividends distributed by such companies. Such investors are allowed to purchase foreign exchange at free market currency rates through any member of the Peruvian banking system and transfer such foreign currency rates through any member of the Peruvian banking system and transfer such foreign currency outside Peru without restriction.
E. Taxation
Peruvian Tax Considerations
The following is a general summary of material Peruvian tax matters under Peruvian law, as in effect on the date of this annual report, and describes the principal tax consequences of ownership of ADSs and common shares bynon-resident individuals or entities(“Non-Peruvian Holders”). Legislative, judicial or administrative changes or interpretations may, however, be forthcoming. Any such changes or interpretations could affect the tax consequences to holders of ADSs and common shares and could alter or modify the conclusions set forth herein. This summary is not intended to be a comprehensive description of all of the tax considerations that may be relevant to a decision to make an investment in the ADSs or common shares. In addition, it does not describe any tax consequences arising under the laws of any taxing jurisdiction other than Peru or applicable to an individual or entity resident of Peru or to a person with a permanent establishment in Peru.
For purposes of Peruvian taxation:
individuals are residents of Peru, if they are Peruvian nationals who have established their place of residence in Peru or if they are foreign nationals with a permanence of more than 183 days in Peru in any12-month period (in the latter case, the condition of Peruvian resident can only be acquired as of the 1st of January of the year following the fulfillment of residence conditions); and
legal entities are residents of Peru if they are established or incorporated in Peru.
Cash Dividends and Other Distributions
Cash dividends paid toNon-Peruvian Holders with respect to common shares and amounts distributed with respect to ADSs have been subject to Peruvian withholding income tax at a rate of 5% since 2017. As a general rule, the distribution of additional common shares representing profits, the distribution of shares which differ from the distribution of earnings or profits, as well as the distribution of preemptive rights with respect to common shares, which are carried out as part of a pro rata distribution to all shareholders, will not be subject to Peruvian income tax or withholding taxes.
Capital Gains
Pursuant to Article 6 of the Peruvian income tax law, individuals and domiciled entities in Peru are subject to Peruvian income tax on their worldwide income whilenon-domiciled entities – including branches, agencies (agencias), and permanent establishment (establecimientos permanentspermanentes) ofnon-domiciled entities – are subject to Peruvian income tax only on their Peruvian source income.
Peruvian income tax law provides that income derived from the disposal of securities issued by Peruvian entities is considered Peruvian source income and is therefore subject to income tax. Under current Peruvian income tax law, capital gains resulting from the disposal of American Depositary Receipts (ADRs)(“ADSs”) that represent shares issued by Peruvian entities are considered Peruvian source income and therefore are subject to Peruvian income tax. Peruvian income tax law also provides that the taxable income resulting from the disposal of securities is equal to the difference between the sale price of the securities (which may not be less than their fair market value) and their tax basis.
Notwithstanding the foregoing, capital gains resulting from the disposal of ADSs or the beneficial interest in ADSs that represent shares issued by a Peruvian entity are not considered Peruvian source income, and therefore are not subject to Peruvian income tax.
In the event ADSs are exchanged into common shares and such common shares are disposed of, capital gains resulting therefrom will be subject to an income tax rate of either 5% or 30%, depending on where the transaction takes place. If the transaction is consummated in Peru, any capital gain will be subject to an income tax rate of 5%; and if the transaction is performed outside of Peru, any capital gain will be subject to a 30% income tax rate. Peruvian income tax law regulations have stated with respect to the transfer of common shares, that transactions are deemed to be consummated in Peru if the common shares are transferred through the Lima Stock Exchange.
From 2016 through December 31 of 2019, pursuant to the Law 30341, capital gains resulting from a transfer of: (i) Common shares and investment shares, (ii) ADRsADSs and Global Depositary Receipts (GDRs), (iii) Exchange Trade Funds (ETF) units that have underlying shares and/or securities representing debt, (iv) representative securities of debt, (v) Certificates of participation in mutual funds for investment in securities, (vi) Certificates of participation in investment Funds in Rent of Real Property (FIRBI) and certificates of participation in Trustee of Securitization for Investment in Rent of Real Estate (FIBRA), and (vii) Negotiable invoices, will be exempt from income tax, provided, however, that the following conditions are met:
With respect to (i), (ii) and convertible bonds:
| | (a) | The transfer must be performed through a centralized trading mechanism supervised by the Securities Market Superintendence; |
| | (b) | In any12-month period, neither the seller or any person related to him must dispose of more than 10% of the total number of common shares issued by the company through one or more simultaneous or successive operations; and |
| | (c) | The shares must have a “market presence”, meaning that transactions in respect of those shares for a value exceeding four Tax Units (currently, S/.4,200.00)4,400.00 per Tax Unit) shall have occurred in at least 27 business days out of any 180 business day period including the date of the transaction. |
With respect to (iii), (iv), (v) and (vi):
| | (a) | The transfer must be performed through a centralized trading mechanism supervised by the Securities Market Superintendence; and |
| | (b) | The shares must have a “market presence,” meaning that transactions in respect of those shares for a value exceeding four Tax Units (currently, S/.4,200.00)4,400.00) shall have occurred in at least 27 business days out of any 180 business day period including the date of the transaction. |
With respect to (vii), the transfer must be performed through a centralized trading mechanism supervised by the Securities Market Superintendence.
Any gain resulting from the conversion of ADSs into common shares or common shares into ADSs will not be subject to taxation in Peru.
Likewise, it is important to noticenote that if after applying the exemption, the issuer delisted the securities from the Registry of the Lima Stock Exchange, in whole or in part, in an act or progressively, within the next 12 months after the disposal is made, the exemption that is applied to the securities unlisted is lost.
AnyNon-Peruvian Holder entities who acquires common shares will have the following tax basis: (i) for common shares purchased by the transferor, the acquisition price paid for the shares; (ii) for common shares received by the transferor as a result of a share capital increase because of a capitalization of net profits, the par value of such common shares; (iii) for other common shares received free of any payment, tax basis will be: (x) zero or the cost borne by the transferor, in the case of individuals and (y) the fair market value at the time of the acquisition, in the case of entities; and (iv) for common shares of the same type acquired at different opportunities and at different values, the tax basis will be the weighted average cost. In cases where common shares are sold byNon-Peruvian Holders outside the Lima Stock Exchange, the tax basis must be certified by the Peruvian tax administration prior to the time payment is made to the transferor; otherwise it would not be possible to deduct the tax basis and the 30% Peruvian income tax would apply to the total sale price. Under Peruvian income tax law, tax basis certification is granted by the Peruvian tax authorities within 30 business days after the filing of the corresponding application. If the Peruvian tax authorities do not respond within the abovementioned period, the tax basis calculation will be deemed automatically approved.
In any transaction relating to Peruvian securities through the Lima Stock Exchange, CAVALI will act as withholding agent of the Peruvian income tax. If the purchaser is a resident in Peru and the sale is not performed through the Lima Stock Exchange, the purchaser will act as withholding agent. In other cases, the transferor shall be obliged to self-assess the tax and pay it to the Peruvian tax authorities within the first 12 business days of the month following the transfer.
Other Considerations
No Peruvian estate or gift taxes are imposed on the gratuitous transfer of ADSs or common shares. No stamp, transfer or similar tax applies to any transfer of ADSs or common shares, except for commissions payable by seller and buyer to the Lima Stock Exchange (0.021% of value sold, provided that the Lima Stock Exchange applies a discount of 90% of such commission if stock is included in the Good Corporate Governance Index), fees payable to the Peruvian Securities Commission (0.0135% of value sold, provided that the Peruvian Securities Commission applies a discount of 90% of the abovementioned commission if stock is included in the Good Corporate Governance Index), brokers’ fees (about 0.05% to 0.50% of value sold by legal entities) and value added tax (at the rate of 18%) on commissions and fees. Any investor who sells its common shares on the Lima Stock Exchange will incur these fees and taxes upon purchase and sale of the common shares.
United States Federal Income Tax Considerations
The following summary describes certain United States federal income tax consequences to a United States Holder (as defined below) of the purchase, ownership and disposition of our common shares and ADSs as of the date of this annual report. Except where noted, this summary deals only with common shares and ADSs held as capital assets (generally, property held for investment). As used herein, the term “United States Holder” means a beneficial owner of common shares or ADSs that is for United States federal income tax purposes:
an individual citizen or resident of the United States;
a corporation (or other entity treated as a corporation for United States federal income tax purposes) created or organized in or under the laws of the United States, any state thereof or the District of Columbia;
an estate the income of which is subject to United States federal income taxation regardless of its source; or
a trust if it (i) is subject to the primary supervision of a court within the United States and one or more United States persons have the authority to control all substantial decisions of the trust, or (ii) has a valid election in effect under applicable United States Treasury regulations to be treated as a United States person.
This summary does not represent a detailed description of the United States federal income tax consequences applicable to you in light of your particular circumstances and does not address the United States federal income tax consequences applicable to you if you are subject to special treatment under the United States federal income tax laws, including if you are:
a dealer in securities or currencies;
a regulated investment company;
a real estate investment trust;
atax-exempt organization;
a person holding our common shares or ADSs as part of a hedging, integrated or conversion transaction, a constructive sale or a straddle;
a trader in securities that has elected themark-to-market method of accounting for your securities;
a person liable for alternative minimum tax;
a person who owns or is deemed to own 10% or more of our stock (by vote or value);
a person required to accelerate the recognition of any item of gross income with respect to our common shares or ADSs as a result of such income being recognized on an applicable financial statement;
a partnership or other pass-through entity for United States federal income tax purposes; or
a person whose “functional currency” is not the U.S. dollar.
The discussion below is based upon the provisions of the Internal Revenue Code of 1986, as amended (the “Code”), and regulations, rulings and judicial decisions thereunder as of the date hereof, and such authorities may be replaced, revoked or modified so as to result in United States federal income tax consequences different from those discussed below. There is currently no income tax treaty between the United States and Peru that would provide for United States federal income tax consequences different than the consequences under the foregoing authorities. In addition, this summary is based, in part, upon representations made by the depositary to us and assumes that the deposit agreement, and all other related agreements, will be performed in accordance with their terms.
If a partnership (or other entity or arrangement treated as a partnership for United States federal income tax purposes) holds our common shares or ADSs, the tax treatment of a partner in the partnership will generally depend upon the status of the partner and the activities of the partnership. If you are a partner of a partnership holding our common shares or ADSs, you should consult your tax advisors.
This summary does not address the effects of the Medicare tax on net investment income or other United States income tax consequences such as United States federal estate or gift tax consequences, and does not address the effects of any state, local ornon-United States tax laws. If you are considering the purchase, ownership or disposition of our common shares or ADSs, you should consult your own tax advisors concerning the United States federal income tax consequences to you in light of your particular situation as well as any consequences arising under the laws of any other taxing jurisdiction.
ADSs
If you hold ADSs, for United States federal income tax purposes, you generally will be treated as the owner of the underlying common shares that are represented by such ADSs. Accordingly, deposits or withdrawals of common shares for ADSs will not be subject to United States federal income tax.
Taxation of Dividends
The gross amount of distributions, other than certain pro rata distributions of common shares, on the ADSs or common shares (including amounts withheld to reflect Peruvian withholding taxes) will be taxable as dividends, to the extent paid out of our current or accumulated earnings and profits, as determined under United States federal income tax principles.
To the extent that the amount of any distribution (including amounts withheld to reflect Peruvian withholding taxes) exceeds our current and accumulated earnings and profits for a taxable year, as determined under United States federal income tax principles, the distribution will first be treated as atax-free return of capital, causing a reduction in the adjusted basis of the ADSs or common shares, and the balance in excess of adjusted basis will be taxed as capital gain recognized on a sale or exchange. However, we do not expect to keep earnings and profits in accordance with United States federal income tax principles. Therefore, you should expect that a distribution will generally be treated as a dividend. Such dividends (including any withheld taxes) will be includable in your gross income as ordinary income on the day actually or constructively received by you, in the case of the common shares, or by the depositary, in the case of ADSs. Such dividends will not be eligible for the dividends received deduction allowed to corporations under the Code.
With respect tonon-corporate United States Holders, certain dividends received from a qualified foreign corporation may be subject to reduced rates of taxation. Anon-United States corporation is treated as a qualified foreign corporation with respect to dividends received from that corporation on common shares (or ADSs backed by such shares) that are readily tradable on an established securities market in the United States. United States Treasury Department guidance indicates that our ADSs, which are listed on the NYSE, will be considered readily tradable on an established securities market in the United States. Based on existing guidance, it is not entirely clear whether our common shares will be considered readily tradable on an established securities market in the United States because only the ADSs, not the underlying common shares, are listed on a securities market in the United States. We believe that dividends we pay on our common shares that are represented by ADSs, but not our common shares that are not so represented, will meet such conditions required for the reduced tax rates. There can be no assurance that our ADSs will be considered readily tradable on an established securities market in later years.Non-corporate United States Holders that do not meet a minimum holding period requirement during which they are not protected from the risk of loss or that elect to treat the dividend income as “investment income” pursuant to Section 163(d)(4) of the Code will not be eligible for the reduced rates of taxation regardless of our status as a qualified foreign corporation. In addition, the rate reduction will not apply to dividends if the recipient of a dividend is obligated to make related payments with respect to positions in substantially similar or related property. This disallowance applies even if the minimum holding period has been met. You should consult your own tax advisors regarding the application of these rules given your particular circumstances.
The amount of any dividend paid in soles will equal the U.S. dollar value of the soles received, calculated by reference to the exchange rate in effect on the date the dividend is actually or constructively received by you, in the case of the common shares, or by the depositary, in the case of ADSs, regardless of whether the soles are converted into U.S. dollars at that time. If the soles received as a dividend are converted into U.S. dollars on the date they are received, you generally will not be required to recognize foreign currency gain or loss in respect of the dividend income. If the soles received as a dividend are not converted into U.S. dollars on the date of receipt, you will have a tax basis in the soles equal to their U.S. dollar value on the date of receipt. Any gain or loss realized on a subsequent conversion or other disposition of the soles will be treated as United States source ordinary income or loss.
Subject to certain conditions and limitations, Peruvian withholding taxes on dividends may be treated as foreign taxes eligible for credit against your United States federal income tax liability. For purposes of calculating the foreign tax credit, dividends paid on the ADSs or common shares will be treated as foreign source income and will generally constitute passive category income. However, in certain circumstances, if you have held the ADSs or common shares for less than a specified minimum period during which you are not protected from risk of loss, or are obligated to make payments related to the dividends, you will not be allowed a foreign tax credit for any Peruvian withholding taxes imposed on dividends paid on the ADSs or common shares. If you do not elect to claim a United States foreign tax credit, you may instead claim a deduction for Peruvian income tax withheld, but only for a taxable year in which you elect to do so with respect to all foreign income taxes paid or accrued in such taxable year. The rules governing the foreign tax credit are complex. You are urged to consult your tax advisors regarding the availability of the foreign tax credit under your particular circumstances.
Taxation of Capital Gains
For United States federal income tax purposes, you will recognize taxable gain or loss on any sale or exchangeother disposition of ADSs or common shares in an amount equal to the difference between the amount realized for the ADSs or common shares and your tax basis in the ADSs or common shares, in each case as determined in U.S. dollars. Such gain or loss will generally be capital gain or loss. Capital gains ofnon-corporate United States Holders derived with respect to capital assets held for more than one year are eligible for reduced rates of taxation. The deductibility of capital losses is subject to limitations.
If a Peruvian income tax is withheld on the sale or other disposition of our ADSs or common shares, your amount realized will include the gross amount of the proceeds of that sale or other disposition before deduction of the Peruvian income tax. See “—Peruvian Tax Considerations—Capital Gains” for a description of when a sale or other disposition of our ADSs or common shares may be subject to taxation by Peru. Any gain or loss recognized by you will generally be treated as United States source gain or loss for foreign tax credit purposes. Consequently, in the case of gain from the disposition of ADSs or common shares that is subject to Peruvian income tax, you may not be able to benefit from the foreign tax credit for that Peruvian income tax (i.e., because the gain from the disposition would be United States source), unless you can apply the credit (subject to applicable limitations) against United States federal income tax payable on other income from foreign sources. Alternatively, you may take a deduction for
the Peruvian income tax if you do not take a credit for any foreign taxes paid or accrued during the taxable year. You are urged to consult your tax advisors regarding the tax consequences if Peruvian income tax is imposed on a disposition of ADSs or common shares, including the availability of the foreign tax credit under your particular circumstances.
Passive Foreign Investment Company
We do not believe that we are, for United States federal income tax purposes, a passive foreign investment company (a “PFIC”), and we expect to operate in such a manner so as not to become a PFIC. If, however, we are or become a PFIC, you could be subject to additional United States federal income taxes on gain recognized with respect to the ADSs or common shares and on certain distributions, plus an interest charge on certain taxes treated as having been deferred under the PFIC rules.Non-corporate United States Holders will not be eligible for reduced rates of taxation on any dividends received from us (as discussed above under “—Taxation of Dividends”) if we are a PFIC in the taxable year in which such dividends are paid or in the preceding taxable year.
Information Reporting and Backup Withholding
In general, information reporting will apply to dividends in respect of our ADSs or common shares and the proceeds from the sale exchange or other disposition of our ADSs or common shares that are paid to you within the United States (and in certain cases, outside the United States), unless you are an exempt recipient. Backup withholding may apply to such payments if you fail to provide a taxpayer identification number or certification of exempt status or fail to report in full dividend and interest income.
Any amounts withheld under the backup withholding rules will be allowed as a refund or a credit against your United States federal income tax liability provided the required information is furnished to the Internal Revenue Service in a timely manner.
The above description is not intended to constitute a complete analysis of all tax consequences relating to the acquisition, ownership or disposition of our ADSs or common shares. You should consult your own tax advisors concerning the overall tax consequences to you, including the consequences under laws other than United States federal income tax laws, of an investment in our ADSs or common shares.
F. Dividends and Paying Agents
| F. | Dividends and Paying Agents |
Not applicable.
G. Statement by Experts
Not applicable.
H. Documents on Display
We are subject to the informational requirements of the U.S. Securities Exchange Act of 1934, or the Exchange Act. Accordingly, we are required to submit reports and other information to the SEC, including annual reports on Form20-F and reports on Form6-K. In addition, the SEC maintains an Internet website at http://www.sec.gov, from which you can electronically access these materials.
As a foreign private issuer, we are required to file with the SEC annual reports on Form20-F, but we are not subject to the same disclosure requirements as a domestic U.S. registrant under the Exchange Act. For example, we are not required to prepare and issue quarterly reports. However, we have furnished, and intend to continue to furnish, our shareholders with quarterly reports containing unaudited financial data for the first three quarters of each fiscal year. In addition, as a foreign issuer, we are not subject to the proxy rules under Section 14 of the Exchange Act and our officers and directors are subject to Section 16 of the Exchange Act relating to insider short-swing profit disclosure and recovery regime.
We send the depositary a copy of all notices that we give relating to meetings of our shareholders or to distributions to shareholders or the offering of rights and a copy of any other report or communication that we make generally available to our shareholders. The depositary makes all these notices, reports and communications that it receives from us available for inspection by registered holders of ADSs at its office. The depositary mails copies of those notices, reports and communications to you if we ask the depositary to do so and furnish sufficient copies of materials for that purpose.
We file financial statements and other periodic reports with the Peruvian Securities Commission in Peru. Issuers of securities registered with the Peruvian Securities Commission are required to disclose material information relating to the issuer. Pursuant to the Securities Market Law and relevant regulations enacted thereunder, all material information in connection with the issuer of registered securities, its activities or securities issued or secured by such issuer which may influence the liquidity or price of such securities must be disclosed. Accordingly, issuers must file with the Peruvian Securities Commission mainly two types of information: (a) financial information, including unaudited interim financial statements on a quarterly basis (which are not required to be subject to limited review), and audited annual consolidated financial statements on an annual basis, and (b) material information relating to the issuer and its activities that may significantly affect the price, offering or negotiation of the issued securities, and in general, all the information that may be relevant for investors to be able to make investment decisions.
I. Subsidiary Information
See the notes 2.2 and 6 to our audited annual consolidated financial statements included in this annual report for a description of our subsidiaries.
ITEM 11. QUANTITATIVE AND QUALITATIVE DISCLOSURES ABOUT MARKET RISK
ITEM 11. | QUANTITATIVE AND QUALITATIVE DISCLOSURES ABOUT MARKET RISK
|
We are exposed to a number of market risks arising from our normal business activities, including the possibility that changes in currency exchange rates or interest rates will adversely affect future cash flows and profit or the value of our financial assets and liabilities. From time to time, we enter into derivative transactions to hedge against foreign currencies and interest rate fluctuations. For further information regarding our market risk, see note 4 to our audited annual consolidated financial statements included in this annual report.
Exchange Rate Risk
We are exposed to market risk associated with changes in foreign currency exchange rates. Our revenues and costs, and our assets and liabilities, are denominated in soles, U.S. dollars, Chilean pesos and, to a lesser extent, other currencies. In 2018,2020, we estimate that 32.53%31.4%, 55.63%51.4% and 11.83%17.2% of our revenues were denominated in soles, U.S. dollars and other currencies (principally Chilean pesos), respectively, while 63.22%49.2%, 23.11%31.5% and 13.67%19.3% of our cost of sales during the year were denominated in soles, U.S. dollars and other currencies. In addition, as of December 31, 2018, 56%2020, 61%, 41%30% and 3%9% of our total debt was denominated in soles, U.S. dollars and other currencies, respectively. If, at December 31, 2018,2020, the sol had strengthened/weakened by 2% against the U.S. dollar, with all other variables remaining constant, orpre-tax profit for the year would have increased/decreased by S/.0.5 million.0.1 million (S/0.7 million in 2019 and S/0.5 million in 2018).
Interest Rate Risk
We may from time to time incur variable interest rate indebtedness, and accordingly our financial expenses are affected by changes in interest rates. Based upon our indebtedness at December 31, 2018,2020, and taking into account our interest rate derivative instruments, a change in interest rates of five percent5% (or 500 basis points) would impact our net profit by S/.0.750.003 million annually.
Commodity Price Risk
We are exposed to market risk associated with changes in commodity prices, primarily for oil, steel and cement, which in aggregate represented a majority of our total input cost in 2018.2020. We do not have long-term contracts for the supply of these key inputs. Based upon our consumption of these inputs during 2018,2020, a 10% increase/decrease in the prices of each of oil, steel and cement would have increased/decreased our costs of sales by S/.1.01.398 million, S/.6.82.309 million and S/.1.74.872 million, respectively. However, based on our production of oil during 2018,2020, a 10% increase/decrease in the price of oil would have increased/increased or decreased our revenues by S/.29.317.6 million.
ITEM 12. DESCRIPTION OF SECURITIES OTHER THAN EQUITY SECURITIES
ITEM 12.A. | DESCRIPTION OF SECURITIES OTHER THAN EQUITY SECURITIESDebt Securities
|
A. Debt Securities
Not applicable.
B. Warrants and Rights
Not applicable.
C. Other Securities
Not applicable.
D. American Depositary Shares
| D. | American Depositary Shares |
Fees and Expenses
The depositary may charge each person to whom ADSs are issued, including, without limitation, issuances against deposits of common shares, issuances in respect of common share distributions, rights and other distributions, issuances pursuant to a stock dividend or stock split declared by us or issuances pursuant to a merger, exchange of securities or any other transaction or event affecting the ADSs or deposited securities, and each person surrendering ADSs for withdrawal of deposited securities or whose ADRsADSs are cancelled or reduced for any other reason, US$5.00 or less for each 100 ADSs (or any portion thereof) issued, delivered, reduced, cancelled or surrendered, as the case may be. The depositary may sell (by public or private sale) sufficient securities and property received in respect of a common share distribution, rights and/or other distribution prior to such deposit to pay such charge.
The following additional charges shall be incurred by the ADRADS holders, by any party depositing or withdrawing common shares or by any party surrendering ADSs or to whom ADSs are issued (including, without limitation, issuance pursuant to a stock dividend or stock split declared by us or an exchange of stock regarding the ADRsADSs or the deposited securities or a distribution of ADSs), whichever is applicable:
a fee of US$1.50 per ADR or ADRs for transfers of certificated or direct registration ADRs;
a fee of US$0.05 or less per ADS for any cash distribution made pursuant to the deposit agreement;
a fee of US$0.05 or less per ADS per calendar year (or portion thereof) for services performed by the depositary in administering the ADRsADSs (which fee may be charged on a periodic basis during each calendar year and shall be assessed against holders of ADRsADSs as of the record date or record dates set by the depositary during each calendar year and shall be payable in the manner described in the next succeeding provision);
a fee for the reimbursement of such fees, charges and expenses as are incurred by the depositary and/or any of the depositary’s agents (including, without limitation, the custodian and expenses incurred on behalf of holders in connection with compliance with foreign exchange control regulations or any law or regulation relating to foreign investment) in connection with the servicing of the common shares or other deposited securities, the sale of securities, the delivery of deposited securities or otherwise in connection with the depositary’s or the custodian’s compliance with applicable law, rule or regulation (which charge shall be assessed on a proportionate basis against holders as of the record date or dates set by the depositary and shall be payable at the sole discretion of the depositary by billing such holders or by deducting such charge from one or more cash dividends or other cash distributions);
a fee for the distribution or sale of securities pursuant to paragraph 10 of the deposit agreement, such fee being in an amount equal to the US$0.05 per ADS issuance fee for the execution and delivery of ADSs which would have been charged as a result of the deposit of such securities (treating all such securities as if they were common shares) but which securities or the net cash proceeds from the sale thereof are instead distributed by the depositary to those holders entitled thereto;
stock transfer or other taxes and other governmental charges;
cable and facsimile transmission and delivery charges incurred at your request in connection with the deposit or delivery of common shares;
transfer or registration fees for the registration of transfer of deposited securities on any applicable register in connection with the deposit or withdrawal of deposited securities; and
expenses of the depositary in connection with the conversion of foreign currency into U.S. dollars.
We will pay all other charges and expenses of the depositary and any agent of the depositary (except the custodian) pursuant to agreements from time to time between us and the depositary. The charges described above may be amended from time to time by agreement between us and the depositary.
Our depositary has agreed to reimburse us for certain expenses we incur that are related to establishment and maintenance of the ADRADS program, including investor relations expenses and exchange application and listing fees. The amounts of reimbursements available to us are not based upon the amounts of fees the depositary collects from investors. The depositary collects its fees for issuance and cancellation of ADSs directly from investors depositing common shares or surrendering ADSs for the purpose of withdrawal or from intermediaries acting on their behalf. The depositary collects fees for making distributions to investors by deducting those fees from the amounts distributed or by selling a portion of distributable property to pay the fees. The depositary may collect its annual fee for depositary services by deduction from cash distributions, or by directly billing investors, or by charging the book-entry system accounts of participants acting for them. The depositary will generally set off the amounts owing from distributions made to holders of ADSs. If, however, no distribution exists and payment owing is not timely received by the depositary, the depositary may refuse to provide any further services to holders that have not paid those fees and expenses owing until such fees and expenses have been paid. At the discretion of the depositary, all fees and charges owing under the deposit agreement are due in advance and/or when declared owing by the depositary.
During 2018,2020, the depositary reimbursed us for expenses in an aggregate amount of US$90,718222,667.74 (S/.306,538)806,947.89).
PART II.ITEM 13. DEFAULTS, DIVIDEND ARREARAGES AND DELINQUENCIES
ITEM 13. | DEFAULTS, DIVIDEND ARREARAGES AND DELINQUENCIES
|
Financing of the Expansion Project of the Lima Metro Concession
On August 23, 2017, GyM Ferrovias entered into a US$396 million financing structure with Mizuho Bank, Ltd and Sumitomo Mitsui Banking Corporation. The particular structure for the expansion project of the Lima Metro involves the securitization of irrevocable and unconditional payment obligations of the Government ofCS Peru (CPAOs), which have been sold by GyM Ferrovias to a borrower under a long-term loan facility. The expansion project includes the improvement of civil works and the purchase of additional rolling stock, including trains and cars that will be designed, built, operated and maintained by GyM Ferrovías, as concessionaire under the Lima Metro concession. The financing is structured as a long-term loan facility and a working capital facility.
During 2018, GyM Ferrovias was in continuing default under the financing of the expansion project due to thenon-delivery of our audited consolidated financial statements for the 2016 fiscal year, in our capacity as guarantor of the obligations of GyM Ferrovias under the agreement. The financing required that we provide the financial statements no later than April 4, 2018. Also, the financing required that we deliver our audited consolidated financial statements for the 2017 fiscal year by May 15, 2018. We were not able to deliver those financial statements on time. We requested a waiver from the lenders, which we received on July 2, 2018, by which time we had already delivered our audited financial statements for the 2016 and 2017 years.
SyndicatedInfrastructure Loan
Due to the terminationimpact of the GSP gas pipeline concessionCOVID-19 pandemic on January 24, 2017, we were in breach of our covenants, including our Consolidated Leverage Ratio, under our syndicated loan as of December 31, 2016, as the effects on our financial condition andcompany’s results of operations during the third and fourth quarters of 2020, the concession termination were taken into accountcompany was in default under the CS Peru Infrastructure Loan for the purposes of calculating compliance with our financial covenants for 2016. However, as of December 31, 2017 our Consolidatedfailing to maintain its maximum Leverage Ratio (as defined therein). On December 23, 2020, the company and the initial lender signed a waiver and consent agreement in respect of this event of default. Based on preliminary financial information, the company expects that it was 2.2x, no more than 3.5x as required underalso in default duirng the syndicated loan. Uponfirst quarter of 2021 for failing to maintain its maximum Leverage Ratio. If that is the terminationcase, the company intends to request a waiver from the lender.
Norvial Corporate Bonds
Due to the impact of the GSP gas pipeline concessionCOVID-19 pandemic on January 24, 2017, we were requiredour subsidiary Norvial’s results of operations, and government measures to prepay our syndicated loan. We amendedcurb the terms of our syndicated loan, including certain financial covenants and certain prepayment requirements.
During 2018, and due to the accounting adjustments in connection to the terminationspread of the GSP gas pipeline concession, we were againvirus, including the temporary suspension of tolls in Peru pursuant to Law 31018, during the second quarter of 2020, Norvial was in default under certain continuing defaults under the syndicated loan with respectits corporate bonds for failing to certain financial ratios and the failure to timely deliver our audited consolidated financial statements for the 2016 and 2017 fiscal years. The syndicated loan required that we provide the financial statements for the 2016 and 2017 fiscal years no later than April 30, 2018. As of March 31, 2018, our Consolidated Leveragemaintain its Debt Service Coverage Ratio (as defined therein) was 2.6, rather than no more than 2.50 as required under. Norvial complied with the syndicated loan. We have requestedDebt Service Coverage Ratio for the third and fourth quarters of 2020. On August 5, 2020, the general assembly of bondholders granted a waiver from the lenders, which we received on August 17, 2018, by which time we had already delivered our audiated financial statements for the 2016 and 2017 years.
GSP Bridge Loan and New Term Loan.
With the terminationin respect of the GSP gas pipeline concession, our proportional guarantee under the GSP bridge loan became due. As of December 31, 2017, there was US$72.5 million (S/.235.2 million) of principal amount outstanding under our corporate guarantee. On June 27, 2017 we entered into a new US$78.7 million (S/.264.8 million) term loan with Natixis, BBVA, SMBC and MUFJ, the proceeds of which were used to prepay GSP bridge loan.
In 2018, we were under certain defaults under the new term loan with respect to the failure to timely deliver by April 30, 2018 our audited consolidated financial statements for the 2016 and 2017 fiscal years, which we delivered in July 2018. In addition, the company was in default as of December 31, 2018 due to its failure to make payment on June 27, 2018 of 40% of the amounts outstanding under the term loan. The company requested a waiver, which it formally received from the lenders on January 31, 2019, concurrent with which the company repaid the amounts that were overdue (US$16.2 million).prior default.
Financial Stability Framework Agreement
As of December 31, 2018 and as of the date hereof, our construction subsidiary GyM is under a continuing default under theOur Financial Stability Framework Agreement with respectmatured in July 2020, which maturity was extended, most recently, until April 30, 2021. We are currently negotiating an additional extension. As of the date of this annual report, US$30.2 million was outstanding under the agreement.
Santander Loan
The maturity of a short term loan from Banco Santander to its failure to comply with certain ratios between Tranche A (client invoices (facturas)) and Tranche B (client provisions). No event of default has been formally notified to GyM by the lenders, and our subsidiary has requested a waiver from the lenders, which is pending. If duly notified to GyM by the lenders, the consequence of this default would be to transfer certain amounts due under Tranche A to Tranche B, for whichCumbra was extended until March 30, 2021. We subsequently negotiated payment is not due until July 2019. As of December 31, 2018, there was US$43.7 million (S/.147.8 million) outstanding under Tranche Ain installments, beginning in May 2021 and US$15.7 (S/.53.0) outstanding under Tranche B of the facility, for a total of $US$59.4 million.ending in September 2021.
For more information, see “Item 5.A. Operating and Financial Review and Prospects—Operating Results—Recent Developments” and “Item 5.B. Operating and Financial Review and Prospects—Liquidity and Capital Resources—Indebtedness.”
ITEM 14. MATERIAL MODIFICATIONS TO THE RIGHTS OF SECURITY HOLDERS AND USE OF PROCEEDS
ITEM 14. | MATERIAL MODIFICATIONS TO THE RIGHTS OF SECURITY HOLDERS AND USE OF PROCEEDS
|
Material Modifications to the Rights of Security Holders
None.
Use of Proceeds
On November 6, 2018, our company’s general meeting of shareholders and board of directors approved an offering and sale of our company’s common shares pursuant to a private placement. In December 2018, our company issued and sold a total of 69,380,402 common shares, to certain of our company’s existing shareholders that exercised preemptive rights in accordance with Peruvian law.law and pursuant to a private placement. On April 2, 2019, our company issued and sold 142,483,633 common shares pursuant to the private placement, of which: (i) 55,291,877 shares were paid in full and (ii) 87,191,786 shares were paid 50% on such date with 50% to be paid by Julyon June 1, 2019. In total, our company issued and sold 211,864,065 common shares with the proceeds used to reduce debt, to pay our vendors and for working capital of one of our company’s subsidiaries.
ITEM 15. CONTROLS AND PROCEDURES
ITEM 15. | CONTROLS AND PROCEDURES
|
CONTROLS AND PROCEDURES
| A. | Disclosure Controls and Procedures |
Management, with the participation of theour company’s Chief Executive Officer and Chief Financial Officer, performed an evaluation of the effectiveness of our disclosure controls and procedures as defined in Rules13a-15(e) and15d-15(e) of the Exchange Act. Our disclosure controls and procedures are designed to ensure that information required to be disclosed in the reports we file or submit under the Exchange Act is recorded, processed, summarized and reported within the time periods specified in the SEC’s rules and forms, and that such information is accumulated and communicated to our management, including the Chief Executive Officer and the Chief Financial Officer, to allow timely decisions regarding required disclosures. Any controls and procedures, no matter how well designed and operated, can provide only reasonable assurance of achieving the desired control objective. Based on this evaluation, our Chief Executive Officer and Chief Financial Officer concluded that, as of December 31, 2018,2020, our disclosure controls and procedures were not effective as a result of the material weaknessesweakness in internal control over financial reporting described below.
| B. | Management’s Annual Report on Internal Control Over Financial Reporting |
Management is responsible for establishing and maintaining adequate internal control over financial reporting for our company as such term is defined by Exchange Act rules13(a)-15(f) and15(d)-15(f). In order to evaluate the effectiveness of internal control over financial reporting, as required by Section 404 of the U.S. Sarbanes-Oxley Act of 2002 (“SOX”), management has conducted an assessment, including testing, using the criteria in Internal Control-Integrated Framework (2013), issued by the Committee of Sponsoring Organizations of the Treadway Commission (COSO). Our company’s system of internal control over financial reporting is designed to provide reasonable assurance regarding the reliability of financial reporting and the preparation of financial statements for external purposes in accordance with generally accepted IFRS accounting principles. Because of its inherent limitations, internal control over financial reporting may not prevent or detect misstatements. Also, projections of any evaluation of effectiveness to future periods are subject to the risk that controls may become inadequate because of changes in conditions, or that the degree of compliance with the policies or procedures may deteriorate.
We have established a continuous testing process throughout the year. From this assessment of the effectiveness of our internal control over financial reporting as of December 31, 2018,2020, we have identified certainone material weaknesses.weakness. A material weakness is a deficiency, or combination of deficiencies, in internal control over financial reporting, such that there is a reasonable possibility that a material misstatement of our annual and interim consolidated financial statements will not be prevented or detected on a timely basis. The material weaknessesweakness identified areis described below:
as follows: deficiencies in the operational effectiveness of controls over SOX compliance including those related to determining(1) the subsidiaries to be included in the scopelack of SOX testing, the review and formal approvalofrisk and control matrices, the updating and approval of narratives and flowcharts, as well as the monitoring of detected control failures and theprocedures or implementation of our internal control system over financing reporting;
deficiency in formally having an established and documented processcontrols for enterprise and fraud risk management, including the implementation of a risk management system that includes a methodology, a process of identification, evaluation and quantificationassurance of the risks, a continuous improvement plancompleteness and a monitoringaccuracy of key reports and reporting process;
deficiencies in(2) the design and operational effectivenessabsence of controls over segregation of duties to help ensure that personnel with potential conflicts were not involved innon-compatible activities;self-assessment by controls’ owners.
deficiencies in the design and operational effectiveness of the controls established in the accounting closing process with respect to the: (1) preparation and review of the annual and interim consolidated financial statements, (2) review, approval and supporting documentation of certain accounting entries, (3) segregation of duties between preparation and approval of accounting entries, (4) access control to spreadsheets used for manual accounting records in compliance with IFRS disclosures, (5) disclosure of discontinued operations, and (6) complete, accurate and timely provision of information to the accounting department; and
deficiencies in the design and operational effectiveness of controls established in the revenue recognition process with respect to the criteria for, and the documentation supporting, the recognition of revenue and the determination of related provisions, including construction contract revenues and contingent revenues.
Conclusion
TheseThe material weaknesses resultedweakness described above did not result in adjustments to the accounting for revenue and accounts receivable. Additionally, theseour annual consolidated financial statements. However, this material weaknessesweakness could result in other misstatements in our financial results and disclosures, which could result in a material misstatement to our annual or interim consolidated financial statements not being prevented or detected. Because of thesethis material weaknesses, management concluded that we did not maintain effective internal control over financial reporting as of December 31, 2018,2020, based on criteria in Internal Control-Integrated Framework (2013) issued by the COSO.
Moore Stephens SCAI S.A.Assurance S.A.S. (a member firm of Moore Stephens International)Global Network Limited), an independent registered public accounting firm, which has audited and reported on the consolidated financial statements as of and for the year ended December 31, 20182020 contained in this annual report on Form20-F, has issued an attestation report on our internal control over financial reporting as of December 31, 2018.2020.
Remediation Plan
We are in the process of implementing significant improvements to our internal control over financial reporting, as described in our annual report on Form20-F for fiscal year 2017 and as described herein. As part of this process, we are taking remedial actions to address the material weaknessesweakness that havehas been identified with respect to our internal control over financial reporting.
We are currently preparingcontinue to work on the remediation of our deficiencies with respect to the operational effectiveness of controls over SOX compliance. We have established a draft company risk manual that includes a methodology, a process of identification, evaluation and quantification of risks, a continuous improvementremediation plan and a monitoring and reporting process. In parallel and for the deficiencies detected in 2020 which includes (1) designing and implementing controls necessary to ensure the integrity and accuracy of key processes,reports used by owners and (2) implementing self-assessment controls for our processes.
In June 2020, we launched a project to identify and implement controls to ensure integrity and accuracy of key reports generated in accounting systems, payroll systems, and spreadsheets. By the end of 2020, we had defined the criteria, and identified the key reports with respect to payroll systems. During the first half of 2021, we plan to finalize the criteria and the identification of key reports with respect to accounting systems and spreadsheets. We will then formalize in a policy to ensure the integrity and accuracy of key reports, including aspects such as the criteria to define a key report, access controls, integrity and accuracy tests, and protocols for management is identifying significant riskschanges and their impact to prioritize their review and control enhancement and monitor their implementation as necessary.updates.
AsIn the fourth quarter of December 31, 2018,2020, we completed the implementationdesign of controls over substantially all (and as ofa self-evaluation program, including a procedure that included the date hereof, we have completed the implementation of controls over all) of our subsidiaries to comply with the SOX requirements, and the testing of these controls in design and effectiveness over financial reporting will be performed in 2019.
In relation to controls on segregation of duties, we have completed the identification of the conflicted accesses to our accounting and key systems, and a remediation plan is in progress. This plan includes making changes to those accesses in order to ensure there is no conflict over the segregation of duties.
We will continue providing proper training to our accounting team in matters related to IFRS, and to employeesstaff responsible for our internal controls, to ensure they have an appropriate levelself-assessments, the frequency of knowledgereviews, reporting schedules and can build on our experience with those controls, specifically, relating to monitoringescalation steps. During the first quarter of 2021, we updated the program, and accounting,beginning in order to execute their control responsibilities. In addition, controls over the accounting process are under review to ensure that information is provided tosecond quarter of 2021, we will deploy the accounting department in a complete, accurate and timely fashion, financial statements are assessed, supporting documentation of accounting entries is provided, there is a correct segregation of duties between preparation and approval of accounting entries, and access control to spreadsheets used for manual accounting are kept correctly. In addition, as part of this plan, controls in revenue recognition will be reinforced withself-evaluation program gradually across the implementation of policies and procedures in accordance with IFRS.company.
Furthermore, moving forward, we will continue to monitor and assess our remediation activities to address the material weaknessesweakness described above through remediation as soon as practicable. The implementation of these measures may not fully address the material weaknessesweakness in our internal control over financial reporting described above.
The process of designing and implementing an effective reporting system is a continuous effort that requires us to anticipate and react to changes in our business and the economic and regulatory environments and to devote significant resources to maintain a financial reporting system that is adequate to satisfy our reporting obligations. See “Item 3. Key Information— D. Risk Factors — We have identified a material weaknessesweakness in our internal control over financial reporting, and if we cannot maintain effective internal controls or provide reliable
financial and other information in the future, investors may lose confidence in the reliability of our consolidated financial statements, which could result in a decrease in the value of our ADSs.” If we fail to implement and maintain an effective system of internal control, we may be unable to accurately report our results of operations or prevent fraud or fail to meet our reporting obligations, and investor confidence and the market price of our ADSs may be materially and adversely affected.
| C. | Attestation Report of the Registered Public Accounting Firm |
See Item 18. Financial Statements.
| D. | Changes in Internal Control Over Financial Reporting |
During 2018,2020, the company made changes to its internal control over financing reporting to address material weaknesses identified during 2017.2019. The company continued implementing its remedial plan as described in Item 15.B. of the annual report for the 20172019 fiscal year. Specifically, the company addressed material weaknesses in its control environment,SOX compliance, deficiencies in the timely accounting for signed contracts,design and operational effectiveness of the controls overestablished in the accounting closing process concerning the preparation and review of inventory,the annual and interim consolidated financial statements, deficiencies in the implementation of our new SAP-based payroll system for employees established in 2019, and in the segregation of duties for both our new employee payroll system and our existing construction workers’ payroll system as follows:
We reviewed and monitored, under an ISAE 3402 Type 2 report, the monitoring of Canvia, the entity that provides IT services to companies in our group, and may have an impact on our financial reporting. The report assessed the existence of security, availability and confidentiality controls on the service provider organization’s controls.
We developed and implemented suitable controls for significant transactions so as to ensure the availability of adequate documentary support prior to the time of approval and recording of the transactions. These controls were tested independently and proved to be applied appropriately.
We developed and implemented a new entity level control to ensure the accounting function has a process to timely identify and address changes in IFRS, and that any significant change is communicated to the Audit Committee.
We finished writing the accounting manual for the company and its subsidiaries in 2020, and it was formally approved by the Audit Committee in November 2020 and subjected to further section-by-section review. Each section of the manual was distributed to the company’s accounting team and applied throughout the year.
We have remediated the most important deficiencies in access and user roles previously identified during the implementation of the company’s SAP-based payroll system. We also conducted further testing, which revealed no significant issues.
During 2020, we completed our Employee Payroll Functions Segregation of Duties Matrix and prepared our Segregation of Duties Matrix for Worker Payroll. At the end of 2020, the Employee Payroll Functions Segregation of Duties Matrix was in the process of being approved, and the roleSegregation of Duties Matrix for Worker Payroll remained under preparation. During 2020, we implemented compensatory operational controls to mitigate risks. This included controls on (a) registration of new personnel and validation checks on workers’ existence, (b) adequate payroll processing through various variance analyses, (c) termination of employment through the re-calculation of severance packages and checks of timely withdrawal of access rights from the company’s systems. In the second quarter of 2021, we expect to approve the Segregation of Duties Matrix for Worker Payroll and to finalize the implementation of the internal audit function, as follows:functionalities of SAP SuccessFactors (SSFF) that we are currently evaluating, in order to strengthen compliance with the segregation of duties matrices.
During 2017 and 2018,2020, the company, through its senior management, begancontinued to implement programs to strengthen ethics, compliance and the tone of the top of the organization affecting how the organization performs risk management, financial analysis, accounting and financial reporting. These activities have included during 2018: the launch of an updated code of ethics to all officers and employees;included: ethics training programs, which have beenwere completed by 90%approximately 95% of employees; conflicts of interest declarations forrequired of all employees; the strengthening of ourthe hiring process; the launchcontinuation of a communication program for all employees with respect to the company’s compliance policies; the implementation of an updated organizational structure, including the review and adjustment of the delegation of authority; the development of a plan to implement the new internal control system across the company, the completion of which is ongoing; and the implementationcontinued application of a due diligence program to third parties (partners and suppliers) and employees as part of our fraud risk program; and enactment of a plan to enhance the new internal control system across the company, the implementation of a fraudwhich is ongoing, including an enhanced risk program.management process that identifies, mitigates, monitors and reports key risks at various levels in the business.
During 2018,2020, the company begancontinued the review of the mainits processes to identify deficiencies in controls to address risks related to material misstatements. This reviewmisstatements reported previously. These processes included the following processes: accounting closing inventory, signing of contracts, segregation of duties,and reporting, contract documentation, new business engagement, project management and new business development.
Onesegregation of duties. The company remediated two of the three material weaknesses that were identified in 2017 was2019. We are in the timely accounting for signed contracts. During 2018, this process was reviewed and changes were madeof implementing the remediation plan described in Item 15.B. above, which is expected to ensure that all signed contracts were accounted for on a timely basis. The deficiencies identified in 2017 with respect to the accounting for inventory were related to inventory reviews that were not performed on a timely basis. During 2018, inventory reviews were performed in all our applicable subsidiaries and actions were taken to address discrepancies.be completed during 2021.
Additionally, the company’s internal audit function was reorganized. A new Chief Executive Auditor, who reports directly toITEM 16. [RESERVED]
ITEM 16A. AUDIT COMMITTEE FINANCIAL EXPERT
Mr. Carlos Rojas, chairman of the Audit Committee, was appointed in January 2018. Additionally, we hired personnel within the internal audit department with the appropriate training and experience in auditing to ensure that our internal control system and processes are executed adequately.
ITEM 16A. | AUDIT COMMITTEE FINANCIAL EXPERT
|
Mr. Manuel del Río qualifies as an “audit committee financial expert” and is independent under the Exchange Act.
ITEM 16B. CODE OF BUSINESS CONDUCT AND ETHICS
ITEM 16B. | CODE OF BUSINESS CONDUCT AND ETHICS
|
We are committed to responsible, honest, transparent and ethical conduct. Our management system enables us to communicate our corporate values and principles to all levels of the organization, offers a confidential reporting mechanism (canal ético), and has a governance structure, independent from management, to investigate and remedy potential breaches of our code.
We have adopted a code of business conduct and it applies to our directors, officers and employees. Our code of business conduct is available on our website www.granaymontero.com.pe.www.aenza.com.pe. Information on our website is not incorporated by reference in this annual report.
If we make any substantive amendment to the code of business conduct or if we grant any waiver, including any implicit waiver, from a provision of the code of business conduct that applies to our chief executive officer, chief financial officer or controller, we will disclose the nature of such amendment or waiver in our website or in our next Form20-F to be filed with the SEC to the extent required under applicable rules. During the year ended December 31, 2018,2020, no such amendment or waiver was granted. Certain amendments to our code of business conduct were made as described below.
In 2015, we reinforced our ethics management system as a preventative measure. Our board of directors approved an anti-corruption compliance program, which establishes the leadership and commitment of senior management on this matter, defines supervisory bodies and the reporting lines, establishes new policies and procedures, identifies additional internal controls, and proposes training plans for the entire organization. This program applies to all companies in the group and to any third parties that may act on our behalf. Within the program, the anti-corruption policy provides the guidelines required to avoid acts of corruption in our business or in our relations with any state entity, and reinforces the obligation to have accounting records and internal controls.ITEM 16C. PRINCIPAL ACCOUNTANT FEES AND SERVICES
During 2016, our efforts regarding compliance and prevention were focused on the deployment of the anti-corruption program across our companies. As part of this process, we implemented in ourweb-based platform a training program with respect to the principal anti-corruption guidelines. Additionally, we have included anti-corruption matters in our board of directors’ periodic agenda, and we also have established a compliance officer who reports to the Audit and Processes Committee. We continue performing due diligence in connection with acquisitions, and used the “Know Your Partner” initiative (2015), through which preventive assessments were performed on potential strategic partners, suppliers and potential recipients of grants in 2016. In this regard, anti-corruption clauses were included in contracts with suppliers and a specific procedure was implemented for charitable donations.
In March 2017, our board of directors created the Risk, Compliance and Sustainability Committee to enhance our ethics and compliance program. That committee then created the Risk and Compliance Corporate Function, which reports to the committee. A new Chief Risk and Compliance Officer for the group was appointed on July 1, 2017 to enhance and develop further our ethics and compliance program. Our board of directors also appointed an External Advisory Council to provide the Board with independent advice and recommendations on corporate governance and compliance matters. The first meeting was held in Lima on October 10, 2017. In 2017, we launched training sessions, combined with specialized courses addressed to middle and senior managers as well as to all members of our board of directors.
On February 5, 2018 we launched a revised, risk-based due diligence corporate policy with respect to our employees and existing and potential third-parties. The first phase began immediately and we renewed the due diligence with our partners and customers. We also trained our commercial force and managers on the new policy and launched a modern, risk-based approach supported by proven tools that have been worldwide. We are currently undergoing the second phase, which was launched in September 2018 and focuses on due diligence with our suppliers andsub-contractors.
On the May 11, 2018, the chairman of our board of directors launched the group’s new Code of Business Conduct. We consolidated, in a single, enhanced document, our previous Ethics Charter and our Code of Conduct, and complemented it with additional relevant topics in accordance with benchmarks from peer organizations, best practices and guidance from international organizations.
From September to December 2018, 1,200 leaders within our organization were trained through 48face-to-face sessions in matters related to compliance, such as conflict of interest, ethical management and anti-corruption norms. The Risks and Compliance staff, as well as the Chief Risk and Compliance Officer and the Chief Executive Officer conducted the training sessions. Once theseface-to-face trainings were carried out,e-learning trainings were launched to the rest of our employees. 88% of the target group had completed thee-learning trainings by December 31, 2018.
On October 29, 2018, we concluded the recruitment of all approved positions for the Risk and Compliance function across Peru, Colombia and Chile. The function is independent from management and reports directly to the Risk, Compliance and Sustainability Committee of the Board of Directors through the Chief Risk and Compliance Officer. The function is structured in four areas (each area has a manager in charge and a specialist): (i) Risks and Monitoring, (ii) Ethics and Training, (iii) Due Diligence and Research, (iv) Integration into the Business Area, and (v) Country Compliance Officer. The staff of the Risk and Compliance function bring various experience in matters of risk, ethics and compliance at both the national and international level and have completed undergraduate and post-graduate studies in a variety of areas, including risk, law, administration, finance, accounting, auditing, economics, engineering, compliance, ethics and human resources.
In November 2018, we initiated an active corporate communication campaign tore-launch our confidential reporting mechanism (canal ético). This includedre-iterating our company values and encouraging employees and management to report cases where they have identified activities outside of those values. In 2018, this confidential reporting mechanism increased the number of cases reported, which has helped to strengthen our internal controls.
ITEM 16C. | PRINCIPAL ACCOUNTANT FEES AND SERVICES
|
Audit andNon-Audit Fees
The following table sets forth the fees billed to us by our current independent registered public accounting firm, Moore Stephens,Assurance S.A.S. (a member firm of Moore Global Network Limited), in connection with its audit of our annual consolidated financial statements for the fiscal years ended December 31, 20172019 and 2018,2020, which are included in this report.
| | | | For the year ended December 31, | | | For the year ended December 31, | |
| | | 2017 | | | 2018 | | | 2019 | | | 2020 | |
| | | (in thousands of S/.) | | | (in thousands of S/) | |
Audit fees | | | 4,932.4 | | | | 5,406 | | | | 4,257 | | | | 4,257 | |
Audit-related fees | | | — | | | | — | | | | — | | | | — | |
Tax fees | | | — | | | | — | | | | — | | | | — | |
All other fees | | | — | | | | — | | | | — | | | | — | |
| | | | | | | | | | | | |
Total fees | | | 4,932.4 | | | | 5,406 | | | | 4,257 | | | | 4,257 | |
| | | | | | | |
Audit fees in the table above are the aggregate fees billed and billable by our independent auditor in connection with the audit of, or audit procedures in connection with, our annual consolidated financial statements and review of our internal controls.
Audit-related fees in the tables above relate to accounting consultation.
Tax fees in the tables above are fees billed relating to tax compliance services.
Our Audit and Process Committee is responsible for the oversight of the independent auditors and has establishedpre-approval procedures for the engagement of our registered public accounting firm for audit andnon-audit services. Such servicesServices can only be contracted if they are approved by the Audit and Process Committee, they comply with the restrictions provided under applicable rules and they do not jeopardize the independence of our auditors. All services provided by our current independent auditor for our fiscal years ended December 31, 20172019 and 20182020 werepre-approved by our Audit and Process Committee.
ITEM 16D. EXEMPTIONS FROM THE LISTING STANDARDS FOR AUDIT COMMITTEES
ITEM 16D. | EXEMPTIONS FROM THE LISTING STANDARDS FOR AUDIT COMMITTEES
|
None.Not applicable.
| ITEM 16E. PURCHASES OF EQUITY SECURITIES BY THE ISSUER AND AFFILIATED PURCHASERS | PURCHASES OF EQUITY SECURITIES BY THE ISSUER AND AFFILIATED PURCHASERS
|
None.
ITEM 16F. | CHANGE IN REGISTRANT’S CERTIFYING ACCOUNTANT
|
(a) Dismissal of Independent Registered Public Accounting FirmNot applicable.
Our company and Gaveglio, Aparicio y Asociados S.C. de R.L., a member firm of PricewaterhouseCoopers (“PwC”) determined that PwC lacked independence from our company with respect to our company’s financial statements for the fiscal year 2016 as a consequence ofnon-audit services provided by PwC to our company beginning in the fourth quarter of the fiscal year 2016. The services related to our company’s testing of internal controls in accordance with the Sarbanes-Oxley Act. As a result, our company and PwC mutually agreed on October 4, 2017 to our company’s dismissal of PwC as auditor of our company’s consolidated financial statements for the fiscal year 2016. Our company’s Audit and Process Committee and Board of Directors participated in and approved the decision to dismiss PwC and recommended the appointment of our company’s new independent registered public accounting firm.ITEM 16F. CHANGE IN REGISTRANT’S CERTIFYING ACCOUNTANT
(b) New Audit of 2015Not applicable.
The independence issue described above did not affect the independence of PwC with respect to PwC’s audit of our company’s consolidated financial statements for the fiscal years 2014 and 2015. The audit reports of PwC on our company’s consolidated financial statements for the fiscal years 2014 and 2015 did not contain any adverse opinion or a disclaimer of opinion and were not qualified or modified as to uncertainty, audit scope or accounting principles.ITEM 16G. CORPORATE GOVERNANCE
On or about March 23, 2018, PwC informed our company that it would not authorize the use of its 2015 audit opinion in connection with the filing of our company’s annual report on Form20-F without conducting substantial additional procedures. PwC could not give any assurance as to when it could complete such additional procedures and stated it could take several months. PwC informed our company that professional standards required the performance of substantial additional procedures with respect to the 2015 consolidated financial statements because of publicly reported procedural developments since the firm’s dismissal in October 2017 concerning the cumulative effect of the decision of the Peruvian court to include three former executives of our company and our company in its ongoing criminal investigation relating to projects involving Odebrecht, coupled with a 2015 agreement that was first provided to PwC in May 2017 while PwC was conducting the audit for the fiscal year 2016.
On April 17, 2018, to avoid further delay, our company appointed Moore Stephens SCAI S.A. (“Moore Stephens”) as its new independent registered public accounting firm for the fiscal year 2015 and announced that the previously issued consolidated financial statements of our company for the 2015 fiscal year (and the related audit opinion of PwC) should no longer be relied upon. Among other factors, as our company’s current auditor, Moore Stephens, was in the process of completing its audit work with respect to the 2016 fiscal year (see (d) below) and thus, in our company’s view, could more timely and efficiently complete the 2015 audit processes as well.
(c) Disagreements and Reportable Events
During the 2015 and 2016 fiscal years and the subsequent interim period through October 4, 2017, there were no “disagreements” (as described in Item 16.F(a)(1)(iv) of Form20-F) with PwC on any matter of accounting principles or practices, financial statement disclosure or auditing scope or procedures, which disagreements, if not resolved to the satisfaction of PwC, would have caused them to make reference thereto in their reports on the financial statements for such years.
During the 2015 and 2016 fiscal years and the subsequent interim period through October 4, 2017, there were “reportable events” (as that term is defined in Item 16.F(a)(1)(v) of Form20-F) as follows: (i) as disclosed in our company’s annual report on Form20-F for the 2015 fiscal year, our company’s management and PwC each concluded that our company did not maintain effective internal control over financial reporting as of December 31, 2015, because of a material weakness related to inadequate controls over segregation of duties in certain activities in some subsidiaries; (ii) PwC advised our company that our company did not maintain effective internal control over financial reporting as of December 31, 2016 as a result of the material weaknesses described in Item 15.B of our company’s annual report on Form20-F for the fiscal year ended December 31, 2016, except that the following items were not advised by PwC: (1) inadequate oversight by the Audit Committee regarding the role of the Internal Audit Department, (2) a control environment not always sufficient to ensure adequate enterprise risk management (including fraud risk), and (3) the conclusion which states that there
were no significant impacts in our consolidated financial statements because clarifying addendums were signed by the parties; and (iii) at the time of PwC’s dismissal, as described in (a) above, PwC’s audit of the consolidated financial statements for the fiscal year 2016 was not complete, including the final resolution of matters related to the accounting for two contracts and any related implications from the finalization of the internal investigation conducted by our company.
The Audit and Process Committee of our company discussed the subject matter of each of the reportable events with PwC. Our company authorized PwC to fully respond to the inquiries of the successor accountant concerning these reportable events.
Our company has requested that PwC furnish it with a letter addressed to the SEC stating whether or not it agrees with the above statements. A copy of such letter, dated May 15, 2018, is filed as Exhibit 16.01 to our company’s annual report on Form20-F for the fiscal year ended December 31, 2016.
(d) Appointment of New Independent Registered Public Auditing Firm
A shareholders’ meeting of our company held on November 2, 2017 appointed Moore Stephens as the new independent auditor for the fiscal year 2016.
On April 17, 2018, the Audit and Process Committee of our company appointed Moore Stephens to audit the 2015 fiscal year. The shareholders’ meeting of our company held on May 14, 2018 ratified the appointment.
During the 2015 and 2016 fiscal years and the subsequent interim period through April 16, 2018, our company did not consult with Moore Stephens regarding either (i) the application of accounting principles to a specified transaction, either completed or proposed, or the type of audit opinion that might be rendered on our company’s consolidated financial statements, other than in connection with the ongoing audit work by Moore Stephens of our company’s consolidated financial statements for the 2016 fiscal year; or (ii) any matter that was either the subject of a disagreement or a reportable event.
ITEM 16G. | CORPORATE GOVERNANCE
|
We are a “foreign private issuer” within the meaning of the NYSE corporate governance standards. Under NYSE rules, a foreign private issuer may elect to comply with the practices of its home country and not to comply with certain corporate governance requirements applicable to U.S. companies with securities listed on the exchange.
We currently follow certain Peruvian practices concerning corporate governance and intend to continue to do so. There are significant differences in the Peruvian corporate governance practices as compared to those followed by United States domestic companies under the NYSE’s listing standards.
The NYSE listing standards provide that the board of directors of a U.S. listed company must have a majority of independent directors. Under Peruvian corporate governance practices, a Peruvian company is not required to have a majority of independent members on its board of directors. However we currently have a majority of independent directors on our board in accordance with NYSE independence standards. Our Audit and Process Committee is comprised of independent directors under SEC rules applicable to foreign private issuers. Additionally, our Human Resource ManagementTalent Committee is currently comprised of independent directors, while our Investment Committee and our Risk Compliance and SustainabilityCompliance Committee are currently comprised of a majority of independent directors, in each case under NYSE independence standards. Our Human Resource ManagementTalent Committee is not the equivalent of, or wholly comparable to, a U.S. compensation committee.
The listing standards for the NYSE also require that U.S. listed companies have a nominating/corporate governance committee and a compensation committee (in addition to an audit committee). Each of these committees must consist solely of independent directors and must have a written charter that addresses certain matters specified in the listing standards. Under Peruvian law, a Peruvian company may, but is not required to, form such committees, which may be composed partially or entirely ofnon-independent directors. Accordingly, we do not have a nominating/corporate governance committee and a compensation committee.
In addition, NYSE rules require the independentnon-executive directors of U.S. listed companies to meet on a regular basis without management being present. There is no similar requirement under Peruvian law, accordingly, we do not have such meetings.
The NYSE’s listing standards also require U.S. listed companies to adopt and disclose corporate governance guidelines. In July 2002, the Peruvian Securities Commission and a committee comprised of regulatory agencies and associations prepared and published a list of suggestednon-mandatory corporate governance guidelines called the “Principles of Good Governance for Peruvian Companies.” These principles are disclosed on the Peruvian Securities Commission web page http://www.smv.gob.pe and the Lima Stock Exchange web page http://www.bvl.com.pe. Although we have implemented a number of these measures and have been selected to form part of the Best Corporate Governance Practices Index of the Lima Stock Exchange, we are not required to comply with the referred corporate governance guidelines by law or regulation.
ITEM 16H. MINE SAFETY DISCLOSURE
ITEM 16H. | MINE SAFETY DISCLOSURE
|
Not applicable.
ITEM 17. FINANCIAL STATEMENTS
ITEM 17. | FINANCIAL STATEMENTS
|
Not applicable.
ITEM 18. FINANCIAL STATEMENTS
ITEM 18. | FINANCIAL STATEMENTS
|
See our consolidated financial statements beginning at pageF-1 of this annual report. See also Oil and Gas Supplementary Schedules beginning on pageS-1.
ITEM 19. EXHIBITS
The agreements and other documents filed as exhibits to this annual report are not intended to provide factual information or other disclosure other than with respect to the terms of the agreements or other documents themselves, and you should not rely on them for that purpose. In particular, any representations and warranties made by us in these agreements or other documents were made solely within the specific context of the relevant agreement or document and for the benefit of the other parties to the agreements and they may not describe the actual state of affairs as of the date they were made or at any other time.
| | |
Exhibit Number | | Description |
| |
1.01*1.01 | | By-Laws of the Registrant, as currently in effect |
| |
2.01** | | Registrant’s Form of American Depositary Receipt |
| |
2.02** | | Deposit Agreement, dated as of December 31, 2018, among the Registrant, The Bank of New York Mellon, as depositary, and all owners and holders from time to time of American depositary shares issued thereunder |
| |
| 8.01 | | Subsidiaries of the Registrant |
| |
10.01*** | | Credit Agreement, dated as of December 10, 2015,July 31, 2019, by and among, inter alia, Graña y Montero,between Aenza, as borrower, and Credit Suisse AG, Cayman Islands Branch,CS Peru Infrastructure Holdings LLC, as administrative agent.initial lender. |
| |
10.01.1*** | | Amendment, No. 1,Waiver and Consent, dated as of December 22, 2015, to the Credit Agreement, dated as of December 10, 2015,February 28, 2020, by and among, inter alia, Graña y Montero,between Aenza, as borrower, and Credit Suisse AG, Cayman Islands Branch,CS Peru Infrastructure Holdings LLC, as administrative agent.initial lender. |
| |
10.01.2*** | | Amendment No. 2, dated as of February 1, 2016, to the Credit Agreement, dated as of December 10, 2015, by and among, inter alia, Graña y Montero, as borrower, and Credit Suisse AG, Cayman Islands Branch, as administrative agent. |
| |
10.01.3*** | | Amendment No. 3, dated as of February 12, 2016, to the Credit Agreement, dated as of December 10, 2015, by and among, inter alia, Graña y Montero, as borrower, and Credit Suisse AG, Cayman Islands Branch, as administrative agent. |
| |
10.01.4*** | | Amendment No. 4, dated as of February 29, 2016, to the Credit Agreement, dated as of December 10, 2015, by and among, inter alia, Graña y Montero, as borrower, and Credit Suisse AG, Cayman Islands Branch, as administrative agent. |
| |
10.01.5*** | | Amendment No. 5, dated as of April 15, 2016, to the Credit Agreement, dated as of December 10, 2015, by and among, inter alia, Graña y Montero, as borrower, and Credit Suisse AG, Cayman Islands Branch, as administrative agent. |
10.01.6***10.01.2 | | Waiver and Amendment No. 6, dated as of September 15, 2016, to the CreditConsent Agreement, dated as of December 10, 2015,23, 2020, by and among, inter alia, Graña y Montero,between Aenza, as borrower, and Credit Suisse AG, Cayman Islands Branch,CS Peru Infrastructure Holdings LLC, as administrative agent. |
| | |
Exhibit Number
| | Description
|
| |
10.01.7*** | | Amendment No. 7, dated as of December 16, 2016, to the Credit Agreement, dated as of December 10, 2015, by and among, inter alia, Graña y Montero, as borrower, and Credit Suisse AG, Cayman Islands Branch, as administrative agent. |
| |
10.01.8*** + | | Amendment No. 8, dated as of June 27, 2017, to the Credit Agreement, dated as of December 10, 2015, by and among, inter alia, Graña y Montero, as borrower, and Credit Suisse AG, Cayman Islands Branch, as administrative agent. |
| |
10.01.9*** | | Amendment No. 9, dated as of October 12, 2017, to the Credit Agreement, dated as of December 10, 2015, by and among, inter alia, Graña y Montero, as borrower, and Credit Suisse AG, Cayman Islands Branch, as administrative agent.initial lender. |
| |
10.02*** | | Loan Agreement, dated as of June 27, 2017, by and among, inter alia, Graña y Montero, as borrower, and Natixis, New York Branch, as administrative agent. |
| |
10.02.1*** | | Waiver and Amendment, dated as of March 26, 2018, to the Credit Agreement, dated as of June 27, 2017, by and among, inter alia, Graña y Montero, as borrower, and Natixis, New York Branch, as administrative agent. |
| |
10.03*** | | English translation of Financial Stability Framework Agreement, dated as of July 31, 2017, by and among, inter alia, Graña y Montero,Aenza, as borrower, and Scotiabank Perú S.A.A., Banco Internacional del Perú S.A.A., BBVA Banco Continental, Banco de Crédito del Perú, Citibank del Perú S.A. and Citibank, N.A., as lenders. |
| | |
Exhibit Number | | Description |
| |
10.04*10.03*** | | English translation of Section 20 of Concession Agreement, dated as of July 22, 2014, by and among the Peruvian Ministry of Energy and Mines, as contracting authority and the concessionaire party thereto. |
| |
10.05*10.04*** | | English translation of Memorandum of Understanding, dated as of September 26, 2017, by and among Graña y Montero,Aenza, Negocios de Gas S.A., Enagás S.A., Odebrecht S.A., and Inversiones en Infraestructura de Transporte por Ductos S.A.C. |
| |
10.05.1*10.04.1*** | | English translation of Rights Subordination Agreement, dated as of April 29, 2016, by and among Odebrecht Latinvest Peru Ductos, S.A., Odebrecht S.A., Enagás, S.A., Graña y Montero,Aenza, Negocios de Gas S.A., Inversiones en Infraestructura de Transporte por Ductos S.A.C., and Gasoducto Sur Peruano S.A. |
| |
10.05.1.1*10.04.1.1*** | | English translation of Addendum No. 1, dated as of June 24, 2016, to the Rights Subordination Agreement, dated as of April 29, 2016, by and among, inter alia, Odebrecht Latinvest Peru Ductos, S.A., Odebrecht S.A., Enagás, S.A., Graña y Montero, GyM S.A.,Aenza, Cumbra, Negocios de Gas S.A., Inversiones en Infraestructura de Transporte por Ductos S.A.C., Gasoducto Sur Peruano S.A., Odebrecht Perú Ingeniería y Construcción S.A.C., and Constructora Norberto Odebrecht S.A., Sucursal del Perú. |
| |
10.05.1.2*10.04.1.2*** | | English translation of Addendum No. 2 and Assignment Agreement, dated as of August 11, 2016, to the Rights Subordination Agreement, dated as of April 29, 2016, by and among, inter alia, Odebrecht Latinvest Peru Ductos, S.A., Odebrecht S.A., Enagás, S.A., Graña y Montero, GyM S.A.,Aenza, Cumbra, Negocios de Gas S.A., Inversiones en Infraestructura de Transporte por Ductos S.A.C., Gasoducto Sur Peruano S.A., Odebrecht Perú Ingeniería y Construcción S.A.C., and Constructora Norberto Odebrecht S.A., Sucursal del Perú. |
| |
10.05.1.3*10.04.1.3*** | | English translation of Modification to Addendum No. 2 and Assignment Agreement, dated as of October 25, 2016, to the Rights Subordination Agreement, dated as of April 29, 2016, by and among, inter alia, Odebrecht Latinvest Peru Ductos, S.A., Odebrecht S.A., Enagás, S.A., Graña y Montero, GyM S.A.,Aenza, Cumbra, Negocios de Gas S.A., Inversiones en Infraestructura de Transporte por Ductos S.A.C., Gasoducto Sur Peruano S.A., Odebrecht Perú Ingeniería y Construcción S.A.C., and Constructora Norberto Odebrecht S.A., Sucursal del Perú. |
| |
| 10.05** | | Description of Securities Registered Pursuant to Section 12 of the Exchange Act |
| |
| 12.01 | | Certification of the Chief Executive Officer pursuant to Section 302 of the Sarbanes-Oxley Act |
| |
| 12.02 | | Certification of the Chief Financial Officer pursuant to Section 302 of the Sarbanes-Oxley Act |
| |
| 13.01**** | | Certification of the Chief Executive Officer pursuant to 18 U.S.C. Section 1350, as adopted pursuant to Section 906 of the Sarbanes-Oxley Act |
| |
| 13.02**** | | Certification of the Chief Financial Officer pursuant to 18 U.S.C. Section 1350, as adopted pursuant to Section 906 of the Sarbanes-Oxley Act |
| |
16.01*** | | Letter dated May 15, 2018 by Gaveglio, Aparicio y Asociados S.C. de R.L., a member firm of PricewaterhouseCoopers, as required by Item 16F of Form20-F. |
| |
| 101. INS | | XBRL Instance Document |
| |
| 101. SCH | | XBRL Taxonomy Extension Schema Document |
| | |
Exhibit Number
| | Description
|
| |
| 101. CAL | | XBRL Taxonomy Extension Calculation Linkbase Document |
| |
| 101. DEF | | XBRL Taxonomy Extension Definition Linkbase Document |
| |
| 101. LAB | | XBRL Taxonomy Extension Label Linkbase Document |
| |
| 101. PRE | | XBRL Taxonomy Extension Presentation Linkbase Document |
| * | Incorporated herein by reference to exhibit 1.01 of the Registrant’s registration statement on Form20-F (FileNo. 333-172855)F-6 filed with the SEC on April 30, 2014.December 10, 2018. |
| ** | Incorporated herein by reference to exhibit 1 to the Registrant’s registration statement on FormF-6 (FileNo. 333-228727)20-F filed with the SEC on December 10, 2018.June 25, 2020. |
| *** | Incorporated herein by reference to the Registrant’s Form20-F (FileNo. 333-172855) filed with the SEC on May 15, 2018. |
| **** | This certification will not be deemed “filed” for purposes of Section 18 of the Exchange Act (15 U.S.C. §78r), or otherwise subject to the liability of that section. Such certification will not be deemed to be incorporated by reference into any filing under the Securities Act or the Exchange Act, except to the extent that the Registrant specifically incorporates it by reference. |
SIGNATURES
The registrant hereby certifies that it meets all of the requirements for filing on Form 20-F and that it has duly caused and authorized the undersigned to sign this annual report on Form 20-F on its behalf.
+ | | |
| AENZA S.A.A. |
| |
| By: | | Confidential treatment requested./s/ Luis Francisco Díaz Olivero
|
| Name: | | Luis Francisco Díaz Olivero |
| Title: | | Chief Executive Officer |
| |
| By: | | /s/ Dennis Gray Febres |
| Name: | | Dennis Gray Febres |
| Title: | | Chief Financial Officer |
Date: May 17, 2021
(All amounts expressed in thousands of S/ unless otherwise stated)
AENZA S.A.A (FORMERLY GRAÑA Y MONTERO S.A.A.) AND SUBSIDIARIES
CONSOLIDATED FINANCIAL STATEMENTS
DECEMBER 31, 2016, 2017 AND 2018
GRAÑA Y MONTERO S.A.A. AND SUBSIDIARIES
CONSOLIDATED FINANCIAL STATEMENTS
DECEMBER 31, 2016, 20172018, 2019 AND 2020
AENZA S.A.A. (FORMERLY GRAÑA Y MONTERO S.A.A.) AND SUBSIDIARIES
CONSOLIDATED FINANCIAL STATEMENTS DECEMBER 31, 2018, 2019 AND 2020
| | | | |
| S/ | | = | | Peruvian Sol |
| US$ | | = | | United States dollar |


Report of Independent Registered Public Accounting Firm
To the Board of Directors and Shareholders of Aenza S.A.A. (formerly Graña y Montero S.A.A.) and its subsidiaries
Opinions on the Financial Statements and Internal Control over Financial Reporting
We have audited the accompanying consolidated statements of financial position of Aenza S.A.A. (formerly Graña y Montero S.A.A.) and its subsidiaries (the “Company”) as of December 31, 20182020 and 20172019 and the related consolidated statements of income, comprehensive income, changes in equity, and cash flows for each of the three years in the period ended December 31, 2018,2020, and the related notes. We also have audited the Company’s internal control over financial reporting as of December 31, 2020, based on criteria established in Internal Control - Integrated Framework(2013), issued by the Committee of Sponsoring Organizations of the Treadway Commission (COSO).
In our opinion, the financial statements present fairly, in all material respects, the financial position of the Company as of December 31, 20182020 and 20172019 and the results of their operations and their cash flows for each of the three years in the period ended December 31, 2018,2020, in conformity with International Financial Reporting Standards as issued by the International Accounting Standards Board. Also, in our opinion, the Company did not maintain, in all material respects, effective internal control over financial reporting as of December 31, 2018,2020, based on criteria established inInternal Control—Control - Integrated Framework (2013), issued by the Committee of Sponsoring Organizations of the Treadway Commission (COSO) because the following material weaknessesweakness in internal control over financial reporting existed as of that date:
- | Deficiencies in a formally established and documented process for enterprise and fraud risk management.
|
- | Deficiencies in the design and operational effectiveness of controls over segregation of duties to help ensure that personnel with potential conflicts were not involved in incompatible activities.
|
- | Deficiencies in the design and operational effectiveness of the controls established in the accounting closing process with respect to the preparation and review of the annual and interim financial statements, including controls over the review, approval, and supporting documentation related to journal entries.
|
- | Deficiencies in the design and operational effectiveness of controls established with respect to the recognition of revenue and determination of related estimates, including construction contract revenues and contingent revenues.
|
- | Deficienciesdate related to deficiencies in the operational effectiveness of controls over SOX compliance.
|
A material weakness is a deficiency, or a combination of deficiencies, in internal control over financial reporting, such that there is a reasonable possibility that a material misstatement of the annual or interim financial statements will not be prevented or detected on a timely basis. The material weaknessesweakness referred to above are described in the Management Report on Internal Control over Financial Reporting appearing under Item 15. We considered thesethis material weaknessesweakness in determining the nature, timing, and extent of audit tests applied in our audit of the 20182020 consolidated financial statements, and our opinion regarding the effectiveness of the Company’s internal control over financial reporting does not affect our opinion on those consolidated financial statements.
A company’s internal control over financial reporting is a process designed to provide reasonable assurance regarding the reliability of financial reporting and the preparation of financial statements for external purposes in accordance with generally accepted accounting principles. A company’s internal control over financial reporting includes those policies and procedures that (i) pertain to the maintenance of records that, in reasonable detail, accurately and fairly reflect the transactions and dispositions of the assets of the company; (ii) provide reasonable assurance that transactions are recorded as necessary to permit preparation of financial statements in accordance with generally accepted accounting principles, and that receipts and expenditures of the company are being made only in accordance with authorizations of management and directors of the company; and (iii) provide reasonable assurance regarding prevention or timely detection of unauthorized acquisition, use, or disposition of the company’s assets that could have a material effect on the financial statements.
Because of its inherent limitations, internal control over financial reporting may not prevent or detect misstatements. Also, projections of any evaluation of effectiveness to future periods are subject to the risk that controls may become inadequate because of changes in conditions, or that the degree of compliance with the policies or procedures may deteriorate.
- 1 -
Emphasis of Certain Matters
As discussed in Note 1 to the financial statements, Graña y Montero S.A.A. has been included as civilly liable third party in the investigations in connection with the IIRSA Project and GyM S.A. (a subsidiary of Graña y Montero S.A.A.) has been included as civilly liable third party in the IIRSA project, the Construction of the Electric Train project and the Constructors’ Club. The Note also states that GyM S.A. is being investigated by a Peruvian regulatory entity for the existence of an alleged cartel called the Constructors’ Club. The Company’s Management does not rule out the possibility of finding, in the future, adverse evidence, nor does it rule out that authorities or third parties will find, in the future, adverse evidence not currently known to date during the investigations being conducted.
| 1) | As described in note 1 to the consolidated financial statements as of December 31, 2020, the General Shareholder’s Meeting on November 2, 2020, approved the modification of the Company’s name from Graña y Montero S.A.A. to Aenza S.A.A., which is effective as of February 4, 2021. |
As discussed in Note 2.31 to the consolidated financial statements, the Company has restated the consolidated statement of income for the year ended December 31, 2017, which included the net gain on the sale of the former subsidiary GMD (S/218.3 million (US$64.6 million)) in the “Gain from the sale of investments” line item rather than the “Profit from discontinued operations” line item. While there was no effect of the restatement on Net profit, the restatement had the effect of reducing the operating profit, (loss) profit from continuing operations and earnings (loss) per share from continuing operations attributable to owners for 2017.
| 2) | As discussed in Note 1 to the financial statements, Aenza S.A.A. (formerly Graña y Montero S.A.A.) has been included as a responsible third party in the investigations related to the IIRSA case and has an exposure to the preliminary investigation process conducted in relation to the Gasoducto Sur Peruano project; Cumbra Peru S.A. (formerly GyM S.A.), a subsidiary of Aenza S.A.A. has been included as a responsible third party in IIRSA cases, the Electric Train Construction and Construction Club and has also been included in a Sanctioning Administrative Process by a Peruvian regulatory entity for the existence of an alleged cartel called the Construction Club. Likewise, Concar S.A.C. a subsidiary of Aenza S.A.A. has been required to be included in the investigation process of the Construction Club. The aforementioned Note 1 also describes that the Company signed an agreement of understanding with the Peruvian authorities wherethey undertake to enter into a definitive plea agreement regarding the contingencies it facesas a consequence of the aforementioned processes and with Sanctioning Administrative Process the Company and its legal advisors estimate that the fine to be imposed in this case should not exceed the present value of S/24 million that was recorded on December 31, 2020. The Company’s Management cannot rule out the possibility of finding, in the future, adverse evidence, nor that the authorities or third parties find, in the future, adverse evidence not currently known during the investigations that are being carried out. |
| 3) | As indicated in the Notes 12 and 15 to the consolidated financial statements, the Company has an account receivable from Gasoducto Sur Peruano (an associate entity of Aenza S.A.A. for S/620 million as of December 31, 2020. Gasoducto Sur Peruano entered into a bankruptcy process due to the early termination of the concessioncontract with the Peruvian government to build, operate and maintain the transportation system for natural gas pipelines. This process is in the creditors’ recognition stage that will form the creditors’ assembly. Based on the preliminary plea agreement signed with the Peruvian authorities, the Company desisted from requesting an arbitration for the collection of that debt; however, according to the opinion of its legal advisors, the Company considers that Gasoducto Sur Peruano can exercise its right to collect from the Peruvian State for the net book value of the concession assets and thus recover the corresponding accounts receivable. |
Basis for Opinion
The Company’s management is responsible for these financial statements, for maintaining effective internal control over financial reporting, and for its assessment of the effectiveness of internal control over financial reporting included in the Management’s Report on Internal Control over Financial Reporting referred to above. Our responsibility is to express opinions on these financial statements and on the Company’s internal control over financial reporting based on our audits.
We are a public accounting firm registered with the Public Company Accounting Oversight Board (United States) (“PCAOB”) and are required to be independent with respect to the Company in accordance with the U.S. federal securities laws and the applicable rules and regulations of the Securities and Exchange Commission and the PCAOB.
We conducted our audits in accordance with the standards of the PCAOB. Those standards require that we plan and perform the audit to obtain reasonable assurance about whether the financial statements are free of material misstatement, whether due to error or fraud, and whether effective internal control over financial reporting was maintained in all material respects.
Our audits of the financial statements included performing procedures to assess the risks of material misstatement of the financial statements, whether due to error or fraud, and performing procedures that respond to those risks. Such procedures included examining, on a test basis, evidence regarding the amounts and disclosures in the financial statements. Our audits also included evaluating the accounting principles used and significant estimates made by management, as well as evaluating the overall presentation of the financial statements. Our audit of internal control over financial reporting included obtaining an understanding of internal control over financial reporting, assessing the risk that a material weakness exists, and testing and evaluating the design and operating effectiveness of internal control based on the assessed risk. Our audits also included performing such other procedures as we considered necessary in the circumstances. We believe that our audits provide a reasonable basis for our opinions.
Definition and Limitations of Internal Control Over Financial Reporting
A company’s internal control over financial reporting is a process designed to provide reasonable assurance regarding the reliability of financial reporting and the preparation of financial statements for external purposes in accordance with generally accepted accounting principles. A company’s internal control over financial reporting includes those policies and procedures that (1) pertain to the maintenance of records that, in reasonable detail, accurately and fairly reflect the transactions and dispositions of the assets of the company; (2) provide reasonable assurance that transactions are recorded as necessary to permit preparation of financial statements in accordance with generally accepted accounting principles, and that receipts and expenditures of the company are being made only in accordance with authorizations of management and directors of the company; and (3) provide reasonable assurance regarding prevention or timely detection of unauthorized acquisition, use, or disposition of the company’s assets that could have a material effect on the financial statements.
Because of its inherent limitations, internal control over financial reporting may not prevent or detect misstatements. Also, projections of any evaluation of effectiveness to future periods are subject to the risk that controls may become inadequate because of changes in conditions, or that the degree of compliance with the policies or procedures may deteriorate.
Critical Audit Matters
The critical audit matters communicated below are matters arising from the current period audit of the consolidated financial statements that were communicated or required to be communicated to the audit committee and that (i) relate to accounts or disclosures that are material to the consolidated financial statements and (ii) involved our especially challenging, subjective, or complex judgments. The communication of critical audit matters does not alter in any way our opinion on the consolidated financial statements, taken as a whole, and we are not, by communicating the critical audit matters below, providing a separate opinion on the critical audit matters or on the accounts or disclosures to which they relate.
Provision for civil reparation
As described in note 22 to the consolidated financial statements, as of December 31, 2020, the company has registered a legal contingency for civil reparation amounting to S/216.3 million. That value corresponds to a probable compensation related to the participation of the Company and its subsidiaries as minority partners in certain entities that developed infrastructure projects in Peru with companies belonging to the Odebrecht group and the projects associated with the Construction Club. As indicated in notes 1 and 22, the Company recognized the civil compensation provisions based on the projects that have been reviewed with the Ad Hoc Attorney, the formulas established in Law 30737 and the conditions under which the preliminary plea agreement was signed on December 27, 2019. The use of estimates and judgments based on the negotiations developed during the plea agreement process is required by management to determine its provision.
The principal considerations for our determination that performing procedures related to the legal provision of civil reparation is a critical audit matter are (i) the important judgments that may arise once the final plea agreement is signed, which led to (ii) a high degree of auditor judgment, subjectivity, and effort in performing procedures related to the provision of civil reparation.
Addressing the matter involved performing procedures and evaluating audit evidence in relation to forming our overall opinion on the consolidated financial statements. These procedures included: (i) holding meetings with management to understand the process of updating the value of the registered civil reparation provision; (ii) requesting confirmation communications from the general management and the audit committee; (iii) reading and evaluating the confirmation response issued by the company’s legal advisor for matters related to the plea agreement process that could have an impact on determining the updated value of the estimated liability as of December 31, 2020; (iv) evaluating the competence and capabilities of the external legal counsel that assessed the likelihood of loss and the estimate of the outflow of resources; (v) reviewing and testing the assumptions used in updating the value of the provision based on Law 30737 issued in March 2018 and (vi) testing the mathematical accuracy of the data that supports the calculation of the provision.
Valuation of account receivable related to Gasoducto Sur Peruano
As described in notes 12 and 15 to the consolidated financial statements, Aenza S.A.A. (formerly Graña y Montero S.A.A.) as of December 31, 2020, has an account receivable from an associated entity, Gasoducto Sur Peruano (hereinafter GSP), for S/620 million. GSP entered into a bankruptcy process due to the early termination of the concession contract with the Peruvian government to build, operate and maintain the transportation system through natural gas pipelines. This process is in the recognition stage of the creditors that will make up the Board of Creditors. As described in the emphasis paragraph of this report, based on the preliminary plea agreement signed with the Peruvian authorities, the Company withdrew from requesting arbitration for the collection of this debt; however, according to the opinion of its legal advisors, the Company believes GSP can exercise its right to collect from the Peruvian State for the Net Book Value of the concession assets and in this way recover the corresponding accounts receivable. The use of estimates and based judgments to calculate the amount of the account receivable that can be recovered is required by management to determine whether its related provision should be adjusted.
The principal considerations for our determination that performing procedures related to updating the collection right to GSP is a critical audit matter are (i) the significant judgment of management in determining whether the receivable was impaired, which led to (ii) a high degree of auditor judgment, subjectivity and effort in performing procedures related to the value recorded as a collection right from GSP as of December 31, 2020, as well as the uncertainty about the final outcome of the resolution that exists in this type of process due to its long duration and complexity, so the estimates made by the company’s management based on the opinions of its advisors could vary in the future.
Addressing the matter involved performing procedures and evaluating audit evidence in relation to forming our overall opinion on the consolidated financial statements. These procedures included: (i) conducting meetings with management to understand the process of updating the GSP collection right developed by the corporate financial management and the corporate accounting management of the Company, (ii) reading and evaluating the confirmation response issued by the company’s legal advisor for matters related to GSP and (iii) obtaining and evaluating the assumptions used in the calculations made by management regarding the updated valuation of the GSP collection right as of December 31, 2020.
Uncertainty in determining the value of provision related to sanctioning administrative process by a Peruvian regulatory entity
As described in note 1 to the consolidated financial statements, on February 11, 2020, the subsidiary Cumbra Peru S.A. was notified by the Technical Secretary (the “TS”) of the Commission for the Defense of Free Competition (the “Commission”) of the Peruvian National Institute for the Defense of Free Competition and the Protection of Intellectual Property (“INDECOPI”) with the resolution that begins a sanctioning administrative procedure that involves a total of 35 companies and 28 natural persons, for alleged anti-competitive conduct in the market for public works. The resolution does not include the assignment of responsibilities or the result of the administrative sanctioning procedure, which will be determined at the end of the aforementioned procedure. The proceeding has concluded its evidentiary stage and the TS has recommended that the Commission to impose a fine which amount has been objected. The decision of the Commission will conclude the first instance of the proceeding and can be appealed before the Tribunal of INDECOPI. As described in note 22 to the consolidated financial statements, the Company has recognized a provision in the amount of S/24 million based on a present value calculation based on its external advisor’s assessment of the case.
The principal considerations for our determination that performing procedures relating to sanctioning administrative process provision is a critical audit matter are (i) the uncertainty in determining the value of the sanction, so the estimates made by Management, based on the opinions of its legal advisors, could vary in the future, which led to (ii) a high degree of auditor judgment, subjectivity, and effort in performing procedures and evaluating management’s significant assumptions related to the estimated liability recognized to INDECOPI for the connection to the Construction Club.
Addressing the matter involved performing procedures and evaluating audit evidence in relation to forming our overall opinion on the consolidated financial statements. These procedures included: (i) holding meetings to understand management’s process of updating the value of the estimated liability recognized to INDECOPI for its connection to the Construction Club, (ii) reading and evaluating the confirmation response issued by the company’s legal advisor for matters related to this legal claim and (iii) evaluating the assumptions used to determine the amount provisioned based on its external advisor’s assessment of the case as of December 31, 2020.
Impairment assessment of certain accounts receivable, other assets and contingencies
As described in note 13 to the consolidated financial statements, Aenza S.A.A. through its subsidiary Cumbra Peru S.A. maintains a lawsuit filed against a customer for an approximate amount of US $ 78 million for damages suffered as a result of various contractual breaches. Tecnicas Reunidas Talara, the defendant, has filed a counterclaim for an approximate amount of US$ 81 million alleging that Cumbra Peru S.A. would have breached the subcontract entered into between the two (hereinafter the “Arbitration Process”). The Company has recognized assets, net of their amortized cost for S/154 million (Rights receivable not invoiced for S/48.6 million, funds retained as collateral for S/51.8 million and other accounts receivable for S/53.6 million respectively) as well as liabilities to cover possible contingencies for S/41.4 million.
The principal considerations for our determination that performing procedures related to unbilled receivables, funds held as collateral, other accounts receivable, and liabilities to cover possible contingencies is a critical audit matter are (i) uncertainty about the outcome of the resolution that exists in this type of process, long and complex, from a legal and economic point of view, so that the estimates made by Management, based on the opinions of its legal advisors, could vary in the future which led to (ii) a high degree of subjectivity in the auditor’s judgment for the performance of audit procedures.
Addressing the matter involved performing procedures and evaluating audit evidence in relation to forming our overall opinion on the consolidated financial statements. These procedures included, among others: (i) understanding the process adopted by Cumbra Peru S.A. to assess the recovery capacity of said assets and evaluating the design and implementation and operational effectiveness of the key controls related to these aspects; (ii) reading the Minutes of the engineering and construction committees and the Regional engineering and construction management, as well as the reading of Important Facts related to this process, communicated by the Corporation; (iii) evaluating confirmation responses from legal advisors, experts in Peruvian and international law, internal, as well as external and independent, hired by Cumbra Peru S.A.A.; (iv) evaluatingthe analysis of the recovery of financial assets developed by Management and the defense technical team in the arbitration process; (v) evaluating the recognition of liabilities, to cover possible contingencies related to the arbitration process (Backcharge) carried out by Management and (vi) evaluating assumptions used in calculating accounting estimates of the Corporation, related to the updating of collection rights, impairment of financial assets, as well as the calculation of the amortized cost for financial assets and liabilities related to the arbitration process.
Revenue and costs recognition from construction contracts with customers
As described in notes 7 and 26 to the consolidated financial statements, a large part of the company’s income and costs corresponds to contracts for construction services in which income is recognized by the degree of progress or degree of completion method.
The principal considerations for our determination that performing procedures related to the assessment of revenue and costs recognition from construction contracts with customers is a critical audit matter are (i) the recognition of the revenue, costs and the results of these contracts requires a high degree of judgment on the part of Management and a control of the estimates made and the deviations that may occur throughout the duration of the contracts. These estimates consider all the costs and income related to the contracts, including any additional costs to those initially budgeted, the risks or claims that are in dispute, as well as the additional ones that are in the process of negotiation or even in the claim process, insofar as it is considered highly probable that there is no significant reversal when the inherent uncertainty is resolved, either because there is an approval by the client or because there are technical and / or legal reports that support it which led to (ii) a high degree of subjectivity in the auditor’s judgment for the performance of audit procedures.
Addressing the matter involved performing procedures and evaluating audit evidence in relation to forming our overall opinion on the consolidated financial statements. These procedures included, among others: (i) evaluation of the design and implementation of the key controls related to the income and cost recognition process by the degree of advancement method; (ii) reviewing of the company’s construction contracts to evaluate the most significant estimates used in the recognition of income and costs; (iii) obtaining the supporting documentation for these estimates and the evidence of the judgments made, where appropriate by Management, such as: review of works control panels, quarterly planning, analysis of income and cost gaps, calculation of estimates of the degree of progress, review of supporting documentation for additional works, as well as reading the income and cost recognition policies; (iv) performing visits by an expert to the constructions sites; (v) analyzing contracts to identify relevant contractual mechanisms, such as penalties and evaluating whether these clauses have been adequately reflected in the Company’s consolidated financial statements and (vi) evaluating the provisions recognized at the close of the 2020 financial year related to the contracts, which includes verifying that the main obligations and their level of risk are reasonably reflected.
Determination of depreciation, depletion and amortization and impairment of long-lived assets
As described in notes 16 and 17 to the consolidated financial statements, the computation of the units-of-production method, which is used in the determination of depreciation, depletion and amortization (DD&A) of property, plant and equipment related to exploration and production and natural and environmental resources, as well as in the determination of future cash flows used in the impairment analysis of long-lived assets, is dependent upon the estimation related to oil and gas reserves.
The principal considerations for our determination that performing procedures relating to the determination of depreciation, depletion and amortization and impairment of long-lived assets is a critical audit matter are (i) the significant judgment by management, including the estimation of oil and gas reserves used to calculate the DD&A and perform the impairment analysis management uses internal reservoir engineers (hereinafter “specialists’’) when estimating the reserves, which are determined based on geological, technical and economic factors. Estimates of oil and gas reserves depend upon a number of variable factors and key assumptions, including, quantities of oil and gas that are expected to be recovered, the timing of the recovery, production levels, operating and capital costs to be incurred, sales price, among others, which led to (ii) a high degree of subjectivity in the auditor’s judgment for the performance of audit procedures and evaluating management’s significant assumptions related to the inherent technical engineering nature of the reserves estimation process, which requires the use of specialists in the performance of the assessment, including in the determining the reasonableness of management’s key assumptions previously identified.
Addressing the matter involved performing procedures and evaluating audit evidence in relation to forming our overall opinion on the consolidated financial statements. These procedures included, among others: (i) obtaining an understanding, evaluated the design, and tested the operating effectiveness of controls over the Company’s process to calculate the DD&A and to perform its impairment analysis, including management’s controls over the completeness and the accuracy of the financial data provided to the specialists for use in estimating oil and gas reserves and methodology used to develop such estimates; (ii) evaluating the estimated quantity of oil and gas reserves expected to be recovered used to calculate the DD&A and in the impairment calculation, we obtained the reports from internal specialists hired by management and evaluated the competency and objectivity of the specialists through the consideration of their professional qualifications, experience and their use of accepted industry practices; (iii) evaluating the completeness and accuracy of the financial data and inputs described above, which were used by the specialists in estimating oil and gas reserves by agreeing them to the DD&A and cash flows used in impairment analysis; (iv) for proved undeveloped reserves, we evaluated management’s development plan for compliance with the SEC rule that undrilled locations are scheduled to be drilled within five years, unless specific circumstances justify a longer time, by assessing consistency of the development projections with the Company’s drill plan and the availability of capital relative to the drill plan and (v) testing the mathematical accuracy of the DD&A computations and reviewed the model of impairment analysis of long-lived assets by assessing the consistency between the estimation of oil and gas reserves prepared by the specialists with volumes of reserves included in the projected financial information, among other procedures.
|
/s/ Moore Stephens SCAI S.A.
 |
Moore Stephens SCAI S.A. Assurance S.A.S |
We have served as the Company’s auditor since 2017.
Bogota,Bogotá, Colombia
April 30, 2019
- 2 -May 17, 2021
AENZA S.A.A. (FORMERLY GRAÑA Y MONTERO S.A.A.) AND SUBSIDIARIES
CONSOLIDATED STATEMENT OF FINANCIAL POSITION
(All amounts are expressed in thousands of S/ unless otherwise stated)
ASSETS
| | | | | | | | | | | | |
| | | | | | As of December 31, | |
| | | Note | | | 2019 | | | 2020 | |
| | | | | | (as restated) | | | | |
Current assets | | | | | | | | | | | | |
Cash and cash equivalents | | | 9 | | | | 950,701 | | | | 900,168 | |
Trade accounts receivables, net | | | 10 | | | | 914,204 | | | | 703,167 | |
Work in progress, net | | | 11 | | | | 49,457 | | | | 186,433 | |
Accounts receivable from related parties | | | 12 | | | | 36,658 | | | | 27,338 | |
Other accounts receivable | | | 13 | | | | 454,474 | | | | 433,531 | |
Inventories, net | | | 14 | | | | 555,401 | | | | 552,000 | |
Prepaid expenses | | | | | | | 16,478 | | | | 22,972 | |
| | | | | | | | | | | | |
| | | | | | | 2,977,373 | | | | 2,825,609 | |
Non-current assets as held for sale | | | | | | | 2,398 | | | | — | |
| | | | | | | | | | | | |
Total current assets | | | | | | | 2,979,771 | | | | 2,825,609 | |
| | | | | | | | | | | | |
Non-current assets | | | | | | | | | | | | |
Trade accounts receivable, net | | | 10 | | | | 779,609 | | | | 730,666 | |
Work in progress, net | | | 11 | | | | 23,117 | | |
| —
|
|
Accounts receivable from related parties | | | 12 | | | | 574,723 | | | | 620,071 | |
Prepaid expenses | | | | | | | 27,934 | | | | 22,264 | |
Other accounts receivable | | | 13 | | | | 273,432 | | | | 328,223 | |
Investments in associates and joint ventures | | | 15 | | | | 37,035 | | | | 35,516 | |
Investment property | | | | | | | 28,326 | | | | 26,073 | |
Property, plant and equipment, net | | | 16 | | | | 463,990 | | | | 405,469 | |
Intangible assets, net | | | 17 | | | | 854,227 | | | | 791,990 | |
Right-of-use assets, net | | | 16.2 | | | | 90,581 | | | | 64,518 | |
Deferred income tax asset | | | 24 | | | | 271,719 | | | | 262,165 | |
| | | | | | | | | | | | |
Total non-current assets | | | | | | | 3,424,693 | | | | 3,286,955 | |
| | | | | | | | | | | | |
Total assets | | | | | | | 6,404,464 | | | | 6,112,564 | |
| | | | | | | | | | | | |
LIABILITIES AND EQUITY
| | | | | | | | | | | | |
| | | | | | As of December 31, | |
| | | Note | | | 2019 | | | 2020 | |
| | | | | | (as restated) | | | | |
Current liabilities | | | | | | | | | | | | |
Borrowings | | | 18 | | | | 481,529 | | | | 452,884 | |
Bonds | | | 19 | | | | 44,737 | | | | 58,446 | |
Trade accounts payable | | | 20 | | | | 1,159,075 | | | | 1,097,167 | |
Accounts payable to related parties | | | 12 | | | | 38,916 | | | | 43,818 | |
Current income tax | | | | | | | 51,169 | | | | 34,494 | |
Other accounts payable | | | 21 | | | | 669,674 | | | | 718,406 | |
Other provisions | | | 22 | | | | 113,483 | | | | 92,757 | |
| | | | | | | | | | | | |
Total current liabilities | | | | | | | 2,558,583 | | | | 2,497,972 | |
| | | | | | | | | | | | |
Non-current liabilities | | | | | | | | | | | | |
Borrowings | | | 18 | | | | 409,066 | | | | 445,436 | |
Bonds | | | 19 | | | | 879,305 | | | | 874,313 | |
Trade accounts payable | | | 20 | | | | 34,814 | | | | 40,502 | |
Other accounts payable | | | 21 | | | | 296,290 | | | | 183,232 | |
Accounts payable to related parties | | | 12 | | | | 22,583 | | | | 36,297 | |
Other provisions | | | 22 | | | | 214,952 | | | | 336,609 | |
Derivative financial instruments | | | | | | | 52 | | |
| —
|
|
Deferred income tax liability | | | 24 | | | | 112,734 | | | | 102,907 | |
| | | | | | | | | | | | |
Total non-current liabilities | | | | | | | 1,969,796 | | | | 2,019,296 | |
| | | | | | | | | | | | |
Total liabilities | | | | | | | 4,528,379 | | | | 4,517,268 | |
| | | | | | | | | | | | |
Equity | | | 23 | | | | | | | | | |
Capital | | | | | | | 871,918 | | | | 871,918 | |
Legal reserve | | | | | | | 132,011 | | | | 132,011 | |
Voluntary reserve | | | | | | | 29,974 | | | | 29,974 | |
Share Premium | | | | | | | 1,132,179 | | | | 1,131,574 | |
Other reserves | | | | | | | (177,506 | ) | | | (169,234 | ) |
Retained earnings | | | | | | | (510,766 | ) | | | (728,637 | ) |
| | | | | | | | | | | | |
Equity attributable to controlling interest in the Company | | | | | | | 1,477,810 | | | | 1,267,606 | |
Non-controlling interest | | | | | | | 398,275 | | | | 327,690 | |
| | | | | | | | | | | | |
Total equity | | | | | | | 1,876,085 | | | | 1,595,296 | |
| | | | | | | | | | | | |
Total liabilities and equity | | | | | | | 6,404,464 | | | | 6,112,564 | |
| | | | | | | | | | | | |
The accompanying notes on pages 14 to 124 are an integral part of the consolidated financial statements.
AENZA S.A.A. (FORMERLY GRAÑA Y MONTERO S.A.A.) AND SUBSIDIARIES
CONSOLIDATED STATEMENT OF INCOME
(All amounts are expressed in thousands of S/ unless otherwise stated)
| | | | | | | | | | | | | | |
| | | | | For the year ended December 31, | |
| | | Note | | 2018 | | | 2019 | | | 2020 | |
| | | | | (as restated) | | | (as restated) | | | | |
Revenues from construction activities | | | | | 1,961,100 | | | | 2,411,880 | | | | 1,815,671 | |
Revenues from services provided | | | | | 1,089,315 | | | | 1,254,059 | | | | 1,055,423 | |
Revenue from real estate and sale of goods | | | | | 1,151,983 | | | | 671,922 | | | | 442,935 | |
| | | | | | | | | | | | | | |
| | | | | 4,202,398 | | | | 4,337,861 | | | | 3,314,029 | |
| | | | | | | | | | | | | | |
Cost of construction activities | | | | | (1,921,112 | ) | | | (2,351,563 | ) | | | (1,716,309 | ) |
Cost of services provided | | | | | (906,953 | ) | | | (1,035,251 | ) | | | (929,206 | ) |
Cost of real estate and sale of goods | | | | | (660,363 | ) | | | (500,610 | ) | | | (347,906 | ) |
| | | | | | | | | | | | | | |
| | 26 | | | (3,488,428 | ) | | | (3,887,424 | ) | | | (2,993,421 | ) |
| | | | | | | | | | | | | | |
Gross profit | | | | | 713,970 | | | | 450,437 | | | | 320,608 | |
Administrative expenses | | 26 | | | (311,163 | ) | | | (248,652 | ) | | | (152,909 | ) |
Other income and expenses | | 28 | | | (65,854 | ) | | | (339,494 | ) | | | (182,846 | ) |
Loss from the sale of investments | | | | | (7 | ) | | | — | | |
| —
|
|
| | | | | | | | | | | | | | |
Operating profit (loss) | | | | | 336,946 | | | | (137,709 | ) | | | (15,147 | ) |
Financial expenses | | 27 | | | (260,768 | ) | | | (253,134 | ) | | | (156,943 | ) |
Financial income | | 27 | | | 51,536 | | | | 74,346 | | | | 39,420 | |
Share of the profit or loss of associates and joint ventures accounted for using the equity method | | 15 a)-b) | | | (3,709 | ) | | | (218,774 | ) | | | 770 | |
| | | | | | | | | | | | | | |
Profit (loss) before income tax | | | | | 124,005 | | | | (535,271 | ) | | | (131,900 | ) |
Income tax expense | | 29 | | | (110,993 | ) | | | (303,371 | ) | | | (58,444 | ) |
| | | | | | | | | | | | | | |
Profit (loss) from continuing operations | | | | | 13,012 | | | | (838,642 | ) | | | (190,344 | ) |
| | | | | | | | | | | | | | |
Profit from discontinued operations | | | | | 44,403 | | | | — | | | | — | |
| | | | | | | | | | | | | | |
Profit (loss) for the year | | | | | 57,415 | | | | (838,642 | ) | | | (190,344 | ) |
| | | | | | | | | | | | | | |
Profit (loss) attributable to: | | | | | | | | | | | | | | |
Owners of the Company | | | | | (83,188 | ) | | | (884,721 | ) | | | (217,871 | ) |
Non-controlling interest | | | | | 140,603 | | | | 46,079 | | | | 27,527 | |
| | | | | | | | | | | | | | |
| | | | | 57,415 | | | | (838,642 | ) | | | (190,344 | ) |
| | | | | | | | | | | | | | |
Loss per share attributable to owners of the Company during the year | | 34 | | | (0.125 | ) | | | (1.076 | ) | | | (0.250 | ) |
| | | | | | | | | | | | | | |
Loss per share from continuing operations attributable to owners of the Company during the year | | 34 | | | (0.110 | ) | | | (1.076 | ) | | | (0.250 | ) |
| | | | | | | | | | | | | | |
The accompanying notes on pages 14 to 124 are an integral part of the consolidated financial statements.
AENZA S.A.A. (FORMERLY GRAÑA Y MONTERO S.A.A.) AND SUBSIDIARIES
CONSOLIDATED STATEMENT OF COMPREHENSIVE INCOME
(All amounts are expressed in thousands of S/ unless otherwise stated)
| | | | | | | | | | | | | | | | |
| | | | | | For the year ended December 31, | |
| | | Nota | | | 2018 | | | 2019 | | | 2020 | |
| | | | | | | | | | | | | | | | |
| | | | | | | | | | | | | | | | |
Profit (loss) for the year | | | | | | | 57,415 | | | | (838,642 | ) | | | (190,344 | ) |
| | | | | | | | | | | | | | | | |
Other comprehensive income: | | | | | | | | | | | | | | | | |
Items that will not be reclassified to profit or loss | | | | | | | | | | | | | | | | |
| | | | | | | | | | | | | | | | |
Remeasurement of actuarial gains and losses, net of tax | | | | | | | 16,589 | | | | — | | |
| —
|
|
| | | | | | | | | | | | | | | | |
Items that may be subsequently reclassified to profit or loss | | | | | | | | | | | | | | | | |
Cash flow hedge, net of tax | | | 30 | | | | 119 | | | | 6 | | | | (626 | ) |
Foreign currency translation adjustment, net of tax | | | 30 | | | | 5,733 | | | | (8,170 | ) | | | 8,304 | |
Exchange difference from net investment in a foreign operation, net of tax | | | 30 | | | | (8,147 | ) | | | (456 | ) | | | 708 | |
| | | | | | | | | | | | | | | | |
| | | | | | | (2,295 | ) | | | (8,620 | ) | | | 8,386 | |
| | | | | | | | | | | | | | | | |
Other comprehensive income for the year, net of tax | | | | | | | 14,294 | | | | (8,620 | ) | | | 8,386 | |
| | | | | | | | | | | | | | | | |
Total comprehensive income for the year | | | | | | | 71,709 | | | | (847,262 | ) | | | (181,958 | ) |
| | | | | | | | | | | | | | | | |
Comprehensive income attributable to: | | | | | | | | | | | | | | | | |
Owners of the Company | | | | | | | (67,548 | ) | | | (891,607 | ) | | | (209,599 | ) |
Non-controlling interest | | | | | | | 139,257 | | | | 44,345 | | | | 27,641 | |
| | | | | | | | | | | | | | | | |
| | | | | | | 71,709 | | | | (847,262 | ) | | | (181,958 | ) |
| | | | | | | | | | | | | | | | |
The accompanying notes on pages 14 to 124 are an integral part of the consolidated financial statements.
AENZA S.A.A. (FORMERLY GRAÑA Y MONTERO S.A.A.) AND SUBSIDIARIES
CONSOLIDATED STATEMENT OF CHANGES IN EQUITY
FOR THE YEAR ENDED DECEMBER 31, 2018, 2019 AND 2020
(All amounts are expressed in thousands of S/ unless otherwise stated)
| | | | | | | | | | | | | | | | | | | | | | | | | | | | | | | | | | | | | | | | |
| | | Attributable to the controlling interests of the Company | | | | | | | |
| | | Number of
shares
In thousands | | | Capital | | | Legal
reserve | | | Voluntary
reserve | | | Share
premium | | | Other
reserves | | | Retained
earnings | | | Total | | | Non-controlling
interest | | | Total | |
Balances as of January 1, 2018 | | | 660,054 | | | | 660,054 | | | | 132,011 | | | | 29,974 | | | | 881,795 | | | | (169,671 | ) | | | 589,167 | | | | 2,123,330 | | | | 465,748 | | | | 2,589,078 | |
| | | | | | | | | | | | | | | | | | | | | | | | | | | | | | | | | | | | | | | | |
- IFRS adoption | | | — | | | | — | | | | — | | | | — | | | | — | | | | — | | | | (52,564 | ) | | | (52,564 | ) | | | (979 | ) | | | (53,543 | ) |
| | | | | | | | | | | | | | | | | | | | | | | | | | | | | | | | | | | | | | | | |
Initial balances restated | | | 660,054 | | | | 660,054 | | | | 132,011 | | | | 29,974 | | | | 881,795 | | | | (169,671 | ) | | | 536,603 | | | | 2,070,766 | | | | 464,769 | | | | 2,535,535 | |
| | | | | | | | | | | | | | | | | | | | | | | | | | | | | | | | | | | | | | | | |
(Loss) profit for the year | | | — | | | | — | | | | — | | | | — | | | | — | | | | — | | | | (83,188 | ) | | | (83,188 | ) | | | 140,603 | | | | 57,415 | |
Cash flow hedge | | | — | | | | — | | | | — | | | | — | | | | — | | | | 113 | | | | — | | | | 113 | | | | 6 | | | | 119 | |
Adjustment for actuarial gains and losses | | | — | | | | — | | | | — | | | | — | | | | — | | | | — | | | | 16,589 | | | | 16,589 | | | | — | | | | 16,589 | |
Foreign currency translation adjustment | | | — | | | | — | | | | — | | | | — | | | | — | | | | 6,930 | | | | — | | | | 6,930 | | | | (1,197 | ) | | | 5,733 | |
Exchange difference from net investment in a foreign operation | | | — | | | | — | | | | — | | | | — | | | | — | | | | (7,992 | ) | | | — | | | | (7,992 | ) | | | (155 | ) | | | (8,147 | ) |
| | | | | | | | | | | | | | | | | | | | | | | | | | | | | | | | | | | | | | | | |
Comprehensive income of the year | | | — | | | | — | | | | — | | | | — | | | | — | | | | (949 | ) | | | (66,599 | ) | | | (67,548 | ) | | | 139,257 | | | | 71,709 | |
| | | | | | | | | | | | | | | | | | | | | | | | | | | | | | | | | | | | | | | | |
Transactions with shareholders: | | | | | | | | | | | | | | | | | | | | | | | | | | | | | | | | | | | | | | | | |
- Dividend distribution | | | — | | | | — | | | | — | | | | — | | | | — | | | | — | | | | — | | | | — | | | | (102,772 | ) | | | (102,772 | ) |
- Contributions (devolution) of non-controlling shareholders, net | | | — | | | | — | | | | — | | | | — | | | | — | | | | — | | | | — | | | | — | | | | (84,442 | ) | | | (84,442 | ) |
- Additional acquisition of non-controlling | | | — | | | | — | | | | — | | | | — | | | | (9,583 | ) | | | — | | | | — | | | | (9,583 | ) | | | (4,050 | ) | | | (13,633 | ) |
- Capital Increase | | | 69,380 | | | | 69,380 | | | | — | | | | — | | | | 68,223 | | | | — | | | | — | | | | 137,603 | | | | — | | | | 137,603 | |
- Deconsolidation CAM Group | | | — | | | | — | | | | — | | | | — | | | | — | | | | — | | | | (42,878 | ) | | | (42,878 | ) | | | 18,221 | | | | (24,657 | ) |
- Deconsolidation Stracon GyM | | | — | | | | — | | | | — | | | | — | | | | 51,709 | | | | — | | | | (51,709 | ) | | | — | | | | (29,412 | ) | | | (29,412 | ) |
| | | | | | | | | | | | | | | | | | | | | | | | | | | | | | | | | | | | | | | | |
Total transactions with shareholders | | | 69,380 | | | | 69,380 | | | | — | | | | — | | | | 110,349 | | | | — | | | | (94,587 | ) | | | 85,142 | | | | (202,455 | ) | | | (117,313 | ) |
| | | | | | | | | | | | | | | | | | | | | | | | | | | | | | | | | | | | | | | | |
Balances as of December 31, 2018 | | | 729,434 | | | | 729,434 | | | | 132,011 | | | | 29,974 | | | | 992,144 | | | | (170,620 | ) | | | 375,417 | | | | 2,088,360 | | | | 401,571 | | | | 2,489,931 | |
| | | | | | | | | | | | | | | | | | | | | | | | | | | | | | | | | | | | | | | | |
Balances as of January 1, 2019 | | | 729,434 | | | | 729,434 | | | | 132,011 | | | | 29,974 | | | | 992,144 | | | | (170,620 | ) | | | 375,417 | | | | 2,088,360 | | | | 401,571 | | | | 2,489,931 | |
| | | | | | | | | | | | | | | | | | | | | | | | | | | | | | | | | | | | | | | | |
- IFRS adoption | | | — | | | | — | | | | — | | | | — | | | | — | | | | — | | | | (1,462 | ) | | | (1,462 | ) | | | — | | | | (1,462 | ) |
| | | | | | | | | | | | | | | | | | | | | | | | | | | | | | | | | | | | | | | | |
Initial balances restated | | | 729,434 | | | | 729,434 | | | | 132,011 | | | | 29,974 | | | | 992,144 | | | | (170,620 | ) | | | 373,955 | | | | 2,086,898 | | | | 401,571 | | | | 2,488,469 | |
| | | | | | | | | | | | | | | | | | | | | | | | | | | | | | | | | | | | | | | | |
(Loss) profit for the year | | | — | | | | — | | | | — | | | | — | | | | — | | | | — | | | | (884,721 | ) | | | (884,721 | ) | | | 46,079 | | | | (838,642 | ) |
Cash flow hedge | | | — | | | | — | | | | — | | | | — | | | | — | | | | 6 | | | | — | | | | 6 | | | | — | | | | 6 | |
Foreign currency translation adjustment | | | — | | | | — | | | | — | | | | — | | | | — | | | | (6,440 | ) | | | — | | | | (6,440 | ) | | | (1,730 | ) | | | (8,170 | ) |
Exchange difference from net investment in a foreign operation | | | — | | | | — | | | | — | | | | — | | | | — | | | | (452 | ) | | | — | | | | (452 | ) | | | (4 | ) | | | (456 | ) |
| | | | | | | | | | | | | | | | | | | | | | | | | | | | | | | | | | | | | | | | |
Comprehensive income of the year | | | — | | | | — | | | | — | | | | — | | | | — | | | | (6,886 | ) | | | (884,721 | ) | | | (891,607 | ) | | | 44,345 | | | | (847,262 | ) |
| | | | | | | | | | | | | | | | | | | | | | | | | | | | | | | | | | | | | | | | |
Transactions with shareholders: | | | | | | | | | | | | | | | | | | | | | | | | | | | | | | | | | | | | | | | | |
- Dividend distribution | | | — | | | | — | | | | — | | | | — | | | | — | | | | — | | | | — | | | | — | | | | (12,762 | ) | | | (12,762 | ) |
- Contributions (devolution) of non-controlling shareholders, net | | | — | | | | — | | | | — | | | | — | | | | — | | | | — | | | | — | | | | — | | | | (32,996 | ) | | | (32,996 | ) |
- Additional acquisition of non-controlling | | | — | | | | — | | | | — | | | | — | | | | 1,883 | | | | — | | | | — | | | | 1,883 | | | | (1,883 | ) | | | — | |
- Capital Increase | | | 142,484 | | | | 142,484 | | | | — | | | | — | | | | 138,152 | | | | — | | | | — | | | | 280,636 | | | | — | | | | 280,636 | |
| | | | | | | | | | | | | | | | | | | | | | | | | | | | | | | | | | | | | | | | |
Total transactions with shareholders | | | 142,484 | | | | 142,484 | | | | — | | | | — | | | | 140,035 | | | | — | | | | — | | | | 282,519 | | | | (47,641 | ) | | | 234,878 | |
| | | | | | | | | | | | | | | | | | | | | | | | | | | | | | | | | | | | | | | | |
Balances as of December 31, 2019 | | | 871,918 | | | | 871,918 | | | | 132,011 | | | | 29,974 | | | | 1,132,179 | | | | (177,506 | ) | | | (510,766 | ) | | | 1,477,810 | | | | 398,275 | | | | 1,876,085 | |
| | | | | | | | | | | | | | | | | | | | | | | | | | | | | | | | | | | | | | | | |
Balances as of January 1, 2020 | | | 871,918 | | | | 871,918 | | | | 132,011 | | | | 29,974 | | | | 1,132,179 | | | | (177,506 | ) | | | (510,766 | ) | | | 1,477,810 | | | | 398,275 | | | | 1,876,085 | |
| | | | | | | | | | | | | | | | | | | | | | | | | | | | | | | | | | | | | | | | |
(Loss) profit for the year | | | — | | | | — | | | | — | | | | — | | | | — | | | | — | | | | (217,871 | ) | | | (217,871 | ) | | | 27,527 | | | | (190,344 | ) |
Cash flow hedge | | | — | | | | — | | | | — | | | | — | | | | — | | | | (594 | ) | | | — | | | | (594 | ) | | | (32 | ) | | | (626 | ) |
Foreign currency translation adjustment | | | — | | | | — | | | | — | | | | — | | | | — | | | | 8,158 | | | | — | | | | 8,158 | | | | 146 | | | | 8,304 | |
Exchange difference from net investment in a foreign operation | | | — | | | | — | | | | — | | | | — | | | | — | | | | 708 | | | | — | | | | 708 | | | | — | | | | 708 | |
| | | | | | | | | | | | | | | | | | | | | | | | | | | | | | | | | | | | | | | | |
Comprehensive income of the year | | | — | | | | — | | | | — | | | | — | | | | — | | | | 8,272 | | | | (217,871 | ) | | | (209,599 | ) | | | 27,641 | | | | (181,958 | ) |
| | | | | | | | | | | | | | | | | | | | | | | | | | | | | | | | | | | | | | | | |
Transactions with shareholders: | | | | | | | | | | | | | | | | | | | | | | | | | | | | | | | | | | | | | | | | |
- Dividend distribution | | | — | | | | — | | | | — | | | | — | | | | — | | | | — | | | | — | | | | — | | | | (82,412 | ) | | | (82,412 | ) |
- Contributions (devolution) of non-controlling shareholders, net | | | — | | | | — | | | | — | | | | — | | | | — | | | | — | | | | — | | | | — | | | | (15,725 | ) | | | (15,725 | ) |
- Additional acquisition of non-controlling | | | — | | | | — | | | | — | | | | — | | | | (605 | ) | | | — | | | | — | | | | (605 | ) | | | (89 | ) | | | (694 | ) |
| | | | | | | | | | | | | | | | | | | | | | | | | | | | | | | | | | | | | | | | |
Total transactions with shareholders | | | — | | | | — | | | | — | | | | — | | | | (605 | ) | | | — | | | | — | | | | (605 | ) | | | (98,226 | ) | | | (98,831 | ) |
| | | | | | | | | | | | | | | | | | | | | | | | | | | | | | | | | | | | | | | | |
Balances as of December 31, 2020 | | | 871,918 | | | | 871,918 | | | | 132,011 | | | | 29,974 | | | | 1,131,574 | | | | (169,234 | ) | | | (728,637 | ) | | | 1,267,606 | | | | 327,690 | | | | 1,595,296 | |
| | | | | | | | | | | | | | | | | | | | | | | | | | | | | | | | | | | | | | | | |
The accompanying notes on pages 14 to 124 are an integral part of the consolidated financial statements.
AENZA S.A.A. (FORMERLY GRAÑA Y MONTERO S.A.A.) AND SUBSIDIARIES
CONSOLIDATED STATEMENT OF FINANCIAL POSITIONCASH FLOWS
(All amounts are expressed in thousands of S/ unless otherwise stated)
ASSETS
| | | | | | | | | | | | |
| | | | | | As at
December 31, | | | As at
December 31, | |
| | | Note | | | 2017 | | | 2018 | |
Current assets | | | | | | | | | | | | |
Cash and cash equivalents | | | 9 | | | | 626,180 | | | | 801,140 | |
Financial asset at fair value through profit or loss | | | | | | | 181 | | | | — | |
Trade accounts receivables, net | | | 11 | | | | 1,515,673 | | | | 1,007,828 | |
Work in progress, net | | | 12 | | | | 61,804 | | | | 28,538 | |
Accounts receivable from related parties | | | 13 | | | | 100,752 | | | | 34,903 | |
Other accounts receivable | | | 14 | | | | 765,445 | | | | 588,451 | |
Inventories, net | | | 15 | | | | 770,711 | | | | 514,047 | |
Prepaid expenses | | | | | | | 33,478 | | | | 10,549 | |
| | | | | | | | | | | | |
| | | | | | | 3,874,224 | | | | 2,985,456 | |
| | | |
Non-current assets classified as held for sale | | | 37 | | | | 17,722 | | | | 247,798 | |
| | | | | | | | | | | | |
Total current assets | | | | | | | 3,891,946 | | | | 3,233,254 | |
| | | | | | | | | | | | |
Non-current assets | | | | | | | | | | | | |
Long-term trade accounts receivable, net | | | 11 | | | | 907,587 | | | | 1,020,067 | |
Long-term work in progress, net | | | 12 | | | | 28,413 | | | | 32,212 | |
Long-term accounts receivable from related parties | | | 13 | | | | 773,930 | | | | 778,226 | |
Prepaid expenses | | | | | | | 38,082 | | | | 33,697 | |
Other long-term accounts receivable | | | 14 | | | | 470,852 | | | | 302,957 | |
Investments in associates and joint ventures | | | 16 | | | | 268,671 | | | | 257,765 | |
Investment property | | | | | | | 45,687 | | | | 29,133 | |
Property, plant and equipment, net | | | 17 | | | | 865,735 | | | | 470,554 | |
Intangible assets, net | | | 18 | | | | 940,070 | | | | 847,095 | |
Deferred income tax asset | | | 25 | | | | 436,697 | | | | 425,436 | |
| | | | | | | | | | | | |
Total non-current assets | | | | | | | 4,775,724 | | | | 4,197,142 | |
| | | | | | | | | | | | |
Total assets | | | | | | | 8,667,670 | | | | 7,430,396 | |
| | | | | | | | | | | | |
LIABILITIES AND EQUITY
| | | | | | | | | | | | |
| | | | | | As at
December 31, | | | As at
December 31, | |
| | | Note | | | 2017 | | | 2018 | |
Current liabilities | | | | | | | | | | | | |
Borrowings | | | 19 | | | | 1,056,764 | | | | 826,474 | |
Bonds | | | 20 | | | | 36,655 | | | | 39,167 | |
Trade accounts payable | | | 21 | | | | 1,453,046 | | | | 1,079,531 | |
Accounts payable to related parties | | | 13 | | | | 55,174 | | | | 55,941 | |
Current income tax | | | | | | | 85,543 | | | | 25,807 | |
Other accounts payable | | | 22 | | | | 848,500 | | | | 632,669 | |
Provisions | | | 23 | | | | 13,503 | | | | 6,197 | |
| | | | | | | | | | | | |
Total current liabilities | | | | | | | 3,549,185 | | | | 2,665,786 | |
| | | |
Non-current liabilities classified as held for sale | | | 37 | | | | — | | | | 225,828 | |
| | | | | | | | | | | | |
Total current liabilities | | | | | | | 3,549,185 | | | | 2,891,614 | |
| | | | | | | | | | | | |
Non-current liabilities | | | | | | | | | | | | |
Borrowings | | | 19 | | | | 633,299 | | | | 376,198 | |
Long-term bonds | | | 20 | | | | 910,912 | | | | 897,875 | |
Other long-term accounts payable | | | 22 | | | | 852,473 | | | | 574,110 | |
Long-term accounts payable to related parties | | | 13 | | | | 25,954 | | | | 21,849 | |
Provisions | | | 23 | | | | 33,914 | | | | 103,411 | |
Derivative financial instruments | | | | | | | 383 | | | | 61 | |
Deferred income tax liability | | | 25 | | | | 72,472 | | | | 75,347 | |
| | | | | | | | | | | | |
Total non-current liabilities | | | | | | | 2,529,407 | | | | 2,048,851 | |
| | | | | | | | | | | | |
Total liabilities | | | | | | | 6,078,592 | | | | 4,940,465 | |
| | | | | | | | | | | | |
Equity | | | 24 | | | | | | | | | |
Capital | | | | | | | 660,054 | | | | 729,434 | |
Legal reserve | | | | | | | 132,011 | | | | 132,011 | |
Voluntary reserve | | | | | | | 29,974 | | | | 29,974 | |
Share Premium | | | | | | | 881,795 | | | | 992,144 | |
Other reserves | | | | | | | (169,671 | ) | | | (170,620 | ) |
Retained earnings | | | | | | | 589,167 | | | | 375,417 | |
| | | | | | | | | | | | |
Equity attributable to controlling interest in the Company | | | | | | | 2,123,330 | | | | 2,088,360 | |
Non-controlling interest | | | | | | | 465,748 | | | | 401,571 | |
| | | | | | | | | | | | |
Total equity | | | | | | | 2,589,078 | | | | 2,489,931 | |
| | | | | | | | | | | | |
Total liabilities and equity | | | | | | | 8,667,670 | | | | 7,430,396 | |
| | | | | | | | | | | | |
| | | | | | | | | | | | | | |
| | | | | For the year
ended December 31, | |
| | | Note | | 2018 | | | 2019 | | | 2020 | |
OPERATING ACTIVITIES | | | | | | | | | | | | | | |
Loss before income tax | | | | | 168,408 | | | | (535,271 | ) | | | (131,900 | ) |
Adjustments to profit not affecting cash flows from operating activities: | | | | | | | | | | | | | | |
Depreciation | | 26 | | | 125,419 | | | | 112,318 | | | | 98,504 | |
Amortization | | 26 | | | 112,072 | | | | 107,499 | | | | 98,621 | |
Impairment of inventories | | 26 | | | — | | | | 4,503 | | | | 791 | |
Impairment of accounts receivable and other accounts receivable | | 26 | | | 65,076 | | | | 290,491 | | | | 134,964 | |
Reversal of impairment of inventories | | | | | (26,993 | ) | | | (4,752 | ) | | | (821 | ) |
Debt condonation | | | | | — | | | | (18,186 | ) | | | (9,451 | ) |
Impairment (reversal) of property, plant and equipment | | 26 | | | 5,664 | | | | 20,018 | | | | — | |
Impairment of intangible assets | | 28 | | | — | | | | 45,821 | | | | — | |
Reversal of impairment of accounts receivable | | | | | — | | | | (19,448 | ) | | | — | |
Reversal of impairment of intangible assets | | | | | — | | | | (20,676 | ) | | | — | |
Indemnification | | | | | 686 | | | | — | | | | — | |
Change in the fair value of the liability for put option | | 28 | | | (6,122 | ) | | | 4,697 | | | | 245 | |
Other provisions | | 22 | | | 75,369 | | | | 186,894 | | | | 126,896 | |
Financial expense, net | | | | | 177,649 | | | | 167,872 | | | | 225,212 | |
Impairment of investment | | | | | — | | | | 384 | | | | 38 | |
Incremental cost accrued | | | | | — | | | | — | | | | 8,875 | |
Share of the profit and loss of associates and joint ventures accounted for using the equity method | | 15 a)-b) | | | 3,709 | | | | 218,774 | | | | (770 | ) |
Reversal of provisions | | 22 | | | (6,218 | ) | | | (7,471 | ) | | | (33,264 | ) |
Disposal (reversal) of assets | | | | | 16,327 | | | | 349 | | | | 8,895 | |
Profit on sale of property, plant and equipment | | 16 | | | 7,105 | | | | (11,892 | ) | | | (2,322 | ) |
Loss on sale from available-for-sale financial assets | | | | | 1,529 | | | | — | | | | — | |
Profit on sale of investments in subsidiaries | | | | | (73,642 | ) | | | — | | | | — | |
Profit on remeasurement of accounts receivable | | | | | 25,110 | | | | 45,363 | | | | (25,888 | ) |
Net variations in assets and liabilities: | | | | | | | | | | | | | | |
Trade accounts receivable and working in progress | | | | | (236,011 | ) | | | 457,709 | | | | 131,674 | |
Other accounts receivable | | | | | 190,354 | | | | 148,833 | | | | (46,117 | ) |
Other accounts receivable from related parties | | | | | 24,609 | | | | (11,178 | ) | | | (20,641 | ) |
Inventories | | | | | 200,575 | | | | (34,091 | ) | | | 22,578 | |
Pre-paid expenses and other assets | | | | | 18,309 | | | | 4,964 | | | | (823 | ) |
Trade accounts payable | | | | | 10,917 | | | | 58,973 | | | | (42,062 | ) |
Other accounts payable | | | | | (311,848 | ) | | | (292,184 | ) | | | (58,011 | ) |
Other accounts payable to related parties | | | | | 92,613 | | | | (24,461 | ) | | | 3,591 | |
Other provisions | | | | | (6,615 | ) | | | (1,134 | ) | | | (9,051 | ) |
Interest payment | | | | | (188,704 | ) | | | (172,377 | ) | | | (137,369 | ) |
Payments for purchases of intangibles - Concessions | | | | | (10,305 | ) | | | (25,917 | ) | | | (3,519 | ) |
Payment of income tax | | | | | (175,769 | ) | | | (94,669 | ) | | | (112,851 | ) |
| | | | | | | | | | | | | | |
Net cash provided by operating activities | | | | | 279,273 | | | | 601,755 | | | | 226,024 | |
| | | | | | | | | | | | | | |
INVESTING ACTIVITIES | | | | | | | | | | | | | | |
Sale of investment | | | | | 229,045 | | | | — | | | | — | |
Sale of property, plant and equipment | | | | | 31,852 | | | | 18,607 | | | | 9,118 | |
Sale of non-current assets held for sale, net | | | | | 16,244 | | | | — | | | | — | |
Interest received | | | | | 36,508 | | | | 6,552 | | | | 4,292 | |
Dividends received | | 15 a)-b) | | | 1,823 | | | | 1,517 | | | | 2,318 | |
Payment for purchase of investments properties | | | | | (209 | ) | | | (88 | ) | | | (98 | ) |
Payments for intangible purchase | | | | | (86,799 | ) | | | (84,201 | ) | | | (46,767 | ) |
Payments for purchase and contributions on investment in associate and joint ventures | | | | | (3,770 | ) | | | — | | | | — | |
Payments for property, plant and equipment purchase | | | | | (80,765 | ) | | | (93,017 | ) | | | (33,596 | ) |
| | | | | | | | | | | | | | |
Net cash applied to investing activities | | | | | 143,929 | | | | (150,630 | ) | | | (64,733 | ) |
| | | | | | | | | | | | | | |
FINANCING ACTIVITIES | | | | | | | | | | | | | | |
Loans received | | | | | 1,018,744 | | | | 644,312 | | | | 185,644 | |
Amortization of loans received | | | | | (1,265,920 | ) | | | (1,130,301 | ) | | | (275,163 | ) |
Amortization of bonds issued | | | | | (28,914 | ) | | | (31,335 | ) | | | (37,981 | ) |
Payment for transaction costs for debt | | | | | — | | | | (4,770 | ) | | | — | |
Dividends paid to non-controlling interest | | 35 | | | (102,772 | ) | | | (12,762 | ) | | | (82,412 | ) |
Cash received (return of contributions) from non-controlling shareholders | | | | | (59,053 | ) | | | (32,996 | ) | | | (15,725 | ) |
Capital increase | | 23 | | | 137,603 | | | | 280,636 | | | | — | |
Acquisition or sale of interest in a subsidiary of non-controlling shareholders | | | | | 389 | | | | — | | | | — | |
| | | | | | | | | | | | | | |
Net cash applied to financing activities | | | | | (299,923 | ) | | | (287,216 | ) | | | (225,637 | ) |
| | | | | | | | | | | | | | |
Net increase (net decrease) in cash | | | | | 123,279 | | | | 163,909 | | | | (64,346 | ) |
Exchange difference | | | | | 57,756 | | | | (20,303 | ) | | | 13,813 | |
Cash and cash equivalents at the beginning of the year | | | | | 626,060 | | | | 807,095 | | | | 950,701 | |
| | | | | | | | | | | | | | |
Cash and cash equivalents at the end of the year | | 9 | | | 807,095 | | | | 950,701 | | | | 900,168 | |
| | | | | | | | | | | | | | |
NON-CASH TRANSACTIONS: | | | | | | | | | | | | | | |
Capitalization of interests | | | | | 3,361 | | | | 7,229 | | | | 4,887 | |
Acquisition of assets through finance leases | | | | | 2,365 | | | | 3,851 | | | | 71 | |
Accounts payable to the non-controlling interest for purchase of investments | | | | | 14,022 | | | | — | | | | — | |
Return of contribution in inventories | | | | | 25,389 | | | | — | | | | — | |
Acquisition of right-of-use assets | | | | | — | | | | 101,745 | | | | 12,075 | |
Deconsolidation from non-controlling interest | | | | | 54,069 | | | | — | | | | — | |
Reclassification to other accounts receivable by Concesionaria Vía Expresa Sur | | | | | — | | | | — | | | | 24,157 | |
Acquisition of supplier bonds | | | | | — | | | | — | | | | 25,871 | |
The accompanying notes on pages 914 to 113124 are an integral part of the consolidated financial statements.
- 3 -
AENZA S.A.A (FORMERLY GRAÑA Y MONTERO S.A.A.) AND SUBSIDIARIES
CONSOLIDATED STATEMENT OF INCOME
(All amounts are expressed in thousands of S/ unless otherwise stated)
| | | | | | | | | | | | | | |
| | | | | For the year
ended December 31, | |
| | | Note | | 2016 | | | 2017 | | | 2018 | |
| | | | | | | | (as restated) | | | | |
Revenues from construction activities | | | | | 2,713,013 | | | | 2,214,108 | | | | 1,961,100 | |
Revenues from services provided | | | | | 869,106 | | | | 956,300 | | | | 1,003,623 | |
Revenue from real estate and sale of goods | | | | | 555,190 | | | | 843,605 | | | | 934,739 | |
| | | | | | | | | | | | | | |
| | | | | 4,137,309 | | | | 4,014,013 | | | | 3,899,462 | |
| | | | | | | | | | | | | | |
Cost of construction activities | | | | | (2,683,703 | ) | | | (2,107,206 | ) | | | (1,921,112 | ) |
Cost of services provided | | | | | (763,193 | ) | | | (770,792 | ) | | | (741,172 | ) |
Cost of real estate and goods sold | | | | | (374,324 | ) | | | (633,563 | ) | | | (562,689 | ) |
| | | | | | | | | | | | | | |
| | 27 | | | (3,821,220 | ) | | | (3,511,561 | ) | | | (3,224,973 | ) |
| | | | | | | | | | | | | | |
Gross profit | | | | | 316,089 | | | | 502,452 | | | | 674,489 | |
| | | | |
Administrative expenses | | 27 | | | (278,303 | ) | | | (322,454 | ) | | | (278,433 | ) |
Other income and expenses | | 29 | | | (22,360 | ) | | | (32,869 | ) | | | (61,335 | ) |
Gain (loss) from the sale of investments | | | | | 46,336 | | | | 34,545 | | | | (7 | ) |
| | | | | | | | | | | | | | |
Operating profit | | | | | 61,762 | | | | 181,674 | | | | 334,714 | |
| | | | |
Financial expenses | | 28 | | | (198,055 | ) | | | (150,777 | ) | | | (247,982 | ) |
Financial income | | 28 | | | 18,225 | | | | 13,742 | | | | 50,925 | |
Share of the profit or loss in associates and joint ventures | | 16 a) b) | | | (590,066 | ) | | | 473 | | | | (3,709 | ) |
| | | | | | | | | | | | | | |
(Loss) profit before income tax | | | | | (708,134 | ) | | | 45,112 | | | | 133,948 | |
Income tax | | 30 | | | 152,182 | | | | (46,305 | ) | | | (113,318 | ) |
| | | | | | | | | | | | | | |
(Loss) profit from continuing operations | | | | | (555,952 | ) | | | (1,193 | ) | | | 20,630 | |
| | | | | | | | | | | | | | |
Profit from discontinued operations | | 37 | | | 104,354 | | | | 210,431 | | | | 36,785 | |
| | | | | | | | | | | | | | |
(Loss) profit for the year | | | | | (451,598 | ) | | | 209,238 | | | | 57,415 | |
| | | | | | | | | | | | | | |
(Loss) profit attributable to: | | | | | | | | | | | | | | |
Owners of the Company | | | | | (509,699 | ) | | | 148,738 | | | | (83,188 | ) |
Non-controlling interest | | | | | 58,101 | | | | 60,500 | | | | 140,603 | |
| | | | | | | | | | | | | | |
| | | | | (451,598 | ) | | | 209,238 | | | | 57,415 | |
| | | | | | | | | | | | | | |
Earnings (loss) per share from continuing operations attributable to owners of the Company during the year | | 35 | | | (0.772 | ) | | | 0.225 | | | | (0.125 | ) |
| | | | | | | | | | | | | | |
The accompanying notes on pages 9 to 113 are an integral part of the consolidated financial statements.
- 4 -
GRAÑA Y MONTERO S.A.A. AND SUBSIDIARIES
CONSOLIDATED STATEMENT OF COMPREHENSIVE INCOME
(All amounts are expressed in thousands of S/ unless otherwise stated)
| | | | | | | | | | | | | | |
| | | | | For the year
ended December 31, | |
| | | | | 2016 | | | 2017 | | | 2018 | |
Profit (loss) for the period | | | | | (451,598 | ) | | | 209,238 | | | | 57,415 | |
| | | | | | | | | | | | | | |
Other comprehensive income: | | | | | | | | | | | | | | |
Items that will not be reclassified to profit or loss | | | | | | | | | | | | | | |
Remeasurement of actuarial gains and losses, net of tax | | | | | (1,531 | ) | | | (4,031 | ) | | | 16,589 | |
| | | | | | | | | | | | | | |
Items that may be subsequently reclassified to profit or loss | | | | | | | | | | | | | | |
Cash flow hedge, net of tax | | | | | 883 | | | | 482 | | | | 119 | |
Foreign currency translation adjustment, net of tax | | | | | 14,307 | | | | (11,341 | ) | | | 5,733 | |
Change in value ofavailable-for-sale financial assets, net of tax | | | | | (2,220 | ) | | | — | | | | — | |
Transfer to profit or loss from sales ofavailable-for-sale financial assets, net of tax | | 10 | | | (41,461 | ) | | | — | | | | — | |
Exchange difference from net investment in a foreign operation, net of tax | | | | | 7,860 | | | | 6,610 | | | | (8,147 | ) |
Exchange difference from foreign net investment, net of tax | | | | | 1,563 | | | | — | | | | — | |
| | | | | | | | | | | | | | |
| | | | | (19,068 | ) | | | (4,249 | ) | | | (2,295 | ) |
| | | | | | | | | | | | | | |
Other comprehensive income for the period, net of tax | | | | | (20,599 | ) | | | (8,280 | ) | | | 14,294 | |
| | | | | | | | | | | | | | |
Total comprehensive income for the period | | | | | (472,197 | ) | | | 200,958 | | | | 71,709 | |
| | | | | | | | | | | | | | |
Comprehensive income attributable to: | | | | | | | | | | | | | | |
Owners of the Company | | | | | (534,492 | ) | | | 143,575 | | | | (67,548 | ) |
Non-controlling interest | | | | | 62,295 | | | | 57,383 | | | | 139,257 | |
| | | | | | | | | | | | | | |
| | | | | (472,197 | ) | | | 200,958 | | | | 71,709 | |
| | | | | | | | | | | | | | |
Comprehensive income attributable to owners of the Company: | | | | | | | | | | | | | | |
Continuing operations | | | | | (639,371 | ) | | | (62,773 | ) | | | (131,284 | ) |
Discontinued operations | | | | | 104,879 | | | | 206,348 | | | | 63,736 | |
| | | | | | | | | | | | | | |
| | | | | (534,492 | ) | | | 143,575 | | | | (67,548 | ) |
| | | | | | | | | | | | | | |
The accompanying notes on pages 9 to 113 are an integral part of the consolidated financial statements.
- 5 -
GRAÑA Y MONTERO S.A.A. AND SUBSIDIARIES
CONSOLIDATED STATEMENT OF CHANGES IN EQUITY
FOR THE YEAR DECEMBER 31, 2016, 2017 AND 2018
(All amounts are expressed in thousands of S/ unless otherwise stated)
| | | | | | | | | | | | | | | | | | | | | | | | | | | | | | | | | | | | | | | | |
| | | Attributable to the controlling interests of the Company | | | | | | | |
| | | Number
of shares
In thousands | | | Capital | | | Legal
reserve | | | Voluntary
reserve | | | Share
Premium | | | Other
reserves | | | Retained
earnings | | | Total | | | Non-controlling
interest | | | Total | |
Balances as of January 1, 2016 | | | 660,054 | | | | 660,054 | | | | 132,011 | | | | 29,974 | | | | 897,532 | | | | (143,784 | ) | | | 982,987 | | | | 2,558,774 | | | | 523,138 | | | | 3,081,912 | |
| | | | | | | | | | | | | | | | | | | | | | | | | | | | | | | | | | | | | | | | |
(Loss) profit for the year | | | — | | | | — | | | | — | | | | — | | | | — | | | | — | | | | (509,699 | ) | | | (509,699 | ) | | | 58,101 | | | | (451,598 | ) |
Cash flow hedge | | | — | | | | — | | | | — | | | | — | | | | — | | | | 839 | | | | — | | | | 839 | | | | 44 | | | | 883 | |
Adjustment for actuarial gains and losses | | | — | | | | — | | | | — | | | | — | | | | — | | | | — | | | | (1,121 | ) | | | (1,121 | ) | | | (410 | ) | | | (1,531 | ) |
Foreign currency translation adjustment | | | — | | | | — | | | | — | | | | — | | | | — | | | | 9,885 | | | | — | | | | 9,885 | | | | 4,422 | | | | 14,307 | |
Change in value ofavailable-for-sale financial assets | | | — | | | | — | | | | — | | | | — | | | | — | | | | (2,220 | ) | | | — | | | | (2,220 | ) | | | — | | | | (2,220 | ) |
Transfer to profit or loss for sale of investment ofavailable-for-sale financial assets, net of tax | | | — | | | | — | | | | — | | | | — | | | | — | | | | (41,461 | ) | | | — | | | | (41,461 | ) | | | — | | | | (41,461 | ) |
Exchange difference from net investment in a foreign operation | | | — | | | | — | | | | — | | | | — | | | | — | | | | 7,722 | | | | — | | | | 7,722 | | | | 138 | | | | 7,860 | |
Transfer to profit or loss of exchange difference from net investment in a foreign operation, net of tax | | | — | | | | — | | | | — | | | | — | | | | — | | | | 1,563 | | | | — | | | | 1,563 | | | | — | | | | 1,563 | |
| | | | | | | | | | | | | | | | | | | | | | | | | | | | | | | | | | | | | | | | |
Comprehensive income of the year | | | — | | | | — | | | | — | | | | — | | | | — | | | | (23,672 | ) | | | (510,820 | ) | | | (534,492 | ) | | | 62,295 | | | | (472,197 | ) |
| | | | | | | | | | | | | | | | | | | | | | | | | | | | | | | | | | | | | | | | |
Transactions with shareholders: | | | | | | | | | | | | | | | | | | | | | | | | | | | | | | | | | | | | | | | | |
- Dividend distribution (Note 36 d) | | | — | | | | — | | | | — | | | | — | | | | — | | | | — | | | | (30,853 | ) | | | (30,853 | ) | | | (25,473 | ) | | | (56,326 | ) |
- Contributions (devolution) ofnon-controlling shareholders, net (Note 36 c) | | | — | | | | — | | | | — | | | | — | | | | — | | | | — | | | | — | | | | — | | | | (19,099 | ) | | | (19,099 | ) |
- Additional acquisition ofnon-controlling interest (Note 36 a) | | | — | | | | — | | | | — | | | | — | | | | (15,167 | ) | | | — | | | | — | | | | (15,167 | ) | | | (35,972 | ) | | | (51,139 | ) |
- Sale tonon-controlling interest | | | — | | | | — | | | | — | | | | — | | | | 99 | | | | — | | | | — | | | | 99 | | | | 236 | | | | 335 | |
- Purchase of subsidiaries | | | — | | | | — | | | | — | | | | — | | | | — | | | | — | | | | — | | | | — | | | | 4,153 | | | | 4,153 | |
- Deconsolidation of former subsidiary | | | — | | | | — | | | | — | | | | — | | | | — | | | | — | | | | 2,063 | | | | 2,063 | | | | 35 | | | | 2,098 | |
| | | | | | | | | | | | | | | | | | | | | | | | | | | | | | | | | | | | | | | | |
Total transactions with shareholders | | | — | | | | — | | | | — | | | | — | | | | (15,068 | ) | | | — | | | | (28,790 | ) | | | (43,858 | ) | | | (76,120 | ) | | | (119,978 | ) |
| | | | | | | | | | | | | | | | | | | | | | | | | | | | | | | | | | | | | | | | |
Balances as of December 31, 2016 | | | 660,054 | | | | 660,054 | | | | 132,011 | | | | 29,974 | | | | 882,464 | | | | (167,456 | ) | | | 443,377 | | | | 1,980,424 | | | | 509,313 | | | | 2,489,737 | |
| | | | | | | | | | | | | | | | | | | | | | | | | | | | | | | | | | | | | | | | |
Balances as of January 1, 2017 | | | 660,054 | | | | 660,054 | | | | 132,011 | | | | 29,974 | | | | 882,464 | | | | (167,456 | ) | | | 443,377 | | | | 1,980,424 | | | | 509,313 | | | | 2,489,737 | |
| | | | | | | | | | | | | | | | | | | | | | | | | | | | | | | | | | | | | | | | |
Profit for the year | | | — | | | | — | | | | — | | | | — | | | | — | | | | — | | | | 148,738 | | | | 148,738 | | | | 60,500 | | | | 209,238 | |
Cash flow hedge | | | — | | | | — | | | | — | | | | — | | | | — | | | | 458 | | | | — | | | | 458 | | | | 24 | | | | 482 | |
Adjustment for actuarial gains and losses | | | — | | | | — | | | | — | | | | — | | | | — | | | | — | | | | (2,948 | ) | | | (2,948 | ) | | | (1,083 | ) | | | (4,031 | ) |
Foreign currency translation adjustment | | | — | | | | — | | | | — | | | | — | | | | — | | | | (9,166 | ) | | | — | | | | (9,166 | ) | | | (2,175 | ) | | | (11,341 | ) |
Exchange difference from net investment in a foreign operation | | | — | | | | — | | | | — | | | | — | | | | — | | | | 6,493 | | | | — | | | | 6,493 | | | | 117 | | | | 6,610 | |
| | | | | | | | | | | | | | | | | | | | | | | | | | | | | | | | | | | | | | | | |
Comprehensive income of the year | | | — | | | | — | | | | — | | | | — | | | | — | | | | (2,215 | ) | | | 145,790 | | | | 143,575 | | | | 57,383 | | | | 200,958 | |
| | | | | | | | | | | | | | | | | | | | | | | | | | | | | | | | | | | | | | | | |
Transactions with shareholders: | | | | | | | | | | | | | | | | | | | | | | | | | | | | | | | | | | | | | | | | |
- Dividend distribution (Note 36 d) | | | — | | | | — | | | | — | | | | — | | | | — | | | | — | | | | — | | | | — | | | | (59,677 | ) | | | (59,677 | ) |
- Contributions (devolution) ofnon-controlling shareholders, net | | | — | | | | — | | | | — | | | | — | | | | — | | | | — | | | | — | | | | — | | | | (33,197 | ) | | | (33,197 | ) |
- Additional acquisition ofnon-controlling interest (Note 36 a) | | | — | | | | — | | | | — | | | | — | | | | (669 | ) | | | — | | | | — | | | | (669 | ) | | | (273 | ) | | | (942 | ) |
- Deconsolidation of former subsidiary | | | — | | | | — | | | | — | | | | — | | | | — | | | | — | | | | — | | | | — | | | | (7,801 | ) | | | (7,801 | ) |
| | | | | | | | | | | | | | | | | | | | | | | | | | | | | | | | | | | | | | | | |
Total transactions with shareholders | | | — | | | | — | | | | — | | | | — | | | | (669 | ) | | | — | | | | — | | | | (669 | ) | | | (100,948 | ) | | | (101,617 | ) |
| | | | | | | | | | | | | | | | | | | | | | | | | | | | | | | | | | | | | | | | |
Balances as of December 31, 2017 | | | 660,054 | | | | 660,054 | | | | 132,011 | | | | 29,974 | | | | 881,795 | | | | (169,671 | ) | | | 589,167 | | | | 2,123,330 | | | | 465,748 | | | | 2,589,078 | |
| | | | | | | | | | | | | | | | | | | | | | | | | | | | | | | | | | | | | | | | |
Balances as of January 1, 2018 | | | 660,054 | | | | 660,054 | | | | 132,011 | | | | 29,974 | | | | 881,795 | | | | (169,671 | ) | | | 589,167 | | | | 2,123,330 | | | | 465,748 | | | | 2,589,078 | |
| | | | | | | | | | | | | | | | | | | | | | | | | | | | | | | | | | | | | | | | |
- IFRS adoption | | | — | | | | — | | | | — | | | | — | | | | — | | | | — | | | | (52,564 | ) | | | (52,564 | ) | | | (979 | ) | | | (53,543 | ) |
| | | | | | | | | | | | | | | | | | | | | | | | | | | | | | | | | | | | | | | | |
Initial balances restated | | | 660,054 | | | | 660,054 | | | | 132,011 | | | | 29,974 | | | | 881,795 | | | | (169,671 | ) | | | 536,603 | | | | 2,070,766 | | | | 464,769 | | | | 2,535,535 | |
| | | | | | | | | | | | | | | | | | | | | | | | | | | | | | | | | | | | | | | | |
(Loss) profit for the year | | | — | | | | — | | | | — | | | | — | | | | — | | | | — | | | | (83,188 | ) | | | (83,188 | ) | | | 140,603 | | | | 57,415 | |
Cash flow hedge | | | — | | | | — | | | | — | | | | — | | | | — | | | | 113 | | | | — | | | | 113 | | | | 6 | | | | 119 | |
Adjustment for actuarial gains and losses | | | — | | | | — | | | | — | | | | — | | | | — | | | | — | | | | 16,589 | | | | 16,589 | | | | — | | | | 16,589 | |
Foreign currency translation adjustment | | | — | | | | — | | | | — | | | | — | | | | — | | | | 6,930 | | | | — | | | | 6,930 | | | | (1,197 | ) | | | 5,733 | |
Exchange difference from net investment in a foreign operation | | | — | | | | — | | | | — | | | | — | | | | — | | | | (7,992 | ) | | | — | | | | (7,992 | ) | | | (155 | ) | | | (8,147 | ) |
| | | | | | | | | | | | | | | | | | | | | | | | | | | | | | | | | | | | | | | | |
Comprehensive income of the year | | | — | | | | — | | | | — | | | | — | | | | — | | | | (949 | ) | | | (66,599 | ) | | | (67,548 | ) | | | 139,257 | | | | 71,709 | |
| | | | | | | | | | | | | | | | | | | | | | | | | | | | | | | | | | | | | | | | |
Transactions with shareholders: | | | | | | | | | | | | | | | | | | | | | | | | | | | | | | | | | | | | | | | | |
- Dividend distribution (Note 36 d) | | | — | | | | — | | | | — | | | | — | | | | — | | | | — | | | | — | | | | — | | | | (102,772 | ) | | | (102,772 | ) |
- Contributions (devolution) ofnon-controlling shareholders, net | | | — | | | | — | | | | — | | | | — | | | | — | | | | — | | | | — | | | | — | | | | (84,442 | ) | | | (84,442 | ) |
- Additional acquisition ofnon-controlling interest (Note 36 a) | | | — | | | | — | | | | — | | | | — | | | | (9,583 | ) | | | — | | | | — | | | | (9,583 | ) | | | (4,050 | ) | | | (13,633 | ) |
- Capital Increase | | | 69,380 | | | | 69,380 | | | | — | | | | — | | | | 68,223 | | | | — | | | | — | | | | 137,603 | | | | — | | | | 137,603 | |
- Deconsolidation CAM Group | | | — | | | | — | | | | — | | | | — | | | | — | | | | — | | | | (42,878 | ) | | | (42,878 | ) | | | 18,221 | | | | (24,657 | ) |
- Deconsolidation Stracon GyM | | | — | | | | — | | | | — | | | | — | | | | 51,709 | | | | — | | | | (51,709 | ) | | | — | | | | (29,412 | ) | | | (29,412 | ) |
| | | | | | | | | | | | | | | | | | | | | | | | | | | | | | | | | | | | | | | | |
Total transactions with shareholders | | | 69,380 | | | | 69,380 | | | | — | | | | — | | | | 110,349 | | | | — | | | | (94,587 | ) | | | 85,142 | | | | (202,455 | ) | | | (117,313 | ) |
| | | | | | | | | | | | | | | | | | | | | | | | | | | | | | | | | | | | | | | | |
Balances as of December 31, 2018 | | | 729,434 | | | | 729,434 | | | | 132,011 | | | | 29,974 | | | | 992,144 | | | | (170,620 | ) | | | 375,417 | | | | 2,088,360 | | | | 401,571 | | | | 2,489,931 | |
| | | | | | | | | | | | | | | | | | | | | | | | | | | | | | | | | | | | | | | | |
The accompanying notes on pages 9 to 113 are an integral part of the consolidated financial statements.
- 6 -
GRAÑA Y MONTERO S.A.A. AND SUBSIDIARIES
(All amounts are expressed in thousands of S/ unless otherwise stated)
CONSOLIDATED STATEMENT OF CASH FLOWS
| | | | | | | | | | | | | | | | |
| | | | | | For the year
ended December 31, | |
| | | Note | | | 2016 | | | 2017 | | | 2018 | |
OPERATING ACTIVITIES | | | | | | | | | | | | | | | | |
(Loss) profit before income tax | | | | | | | (603,780 | ) | | | 255,543 | | | | 170,733 | |
Adjustments to profit not affecting cash flows from operating activities: | | | | | | | | | | | | | | | | |
Depreciation | | | 27 | | | | 205,522 | | | | 199,794 | | | | 125,419 | |
Amortization of other assets | | | 27 | | | | 82,743 | | | | 86,557 | | | | 112,072 | |
Impairment of inventories | | | 27 | | | | 36,353 | | | | 40,908 | | | | — | |
Impairment of accounts receivable and other accounts receivable | | | 27 | | | | 419,584 | | | | 19,109 | | | | 65,076 | |
Reversal of impairment of inventories | | | | | | | — | | | | — | | | | (26,993 | ) |
Debt condonation | | | 5.1-f) | | | | (431,484 | ) | | | — | | | | — | |
Impairment of property, plant and equipment | | | 27 | | | | 9,263 | | | | 14,680 | | | | 5,664 | |
Impairment of intangible assets | | | 29 | | | | 54,308 | | | | 49,609 | | | | — | |
Financial expenses-CCDS | | | | | | | 7,004 | | | | — | | | | — | |
Expenses for liquidation of works - CCDS | | | | | | | 164 | | | | — | | | | — | |
Indemnification | | | | | | | (33,600 | ) | | | 3,220 | | | | 686 | |
Profit on fair value of financial asset at fair value through profit or loss | | | | | | | 31 | | | | (34 | ) | | | — | |
Change in the fair value of the liability for put option | | | 23 | | | | (984 | ) | | | (1,400 | ) | | | (6,122 | ) |
Provisions | | | 23 | | | | 9,486 | | | | 9,510 | | | | 75,369 | |
Proceeds from the returned sale of Morelco | | | | | | | (6,658 | ) | | | — | | | | — | |
Remeasurement of purchase consideration of Morelco | | | | | | | (7,166 | ) | | | — | | | | — | |
Financial expense,net | | | | | | | 106,739 | | | | 138,016 | | | | 177,649 | |
Other provisions in CCDS | | | | | | | 24,915 | | | | — | | | | — | |
Share of the profit and loss in associates and joint ventures under the equity method of accounting | | | 16 a) b) | | | | 589,710 | | | | (1,327 | ) | | | 3,709 | |
Reversal of provisions | | | 23 | | | | (17,883 | ) | | | (1,044 | ) | | | (6,218 | ) |
Disposal of assets | | | | | | | 3,951 | | | | 5,438 | | | | 16,327 | |
Disposal of investments | | | | | | | 1,227 | | | | 106 | | | | — | |
(Profit) loss on sale of property, plant and equipment | | | 17 | | | | (18,393 | ) | | | (26,883 | ) | | | 7,105 | |
Loss on sale of financial assets at fair value through profit or loss | | | | | | | 221 | | | | — | | | | — | |
Loss on sale ofnon-current asset held for sale | | | | | | | 22 | | | | 45 | | | | — | |
(Profit) loss on sale ofavailable-for-sale financial assets | | | 10 | | | | (46,337 | ) | | | (25,768 | ) | | | 1,529 | |
Profit on sale of investments in subsidiaries | | | | | | | — | | | | (244,313 | ) | | | (73,642 | ) |
Loss on remeasurement of accounts receivable | | | | | | | 76,864 | | | | 15,807 | | | | 25,110 | |
Loss on remeasurement of investment | | | | | | | 6,832 | | | | — | | | | — | |
Net variations in assets and liabilities: | | | | | | | | | | | | | | | | |
Trade accounts receivable and unbilled working in progress | | | | | | | 115,263 | | | | (213,126 | ) | | | (236,011 | ) |
Other accounts receivable | | | | | | | (85,234 | ) | | | 33,196 | | | | 190,354 | |
Other accounts receivable from related parties | | | | | | | 84,448 | | | | (245,688 | ) | | | 24,609 | |
Inventories | | | | | | | 33,709 | | | | 279,867 | | | | 200,575 | |
Pre-paid expenses and other assets | | | | | | | (99 | ) | | | (6,494 | ) | | | 18,309 | |
Trade accounts payable | | | | | | | (87,553 | ) | | | 463,401 | | | | 10,917 | |
Other accounts payable | | | | | | | 156,261 | | | | 49,319 | | | | (311,848 | ) |
Other accounts payable to related parties | | | | | | | 45,902 | | | | (66,819 | ) | | | 92,613 | |
Provisions | | | | | | | (2,756 | ) | | | (1,680 | ) | | | (6,615 | ) |
Interest payment | | | | | | | (171,572 | ) | | | (173,662 | ) | | | (188,704 | ) |
Payments for purchases of intangibles - Concessions | | | | | | | (97,711 | ) | | | (20,178 | ) | | | (10,305 | ) |
Payment of income tax | | | | | | | (125,619 | ) | | | (144,545 | ) | | | (178,094 | ) |
| | | | | | | | | | | | | | | | |
Net cash provided by operating activities | | | | | | | 333,693 | | | | 491,164 | | | | 279,273 | |
| | | | | | | | | | | | | | | | |
- 7 -
GRAÑA Y MONTERO S.A.A. AND SUBSIDIARIES
(All amounts are expressed in thousands of S/ unless otherwise stated)
CONSOLIDATED STATEMENT OF CASH FLOWS
| | | | | | | | | | | | | | | | |
| | | | | | For the year
ended December 31, | |
| | | Note | | | 2016 | | | 2017 | | | 2018 | |
INVESTING ACTIVITIES | | | | | | | | | | | | | | | | |
Sale of investment | | | | | | | 107,341 | | | | 391,786 | | | | 222,971 | |
Sale of property, plant and equipment | | | | | | | 66,086 | | | | 127,221 | | | | 31,852 | |
Sale of financial asset at fair value through profit or loss | | | | | | | 1,427 | | | | 98 | | | | — | |
Sale ofnon-current assets held for sale | | | | | | | 117 | | | | 43,367 | | | | 16,244 | |
Refunding for price adjustment - Morelco | | | | | | | 6,658 | | | | — | | | | — | |
Return of contributions | | | | | | | 1,963 | | | | — | | | | — | |
Interest received | | | | | | | 15,370 | | | | 6,992 | | | | 36,508 | |
Dividends received | | | 16 a) b) | | | | 27,992 | | | | 3,758 | | | | 1,823 | |
Payment for purchase of investments properties | | | | | | | (17,543 | ) | | | (1,183 | ) | | | (209 | ) |
Payments for intangible purchase | | | | | | | (45,706 | ) | | | (97,112 | ) | | | (86,799 | ) |
Payments for purchase and contributions on investment in associate and joint ventures | | | | | | | (389,657 | ) | | | (2,116 | ) | | | (3,770 | ) |
Payments for property, plant and equipment purchase | | | | | | | (147,732 | ) | | | (123,941 | ) | | | (80,765 | ) |
| | | | | | | | | | | | | | | | |
Net cash (applied to) provided by investing activities | | | | | | | (373,684 | ) | | | 348,870 | | | | 137,855 | |
| | | | | | | | | | | | | | | | |
FINANCING ACTIVITIES | | | | | | | | | | | | | | | | |
Loans received | | | | | | | 3,941,750 | | | | 1,415,113 | | | | 1,018,744 | |
Bonds issued | | | | | | | 178,640 | | | | — | | | | — | |
Amortization of loans received | | | | | | | (3,914,570 | ) | | | (2,044,256 | ) | | | (1,265,920 | ) |
Amortization of bonds issued | | | | | | | (25,281 | ) | | | (39,151 | ) | | | (28,914 | ) |
Payment for transaction costs for debt | | | | | | | (650 | ) | | | (31,286 | ) | | | — | |
Dividends paid to owners of the parent | | | | | | | (30,853 | ) | | | — | | | | — | |
Dividends paid tonon-controlling interest | | | 36 d) | | | | (25,473 | ) | | | (43,942 | ) | | | (102,772 | ) |
Cash received (return of contributions) fromnon-controlling shareholders | | | | | | | (19,099 | ) | | | (33,197 | ) | | | (59,053 | ) |
Capital increase | | | 24 | | | | — | | | | — | | | | 137,603 | |
Acquisition or sale of interest in a subsidiary ofnon-controlling shareholders | | | | | | | (18,702 | ) | | | (942 | ) | | | 389 | |
| | | | | | | | | | | | | | | | |
Net cash provided by (applied to) financing activities | | | | | | | 85,762 | | | | (777,661 | ) | | | (299,923 | ) |
| | | | | | | | | | | | | | | | |
Net increase (net decrease) in cash | | | | | | | 45,771 | | | | 62,373 | | | | 117,205 | |
Exchange difference | | | | | | | (1,219 | ) | | | (34,867 | ) | | | 57,756 | |
Cash and cash equivalents at the beginning of the year | | | | | | | 554,002 | | | | 598,554 | | | | 626,060 | |
| | | | | | | | | | | | | | | | |
Cash and cash equivalents at the end of the year | | | 9 | | | | 598,554 | | | | 626,060 | | | | 801,021 | |
| | | | | | | | | | | | | | | | |
NON-CASH TRANSACTIONS: | | | | | | | | | | | | | | | | |
Debt capitalization | | | | | | | 8,308 | | | | — | | | | — | |
Interest debt capitalization | | | | | | | — | | | | 26,015 | | | | 3,361 | |
Acquisition of assets through finance leases | | | | | | | 65,336 | | | | 48,507 | | | | 2,365 | |
Recognition of debt due to termination of GSP | | | | | | | 608,247 | | | | — | | | | | |
Accounts payable to thenon-controlling interest for purchase of investments | | | | | | | — | | | | — | | | | 14,022 | |
Return of contribution in inventories | | | | | | | — | | | | — | | | | 25,389 | |
Dividends declared tonon-controlling interest | | | | | | | — | | | | 15,735 | | | | — | |
Deconsolidation from non-controlling interest | | | | | | | — | | | | 7,801 | | | | 54,069 | |
The accompanying notes on pages 9 to 113 are an integral part of the consolidated financial statements.
- 8 -
GRAÑA Y MONTERO S.A.A. AND SUBSIDIARIES
NOTES TO THE CONSOLIDATED FINANCIAL STATEMENTS
DECEMBER 31, 2016, 20172018, 2019 AND 20182020
| | a) | Incorporation and operations |
AENZA S.A.A., formerly Graña y Montero S.A.A. (hereinafter the Company)“Company”) was incorporated in PeruPerú on August 12, 1996, as a result of the equityspin-off of Inversiones GyM S.A. (formerly Graña y Montero S.A.). The Company’s legal address is Av. Paseo de la RepublicaRepública 4675, Surquillo Lima, PeruPerú and is listed on the Lima Stock Exchange and the New York Stock Exchange (NYSE).
The Company is the parent of the Graña y Montero GroupAENZA Corporation that includes the Company and its subsidiaries (hereinafter, the “Group”“Corporation”) and is mainly engaged in holding investments in different GroupCorporation companies. Additionally,In addition, the Company provides strategic and functional services of general management, financial management, commercial management, legal advisory, human resources management and leases office spaceleases to the Group companies.companies of the Corporation.
The GroupGeneral Shareholder’s Meeting on November 2, 2020 approved the modification of the Company’s name from Graña y Montero S.A.A. to AENZA S.A.A., which is effective as of February 4, 2021.
The Corporation is a conglomerate of companies withwhose operations includingencompass different business activities where, the most significant are engineering and construction, infrastructure (public concession ownership and operation) and real estate businesses.businesss. See details of operating segments in Note 7.
| | b) | Authorization for the issue of the financial statements |
The consolidated financial statements for the year ended December 31, 2018,2020, have been prepared and issued with authorization of Management and the Board of Directors’ authorization on March 7, 2019,5, 2021, and will be submitted for consideration and approval atwere approved on the General Shareholders’ Meeting hold on March 31, 2021.
Since the date of approval of the financial statements by our shareholders until the date hereof, subsequent events with material impact on our results have occurred and as a result, we have recorded such impacts herein. For example, we have made considerable progress in the negotiations of the Company’s plea bargain agreement that has allowed us to be heldreassess our estimate of our exposure to the contingencies including within the term established by Peruvian law. Management expects that theits scope.
The consolidated financial statements as offor the year ended December 31, 2018, will be2019 were approved with no changes.on the Annual General Mandatory Shareholder’s Meeting on July 13, 2020.
| | c) | Current situation of the Company |
The Corporation is involved in a series of criminal investigations conducted by the Public Ministry and administrative proceedings conducted by INDECOPI based on events that mainly occurred between years 2003 and 2015. Such situations led to significant changes at Corporation’s corporate governance structure, the opening of independent investigations and the adoption of measures to address and clarify these situations, as explained below:
| 1) | Projects conducted in association with companies of the Odebrecht Group
|
Our
On January 9, 2017, the Board of Directors approved the opening of an independent investigation related to six projects developed in association with companies of the Odebrecht Group.
On March 2, 2017, a new Chief Executive Officer was appointed and on March 31, 2017, the shareholders appointed a new Board of Directors with an independent majority, all non-executive directors, introducing fundamental changes in the corporate governance and culture of the Corporation.
On March 30, 2017, the Board of Directors created the Risk and Compliance Committee, who was in charge of the oversight of the investigation independently from Management. The investigation was conducted by an external law firm with the assistance of forensic accountants, who reported exclusively to the Risk and Compliance Committee.
The external investigation concluded on November 2, 2017 and identified no evidence to conclude that any company personnel engaged in bribery in connection with any of our company’s public projects in Peru with Odebrecht or its subsidiaries, or that any company personnel was aware of, or knowingly participated in, any corrupt payments made in relation to such projects.
As new information emerged, the Company’s Board of Directors continued to investigate the facts that were the subject of the criminal investigations, including matters relating to the “Construction Club”, which scope was outside of the prior investigation. After an extensive and onedetailed review process, it was decided to share all the findings with the Peruvian authorities within the framework of a plea bargain process, in line with the Company’s commitment to transparency and integrity.
Subsequently, in August 2019, José Graña Miró Quesada, a shareholder and former chairman of our Company’s Board of Directors, publicly announced that he and Hernando Graña Acuña, a shareholder and former member of the Company’s Board of Director’s, had initiated a process of plea bargaining to cooperate with Peruvian prosecutors in relation to the investigations of “Lava Jato” case and others in progress. Due to the reserved nature of the plea bargain process, it is impossible for us to know or verify the statements made by the aforementioned persons within the scope of those processes. Any admission or other evidence provided that corroborate wrongdoing could be inconsistent with the investigations carried out and could have a significant impact on the conclusions.
As a result of its subsidiariescontribution to the investigations, on December 27, 2019, the Company signed a preliminary agreement whereby the Anti-Corruption Prosecutor Office and the Ad Hoc Prosecutor’s Office promise to execute a final plea bargain agreement with the Company that would provide the Company with certainty regarding the contingencies it faces as a result of the above-mentioned processes. Additionally, in the aforementioned preliminary agreement, the Anti-Corruption Prosecutor Office and the Ad Hoc Attorney General’s Office authorize the Company to disclose the existence of the agreement but to maintain its content confidential.
The outbreak of the Covid-19 pandemic in Peru suspended the negotiations of the plea bargain agreement in March 2020 and such negotiations discussions resumed in July 2020. The Company has made substantial progress in the negotiations and expects to execute an agreements soon which will then be submitted to judicial approval.
At the same time, since the beginning of year 2017, the new administration together with the new Board of Directors began a transformation process based on the principles of Truth, Transparency and Integrity, making profound changes in the organization supported by a Board of Directors with an independent majority, as well as the creation of new governance practices, such as the Corporate Risk Management and autonomous Compliance function, with direct report to the Board of Directors, among other actions.
Criminal investigations derived from projects developed in partnership with companies of the Odebrecht Group
In connection with the Lava Jato case, the Company participated as a minority partnerspartner of Odebrecht Group companies, directly or through its subsidiaries, in certain entities or consortiums that developed six infrastructure projects in Peru with companies belonging to the group Odebrecht (hereinafter Odebrecht). projects.
In 2016, Odebrecht entered into a Pleaan Agreement with the authorities of the United States Department of Justice and the Office of the District Attorney for the Eastern District of New York by which it admitted corruption acts in connection with twosome of these projects (tranches 2 and 3 ofin which the Interoceanica Sur highway (“IIRSA Sur”) and the project to construct the Lima Metro (Electric Train)). As a result of this agreement, the Peruvian authorities opened investigations for admitted illicit activities.Company participate as minority partner, which are mentioned below:
With respect to the investigations conducted inIIRSA Sur
In relation to investigations on IIRSA Sur, the Public Prosecutor’s Office indicted the former Chairman of the Board of Directors was included as a subject of an investigation for collusion;collusion, and a former director and a former executive was included as a subject of an investigation for money laundering. Subsequently, AENZA S.A.A. and Cumbra Peru S.A. (formerly GyM S.A.). were included as civilly liable third-party responsible in the process, which means that it will be assessed whether the obligation to indemnify Government for damages resulting from the facts under investigation will be imposed on these entities.
Electric Train Construction Project
The first Preparatory Investigation Court of the Judiciary decided to incorporate Cumbra Peru S.A. as civilly liable third-party responsible in the process related to the construction of the Electric train construction Project, tranches 1 and 2. In this investigation a former Chairman of the Board of Directors, a former Director and a former executiveManager have been charged.
Gasoducto Sur Peruano (GSP)
In year 2019, the Company concluded that it may have exposure with respect to the preliminary investigation process conducted in relation to GSP (the South Peruvian Gas Pipeline project). As of the date hereof, the Company for money laundering. Subsequently, Graña y Montero S.A.A. and GyM S.A. were incorporated as subjects investigated in the case described above. The companies appealed this decision, and later the Superior Court ruled in favor of both companies.
In addition, Graña y Montero S.A.A. and GyM S.A. havehas not been incorporated as civilly liable third parties in the investigation process, which means that the court will assess whether these entities are obligated to compensate the Peruvian Government for damages suffered as a result of the facts under investigation.
- 9 -
GyM S.A. has beenindicted or incorporated as a civilly liable third partythird-party or as an investigated legal person.
Subsequently, in 2020, the process relatedCompany and its legal advisors concluded that there is exposure to the Electric Train construction project, tranches 1 and 2. However, hitherto, no current or past director or officer ofpreliminary investigation process conducted in relation to the IIRSA Norte project. To date, the Company has not been incorporated either as a responsible civil third party or as an investigated legal person.
Criminal investigations in the investigation.
On July 11, 2017, the Peruvian Commission for Free Competition (“Indecopi”) initiated an investigation against several construction companies, including GyM S.A., about the existence of an alleged cartel calledrelation to the Construction Club. Throughout the investigation, GyM S.A. has provided to Indecopi with all the information requested and continues collaborating with the ongoing investigations.Club case
The Company’s former commercial manager is under a criminal investigation, as well as other individuals related to other construction companies. GyMCumbra Peru S.A. has been incorporated, along with other construction companies, as a legal entity investigated in the criminal proceedings as a civilly liable third party along with 11investigation that the Public Ministry has been carrying out for the alleged crime of corruption of officials in relation to the so-called Construction Club. Similarly, at the end of February 2020, the Public Ministry has requested the incorporation of Concar S.A., the latter is pending judicial decision. Like officials of other construction companies.
| 3) | Independent Investigation related to businesses with Odebrecht Group
|
On January 9, 2017,companies, a former commercial manager of Cumbra Peru S.A., a former president of the Board of Directors, approved a plan to conduct an internal investigation related to six projects executed in association with Odebrecht.
On March 30, 2017,former Director and the Board of Directors created a Risk, Compliance and Sustainability Committee who was in chargeformer Chief Executive Officer of the oversight ofCompany have been included in the criminal investigation independent from management. The external investigation was entrusted tointo these events.
Anticorruption Law - effects on the law firm Simpson, Thatcher and Bartlett, who reported exclusively to the Risk, Compliance and Sustainability Committee in order to preserve the independence of the investigation.Corporation
The independent investigation concluded on November 2, 2017, and found no evidence for determining that the Group or any of its former or current directors or executives had intentionally or knowingly participated in acts of corruption related to the six projects developed in association with Odebrecht.
We were informed by the press in February 2019, that Odebrecht has signed an effective collaboration agreement with the Prosecutor´s Office and the Ad Hoc Prosecutor’s Office in which, among other things, it is determined that Odebrecht will pay the Peruvian Government an indemnity calculated according to the parameters established in Law No. 30737 and that Odebrecht will collaborate with the Prosecutor’s Office providing all the relevant information it has about the facts under investigation.
| 4) | Anticorruption Law - effects on the Group
|
Law 30737 and its regulation issued by Supreme Decree 096-2018-EF have mitigated the Company and subsidiaries exposure toon the cases described in subsections 1) and 2) above.corruption cases. These rulesstandards set clear guidelines to estimatefor the calculation of potential compensationindemnification, reducing the uncertainty derived from the legal proceedings, by among other things, preventingabout the imposition of liens or attachments ofseizures on assets that would impaircould hinder the operation of the Company’s business.
In the case of the Company and its ability to operate.
- 10 -
Thesubsidiary Cumbra Peru, the benefits of the mentioned rules are subject to the fulfillment of the following obligations:obligations as a consequence of the association with Odebrecht in the IRSA Sur and construction of the Electric train construction Project, tranches 1 and 2:
The obligation to set up a trust that will guarantee any eventual payment obligation of an eventual civil compensation in favor of the Peruvian Government;
The obligation not to transfer funds abroad without the prior consent of the Ministry of Justice;
The implementation of a compliance program; and
The obligation to disclose information to the authorities and to collaborate in the investigation.
The GroupCorporation has designed a compliance program which is currently under implementation. In addition,implementation, it fully cooperates with the authorities in its investigations and has executed a trust agreement with the Ministry of Justice, that provides tounder which the terms and conditions that govern the trust that will secure its contingent obligationsCompany has established for an approximate amount confirmed by authorities of S/73.572 million (equivalent to US$22.320 million) (Note 23).
On
In 2020, the other hand, basedCompany was included in the framework of Law 30737 for the IIRSA Norte and Chavimochic. However, the Company has been in contact with the Ministry of Justice in order to clarify this information, given that the incorporation of the Company in the Category 2 is not in accordance with the provisions set forth in the law. Based on the standards indicated and their guidelines, management hasIt is estimated that the value of the contingency forcontingencies related to Odebrecht and the casesConstruction Club described above should not exceed US$45.8is S/469.7 million (US$129.6 million) and was recorded at December 31, 2020 the equivalent to the corresponding present value that results in S/216 million (equivalent to S/148.4US$59.6 million).
On the other hand, in addition to the cases where a provision for civil reparation has been recorded, there is a project carried out in partnership with Odebrecht that to date is not under investigation. If Thethis is started and some evidence is found, the maximum possible exposure for civil reparation estimated according to Law 30737 for the project would be S/9.6 million (approximately US$2.6 million).
As of the date hereof, the negotiations of the agreement are advanced and the Company expects the agreement to impose an obligation to pay damages in an amount that should not deviate materially from the amount estimated in the financial statements and, in addition, a temporary prohibition from contracting with the government.
Although we expect to execute a final settlement and cooperation agreement soon, we cannot assure you that an agreement will be reached in a timely manner or at all, and in case an agreement is reached, we can not assure you that it will not contain terms and conditions that are substantially more onerous to the Company that we have foreseen. In addition, any agreement would be subject to further approval by the Peruvian court.
Investigations and administrative process initiated by INDECOPI in relation to the Construction Club case is deemed incorporated within
On July 11, 2017, the scopePeruvian National Institute for the Defense of Free Competition and the Protection of Intellectual Property (“INDECOPI”) initiated an investigation against several construction companies (including Cumbra Peru S.A.), about the existence of an alleged cartel called the Construction Club. Cumbra Peru S.A. has provided to INDECOPI with all the information requested and continues collaborating with the investigation.
On February 11, 2020, the subsidiary Cumbra Peru S.A. was notified by the Technical Secretariat of the referencedCommission for the Defense of Free Competition of INDECOPI with the resolution that begins a sanctioning administrative procedure involving a total of 35 companies and 28 natural persons, for alleged anticompetitive conduct in the market of Public Works. The resolution does not include the assignment of responsibilities or the result of the administrative sanctioning procedure, which will be determined at the end of said procedure. The proceeding has concluded its evidentiary stage and the TS has recommended the Commission the imposition of a fine of approximately S/. 103.4 million. Cumbra Peru S.A. has objected this recommendation and its advisors estimate its exposure in approximately S/. 39 million without considering present value deductions and additional deductions to which Cumbra Peru S.A. may be entitled under applicable law, thenand was recorded at December 31, 2020 the equivalent present value in S/24.5 million.
| d) | Impact of the COVID-19 Pandemic |
The outbreak of the COVID-19 pandemic, which the World Health Organization declared to be a “public health emergency of international concern”, has spread across the world since 2019. Throughout 2020, countries around the world, including Peru, Chile and Colombia, took extraordinary measures to contain the spread of COVID-19, including social immobilization, imposition of travel restrictions, temporary closure of non-essential businesses, restrictions on public gatherings and similar actions.
These measures led to a substantial reduction in economic activity, especially in the second quarter of 2020. In response to this situation, the governments of Peru, Chile and Colombia implemented various stimulus programs to assist families and businesses.
In this context the results of operations, financial positions and cash flows of the Corporation have been adversely affected during second quarter of 2020. However as of the date of this report and as a result of the gradual normalization of activities since July 2020, the results of the following months show a significant recovery in activity.
From the analysis carried out by Management the different business of the Corporation have been impacted during 2020 as follows:
1) In the engineering and construction business the mandatory stoppage of activities, specially form March to June, caused total revenues to decrease by 25% compare to 2019. However, the gradual normalization of activities from July and the result of negotiations with our clients regarding higher costs due to the stoppages and new operating standards prevented gross and operating margins from deteriorating substantially compare to 2019. Finally, it was very relevant the award of new contracts during the year, especially the contract for the construction of the second runway at Jorge Chavez airport and the contract for the construction of the Piura gas pipeline.
2) In the real estate business the shutdown of projects has impacted the delivery of real estate units during the year, which impacts the revenues and results of the year. However, despite these adverse circumstances, a positive result was achieved for this business in 2020.
3) The infrastructure businesses continue operating as they were declared essential services:
| a. | Line 1 of the Metro operated with fewer passengers but revenues were not impacted due to the fact that revenues don’t depend on traffic but on the amount of kms travelled by each train. |
| b. | The oil and gas business was impacted by the reduction of the oil Price to levels below the estimations considered for 2020. During the sanitary crisis, the enforceability of further investment obligation on new wells in Lots III and IV was suspended obligations with suppliers were renegotiated. |
| c. | The state emergency situation caused an impact on Norvial S.A. revenues and on the results of 2020 as a result of lower vehicle traffic until July. In addition, in May the Peruvian Congress approved a law in order suspending the collection of tolls, a measure that was in effect from May 9 to June 30, 2020. Norvial S.A. has claimed from the State the payment of a compensation foreseen in clause 9.9 of the Concession Contract, which establishes the obligation of the Grantor to recognize and pay the Concessionaire the corresponding tariff difference in the event that any public entity does not allow the Concessionaire to collect the tariff as stipulated in the same contract. |
| d. | In the road concessions Survial S.A. and Concesion Canchaque S.A. the suspension in the collection of tolls did not impact the results of the year as the revenues do not depend on vehicle traffic. |
In general terms, we have not been affected by interruptions in the supply chain of personnel, services or materials, and despite the temporary stoppage of some of our projects, there were no penalties or non-compliance with our agreements with clients.
The most important goodwill of the Corporation is the result of acquisitions in Colombia and Chile. Considering that in both countries the impacts of the pandemic did not lead to major projects shut downs, our estimates of the value of the assets assignedgoodwill have not been affected. Based on our impairment assessment as of December 31, 2020, we have determined that our goodwill is not impaired.
On the liquidity side, the Corporation implemented a plan that included several measures to reduce expenses and preserve cash in response to the trust would needongoing COVID-19 pandemic, including the following: (i) developing a twelve-week cash plan, project-by-project, to be increased by approximately US$3 million (equivalentensure that Group subsidiaries will continue to S/10.1 million),meet its critical obligations during that period, which plan is monitored and updated weekly; (ii) preparing a cash plan for the potential contingency would increase by approximately US$3.1 million (equivalent to S/10.5 million).
Nonetheless, the Company, through its external attorneys, continues to conduct an ongoing evaluationremainder of the information related2020 fiscal year, to identify in advance key liquidity issues that may arise; (iii) renegotiating certain of the criminal investigations described inCorporation’s subsidiaries obligations with respect to suppliers, banks and other third parties; (iv) identifying and reducing non-essential general expenses across the Corporation; (v) reducing headcount, and temporarily reducing salaries of senior management and Directors’ allowances, across the Corporation’s three segments; and (vi) reducing capital expenditures across the Corporation’s subsidiaries. This plan was approved by the Board of Directors on April and May 2020 sessions. In this Note 1 in order to keep its defenseregard, the accompanying financial statements have been prepared inassuming that the event of any new charges arises during those investigations. In conducting the aforementioned evaluation, the Company does not rule out the possibility of finding, in the future, adverse evidence nor does rule out that authorities or third partiesCorporation and subsidiaries will find, in the future, adverse evidence not currently known to date during the investigations being conducted.continue as a going concern.
| 2 | SUMMARY OF SIGNIFICANT ACCOUNTING POLICIES |
The principal accounting policies applied in the preparation of these consolidated financial statements are set out below. These policies have been consistently applied in all the years presented, unless otherwise stated.
The consolidated financial statements of the Company and its subsidiaries have been prepared in accordance with International Financial Reporting Standards (IFRS) and interpretations issued by the IFRS Interpretations Committee (IFRIC) applicable to companies reporting under IFRS. The financial statements comply with IFRS as issued by the IASB in force as of December 31, 2017,2019, and December 31, 2018,2020, respectively.
The consolidated financial statements have been prepared under the historical cost convention, except for derivative financial instruments, financial assets at fair value through profit or loss, andavailable-for-sale financial assets measured at fair value. The financial statements are presented in thousands of Peruvian Sol unless otherwise stated.
The preparation of the consolidated financial statements in conformity with IFRS requires the use of certain critical accounting estimates. Also requires that the managementManagement exercise its critical judgment in the process of applying the Group’sCorporation’s accounting policies. The areas involving a higher degree of judgment or complexity, or areas where assumptions and estimates are significant to the consolidated financial statements are disclosed in Note 5.
- 11 -
| 2.2 | Consolidation of financial statements |
Subsidiaries are entities over which the Company has control. Subsidiaries are fully consolidated from the date on which control is transferred to the Group.Corporation. They are deconsolidated from the date that control ceases.
The GroupCorporation applies the acquisition method to account for business combinations. Identifiable assets acquired, liabilities and contingent liabilities assumed in a business combination are measured initially at their fair values at the acquisition date.
The GroupCorporation evaluates the measurement of thenon-controlling interest on anacquisition-by-acquisition basis. AtAs of December 31, 2017,2019, and 2018,2020, the measurements of thenon-controlling interest in the Group´sCorporation’s acquisitions were made at thenon-controlling interest´sinterest’s proportionate share of the recognized amounts of the acquiree´sacquiree’s identifiable net assets.
Business acquisition-related costs are expensed as incurred.
Any contingent consideration assumed by the GroupCorporation with the selling party is recognized at fair value at the acquisition date. Subsequent changes to the fair value of the contingent consideration are recognized in accordance with IFRS 9 “Financial Instruments” as profit or loss.
Goodwill is initially measured as the excess of the acquisition cost, the fair value at the acquisition date of any interest previously acquired plus the fair value of thenon-controlling interest, over the net identifiable assets acquired and liabilities and contingent liabilities assumed. If the acquisition cost is less than the fair value of the net assets of the subsidiary acquired, the difference is recognized in profit or loss at the time of acquisition.
For consolidating subsidiaries, balances, income, and expenses from transactions between Group companies are eliminated. Profits and losses resulting from inter-company transactions that are recognized as assets are also eliminated. Group companies use common accounting practices, except for those that are specifically required for specific businesses.
| | b) | Changes in ownership interests in subsidiaries without change of control |
Transactions withnon-controlling interests that do not result in loss of control are accounted for as equity transactions, in other words as transactions with owners in their capacity as owners. The difference between the fair value of any consideration paid and the relevant share acquired of the carrying value of net assets of the subsidiary is recorded in equity. Gains or losses on disposals tonon-controlling interest are also recorded in equity at the time of disposal.
| | c) | Disposal of subsidiaries |
When the GroupCorporation ceases to have control over a subsidiary, any retained interest in the entity isre-measured at its fair value at the date when control is lost, with the change in carrying amount recognized in profit or loss at such date. The fair value is the initial carrying amount for the purposes of subsequently accounting for the retained interest as an associate, joint venture or financial asset. In addition, any amounts previously recognized in other comprehensive income in respect of that entity are accounted for as if the GroupCorporation had directly disposed of the related assets or liabilities. This may mean that the amount previously recognized in other comprehensive income is reclassified to profit or loss.
- 12 -
Contracts in which the GroupCorporation and one or more of the contracting parties have joint control on the relevant joint activities are called joint arrangements.
Investments in joint arrangements are classified as eitherjoint operations orjoint ventures depending on the contractual rights and obligations of each investor. The GroupCorporation has assessed the nature of its joint arrangements and determined them to be bothjoint ventures as well asjoint operations.
Joint ventures are accounted for using the equity method. Under this method, interests in joint ventures are initially recognized at cost and adjusted thereafter to recognize the Group’sCorporation’s share of the post-acquisition profits or losses and movements in the comprehensive income statement.
The GroupCorporation assesses on an annual basis whether there is any objective evidence that the investment in the joint ventures and associate is impaired. If this is the case, the GroupCorporation calculates the amount of impairment as the difference between the recoverable amount of the associate and its carrying value and recognizes the impairment loss in share of the profit or loss in associates and joint ventures under the equity method of accounting in the income statement. In addition, the GroupCorporation stops the use of the equity method if the entity ceases to be an operating entity.
Joint operations are joint arrangements whereby the parties that have joint control of the arrangement, have rights over the assets, and obligations for the liabilities, relating to the arrangement. Each party recognizes its assets, liabilities, revenue and cost and its share of any asset or liability jointly held and, on any revenue, or cost arisen from the joint operation.
In the Group,Corporation, joint operations mainly relate to consortiums (entities without legal personality) created exclusively for the development of a construction contract. Considering that the only objective of the consortium is to develop a specific project, all revenue and costs are included within revenue from construction activities and cost of construction activities, respectively.
Associates are all entities over which the GroupCorporation has significant influence but not control, generally accompanying a holding of between 20% and 50% of the voting rights. Investments in associates are accounted for using the equity method (see section d) above).
Profits and losses resulting from transactions between the GroupCorporation and its associates are recognized in the Group’sCorporation’s consolidated financial statements only to the extent of unrelated investor’s interests in the associates. Unrealized losses are eliminated unless the transaction provides evidence of an impairment of the asset transferred. Accounting policies of associates are changed where necessary to ensure consistency with the policies adopted by the Group.Corporation.
Impairment losses are measured and recorded in accordance with section d) above.
Operating segments are reported in a consistent manner with internal reporting provided to the Management of the Group.Corporation.
If an entity changes the structure of its internal organization in a manner that causes the composition of its reportable segments to change, the GroupCorporation restates the information for earlier periods unless the information is not available.
| 2.4 | Foreign currency translation |
| | a) | Functional and presentation currency |
The consolidated financial statements are presented in Peruvian soles, which is the functional and presentation currency of the Group.Corporation. All subsidiaries, joint arrangements, and associates use the Peruvian Sol as their functional currency, except for foreign entities, for which the functional currency is the currency of the country in which they operate.
- 13 -
| | b) | Transactions and balances |
Foreign currency transactions are translated into the functional currency using prevailing the exchange rates at the date of the transactions or valuation when items arere-measured. Foreign exchange gains and losses resulting from the settlement of such transactions are recognized in the consolidated income statement, except when deferred in other comprehensive income. Foreign exchange gains and losses of all monetary items are included in the income statement within financial income or expense.
Exchange differences arising on loans from the Company to its subsidiaries in foreign currencies are recognized in the separate financial statements of the Company and separate financial statements of the subsidiaries. In the consolidated financial statements, such exchange differences are recognized in other comprehensive income and arere-classified in the income statement on the disposal of the subsidiary or debt repayment to the extent such loans qualify as part of the “net investment in a foreign operation”.
Foreign exchange gains and losses of all monetary items are included in the income statement within financial income or expense.
| | c) | GroupCorporation companies
|
The results and financial position of all the GroupCorporation entities (none of which has the currency of a hyperinflationary economy) that have a functional currency different from the presentation currency of the GroupCorporation are translated into the presentation currency as follows:
| | i) | Assets and liabilities for each statement of financial position are translated using the closing exchange rate prevailing at the date of the consolidated statement of financial position; |
| | ii) | income and expenses for each income statement are translated at the average exchange rate (unless this average is not a reasonable approximation of the cumulative effect of the rates prevailing on the transaction dates, in which case income and expenses are translated using the exchange rate on the date of the transaction); |
| | iii) | capital is translated by using the historical exchange rate for each capital contribution made; and |
| | iv) | all exchange differences are recognized as separate components in other comprehensive income, (loss), within foreign currency translations adjustment.adjustment |
Goodwill and fair value adjustments arising from the acquisition of a foreign entity are treated as assets and liabilities of the foreign entity and are translated at the closing exchange rate. Exchange differences are recognized in other comprehensive income.
| 2.5 | Public services concession agreements |
Concession agreements signed between the GroupCorporation and the Peruvian Government entitle the Group,Corporation, as a Concessionaire, to assume obligations for the construction or improvement of infrastructure and which qualify as public service concessions are accounted as defined by IFRIC 12 “Service Concession Arrangements”. The consideration to be received from the Government for the services of constructing or improving public infrastructure is recognized as a financial asset, or as an intangible asset or both, as set forth below.stated below:
| | a) | It is recognized as a financial asset to the extent that it has a contractual right to receive cash or other financial assets either because the Government secures the payment of specified or determinable amounts or because the Government will cover any difference arising from the amounts actually received from public service users in relation with the specified or determinable amounts. These financial assets are recognized initially at fair value and subsequently at amortized cost (the financial(financial asset model). |
- 14 -
| | b) | It is recognized as an intangible asset to the extent that the service agreement grants the GroupCorporation a contractual right to charge users of the public service. The resulting intangible asset is measured at cost and is amortized as described in Note 2.15 (intangible asset model). |
| | c) | It is recognized as a financial asset and an intangible asset when the GroupCorporation recovers its investment partially by a financial asset and partially by an intangible asset (bifurcated model). |
| 2.6 | Cash and cash equivalents |
In the consolidated statements of financial position and cash flows, cash and cash equivalents include cash on hand,on-demand bank deposits, other highly liquid investments with original maturities of three months or less and bank overdrafts. In the consolidated statement of financial position, bank overdrafts are included in the balance of financial obligationsborrowings as current liabilities.
| 2.7.1 | Classification and measurement |
The GroupCorporation classifies its financial assets, according to its subsequent measurement, in the following categories: i) amortized cost; ii) financial assets at fair value through other comprehensive income and iii) financial assets at fair value through profit or loss. The classification depends on the purpose for which the financial assets were acquired on the basis of the Group’sCorporation’s business model for managing the financial assets and the characteristics of the contractual cash flows of the financial asset.
Management determines the classification of its financial assets at the date of its initial recognition andre-evaluates this classification at the date of each closing of its consolidated financial statements. As of December 31, 2017,2019, and 2018,2020, the GroupCorporation only maintains financial assets in the following categories:
This category is the most relevant for the Group.Corporation. The GroupCorporation measures financial assets at amortized cost if the following conditions are met:
i) The financial asset is held within a business model with the objective of maintaining the financial assets to obtain the contractual cash flows; and
ii) The contractual terms of the financial asset generate cash flows, on specific dates, that are only payments of the principal and interest on the amount of the outstanding principal.
Financial assets at amortized cost are subsequently measured using the effective interest method and are subject to impairment. Profits and losses are recognized in profits or losses when the asset is written off, modified or impaired.
Trade accounts receivable, accounts receivable from related companies, other accounts receivable, work in progress and cash and cash equivalents are included in current assets except for those over twelve months after the date of the consolidated statement of financial position. The latter are classified asnon-current assets.
| b) | Financial assets at fair value through other comprehensive results |
Financial assets at fair value through other comprehensive income of the GroupCorporation are classified in this category when they meet the following conditions:
i) keep them within a business model whose objective is achieved by obtaining contractual cash flows and selling financial assets; and
- 15 -
ii) the contractual terms of the financial asset give rise, on specific dates, to cash flows that are only payments of the principal and interest on the outstanding principal amount.
The investment account at Inversiones en Autopistas S.A. is included in this category.
| c) | Financial assets at fair value through profit or loss |
Financial assets that do not meet the criteria of amortized costs or fair value through other comprehensive income are measured at fair value through profit or loss. The result in a debt investment that is subsequently measured at fair value through gains and losses is recognized in the consolidated statement of comprehensive income in the period in which it occurs.
Financial assets at fair value through profit or loss arenon-derivative financial assets designated by the GroupCorporation at their fair value upon initial recognition and are held for sale. These are included in current assets.
| 2.7.2 | Derecognition of financial assets |
The GroupCorporation derecognizes a financial asset when the contractual rights over the cash flows of the financial asset expire, or when it transfers the rights to receive the contractual cash flows in a transaction in which all the risks and benefits of ownership of the financial asset are substantially transferred, or does not transfer or retain substantially all the risks and benefits related to the property and does not retain control over the assets transferred.
The GroupCorporation participates in transactions in which it transfers the assets recognized in its statement of financial position but retains all or substantially all the risks and advantages of the assets transferred, and/or control over them. In these cases, the assets transferred are not derecognized and are measured on a basis that reflects rights and obligations that the GroupCorporation has retained.
| 2.8 | Impairment of financial assets |
IFRS 9 “Financial Instruments”, requires to register expected credit losses of all financial assets, except for those that are carried at fair value with an effect on results, estimating it over 12 months or for the entire life of the financial instrument (“lifetime”). In accordance with the provisions of the standard, the GroupCorporation applies the simplified approach (which estimates the loss for the entire life of the financial instrument), for the commercial debtors of the rental business line of the real estate sector, and the general approach for the trade accounts receivables, work in progress and other accounts receivable; the same that requires evaluating whether or not a significant increase in risk exists to determine whether the loss should be estimated based on 12 months after the reporting date or during the entire life of the asset.
The GroupCorporation has established a policy to conduct an evaluation, at the end of each reporting period, to identify whether the asset has suffered a significant increase in credit risk since the initial date. Both the credit losses expected at 12 months and the expected credit losses during the life of the asset are calculated individually or collectively, depending on the nature of the portfolio.
For financial assets for which the GroupCorporation has no reasonable expectation of recovering, either the entire outstanding amount or a portion thereof, the gross carrying amount of the financial asset is reduced. This is considered a decrease in (partial) accounts of the financial asset.
| 2.9 | Derivative financial instruments and hedging activities |
Derivatives are initially recognized at fair value on the date a derivative contract is enteredsigned into and are subsequentlyre-measured at their fair value at the end of each reporting period. The method offor recognizing the resulting gain or loss resulting from changes in the fair value of the derivatives depends on whether the derivative isthey are designated as aan hedging instrument, and if so, the nature of the item being hedged.
- 16 -
The GroupCorporation designates certain derivatives as hedges of a particular risk associated with a recognized asset or liability (fair value hedge) or a highly probable forecast transaction (cash flow hedge). Derivatives are initially recognized at fair value on the date of subscription of the contract and are subsequently recognized at their fair value. The method to recognize the gain or loss resulting from changes in the fair values of the derivatives depends on the nature of the item being covered.
The GroupCorporation documents, at the inception of the transaction, the relationship between hedging instruments and hedged items, as well as its risk management objectives and strategy for undertaking various hedginghedges transactions. The GroupCorporation also documents its assessment, both at hedge inception and on an ongoing basis,as at the date of each subsequent statement of financial position, of whether the derivatives that are used in hedginghedges transactions are highly effective in offsetting changes in fair values or cash flows of hedged items.
The fair valuesvalue of various derivative instruments used for hedging purposes and changes in the account reserves for hedginghedges in equity are disclosed in Note 8. The full fair value of a hedging derivative is classified as anon-current asset or liability when the remaining maturity period of the hedged item is more than 12 months and as a current asset or liability when the remaining maturity period of the hedged item is less than 12 months. Trading derivatives are classified as a current asset or liability.
Cash flow hedge
The effective portion of changes in the fair value of derivatives that are designated and qualify as fair value hedges is recognized as other comprehensive income. The gain or loss relating to the ineffective portion is recognized immediately in the income statement. Amounts accumulated in equity are reclassified to profit or loss in the periods when the hedged item affects profit or loss (for example, when the forecasted sale that is hedged takes place).
The gain or loss relating to the effective portion of interest rate swaps hedging variable rate borrowings is recognized in the income statement as “Financial income or Financial expenses”.
However, when the forecasted transaction that is hedged results in the recognition of anon-financial asset (for example, inventory or fixed assets), the gains or losses previously deferred in equity are transferred from equity and are included in the initial measurement of the cost of thenon-financial asset. The deferred amounts are ultimatelyfinally recognized in cost of goods sold in the case of inventory or depreciation in the case of fixed assets.
When a hedging instrument expires or is sold, or when a hedge no longer meets the criteria for hedge accounting, any cumulative gain or loss existing in equity at that time remains in equity and is recognizedwill be reversed to income when the forecasted transaction is ultimatelyfinally recognized in the income statement.statement of comprehensive income. When a forecasted transaction is no longer expected to occur, the cumulative gain or loss that was reported in equity is immediately transferred to the income statement within “other income and expenses, net”.
| 2.10 | Trade accounts receivables |
Trade receivables are amounts due from customers for goods or services sold by the Group.Corporation. If the collection is expected in one year or less, they are classified as current assets. If not, they are presented asnon-current assets. In the Infrastructure segment it includes the billing of the first purchase of trains as part of the model of the financial asset of the concessionaire Tren Urbano de Lima S.A. (formerly GyM Ferrovias S.A.) (Note 2.5).
Trade receivables are recognized initially at fair value and subsequently measured at amortized cost using the effective interest method, less any provision for impairment, except for receivables of less than one year that are stated at a nominal amount which is similar to their fair values since they are short term.
AlsoIt includes the managementManagement estimates relatedcorresponding to the engineeringcollection rights for services performed pending invoice and/or approval by client, which have been valued using the completion percentage method. It corresponds mainly to the Engineering and construction, correspondingConstruction segment (subsidiaries Cumbra Peru S.A. and Cumbra Ingenieria S.A. (formerly GMI S.A.). In the Infrastructure segment, for concessions it corresponds to future collections for public services, mainly represented by unconditional contractual rights to be received from the Grantor under the model of executed services that have not been approved by customers (Progress level valuation)the financial asset (Note 2.5).
- 17 -
This account includes the balance of work in progress costs incurred that relates to future activities of the construction contracts and the constructions phase in concessions (see Note 2.262.27 for detail on Revenuerevenue recognition from construction activities)activities and concessions services).
Changes in estimates of contract revenues and costs can increase or decrease the estimated margin. When a change in the estimate is known, the cumulative impact of the change is recorded in the period in which it is known.known, based on the progress completed.
The inventories include land, works in progress and finished buildings related to the real estate activity, materials used in the construction activity.activity and marketed supplies for exploration and extraction activities.
Land used for the execution of real estate projects is recognized at acquisition cost. Work in progress and finished real estate includes the costs of design, materials, direct labor, borrowing costs (directly attributable to the acquisition, construction, production of the asset), other indirect costs and general expenses related to the construction phase.construction.
Net realizable value is the estimated selling price in the ordinary course of business, less applicable variable selling expenses. The GroupAnnually, the Corporation reviews annually whether inventories have been impaired identifying three groups of inventories to measure their net realizable value: i) land bought for future real estate projects which are compared to their net appraisal value; if the acquisition value is higher, a provision of impairment is made;recognized; ii) land under construction, impairment is measured based on cost projections; if these costs are higher than selling prices of each real estate unit, an estimateimpairment estimated is made for impairment;recorded; and iii) completed real estate units; these inventory items are compared to the selling prices less selling expenses; if these selling expenses are higher, a provision for impairment is made.recorded.
For the reductions in the carrying amount of these inventories to their net realizable value, a provision is maderecognized for impairment of inventories with a charge to profit or loss for the year in which those reductions occur.
| | b) | Exploration and extraction activities |
Inventories are valued at production costs or net realizable value (NRV), the one with the lowest result, on the basis of the weighted average method. The NRV represents the value at which it is estimated to make oil, gas and its derivatives LPG and HAS, which is calculated on the basis of international prices at which discounts that are usually granted are deducted. Miscellaneous supplies, materials, and spare parts are valued at cost or replacement value, whichever is less based on the average method. The cost of inventories excludes financing expenses and exchange differences. Inventories to be received are recorded at cost by the specific identification method.
The GroupCorporation constitutes a devaluation of materials charged to income for the year in cases in which the book value exceeds its recoverable value.
Materials and supplies are recorded at cost by the weighted average method or at their replacement value, the lower. The cost of these items includes freight andnon-refundable applicable taxes.
The devaluation of these items is estimated on the basis of specific analysis made by the Management on its rotation. If it is identified that the book value of the stocks of materials and supplies exceeds their replacement value, the difference is charged to income in the year in which this situation is determined.
Management considers that as of the date of the consolidated financial statements it is not necessary to establish additional provisions to those recognized in the financial statements to cover losses due to obsolescence of these inventories.
- 18 -
Investment properties are shown at cost less accumulated depreciation and impairment losses, if any. Subsequent costs attributable to investment properties are capitalized only if it is probable that future economic benefits will flow to the Company and the cost of these assets can be measured reliably; if not, they are recognized as expenses when incurred.
Repair and maintenance expenses are recognized in profit and loss when they are incurred. If the property’s carrying amount is greater than its estimated recoverable amount, an adjustment to reduce the carrying amount to the recoverable amount is recognized.
Depreciation is determined by the straight-line method at rates calculateda rate that is considered sufficient to write offabsorb the cost less estimated residual value, of each asset on a straight-line basis over its estimatedthe assets and the end of the useful life. Significantlife and considered their significant components with useful lives substantially different are(each component is treated separately for depreciation purposes.purposes). The estimated useful lives of those properties range from 35 to 3350 years.
The investment properties held by the GroupCorporation correspond to: (i) “Agustino Plaza” Shopping Center, located in the El Agustino District, and (ii) the stores situated within the stations of Line 1 of the Lima Metro; the properties owned by the subsidiary VIVA GyM SA have an estimatedViva Negocio Inmobiliario S.A. are represented by a fair value ofamount to US$19.214.16 million, equivalent to S/64.351.31 million as of December 31, 20182020 (US$34.518.7 million, equivalent to S/112.762.6 million, as of December 31 of 2017)2019).
These investment properties have been leased under the modality of an operating lease.
| 2.14 | Property, plant and equipment |
Property, plant and equipment are stated at historical cost less accumulated depreciation and impairment losses, if any. Historical cost includes expenditure that is directly attributable to the acquisition of these items.
Subsequent costs are included in the asset’s carrying amount or are recognized as a separate asset, as appropriate, only when it is probable that future economic benefits associated with the item will flow to the GroupCorporation and the cost of the item can be measured reliably. Repairs and maintenance expense are charged to the statement of income statement during the financial period in which they are incurred.
Assets under construction are capitalized as a separate component. At their completion, the cost of such assets is transferred to their definitive category.
Replacement units are major spare parts in which depreciation starts when the units are installed for use within the related asset.
Depreciation of machinery, equipment and vehicles recognized as “Major equipment” are depreciated based on their hours of use. Under this method, the total number of work hours that machinery and equipment is capable of producing is estimated and a charge per hour is determined. The depreciation of other assets that do not qualify as “Major equipment” is calculated under the straight-line method to allocate their cost less their residual values over their estimated useful lives, as follows:
| | |
| | | Years |
| Buildings and facilities | | Between 3 and 3350 |
| Machinery and equipment | | Between 42 and 10 |
| Vehicles | | Between 2 and 10 |
| Furniture and fixtures | | Between 2 and 10 |
| Other equipment | | Between 2 and 10 |
- 19 -
Residual values and useful lives are reviewed and adjusted as appropriate at each reporting date. Gains and losses on disposals are recognized in “Other income and expenses, net” in the income statement.statement of income. Regarding joint operations that carry out construction activities, the difference between the proceeds from disposals of fixed assets and their carrying amount is shown within “revenue from construction activities” and “cost of construction activities”, respectively.
Goodwill arises on the acquisition of subsidiaries and represents the excess of the purchase consideration, the amount of any non-controlling interest and the acquisition-date fair value of any previous equity interest in the acquiree over the fair value of the net identifiable assets acquired. If the totalpayment made, the amount of the consideration transferred, the non-controlling interest recognized and previously held interest measured at fair value is less than the fair value of the net assets of the subsidiary acquired, the difference is recognized directly in the consolidated statement of income.
Goodwill acquired in a business combination is allocated to each cash-generating units (CGU), or group of CGUs, that is expected to benefit from the synergies of the combination. Goodwill is monitored at the operating segment level.
Goodwill impairment reviews are performed at least annually and when events or changes in circumstances indicate a potential impairment. Any impairment is recognized immediately as an expense in item “Other income and expenses, net” and cannot be reversed later.
Trademarks acquired separately are shown at historical cost. Trademarks acquired in a business combination are recognized at fair value at the acquisition date. Management has determined that these trademarks have indefinite useful lives.
Trademark impairment reviews are performed at least annually and when events or changes in circumstances indicate a potential impairment. Any impairment is recognized immediately as an expense in item “Other income and expenses, net”. The carrying amount that has been subject to impairment is reviewed at each reporting date to verify possible reversals of the impairment and is recognized in the “other income and expenses, net” item.
The intangible asset consisting of the right to charge users for the services related to service concessions agreements (Note 2.5 and Note 6.b) is initially recorded at the fair value of construction or improvement services. Beforeservices and before amortization is started, an impairment test is performed; it is amortized under the straight-line method, from the date revenue starts using the lower of its estimated expected useful life or effective period of the concession agreement.
| | iv) | Contractual relationships with customers |
Contractual relationships with customers are assets resulting from business combinations that were initially recognized at fair value as determined based on the expected cash flows from those relations over an estimateda period of time based on the time period those customers will remain as customersestimated permanent of the GroupCorporation’s customer (the estimation of useful life is based on the term of contract termswith customers which fluctuate between 5 and 9 years). The useful life and the impairment of these assets are individually assessed.
| | v) | Cost of development wells |
Costs incurred in preparing wells to extract hydrocarbons in Blocks I, III, IV, and V, located in Talara, are capitalized as part of intangible assets. These costs are amortized over the useful lives of the wells (estimated to be five yearsin remaining periods for Blocks I and V and the unit of production method for Blocks III and IV), which is less thanuntil the end period of the service agreementagreements signed with Perupetro.
- 20 -
| | vi) | Software and development costs |
Development costs that are directly attributable to the design and testing of identifiable and unique software products controlled by the GroupCorporation are recognized as intangible assets when the following criteria are met:
It is technically feasible to complete the software product so that it will be available for use;
management intends to complete the software product and use or sell it;
there is the ability to use or sell the software product;
it can be demonstrated how the software product will probably generate future economic benefits;
technical, financial and other resources are available to complete the development and to use or sell the software product; and
expenses incurred during its development can be reliably measured.
Other development expenditurescosts that do not meet these criteria are expensedreconized in the statement of income as incurred. Development costs previously recognized as an expense are not recognized as an asset in a subsequent period. Computer software development costs recognized as assets are amortized over their estimated useful lives, which fluctuate between 2 to 15 years.
Refers to the rights maintained by the subsidiary Promotora Larcomar S.A. Land use of rights are stated at historical cost less amortization and any accumulated impairment losses. The useful life of this asset is based on the agreement signed (60 years) and may be extended if agreed by parties. Amortization will begin when it becomes ready for its intended use by Management.
| 2.16 | Impairment ofnon-financial assets |
Assets subject to amortization are subject to impairment tests when events or circumstances occur that indicate that their book value may not be recovered. Impairment losses are measured as the amount by which the book value of the asset exceeds its recoverable value. The recoverable value of the assets corresponds to the higher of its fair value and its value in use. For purposes of the impairment assessment, assets are grouped at the lowest levels in which they generate identifiable cash flows (cash-generating units). The book value ofnon-financial assets other than goodwill that have been subject to write-offs for impairment is reviewed at each reporting date to verify possible reversals of impairment.
| 2.17 | Financial liabilities |
The financial liabilities of the GroupCorporation include trade accounts payable, accounts payable to related parties, remuneration and other accounts payable. All financial liabilities are initially recognized at fair value and subsequently valued at amortized cost using the effective interest rate method.
Financial liabilities are classified as current liabilities if the payment must be made within a year or less (or in the normal operating cycle of the business if it is greater). Otherwise,, otherwise, they are presented asnon-current liabilities.
| 2.18 | Trade accounts payable |
Trade payables are obligations to pay for goods or services that have been acquired in the ordinary course of business. Accounts payable are classified as current liabilities if payment is due within one year or less (or in the normal operating cycle of the business if longer). If, if not, they are presented asnon-current liabilities.
- 21 -
Accounts payable are initially recognized at their fair value and subsequently are amortized at amortized cost using the effective interest method, except for accounts payable within less than one year that are recorded at their nominal value that is similar to their fair value due to its maturity in the short term.
| 2.19 | Financial liabilities at fair value through profit or loss |
Financial liabilities at fair value through profit or loss include liabilities designated at initial recognition as at fair value through profit or loss.
Financial liabilities designated at initial recognition at fair value through profit or loss are designated at the initial recognition date, and only if the criteria of IFRS 9 are met. The Company has only designated the obligation with BCI Peru as a financial liability at fair value through profit or loss, see note 18.
| 2.20 | Other financial liabilities |
Corresponds to the loans and bonds issued by the Group,Corporation, which are initially recognized at their fair value, net of the costs incurred in the transaction. These financial liabilities are subsequently recorded at amortized cost; any difference between the funds received (net of transaction costs) and the redemption value is recognized in the statement of income statement during the period of the loan using the effective interest method.
The costs incurred to obtain these financial liabilities are recognized as transaction costs to the extent that it is probable that part or the entire loan will be received. In this case, these charges are deferred until the time the loan is received.
Debt costs are recognized at the statement of income statement in the period in which they have been incurred, except for intangible assets and inventories in which the borrowing costs are capitalized.
General and specific borrowing costs directly attributable to the acquisition, construction or production of qualified assets, which are assets that necessarily take a substantial period (more than 12 months) to reach their condition of use or sale, are added to the cost of said assets until the period when the assets are substantially ready for use or sale. The GroupCorporation suspends the capitalization of borrowing costs during the periods in which the development of activities of a qualified asset has been suspended. The income obtained from the temporary investment of specific loans that have not yet been invested in qualified assets is deducted from the borrowing costs eligible for capitalization.
2.212.22 | Current and deferred income tax |
Income tax expense comprises current and deferred tax. Tax expense is recognized in the statement of income, statement, except to the extent that it relates to items recognized in other comprehensive income or directly in equity. In this case, tax is also recognized in the statement of comprehensive income or directly in equity, respectively.
The current income tax is calculated based on the tax laws enacted at the date of the statement of financial position in the countries where the Company and its subsidiaries operate and generate taxable income. Management, where appropriate, establishes provisions based on amounts expected to be paid to the tax authorities.
Deferred tax is recognized on temporary differences arising between the tax bases of assets and liabilities and their carrying amounts in the financial statements. Deferred income tax assets are recognized only to the extent that it is probable that future taxable profit will be available against which the temporary differences can be utilized. Deferred income tax is determined using tax rates (and legislation) that have been enacted as of the date of the statement of financial position and that are expected to be applicable when the deferred income tax is realized or paid.
Deferred income tax is provided on temporary differences arising on investments in subsidiaries and associates, except for deferred income tax liability where the timing of the reversal of the temporary difference is controlled by the Group,Corporation, and it is probable that the temporary difference will not reverse in the foreseeable future. Deferred income tax arising from the initial recognition of goodwill is not recognized; likewise, the deferred tax is not recorded if it arises from the initial recognition of an asset or liability in a transaction that is not a business combination of businesses that does not affect the accounting or tax profit or loss at the time of the transaction
- 22 -transaction.
2.222.23 | Employee benefits |
The GroupCorporation recognizes a liability when the employee has rendered services in exchange for which is entitled to receive future payments and an expense when the GroupCorporation has consumed the economic benefit from the service provided by the employee in exchange for the benefits in question.
The GroupCorporation determines employee benefits in accordance with current labor and legal regulations and classifies them as short-term benefits, post-employment benefits, long-term benefits, and termination benefits.
Short-term benefits are those other than termination indemnities, whose payment is settled in the twelve months following the end of the period in which the employees have rendered the services; they correspond to current remunerations (salaries, and salarieswages and contributions to social security), annual paid and sick absences, participation in profits and incentives and othernon-monetary benefits.
Post-employment benefits are those other than termination benefits that are paid after completing the period of employment with the entity. Retirement benefits or post-employment benefit plans can be classified into (i) Defined contribution plans and (ii) Defined benefit plans. The Group maintains defined benefit plans and therefore assumes the actuarial risk.
Long-term benefits are those benefits that must be paid more than twelve months after the end of the period in which the services were rendered. As of December 31, 2017,2019, and 2018,2020, the GroupCorporation does not grant benefits in this category.
Termination benefits are those benefits payable as a result of (i) the entity’s decision to terminate the employee’s contract before the retirement date, and (ii) the employee’s decision to voluntarily accept the conclusion of the relationship of work.
Short-term benefits:
| | a) | Current salaries and wages |
The current remunerations are constituted by salaries, wages, contributions to social security, statutory bonuses and compensation for the time of services. Salaries, wages, and contributions to social security are settled on a monthly basis.
Entities of the GroupCorporation recognize the expense and the related liability for statutory bonuses based on applicable laws and regulations effective in Peru, Chile, Bolivia, Guyana, and Colombia. In Peru bonuses correspond to two monthly payments, settled one in July and one in December of each year.year, and accrue based on the consideration of the service.
The compensation for time of service corresponds to the indemnification rights of the staff, and is accrued based on the consideration of the service calculated according to the legislation in force in each country in which the entities that make upof the GroupCorporation operate and determine as follows: (i) in Peru it is equivalent to half the remuneration in force at the date of payment and this is effected by deposit in bank accounts designated by the workers in the months of May and November of each year; (ii) In Colombia, it is equivalent to 8.33% of the monthly remuneration, (iii) in Bolivia, the calculation is made taking into account the average salary or wages of the last three months. In Chile and Guyana, this benefit is not available.
Annual holidays are recognized on an accrual basis. The provision for the estimated obligation for the annual vacations of personnel resulting from the services rendered by employees is recognized on the date of the consolidated statement of financial position and corresponds; (i) one month for personnel in Peru, (ii) fifteen days for personnel in Colombia, and (iii) in the case of Chile, they are subject to the worker’s seniority and range from fifteen to thirty days.
- 23 -
| | c) | Workers’ profit sharing and incentives |
The workers’ profit sharing is determined on the basis of the legal provisions in force in each country where the entities that make upof the GroupCorporation operate, as follows: (i) in Peru it is equivalent to 5% of the taxable base determined by each Companyentity of the Group,Corporation, in accordance with current income tax legislation, (ii) in Chile, workers’ participation is a component of the remuneration (equivalent to 4.75 minimum wages per year) and not a determinable percentage of the profit, (iii) in Colombia these benefits are not provided to employees.
Post-employment
Termination benefits
The indirect subsidiary Cam Chile Spa has a pension plan for its staff. The liability recognized in the statement of financial position with respect to defined benefit plan is measured based on the present value of the obligation at the end of the reporting period less the fair value of the planned assets.
The present value of the defined benefit obligations is determined by discounting the estimated future cash flows using the interest rates of high-quality corporate bonds denominated in the currency in which the benefits will be paid and with maturity periods similar to the obligations for pension plans. In countries where there is no market with instruments with similar characteristics, the market rate of government bonds will be used.
The remeasurements that arise from adjustments and changes in the actuarial assumptions are recorded in other comprehensive income in the period in which they arise.
Termination benefits
The GroupCorporation entities recognize the liability and expense for severance payments when they occur, based on the legal provisions in force in each country. In accordance with the legislation of Peru, the compensation for arbitrary dismissal for personnel with an indefinite contract amounts to 1.5 times the monthly remuneration for each year worked.
In Colombian legislation, compensation dependsfor the first year worked, the equivalent of 30 days of salary is granted, and from the second year on, the remuneration received;compensation will be the equivalent of 20 days of salary for each additional year (or the proportion); in the legislation of Chile is granted compensation of 30thirty days of salary for each year worked with a maximum salary of 330 days.
Provisions are recognized when i) the GroupCorporation has a present, legal or constructive obligation as a result of past events; ii) it is probable that an outflow of resources will be required to settle the obligation; and iii) the amount has been reliably estimated. Provisions are reviewed at year - end. If the time value of money is significant, provisions are discounted using apre-tax rate that reflects, when applicable, the specific risks related to the liability. Reversal of the discount due to the passage of time results in the obligation being recognized with a charge to the statement of income statement as a financial expense.
Contingent obligations when their existence will only be confirmed by future events or their amount cannot be reliably measured. Contingent assets are not recognized and are disclosed only if it is probable that the GroupCorporation will generate an income from economic benefits in the future.
- 24 -
| | b) | Provision for the closure of production wells |
The subsidiary UNNA ENERGIA S.A. (formerly GMP S.A.) recognizes a provision for the closure of operating units that correspond to the legal obligation to close oil production wells once the production phase has been completed. At the initial date of recognition, the liability that arises from this obligation measured at its fair value and discounted at its present value, according to the valuation techniques established by IFRS 13, “Fair Value Measurement”, and is simultaneously charged to the intangible account in the consolidated statement of financial position.
Subsequently, the liability is increased in each period to reflect the financial cost considered in the initial measurement of the discount, and the capitalized cost is depreciated based on the useful life of the related asset. When a liability is settled, the subsidiaries recognize any gain or loss that may arise. The fair value changes estimated for the initial obligation and the interest rates used to discount the flows they are recognized as an increase or decrease in the book value of the obligation and the asset to which they relate to, any decrease in the provision, and any decrease of the asset that may exceed the carrying amount of said asset is immediately recognized in the consolidated statement of income.
If the review of the estimated obligation results in the need to increase the provision and, accordingly, increase the carrying amount of the asset, the subsidiaries should also take into consideration if the said increase corresponds to an indicator that the asset has been impaired and, if so, impairment tests are to be carried out (Note 2.16).
2.242.25 | Put option arrangement |
The subsidiary GyMCumbra Peru S.A. signed a sale option contract on the equity of its subsidiary Morelco SASS.A.S. (Note 33 b)32) that allows the shareholder to reallocate its shares over a period of 10 years. The amount payable under the option is initially recognized at the present value of the reimbursement under “Other accounts payable”, directly charged to equity. The charge to equity is recorded separately as put options subscribed on thenon-controlling interest, adjacent to thenon-controlling interest in the net assets of the consolidated subsidiaries.
Subsequently, the financial liability is updated by changes in the assumptions on which the estimation of the expected cash flows is based and by the financial component due to the passage of time. The effects of this update are recognized in results. In the event that the option expires without being exercised, the liability is written off with the corresponding adjustment to equity.
Common shares are classified as equity.
Incremental costs directly attributable to the issue of new shares or options are shown in equity, as a deduction, of the proceeds, net of taxes.
When any Group company purchases Company’s equity shares (treasury shares), the consideration paid, including any directly attributable incremental costs (net of income taxes) is deducted from equity attributable to the company’s equity holders until the shares are canceled, placed or reissued. When such shares are subsequently reissued, any consideration received, net of any directly attributable incremental transaction costs and the related income tax effects is included in equity attributable to the Group’s equity holders.
2.262.27 | Revenue recognition from contracts with customers |
Revenues from contracts with customers are recognized, for each performance obligation, either during a period of time or at a specific time, depending on which method best reflects the transfer of control of the underlying products or services to the obligation of particular performance with the client.
- 25 -
The GroupCorporation recognizes the income through the application of the five steps defined in the regulation i) identification of the contract with the client; ii) identification of performance obligations in the contract; iii) determination of the price of the transaction; iv) allocation of the transaction price for performance obligations; and v) recognition of income when (or as) a performance obligation is satisfied.
Subsequently, the GroupCorporation policy of recognition of each type of income according to IFRS 15:
| | i) | Engineering and construction |
The Company recognizes revenuesRevenues from engineering and construction contracts are recognized over time as performancethe Corporation performs its obligations are satisfied, due to thebecause there is a continuous transfer of control of the deliverable to the customer. Engineering and construction contractscustomer pursuant to the terms of such contracts. For this reason, the Corporation accounts for revenue over time by measuring the progress towards complete satisfaction of its performance obligations under each contract. In this manner, revenues are generally accounted for as a single unit of account (a single performance obligation) and are not segmented between types of services.
Construction
Revenues from construction contracts are recognized using thepercentage-of-completion method, based on surveys of performance by the Corporation’s experts who review the work performed to date under each contract.
The Corporation recognizes revenue based on surveys of work to date, using the output method, which is the direct measurement of the value to the customer of the construction services completed to date relative to the remaining services to be performed under the contract. The Corporation believes that the use of the output method based on the completionsurveys of performance provides a physical proportionfaithful depiction of the overall work contract considering total costs and revenues estimated attransfer of services by the end of the project. Under this method, revenues are determined based on the proportion of actual physical completion comparedCorporation to the total contracted physical construction commitment.customer because it reflects an enforceable right to payment from the Corporation for the work completed to date.
The contract generates assets when the costs incurred are greater than the cost associated with those revenues. Otherwise, liabilities are generated for the accrued costs not invoiced.
When it is probable that the total costs of the contract will exceed the related revenue, the expected loss is immediately recognized.
Revenues for additional work resulting from a modification or an instruction received from the customer to make a change in the scope of work or the price, or both, will result in an increase in contract revenue. The Corporation does not account for contract modifications unless approved by the customer. In addition, the Corporation reviews the enforceability of changes to the rights and obligations in contract modifications.
As part of its evaluation of whether changes to the rights and obligations in a contract modification are enforceable, the Corporation considers whether one or more of the following factors has been satisfied: a) the contract, applicable law or other evidence provides a legal basis for the modification; b) additional costs were caused by circumstances that were unforeseen on the date of execution of the contract and not a result of deficiencies incurred by the Corporation’s performance; c) modification-related costs are identifiable and considered reasonable in view of the work performed; or d) evidence supporting the modification is objective and verifiable. When one or more of the foregoing factors is satisfied, the changes to the rights and obligations in the contract modification are considered by the Corporation to be enforceable.
The Corporation estimates the change in the transaction price arising from the contract modification if the transaction price has not yet been approved by the customer in accordance with the requirements of IFRS 15 to estimate variable consideration. In order to include variable consideration related to a contract modification in the estimated transaction price, the Corporation must conclude that it is ‘highly probable’ that a significant revenue reversal will not occur. The Corporation determines the probability that the revenue reversal will occur (and therefore whether such price will be recovered) based on an analysis of whether any of the following factors is present: i) contractual entitlement; ii) past practices with the customer; iii) specific discussions or preliminary negotiations with the customer; and iv) verbal approval by the customer. If, as a result of such analysis, the Corporation concludes that it is ‘highly probable’ that a significant reversal in the amount of revenue recognized will not occur, it recognizes the variable consideration relating to the contract modification.
When the construction contract profit cannot be estimated reliably, the associated revenue is recognized to the extent of costs incurred are recoverable. Revenue is billed once approval is received by the owners of the work in progress.
Revenues for additional works come from a modification or instruction received from the client to make a changeThe nature of certain contracts, such us cost-plus fee contracts in the scope of work or theits E&C segment and unit price or both,similar contracts in its E&C segment and whichcertain services it provides in its Infrastructure segment, give rise to variable consideration. Depending on the type of contract, this variable consideration may result in an increaseinclude reimbursable or decrease in contract revenue. A modification is included in the contract revenue when the customer is likely to approve the modification, as well as whentarget costs; variable number of units; award and incentive fees; and penalties. The Corporation estimates the amount of income arising fromrevenue to be recognized as variable consideration using the expected value method or the most likely amount method, whichever is expected to better predict the amount of consideration to which the Corporation will be entitled. These methods require the Corporation to estimate costs, unit quantities, award/incentive fees and penalties. In making such modification can be measured reliably.
A claim is an amount that the Group seeksestimates, judgments are required to collect from the customer or third party as reimbursement for costs not includedevaluate potential variances in the contract price. Claims are included in contract revenue only when it is probable thatcost of materials, the cost incurred are recoverableof labor, productivity levels, the impact of change orders, liability claims and contract disputes, the amount can be reliably measured.
Engineering
Revenues from engineering services are recognized using the methodachievement of the level of progress on the basis of the progress or percentage of completion in the accounting periods in which the services are provided. In this type of income there is a singlecontractual performance obligation, which is performed when the service is provided over time, based on the degree of progress.standards, and other contingencies.”
| | ii) | Real-estate – Real estate, urban and industrial lots |
Sale of Real estate
Revenue from sales of real estate properties is recognized when control over the property has been transferred to the client with the delivery record. Revenue is measured based on the price agreed under the contract. Until this is met, the incomes received will be counted as customer advances. These sales contracts have two performance obligations: i) the one corresponding to the transfer of the property,
- 26 -
which includes the common areas of the building where these real estateestates are located, and ii) the one corresponding to the transfer of the common area outside the real estate assets but that are part of the real estate projects, which are recognized when the common area has been delivered.
Sale of urban lots
Revenue related to sales of urban lots is recognized when control over the property is transferred to the customer. Until this is met, the incomes received will be recognized as customer advances. Revenue is measured based on the transaction price agreed under the contract. These sales contracts have a single performance obligation for the sale of lots, which is executed upon delivery of the sale of the assets.
Sale of industrial lots
Revenue related to sales of industrial lots is recognized when control over the property has been transferred to the customer. Until this is met, the incomes received will be counted as customer advances. These sales contracts have two performance obligations: i) transfer of the industrial lot and ii) urban authorization of the industrial lot.
Income for provided services of oil and gas extraction, fuel dispatch and other services
RevenuesThe revenue from the provision ofproviding these services areis recognized usingat the level of advance method based ontime the progress or percentage of completion inservice is provided, calculating the accounting periods in which the provisionservice actually provided as a portion of the service takes place. In thistotal services to be provided. This type of income there ishas a single performance obligation, whichobligation; that is performed when the service is provided overat a time based on the level of progress.moment.
Income from the sale of oil and derivative products
Revenue from the sale of goods is recognized when the control of the assets is transferred to the customer, which is when the goods are delivered. In this type of income there is only one performance obligation for the sale of oil; which is executed at the delivery of the goods.
Income from concession services
Revenues from concession services correspond to operation and maintenance services, and are recognized according to itstheir nature in the accounting periodsperiod in which the service is provided. In this type of incomerevenue there is only one performance obligation, executed when the service is provided.
2.272.28 | Recognition of cost and expenses |
ConstructionEngineering and construction contracts
The costs of construction contracts are recognized as an expense in the period in which they are incurred.
Contract costs include all direct costs such as materials, labor, subcontracting costs, manufacturing and supply costs of equipment,start-up costs, depreciation and amortization, and indirect costs. Periodically, the Group evaluates the reasonableness of the estimates used in the determination of thepercentage-of-completion. total estimated contract cost. If, as a result of this evaluation, there are modifications to the revenue or cost previously estimated, or if the total estimated cost of the project exceeds expected revenues, an adjustment is made in order to reflect the effect in results of the period in which the adjustment or loss is incurred.
When the outcome of a construction work cannot be estimated reliably, the revenue of the contract is recognized only up to the amount of the contractual costs incurred and that are likely to be recovered.
- 27 -
Costs for sale of oil and derivative products
The costs of the services rendered and the costs of sales of petroleum and derivative products are recognized when they are incurred, simultaneously with the recognition of related revenues. Other costs and expenses are recognized as they accrue, regardless of when they are paid and are recorded in the accounting periods to which they relate.
Costs for concession operation services
The costs of the operation and maintenance services are recognized when they are incurred, simultaneously with the recognition of related revenues. Other costs and expenses are recognized as they are accrued, regardless of when they are paid and are recorded in the accounting periods with which they are related.
Lease contracts are analyzed for the purpose of identifying those containing the characterisctics according to IFRS 16 Leases (hereinafter “IFRS 16”) for recognition, measurement, presentation and disclosure.
The Corporation evaluates in every lease contract the following:
If you have the right to control the use of the identified asses,
If the contract term is longer that twelve months,
If the underlying asset amount is a material amount, and,
That the fees to be paid are not entirely variable.
| | a) | The Group asLeases in which the Corporation is a lessee
|
Operating leasesThe Corporation recognizes a right-of-use asset and a lease liability as of the beginning of the lease.
LeasesThe right-of-use asset is initially measured by the initial amount of the lease liability adjusted for any lease payment made on or before the start date, plus the initial direct costs incurred. The right-of-use assets are depreciated in which a significantstraight line, from the start date until the end of the lease contract. The term of the lease includes the periods covered by an option to extend the contract if the Corporation is reasonably sure to exercise that option.
The lease liability is the total unpaid installments, measured at amortized cost using the effective interest method. It is measured again when there is a change in future lease payments that arise from a change in an index or rate, if there is a change in the Corporation’s estimate of the amount expected to be paid under a residual value guarantee, or if the Corporation changes its assessment of whether it is sure that it will exercise a purchase, extension or term option.
When the lease liability is measured again, the carrying amount of the right-of-use asset is adjusted.
In engineering and construction segment, interest expenses related to leasing contracts of the core business are reported in gross margin; the rest of the Corporation segments, report them in financial expenses.
Operational cash flows will be greater since cash payments for the main portion of the risks and rewards of ownership are retained by the lessorlease debt are classified within the financing activities. Only the part of the payments that reflects interest can continue to be presented as operating leases. Payments made under operating leases, including prepayments (net of any incentives received from lessor) are recognized in the consolidated income statement under the straight-line method over the lease term. The Group’s major kinds of operating leases are leases of machinery, computer equipment, printing equipment, among others.
Finance leases
Leases in which the Group assumes substantially all the risks and rewards of ownership of an asset are classified as finance leases. Each lease payment is allocated between the liability and finance charges so as to produce a constant periodic rate of interest on the remaining balance of the liability for each period. The corresponding rental obligations, net of finance charges, are included in other payables, short- and long-term in the consolidated statement of financial position. The interest element of the finance cost is charged to the consolidated income statement of over the lease period so as to produce a constant periodic rate of interest on the remaining balance of the liability for each period. The property, plant and equipment acquired under finance leases are depreciated over the useful life of the asset or the lease term.cash flow.
| | b) | The Group asLeases in which the Corporation is a lessor
|
OperatingLiabilities for operating leases and the leased assets are statedincluded in the statement of financial position based onaccording to the nature of the asset. RevenueRevenues from operating leases are recognized under the straight-line methodin a straight line over the term of the lease termagreement and the incentives givengranted to lessees reduceare reduced from rental income.
Based on the revenue obtained fromforegoing, the Corporation as lessor has not changed the recognition of its leases.
2.292.30 | Dividend distribution |
Dividend distribution to the GroupCorporation shareholders is recognized as a liability in the financial statements in the period in which the dividends are approved.
2.302.31 | Significantnon-operating items |
Significantnon-operating items are separately shown in the financial statements when they are necessary to provide an adequate understanding of the Group’sCorporation’s financial performance. These material items are income or expenses shown separately due to their nature or significant amount.
- 28 -
2.312.32 | Restatement of the Statement of IncomeAccount balance reclassified as of December 31, 2017
|
The consolidated statement of income for the year ended December 31, 2017 included the net gain on the sale of our former subsidiary GMD (S/218.3 million (US$64.6)) under the “Gain from the sale of investments” line item, rather than the “Profit from discontinued operations” line item in accordance with IAS 8, Accounting Policies, changes in Accounting Estimates and errors, such amount has been restated in application of IFRS 5 paragraph 33 a).
| | | | | | | | | | | | |
| | | 2017
Audited | | | Restatement
GMD (i) | | | 2017
Restated | |
Revenues | | | 6,080,142 | | | | — | | | | 6,080,142 | |
Operating costs | | | (5,407,355 | ) | | | — | | | | (5,407,355 | ) |
| | | | | | | | | | | | |
Gross profit (loss) | | | 672,787 | | | | — | | | | 672,787 | |
| | | |
Administrative expenses | | | (429,181 | ) | | | — | | | | (429,181 | ) |
Other (expenses) income, net | | | (20,545 | ) | | | — | | | | (20,545 | ) |
Gain (loss) from the sale of investments | | | 274,363 | | | | (218,264 | ) | | | 56,099 | |
| | | | | | | | | | | | |
Operating profit (loss) | | | 497,424 | | | | (218,264 | ) | | | 279,160 | |
| | | |
Financial expenses | | | (185,445 | ) | | | — | | | | (185,445 | ) |
Financial income | | | 15,407 | | | | — | | | | 15,407 | |
| | | |
Share of the profit or loss in associates and joint ventures | | | 1,327 | | | | — | | | | 1,327 | |
| | | | | | | | | | | | |
Profit (loss) before income tax | | | 328,713 | | | | (218,264 | ) | | | 110,449 | |
Income tax | | | (123,037 | ) | | | 63,940 | | | | (59,097 | ) |
| | | | | | | | | | | | |
Profit (loss) from continuing operations | | | 205,676 | | | | (154,324 | ) | | | 51,352 | |
| | | | | | | | | | | | |
Profit from discontinued operations | | | 3,562 | | | | 154,324 | | | | 157,886 | |
| | | | | | | | | | | | |
Profit of the year | | | 209,238 | | | | | | | | 209,238 | |
| | | | | | | | | | | | |
Earnings per share attributable to owners of the Company during the year | | | 0.225 | | | | | | | | 0.225 | |
| | | | | | | | | | | | |
Loss per share from continuing operations attributable to owners of the Company during the year | | | 0.220 | | | | | | | | (0.014 | ) |
| | | | | | | | | | | | |
(i) | In application of IAS 8 paragraph 42, line items affected of the Statement of Income are disclosed.2018 and 2019
|
2.32 | a) | Reclassified discontinued operationsThe receivable balance to Consorcio Constructor Ductos del Sur amounting to S/27.8 million as of December 31, 2019, was reclassified from 2016 and 2017“other accounts receivable” to “accounts receivable from related parties”.
|
| b) | Information on the subsidiary Adexus S.A. is presented. (hereinafter “Adexus”), whose main activity is to provide information technology solutions mainly in Chile and Peru, as of December 31, 2018 and 2019 the subsidiary was recognized as a non-current asset held for sale; However, as of September 30, 2020, it was reclassified as a continuing operation for the reasons set forth in Note 36. |
| | | | | | | | | | | | | | | | |
| | | As of
December 31, | | | | | | | | | As of
December 31, | |
| | | 2019 | | | Reclassified (a) | | | Adexus (b) | | | 2019 | |
| | | Audited | | | | | | | | | As restated | |
ASSETS | | | | | | | | | | | | | | | | |
Current assets | | | | | | | | | | | | | | | | |
Cash and cash equivalents | | | 948,978 | | | | — | | | | 1,723 | | | | 950,701 | |
Trade accounts receivables, net | | | 821,737 | | | | — | | | | 92,467 | | | | 914,204 | |
Work in progress, net | | | 49,457 | | | | — | | | | — | | | | 49,457 | |
Accounts receivable from related parties | | | 36,658 | | | | — | | | | — | | | | 36,658 | |
Other accounts receivable | | | 444,500 | | | | — | | | | 9,974 | | | | 454,474 | |
Inventories, net | | | 552,573 | | | | — | | | | 2,828 | | | | 555,401 | |
Prepaid expenses | | | 11,348 | | | | — | | | | 5,130 | | | | 16,478 | |
| | | | | | | | | | | | | | | | |
| | | 2,865,251 | | | | — | | | | 112,122 | | | | 2,977,373 | |
Non-current assets as held for sale | | | 205,418 | | | | — | | | | (203,020 | ) | | | 2,398 | |
| | | | | | | | | | | | | | | | |
Total current assets | | | 3,070,669 | | | | — | | | | (90,898 | ) | | | 2,979,771 | |
| | | | | | | | | | | | | | | | |
Non-current assets | | | | | | | | | | | | | | | | |
Trade accounts receivable, net | | | 753,202 | | | | — | | | | 26,407 | | | | 779,609 | |
Work in progress, net | | | 23,117 | | | | — | | | | — | | | | 23,117 | |
Accounts receivable from related parties | | | 546,941 | | | | 27,782 | | | | — | | | | 574,723 | |
Prepaid expenses | | | 27,934 | | | | — | | | | — | | | | 27,934 | |
Other accounts receivable | | | 300,323 | | | | (27,782 | ) | | | 891 | | | | 273,432 | |
Investments in associates and joint ventures | | | 37,035 | | | | — | | | | — | | | | 37,035 | |
Investment property | | | 28,326 | | | | — | | | | — | | | | 28,326 | |
Property, plant and equipment, net | | | 443,870 | | | | — | | | | 20,120 | | | | 463,990 | |
Intangible assets, net | | | 853,315 | | | | — | | | | 912 | | | | 854,227 | |
Right-of-use assets, net | | | 78,813 | | | | — | | | | 11,768 | | | | 90,581 | |
Deferred income tax asset | | | 240,919 | | | | — | | | | 30,800 | | | | 271,719 | |
| | | | | | | | | | | | | | | | |
Total non-current assets | | | 3,333,795 | | | | — | | | | 90,898 | | | | 3,424,693 | |
| | | | | | | | | | | | | | | | |
Total assets | | | 6,404,464 | | | | — | | | | — | | | | 6,404,464 | |
| | | | | | | | | | | | | | | | |
| | | | | | | | | | | | | | | | |
| | | As of
December 31, | | | | | | | | | As of
December 31, | |
| | | 2019 | | | Reclassified (a) | | | Adexus (b) | | | 2019 | |
| | | Audited | | | | | | | | | As restated | |
LIABILITIES AND EQUITY | | | | | | | | | | | | | | | | |
Current liabilities | | | | | | | | | | | | | | | | |
Borrowings | | | 454,260 | | | | — | | | | 27,269 | | | | 481,529 | |
Bonds | | | 44,737 | | | | — | | | | — | | | | 44,737 | |
Trade accounts payable | | | 1,136,121 | | | | — | | | | 22,954 | | | | 1,159,075 | |
Accounts payable to related parties | | | 38,916 | | | | — | | | | — | | | | 38,916 | |
Current income tax | | | 47,999 | | | | — | | | | 3,170 | | | | 51,169 | |
Other accounts payable | | | 635,305 | | | | — | | | | 34,369 | | | | 669,674 | |
Provisions | | | 113,483 | | | | — | | | | — | | | | 113,483 | |
| | | | | | | | | | | | | | | | |
Total current liabilities | | | 2,470,821 | | | | — | | | | 87,762 | | | | 2,558,583 | |
| | | | | | | | | | | | | | | | |
Non-current liabilities as held for sale | | | 210,025 | | | | — | | | | (210,025 | ) | | | — | |
| | | | | | | | | | | | | | | | |
Total current liabilities | | | 2,680,846 | | | | — | | | | (122,263 | ) | | | 2,558,583 | |
| | | | | | | | | | | | | | | | |
Non-current liabilities | | | | | | | | | | | | | | | | |
Borrowings | | | 344,806 | | | | — | | | | 64,260 | | | | 409,066 | |
Bonds | | | 879,305 | | | | — | | | | — | | | | 879,305 | |
Trade accounts payable | | | — | | | | — | | | | 34,814 | | | | 34,814 | |
Other accounts payable | | | 273,101 | | | | — | | | | 23,189 | | | | 296,290 | |
Accounts payable to related parties | | | 22,583 | | | | — | | | | — | | | | 22,583 | |
Provisions | | | 214,952 | | | | — | | | | — | | | | 214,952 | |
Derivative financial instruments | | | 52 | | | | — | | | | — | | | | 52 | |
Deferred income tax liability | | | 112,734 | | | | — | | | | — | | | | 112,734 | |
| | | | | | | | | | | | | | | | |
Total non-current liabilities | | | 1,847,533 | | | | — | | | | 122,263 | | | | 1,969,796 | |
| | | | | | | | | | | | | | | | |
Total liabilities | | | 4,528,379 | | | | — | | | | — | | | | 4,528,379 | |
| | | | | | | | | | | | | | | | |
Equity | | | | | | | | | | | | | | | | |
Capital | | | 871,918 | | | | — | | | | — | | | | 871,918 | |
Legal reserve | | | 132,011 | | | | — | | | | — | | | | 132,011 | |
Voluntary reserve | | | 29,974 | | | | — | | | | — | | | | 29,974 | |
Share Premium | | | 1,132,179 | | | | — | | | | — | | | | 1,132,179 | |
Other reserves | | | (177,506 | ) | | | — | | | | — | | | | (177,506 | ) |
Retained earnings | | | (510,766 | ) | | | — | | | | — | | | | (510,766 | ) |
| | | | | | | | | | | | | | | | |
Equity attributable to controlling interest in the Company | | | 1,477,810 | | | | — | | | | — | | | | 1,477,810 | |
Non-controlling interest | | | 398,275 | | | | — | | | | — | | | | 398,275 | |
| | | | | | | | | | | | | | | | |
Total equity | | | 1,876,085 | | | | — | | | | — | | | | 1,876,085 | |
| | | | | | | | | | | | | | | | |
Total liabilities and equity | | | 6,404,464 | | | | — | | | | — | | | | 6,404,464 | |
| | | | | | | | | | | | | | | | |
As parta result of the divestmentthis process, the resultsamounts in the consolidated statement of operations of the following entities have beenincome are reclassified to discontinued operations for the year ended December 31, 2016 and 2017: i) sale of investments in subsidiaries completed in 2018 (Stracon GyM S.A., CAM Chile SpA, CAM Servicios del Peru S.A., and; ii) planned sale of subsidiary Adexus S.A. See Note 37. These reclassifications have no effect on net profit (loss) as previously reported.follows:
| | | | | | | | | | | | |
| | | For the year ended
December 31, 2018 | |
| | | Reported | | | Adexus | | | As restated | |
Revenues from construction activities | | | 1,961,100 | | | | — | | | | 1,961,100 | |
Revenues from services provided | | | 1,003,623 | | | | 85,692 | | | | 1,089,315 | |
Revenue from real estate and sale of goods | | | 934,739 | | | | 217,244 | | | | 1,151,983 | |
| | | | | | | | | | | | |
| | | 3,899,462 | | | | 302,936 | | | | 4,202,398 | |
| | | | | | | | | | | | |
Cost of construction activities | | | (1,921,112 | ) | | | — | | | | (1,921,112 | ) |
Cost of services provided | | | (741,172 | ) | | | (165,781 | ) | | | (906,953 | ) |
Cost of real estate and sale of goods | | | (562,689 | ) | | | (97,674 | ) | | | (660,363 | ) |
| | | | | | | | | | | | |
| | | (3,224,973 | ) | | | (263,455 | ) | | | (3,488,428 | ) |
| | | | | | | | | | | | |
Gross profit | | | 674,489 | | | | 39,481 | | | | 713,970 | |
Administrative expenses | | | (278,433 | ) | | | (32,730 | ) | | | (311,163 | ) |
Other income and expenses | | | (61,335 | ) | | | (4,519 | ) | | | (65,854 | ) |
Loss from the sale of investments | | | (7 | ) | | | — | | | | (7 | ) |
| | | | | | | | | | | | |
Operating profit | | | 334,714 | | | | 2,232 | | | | 336,946 | |
Financial expenses | | | (247,982 | ) | | | (12,786 | ) | | | (260,768 | ) |
Financial income | | | 50,925 | | | | 611 | | | | 51,536 | |
| | | (3,709 | ) | | | — | | | | (3,709 | ) |
| | | | | | | | | | | | |
Profit (loss) before income tax | | | 133,948 | | | | (9,943 | ) | | | 124,005 | |
Income tax expense | | | (113,318 | ) | | | 2,325 | | | | (110,993 | ) |
| | | | | | | | | | | | |
Profis (loss) from continuing operations | | | 20,630 | | | | (7,618 | ) | | | 13,012 | |
| | | | | | | | | | | | |
Profit from discontinued operations | | | 36,785 | | | | 7,618 | | | | 44,403 | |
| | | | | | | | | | | | |
Profit for the period | | | 57,415 | | | | — | | | | 57,415 | |
| | | | | | | | | | | | |
Profit (loss) attributable to: | | | | | | | | | | | | |
Owners of the Company | | | 11,336 | | | | (94,524 | ) | | | (83,188 | ) |
Non-controlling interest | | | 46,079 | | | | 94,524 | | | | 140,603 | |
| | | | | | | | | | | | |
| | | 57,415 | | | | — | | | | 57,415 | |
| | | | | | | | | | | | |
| | | | | | | | | | | | |
| | | For the year ended
December 31, 2019 | |
| | | Reported | | | Adexus | | | As restated | |
Revenues from construction activities | | | 2,411,880 | | | | — | | | | 2,411,880 | |
Revenues from services provided | | | 1,089,465 | | | | 164,594 | | | | 1,254,059 | |
Revenue from real estate and sale of goods | | | 583,659 | | | | 88,263 | | | | 671,922 | |
| | | | | | | | | | | | |
| | | 4,085,004 | | | | 252,857 | | | | 4,337,861 | |
| | | | | | | | | | | | |
Cost of construction activities | | | (2,351,563 | ) | | | — | | | | (2,351,563 | ) |
Cost of services provided | | | (866,326 | ) | | | (168,925 | ) | | | (1,035,251 | ) |
Cost of real estate and sale of goods | | | (425,352 | ) | | | (75,258 | ) | | | (500,610 | ) |
| | | | | | | | | | | | |
| | | (3,643,241 | ) | | | (244,183 | ) | | | (3,887,424 | ) |
| | | | | | | | | | | | |
Gross profit | | | 441,763 | | | | 8,674 | | | | 450,437 | |
Administrative expenses | | | (213,908 | ) | | | (34,744 | ) | | | (248,652 | ) |
Other income and expenses | | | (326,754 | ) | | | (12,740 | ) | | | (339,494 | ) |
| | | | | | | | | | | | |
Operating loss | | | (98,899 | ) | | | (38,810 | ) | | | (137,709 | ) |
Financial expenses | | | (231,709 | ) | | | (21,425 | ) | | | (253,134 | ) |
Financial income | | | 74,656 | | | | (310 | ) | | | 74,346 | |
Share of the profit or loss of associates and joint ventures accounted for using the equity method | | | (218,774 | ) | | | — | | | | (218,774 | ) |
| | | | | | | | | | | | |
Loss before income tax | | | (474,726 | ) | | | (60,545 | ) | | | (535,271 | ) |
Income tax expense | | | (319,957 | ) | | | 16,586 | | | | (303,371 | ) |
| | | | | | | | | | | | |
Loss from continuing operations | | | (794,683 | ) | | | (43,959 | ) | | | (838,642 | ) |
| | | | | | | | | | | | |
(Loss) profit from discontinued operations | | | (43,959 | ) | | | 43,959 | | | | — | |
| | | | | | | | | | | | |
Loss for the year | | | (838,642 | ) | | | — | | | | (838,642 | ) |
| | | | | | | | | | | | |
(Loss) profit attributable to: | | | | | | | | | | | | |
Owners of the Company | | | (884,721 | ) | | | — | | | | (884,721 | ) |
Non-controlling interest | | | 46,079 | | | | — | | | | 46,079 | |
| | | | | | | | | | | | |
| | | (838,642 | ) | | | — | | | | (838,642 | ) |
| | | | | | | | | | | | |
| 3 | STANDARDS, AMENDMENTS, AND INTERPRETATION ADOPTED IN 2018OF INTERNATIONAL FINANCIAL REPORTING STANDARDS |
3.1. | Current standards, amendments, and interpretations adopted
|
The following current standards, amendments to the policies and interpretations were adopted by the Group on January 1, 2018:
IFRS 9, financial instruments comprise mainly: i) the classification and measurement of financial assets and financial liabilities; ii) the new impairment model for the recognition of expected credit losses; and iii) the new hedge accounting model.
IFRS 15, income resulting from revenues from contracts with customers, outlines a single integral model for the entities that will be used in accounting for the income derived from contracts with customers. It replaces the previous income recognition guide, including IAS 18, income, IAS 11, construction contracts and related interpretations.
The amendments to IFRS 15 clarify how to: i) identify a performance obligation in a contract; ii) determine if a company is a director or an agent and iii) determine whether the income from the granting of a license should be recognized at a specific time or over time. In addition, the amendments to IFRS 15 include two additional transition exceptions.
The amendments to IFRS 2, payment on the basis of the shares, provide accounting requirements for i) the effects of the conditions of becoming and not becoming a beneficiary (Vesting andno-Vesting) in the measurement of cash payments settled on the basis of shares; ii) payment transactions based on shares with a net settlement characteristic for the withholding tax obligations; and iii) a modification of the terms and conditions of a payment based on assets that change the classification of a payment transaction in cash to payment in equity.
The amendments to IAS 28, investments in associates and joint ventures, clarify that the choice to measure at fair value through profit or loss an investment in an associate or a joint venture that retains an entity that is a capital organization of the risk, or other qualifying entity, is available for each investment in an associate or joint venture on the basis of investment by investment, after its initial recognition.
Interpretation of IFRIC 22, Transactions in foreign currency and anticipated consideration, clarifies that: i) the date of the transaction, in order to determine the exchange rate, is the date of initial recognition of thenon-monetary asset paid in advance and of the liability for deferred income; and ii) if there are several payments or collections in advance, a transaction date is established for each payment or collection.
Transfers of real estate investments (amendments to IAS 40, real estate investments) state that an entity will transfer real property to, or from, real estate investments when, and only when, there is evidence of a change in use. A change in use occurs if the property meets, or fails to meet, the definition of real estate investment. A change in management’s intentions for the use of a property by itself does not constitute evidence of a change in use.
Current standards, amendments, and interpretations adoption did not have a significant impact on the Group’s financial statements, except for IFRS 9, IFRS 15 and the amendments to IFRS 15, described below.
IFRS 9 “Financial Instruments”
| | a) | TransitionNew standards and amendments to standards and interpretations adopted by the Company in 2020
|
The following accounting standards (IFRS), amendments to standards and interpretations are effective as of January 1, 2020, and have had no impact on the Company’s consolidated financial statements:
Amendments to IAS 1 and IAS 8 - Definition of materiality.
The amendments provide a new definition of “materiality” as information the omission of which, through error or obstruction, would reasonably be expected to influence the decision-making of the primary users of the financial statements. The amendments clarify that materiality will depend on the nature or extent of information, individually or aggregated with other information, in the context of the financial statements.
Amendments to IFRS 3 - Definition of a Business
The amendments provide a new definition of business that requires an acquisition to include at least one input and one substantive process that together contribute significantly to the ability to create products. The definition of the term “products” is modified to focus on goods and services provided to customers, generating investment and other income, and excludes returns in the form of lower costs, savings and other economic benefits.
Amendments to IFRS 7, IFRS 9 financial instruments, replacedand IAS 39 financial instruments: recognition and measurement and was applied in accordance with the transitional provisions of- Benchmark interest rate reform
The amendments to IFRS 7 Financial Instruments: Disclosures, IFRS 9 which require an entityFinancial Instruments and IAS 39 Financial Instruments: Recognition and Measurement provide certain exemptions in relation to apply IFRS 9benchmark interest rate reforms. The exemptions relate to hedge accounting and have the effect that the reforms should generally not cause the termination of hedge accounting. However, any hedge ineffectiveness will continue to be recorded in accordance with IAS 8, Accounting policies, change in accounting estimatesthe income statement.
Modifications to the Conceptual Framework for Financial Reporting
The revised conceptual framework includes some new concepts and errors. The transitional provisionsdefinitions, as well as criteria for recognition of IFRS 9 for the classification and measurement of financial assets and financial liabilities, require an entityand clarifies some concepts. In particular, the IASB has issued a revised Conceptual Framework to retrospectively apply the requirements of IFRS 9.be used for standard-setting decisions with immediate effect. Key changes include:
In accordance with the optional exception of IFRS 9, the Group chose not to redo comparative figures.
| (i) | Increasing the importance of management in the objective of financial reporting. |
IFRS 9 does not apply to financial assets and financial liabilities that have been written off
| (ii) | Restoring prudence as a component of neutrality. |
| (iii) | Defining a reporting entity, which may be a legal entity, or a part of an entity. |
| (iv) | Revise the definitions of an asset and a liability. |
| (v) | Eliminate the probability threshold for recognition and add guidance on derecognition. |
| (vi) | Add guidance on different measurement bases; and |
| (vii) | establishing that profit or loss is the primary performance indicator and that, in principle, income and expenses in other comprehensive income should be recycled when this improves the relevance or faithful representation of the financial statements. |
These amendments had no impact on the dateconsolidated financial statements and are not expected to have future impacts on the Company.
Amendment to IFRS 16 “Leases” – Rent decrease related to Covid-19
This amendment was issued on May 28, 2020, is applicable for annual periods beginning on June 1, 2020 and provides an exemption in relation to the accounting treatment of lease modifications under IFRS 16 to lessees that obtain lease modifications in the initial adoption (i.e.context of Covid-19 (payment holidays and extension of lease payments).
The application of this amendment had no significant impact on the date an entity applies IFRS 9 for the first time), which for the Group corresponds to January 1, 2018).Company’s consolidated financial statements as of December 31, 2020.
In general, the main changes introduced by IFRS 9 relating to the classification and measurement of financial assets, the introduction of a new impairment model based on expected credit losses (instead of losses incurred under IAS 39) and the accounting treatment of hedges.
- 29 -
Classification and measurement of financial assets and liabilities
The table below explains the original measurement categories under IAS 39 and the new measurement categories under IFRS 9 for each class of financial assets of the Group and financial liabilities as of January 1, 2018:
| | | | | | | | | | | | |
| | | IAS 39 | | | IFRS 9 | |
| Financial assets | | Measurement category | | Balance | | | Measurement category | | Balance | |
Cash and cash equivalents | | Loans and accounts receivables | | | 626,180 | | | Amortized cost | | | 626,180 | |
Trade accounts receivables and other account receivables | | Loans and accounts receivables | | | 1,447,629 | | | Amortized cost | | | 1,447,629 | |
Unbilled work in progress | | Loans and accounts receivables | | | 672,163 | | | Amortized cost | | | 672,163 | |
Financial assets related to Concession arrangements | | Loans and accounts receivables | | | 952,780 | | | Amortized cost | | | 952,780 | |
Accounts receivable from related parties | | Loans and accounts receivables | | | 874,682 | | | Amortized cost | | | 872,110 | |
Other accounts receivable | | Fair value through profit or loss | | | 181 | | | Fair value through profit or loss | | | 181 | |
| | |
| | | IAS 39 | | | IFRS 9 | |
| Financial liabilites | | Measurement category | | Balance | | | Measurement category | | Balance | |
Other financial loans | | Amortized cost | | | 1,561,754 | | | Amortized cost | | | 1,561,754 | |
Finance leases | | Amortized cost | | | 128,309 | | | Amortized cost | | | 128,309 | |
Accounts payable and other accounts payable | | Amortized cost | | | 2,054,217 | | | Amortized cost | | | 2,054,217 | |
Accounts payable to related parties | | Amortized cost | | | 81,128 | | | Amortized cost | | | 81,128 | |
Derivative financial instruments used in hedging transactions | | Fair value through other comprehensive income | | | 383 | | | Fair value through other comprehensive income | | | 383 | |
| c) | New Impairment Modelstandards and interpretations that have not been adopted in advance |
The modelfollowing standards, amendments to standards and interpretations have been published with application for periods beginning after the date of credit loss incurred bypresentation of these financial statements and have not been adopted in advance:
Amendment to IAS 39 was replaced1: Classification of Liabilities as current or non-current.
The amendments to IAS 1 Presentation of Financial Statements clarify that liabilities are classified as current or non-current, depending on the rights that exist at the end of the reporting period. The classification is not affected by the expected credit loss model by IFRS 9. The expected credit losses are the present value of all unpaid amounts over the expected life of the financial instrument.
The new impairment model generally requires entities to recognize the expected credit losses in gains and losses for all financial assets, including those that originatedentity’s expectations or acquired recently. Although IFRS 9 does not require recognition of a provision for the loss in the initial recognition of the new financial asset, it is required for the following reporting date. This treatment is different from that of IAS 39, which did not require recognizing any impairment unless and until a loss event occurred after the initial recognition of the financial asset.
Under IFRS 9, impairment is measured as i) expected credit losses in 12 months; or ii) expected credit losses over the life of the instrument.
The Group applies the simplified approach (which estimates the lifetime loss of the financial instrument), for the commercial debtors of the Real Estate business line of income, and the general approach for trade accounts receivable, pending work in progress receivable and other accounts receivable; the same that requires evaluating whether or not a significant increase in risk exists to determine whether the loss should be estimated based on 12 monthsevents after the reporting date (e.g., receipt of a waiver or duringbreach of covenant).
The amendments also clarify what IAS 1 means when it refers to the entire life‘settlement’ of the asset.
- 30 -a liability.
The Group has established a policy to conduct an evaluation, at the end of each reporting period, to identify whether the asset has suffered a significant increase in credit risk since the initial date. Both the credit losses expected at 12 months and the expected credit losses during the life of the asset are calculated individually or collectively, depending on the nature of the portfolio.
As permitted by IFRS 9, the Group continues to apply the requirements contained in IAS 39 for hedge accounting.
At the beginning of a hedging operation, the Group documents the relationship between the hedging instruments and the elements covered, as well as its risk management objectives and its strategy for carrying out various hedging transactions. The Group also documents its assessment, both at the beginning of the hedges and subsequently as to whether the derivative financial instruments used in hedging transactions are highly effective in offsetting changes in the fair values or cash flows of the hedged items.
The effective portion of changes in the fair value of derivative financial instruments that are designated as hedges of a particular risk associated with a recognized asset or liability or with a highly probable projected transaction is recognized in Other Comprehensive Income (OCI). The gain or loss related to the ineffective part, if any, is recognized immediately in the consolidated statement of profit and loss.
The realized gain or loss recognized in the settlement of a hedging instrument designated as a cash flow hedge will be reclassified to the gains on the same basis as the cash flows received from the hedged item. When a hedging instrument no longer meets the criteria for hedge accounting, the accumulated gains or losses existing in OCI at that time are recognized in the profits immediately.
IFRS 15 “Revenue from Contracts with Customers” and amendments of IFRS 15
IFRS 15 introduces a5-step model for revenue recognition for contracts with customers. This model requires that an entity: 1) identify the contract with the client; 2) identify performance obligations related to that contract; 3) determine the transaction price of the contract; 4) assigning said transaction price among the performance obligations; and 5) recognize income when (or as) the performance obligations are met. In addition to recognition and measurement, IFRS 15 also provides new requirements in the presentation and disclosures.
The Group chose to adopt IFRS 15 using the modified retrospective method, with the recognition of transitory adjustments in the opening of retained income at the date of initial application (January 1, 2018), without restating comparative figures.
IFRS 15 provides for certain optional practical expedients, including those related to the initial adoption of the standard. The Group applied the following practical expedients after the adoption of IFRS 15 on January 1, 2018:
| | |
Practical Resource
| | Description
|
Contract | | The Group applied IFRS 15 retrospectively only to contracts that have not been completed as of January 1, 2018. |
| |
Contract modifications | | The Group did not separately evaluate the effects of each contract modification before January 1, 2018. Instead, it reflects the cumulative effect of all modifications that occurred prior to January 1, 2018, when:
i) satisfied and unsatisfied performance obligations were identified;
ii) the prices of the transaction were determined, and
iii) the transaction price was assigned to satisfied and unsatisfied performance obligations.
|
- 31 -
The Group evaluated the impact of the adoption of IFRS 9 and IFRS 15 in its consolidated financial statements; the impacts in Equity as of January 1, 2018, are shown as follows:
| | | | | | | | | | | | | | | | |
| | | As of 1 January 2018 | |
| | | IAS 18/39
Balance | | | IFRS 9
Adjustments | | | IFRS 15
Adjustments | | | IFRS
Balance | |
Retained earnings | | | 589,167 | | | | (2,572 | ) | | | (49,992 | ) | | | 536,603 | |
As a result of the evaluation of IFRS 15, an adjustment of S/49.99 million has been made, which corresponds mainly to the reversal of variable considerations that came from customer claims for reimbursement of costs that are currently in the process of arbitration. In relation to the evaluation of IFRS 9, S/2.57 million was adjusted corresponding to the impairment of financial assets with related parties. The adoption of the new standards did notcould affect the other comprehensive results.
The new accounting policies on revenue recognition are described in note 2.26.
3.2. | Standards and amendments issued to be adopted at a later date
|
The following standard has been issued and is applicable to the Group for annual periods asclassification of January 1, 2019, and after, its early application is permittedliabilities, particularly for entities that adopted IFRS 15:previously considered management’s intentions in determining classification and for some liabilities that may be converted to equity.
IFRS 16, leases, provides a complete model for the identification of lease agreements and their treatment in the financial statements of both tenants and lessors. It will replace IAS 17, leases, and its interpretation guides.
Considerations in the application of IFRS 16:
It is required that IFRS 16The amendments should be applied retrospectively in accordance with the normal requirements of IAS 8 Accounting Policies, Changes in Accounting Estimates and Errors.
The amendments are effective for annual reporting periods as ofbeginning on or after January 1, 2019. The Group is not adopting IFRS 16 in advance.
IFRS 16 introduces a single-lease accounting model for lessees that will result in the recognition in the balance sheet of most of its leases with few potential exceptions. The Group expects that the adoption of IFRS 16 will result in a substantial increase in its assets2023 and liabilities due to the recognition of assets for the right to use the underlying asset and a lease liability that reflects the present value of the lease payments futures. The depreciation expense of theright-of-use asset and the interest expense of the lease liability will replace the operating lease expenses recognized in IAS 17.
During the year 2018, the Group evaluated the impact of the application of IFRS 16 in its consolidated financial statements. In this way, the Group is reviewing its leasing portfolio and is working on the change of certain internal processes and controls, including the implementation of a new lease management and accounting system. The Group is also evaluating the options of transition and the practical resources available in IFRS 16.
The following amendments to the standards have been issued and are applicable to the Group for its annual periods as of January 1, 2019, and subsequently, its early application is permitted:should be applied retrospectively.
The functionsAmendment to IAS 16 - Property, Plant and Equipment: Property, Plant and Equipment: Property, Plant and Equipment: Product before use
This amendment prohibits entities from deducting from the cost of a prepayment with negative compensation (amendmentsan item of Property, Plant and Equipment any income from the sale of items produced while bringing the asset to IFRS 9, financial instruments) allow financial assets with a prepayment option that could resultthe location and condition necessary for it to be capable of operating in the holdermanner intended by management. Instead, an entity should recognize the proceeds from the sale of such items, and the option receiving compensation for early termination to meetproduction costs associated with those items, in profit or loss.
Likewise, the single payments of the principal and interest if certain specific criteria are met.
Long-term interests in associates and joint ventures (amendments toamendment clarifies that when IAS 28, investments in associates and joint ventures) clarify16 indicates that an entity applies IFRS 9, including its impairment requirements,is “testing whether the asset is operating properly”, it refers to long-term investments in an associate or joint venture which is partthe physical and technical evaluation, the financial performance of the net investment in the associate or joint venture, but to which the equity participation methodasset being not relevant.
This modification is not applied.effective from January 1, 2022 and must be applied retrospectively.
Amendments to IFRS 3 business combinations, indicate- reference to the Conceptual Framework
Minor amendments were made to IFRS 3 Business Combinations to update the references to the Conceptual Framework for Financial Reporting and to add an exception for the recognition of liabilities and contingent liabilities within the scope of IAS 37 Provisions, Contingent Liabilities and Contingent Assets and IFRIC Interpretation 21 Liens.
The amendments also confirm that an entitycontingent assets should not be recognized at the acquisition date.
The amendment will reimburse its previously held interest in a joint operation when it obtains control of the business.be effective for annual reporting periods on or after January 1, 2022.
Amendments to IFRS 11, joint agreements, indicate that an entity will not reimburse its previously held interest inOnerous Contracts - Cost of fulfilling a joint operation when it obtains joint control of the business.
contract - Amendments to IAS 12, income tax, clarify37
In May 2020, the International Accounting Standards Board issued amendments to IAS 37 to specify which cost an entity needs to include when assessing whether a contract is onerous or loss making.
The amendment to IAS 37 clarifies that direct contract performance costs include both incremental contract performance costs and an allocation of other costs directly related to the performance of contracts. Before recognizing a separate provision for an onerous contract, an entity recognizes any impairment loss that has occurred on assets used to fulfill the contract.
The amendment is effective for annual reporting periods beginning on or after January 1, 2022.
The Company will apply this modification to contracts for which it has not yet fulfilled all its obligations at the consequencesbeginning of dividend income tax (thatthe annual reported period, in which it is the distributionfirst time the modifications are applied.
Annual Improvements to IFRSs 2018-2020 Cycle
As part of profits) mustits 2018-2020 annual improvements to the IFRS standard process in May 2020 the IASB issued the following amendments:
| (i) | IFRS 9 Financial Instruments - clarifies which fees should be included in the 10% test for derecognition of financial liabilities. |
| (ii) | IFRS 16 Leases - amended Illustrative Example 13 to remove the illustration of lessor payments related to leasehold improvements, to eliminate any misinterpretation on the treatment of lease incentives. |
| (iii) | IFRS 1 First-time Adoption of International Financial Reporting Standards - permits entities that have measured their assets and liabilities at the carrying amounts recorded in the books of their parent to also measure any cumulative translation differences using the amounts reported by the parent. This amendment will also apply to associates and joint ventures that have taken the same IFRS 1 exception. |
The amendments will be recognizedeffective for annual reporting periods beginning on or after January 1, 2022 with early adoption permitted.
Amendment to IFRS 10 and IAS 28 - Sale or Contribution of Assets between an Investor and its Associate or Joint Venture
The IASB has made limited scope amendments to IFRS 10 “Consolidated Financial Statements” and IAS 28 “Investments in profitAssociates and Joint Ventures”.
The amendments clarify the accounting treatment of sales or contributions of assets between an investor and its associates or joint ventures. They also confirm that the accounting treatment will depend on whether the non-cash assets sold or contributed to an associate or joint venture constitute a “business” (as defined in IFRS 3 “Business Combinations”).
When the non-monetary assets constitute a business, the investor shall recognize the full gain or loss regardlessfrom the sale or contribution of how the tax arises.
assets. If the assets do not meet the definition of a business, the gain or loss is recognized by the investor only to the extent of the investment of the other investors in the joint venture associate. These amendments will be applied prospectively.
- 32 -
In December 2015, the IASB decided to defer the date of application of this amendment until its research project on the equity method has been completed.
AmendmentsThe amendments will be effective for annual reporting periods beginning on or after January 1, 2023 and should be applied retrospectively to IAS 23, borrowing costs, clarify that, if a specific loan is still pendingitems of property, plant and equipment made available for use on or after the related asset is ready for its intended use or sale, that loan becomes partbeginning of the fundsearliest period presented when the entity first applied the amendment.
The Company is currently evaluating the impact that an entity borrows in general when calculating the capitalization rate on general loans.
Modification of the plan, reductionmodifications or liquidation (amendments to IAS 19, benefits for employees) specifies how an entity determines pension expenses when changes occur in a defined benefit pension plan. When carried out - a correction, restriction or settlement - IAS 19 requires an entity to set aside its net defined benefit or net asset liability. The amendments require an entity to use the updated assumptions of this remeasurement to determine the current cost of the service and the net interest for the rest of the reporting period after the change in the plan.
It is not expected that other IFRS or IFRIC interpretations that are not yet implementeddescribed before may have a significant impact on the consolidated financial statements.current practice.
| 4 | FINANCIAL RISK MANAGEMENT |
Financial risk management is carried out by the Group’sCorporation’s Management. Management oversees the general management of financial risks, in specific areas, such as foreign exchange rate risk, price risk, cash flow, and fair value interest rate risk, credit risk, the use of derivative andnon-derivative financial instruments and the investment of excess liquidity, as well as financial riskswhich are supervised and carries out periodic supervision and monitoring.monitoring periodically.
| 4.1 | Financial Risk Factors |
The Group’sCorporation’s activities expose it to a variety of financial risks: market risk (including foreign exchange risk, price risk, fair value interest rate risk and cash flow interest rate risk), credit risk and liquidity risk. The Group’sCorporation’s overall risk management program focuses on the unpredictability of financial markets and seeks to minimize potential adverse effects on the Group’sCorporation’s financial performance. The GroupCorporation uses derivative financial instruments to hedge certain risk exposures in one of its subsidiaries and considers the use of other derivatives in the event that it identifies risks that may generate an adverse effect for the GroupCorporation in the short and medium-term.
The GroupCorporation is exposed to exchange rate risk as a result of the transactions carried out locally in foreign currency and due to its operations abroad. As of December 31, 2017,2019, and 20182020 this exposure is mainly concentrated in fluctuations of U.S. dollar, the Chilean and Colombian Pesos. The
As of December 31, 2020, the balances of financial assets and liabilities denominated in foreign currencies correspond to balances in U.S. dollars, which are expressed at the published bid and ask exchange riskrate in effect at that date, according to the currency exchange rate: soles for S/3.624 published by the Superintendency of Banking, Insurance and Pension Fund Administrators (SBS), Chilean pesos for CLP711.24 published by the Central Bank of Chile and Colombian pesos for COP3,432.50 published by Banco of the investments in Mexico, Bolivia, and Panama are not significant due to the volumeRepublica of operations.Colombia.
AtAs of December 31, 2018, the consolidated statement of financial position includes the following:
| | | | | | | | | | | | | | | | |
| | | 2017 | | | 2018 | |
| | | S/(000) | | | USD(000) | | | S/(000) | | | USD(000) | |
Assets | | | 1,851,309 | | | | 570,511 | | | | 2,273,132 | | | | 674,753 | |
Liabilities | | | 1,982,007 | | | | 610,788 | | | | 2,042,176 | | | | 604,383 | |
- 33 -
| | | | | | | | | | | | | | | | |
| | | 2019 | | | 2020 | |
| | | S/(000) | | | USD(000) | | | S/(000) | | | USD(000) | |
Assets | | | 2,868,128 | | | | 864,675 | | | | 2,125,400 | | | | 586,479 | |
Liabilities | | | 1,754,630 | | | | 528,981 | | | | 1,165,475 | | | | 321,599 | |
The Group’sCorporation’s exchange gains and losses for the Peruvian Sol, the Chilean and Colombian Pesos exposure against the U.S. dollar was:
| | | | 2016 | | | 2017 | | | 2018 | | | 2018 | | | 2019 | | | 2020 | |
Gain | | | 742,930 | | | | 329,751 | | | | 382,104 | | | | 383,085 | | | | 392,942 | | | | 426,850 | |
Loss | | | (755,680 | ) | | | (323,927 | ) | | | (405,380 | ) | | | (406,789 | ) | | | (425,782 | ) | | | (432,652 | ) |
If atas of December 31, 20182020 the Peruvian Sol, the Chilean and Colombian Pesos had strengthened/weakened by 2% against the U.S. dollar, with all other variables held constant, thepre-tax profitresults for the year would have increased/decreased by S/0.1 million (S/0.7 million in 2019 and S/0.5 million (S/0.1 million in 2017 and S/0.3 million in 2016)2018).
The consolidated statement of changes in equity comprises a foreign currency translation adjustment originated by its subsidiaries. The consolidated statement of financial position includes assets and liabilities in functional currency equivalent to:to (in thousands):
| | | | | | | | | | | | | | | | |
| | | 2017 | | | 2018 | |
| | | Assets | | | Liabilities | | | Assets | | | Liabilities | |
CLP | | | 77,199,082 | | | | 74,447,874 | | | | 48,129,848 | | | | 49,728,313 | |
COP | | | 101,300,811 | | | | 74,319,654 | | | | 163,560,697 | | | | 76,978,655 | |
| | | | | | | | | | | | | | | | |
| | | 2019 | | | 2020 | |
| | | Assets | | | Liabilities | | | Assets | | | Liabilities | |
Chilean Pesos | | | 53,383,866 | | | | 65,260,543 | | | | 40,869,086 | | | | 74,151,415 | |
Colombian Pesos | | | 187,119,204 | | | | 76,446,723 | | | | 113,350,078 | | | | 54,581,654 | |
The Group’sCorporation’s foreign exchange translation adjustment for 20182020 was positive forby S/8.3 million (in 2019, S/8.2 million, negative and positive by S/5.7 million (negative for S/11.3 million in 2017)2018).
Management considers that the exposure of the GroupCorporation to the price risk of its investments in mutual funds, bonds, and equity securities is low since the invested amounts are not significant. Any fluctuation in their fair value will not have any significant impact on the balances reported in the consolidated financial statements.
| | iii) | Cash flow and fair value interest rate risk |
The Group’sCorporation’s interest rate risk mainly arises from its long-term borrowings. Borrowings issued at variable rates expose the GroupCorporation to cash flow interest rate risk. Borrowings issued at fixed rates expose the GroupCorporation to fair value interest rate risk. Group policy is to maintain most of its borrowings at fixed rate instruments; 46.9%62.3% of total debt in 2018 (57.8%2020 (61.8% in 2017)2019) was contracted at fixed rates and 53.1%37.7% at variable rates (42.2%(38.2% in 2017)2019) which consisted of a 27.7%37.5% fixed rate plus VAC (adjusted for inflation) and the remaining 25.4%0.2% at a variable rate (22.9%(37.7% fixed rate + VAC and the remaining 19.3%0.5% at a variable rate in 2017)2019).
TheDuring 2019 and 2020, the debt subject to fixed rate plus VAC is related to a bond issued in Peruvian Sol to finance the GyM Ferrovias Project, Metro Line 1 (Note 20)19). Any increase in the interest rate resulting from higher inflation will have no significant impact on the Group’sCorporation’s profit because these revenues are also adjusted for inflation.
During 2018 and 2017 borrowings atIn the event that the Corporation accrues variable interest rates are denominated in Peruvian Sol,soles and U.S. dollars, and the Group’s policy iswould be to manage theirhedge the cash flow risk by using interest-rate swaps,with interest rate swap-type derivatives, on which are recognized underthe hedge accounting. However, regarding the variable rate loans related to GSP (Note 19 a-ii), Management decided to assume the risk since it expects to pre-pay them before due.accounting treatment is applied.
If atas of December 31, 2018,2019, the Liborlibor rate plus three months had increased/decreased by 5%, with all other variables held constant, thepre-tax profitresults for the year would have increased/decreased by S/0.75 million (S/0.49 million in 2017).0.01 million. In 2018 and 20172019 there was no significant ineffectiveness in the cash flow hedge. In 2020, it was not necessary to perform the sensitivity analysis since the variable rate debt was not significant.
- 34 -
Credit risk arises from cash and cash equivalents and deposits with banks and financial institutions, as well as customer credit counterparties, including the outstanding balance of accounts receivable and committed transactions. For banks and financial institutions, only independently rated parties with a minimum rating of ‘A’ are accepted.
Concerning to loans to related parties, the GroupCorporation has measures in place to ensure the recovery of these loans through the controls maintained by the Corporate Finance Management and the performance evaluation conducted by the Board.
No credit limits were exceeded during the reporting period, and Management does not expect the GroupCorporation to incur any losses from the performance by these counterparties, except for the ones already recorded at the financial statements.
Prudent liquidity risk management implies maintaining sufficient cash and cash equivalents, the availability of funding through an adequate number of sources of committed credit facilities and the capacity to close out positions in the market. Historically, the Group cash flows enabled it to maintain sufficient cash to meet its obligations. However, as of December 31, 2016,Due to the Group startedCOVID-19 pandemic (Note 1-d), the Company has implemented various actions to experiencedreduce its exposure to liquidity risk, dueand has developed a Financial Plan based on several steps, which were designed assuming attaining a plea bargain agreement within a reasonable time frame. The Financial Plan aims to enable compliance with the early termination ofvarious obligations at the GSP concession agreementcorporate and the obligations assumed (Note 16a-i). As a consequence, the Group started a disinvestment plan to be able to meet the obligations resulting from this scenario (Note 37).group companies’ levels.
GroupThe Group’s Corporate Finance Office monitors rolling forecasts of the Group’s liquidity requirements to ensure it hasexists sufficient cash to meet operational needs so that the Group does not breach borrowing limits or covenants, where applicable, on any of its borrowing facilities. Less significant financing transactions are controlled by the Finance Management of each subsidiary.
Such forecasting takes into consideration the Group’sCorporation’s debt financing plans, covenant compliance, compliance with internal statement of financial position ratio targets and, if applicable, external regulatory or legal requirements;requirements, for example, foreign currency restrictions.
Surplus cash held by the operating entities over the balance required for working capital management is invested in interest-bearing checking accounts or time deposits, selecting instruments with appropriate maturities and sufficient liquidity.
The table below analyzes the Group’sCorporation’s financial liabilities into relevant maturity groupings based on the remaining period from the date of the consolidated statement of financial position to the contractual maturity date. The amounts disclosed in the table are the contractual undiscounted cash flows.
| | | | | | | | | | | | | | | | | | | | |
| | | Less than | | | 1-2 | | | 2-5 | | | More than | | | | |
| | | 1 year | | | years | | | years | | | 5 years | | | Total | |
At December 31, 2017 | | | | | | | | | | | | | | | | | | | | |
Other financial liabilities (except for finance leases) | | | 1,003,500 | | | | 336,913 | | | | 290,253 | | | | — | | | | 1,630,666 | |
Finance leases | | | 72,864 | | | | 41,877 | | | | 24,022 | | | | 638 | | | | 139,401 | |
Bonds | | | 109,746 | | | | 148,986 | | | | 353,349 | | | | 1,272,647 | | | | 1,884,728 | |
Trade accounts payables | | | 1,453,046 | | | | — | | | | — | | | | — | | | | 1,453,046 | |
Accounts payables to related parties | | | 55,174 | | | | 25,954 | | | | — | | | | — | | | | 81,128 | |
Other accounts payables | | | 153,498 | | | | 34,527 | | | | 371,976 | | | | — | | | | 560,001 | |
Othernon-financial liabilities | | | — | | | | 383 | | | | — | | | | — | | | | 383 | |
| | | | | | | | | | | | | | | | | | | | |
| | | 2,847,828 | | | | 588,640 | | | | 1,039,600 | | | | 1,273,285 | | | | 5,749,353 | |
| | | | | | | | | | | | | | | | | | | | |
| | | | | | | | | | | | | | | | | | | | |
| | | Less than | | | 1-2 | | | 2-5 | | | More than | | | | |
| | | 1 year | | | years | | | years | | | 5 years | | | Total | |
At December 31, 2018 | | | | | | | | | | | | | | | | | | | | |
Other financial liabilities (except for finance leases) | | | 816,122 | | | | 273,079 | | | | 129,233 | | | | 41,577 | | | | 1,260,011 | |
Finance leases | | | 15,151 | | | | 7,489 | | | | 14,094 | | | | — | | | | 36,734 | |
Bonds | | | 111,080 | | | | 153,287 | | | | 355,667 | | | | 1,174,404 | | | | 1,794,438 | |
Trade accounts payables | | | 1,079,531 | | | | — | | | | — | | | | — | | | | 1,079,531 | |
Accounts payables to related parties | | | 55,941 | | | | 21,849 | | | | — | | | | — | | | | 77,790 | |
Other accounts payables | | | 116,806 | | | | 17,777 | | | | 338,627 | | | | — | | | | 473,210 | |
Other non-financial liabilities | | | — | | | | 61 | | | | — | | | | — | | | | 61 | |
| | | | | | | | | | | | | | | | | | | | |
| | | 2,194,631 | | | | 473,542 | | | | 837,621 | | | | 1,215,981 | | | | 4,721,775 | |
| | | | | | | | | | | | | | | | | | | | |
- 35 -
| | | | | | | | | | | | | | | | | | | | |
| As of December 31, 2019 | | Less than
1 year | | | 1-2 years | | | 2-5 years | | | More than
5 years | | | Total | |
Other financial liabilities (except for finance leases and lease liability for right-of-use asset) | | | 501,864 | | | | 147,473 | | | | 235,222 | | | | — | | | | 884,559 | |
Finance leases | | | 11,438 | | | | 3,531 | | | | 13,346 | | | | — | | | | 28,315 | |
Lease liability for right-of-use asset | | | 31,036 | | | | 40,808 | | | | 32,562 | | | | 11,551 | | | | 115,957 | |
Bonds | | | 115,690 | | | | 157,516 | | | | 358,461 | | | | 1,077,960 | | | | 1,709,627 | |
Trade accounts payables (except non-financial liabilities) | | | 989,574 | | | | — | | | | 34,814 | | | | — | | | | 1,024,388 | |
Accounts payables to related parties | | | 38,916 | | | | 21,747 | | | | — | | | | 836 | | | | 61,499 | |
Other accounts payables (except non-financial liabilities) | | | 220,602 | | | | 2,505 | | | | 219,788 | | | | — | | | | 442,895 | |
Other non-financial liabilities | | | — | | | | 52 | | | | — | | | | — | | | | 52 | |
| | | | | | | | | | | | | | | | | | | | |
| | | 1,909,120 | | | | 373,632 | | | | 894,193 | | | | 1,090,347 | | | | 4,267,292 | |
| | | | | | | | | | | | | | | | | | | | |
| | | | | | | | | | | | | | | | | | | | |
| As of December 31, 2020 | | Less than
1 year | | | 1-2 years | | | 2-5 years | | | More than
5 years | | | Total | |
Other financial liabilities (except for finance leases and lease liability for right-of-use asset) | | | 433,318 | | | | 183,796 | | | | 197,785 | | | | 23,953 | | | | 838,852 | |
Finance leases | | | 16,287 | | | | 14,919 | | | | 20,851 | | | | 8,515 | | | | 60,572 | |
Lease liability for right-of-use asset | | | 24,714 | | | | 32,006 | | | | 19,847 | | | | 11,131 | | | | 87,698 | |
Bonds | | | 137,090 | | | | 168,673 | | | | 385,919 | | | | 971,543 | | | | 1,663,225 | |
Trade accounts payables (except non-financial liabilities) | | | 1,001,470 | | | | 40,502 | | | | — | | | | — | | | | 1,041,972 | |
Accounts payables to related parties | | | 43,818 | | | | 35,461 | | | | — | | | | 836 | | | | 80,115 | |
Other accounts payables (except non-financial liabilities) | | | 288,037 | | | | 2,185 | | | | 115,321 | | | | — | | | | 405,543 | |
| | | | | | | | | | | | | | | | | | | | |
| | | 1,944,734 | | | | 477,542 | | | | 739,723 | | | | 1,015,978 | | | | 4,177,977 | |
| | | | | | | | | | | | | | | | | | | | |
| 4.2 | Capital management risk |
The Group’sCorporation’s objectives when managing capital are to safeguard the Group’sCorporation’s ability to continue as a going concern in order to provide returns for shareholders, benefits for other stakeholders and to maintain an optimal capital structure to reduceminimize the cost of capital. In 2017 the situation of the GroupCorporation had lead Management to monitor deviations that might cause thenon-compliance of covenants and may hinder renegotiation of liabilities(Note19-a)(Note18-a). In extraordinary situations and events as explained in Note 1 d), the Corporation identifies potential deviations and requirements and establishes a plan.
In order to maintain or adjust the capital structure, the GroupCorporation may adjust the amount of dividends paid to shareholders, return capital to shareholders, issue new shares or sell assets to reduce debt.
The GroupCorporation monitors capital based on the gearing ratio. This ratio is calculated as net debt divided by total capital. Net debt is calculated as total borrowings (including current andnon-current borrowings), less cash and cash equivalents. Total capital is calculated as ‘equity’ as shown in the consolidated statement of financial position plus net debt.
As of December 31, 2017,2019, and 2018,2020, the gearing ratio is presented below indicating the Group’sCorporation’s strategy to keep it in a range from 0.10 to 0.70.
| | | | 2017 | | | 2018 | | | 2019 | | | 2020 | |
Total financial liabilities and bonds | | | 2,637,630 | | | | 2,139,714 | | |
Less: Cash and cash equivalents | | | (626,180 | ) | | | (801,140 | ) | |
Total financial liabilities and bonds (Note 18 and Note 19) | | | | 1,814,637 | | | | 1,831,079 | |
Less: Cash and cash equivalents (Note 9) | | | | (950,701 | ) | | | (900,168 | ) |
| | | | | | | | | | | | |
Net debt | | | 2,011,450 | | | | 1,338,574 | | | | 863,936 | | | | 930,911 | |
Total equity | | | 2,589,078 | | | | 2,489,931 | | | | 1,876,085 | | | | 1,595,296 | |
| | | | | | | | | | | | |
Total capital | | | 4,600,528 | | | | 3,828,505 | | | | 2,740,021 | | | | 2,526,207 | |
| | | | | | | | | | | | |
Gearing ratio | | | 0.44 | | | | 0.35 | | | | 0.32 | | | | 0.37 | |
| | | | | | | | | | | | |
For the classification of the type of valuation used by the GroupCorporation for its financial instruments at fair value, the following levels of measurement have been established.
Level 1: Measurement based on quoted prices in active markets for identical assets or liabilities.
Level 2: Measurement based on inputs other than quoted prices included within Level 1 that are observable for the asset or liability, either directly (that is, as prices) or indirectly (that is, derived from prices).
Level 3: Measurement based on inputs for the asset or liability that are not based on observable market data (that is, unobservable inputs, generally based on internal estimates and assumptions of the Group)Corporation).
- 36 -
The table below shows the Group’sCorporation’s assets and liabilities measured at fair value on December 31, 2017, and 2018:value:
| | | | | | | | | | | | |
| | | Level 1 | | | Level 2 | | | Total | |
At December 31, 2017 | | | | | | | | | | | | |
Financial assets | | | | | | | | | | | | |
Financial assets at fair value through profit or loss | | | 181 | | | | — | | | | 181 | |
Financial liabilities | | | | | | | | | | | | |
Derivatives used for hedging | | | — | | | | 383 | | | | 383 | |
At December 31, 2018 | | | | | | | | | | | | |
Financial liabilities | | | | | | | | | | | | |
Derivatives used for hedging | | | — | | | | 61 | | | | 61 | |
| | | | | | | | |
| | Level 2 | | | Level 3 | |
As of December 31, 2019 | | | | | | | | |
Financial liabilities | | | | | | | | |
Derivatives used for hedging (a) | | | 52 | | | | — | |
As of December 31, 2020 | | | | | | | | |
Financial liabilities | | | | | | | | |
Other financial entities (Note 18-d) | | | — | | | | 152,523 | |
There were no transfers between levels 1 and 2 during the year.
| (a) | As of December 31, 2020, this financial liability was liquidated. |
| 5 | CRITICAL ACCOUNTING ESTIMATES AND JUDGMENTS |
Estimates and judgments used are continuously evaluated and are based on historical experience and other factors, including expectations of future events that are believed to be reasonable under the circumstances.
| 5.1 | Critical accounting estimates and assumptions |
The GroupCorporation makes estimates and assumptions concerning the future. The resulting accounting estimates will, by definition, seldom equal the related actual results. The estimates and assumptions that have a significant risk of causing a material adjustment to the carrying amounts of assets and liabilities within the next financial year are addressed below.
| | a) | EstimatedEvaluation of the impairment of goodwill and other fixed assets of definite useful life and intangible assets with anof indefinite useful life
|
Impairment reviews are undertaken annually to determine if goodwill arising from business acquisitions and other intangible assets with indefinite useful life are impaired, in accordance with the policy described in Note2.15-i). For this purpose, goodwill is allocated to the different CGUCash Generating Unit (“CGU”) to which it relates while other intangible assets with indefinite useful life are assessed individually.
The recoverable amounts of the CGU and of other intangible assets with indefinite useful life have been determined based on the higher of theirvalue-in-use and fair value less costs to sell. This evaluation requires the exercise of Management’s professional judgment to analyze any potential indicators of impairment as well as the use of estimates in determining the value in use, including preparing future cash flows, macro-economic forecasts as well as defining the interest rate at which said cash flows will be discounted.
If the GroupCorporation experiences a significant drop in revenues or a drastic increase in costs or changes in other factors, the fair value of their business units might decrease. If management determines that the factors reducing the fair value of the business are permanent, those economic factors will be taken into consideration to determine the recoverable amount of those business units and therefore, goodwill, as well as other intangible assets with indefinite useful life may be deemed to be impaired, which may cause their write-down.
In accordance with the impairment evaluations carried out by Management, losses due to deterioration of goodwill and trademarks have been recognized; they were generated by the decrease in the expected flows as a reduction of the contracts’ “backlog”.
- 37 -
AtAs of December 31, 2017,2019, and 20182020 the GroupCorporation has performed a sensitivity analysis increasing or decreasing the assumptions of gross margin, discount rate, and revenue and terminal growth rate by a 10%, with all the other variables held constant, as follows:
| | | | Difference between recoverable amount and carrying amounts | | | Difference between recoverable amount and carrying amounts | |
| | | 2017 | | 2018 | | | 2019 | | 2020 | |
Goodwill | | | | | | | | | | | | | | | | |
Gross margin | | | (10 | %) | | | +10 | % | | | (10 | %) | | | +10 | % | | | (10 | %) | | | +10 | % | | | (10 | %) | | | +10 | % |
Engineering and construction | | | 81.31 | % | | 143.63 | % | | 0.51 | % | | 41.12 | % | | | (25.54 | %) | | | (4.25 | %) | | | (8.30 | %) | | | 37.10 | % |
Electromechanical | | | 197.30 | % | | 620.85 | % | | (9.73 | %) | | 38.89 | % | | | 35.63 | % | | | 52.97 | % | | | 41.81 | % | | | 55.60 | % |
IT equipment and services | | | 0.32 | % | | 38.87 | % | | 42.60 | % | | 101.27 | % | |
Telecommunication services | | | 465.17 | % | | 1339.26 | % | | | — | | | | — | | |
| Discount rate: | | | (10 | %) | | | 10 | % | | | (10 | %) | | | 10.00 | % | | | (10 | %) | | | +10 | % | | | (10 | %) | | | +10 | % |
Engineering and construction | | | 146.07 | % | | 86.86 | % | | 39.19 | % | | 6.65 | % | | | (4.30 | %) | | | (23.09 | %) | | | 32.68 | % | | | 0.53 | % |
Electromechanical | | | 478.08 | % | | 354.39 | % | | 29.36 | % | | 2.97 | % | | | 48.89 | % | | | 39.92 | % | | | 52.32 | % | | | 45.23 | % |
IT equipment and services | | | 30.06 | % | | 11.25 | % | | 77.06 | % | | 48.93 | % | |
Telecommunication services | | | 2190.66 | % | | 1967.37 | % | | | — | | | | — | | |
| Terminal growth rate: | | | (10 | %) | | | +10 | % | | | (10 | %) | | | +10 | % | | | (10 | %) | | | +10 | % | | | (10 | %) | | | +10 | % |
Engineering and construction | | | 107.41 | % | | 117.91 | % | | 18.48 | % | | 23.30 | % | | | (16.31 | %) | | | (13.38 | %) | | | 11.58 | % | | | 17.44 | % |
Electromechanical | | | 402.19 | % | | 416.25 | % | | 12.90 | % | | 16.34 | % | | | 42.36 | % | | | 46.32 | % | | | 46.83 | % | | | 50.65 | % |
IT equipment and services | | | 18.54 | % | | 20.52 | % | | 59.73 | % | | 62.91 | % | |
Telecommunication services | | | 2232.86 | % | | 2394.81 | % | | | — | | | | — | | |
| | | | | | | | | |
| | | | Difference between recoverable amount and carrying amounts | | |
| | | 2017 | | 2018 | | |
Trademarks | | | | | | | | | | | | | | | | |
Revenue growth rate: | | | (10 | %) | | | +10 | % | | | (10 | %) | | | +10 | % | | | (10 | %) | | | +10 | % | | | (10 | %) | | | +10 | % |
Morelco | | | 16.37 | % | | (4.79 | %) | | 75.00 | % | | 116.27 | % | | | 22.14 | % | | | 60.11 | % | | | 59.65 | % | | | 123.51 | % |
Vial y Vives - DSD | | | (40.72 | %) | | (63.32 | %) | | 27.40 | % | | 55.71 | % | | | 110.69 | % | | | 72.38 | % | | | (1.04 | %) | | | 2.79 | % |
Adexus | | | 22.10 | % | | (0.10 | %) | | 21.40 | % | | 48.38 | % | |
| Discount rate: | | | (10 | %) | | | +10 | % | | | (10 | %) | | | +10 | % | | | (10 | %) | | | +10 | % | | | (10 | %) | | | +10 | % |
Morelco | | | (7.21 | %) | | 22.92 | % | | 126.00 | % | | 72.33 | % | | | 63.02 | % | | | 23.56 | % | | | 124.29 | % | | | 66.82 | % |
Vial y Vives - DSD | | | (58.56 | %) | | (45.65 | %) | | 29.54 | % | | 55.99 | % | | | 78.72 | % | | | 106.64 | % | | | (6.56 | %) | | | 9.95 | % |
Adexus | | | (2.13 | %) | | 28.02 | % | | 56.26 | % | | 18.49 | % | |
Terminal growth rate: | | | (10 | %) | | | +10 | % | | | (10 | %) | | | +10 | % | | | (10 | %) | | | +10 | % | | | (10 | %) | | | +10 | % |
| Morelco | | | 8.61 | % | | 3.17 | % | | 91.70 | % | | 99.82 | % | | | 37.49 | % | | | 44.02 | % | | | 86.47 | % | | | 97.09 | % |
Vial y Vives - DSD | | | (51.36 | %) | | (54.47 | %) | | 38.99 | % | | 44.26 | % | | | 88.07 | % | | | 95.20 | % | | | (9.14 | %) | | | 11.05 | % |
Adexus | | | 13.27 | % | | 8.86 | % | | 31.90 | % | | 48.38 | % | |
Goodwill
In 2018,2020, if the gross margin had been 10% less than management’s estimate, the Corporation would have had to recognize an impairment provision for goodwill of the Engineering and Construction CGU (Morelco); however, if the discount rate or terminal growth rate had been 10% belowless or 10% abovemore than management’s estimate, it would not have had to recognize an impairment provision. In 2019, if these assumptions had been 10% less or 10% more than Management’s estimates,estimate, the GroupCorporation would not have recognized a provision for impairment of goodwill;goodwill in the Electromechanical CGU (GMA); however, at the same variation, the GroupCorporation would have to recognized a provision for impairment of the Electromechanical GMA (in 2017 would nor have recognizedEngineering and Construction (Morelco).
As a result of these assessments, as of December 31, 2020, no impairment provision for impairment)was identified. As of December 31, 2019, an impairment of the goodwill in Morelco was identified and recorded in the Engineering and Construction CGU (Note 17).
Trademarks
In 2018,2020, if the revenue growth rate, terminal growth rate, or the discount rate were 10% below Management’s estimates, the Corporation would have had to recognize a provision for trademark impairment in Vial y Vives-DSD. In 2019, if these assumptions had been 10% less or had been 10% abovemore than Management’s estimates, the GroupCorporation would have not recognized a provision for impairment in trademarks (in 2017, would have recognized a provision for impairment of trademark in Morelco, Vial yVives-DSD and Adexus).trademarks.
At December 31, 2017, asAs a result of these evaluations, anassessments, as of December 31, 2020, no impairment provision was identified. As of December 31, 2019, a reversal of goodwill impairment was identified and recorded in the Engineering and Construction CGU, trademark impairment in Vial yVives-DSD (Note 17).
Review of carrying amounts of UNNA ENERGIA’s long-lived assets
At the date of each consolidated statement of financial position, the Group reviews the carrying amounts of its non-financial assets with finite useful lives to determine whether there is any indication that their carrying amounts are impaired. If there is any indication of impairment, the recoverable amount of the asset is estimated in order to determine, if applicable, the amount of the impairment.
The determination of whether an asset or group of assets is impaired involves management’s estimates with a certain level of uncertainty, such as future oil and goodwillgas (commodity) prices, effects of inflation on operating expenses, discount rates, production profiles and the outlook for world supply and demand conditions for crude oil, natural gas and refined products. Expected future cash flows are determined using management’s best estimate of future oil and gas prices and reserve volumes.
The level of expected future production in any impairment test is based on assumptions about future oil and gas prices, development and production costs, current tax regimes, among other factors.
As a consequence of the decrease in Morelco (Note 18).crude oil and gas prices at international level, the Group performed an impairment test of its long-lived assets belonging to its Cash Generating Units (hereinafter CGU), crude oil and non-associated gas, Block I, Block V, Block III, Block IV and the Pariñas Gas Plant, respectively, for which it used the value in use approach, since it has considered within its maintenance capex cash flows and the pre-tax valuation has been performed.
Management based its estimates of expected future cash flows to determine the recoverable value on i) information on reserves determined by technical management; and ii) estimated future prices and costs projected by management, using the following assumptions:
- 38 -Projection horizon of the concession of its lots, (Block I until 2021, Block V until 2023, Block III until 2045, Block IV until 2045 and gas plant until 2046).
Future prices projected based on information available in the market at the date of the consolidated statement of financial position, based on a “Crude Oil Brent” price forecast and published by the Energy Information Administration (EIA) starting at US$/bbl57.50, reaching US$/bbl100.25 in the long term for crude oil. Likewise, the prices for the Company have been considered a reference price starting at US$/bbl57.50 up to US$/bbl98.68 in the long term.
Future costs projected by Management based on the estimated evolution of the business, considering the investment plan reported to Perupetro S.A.
Actual discount rate for the four Lots is 11.09% and for the Plant 10.17%, which is the weighted average cost of capital (WACC) rate, determined in accordance with the Company’s policies, before taxes.
The recoverable value determined by the Company for crude oil following the value in use approach was S/783.8 million, which is higher than the carrying value of the CGU’s S/361 million, therefore management concludes that it is not required to recognize an impairment recovery of its assets (Level 3)
Sensitivity analysis
The sensitivity of the results obtained from the impairment test above to changes in the assumptions used by management is detailed below:
Changes in projected future prices based on information available in the market at a date close to the date of approval of the consolidated financial statements by the Board of Directors. This assumption has considered a decrease in quoted oil and gas prices at December 31, 2019 by 10%.
Changes in the discount rate: If the discount rate used by management were to increase by 10%.
As a result of the volatility of oil and gas prices in the international and local market, the Company sensitized the prices and discount rates in its expected cash flow model according to the assumptions included obtaining the recoverable values as of December 31, 2020. Assuming that prices had been reduced by 10%, and the discount rate had been increased by 10%, this would have resulted in a negative variation in the Company’s value in use of 29.2%. Although there is a high level of uncertainty, the impact is not significant in the separate financial statements, which is still higher than the carrying value of the CGU’s S/194 million.
Determination of the tax obligations and expenses requires interpretations of the applicable tax laws and regulations. The GroupCorporation seeks legal and tax counsel before making any decision on tax matters.
Deferred income tax assets and liabilities are calculated on the temporary differences arising between the tax basis of assets and liabilities and the amounts stated in the financial statement of each entity that makes up the Group,Corporation, using the tax rates in effect in each of the years in which the difference is expected to reverse. Any change in tax rates will affect the deferred income tax assets and liabilities. This change will be recognized in the consolidated statement of income statement in the period in which the change takes effect.
Deferred income tax assets are recognized only to the extent that it is probable that future taxable profits will be available against which deductible temporary differences and tax loss carryforwards can be utilized. For this purpose, the GroupCorporation takes into consideration all available evidence, including factors such as historical data, projected income, current operations, and tax planning strategies. A tax benefit related to a tax position is only recognized if it is more likely than not that the benefit will ultimately be realized.
The Group’sCorporation’s possible maximum exposure to tax contingencies amountsamount to S/15.7147.7 million.
The income tax for the year includes Management’s evaluation of the amount of taxes to be paid in uncertain tax positions, where the liabilities have not yet been agreed with the tax administration.
| | c) | Percentage of completion revenue recognition |
Revenues fromService revenues based on construction contracts are recognized usingby thepercentage-of-completion percentage of completion method, which isrequires estimating the margin will be obtained culminating works. Projections of these margins are determined by management based on their budgets execution and adjusted periodically in order to use updated information to reflect actual performance in the completion of a physical proportion ofwork. In this regard, management believes that the overall work contract considering total costs and revenues estimatedestimates made at the end of the project (Note 2.26 i).year are reasonable. When changes occur not approved in the scope of work, income is recognized as equivalent to the cost incurred (no profit is recognized) until it has been approved the additional work.
The revenue of the contract is recognized as such in the consolidated statement of comprehensive income in the accounting periods in which the work was executed. Costs related to the construction contract costs are recognized as works in the consolidated comprehensive income in the accounting periods in which the work was executed. However, any expected and likely cost overruns related to the contract over total expected income under the contract is recognized as expense immediately. In addition, any change in the estimates under the contract is recognized as a change in accounting estimates in the period in which the change is made and future periods if applicable. In certain construction contracts, the terms of these agreements allow to retain an amount to customers until it culminates with construction. Under these contracts, the total amount cannot be recognized until the construction is finished.
As of December 31, 2016, 20172018, 2019 and 2018,2020, a sensitivity analysis was performed considering a 10% increase/decrease in the Group’sCorporation’s gross margins, as follows:
| | | | 2016 | | | 2017 | | | 2018 | | | 2018 | | | 2019 | | | 2020 | |
Revenues | | | 2,713,013 | | | | 2,214,108 | | | | 1,961,100 | | | | 1,961,100 | | | | 2,411,880 | | | | 1,815,671 | |
Gross profit | | | 29,310 | | | | 106,902 | | | | 32,685 | | | | 32,685 | | | | 60,317 | | | | 99,362 | |
% | | | 1.08 | | | | 4.83 | | | | 1.67 | | | | 1.67 | | | | 2.50 | | | | 5.47 | |
Plus 10% | | | 1.19 | | | | 5.31 | | | | 1.84 | | | | 1.84 | | | | 2.75 | | | | 6.02 | |
| | | | | | | | | | | | | | | | | | |
Increase in profit before income tax | | | 2,975 | | | | 10,667 | | | | 3,399 | | | | 3,399 | | | | 6,010 | | | | 9,941 | |
| | | | | | | | | | | | | | | | | | |
| | | 32,285 | | | | 117,569 | | | | 36,084 | | | | 36,084 | | | | 66,327 | | | | 109,303 | |
| | | | | | | | | | | | | | | | | | |
Less 10% | | | 0.97 | | | | 4.35 | | | | 1.50 | | | | 1.50 | | | | 2.25 | | | | 4.92 | |
| | | | | | | | | | | | | | | | | | |
Decrease in profit before income tax | | | (2,975 | ) | | | (10,667 | ) | | | (3,399 | ) | | | (3,399 | ) | | | (6,010 | ) | | | (9,941 | ) |
| | | | | | | | | | | | | | | | | | |
| | | 26,335 | | | | 96,235 | | | | 29,286 | | | | 29,286 | | | | 54,307 | | | | 89,421 | |
| | | | | | | | | | | | | | | | | | |
- 39 -
| | d) | Provision for well closure costs |
AtAs of December 31, 2018,2020, the present value of the estimated provision for the closure of 158193 wells located in Talara amounted to S/20.352.9 million (S/16.850.1 million as of December 31, 2017,2019, for the closure of 144189 wells). The well closure liability is adjusted to reflect the changes that resulted from the passage of time and from reviews of either the date of occurrence or the amount of the present value of the originally estimated obligations (Note18-d)17-d).
The GroupCorporation estimates the present value of its future obligation for well closure costs, or well closure liability, and increases the carrying amount of the asset that will be withdrawn in the future and that is shown under the heading of intangibles in the consolidated statement of financial position.
TheIn 2020, the calculation of the provision has been separated according to the obligations currency. Therefore, the pre-tax discount raterates used for the calculation of the present value calculation was 2.46%were 0.36% (for dollars) 1.95% (for soles) Block I, and 0.17% (for dollars) 1.149% (for soles) Block V (1.58% for Block I and 2.51%1.66% for Block V (2.09% for block I and 2.27% for block V for the year 2017)in 2019), and 2.98%1.55% (for dollars) 5.65% (for soles) for Blocks III and IV (2.72% for the year 2017)(2.33% in 2019), based on the rate applicable to Peruvian sovereign bonds in soles and dollars between 3, 5 and30-year rate used on U.S. bonds effective at 30 years respectively, in effect as of December 31, 2018.2019 and 2020.
If on December 31, 2017,2019, and 2018,2020, the estimated rate had increased or decreased by 10%, with all variables held constant, the impact onpre-tax profit would not have been significant.
| | e) | Impairment of investment in associate and account receivable to Gasoducto Sur Peruano S.A. (GSP) |
Based on the termination of the concession agreement, on which Gasoducto Sur Peruano S.A. (GSP) acts as concessionaire (Note 1615 a-i), as well as the Groupagreements taken at the end of the year, the Corporation identified potential impairment indicators affecting the recoverability of its investment. Consequently, the Group has appliedCorporation impaired the rules statedfull investment amount in IAS 36 “Impairment of assets” to determine the recoverable amount of this investment.2019.
In that process, the GroupCorporation has applied judgment to weight the various uncertainties surrounding the amount that can be recovered from this investment. Management has determined the recoverable amount assuming twothe following key factors: (i) the amount that GSP will recover as a result of thea possible public auction, (ii) the liquidation of the company via the GSP Creditor’s meeting, and (ii)(iii) the validity of its right to subordinate the Odebrecht Group’s debts in GSP.
WithThe calculation of the impairment estimate assumes a process of liquidation of GSP in accordance with Peruvian legislation, whereby the value of the asset to be recovered is first applied to the payments of liabilities in the different categories of creditors and the remainder, if it is the case, to the payment of the shareholders, taking into account the existing subordination agreements.
In 2018, in relation to the amount to be recovered by GSP, the GroupCorporation is assuming a recovery of the minimum amount established in the concession agreement, which is equivalent to 72.25% of the Net Carrying Amount (NCA) of the Concession assets. This amount, in substance, represents a minimum payment to be obtained by GSP based on a public auction (liquidation) to be set up for the adequate transfer of the Concession’s assets to a new Concessionaire, within a year, under the relevant contractual terms and conditions.
With relation Additionally, given the situation of non-compliance by the Peruvian State and the situation in which the process of forming the creditors’ meeting was, and according to the validityopinion of its right to subordinatelawyers for similar cases, the Odebrecht Group’s liabilities in GSP, Management´s assessment, in consultation with its legal advisors, is that although some uncertainties exist, these do not represent a material riskterm for exercising this right.
The concession agreement also established two additional tranches of 85% or 100%five years was estimated the recovery of the NCA to be recovered as a result of a public auction, depending on several factors. In any of these scenarios, the Group would be able to recover its total investment, and no additional impairment would be necessary to be recognized.account receivable.
The calculation of the impairment estimate assumes a GSP settlement process in accordance with Peruvian legislation, whereby the value of the asset to be recovered is applied first to the payments of liabilities in the different categories of creditors and the remainder, if the case, to the payment of the shareholders, taking into account the existing subordination agreements.
| f) | Impairment of the joint operation in Consorcio Constructor Ductos del Sur (CCDS)
|
CCDS was mainly engaged in performing the engineering, procurement and construction work for Gasoducto Sur Peruano S.A. (GSP). Due to the early termination of GSP, the Group applied the rules stated in IAS 36 “Impairment of assets” and IAS 37 “Provisions” to determine the recoverable amounts of the assets and
- 40 -
liabilities to be recorded, respectively. As of December 31, 2016, adjustments were made to2019 and 2020, the audited financial statementsrecovery of CCDS;NCA estimated by Management equals 50%, in consideration of the agreements taken as a result,consequence of the following adjustments were includedsigning of the preliminary effective collaboration agreement. Likewise, considering that the formation of the creditors’ meeting is still pending, the deadline to initiate actions to start the collection process has been delayed. Therefore, a total term of eight years has been considered, from the date and until the formation of the creditors’ meeting, the approval of the settlement plan, the presentation of the arbitration claim, as well as the entire arbitration process in the financial statements of our subsidiary GyM S.A., resulting in a loss of S/15.2 million:itself.
| | | | |
| | S/000 | |
Income for debt forgiveness (i)
| | | 431,484 | |
Indemnification income
| | | 33,600 | |
Work in progress impairment (ii)
| | | (410,199 | ) |
Other provisions
| | | (24,915 | ) |
Inventories impairment (iii)
| | | (33,824 | ) |
Financial expenses
| | | (7,004 | ) |
Property, plant and equipment impairment
| | | (4,143 | ) |
Others (liability) asset, net
| | | (164 | ) |
| | | | |
| | | (15,165 | ) |
| | | | |
(i) | The extinguished trade accounts payable relates to the recognition of the project estimated margin recorded as a liability (Note 2.17).
|
(ii) | The recoverable of work in progress relates to the minimum secured payment to be obtained from GSP.
|
(iii) | Inventories are assets specific in nature and cannot be traded in an active market.
|
| 5.2 | Critical judgments in applying the accounting policies |
Consolidation of entities in which the GroupCorporation holds less than 50%
The GroupCorporation owns some direct and indirect subsidiaries of which the GroupCorporation has control even though it has less than 50% of the voting rights. These subsidiaries mainly comprise indirect subsidiaries in the real estate business owned through Viva GyMNegocio Inmobiliario S.A., having the power to affect the relevant activities that impact the subsidiaries’ returns, even though the GroupCorporation holds interest between 30% and 50%. Additionally, the GroupCorporation has controlde facto by a contractual agreement with the majority investor over Promotora Larcomar S.A. of which it owns 46.55% of the equity interest.
UNNA ENERGIA S.A. Lots III and IV, License contracts for the exploitation of hydrocarbons
As a result of the signing in March 2015 of the license agreements for block III and IV, the Group’s oil production and business capacity has increased. The most relevant critical judgments applied by the Group are listed below.
The Corporation’s Management concluded that it acquired control over the assets of the aforementioned blocks, by defining the main aspects of the operation, maintenance and disposal, as well as being exposed to the main risks and benefits inherent to the ownership of the assets and, consequently, the Group is not simply assuming a right of use. Therefore, on April 2015, the Group recognized facilities, machinery and equipment for S / 35.7 million and will recognize its futures investments as part of its assets.
Additionally, the Group would assume the costs of the permanent abandonment of the productive wells and facilities that are part of its operations and that have been produced in the Group’s management, which, for safety, environmental or economic reasons, cease to operate, in accordance with established in clause 13.5 of the aforementioned contract. It should be noted that it is not the Group’s obligation to carry out closure activities for existing wells that are not produced by it. These costs must be part of the assets of the company, see Note 13 - Intangible Assets - Provision for the closure of wells.
On December 31, 2016, the Company began its well drilling activities in Block IV, which continued until March 2020, when due to a Sanitary Emergency, the drilling campaigns were suspended due to Force Majeure. In Block III, the company has not started its drilling activities, for reasons of Force Majeure, as it does not have the authorization of the Miramar Vichayal Peasant Community (the Community), until the Easement Contract is registered in Public Registries. In November 2019, UNNA ENERGIA S.A. and the Community entered into the Easement Agreement. Efforts are under way to register the Easement Contract in Public Records, to then continue with the respective payments and start the drilling campaign in Block III.
Consolidation of entities in which the GroupCorporation does not have joint control but holds rights and obligations over the assets and liabilities
The GroupCorporation assesses, on an ongoing basis, the nature of the contracts signed with one or more parties. If no control or joint control is determined to be held by the Group,Corporation, but it has rights over assets and obligations for liabilities under the arrangement, then the GroupCorporation recognizes its assets, liabilities, revenue and expenses and its share of any jointly controlled assets or liabilities and any revenue or expense arising under the arrangement as a joint operation in accordance with IFRS 11 - Joint arrangements (Note2.2-d).
| 6. | INTERESTS IN OTHER ENTITIES |
The consolidated financial statements include the accounts of the GroupCorporation and its subsidiaries. Additionally, the consolidated financial statements of the GroupCorporation include its interest in joint operations in which the Company or certain subsidiaries have joint control with their partners (Note2.2-d).
- 41 -
The following table shows the principal direct and indirect subsidiaries classified by operating segment (Note 7):
| | | | |
Name | | Country | | Economic activity |
| Engineering and Construction: | | | | |
| | |
GyMCumbra Peru S.A. | | Peru and Colombia | | Civil construction, electro-mechanic assembly, buildings management and implementing housing development projects and other related services. |
| | |
| GyM Chile S.p.A. | | Chile | | Electromechanical assembliesInvestment funds, investment companies and services to energy, oil, gas and mining sector.similar financial entities. |
| | |
| Vial y Vives - DSD S.A. | | Chile | | Electromechanical assemblies and services. Develop activities related to the construction ofConstruction engineering projects, civil construction projects and electromechanical assemblies, as well as architectural designrelated technical consultancy, rental of agricultural machinery and installations in general. Constructionequipment, forestry, construction and assemblies and electromechanical services in the sectors of energy, oil, gas and mining.civil engineering without operator. |
| | |
GMICumbra Ingenieria S.A. | | Peru, Mexico, and Bolivia | | Advisory and consultancy services in engineering, carrying out studies and projects, managing projects and supervision of works. |
| | |
Morelco S.A.SS.A.S. | | Colombia and Ecuador | | Providing construction and assembly services, supplyingsupply of equipment and material to design, build, assemble, operatematerials, operation and maintain all typesmaintenance and engineering services in the specialties of mechanical engineering,mechanics, instrumentation and civil work.works. |
| | |
Infrastructure: | | | | |
| | |
GMPUNNA Energia S.A. | | Peru | | Oil and oilby-products extraction, operation and exploration services, as well as providing storage and fuel dispatch services. |
| | |
| Oiltanking Andina Services S.A. | | Peru | | Operation of the gas processing plant of Pisco - Camisea. |
| | |
| Transportadora de Gas Natural Comprimido Andino S.A.C. | | Peru | | Supply, process and market natural gas and its derivative products. |
| | | | |
Name | | Country | | Economic activity |
Concar S.A.S.A.C. | | Peru | | Highway and roads concessions operation and maintenance. |
| | |
GyM FerroviasTren Urbano de Lima S.A. | | Peru | | Concession for the operation of the public transportation system of the Line 1 of the Lima Metro (Metro de Lima Metropolitana). |
| | |
| Survial S.A. | | Peru | | Concession for constructing, operating and maintaining Section 1 of the “Southern Inter-oceanic” highway. |
| | |
| Norvial S.A. | | Peru | | Concession for restoring, operating and maintaining the “Ancon -— Huacho -— Pativilca” section of the Panamericana Norte road. |
- 42 -
| | | | |
Name
| | Country
| | Economic activity
|
| Concesion Canchaque S.A.C. | | Peru | | Concession for operating and maintaining of the Buenos Aires -– Canchaque provincial road highway. |
| | |
| Concesionaria Via Expresa Sur S.A. | | Peru | | Concession for designing, constructing, operating and maintaining the Via Expresa -— Paseo de la Republica in Lima. |
| | |
Real estate: | | | | |
| | |
VIVA GyMViva Negocio Inmobiliario S.A. | | Peru | | Developing and managing real estate projects directly or together with other partners. |
| | |
| Parent company operation: | | | | |
| | |
| Adexus S.A. | | Chile, Peru, Colombia and Ecuador | | IT solutions services. |
| | |
| CAM Holding S.p.A. | | Chile | | Electric and technological services for the power industry.Investment company. |
| | |
Generadora ArabescoQualys S.A. | | Peru | | Implementing projects relatedHuman, economic and technological services to electric power-generating activities. |
| | |
Larcomar S.A. | | Peru | | Exploiting land right to use the Larcomar Shopping Center. |
| | |
Promotora Larcomar S.A. | | Peru | | Building a hotel complex on a plot of land located in the district of Miraflores.Corporation’s companies. |
| | |
| Promotores Asociados de Inmobiliarias S.A. | | Peru | | Operating in the real-estate industry and engaged in the development and sale of office premises in Peru. |
| | |
| Negocios del Gas S.A. | | Peru | | Construction,Investment company for construction, operation, and maintenance of the pipeline system to transport natural gas and liquids. |
| | |
| Inversiones en Autopistas S.A. | | Peru | | Holding company of shares, participation or any other credit instrument or investment document. |
| | |
| Agenera S.A.C. | | Perú | | Activities related to the generation, cogeneration, transmission, import, export and distribution of electrical energy. |
- 43 -
The following table shows the Group’sCorporation’s subsidiaries and related interest as of December 31, 2018:2020:
| | | | | | | | | | | | | | | | |
| | | Percentage of
common shares
directly held by
Parent (%) | | | Percentage of
common shares
held by
Subsidiaries (%) | | | Percentage of
common
shares held by
the group (%) | | | Percentage of
common shares
held by non-
controlling
interests (%) | |
Engineering and Construction: | | | | | | | | | | | | | | | | |
GyM S.A. | | | 98.24 | % | | | — | | | | 98.24 | % | | | 1.76 | % |
- Morelco S.A.S. | | | — | | | | 70.00 | % | | | 70.00 | % | | | 30.00 | % |
GyM Chile SpA | | | — | | | | 94.49 | % | | | 99.99 | % | | | 0.01 | % |
- V y V – DSD S.A. | | | — | | | | 94.49 | % | | | 94.49 | % | | | 5.51 | % |
GMI S.A. | | | 89.41 | % | | | — | | | | 89.41 | % | | | 10.59 | % |
- Ecotec | | | — | | | | 99.99 | % | | | 99.99 | % | | | 0.01 | % |
- Gm Ingenieria y Construcción de CV | | | — | | | | 99.00 | % | | | 99.00 | % | | | 1.00 | % |
- Gm Ingeniería Bolivia S.R.L. | | | — | | | | 99.00 | % | | | 99.00 | % | | | 1.00 | % |
- Consorcio Vial La Concordia | | | — | | | | 88.00 | % | | | 88.00 | % | | | 12.00 | % |
| | | | |
Infrastructure: | | | | | | | | | | | | | | | | |
GMP S.A. | | | 95.00 | % | | | — | | | | 95.00 | % | | | 5.00 | % |
- Oiltanking Andina Services S.A. | | | — | | | | 50.00 | % | | | 50.00 | % | | | 50.00 | % |
- Transportadora de Gas Natural Comprimido Andino S.A.C. | | | — | | | | 99.93 | % | | | 99.93 | % | | | 0.07 | % |
Concar S.A. | | | 99.99 | % | | | — | | | | 99.99 | % | | | 0.01 | % |
GyM Ferrovias S.A. | | | 75.00 | % | | | — | | | | 75.00 | % | | | 25.00 | % |
Survial S.A. | | | 99.99 | % | | | — | | | | 99.99 | % | | | 0.01 | % |
Norvial S.A. | | | 67.00 | % | | | — | | | | 67.00 | % | | | 33.00 | % |
Concesión Canchaque S.A. | | | 99.96 | % | | | — | | | | 99.96 | % | | | 0.04 | % |
Concesionaria Vía Expresa Sur S.A. | | | 99.98 | % | | | 0.02 | % | | | 100.00 | % | | | — | |
| | | | | | | | | | | | | | | | |
| | | Percentage of
common shares
directly held by
Parent (%) | | | Percentage of
common shares
held by
Subsidiaries (%) | | | Percentage of
common
shares held by
the group (%) | | | Percentage of
common shares
held by non-
controlling
interests (%) | |
Real Estate: | | | | | | | | | | | | | | | | |
Viva GyM S.A. | | | 63.44 | % | | | 36.10 | % | | | 99.54 | % | | | 0.46 | % |
| | | | |
Parent company operations: | | | | | | | | | | | | | | | | |
Generadora Arabesco S.A. | | | 99.00 | % | | | — | | | | 99.00 | % | | | 1.00 | % |
Larcomar S.A. | | | 79.66 | % | | | — | | | | 79.66 | % | | | 20.34 | % |
Promotora Larcomar S.A. | | | 46.55 | % | | | — | | | | 46.55 | % | | | 53.45 | % |
Promotores Asociados de Inmobiliarias S.A. | | | 99.99 | % | | | — | | | | 99.99 | % | | | 0.01 | % |
Negocios del Gas S.A. | | | 99.99 | % | | | 0.01 | % | | | 100.00 | % | | | — | |
Agenera S.A. | | | 99.00 | % | | | 1.00 | % | | | 100.00 | % | | | — | |
Inversiones en Autopistas S.A. | | | 100.00 | % | | | — | | | | — | | | | — | |
Cam Holding S.p.A. | | | 100.00 | % | | | — | | | | 100.00 | % | | | — | |
Adexus S.A. | | | 99.99 | % | | | 0.01 | % | | | 100.00 | % | | | — | |
- 44 -
| | | | | | | | | | | | | | | | |
| | | Percentage of
common
shares directly
held by Parent (%) | | | Percentage of
common shares
held by
Subsidiaries (%) | | | Percentage of
common
shares held
by the Group (%) | | | Percentage of
common shares
held by non-controlling
interests (%) | |
Engineering and Construction: | | | | | | | | | | | | | | | | |
Cumbra Peru S.A. | | | 98.90 | % | | | — | | | | 98.90 | % | | | 1.10 | % |
- Morelco S.A.S. | | | — | | | | 70.00 | % | | | 70.00 | % | | | 30.00 | % |
- GyM Chile S.p.A. | | | — | | | | 100.00 | % | | | 100.00 | % | | | — | |
- Vial y Vives – DSD S.A. | | | — | | | | 94.49 | % | | | 94.49 | % | | | 5.51 | % |
Cumbra Ingenieria S.A. | | | 89.41 | % | | | — | | | | 89.41 | % | | | 10.59 | % |
- Ecología Tecnología Ambiental S.A.C. | | | — | | | | 100.00 | % | | | 100.00 | % | | | — | |
- GM Ingenieria y Construccion de CV | | | — | | | | 100.00 | % | | | 100.00 | % | | | — | |
- GM Ingenieria Bolivia S.R.L. | | | — | | | | 98.57 | % | | | 98.57 | % | | | 1.43 | % |
Infrastructure: | | | | | | | | | | | | | | | | |
UNNA ENERGIA S.A. | | | 95.00 | % | | | — | | | | 95.00 | % | | | 5.00 | % |
- Oiltanking Andina Services S.A. | | | — | | | | 50.00 | % | | | 50.00 | % | | | 50.00 | % |
- Transportadora de Gas Natural | | | | | | | | | | | | | | | | |
Comprimido Andino S.A.C. | | | — | | | | 99.93 | % | | | 99.93 | % | | | 0.07 | % |
Concar S.A.C. | | | 100.00 | % | | | — | | | | 100.00 | % | | | — | |
Tren Urbano de Lima S.A. | | | 75.00 | % | | | — | | | | 75.00 | % | | | 25.00 | % |
Survial S.A. | | | 100.00 | % | | | — | | | | 100.00 | % | | | — | |
Norvial S.A. | | | 18.20 | % | | | 48.80 | % | | | 67.00 | % | | | 33.00 | % |
Concesion Canchaque S.A. | | | 99.96 | % | | | 0.04 | % | | | 100.00 | % | | | — | |
Concesionaria Via Expresa Sur S.A. | | | 99.98 | % | | | 0.02 | % | | | 100.00 | % | | | — | |
Real Estate: | | | | | | | | | | | | | | | | |
Viva Negocio Inmobiliario S.A. | | | 56.22 | % | | | 43.32 | % | | | 99.54 | % | | | 0.46 | % |
Parent company operations: | | | | | | | | | | | | | | | | |
Qualys S.A. | | | 100.00 | % | | | — | | | | 100.00 | % | | | — | |
Promotora Larcomar S.A. | | | 46.55 | % | | | — | | | | 46.55 | % | | | 53.45 | % |
Negocios del Gas S.A. | | | 99.99 | % | | | 0.01 | % | | | 100.00 | % | | | — | |
Agenera S.A. | | | 99.00 | % | | | 1.00 | % | | | 100.00 | % | | | — | |
Inversiones en Autopistas S.A. | | | 1.00 | % | | | 99.00 | % | | | 100.00 | % | | | — | |
Cam Holding S.p.A. | | | 100.00 | % | | | — | | | | 100.00 | % | | | — | |
Adexus S.A. | | | 100.00 | % | | | — | | | | 100.00 | % | | | — | |
The following table shows the Group’sCorporation’s subsidiaries and related interest as of December 31, 2017:2019:
| | | | | | | | | | | | | | | | |
| | | Percentage of
common shares
directly held by
Parent (%) | | | Percentage of
common shares
held by
Subsidiaries (%) | | | Percentage of
common
shares held by
the group (%) | | | Percentage of
common shares
held by non-
controlling
interests (%) | |
Engineering and Construction: | | | | | | | | | | | | | | | | |
GyM S.A. | | | 98.23 | % | | | — | | | | 98.23 | % | | | 1.77 | % |
Stracon GyM S.A. | | | — | | | | 87.59 | % | | | 87.59 | % | | | 12.41 | % |
GyM Chile SpA | | | — | | | | 99.99 | % | | | 99.99 | % | | | 0.01 | % |
V y V – DSD S.A. | | | — | | | | 94.49 | % | | | 94.49 | % | | | 5.51 | % |
Morelco S.A.S. | | | — | | | | 70.00 | % | | | 70.00 | % | | | 30.00 | % |
GMI S.A. | | | 89.41 | % | | | — | | | | 89.41 | % | | | 10.59 | % |
| | | | |
Infrastructure: | | | | | | | | | | | | | | | | |
GMP S.A. | | | 95.00 | % | | | — | | | | 95.00 | % | | | 5.00 | % |
Oiltanking Andina Services S.A. | | | — | | | | 50.00 | % | | | 50.00 | % | | | 50.00 | % |
Transportadora de Gas Natural | | | | | | | | | | | | | | | | |
Comprimido Andino S.A.C. | | | — | | | | 99.93 | % | | | 99.93 | % | | | 0.07 | % |
Concar S.A. | | | 99.75 | % | | | — | | | | 99.75 | % | | | 0.25 | % |
GyM Ferrovias S.A. | | | 75.00 | % | | | — | | | | 75.00 | % | | | 25.00 | % |
Survial S.A. | | | 99.99 | % | | | — | | | | 99.99 | % | | | 0.01 | % |
Norvial S.A. | | | 67.00 | % | | | — | | | | 67.00 | % | | | 33.00 | % |
Concesión Canchaque S.A. | | | 99.96 | % | | | — | | | | 99.96 | % | | | 0.04 | % |
| | | | |
Real Estate: | | | | | | | | | | | | | | | | |
Viva GyM S.A. | | | 63.44 | % | | | 36.10 | % | | | 99.54 | % | | | 0.46 | % |
| | | | |
Parent company operations: | | | | | | | | | | | | | | | | |
Cam Holding S.p.A. | | | 100.00 | % | | | — | | | | 100.00 | % | | | — | |
Coasin Instalaciones Ltda. | | | — | | | | 100.00 | % | | | 100.00 | % | | | — | |
CAM Servicios del Perú S.A. | | | 73.16 | % | | | — | | | | 73.16 | % | | | 26.84 | % |
Adexus S.A. | | | 99.99 | % | | | 0.01 | % | | | 100.00 | % | | | — | |
Generadora Arabesco S.A. | | | 99.00 | % | | | — | | | | 99.00 | % | | | 1.00 | % |
Larcomar S.A. | | | 79.66 | % | | | — | | | | 79.66 | % | | | 20.34 | % |
Promotora Larcomar S.A. | | | 46.55 | % | | | — | | | | 46.55 | % | | | 53.45 | % |
Promotores Asociados de Inmobiliarias S.A. | | | 99.99 | % | | | — | | | | 99.99 | % | | | 0.01 | % |
Negocios del Gas S.A. | | | 99.99 | % | | | 0.01 | % | | | 100.00 | % | | | — | |
Agenera S.A. | | | 99.00 | % | | | 1.00 | % | | | 100.00 | % | | | — | |
Inversiones en Autopistas S.A. | | | 99.99 | % | | | 0.01 | % | | | 100.00 | % | | | — | |
| | | | | | | | | | | | | | | | |
| | | Percentage of
common
shares directly
held by Parent (%) | | | Percentage of
common shares
held by
Subsidiaries (%) | | | Percentage of
common
shares held by
the Group (%) | | | Percentage of
common shares
held by non-controlling
interests (%) | |
Engineering and Construction: | | | | | | | | | | | | | | | | |
Cumbra Peru S.A. | | | 98.87 | % | | | — | | | | 98.87 | % | | | 1.13 | % |
- Morelco S.A.S. | | | — | | | | 70.00 | % | | | 70.00 | % | | | 30.00 | % |
- GyM Chile S.p.A. | | | — | | | | 100.00 | % | | | 100.00 | % | | | — | |
- Vial y Vives – DSD S.A. | | | — | | | | 94.49 | % | | | 94.49 | % | | | 5.51 | % |
Cumbra Ingenieria S.A. | | | 89.41 | % | | | — | | | | 89.41 | % | | | 10.59 | % |
- Ecología Tecnología Ambiental S.A.C. | | | — | | | | 100.00 | % | | | 100.00 | % | | | — | |
- GM Ingenieria y Construccion de CV | | | — | | | | 99.00 | % | | | 99.00 | % | | | 1.00 | % |
- GM Ingenieria Bolivia S.R.L. | | | — | | | | 98.57 | % | | | 98.57 | % | | | 1.43 | % |
Infrastructure: | | | | | | | | | | | | | | | | |
UNNA ENERGIA S.A. | | | 95.00 | % | | | — | | | | 95.00 | % | | | 5.00 | % |
- Oiltanking Andina Services S.A. | | | — | | | | 50.00 | % | | | 50.00 | % | | | 50.00 | % |
- Transportadora de Gas Natural | | | | | | | | | | | | | | | | |
Comprimido Andino S.A.C. | | | — | | | | 99.93 | % | | | 99.93 | % | | | 0.07 | % |
Concar S.A.C. | | | 100.00 | % | | | — | | | | 100.00 | % | | | — | |
Tren Urbano de Lima S.A. | | | 75.00 | % | | | — | | | | 75.00 | % | | | 25.00 | % |
Survial S.A. | | | 100.00 | % | | | — | | | | 100.00 | % | | | — | |
Norvial S.A. | | | 18.20 | % | | | 48.80 | % | | | 67.00 | % | | | 33.00 | % |
Concesion Canchaque S.A. | | | 99.96 | % | | | 0.04 | % | | | 100.00 | % | | | — | |
Concesionaria Via Expresa Sur S.A. | | | 99.98 | % | | | 0.02 | % | | | 100.00 | % | | | — | |
Real Estate: | | | | | | | | | | | | | | | | |
Viva Negocio Inmobiliario S.A. | | | 56.22 | % | | | 43.32 | % | | | 99.54 | % | | | 0.46 | % |
Parent company operations: | | | | | | | | | | | | | | | | |
Qualys S.A | | | 100.00 | % | | | — | | | | 100.00 | % | | | — | |
Promotora Larcomar S.A. | | | 46.55 | % | | | — | | | | 46.55 | % | | | 53.45 | % |
Negocios del Gas S.A. | | | 99.99 | % | | | 0.01 | % | | | 100.00 | % | | | — | |
Agenera S.A. | | | 99.00 | % | | | 1.00 | % | | | 100.00 | % | | | — | |
Inversiones en Autopistas S.A. | | | 1.00 | % | | | 99.00 | % | | | 100.00 | % | | | — | |
Cam Holding S.p.A. | | | 100.00 | % | | | — | | | | 100.00 | % | | | — | |
Adexus S.A. | | | 100.00 | % | | | — | | | | 100.00 | % | | | — | |
In June 2018, the Company increased its interest in the shares of Adexus S.A. to 100% (Note33-a).All investments in subsidiaries have been included in the consolidation. The percentageproportion of voting rights in thosesuch subsidiaries is held directly held by the Parent Company and dodoes not differ significantly differ from the percentageproportion of shares held.
As of December 31, the non-controlling interest is attributed to the following subsidiaries:
| | | | | | | | |
| | | 2019 | | | 2020 | |
Viva Negocio Inmobiliario S.A. and subsidiaries | | | 168,839 | | | | 132,238 | |
Cumbra Peru S.A. and subsidiaries | | | 61,569 | | | | 51,798 | |
Norvial S.A. | | | 63,031 | | | | 57,941 | |
UNNA ENERGIA S.A. | | | 24,413 | | | | 24,162 | |
Tren Urbano de Lima S.A. | | | 77,564 | | | | 59,231 | |
Promotora Larcomar S.A. | | | 3,058 | | | | 3,022 | |
Other | | | (199 | ) | | | (702 | ) |
| | | | | | | | |
| | | 398,275 | | | | 327,690 | |
| | | | | | | | |
In 2017, the Group sold GMD S.A. and, in 2018,December 2019, the subsidiary Cam Servicios del Peru S.A. was sold as well as the following indirect subsidiaries: i) Stracon GyMViva Negocio Inmobiliario S.A. through GyM S.A. and ii) Cam Chile SpA, through Cam Holding SpA. These investments were deconsolidated from the Company, and their operations are shown in Note 37.
In August 2016,General Shareholders’ Meeting, it agreed to capitalize its supplementary premium for the Company had acquired additional interest inamount of S/65.3 million to subsequently reduce the share capital of Adexus S.A.in a non-proportional manner by returning contributions amounting to obtain control (Note33-a).
- 45 -S/82.3 million.
The following table showsreturn did not generate cash outflow as the Group’s subsidiariesreciprocal obligations between its shareholders with the subsidiary were offset. Consequently, the Company modified its participation in its subsidiary from 63.4% to 56.2%, in turn its subsidiary Cumbra Peru S.A. (also a shareholder of Viva Negocio Inmobiliario S.A.) modified its stake from 36.1% to 43.3%.
In addition, in December 2019 the subsidiary Cumbra Peru S.A. through the General Shareholders’ Meeting agreed to the capital increase for monetary contributions in the amount of S/146.1 million. Minority shareholders voluntarily waived the non-controllingpre-emptive interests as of December 31, 2018:subscription right, causing the Company’s participation percentage to increase from 98.2% to 98.9%.
| | | | | | | | |
Non-controlling participation | | | 2017 | | | | 2018 | |
| | | | | | | | |
Viva GyM S.A. and subsidiaries | | | 225,921 | | | | 168,612 | |
GyM S.A. and subsidiaries | | | 103,170 | | | | 67,639 | |
Norvial S.A. | | | 68,419 | | | | 65,918 | |
CAM Holding S.p.A. | | | (6,417 | ) | | | — | |
GMP S.A. | | | 22,263 | | | | 23,424 | |
GyM Ferrovias S.A. | | | 35,419 | | | | 55,986 | |
Promotora Larcomar S.A. | | | 13,395 | | | | 13,121 | |
Other | | | 3,578 | | | | 6,871 | |
| | | | | | | | |
| | | 465,748 | | | 401,571 | |
| | | | | | | | |
Summarized financial information of subsidiaries with materialnon-controlling interests
Set out below is the summarized financial information for each subsidiary that hasnon-controlling interests that are material to the Group.Corporation.
Summarized statement of financial position
| | | | | | | | | | | | | | | | | | | | | | | | |
| | | Viva GyM S.A. and
subsidiaries | | | GyM S.A. and
subsidiaries | | | Norvial S.A. | |
| | | At December 31, | | | At December 31, | | | At December 31, | |
| | | 2017 | | | 2018 | | | 2017 | | | 2018 | | | 2017 | | | 2018 | |
Current: | | | | | | | | | | | | | | | | | | | | | | | | |
Assets | | | 884,591 | | | | 720,976 | | | | 1,875,231 | | | | 1,262,588 | | | | 88,077 | | | | 109,778 | |
Liabilities | | | (352,125 | ) | | | (310,132 | ) | | | (2,142,618 | ) | | | (1,467,953 | ) | | | (45,613 | ) | | | (66,506 | ) |
| | | | | | | | | | | | | | | | | | | | | | | | |
Current net assets (liabilities) | | | 532,466 | | | | 410,844 | | | | (267,387 | ) | | | (205,365 | ) | | | 42,464 | | | | 43,272 | |
| | | | | | | | | | | | | | | | | | | | | | | | |
Non-current: | | | | | | | | | | | | | | | | | | | | | | | | |
Assets | | | 78,457 | | | | 98,504 | | | | 1,368,460 | | | | 980,653 | | | | 492,803 | | | | 462,739 | |
Liabilities | | | (44,068 | ) | | | (37,154 | ) | | | (546,342 | ) | | | (413,026 | ) | | | (327,936 | ) | | | (306,261 | ) |
| | | | | | | | | | | | | | | | | | | | | | | | |
Current net assets | | | 34,389 | | | | 61,350 | | | | 822,118 | | | | 567,627 | | | | 164,867 | | | | 156,478 | |
| | | | | | | | | | | | | | | | | | | | | | | | |
Net assets | | | 566,855 | | | | 472,194 | | | | 554,731 | | | | 362,262 | | | | 207,331 | | | | 199,750 | |
| | | | | | | | | | | | | | | | | | | | | | | | |
- 46 -
| | | | | | | | | | | | | | | | | | | | | | | | | | | | | | | | |
| | | Viva Negocio
Inmobiliario S.A.
and subsidiaries | | | Cumbra Peru S.A.
and subsidiaries | | | Norvial S.A. | | | Tren Urbano
de Lima S.A. | |
| | | As of December 31, | | | As of December 31, | | | As of December 31, | | | As of December 31, | |
| | | 2019 | | | 2020 | | | 2019 | | | 2020 | | | 2019 | | | 2020 | | | 2019 | | | 2020 | |
Current: | | | | | | | | | | | | | | | | | | | | | | | | | | | | | | | | |
Assets | | | 591,402 | | | | 541,703 | | | | 1,232,486 | | | | 1,310,053 | | | | 84,889 | | | | 72,462 | | | | 449,180 | | | | 367,610 | |
Liabilities | | | (263,592 | ) | | | (249,816 | ) | | | (1,491,747 | ) | | | (1,687,355 | ) | | | (53,715 | ) | | | (45,185 | ) | | | (93,879 | ) | | | (85,616 | ) |
| | | | | | | | | | | | | | | | | | | | | | | | | | | | | | | | |
Current net assets (liabilities) | | | 327,810 | | | | 291,887 | | | | (259,261 | ) | | | (337,302 | ) | | | 31,174 | | | | 27,277 | | | | 355,301 | | | | 281,994 | |
| | | | | | | | | | | | | | | | | | | | | | | | | | | | | | | | |
| | | | | | | | |
Non-current: | | | | | | | | | | | | | | | | | | | | | | | | | | | | | | | | |
Assets | | | 121,529 | | | | 120,223 | | | | 1,100,218 | | | | 1,092,120 | | | | 442,186 | | | | 403,280 | | | | 623,033 | | | | 635,836 | |
Liabilities | | | (37,851 | ) | | | (34,378 | ) | | | (486,924 | ) | | | (439,253 | ) | | | (282,358 | ) | | | (254,979 | ) | | | (668,080 | ) | | | (680,905 | ) |
| | | | | | | | | | | | | | | | | | | | | | | | | | | | | | | | |
Non-current net assets (liabilities) | | | 83,678 | | | | 85,845 | | | | 613,294 | | | | 652,867 | | | | 159,828 | | | | 148,301 | | | | (45,047 | ) | | | (45,069 | ) |
| | | | | | | | | | | | | | | | | | | | | | | | | | | | | | | | |
Net assets | | | 411,488 | | | | 377,732 | | | | 354,033 | | | | 275,565 | | | | 191,002 | | | | 175,578 | | | | 310,254 | | | | 236,925 | |
| | | | | | | | | | | | | | | | | | | | | | | | | | | | | | | | |
Summarized income statement
| | | | | | | | | | | | | | | | | | | | | | | | |
| | | Viva GyM S.A. and
subsidiaries | | | GyM S.A. and
subsidiaries | | | Norvial S.A. | |
| | | At December 31, | | | At December 31, | | | At December 31, | |
| | | 2017 | | | 2018 | | | 2017 | | | 2018 | | | 2017 | | | 2018 | |
Revenue | | | 647,535 | | | | 630,130 | | | | 2,163,543 | | | | 1,704,998 | | | | 149,467 | | | | 163,117 | |
| | | | | | | | | | | | | | | | | | | | | | | | |
Profit (loss) before income tax | | | 153,602 | | | | 226,945 | | | | (75,977 | ) | | | (154,452 | ) | | | 68,104 | | | | 21,104 | |
Income tax | | | (35,900 | ) | | | (69,166 | ) | | | 4,486 | | | | 18,559 | | | | (18,678 | ) | | | (3,885 | ) |
| | | | | | | | | | | | | | | | | | | | | | | | |
Profit (loss) for the period | | | 117,702 | | | | 157,779 | | | | (71,491 | ) | | | (135,893 | ) | | | 49,426 | | | | 17,219 | |
Discontinued operations | | | — | | | | — | | | | 76,837 | | | | 44,096 | | | | — | | | | — | |
Other comprehensive Income | | | — | | | | — | | | | (2,641 | ) | | | (14,061 | ) | | | — | | | | — | |
| | | | | | | | | | | | | | | | | | | | | | | | |
Total comprehensive income/loss for the period | | | 117,702 | | | | 157,779 | | | | 2,705 | | | | (105,858 | ) | | | 49,426 | | | | 17,219 | |
| | | | | | | | | | | | | | | | | | | | | | | | |
Dividends paid tonon-controlling interest Note(36-d) | | | 21,165 | | | | 84,870 | | | | 4,056 | | | | 4,241 | | | | 9,240 | | | | 8,184 | |
| | | | | | | | | | | | | | | | | | | | | | | | |
| | | | | | | | | | | | | | | | | | | | | | | | | | | | | | | | |
| | | Viva Negocio
Inmobiliario S.A.
and subsidiaries | | | Cumbra Peru S.A.
and subsidiaries | | | Norvial S.A. | | | Tren Urbano
de Lima S.A. | |
| | | For the year ended | | | For the year ended | | | For the year ended | | | For the year ended | |
| | | 2019 | | | 2020 | | | 2019 | | | 2020 | | | 2019 | | | 2020 | | | 2019 | | | 2020 | |
Revenue | | | 264,401 | | | | 182,439 | | | | 2,279,786 | | | | 1,816,358 | | | | 272,679 | | | | 134,149 | | | | 397,853 | | | | 345,258 | |
| | | | | | | | | | | | | | | | | | | | | | | | | | | | | | | | |
Profit (loss) before income tax | | | 30,729 | | | | 17,816 | | | | (116,081 | ) | | | (76,669 | ) | | | 24,067 | | | | (2,029 | ) | | | 121,079 | | | | 87,522 | |
Income tax | | | (7,000 | ) | | | (2,854 | ) | | | (30,843 | ) | | | (1,753 | ) | | | (6,815 | ) | | | 1,405 | | | | (39,634 | ) | | | (26,681 | ) |
| | | | | | | | | | | | | | | | | | | | | | | | | | | | | | | | |
Profit (loss) for the year | | | 23,729 | | | | 14,962 | | | | (146,924 | ) | | | (78,422 | ) | | | 17,252 | | | | (624 | ) | | | 81,445 | | | | 60,841 | |
Other comprehensive income | | | — | | | | 0 | | | | (7,436 | ) | | | 7,368 | | | | — | | | | 0 | | | | — | | | | 0 | |
| | | | | | | | | | | | | | | | | | | | | | | | | | | | | | | | |
Total comprehensive income for the year | | | 23,729 | | | | 14,962 | | | | (154,360 | ) | | | (71,054 | ) | | | 17,252 | | | | (624 | ) | | | 81,445 | | | | 60,841 | |
| | | | | | | | | | | | | | | | | | | | | | | | | | | | | | | | |
Summarized statement of cash flows
| | | | | | | | | | | | | | | | | | | | | | | | |
| | | Viva GYM S.A. and
subsidiaries | | | GyM S.A. and
subsidiaries | | | Norvial S.A. | |
| | | For the year ended | | | For the year ended | | | For the year ended | |
| | | 2017 | | | 2018 | | | 2017 | | | 2018 | | | 2017 | | | 2018 | |
Cash flows from operating activities provided by, net | | | 163,304 | | | | 259,992 | | | | 211,315 | | | | 148,754 | | | | 25,041 | | | | 70,939 | |
| | | | | | | | | | | | | | | | | | | | | | | | |
Cash flows from investing activities provided by (applied to), net | | | 79,471 | | | | (8,460 | ) | | | 72,438 | | | | 233,150 | | | | — | | | | (2 | ) |
| | | | | | | | | | | | | | | | | | | | | | | | |
Cash flows from financing activities applied to, net | | | (203,958 | ) | | | (255,979 | ) | | | (183,092 | ) | | | (388,836 | ) | | | (48,010 | ) | | | (43,536 | ) |
| | | | | | | | | | | | | | | | | | | | | | | | |
Increase (decrease) in cash and cash equivalents, net | | | 38,817 | | | | (4,447 | ) | | | 100,661 | | | | (6,932 | ) | | | (22,969 | ) | | | 27,401 | |
| | | | | | | | | | | | | | | | | | | | | | | | |
Cash and cash equivalents at the beginning of the year | | | 58,892 | | | | 97,709 | | | | 78,899 | | | | 179,560 | | | | 95,418 | | | | 72,449 | |
| | | | | | | | | | | | | | | | | | | | | | | | |
Cash and cash equivalents at the end of the year | | | 97,709 | | | | 93,262 | | | | 179,560 | | | | 172,628 | | | | 72,449 | | | | 99,850 | |
| | | | | | | | | | | | | | | | | | | | | | | | |
| | | | | | | | | | | | | | | | | | | | | | | | | | | | | | | | |
| | | Viva Negocio
Inmobiliario S.A.
and subsidiaries | | | Cumbra Peru S.A.
and subsidiaries | | | Norvial S.A. | | | Tren Urbano
de Lima S.A. | |
| | | For the year ended | | | For the year ended | | | For the year ended | | | For the year ended | |
| | | 2019 | | | 2020 | | | 2019 | | | 2020 | | | 2019 | | | 2020 | | | 2019 | | | 2020 | |
Net cash provided from operating activities | | | 28,791 | | | | 84,770 | | | | (25,503 | ) | | | 1,400 | | | | 12,514 | | | | 36,942 | | | | 379,882 | | | | 52,055 | |
Net cash (applied to) provided from investing activities | | | (2,613 | ) | | | (473 | ) | | | (20,173 | ) | | | (8,835 | ) | | | (33 | ) | | | (12 | ) | | | 2,845 | | | | 812 | |
Net cash (applied to) provided from financing activities | | | (58,722 | ) | | | (71,484 | ) | | | 209,515 | | | | 26,550 | | | | (46,045 | ) | | | (39,667 | ) | | | (273,009 | ) | | | (145,788 | ) |
| | | | | | | | | | | | | | | | | | | | | | | | | | | | | | | | |
(Decrease) increase in cash and cash equivalents, net | | | (32,544 | ) | | | 12,813 | | | | 163,839 | | | | 19,115 | | | | (33,564 | ) | | | (2,737 | ) | | | 109,718 | | | | (92,921 | ) |
Cash and cash equivalents at the beginning of the year | | | 93,262 | | | | 60,718 | | | | 172,628 | | | | 336,467 | | | | 99,850 | | | | 66,286 | | | | 191,178 | | | | 300,896 | |
| | | | | | | | | | | | | | | | | | | | | | | | | | | | | | | | |
Cash and cash equivalents at the end of the year | | | 60,718 | | | | 73,531 | | | | 336,467 | | | | 355,582 | | | | 66,286 | | | | 63,549 | | | | 300,896 | | | | 207,975 | |
| | | | | | | | | | | | | | | | | | | | | | | | | | | | | | | | |
The information above is the amount before inter-company eliminations.
| | b) | Public services concessions |
The Group operates variousCorporation has public service concessions. When applicable, revenuethe income attributable to the construction or restoration of infrastructure has been accounted for by applying the models set forthdescribed in Note 2.5 (financial asset model, intangible asset;asset and bifurcated models)forked model).
The subsidiary Transportadora de Gas Natural Comprimido Andino S.A.C. (hereinafter TGNCA) held a concession to design, finance, construct, maintainSince the termination of the Contract between TGNCA and operate the compressed natural gas supply system to be implemented in certain cities. In September 2016 the Concession Agreement was terminated. As of December 14, 2018; the Ministry of Energy and Mines, paidManagement has worked on developing and completing new gas compression and liquefaction projects. Additionally, it is evaluating the remaining balance related to trade accounts receivable for S/17.3 million.
Under allcentralization of the Groupgas business through this vehicle and expects to start the gas compression project in 2021.
In all the Corporation’s concessions, the infrastructure is returnedreturns to the grantorGrantor at the end of the concession agreement.
- 47 -Contract.
The concessions held by the GroupCorporation are as follows as of December 31, 2018:2020:
| | | | | | | | | | | | | | | | |
Name of Concession | | Description | | Estimated investment | | Consideration | | Ordinary
shares held | | | Concession
termination | | | Accounting
model |
| Survial S.A. | | This company operates and maintains a 750 km road from the San Juan de Marcona port to Urcos, Peru, which is connected to an interoceanic road. The road has five toll stations and three weigh stations. | | US$98.9 million | | Transaction secured by the Peruvian Government involving from annual payments for the maintenance and operation of the road, which is in charge of the Peruvian Ministry of Transport and Communications (MTC). | | | 99.90% | | | | 2032 | | | Financial asset |
| | | | | | |
| Canchaque S.A.C. | | This company operates and periodically maintains a 78 km road which connects the towns of Buenos Aires and Canchaque, in Peru The road has one toll station. | | US$29 million | | Transaction secured by the Peruvian Government regardless the traffic volume. Revenue is secured by an annual minimum amount of US$ 0.3 million. | | | 99.96% | | | | 2025 | | | Financial asset |
| | | | | | |
| Concesionaria. La Chira S.A. | | Designing, financing, constructing, operating and maintaining project called “Planta de Tratamiento de Aguas Residuales y Emisario Submarino La Chira”. The Project will treat approximately 25% of wastewaters in Lima. | | S/250 million | | Transaction secured by the Peruvian Government consisting of monthly and quarterly payments settled by Sedapal’s collection trust. | | | 50.00% | | | | 2036 | | | Financial asset |
| | | | | | |
| GyM Ferrovias S.A. | | Concession for the operation of Line 1 of the Lima Metro, Peru’s only urban railway system in Lima city, which includes (i) operation and maintenance of the five existing trains, (ii) operation and maintenance and the acquisition of 19 trains on behalf of the Peruvian Government and (iii) design and construction of the repair yard and maintenance of railway. | | S/549.8 million | | Transaction secured by the Peruvian Government involving a quarterly payment received from MTC based on km travelled per train. | | | 75.00% | | | | 2041 | | | Financial asset |
- 48 -
| | | | | | | | | | | | |
Name of
Concession | | Description | | Estimated
investment | | Consideration | | Ordinary
shares held | | Concession
termination | | Accounting
model |
| Survial S.A. | | This company operates and maintains a 750 km road from the San Juan de Marcona port to Urcos, Peru, which is connected to an interoceanic road. The road has five toll stations and three weigh stations. | | US$99 million | | Transaction secured by the Peruvian Government involving from annual payments for the maintenance and operation of the road, which is in charge of the Peruvian Ministry of Transport and Communications (MTC). | | 99.90% | | 2032 | | Financial asset |
| | | | | | |
| Canchaque S.A.C. | | This company operates and periodically maintains a 78 km road which connects the towns of Buenos Aires and Canchaque, in Peru. The road has one toll station. | | US$31 million | | Transaction secured by the Peruvian Government regardless the traffic volume. Revenue is secured by an annual minimum amount of US$0.3 million. | | 99.96% | | 2025 | | Financial asset |
| | | | | | |
| Concesionaria. La Chira S.A. | | Designing, financing, constructing, operating and maintaining project called “Planta de Tratamiento de Aguas Residuales y Emisario Submarino La Chira”. The Project will treat approximately 25% of wastewaters in Lima. | | S/250 million | | Transaction secured by the Peruvian Government consisting of monthly and quarterly payments settled by Sedapal´s collection trust. | | 50.00% | | 2036 | | Financial asset |
| | | | | | |
| Tren Urbano de Lima S.A. | | Concession for the operation of Line 1 of Lima Metro, Peru’s only urban railway system in Lima city, which includes (i) operation and maintenance of the existing trains (24 initial investment trains and 20 additional trains), (ii) operation and maintenance of the railway system (railway and infrastructure). | | S/642 million | | Transaction secured by the Peruvian Government involving a quarterly payment received from MTC based on km travelled per train. | | 75.00% | | 2041 | | Financial asset |
| | | | | | | | | | | | | | | | |
Name of Concession | | Description | | Estimated investment | | Consideration | | Ordinary
shares held | | | Concession
termination | | | Accounting
model |
| Norvial S.A. | | The Company operates and maintains part of the only highway that connects Lima to the northwest of Peru. This 183 km road known as Red Vial 5 runs from the cities of Ancón to Pativilca and has three toll stations. | | US$152 million | | From users (self-financed concession; revenue is derived from collection of tolls). | | | 67.00% | | | | 2028 | | | Intangible |
| | | | | | |
| Via Expresa Sur S.A. | | The Company obtained the concession for designing, financing, building, operating and maintaining the infrastructure associated with the Vía Expresa Sur Project. This project involves the second stage expansion of the Via Expresa - Paseo de la Republica, between Av. Republica de Panama and and Panamericana highway. | | US$196.8 million | | The contract gives the right of collection from users; however the Peruvian Government shall pay the difference when the operating revenue obtained is below US$18 million during the first two years and below US$19.7 million from the third year to the fifteenth year of the effective period of the financing, with a ceiling of US$10 million. In June 2017, the contract was suspended temporarily for one year by agreement between the Concessionaire and the grantor. The suspension was extended for an additional year. | | | 99.98% | | | | 2053 | | | Bifurcated |
| | | | | | |
| Recaudo Trujillo S.A.C. | | Design, implementation, operation, technological maintenance and renewal (estimate) of the single system of electronic collection. Design, implementation, operation and maintenance of the Clearing house Implementation of the Fleet Control Center, as well as training to personnel. | | US$40.2 million | | Economic consideration resulting from applying the “price for validation” considering daily validations input on the system to be managed through a trust. | | | 95.00% | | | | 2036 | | | Intangible |
- 49 -
| | | | | | | | | | | | | | | | |
Name of concession | | Description | | Estimated
investment | | Consideration | | Ordinary
shares held | | | Concession
termination | | | Accounting
model |
| Norvial S.A. | | The Company operates and maintains the highway that connects Lima to the northwest of Peru. This 183 km road known as Red Vial 5 runs from the cities of Ancon to Pativilca and has three toll stations. | | US$187 million | | Collected from users (self-financed concession; revenue is derived from collection of tolls). | | | 67.00 | % | | | 2028 | | | Intangible |
| | | | | | |
| Via Expresa Sur S.A. | | The Company obtained the concession for designing, financing, building, operating and maintaining the infrastructure associated with the Via Expresa Sur Project. This project involves the second stage expansion of the Via Expresa — Paseo de la Republica,between Av. Republica de Panama and and Panamericana highway. | | US$197 million | | The contract gives the right of collection from users; however the Peruvian Government shall pay the difference when the operating revenue obtained is below US$18 million during the first two years and US$19.7 million from the third year to the fifteenth year of the effective period of the financing, with a ceiling of US$10 million. In June 2017, the contract was suspended temporarily and has been extended until June 2021. To date, the term of the Concession remains suspended by agreement between the parties pending agreement on the terms and conditions to approve the Early Termination of the Concession Contract by Mutual Agreement as provided in Clause 16.3 of the aforementioned Contract. | | | 99.98 | % | | | 2053 | | | Bifurcated |
AtAs of December 31, 2018 and 2019, the GroupCorporation is a partner to 4651, and as of December 31, 2020, to 52 Joint Operations with third parties, (64 at December 31, 2017, and 69 at December 31, 2016).respectively. The table below lists the Group’sCorporation’s major Joint Operations.
| | | | | | | | | | | | |
| | | Percentage of interest | |
Joint operations | | 2016 | | | 2017 | | | 2018 | |
Graña y Montero S.A.A. | | | | | | | | | | | | |
- Concesionaria la Chira S.A. | | | 50.00 | % | | | 50.00 | % | | | 50.00 | % |
| | | |
GyM S.A. | | | | | | | | | | | | |
- Consorcio Constructor Alto Cayma | | | 50.00 | % | | | 50.00 | % | | | 50.00 | % |
- Consorcio Alto Cayma | | | 49.00 | % | | | 49.00 | % | | | 49.00 | % |
- Consorcio Lima Actividades Comerciales | | | 50.00 | % | | | 50.00 | % | | | 50.00 | % |
- Consorcio Norte Pachacutec | | | 49.00 | % | | | 49.00 | % | | | 49.00 | % |
- Consorcio La Chira | | | 50.00 | % | | | 50.00 | % | | | 50.00 | % |
- Consorcio Río Urubamba | | | 50.00 | % | | | 50.00 | % | | | 50.00 | % |
- Consorcio Vial Quinua | | | 46.00 | % | | | 46.00 | % | | | 46.00 | % |
- Consorcio Rio Mantaro | | | 50.00 | % | | | 50.00 | % | | | 50.00 | % |
- Consorcio GyM – CONCIVILES | | | 66.70 | % | | | 66.70 | % | | | 66.70 | % |
- Consorcio Construcciones y Montajes CCM | | | 25.00 | % | | | 25.00 | % | | | 25.00 | % |
- Consorcio HV GyM | | | 50.00 | % | | | 50.00 | % | | | 50.00 | % |
- Consorcio Stracon Motta Engil JV | | | 50.00 | % | | | 50.00 | % | | | — | |
- Consorcio Huacho Pativilca | | | 67.00 | % | | | 67.00 | % | | | 67.00 | % |
- Consorcio Constructor Chavimochic | | | 26.50 | % | | | 26.50 | % | | | 26.50 | % |
- Consorcio Constructor Ductos del Sur | | | 29.00 | % | | | 29.00 | % | | | 29.00 | % |
- Consorcio Italo Peruano | | | 48.00 | % | | | 48.00 | % | | | 48.00 | % |
- Consorcio Menegua | | | 50.00 | % | | | 50.00 | % | | | 50.00 | % |
- Consorcio Energia y Vapor | | | 50.00 | % | | | 50.00 | % | | | 50.00 | % |
- Consorcio Ermitaño | | | 50.00 | % | | | 50.00 | % | | | 50.00 | % |
- Consorcio para la Atención y Mantenimiento de Ductos | | | 50.00 | % | | | 50.00 | % | | | 50.00 | % |
- Consorcio Lima Actividades Comerciales Sur | | | 50.00 | % | | | 50.00 | % | | | 50.00 | % |
- Consorcio CDEM | | | — | | | | 85.00 | % | | | 85.00 | % |
- Consorcio Chicama - Ascope | | | — | | | | 50.00 | % | | | 50.00 | % |
- Consorcio TNT Vial y Vives - DSD Chile LTDA | | | — | | | | 50.00 | % | | | 50.00 | % |
- Consorcio La Gloria | | | 49.00 | % | | | 49.00 | % | | | 49.00 | % |
- Consorcio GyM Sade Skanska | | | 50.00 | % | | | 50.00 | % | | | 50.00 | % |
- Constructora Incolur DSD Limitada | | | 50.00 | % | | | 50.00 | % | | | 50.00 | % |
- Consorcio Chiquintirca | | | — | | | | 40.00 | % | | | 40.00 | % |
- Consorcio Vial ICAPAL | | | — | | | | 10.00 | % | | | 10.00 | % |
| | | |
GMP S.A. | | | | | | | | | | | | |
- Consorcio Terminales | | | 50.00 | % | | | 50.00 | % | | | 50.00 | % |
- Terminales del Peru | | | 50.00 | % | | | 50.00 | % | | | 50.00 | % |
| | | |
GMD S.A. | | | | | | | | | | | | |
- Consorcio Cosapi-Data - GMD S.A. | | | 70.00 | % | | | — | | | | — | |
- Consorcio The Louis Berger Group Inc. - GMD | | | 66.45 | % | | | — | | | | — | |
- Consorcio Procesos Digitales | | | 43.65 | % | | | — | | | | — | |
- Consorcio GMD S.A. - Indra S.A. | | | 50.00 | % | | | — | | | | — | |
- Consorcio Fabrica de Software | | | 50.00 | % | | | — | | | | — | |
- Consorcio Gestion de Procesos Electorales (ONPE) | | | 50.00 | % | | | — | | | | — | |
- Consorcio Lima Actividades Sur | | | 50.00 | % | | | — | | | | — | |
- Consorcio Latino de Actiuvidades Comerciales de Clientes Especiales | | | 50.00 | % | | | — | | | | — | |
- Consorcio Latino de Actividades Comerciales de | | | 75.00 | % | | | — | | | | — | |
- Consorcio Gestion de Procesos Junta de Gobernadores | | | 45.00 | % | | | — | | | | — | |
- Consorcio Soluciones Digitales | | | 38.00 | % | | | — | | | | — | |
- Consorcio de Gestion de la Informacion | | | 56.00 | % | | | — | | | | — | |
- Consorcio de la disponibilidad PKI | | | 70.00 | % | | | — | | | | — | |
- 50 -
| | | | | | | | | | | | |
| | | Percentage of interest | |
Joint operations | | 2018 | | | 2019 | | | 2020 | |
AENZA S.A.A. | | | | | | | | | | | | |
- Concesionaria La Chira S.A. | | | 50 | % | | | 50 | % | | | 50 | % |
Cumbra Peru S.A. | | | | | | | | | | | | |
- Consorcio CDEM | | | 85 | % | | | 85 | % | | | — | |
- Consorcio Huacho Pativilca | | | 67 | % | | | 67 | % | | | 67 | % |
- Consorcio GyM – CONCIVILES | | | 67 | % | | | 67 | % | | | 67 | % |
- Consorcio AMDP norte | | | 50 | % | | | — | | | | 50 | % |
- Consorcio Chicama - Ascope | | | 50 | % | | | 50 | % | | | — | |
- Consorcio Constructor Alto Cayma | | | 50 | %�� | | | 50 | % | | | 50 | % |
- Consorcio Energia y Vapor | | | 50 | % | | | 50 | % | | | — | |
- Consorcio Ermitaño | | | 50 | % | | | 50 | % | | | 50 | % |
- Consorcio GyM Sade Skanska | | | 50 | % | | | 50 | % | | | — | |
- Consorcio GYM-OSSA | | | — | | | | 50 | % | | | 100 | % |
- Consorcio GyM-Stracon | | | 50 | % | | | 50 | % | | | 50 | % |
- Consorcio HV GyM | | | 50 | % | | | 50 | % | | | 50 | % |
- Consorcio La Chira | | | 50 | % | | | 50 | % | | | 50 | % |
- Consorcio Lima Actividades Comerciales Sur | | | 50 | % | | | 50 | % | | | 50 | % |
- Consorcio Lima Actividades Sur | | | 50 | % | | | 50 | % | | | 50 | % |
- Consorcio Menegua | | | 50 | % | | | 50 | % | | | — | |
- Consorcio para la Atencion y Mantenimiento de Ductos | | | 40 | % | | | - | | | | — | |
- Consorcio Rio Mantaro | | | 50 | % | | | 50 | % | | | — | |
- Consorcio Río Urubamba | | | 50 | % | | | 50 | % | | | 50 | % |
- Consorcio TNT Vial y Vives - DSD Chile LTDA | | | 50 | % | | | 50 | % | | | — | |
- Constructora Incolur DSD Limitada | | | 50 | % | | | 50 | % | | | — | |
- Consorcio Alto Cayma | | | 49 | % | | | 49 | % | | | 49 | % |
- Consorcio La Gloria | | | 49 | % | | | 49 | % | | | 49 | % |
- Consorcio Norte Pachacutec | | | 49 | % | | | 49 | % | | | 49 | % |
- Consorcio Italo Peruano | | | 48 | % | | | 48 | % | | | 48 | % |
- Consorcio Vial Quinua | | | 46 | % | | | 46 | % | | | 46 | % |
- Consorcio Constructor Ductos del Sur | | | 29 | % | | | 29 | % | | | 29 | % |
- Consorcio Constructor Chavimochic | | | 27 | % | | | 27 | % | | | 27 | % |
- Consorcio Inti Punku | | | — | | | | — | | | | 49 | % |
- Consorcio Pasco | | | — | | | | 1 | % | | | 1 | % |
UNNA ENERGIA S.A. | | | | | | | | | | | | |
- Consorcio Terminales | | | 50 | % | | | 50 | % | | | 50 | % |
- Terminales del Perú | | | 50 | % | | | 50 | % | | | 50 | % |
| | | | | | | | | | | | |
| | | Percentage of interest | |
Joint operations | | 2016 | | | 2017 | | | 2018 | |
CONCAR S.A. | | | | | | | | | | | | |
- Consorcio Ancón-Pativilca | | | 67.00 | % | | | 67.00 | % | | | 67.00 | % |
- Consorcio Peruano de Conservación | | | 50.00 | % | | | 50.00 | % | | | 50.00 | % |
- Consorcio Manperán | | | 67.00 | % | | | 67.00 | % | | | 67.00 | % |
- Consorcio Vial Sierra | | | 50.00 | % | | | 50.00 | % | | | 100.00 | % |
- Consorcio Vial Ayahuaylas | | | — | | | | 99.00 | % | | | 99.00 | % |
- Consorcio Vial Sullana | | | — | | | | 99.00 | % | | | 99.00 | % |
-Consorcio Vial del Sur | | | — | | | | 99.00 | % | | | 99.00 | % |
| | | |
Viva GyM S.A. | | | | | | | | | | | | |
- Consorcio Panorama | | | 35.00 | % | | | 35.00 | % | | | — | |
| | | |
CAM HOLDING S.p.A | | | | | | | | | | | | |
- Consorcio Mecam | | | 50.00 | % | | | 50.00 | % | | | — | |
- Consorcio Seringel | | | 50.00 | % | | | 50.00 | % | | | — | |
| | | |
GMI S.A. | | | | | | | | | | | | |
- Consorcio Poyry-GMI | | | — | | | | 40.00 | % | | | 40.00 | % |
- Consorcio Internacional Supervisión Valle Sagrado | | | — | | | | 33.00 | % | | | 33.00 | % |
- Consorcio Supervisor Ilo | | | — | | | | 55.00 | % | | | 55.00 | % |
| | | | | | | | | | | | |
| | | Percentage of interest | |
Joint operations | | 2018 | | | 2019 | | | 2020 | |
Concar S.A.C. | | | | | | | | | | | | |
- Consorcio Ancon-Pativilca | | | 67 | % | | | 67 | % | | | 67 | % |
- Consorcio Peruano de Conservación | | | 50 | % | | | 50 | % | | | 50 | % |
- Consorcio Manperan | | | 67 | % | | | 67 | % | | | 67 | % |
- Consorcio Vial Sierra | | | 100 | % | | | 50 | % | | | 50 | % |
- Consorcio Vial Ayahuaylas | | | 99 | % | | | 99 | % | | | 99 | % |
- Consorcio Vial ICAPAL | | | 10 | % | | | 10 | % | | | 10 | % |
- Consorcio Vial Sullana | | | 99 | % | | | 99 | % | | | 99 | % |
- Consorcio Vial del Sur | | | 99 | % | | | 99 | % | | | 99 | % |
- Consorcio Obras Viales | | | — | | | | 99 | % | | | 99 | % |
Cumbra Ingenieria S.A. | | | | | | | | | | | | |
- Consorcio Vial la Concordia | | | 88 | % | | | 88 | % | | | 88 | % |
- Consorcio GMI- Haskoningdhv | | | 70 | % | | | 70 | % | | | 70 | % |
- Consorcio Supervisor Ilo | | | 55 | % | | | 55 | % | | | 55 | % |
- Consorcio Poyry-GMI | | | 40 | % | | | 40 | % | | | 40 | % |
- Consorcio Internacional Supervision Valle Sagrado | | | 33 | % | | | 33 | % | | | 33 | % |
- Consorcio Ecotec — GMI — PIM | | | 30 | % | | | 30 | % | | | 30 | % |
- Consorcio Ribereño Chinchaycamac | | | — | | | | 40 | % | | | 40 | % |
- Consorcio Supervisor GRH | | | — | | | | — | | | | 64 | % |
- Consorcio Ecotec — GMI | | | — | | | | — | | | | 20 | % |
All of the joint arrangementsJoint operations agreements listed above operateare operated in Peru, Chile and Colombia.
The table below provides a descriptionOn November 2, 2019, the operation contract of Consorcio Terminales of the subsidiary UNNA ENERGIA S.A., corresponding to the terminals of Pisco, Mollendo, Ilo, Cusco and Juliaca, was terminated, and the assets and operations were delivered to Petroperú. Currently, it is in the process of liquidating assets and liabilities.
The main activities carried out by theseof the joint operations:operations correspond to:
| | |
Joint Operations in | | Economic activity |
| |
| AENZA S.A.A. (formerly Graña y Montero S.A.A.) | | Construction, operation and maintenance of La Chira wastewater treatment plant in the south of Lima. The project is aimed to solve Lima’s environmental problems caused by sewage discharged directly into the sea. |
| |
GyMCumbra Peru S.A. | | ThesesThese joint operations are carried out through the four divisionswere created exclusively to development of the engineering and construction segment (Note 7).contracts. |
| |
GMPUNNA ENERGIA S.A. | | Consorcio Terminales and Terminales del Peru provide services for receiving, storing, shipping and transporting liquid hydrocarbons, such as gasoline, jet fuel, diesel fuel and residual among others. |
| |
CONCAR S.A.S.A.C. | | Concar’s joint operations provides rehabilitation service, routine and periodic maintenance of the road; and road conservation and preservation services. |
| |
| Cumbra Ingenieria S.A. | | Engineering consulting services in, study and project execution, project management and Works supervision. |
The consolidated financial statements do not include any other type of entities in addition to those mentioned above, such as trust funds or special purpose entities.
Operating segments are reported consistently with the internal reports that are reviewed by the Group’sCorporation’s chief decision-maker; that is, the Executive Committee, which is led by the Corporate General Manager. This Committee acts as the maximum authority in operations decision making and is responsible for allocating resources and evaluating the performance of each operating segment.
- 51 -
The Group’sCorporation’s operating segments are assessed by the activities of the following business units: (i) engineering and construction, (ii) infrastructure, and (iii) real estate.estate and (iv) parent company operations.
As set forth under IFRS 8, reportable segments based on the level of revenue is: ‘engineering and construction’. However, the GroupCorporation has voluntarily decided to report onin all its operating segments as detailed in this Note.
The revenues derived from foreign operations (Chile, Colombia Bolivia, and Guyana)y Mexico) comprise 14.2%24% of the Group’sCorporation’s total revenue reported in 2018 (10.6% in 2017 and 13.2% in 2016)2020 (19% to 2019).
Sales between segments are carried out at arm’s length, are not material, and are eliminated on consolidation. The revenue from external parties is measured in a manner consistent with that in the income statement. Sale of goods relate to the real estate segment. Revenue from services relate to all other segments.
Group sales and receivables are not concentrated in a few private customers. There is no external customer that represents 10% or more of the Group’s revenue.
The principal activities of the GroupCorporation in each operating segmentssegment are as follows:
| | a) | Engineering and construction: This segment includes from traditional engineering services such as structural, civil and design engineering, and architectural planning to advanced specialties including process design, simulation, and environmental services at three divisions; i) civil works, such as the construction of hydroelectric power stations and other large infrastructure facilities; (ii) electro-mechanic construction, such as concentrator plants, oil, and natural gas pipelines, and transmission lines; iii) building construction, such as office buildings, residential buildings, hotels, affordable housing projects, shopping centers, and industrial facilities. |
| | b) | Infrastructure: The GroupCorporation has long-term concessions or similar contractual arrangements in Peru for three toll roads, the Lima Metro, a wastewater treatment plant in Lima, four producing oil fields, a gas processing plant and operation and maintenance services for infrastructure assets. |
| | c) | Real Estate: The GroupCorporation develops and sells homes targeted to low and middle-income population sectors which are experiencing a significant increase in disposable income, as well as, office and commercial space to a lesser extent. |
| | d) | Parent Company Operation correspondsOperation: Corresponds to services provided to related entities of the Corporation such as strategic and functional advisory services which the Holding company provides, management, logistics and accounting services, among others.operational leasing of offices. |
The Executive Committee uses adjusted earnings before interest, tax, depreciation, and amortization (EBITDA) to assess the performance of operating segments. In the years 2019 and 2020, additional provisions have been considered for some of the Corporation’s asses, such as impairment of investments, impairment of account receivables, impairment of goodwill, provision for civil repair and legal claims.
Profit
EBITDA is reconciled to operating income (loss) before income tax reconciles to EBITDAtaxes as follows:
| | | | | | | | | | | | |
| | | 2016 | | | 2017 | | | 2018 | |
| | | (as restated) | |
(Loss)/profit before income tax | | | (708,134 | ) | | | 45,112 | | | | 133,948 | |
Discontinued operations | | | 104,354 | | | | 210,431 | | | | 36,785 | |
Financial cost, net | | | 179,829 | | | | 137,035 | | | | 197,057 | |
Depreciation | | | 118,832 | | | | 109,342 | | | | 86,335 | |
Amortization | | | 64,572 | | | | 70,383 | | | | 103,174 | |
| | | | | | | | | | | | |
EBITDA (*) | | | (240,546 | ) | | | 572,303 | | | | 557,299 | |
| | | | | | | | | | | | |
- 52 -
| | | | | | | | | | | | |
| | | 2018 | | | 2019 | | | 2020 | |
Net profit (loss) | | | 57,415 | | | | (838,642 | ) | | | (190,344 | ) |
Financial income and expenses | | | 209,232 | | | | 178,787 | | | | 117,523 | |
Income tax | | | 110,993 | | | | 303,371 | | | | 58,444 | |
Depreciation and amortization | | | 206,520 | | | | 219,817 | | | | 197,125 | |
| | | | | | | | | | | | |
Initial EBITDA | | | 584,160 | | | | (136,667 | ) | | | 182,748 | |
Extraordinary adjustments to EBITDA | | | | | | | | | | | | |
Impairment of investments | | | — | | | | 261,924 | | | | — | |
Impairment of accounts receivables | | | — | | | | 332,862 | | | | 102,148 | |
Impairment of goodwill | | | — | | | | 33,089 | | | | — | |
Provisions: civil compensation and legal claims | | | 73,499 | | | | 127,147 | | | | 89,084 | |
Provisions for labor claims | | | — | | | | — | | | | 7,434 | |
Impairment recovery | | | — | | | | (40,094 | ) | | | — | |
| | | | | | | | | | | | |
Adjusted EBITDA | | | 657,659 | | | | 578,261 | | | | 381,414 | |
| | | | | | | | | | | | |
EBITDA for each segment is as follows:
| | | | 2016 | | | 2017 | | | 2018 | | | 2018 | | | 2019 | | | 2020 | |
Engineering and construction | | | 19,255 | | | | 119,987 | | | | 19,242 | | | | 44,003 | | | | 51,147 | | | | 55,766 | |
Infrastructure | | | 237,752 | | | | 300,935 | | | | 411,502 | | | | 409,626 | | | | 403,554 | | | | 290,335 | |
Real state | | | 121,420 | | | | 177,286 | | | | 240,991 | | |
Real estate | | | | 240,991 | | | | 56,821 | | | | 32,555 | |
Parent company operations | | | (1,025,197 | ) | | | 125,938 | | | | (27,802 | ) | | | 49,671 | | | | (417,954 | ) | | | (93,931 | ) |
Intercompany eliminations | | | 406,546 | | | | (151,843 | ) | | | (86,634 | ) | | | (86,632 | ) | | | 484,693 | | | | 96,689 | |
| | | | | | | | | | | | | | | | | | |
Total EBITDA | | | (240,546 | ) | | | 572,303 | | | | 557,299 | | |
EBITDA | | | | 657,658 | | | | 578,261 | | | | 381,414 | |
| | | | | | | | | | | | | | | | | | |
Backlog refers to the expected future revenue under signedundersigned contracts and legally binding letters of intent. The breakdown by operating segments as of December 31, 2018,2020, and the dates in which they are estimated to be realized is shown in the following table:
| | | | | | | | | | | | | | | | |
| | | | | | Annual Backlog | |
| | | 2018 | | | 2019 | | | 2020 | | | 2021+ | |
Engineering and construction | | | 2,644,386 | | | | 1,755,890 | | | | 725,351 | | | | 163,145 | |
Infrastructure | | | 1,759,849 | | | | 600,630 | | | | 570,114 | | | | 589,108 | |
Real state | | | 195,566 | | | | — | | | | 177,135 | | | | 18,431 | |
Intercompany eliminations | | | (351,865 | ) | | | (115,748 | ) | | | (119,221 | ) | | | (116,897 | ) |
| | | | | | | | | | | | | | | | |
| | | 4,247,936 | | | | 2,240,772 | | | | 1,353,379 | | | | 653,787 | |
| | | | | | | | | | | | | | | | |
- 53 -
| | | | | | | | | | | | | | | | |
| | | | | | Annual Backlog | |
| | | 2020 | | | 2021 | | | 2022 | | | 2023+ | |
Engineering and Construction | | | 3,091,072 | | | | 2,588,137 | | | | 502,935 | | | | — | |
Infrastructure | | | 1,784,582 | | | | 601,020 | | | | 597,520 | | | | 586,042 | |
Real estate | | | 218,598 | | | | 194,654 | | | | 23,944 | | | | — | |
Parent company operations | | | 166,324 | | | | 97,808 | | | | 45,702 | | | | 22,814 | |
Intercompany eliminations | | | (440,152 | ) | | | (145,950 | ) | | | (146,968 | ) | | | (147,235 | ) |
| | | | | | | | | | | | | | | | |
| | | 4,820,424 | | | | 3,335,670 | | | | 1,023,134 | | | | 461,621 | |
| | | | | | | | | | | | | | | | |
The following table shows the Group’sCorporation’s financial statements by operating segments:
| | | | | | | | | | | | | | | | | | | | | | | | | | | | | | | | | | | | |
| | | | | | Infrastructure | | | | | | | | | | | | | |
| | | Engineering
and
construction | | | Energy | | | Toll
roads | | | Transportation | | | Water
treatment | | | Real
estate | | | Parent
Company
Operations | | | Eliminations | | | Consolidated | |
As of December 31, 2017 | | | | | | | | | | | | | | | | | | | | | | | | | | | | | | | | | | | | |
Assets.- | | | | | | | | | | | | | | | | | | | | | | | | | | | | | | | | | | | | |
Cash and cash equivalent | | | 184,401 | | | | 43,878 | | | | 121,901 | | | | 161,073 | | | | 4,204 | | | | 85,187 | | | | 25,536 | | | | — | | | | 626,180 | |
Financial asset at fair value through profit or loss | | | 181 | | | | — | | | | — | | | | — | | | | — | | | | — | | | | — | | | | — | | | | 181 | |
Trade accounts receivables | | | 891,252 | | | | 64,364 | | | | 128,124 | | | | 108,706 | | | | 604 | | | | 45,897 | | | | 274,522 | | | | 2,204 | | | | 1,515,673 | |
Work in progress | | | 55,774 | | | | — | | | | — | | | | — | | | | — | | | | — | | | | 6,030 | | | | — | | | | 61,804 | |
Accounts receivable from related parties | | | 230,607 | | | | 2,746 | | | | 62,525 | | | | 3,072 | | | | 8,852 | | | | 69,382 | | | | 76,006 | | | | (352,438 | ) | | | 100,752 | |
Other accounts receivable | | | 518,123 | | | | 55,959 | | | | 66,765 | | | | 31,381 | | | | 1,922 | | | | 40,026 | | | | 51,269 | | | | — | | | | 765,445 | |
Inventories | | | 46,499 | | | | 15,093 | | | | 8,685 | | | | 19,457 | | | | — | | | | 643,882 | | | | 45,702 | | | | (8,607 | ) | | | 770,711 | |
Prepaid expenses | | | 4,470 | | | | 1,168 | | | | 2,354 | | | | 10,312 | | | | 164 | | | | 216 | | | | 14,794 | | | | — | | | | 33,478 | |
| | | | | | | | | | | | | | | | | | | | | | | | | | | | | | | | | | | | |
| | | 1,931,307 | | | | 183,208 | | | | 390,354 | | | | 334,001 | | | | 15,746 | | | | 884,590 | | | | 493,859 | | | | (358,841 | ) | | | 3,874,224 | |
Non-current assets classified as held for sale | | | 17,722 | | | | — | | | | — | | | | — | | | | — | | | | — | | | | — | | | | — | | | | 17,722 | |
| | | | | | | | | | | | | | | | | | | | | | | | | | | | | | | | | | | | |
Total current assets | | | 1,949,029 | | | | 183,208 | | | | 390,354 | | | | 334,001 | | | | 15,746 | | | | 884,590 | | | | 493,859 | | | | (358,841 | ) | | | 3,891,946 | |
| | | | | | | | | | | | | | | | | | | | | | | | | | | | | | | | | | | | |
Long-term trade accounts receivable | | | 58,997 | | | | — | | | | 14,747 | | | | 793,991 | | | | — | | | | — | | | | 39,852 | | | | — | | | | 907,587 | |
Long-term work in progress | | | — | | | | — | | | | 28,413 | | | | — | | | | — | | | | — | | | | — | | | | — | | | | 28,413 | |
Long-term accounts receivable from related parties | | | 258,479 | | | | — | | | | 27,660 | | | | — | | | | — | | | | — | | | | 637,415 | | | | (149,624 | ) | | | 773,930 | |
Prepaid expenses | | | — | | | | — | | | | 24,585 | | | | 13,115 | | | | 892 | | | | — | | | | — | | | | (510 | ) | | | 38,082 | |
Other long-term accounts receivable | | | 75,030 | | | | 53,917 | | | | 11,159 | | | | 255,179 | | | | 7,348 | | | | 9,811 | | | | 58,408 | | | | — | | | | 470,852 | |
Investments in associates and joint ventures | | | 111,513 | | | | 7,344 | | | | — | | | | — | | | | — | | | | 1 | | | | 2,216,343 | | | | (2,066,530 | ) | | | 268,671 | |
Investment property | | | — | | | | — | | | | — | | | | — | | | | — | | | | 45,687 | | | | — | | | | — | | | | 45,687 | |
Property, plant and equipment | | | 509,700 | | | | 171,226 | | | | 18,572 | | | | 580 | | | | 60 | | | | 11,621 | | | | 171,563 | | | | (17,587 | ) | | | 865,735 | |
Intangible assets | | | 203,390 | | | | 160,288 | | | | 492,424 | | | | 323 | | | | — | | | | 1,022 | | | | 71,363 | | | | 11,260 | | | | 940,070 | |
Deferred income tax asset | | | 165,227 | | | | 5,507 | | | | 11,057 | | | | — | | | | — | | | | 10,316 | | | | 238,560 | | | | 6,030 | | | | 436,697 | |
| | | | | | | | | | | | | | | | | | | | | | | | | | | | | | | | | | | | |
Totalnon-current assets | | | 1,382,336 | | | | 398,282 | | | | 628,617 | | | | 1,063,188 | | | | 8,300 | | | | 78,458 | | | | 3,433,504 | | | | (2,216,961 | ) | | | 4,775,724 | |
| | | | | | | | | | | | | | | | | | | | | | | | | | | | | | | | | | | | |
Total assets | | | 3,331,365 | | | | 581,490 | | | | 1,018,971 | | | | 1,397,189 | | | | 24,046 | | | | 963,048 | | | | 3,927,363 | | | | (2,575,802 | ) | | | 8,667,670 | |
| | | | | | | | | | | | | | | | | | | | | | | | | | | | | | | | | | | | |
Liabilities.- | | | | | | | | | | | | | | | | | | | | | | | | | | | | | | | | | | | | |
Borrowings | | | 591,987 | | | | 46,924 | | | | 2,589 | | | | — | | | | — | | | | 162,031 | | | | 253,233 | | | | — | | | | 1,056,764 | |
Bonds | | | — | | | | — | | | | 24,361 | | | | 12,294 | | | | — | | | | — | | | | — | | | | — | | | | 36,655 | |
Trade accounts payable | | | 955,015 | | | | 62,659 | | | | 85,329 | | | | 81,161 | | | | 132 | | | | 43,724 | | | | 225,966 | | | | (940 | ) | | | 1,453,046 | |
Accounts payable to related parties | | | 114,198 | | | | 3,664 | | | | 60,857 | | | | 83,841 | | | | 14 | | | | 37,396 | | | | 102,976 | | | | (347,772 | ) | | | 55,174 | |
Current income tax | | | 29,379 | | | | 1,282 | | | | 1,122 | | | | — | | | | 161 | | | | 45,299 | | | | 8,300 | | | | — | | | | 85,543 | |
Other accounts payable | | | 492,362 | | | | 12,487 | | | | 68,994 | | | | 27,058 | | | | 49 | | | | 63,654 | | | | 183,895 | | | | 1 | | | | 848,500 | |
Provisions | | | 6,682 | | | | 5,204 | | | | — | | | | — | | | | — | | | | 20 | | | | 1,597 | | | | — | | | | 13,503 | |
| | | | | | | | | | | | | | | | | | | | | | | | | | | | | | | | | | | | |
Total current liabilities | | | 2,189,623 | | | | 132,220 | | | | 243,252 | | | | 204,354 | | | | 356 | | | | 352,124 | | | | 775,967 | | | | (348,711 | ) | | | 3,549,185 | |
| | | | | | | | | | | | | | | | | | | | | | | | | | | | | | | | | | | | |
Borrowings | | | 127,773 | | | | 101,549 | | | | 1,945 | | | | — | | | | — | | | | 12,010 | | | | 390,022 | | | | — | | | | 633,299 | |
Long-term bonds | | | — | | | | — | | | | 319,549 | | | | 591,363 | | | | — | | | | — | | | | — | | | | — | | | | 910,912 | |
Other long-term accounts payable | | | 379,043 | | | | — | | | | 52,349 | | | | 349,987 | | | | 158 | | | | 32,058 | | | | 38,878 | | | | — | | | | 852,473 | |
Long-term accounts payable to related parties | | | 4,306 | | | | — | | | | 836 | | | | 89,023 | | | | 23,445 | | | | — | | | | 62,841 | | | | (154,497 | ) | | | 25,954 | |
Provisions | | | 8,587 | | | | 16,707 | | | | — | | | | — | | | | — | | | | — | | | | 8,620 | | | | — | | | | 33,914 | |
Derivative financial instruments | | | — | | | | 383 | | | | — | | | | — | | | | — | | | | — | | | | — | | | | — | | | | 383 | |
Deferred income tax liability | | | 26,633 | | | | 8,957 | | | | 8,606 | | | | 20,789 | | | | 210 | | | | — | | | | 7,277 | | | | — | | | | 72,472 | |
| | | | | | | | | | | | | | | | | | | | | | | | | | | | | | | | | | | | |
Totalnon-current liabilities | | | 546,342 | | | | 127,596 | | | | 383,285 | | | | 1,051,162 | | | | 23,813 | | | | 44,068 | | | | 507,638 | | | | (154,497 | ) | | | 2,529,407 | |
| | | | | | | | | | | | | | | | | | | | | | | | | | | | | | | | | | | | |
Total liabilities | | | 2,735,965 | | | | 259,816 | | | | 626,537 | | | | 1,255,516 | | | | 24,169 | | | | 396,192 | | | | 1,283,605 | | | | (503,208 | ) | | | 6,078,592 | |
| | | | | | | | | | | | | | | | | | | | | | | | | | | | | | | | | | | | |
Equity attributable to controlling interest in the Company | | | 487,923 | | | | 299,411 | | | | 323,987 | | | | 106,256 | | | | (123 | ) | | | 217,290 | | | | 2,629,428 | | | | (1,940,842 | ) | | | 2,123,330 | |
Non-controlling interest | | | 107,477 | | | | 22,263 | | | | 68,447 | | | | 35,417 | | | | — | | | | 349,566 | | | | 14,330 | | | | (131,752 | ) | | | 465,748 | |
| | | | | | | | | | | | | | | | | | | | | | | | | | | | | | | | | | | | |
Total liabilities and equity | | | 3,331,365 | | | | 581,490 | | | | 1,018,971 | | | | 1,397,189 | | | | 24,046 | | | | 963,048 | | | | 3,927,363 | | | | (2,575,802 | ) | | | 8,667,670 | |
| | | | | | | | | | | | | | | | | | | | | | | | | | | | | | | | | | | | |
- 54 -
Operating segments financial position
Segment reporting
| | | | | | | | | | | | | | | | | | | | | | | | | | | | | | | | | | | | |
| | | | | | Infrastructure | | | | | | | | | | | | | |
| | | Engineering
and
construction | | | Energy | | | Toll
roads | | | Transportation | | | Water
treatment | | | Real
estate | | | Parent
Company
Operations | | | Eliminations | | | Consolidated | |
As of December 31, 2018 | | | | | | | | | | | | | | | | | | | | | | | | | | | | | | | | | | | | |
Assets.- | | | | | | | | | | | | | | | | | | | | | | | | | | | | | | | | | | | | |
Cash and cash equivalent | | | 177,455 | | | | 34,816 | | | | 168,460 | | | | 191,178 | | | | 6,700 | | | | 93,262 | | | | 129,269 | | | | — | | | | 801,140 | |
Financial asset at fair value through profit or loss | | | — | | | | — | | | | — | | | | — | | | | — | | | | — | | | | — | | | | — | | | | — | |
Trade accounts receivables | | | 583,842 | | | | 54,350 | | | | 78,013 | | | | 226,919 | | | | 598 | | | | 63,038 | | | | 1,068 | | | | — | | | | 1,007,828 | |
Work in progress | | | 24,962 | | | | — | | | | — | | | | — | | | | — | | | | — | | | | 3,576 | | | | — | | | | 28,538 | |
Accounts receivable from related parties | | | 203,583 | | | | 492 | | | | 40,820 | | | | 758 | | | | 9,930 | | | | 60,759 | | | | 98,308 | | | | (379,747 | ) | | | 34,903 | |
Other accounts receivable | | | 386,467 | | | | 37,611 | | | | 28,492 | | | | 31,012 | | | | 199 | | | | 55,508 | | | | 49,160 | | | | 2 | | | | 588,451 | |
Inventories | | | 27,852 | | | | 18,823 | | | | 9,206 | | | | 25,282 | | | | — | | | | 448,328 | | | | — | | | | (15,444 | ) | | | 514,047 | |
Prepaid expenses | | | 3,825 | | | | 1,345 | | | | 3,068 | | | | 874 | | | | 135 | | | | 81 | | | | 1,221 | | | | — | | | | 10,549 | |
| | | | | | | | | | | | | | | | | | | | | | | | | | | | | | | | | | | | |
| | | 1,407,986 | | | | 147,437 | | | | 328,059 | | | | 476,023 | | | | 17,562 | | | | 720,976 | | | | 282,602 | | | | (395,189 | ) | | | 2,985,456 | |
Non-current assets classified as held for sale | | | — | | | | — | | | | — | | | | — | | | | — | | | | — | | | | 247,798 | | | | — | | | | 247,798 | |
| | | | | | | | | | | | | | | | | | | | | | | | | | | | | | | | | | | | |
Total current assets | | | 1,407,986 | | | | 147,437 | | | | 328,059 | | | | 476,023 | | | | 17,562 | | | | 720,976 | | | | 530,400 | | | | (395,189 | ) | | | 3,233,254 | |
| | | | | | | | | | | | | | | | | | | | | | | | | | | | | | | | | | | | |
Long-term trade accounts receivable | | | 14,455 | | | | — | | | | 33,380 | | | | 966,202 | | | | — | | | | 6,030 | | | | — | | | | — | | | | 1,020,067 | |
Long-term work in progress | | | — | | | | — | | | | 32,212 | | | | — | | | | — | | | | — | | | | — | | | | — | | | | 32,212 | |
Long-term accounts receivable from related parties | | | 254,660 | | | | — | | | | 39,341 | | | | — | | | | — | | | | — | | | | 744,655 | | | | (260,430 | ) | | | 778,226 | |
Prepaid expenses | | | — | | | | — | | | | 28,214 | | | | 5,152 | | | | 840 | | | | — | | | | — | | | | (509 | ) | | | 33,697 | |
Other long-term accounts receivable | | | 77,028 | | | | 63,797 | | | | 7,058 | | | | 64,817 | | | | 7,346 | | | | 30,268 | | | | 52,645 | | | | (2 | ) | | | 302,957 | |
Investments in associates and joint ventures | | | 114,676 | | | | 7,230 | | | | — | | | | — | | | | — | | | | 5,604 | | | | 2,213,023 | | | | (2,082,768 | ) | | | 257,765 | |
Investment property | | | — | | | | — | | | | — | | | | — | | | | — | | | | 29,133 | | | | — | | | | — | | | | 29,133 | |
Property, plant and equipment | | | 205,678 | | | | 171,430 | | | | 14,585 | | | | 1,586 | | | | 109 | | | | 9,237 | | | | 69,088 | | | | (1,159 | ) | | | 470,554 | |
Intangible assets | | | 160,088 | | | | 183,614 | | | | 466,153 | | | | 749 | | | | — | | | | 1,105 | | | | 23,514 | | | | 11,872 | | | | 847,095 | |
Deferred income tax asset | | | 166,624 | | | | 5,025 | | | | 11,876 | | | | — | | | | 620 | | | | 17,127 | | | | 218,201 | | | | 5,963 | | | | 425,436 | |
| | | | | | | | | | | | | | | | | | | | | | | | | | | | | | | | | | | | |
Totalnon-current assets | | | 993,209 | | | | 431,096 | | | | 632,819 | | | | 1,038,506 | | | | 8,915 | | | | 98,504 | | | | 3,321,126 | | | | (2,327,033 | ) | | | 4,197,142 | |
| | | | | | | | | | | | | | | | | | | | | | | | | | | | | | | | | | | | |
Total assets | | | 2,401,195 | | | | 578,533 | | | | 960,878 | | | | 1,514,529 | | | | 26,477 | | | | 819,480 | | | | 3,851,526 | | | | (2,722,222 | ) | | | 7,430,396 | |
| | | | | | | | | | | | | | | | | | | | | | | | | | | | | | | | | | | | |
Liabilities.- | | | | | | | | | | | | | | | | | | | | | | | | | | | | | | | | | | | | |
Borrowings | | | 232,409 | | | | 26,621 | | | | 15,384 | | | | 209,463 | | | | — | | | | 133,105 | | | | 209,492 | | | | — | | | | 826,474 | |
Bonds | | | — | | | | — | | | | 25,745 | | | | 13,422 | | | | — | | | | — | | | | — | | | | — | | | | 39,167 | |
Trade accounts payable | | | 777,130 | | | | 49,254 | | | | 61,233 | | | | 104,652 | | | | 121 | | | | 31,173 | | | | 55,968 | | | | — | | | | 1,079,531 | |
Accounts payable to related parties | | | 179,351 | | | | 1,933 | | | | 46,099 | | | | 65,256 | | | | 58 | | | | 35,085 | | | | 91,754 | | | | (363,595 | ) | | | 55,941 | |
Current income tax | | | 5,898 | | | | 2,797 | | | | 1,398 | | | | 9,888 | | | | 226 | | | | 4,219 | | | | 1,381 | | | | — | | | | 25,807 | |
Other accounts payable | | | 389,896 | | | | 13,147 | | | | 72,823 | | | | 11,677 | | | | 631 | | | | 106,286 | | | | 38,209 | | | | — | | | | 632,669 | |
Provisions | | | 521 | | | | 5,412 | | | | — | | | | — | | | | — | | | | 264 | | | | — | | | | — | | | | 6,197 | |
Non-current liabilities classified as held for sale | | | — | | | | — | | | | — | | | | — | | | | — | | | | — | | | | 225,828 | | | | — | | | | 225,828 | |
| | | | | | | | | | | | | | | | | | | | | | | | | | | | | | | | | | | | |
Total current liabilities | | | 1,585,205 | | | | 99,164 | | | | 222,682 | | | | 414,358 | | | | 1,036 | | | | 310,132 | | | | 622,632 | | | | (363,595 | ) | | | 2,891,614 | |
| | | | | | | | | | | | | | | | | | | | | | | | | | | | | | | | | | | | |
Borrowings | | | 9,314 | | | | 87,166 | | | | 556 | | | | — | | | | — | | | | 10,684 | | | | 268,478 | | | | — | | | | 376,198 | |
Long-term bonds | | | — | | | | — | | | | 299,637 | | | | 598,238 | | | | — | | | | — | | | | — | | | | — | | | | 897,875 | |
Other long-term accounts payable | | | 357,146 | | | | — | | | | 31,477 | | | | 154,756 | | | | 1,656 | | | | 26,470 | | | | 2,605 | | | | — | | | | 574,110 | |
Long-term accounts payable to related parties | | | 8,880 | | | | — | | | | 1,167 | | | | 81,207 | | | | 23,445 | | | | — | | | | 183,826 | | | | (276,676 | ) | | | 21,849 | |
Provisions | | | 32,122 | | | | 20,234 | | | | — | | | | — | | | | — | | | | — | | | | 51,055 | | | | — | | | | 103,411 | |
Derivative financial instruments | | | — | | | | 61 | | | | — | | | | — | | | | — | | | | — | | | | — | | | | — | | | | 61 | |
Deferred income tax liability | | | 5,564 | | | | 24,541 | | | | 7,010 | | | | 37,178 | | | | — | | | | — | | | | 1,054 | | | | — | | | | 75,347 | |
| | | | | | | | | | | | | | | | | | | | | | | | | | | | | | | | | | | | |
Totalnon-current liabilities | | | 413,026 | | | | 132,002 | | | | 339,847 | | | | 871,379 | | | | 25,101 | | | | 37,154 | | | | 507,018 | | | | (276,676 | ) | | | 2,048,851 | |
| | | | | | | | | | | | | | | | | | | | | | | | | | | | | | | | | | | | |
Total liabilities | | | 1,998,231 | | | | 231,166 | | | | 562,529 | | | | 1,285,737 | | | | 26,137 | | | | 347,286 | | | | 1,129,650 | | | | (640,271 | ) | | | 4,940,465 | |
| | | | | | | | | | | | | | | | | | | | | | | | | | | | | | | | | | | | |
Equity attributable to controlling interest in the Company | | | 331,178 | | | | 323,943 | | | | 332,406 | | | | 171,594 | | | | 340 | | | | 193,483 | | | | 2,708,803 | | | | (1,973,387 | ) | | | 2,088,360 | |
Non-controlling interest | | | 71,786 | | | | 23,424 | | | | 65,943 | | | | 57,198 | | | | — | | | | 278,711 | | | | 13,073 | | | | (108,564 | ) | | | 401,571 | |
| | | | | | | | | | | | | | | | | | | | | | | | | | | | | | | | | | | | |
Total liabilities and equity | | | 2,401,195 | | | | 578,533 | | | | 960,878 | | | | 1,514,529 | | | | 26,477 | | | | 819,480 | | | | 3,851,526 | | | | (2,722,222 | ) | | | 7,430,396 | |
| | | | | | | | | | | | | | | | | | | | | | | | | | | | | | | | | | | | |
- 55 -
| | | | | | | | | | | | | | | | | | | | | | | | | | | | | | | | | | | | |
| | | | | | Infrastructure | | | | | | | | | | | | | |
| As of December 31, 2019 | | Engineering and
construction | | | Energy | | | Toll roads | | | Transportation | | | Water
treatment | | | Real estate | | | Parent
Company
operations | | | Eliminations | | | Consolidated | |
Assets.- | | | | | | | | | | | | | | | | | | | | | | | | | | | | | | | | | | | | |
Cash and cash equivalent | | | 372,991 | | | | 53,118 | | | | 123,020 | | | | 300,896 | | | | 6,388 | | | | 60,718 | | | | 33,570 | | | | — | | | | 950,701 | |
Trade accounts receivables, net | | | 531,591 | | | | 63,402 | | | | 44,513 | | | | 97,059 | | | | 1,168 | | | | 83,019 | | | | 93,452 | | | | — | | | | 914,204 | |
Work in progress, net | | | 49,457 | | | | — | | | | — | | | | — | | | | — | | | | — | | | | — | | | | — | | | | 49,457 | |
Accounts receivable from related parties | | | 202,181 | | | | 369 | | | | 43,852 | | | | 1,853 | | | | — | | | | 1,144 | | | | 99,794 | | | | (312,535 | ) | | | 36,658 | |
Other accounts receivable | | | 327,977 | | | | 30,853 | | | | 30,228 | | | | 18,548 | | | | 109 | | | | 9,509 | | | | 37,248 | | | | 2 | | | | 454,474 | |
Inventories, net | | | 57,093 | | | | 32,366 | | | | 7,109 | | | | 30,594 | | | | — | | | | 437,012 | | | | 2,828 | | | | (11,601 | ) | | | 555,401 | |
Prepaid expenses | | | 6,812 | | | | 1,271 | | | | 2,779 | | | | 231 | | | | 133 | | | | — | | | | 5,252 | | | | — | | | | 16,478 | |
| | | | | | | | | | | | | | | | | | | | | | | | | | | | | | | | | | | | |
| | | 1,548,102 | | | | 181,379 | | | | 251,501 | | | | 449,181 | | | | 7,798 | | | | 591,402 | | | | 272,144 | | | | (324,134 | ) | | | 2,977,373 | |
Non-current assets classified as held for sale | | | 2,398 | | | | — | | | | — | | | | — | | | | — | | | | — | | | | — | | | | — | | | | 2,398 | |
| | | | | | | | | | | | | | | | | | | | | | | | | | | | | | | | | | | | |
Total current assets | | | 1,550,500 | | | | 181,379 | | | | 251,501 | | | | 449,181 | | | | 7,798 | | | | 591,402 | | | | 272,144 | | | | (324,134 | ) | | | 2,979,771 | |
| | | | | | | | | | | | | | | | | | | | | | | | | | | | | | | | | | | | |
| | | | | | | | | | | | | | | | | | | | | | | | | | | | | | | | | | | | |
Long-term trade accounts receivable, net | | | 97,256 | | | | — | | | | 36,273 | | | | 619,086 | | | | — | | | | 587 | | | | 26,407 | | | | — | | | | 779,609 | |
Long-term work in progress, net | | | — | | | | — | | | | 23,117 | | | | — | | | | — | | | | — | | | | — | | | | — | | | | 23,117 | |
Long-term accounts receivable from related parties | | | 318,748 | | | | — | | | | 836 | | | | — | | | | 10,475 | | | | — | | | | 552,687 | | | | (308,023 | ) | | | 574,723 | |
Prepaid expenses | | | — | | | | 887 | | | | 24,462 | | | | 2,307 | | | | 788 | | | | — | | | | — | | | | (510 | ) | | | 27,934 | |
Other long-term accounts receivable | | | 86,097 | | | | 63,649 | | | | 5,156 | | | | — | | | | 7,346 | | | | 50,449 | | | | 60,735 | | | | — | | | | 273,432 | |
Investments in associates and joint ventures | | | 109,839 | | | | 8,006 | | | | — | | | | — | | | | — | | | | 6,062 | | | | 1,495,422 | | | | (1,582,294 | ) | | | 37,035 | |
Investment property | | | 1,450 | | | | — | | | | — | | | | — | | | | — | | | | 26,876 | | | | — | | | | — | | | | 28,326 | |
Property, plant and equipment, net | | | 186,589 | | | | 184,819 | | | | 11,106 | | | | 841 | | | | 153 | | | | 11,742 | | | | 69,899 | | | | (1,159 | ) | | | 463,990 | |
Intangible assets, net | | | 136,547 | | | | 244,901 | | | | 443,420 | | | | 794 | | | | — | | | | 1,029 | | | | 20,402 | | | | 7,134 | | | | 854,227 | |
Right-of-use assets, net | | | 5,638 | | | | 24,038 | | | | 3,860 | | | | 5 | | | | 7 | | | | 5,048 | | | | 67,300 | | | | (15,315 | ) | | | 90,581 | |
Deferred income tax asset | | | 176,740 | | | | 4,741 | | | | 13,054 | | | | — | | | | 720 | | | | 19,736 | | | | 51,552 | | | | 5,176 | | | | 271,719 | |
| | | | | | | | | | | | | | | | | | | | | | | | | | | | | | | | | | | | |
Total non-current assets | | | 1,118,904 | | | | 531,041 | | | | 561,284 | | | | 623,033 | | | | 19,489 | | | | 121,529 | | | | 2,344,404 | | | | (1,894,991 | ) | | | 3,424,693 | |
| | | | | | | | | | | | | | | | | | | | | | | | | | | | | | | | | | | | |
Total assets | | | 2,669,404 | | | | 712,420 | | | | 812,785 | | | | 1,072,214 | | | | 27,287 | | | | 712,931 | | | | 2,616,548 | | | | (2,219,125 | ) | | | 6,404,464 | |
| | | | | | | | | | | | | | | | | | | | | | | | | | | | | | | | | | | | |
Liabilities.- | | | | | | | | | | | | | | | | | | | | | | | | | | | | | | | | | | | | |
Borrowings | | | 180,535 | | | | 42,760 | | | | 2,383 | | | | 5 | | | | 6 | | | | 116,231 | | | | 148,648 | | | | (9,039 | ) | | | 481,529 | |
Bonds | | | — | | | | — | | | | 28,995 | | | | 15,742 | | | | — | | | | — | | | | — | | | | — | | | | 44,737 | |
Trade accounts payable | | | 932,142 | | | | 67,444 | | | | 34,762 | | | | 28,508 | | | | 132 | | | | 39,645 | | | | 56,442 | | | | — | | | | 1,159,075 | |
Accounts payable to related parties | | | 206,907 | | | | 2,233 | | | | 35,554 | | | | 21,024 | | | | — | | | | 23,437 | | | | 58,951 | | | | (309,190 | ) | | | 38,916 | |
Current income tax | | | 18,451 | | | | 961 | | | | 3,710 | | | | 23,887 | | | | — | | | | 704 | | | | 3,456 | | | | — | | | | 51,169 | |
Other accounts payable | | | 441,271 | | | | 16,721 | | | | 53,987 | | | | 4,713 | | | | 835 | | | | 83,345 | | | | 68,802 | | | | — | | | | 669,674 | |
Provisions | | | 6,031 | | | | 18,459 | | | | 6,183 | | | | — | | | | — | | | | 230 | | | | 82,580 | | | | — | | | | 113,483 | |
| | | | | | | | | | | | | | | | | | | | | | | | | | | | | | | | | | | | |
| | | | | | | | | | | | | | | | | | | | | | | | | | | | | | | | | | | | |
Total current liabilities | | | 1,785,337 | | | | 148,578 | | | | 165,574 | | | | 93,879 | | | | 973 | | | | 263,592 | | | | 418,879 | | | | (318,229 | ) | | | 2,558,583 | |
| | | | | | | | | | | | | | | | | | | | | | | | | | | | | | | | | | | | |
| | | | | | | | | | | | | | | | | | | | | | | | | | | | | | | | | | | | |
Borrowings | | | 32,620 | | | | 116,218 | | | | 2,070 | | | | — | | | | — | | | | 11,010 | | | | 254,931 | | | | (7,783 | ) | | | 409,066 | |
Long-term bonds | | | — | | | | — | | | | 276,550 | | | | 602,755 | | | | — | | | | — | | | | — | | | | — | | | | 879,305 | |
Long-term trade accounts payable | | | — | | | | — | | | | — | | | | — | | | | — | | | | — | | | | 34,814 | | | | — | | | | 34,814 | |
Other long-term accounts payable | | | 222,887 | | | | — | | | | 15,989 | | | | 2,176 | | | | 2,106 | | | | 26,841 | | | | 26,291 | | | | — | | | | 296,290 | |
Long-term accounts payable to related parties | | | 120,255 | | | | — | | | | 836 | | | | 22,583 | | | | 23,784 | | | | — | | | | 165,286 | | | | (310,161 | ) | | | 22,583 | |
Provisions | | | 80,125 | | | | 40,268 | | | | 24,691 | | | | 1,394 | | | | — | | | | — | | | | 68,474 | | | | — | | | | 214,952 | |
Derivative financial instruments | | | — | | | | 52 | | | | — | | | | — | | | | — | | | | — | | | | — | | | | — | | | | 52 | |
Deferred income tax liability | | | 31,037 | | | | 36,476 | | | | 5,806 | | | | 39,172 | | | | — | | | | — | | | | 243 | | | | — | | | | 112,734 | |
| | | | | | | | | | | | | | | | | | | | | | | | | | | | | | | | | | | | |
Total non-current liabilities | | | 486,924 | | | | 193,014 | | | | 325,942 | | | | 668,080 | | | | 25,890 | | | | 37,851 | | | | 550,039 | | | | (317,944 | ) | | | 1,969,796 | |
| | | | | | | | | | | | | | | | | | | | | | | | | | | | | | | | | | | | |
Total liabilities | | | 2,272,261 | | | | 341,592 | | | | 491,516 | | | | 761,959 | | | | 26,863 | | | | 301,443 | | | | 968,918 | | | | (636,173 | ) | | | 4,528,379 | |
| | | | | | | | | | | | | | | | | | | | | | | | | | | | | | | | | | | | |
Equity attributable to controlling interest in the Company | | | 330,992 | | | | 346,415 | | | | 258,223 | | | | 232,692 | | | | 424 | | | | 137,542 | | | | 1,644,707 | | | | (1,473,185 | ) | | | 1,477,810 | |
Non-controlling interest | | | 66,151 | | | | 24,413 | | | | 63,046 | | | | 77,563 | | | | — | | | | 273,946 | | | | 2,923 | | | | (109,767 | ) | | | 398,275 | |
| | | | | | | | | | | | | | | | | | | | | | | | | | | | | | | | | | | | |
Total liabilities and equity | | | 2,669,404 | | | | 712,420 | | | | 812,785 | | | | 1,072,214 | | | | 27,287 | | | | 712,931 | | | | 2,616,548 | | | | (2,219,125 | ) | | | 6,404,464 | |
| | | | | | | | | | | | | | | | | | | | | | | | | | | | | | | | | | | | |
| | | | | | | | | | | | | | | | | | | | | | | | | | | | | | | | | | | | |
Operating segments financial position Segment reporting | |
| | | | | | Infrastructure | | | | | | | | | | | | | |
| As of December 31, 2020 | | Engineering and
construction | | | Energy | | | Toll roads | | | Transportation | | | Water
treatment | | | Real estate | | | Parent
Company
operations | | | Eliminations | | | Consolidated | |
Assets.- | | | | | | | | | | | | | | | | | | | | | | | | | | | | | | | | | | | | |
Cash and cash equivalent | | | 382,850 | | | | 60,165 | | | | 117,893 | | | | 207,975 | | | | 7,408 | | | | 73,531 | | | | 50,346 | | | | — | | | | 900,168 | |
Trade accounts receivables, net | | | 425,939 | | | | 37,614 | | | | 25,014 | | | | 111,602 | | | | 565 | | | | 38,043 | | | | 64,390 | | | | — | | | | 703,167 | |
Work in progress, net | | | 186,433 | | | | — | | | | — | | | | — | | | | — | | | | — | | | | — | | | | — | | | | 186,433 | |
Accounts receivable from related parties | | | 107,495 | | | | 35 | | | | 31,868 | | | | 2,624 | | | | 30 | | | | 1,342 | | | | 102,103 | | | | (218,159 | ) | | | 27,338 | |
Other accounts receivable | | | 323,084 | | | | 27,900 | | | | 23,631 | | | | 13,220 | | | | 197 | | | | 10,446 | | | | 35,051 | | | | 2 | | | | 433,531 | |
Inventories, net | | | 58,653 | | | | 36,016 | | | | 8,496 | | | | 31,861 | | | | — | | | | 418,341 | | | | 360 | | | | (1,727 | ) | | | 552,000 | |
Prepaid expenses | | | 7,798 | | | | 1,964 | | | | 6,485 | | | | 328 | | | | 116 | | | | — | | | | 6,281 | | | | — | | | | 22,972 | |
| | | | | | | | | | | | | | | | | | | | | | | | | | | | | | | | | | | | |
Total current assets | | | 1,492,252 | | | | 163,694 | | | | 213,387 | | | | 367,610 | | | | 8,316 | | | | 541,703 | | | | 258,531 | | | | (219,884 | ) | | | 2,825,609 | |
| | | | | | | | | | | | | | | | | | | | | | | | | | | | | | | | | | | | |
Long-term trade accounts receivable, net | | | 53,036 | | | | — | | | | 15,740 | | | | 632,214 | | | | — | | | | 2,181 | | | | 27,495 | | | | — | | | | 730,666 | |
Long-term accounts receivable from related parties | | | 315,393 | | | | — | | | | 14,508 | | | | — | | | | 11,103 | | | | — | | | | 611,498 | | | | (332,431 | ) | | | 620,071 | |
Prepaid expenses | | | — | | | | 981 | | | | 19,009 | | | | 2,048 | | | | 736 | | | | — | | | | — | | | | (510 | ) | | | 22,264 | |
Other long-term accounts receivable | | | 134,719 | | | | 70,694 | | | | 531 | | | | — | | | | 7,346 | | | | 54,237 | | | | 60,696 | | | | — | | | | 328,223 | |
Investments in associates and joint ventures | | | 109,870 | | | | 8,080 | | | | — | | | | — | | | | — | | | | 6,095 | | | | 1,322,865 | | | | (1,411,394 | ) | | | 35,516 | |
Investment property | | | 1,467 | | | | — | | | | — | | | | — | | | | — | | | | 24,606 | | | | 44,521 | | | | (44,521 | ) | | | 26,073 | |
Property, plant and equipment, net | | | 169,091 | | | | 166,382 | | | | 9,186 | | | | 794 | | | | 146 | | | | 9,592 | | | | 16,718 | | | | 33,560 | | | | 405,469 | |
Intangible assets, net | | | 143,575 | | | | 250,327 | | | | 371,437 | | | | 681 | | | | — | | | | 872 | | | | 19,017 | | | | 6,081 | | | | 791,990 | |
Right-of-use assets, net | | | 8,179 | | | | 9,872 | | | | 4,626 | | | | 99 | | | | — | | | | 3,936 | | | | 51,401 | | | | (13,595 | ) | | | 64,518 | |
Deferred income tax asset | | | 174,269 | | | | 4,717 | | | | 5,037 | | | | — | | | | 779 | | | | 18,704 | | | | 53,536 | | | | 5,123 | | | | 262,165 | |
| | | | | | | | | | | | | | | | | | | | | | | | | | | | | | | | | | | | |
Total non-current assets | | | 1,109,599 | | | | 511,053 | | | | 440,074 | | | | 635,836 | | | | 20,110 | | | | 120,223 | | | | 2,207,747 | | | | (1,757,687 | ) | | | 3,286,955 | |
| | | | | | | | | | | | | | | | | | | | | | | | | | | | | | | | | | | | |
Total assets | | | 2,601,851 | | | | 674,747 | | | | 653,461 | | | | 1,003,446 | | | | 28,426 | | | | 661,926 | | | | 2,466,278 | | | | (1,977,571 | ) | | | 6,112,564 | |
| | | | | | | | | | | | | | | | | | | | | | | | | | | | | | | | | | | | |
Liabilities.- | | | | | | | | | | | | | | | | | | | | | | | | | | | | | | | | | | | | |
Borrowings | | | 230,682 | | | | 32,550 | | | | 2,405 | | | | 42 | | | | — | | | | 95,709 | | | | 102,469 | | | | (10,973 | ) | | | 452,884 | |
Bonds | | | 4,546 | | | | — | | | | 32,819 | | | | 21,081 | | | | — | | | | — | | | | — | | | | — | | | | 58,446 | |
Trade accounts payable | | | 861,833 | | | | 51,225 | | | | 51,221 | | | | 32,637 | | | | 61 | | | | 42,565 | | | | 57,625 | | | | — | | | | 1,097,167 | |
Accounts payable to related parties | | | 185,104 | | | | 1,083 | | | | 17,738 | | | | 21,531 | | | | — | | | | 19,074 | | | | 15,708 | | | | (216,420 | ) | | | 43,818 | |
Current income tax | | | 26,922 | | | | 1,351 | | | | 1,638 | | | | 3,606 | | | | 166 | | | | — | | | | 811 | | | | — | | | | 34,494 | |
Other accounts payable | | | 525,195 | | | | 12,905 | | | | 35,997 | | | | 6,719 | | | | 766 | | | | 91,976 | | | | 40,252 | | | | 4,596 | | | | 718,406 | |
Provisions | | | 8,876 | | | | 18,943 | | | | 1,659 | | | | — | | | | — | | | | 492 | | | | 62,787 | | | | — | | | | 92,757 | |
| | | | | | | | | | | | | | | | | | | | | | | | | | | | | | | | | | | | |
Total current liabilities | | | 1,843,158 | | | | 118,057 | | | | 143,477 | | | | 85,616 | | | | 993 | | | | 249,816 | | | | 279,652 | | | | (222,797 | ) | | | 2,497,972 | |
| | | | | | | | | | | | | | | | | | | | | | | | | | | | | | | | | | | | |
Borrowings | | | 25,273 | | | | 103,154 | | | | 2,291 | | | | 59 | | | | — | | | | 11,021 | | | | 328,753 | | | | (25,115 | ) | | | 445,436 | |
Long-term bonds | | | 22,911 | | | | — | | | | 248,029 | | | | 603,373 | | | | — | | | | — | | | | — | | | | — | | | | 874,313 | |
Long-term trade accounts payable | | | — | | | | — | | | | — | | | | — | | | | — | | | | — | | | | 40,502 | | | | — | | | | 40,502 | |
Other long-term accounts payable | | | 140,605 | | | | — | | | | 11,623 | | | | 231 | | | | 2,762 | | | | 23,357 | | | | 4,654 | | | | — | | | | 183,232 | |
Long-term accounts payable to related parties | | | 104,432 | | | | — | | | | 836 | | | | 36,297 | | | | 24,207 | | | | — | | | | 186,886 | | | | (316,361 | ) | | | 36,297 | |
Provisions | | | 122,503 | | | | 37,599 | | | | 26,034 | | | | 1,925 | | | | — | | | | — | | | | 148,548 | | | | — | | | | 336,609 | |
Deferred income tax liability | | | 25,576 | | | | 36,793 | | | | 1,518 | | | | 39,020 | | | | — | | | | — | | | | — | | | | — | | | | 102,907 | |
| | | | | | | | | | | | | | | | | | | | | | | | | | | | | | | | | | | | |
Total non-current liabilities | | | 441,300 | | | | 177,546 | | | | 290,331 | | | | 680,905 | | | | 26,969 | | | | 34,378 | | | | 709,343 | | | | (341,476 | ) | | | 2,019,296 | |
| | | | | | | | | | | | | | | | | | | | | | | | | | | | | | | | | | | | |
Total liabilities | | | 2,284,458 | | | | 295,603 | | | | 433,808 | | | | 766,521 | | | | 27,962 | | | | 284,194 | | | | 988,995 | | | | (564,273 | ) | | | 4,517,268 | |
| | | | | | | | | | | | | | | | | | | | | | | | | | | | | | | | | | | | |
Equity attributable to controlling interest in the Company | | | 261,501 | | | | 354,982 | | | | 161,710 | | | | 177,694 | | | | 464 | | | | 138,933 | | | | 1,474,398 | | | | (1,302,076 | ) | | | 1,267,606 | |
Non-controlling interest | | | 55,892 | | | | 24,162 | | | | 57,943 | | | | 59,231 | | | | — | | | | 238,799 | | | | 2,885 | | | | (111,222 | ) | | | 327,690 | |
| | | | | | | | | | | | | | | | | | | | | | | | | | | | | | | | | | | | |
Total liabilities and equity | | | 2,601,851 | | | | 674,747 | | | | 653,461 | | | | 1,003,446 | | | | 28,426 | | | | 661,926 | | | | 2,466,278 | | | | (1,977,571 | ) | | | 6,112,564 | |
| | | | | | | | | | | | | | | | | | | | | | | | | | | | | | | | | | | | |
Operating segment performance
Segment Reporting
| | | | | | | | | | | | | | | | | | | | | | | | | | | | | | | | | | | | |
| | | | | | Infrastructure | | | | | | | | | | | | | |
| | | Engineering | | | | | | | | | | | | | | | | | | Parent | | | | | | | |
| | | and | | | | | | | | | | | | Water | | | Real | | | Company | | | | | | | |
| | | construction | | | Energy | | | Toll roads | | | Electric Train | | | treatment | | | estate | | | operations | | | Eliminations | | | Consolidated | |
Year 2016 - | | | | | | | | | | | | | | | | | | | | | | | | | | | | | | | | | | | | |
Revenue | | | 2,936,831 | | | | 382,211 | | | | 527,104 | | | | 247,040 | | | | 18,459 | | | | 411,518 | | | | 62,070 | | | | (447,924 | ) | | | 4,137,309 | |
Gross profit (loss) | | | 60,191 | | | | 42,129 | | | | 121,114 | | | | 42,474 | | | | 5,698 | | | | 136,539 | | | | (171 | ) | | | (91,885 | ) | | | 316,089 | |
Administrative expenses | | | (212,048 | ) | | | (17,260 | ) | | | (35,084 | ) | | | (12,951 | ) | | | (787 | ) | | | (28,429 | ) | | | (35,967 | ) | | | 64,223 | | | | (278,303 | ) |
Other income and expenses | | | (14,246 | ) | | | 542 | | | | 262 | | | | 9 | | | | — | | | | 835 | | | | (5,842 | ) | | | (3,920 | ) | | | (22,360 | ) |
Gain from the sale of investments | | | — | | | | — | | | | — | | | | — | | | | — | | | | — | | | | 46,336 | | | | — | | | | 46,336 | |
| | | | | | | | | | | | | | | | | | | | | | | | | | | | | | | | | | | | |
Operating (loss) profit | | | (166,103 | ) | | | 25,411 | | | | 86,292 | | | | 29,532 | | | | 4,911 | | | | 108,945 | | | | 4,356 | | | | (31,582 | ) | | | 61,762 | |
Financial expenses | | | (60,806 | ) | | | (10,801 | ) | | | (7,390 | ) | | | (2,810 | ) | | | (37 | ) | | | (14,388 | ) | | | (116,554 | ) | | | 14,731 | | | | (198,055 | ) |
Financial income | | | 9,987 | | | | 1,040 | | | | 2,225 | | | | 8,037 | | | | 86 | | | | 2,817 | | | | 20,924 | | | | (26,891 | ) | | | 18,225 | |
Share of the profit or loss in associates and joint ventures | | | 16,505 | | | | 1,615 | | | | — | | | | — | | | | — | | | | 6,850 | | | | (1,036,888 | ) | | | 421,852 | | | | (590,066 | ) |
| | | | | | | | | | | | | | | | | | | | | | | | | | | | | | | | | | | | |
(Loss) profit before income tax | | | (200,417 | ) | | | 17,265 | | | | 81,127 | | | | 34,759 | | | | 4,960 | | | | 104,224 | | | | (1,128,162 | ) | | | 378,110 | | | | (708,134 | ) |
Income tax | | | 19,731 | | | | (5,308 | ) | | | (22,213 | ) | | | (10,904 | ) | | | (1,433 | ) | | | (27,054 | ) | | | 192,131 | | | | 7,232 | | | | 152,182 | |
| | | | | | | | | | | | | | | | | | | | | | | | | | | | | | | | | | | | |
(Loss) profit from continuing operations | | | (180,686 | ) | | | 11,957 | | | | 58,914 | | | | 23,855 | | | | 3,527 | | | | 77,170 | | | | (936,031 | ) | | | 385,342 | | | | (555,952 | ) |
Profit from discontinued operations | | | 87,239 | | | | — | | | | — | | | | — | | | | — | | | | — | | | | 1,423 | | | | 15,692 | | | | 104,354 | |
| | | | | | | | | | | | | | | | | | | | | | | | | | | | | | | | | | | | |
(Loss) profit for the year | | | (93,447 | ) | | | 11,957 | | | | 58,914 | | | | 23,855 | | | | 3,527 | | | | 77,170 | | | | (934,608 | ) | | | 401,034 | | | | (451,598 | ) |
| | | | | | | | | | | | | | | | | | | | | | | | | | | | | | | | | | | | |
(Loss) profit attributable to: | | | | | | | | | | | | | | | | | | | | | | | | | | | | | | | | | | | | |
Owners of the Company | | | (87,710 | ) | | | 9,369 | | | | 43,656 | | | | 17,892 | | | | 3,527 | | | | 22,105 | | | | (932,961 | ) | | | 414,423 | | | | (509,699 | ) |
Non-controlling interest | | | (5,737 | ) | | | 2,588 | | | | 15,258 | | | | 5,963 | | | | — | | | | 55,065 | | | | (1,647 | ) | | | (13,389 | ) | | | 58,101 | |
| | | | | | | | | | | | | | | | | | | | | | | | | | | | | | | | | | | | |
| | | (93,447 | ) | | | 11,957 | | | | 58,914 | | | | 23,855 | | | | 3,527 | | | | 77,170 | | | | (934,608 | ) | | | 401,034 | | | | (451,598 | ) |
| | | | | | | | | | | | | | | | | | | | | | | | | | | | | | | | | | | | |
- 56 -
| | | | | | | | | | | | | | | | | | | | | | | | | | | | | | | | | | | | |
| | | | | | Infrastructure | | | | | | | | | | | | | |
| For the year ended December 31, 2018 | | Engineering
and
construction | | | Energy | | | Toll roads | | | Transportation | | | Water
treatment | | | Real estate | | | Parent
Company
operations | | | Elimination | | | Consolidated | |
Revenue | | | 1,960,863 | | | | 560,506 | | | | 733,148 | | | | 586,329 | | | | 3,270 | | | | 630,130 | | | | 367,600 | | | | (639,448 | ) | | | 4,202,398 | |
Gross profit (loss) | | | 62,095 | | | | 120,360 | | | | 107,092 | | | | 122,567 | | | | 592 | | | | 287,959 | | | | 29,251 | | | | (15,946 | ) | | | 713,970 | |
Administrative expenses | | | (136,066 | ) | | | (20,898 | ) | | | (35,626 | ) | | | (12,007 | ) | | | (296 | ) | | | (50,730 | ) | | | (95,653 | ) | | | 40,113 | | | | (311,163 | ) |
Other income and expenses, net | | | (13,508 | ) | | | 1,243 | | | | (11 | ) | | | 31 | | | | — | | | | (1,971 | ) | | | (52,298 | ) | | | 660 | | | | (65,854 | ) |
Loss from the sale of investments | | | (7 | ) | | | — | | | | — | | | | — | | | | — | | | | — | | | | — | | | | — | | | | (7 | ) |
| | | | | | | | | | | | | | | | | | | | | | | | | | | | | | | | | | | | |
Operating (loss) profit | | | (87,486 | ) | | | 100,705 | | | | 71,455 | | | | 110,591 | | | | 296 | | | | 235,258 | | | | (118,700 | ) | | | 24,827 | | | | 336,946 | |
Financial expenses | | | (82,861 | ) | | | (15,631 | ) | | | (26,691 | ) | | | (20,604 | ) | | | 6 | | | | (11,859 | ) | | | (127,863 | ) | | | 24,735 | | | | (260,768 | ) |
Financial income | | | 15,122 | | | | 4,593 | | | | 2,560 | | | | 35,147 | | | | 554 | | | | 3,556 | | | | 32,363 | | | | (42,359 | ) | | | 51,536 | |
Dividends | | | — | | | | — | | | | — | | | | — | | | | — | | | | — | | | | 8,344 | | | | (8,344 | ) | | | — | |
Share of profit or loss in associates and joint ventures | | | 11,366 | | | | 1,608 | | | | — | | | | — | | | | — | | | | (10 | ) | | | 84,138 | | | | (100,811 | ) | | | (3,709 | ) |
| | | | | | | | | | | | | | | | | | | | | | | | | | | | | | | | | | | | |
(Loss) profit before income tax | | | (143,859 | ) | | | 91,275 | | | | 47,324 | | | | 125,134 | | | | 856 | | | | 226,945 | | | | (121,718 | ) | | | (101,952 | ) | | | 124,005 | |
Income tax | | | 14,361 | | | | (26,275 | ) | | | (15,737 | ) | | | (38,017 | ) | | | (517 | ) | | | (69,166 | ) | | | 25,192 | | | | (834 | ) | | | (110,993 | ) |
| | | | | | | | | | | | | | | | | | | | | | | | | | | | | | | | | | | | |
(Loss) profit from continuing operations | | | (129,498 | ) | | | 65,000 | | | | 31,587 | | | | 87,117 | | | | 339 | | | | 157,779 | | | | (96,526 | ) | | | (102,786 | ) | | | 13,012 | |
Profit (Loss) from discontinuing operations | | | 44,096 | | | | — | | | | — | | | | — | | | | — | | | | — | | | | 3,608 | | | | (3,301 | ) | | | 44,403 | |
| | | | | | | | | | | | | | | | | | | | | | | | | | | | | | | | | | | | |
(Loss) profit for the year | | | (85,402 | ) | | | 65,000 | | | | 31,587 | | | | 87,117 | | | | 339 | | | | 157,779 | | | | (92,918 | ) | | | (106,087 | ) | | | 57,415 | |
| | | | | | | | | | | | | | | | | | | | | | | | | | | | | | | | | | | | |
(Loss) profit from attributable to: | | | | | | | | | | | | | | | | | | | | | | | | | | | | | | | | | | | | |
Owners of the Company | | | (86,857 | ) | | | 59,866 | | | | 26,732 | | | | 65,338 | | | | 339 | | | | 28,921 | | | | (85,716 | ) | | | (91,811 | ) | | | (83,188 | ) |
Non-controlling interest | | | 1,455 | | | | 5,134 | | | | 4,855 | | | | 21,779 | | | | — | | | | 128,858 | | | | (7,202 | ) | | | (14,276 | ) | | | 140,603 | |
| | | | | | | | | | | | | | | | | | | | | | | | | | | | | | | | | | | | |
| | | (85,402 | ) | | | 65,000 | | | | 31,587 | | | | 87,117 | | | | 339 | | | | 157,779 | | | | (92,918 | ) | | | (106,087 | ) | | | 57,415 | |
| | | | | | | | | | | | | | | | | | | | | | | | | | | | | | | | | | | | |
Operating segment performance
Segment Reporting
| | | | | | | | | | | | | | | | | | | | | | | | | | | | | | | | | | | | |
| | | | | | Infrastructure | | | | | | | | | | | | | |
| | | Engineering | | | | | | | | | | | | | | | | | | Parent | | | | | | | |
| | | and | | | | | | | | | | | | Water | | | Real | | | Company | | | | | | | |
| | | construction | | | Energy | | | Toll roads | | | Transportation | | | treatment | | | estate | | | operations | | | Eliminations | | | Consolidated
(as restated) | |
Year 2017 - | | | | | | | | | | | | | | | | | | | | | | | | | | | | | | | | | | | | |
Revenue | | | 2,331,907 | | | | 436,876 | | | | 642,127 | | | | 365,771 | | | | 3,152 | | | | 647,535 | | | | 70,050 | | | | (483,405 | ) | | | 4,014,013 | |
Gross profit (loss) | | | 176,473 | | | | 71,825 | | | | 139,196 | | | | 48,696 | | | | 445 | | | | 147,383 | | | | (37,771 | ) | | | (43,795 | ) | | | 502,452 | |
Administrative expenses | | | (188,162 | ) | | | (15,854 | ) | | | (32,453 | ) | | | (15,279 | ) | | | (317 | ) | | | (21,189 | ) | | | (100,968 | ) | | | 51,768 | | | | (322,454 | ) |
Other income and expenses | | | (46,445 | ) | | | 5,138 | | | | 1,061 | | | | 5 | | | | — | | | | (3,700 | ) | | | 10,512 | | | | 560 | | | | (32,869 | ) |
Gain from the sale of investments | | | — | | | | — | | | | — | | | | — | | | | — | | | | 49,002 | | | | (18,672 | ) | | | 4,215 | | | | 34,545 | |
| | | | | | | | | | | | | | | | | | | | | | | | | | | | | | | | | | | | |
Operating (loss) profit | | | (58,134 | ) | | | 61,109 | | | | 107,804 | | | | 33,422 | | | | 128 | | | | 171,496 | | | | (146,899 | ) | | | 12,748 | | | | 181,674 | |
Financial expenses | | | (46,655 | ) | | | (13,423 | ) | | | (6,892 | ) | | | (8,000 | ) | | | (50 | ) | | | (21,918 | ) | | | (81,310 | ) | | | 27,471 | | | | (150,777 | ) |
Financial income | | | 8,491 | | | | 1,965 | | | | 3,257 | | | | 3,606 | | | | 26 | | | | 3,569 | | | | 35,431 | | | | (42,603 | ) | | | 13,742 | |
Share of the profit or loss in associates and joint ventures | | | 30,982 | | | | 1,584 | | | | — | | | | — | | | | — | | | | 456 | | | | 142,595 | | | | (175,144 | ) | | | 473 | |
| | | | | | | | | | | | | | | | | | | | | | | | | | | | | | | | | | | | |
Profit (loss) before income tax | | | (65,316 | ) | | | 51,235 | | | | 104,169 | | | | 29,028 | | | | 104 | | | | 153,603 | | | | (50,183 | ) | | | (177,528 | ) | | | 45,112 | |
Income tax | | | 877 | | | | (13,151 | ) | | | (32,290 | ) | | | (9,544 | ) | | | (228 | ) | | | (35,900 | ) | | | 44,032 | | | | (101 | ) | | | (46,305 | ) |
| | | | | | | | | | | | | | | | | | | | | | | | | | | | | | | | | | | | |
Profit (loss) from continuing operations | | | (64,439 | ) | | | 38,084 | | | | 71,879 | | | | 19,484 | | | | (124 | ) | | | 117,703 | | | | (6,151 | ) | | | (177,629 | ) | | | (1,193 | ) |
Profit from discontinued operations | | | 76,837 | | | | — | | | | — | | | | — | | | | — | | | | — | | | | 123,603 | | | | 9,991 | | | | 210,431 | |
| | | | | | | | | | | | | | | | | | | | | | | | | | | | | | | | | | | | |
Profit (loss) for the period | | | 12,398 | | | | 38,084 | | | | 71,879 | | | | 19,484 | | | | (124 | ) | | | 117,703 | | | | 117,452 | | | | (167,638 | ) | | | 209,238 | |
| | | | | | | | | | | | | | | | | | | | | | | | | | | | | | | | | | | | |
Profit (loss) attributable to: | | | | | | | | | | | | | | | | | | | | | | | | | | | | | | | | | | | | |
Owners of the Company | | | 12,078 | | | | 33,714 | | | | 55,620 | | | | 14,613 | | | | (124 | ) | | | 48,647 | | | | 125,182 | | | | (140,992 | ) | | | 148,738 | |
Non-controlling interest | | | 320 | | | | 4,370 | | | | 16,259 | | | | 4,871 | | | | — | | | | 69,056 | | | | (7,730 | ) | | | (26,646 | ) | | | 60,500 | |
| | | | | | | | | | | | | | | | | | | | | | | | | | | | | | | | | | | | |
| | | 12,398 | | | | 38,084 | | | | 71,879 | | | | 19,484 | | | | (124 | ) | | | 117,703 | | | | 117,452 | | | | (167,638 | ) | | | 209,238 | |
| | | | | | | | | | | | | | | | | | | | | | | | | | | | | | | | | | | | |
- 57 -
| | | | | | | | | | | | | | | | | | | | | | | | | | | | | | | | | | | | |
| | | | | | Infrastructure | | | | | | | | | | | | | |
| For the year ended December 31, 2019 | | Engineering
and
construction | | | Energy | | | Toll roads | | | Transportation | | | Water
treatment | | | Real estate | | | Parent
Company
operations | | | Elimination | | | Consolidated | |
Revenue | | | 2,797,326 | | | | 552,584 | | | | 633,301 | | | | 397,853 | | | | 3,555 | | | | 264,401 | | | | 342,608 | | | | (653,767 | ) | | | 4,337,861 | |
Gross profit (loss) | | | 98,362 | | | | 108,291 | | | | 96,164 | | | | 119,464 | | | | 500 | | | | 70,787 | | | | 6,584 | | | | (49,715 | ) | | | 450,437 | |
Administrative expenses | | | (141,421 | ) | | | (24,230 | ) | | | (28,623 | ) | | | (17,991 | ) | | | (397 | ) | | | (22,045 | ) | | | (75,146 | ) | | | 61,201 | | | | (248,652 | ) |
Other income and expenses, net | | | 9,937 | | | | 606 | | | | (47,998 | ) | | | (2,661 | ) | | | 12 | | | | 20,020 | | | | (318,489 | ) | | | (921 | ) | | | (339,494 | ) |
| | | | | | | | | | | | | | | | | | | | | | | | | | | | | | | | | | | | |
Operating (loss) profit | | | (33,122 | ) | | | 84,667 | | | | 19,543 | | | | 98,812 | | | | 115 | | | | 68,762 | | | | (387,051 | ) | | | 10,565 | | | | (137,709 | ) |
Financial expenses | | | (74,171 | ) | | | (13,266 | ) | | | (27,297 | ) | | | (10,948 | ) | | | (12 | ) | | | (42,320 | ) | | | (123,339 | ) | | | 38,219 | | | | (253,134 | ) |
Financial income | | | 5,644 | | | | 2,033 | | | | 2,245 | | | | 33,214 | | | | 826 | | | | 3,829 | | | | 74,546 | | | | (47,991 | ) | | | 74,346 | |
Dividends | | | — | | | | — | | | | — | | | | — | | | | — | | | | — | | | | 12,688 | | | | (12,688 | ) | | | — | |
Share of profit or loss in associates and joint ventures | | | (3,558 | ) | | | 2,293 | | | | — | | | | — | | | | — | | | | 458 | | | | (711,962 | ) | | | 493,995 | | | | (218,774 | ) |
| | | | | | | | | | | | | | | | | | | | | | | | | | | | | | | | | | | | |
(Loss) profit before income tax | | | (105,207 | ) | | | 75,727 | | | | (5,509 | ) | | | 121,078 | | | | 929 | | | | 30,729 | | | | (1,135,118 | ) | | | 482,100 | | | | (535,271 | ) |
Income tax | | | (35,457 | ) | | | (22,911 | ) | | | (17,112 | ) | | | (39,634 | ) | | | (506 | ) | | | (7,000 | ) | | | (179,633 | ) | | | (1,118 | ) | | | (303,371 | ) |
| | | | | | | | | | | | | | | | | | | | | | | | | | | | | | | | | | | | |
(Loss) profit for the year | | | (140,664 | ) | | | 52,816 | | | | (22,621 | ) | | | 81,444 | | | | 423 | | | | 23,729 | | | | (1,314,751 | ) | | | 480,982 | | | | (838,642 | ) |
| | | | | | | | | | | | | | | | | | | | | | | | | | | | | | | | | | | | |
(Loss) profit from attributable to: | | | | | | | | | | | | | | | | | | | | | | | | | | | | | | | | | | | | |
Owners of the Company | | | (137,109 | ) | | | 48,056 | | | | (28,270 | ) | | | 61,084 | | | | 423 | | | | (4,995 | ) | | | (1,304,676 | ) | | | 480,766 | | | | (884,721 | ) |
Non-controlling interest | | | (3,555 | ) | | | 4,760 | | | | 5,649 | | | | 20,360 | | | | — | | | | 28,724 | | | | (10,075 | ) | | | 216 | | | | 46,079 | |
| | | | | | | | | | | | | | | | | | | | | | | | | | | | | | | | | | | | |
| | | (140,664 | ) | | | 52,816 | | | | (22,621 | ) | | | 81,444 | | | | 423 | | | | 23,729 | | | | (1,314,751 | ) | | | 480,982 | | | | (838,642 | ) |
| | | | | | | | | | | | | | | | | | | | | | | | | | | | | | | | | | | | |
Operating segment performance
Segment Reporting
| | | | | | | | | | | | | | | | | | | | | | | | | | | | | | | | | | | | |
| | | | | | Infrastructure | | | | | | | | | | | | | |
| | | Engineering
and
construction | | | Energy | | | Toll roads | | | Transportation | | | Water
treatment | | | Real
estate | | | Parent
Company
operations | | | Eliminations | | | Consolidated | |
Year 2018 - | | | | | | | | | | | | | | | | | | | | | | | | | | | | | | | | | | | | |
Revenue | | | 1,960,863 | | | | 560,506 | | | | 733,148 | | | | 586,329 | | | | 3,270 | | | | 630,130 | | | | 62,098 | | | | (636,882 | ) | | | 3,899,462 | |
Gross profit (loss) | | | 62,095 | | | | 120,360 | | | | 107,092 | | | | 122,567 | | | | 592 | | | | 287,959 | | | | (10,564 | ) | | | (15,612 | ) | | | 674,489 | |
Administrative expenses | | | (136,066 | ) | | | (20,898 | ) | | | (35,626 | ) | | | (12,007 | ) | | | (295 | ) | | | (50,730 | ) | | | (62,891 | ) | | | 40,080 | | | | (278,433 | ) |
Other income and expenses | | | (13,509 | ) | | | 1,243 | | | | (11 | ) | | | 31 | | | | — | | | | (1,971 | ) | | | (47,778 | ) | | | 660 | | | | (61,335 | ) |
Gain from the sale of investments | | | (7 | ) | | | — | | | | — | | | | — | | | | — | | | | — | | | | — | | | | — | | | | (7 | ) |
| | | | | | | | | | | | | | | | | | | | | | | | | | | | | | | | | | | | |
Operating profit (loss) | | | (87,487 | ) | | | 100,705 | | | | 71,455 | | | | 110,591 | | | | 297 | | | | 235,258 | | | | (121,233 | ) | | | 25,128 | | | | 334,714 | |
Financial expenses | | | (82,861 | ) | | | (15,631 | ) | | | (28,762 | ) | | | (20,604 | ) | | | — | | | | (14,700 | ) | | | (121,938 | ) | | | 36,514 | | | | (247,982 | ) |
Financial income | | | 15,122 | | | | 4,593 | | | | 4,631 | | | | 35,147 | | | | 559 | | | | 6,397 | | | | 38,614 | | | | (54,138 | ) | | | 50,925 | |
Dividends | | | — | | | | — | | | | — | | | | — | | | | — | | | | — | | | | 8,344 | | | | (8,344 | ) | | | — | |
Share of the profit or loss in associates and joint ventures | | | 11,366 | | | | 1,608 | | | | — | | | | — | | | | — | | | | (10 | ) | | | 84,138 | | | | (100,811 | ) | | | (3,709 | ) |
| | | | | | | | | | | | | | | | | | | | | | | | | | | | | | | | | | | | |
(Loss)/profit before income tax | | | (143,860 | ) | | | 91,275 | | | | 47,324 | | | | 125,134 | | | | 856 | | | | 226,945 | | | | (112,075 | ) | | | (101,651 | ) | | | 133,948 | |
Income tax | | | 14,361 | | | | (26,275 | ) | | | (15,737 | ) | | | (38,018 | ) | | | (517 | ) | | | (69,166 | ) | | | 22,866 | | | | (832 | ) | | | (113,318 | ) |
| | | | | | | | | | | | | | | | | | | | | | | | | | | | | | | | | | | | |
(Loss) profit from continuing operations | | | (129,499 | ) | | | 65,000 | | | | 31,587 | | | | 87,116 | | | | 339 | | | | 157,779 | | | | (89,209 | ) | | | (102,483 | ) | | | 20,630 | |
Profit from discontinued operations | | | 44,096 | | | | — | | | | — | | | | — | | | | — | | | | — | | | | (3,708 | ) | | | (3,603 | ) | | | 36,785 | |
| | | | | | | | | | | | | | | | | | | | | | | | | | | | | | | | | | | | |
(Loss) profit for the period | | | (85,403 | ) | | | 65,000 | | | | 31,587 | | | | 87,116 | | | | 339 | | | | 157,779 | | | | (92,917 | ) | | | (106,086 | ) | | | 57,415 | |
| | | | | | | | | | | | | | | | | | | | | | | | | | | | | | | | | | | | |
Profit (loss) attributable to: | | | | | | | | | | | | | | | | | | | | | | | | | | | | | | | | | | | | |
Owners of the Company | | | (86,857 | ) | | | 59,866 | | | | 26,731 | | | | 65,337 | | | | 339 | | | | 28,921 | | | | (85,715 | ) | | | (91,810 | ) | | | (83,188 | ) |
Non-controlling interest | | | 1,454 | | | | 5,134 | | | | 4,856 | | | | 21,779 | | | | — | | | | 128,858 | | | | (7,202 | ) | | | (14,276 | ) | | | 140,603 | |
| | | | | | | | | | | | | | | | | | | | | | | | | | | | | | | | | | | | |
| | | (85,403 | ) | | | 65,000 | | | | 31,587 | | | | 87,116 | | | | 339 | | | | 157,779 | | | | (92,917 | ) | | | (106,086 | ) | | | 57,415 | |
| | | | | | | | | | | | | | | | | | | | | | | | | | | | | | | | | | | | |
- 58 -
| | | | | | | | | | | | | | | | | | | | | | | | | | | | | | | | | | | | |
| | | | | | Infrastructure | | | | | | | | | | | | | |
| For the year ended December 31, 2020 | | Engineering
and
construction | | | Energy | | | Toll roads | | | Transportation | | | Water
treatment | | | Real estate | | | Parent
Company
operations | | | Elimination | | | Consolidated | |
Revenue | | | 2,092,592 | | | | 369,798 | | | | 466,824 | | | | 345,258 | | | | 3,359 | | | | 182,439 | | | | 240,799 | | | | (387,040 | ) | | | 3,314,029 | |
Gross profit (loss) | | | 115,995 | | | | 53,251 | | | | 40,858 | | | | 107,918 | | | | 366 | | | | 40,345 | | | | 8,134 | | | | (46,259 | ) | | | 320,608 | |
Administrative expenses | | | (102,985 | ) | | | (16,119 | ) | | | (16,584 | ) | | | (12,738 | ) | | | (289 | ) | | | (16,462 | ) | | | (42,543 | ) | | | 54,811 | | | | (152,909 | ) |
Other income and expenses, net | | | (43,573 | ) | | | (4,185 | ) | | | (79,576 | ) | | | 72 | | | | 42 | | | | 1,962 | | | | (57,648 | ) | | | 60 | | | | (182,846 | ) |
| | | | | | | | | | | | | | | | | | | | | | | | | | | | | | | | | | | | |
Operating profit (loss) | | | (30,563 | ) | | | 32,947 | | | | (55,302 | ) | | | 95,252 | | | | 119 | | | | 25,845 | | | | (92,057 | ) | | | 8,612 | | | | (15,147 | ) |
Financial expenses | | | (54,173 | ) | | | (17,525 | ) | | | (32,376 | ) | | | (9,316 | ) | | | (275 | ) | | | (12,647 | ) | | | (59,076 | ) | | | 28,445 | | | | (156,943 | ) |
Financial income | | | 8,792 | | | | 2,239 | | | | 4,326 | | | | 1,586 | | | | 897 | | | | 4,584 | | | | 47,506 | | | | (30,510 | ) | | | 39,420 | |
Dividends | | | — | | | | — | | | | — | | | | — | | | | — | | | | — | | | | 7,222 | | | | (7,222 | ) | | | — | |
Share of profit or loss in associates and joint ventures | | | — | | | | 2,391 | | | | — | | | | — | | | | — | | | | 34 | | | | (105,888 | ) | | | 104,233 | | | | 770 | |
| | | | | | | | | | | | | | | | | | | | | | | | | | | | | | | | | | | | |
(Loss) profit before income tax | | | (75,944 | ) | | | 20,052 | | | | (83,352 | ) | | | 87,522 | | | | 741 | | | | 17,816 | | | | (202,293 | ) | | | 103,558 | | | | (131,900 | ) |
Income tax | | | (3,614 | ) | | | (7,500 | ) | | | (13,477 | ) | | | (26,681 | ) | | | (277 | ) | | | (2,854 | ) | | | (4,004 | ) | | | (37 | ) | | | (58,444 | ) |
| | | | | | | | | | | | | | | | | | | | | | | | | | | | | | | | | | | | |
(Loss) profit for the year | | | (79,558 | ) | | | 12,552 | | | | (96,829 | ) | | | 60,841 | | | | 464 | | | | 14,962 | | | | (206,297 | ) | | | 103,521 | | | | (190,344 | ) |
| | | | | | | | | | | | | | | | | | | | | | | | | | | | | | | | | | | | |
(Loss) profit from attributable to: | | | | | | | | | | | | | | | | | | | | | | | | | | | | | | | | | | | | |
Owners of the Company | | | (76,580 | ) | | | 9,176 | | | | (88,865 | ) | | | 45,631 | | | | 464 | | | | 1,391 | | | | (206,257 | ) | | | 97,169 | | | | (217,871 | ) |
Non-controlling interest | | | (2,978 | ) | | | 3,376 | | | | (7,964 | ) | | | 15,210 | | | | — | | | | 13,571 | | | | (40 | ) | | | 6,352 | | | | 27,527 | |
| | | | | | | | | | | | | | | | | | | | | | | | | | | | | | | | | | | | |
| | | (79,558 | ) | | | 12,552 | | | | (96,829 | ) | | | 60,841 | | | | 464 | | | | 14,962 | | | | (206,297 | ) | | | 103,521 | | | | (190,344 | ) |
| | | | | | | | | | | | | | | | | | | | | | | | | | | | | | | | | | | | |
Segments by geographical area
| | | | 2016 | | | 2017 | | | 2018 | | | 2018 | | | 2019 | | | 2020 | |
Revenues: | | | | | | | | | | | | |
- Peru | | | 3,590,772 | | | | 3,589,048 | | | | 3,347,540 | | | | 3,348,824 | | | | 3,496,799 | | | | 2,517,928 | |
- Chile | | | 163,990 | | | | 371,986 | | | | 226,891 | | | | 528,543 | | | | 599,301 | | | | 642,038 | |
- Colombia | | | 363,311 | | | | 50,829 | | | | 325,031 | | | | 325,031 | | | | 241,761 | | | | 151,876 | |
- Guyana | | | 717 | | | | — | | | | — | | |
- Ecuador | | | 3,682 | | | | — | | | | — | | |
- Bolivia | | | 14,837 | | | | 2,150 | | | | — | | |
- Mexico | | | | | | — | | | | 2,187 | |
| | | | | | | | | | | | | | | | | | |
| | | 4,137,309 | | | | 4,014,013 | | | | 3,899,462 | | | | 4,202,398 | | | | 4,337,861 | | | | 3,314,029 | |
| | | | | | | | | | | | | | | | | | |
Non-current assets: | | | | | | | | | | | | |
- Peru | | | 3,995,453 | | | | 4,164,342 | | | | 3,896,920 | | | | 4,009,849 | | | | 3,065,132 | | | | 2,933,742 | |
- Chile | | | 446,998 | | | | 407,152 | | | | 142,383 | | | | 142,819 | | | | 235,803 | | | | 245,727 | |
- Colombia | | | 260,732 | | | | 203,203 | | | | 157,839 | | | | 157,839 | | | | 123,758 | | | | 107,486 | |
- Bolivia | | | 13,043 | | | | 149 | | | | — | | |
- Ecuador | | | 888 | | | | — | | | | — | | |
- Guyana | | | 862 | | | | 878 | | | | — | | |
| | | | | | | | | | | | | | | | | | |
| | | 4,717,976 | | | | 4,775,724 | | | | 4,197,142 | | | | 4,310,507 | | | | 3,424,693 | | | | 3,286,955 | |
| | | | | | | | | | | | | | | | | | |
| 8.1 | Financial instruments by category |
The classification of financial assets and liabilities by category is as follows:
| | | | | | | | |
| | | At December 31 | |
| | | 2017 | | | 2018 | |
Assets according to the statement of financial position | | | | | | | | |
Loans and accounts receivable at amortized cost: | | | | | | | | |
- Cash and cash equivalents | | | 626,180 | | | | 801,140 | |
- Trade accounts receivable and other accounts receivable (excluding financial assets) | | | 2,029,575 | | | | 1,302,358 | |
- Work in progress | | | 90,217 | | | | 60,750 | |
- Financial assets related to concession agreements | | | 952,780 | | | | 1,227,994 | |
- Accounts receivable from related parties | | | 874,682 | | | | 813,129 | |
| | | | | | | | |
| | | 4,573,434 | | | | 4,205,371 | |
| | | | | | | | |
Financial asset at fair value through profit or loss | | | | | | | | |
- Other financial asset | | | 181 | | | | — | |
| | | | | | | | |
| | | 181 | | | | — | |
| | | | | | | | |
| | | | | | | | |
| | | As of December 31, | |
| | | 2019 | | | 2020 | |
Financial assets according to the statement of financial position | | | | | | | | |
Loans and accounts receivable at amortized cost: | | | | | | | | |
- Cash and cash equivalents | | | 950,701 | | | | 900,168 | |
- Trade accounts receivable and other accounts receivable
(excluding non-financial assets) | | | 1,358,282 | | | | 1,178,577 | |
- Financial assets related to concession agreements | | | 748,365 | | | | 775,677 | |
- Accounts receivable from related parties | | | 611,381 | | | | 647,409 | |
| | | | | | | | |
| | | 3,668,729 | | | | 3,501,831 | |
| | | | | | | | |
Financial assets related to concession agreements are recordedpresented in the consolidated statement of financial position as the line items short-term trade accounts receivable and long-term trade accounts receivable.
- 59 -
| | | | | | | | |
| | | As of December 31, | |
| | | 2019 | | | 2020 | |
Financial liabilities according to the statement of financial position | | | | | | | | |
Other financial liabilities at amortized cost: | | | | | | | | |
- Other financial liabilities | | | 774,075 | | | | 773,203 | |
- Finance leases | | | 23,650 | | | | 52,391 | |
- Lease liability for right-of-use asset | | | 92,870 | | | | 72,726 | |
- Bonds | | | 924,042 | | | | 932,759 | |
- Trade and other accounts payable
(excluding non-financial liabilities) | | | 1,467,283 | | | | 1,447,515 | |
- Accounts payable to related parties | | | 61,499 | | | | 80,115 | |
| | | | | | | | |
| | | 3,343,419 | | | | 3,358,709 | |
| | | | | | | | |
Hedging derivatives: | | | | | | | | |
- Derivative financial instruments | | | 52 | | | | — | |
| | | | | | | | |
| | | | | | | | |
| | | At December 31 | |
| | | 2017 | | | 2018 | |
Financial liabilities according to the statement of financial position | | | | | | | | |
Other financial liabilities at amortized cost | | | | | | | | |
- Other financial liabilities | | | 1,561,754 | | | | 1,169,184 | |
- Finance leases | | | 128,309 | | | | 33,488 | |
- Bonds | | | 947,567 | | | | 937,042 | |
- Trade and other accounts payable (excludingnon-financial liabilities) | | | 2,054,217 | | | | 1,552,741 | |
- Accounts payable to related parties | | | 81,128 | | | | 77,790 | |
| | | | | | | | |
| | | 4,772,975 | | | | 3,770,245 | |
| | | | | | | | |
Hedging derivatives: | | | | | | | | |
- Derivative financial instruments | | | 383 | | | | 61 | |
| | | | | | | | |
| 8.2 | Credit quality of financial assets |
The credit quality of financial assets that are neither past due nor impaired can be assessed bywith reference to external risk ratings (if available)they exist), or based on historical information about counterpartyon the default rates.rates of their counterparties.
- 60 -
AtAs of December 31, the credit quality of financial assets is shown as follows:presented below:
| | | | | | | | |
| | | At December 31, | |
| | | 2017 | | | 2018 | |
Cash and cash equivalents (*) | | | | | | | | |
Banco de Credito del Peru (A+) | | | 224,834 | | | | 350,403 | |
Citibank (A) | | | 110,846 | | | | 134,990 | |
Banco Continental (A+) | | | 100,882 | | | | 114,067 | |
Banco Scotiabank (A+) | | | 71,608 | | | | 73,039 | |
Fondo de Inversion Alianza | | | — | | | | 39,051 | |
Banco de la Nacion (A) | | | 17,776 | | | | 23,766 | |
Banco Bogota (A) | | | 25,609 | | | | 16,782 | |
Banco Interbank (A) | | | 14,937 | | | | 14,075 | |
Banco Santander - Peru (A) | | | — | | | | 12,221 | |
Banco de Credito e Inversiones - Chile (AA+) | | | 1,105 | | | | 5,909 | |
Banco Santander - Chile (AAA) | | | 22,041 | | | | 3,325 | |
Banco de Chile (AAA) | | | 4,337 | | | | 49 | |
Banco Interamericano de Finanzas (A) | | | 5,551 | | | | 126 | |
Banco Scotiabank de Guyana (A) | | | — | | | | 121 | |
Others | | | 7,388 | | | | 8,273 | |
| | | | | | | | |
| | | 606,914 | | | | 796,197 | |
| | | | | | | | |
| | | | | | | | |
| | | 2019 | | | 2020 | |
Cash and cash equivalents (*) | | | | | | | | |
Banco de Credito del Peru (A+) | | | 303,193 | | | | 351,515 | |
Banco Continental (A+) | | | 186,239 | | | | 147,868 | |
Citibank (A+) | | | 183,723 | | | | 128,100 | |
Banco Santander - Peru (A+) | | | 114 | | | | 54,478 | |
Banco Scotiabank (A+) | | | 64,106 | | | | 52,448 | |
Banco Interbank (A) | | | 41,718 | | | | 45,808 | |
Banco de la Nacion (A) | | | 56,114 | | | | 22,882 | |
Fondo de Inversion Alianza (AA+) | | | 46 | | | | 21,247 | |
Santander Colombia (A-) | | | 15,183 | | | | 18,256 | |
Banco Santander - Chile (AAA) | | | 5,833 | | | | 17,174 | |
Banco Bogota (BBB-) | | | 7,255 | | | | 12,194 | |
Banco de Credito e Inversiones - Chile (A-) | | | 1,407 | | | | 8,579 | |
Bancolombia (BBB-) | | | 115 | | | | 8,516 | |
Banco Scotiabank - Chile (AAA) | | | 9,801 | | | | 2,114 | |
Credicorp Capital Colombia (AAA) | | | 44,338 | | | | — | |
JP Morgan (A+) | | | 17,853 | | | | — | |
Otros | | | 6,676 | | | | 5,653 | |
| | | | | | | | |
| | | 943,714 | | | | 896,832 | |
| | | | | | | | |
The ratings in the table above “A” and “AAA” represent high-quality credit ratings. For banks located in Peru, thethese risk ratings are derivedobtained from the risk rating agencies authorized by the Peruvian bankingSuperintendence of Banking, Insurance and insurance regulator “Superintendencia de Banca, Seguros y AFP”AFP (SBS). For banks located in Chile, the ratings are derivedobtained from the risk rating agencies authorized by the ChileanSuperintendence of Securities and Insurance Supervisor “Superintendencia(SVS) of Chile (Fitch Chile Clasificadora de Valores y Seguros” (SVS)Riesgo Ltda. and ICR International Credit Rating Cia Clasificadora de Riesgo Ltda.). For banks in Colombia, ratings are obtained from the following financial institutions: Fitch Ratings, Value and Risk Rating S.A., BRC Standard and Poor’s Rating and Technical Committe of BRC Investor Services S.A. SCV.
| (*) | The difference between the balances shown above withand the balances shown inof the statement of financial position correspondscorrespond to cash on hand andin-transit remittances in transit (Note 9). |
The credit quality of customers is assessed in three categories (internal classification):
| | A: | New customers/related parties (less than six months), |
| | B: | Existing customers/related parties (with more than six months of trade relationship) with no previous default history; and |
- 61 -
| | C: | Existing customers/related parties (with more than six months of trade relationship) with previous default history. |
| | | | | | | | |
| | | 2017 | | | 2018 | |
Trade accounts receivable (Note 11 and Note 12) | | | | | | | | |
Counterparties with no external risk rating | | | | | | | | |
A | | | 6,042 | | | | 140,594 | |
B | | | 2,313,187 | | | | 1,762,557 | |
C | | | 194,248 | | | | 185,494 | |
| | | | | | | | |
| | | 2,513,477 | | | | 2,088,645 | |
| | | | | | | | |
Receivable from related parties and joint operators (Note 13) | | | | | | | | |
B | | | 874,682 | | | | 813,129 | |
| | | | | | | | |
| | | 2019 | | | 2020 | |
Trade accounts receivable (Note 10) | | | | | | | | |
Counterparties with no external risk rating | | | | | | | | |
A | | | 58,442 | | | | 40,034 | |
B | | | 1,492,446 | | | | 1,275,523 | |
C | | | 142,925 | | | | 118,276 | |
| | | | | | | | |
| | | 1,693,813 | | | | 1,433,833 | |
| | | | | | | | |
Receivable from related parties and joint operators (Note 12) | | | | | | | | |
B | | | 611,381 | | | | 647,409 | |
The total balance of trade accounts receivable and accounts receivable from related parties is in compliance with contractsubject to the terms and conditions;conditions of the respective contract, none haveof which has beenre-negotiated. renegotiated.
| 9 | CASH AND CASH EQUIVALENTS |
AtAs of December 31, this account comprises:
| | | | 2017 | | | 2018 | | | 2019 | | | 2020 | |
Cash on hand | | | 16,468 | | | | 1,377 | | | | 1,323 | | | | 996 | |
Cashin-transit | | | 2,798 | | | | 3,566 | | |
Remittances in-transit | | | | 5,664 | | | | 2,340 | |
Bank accounts (a) | | | 493,666 | | | | 647,832 | | | | 225,101 | | | | 300,552 | |
Time deposits (b) | | | 113,248 | | | | 148,365 | | |
Escrow accounts (a) | | | | 507,982 | | | | 471,339 | |
Deposits in financial institutions (b) | | | | 210,631 | | | | 124,941 | |
| | | | | | | | | | | | |
| | | 626,180 | | | | 801,140 | | | 950,701 | | | 900,168 | |
| | | | | | | | | | | | |
| (a) | The GroupCorporation maintains depositstrust accounts in local and foreign banks are available and earn interest at market rates. Thisthat includes reserve funds for bond payments issued by the subsidiaries GyM FerroviasTren Urbano de Lima S.A. and Norvial S.A.; for the year 20182020 S/133125 million and S/1328 million, respectively (for the year 20172019 S/108181 million and S/1618 million, respectively)., as shown in the following detail: |
| | | | | | | | |
| | | 2019 | | | 2020 | |
Reserve funds issued bonds | | | 199,192 | | | | 153,075 | |
Real estate projects | | | 31,794 | | | | 35,273 | |
Engineering and construction projects | | | 192,069 | | | | 233,955 | |
Infrastructure projects | | | 84,927 | | | | 49,036 | |
| | | | | | | | |
| | | 507,982 | | | | 471,339 | |
| | | | | | | | |
| (b) | As of December 31, this account comprises. |
| | | | | | | | | | |
| | | Financial entities | | 2019 | | | 2020 | |
Cumbra Peru S.A. | | Credicorp Capital Colombia SA | | | 7,588 | | | | 151 | |
Cumbra Peru S.A. | | Bancolombia S.A. | | | 36,751 | | | | 29,439 | |
Cumbra Peru S.A. | | Banco de Bogota S.A. | | | 72 | | | | 37 | |
Cumbra Peru S.A. | | Alianza Fiduciaria S.A. | | | 46 | | | | 49 | |
| | | | | | | | | | |
| | | | | 44,457 | | | | 29,676 | |
| | | | | | | | | | |
| ii) | Time deposits have maturities less than 90 days and may be renewed upon maturity. These deposits earn interest that fluctuates between 2.5%0.15% and 3.5%2.70%. |
As of December 31, 2017, and 2018, time deposits are mainly from subsidiaries:
| | | | | | | | |
| | | 2017 | | | 2018 | |
Graña y Montero S.A.A. | | | — | | | | 110,281 | |
GyM Ferrovias S.A. | | | 36,757 | | | | 32,000 | |
GyM S.A. | | | 30,497 | | | | 1,906 | |
Concesionaria la Chira S.A. | | | — | | | | 4,170 | |
GMP S.A. | | | 3,238 | | | | 7 | |
Viva GyM S.A. | | | 17,879 | | | | 1 | |
Concar S.A. | | | 13,611 | | | | — | |
Concesion Canchaque | | | 11,000 | | | | — | |
Other minors | | | 266 | | | | — | |
| | | | | | | | |
| | | 113,248 | | | | 148,365 | |
| | | | | | | | |
Reconciliation to the cash flow statement
- 62 -
| | | | | | | | | | | | | | |
| | | Financial entities | | Interest
rate | | | 2019 | | | 2020 | |
Tren Urbano de Lima S.A. | | Banco de Credito del Peru S.A. | | | 2.70 | % | | | 32,300 | | | | 65,000 | |
Tren Urbano de Lima S.A. | | BBVA Banco Continental S.A | | | | | | | 69,531 | | | | - | |
Norvial S.A. | | Banco de Credito del Peru S.A. | | | 0.25 | % | | | 4,763 | | | | 7,429 | |
AENZA S.A.A. | | Banco de Credito del Peru S.A. | | | 2.40 | % | | | 5,312 | | | | 6,500 | |
Concesionaria la Chira S.A. | | BBVA Banco Continental S.A | | | 1.65 | % | | | - | | | | 6,250 | |
Survial S.A. | | Banco de Credito del Peru S.A. | | | 0.15 | % | | | 15,400 | | | | 4,800 | |
Concesion Canchaque S.A.C. | | Banco de Credito del Peru S.A. | | | 0.25 | % | | | 662 | | | | 4,381 | |
UNNA ENERGIA S.A. | | Banco de Credito del Peru S.A. | | | 0.50 | % | | | - | | | | 905 | |
Cumbra Peru S.A. | | Banco de Credito del Peru S.A. | | | | | | | 28,213 | | | | - | |
Cumbra Ingenieria S.A. | | Banco de Credito del Peru S.A. | | | | | | | 9,993 | | | | - | |
| | | | | | | | | | | | | | |
| | | | | | | | | 166,174 | | | | 95,265 | |
| | | | | | | | | | | | | | |
The above figures reconcile toare reconciled with the amount of cash shown in the consolidated statement of cash flows at the end of the financial year as follows:
| | | | | | | | | | | | |
| | | 2016 | | | 2017 | | | 2018 | |
Cash and cash equivalent on Consolidated statement of financial position | | | 606,950 | | | | 626,180 | | | | 801,140 | |
Bank overdrafts (Note 19) | | | (8,396 | ) | | | (120 | ) | | | (119 | ) |
| | | | | | | | | | | | |
Balances per consolidated statement of cash flows | | | 598,554 | | | | 626,060 | | | | 801,021 | |
| | | | | | | | | | | | |
| | | | | | | | | | | | |
| | | 2018 | | | 2019 | | | 2020 | |
Cash and cash equivalent on consolidated statement of financial position | | | 807,214 | | | | 950,701 | | | | 900,168 | |
Bank overdrafts | | | (119 | ) | | | — | | | | — | |
| | | | | | | | | | | | |
Balances per consolidated statement of cash flows | | | 807,095 | | | | 950,701 | | | | 900,168 | |
| | | | | | | | | | | | |
On April 2016, the Company sold their 1.64% of interest held in Transportadora de Gas del Peru S.A. (TGP) for S/107.3 million, resulting in a net profit of S/46.3 million, as shown in the income statement, within “Profit (loss) on sale of investments”. The balance of its investment at the date of sale was S/117.1 million.
The cumulative amount of fair values at the date of sale amounting to S/41.5 million (S/56 million of gain on fair value and S/14.6 million of income tax), as recognized in the statement of comprehensive income was transferred to profits for the period.
11 | TRADE ACCOUNTS RECEIVABLES, NET |
AtAs of December 31, this account comprises:
| | | | | | | | | | | | | | | | |
| | | 2017 | | | 2018 | |
| | | Current | | | Non-current | | | Current | | | Non-current | |
Invoice receivables | | | 459,722 | | | | 819,699 | | | | 907,007 | | | | 469,510 | |
Unbilled receivables | | | 1,069,299 | | | | 87,888 | | | | 113,464 | | | | 550,557 | |
| | | | | | | | | | | | | | | | |
| | | 1,529,021 | | | | 907,587 | | | | 1,020,471 | | | | 1,020,067 | |
(-) Impairment of account receivables | | | (13,348 | ) | | | — | | | | (12,643 | ) | | | — | |
| | | | | | | | | | | | | | | | |
| | | 1,515,673 | | | | 907,587 | | | | 1,007,828 | | | | 1,020,067 | |
| | | | | | | | | | | | | | | | |
| | | | | | | | | | | | | | | | | | | | | | | | |
| | | Total | | | Current | | | Non-current | |
| | | 2019 | | | 2020 | | | 2019 | | | 2020 | | | 2019 | | | 2020 | |
Receivables, net (a) | | | 959,151 | | | | 753,693 | | | | 415,970 | | | | 254,587 | | | | 543,181 | | | | 499,106 | |
Unbilled receivables, net - Subsidiaries (b) | | | 499,974 | | | | 413,364 | | | | 387,998 | | | | 337,244 | | | | 111,976 | | | | 76,120 | |
Unbilled receivables, net - Concessions (c) | | | 234,688 | | | | 266,776 | | | | 110,236 | | | | 111,336 | | | | 124,452 | | | | 155,440 | |
| | | | | | | | | | | | | | | | | | | | | | | | |
| | | 1,693,813 | | | 1,433,833 | | | 914,204 | | | 703,167 | | | 779,609 | | | 730,666 | |
| | | | | | | | | | | | | | | | | | | | | | | | |
The fair value of current receivablesaccounts receivable is similar to their carrying amount sincebook value because their average collection turnovermaturity period is less than 60 days. These current receivablesaccounts receivable do not bearaccrue interest and do not have no specific guarantees.
Thenon-current portion of the trade accounts receivable is related to the financial asset model (Note 2.5) of subsidiary GyM Ferrovias S.A.
At December 31, 2018, the fair value ofnon-current accounts receivable amounted to S/1,060 million (S/835 million at December 31, 2017), which was calculated under the discounted cash flows method, using rates of 7.33% (6.33% at December 31, 2017).
Unbilled receivables are documents related to estimates for services rendered that were not billed by the Engineering and Construction segment related to estimates of the completion advance percentage. Until such revenues are billed, they are recorded in the unbilled receivables account. As of December 31, 2018, the carrying value ofnon-current unbilled receivables is similar to their fair value, as they were recorded using the discounted cash flow method, using a rate of 1.71%.
Rights for concessions in progress correspond to future collection rights for public service concessions that are still in thepre-operational stage.
- 63 -
At December 31, 2018, current and non-current unbilled receivables mainly from the following subsidiaries are as follows:
| | | | | | | | |
| Unbilled receivables | | 2017 | | | 2018 | |
GyM S.A. | | | 581,946 | | | | 14,455 | |
GyM Ferrovias | | | 354,763 | | | | 558,179 | |
Concar S.A. | | | 52,508 | | | | 38,770 | |
Survial S.A. | | | 30,647 | | | | 19,138 | |
GMI S.A. | | | 19,699 | | | | 26,622 | |
Norvial S.A. | | | 7,057 | | | | 2,885 | |
Cam Holding SPA | | | 85,366 | | | | — | |
Others | | | 25,201 | | | | 3,972 | |
| | | | | | | | |
| | | 1,157,187 | | | | 664,021 | |
| | | | | | | | |
Aging of2020, trade accounts receivable iscorrespond mainly to Tren Urbano de Lima S.A. in S/743.8 (S/716.1 million to 2019), Cumbra Peru S.A. in S/435.8 million (S/575.5 million as follows:
| | | | | | | | |
| | | 2017 | | | 2018 | |
Current | | | 2,157,656 | | | | 1,866,913 | |
Past due up to 30 days | | | 118,158 | | | | 37,750 | |
Past due from 31 days up to 180 days | | | 141,120 | | | | 25,854 | |
Past due from 181 days up to 360 days | | | 1,962 | | | | 17,660 | |
Past due over 360 days | | | 17,712 | | | | 92,361 | |
| | | | | | | | |
| | | 2,436,608 | | | | 2,040,538 | |
| | | | | | | | |
The Group has recognized impairment amounting toof 2019), Adexus S.A. in S/3.191.7 million (S/0.7118.9 million as of 2019), Cumbra Ingenieria S.A. in 2017S/43.2 million (S/53.3 million as of 2019), Viva Negocio Immobiliario S.A. in S/40.2 million (S/83.6 million as of 2019), UNNA ENERGIA S.A. in S/37.6 million (S/63.4 million as of 2019), and S/3.1others in 2016) inS/41.5 million (S/83 million to 2019).
Trade accounts receivable of Tren Urbano de Lima S.A. includes the consolidated statement of income (Note 27). The maximum exposurefinancial asset related to credit risk atcontractual right, for the reporting date is the carrying amount of the accounts receivable and unbilled work in progress (Note 12)S/590.1 million (S/579.8 as of December 31, 2019).
| a) | The detail of the age of the commercial receivables net of impairment corresponds as follows: |
| | | | | | | | |
| | | 2019 | | | 2020 | |
Current | | | 817,233 | | | | 718,220 | |
0 to 30 days past due | | | 45,922 | | | | 5,737 | |
31 to 90 days past due | | | 27,364 | | | | 6,801 | |
91 to 120 days past due | | | 1,319 | | | | 2,279 | |
121 to 360 days past due | | | 10,502 | | | | 4,185 | |
Over 360 days past due | | | 56,811 | | | | 16,471 | |
| | | | | | | | |
| | | 959,151 | | | | 753,693 | |
| | | | | | | | |
12 | b) | The unbilled receivables by subsidiaries are documents related to the estimates of the degree of progress for services rendered that were not billed, as follows: |
| | | | | | | | |
| | | 2019 | | | 2020 | |
Cumbra Peru S.A. | | | 384,660 | | | | 315,878 | |
Concar S.A.C. | | | 10,737 | | | | 6,298 | |
Cumbra Ingenieria S.A. | | | 24,787 | | | | 25,823 | |
UNNA ENERGIA S.A. | | | 1,657 | | | | 1,512 | |
Adexus S.A. | | | 78,133 | | | | 63,853 | |
| | | | | | | | |
| | | 499,974 | | | | 413,364 | |
| | | | | | | | |
Below are the unbilled receivables by the subsidiaries grouped by the main projects:
| | | | | | | | |
| | | 2019 | | | 2020 | |
Infrastructure | | | | | | | | |
Operation and maintenance of roads | | | 9,837 | | | | 4,167 | |
Oil services | | | 1,657 | | | | 1,512 | |
Others | | | 901 | | | | 2,131 | |
| | | | | | | | |
| | | 12,395 | | | | 7,810 | |
| | | | | | | | |
Engineering and Construction | | | | | | | | |
Talara Refinery | | | 190,831 | | | | 70,329 | |
Project Quellaveco | | | 52,488 | | | | 84,014 | |
Project Mina Justa | | | 26,658 | | | | 1,743 | |
Civil works, assembly and electromechanics — Acero Arequipa | | | 16,449 | | | | 1,357 | |
Project Mina Gold Fields La Cima S.A. | | | 3,409 | | | | 15,055 | |
Generating Plant Machu Picchu | | | 13,098 | | | | 15,653 | |
Works and Consortiums | | | 11,311 | | | | 6,576 | |
Engineering and Construction Works VyV-DSD S.A. | | | 38,194 | | | | 43,159 | |
Engineering and Construction Works — Morelco S.A.S. | | | 40,400 | | | | 16,066 | |
Others | | | 16,608 | | | | 87,749 | |
| | | | | | | | |
| | | 409,446 | | | | 341,701 | |
| | | | | | | | |
Parent Company Operation | | | 78,133 | | | | 63,853 | |
| | | | | | | | |
| | | 499,974 | | | | 413,364 | |
| | | | | | | | |
| c) | The unbilled receivables (net) – Concessions (Note 2.5), corresponds to future collections for public services granted according to the following: |
| | | | | | | | |
| | | 2019 | | | 2020 | |
Tren Urbano de Lima S.A. | | | 208,205 | | | | 235,763 | |
Survial S.A. | | | 16,466 | | | | 10,611 | |
Norvial S.A. | | | 2,149 | | | | 15,436 | |
Concesión Canchaque S.A.C. | | | 6,700 | | | | 4,401 | |
Concesionaria La Chira S.A. | | | 1,168 | | | | 565 | |
| | | | | | | | |
| | | 234,688 | | | | 266,776 | |
| | | | | | | | |
| d) | The movement of impairment in trade accounts receivable is as follows: |
| | | | | | | | | | | | |
| | | 2018 | | | 2019 | | | 2020 | |
Balance at January, 1 | | | (17,227 | ) | | | (7,633 | ) | | | (8,422 | ) |
Impairment, net (Note 26.ii) | | | (3,065 | ) | | | (955 | ) | | | (19,772 | ) |
Impairment, net (Note 28.b) | | | — | | | | — | | | | (33,874 | ) |
Write-off | | | 12,873 | | | | 12 | | | | 5,653 | |
Exchange difference | | | (214 | ) | | | 37 | | | | (212 | ) |
Translation adjustments | | | — | | | | 117 | | | | (3 | ) |
| | | | | | | | | | | | |
Balance at December, 31 | | | (7,633 | ) | | | (8,422 | ) | | | (56,630 | ) |
| | | | | | | | | | | | |
| e) | The no current unbilled receivables from Tren Urbano de Lima S.A. to the Peruvian State, which is measured at its cost amortized, accrued interest at a rate of 7.7% rate used in a financial instrument of similar characteristics (similar term, currency and counterparty risk) |
The fair value and carrying amount for this concept are detailed below:
| | | | | | | | | | | | | | | | |
| | | Carrying amount | | | Fair value | |
| | | 2019 | | | 2020 | | | 2019 | | | 2020 | |
Tren Urbano de Lima S.A. | | | 579,765 | | | | 590,092 | | | | 696,665 | | | | 783,643 | |
| | | | | | | | | | | | | | | | |
| | | 579,765 | | | | 590,092 | | | | 696,665 | | | | 783,643 | |
| | | | | | | | | | | | | | | | |
| f) | The maximum exposure to credit risk at the reporting date is the carrying amount of accounts receivable and work in progress (Note 11). |
AtAs of December 31, this account comprises:
| | | | 2017 | | | 2018 | | | Total | | | Current | | | Non-current | |
| | | Current | | | Non-current | | | Current | | | Non-current | | | 2019 | | | 2020 | | | 2019 | | | 2020 | | | 2019 | | | 2020 | |
Unbilled receivable concessions in progress | | | — | | | | 28,413 | | | | — | | | | 32,212 | | | | 23,117 | | | | — | | | | — | | | | — | | | | 23,117 | | | | — | |
Work in Progress | | | 61,804 | | | | — | | | | 28,538 | | | | — | | |
Work in progress (b) | | | | 49,457 | | | | 186,433 | | | | 49,457 | | | | 186,433 | | | | — | | | | — | |
| | | | | | | | | | | | | | | | | | | | | | | | | | | | | | |
| | | 61,804 | | | | 28,413 | | | | 28,538 | | | | 32,212 | | | | 72,574 | | | | 186,433 | | | | 49,457 | | | | 186,433 | | | | 23,117 | | | | — | |
| | | | | | | | | | | | | | | | | | | | | | | | | | | | | | |
Concession rights in progress correspond to future collection rights for public service in Concesionaria Via Expresa Sur S.A. that is in the pre-operational stage and has been suspended until July 2019 (Note 6-b).
- 64 -
Work in progressThe ongoing work costs include all expenses incurred by the Group comprising future activities to be carried outCorporation under construction contracts currently effective.in force. The GroupCorporation estimates that all the costs incurred cost will be billed and collected.
At
a) Corresponds to the accounts receivable from the Municipality of Lima related to the mandatory investments from the Concession Contract and the income guaranteed by the Grantor from the start of exploitation. As of December 31, 2018 and 2017 work2019, these accounts are presented in progress that remainedthe long term because it was expected to be billed are shown netcollected once the operation stage began. To date, both the Concession term and most of any advances received from customers for S/13.5 millionthe obligations under the respective Concession Contract remain suspended by agreement between the parties and S/15.3 million, respectively, underpending the agreement of the terms and conditions set forthto approve the Early Termination of the Concession Contract by Mutual Agreement. In accordance with the provisions of Clause 16.3 of the aforementioned Contract, for this reason the balance has been reclassified to “Other accounts receivable - Third-party claims”.
b) Mainly includes S/171 million corresponding to Cumbra Peru S.A. and its subsidiary Vial y Vives - DSD S.A. (S/29.6 million as of December 31, 2019); and S/15.5 million from Cumbra Ingenieria S.A. (S/19.9 million as of December 31, 2019).
Below are the work in each specific agreement. These advances are mostly related to subsidiary GyM S.A.progress grouped by the main projects:
| | | | | | | | |
| | | 2019 | | | 2020 | |
Infrastructure | | | | | | | | |
Road operation and maintenance | | | 23,117 | | | | — | |
| | | | | | | | |
| | | 23,117 | | | | — | |
| | | | | | | | |
Engineering and construction | | | | | | | | |
Engineering and Construction Works — GYM Chile S.p.A. | | | 19,531 | | | | 97,561 | |
Talara Refinery | | | 20,126 | | | | 15,468 | |
North Concentrator Plant of Quellaveco | | | 1,033 | | | | 50,216 | |
Ground transport tunnel of Quellaveco | | | — | | | | 18,485 | |
Others | | | 8,767 | | | | 4,703 | |
| | | | | | | | |
| | | 49,457 | | | | 186,433 | |
| | | | | | | | |
| | | 72,574 | | | | 186,433 | |
| | | | | | | | |
1312 | TRANSACTIONS WITH RELATED PARTIES AND JOINT OPERATORS |
| | a) | Transactions with related parties |
Major transactions between the Company and its related parties are summarized as follows:
| | | | 2016 | | | 2017 | | | 2018 | | | 2018 | | | 2019 | | | 2020 | |
Revenue from sales of goods and services: | | | | | | | | | | | | |
- Joint operations | | | | 56,560 | | | | 44,130 | | | | 15,903 | |
- Associates | | | — | | | | 3,367 | | | | 1,704 | | | | 1,704 | | | | 108 | | | | 5 | |
- Joint operations | | | 36,901 | | | | 18,138 | | | | 56,560 | | |
| | | | | | | | | | | | | | | | | | |
| | | 36,901 | | | | 21,505 | | | | 58,264 | | | | 58,264 | | | | 44,238 | | | | 15,908 | |
| | | | | | | | | | | | | | | | | | |
Purchase of goods and services: | | | | | | | | | | | | |
- Joint operations | | | | 601 | | | | 1,765 | | | | — | |
- Associates | | | 739 | | | | 2,776 | | | | 2,130 | | | | 2,130 | | | | — | | | | 1,225 | |
- Joint operations | | | 3,228 | | | | 14,191 | | | | 601 | | |
| | | | | | | | | | | | | | | | | | |
| | | 3,967 | | | | 16,967 | | | | 2,731 | | | | 2,731 | | | | 1,765 | | | | 1,225 | |
| | | | | | | | | | | | | | | | | | |
Inter-company transactionsTransactions between related parties are made based on prevailingcurrent price lists and the terms and conditions that would beare the same as those agreed with third parties.
| | b) | Key managementManagement compensation |
Key managementManagement includes directors (executive(executives andnon-executive)non-executives), members of the Executive Committee and Internal Audit Management. The compensationManagement and only includes short-term benefits. Compensation paid or payable to key management in 20182020 amounted to S/64.5 million (S/87.4 million in 2019 and S/58 million (S/90.5 million in 2017, which includes S/25.6 million to discontinued operations, S/106.9 million in 2016, which includes S/82 million to discontinued operations) and only relates to short-term benefits.
- 65 -2018).
| | c) | Balances at the end of the year were: |
| | | | At December 31, | | | At December 31, | | | As of December 31, | | | As of December 31, | |
| | | 2017 | | | 2018 | | | 2019 | | | 2020 | |
| | | Receivable | | | Payable | | | Receivable | | | Payable | | | Receivable | | | Payable | | | Receivable | | | Payable | |
Current portion: | | | | | | | | | | | | | | | | |
Joint operations | | | | | | | | | | | | | | | | |
Consorcio Rio Urubamba | | | 8,964 | | | | — | | | | 9,122 | | | | — | | | | 9,042 | | | | — | | | | 9,357 | | | | — | |
Consorcio Peruano de Conservacion | | | 7,417 | | | | — | | | | 6,417 | | | | — | | | | 3,592 | | | | — | | | | 3,156 | | | | — | |
Consorcio Italo Peruano | | | 14,536 | | | | 18,849 | | | | 3,322 | | | | 4,996 | | | | 1,011 | | | | 363 | | | | 1,520 | | | | 217 | |
Consorcio Constructor Chavimochic | | | 1,959 | | | | 5,817 | | | | 2,138 | | | | 6,199 | | | | — | | | | 5,953 | | | | — | | | | 6,208 | |
Consorcio GyM Conciviles | | | 43,435 | | | | — | | | | 1,855 | | | | — | | | | 1,257 | | | | 1,958 | | | | 1,341 | | | | 1,472 | |
Consorcio La Gloria | | | 1,688 | | | | 1,358 | | | | 1,369 | | | | 1,006 | | | | 1,750 | | | | 1,017 | | | | 69 | | | | 113 | |
Consorcio Ermitaño | | | 1,067 | | | | 6 | | | | 781 | | | | 624 | | | | 831 | | | | 440 | | | | 890 | | | | 474 | |
Terminales del Perú | | | 3,290 | | | | — | | | | 459 | | | | — | | |
Consorcio TNT Vial y Vives - DSD Chile Ltda | | | — | | | | — | | | | — | | | | 11,804 | | |
Terminales del Peru | | | | 1,176 | | | | — | | | | 501 | | | | 161 | |
Consorcio TNT Vial y Vives — DSD Chile Ltda | | | | — | | | | 1,088 | | | | — | | | | 1,015 | |
Consorcio Rio Mantaro | | | 1,134 | | | | 763 | | | | — | | | | 6,655 | | | | — | | | | 5,869 | | | | — | | | | 7,655 | |
Consorcio Vial Quinua | | | — | | | | 2,162 | | | | — | | | | 1,970 | | | | — | | | | 2,048 | | | | — | | | | 2,051 | |
Consorcio Huacho Pativilca | | | — | | | | 2,377 | | | | — | | | | 475 | | | | 1,419 | | | | 5,895 | | | | 4 | | | | 85 | |
Consorcio Vial Sierra | | | 2,355 | | | | 1,854 | | | | — | | | | — | | |
Consorcio para la Atencion y Mantenimiento de Ductos | | | — | | | | 12,074 | | | | — | | | | — | | |
Consorcio CDEM | | | | 638 | | | | — | | | | 1,111 | | | | — | |
Consorcio GyM-Stracon | | | | 2,230 | | | | — | | | | — | | | | 644 | |
Consorcio GyM-OSSA | | | | 7,202 | | | | — | | | | — | | | | — | |
Consorcio Chicama Ascope | | | | 2,471 | | | | — | | | | 2,922 | | | | — | |
Consorcio Inti Punku | | | | — | | | | — | | | | — | | | | 6,556 | |
Consorcio Manperan | | | | — | | | | — | | | | 1,057 | | | | 656 | |
Consorcio Norte Pachacutec | | | | — | | | | — | | | | 1,077 | | | | 1,192 | |
Other minors | | | 12,221 | | | | 7,045 | | | | 9,215 | | | | 11,323 | | | | 1,407 | | | | 2,102 | | | | 2,373 | | | | 1,503 | |
| | | | | | | | | | | | | | | | | | | | | | | | |
| | | 98,066 | | | | 52,305 | | | | 34,678 | | | | 45,052 | | | | 34,026 | | | | 26,733 | | | | 25,378 | | | | 30,002 | |
| | | | | | | | | | | | | | | | | | | | | | | | |
Other related parties | | | | | | | | | |
Ferrovias S.A. | | | | — | | | | 12,183 | | | | — | | | | 11,139 | |
Perú Piping Spools S.A.C. | | | | 2,632 | | | | — | | | | 1,960 | | | | 2,677 | |
| | | | | | | | | | | | | |
| | | | 2,632 | | | | 12,183 | | | | 1,960 | | | | 13,816 | |
| | | | | | | | | | | | | |
Current portion | | | | 36,658 | | | | 38,916 | | | | 27,338 | | | | 43,818 | |
| | | | | | | | | | | | | |
Non-current portion | | | | | | | | | |
Gasoducto Sur Peruano S.A. (GSP) | | | | 572,624 | | | | — | | | | 620,071 | | | | — | |
Ferrovias S.A. | | | | — | | | | — | | | | — | | | | 12,862 | |
Ferrovias Participaciones S.A. | | | | — | | | | 22,583 | | | | — | | | | 23,435 | |
Other minors | | | | 2,099 | | | | — | | | | — | | | | — | |
| | | | | | | | | | | | | |
Non-current | | | | 574,723 | | | | 22,583 | | | | 620,071 | | | | 36,297 | |
| | | | | | | | | | | | | |
| | | | | | | | | | | | | | | | |
| | | At December 31, | | | At December 31, | |
| | | 2017 | | | 2018 | |
| | | Receivable | | | Payable | | | Receivable | | | Payable | |
Other related parties | | | | | | | | | | | | | | | | |
Ferrovias Argentina | | | — | | | | 2,684 | | | | — | | | | 10,242 | |
Peru Piping Spools S.A.C. | | | 279 | | | | 185 | | | | 225 | | | | — | |
Gasoducto Sur Peruano S.A | | | 2,407 | | | | — | | | | — | | | | — | |
Other minors | | | — | | | | — | | | | — | | | | 647 | |
| | | | | | | | | | | | | | | | |
Current portion | | | 100,752 | | | | 55,174 | | | | 34,903 | | | | 55,941 | |
| | | | | | | | | | | | | | | | |
Non-current portion: | | | | | | | | | | | | | | | | |
Gasoducto Sur Peruano S.A | | | 773,930 | | | | — | | | | 773,927 | | | | — | |
Ferrovias Participaciones | | | — | | | | 21,648 | | | | — | | | | 21,849 | |
Other minors | | | — | | | | 4,306 | | | | 4,299 | | | | — | |
| | | | | | | | | | | | | | | | |
Non-current | | | 773,930 | | | | 25,954 | | | | 778,226 | | | | 21,849 | |
| | | | | | | | | | | | | | | | |
ReceivablesAccounts receivable and payablespayable are mainly of short-termcurrent maturity and have no specific guarantees; except for accounts receivable from GSP and Ferrovías participations. These balances do not have specific guarantees, except for the receivable account from GSP. Accounts receivable from related parties havegenerate interest considering their maturity periods of 60 days and arise from sales of goods and services. These short-term balances arenon-interest-bearing. As of December 31, 2018, an impairment was recognized for S/31 million in the financial statements of Consorcio GyM Conciviles (S/18 million as of December 31, 2017).short term.
The non-current balance corresponds to the obligations arising from the early termination of the GSP project (Note 16 15 a-i). As of December 31, 2018,2020, the book value of the non-current account receivables recordedreceivable registered by the Group totalingCompany, for S/773.9364 million, (S/524.9 million in the Company and S/249 in GyM S.A.). The amount of S/524.9 million is similar to its fair value as it was recorded using the discounted cash flow method, at an annuala rate of 3.46%1.6% (3.46% in 2019) that originated a discount value of discount of S/44 million equivalent to US$12 million (S/333 million and S/57 million equivalent to US$17.8 million, (equivalent to S/8.1 million in 2017) (Note 28)as of December 31, 2019, respectively).
Additionally, as a consequenceresult of the early termination of the GSP, and the related facts, the subsidiary GyMCumbra Peru S.A. reclassified as of December 31, 2017, theit has balances offrom the Consorcio Constructor Ductos del Sur (CCDS) to which adjustments for impairmentthose who had previously been applied (Note 5.1-f) and which, up todeteriorated in 2016, it was includedintegrated in the consolidation under the proportional shareparticipation method. TheAs of December 31, 2020, the value of accounts receivable from CCDS corresponds mainly to collection rights to GSP for S/249 million.299 million, which includes S/267 million receivable from CCDS and S/32 million for lost profits (as of December 31, 2019, S/298 million which includes S/270 million and S/28 million, respectively).
Accounts payable to related parties have maturity periods of 60 days and arise from engineering, construction, maintenance, and other services received. These balances are not interest-bearing due to their short-term maturities.
Transactions withnon-controlling interestinterests are disclosed in Note 36.35.
- 66 -
1413 | OTHER ACCOUNTS RECEIVABLE |
AtAs of December 31, this account comprises:
| | | | | | | | | | | | | | | | |
| | | 2017 | | | 2018 | |
| | | Current | | | Non-current | | | Current | | | Non-current | |
Advances to suppliers (a) | | | 149,464 | | | | 255,181 | | | | 81,719 | | | | 64,817 | |
Income taxon-account payments (b) | | | 125,176 | | | | 2,607 | | | | 91,353 | | | | — | |
VAT credit (c) | | | 81,732 | | | | 30,680 | | | | 79,076 | | | | 26,162 | |
Guarantee deposits (d) | | | 113,429 | | | | — | | | | 167,769 | | | | 12,241 | |
Claims to third parties (e ) | | | 109,491 | | | | 11,808 | | | | 62,163 | | | | — | |
Petroleos del Peru S.A.- Petroperu S.A. | | | 3,619 | | | | 53,918 | | | | 11,953 | | | | 63,797 | |
Taxes receivable | | | 66,083 | | | | 33,428 | | | | 20,246 | | | | 25,644 | |
Restricted funds (f) | | | 61,993 | | | | 44,770 | | | | 39,394 | | | | 28,578 | |
Rental and sale of equipment | | | 27,970 | | | | — | | | | 34,768 | | | | — | |
Accounts receivable from personnel | | | 8,868 | | | | — | | | | 3,479 | | | | — | |
Consorcio Constructor Ductos del Sur (g) | | | — | | | | 29,264 | | | | — | | | | 52,114 | |
Consorcio Panorama | | | — | | | | — | | | | 5,306 | | | | 21,826 | |
Other minors | | | 19,018 | | | | 9,196 | | | | 16,059 | | | | 7,778 | |
| | | | | | | | | | | | | | | | |
| | | 766,843 | | | | 470,852 | | | | 613,285 | | | | 302,957 | |
(-) Impairment | | | (1,398 | ) | | | — | | | | (24,834 | ) | | | — | |
| | | | | | | | | | | | | | | | |
| | | 765,445 | | | | 470,852 | | | | 588,451 | | | | 302,957 | |
| | | | | | | | | | | | | | | | |
Othernon-current accounts receivable have maturities between two and five years.
| | | | | | | | | | | | | | | | | | | | | | | | |
| | | Total | | | Current | | | Non-current | |
| | | 2019 | | | 2020 | | | 2019 | | | 2020 | | | 2019 | | | 2020 | |
Advances to suppliers (a) | | | 135,481 | | | | 76,200 | | | | 135,481 | | | | 76,200 | | | | — | | | | — | |
Income tax on-account payments (b) | | | 71,541 | | | | 48,054 | | | | 71,541 | | | | 48,052 | | | | — | | | | 2 | |
VAT credit (c) | | | 47,167 | | | | 54,076 | | | | 32,903 | | | | 43,498 | | | | 14,264 | | | | 10,578 | |
Guarantee deposits (d) | | | 189,210 | | | | 217,441 | | | | 104,965 | | | | 156,123 | | | | 84,245 | | | | 61,318 | |
Claims to third parties (e) | | | 83,054 | | | | 212,565 | | | | 38,874 | | | | 108,748 | | | | 44,180 | | | | 103,817 | |
Petroleos del Peru S.A.- Petroperu S.A. (f) | | | 80,942 | | | | 87,826 | | | | 17,293 | | | | 17,132 | | | | 63,649 | | | | 70,694 | |
ITAN and other tax receivable | | | 60,883 | | | | 63,003 | | | | 30,233 | | | | 30,468 | | | | 30,650 | | | | 32,535 | |
Restricted funds (g) | | | 16,523 | | | | 29,121 | | | | 1,522 | | | | 2,092 | | | | 15,001 | | | | 27,029 | |
Rental and sale of equipment - Cumbra Peru S.A. projects | | | 30,798 | | | | 29,149 | | | | 30,798 | | | | 29,149 | | | | — | | | | — | |
Accounts receivable from personneel | | | 2,940 | | | | 10,957 | | | | 2,940 | | | | 10,957 | | | | — | | | | — | |
Consorcio Panorama (h) | | | 23,491 | | | | 25,026 | | | | — | | | | — | | | | 23,491 | | | | 25,026 | |
Other minors | | | 16,574 | | | | 10,386 | | | | 15,339 | | | | 9,738 | | | | 1,235 | | | | 648 | |
| | | | | | | | | | | | | | | | | | | | | | | | |
| | | 758,604 | | | | 863,804 | | | | 481,889 | | | | 532,157 | | | | 276,715 | | | | 331,647 | |
Impairment (i) | | | (30,698 | ) | | | (102,050 | ) | | | (27,415 | ) | | | (98,626 | ) | | | (3,283 | ) | | | (3,424 | ) |
| | | | | | | | | | | | | | | | | | | | | | | | |
| | | 727,906 | | | | 761,754 | | | | 454,474 | | | | 433,531 | | | | 273,432 | | | | 328,223 | |
| | | | | | | | | | | | | | | | | | | | | | | | |
The fair value of the other short-term receivables approximatesaccounts receivable is similar to their carrying amountbook value due to their short-term maturities.maturity. Thenon-current portion corresponds mainly comprisesto non-financial assets such as advances to suppliers and fiscaltax credits. Other non-current accounts receivable have maturities ranging from 2 to 5 years.
The maximum exposure to credit risk at the reporting date is the carrying amountsamount of each class of above-mentioned other receivables.accounts receivable mentioned. The GroupCorporation does not demandrequest guarantees.
The following paragraph containsBelow is a description and composition of majorthe main accounts receivable:
The balance(a) Advance to suppliers - corresponds mainly comprises advances to:to the following:
| | | | | | | | | | | | | | | | |
| | | 2017 | | | 2018 | |
| | | Current | | | Non-current | | | Current | | | Non-current | |
Alsthom Transporte - Linea 1 | | | 9,985 | | | | 223,387 | | | | 1,578 | | | | 64,817 | |
Electromechanical works Refineria Talara | | | 29,814 | | | | — | | | | 4,582 | | | | — | |
Infrastructure Linea Amarilla | | | 40,669 | | | | — | | | | 5,545 | | | | — | |
Bombardier - Linea 1 | | | — | | | | 29,142 | | | | — | | | | — | |
Advances - joint operations vendors | | | — | | | | — | | | | 21,647 | | | | — | |
Other | | | 68,996 | | | | 2,652 | | | | 48,367 | | | | — | |
| | | | | | | | | | | | | | | | |
| | | 149,464 | | | | 255,181 | | | | 81,719 | | | | 64,817 | |
| | | | | | | | | | | | | | | | |
- 67 -
| | | | | | | | |
| | | Current | |
| | | 2019 | | | 2020 | |
Alstom Transporte — Linea 1 | | | 2,597 | | | | 5,786 | |
Advances — Refineria Talara | | | 48,303 | | | | 6,951 | |
Advances — joint operations vendors | | | 49,181 | | | | 36,803 | |
Others | | | 35,400 | | | | 26,660 | |
| | | | | | | | |
| | | 135,481 | | | | 76,200 | |
| | | | | | | | |
| (b) | Income tax on-account payments
|
This balance mainly consists(b) Income tax on-account payments, consist of income tax payments and credits in the following subsidiaries:
| | | | | | | | | | | | | | | | |
| | | 2017 | | | 2018 | |
| | | Current | | | Non-current | | | Current | | | Non-current | |
GyM S.A. | | | 84,923 | | | | — | | | | 55,377 | | | | — | |
GMI S.A. | | | 542 | | | | — | | | | 3,877 | | | | — | |
GMP S.A. | | | 19,318 | | | | — | | | | 8,511 | | | | — | |
CONCAR S.A. | | | 4,565 | | | | — | | | | 8,563 | | | | — | |
VIVA GyM S.A. | | | 6,121 | | | | — | | | | 8,114 | | | | — | |
Graña y Montero S.A.A. | | | — | | | | — | | | | 6,463 | | | | — | |
GyM Ferrovías S.A. | | | 3,606 | | | | — | | | | — | | | | — | |
Others | | | 6,101 | | | | 2,607 | | | | 448 | | | | — | |
| | | | | | | | | | | | | | | | |
| | | 125,176 | | | | 2,607 | | | | 91,353 | | | | — | |
| | | | | | | | | | | | | | | | |
| | | | | | | | | | | | | | | | | | | | | | | | |
| | | Total | | | Current | | | Non-current | |
| | | 2019 | | | 2020 | | | 2019 | | | 2020 | | | 2019 | | | 2020 | |
Cumbra Peru S.A. | | | 45,628 | | | | 35,599 | | | | 45,628 | | | | 35,599 | | | | — | | | | — | |
Cumbra Ingenieria S.A. | | | 7,203 | | | | 3,532 | | | | 7,203 | | | | 3,532 | | | | — | | | | — | |
UNNA ENERGIA S.A. S.A. | | | 2,400 | | | | 1,883 | | | | 2,400 | | | | 1,883 | | | | — | | | | — | |
Concar S.A. | | | 3,709 | | | | 3,340 | | | | 3,709 | | | | 3,340 | | | | — | | | | — | |
Viva Negocio Inmobiliario S.A. | | | 3,485 | | | | 1,351 | | | | 3,485 | | | | 1,351 | | | | — | | | | — | |
AENZA S.A.A. | | | 2,895 | | | | 1,348 | | | | 2,895 | | | | 1,348 | | | | — | | | | — | |
Norvial S.A. | | | 4,266 | | | | 5 | | | | 4,266 | | | | 5 | | | | — | | | | — | |
Survial S.A. | | | 426 | | | | 141 | | | | 426 | | | | 141 | | | | — | | | | — | |
Others | | | 1,529 | | | | 855 | | | | 1,529 | | | | 853 | | | | — | | | | 2 | |
| | | | | | | | | | | | | | | | | | | | | | | | |
| | | 71,541 | | | | 48,054 | | | | 71,541 | | | | 48,052 | | | | — | | | | 2 | |
| | | | | | | | | | | | | | | | | | | | | | | | |
(c) Tax credit related to VAT on the following subsidiaries:
| (c) | Tax credit related to VAT on the following subsidiaries:
|
| | | | | | | | | | | | | | | | |
| | | 2017 | | | 2018 | |
| | | Current | | | Non-current | | | Current | | | Non-current | |
GyM S.A. | | | 50,326 | | | | 530 | | | | 38,653 | | | | 530 | |
VIVA GyM S.A. | | | 10,894 | | | | 9,983 | | | | 511 | | | | 6,744 | |
GyM Ferrovías S.A. | | | 8,653 | | | | — | | | | 25,453 | | | | — | |
Negocios del gas S.A. | | | — | | | | 8,411 | | | | — | | | | 8,411 | |
Concesionaria Vesur S.A. | | | — | | | | 5,319 | | | | 1,015 | | | | 5,059 | |
Graña y Montero S.A.A. | | | 1,571 | | | | — | | | | 9,821 | | | | — | |
GMP S.A. | | | 3,992 | | | | — | | | | 456 | | | | — | |
CONCAR S.A. | | | 1,551 | | | | — | | | | 2,382 | | | | — | |
NORVIAL S.A. | | | — | | | | 3,209 | | | | — | | | | 1,997 | |
Others | | | 4,745 | | | | 3,228 | | | | 785 | | | | 3,421 | |
| | | | | | | | | | | | | | | | |
| | | 81,732 | | | | 30,680 | | | | 79,076 | | | | 26,162 | |
| | | | | | | | | | | | | | | | |
| | | | | | | | | | | | | | | | | | | | | | | | |
| | | Total | | | Current | | | Non-current | |
| | | 2019 | | | 2020 | | | 2019 | | | 2020 | | | 2019 | | | 2020 | |
Cumbra Peru S.A. | | | 12,963 | | | | 12,868 | | | | 12,963 | | | | 12,868 | | | | — | | | | — | |
Tren Urbano de Lima S.A. | | | 11,970 | | | | 3,335 | | | | 11,970 | | | | 3,335 | | | | — | | | | — | |
AENZA S.A.A. | | | — | | | | 648 | | | | — | | | | 648 | | | | — | | | | — | |
Concar S.A. | | | 1,653 | | | | 1,527 | | | | 1,653 | | | | 1,527 | | | | — | | | | — | |
Survial SA. | | | 1,817 | | | | 2,631 | | | | 1,817 | | | | 2,631 | | | | — | | | | — | |
Cumbra Ingenieria S.A. | | | 1,513 | | | | 13,754 | | | | 1,513 | | | | 13,754 | | | | — | | | | — | |
Viva Negocio Inmobiliario S.A. | | | 6,874 | | | | 8,111 | | | | 513 | | | | 953 | | | | 6,361 | | | | 7,158 | |
UNNA ENERGIA S.A. S.A. | | | 396 | | | | 678 | | | | 396 | | | | 678 | | | | — | | | | — | |
Others | | | 9,981 | | | | 10,524 | | | | 2,078 | | | | 7,104 | | | | 7,903 | | | | 3,420 | |
| | | | | | | | | | | | | | | | | | | | | | | | |
| | | 47,167 | | | | 54,076 | | | | 32,903 | | | | 43,498 | | | | 14,264 | | | | 10,578 | |
| | | | | | | | | | | | | | | | | | | | | | | | |
Management considers that this VAT-fiscalVAT credit will be recovered in the normalregular course of future operations of these subsidiaries.
(d) Guarantee deposits are the
Corresponds to funds retainedheld by customers for workconstruction contracts assumed basically bymainly from the subsidiary GyM S.A. These deposits are retained by the customers to secureensure the Subsidiary’ssubsidiary’s compliance with its obligations under the contracts. The amounts retained will be recovered once the contracted work is completed.
| (e) | Third-Party Claims | | | | | | | | | | | | | | | | | | | | | | | | | | | | Total | | | Current | | | Non-current | | | | | 2019 | | | 2020 | | | 2019 | | | 2020 | | | 2019 | | | 2020 | | Talara Refinery | | | 55,567 | | | | 58,831 | | | | 308 | | | | 812 | | | | 55,259 | | | | 58,019 | | Retention Toquepala | | | 19,630 | | | | — | | | | 19,630 | | | | — | | | | — | | | | — | | Retention Minera Teck | | | 16,075 | | | | 64,175 | | | | 16,075 | | | | 64,175 | | | | — | | | | — | | Retention Quellaveco | | | 15,926 | | | | 23,699 | | | | 15,926 | | | | 23,699 | | | | — | | | | — | | Joint operations retention | | | 29,575 | | | | 29,792 | | | | 15,654 | | | | 29,792 | | | | 13,921 | | | | — | | Retention Morelco | | | 15,261 | | | | 14,108 | | | | 15,261 | | | | 14,108 | | | | — | | | | — | | Retention Marcobre | | | 5,052 | | | | 302 | | | | 5,052 | | | | 302 | | | | — | | | | — | | SBLC guarantees — Sale of CAM Chile S.p.A. | | | 14,726 | | | | — | | | | 3,576 | | | | — | | | | 11,150 | | | | — | | Others | | | 17,398 | | | | 26,534 | | | | 13,483 | | | | 23,235 | | | | 3,915 | | | | 3,299 | | | | | | | | | | | | | | | | | | | | | | | | | | | | | | 189,210 | | | | 217,441 | | | | 104,965 | | | | 156,123 | | | | 84,245 | | | | 61,318 | | | | | | | | | | | | | | | | | | | | | | | | | | |
(e) Third-party claims | | | | | | | | | | | | | | | | | | | | | | | | | | | | Total | | | Current | | | Non-current | | | | | 2019 | | | 2020 | | | 2019 | | | 2020 | | | 2019 | | | 2020 | | Tecnicas Reunidas — Talara (e.1) | | | — | | | | 53,635 | | | | — | | | | — | | | | — | | | | 53,635 | | Municipalidad Metropolitana de Lima (e.2) | | | — | | | | 49,625 | | | | — | | | | 49,625 | | | | — | | | | — | | Ministerio de Vivienda and Fondo Mi Vivienda | | | 20,536 | | | | 21,816 | | | | — | | | | — | | | | 20,536 | | | | 21,816 | | Accounts receivable from joint venture | | | 39,736 | | | | 60,861 | | | | 23,934 | | | | 38,326 | | | | 15,802 | | | | 22,535 | | Others | | | 22,782 | | | | 26,628 | | | | 14,940 | | | | 20,797 | | | | 7,842 | | | | 5,831 | | | | | | | | | | | | | | | | | | | | | | | | | | | | | | 83,054 | | | | 212,565 | | | | 38,874 | | | | 108,748 | | | | 44,180 | | | | 103,817 | | | | | | | | | | | | | | | | | | | | | | | | | | |
(e.1) Tecnicas Reunidas - Talara Cumbra Peru S.A. filed a lawsuit case against Tecnicas Reunidas for approximately US$78 million as indemnification for damages as a consequence of several contractual breaches. Tecnicas Reunidas has filed a counterclaim for approximately US$ 81 million alleging that Cumbra Peru S.A. has breached the subcontract entered between the two companies. On December 28, 2020, Tecnicas Reunidas executed two letters of guarantee issued by Banco Santander, for US$16 million for Performance and the second letter for advance payment for US$7.7 million, despite the fact that the obligations guaranteed by the letter of guarantee were being litigated in the process described in this paragraph. As of December 31, 2020, the balance of this item at face value amounts to US$17.3 million equivalent to S/62.5 million (at present value the balance amounts to US$14.8 million equivalent to S/53.6 million). (e.2) Municipalidad Metropolitana de Lima |
Includes mainly an amountthe reclassification of net intangible assets for S/27.221.8 million (Note 17), work in progress - related to concession agreements for S/23.4 million (Note 11-a), other accounts S/4.4 million. In 2020, this item includes an impairment of S/49.6 million (Note 28-b).
(f) Other accounts receivable from Petroperu S.A.
It corresponds to accounts receivable to Petroperu S.A., for the claim from the resolutionadditional investments of the Sale and Purchase Contract for the DevelopmentTerminales del Peru Consortium of the Large Scale Real Estate Project for Social Housing Construction “Ciudad Alameda de Ancon” subscribed bysubsidiary UNNA ENERGIA S.A.
(g) Restricted funds
As of December 31, 2020, includes restricted funds of S/19.1 million of the Company and S/0.9 million of the subsidiary Viva GyM together with the Ministry of Housing,Negocio Inmobiliario S.A. for bank certificates under guarantee and Fondo Mi Vivienda.
This Sale and Purchase Contract was rightfully terminated dueS/7.3 corresponds to the impossibility of executing its terms and conditions since it became impossible to install proper potable water and sewerage services for the housing units that were to be developed within the term limit established in the Contract. As a consequence, and in accordance with the provisions of Civil Code 1372, the parties are obliged to fully reimburse the executed benefits to date, which results in the reimbursement of S/22 million by the Ministry of Housing and S/5.2 million by the Fondo Mi Vivienda to Viva GyM.
- 68 -
Includes guaranteebank accounts for the credit agreement subscribed betweenreserve account of the CompanyConcesionaria La Chira S.A. and Credit Suisse AG amounting toothers subsidiaries for S/281.6 million (S/7.7 million, S/0.9 million, S/7.3 million and S/0.5 million as reserve forof December 31, 2019, respectively).
(h) Consorcio Panorama
Corresponds to the paymentsettlement agreement of interest;the Consorcio Panorama signed by Viva Negocio Inmobiliario S.A. and S/11 million from Viva GyM S.A. for bank guarantee.Inversiones Maje S.A.C. on December 14, 2018. This balance includes the return of contributions and the profit earned, based on future sales of the properties held in the project.
(i) Impairment
The movement in impairment of other receivables during 2018, 2019 and 2020 was as follows:
| | | | | | | | | | | | | | | | | | | | | | | | | | | | | | | | | | | | |
| | | Total | | | Guaranties Retention | | | Claims to third parties | |
| | | 2018 | | | 2019 | | | 2020 | | | 2018 | | | 2019 | | | 2020 | | | 2018 | | | 2019 | | | 2020 | |
Balance at January, 1 | | | (1,398 | ) | | | (25,567 | ) | | | (30,698 | ) | | | — | | | | — | | | | 165 | | | | (1,398 | ) | | | (25,567 | ) | | | (30,863 | ) |
Impairment of Concar S.A.C. (Note 26.ii) | | | (665 | ) | | | (1,457 | ) | | | (11,431 | ) | | | — | | | | — | | | | — | | | | (665 | ) | | | (1,457 | ) | | | (11,431 | ) |
Impairment of Sucursal Colombia (Note 26.ii) | | | — | | | | (3,283 | ) | | | — | | | | — | | | | — | | | | — | | | | — | | | | (3,283 | ) | | | — | |
Impairment of Cumbra Peru S.A. (Note 26.ii) | | | (24,169 | ) | | | (937 | ) | | | (828 | ) | | | — | | | | — | | | | — | | | | (24,169 | ) | | | (937 | ) | | | (828 | ) |
Impairment of Viva Negocio Inmobiliario S.A. (Note 26.ii) | | | (19,418 | ) | | | — | | | | — | | | | — | | | | — | | | | — | | | | (19,418 | ) | | | — | | | | — | |
Impairment of other minors (Note 26.ii) | | | — | | | | (27 | ) | | | (59 | ) | | | — | | | | — | | | | — | | | | — | | | | (27 | ) | | | (59 | ) |
Impairment of Cam Holding S.P.A. (Note 28.b) | | | — | | | | — | | | | (12,511 | ) | | | — | | | | — | | | | (12,511 | ) | | | — | | | | — | | | | — | |
Impairment of Concesionaria Vía Expresa Sur S.A. (Note 28.b) | | | — | | | | — | | | | (55,847 | ) | | | — | | | | — | | | | — | | | | — | | | | — | | | | (49,625 | ) |
Impairment of other minors (Note 28.b) | | | — | | | | — | | | | (513 | ) | | | — | | | | — | | | | — | | | | — | | | | — | | | | (513 | ) |
Reversal of impairment (Note 28.b) | | | — | | | | 32 | | | | — | | | | — | | | | — | | | | — | | | | — | | | | 32 | | | | — | |
Write-off | | | 20,083 | | | | — | | | | 12,205 | | | | — | | | | — | | | | 12,530 | | | | 20,083 | | | | — | | | | (325 | ) |
Exchange difference | | | — | | | | 387 | | | | (2,188 | ) | | | — | | | | — | | | | — | | | | — | | | | 387 | | | | (2,188 | ) |
Translations adjustments | | | — | | | | 154 | | | | (180 | ) | | | — | | | | 165 | | | | (184 | ) | | | — | | | | (11 | ) | | | 4 | |
| | | | | | | | | | | | | | | | | | | | | | | | | | | | | | | | | | | | |
Balance at December, 31 | | | (25,567 | ) | | | (30,698 | ) | | | (102,050 | ) | | | — | | | | 165 | | | | — | | | | (25,567 | ) | | | (30,863 | ) | | | (95,828 | ) |
| | | | | | | | | | | | | | | | | | | | | | | | | | | | | | | | | | | | |
| (g) | Consorcio Constructor Ductos del Sur
|
In 2018, it refers to the recognition of debts to subcontractors for S/21.6 million and rights for the collection of a penalty for termination of the contract for S/30.6 million.
AtAs of December 31, this account comprises:
| | | | | | | | |
| | | 2017 | | | 2018 | |
Land | | | 317,337 | | | | 230,689 | |
Work in progress - real estate | | | 150,537 | | | | 135,376 | |
Finished properties | | | 203,209 | | | | 76,027 | |
Construction materials | | | 51,131 | | | | 27,852 | |
Merchandise and supplies | | | 90,504 | | | | 53,310 | |
| | | | | | | | |
| | | 812,718 | | | | 523,254 | |
(-) Impairment of inventories | | | (42,007 | ) | | | (9,207 | ) |
| | | | | | | | |
| | | 770,711 | | | | 514,047 | |
| | | | | | | | |
- 69 -
| | | | | | | | |
| | | 2019 | | | 2020 | |
Land | | | 183,218 | | | | 176,927 | |
Work in progress - Real estate | | | 158,010 | | | | 164,514 | |
Finished properties | | | 86,190 | | | | 78,048 | |
Construction materials | | | 59,879 | | | | 58,621 | |
Merchandise and supplies | | | 77,787 | | | | 80,142 | |
| | | | | | | | |
| | | 565,084 | | | | 558,252 | |
Impairment of inventories | | | (9,683 | ) | | | (6,252 | ) |
| | | | | | | | |
| | | 555,401 | | | | 552,000 | |
| | | | | | | | |
Land
Land comprises properties, net of impairment and includes properties for the implementationdevelopment of the following projects of the subsidiary Viva GyM.Negocio Inmobiliario Viva S.A. As of December 2018,31, 2020, the land impairment provision amounts toequals S/9.21.2 million (nil at 2017)(S/5.2 million in 2019):
| | | | | | | | |
| | | 2017 | | | 2018 | |
Lurin (a) | | | 103,574 | | | | 72,080 | |
San Isidro (b) | | | 58,441 | | | | 49,664 | |
San Miguel (c) | | | 44,126 | | | | 28,811 | |
Nuevo Chimbote (d) | | | 17,201 | | | | 17,262 | |
Barranco (e) | | | 11,413 | | | | 13,585 | |
Huancayo (f) | | | 13,572 | | | | 8,282 | |
Ancon (g) | | | 37,823 | | | | — | |
Canta Callao | | | 12,978 | | | | — | |
Piura | | | — | | | | 8,105 | |
Carabayllo II | | | — | | | | 14,941 | |
Others | | | 18,209 | | | | 8,752 | |
| | | | | | | | |
| | | 317,337 | | | | 221,482 | |
| | | | | | | | |
| | | | | | | | |
| | | 2019 | | | 2020 | |
Lurin (a) | | | 71,902 | | | | 81,493 | |
San Isidro (b) | | | 51,285 | | | | 51,626 | |
Nuevo Chimbote (c) | | | 17,457 | | | | 17,616 | |
Barranco (d) | | | 14,202 | | | | 14,432 | |
Piura (e) | | | 11,805 | | | | 11,760 | |
Carabayllo III | | | 16,567 | | | | — | |
| | | | | | | | |
| | | 183,218 | | | | 176,927 | |
| | | | | | | | |
| (a) | Plot of land of 318107 hectares that corresponds to Inmobiliaria Almonte S.A.C. and a land 210 hectares that corresponds to Inmobiliaria Almonte 2 S.A.C., both lands located in the district of Lurin, province of Lima, destined for the purposes of industrial development and public housing. |
| (b) | A plot of landLand located on David Samanez Ocampo street N° 140 in the district of San Isidro in whichdistrict where a15-story building will be built with 24 apartments and 124 parking spaces.lots will be built.
|
| (c) | Land located in San MiguelChimbote of 1 hectare for the development of a multi-family housing project of 248 apartments and 185 parking lots. |
(d) | Land located in Chimbote, 11.5 hectares for the development of a real estate social housing projectproject.
|
(e)(d) | Land located in Paul Harris St. N°332 and N°336 in Barranco district, for the development of a residential building project. |
(f)(e) | Land located in Huancayo, 8.5 hectaresthe district of Veintiséis de Octubre, province of Piura with an area of 65,096 m2 for the development of a land saleLos Parques de Piura IV project. |
(g) | In Ancon, a large scale housing-project was terminated and the subsidiary Viva GyM reclassified to accounts receivable from Ministry of Housing.
|
Land properties correspond to assets maintained since 2015, for which construction has not yet begun. Variance in these balances over 2018 is mainly due to engineering, license paperwork, and other smaller costs. Construction in these land properties is expected to begin in late 2019 and the second half of 2020.
Real estate - work in progress
AtAs of December 31, real state work in progress comprises the following projects:
| | | | 2017 | | | 2018 | | | 2019 | | | 2020 | |
Los Parques de Comas | | | 70,647 | | | | 69,743 | | | | 77,757 | | | | 66,114 | |
Los Parques del Callao | | | 53,441 | | | | 46,697 | | | | 35,549 | | | | 26,613 | |
Villa El Salvador 2 | | | 2,141 | | | | — | | |
Los Parques de Piura | | | | 5,658 | | | | 9,514 | |
Los Parques del Mar | | | | 32,183 | | | | 44,683 | |
Los Parques de Carabayllo III | | | | — | | | | 10,266 | |
Inmobiliaria Pezet 417 S.A.C. | | | | 4,091 | | | | 4,459 | |
Others | | | 24,308 | | | | 18,936 | | | | 2,772 | | | | 2,865 | |
| | | | | | | | | | | | |
| | | 150,537 | | | | 135,376 | | | | 158,010 | | | | 164,514 | |
| | | | | | | | | | | | |
During 20182020, the GroupCorporation has capitalized financing costs of these construction projects (Note 2.20)2.21) amounting to S/7.93.8 million at annual interest rates between 7.0%7% and 12.0%11% (S/5.93.7 million in 20172019 at interest rates between 7.0%7% and 11.22%12%).
- 70 -
Finished properties
AtAs of December 31, the balance of finished properties consists of the following investment properties:
| | | | 2017 | | | 2018 | | | 2019 | | | 2020 | |
El Rancho | | | 82,796 | | | | 19,314 | | |
Panorama | | | 18,481 | | | | — | | |
Los Parques de Comas | | | | 37,605 | | | | 32,098 | |
Los Parques de Callao | | | | 10,914 | | | | 14,479 | |
Huancayo | | | | 19,672 | | | | 13,033 | |
Los Parques de Carabayllo III | | | | 168 | | | | 8,518 | |
Strip Callao | | | | — | | | | 6,286 | |
El Nuevo Rancho | | | | 4,060 | | | | 1,284 | |
Los Parques de Piura | | | | 6,050 | | | | 1,034 | |
Klimt | | | | 5,978 | | | | — | |
Los Parques de San Martín de Porres | | | 16,687 | | | | 4,029 | | | | 903 | | | | — | |
Los Parques de Callao | | | 486 | | | | 389 | | |
Rivera Navarrete | | | 7,870 | | | | 4,053 | | |
Los Parques de Carabayllo 2da etapa | | | 3,134 | | | | 942 | | |
Los Parques de Comas | | | 16,058 | | | | 18,785 | | |
Los Parques de Villa El Salvador II | | | 9,313 | | | | 4,277 | | |
Klimt | | | 44,103 | | | | 5,911 | | |
Real 2 | | | 3,877 | | | | 556 | | |
Huancayo | | | — | | | | 15,546 | | |
Others | | | 404 | | | | 2,225 | | | | 840 | | | | 1,316 | |
| | | | | | | | | | | | |
| | | 203,209 | | | | 76,027 | | | | 86,190 | | | | 78,048 | |
| | | | | | | | | | | | |
As of December 31, 2020, the balance of finished properties is net of an impairment of S/3.8 million (S/4.5 million as of December 31, 2019).
Construction materials
AtAs of December 31, 2018,2020, the construction materials correspond mainly to different projects of the subsidiary GyMCumbra Peru S.A. for S/27.853.1 million (Stracon GyM S.A., Morelco S.A., and GyM(Cumbra Peru S.A. for S/5056.2 million atas of December 31, 2017)2019).
1615 | INVESTMENTS IN ASSOCIATES AND JOINT VENTURES |
AtAs of December 31, this account comprises:
| | | | 2017 | | | 2018 | | | 2019 | | | 2020 | |
Associates | | | 250,053 | | | | 250,282 | | | | 28,875 | | | | 27,246 | |
Joint ventures | | | 18,618 | | | | 7,483 | | | | 8,160 | | | | 8,270 | |
| | | | | | | | | | | | |
| | | 268,671 | | | | 257,765 | | | | 37,035 | | | | 35,516 | |
| | | | | | | | | | | | |
The amounts recognized in the income statement as the value of the equity interest are as follows:
| | | | | | | | |
| | | 2017 | | | 2018 | |
Associates | | | (5,566 | ) | | | (5,308 | ) |
Joint ventures | | | 6,039 | | | | 1,599 | |
| | | | | | | | |
| | | 473 | | | | (3,709 | ) |
| | | | | | | | |
- 71 -
| | | | | | | | |
| | | 2019 | | | 2020 | |
Associates | | | (220,993 | ) | | | (1,635 | ) |
Joint ventures | | | 2,219 | | | | 2,405 | |
| | | | | | | | |
| | | (218,774 | ) | | | 770 | |
| | | | | | | | |
| | a) | Investment in associates |
Set out in the table below are the associates of the Group atCorporation as of December 31, 2017,2019 and 2018. The2020 the associates listed below have share capital solely consisting of common shares, which are held directly by the Group.Corporation. None of the associates are listed companies; therefore, there is no quoted market price available for their shares.
| | | | | | | | | | | | | | | | | | | | |
| | | | | | | | | | | | Carrying amount | |
| | | Class | | | Interest in capital | | | At December 31, | |
Entity | | of share | | | 2017 | | | 2018 | | | 2017 | | | 2018 | |
| | | | | | % | | | % | | | | | | | |
Gasoducto Sur Peruano S.A. | | | Common | | | | 21.49 | | | | 21.49 | | | | 218,276 | | | | 218,276 | |
Concesionaria Chavimochic S.A.C. | | | Common | | | | 26.50 | | | | 26.50 | | | | 22,091 | | | | 20,524 | |
Betchel Vial y Vives Servicios Complementarios Ltda. | | | Common | | | | 40.00 | | | | 40.00 | | | | 102 | | | | 94 | |
Others | | | | | | | | | | | | | | | 9,584 | | | | 11,388 | |
| | | | | | | | | | | | | | | | | | | | |
| | | | | | | | | | | | | | | 250,053 | | | | 250,282 | |
| | | | | | | | | | | | | | | | | | | | |
| | | | | | | | | | | | | | | | | | | | |
| | | | | | | | | | | | Carrying amount | |
| | | | | | Interest in capital | | | At December 31, | |
Entity | | Class
of share | | | 2019 | | | 2020 | | | 2019 | | | 2020 | |
| | | | | | % | | | % | | | | | | | |
Gasoducto del Peru S.A. ( * ) | | | Common | | | | — | | | | — | | | | — | | | | — | |
Concesionaria Chavimochic S.A.C. | | | Common | | | | 26.50 | | | | 26.50 | | | | 18,320 | | | | 18,058 | |
Peru Piping Spools S.A.C. | | | Common | | | | 33.33 | | | | 33.33 | | | | 4,166 | | | | 2,760 | |
Obratres S.A.C. | | | Common | | | | 37.50 | | | | 37.50 | | | | 3,756 | | | | 3,812 | |
Inversiones Maje S.A.C. | | | Common | | | | 9.59 | | | | 9.59 | | | | 2,306 | | | | 2,283 | |
Otros | | | Common | | | | | | | | | | | | 327 | | | | 333 | |
| | | | | | | | | | | | | | | | | | | | |
| | | | | | | | | | | | | | | 28,875 | | | | 27,246 | |
| | | | | | | | | | | | | | | | | | | | |
| (*) | Mainly corresponds to an write-off of the investment in Gasoducto Sur Peruano S.A. as a whole. |
The movement of the investments in associates is as follows:
| | | | | | | | | | | | |
| | | 2018 | | | 2019 | | | 2020 | |
Opening balance | | | 250,053 | | | | 250,282 | | | | 28,875 | |
Contributions received | | | 5,616 | | | | — | | | | — | |
Equity interest in results | | | (5,308) | | | | (220,993) | | | | (1,635) | |
Decrease in capital | | | (30) | | | | — | | | | — | |
Impairment of investment | | | — | | | | (374) | | | | (38) | |
Conversion adjustment | | | (49) | | | | (40) | | | | 44 | |
| | | | | | | | | | | | |
Final balance | | | 250,282 | | | | 28,875 | | | | 27,246 | |
| | | | | | | | | | | | |
The most significant associates are described as follows:
| | i) | Gasoducto Sur Peruano S.A. |
In November 2015, the groupCorporation acquired a 20% interest in Gasoducto Sur Peruano (hereafterS.A. (hereinafter “GSP”) and obtained a 29% interest in Consorcio Constructor Ductos del Sur (CCDS)(hereinafter “CCDS”) through its subsidiary GyMCumbra Peru S.A. GSP signed on July 22, 2014, a concession contract with the Peruvian Government (Grantor) to build, operate and maintain the pipelines transportation system of natural gas to meet the demand of cities in the Peruvian southern region.south of Peru (hereinafter, the “Concession Contract”). Additionally, GSP signed an engineering, procurement, and construction (EPC) contract with CCDS. The GroupCorporation made an investment of US$242.5 million (S/819 million) and was required to assume 20% of the performance guarantee established in the concession contract for US$262.5 million (equivalent to S/887 million) and 21.49% of the guarantee for a bridge loan obtained by GSP of US$600 million (equivalent to S/2,027 million).million.
Early termination of the Concession Agreement
On January 24, 2017 the Ministry of Energy and Mining (MEM)Mines (hereinafter “MEM”) notified the early termination of the Concession Contract under its clause 6.7 based on the provisions of clause 6.7GSP’s failure to provide evidence of the concession agreement “Improvements to the country’s energy security and development of the South Peru Gas Pipeline”, as GSP failed to certify theproject’s financial closing within the established contractual deadline and proceeded to the immediate executionenforcement of the performance guarantee. This situation generated the executionenforcement of the collaterals offeredguarantees provided by the GroupCompany for US$52.5 million (S/177.4 million nominal value)value and US$129 million (S/435.9 million nominal value) for the corporate guarantee of thevalue to secure GSP’s obligation with its lenders under a bridge loan granted to GSP.it. Under the concession agreement,Concession Agreement, the guarantees were paid by the Company on behalf of GSP, therefore the Company recognized a right to collect offrom GSP an amount equal to US$181.5 million (S/613.3 million nominal value) and itvalue that was recorded in 2016 as accounts receivable from related parties. (Note 13)
On October 11, 2017, GSP and MEM entered into an agreement to deliver the delivery of the assets of GSP was formalized by agreement with MEM. As stated in the agreement, in December 2017, GSP substantially finalized the process of delivery of the concession’s assetsconcession asset pursuant to the administrator designated by the MEM for its custody and conservation. TheConcession Agreement. These assets includeincluded all the works, equipment, facilities and facilities providedengineering studies needed for the executiondevelopment of the project, as well as the engineering studies that were prepared by the concessionaire.project.
After the termination of the contract,Concession Contract, the Peruvian Government had the obligation to apply Clause 20 of the contract, having to appointshould have appointed a recognized international audit firm to calculate the Net Book Value (“VCN” for its Spanish definition “Valor Contable Neto”)net book value of the concession assets (hereinafter “VCN”) and the subsequent call forconducted up to three public auctions being the base amount for the first of them 100% of the VCN, guaranteeing in any case that after the third auction, in case theGSP concession has not been awarded, the paymentpursuant to GSP would be at least 72.25%clause 20 of the VCN. Having elapsed more than a year since the terminationConcession Agreement. However, as of the contract,date hereof, the Peruvian Government has not taken any actioncontinues to calculatebe in breach of such contractual obligation. An independent audit firm engaged by GSP calculated the VCN or call for auctions. In the opinion of the external and internal legal advisors, since the previous procedure had not been completed within the established deadlines, the Peruvian Government would be obliged to pay GSP 100% of the VCN. Regarding the amount of the VCN, there is a previous calculation commissioned by GSP and reviewed by an independent audit firmequal US$2,602 million as of December 31, 2016, determining a VCN of US$2,602 million.2016.
- 72 -
As ofOn December 4, 2017, GSP entered into a bankruptcy proceeding that will be carried out bybefore the National Institute for the Defense of Competition and Intellectual Protection of Peru (hereinafter, INDECOPI).Peru. The GroupCorporation registered a claim for accounts receivable for US$0.4 million (S/1.4 million) and the fiduciary as administratoran additional accounts receivable of US$169.3 million that is held in trust in benefit of the accounts receivable for US$169.3 million (S/572.1 million).Company’s creditors. The process is in the debt recognition stage to determine the parties who will be entitled to participate in the Creditors’ Meeting.Assembly to convoked under the mentioned bankruptcy proceeding.
On December 21, 2018, the Company. submitted to the Peruvian Government a request for direct negotiations demanding the payment of the VCN in favor of GSP therefore, commencing the cool off period under the Concession Contract. This request is based on the right that creditors have under article 1219 of the Peruvian Civil Code to initiate actions against its debtor’s debtors that the former to collect a credit that would allow the payment of the outstanding debt. Upon the conclusion of the contractual cool off period, the Company filed on October 18, 2019 a request for arbitration before CIADI. The Company withdrew its request for arbitration on December 27 of the same year the preliminary plea bargain agreement entered on the same date by the Company with the Prosecutor and the Ad hoc State Counsel (Note 1).
The fair value of the investment in GSP, as Corporate associate, is based on the amount of the VCN, taking into consideration the payments anticipated in the insolvency proceedings, the subordination contracts and the loan cessionassignment agreements betweenentered into by the GroupCompany and GSP partners.its partners in the project. Based on management’s estimate of such payments, an impairment of the investment was determinedvalue for US$175.5220 million (S/593.0739 million), corresponding to the year end 2019 US$65 million (S/218 million). In addition, according to the conclusions of internal and external legal advisors, international arbitration will be required to receive the payment from the Government. The estimated time frame for international arbitration is five years. Therefore, managementManagement has applied, a discount in 2016at the consolidated financial statements of the company, an impairment of US$81.5 million (S/276 million) to the long-term account receivable from GSP, and also discount under the amortized cost for US$17 million (S/58 million). In addition, write-offof US$22.854 million (S/77180 million). was made over the deferred tax asset. These two effects amounted to US$199.3163.5 million (S/670552 million) before taxes recorded in the income statement for the year ended December 31, 2016.2019 and US$54 million (S/180 million) related to income tax expense.
In addition, onAs of December 31, 2016,2020, the Group evaluated the impairmentfair value of the assets of CCDS. As a result, a net loss before taxes of S/15.2 millioninvestment in GSP was determined (Noteto be US$88.6 million, equivalent to S/320 million (as of December 31, 2019 US$83 million, equivalent to S/275 million), the Corporation’s management maintains the 5.1-f)8-year investment recovery estimate; however, it has updated the discount rate used in its estimates from 3.43% to 1.6%, resulting in an amortized cost discounting gain of US$5.4 million (S/22.8 million).
In the opinion of our internal and external legal advisors, the obligation ofany proceeds received by GSP from the Peruvian Government derived from the former’s obligation to GSP equivalent toreimburse the VCN of the concession’sconcession assets iswould not within the scope of thebe subject to retention provided for inunder Law 30737 since this payment does not include a net profit margin, nor does it correspond to the sale of assets.
On December 21, 2018, Graña y Montero S.A.A. submitted toSuch withdrawal does not imply the Peruvian Government a request for direct negotiations towards the paymentloss of the VCNCompany’s right of collection against GSP nor does it restrict, limit or obstruct the possibility that GSP has of exercising its rights against the Government in favor of GSP. This request is based on the right that any creditor has to initiate the actions that its debtor does not take in order to collect a credit that would allow it to pay its debt, by virtue of article 1219 of the Peruvian Civil Code. After the term of six months since the beginning of direct negotiations, Graña y Montero S.A.A. under the same title may demand the payment from the Peruvian Government through arbitration to the CIADI (Centro Internacional de Arreglo de Diferencias Relativas a Inversiones).future.
| | ii) | Concesionaria Chavimochic S.A.C. |
The entity was awarded the implementationconcesion of the Chavimochic irrigation project, including a) design and construction of the work required for the third-phasethird phase of the Chavimochic irrigation project in the province of La Libertad; b) operation and maintenance of works; and c) water supply to the Project users. Construction activities started in 2015; the effective concession period is 25 years, and the total investment amounts was estimated in US$647 million.
The civil works of the third stage of the Chavimochic Irrigation Project were structured in two phases. To date, the works of the first phase (Palo Redondo Dam) are 70% complete.completed. However, at the beginning of 2017, the procedure for early termination of the Concession Contract was initiated due to the breach of contract by the Grantor, and all activities were suspended in December 2017. Not havingDue to the fact that no agreement was reached, the Concessionaire initiated an agreement, the arbitration process was initiated beforeat the CNUDI, andUNCID. The arbitration proceedings are suspended, as a consequence of the Arbitral Tribunal was installed.of the National Emergency.
Moreover, duringfrom 2018 to date, the Grantor initiated Peruvian Government (“the procedure of negotiation and commencement ofGrantor”) has been evaluating the modification of the Concession Contract, in order to determine a mechanism that would allow restarting the executioncompletion of the project, without satisfactory resolution as of to date.
Finally, the Grantor and the Ministry of Agriculture and Irrigation (MINAGRI), and the Chavimochic Special Project, have signed an Agreement in order to allow MINAGRI to subrogate the ownership of the Project, within the framework of the provisions of the Emergency Decree N ° 021-2020.
- 73 -
The following table shows the financial information of the principal associates:
Summarized financial information for associates –
| | | | | | | | | | | | |
| | | Gasoducto Sur
Peruano S.A. | | | Concesionaria
Chavimochic S.A.C. | |
| | | At December, 31 | | | At December, 31 | |
Entity | | 2017 | | | 2017 | | | 2018 | |
| | | Liquidation Base | | | | | | | |
Current | | | | | | | | | | | | |
Assets | | | 6,813,938 | | | | 73,004 | | | | 66,052 | |
Liabilities | | | (5,028,381 | ) | | | (1,111 | ) | | | (2,183 | ) |
| | | |
Non-current | | | | | | | | | | | | |
Assets | | | — | | | | 11,809 | | | | 13,580 | |
Liabilities | | | — | | | | (342 | ) | | | — | |
| | | | | | | | | | | | |
Net assets | | | 1,785,557 | | | | 83,360 | | | | 77,449 | |
| | | | | | | | | | | | |
| | |
Entity | | Gasoducto Sur
Peruano S.A. | | | Concesionaria
Chavimochic S.A.C. | |
| | | 2017 | | | 2017 | | | 2018 | |
Revenues | | | | | | | — | | | | — | |
Loss from continuing operations | | | | | | | (43,340 | ) | | | (8,455 | ) |
Income tax | | | — | | | | 3,185 | | | | 2,543 | |
| | | | | | | | | | | | |
Loss from continuing operations after income tax | | | — | | | | (40,155 | ) | | | (5,912 | ) |
| | | | | | | | | | | | |
Other comprehensive loss | | | — | | | | — | | | | — | |
| | | | | | | | | | | | |
Total comprehensive loss | | | — | | | | (40,155 | ) | | | (5,912 | ) |
| | | | | | | | | | | | |
The movement of the investments in associates is as follows:
| | | | | | | | |
| | | Concesionaria
Chavimochic S.A.C. | |
| | | At December, 31 | |
Entity | | 2019 | | | 2020 | |
Current | | | | | | | | |
Assets | | | 55,830 | | | | 58,814 | |
Liabilities | | | (1,596 | ) | | | (4,795 | ) |
Non-current | | | | | | | | |
Assets | | | 12,408 | | | | 11,635 | |
| | | | | | | | |
Net assets | | | 66,642 | | | | 65,654 | |
| | | | | | | | |
| | | | | | | | | | | | |
| | | 2016 | | | 2017 | | | 2018 | |
Opening balance | | | 490,702 | | | | 286,403 | | | | 250,053 | |
Contributions received | | | 390,506 | | | | 2,116 | | | | 5,616 | |
Impairment of GSP | | | (593,101 | ) | | | — | | | | — | |
Dividends received | | | (10,149 | ) | | | (259 | ) | | | — | |
Equity interest in results | | | 8,304 | | | | (5,566 | ) | | | (5,308 | ) |
Decrease in capital | | | (166 | ) | | | (111 | ) | | | (30 | ) |
Disposal of Investment | | | — | | | | (32,223 | ) | | | — | |
Conversion adjustment | | | 311 | | | | 42 | | | | (49 | ) |
Discontinued operations | | | (4 | ) | | | (349 | ) | | | — | |
| | | | | | | | | | | | |
Final balance | | | 286,403 | | | | 250,053 | | | | 250,282 | |
| | | | | | | | | | | | |
In 2017, the sale of investments referred to the purchase-sale contract subscribed by the subsidiary VIVA GyM S.A. for the total of shares (representing 22.5%) of the associate Promocion Inmobiliaria del Sur S.A. The sale price was agreed in US$25 million (equivalent to S/81 million), which was fully paid.
- 74 -
| | | | | | | | |
| | | Concesionaria
Chavimochic S.A.C. | |
Entity | | 2019 | | | 2020 | |
Administrative expenses | | | (11,028 | ) | | | (4,521 | ) |
| | | | | | | | |
Loss operative | | | (11,028 | ) | | | (4,521 | ) |
Others | | | (719 | ) | | | 3,534 | |
| | | | | | | | |
Loss of the year | | | (11,747 | ) | | | (987 | ) |
| | | | | | | | |
Total comprehensive loss | | | (11,747 | ) | | | (987 | ) |
| | | | | | | | |
During 2016, cash contributions were mainly made to Gasoducto Sur Peruano S.A. and Concesionaria Chavimochic amounting to S/373.9 million and S/15.7 million, respectively.
In 2016 the Group obtained dividends mainly from Bechtel Vial y Vives and Promocion Inmobiliaria del Sur S.A. amounting to S/6.3 million and S/3.8 million, respectively.
In 2016, the Group included an impairment provision of GSP for S/593.1 million (US$176.49 million).
| | b) | Investment in Joint Ventures |
Set out below are the joint ventures of the GroupCorporation as of December 31:
| | | | | | | | | | | | | | | | | | | | |
| | | | | | | | | | | | Carrying amount | |
| | | Class | | | Interest in capital | | | At December 31, | |
Entity | | of share | | | 2017 | | | 2018 | | | 2017 | | | 2018 | |
| | | | | | % | | | % | | | | | | | |
Sistemas SEC | | | Common | | | | 49.00 | | | | — | | | | 10,112 | | | | — | |
Logistica Químicos del Sur S.A.C. | | | Common | | | | 50.00 | | | | 50.00 | | | | 7,343 | | | | 7,230 | |
G.S.J.V. SCC | | | Common | | | | 50.00 | | | | 50.00 | | | | 878 | | | | — | |
ConstructoraSK-VyV Ltda. | | | Common | | | | 50.00 | | | | 50.00 | | | | 49 | | | | 34 | |
Others | | | | | | | — | | | | — | | | | 236 | | | | 219 | |
| | | | | | | | | | | | | | | | | | | | |
| | | | | | | | | | | | | | | 18,618 | | | | 7,483 | |
| | | | | | | | | | | | | | | | | | | | |
| | | | | | | | | | | | | | | | | | |
| | | | | | | | | | | Carrying amount | |
| | | Class | | | Interest in capital | | | At December 31, | |
Entity | | of share | | | 2019 | | 2020 | | | 2019 | | | 2020 | |
| | | | | | % | | % | | | | | | | |
Logistica Quimicos del Sur S.A.C. | | | Common | | | 50.00 | | | 50.00 | | | | 8,006 | | | | 8,080 | |
Constructora SK-VyV Ltda. | | | Common | | | 50.00 | | | 50.00 | | | | 29 | | | | 34 | |
Others | | | | | | — | | | — | | | | 125 | | | | 156 | |
| | | | | | | | | | | | | | | | | | |
| | | | | | | | | | | | | 8,160 | | | | 8,270 | |
| | | | | | | | | | | | | | | | | | |
This entity provides operation and maintenance services for hydrocarbon pipelines and related activities, it concentrates its activities substantially in fulfilling the obligations arising from the operation and maintenanceThe movement of the pipeline gas transport system related to the concession contract for Gas Concession Peru S.A.A. (TGP, its main client). In April 2017, the Company entered into a purchase-sale contract for all of its shares (representing 51%)investments in the investment in a joint venture with Compañia Operadora del Gas del Amazonas S.A.C. (COGA). The sale priceventures was agreed at US$21.5 million (equivalent to S/69.8), which is fully paid.as follows:
The company’s activities include the renovation and automation of the electrical system and signaling of railways and communications within the Santiago - Chillan - Bulnes - Caravans and Conception areas. The contract was awarded in 2005 for a period of 16 years. In December 2018, the SEC contract was transferred to Engie S.A. as part of the CAM Group investment sale (Note 37).
- 75 -
| | | | | | | | | | | | |
| | | 2018 | | | 2019 | | | 2020 | |
Opening balance | | | 18,618 | | | | 7,483 | | | | 8,160 | |
Equity interest in results | | | 1,599 | | | | 2,219 | | | | 2,405 | |
Disposal of Investment | | | (10,112 | ) | | | — | | | | — | |
Dividends received | | | (1,823 | ) | | | (1,517 | ) | | | (2,318 | ) |
Conversion adjustment | | | 79 | | | | (14 | ) | | | 23 | |
Impairment of investment | | | (878 | ) | | | (11 | ) | | | — | |
| | | | | | | | | | | | |
Final balance | | | 7,483 | | | | 8,160 | | | | 8,270 | |
| | | | | | | | | | | | |
The following table shows the financial information of the principal joint ventures:
Summarized financial information for joint ventures
| | | | Logistica Quimicos del Sur S.A.C. | | | At December, 31 | |
| | | At December, 31 | | |
Entity | | 2017 | | | 2018 | | |
Logistica Quimicos del Sur S.A.C. | | | 2019 | | | 2020 | |
Current | | | | | | | | |
Cash and cash equivalents | | | 2,076 | | | | 1,520 | | | | 2,131 | | | | 2,710 | |
Other current assets | | | 1,652 | | | | 1,549 | | | | 2,416 | | | | 3,324 | |
| | | | | | | | | | | | |
Total current assets | | | 3,728 | | | | 3,069 | | | | 4,547 | | | | 6,034 | |
| | | | | | | | | | | | |
Other current liabilities | | | (3,104 | ) | | | (3,513 | ) | | | (4,381 | ) | | | (6,108 | ) |
| | | | | | | | | | | | |
Total current liabilities | | | (3,104 | ) | | | (3,513 | ) | | | (4,381 | ) | | | (6,108 | ) |
| | | | | | | | | | | | |
Non-current | | | | | | | | |
Totalnon-current assets | | | 39,327 | | | | 37,349 | | | | 37,620 | | | | 35,715 | |
Total non-current liabilities | | | | (21,773 | ) | | | (19,484 | ) |
| | | | | | | | | | | | |
Net assets | | | 14,267 | | | | 14,904 | | | | 16,013 | | | | 16,157 | |
| | | | | | | | | | | | |
| Revenues | | | 10,750 | | | | 11,399 | | |
Revenue | | | | 12,622 | | | | 13,351 | |
Depreciation and amortization | | | (2,039 | ) | | | (2,313 | ) | | | (2,505 | ) | | | (2,394 | ) |
Interest expense | | | (675 | ) | | | (668 | ) | | | (644 | ) | | | (508 | ) |
| | | | | | | | | | | | |
Profit from continuing operations | | | 4,988 | | | | 4,698 | | | | 6,500 | | | | 6,854 | |
Income tax expense | | | (1,614 | ) | | | (1,482 | ) | | | (1,913 | ) | | | (2,072 | ) |
| | | | | | | | | | | | |
Profit from continuing operations after income tax | | | 3,374 | | | | 3,216 | | | | 4,587 | | | | 4,782 | |
| | | | | | | | | | | | |
Other comprehensive income | | | — | | | | — | | |
| | | | | | | |
Total comprehensive income | | | 3,374 | | | | 3,216 | | | | 4,587 | | | | 4,782 | |
| | | | | | | | | | | | |
The movement of the investments in joint ventures was as follows:
| | | | | | | | | | | | |
| | | 2016 | | | 2,017 | | | 2,018 | |
Opening balance | | | 146,303 | | | | 103,356 | | | | 18,618 | |
Equity interest in results | | | (5,269 | ) | | | 6,039 | | | | 1,599 | |
Debt capitalization | | | 8,308 | | | | — | | | | — | |
Contributions received | | | 6,889 | | | | — | | | | — | |
Transfer to Adexus from acquisition of control | | | (35,870 | ) | | | — | | | | — | |
Disposal of Investment | | | — | | | | (88,556 | ) | | | (10,112 | ) |
Dividends received | | | (17,843 | ) | | | (3,758 | ) | | | (1,823 | ) |
Conversion adjustment | | | 2,276 | | | | 334 | | | | 79 | |
Write-off of Investment | | | (1,798 | ) | | | — | | | | (878 | ) |
Discontinued operations | | | 360 | | | | 1,203 | | | | — | |
| | | | | | | | | | | | |
Final balance | | | 103,356 | | | | 18,618 | | | | 7,483 | |
| | | | | | | | | | | | |
In 2018, 2017 and 2016 the following significant movements were carried out:
The Group obtainedCorporation received dividends in 20182020 from LogisticaLogística Quimicos del Sur S.A. for S/2.3 million (S/1.5 million in 2019 and S/1.8 million (from Consorcio Sistemas SEC for S/1 million and from Logistica Quimicos del Sur S.A. for S/2.8 million in 2017 and S/13.1 million and S/3.3 million from G.S.J.V. in 2016)2018).
On April 24, 2017, the Company signed a purchase-sale agreement for their total capital stock (representing 51%) held in their joint venture with Compañia Operadora de Gas del Amazonas S.A.C. (COGA). The selling price was agreed at US$21.5 million (equivalent to S/69.8 million), which was fully paid.
In February 2016 the Group acquired 8% of additional interest by capitalizing debt for S/8.3 million. In August 2016, the Group obtained control over Adexus S.A. The balance of the investment at that date was transferred to investments in subsidiaries for S/35.9 million. From that date, the Company consolidated the financial statements of Adexus S.A.(Note 33-a).
- 76 -
1716 | PROPERTY, PLANT AND EQUIPMENT, NET AND RIGHT— OF— USE ASSETS |
| 16.1. | PROPERTY, PLANT AND EQUIPMENT |
The movement in property, plant and equipment accounts and its related accumulated depreciation for the year ended December 31, 2016, 20172018, 2019 and 20182020 is as follows:
| | | | | | | | | | | | | | | | | | | | | | | | | | | | | | | | | | | | | | | | |
| | | Land | | | Buildings | | | Machinery | | | Vehicles | | | Furniture
and
fixtures | | | Other
equipment | | | Replacement
units | | | In-transit
units | | | Work in
progress | | | Total | |
At January 1, 2016 | | | | | | | | | | | | | | | | | | | | | | | | | | | | | | | | | | | | | | | | |
Cost | | | 28,409 | | | | 231,029 | | | | 1,074,195 | | | | 443,239 | | | | 52,225 | | | | 191,238 | | | | 15,448 | | | | 1,817 | | | | 13,044 | | | | 2,050,644 | |
Accumulated depreciation and impairment | | | — | | | | (41,464 | ) | | | (509,510 | ) | | | (222,353 | ) | | | (31,048 | ) | | | (134,508 | ) | | | (4 | ) | | | — | | | | — | | | | (938,887 | ) |
| | | | | | | | | | | | | | | | | | | | | | | | | | | | | | | | | | | | | | | | |
Net carrying amount | | | 28,409 | | | | 189,565 | | | | 564,685 | | | | 220,886 | | | | 21,177 | | | | 56,730 | | | | 15,444 | | | | 1,817 | | | | 13,044 | | | | 1,111,757 | |
| | | | | | | | | | | | | | | | | | | | | | | | | | | | | | | | | | | | | | | | |
Net initial carrying amount | | | 28,409 | | | | 189,565 | | | | 564,685 | | | | 220,886 | | | | 21,177 | | | | 56,730 | | | | 15,444 | | | | 1,817 | | | | 13,044 | | | | 1,111,757 | |
Additions | | | 6,238 | | | | 12,126 | | | | 81,378 | | | | 50,574 | | | | 4,423 | | | | 24,870 | | | | 553 | | | | 19,312 | | | | 13,594 | | | | 213,068 | |
Adquisition of subsidiaries - Adexus (Note 33 a) | | | — | | | | 13,913 | | | | — | | | | 420 | | | | 1,525 | | | | 26,130 | | | | — | | | | — | | | | — | | | | 41,988 | |
Reclassifications | | | — | | | | (281 | ) | | | 4,423 | | | | (1,639 | ) | | | 4,547 | | | | 14,338 | | | | 2,583 | | | | (17,349 | ) | | | (6,622 | ) | | | — | |
Transfers to inventories | | | 2,941 | | | | — | | | | — | | | | — | | | | — | | | | — | | | | — | | | | — | | | | — | | | | 2,941 | |
Transfers to intangibles
(Note 18) | | | — | | | | — | | | | — | | | | — | | | | — | | | | — | | | | — | | | | — | | | | (1,257 | ) | | | (1,257 | ) |
Deduction for sale of assets | | | (5,256 | ) | | | (14,333 | ) | | | (60,374 | ) | | | (48,521 | ) | | | (1,724 | ) | | | (5,766 | ) | | | — | | | | — | | | | — | | | | (135,974 | ) |
Disposals, net | | | — | | | | (1,232 | ) | | | (15,149 | ) | | | (1,354 | ) | | | (1,579 | ) | | | (4,364 | ) | | | (661 | ) | | | (2 | ) | | | — | | | | (24,341 | ) |
Depreciation charge | | | — | | | | (14,842 | ) | | | (104,638 | ) | | | (48,041 | ) | | | (7,548 | ) | | | (28,127 | ) | | | (5 | ) | | | — | | | | — | | | | (203,201 | ) |
Impairment loss | | | — | | | | (73 | ) | | | (5,190 | ) | | | (317 | ) | | | (3,301 | ) | | | (382 | ) | | | — | | | | — | | | | — | | | | (9,263 | ) |
Depreciation for sale deductions | | | — | | | | 8,113 | | | | 48,266 | | | | 29,536 | | | | 1,026 | | | | 1,907 | | | | — | | | | — | | | | — | | | | 88,848 | |
Disposals - accumulated depreciation | | | — | | | | 2,010 | | | | 14,165 | | | | 1,353 | | | | 1,449 | | | | 2,809 | | | | — | | | | — | | | | — | | | | 21,786 | |
Translations adjustments | | | 282 | | | | 130 | | | | 5,987 | | | | 922 | | | | 176 | | | | (344 | ) | | | — | | | | — | | | | 94 | | | | 7,247 | |
| | | | | | | | | | | | | | | | | | | | | | | | | | | | | | | | | | | | | | | | |
Net final carrying amount | | | 32,614 | | | | 195,096 | | | | 533,553 | | | | 203,819 | | | | 20,171 | | | | 87,801 | | | | 17,914 | | | | 3,778 | | | | 18,853 | | | | 1,113,599 | |
| | | | | | | | | | | | | | | | | | | | | | | | | | | | | | | | | | | | | | | | |
At December 31, 2016 | | | | | | | | | | | | | | | | | | | | | | | | | | | | | | | | | | | | | | | | |
Cost | | | 32,614 | | | | 241,352 | | | | 1,090,460 | | | | 443,641 | | | | 59,593 | | | | 246,102 | | | | 17,923 | | | | 3,778 | | | | 18,853 | | | | 2,154,316 | |
Accumulated depreciation and impairment | | | — | | | | (46,256 | ) | | | (556,907 | ) | | | (239,822 | ) | | | (39,422 | ) | | | (158,301 | ) | | | (9 | ) | | | — | | | | — | | | | (1,040,717 | ) |
| | | | | | | | | | | | | | | | | | | | | | | | | | | | | | | | | | | | | | | | |
Net carrying amount | | | 32,614 | | | | 195,096 | | | | 533,553 | | | | 203,819 | | | | 20,171 | | | | 87,801 | | | | 17,914 | | | | 3,778 | | | | 18,853 | | | | 1,113,599 | |
| | | | | | | | | | | | | | | | | | | | | | | | | | | | | | | | | | | | | | | | |
- 77 -
| | | | | | | | | | | | | | | | | | | | | | | | | | | | | | | | | | | | |
| | | Land | | | Buildings | | | Machinery | | | Vehicles | | | Furniture
and
fixtures | | | Other
equipment | | | Replacement
and in—
transit units | | | Work in
progress | | | Total | |
At January 1, 2018 | | | | | | | | | | | | | | | | | | | | | | | | | | | | | | | | | | | | |
Cost | | | 23,951 | | | | 161,057 | | | | 995,155 | | | | 380,503 | | | | 63,727 | | | | 195,142 | | | | 22,938 | | | | 28,713 | | | | 1,871,186 | |
Accumulated depreciation and impairment | | | (273 | ) | | | (48,498 | ) | | | (562,333 | ) | | | (198,720 | ) | | | (48,832 | ) | | | (146,433 | ) | | | (10 | ) | | | (352 | ) | | | (1,005,451 | ) |
| | | | | | | | | | | | | | | | | | | | | | | | | | | | | | | | | | | | |
Net carrying amount | | | 23,678 | | | | 112,559 | | | | 432,822 | | | | 181,783 | | | | 14,895 | | | | 48,709 | | | | 22,928 | | | | 28,361 | | | | 865,735 | |
| | | | | | | | | | | | | | | | | | | | | | | | | | | | | | | | | | | | |
Net initial carrying amount | | | 23,678 | | | | 112,559 | | | | 432,822 | | | | 181,783 | | | | 14,895 | | | | 48,709 | | | | 22,928 | | | | 28,361 | | | | 865,735 | |
Additions (i) | | | — | | | | 13,216 | | | | 11,318 | | | | 9,377 | | | | 2,145 | | | | 14,122 | | | | 5,577 | | | | 27,431 | | | | 83,186 | |
Desconsolidation, net | | | (3,183 | ) | | | (24,295 | ) | | | (109,425 | ) | | | (110,540 | ) | | | (547 | ) | | | (10,421 | ) | | | — | | | | (715 | ) | | | (259,126 | ) |
Reclassifications | | | — | | | | 17,129 | | | | 16,626 | | | | (1,415 | ) | | | (1,430 | ) | | | 75 | | | | (10,577 | ) | | | (20,408 | ) | | | — | |
Deduction for sale of assets | | | — | | | | (3,527 | ) | | | (55,567 | ) | | | (32,399 | ) | | | (2,164 | ) | | | (2,200 | ) | | | (124 | ) | | | — | | | | (95,981 | ) |
Disposals, net | | | — | | | | (9,723 | ) | | | (2,607 | ) | | | (1,418 | ) | | | (292 | ) | | | (461 | ) | | | — | | | | (118 | ) | | | (14,619 | ) |
Depreciation charge | | | — | | | | (14,257 | ) | | | (67,430 | ) | | | (19,391 | ) | | | (3,954 | ) | | | (18,068 | ) | | | — | | | | — | | | | (123,100 | ) |
Impairment loss | | | — | | | | — | | | | (5,664 | ) | | | — | | | | — | | | | — | | | | — | | | | — | | | | (5,664 | ) |
Depreciation for sale deductions (ii) | | | — | | | | 1,189 | | | | 37,452 | | | | 14,868 | | | | 1,813 | | | | 1,702 | | | | — | | | | — | | | | 57,024 | |
Translations adjustments | | | (286 | ) | | | 3,383 | | | | (3,310 | ) | | | (788 | ) | | | (134 | ) | | | (2,415 | ) | | | — | | | | (321 | ) | | | (3,871 | ) |
| | | | | | | | | | | | | | | | | | | | | | | | | | | | | | | | | | | | |
Net final carrying amount | | | 20,209 | | | | 95,674 | | | | 254,215 | | | | 40,077 | | | | 10,332 | | | | 31,043 | | | | 17,804 | | | | 34,230 | | | | 503,584 | |
| | | | | | | | | | | | | | | | | | | | | | | | | | | | | | | | | | | | |
At December 31, 2018 | | | | | | | | | | | | | | | | | | | | | | | | | | | | | | | | | | | | |
Cost | | | 20,482 | | | | 129,482 | | | | 689,845 | | | | 85,349 | | | | 59,643 | | | | 170,622 | | | | 17,814 | | | | 34,582 | | | | 1,207,819 | |
Accumulated depreciation and impairment | | | (273 | ) | | | (33,808 | ) | | | (435,630 | ) | | | (45,272 | ) | | | (49,311 | ) | | | (139,579 | ) | | | (10 | ) | | | (352 | ) | | | (704,235 | ) |
| | | | | | | | | | | | | | | | | | | | | | | | | | | | | | | | | | | | |
Net carrying amount | | | 20,209 | | | | 95,674 | | | | 254,215 | | | | 40,077 | | | | 10,332 | | | | 31,043 | | | | 17,804 | | | | 34,230 | | | | 503,584 | |
| | | | | | | | | | | | | | | | | | | | | | | | | | | | | | | | | | | | |
| | | | | | | | | | | | | | | | | | | | | | | | | | | | | | | | | | | | | | | | |
| | | Land | | | Buildings | | | Machinery | | | Vehicles | | | Furniture
and
fixtures | | | Other
equipment | | | Replacement
units | | | In-transit
units | | | Work in
progress | | | Total | |
At January 1, 2017 | | | | | | | | | | | | | | | | | | | | | | | | | | | | | | | | | | | | | | | | |
Cost | | | 32,614 | | | | 241,352 | | | | 1,090,460 | | | | 443,641 | | | | 59,593 | | | | 246,102 | | | | 17,923 | | | | 3,778 | | | | 18,853 | | | | 2,154,316 | |
Accumulated depreciation and impairment | | | — | | | | (46,256 | ) | | | (556,907 | ) | | | (239,822 | ) | | | (39,422 | ) | | | (158,301 | ) | | | (9 | ) | | | — | | | | — | | | | (1,040,717 | ) |
| | | | | | | | | | | | | | | | | | | | | | | | | | | | | | | | | | | | | | | | |
Net carrying amount | | | 32,614 | | | | 195,096 | | | | 533,553 | | | | 203,819 | | | | 20,171 | | | | 87,801 | | | | 17,914 | | | | 3,778 | | | | 18,853 | | | | 1,113,599 | |
| | | | | | | | | | | | | | | | | | | | | | | | | | | | | | | | | | | | | | | | |
Net initial carrying amount | | | 32,614 | | | | 195,096 | | | | 533,553 | | | | 203,819 | | | | 20,171 | | | | 87,801 | | | | 17,914 | | | | 3,778 | | | | 18,853 | | | | 1,113,599 | |
Additions | | | 157 | | | | 2,724 | | | | 48,207 | | | | 36,594 | | | | 11,607 | | | | 36,179 | | | | 925 | | | | 22,877 | | | | 13,178 | | | | 172,448 | |
Deconsolidation, net | | | (3,713 | ) | | | (26,109 | ) | | | — | | | | (1,527 | ) | | | (2,153 | ) | | | (46,032 | ) | | | — | | | | (3,903 | ) | | | (4 | ) | | | (83,441 | ) |
Reclassifications, net | | | — | | | | 1,969 | | | | 12,459 | | | | 2,888 | | | | 609 | | | | 6,579 | | | | 4,076 | | | | (21,600 | ) | | | (6,980 | ) | | | — | |
Transfers to intangibles
(Note 18) | | | — | | | | — | | | | 2,119 | | | | 724 | | | | — | | | | — | | | | — | | | | (964 | ) | | | (2,048 | ) | | | (169 | ) |
Deduction for sale of assets | | | (5,616 | ) | | | (51,736 | ) | | | (149,202 | ) | | | (92,079 | ) | | | (4,200 | ) | | | (5,270 | ) | | | — | | | | — | | | | — | | | | (308,103 | ) |
Disposals, net | | | — | | | | (245 | ) | | | (4,032 | ) | | | (7,507 | ) | | | (422 | ) | | | (9,413 | ) | | | — | | | | (230 | ) | | | (3,606 | ) | | | (25,455 | ) |
Depreciation charge | | | — | | | | (12,469 | ) | | | (100,976 | ) | | | (45,457 | ) | | | (11,654 | ) | | | (26,928 | ) | | | — | | | | — | | | | — | | | | (197,484 | ) |
Impairment loss | | | — | | | | — | | | | (14,328 | ) | | | — | | | | — | | | | — | | | | — | | | | — | | | | (352 | ) | | | (14,680 | ) |
Depreciation for sale deductions | | | — | | | | 3,579 | | | | 115,864 | | | | 84,145 | | | | 1,049 | | | | 3,128 | | | | — | | | | — | | | | — | | | | 207,765 | |
Translations adjustments | | | 236 | | | | 152 | | | | 606 | | | | (350 | ) | | | (23 | ) | | | 980 | | | | — | | | | — | | | | (346 | ) | | | 1,255 | |
| | | | | | | | | | | | | | | | | | | | | | | | | | | | | | | | | | | | | | | | |
Net final carrying amount | | | 23,678 | | | | 112,961 | | | | 444,270 | | | | 181,250 | | | | 14,984 | | | | 47,024 | | | | 22,915 | | | | (42 | ) | | | 18,695 | | | | 865,735 | |
| | | | | | | | | | | | | | | | | | | | | | | | | | | | | | | | | | | | | | | | |
At December 31, 2017 | | | | | | | | | | | | | | | | | | | | | | | | | | | | | | | | | | | | | | | | |
Cost | | | 23,678 | | | | 157,949 | | | | 998,207 | | | | 380,724 | | | | 62,435 | | | | 180,409 | | | | 22,924 | | | | (42 | ) | | | 19,047 | | | | 1,845,331 | |
Accumulated depreciation and impairment | | | — | | | | (44,988 | ) | | | (553,937 | ) | | | (199,474 | ) | | | (47,451 | ) | | | (133,385 | ) | | | (9 | ) | | | — | | | | (352 | ) | | | (979,596 | ) |
| | | | | | | | | | | | | | | | | | | | | | | | | | | | | | | | | | | | | | | | |
Net carrying amount | | | 23,678 | | | | 112,961 | | | | 444,270 | | | | 181,250 | | | | 14,984 | | | | 47,024 | | | | 22,915 | | | | (42 | ) | | | 18,695 | | | | 865,735 | |
| | | | | | | | | | | | | | | | | | | | | | | | | | | | | | | | | | | | | | | | |
- 78 -
| | | | | | | | | | | | | | | | | | | | | | | | | | | | | | | | | | | | |
| | | Land | | | Buildings | | | Machinery | | | Vehicles | | | Furniture
and
fixtures | | | Other
equipment | | | Replacement
and in-transit
units | | | Work in
progress | | | Total | |
At January 1, 2019 | | | | | | | | | | | | | | | | | | | | | | | | | | | | | | | | | | | | |
Cost | | | 20,482 | | | | 129,482 | | | | 689,845 | | | | 85,349 | | | | 59,643 | | | | 170,622 | | | | 17,814 | | | | 34,582 | | | | 1,207,819 | |
Accumulated depreciation and impairment | | | (273 | ) | | | (33,808 | ) | | | (435,630 | ) | | | (45,272 | ) | | | (49,311 | ) | | | (139,579 | ) | | | (10 | ) | | | (352 | ) | | | (704,235 | ) |
| | | | | | | | | | | | | | | | | | | | | | | | | | | | | | | | | | | | |
Net carrying amount | | | 20,209 | | | | 95,674 | | | | 254,215 | | | | 40,077 | | | | 10,332 | | | | 31,043 | | | | 17,804 | | | | 34,230 | | | | 503,584 | |
| | | | | | | | | | | | | | | | | | | | | | | | | | | | | | | | | | | | |
Net initial carrying amount | | | 20,209 | | | | 95,674 | | | | 254,215 | | | | 40,077 | | | | 10,332 | | | | 31,043 | | | | 17,804 | | | | 34,230 | | | | 503,584 | |
Additions (i) | | | 290 | | | | 459 | | | | 23,011 | | | | 866 | | | | 759 | | | | 9,897 | | | | 7,036 | | | | 39,584 | | | | 81,902 | |
Depreciation charge | | | — | | | | (7,387 | ) | | | (48,035 | ) | | | (9,816 | ) | | | (2,338 | ) | | | (12,989 | ) | | | (1 | ) | | | — | | | | (80,566 | ) |
Deduction for sale of assets (ii) | | | — | | | | (78 | ) | | | (22,885 | ) | | | (9,531 | ) | | | (133 | ) | | | (2,789 | ) | | | (9 | ) | | | — | | | | (35,425 | ) |
Depreciation for sale deductions (ii) | | | — | | | | 78 | | | | 19,520 | | | | 5,232 | | | | 86 | | | | 2,717 | | | | — | | | | — | | | | 27,633 | |
Disposals, net | | | — | | | | (674 | ) | | | (316 | ) | | | (101 | ) | | | (187 | ) | | | (2,350 | ) | | | — | | | | — | | | | (3,628 | ) |
Impairment loss | | | — | | | | — | | | | (3,155 | ) | | | — | | | | — | | | | — | | | | — | | | | (15,785 | ) | | | (18,940 | ) |
Transfers (iii) | | | (273 | ) | | | (1,187 | ) | | | — | | | | — | | | | — | | | | — | | | | — | | | | (804 | ) | | | (2,264 | ) |
Reclassifications | | | — | | | | 1,672 | | | | 52,720 | | | | 342 | | | | 207 | | | | 369 | | | | (14,217 | ) | | | (41,093 | ) | | | — | |
Translations adjustments | | | (525 | ) | | | (647 | ) | | | (3,719 | ) | | | (746 | ) | | | (142 | ) | | | (2,527 | ) | | | — | | | | — | | | | (8,306 | ) |
| | | | | | | | | | | | | | | | | | | | | | | | | | | | | | | | | | | | |
Net final carrying amount | | | 19,701 | | | | 87,910 | | | | 271,356 | | | | 26,323 | | | | 8,584 | | | | 23,371 | | | | 10,613 | | | | 16,132 | | | | 463,990 | |
| | | | | | | | | | | | | | | | | | | | | | | | | | | | | | | | | | | | |
At December 31, 2019 | | | | | | | | | | | | | | | | | | | | | | | | | | | | | | | | | | | | |
Cost | | | 19,974 | | | | 129,911 | | | | 726,173 | | | | 75,146 | | | | 58,236 | | | | 179,179 | | | | 10,624 | | | | 32,269 | | | | 1,231,512 | |
Accumulated depreciation and impairment | | | (273 | ) | | | (42,001 | ) | | | (454,817 | ) | | | (48,823 | ) | | | (49,652 | ) | | | (155,808 | ) | | | (11 | ) | | | (16,137 | ) | | | (767,522 | ) |
| | | | | | | | | | | | | | | | | | | | | | | | | | | | | | | | | | | | |
Net carrying amount | | | 19,701 | | | | 87,910 | | | | 271,356 | | | | 26,323 | | | | 8,584 | | | | 23,371 | | | | 10,613 | | | | 16,132 | | | | 463,990 | |
| | | | | | | | | | | | | | | | | | | | | | | | | | | | | | | | | | | | |
| | | | | | | | | | | | | | | | | | | | | | | | | | | | | | | | | | | | | | | | |
| | | Land | | | Buildings | | | Machinery | | | Vehicles | | | Furniture
and
fixtures | | | Other
equipment | | | Replacement
units | | | In-transit
units | | | Work in
progress | | | Total | |
At January 1, 2018 | | | | | | | | | | | | | | | | | | | | | | | | | | | | | | | | | | | | | | | | |
Cost | | | 23,678 | | | | 157,949 | | | | 998,207 | | | | 380,724 | | | | 62,435 | | | | 180,409 | | | | 22,924 | | | | (42 | ) | | | 19,047 | | | | 1,845,331 | |
Accumulated depreciation and impairment | | | — | | | | (44,988 | ) | | | (553,937 | ) | | | (199,474 | ) | | | (47,451 | ) | | | (133,385 | ) | | | (9 | ) | | | — | | | | (352 | ) | | | (979,596 | ) |
| | | | | | | | | | | | | | | | | | | | | | | | | | | | | | | | | | | | | | | | |
Net carrying amount | | | 23,678 | | | | 112,961 | | | | 444,270 | | | | 181,250 | | | | 14,984 | | | | 47,024 | | | | 22,915 | | | | (42 | ) | | | 18,695 | | | | 865,735 | |
| | | | | | | | | | | | | | | | | | | | | | | | | | | | | | | | | | | | | | | | |
Net initial carrying amount | | | 23,678 | | | | 112,961 | | | | 444,270 | | | | 181,250 | | | | 14,984 | | | | 47,024 | | | | 22,915 | | | | (42 | ) | | | 18,695 | | | | 865,735 | |
Additions | | | — | | | | 13,216 | | | | 11,318 | | | | 9,377 | | | | 2,145 | | | | 14,122 | | | | — | | | | 5,577 | | | | 27,431 | | | | 83,186 | |
Deconsolidation, net | | | (3,183 | ) | | | (33,989 | ) | | | (108,993 | ) | | | (110,859 | ) | | | (1,539 | ) | | | (32,878 | ) | | | — | | | | — | | | | (715 | ) | | | (292,156 | ) |
Reclassifications | | | — | | | | 17,129 | | | | 16,626 | | | | (1,415 | ) | | | (1,430 | ) | | | 75 | | | | (5,257 | ) | | | (5,320 | ) | | | (20,408 | ) | | | — | |
Deduction for sale of assets | | | — | | | | (3,527 | ) | | | (55,567 | ) | | | (32,399 | ) | | | (2,164 | ) | | | (2,200 | ) | | | (124 | ) | | | — | | | | — | | | | (95,981 | ) |
Disposals, net | | | — | | | | (9,723 | ) | | | (2,607 | ) | | | (1,418 | ) | | | (292 | ) | | | (461 | ) | | | — | | | | — | | | | (118 | ) | | | (14,619 | ) |
Depreciation charge | | | — | | | | (14,257 | ) | | | (67,430 | ) | | | (19,391 | ) | | | (3,954 | ) | | | (18,068 | ) | | | — | | | | — | | | | — | | | | (123,100 | ) |
Impairment loss | | | — | | | | — | | | | (5,664 | ) | | | — | | | | — | | | | — | | | | — | | | | — | | | | — | | | | (5,664 | ) |
Depreciation for sale deductions | | | — | | | | 1,189 | | | | 37,452 | | | | 14,868 | | | | 1,813 | | | | 1,702 | | | | — | | | | — | | | | — | | | | 57,024 | |
Translations adjustments | | | (286 | ) | | | 3,383 | | | | (3,310 | ) | | | (788 | ) | | | (134 | ) | | | (2,415 | ) | | | — | | | | — | | | | (321 | ) | | | (3,871 | ) |
| | | | | | | | | | | | | | | | | | | | | | | | | | | | | | | | | | | | | | | | |
Net final carrying amount | | | 20,209 | | | | 86,382 | | | | 266,095 | | | | 39,225 | | | | 9,429 | | | | 6,901 | | | | 17,534 | | | | 215 | | | | 24,564 | | | | 470,554 | |
| | | | | | | | | | | | | | | | | | | | | | | | | | | | | | | | | | | | | | | | |
At December 31, 2018 | | | | | | | | | | | | | | | | | | | | | | | | | | | | | | | | | | | | | | | | |
Cost | | | 20,209 | | | | 112,548 | | | | 694,284 | | | | 83,345 | | | | 57,222 | | | | 106,068 | | | | 17,543 | | | | 215 | | | | 24,916 | | | | 1,116,350 | |
Accumulated depreciation and impairment | | | — | | | | (26,166 | ) | | | (428,189 | ) | | | (44,120 | ) | | | (47,793 | ) | | | (99,167 | ) | | | (9 | ) | | | — | | | | (352 | ) | | | (645,796 | ) |
| | | | | | | | | | | | | | | | | | | | | | | | | | | | | | | | | | | | | | | | |
Net carrying amount | | | 20,209 | | | | 86,382 | | | | 266,095 | | | | 39,225 | | | | 9,429 | | | | 6,901 | | | | 17,534 | | | | 215 | | | | 24,564 | | | | 470,554 | |
| | | | | | | | | | | | | | | | | | | | | | | | | | | | | | | | | | | | | | | | |
- 79 -
| | | | | | | | | | | | | | | | | | | | | | | | | | | | | | | | | | | | |
| | | Land | | | Buildings | | | Machinery | | | Vehicles | | | Furniture
and
fixtures | | | Other
equipment | | | Replacement
and in-transit
units | | | Work in
progress | | | Total | |
At January 1, 2020 | | | | | | | | | | | | | | | | | | | | | | | | | | | | | | | | | | | | |
Cost | | | 19,974 | | | | 129,911 | | | | 726,173 | | | | 75,146 | | | | 58,236 | | | | 179,179 | | | | 10,624 | | | | 32,269 | | | | 1,231,512 | |
Accumulated depreciation and impairment | | | (273 | ) | | | (42,001 | ) | | | (454,817 | ) | | | (48,823 | ) | | | (49,652 | ) | | | (155,808 | ) | | | (11 | ) | | | (16,137 | ) | | | (767,522 | ) |
| | | | | | | | | | | | | | | | | | | | | | | | | | | | | | | | | | | | |
Net carrying amount | | | 19,701 | | | | 87,910 | | | | 271,356 | | | | 26,323 | | | | 8,584 | | | | 23,371 | | | | 10,613 | | | | 16,132 | | | | 463,990 | |
| | | | | | | | | | | | | | | | | | | | | | | | | | | | | | | | | | | | |
Net initial carrying amount | | | 19,701 | | | | 87,910 | | | | 271,356 | | | | 26,323 | | | | 8,584 | | | | 23,371 | | | | 10,613 | | | | 16,132 | | | | 463,990 | |
Additions (i) | | | — | | | | 412 | | | | 17,941 | | | | — | | | | 844 | | | | 1,781 | | | | 3,549 | | | | 11,538 | | | | 36,065 | |
Depreciation charge | | | — | | | | (7,636 | ) | | | (53,220 | ) | | | (4,461 | ) | | | (1,344 | ) | | | (11,899 | ) | |
| —
|
| | | — | | | | (78,560 | ) |
Deduction for sale of assets (ii) | | | — | | | | (192 | ) | | | (26,046 | ) | | | (11,762 | ) | | | (523 | ) | | | (448 | ) | | | — | | | | — | | | | (38,971 | ) |
Depreciation for sale deductions (ii) | | | — | | | | 58 | | | | 25,293 | | | | 5,836 | | | | 495 | | | | 428 | | | | — | | | | — | | | | 32,110 | |
Disposals, net | | | (9,895 | ) | | | (2,014 | ) | | | (237 | ) | | | (94 | ) | | | (140 | ) | | | 6 | | | | — | | | | — | | | | (12,374 | ) |
Impairment loss | | | — | | | | (161 | ) | | | (5,069 | ) | | | (17 | ) | | | 33 | | | | — | | | | — | | | | — | | | | (5,214 | ) |
Transfers (iii) | | | — | | | | — | | | | — | | | | — | | | | — | | | | 89 | | | | — | | | | — | | | | 89 | |
Reclassifications | | | — | | | | 1,404 | | | | 23,745 | | | | 35 | | | | — | | | | 379 | | | | (2,216 | ) | | | (23,347 | ) | | | — | |
Translations adjustments | | | 800 | | | | 1,419 | | | | 3,474 | | | | 864 | | | | (12 | ) | | | 1,769 | | | | — | | | | 20 | | | | 8,334 | |
| | | | | | | | | | | | | | | | | | | | | | | | | | | | | | | | | | | | |
Net final carrying amount | | | 10,606 | | | | 81,200 | | | | 257,237 | | | | 16,724 | | | | 7,937 | | | | 15,476 | | | | 11,946 | | | | 4,343 | | | | 405,469 | |
| | | | | | | | | | | | | | | | | | | | | | | | | | | | | | | | | | | | |
At December 31, 2020 | | | | | | | | | | | | | | | | | | | | | | | | | | | | | | | | | | | | |
Cost | | | 10,879 | | | | 132,940 | | | | 750,769 | | | | 64,666 | | | | 52,843 | | | | 156,111 | | | | 11,957 | | | | 20,481 | | | | 1,200,646 | |
Accumulated depreciation and impairment | | | (273 | ) | | | (51,740 | ) | | | (493,532 | ) | | | (47,942 | ) | | | (44,906 | ) | | | (140,635 | ) | | | (11 | ) | | | (16,138 | ) | | | (795,177 | ) |
| | | | | | | | | | | | | | | | | | | | | | | | | | | | | | | | | | | | |
Net carrying amount | | | 10,606 | | | | 81,200 | | | | 257,237 | | | | 16,724 | | | | 7,937 | | | | 15,476 | | | | 11,946 | | | | 4,343 | | | | 405,469 | |
| | | | | | | | | | | | | | | | | | | | | | | | | | | | | | | | | | | | |
| (i) | In 2018, 2019 and 2020, additions to cost correspond to acquisitions of fixed assets made under financial leases or direct purchases. |
| (ii) | In 2020 the sale of fixed assets which is shown in the statement of income under the caption “other income and expenses, net” (Note 28) amounted to S/9.1 million (S/12.7 million in 2019 and S/31.9 million in 2018), generating a gain of S/2.3 million (gain of S/6.1 million in 2019 and loss of S/7.1 million in 2018). |
| (iii) | During 2019, a property owned by Morelco S.A.S. (subsidiary of Cumbra Peru S.A.) was transferred to investment properties to the leased to a third party. During 2020, corresponds to transfers received for software, and expenses related to UNNA ENERGIA S.A.’s well development. |
In 2016, 2017 and 2018, additions to cost correspond to acquisitions of fixed assets made under financial leases or direct purchases.
| Depreciation | of property, plant and equipment and investment property is distributed in the income statement as follows: |
The balance of work in progress as
| | | | | | | | | | | | |
| | | 2018 | | | 2019 | | | 2020 | |
Cost of services and goods (Note 26) | | | 91,249 | | | | 108,066 | | | | 90,146 | |
Administrative expenses (Note 26) | | | 6,600 | | | | 4,252 | | | | 8,358 | |
(+) Depreciation discontinued operations | | | 27,570 | | | | — | | | | — | |
| | | | | | | | | | | | |
Total depreciation | | | 125,419 | | | | 112,318 | | | | 98,504 | |
(-) Depreciation related to investment property | | | (2,319) | | | | (2,356 | ) | | | (2,413 | ) |
(-) Depreciation related to right-of-use assets (Note 16.2) | | | — | | | | (29,396 | ) | | | (17,531 | ) |
| | | | | | | | | | | | |
Total depreciation of property, plant and equipment | | | 123,100 | | | | 80,566 | | | | 78,560 | |
| | | | | | | | | | | | |
As of December 31, 2018, is related to investments made by2020, the subsidiary GMP S.A. for S/17.3 million (S/11.0 million as of December 31, 2017, and S/19.0 million as of December 31, 2016) for drilling activities to increase the exploitation of oil and gas. Additionally, the balance includes the construction works of the Larcomar Hotel Project for S/15.8 million (S/15.6 million in 2017 and S/14.4 million in 2016).
In 2018 the sale of fixed assets amounted to S/31.9 million (S/127.2 million in 2017 and S/70.5 million in 2016), generating a loss of S/7.1 million (gain of S/26.9 million in 2017 and gain of S/18.41 million in 2016), which is shown in the statement of income under the caption “other income and expenses, net” (Note 29). The difference of income from the sale of fixed assets and the gain generated are presented under the caption “income from construction activities” and in “gross profit”, respectively.
In September 2017, the Company signed a sale contract for the corporate building located in Miraflores with Volcomcapital Petit Thouars S.A.C. The sale was made in October 2017, the amount of the purchase-sale amount to US$20.5 million. This operation includes a 5-year lease period that can be extended up to 10 years as well as a purchase option on the building. The sale of the mentioned property generates a profit of US$3.5 million.
Depreciation of property, plant and equipment and investment property is distributed in the income statement as follows:
| | | | | | | | | | | | |
| | | 2016 | | | 2017 | | | 2018 | |
Cost of services and goods | | | 111,404 | | | | 103,566 | | | | 81,199 | |
Administrative expenses | | | 7,428 | | | | 5,776 | | | | 5,135 | |
(+) Depreciation discontinued operations | | | 86,690 | | | | 90,452 | | | | 39,085 | |
| | | | | | | | | | | | |
Total depreciation related to property, plant and equipment and investment property | | | 205,522 | | | | 199,794 | | | | 125,419 | |
(-) Depreciation related to investment property | | | (2,321 | ) | | | (2,310 | ) | | | (2,319 | ) |
| | | | | | | | | | | | |
Total depreciation of property, plant and equipment | | | 203,201 | | | | 197,484 | | | | 123,100 | |
| | | | | | | | | | | | |
At 31 December 2018, the GroupCorporation had fully depreciated assets in use of S/424119.1 million (S/154135.2 million in 20172019 and S/151.6424.5 million in 2016)2018).
The net carrying amount of machinery and equipment, vehicles and furniture and fixtures acquired under finance lease contracts is broken down as follows:
| | | | | | | | | | At December 31, | | | | | | At December 31, | |
| | | 2016 | | | 2017 | | | 2018 | | | 2018 | | | 2019 | | | 2020 | |
Cost of acquisition | | | 800,927 | | | | 650,301 | | | | 589,269 | | | | 86,881 | | | | 68,553 | | | | 64,623 | |
Accumulated depreciation | | | (386,411 | ) | | | (351,447 | ) | | | (329,613 | ) | | | (38,026 | ) | | | (46,773 | ) | | | (52,165 | ) |
| | | | | | | | | | | | | | | | | | |
Net carrying amount | | | 414,516 | | | | 298,854 | | | | 259,656 | | | | 48,855 | | | | 21,780 | | | | 12,458 | |
| | | | | | | | | | | | | | | | | | |
Other financial liabilities are secured by property, plant and equipment for S/321.179.7 million (S/368.1111.9 million in 20172019 and S/617.9162.9 million in 2016)2018).
Operating lease commitments:
In connection with the lease agreement for the sale of the corporate building located in Miraflores mentioned on the previous page, the Company has outstanding commitments fornon-cancellable operating leases, with the following maturities:
| | | | | | | | |
| | | 2017 | | | 2018 | |
Up to 1 year | | | 8,526 | | | | 8,933 | |
Within 2 to 5 years | | | 35,161 | | | | 47,397 | |
Over 5 years | | | 46,451 | | | | 30,532 | |
| | | | | | | | |
| | | 90,138 | | | | 86,862 | |
| | | | | | | | |
- 80 -
1816.2. | RIGHT-OF-USE ASSETS |
As of December 31, 2019 and 2020, the Corporation recognized assets and liabilities for right-of-use, as shown in the following table:
| | | | | | | | | | | | | | | | |
| | | Buildings | | | Machinery
and
equipments | | | Vehicles | | | Total | |
At January 1, 2019 | | | | | | | | | | | | | | | | |
Additions | | | 80,279 | | | | 18,597 | | | | 20,830 | | | | 119,706 | |
Depreciation | | | (13,568 | ) | | | (6,899 | ) | | | (8,929 | ) | | | (29,396 | ) |
Translations adjustments | | | 271 | | | | — | | | | — | | | | 271 | |
| | | | | | | | | | | | | | | | |
Net final carrying amount | | | 66,982 | | | | 11,698 | | | | 11,901 | | | | 90,581 | |
| | | | | | | | | | | | | | | | |
At December 31, 2019 | | | | | | | | | | | | | | | | |
Cost | | | 80,550 | | | | 18,597 | | | | 20,830 | | | | 119,977 | |
Accumulated depreciation | | | (13,568 | ) | | | (6,899 | ) | | | (8,929 | ) | | | (29,396 | ) |
| | | | | | | | | | | | | | | | |
Net carrying amount | | | 66,982 | | | | 11,698 | | | | 11,901 | | | | 90,581 | |
| | | | | | | | | | | | | | | | |
At January 1, 2020 | | | 66,982 | | | | 11,698 | | | | 11,901 | | | | 90,581 | |
Additions | | | 6,681 | | | | 876 | | | | 4,518 | | | | 12,075 | |
Depreciation | | | (13,211 | ) | | | (5,834 | ) | | | 1,514 | | | | (17,531 | ) |
Disposals, net | | | (10,463 | ) | |
| —
|
| | | (11,078 | ) | | | (21,541 | ) |
Translations adjustments | | | 880 | | |
| —
|
| | | 54 | | | | 934 | |
| | | | | | | | | | | | | | | | |
Net final carrying amount | | | 50,869 | | | | 6,740 | | | | 6,909 | | | | 64,518 | |
| | | | | | | | | | | | | | | | |
At December 31, 2020 | | | | | | | | | | | | | | | | |
Cost | | | 75,849 | | | | 19,344 | | | | 14,324 | | | | 109,517 | |
Accumulated depreciation | | | (24,980 | ) | | | (12,604 | ) | | | (7,415 | ) | | | (44,999 | ) |
| | | | | | | | | | | | | | | | |
Net carrying amount | | | 50,869 | | | | 6,740 | | | | 6,909 | | | | 64,518 | |
| | | | | | | | | | | | | | | | |
The expense for depreciation of right-of-use assets has been distributed in the following items of the consolidated statement of income:
| | | | | | | | |
| | | 2019 | | | 2020 | |
Cost of services and goods | | | 26,449 | | | | 15,938 | |
Administrative expenses | | | 2,947 | | | | 1,593 | |
| | | | | | | | |
| | | 29,396 | | | | 17,531 | |
| | | | | | | | |
The costs related to the leasing of machinery and equipment for which the Corporation applied the exceptions described in paragraph 5 of IFRS 16 are the following:
Leases under 12 months: S/351.7 million (S/167.3 million in 2019).
Leases of low value assets: S/5.1 million (S/7 million in 2019).
Likewise, leases whose payments are entirely variable, which depend on their future performance or use, were excluded, during the year 2020 the expenditure was S/48.7 million (in 2019, S/0.6 million).
The movement in intangible assets and the related accumulated amortization as of December 31, 2016, 20172018, 2019 and 20182020 is as follows:
| | | | | | | | | | | | | | | | | | | | | | | | | | | | | | | | | | | | | | | | |
| | | Goodwill | | | Trade-
marks | | | Concession
rights | | | Contractual
relations
with clients | | | Software
and
development
costs | | | Costs of
development
of wells | | | Development
costs | | | Land
use
rights | | | Other
assets | | | Total | |
At January 1, 2016 | | | | | | | | | | | | | | | | | | | | | | | | | | | | | | | | | | | | | | | | |
Cost | | | 192,227 | | | | 96,751 | | | | 716,125 | | | | 82,134 | | | | 42,761 | | | | 326,723 | | | | 3,623 | | | | 13,288 | | | | 15,425 | | | | 1,489,057 | |
Accumulated amortization and impairment | | | (21,995 | ) | | | (217 | ) | | | (298,232 | ) | | | (57,940 | ) | | | (32,543 | ) | | | (192,460 | ) | | | (3,623 | ) | | | — | | | | (3,761 | ) | | | (610,771 | ) |
| | | | | | | | | | | | | | | | | | | | | | | | | | | | | | | | | | | | | | | | |
Net carrying amount | | | 170,232 | | | | 96,534 | | | | 417,893 | | | | 24,194 | | | | 10,218 | | | | 134,263 | | | | — | | | | 13,288 | | | | 11,664 | | | | 878,286 | |
| | | | | | | | | | | | | | | | | | | | | | | | | | | | | | | | | | | | | | | | |
Net initial carrying amount | | | 170,232 | | | | 96,534 | | | | 417,893 | | | | 24,194 | | | | 10,218 | | | | 134,263 | | | | — | | | | 13,288 | | | | 11,664 | | | | 878,286 | |
Additions | | | — | | | | — | | | | 118,222 | | | | — | | | | 16,477 | | | | 17,772 | | | | — | | | | — | | | | 19,255 | | | | 171,726 | |
Acquisition of subsidiary – Adexus (Note 33 a) | | | 930 | | | | 9,088 | | | | 6,090 | | | | 12,822 | | | | — | | | | — | | | | — | | | | — | | | | 4,203 | | | | 33,133 | |
Transfers from assets under construction (Note 17) | | | — | | | | — | | | | — | | | | — | | | | — | | | | — | | | | — | | | | — | | | | 1,257 | | | | 1,257 | |
Reclasifications | | | — | | | | — | | | | 5,258 | | | | — | | | | 345 | | | | — | | | | — | | | | — | | | | (5,603 | ) | | | — | |
Disposals – net cost | | | — | | | | — | | | | (1,395 | ) | | | — | | | | — | | | | (2,395 | ) | | | — | | | | — | | | | — | | | | (3,790 | ) |
Amortization | | | — | | | | — | | | | (28,206 | ) | | | (4,376 | ) | | | (8,043 | ) | | | (40,918 | ) | | | — | | | | — | | | | (1,200 | ) | | | (82,743 | ) |
Impairment loss | | | (38,680 | ) | | | (15,628 | ) | | | — | | | | — | | | | — | | | | — | | | | — | | | | — | | | | — | | | | (54,308 | ) |
Translations adjustments | | | 12,038 | | | | 3,672 | | | | (102 | ) | | | 171 | | | | 1,024 | | | | — | | | | — | | | | — | | | | (78 | ) | | | 16,725 | |
| | | | | | | | | | | | | | | | | | | | | | | | | | | | | | | | | | | | | | | | |
Net final carrying amount | | | 144,520 | | | | 93,666 | | | | 517,760 | | | | 32,811 | | | | 20,021 | | | | 108,722 | | | | — | | | | 13,288 | | | | 29,498 | | | | 960,286 | |
| | | | | | | | | | | | | | | | | | | | | | | | | | | | | | | | | | | | | | | | |
At December 31, 2016 | | | | | | | | | | | | | | | | | | | | | | | | | | | | | | | | | | | | | | | | |
Cost | | | 205,195 | | | | 109,511 | | | | 844,213 | | | | 95,127 | | | | 60,607 | | | | 342,100 | | | | 3,623 | | | | 13,288 | | | | 34,294 | | | | 1,707,958 | |
Accumulated amortization and impairment | | | (60,675 | ) | | | (15,845 | ) | | | (326,453 | ) | | | (62,316 | ) | | | (40,586 | ) | | | (233,378 | ) | | | (3,623 | ) | | | — | | | | (4,796 | ) | | | (747,672 | ) |
| | | | | | | | | | | | | | | | | | | | | | | | | | | | | | | | | | | | | | | | |
Net carrying amount | | | 144,520 | | | | 93,666 | | | | 517,760 | | | | 32,811 | | | | 20,021 | | | | 108,722 | | | | — | | | | 13,288 | | | | 29,498 | | | | 960,286 | |
| | | | | | | | | | | | | | | | | | | | | | | | | | | | | | | | | | | | | | | | |
| | | | | | | | | | | | | | | | | | | | | | | | | | | | | | | | | | | | |
| | | Goodwill | | | Trade-
marks | | | Concession
rights | | | Contractual
relations
with clients | | | Software and
development
costs | | | Costs of
development
of wells | | | Land
use
rights | | | Other
assets | | | Total | |
At January 1, 2018 | | | | | | | | | | | | | | | | | | | | | | | | | | | | | | | | | | | | |
Cost | | | 193,862 | | | | 110,486 | | | | 879,289 | | | | 100,640 | | | | 66,301 | | | | 400,429 | | | | 13,288 | | | | 51,983 | | | | 1,816,278 | |
Accumulated amortization and impairment | | | (77,058 | ) | | | (45,386 | ) | | | (351,062 | ) | | | (66,375 | ) | | | (48,677 | ) | | | (283,696 | ) | | | — | | | | (3,954 | ) | | | (876,208 | ) |
| | | | | | | | | | | | | | | | | | | | | | | | | | | | | | | | | | | | |
Net cost | | | 116,804 | | | | 65,100 | | | | 528,227 | | | | 34,265 | | | | 17,624 | | | | 116,733 | | | | 13,288 | | | | 48,029 | | | | 940,070 | |
| | | | | | | | | | | | | | | | | | | | | | | | | | | | | | | | | | | | |
Net initial cost | | | 116,804 | | | | 65,100 | | | | 528,227 | | | | 34,265 | | | | 17,624 | | | | 116,733 | | | | 13,288 | | | | 48,029 | | | | 940,070 | |
Additions | | | — | | | | — | | | | 23,803 | | | | — | | | | 3,267 | | | | 68,544 | | | | — | | | | 5,067 | | | | 100,681 | |
Capitalization of interest | | | — | | | | — | | | | 3,361 | | | | — | | | | — | | | | — | | | | — | | | | — | | | | 3,361 | |
Desconsolidation, net | | | (20,086 | ) | | | — | | | | (20,716 | ) | | | — | | | | (10,153 | ) | | | — | | | | — | | | | (219 | ) | | | (51,174 | ) |
Transfers from assets under construction | | | — | | | | — | | | | — | | | | — | | | | 199 | | | | — | | | | — | | | | (199 | ) | | | — | |
Derecognition - cost | | | — | | | | — | | | | (16 | ) | | | — | | | | (1,941 | ) | | | (4,126 | ) | | | — | | | | — | | | | (6,083 | ) |
Amortization | | | — | | | | — | | | | (50,776 | ) | | | (7,996 | ) | | | (5,834 | ) | | | (41,930 | ) | | | — | | | | (5,536 | ) | | | (112,072 | ) |
Translations adjustments | | | (3,430 | ) | | | (4,301 | ) | | | 199 | | | | (303 | ) | | | 830 | | | | — | | | | — | | | | 272 | | | | (6,733 | ) |
| | | | | | | | | | | | | | | | | | | | | | | | | | | | | | | | | | | | |
Net final cost | | | 93,288 | | | | 60,799 | | | | 484,082 | | | | 25,966 | | | | 3,992 | | | | 139,221 | | | | 13,288 | | | | 47,414 | | | | 868,050 | |
| | | | | | | | | | | | | | | | | | | | | | | | | | | | | | | | | | | | |
At December 31, 2018 | | | | | | | | | | | | | | | | | | | | | | | | | | | | | | | | | | | | |
Cost | | | 170,346 | | | | 106,185 | | | | 885,915 | | | | 100,337 | | | | 22,565 | | | | 464,847 | | | | 13,288 | | | | 55,131 | | | | 1,818,614 | |
Accumulated amortization and impairment | | | (77,058 | ) | | | (45,386 | ) | | | (401,833 | ) | | | (74,371 | ) | | | (18,573 | ) | | | (325,626 | ) | | | — | | | | (7,717 | ) | | | (950,564 | ) |
| | | | | | | | | | | | | | | | | | | | | | | | | | | | | | | | | | | | |
Net cost | | | 93,288 | | | | 60,799 | | | | 484,082 | | | | 25,966 | | | | 3,992 | | | | 139,221 | | | | 13,288 | | | | 47,414 | | | | 868,050 | |
| | | | | | | | | | | | | | | | | | | | | | | | | | | | | | | | | | | | |
| | | | | | | | | | | | | | | | | | | | | | | | | | | | | | | | | | | | |
| | | Goodwill | | | Trade-
marks | | | Concession
rights | | | Contractual
relations
with clients | | | Software and
development
costs | | | Costs of
development
of wells | | | Land
use
rights | | | Other
assets | | | Total | |
At January 1, 2019 | | | | | | | | | | | | | | | | | | | | | | | | | | | | | | | | | | | | |
Cost | | | 170,346 | | | | 106,185 | | | | 885,915 | | | | 100,337 | | | | 22,565 | | | | 464,847 | | | | 13,288 | | | | 55,131 | | | | 1,818,614 | |
Accumulated amortization and impairment | | | (77,058 | ) | | | (45,386 | ) | | | (401,833 | ) | | | (74,371 | ) | | | (18,573 | ) | | | (325,626 | ) | | | — | | | | (7,717 | ) | | | (950,564 | ) |
| | | | | | | | | | | | | | | | | | | | | | | | | | | | | | | | | | | | |
Net cost | | | 93,288 | | | | 60,799 | | | | 484,082 | | | | 25,966 | | | | 3,992 | | | | 139,221 | | | | 13,288 | | | | 47,414 | | | | 868,050 | |
| | | | | | | | | | | | | | | | | | | | | | | | | | | | | | | | | | | | |
Net initial cost | | | 93,288 | | | | 60,799 | | | | 484,082 | | | | 25,966 | | | | 3,992 | | | | 139,221 | | | | 13,288 | | | | 47,414 | | | | 868,050 | |
Additions | | | — | | | | — | | | | 26,645 | | | | — | | | | 5,016 | | | | 102,022 | | | | — | | | | 5,212 | | | | 138,895 | |
Capitalization of interest expenses | | | — | | | | — | | | | 2,725 | | | | — | | | | — | | | | — | | | | — | | | | 802 | | | | 3,527 | |
Transfers from assets under construction | | | — | | | | — | | | | — | | | | — | | | | 672 | | | | — | | | | — | | | | (672 | ) | | | — | |
Derecognition - net | | | (930 | ) | | | (8,358 | ) | | | — | | | | (11,665 | ) | | | (2,015 | ) | | | — | | | | — | | | | (2,996 | ) | | | (25,964 | ) |
Amortization | | | — | | | | — | | | | (50,102 | ) | | | (3,682 | ) | | | (7,529 | ) | | | (43,552 | ) | | | — | | | | (2,634 | ) | | | (107,499 | ) |
Impairment loss | | | (33,089 | ) | | | — | | | | (3,213 | ) | | | — | | | | — | | | | — | | | | (2,468 | ) | | | — | | | | (38,770 | ) |
Impairment reversal | | | — | | | | 20,676 | | | | — | | | | — | | | | — | | | | — | | | | — | | | | — | | | | 20,676 | |
Translations adjustments | | | (1,902 | ) | | | (2,422 | ) | | | (16,187 | ) | | | (10,118 | ) | | | 21,251 | | | | (3,717 | ) | | | — | | | | 8,407 | | | | (4,688 | ) |
| | | | | | | | | | | | | | | | | | | | | | | | | | | | | | | | | | | | |
Net final cost | | | 57,367 | | | | 70,695 | | | | 443,950 | | | | 501 | | | | 21,387 | | | | 193,974 | | | | 10,820 | | | | 55,533 | | | | 854,227 | |
| | | | | | | | | | | | | | | | | | | | | | | | | | | | | | | | | | | | |
At December 31, 2019 | | | — | | | | — | | | | — | | | | — | | | | — | | | | — | | | | — | | | | — | | | | — | |
Cost | | | 93,887 | | | | 73,836 | | | | 710,290 | | | | 72,810 | | | | 63,278 | | | | 558,530 | | | | 13,288 | | | | 113,057 | | | | 1,698,976 | |
Accumulated amortization and impairment | | | (36,520 | ) | | | (3,141 | ) | | | (266,340 | ) | | | (72,309 | ) | | | (41,891 | ) | | | (364,556 | ) | | | (2,468 | ) | | | (57,524 | ) | | | (844,749 | ) |
| | | | | | | | | | | | | | | | | | | | | | | | | | | | | | | | | | | | |
Net cost | | | 57,367 | | | | 70,695 | | | | 443,950 | | | | 501 | | | | 21,387 | | | | 193,974 | | | | 10,820 | | | | 55,533 | | | | 854,227 | |
| | | | | | | | | | | | | | | | | | | | | | | | | | | | | | | | | | | | |
- 81 -
| | | | | | | | | | | | | | | | | | | | | | | | | | | | | | | | | | | | | | | | |
| | | Goodwill | | | Trade-
marks | | | Concession
rights | | | Contractual
relations
with clients | | | Software
and
development
costs | | | Costs of
development
of wells | | | Development
costs | | | Land
use
rights | | | Other
assets | | | Total | |
At January 1, 2017 | | | | | | | | | | | | | | | | | | | | | | | | | | | | | | | | | | | | | | | | |
Cost | | | 205,195 | | | | 109,511 | | | | 844,213 | | | | 95,127 | | | | 60,607 | | | | 342,100 | | | | 3,623 | | | | 13,288 | | | | 34,294 | | | | 1,707,958 | |
Accumulated amortization and impairment | | | (60,675 | ) | | | (15,845 | ) | | | (326,453 | ) | | | (62,316 | ) | | | (40,586 | ) | | | (233,378 | ) | | | (3,623 | ) | | | — | | | | (4,796 | ) | | | (747,672 | ) |
| | | | | | | | | | | | | | | | | | | | | | | | | | | | | | | | | | | | | | | | |
Net cost | | | 144,520 | | | | 93,666 | | | | 517,760 | | | | 32,811 | | | | 20,021 | | | | 108,722 | | | | — | | | | 13,288 | | | | 29,498 | | | | 960,286 | |
| | | | | | | | | | | | | | | | | | | | | | | | | | | | | | | | | | | | | | | | |
Net initial cost | | | 144,520 | | | | 93,666 | | | | 517,760 | | | | 32,811 | | | | 20,021 | | | | 108,722 | | | | — | | | | 13,288 | | | | 29,498 | | | | 960,286 | |
Additions | | | — | | | | — | | | | 38,156 | | | | 5,274 | | | | 3,330 | | | | 49,698 | | | | — | | | | — | | | | 20,832 | | | | 117,290 | |
Capitalization of interest | | | — | | | | — | | | | 26,015 | | | | — | | | | — | | | | — | | | | — | | | | — | | | | — | | | | 26,015 | |
Deconsolidation, net | | | (3,524 | ) | | | — | | | | (17,354 | ) | | | — | | | | (21 | ) | | | — | | | | — | | | | — | | | | (2,767 | ) | | | (23,666 | ) |
Transfers from assets under construction (Note 17) | | | — | | | | — | | | | (11,217 | ) | | | — | | | | 2,761 | | | | 5,008 | | | | — | | | | — | | | | 3,617 | | | | 169 | |
Derecognition - cost | | | — | | | | — | | | | (537 | ) | | | — | | | | (1,572 | ) | | | — | | | | — | | | | — | | | | (355 | ) | | | (2,464 | ) |
Amortization | | | — | | | | — | | | | (24,609 | ) | | | (4,189 | ) | | | (8,091 | ) | | | (46,695 | ) | | | — | | | | — | | | | (2,973 | ) | | | (86,557 | ) |
Impairment | | | (20,068 | ) | | | (29,541 | ) | | | — | | | | — | | | | — | | | | — | | | | — | | | | — | | | | — | | | | (49,609 | ) |
Translations adjustments | | | (4,124 | ) | | | 975 | | | | 13 | | | | 369 | | | | 1,196 | | | | — | | | | — | | | | — | | | | 177 | | | | (1,394 | ) |
| | | | | | | | | | | | | | | | | | | | | | | | | | | | | | | | | | | | | | | | |
Net final cost | | | 116,804 | | | | 65,100 | | | | 528,227 | | | | 34,265 | | | | 17,624 | | | | 116,733 | | | | — | | | | 13,288 | | | | 48,029 | | | | 940,070 | |
| | | | | | | | | | | | | | | | | | | | | | | | | | | | | | | | | | | | | | | | |
At December 31, 2017 | | | | | | | | | | | | | | | | | | | | | | | | | | | | | | | | | | | | | | | | |
Cost | | | 197,547 | | | | 110,486 | | | | 841,229 | | | | 98,607 | | | | 59,913 | | | | 396,806 | | | | 3,623 | | | | 13,288 | | | | 55,701 | | | | 1,777,200 | |
Accumulated amortization and impairment | | | (80,743 | ) | | | (45,386 | ) | | | (313,002 | ) | | | (64,342 | ) | | | (42,289 | ) | | | (280,073 | ) | | | (3,623 | ) | | | — | | | | (7,672 | ) | | | (837,130 | ) |
| | | | | | | | | | | | | | | | | | | | | | | | | | | | | | | | | | | | | | | | |
Net cost | | | 116,804 | | | | 65,100 | | | | 528,227 | | | | 34,265 | | | | 17,624 | | | | 116,733 | | | | — | | | | 13,288 | | | | 48,029 | | | | 940,070 | |
| | | | | | | | | | | | | | | | | | | | | | | | | | | | | | | | | | | | | | | | |
- 82 -
| | | | | | | | | | | | | | | | | | | | | | | | | | | | | | | | | | | | |
| | | Goodwill | | | Trade-
marks | | | Concession
rights | | | Contractual
relations
with clients | | | Software and
development
costs | | | Costs of
development
of wells | | | Land
use
rights | | | Other
assets | | | Total | |
At January 1, 2020 | | | | | | | | | | | | | | | | | | | | | | | | | | | | | | | | | | | | |
Cost | | | 93,887 | | | | 73,836 | | | | 710,290 | | | | 72,810 | | | | 63,278 | | | | 558,530 | | | | 13,288 | | | | 113,057 | | | | 1,698,976 | |
Accumulated amortization and impairment | | | (36,520 | ) | | | (3,141 | ) | | | (266,340 | ) | | | (72,309 | ) | | | (41,891 | ) | | | (364,556 | ) | | | (2,468 | ) | | | (57,524 | ) | | | (844,749 | ) |
| | | | | | | | | | | | | | | | | | | | | | | | | | | | | | | | | | | | |
Net cost | | | 57,367 | | | | 70,695 | | | | 443,950 | | | | 501 | | | | 21,387 | | | | 193,974 | | | | 10,820 | | | | 55,533 | | | | 854,227 | |
| | | | | | | | | | | | | | | | | | | | | | | | | | | | | | | | | | | | |
Net initial cost | | | 57,367 | | | | 70,695 | | | | 443,950 | | | | 501 | | | | 21,387 | | | | 193,974 | | | | 10,820 | | | | 55,533 | | | | 854,227 | |
Additions | |
| —
|
| |
| —
|
| | | 4,412 | | |
| —
|
| | | 1,526 | | | | 37,994 | | |
| —
|
| | | 6,473 | | | | 50,405 | |
Capitalization of interest expenses | |
| —
|
| |
| —
|
| |
| —
|
| |
| —
|
| |
| —
|
| |
| —
|
| |
| —
|
| | | 1,105 | | | | 1,105 | |
Transfers from assets under construction | |
| —
|
| |
| —
|
| |
| —
|
| |
| —
|
| | | (64 | ) | | | (25 | ) | |
| —
|
| |
| —
|
| | | (89 | ) |
Derecognition - net | |
| —
|
| |
| —
|
| |
| —
|
| |
| —
|
| | | (492 | ) | |
| —
|
| |
| —
|
| |
| —
|
| | | (492 | ) |
Amortization | |
| —
|
| |
| —
|
| | | (52,408 | ) | |
| —
|
| | | (6,037 | ) | | | (36,942 | ) | |
| —
|
| | | (3,234 | ) | | | (98,621 | ) |
Translations adjustments | | | 1,579 | | | | 7,810 | | |
| —
|
| | | 22 | | | | 201 | | |
| —
|
| |
| —
|
| |
| —
|
| | | 9,612 | |
Reclassifications | |
| —
|
| | | (84 | ) | | | (24,157 | ) | |
| —
|
| | | 74 | | |
| —
|
| |
| —
|
| | | 10 | | | | (24,157 | ) |
| | | | | | | | | | | | | | | | | | | | | | | | | | | | | | | | | | | | |
Net final cost | | | 58,946 | | | | 78,421 | | | | 371,797 | | | | 523 | | | | 16,595 | | | | 195,001 | | | | 10,820 | | | | 59,887 | | | | 791,990 | |
| | | | | | | | | | | | | | | | | | | | | | | | | | | | | | | | | | | | |
At December 31, 2020 | | | | | | | | | | | | | | | | | | | | | | | | | | | | | | | | | | | | |
Cost | | | 95,466 | | | | 81,562 | | | | 690,545 | | | | 77,542 | | | | 63,871 | | | | 596,499 | | | | 13,288 | | | | 120,645 | | | | 1,739,418 | |
Accumulated amortization and impairment | | | (36,520 | ) | | | (3,141 | ) | | | (318,748 | ) | | | (77,019 | ) | | | (47,276 | ) | | | (401,498 | ) | | | (2,468 | ) | | | (60,758 | ) | | | (947,428 | ) |
| | | | | | | | | | | | | | | | | | | | | | | | | | | | | | | | | | | | |
Net cost | | | 58,946 | | | | 78,421 | | | | 371,797 | | | | 523 | | | | 16,595 | | | | 195,001 | | | | 10,820 | | | | 59,887 | | | | 791,990 | |
| | | | | | | | | | | | | | | | | | | | | | | | | | | | | | | | | | | | |
| | | | | | | | | | | | | | | | | | | | | | | | | | | | | | | | | | | | | | | | |
| | | Goodwill | | | Trade-
marks | | | Concession
rights | | | Contractual
relations
with clients | | | Software
and
development
costs | | | Costs of
development
of wells | | | Development
costs | | | Land
use
rights | | | Other
assets | | | Total | |
At January 1, 2018 | | | | | | | | | | | | | | | | | | | | | | | | | | | | | | | | | | | | | | | | |
Cost | | | 197,547 | | | | 110,486 | | | | 841,229 | | | | 98,607 | | | | 59,913 | | | | 396,806 | | | | 3,623 | | | | 13,288 | | | | 55,701 | | | | 1,777,200 | |
Accumulated amortization and impairment | | | (80,743 | ) | | | (45,386 | ) | | | (313,002 | ) | | | (64,342 | ) | | | (42,289 | ) | | | (280,073 | ) | | | (3,623 | ) | | | — | | | | (7,672 | ) | | | (837,130 | ) |
| | | | | | | | | | | | | | | | | | | | | | | | | | | | | | | | | | | | | | | | |
Net cost | | | 116,804 | | | | 65,100 | | | | 528,227 | | | | 34,265 | | | | 17,624 | | | | 116,733 | | | | — | | | | 13,288 | | | | 48,029 | | | | 940,070 | |
| | | | | | | | | | | | | | | | | | | | | | | | | | | | | | | | | | | | | | | | |
Net initial cost | | | 116,804 | | | | 65,100 | | | | 528,227 | | | | 34,265 | | | | 17,624 | | | | 116,733 | | | | — | | | | 13,288 | | | | 48,029 | | | | 940,070 | |
Additions | | | — | | | | — | | | | 23,803 | | | | — | | | | 3,267 | | | | 68,544 | | | | — | | | | — | | | | 5,067 | | | | 100,681 | |
Capitalization of interest expenses | | | — | | | | — | | | | 3,361 | | | | — | | | | — | | | | — | | | | — | | | | — | | | | — | | | | 3,361 | |
Desconsolidation, net | | | (20,086 | ) | | | (8,358 | ) | | | (22,758 | ) | | | (8,909 | ) | | | (10,153 | ) | | | — | | | | — | | | | — | | | | (1,863 | ) | | | (72,127 | ) |
Transfers from assets under construction (Note 17) | | | — | | | | — | | | | — | | | | — | | | | 199 | | | | — | | | | — | | | | — | | | | (199 | ) | | | — | |
Derecognition - cost | | | — | | | | — | | | | (16 | ) | | | — | | | | (1,941 | ) | | | (4,126 | ) | | | — | | | | — | | | | — | | | | (6,083 | ) |
Amortization | | | — | | | | — | | | | (50,776 | ) | | | (7,996 | ) | | | (5,834 | ) | | | (41,930 | ) | | | — | | | | — | | | | (5,536 | ) | | | (112,072 | ) |
Translations adjustments | | | (3,430 | ) | | | (4,301 | ) | | | 199 | | | | (303 | ) | | | 830 | | | | — | | | | — | | | | — | | | | 270 | | | | (6,735 | ) |
| | | | | | | | | | | | | | | | | | | | | | | | | | | | | | | | | | | | | | | | |
Net final cost | | | 93,288 | | | | 52,441 | | | | 482,040 | | | | 17,057 | | | | 3,992 | | | | 139,221 | | | | — | | | | 13,288 | | | | 45,768 | | | | 847,095 | |
| | | | | | | | | | | | | | | | | | | | | | | | | | | | | | | | | | | | | | | | |
At December 31, 2018 | | | | | | | | | | | | | | | | | | | | | | | | | | | | | | | | | | | | | | | | |
Cost | | | 174,031 | | | | 97,097 | | | | 836,254 | | | | 85,482 | | | | 16,177 | | | | 461,224 | | | | 3,623 | | | | 13,288 | | | | 54,644 | | | | 1,741,820 | |
Accumulated amortization and impairment | | | (80,743 | ) | | | (44,656 | ) | | | (354,214 | ) | | | (68,425 | ) | | | (12,185 | ) | | | (322,003 | ) | | | (3,623 | ) | | | — | | | | (8,876 | ) | | | (894,725 | ) |
| | | | | | | | | | | | | | | | | | | | | | | | | | | | | | | | | | | | | | | | |
Net cost | | | 93,288 | | | | 52,441 | | | | 482,040 | | | | 17,057 | | | | 3,992 | | | | 139,221 | | | | — | | | | 13,288 | | | | 45,768 | | | | 847,095 | |
| | | | | | | | | | | | | | | | | | | | | | | | | | | | | | | | | | | | | | | | |
- 83 -
Management reviews the results of its businesses on the basis of the type of economic activity carried on. AtAs of December 31, the goodwill of the cash-generating units (CGUs) is distributed as follows:
| | | | 2016 | | | 2017 | | | 2018 | | | 2018 | | | 2019 | | | 2020 | |
Engineering and construction | | | 98,587 | | | | 75,051 | | | | 71,621 | | | | 71,621 | | | | 36,632 | | | | 38,211 | |
Electromechanical | | | 20,737 | | | | 20,737 | | | | 20,737 | | | | 20,737 | | | | 20,735 | | | | 20,735 | |
Mining and construction services | | | 13,366 | | | | 13,366 | | | | — | | |
IT equipment and services | | | 5,102 | | | | 930 | | | | 930 | | | | 930 | | | | — | | | | 0 | |
Telecommunications services | | | 6,728 | | | | 6,720 | | | | — | | |
| | | | | | | | | | | | | | | | | | |
| | | 144,520 | | | | 116,804 | | | | 93,288 | | | | 93,288 | | | | 57,367 | | | | 58,946 | |
| | | | | | | | | | | | | | | | | | |
As a result of management’s annual impairment tests on goodwill, the recoverable amount of cash-generating units was determined on the basis of the greater their value in use and fair value less disposal costs. The value in use was determined on the basis of expected future cash flows generated by the evaluation of CGUs.
As a result of these assessments,evaluations, in 2020, no impairment was identified. In 2019, an impairment was identified in 2016Morelco S.A.S. for S/33 million and 2017Adexus S.A. for S/0.9 million. Through the subsidiary Cumbra Peru S.A., the loss due to deterioration in two CGU’s, Vial yVives-DSD, and Morelco S.A. and was accounted for as of December 31st, 2016 and 2017, respectively. The impairment loss was generated due toby the decrease in the expected cash flows as a result of the reduction in the contracting of new projects during the contracts linkedyear (“Backlog”). Additionally, the Company impaired the value of goodwill in Adexus, because the subsidiary submitted a request for bankruptcy reorganization at the Justice Court of Chile, according to the backlog. The amount of the impairment impacted the goodwillLaw 20.720 (Note 36).
In 2018, no provision for S/20.1 million in 2017 (S/38.7 million in 2016). No impairment was identified during 2018.recorded.
The main assumptions used by the GroupCorporation to determine fair value less disposal costs and value in use are as follows:
| | | | | | | | | | | | | | | | |
| | | Engineering
and
construction | | | Electro-
mechanical | | | IT equipment
and
services | | | Telecommu-
nication
services | |
| | | % | | | % | | | % | | | % | |
2016 | | | | | | | | | | | | | | | | |
Gross margin | | | 9.50% - 12.99% | | | | 11.10% | | | | 15.00% - 23.19% | | | | 11.75% | |
Terminal growth rate | | | 3.00% - 4.00% | | | | 2.00% | | | | 2.00% - 3.00% | | | | 3.00% | |
Discount rate | | | 9.66% - 12.72% | | | | 11.01% | | | | 21.74% | | | | 10.02% | |
2017 | | | | | | | | | | | | | | | | |
Gross margin | | | 9.50% | | | | 8.00% | | | | 20.83% | | | | 4.26% | |
Terminal growth rate | | | 3.00% | | | | 2.00% | | | | 2.90% | | | | 3.00% | |
Discount rate | | | 11.18% | | | | 11.48% | | | | 10.17% | | | | 4.02% | |
2018 | | | | | | | | | | | | | | | | |
Gross margin | | | 12.67% | | | | 7.63% | | | | 20.00% | | | | — | |
Terminal growth rate | | | 3.00% | | | | 2.00% | | | | 2.90% | | | | — | |
Discount rate | | | 12.55% | | | | 11.44% | | | | 15.39% | | | | — | |
- 84 -
| | | | | | | | |
| | | Engineering
and
construction | | | Electro-
mechanical | |
| | | % | | | % | |
2018 | | | | | | | | |
Gross margin | | | 12.67 | % | | | 7.63 | % |
Terminal growth rate | | | 3.00 | % | | | 2.00 | % |
Discount rate | | | 12.55 | % | | | 11.44 | % |
2019 | | | | | | | | |
Gross margin | | | 12.43 | % | | | 8.86 | % |
Terminal growth rate | | | 3.00 | % | | | 2.00 | % |
Discount rate | | | 11.83 | % | | | 11.40 | % |
2020 | | | | | | | | |
Gross margin | | | 12.50 | % | | | 9.36 | % |
Terminal growth rate | | | 3.00 | % | | | 2.00 | % |
Discount rate | | | 11.06 | % | | | 11.77 | % |
These assumptions have been used for the analysis of each CGUs for a period of 5 years.
Management determines budgeted gross margins based on past results and market development expectations. Average growth rates are consistent with those prevailing in the industry. The discount rates used arepre-tax orpost-tax, as applicable, and reflect the specific risks associated with the CGUs evaluated.
This item mainly includes the brands acquired in the business combination processes with Vial y Vives S.A.C. (S/75.4 million) in August 2013, Morelco S.A.S. (S/33.33 million) in December 2014 and Adexus S.A. (S/9.1 million) in August 2016. Management determined that the brands from Vial y Vives, Morelco and Adexus have indefinite useful lives; consequently, annual impairment tests are performed on these intangible assets as explained in paragraph a) above.
As a result of these evaluations, as of December 31, 2017, and 2016,in 2020, no impairment was identified. In 2019, the Vial y Vives - DSD brand partially deteriorated, the amount of thebrand impairment was S/29.5 million and S/15.6 million respectively. It was not necessary to evaluate the impairment of goodwill in Stracon GyM S.A. because in March 2018 the Company sold its interest (87.59%)reversed for a total of US$76.8S/20.7 million (equivalent to S/248.8CLP4,782 million), generating. Management considered that the market value of the brand has increased due to the increase of projects in execution and projects and award process.
Additionally, in 2019, the Company impaired the value of the Adexus brand, because the subsidiary submitted a profitrequest for bankruptcy reorganization before the courts of S/41.9 million.justice of Chile, under the law 20.720 of that country (Note 36). In 2018, no provision for impairment was recorded.
The main assumptions used by the GroupCorporation to determine fair value less cost of sales are as follows:
| | | | Engineering and
construction | | IT
Equipment
Services | | | Engineering
and construction | |
| | | Morelco | | Vial yVives-
DSD | | Adexus | | | Morelco | | Vial y Vives-
DSD | |
| | | % | | % | | % | | | % | | % | |
2016 | | | | | | | |
Average revenue growth rate | | | 14.39 | % | | 24.53 | % | | 12.60 | % | |
Terminal growth rate | | | 3.00 | % | | 4.00 | % | | 3.00 | % | |
Discount rate | | | 11.85 | % | | 9.87 | % | | 16.05 | % | |
2017 | | | | | | | |
Average revenue growth rate | | | 9.60 | % | | 25.00 | % | | 9.19 | % | |
Terminal growth rate | | | 3.00 | % | | 4.00 | % | | 3.00 | % | |
Discount rate | | | 11.18 | % | | 14.80 | % | | 16.63 | % | |
2018 | | | | | | | | | | |
Average revenue growth rate | | | 12.25 | % | | 19.58 | % | | 17.93 | % | | | 12.25 | % | | | 19.58 | % |
Terminal growth rate | | | 3.00 | % | | 3.00 | % | | 2.90 | % | | | 3.00 | % | | | 3.00 | % |
Discount rate | | | 12.55 | % | | 14.00 | % | | 12.40 | % | | | 12.55 | % | | | 14.00 | % |
2019 | | | | | |
Average revenue growth rate | | | | 5.70 | % | | | 19.58 | % |
Terminal growth rate | | | | 3.00 | % | | | 2.00 | % |
Discount rate | | | | 11.83 | % | | | 14.12 | % |
2020 | | | | | |
Average revenue growth rate | | | | 7.60 | % | | | 5.00 | % |
Terminal growth rate | | | | 3.00 | % | | | 2.10 | % |
Discount rate | | | | 11.06 | % | | | 13.16 | % |
TheAs of December 31, mainly include intangibles of Norvial S.A. as of December 31, 2018, mainly comprise: i) the EPC Contract for S/70 million (S/78 million as of December 31, 2017), ii) the construction of the second section of the“Ancon-Huacho-Pativilca” highway and the cost of capitalized indebtedness at effective interest rates between 7.14% and 8.72% for S/19 million and S/3 million, respectively (S/331 million and S/26 million, respectively as of December 31, 2017 at interest rates between 7.14% and 8.72%), iii) road improvement for S/20 million (S/17 million as of December 31, 2017), iv) Implementation for road safety for S/4 million (S/4 million as of December 31, 2017), v) capitalization of the work of the second roadway for S/310 million (there was no movement as of December 31, 2017), (vi) disbursements for land adquisition for S/5 million (S/5 million as of December 31, 2017), (vii) Other intangible assets contracted for the delivery process of the S/5 million Concession (S/4 million as of December 31, 2017). During 2018 debt costs of S/3 million have been capitalized (S/26 million in 2017). See Note 2.20.:
| | | | | | | | |
| | | 2019 | | | 2020 | |
EPC Contract | | | 62,319 | | | | 54,506 | |
Construction of the second tranch of the “Ancon- Huacho-Pativilca” highway | | | 4,809 | | | | 3,406 | |
Cost of capitalized indebtedness at effective interest rates between 7.14% and 8.72% | | | 950 | | |
| —
|
|
Road improvement | | | 14,449 | | | | 12,922 | |
Implementation for road safety | | | 8,152 | | | | 9,034 | |
Work capitalization of second roadway | | | 314,614 | | | | 280,326 | |
Disbursements for land adquisition | | | 4,233 | | | | 4,510 | |
Other intangible assets contracted for the delivery process | | | 7,477 | | | | 5,026 | |
| | | | | | | | |
Total Norvial S.A. | | | 417,003 | | | | 369,730 | |
Other concessions | | | 26,947 | | | | 2,067 | |
| | | | | | | | |
| | | 443,950 | | | | 371,797 | |
| | | | | | | | |
- 85 -
| | d) | Cost of well’s development |
Through one of its subsidiaries, GMPUNNA ENERGIA S.A., the GroupCorporation operates and extracts oil from two fields (Lot I and Lot V) located in the province of Talara, in northern Peru. Both fields are operated under long-term service contracts in which the GroupCorporation provides hydrocarbon extraction services to Perupetro. The expiration date of these contracts are December 2021 and October 2023 for Lot I and Lot V, respectively.
On December 10, 2014, the Peruvian State granted the subsidiary GMPUNNA ENERGIA S.A. the right to exploit for 30 years the oil lots III and IV (owned by the Peruvian State - Perupetro) located in the Talara basin, Piura,Piura. The investment committed is estimated at US$400 million and corresponds to the drilling of 230 wells in Lot III and 330 wells respectively.in Lot IV. The total expected investment in both lots amounts to US$350 million; operationsdrilling began in April 2015.2015 in both lots.
As part of the Group’sCorporation’s obligations under the service contracts,infrastructure, it is necessary to incur certain costs to prepare the wells located in Lots I, III, IV and V. These costs are capitalized as part of the intangible assets with a value of S/41 million during 2020 (S/108 million in 2019 and S/68 million during 2018 (S/99 million in 2017 and S/80 million in 2016)2018), which includes the capitalization of the provision for dismantling wells for S/3 millionand instalations in Lots I, III, IV and V, which during 2020 has not had a significant movement (S/5036 million during 2017)2019).
The lots are amortized on the basis of the useful lives of the wells (determined as five yearson the remaining terms for lots I and V and units produced for lots III and IV), which is less thanuntil the total serviceterm of contract period with Perupetro.
| | e) | Amortization of intangible assets |
Amortization of intangibles is broken down in the consolidated income statement as follows:
| | | | | | | | | | | | |
| | | 2016 | | | 2017 | | | 2018 | |
Cost of sales and services (Note 27) | | | 59,682 | | | | 67,381 | | | | 98,318 | |
Administrative expenses (Note 27) | | | 4,890 | | | | 3,002 | | | | 4,856 | |
(+) Amortization discontinued operations | | | 18,171 | | | | 16,174 | | | | 8,898 | |
| | | | | | | | | | | | |
| | | 82,743 | | | | 86,557 | | | | 112,072 | |
| | | | | | | | | | | | |
| | | | | | | | | | | | |
| | | 2018 | | | 2019 | | | 2020 | |
Cost of sales and services (Note 26) | | | 101,378 | | | | 101,810 | | | | 94,483 | |
Administrative expenses (Note 26) | | | 7,293 | | | | 5,689 | | | | 4,138 | |
(+) Amortization discontinued operations | | | 3,401 | | | | — | | |
| —
|
|
| | | | | | | | | | | | |
| | | 112,072 | | | | 107,499 | | | | 98,621 | |
| | | | | | | | | | | | |
As of December 31, this item includes:
| | | | | | | | | | | | | | | | | | | | | | | | |
| | | Total | | | Current | | | Non-current | |
| | | 2017 | | | 2018 | | | 2017 | | | 2018 | | | 2017 | | | 2018 | |
Bank overdrafts | | | 120 | | | | 119 | | | | 120 | | | | 119 | | | | — | | | | — | |
Bank loans | | | 1,561,634 | | | | 1,023,481 | | | | 990,467 | | | | 810,188 | | | | 571,167 | | | | 213,293 | |
Finance leases | | | 128,309 | | | | 33,488 | | | | 66,177 | | | | 13,514 | | | | 62,132 | | | | 19,974 | |
Other financial entities | | | — | | | | 145,584 | | | | — | | | | 2,653 | | | | — | | | | 142,931 | |
| | | | | | | | | | | | | | | | | | | | | | | | |
| | | 1,690,063 | | | | 1,202,672 | | | | 1,056,764 | | | | 826,474 | | | | 633,299 | | | | 376,198 | |
| | | | | | | | | | | | | | | | | | | | | | | | |
| | | | | | | | | | | | | | | | | | | | | | | | |
| | | Total | | | Current | | | Non-current | |
| | | 2019 | | | 2020 | | | 2019 | | | 2020 | | | 2019 | | | 2020 | |
Bank loans (a) | | | 631,863 | | | | 571,659 | | | | 445,289 | | | | 409,272 | | | | 186,574 | | | | 162,387 | |
Finance leases (b) | | | 23,650 | | | | 52,391 | | | | 10,357 | | | | 13,635 | | | | 13,293 | | | | 38,756 | |
Lease liability for right-of-use asset (c) | | | 92,870 | | | | 72,726 | | | | 23,980 | | | | 19,950 | | | | 68,890 | | | | 52,776 | |
Other financial entities (d) | | | 142,212 | | | | 201,544 | | | | 1,903 | | | | 10,027 | | | | 140,309 | | | | 191,517 | |
| | | | | | | | | | | | | | | | | | | | | | | | |
| | | 890,595 | | | | 898,320 | | | | 481,529 | | | | 452,884 | | | | 409,066 | | | | 445,436 | |
| | | | | | | | | | | | | | | | | | | | | | | | |
- 86 -
As of December 31, 2017,2019 and 2018 includes2020, this item comprises bank loans in local and foreign currencycurrencies for working capital.capital purposes. These obligations bearaccrue fixed interest rates ranging from 1.6% to 15.8%that fluctuate between 1.0% and 12.0% in 20182019 and from 3.3% to 13.9%between 0.5% and 11.0% in 2017.2020.
| | | | | | | | | | | | | | | | | | | | | | |
| | | | | | | | Current | | | Non-current | |
| | | Interest | | Date of | | | At December, 31 | | | At December, 31 | |
| | | rate | | maturity | | | 2017 | | | 2018 | | | 2017 | | | 2018 | |
GyM S.A. | | 1.63% /8.91% | | | 2018 / 2019 | | | | 551,413 | | | | 227,770 | (iii) | | | 95,376 | | | | — | |
Graña y Montero S.A.A. | | Libor USD 3M + from 4.9% to 5.5% | | | 2018 / 2020 | | | | 113,412 | | | | 206,836 | (ii) | | | 363,564 | | | | 125,547 | (i) |
GyM Ferrovías | | Libor USD 1M + to 2% | | | 2019 | | | | — | | | | 209,463 | | | | — | | | | — | |
Viva GyM S.A. | | 7.00% / 12.00% | | | 2018 / 2020 | | | | 157,592 | | | | 129,617 | | | | — | | | | 2,102 | |
GMP S.A. | | 4.55% /6.04% | | | 2018 / 2020 | | | | 42,911 | | | | 22,587 | | | | 96,245 | | | | 85,644 | |
CONCAR S.A. | | 15.75% | | | 2019 | | | | 812 | | | | 13,915 | | | | — | | | | — | |
Adexus S.A. | | 5.90% | | | 2018 / 2019 | | | | 46,552 | | | | — | | | | 3,175 | | | | — | |
CAM Holding S.A. | | 4.68% / 13.76% | | | 2018 | | | | 77,775 | | | | — | | | | 12,807 | | | | — | |
| | | | | | | | | | | | | | | | | | | | | | |
| | | | | | | | | 990,467 | | | | 810,188 | | | | 571,167 | | | | 213,293 | |
| | | | | | | | | | | | | | | | | | | | | | |
| | | | | | | | | | | | | | | | | | | | | | |
| | | | | | | | Current | | | Non-current | |
| | | Interest | | Date of | | | At December, 31 | | | At December, 31 | |
| | | rate | | maturity | | | 2019 | | | 2020 | | | 2019 | | | 2020 | |
Cumbra Peru S.A. (i) | | 2.00% / 11.00% | | | 2022 | | | | 170,798 | | | | 222,924 | | | | 26,401 | | | | 19,977 | |
UNNA ENERGIA S.A. (ii) | | 3.06% / 6.04% | | | 2027 | | | | 30,367 | | | | 24,950 | | | | 102,895 | | | | 99,474 | |
AENZA S.A.A. (iii) | | 9.10% / 10.10% | | | 2022 | | | | 112,854 | | | | 51,977 | | | | — | | | | 39,618 | |
Adexus S.A. | | 0.50% / 1.15% | | | 2021 | | | | 20,927 | | | | 19,224 | | | | 57,278 | | |
| —
|
|
Viva Negocio Inmobiliario S.A. | | 6.84% / 11.00% | | | 2022 | | | | 110,343 | | | | 90,197 | | | | — | | | | 3,318 | |
| | | | | | | | | | | | | | | | | | | | | | |
| | | | | | | | | 445,289 | | | | 409,272 | | | | 186,574 | | | | 162,387 | |
| | | | | | | | | | | | | | | | | | | | | | |
| | i) | Credit Suisse Syndicated Loan
|
In December 2015, the Company entered into a US$200 million medium-term loan agreement with Credit Suisse AG, Cayman Islands Branch and Credit Suisse Securities (USA) LLC. The loan term is five years with quarterly installments starting on the 18th month. The loan bears interest at a rate of three months Libor plus 4.9% per year (3.8% in 2017). The funds were used to finance the equity participation in GSP. On June 27, 2017, the Company renegotiated the terms of this loan to correct defaults related to the cancellation of the GSP concession.
As of December 31, 2018, the principal balance of the loan amounts to US$37.5 million (equivalent to S/126.7 million). The Company is in compliance with its obligations to do and not to do under the credit agreement.
As of December 31, 2016, the balance of bank loans included US$129 million (S/433 million) of the corporate guarantee issued by the Company to guarantee the bridge loan granted to GSP, which was due as of December 31, 2016. However, on June 27, 2017, the Company reached a refinancing agreement with Natixis, BBVA, SMBC and MUFJ for US$78.7 million (S/256.3 million), this amount was used to repay the GSP bridge loan. The new loan matures in June 2020, with prepayments coming from the sale of assets for 40% in the first year and an additional 30% in the second year.
As of December 31, 2018, the principal balance of the loan was US$63.5 million (equivalent to S/214.5 million). Although as of December 31, 2018, the company had breached some of its obligations under the credit agreement, it has requested a waiver. Due to this default, the loan balance was reclassified as current. This waiver was granted at the closing of this report.
| iii) | Financial Stability Framework Agreement |
OnIn July 31, 2017, we,the Company and certain of ourits subsidiaries GyM,(Cumbra Peru S.A., Construyendo Pais S.A., Vial y Vives — DSDVives-DSD S.A. and Concesionaria VíaVia Expresa Sur S.A.,) entered into a Financial Stability Framework Agreement (together with certain complementary contracts, the “Framework Agreement”) with the following financial entities: Scotiabank PerúPeru S.A., Banco Internacional del PerúPeru S.A.A., BBVA Banco Continental, Banco de CréditoCredito del Perú,Peru, Citibank del Peru SA and Citibank N.A. The Framework Agreement aims to: (i) grant GyMCumbra Peru S.A. a syndicated revolving line of credit for working capital for up to US$1.6 million and S/143.9 million, which may be increased by an additional US$14 million subject to certain conditions; (ii) grant GyMCumbra Peru S.A. a line of credit of up to US$51.6 million and S/33.6 million; (iii) grant Graña y Montero S.A.A.the Company, Cumbra Peru S.A., GyM, Construyendo Pais S.A., Vial y Vives –- DSD S.A. and Concesionaria VíaVia Expresa Sur S.A. a non-revolving line of credit to finance reimbursement obligations underrepayment commitments subject to performance bonds; (iv) grant a syndicated line of credit in favor of Graña y Montero S.A.A.the Company and GyMCumbra Peru S.A. for the issuance of performance bonds up to an amount of US$100 million (which may be increased by an additional US$50 million subject to compliance with certain conditions); and (v) to commit to maintain existing standby letters of credit issued at the request of GyMCumbra Peru S.A. and Graña y Montero S.A.A.,the Company, as well as the request of Construyendo Pais S.A., Vial y Vives – DSD and Concesionaria Vía Expresa Sur S.A. In April of 2018, the Group repaid US$72.7 million (equivalent to S/245.8 million) of the facility with the proceeds of the sale of Stracon GyM S.A., and in July of 2018, an additional of US$15.4 million (equivalent to S/52.1 million). As of December 31, 2018, and the date of this annual report, there was US$59.430.2 million (equivalent to S/200.8(S/110.0 million) is outstanding under this agreement.the Financial Stability Framework Agreement. The loan matured in July 2020, which maturity was extended, most recently, until April 30, 2021. We are currently negotiating an additional extension.
In accordance with the Financial Stability Framework Agreement, the Company must comply quarterly with two ratios, related to its invoices and sales provisions: (i) the calculated value of 90% of its bills receivable, and (ii) the calculated value of 80% of its income provisions must be greater than 50% of the amount of Tranche A pending payment.
- 87 -As of December 31, 2020 due to the stoppage of activities generated by the COVID-19 pandemic, the account receivable rate and unbilled receivable rate reached 56% and 142%, respectively. In relation to account receivable rate, the Company does not comply with the requirement of the Financial Stability Framework Agreement.
As of December 31, 2018 and as of2019, the date hereof, our construction subsidiary GyM is under a continuing defaultbalance payable under the Financial Stability Framework Agreement with respectamounted to its failureUS$44.2 million (equivalent to comply with certain ratios betweenS/146.6 million). In August 2019, the Corporation paid the entire balance of Tranche B, equivalent to S/9.7 million and US$9.2 million. In September and October 2019, Tranche A (client invoices (facturas))was partially paid for S/.0.4 million and Tranche B (project valuations (valorizaciones)). No event of default has been formally noticed to GyM by the lenders,US$0.1 million; and our subsidiary has requested a waiver from the lenders, which is pending. If duly noticed to GyM by the lenders, the consequence of this default would be to transfer certain amounts due under Tranche B to Tranche A, for which payment is not due until July 2019. S/0.5 million, respectively.
As of December 31, 2018, there was2020, the Company’s balance payable under the Financial Stability Framework Agreement amounts to US$43.730.7 million (S/.147.8(equivalent to S/111 million) outstanding under Tranche A and US$15.7 million (S/.53.0 million) outstanding under Tranche B.
| ii) | Terminales del Peru Loan |
Terminales del Peru (hereinafter “TP”), a joint operation of the facility,subsidiary UNNA ENERGIA S.A., has a medium-term loan agreement with Banco de Credito del Peru S.A.(hereinafter BCP) up to US$30 million to finance the investments committed and up to US$70 million to finance the additional investments from the operation contract of the North and Center terminals for the period 2015 to 2019 with a maximum exposure limit of US$80 million. These facilities are repaid within 8 years. As of December 31, 2020, these loans amount to US$23.2 million (equivalent to S/84.1 million), and due in 2027, this amount corresponds to the 50% interest held by the subsidiary UNNA ENERGIA.
In addition, in November 2019, TP signed a loan agreement to finance the additional investments from 2019 to 2023, for a totalcredit line amount to US$46 million with BCP. The contract confirmed the participation of an assignee, so BD Capital (BDC) acquired 50% of the BCP contractual position through the subscription of the accession contract and in November 2019 disbursed to TP US$59.423 million. As of December 31, 2020, the loan amounts to US$11 million (S/200.8(equivalent to S/40 million), this amount corresponds to the 50% interest held by the subsidiary UNNA ENERGIA and is due in 2026.
As of December 31, 2020 and the date of this report, TP is in compliance with the ratios established in the contract loan.
| iii) | CS Peru Infrastructure Holdings LLC Loan |
In July 2019, the Company entered into a medium term loan credit agreement for up to US$35 million with CS Peru Infrastructure Holdings LLC. The term of the loan is three years, with quarterly installments of principal starting on the 18th month. The loan accrued interest at the following rates per annum: (i) for the period from and including the July 31, 2019 (“Closing Date”) to but excluding the date that is 6 months after the Closing Date, 9.10%; (ii) for the period from and including the date that is 6 months after the Closing Date to but excluding the date that is 1 year after the Closing Date, 9.35%; (iii) for the period between the first annual anniversary of the Closing Date and the day before the thirtieth month of the Closing Date, 9.60%, and (iv) for the period from the thirtieth month of the Closing Date to the third annual anniversary of the Closing Date, 10.10%. The loan was used for working capital in the Company, Cumbra Peru S.A. and Adexus S.A.
On November 21, 2019, as a result of the initiation of a preventive insolvency process by the Chilean subsidiary, Adexus SA, the Company received a communication from CS Peru Infrastructure Holdings LLC reporting the occurrence of a default event under the loan contract, in accordance with the provisions of Section 7.02 (e) and 9.09 of the same contract. As a consequence, as of December 31, 2019, the loan was classified as current liabilities. In February 2020, US$10 million was partially paid.
On February 28, 2020, the waiver was obtained by the Company, so it was reclassified to non-current liabilities. As of December 31, 2020 and as of the date of this report, the Company is in compliance with the covenants established in the loan contract.
On November 13, 2020, as a consequence of the health crisis caused by COVID-19, the Company notified CS Peru Infrastructure Holdings LLC of the breach of the leverage ratio in accordance with Section 8.10 (b) for the period ended September 30, 2020. On December 23, 2020, the Company obtained a waiver from CS Peru Infrastructure Holdings LLC for the non-applicability of the leverage ratio for the period ended September 30, 2020 and December 31, 2020.
As of December 31, 2020, the principal amount of the loan is US$25.7 million, equivalent to S/93.2 million (US$35 million, equivalent to S/112.9 million, as of December 31, 2019).
On December 30, 2020, Técnicas Reunidas enforced two letters of credit in the aggregate amount of US$23.7 million, which letters of credit had been issued by Santander on behalf of our subsidiary Cumbra as security pursuant to a construction contract. As a result, Cumbra subscribed to a short term loan with Banco Santander in the aggregate principal amount of US$23.7 million. The loan accrues interest at an annual rate of Libor + 8.0%. The term of the loan was 30 days, which maturity was extended until March 30, 2021. We subsequently negotiated payment in installments starting on May 2021 ending on September 2021. As of December 31, 2020 and to the date of this annual report, the principal amount outstanding is US$23.7 million (equivalent to S/85.9 million).
| | | | | | | | | | | | | | | | | | | | | | | | |
| | | | | | | | | Current | | | Non-current | |
| | | Interest | | | Date of | | | At December, 31 | | | At December, 31 | |
| | | rate | | | maturity | | | 2017 | | | 2018 | | | 2017 | | | 2018 | |
GyM S.A. | | | 0.40% /9.27% | | | | 2018 / 2023 | | | | 40,107 | | | | 4,523 | | | | 32,397 | | | | 9,314 | |
GMP S.A. | | | 0.25% /4.50% | | | | 2018 / 2021 | | | | 4,013 | | | | 4,034 | | | | 5,304 | | | | 1,522 | |
Viva GyM S.A. | | | 7.79% /8.46% | | | | 2018 / 2022 | | | | 4,439 | | | | 3,488 | | | | 12,010 | | | | 8,582 | |
CONCAR S.A. | | | 3.65% /5.05% | | | | 2018 / 2020 | | | | 1,777 | | | | 1,469 | | | | 1,945 | | | | 556 | |
Adexus S.A. | | | 3.36% /12.31% | | | | 2018 / 2022 | | | | 8,567 | | | | — | | | | 4,363 | | | | — | |
GMI S.A. | | | 5.56% /6.90% | | | | 2018 | | | | 347 | | | | — | | | | — | | | | — | |
CAM Holding S.A. | | | 3.01% /14.76% | | | | 2018 | | | | 6,240 | | | | — | | | | 5,692 | | | | — | |
CAM Servicios Perú S.A. | | | 6.79% /7.75% | | | | 2018 | | | | 687 | | | | — | | | | 421 | | | | — | |
| | | | | | | | | | | | | | | | | | | | | | | | |
| | | | | | | | | | | 66,177 | | | | 13,514 | | | | 62,132 | | | | 19,974 | |
| | | | | | | | | | | | | | | | | | | | | | | | |
| | | | | | | | | | | | | | | | | | | | | | |
| | | | | | | | Current | | | Non-current | |
| | | Interest | | Date of | | | At December, 31 | | | At December, 31 | |
| | | rate | | maturity | | | 2019 | | | 2020 | | | 2019 | | | 2020 | |
Adexus S.A. | | 0.23% / 0.51% | | | 2027 | | | | 608 | | | | 6,848 | | | | 62 | | | | 31,557 | |
Viva Negocio Inmobiliario S.A. | | 7.79% / 9.04% | | | 2023 | | | | 4,297 | | | | 4,617 | | | | 7,399 | | | | 4,357 | |
Cumbra Peru S.A. | | 4.80% / 7.67% | | | 2023 | | | | 3,395 | | | | 2,021 | | | | 5,678 | | | | 2,823 | |
UNNA ENERGIA S.A. | | 6.28% | | | 2022 | | | | 1,511 | | | | 149 | | | | 154 | | | | 19 | |
Concar S.A.C. | | 4.30% / 5.05% | | | 2020 | | | | 546 | | |
| —
|
| | | — | | |
| —
|
|
| | | | | | | | | | | | | | | | | | | | | | |
| | | | | | | | | 10,357 | | | | 13,635 | | | | 13,293 | | | | 38,756 | |
| | | | | | | | | | | | | | | | | | | | | | |
The minimum payments to be made according to their maturity and the present value of the leasing obligations are as follows:
| | | | At December 31, | | | At December 31, | |
| | | 2017 | | | 2018 | | | 2019 | | | 2020 | |
Up to 1 year | | | 72,864 | | | | 15,151 | | | | 11,438 | | | | 16,287 | |
From 1 to 5 years | | | 65,899 | | | | 21,583 | | | | 16,877 | | | | 35,770 | |
Over 5 years | | | 638 | | | | — | | | | — | | | | 8,515 | |
| | | | | | | | | | | | |
| | | 139,401 | | | | 36,734 | | | | 28,315 | | | | 60,572 | |
Future financial charges on finance leases | | | (11,092 | ) | | | (3,246 | ) | |
Future financial charges | | | | (4,665 | ) | | | (8,181 | ) |
| | | | | | | | | | | | |
Present value of the obligations for finance lease contracts | | | 128,309 | | | | 33,488 | | | | 23,650 | | | | 52,391 | |
| | | | | | | | | | | | |
The present value of the finance lease agreements obligations are as follows:
| | | | At December 31, | | | At December 31, | |
| | | 2017 | | | 2018 | | | 2019 | | | 2020 | |
Up to 1 year | | | 66,177 | | | | 13,514 | | | | 10,357 | | | | 13,635 | |
From 1 year to 5 years | | | 61,501 | | | | 19,974 | | | | 13,293 | | | | 30,635 | |
Over 5 years | | | 631 | | | | — | | | | — | | | | 8,121 | |
| | | | | | | | | | | | |
| | | 128,309 | | | | 33,488 | | | | 23,650 | | | | 52,391 | |
| | | | | | | | | | | | |
| | c) | Lease liability for right-of-use asset |
| | | | | | | | | | | | | | | | | | | | | | |
| | | | | | | | Current | | | Non-current | |
| | | Interest | | Date of | | | At December, 31 | | | At December, 31 | |
| | | rate | | maturity | | | 2019 | | | 2020 | | | 2019 | | | 2020 | |
UNNA ENERGIA S.A. | | 6.59% / 7.80% | | | 2023 | | | | 10,584 | | | | 6,765 | | | | 10,261 | | | | 2,926 | |
AENZA S.A.A. | | 7.88% | | | 2027 | | | | 4,888 | | | | 6,534 | | | | 50,362 | | | | 41,403 | |
Adexus S.A. | | 0.25% / 0.50% | | | 2025 | | | | 5,734 | | | | 3,408 | | | | 6,920 | | | | 5,656 | |
Cumbra Peru S.A. | | 7.65% | | | 2022 | | | | 1,592 | | | | 852 | | | | 541 | | | | 426 | |
Concar S.A.C. | | 5.55% | | | 2024 | | | | 1,171 | | | | 2,047 | | | | 806 | | | | 1,925 | |
Cumbra Ingenieria S.A. | | 7.40% | | | 2023 | | | | — | | | | 302 | | | | — | | | | 381 | |
Tren Urbano de Lima S.A. | | 10.00% | | | 2023 | | | | — | | | | 42 | | | | — | | | | 59 | |
Other minors | | 6.31% / 10.00% | | | 2020 | | | | 11 | | |
| —
|
| | | — | | |
| —
|
|
| | | | | | | | | | | | | | | | | | | | | | |
| | | | | | | | | 23,980 | | | | 19,950 | | | | 68,890 | | | | 52,776 | |
| | | | | | | | | | | | | | | | | | | | | | |
The minimum payments to be made according to their maturity and the present value of the lease liability for right-of-use asset obligations are as follows:
| | | | | | | | |
| | | At December 31, | |
| | | 2019 | | | 2020 | |
Up to 1 year | | | 31,036 | | | | 24,714 | |
From 1 to 5 years | | | 73,370 | | | | 51,853 | |
Over 5 years | | | 11,551 | | | | 11,131 | |
| | | | | | | | |
| | | 115,957 | | | | 87,698 | |
Future financial charges | | | (23,087 | ) | | | (14,972 | ) |
| | | | | | | | |
Present value of the lease liability for right-of-use asset obligations | | | 92,870 | | | | 72,726 | |
| | | | | | | | |
The present value of the lease liability for right-of-use asset obligations are as follows:
| | | | | | | | |
| | | At December 31, | |
| | | 2019 | | | 2020 | |
Up to 1 year | | | 23,981 | | | | 19,950 | |
From 1 year to 5 years | | | 57,713 | | | | 42,641 | |
Over 5 years | | | 11,176 | | | | 10,135 | |
| | | | | | | | |
| | | 92,870 | | | | 72,726 | |
| | | | | | | | |
| d) | Other financial entities |
MonetizationThe balance is mainly composed of the monetization of Norvial dividends, as described below.
OnAt May 29, 2018 the Company subscribes an investment agreement was signed between the Company and Inversiones ConcesionConcesiones Vial S.A.C. (“BCI Peru”) - with-whith the intervention of Fondo de InversionInversiones BCI NV (“Fondo BCI”) and BCI Management Administradora General de Fondos S.A. (“BCIBCI” Asset Management”) - to monetize the future dividends onfrom Norvial S.A. that ourto the Company. With the signing of this agreement, the Company will receiveobligated itself to indirectly transfer its economic rights over 48.8% of the share capital of Norvial S.A. by transferring its class B shares (equivalent to 48.8% of the capital of Norvial S.A.) to a vehicle specially constituted for a periodsuch purposes named Inversiones en Autopistas S.A. The amount of seven years. Thethe transaction amount iswas US$42.3 million (equivalent to S/138 million) and was completed on June 11, 2018.
ItLikewise, it has also been agreed that the Company will have callpurchase options on 48.8% of theNorvial’s economic rights of Norvial that BCI Peru will maintain through its participation in Inversiones en Autopistas S.A. SuchThese options will be subject to certain conditions such as the maturityexpiration of different terms, recovery of the investment made with the funds of the BCI Fund (according to different economic estimates)calculations) and/or the occurrence ofthat a change of control.control occurs.
- 88 -During the 2020 period, the Company reviewed the projected cash flows and effective interest rate of the financial liability with BCI Peru based on new information available on Norvial’s projected traffic and determined that there was a material quantitative change that exceeds the +/-10% . For this reason, the liability with BCI Peru measured at amortized cost was derecognized during 2020 in the amount of US$46 million; the difference between this amount and the new liability amounted to US$3.9 million, which was recorded in other income and expenses (net) in the income statement. Simultaneously, the Company recorded the same liability amounting to US$42.1 million which is measured at fair value from the date of initial recognition, see note 2.19.
As of December 31, 2020, the loan balance payable amounted to US$42.1 million (equivalent to S/152.5 million), and corresponds entirely to the loan principal (as of December 31, 2019, the balance was US$42.9 million, equivalent to S/142.2 million).
The book value and fair value of financial liabilities are as follows:
| | | | Carrying amount | | | Fair value | | | Carrying amount | | | Fair value | |
| | | At December, 31 | | | At December, 31 | | | At December, 31 | | | At December, 31 | |
| | | 2017 | | | 2018 | | | 2017 | | | 2018 | | | 2019 | | | 2020 | | | 2019 | | | 2020 | |
Bank overdrafts | | | 120 | | | | 119 | | | | 120 | | | | 119 | | |
Bank loans | | | 1,561,634 | | | | 1,023,481 | | | | 1,627,000 | | | | 1,152,885 | | | | 631,863 | | | | 571,659 | | | | 650,224 | | | | 589,737 | |
Finance leases | | | 128,309 | | | | 33,488 | | | | 141,040 | | | | 38,399 | | | | 23,650 | | | | 52,391 | | | | 23,697 | | | | 54,343 | |
Lease liability for right-of-use asset | | | | 92,870 | | | | 72,726 | | | | 109,453 | | | | 88,779 | |
Other financial entities | | | — | | | | 145,584 | | | | — | | | | 145,584 | | | | 142,212 | | | | 201,544 | | | | 142,212 | | | | 247,857 | |
| | | | | | | | | | | | | | | | | | | | | | | | |
| | | 1,690,063 | | | | 1,202,672 | | | | 1,768,160 | | | | 1,336,987 | | | | 890,595 | | | | 898,320 | | | | 925,586 | | | | 980,716 | |
| | | | | | | | | | | | | | | | | | �� | | | | | | |
In 2018,2020, fair values are based on discounted cash flows using debt rates between 2.4%0.7% and 8.9%11% (between 2.4%2.9% and 13.8%11% in 2017)2019) and are within level 2 of the fair value hierarchy.
As of December 31, this item includes:
| | | | | | | | | | | | | | | | | | | | | | | | |
| | | Total | | | Current | | | Non-current | |
| | | 2017 | | | 2018 | | | 2017 | | | 2018 | | | 2017 | | | 2018 | |
GyM Ferrovías | | | 603,657 | | | | 611,660 | | | | 12,294 | | | | 13,422 | | | | 591,363 | | | | 598,238 | |
Norvial | | | 343,910 | | | | 325,382 | | | | 24,361 | | | | 25,745 | | | | 319,549 | | | | 299,637 | |
| | | | | | | | | | | | | | | | | | | | | | | | |
| | | 947,567 | | | | 937,042 | | | | 36,655 | | | | 39,167 | | | | 910,912 | | | | 897,875 | |
| | | | | | | | | | | | | | | | | | | | | | | | |
| | | | | | | | | | | | | | | | | | | | | | | | |
| | | Total | | | Current | | | Non-current | |
| | | 2019 | | | 2020 | | | 2019 | | | 2020 | | | 2019 | | | 2020 | |
Tren Urbano de Lima S.A. (a) | | | 618,497 | | | | 624,454 | | | | 15,742 | | | | 21,081 | | | | 602,755 | | | | 603,373 | |
Norvial S.A. (b) | | | 305,545 | | | | 280,848 | | | | 28,995 | | | | 32,819 | | | | 276,550 | | | | 248,029 | |
Cumbra Peru S.A. (c) | | | — | | | | 27,457 | | | | — | | | | 4,546 | | | | — | | | | 22,911 | |
| | | | | | | | | | | | | | | | | | | | | | | | |
| | | 924,042 | | | | 932,759 | | | | 44,737 | | | | 58,446 | | | | 879,305 | | | | 874,313 | |
| | | | | | | | | | | | | | | | | | | | | | | | |
| | a) | GyM FerroviasTren Urbano de Lima S.A.
|
In February 2015, the subsidiary GyM FerroviasTren Urbano de Lima S.A. completed an internationalissue corporate bond issuebonds under “Regulation S”Regulation S of the United States of America. The issueissuance was made in VAC soles VAC (adjusted byfor the Constant Update Value) for an amount of S/629 million. Issuance costs amounted to S/22 million. The bonds matureexpire in November 2039 and bearaccrue interest at a rate of 4.75% (plus the VAC adjustment), havepresent a risk rating of AA+AA + (local scale) granted by ApoyoSupport & Asociados Internacionales Clasificadora de Riesgo and a guarantee scheme that includes a mortgage on the concessionInternational Associates Risk Classifier. As of which GyM Ferrovias S.A. is the concessionaire, collateral on the shares of GyM Ferrovias S.A., Assignment of the Collection Rights of the Administration Trust, a Flows Trust and Reserve Accounts for the Debt Service, Operation, and Maintenance and the ongoing Capex. At December 31, 2018,2020, an accumulated amortization amounting to S/67.790.6 million have been amortized (S/57.579 million atas of December 31, 2017)2019) has been made.
As of December 31, 2020, the balance includes accrued interest payable and VAC adjustments for S/103.4 million (S/86.8 million as of December 31, 2019).
As of December 31, 2018, the balance includes accrued interest2019 and VAC adjustments for S/72.0 million (S/60.5 million as of December 31, 2017).
- 89 -
As of December 31, 2017, and 2018,2020, the movement inof this account is as follows:
| | | | 2017 | | | 2018 | | | 2018 | | | 2019 | | | 2020 | |
Balance at January, 1 | | | 604,031 | | | | 603,657 | | | | 603,657 | | | | 611,660 | | | | 618,497 | |
Amortization | | | (19,141 | ) | | | (10,178 | ) | | | (10,178 | ) | | | (11,330 | ) | | | (11,582 | ) |
Accrued interest | | | 49,132 | | | | 48,130 | | | | 48,130 | | | | 48,253 | | | | 47,615 | |
Interest paid | | | (30,365 | ) | | | (29,949 | ) | | | (29,949 | ) | | | (30,086 | ) | | | (30,076 | ) |
| | | | | | | | | | | | | | | |
Balance at December, 31 | | | 603,657 | | | | 611,660 | | | | 611,660 | | | | 618,497 | | | | 624,454 | |
| | | | | | | | | | | | | | | |
As part of the bond structuring process, GyM FerroviasTren Urbano de Lima S.A. undertookpledged to report and verify compliance with the following, covenants, measured by itsaccording to their individual financial statements:statements (covenants):
Debt service coverage ratio not less than 1.2 times;
Maintain a minimumconstant balance in the minimum trust equal to one-quarterone month of operation and maintenance costs (including VAT). As of December 31, 2019, maintain a minimum balance equal to one quarter of operating and maintenance costs (including VAT);costs.
Maintain a constant balance in the minimum trust equal to the following two coupons according to the bond schedule.
On August 23, 2017, GyM Ferrovias S.A. and Line One CPAO Purchaser LLC signed the purchase-sale contract and assignment of collection rights for the “Annual Payment for Complementary Investment (PAO Complementary)” derived from the Concession Contract for an amount equivalent to US$316 million.
On August 23, 2017, GyM Ferrovias S.A. as Borrower, Mizuho Bank, Ltd., and Sumitomo Mitsui Banking Corporation as Lenders and Mizuho Bank, Ltd. as Administrative Agent signed a Working Capital loan agreement for an amount equivalent to US$80 million to partially finance the Lima Metro Line 1 Expansion Project. As of December 31, 2018,2019, and 2020, Tren Urbano de Lima S.A. has complied with the balance payablecorresponding covenants.
As of December 31, 2020, the fair value amounts to US$62 million.S/710 million (S/686.8 million, as of December 31, 2019), this is based on discounted cash flows using the rate of 3.6% (4.32% as of December 31, 2019) and corresponds to level 2 of the fair value hierarchy.
Between 2015 and 2016, the subsidiary, Norvial S.A., issued the First Corporate Bond Program on the Lima Stock Exchange for S/365 million. The rating companies Equilibrium Risk and Apoyo & Asociados Internacionales gave the rating of AA to this debt instrument.
The purpose of the awarded funds was to finance the construction works of the Second Stage of the Road Network No. 5 and the financing of the VAT linked to the execution of the expenses of the Project.
- 90 -
As of December 31, 2017,2018, 2019, and 2018,2020, the movement in this account is as follows:
| | | | 2017 | | | 2018 | | | 2018 | | | 2019 | | | 2020 | |
Balance at January, 1 | | | 363,684 | | | | 343,910 | | | | 343,910 | | | | 325,382 | | | | 305,545 | |
Amortization | | | (20,010 | ) | | | (18,736 | ) | | | (18,736 | ) | | | (20,005 | ) | | | (24,820 | ) |
Accrued interest | | | 2,987 | | | | 24,170 | | | | 24,170 | | | | 23,482 | | | | 24,619 | |
Capitalized interest | | | 26,011 | | | | 3,361 | | | | 3,361 | | | | 2,725 | | |
| —
|
|
Interest paid | | | (28,762 | ) | | | (27,323 | ) | | | (27,323 | ) | | | (26,039 | ) | | | (24,496 | ) |
| | | | | | | | | | | | | | | |
Balance at December, 31 | | | 343,910 | | | | 325,382 | | | | 325,382 | | | | 305,545 | | | | 280,848 | |
| | | | | | | | | | | | | | | |
As part of the bond structuring process, Norvial S.A. undertook to periodically report and verify compliance with the following covenants:
Debt service coverage ratio not less than 1.3 times;
Proforma leverage ratio less than 4 times.
TheAs of December 31, 2019, and 2020, Norvial S.A. has complied with the corresponding covenants.
As of December 31, 2020, the fair value amounts to S/304.7 million (as of both obligations at December 31, 20182019, amounts to S/1,037327.2 million, (at December 31, 2017, amounts to S/1,040 million)), andthis is based on discounted cash flows using rates between 4.09%6.73% and 5.45%8.07% (between 4.49%6.20% and 6.63% at7.59% as of December 31, 2017) corresponding2019) corresponds to level 2 of the fair value hierarchy.
At the beginning of 2020, the subsidiary Cumbra Peru S.A. prepared the First Private Bond Program, up to a maximum amount of US$8 million.
In the first quarter of the year, bonds issued amounts to US$7.8 million (equivalent to S/25.9 million) under the debt swap modality, related to its outstanding trade accounts.
The bonds mature in December 2027 and bear interest at a rate of 8.5%, payment is semi-annual and have a risk rating of B-, granted by the rating company Moody’s Peru. As of December 31, 2017,2020, the balance includes accrued interest payable for US$0.6 million (equivalent to S/2.2 million).
As of December 31, 2020, the fair value amounts to S/28.6 million, is based on discounted cash flows using rate 7.14% and 2018,is within level 3 of the Company has complied with the covenants of both types of bonds.fair value hierarchy.
2120 | TRADE ACCOUNTS PAYABLE |
As of December 31, this item includes:
| | | | | | | | |
| | | 2017 | | | 2018 | |
Invoices payable | | | 1,250,586 | | | | 591,619 | |
Unbilled services received | | | 132,514 | | | | 378,670 | |
Notes payable | | | 69,946 | | | | 109,242 | |
| | | | | | | | |
| | | 1,453,046 | | | | 1,079,531 | |
| | | | | | | | |
| | | | | | | | | | | | | | | | | | | | | | | | |
| | | Total | | | Current | | | Non-current | |
| | | 2019 | | | 2020 | | | 2019 | | | 2020 | | | 2019 | | | 2020 | |
Invoices payable (a) | | | 398,347 | | | | 470,118 | | | | 363,533 | | | | 470,118 | | | | 34,814 | | |
| —
|
|
Provision of contract costs (b) | | | 758,116 | | | | 659,299 | | | | 758,116 | | | | 618,797 | | | | — | | | | 40,502 | |
Notes payable | | | 37,426 | | | | 8,252 | | | | 37,426 | | | | 8,252 | | | | — | | |
| —
|
|
| | | | | | | | | | | | | | | | | | | | | | | | |
| | | 1,193,889 | | | | 1,137,669 | | | | 1,159,075 | | | | 1,097,167 | | | | 34,814 | | | | 40,502 | |
| | | | | | | | | | | | | | | | | | | | | | | | |
(a) Invoices payable are obligations accredited with formal documents. The balancefollowing are the invoices payable according to main projects:
| | | | | | | | |
| | | 2019 | | | 2020 | |
Infrastructure | | | | | | | | |
Linea 1 - Metro de Lima | | | 15,125 | | | | 18,992 | |
Oil services | | | 46,932 | | | | 33,085 | |
Operation and maintenance - Roads | | | 16,000 | | | | 20,194 | |
| | | | | | | | |
| | | 78,057 | | | | 72,271 | |
| | | | | | | | |
Engineering and Construction | | | | | | | | |
Talara Refinery | | | 59,740 | | | | 96,051 | |
Engineering and Construction Works VyV-DSD S.A. | | | 26,368 | | | | 70,987 | |
Project Quellaveco | | | 26,589 | | | | 55,107 | |
Engineering and Construction Works - Morelco S.A.S. | | | 8,141 | | | | 17,616 | |
Works and Consortiums | | | 64,571 | | | | 17,114 | |
Project Mina Justa | | | 12,267 | | | | 14,190 | |
Project Mina Gold Fields La Cima S.A. | | | 5,302 | | | | 10,353 | |
Generating Plant Machu Picchu | | | 6,575 | | | | 3,488 | |
Civil works, assembly and electromechanics - Acero Arequipa | | | 5,421 | | | | 2,428 | |
Civil Works, Assembly and Electromechanics - Toquepala | | | 10,325 | | |
| —
|
|
Others | | | 2,825 | | | | 44,385 | |
| | | | | | | | |
| | | 228,124 | | | | 331,719 | |
| | | | | | | | |
Real Estate | | | 26,072 | | | | 18,056 | |
| | | | | | | | |
Parent Company Operation | | | 66,094 | | | | 48,072 | |
| | | | | | | | |
| | | 398,347 | | | | 470,118 | |
| | | | | | | | |
b) Provision of contract costs are obligations not accredited with formal documents. Below are the services received but not billed includes the estimate made by management correspondingaccording to the valuation by the degree of completion, which amounted to S/378.7 million at December 31, 2018 (S/132.5 million at December 31, 2017).
- 91 -main projects:
| | | | | | | | |
| | | 2019 | | | 2020 | |
Infrastructure | | | | | | | | |
Linea 1 - Metro de Lima | | | 13,383 | | | | 13,645 | |
Oil services | | | 20,512 | | | | 18,140 | |
Operation and maintenance - Roads | | | 18,762 | | | | 31,027 | |
| | | | | | | | |
| | | 52,657 | | | | 62,812 | |
| | | | | | | | |
Engineering and Construction | | | | | | | | |
Talara Refinery | | | 418,540 | | | | 204,102 | |
Engineering and Construction Works VyV-DSD S.A. | | | 68,140 | | | | 106,186 | |
Engineering and Construction Works - Morelco S.A.S. | | | 34,804 | | | | 84,513 | |
Project Quellaveco | | | 24,185 | | | | 42,822 | |
Project Mina Justa | | | 19,852 | | | | 33,525 | |
Mina Project of Gold Fields La Cima S.A. | | | 15,050 | | | | 12,670 | |
Civil Works, Assembly and Electromechanics - Acero Arequipa | | | 17,382 | | | | 5,222 | |
Generating Plant Machu Picchu | | | 4,633 | | | | 1,222 | |
Civil Works, Assembly and Electromechanics - Toquepala | | | 5,055 | | | | — | |
Others | | | 71,450 | | | | 34,682 | |
| | | | | | | | |
| | | 679,091 | | | | 524,944 | |
| | | | | | | | |
Real estate | | | 13,573 | | | | 24,509 | |
| | | | | | | | |
Parent Company Operation | | | 12,795 | | | | 47,034 | |
| | | | | | | | |
| | | 758,116 | | | | 659,299 | |
| | | | | | | | |
2221 | OTHER ACCOUNTS PAYABLE |
As of December 31, this item includes:
| | | | Total | | | Current | | | Not current | | | Total | | | Current | | | Non-current | |
| | | 2017 | | | 2018 | | | 2017 | | | 2018 | | | 2017 | | | 2018 | | | 2019 | | | 2020 | | | 2019 | | | 2020 | | | 2019 | | | 2020 | |
Advances received from customers (a) | | | 726,294 | | | | 496,548 | | | | 316,891 | | | | 301,868 | | | | 409,403 | | | | 194,680 | | | | 307,839 | | | | 309,590 | | | | 270,714 | | | | 278,490 | | | | 37,125 | | | | 31,100 | |
Consorcio Constructor Ductos del Sur - payable (b) | | | 250,021 | | | | 234,978 | | | | — | | | | — | | | | 250,021 | | | | 234,978 | | |
Consorcio Ductos del Sur - payable (b) | | | | 148,076 | | | | 88,206 | | | | — | | | | 28,836 | | | | 148,076 | | | | 59,370 | |
Salaries and other payable | | | 246,916 | | | | 97,774 | | | | 246,916 | | | | 97,774 | | | | — | | | | — | | | | 92,313 | | | | 77,386 | | | | 92,313 | | | | 77,386 | | | | — | | | | — | |
Put option liability on Morelco acquisition (Note33-b) | | | 105,418 | | | | 103,649 | | | | — | | | | — | | | | 105,418 | | | | 103,649 | | |
Put option liability on Morelco acquisition (Note 32) | | | | 106,444 | | | | 118,622 | | | | 71,341 | | | | 79,096 | | | | 35,103 | | | | 39,526 | |
Third-party loans | | | 107,314 | | | | 11,560 | | | | 75,256 | | | | 11,560 | | | | 32,058 | | | | — | | | | 11,619 | | | | 11,608 | | | | 9,545 | | | | 9,533 | | | | 2,074 | | | | 2,075 | |
Other taxes payable | | | 69,584 | | | | 90,449 | | | | 69,584 | | | | 69,118 | | | | — | | | | 21,331 | | | | 108,457 | | | | 115,862 | | | | 88,248 | | | | 102,240 | | | | 20,209 | | | | 13,622 | |
VAT payable | | | 48,095 | | | | 42,326 | | | | 37,544 | | | | 42,326 | | | | 10,551 | | | | — | | |
Acquisition of additional non-controlling interest (Note 35-a) | | | | 22,697 | | | | 27,596 | | | | 22,697 | | | | 27,596 | | | | — | | | | — | |
Guarantee deposits | | | | 16,445 | | | | 23,744 | | | | 16,445 | | | | 23,744 | | | | — | | | | — | |
Consorcio Rio Mantaro - payables | | | 35,531 | | | | 35,531 | | | | 35,531 | | | | 35,531 | | | | — | | | | — | | | | 35,625 | | | | 58,129 | | | | 35,625 | | | | 58,129 | | | | — | | | | — | |
Acquisition ofnon-controlling interest (Note36-a) | | | 22,407 | | | | 22,963 | | | | 22,407 | | | | 22,963 | | | | — | | | | — | | |
Supplier funding | | | 14,886 | | | | — | | | | — | | | | — | | | | 14,886 | | | | — | | |
Guarantee deposits | | | 15,580 | | | | 15,137 | | | | 15,580 | | | | 15,137 | | | | — | | | | — | | |
Post-retirement benefits | | | 8,914 | | | | — | | | | — | | | | — | | | | 8,914 | | | | — | | |
Provision of interest for debt with suppliers | | | | 16,055 | | | | 16,425 | | | | 4,326 | | | | — | | | | 11,729 | | | | 16,425 | |
Other accounts payables | | | 50,013 | | | | 55,864 | | | | 28,791 | | | | 36,392 | | | | 21,222 | | | | 19,472 | | | | 100,394 | | | | 54,470 | | | | 58,420 | | | | 33,356 | | | | 41,974 | | | | 21,114 | |
| | | | | | | | | | | | | | | | | | | | | | | | | | | | | | | | | | | | |
| | | 1,700,973 | | | | 1,206,779 | | | | 848,500 | | | | 632,669 | | | | 852,473 | | | | 574,110 | | | | 965,964 | | | | 901,638 | | | | 669,674 | | | | 718,406 | | | | 296,290 | | | | 183,232 | |
| | | | | | | | | | | | | | | | | | | | | | | | | | | | | | | | | | | | |
| (a) | Advances received from customers relate mainly to construction projects, and are discounted from invoicing, in accordance with the terms of the contracts. |
| | | | | | | | | | | | | | | | | | | | | | | | |
| | | Total | | | Current | | | Non-current | |
| | | 2019 | | | 2020 | | | 2019 | | | 2020 | | | 2019 | | | 2020 | |
Advances Customers Consortiums | | | 115,250 | | | | 83,640 | | | | 113,093 | | | | 83,640 | | | | 2,157 | | | | — | |
Customer advances for real estate projects | | | 66,258 | | | | 78,286 | | | | 66,258 | | | | 78,286 | | | | — | | | | — | |
Concentradora Norte—Quellaveco | | | 64,118 | | | | 86,415 | | | | 44,932 | | | | 71,571 | | | | 19,186 | | | | 14,844 | |
Special National Transportation Infrastructure Project | | | 42,030 | | | | 24,050 | | | | 26,534 | | | | 13,781 | | | | 15,496 | | | | 10,269 | |
Others | | | 20,183 | | | | 37,199 | | | | 19,897 | | | | 31,212 | | | | 286 | | | | 5,987 | |
| | | | | | | | | | | | | | | | | | | | | | | | |
| | | 307,839 | | | | 309,590 | | | | 270,714 | | | | 278,490 | | | | 37,125 | | | | 31,100 | |
| | | | | | | | | | | | | | | | | | | | | | | | |
| (b) | The other accounts payable of Consorcio Constructor Ductos del Sur correspond to payment obligations to suppliers and the main subcontractors for S/235 million, assumed by the subsidiary Cumbra Peru S.A.; as a consequenceresult of the termination of GSP’sGSP operations. |
The fair value of short-term accounts approximates their carrying amountbook value due to their short-term maturities. Thenon-current portion comprisespart mainly includes non-financial liabilities such as advances received from customers. Thecustomers; the remaining balance is not significant in the financial statements for the periods shown.
As of December 31, this item includes:
| | | | | | | | | | | | | | | | | | | | | | | | |
| | | Total | | | Current | | | Not current | |
| | | 2017 | | | 2018 | | | 2017 | | | 2018 | | | 2017 | | | 2018 | |
Legal contingencies | | | 23,364 | | | | 84,728 | | | | 12,220 | | | | 6,049 | | | | 11,144 | | | | 78,679 | |
Contingent liabilities from the acquisition of Morelco | | | 4,224 | | | | 4,039 | | | | — | | | | — | | | | 4,224 | | | | 4,039 | |
Contingent liabilities from the acquisition of Coasin and Vial yVives - DSD | | | 1,839 | | | | 459 | | | | — | | | | — | | | | 1,839 | | | | 459 | |
Contingent liabilities from the acquisition of Adexus | | | 1,186 | | | | — | | | | 1,186 | | | | — | | | | — | | | | — | |
Provision for well closure (Note 5.1 d) | | | 16,804 | | | | 20,382 | | | | 97 | | | | 148 | | | | 16,707 | | | | 20,234 | |
| | | | | | | | | | | | | | | | | | | | | | | | |
| | | 47,417 | | | | 109,608 | | | | 13,503 | | | | 6,197 | | | | 33,914 | | | | 103,411 | |
| | | | | | | | | | | | | | | | | | | | | | | | |
| | | | | | | | | | | | | | | | | | | | | | | | |
| | | Total | | | Current | | | Non-current | |
| | | 2019 | | | 2020 | | | 2019 | | | 2020 | | | 2019 | | | 2020 | |
Legal claims | | | 272,274 | | | | 375,596 | | | | 101,266 | | | | 80,456 | | | | 171,008 | | | | 295,140 | |
Tax claims | | | 6,045 | | | | 5,630 | | | | 2,369 | | | | 1,954 | | | | 3,676 | | | | 3,676 | |
Provision for well closure | | | 50,116 | | | | 52,949 | | | | 9,848 | | | | 10,837 | | | | 40,268 | | | | 42,112 | |
| | | | | | | | | | | | | | | | | | | | | | | | |
| | | 328,435 | | | | 429,366 | | | | 113,483 | | | | 92,757 | | | | 214,952 | | | | 336,609 | |
| | | | | | | | | | | | | | | | | | | | | | | | |
Additions for legal claims correspond to:
i) Civil compensation
As of December 31, 2018,2020, corresponds to the legal contingencies correspond mainlycontingency estimated by management for exposure of the Company and its subsidiaries to a probable compensation in relation to their participation as minority partners in certain entities that developed infrastructure projects in Peru with companies belonging to the Odebrecht group and projects related to “Club de la Construccion”. As of December 31, 2020, the present value of the estimated provision oftotals S/73.5 million (approximately US$22.3 million), related to the contingency described in Note 1c-4). (As of December 31, 2017, they correspond mainly to provisions for labor liabilities and tax claims of S/19.3 million).
Legal contingencies also include proceedings brought against the Group by the Peruvian energy regulator (OSINERGMIN), related to the storage of hydrocarbons and applicable environmental laws and regulations for S/5.3216.3 million (S/5.1154 million as of December 31, 2017)2019).
ii) Administrative process Indecopi
- 92 -On March 9, 2021, Cumbra Peru S.A. was notified with the Final Instruction Report prepared by the Technical Secretariat, which is subject to review by the Commission for the Defense of Free Competition of INDECOPI, related to the sanctioning administrative procedure mentioned in Note 1.c). In this regard, Company and its legal advisors estimate that, based on the findings of the Final Investigation Report, the fine to be imposed on Cumbra Peru S.A. in this case should not exceed S/39 million and was recorded on December 31, 2020 the equivalent to the corresponding present value that results in S/24 million.
iii) Class Action
During the first quarter of 2017 two securities class actions have been filed against the Company, and certain former employees in the Eastern District of New York. Both complaints allege false and misleading statements during the class period. In particular, they allege that the Company failed to disclose, among other things, that a) the Company knew that its partner Odebrecht was engaged in illegal activities, and b) the Company profited from such activities in violation of its own corporate governance standards.
As of the date of this report, the Company has signed the definitive settlement agreement with plaintiffs’ counsel, whereby the parties agree to terminate the class action subject to Court approval and payment of the settlement amount by the Company. The amount stipulated for the termination of the class action is equivalent to US$20 million. As of December 31, 2019, the Company registered a provision of US$15 million (equivalent of S/49.8 million). As of December 31, 2020, the Company maintains a provision of US$14.7 million plus interest of US$0.2 million (equivalent to S/53.1 million and S/0.9 million, respectively). In 2020, a payment of US$0.3 million (equivalent to S/1.1 million) and US$5 million was made and covered by the Company and by the professional liability policy in accordance with the agreement signed with the insurer, respectively. The settlement terms stipulate that the remaining $14,650,000, plus interest of 5% per annum running from September 17, 2020, must be paid by the company by June 30, 2021. We have initiated discussions with the plaintiffs regarding a deferral of this payment,
iii) Other provisions
As of December 31, 2020 corresponds to legal claims of civil, labor, administrative processes and administrative litigation nature, for an estimated provision of S/76 million (S/68.5 million as of December 31, 2019). Legal claims of a civil nature, mainly includes claims received from clients for S/41.4 million, corresponding to the subsidiary Cumbra Peru S.A. (S/46 million as of December 31, 2019).
The gross movement of other provisions is as follows:
| Other provisions | | Legal
contingencies | | | Contingent
liabilities
resulting
from
acquisitions | | | Provision
for well
closure | | | Total | | |
At January 1, 2017 | | | 15,732 | | | | 8,125 | | | | 17,216 | | | | 41,073 | | |
| | | | Legal
and tax
claims | | | Contingent
liabilities
resulting from
acquisitions | | | Provision
for well
closure | | | Total | |
At January 1, 2018 | | | | 23,364 | | | | 6,156 | | | | 16,804 | | | | 46,324 | |
Additions | | | | 75,369 | | | | — | | | | 3,578 | | | | 78,947 | |
Reversals of provisions | | | | (4,875 | ) | | | (1,343 | ) | | | — | | | | (6,218 | ) |
Desconsolidation of subsidiaries | | | | (2,340 | ) | | | — | | | | — | | | | (2,340 | ) |
Payments | | | | (6,615 | ) | | | — | | | | — | | | | (6,615 | ) |
Translation adjustments | | | | (175 | ) | | | (315 | ) | | | — | | | | (490 | ) |
| | | | | | | | | | | | | |
At December 31, 2018 | | | | 84,728 | | | | 4,498 | | | | 20,382 | | | | 109,608 | |
| | | | | | | | | | | | | |
At January 1, 2019 | | | | 84,728 | | | | 4,498 | | | | 20,382 | | | | 109,608 | |
Additions | | | 9,510 | | | | — | | | | — | | | | 9,510 | | | | 197,721 | | | | — | | | | 30,998 | | | | 228,719 | |
Reversals of provisions | | | (235 | ) | | | (809 | ) | | | (412 | ) | | | (1,456 | ) | | | (3,122 | ) | | | (4,349 | ) | | | — | | | | (7,471 | ) |
Payments | | | (1,680 | ) | | | — | | | | — | | | | (1,680 | ) | | | (914 | ) | | | — | | | | (1,264 | ) | | | (2,178 | ) |
Translation adjustments | | | 37 | | | | (67 | ) | | | — | | | | (30 | ) | | | (94 | ) | | | (149 | ) | | | — | | | | (243 | ) |
| | | | | | | | | | | | | | | | | | | | | | | | |
At December 31, 2017 | | | 23,364 | | | | 7,249 | | | | 16,804 | | | | 47,417 | | |
At December 31, 2019 | | | | 278,319 | | | | — | | | | 50,116 | | | | 328,435 | |
| | | | | | | | | | | | | | | | | | | | | | | | |
At January 1, 2018 | | | 23,364 | | | | 7,249 | | | | 16,804 | | | | 47,417 | | |
At January 1, 2020 | | | | 278,319 | | | | — | | | | 50,116 | | | | 328,435 | |
Additions | | | 75,369 | | | | — | | | | 3,578 | | | | 78,947 | | | | 128,169 | | | | — | | | | 4,632 | | | | 132,801 | |
Reversals of provisions | | | (4,875 | ) | | | (1,343 | ) | | | — | | | | (6,218 | ) | | | (33,264 | ) | | | — | | | | — | | | | (33,264 | ) |
Deconsolidation of subsidiaries | | | (2,340 | ) | | | — | | | | — | | | | (2,340 | ) | |
Reclasification liabilities classified as held for sale | | | — | | | | (1,093 | ) | | | — | | | | (1,093 | ) | |
Reclasification | | | | 1,079 | | | | — | | | | — | | | | 1,079 | |
Payments | | | (6,615 | ) | | | — | | | | — | | | | (6,615 | ) | | | (7,252 | ) | | | — | | | | (1,799 | ) | | | (9,051 | ) |
Translation adjustments | | | (175 | ) | | | (315 | ) | | | — | | | | (490 | ) | | | 9,366 | | | | — | | | | — | | | | 9,366 | |
| | | | | | | | | | | | | | | | | | | | | | | | |
At December 31, 2018 | | | 84,728 | | | | 4,498 | | | | 20,382 | | | | 109,608 | | |
At December 31, 2020 | | | | 376,417 | | | | — | | | | 52,949 | | | | 429,366 | |
| | | | | | | | | | | | | | | | | | | | | | | | |
The General Shareholders’ Meeting held on November 6, 2018, approved aOn April 2, 2019, the Company concluded the capital increase process by completing the subscription of up to US$130 million (equivalent to S/434 million, approximately), equivalent to 211,864,065142,483,663 new common shares, at a price of US$0.6136. As of December 31, 2018, duringtherefore the first stagecapital of the placement and the conclusion of two preferred subscription rounds, a total of 69,380,402 shares were subscribed. Therefore, the Company’s capitalCompany is represented by 729,434,192 shares with a par value of S/1.00 each, out of which 660,053,790 are registered in871,917,855, after the Public Registry, and 69,380,402 are in the process of registration. As of December 31, 2017, the issued, authorized, subscribed, and paid-in capital in accordance with the Company’s bylaws and amendments thereto was represented by 660,053,790 common shares. The company will continue its efforts to place the balance or partend of the shares pending subscription.private offer and considering the contributions made during the 2 preferential subscription wheels.
As of December 31, 2017,2020, a total of 259,302,745190,863,050 shares were represented in ADS, equivalent to 51,860,54938,172,610 ADSs at thea rate of 5 shares per ADS; and 207,931,660 shares were represented in ADSs equivalent to 41,586,332 ADS as of December 31, 2018.
- 93 -2019, 218,043,480 shares were represented by ADS, equivalent to 43,608,696 ADSs
As of December 31, 2018,2020, the Company’s shareholding structure is as follows:
| Percentage of individual interest in capital | | Number of
shareholders | | | Total
percentage
of interest | | |
Percentage of individual interest in outstanding capital | | | Number of
shareholders | | | Total
percentage of
interest | |
Up to 1.00 | | | 1,926 | | | | 16.37 | | | | 1,728 | | | | 13.27 | % |
From 1.01 to 5.00 | | | 12 | | | | 26.54 | | | | 14 | | | | 27.98 | % |
From 5.01 to 10.00 | | | 2 | | | | 12.47 | | | | 2 | | | | 13.38 | % |
Over 10 | | | 2 | | | | 44.62 | | | | 3 | | | | 45.37 | % |
| | | | | | | | | | | | |
| | | 1,942 | | | | 100.00 | | | | 1,747 | | | | 100.00 | % |
| | | | | | | | | | | | |
As of December 31, 2018,2020, the Company’s shares hadregistered ayear-end market stock price at the end of the year of S/1.991.72 per share and a trading frequency of 91.6%95.65% (S/1.871.70 per share and a trading frequency of 100% as of95.24% at 31 December 31, 2017)2019).
In accordance with the Peruvian General Law of Corporations, the legal reserve of the Company is constituted with the transfer of 10% of the annual profit until reaching an amount equivalent to 20% of the paid-in capital. In the absence of profits or unrestricted reserves, the legal reserve must be applied to the compensation of losses and must be replenished with the profits of subsequent years. This reserve may be capitalized; and its replacement is also mandatory. As of December 31, 2018, the balance of the legal reserve reached the aforementioned limit.
As of December 31, 2017,2019, and 2018,2020, this S/29.97 million reserve is related to the excess of the legal reserve; this reserve is above the requirement to constitute a reserve until it reaches the equivalent of 20% of the paid-in capital.
This item includes the excess of total income obtained by shares issued in 2013 compared to their nominal value of S/1,055.5 millionmillion; and by shares issued in 20182019 an amount of S/68.2138.1 million and 2020 for the acquisition of a non-controlling interest for S/0.6 million.
In addition, this account recognizes the difference between the nominal value and the transaction value for acquisitions of shares innon-controlling interests.
Dividends distributed to shareholders other than domiciled legal entities are subject to the rates of 4.1% (earnings until 2014), 6.8% (2015 and 2016 earnings) and 5.00% (2017 and thereafter) for income tax charged to these shareholders; such tax is withheld and settled by the Company. Dividends for fiscal years 20172019 and 20182020 were not distributed (Note 34)33).
- 94 -
Deferred income tax is classified by its estimated reversal term as follows:
| | | | | | | At December 31, | |
| | | 2017 | | | 2018 | | | 2019 | | | 2020 | |
Deferred income tax asset: | | | | | | | | |
Reversal expected in the following 12 months | | | 73,883 | | | | 48,889 | | |
Reversal expected after 12 months | | | 362,814 | | | | 376,547 | | |
Reversal expected in the following twelve months | | | | 37,927 | | | | 44,780 | |
Reversal expected after twelve months | | | | 233,792 | | | | 217,385 | |
| | | | | | | | | | | | |
Total deferred tax asset | | | 436,697 | | | | 425,436 | | | | 271,719 | | | | 262,165 | |
| | | | | | | | | | | | |
Deferred income tax liability: | | | | | | | | |
Reversal expected in the following 12 months | | | (5,583 | ) | | | (9,067 | ) | |
Reversal expected after 12 months | | | (66,889 | ) | | | (66,280 | ) | |
Reversal expected in the following twelve months | | | | (19,791 | ) | | | (1,261 | ) |
Reversal expected after twelve months | | | | (92,943 | ) | | | (101,646 | ) |
| | | | | | | | | | | | |
Total deferred tax liability | | | (72,472 | ) | | | (75,347 | ) | | | (112,734 | ) | | | (102,907 | ) |
| | | | | | | | | | | | |
Deferred income tax asset, net | | | 364,225 | | | | 350,089 | | | | 158,985 | | | | 159,258 | |
| | | | | | | | | | | | |
The gross movement inof the deferred income tax item is as follows:
| | | | | | | | | | | | |
| | | 2016 | | | 2017 | | | 2018 | |
Deferred income tax asset, net as of January 1 | | | 48,682 | | | | 353,839 | | | | 364,225 | |
Credit to income statement (Note 30) | | | 263,806 | | | | 42,599 | | | | 25,118 | |
Adjustment for changes in rates of income tax | | | 17,105 | | | | 1,951 | | | | (1,524 | ) |
Credit to other comprehensive income | | | 15,004 | | | | — | | | | — | |
Tax charged to equity | | | 159 | | | | — | | | | — | |
Acquisition of a subsidiary | | | 10,363 | | | | (12,160 | ) | | | (40,460 | ) |
Acquisition of joint operation | | | — | | | | (16,804 | ) | | | (95 | ) |
Other movements | | | (1,280 | ) | | | (5,200 | ) | | | 2,825 | |
| | | | | | | | | | | | |
Total as of December 31 | | | 353,839 | | | | 364,225 | | | | 350,089 | |
| | | | | | | | | | | | |
- 95 -
| | | | | | | | | | | | |
| | | At December 31, | |
| | | 2018 | | | 2019 | | | 2020 | |
Opening balance | | | 364,225 | | | | 365,263 | | | | 158,985 | |
Debit (credit) to income statement (Note 29) | | | 28,462 | | | | (188,509 | ) | | | (5,310 | ) |
Adjustment for changes in rates of income tax | | | (1,524 | ) | | | (622 | ) | | | — | |
Sales of a Subsidiary | | | (24,135 | ) | | | — | | | | — | |
IFRIC 23 adoption | | | — | | | | (986 | ) | | | — | |
Debit (credit) to equity | | | (95 | ) | | | (3 | ) | | | — | |
Other movements | | | (1,670 | ) | | | (16,158 | ) | | | 5,583 | |
| | | | | | | | | | | | |
Final balance | | | 365,263 | | | | 158,985 | | | | 159,258 | |
| | | | | | | | | | | | |
The movement in deferred tax assets and liabilities in the year, without considering the offsetting of balances, is as follows:
| | | | | | | | | | | | | | | | | | | | | | | | | | | | | | | | | | | | |
Deferred income tax liabilities | | Difference in
depreciation
rates | | | Deferred
income | | | Fair value
gains | | | Work
in
Process | | | Tax
receivables | | | Borrowing
costs
capitalized | | | Purchase
price
allocation | | | Others | | | Total | |
At January 1, 2016 | | | 45,155 | | | | — | | | | 30,684 | | | | 24,723 | | | | 25,543 | | | | 15,178 | | | | — | | | | 11,810 | | | | 153,093 | |
| | | | | | | | | | | | | | | | | | | | | | | | | | | | | | | | | | | | |
(Charge) credit to P&L | | | 16,595 | | | | — | | | | 13,587 | | | | (16,481 | ) | | | 3,324 | | | | 6,240 | | | | — | | | | 2,618 | | | | 25,883 | |
(Charge) credit to OCI | | | — | | | | — | | | | (15,348 | ) | | | — | | | | — | | | | — | | | | — | | | | — | | | | (15,348 | ) |
Reclassification of previous years | | | — | | | | — | | | | (28,923 | ) | | | — | | | | — | | | | — | | | | 30,187 | | | | (1,264 | ) | | | — | |
Acquisition of subsidiary | | | — | | | | — | | | | — | | | | — | | | | — | | | | — | | | | (3,069 | ) | | | — | | | | (3,069 | ) |
| | | | | | | | | | | | | | | | | | | | | | | | | | | | | | | | | | | | |
At December 31, 2016 | | | 61,750 | | | | — | | | | — | | | | 8,242 | | | | 28,867 | | | | 21,418 | | | | 27,118 | | | | 13,164 | | | | 160,559 | |
| | | | | | | | | | | | | | | | | | | | | | | | | | | | | | | | | | | | |
(Charge) credit to P&L | | | 104,101 | | | | — | | | | — | | | | (5,712 | ) | | | 3,322 | | | | (1,473 | ) | | | (11,780 | ) | | | (3,724 | ) | | | 84,734 | |
Sale of subsidiary | | | — | | | | — | | | | — | | | | — | | | | — | | | | — | | | | — | | | | (83 | ) | | | (83 | ) |
| | | | | | | | | | | | | | | | | | | | | | | | | | | | | | | | | | | | |
At December 31, 2017 | | | 165,851 | | | | — | | | | — | | | | 2,530 | | | | 32,189 | | | | 19,945 | | | | 15,338 | | | | 9,357 | | | | 245,210 | |
| | | | | | | | | | | | | | | | | | | | | | | | | | | | | | | | | | | | |
(Charge) credit to P&L | | | (74,679 | ) | | | 13,574 | | | | — | | | | 2,926 | | | | 689 | | | | (4,229 | ) | | | (11,699 | ) | | | 7,828 | | | | (65,590 | ) |
Sale of subsidiaries | | | (16,189 | ) | | | — | | | | — | | | | — | | | | — | | | | — | | | | (5,201 | ) | | | (3,377 | ) | | | (24,767 | ) |
| | | | | | | | | | | | | | | | | | | | | | | | | | | | | | | | | | | | |
At December 31, 2018 | | | 74,983 | | | | 13,574 | | | | — | | | | 5,456 | | | | 32,878 | | | | 15,716 | | | | (1,562 | ) | | | 13,808 | | | | 154,853 | |
| | | | | | | | | | | | | | | | | | | | | | | | | | | | | | | | | | | | |
| | | | | | | | | | | | | | | | | | | | | | | | | | | | | | | | |
Deferred income tax liabilities | | Difference in
depreciation
rates | | | Deferred
income | | | Work in
process | | | Tax
receivable | | | Borrowing
costs
capitalized | | | PPA | | | Others | | | Total | |
At January 1, 2018 | | | 165,851 | | | | — | | | | 2,530 | | | | 32,189 | | | | 19,945 | | | | 15,338 | | | | 9,357 | | | | 245,210 | |
(Debit) credit to P&L | | | (76,246 | ) | | | 13,574 | | | | 2,926 | | | | 689 | | | | (4,229 | ) | | | (12,479 | ) | | | 9,263 | | | | (66,502 | ) |
Sale of subsidiary | | | (8,052 | ) | | | — | | | | — | | | | — | | | | — | | | | (4,421 | ) | | | 2,125 | | | | (10,348 | ) |
| | | | | | | | | | | | | | | | | | | | | | | | | | | | | | | | |
At December 31, 2018 | | | 81,553 | | | | 13,574 | | | | 5,456 | | | | 32,878 | | | | 15,716 | | | | (1,562 | ) | | | 20,745 | | | | 168,360 | |
| | | | | | | | | | | | | | | | | | | | | | | | | | | | | | | | |
(Debit) credit to P&L | | | 9,937 | | | | 10,571 | | | | 33,403 | | | | 3,312 | | | | (780 | ) | | | 11,385 | | | | 18,821 | | | | 86,649 | |
| | | | | | | | | | | | | | | | | | | | | | | | | | | | | | | | |
At December 31, 2019 | | | 91,490 | | | | 24,145 | | | | 38,859 | | | | 36,190 | | | | 14,936 | | | | 9,823 | | | | 39,566 | | | | 255,009 | |
| | | | | | | | | | | | | | | | | | | | | | | | | | | | | | | | |
(Debit) credit to P&L | | | (4,565 | ) | | | (8,239 | ) | | | (16,740 | ) | | | 2,836 | | | | 172 | | | | 357 | | | | (18,891 | ) | | | (45,070 | ) |
Reclassification | | | 1,063 | | | | — | | | | (4,916 | ) | | | — | | | | — | | | | (1,263 | ) | | | 2,721 | | | | (2,395 | ) |
| | | | | | | | | | | | | | | | | | | | | | | | | | | | | | | | |
At December 31, 2020 | | | 87,988 | | | | 15,906 | | | | 17,203 | | | | 39,026 | | | | 15,108 | | | | 8,917 | | | | 23,396 | | | | 207,544 | |
| | | | | | | | | | | | | | | | | | | | | | | | | | | | | | | | |
| | | | | | | | | | | | | | | | | | | | | | | | | | | | | | | | | | | | | | | | |
Deferred income tax assets | | Provisions | | | Accelerated
tax
depreciation | | | Tax
losses | | | Work in
process | | | Accrual for
unpaid
vacations | | | Investments in
subsidiaries | | | Impairment | | | Tax
Goodwill | | | Others | | | Total | |
At January 1, 2016 | | | 20,949 | | | | 14,892 | | | | 91,313 | | | | 24,103 | | | | 14,977 | | | | 1,476 | | | | — | | | | 17,522 | | | | 16,543 | | | | 201,775 | |
| | | | | | | | | | | | | | | | | | | | | | | | | | | | | | | | | | | | | | | | |
Charge (credit) to P&L | | | 84,571 | | | | 1,489 | | | | 51,163 | | | | (6,489 | ) | | | (2,005 | ) | | | (312 | ) | | | 172,052 | | | | 3,003 | | | | 3,322 | | | | 306,794 | |
Charge (credit) to equity | | | 159 | | | | — | | | | — | | | | — | | | | — | | | | — | | | | — | | | | — | | | | — | | | | 159 | |
Charge (credit) to ORI | | | — | | | | — | | | | — | | | | — | | | | — | | | | — | | | | — | | | | — | | | | (343 | ) | | | (343 | ) |
Adquisition of subsidiary (Adexus) | | | — | | | | — | | | | 10,607 | | | | — | | | | — | | | | — | | | | — | | | | — | | | | (3,313 | ) | | | 7,294 | |
Others | | | — | | | | — | | | | — | | | | — | | | | — | | | | (556 | ) | | | — | | | | — | | | | (725 | ) | | | (1,281 | ) |
| | | | | | | | | | | | | | | | | | | | | | | | | | | | | | | | | | | | | | | | |
At December 31, 2016 | | | 105,679 | | | | 16,381 | | | | 153,083 | | | | 17,614 | | | | 12,972 | | | | 608 | | | | 172,052 | | | | 20,525 | | | | 15,484 | | | | 514,398 | |
| | | | | | | | | | | | | | | | | | | | | | | | | | | | | | | | | | | | | | | | |
Charge (credit) to P&L | | | (12,614 | ) | | | 79,637 | | | | (8,555 | ) | | | 21,873 | | | | 2,166 | | | | 118 | | | | 28,593 | | | | (112 | ) | | | 18,358 | | | | 129,464 | |
Charge (credit) to equity | | | (8,882 | ) | | | — | | | | — | | | | — | | | | — | | | | — | | | | (7,493 | ) | | | — | | | | (347 | ) | | | (16,722 | ) |
Reclassification | | | (30,901 | ) | | | — | | | | — | | | | — | | | | — | | | | (726 | ) | | | 31,627 | | | | — | | | | — | | | | — | |
Sale of subsidiary (GMD S.A.) | | | (683 | ) | | | (9,367 | ) | | | (438 | ) | | | — | | | | (1,697 | ) | | | — | | | | — | | | | — | | | | (236 | ) | | | (12,421 | ) |
Others | | | (160 | ) | | | — | | | | (1 | ) | | | — | | | | (1 | ) | | | — | | | | 1 | | | | — | | | | (5,123 | ) | | | (5,284 | ) |
| | | | | | | | | | | | | | | | | | | | | | | | | | | | | | | | | | | | | | | | |
At December 31, 2017 | | | 52,439 | | | | 86,651 | | | | 144,089 | | | | 39,487 | | | | 13,440 | | | | — | | | | 224,780 | | | | 20,413 | | | | 28,136 | | | | 609,435 | |
| | | | | | | | | | | | | | | | | | | | | | | | | | | | | | | | | | | | | | | | |
Charge (credit) to P&L | | | 702 | | | | (83,561 | ) | | | 25,733 | | | | (5,482 | ) | | | 1,784 | | | | — | | | | 35,289 | | | | (2,365 | ) | | | (14,096 | ) | | | (41,996 | ) |
Charge (credit) to equity | | | — | | | | — | | | | — | | | | — | | | | — | | | | — | | | | — | | | | — | | | | (95 | ) | | | (95 | ) |
Sale of subsidiary | | | (14,775 | ) | | | (2,169 | ) | | | (33,512 | ) | | | — | | | | (6,215 | ) | | | — | | | | (6,462 | ) | | | — | | | | (944 | ) | | | (64,077 | ) |
Others | | | — | | | | — | | | | — | | | | — | | | | — | | | | — | | | | — | | | | — | | | | 1,675 | | | | 1,675 | |
| | | | | | | | | | | | | | | | | | | | | | | | | | | | | | | | | | | | | | | | |
At December 31, 2018 | | | 38,366 | | | | 921 | | | | 136,310 | | | | 34,005 | | | | 9,009 | | | | — | | | | 253,607 | | | | 18,048 | | | | 14,676 | | | | 504,942 | |
| | | | | | | | | | | | | | | | | | | | | | | | | | | | | | | | | | | | | | | | |
- 96 -
| | | | | | | | | | | | | | | | | | | | | | | | | | | | | | | | | | | | | | | | |
Deferred income tax assets | | Provisions | | | Accelerated
tax
depreciation | | | Tax
losses | | | Work in
process | | | Accrual
for
unpaid
vacations | | | Impairment | | | NIIF 9 | | | Tax
Goodwill | | | Others | | | Total | |
At January 1, 2018 | | | 52,439 | | | | 86,651 | | | | 144,089 | | | | 39,487 | | | | 13,440 | | | | 224,780 | | | | — | | | | 20,413 | | | | 28,136 | | | | 609,435 | |
Debit (credit) to P&L | | | (1,336 | ) | | | (82,065 | ) | | | 32,952 | | | | (5,482 | ) | | | 2,529 | | | | 35,289 | | | | — | | | | (2,365 | ) | | | (19,086 | ) | | | (39,564 | ) |
Debit (credit) to
equity | | | — | | | | — | | | | — | | | | — | | | | — | | | | — | | | | — | | | | — | | | | (95 | ) | | | (95 | ) |
Sale of subsidiary | | | (8,531 | ) | | | (3,665 | ) | | | 1,248 | | | | — | | | | (6,187 | ) | | | (6,302 | ) | | | — | | | | — | | | | (11,046 | ) | | | (34,483 | ) |
Others | | | — | | | | — | | | | — | | | | — | | | | — | | | | — | | | | — | | | | — | | | | (1,670 | ) | | | (1,670 | ) |
| | | | | | | | | | | | | | | | | | | | | | | | | | | | | | | | | | | | | | | | |
At December 31, 2018 | | | 42,572 | | | | 921 | | | | 178,289 | | | | 34,005 | | | | 9,782 | | | | 253,767 | | | | — | | | | 18,048 | | | | (3,761 | ) | | | 533,623 | |
| | | | | | | | | | | | | | | | | | | | | | | | | | | | | | | | | | | | | | | | |
Debit (credit) to
P&L | | | 804 | | | | 7,512 | | | | 14,343 | | | | 11,715 | | | | 1,842 | | | | (205,265 | ) | | | 46,804 | | | | (4,526 | ) | | | 24,289 | | | | (102,482 | ) |
Debit (credit) to
equity | | | — | | | | — | | | | — | | | | — | | | | — | | | | — | | | | — | | | | — | | | | (3 | ) | | | (3 | ) |
IFRIC 23 adoption | | | — | | | | — | | | | (986 | ) | | | — | | | | — | | | | — | | | | — | | | | — | | | | — | | | | (986 | ) |
Others | | | — | | | | — | | | | — | | | | — | | | | — | | | | — | | | | — | | | | — | | | | (16,158 | ) | | | (16,158 | ) |
| | | | | | | | | | | | | | | | | | | | | | | | | | | | | | | | | | | | | | | | |
At December 31, 2019 | | | 43,376 | | | | 8,433 | | | | 191,646 | | | | 45,720 | | | | 11,624 | | | | 48,502 | | | | 46,804 | | | | 13,522 | | | | 4,367 | | | | 413,994 | |
| | | | | | | | | | | | | | | | | | | | | | | | | | | | | | | | | | | | | | | | |
Debit (credit) to
P&L | | | (38,130 | ) | | | 374 | | | | (8,767 | ) | | | (12,298 | ) | | | 1,416 | | | | 3,257 | | | | (10,874 | ) | | | (4,518 | ) | | | 19,160 | | | | (50,380 | ) |
Reclassification | | | 24,340 | | | | (1,154 | ) | | | 3,616 | | | | (28,630 | ) | | | — | | | | (507 | ) | | | 10,067 | | | | 4,989 | | | | (15,116 | ) | | | (2,395 | ) |
Others | | | — | | | | — | | | | — | | | | — | | | | — | | | | — | | | | — | | | | — | | | | 5,583 | | | | 5,583 | |
| | | | | | | | | | | | | | | | | | | | | | | | | | | | | | | | | | | | | | | | |
At December 31, 2020 | | | 29,586 | | | | 7,653 | | | | 186,495 | | | | 4,792 | | | | 13,040 | | | | 51,252 | | | | 45,997 | | | | 13,993 | | | | 13,994 | | | | 366,802 | |
| | | | | | | | | | | | | | | | | | | | | | | | | | | | | | | | | | | | | | | | |
As of December 31, 2018,2020, the total tax loss amounts to S/468.8646.6 million and is composed as follows:
| | | | | | | | | | | | | | | | | | | | | | | | |
Company | | | | | Tax loss apli-
cation method | | | Application | | | Statute of
Limitations | |
| | 2019 | | | 2020 | | | Forward | |
GyM S.A. | | | 277,541 | | | | B | | | | 8,801 | | | | 19,417 | | | | 249,323 | | | | | |
Vial y Vives - DSD | | | 76,474 | | | | N/A | | | | 11,022 | | | | 13,226 | | | | 52,226 | | | | | |
Graña y Montero S.A.A. | | | 56,906 | | | | A | | | | 46,278 | | | | 10,628 | | | | — | | | | 2022 | |
GMP S.A. | | | 17,225 | | | | A | | | | — | | | | 5,786 | | | | 11,438 | | | | 2020 / 2021 | |
TGNCA | | | 15,989 | | | | B | | | | — | | | | — | | | | 15,989 | | | | | |
Viva GyM S.A. | | | 12,497 | | | | B | | | | — | | | | — | | | | 12,497 | | | | | |
Consorcio Italo Peruano | | | 3,870 | | | | A | | | | 3,870 | | | | — | | | | — | | | | 2020 | |
Consorcio Peruano de Conservación | | | 3,791 | | | | A | | | | — | | | | 3,243 | | | | 549 | | | | 2020 / 2021 | |
Consorcio Huacho-Pativilca | | | 1,457 | | | | A | | | | 1,457 | | | | — | | | | — | | | | 2022 | |
Others | | | 3,055 | | | | | | | | 1,195 | | | | 142 | | | | 1,718 | | | | | |
| | | | | | | | | | | | | | | | | | | | | | | | |
| | | 468,806 | | | | | | | | 72,624 | | | | 52,442 | | | | 343,739 | | | | | |
| | | | | | | | | | | | | | | | | | | | | | | | |
| | | | | | | | | | | | | | | | | | | | | | | | |
| | | Tax | | | Tax loss
aplication | | | Application | | | Statute of | |
| | | loss | | | method | | | 2020 | | | 2021 | | | Forward | | | limitations | |
Cumbra Peru S.A. | | | 354,381 | | | | B | | | | 25,722 | | | | 19,893 | | | | 308,766 | | | | — | |
Adexus | | | 149,303 | | | | N/A | | | | — | | | | — | | | | 149,303 | | | | — | |
VyV-DSD S.A. | | | 103,886 | | | | N/A | | | | 18,870 | | | | 22,395 | | | | 62,621 | | | | — | |
Transportadora de Gas Natural Comprimido Andino S.A.C. | | | 15,989 | | | | B | | | | — | | | | — | | | | 15,989 | | | | — | |
Viva Negocio Inmobiliario S.A. | | | 9,454 | | | | A | | | | — | | | | 9,454 | | | | — | | | | 2022 | |
GyM Chile SPA | | | 4,236 | | | | N/A | | | | — | | | | — | | | | 4,236 | | | | — | |
Cumbra Ingenieria S.A. | | | 3,052 | | | | A | | | | 3,052 | | | | — | | | | — | | | | 2025 | |
UNNA ENERGIA S.A. | | | 2,092 | | | | A | | | | — | | | | — | | | | 2,092 | | | | 2025 | |
Survial S.A. | | | 1,526 | | | | B | | | | 1,526 | | | | — | | | | — | | | | — | |
Incolur DSD | | | 1,507 | | | | N/A | | | | — | | | | — | | | | 1,507 | | | | — | |
AENZA S.A.A. | | | 1,014 | | | | A | | | | 1,014 | | | | — | | | | — | | | | 2022 | |
Qualys S.A. | | | 162 | | | | A | | | | 162 | | | | — | | | | — | | | | 2025 | |
| | | | | | | | | | | | | | | | | | | | | | | | |
| | | 646,602 | | | | | | | | 50,346 | | | | 51,742 | | | | 544,514 | | | | | |
| | | | | | | | | | | | | | | | | | | | | | | | |
According to Peruvian legislation, there are two ways to compensate for tax losses:
| | 1. | System A, it is allowed to offset the tax loss in future years up to the following four (4) years from the date the loss is incurred. According to Legislative Decree No. 1481 of May 2020, the application term is extended until five (5) years with respect to the tax loss generated in fiscal year 2020. |
| | 2. | System B. The tax loss may be offset in future years up to 50% of the net rent of each year. This option does not consider a statute of limitations. |
The taxable goodwill relates to the tax credit generated in the reorganization of the Chilean subsidiaries in 2014, in accordance with such legislation. In 2016, the arbitration related to the Collahuasi project was closed, and an additional payment to the sellers of the Chilean subsidiary was determined, which originated the increase of this temporary item.
Deferred income corresponds to income that, according to Colombian tax regulations, is not recognized as such for tax purposes until certain requirements are met.
2625 | WORKERS’ PROFIT SHARING |
The distribution of the workers’ profit sharing included in Note 27-i)the income statement for the years ended December 31 is shown below:
| | | | | | | | | | | | |
| | | 2016 | | | 2017 | | | 2018 | |
Cost of sales of goods and services | | | 8,547 | | | | 2,215 | | | | 5,274 | |
Administrative expenses | | | 1,297 | | | | 7,562 | | | | 2,588 | |
| | | | | | | | | | | | |
| | | 9,844 | | | | 9,777 | | | | 7,862 | |
| | | | | | | | | | | | |
- 97 -
| | | | | | | | | | | | |
| | | 2018 | | | 2019 | | | 2020 | |
Cost of sales of goods and services | | | 5,274 | | | | 4,661 | | | | 2,147 | |
Administrative expenses | | | 2,588 | | | | 1,679 | | | | 23 | |
| | | | | | | | | | | | |
| | | 7,862 | | | | 6,340 | | | | 2,170 | |
| | | | | | | | | | | | |
2726 | COSTS AND EXPENSES BY NATURE |
For the years ended December 31, the detail of this item is as follows:
| | | | Cost of
goods and
services | | | Administrative
expenses | | |
2016 | | | | | |
Services provided by third-parties | | | 1,417,412 | | | | 89,328 | | |
Salaries, wages and fringe benefits | | | 875,470 | | | | 153,927 | | |
Purchase of goods | | | 629,765 | | | | — | | |
Impairment of accounts receivable (ii) | | | 419,584 | | | | — | | |
Other management charges | | | 256,541 | | | | 21,361 | | |
Depreciation | | | 111,404 | | | | 7,428 | | |
Amortization | | | 59,682 | | | | 4,890 | | |
Impairment of inventories | | | 37,454 | | | | — | | |
Taxes | | | 6,982 | | | | 1,369 | | |
Impairment of property, plant and equipment | | | 6,926 | | | | — | | |
| | | | | | | |
Total report reclassified | | | 3,821,220 | | | | 278,303 | | |
| | | | | | | |
2017 | | | | | |
Services provided by third-parties | | | 1,268,665 | | | | 104,950 | | |
Salaries, wages and fringe benefits | | | 919,409 | | | | 134,695 | | |
Purchase of goods | | | 856,745 | | | | 140 | | |
Other management charges | | | 235,102 | | | | 48,057 | | |
Depreciation | | | 103,566 | | | | 5,776 | | |
Amortization | | | 67,381 | | | | 3,002 | | |
Impairment of inventories | | | 40,592 | | | | — | | |
Impairment of property, plant and equipment | | | 11,928 | | | | 20 | | |
Taxes | | | 7,470 | | | | 7,408 | | |
Impairment of accounts receivable (ii) | | | 703 | | | | 18,406 | | |
| | | | | | | |
Total report reclassified | | | 3,511,561 | | | | 322,454 | | |
| | | | | | | | Cost
of goods
and services | | | Administrative
expenses | | | Total | |
2018 | | | | | | | | | | |
Services provided by third-parties | | | 1,064,687 | | | | 98,060 | | | | 1,123,461 | | | | 105,217 | | | | 1,228,678 | |
Salaries, wages and fringe benefits (i) | | | 817,392 | | | | 105,505 | | | | 901,029 | | | | 127,001 | | | | 1,028,030 | |
Purchase of goods | | | 755,209 | | | | — | | | | 862,940 | | | | — | | | | 862,940 | |
Other management charges | | | 375,308 | | | | 43,533 | | | | 375,308 | | | | 43,533 | | | | 418,841 | |
Amortization | | | 98,318 | | | | 4,856 | | |
Depreciation | | | 81,199 | | | | 5,135 | | |
Depreciation (Note 16.1) | | | | 91,249 | | | | 6,600 | | | | 97,849 | |
Amortization (Note 17.e) | | | | 101,378 | | | | 7,293 | | | | 108,671 | |
Impairment of accounts receivable (ii) | | | 45,658 | | | | 19,418 | | | | 45,658 | | | | 19,418 | | | | 65,076 | |
Taxes | | | 8,727 | | | | 1,926 | | | | 8,930 | | | | 2,101 | | | | 11,031 | |
Impairment of property, plant and equipment | | | 5,468 | | | | — | | | | 5,468 | | | | — | | | | 5,468 | |
Inventory recovery | | | (26,993 | ) | | | — | | | | (26,993 | ) | | | — | | | | (26,993 | ) |
| | | | | | | | | | | | | | | |
Total report reclassified | | | 3,224,973 | | | | 278,433 | | |
| | | | | | | | | 3,488,428 | | | | 311,163 | | | | 3,799,591 | |
| | | | | | | | | | |
| | | | | | | | | | | | |
| | | Cost
of goods
and services | | | Administrative
expenses | | | Total | |
2019 | | | | | | | | | | | | |
Services provided by third-parties | | | 1,500,897 | | | | 65,154 | | | | 1,566,051 | |
Salaries, wages and fringe benefits (i) | | | 1,040,293 | | | | 143,317 | | | | 1,183,610 | |
Purchase of goods | | | 942,633 | | | | 33 | | | | 942,666 | |
Other management charges | | | 174,678 | | | | 27,708 | | | | 202,386 | |
Depreciation (Note 16.1) | | | 108,066 | | | | 4,252 | | | | 112,318 | |
Amortization (Note 17.e) | | | 101,810 | | | | 5,689 | | | | 107,499 | |
Impairment of accounts receivable (ii) | | | 8,183 | | | | — | | | | 8,183 | |
Taxes | | | 6,951 | | | | 2,499 | | | | 9,450 | |
Impairment of property, plant and equipment | | | 3,907 | | | | — | | | | 3,907 | |
Impairment of investments | | | 255 | | | | — | | | | 255 | |
Inventory recovery | | | (249 | ) | | | — | | | | (249 | ) |
| | | | | | | | | | | | |
| | | 3,887,424 | | | | 248,652 | | | | 4,136,076 | |
| | | | | | | | | | | | |
| | | | | | | | | | | | |
| | | Cost
of goods
and services | | | Administrative
expenses | | | Total | |
2020 | | | | | | | | | | | | |
Services provided by third-parties | | | 987,995 | | | | 39,000 | | | | 1,026,995 | |
Salaries, wages and fringe benefits (i) | | | 1,010,315 | | | | 86,943 | | | | 1,097,258 | |
Purchase of goods | | | 608,424 | | | | 73 | | | | 608,497 | |
Other management charges | | | 158,929 | | | | 14,322 | | | | 173,251 | |
Depreciation (Note 16.1) | | | 90,146 | | | | 8,358 | | | | 98,504 | |
Amortization (Note 17.e) | | | 94,483 | | | | 4,138 | | | | 98,621 | |
Impairment of accounts receivable (ii) | | | 32,215 | | | | 4 | | | | 32,219 | |
Taxes | | | 5,956 | | | | 71 | | | | 6,027 | |
Impairment of property, plant and equipment | | | 4,950 | | | | — | | | | 4,950 | |
Impairment of investments | | | 38 | | | | — | | | | 38 | |
Inventory recovery | | | (30 | ) | | | — | | | | (30 | ) |
| | | | | | | | | | | | |
| | | 2,993,421 | | | | 152,909 | | | | 3,146,330 | |
| | | | | | | | | | | | |
(i) For the years ended on December 31, salaries, wages and fringe benefits comprise the following:
| | | | | | | | | | | | |
| | | 2018 | | | 2019 | | | 2020 | |
Salaries | | | 718,453 | | | | 853,579 | | | | 814,874 | |
Statutory gratification | | | 87,984 | | | | 93,262 | | | | 91,189 | |
Social contributions | | | 74,184 | | | | 61,533 | | | | 57,763 | |
Employee’s severance indemnities | | | 50,852 | | | | 49,944 | | | | 60,090 | |
Vacations | | | 44,482 | | | | 42,025 | | | | 42,135 | |
Workers’ profit sharing (Note 25) | | | 7,862 | | | | 6,340 | | | | 2,170 | |
Others | | | 44,213 | | | | 76,927 | | | | 29,037 | |
| | | | | | | | | | | | |
| | | 1,028,030 | | | | 1,183,610 | | | | 1,097,258 | |
| | | | | | | | | | | | |
(ii) For the years ended December 31, the impairment of accounts receivable includes the following:
| | | | | | | | | | | | |
| | | 2018 | | | 2019 | | | 2020 | |
Trade accounts receivables (Note 10) | | | 3,065 | | | | 955 | | | | 19,772 | |
Other accounts receivable (Note 13.i) | | | 44,252 | | | | 5,704 | | | | 12,318 | |
Accounts receivable from related parties | | | 17,759 | | | | 1,524 | | | | 129 | |
| | | | | | | | | | | | |
| | | 65,076 | | | | 8,183 | | | | 32,219 | |
| | | | | | | | | | | | |
(i) | For the years ended on December 31, salaries, wages and fringe benefits comprise the following:
|
| | | | | | | | | | | | |
| | | 2,016 | | | 2,017 | | | 2,018 | |
Salaries | | | 773,630 | | | | 747,195 | | | | 629,641 | |
Social contributions | | | 87,460 | | | | 106,797 | | | | 80,697 | |
Statutory gratification | | | 57,974 | | | | 76,330 | | | | 73,297 | |
Employee’s severance indemnities | | | 40,411 | | | | 43,399 | | | | 50,852 | |
Others | | | 23,436 | | | | 37,003 | | | | 41,327 | |
Vacations | | | 36,642 | | | | 33,603 | | | | 39,221 | |
Worker’s profit sharing (Note 26) | | | 9,844 | | | | 9,777 | | | | 7,862 | |
| | | | | | | | | | | | |
| | | 1,029,397 | | | | 1,054,104 | | | | 922,897 | |
| | | | | | | | | | | | |
| | | | | | | | | | | | |
- 98 -
(ii) | Detail of impairment of accounts receivable:
|
| | | | | | | | | | | | | | | | | | | | |
Year | | Trade
accounts
receivables | | | Other
accounts
receivable | | | Work in
progress,
net | | | Accounts
receivable
from related
parties | | | Total | |
2016 | | | 3,052 | | | | 6,333 | | | | 410,199 | | | | — | | | | 419,584 | |
2017 | | | 724 | | | | — | | | | — | | | | 18,385 | | | | 19,109 | |
2018 | | | 3,065 | | | | 44,252 | | | | — | | | | 17,759 | | | | 65,076 | |
| | | | | | | | | | | | | | | | | | | | |
Total | | | 6,841 | | | | 50,585 | | | | 410,199 | | | | 36,144 | | | | 503,769 | |
| | | | | | | | | | | | | | | | | | | | |
- 99 -
2827 | FINANCIAL INCOME AND EXPENSES |
For the years ended on December 31, these items include the following:
| | | | | | | | | | | | |
| | | 2016 | | | 2017 | | | 2018 | |
Financial income: | | | | | | | | | | | | |
Interest on loans to third parties | | | 6,142 | | | | 577 | | | | 27,060 | |
Fair value of accounts receivables | | | — | | | | — | | | | 9,786 | |
Interest on short-term bank deposits | | | 7,277 | | | | 5,123 | | | | 3,811 | |
Commissions and collaterals | | | — | | | | 12 | | | | 1,448 | |
Exchange rate gain, net | | | — | | | | 5,603 | | | | — | |
Others | | | 4,806 | | | | 2,427 | | | | 8,820 | |
| | | | | | | | | | | | |
| | | 18,225 | | | | 13,742 | | | | 50,925 | |
| | | | | | | | | | | | |
Financial expenses: | | | | | | | | | | | | |
Interest expense: | | | | | | | | | | | | |
- Bank loans | | | 88,828 | | | | 93,238 | | | | 114,376 | |
- Loans from third parties | | | 264 | | | | 6,784 | | | | 31,296 | |
- Commissions and collaterals | | | 9,156 | | | | 15,537 | �� | | | 31,668 | |
- Financial lease | | | 5,943 | | | | 4,722 | | | | 2,908 | |
- Bonds | | | 25,352 | | | | 28,804 | | | | 3,361 | |
Exchange difference loss, net | | | 12,750 | | | | — | | | | 23,276 | |
Derivative financial instruments | | | 1,248 | | | | 739 | | | | 268 | |
Loss by measurement of financial asset fair value (Note 13) | | | 76,864 | | | | 8,059 | | | | 25,796 | |
Other financial expenses | | | 14,481 | | | | 24,802 | | | | 23,200 | |
Less; capitalized interest | | | (36,831 | ) | | | (31,908 | ) | | | (8,167 | ) |
| | | | | | | | | | | | |
| | | 198,055 | | | | 150,777 | | | | 247,982 | |
| | | | | | | | | | | | |
- 100 -
| | | | | | | | | | | | |
| | | 2018 | | | 2019 | | | 2020 | |
Financial income: | | | | | | | | | | | | |
Interest on loans to third parties | | | 27,060 | | | | 36,876 | | | | 863 | |
Profit for present value of financial asset or financial liability | | | 9,786 | | | | 30,408 | | | | 32,734 | |
Interest on short-term bank deposits | | | 3,811 | | | | 4,770 | | | | 2,457 | |
Commissions and collaterals | | | 1,448 | | | | 535 | | | | 601 | |
Others | | | 9,431 | | | | 1,757 | | | | 2,765 | |
| | | | | | | | | | | | |
| | | 51,536 | | | | 74,346 | | | | 39,420 | |
| | | | | | | | | | | | |
Financial expenses: | | | | | | | | | | | | |
Interest expense: | | | | | | | | | | | | |
- Bank loans | | | 100,256 | | | | 93,019 | | | | 69,420 | |
- Bonds | | | 27,388 | | | | 26,113 | | | | 26,771 | |
- Loans from third parties | | | 32,431 | | | | 16,275 | | | | 12,612 | |
- Right-of-use | | | — | | | | 5,978 | | | | 4,600 | |
- Financial lease | | | 3,768 | | | | 2,218 | | | | 3,139 | |
Commissions and collaterals | | | 31,668 | | | | 24,521 | | | | 14,077 | |
Loss for present value of financial asset or financial liability | | | 25,796 | | | | 41,131 | | | | 4,552 | |
Exchange difference loss, net | | | 23,704 | | | | 32,840 | | | | 5,802 | |
Derivative financial instruments | | | 268 | | | | 92 | | | | 64 | |
Other financial expenses | | | 23,656 | | | | 18,176 | | | | 20,793 | |
Less capitalized interest | | | (8,167 | ) | | | (7,229 | ) | | | (4,887 | ) |
| | | | | | | | | | | | |
| | | 260,768 | | | | 253,134 | | | | 156,943 | |
| | | | | | | | | | | | |
2928 | OTHER INCOME AND EXPENSES, NET |
For the years ended December 31, these items include the following:
| | | | | | | | | | | | |
| | | 2016 | | | 2017 | | | 2018 | |
Other income: | | | | | | | | | | | | |
Sales of property, plant and equipment | | | 26,034 | | | | 93,013 | | | | 26,007 | |
Sale of investments | | | 46 | | | | — | | | | 13,475 | |
Reversal of legal and tax provisions | | | 14,959 | | | | 79 | | | | 20 | |
Present value of the liability from put option | | | — | | | | — | | | | 6,122 | |
Legal indemnities | | | 8,957 | | | | — | | | | — | |
Others | | | 18,033 | | | | 6,466 | | | | 12,795 | |
| | | | | | | | | | | | |
| | | 68,029 | | | | 99,558 | | | | 58,419 | |
| | | | | | | | | | | | |
Other expenses: | | | | | | | | | | | | |
Legal contingency - Law 30737 (Note 23) | | | — | | | | — | | | | 73,500 | |
Net cost of property, plant and equipment disposal | | | 22,305 | | | | 78,378 | | | | 36,931 | |
Impairment of goodwill and trademarks | | | 54,308 | | | | 49,608 | | | | — | |
Loss on remeasurement of previously held interest (Note33-a) | | | 6,832 | | | | — | | | | — | |
Others | | | 6,944 | | | | 4,441 | | | | 9,323 | |
| | | | | | | | | | | | |
| | | 90,389 | | | | 132,427 | | | | 119,754 | |
| | | | | | | | | | | | |
| | | (22,360 | ) | | | (32,869 | ) | | | (61,335 | ) |
| | | | | | | | | | | | |
| | | | | | | | | | | | |
| | | 2018 | | | 2019 | | | 2020 | |
Other income: | | | | | | | | | | | | |
Sale of assets | | | 26,007 | | | | 12,748 | | | | 9,118 | |
Sale of investments | | | 13,475 | | | | — | | | | — | |
Penalty income | | | — | | | | 984 | | | | 1,168 | |
Supplier debt forgiveness | | | — | | | | 19,026 | | | | 14,545 | |
Recovery of provisions and impairments | | | — | | | | 23,279 | | | | 6,501 | |
Trademarks revaluation | | | — | | | | 20,676 | | | | — | |
Profit from Mizuho Bank Ltd. agreement (a) | | | — | | | | 89,688 | | | | — | |
Present value of the liability from put option | | | 6,122 | | | | — | | | | — | |
Others | | | 12,815 | | | | 13,384 | | | | 4,267 | |
| | | | | | | | | | | | |
| | | 58,419 | | | | 179,785 | | | | 35,599 | |
| | | | | | | | | | | | |
Other expenditures: | | | | | | | | | | | | |
Asset impairment (b) | | | — | | | | 339,774 | | | | 103,074 | |
Civil repair to the Peruvian Government | | | 73,500 | | | | 69,150 | | | | 64,571 | |
Net cost of fixed assets disposal | | | 36,931 | | | | 23,697 | | | | 8,682 | |
Legal and tax litigation | | | — | | | | 49,754 | | | | 32,186 | |
Renegotiation of contract with suppliers | | | — | | | | — | | | | 4,889 | |
Present value of the call option | | | — | | | | 4,697 | | | | 2,326 | |
Provision for well closure | | | — | | | | 4,055 | | | | 112 | |
Administrative fine | | | — | | | | 1,423 | | | | 1,897 | |
Others | | | 13,842 | | | | 26,729 | | | | 708 | |
| | | | | | | | | | | | |
| | | 124,273 | | | | 519,279 | | | | 218,445 | |
| | | | | | | | | | | | |
| | | (65,854 | ) | | | (339,494 | ) | | | (182,846 | ) |
| | | | | | | | | | | | |
30(a) | Corresponds to the refinancing agreement linked to the contract signed between Tren Urbano de Lima S.A. and Mitzuho Bank Ltd. where the Company acted as an endorsement of the transaction. Under the contract, a bond letter was issued with Mitzuho Bank Ltd. for it to be covered with a financial derivative required for the closing of the CPAOs purchase operation of the Expansion Project. The contract further indicated that in the event that the bank refinanced the debt obtained for the purchase of the CPAOS, the Company received 70% of the gains obtained. |
| (b) | As of December 31, 2020, corresponds a impairment of accounts receivable generated by the subsidiary Concessionaire Via Expresa Sur S.A. for S/55.8 million (Note 13(i)), as a consequence of the new estimates of the Company regarding the recovery of the investment it maintains in the project, this project concession contract has been suspended by mutual agreement with the Municipality of Lima since June; impairment accounted in CAM Holding S.P.A. for S/12.5 million for claims accepted against the guarantee account (Note 13), and impairment of accounts receivable generated by the subsidiary Concar S.A.C. for S/33.8 million to the Regional Government of Cusco (Note 10); other minor for S/0.5 million from other accounts receivable (Note 13) and S/0.1 million from trade accounts receivable (Note 10) (as of December 31, 2019 corresponds to a provision for impairment of accounts receivable from GSP for S/276 million; the subsidiary Promotora Larco Mar SA recognized an impairment in its assets in progress for S/18.2 million; the subsidiary Cumbra Peru S.A. recognized an impairment of intangibles for S/35.4 million; the subsidiary Adexus recognized an impairment of Intangibles for S/10.1 million). |
| | a) | In accordance withEach company of the current legislation in Peru, Chile, Colombia, Ecuador, Bolivia, and Panama, each Group CompanyCorporation is individually subject to the applicable taxes.taxes in Peru, Chile and Colombia. Management considers that it has determined the taxable amount ofincome under general income tax laws in accordance with the tax legislation in force incurrent effective of each country.
|
| | b) | Amendments toChanges in the Peruvian income tax lawIncome Tax Law in Colombia -
|
By means of legislative decree No. 1261, enacted on December 10, 2016, amendments have been made toWith the income tax Law, effective from 2017 onwards. This amendment establishes the third category income tax rate at 29.5%. Likewise, the aforementioned decree establishes the dividend tax rate for natural persons and legal persons not domiciled at 5% for dividends from 2017 onwards. The accumulated profits until December 31, 2016, remained affected at the rate of 6.8%, independententry into force of the date whenlaw 2010 of December 2019 law of economic growth, employment, investment, strengthening of public finances and the distribution is agreed or occurs in subsequent periods.
| c) | Amendments to the Chilean Income Tax Law
|
On February 1, 2016, law No. 20899 was enacted, which simplifiesprogressivity, equity and clarifies the applicationefficiency of the tax reform defined in the aforementioned law. With respect to income tax, two systems have been established:
| i. | Attributable income system: This system, gradually increases the first category tax rate, 21% in 2014, 22.5% in 2015, 24% in 2016, to 25% in 2017. Their choice is restricted to companies whose partners are natural persons domiciled or resident in Chile or natural or legal persons without domicile or residence in Chile. This system imposes taxes on the partners of Chilean entities on an annual basis regardless of any effective distribution of the local entity’s profits, with the right to use the tax paid in full as a tax credit.
|
| ii. | Partially integrated system: The first category tax rate is gradually increased by 21% in 2014, 22.5% in 2015, 24% in 2016, 25.5% in 2017, to 27% in 2018. Corporations, open or closed, and companies in which at least one of their owners is not a natural person (domiciled or not) or a legal person not domiciled are subject to this system. This system burdens the shareholders of Chilean entities that distribute dividends and entitles them to use said distribution as a tax credit in 65% of the total taxes paid. This limit does not apply to investors with whom Chile has signed double taxation avoidance agreements, as is the case with Peru.
|
- 101 -
| d) | Amendments to the Colombian income tax legislation
|
In December 2016, law No. 1819 was published modifying the tax Code, effective from 2017. The main modifications are as follows:
The income tax rates in force until 2016 (income tax + cree + surcharge) have been simplified to a single income tax rate of 34% and a temporary surcharge of 6% by 2017 and an income tax rate of 33% and a temporary surcharge of 4% by 2018 on a taxable income greater than S/895 thousand (equivalent to COP800 million).
The presumptive income, applicable when there are tax losses or when it is greater than ordinary income, will have as its taxable base 3.5% of liquid equity (formerly 3%) and may be compensated with future taxable income.
Tax losses may be offset in the following twelve (12) years from their generation.was stipulated as of January 1, 2020.
The special rate for dividends and participations received by foreign companies will be 5%.
The VAT rate changes from 16% to 19%.
As of tax year 2017, the term of the firmness of the declarations will be three (3) years. However, some terms may be longer, as is the case of companies that are obliged to transfer prices whose firmness of the declarations will be six (6) years. For the declarations that generate tax losses the term of firmness will be from twelve (12) to fifteen (15) years.
In December 2018, law No. 1943 was published modifying the tax statute, whose application or validity begins in 2019. The main modifications are as follows:
Presumptive rent rate reduced to 1.5% for taxable years 2019 and 2020, and to 0% beginning with the taxable year 2021
The general income tax rate applicable to national companies shallsocieties, permanent establishments and foreign legal entities will be reduced as follows: 33% by 2019, 32% by 2020,, 31% by 2021 and 30% for the periods 2020,2021 and 2022, respectively.
Payments abroad for interest, commissions, fees, royalties, leases, personal services are subject to withholding tax at the rate of 20%. Payments for consulting, technical services and technical assistance provided by 2022.non-residents are subject to the 20% withholding tax rate. Payments for financial returns to non-residents are subject to the 15% withholding tax rate. Payments to the parent company for management fee, are subject to the 33% withholding tax rate.
In case of an increase in taxable income of 30% with respect to the previous year, for fiscal years 2020 and 2021, the statute of limitation of the returns would be six (6) months and in the case of a 20% increase year will be close at month twelve (12).
| | e)c) | The income tax expense shown in the consolidated statement of income comprisescomprises: |
| | | | | | | | | | | | |
| | | 2016 | | | 2017 | | | 2018 | |
| | | (as restated) | |
Current income tax | | | 169,428 | | | | 168,143 | | | | 150,020 | |
Deferred income tax (Note 25) | | | (280,911 | ) | | | (44,550 | ) | | | (23,594 | ) |
PPUA | | | (7,789 | ) | | | 613 | | | | — | |
| | | | | | | | | | | | |
| | | (119,272 | ) | | | 124,206 | | | | 126,426 | |
(-) Discontinued operations | | | (32,910 | ) | | | (77,901 | ) | | | (13,108 | ) |
| | | | | | | | | | | | |
Income tax | | | (152,182 | ) | | | 46,305 | | | | 113,318 | |
| | | | | | | | | | | | |
Under Chilean legislation, when a company has tax losses, it may request a refund of first category taxes paid in prior years, up to the amount of tax calculable on the tax loss and provided that it has not distributed dividends on the income associated with the refund. The amount returned by the Chilean tax administration in this respect is called the provisional payment on absorbed earnings (PPUA). The company recognizes income tax income and an account receivable when requesting this refund.
| | | | | | | | | | | | |
| | | 2018 | | | 2019 | | | 2020 | |
Current income tax | | | 151,039 | | | | 114,240 | | | | 53,134 | |
Deferred income tax (Note 24) | | | (26,938 | ) | | | 189,131 | | | | 5,310 | |
| | | | | | | | | | | | |
| | | 124,101 | | | | 303,371 | | | | 58,444 | |
(-) Discontinued Operations | | | (13,108 | ) | | | — | | | | — | |
| | | | | | | | | | | | |
Income tax expense | | | 110,993 | | | | 303,371 | | | | 58,444 | |
| | | | | | | | | | | | |
- 102 -
| | f)d) | The Group’sCorporation’s income tax differs from the notionaltheoretical amount that would resulthave resulted from applying the group companies weighted average rate ofweighted-average income tax rate applicable to the profit reported by of the consolidatedpre-tax income, companies, as follows: |
| | | | | | | | | | | | |
| | | 2016 | | | 2017 | | | 2018 | |
(Loss) profit before income tax | | | (708,134 | ) | | | 45,112 | | | | 133,948 | |
| | | | | | | | | | | | |
Income tax by applying local applicable tax rates on profit generated in the respective countries | | | (191,225 | ) | | | 13,811 | | | | 40,507 | |
Tax effect on: | | | | | | | | | | | | |
-Non-taxable income | | | (1,534 | ) | | | (4 | ) | | | (1,691 | ) |
- Equity method (profit) loss | | | 3,673 | | | | 394 | | | | (1,094 | ) |
-Non-deductible expenses | | | 56,805 | | | | 30,472 | | | | 70,052 | |
- Unrecognized deferred tax asset income (expense) | | | (4,099 | ) | | | 1,562 | | | | 8,592 | |
- Adjustment for changes in rates of income tax | | | (18,676 | ) | | | 27 | | | | 1,524 | |
- PPUA adjustment for changes in tax rates | | | 4,871 | | | | (611 | ) | | | — | |
- Change in prior years estimations | | | (4,471 | ) | | | 9,005 | | | | 3,235 | |
- Others, net | | | 2,474 | | | | (8,351 | ) | | | (7,807 | ) |
| | | | | | | | | | | | |
Income tax | | | (152,182 | ) | | | 46,305 | | | | 113,318 | |
| | | | | | | | | | | | |
| | | | | | | | | | | | |
| | | 2018 | | | 2019 | | | 2020 | |
Profit (loss) before income tax | | | 124,005 | | | | (535,271 | ) | | | (131,900 | ) |
| | | | | | | | | | | | |
Income tax by applying local applicable tax | | | | | | | | | | | | |
rates on profit generated in the respective countries | | | 37,823 | | | | (157,744 | ) | | | (39,719 | ) |
Tax effect on: | | | | | | | | | | | | |
- Reversal of deferred income tax asset | | | — | | | | 174,716 | | | | 7,950 | |
- Non-recoverable item | | | — | | | | 85,301 | | | | 19,794 | |
- Non-deductible expenses | | | 70,411 | | | | 84,620 | | | | 49,580 | |
- Unrecognized deferred income tax asset | | | 8,592 | | | | 82,424 | | | | 24,930 | |
- Change in prior years estimations | | | 3,235 | | | | 36,529 | | | | 2,213 | |
- Provision of tax contingencies | | | — | | | | 7,079 | | | | (3,421 | ) |
- Adjustment for changes in rates of income tax | | | 1,524 | | | | 622 | | | | (240 | ) |
- Non-taxable income | | | (1,691 | ) | | | (1,195 | ) | | | (22 | ) |
- Equity method (profit) loss | | | (1,094 | ) | | | (64 | ) | | | (227 | ) |
- Others | | | (7,807 | ) | | | (8,917 | ) | | | (2,394 | ) |
| | | | | | | | | | | | |
Income tax | | | 110,993 | | | | 303,371 | | | | 58,444 | |
| | | | | | | | | | | | |
| | g)e) | The theoretical tax disclosed is the result of applying the income tax rate in accordance with the tax legislation of the country where each company that is part of the GroupCorporation is domiciled. In this sense, companies domiciled in Peru, Chile, and Colombia applied in 20182020 income tax rates of 29.5%, 27% and 37%32% respectively (29.5%, 25.5%27% and 40%33% for 2017)2019). Norvial GyM Ferrovias, VesurS.A., Tren Urbano de Lima S.A., Concesionaria Via Expresa Sur S.A. and GMPUNNA ENERGIA S.A. (Blocks III and IV) have legal stability contracts signed with the Peruvian Government in force during the term of the associated concessions. Therefore, the consolidated theoretical amount is obtained from the weighting of the profit or loss before income tax and the applicable income tax rate. |
- 103 -
| | | | | | | | | | | | |
Country | | Local tax
rate | | | (Loss) Profit
before
income tax | | | Income
tax | |
| | | (A) | | | (B) | | | (A)*(B) | |
2016 | | | | | | | | | | | | |
Peru | | | 28.00 | % | | | (1,544,221 | ) | | | (432,382 | ) |
Peru - Norvial S.A. | | | 27.00 | % | | | 63,583 | | | | 17,167 | |
Peru - GyM Ferrovías S.A. | | | 30.00 | % | | | 34,760 | | | | 10,428 | |
Peru - Vesur S.A. | | | 30.00 | % | | | 888 | | | | 267 | |
Peru - GMP S.A. | | | 30.00 | % | | | 8,602 | | | | 2,581 | |
Chile | | | 24.00 | % | | | (81,119 | ) | | | (19,468 | ) |
Colombia | | | 40.00 | % | | | (27,511 | ) | | | (11,004 | ) |
Bolivia | | | 25.00 | % | | | (703 | ) | | | (176 | ) |
Unrealized gains | | | | | | | 837,587 | | | | 241,362 | |
| | | | | | | | | | | | |
Total | | | | | | | (708,134 | ) | | | (191,225 | ) |
| | | | | | | | | | | | |
| | | | | | | | | | | | |
2017 | | | | | | | | | | | | |
Peru | | | 28.00 | % | | | 420,421 | | | | 124,024 | |
Peru – Norvial S.A. | | | 27.00 | % | | | 68,104 | | | | 18,388 | |
Peru – GyM Ferrovias S.A. | | | 30.00 | % | | | 29,028 | | | | 8,708 | |
Peru – Vesur S.A. | | | 30.00 | % | | | 779 | | | | 234 | |
Peru – GMP S.A. | | | 30.00 | % | | | 20,941 | | | | 6,073 | |
Chile | | | 24.00 | % | | | (93,031 | ) | | | (23,723 | ) |
Colombia | | | 40.00 | % | | | (27,970 | ) | | | (11,188 | ) |
Bolivia | | | 25.00 | % | | | (2,897 | ) | | | (724 | ) |
Unrealized gains | | | | | | | (370,263 | ) | | | (107,981 | ) |
| | | | | | | | | | | | |
Total | | | | | | | 45,112 | | | | 13,811 | |
| | | | | | | | | | | | |
| | | | | | | | | | | | |
2018 | | | | | | | | | | | | |
Peru | | | 29.50 | % | | | 151,627 | | | | 44,730 | |
Peru – Norvial S.A. | | | 27.00 | % | | | 21,104 | | | | 5,698 | |
Peru – GyM Ferrovias S.A. | | | 30.00 | % | | | 125,136 | | | | 37,541 | |
Peru – Vesur | | | 30.00 | % | | | 2,951 | | | | 885 | |
Peru – GMP S.A. | | | 29.00 | % | | | 35,421 | | | | 10,272 | |
Chile | | | 27.00 | % | | | (20,768 | ) | | | (5,607 | ) |
Colombia – Morelco S.A. | | | 37.00 | % | | | 11,851 | | | | 4,385 | |
Colombia – GyM S.A. Branch | | | 33.00 | % | | | 1,984 | | | | 655 | |
Bolivia | | | 25.00 | % | | | (137 | ) | | | (34 | ) |
Unrealized gains | | | | | | | (195,221 | ) | | | (58,018 | ) |
| | | | | | | | | | | | |
Total | | | | | | | 133,948 | | | | 40,507 | |
| | | | | | | | | | | | |
A company located in Colombia does not exceed the taxable income of COP 800 million, therefore applies the rate of 33%. (Note 30-d)
| | | | | | | | | | | | |
Country | | Local
Tax
Rates | | | Profit
before
Income Tax | | | Income Tax | |
| | | (A) | | | (B) | | | (A)*(B) | |
2018 | | | | | | | | | | | | |
Peru | | | 29.50 | % | | | 151,627 | | | | 44,730 | |
Peru - Norvial S.A. | | | 27.00 | % | | | 21,104 | | | | 5,698 | |
Peru - Tren Urbano de Lima S.A. | | | 30.00 | % | | | 125,136 | | | | 37,541 | |
Peru -Via Expresa Sur S.A. | | | 30.00 | % | | | 2,951 | | | | 885 | |
Peru - UNNA ENERGIA S.A. | | | 29.00 | % | | | 35,421 | | | | 10,272 | |
Chile | | | 27.00 | % | | | (30,710 | ) | | | (8,292 | ) |
Colombia | | | 37.00 | % | | | 11,851 | | | | 4,385 | |
Colombia | | | 33.00 | % | | | 1,984 | | | | 655 | |
Bolivia | | | 25.00 | % | | | (137 | ) | | | (34 | ) |
Unrealized gains | | | | | | | (195,222 | ) | | | (58,017 | ) |
| | | | | | | | | | | | |
| | | | | | | 124,005 | | | | 37,823 | |
| | | | | | | | | | | | |
2019 | | | | | | | | | | | | |
Peru | | | 29.50 | % | | | (1,612,192 | ) | | | (475,597 | ) |
Peru - Norvial S.A. | | | 27.00 | % | | | 24,066 | | | | 6,498 | |
Peru - Tren Urbano de Lima S.A. | | | 30.00 | % | | | 121,080 | | | | 36,324 | |
Peru - Via Expresa Sur S.A. | | | 30.00 | % | | | (17,752 | ) | | | (5,326 | ) |
Peru - UNNA ENERGIA S.A. | | | 29.00 | % | | | 35,421 | | | | 10,272 | |
Chile | | | 27.00 | % | | | (96,360 | ) | | | (26,017 | ) |
Colombia | | | 33.00 | % | | | (11,824 | ) | | | (3,902 | ) |
Bolivia | | | 25.00 | % | | | 681 | | | | 170 | |
Unrealized gains | | | 0.00 | % | | | 1,021,609 | | | | 299,834 | |
| | | | | | | | | | | | |
| | | | | | | (535,271 | ) | | | (157,744 | ) |
| | | | | | | | | | | | |
2020 | | | | | | | | | | | | |
Peru | | | 29.50 | % | | | (132,192 | ) | | | (38,997 | ) |
Peru - Norvial S.A. | | | 27.00 | % | | | (2,029 | ) | | | (548 | ) |
Peru - Tren Urbano de Lima S.A. | | | 30.00 | % | | | 87,521 | | | | 26,256 | |
Peru - Via Expresa Sur S.A. | | | 30.00 | % | | | (53,697 | ) | | | (16,109 | ) |
Peru - UNNA ENERGIA S.A. | | | 29.00 | % | | | (1,930 | ) | | | (540 | ) |
Chile | | | 27.00 | % | | | (15,282 | ) | | | (4,126 | ) |
Colombia | | | 32.00 | % | | | (11,178 | ) | | | (3,577 | ) |
Bolivia | | | 25.00 | % | | | (13 | ) | | | (3 | ) |
Unrealized gains | | | | | | | (3,100 | ) | | | (2,075 | ) |
| | | | | | | | | | | | |
| | | | | | | (131,900 | ) | | | (38,379 | ) |
| | | | | | | | | | | | |
| | h)f) | The Peruvian tax administration hasauthorities have the powerright to reviewexamine, and, if applicable, correct the calculation ofnecessary, amend the income tax determined by the Company in the last four years, starting onyears—from January 1 of the year followingafter the filing ofdate when the corresponding tax return (years open for review)returns are filed (open fiscal year). Years 2014Therefore, years 2016 through 2020 are subject to 2018 are open for review.examination by the tax authorities. Management believesconsiders that no significant liabilities will arise as a result of these possible tax
|
- 104 -
| audits. In addition, examinations. Additionally, income tax returns for fiscal years 2017 to 2020 remain open for examination by the Chilean tax administration has not yet auditedauthorities who have the right to carry out said examination within the three years following the date the income tax returns have been filed. Fiscal years 2018, 2019 and 2020 are open for 2016, 2017 and 2018, and the Chilean tax administration has the authority to carry out such audits within three years from the filing date of the respective tax returns. Also, in Colombia, years 2016, 2017 and 2018 are pending audit by the Colombian tax administration, which has the powerauthorities. Colombian tax authorities are entitled to perform audits in theaudit two consecutive years following the filing ofdate the income tax return.returns were filed. |
| | i)g) | In accordance with current Peruvian legislation, for the purposes of determining income tax and general sales tax, the transfer prices of transactions with related companies and with companies’companies resident in low or nilno tax territories must be considered. For thisconsidered, for which purpose documentation and information must be available to support the valuation methods used and the criteria considered for their determination (transfer pricing rules). The Tax Administration is empoweredauthorized to request this information from the taxpayer. Based on the analysis of the Company’s operations, managementManagement and its legal advisors estimate that the transfer prices of transactions with related companies are based on market conditions, similar to those agreed with third parties, as of December 31, 2018.2020. |
| | j)h) | Temporary tax on net assets (ITAN) |
TaxesIs applied by the companies which operate in Peru, to third category income generators in Peru subject to the generalPeruvian Income Tax regime. Beginning inGeneral Regime. Effective the year 2012, the tax rate is 0.4%, applicable to the amount of the net assets exceeding S/1 million.
The amount effectively paid may be used as a tax credit against payments on account of income tax underor against the general regime, or againstprovisional tax payment of the provisional income tax forof the corresponding year.related period.
| | k)i) | The unrecognized deferredIn 2019, certain operations have not been recognized to have impact on income tax such as: additional impairment of investments in GSP (Negocios del Gas S.A.) S/67 million, account receivable from the tax authorities converted to a contingent asset amounts(Cumbra Peru S.A.) amount to S/7.7 million and write-offs of non-recoverable assets (Concesionaria Via Expresa Sur S.A. and Promotora Larcomar S.A.) equal to S/10.8 million for 2018 and is mainly related to the tax loss carryforwards generated in Consorcio Ermitaño, Consorcio Conciviles and Consorcio Mantaro for which there is no expectation of recovery in the future.million.
|
| | l)j) | The current income tax payable, after applying the corresponding tax credits and whose due date is up to the first week of April of the following year, includes mainly: |
| | | | | | |
– | | Proyectos Inmobiliarios Consultores• Tren Urbano de Lima S.A. | | S/22 million in 2017 | | 2020 (S/7 million in 2019) |
– | | Viva GyM S.A.• Inmobiliaria Almonte | | S/224.1 million in 2017 | | en 2020 |
– | | Graña y Montero S.A.A.• Consorcio Vial Sierra | | S/73.4 million in 2017 | | |
– | | GyM Ferrovias S.A. | | S/20 million in 2018 | | |
– | | Inversiones Almonte S.A. | | S/10 million in 2018 | | 2020 |
- 105 -
3130 | OTHER COMPREHENSIVE INCOME |
The analysis of this account is reflected below:
| | | | | | | | | | | | | | | | | | | | |
| | | Cash flow
hedge | | | Foreign
currency
translations
adjustment | | | Increase in
fair value of
available-for
sale assets | | | Exchange
difference
from net
investment
in a foreign
operation | | | Total | |
At January 31, 2016 | | | (926 | ) | | | (64,441 | ) | | | 51,142 | | | | (17,740 | ) | | | (31,965 | ) |
Credit (charge) for the year | | | 1,190 | | | | 9,885 | | | | (3,149 | ) | | | 10,965 | | | | 18,891 | |
Tax effects | | | (351 | ) | | | — | | | | 929 | | | | (3,243 | ) | | | (2,665 | ) |
Transfer to profit or loss (Note 10) | | | — | | | | — | | | | (41,461 | ) | | | 1,563 | | | | (39,898 | ) |
| | | | | | | | | | | | | | | | | | | | |
Other comprehensive income of the year | | | 839 | | | | 9,885 | | | | (43,681 | ) | | | 9,285 | | | | (23,672 | ) |
| | | | | | | | | | | | | | | | | | | | |
At December 31, 2016 | | | (87 | ) | | | (54,556 | ) | | | 7,461 | | | | (8,455 | ) | | | (55,637 | ) |
| | | | | | | | | | | | | | | | | | | | |
Credit (charge) for the year | | | 650 | | | | (9,166 | ) | | | — | | | | 9,222 | | | | 706 | |
Tax effects | | | (192 | ) | | | — | | | | — | | | | (2,729 | ) | | | (2,921 | ) |
| | | | | | | | | | | | | | | | | | | | |
Other comprehensive income of the year | | | 458 | | | | (9,166 | ) | | | — | | | | 6,493 | | | | (2,215 | ) |
| | | | | | | | | | | | | | | | | | | | |
At December 31, 2017 | | | 371 | | | | (63,722 | ) | | | 7,461 | | | | (1,962 | ) | | | (57,852 | ) |
| | | | | | | | | | | | | | | | | | | | |
Credit (charge) for the year | | | 160 | | | | (7,875 | ) | | | — | | | | (10,800 | ) | | | (18,515 | ) |
Tax effects | | | (47 | ) | | | — | | | | — | | | | 2,808 | | | | 2,761 | |
Transfer to profit or loss (*) | | | — | | | | 14,805 | | | | — | | | | — | | | | 14,805 | |
| | | | | | | | | | | | | | | | | | | | |
Other comprehensive income of the year | | | 113 | | | | 6,930 | | | | — | | | | (7,992 | ) | | | (949 | ) |
| | | | | | | | | | | | | | | | | | | | |
At December 31, 2018 | | | 484 | | | | (56,792 | ) | | | 7,461 | | | | (9,954 | ) | | | (58,801 | ) |
| | | | | | | | | | | | | | | | | | | | |
(*) | | | | | | | | | | | | | | | | | | | | | | | | | Cash flow
hedge | | | Foreign
currency
translations
adjustment | | | Increase in
fair value of
assets as
held for sale | | | Exchange
difference from
investment
in foreign
operations | | | Total | | As of January 1, 2018 | | | 475 | | | | (69,320 | ) | | | 7,461 | | | | (1,962 | ) | | | (63,346 | ) | | | | | | | | | | | | | | | | | | | | | | (Debit) credit for the year | | | 160 | | | | (7,875 | ) | | | — | | | | (10,800 | ) | | | (18,515 | ) | Tax effects | | | (47 | ) | | | — | | | | — | | | | 2,808 | | | | 2,761 | | Transfer to profit or loss | | | — | | | | 14,805 | | | | — | | | | — | | | | 14,805 | | | | | | | | | | | | | | | | | | | | | | | Other comprehensive income of the year | | | 113 | | | | 6,930 | | | | — | | | | (7,992 | ) | | | (949 | ) | | | | | | | | | | | | | | | | | | | | | | As of December 31, 2018 | | | 588 | | | | (62,390 | ) | | | 7,461 | | | | (9,954 | ) | | | (64,295 | ) | | | | | | | | | | | | | | | | | | | | | | (Debit) credit for the year | | | 8 | | | | (6,892 | ) | | | — | | | | — | | | | (6,884 | ) | Tax effects | | | (2 | ) | | | — | | | | — | | | | — | | | | (2 | ) | | | | | | | | | | | | | | | | | | | | | | Other comprehensive loss of the year | | | 6 | | | | (6,892 | ) | | | — | | | | — | | | | (6,886 | ) | | | | | | | | | | | | | | | | | | | | | | As of December 31, 2019 | | | 594 | | | | (69,282 | ) | | | 7,461 | | | | (9,954 | ) | | | (71,181 | ) | | | | | | | | | | | | | | | | | | | | | | (Debit) credit for the year | | | (594 | ) | | | 8,158 | | | | — | | | | 708 | | | | 8,272 | | | | | | | | | | | | | | | | | | | | | | | Other comprehensive income of the year | | | (594 | ) | | | 8,158 | | | | — | | | | 708 | | | | 8,272 | | | | | | | | | | | | | | | | | | | | | | | As of December 31, 2020 | | | — | | | | (61,124 | ) | | | 7,461 | | | | (9,246 | ) | | | (62,909 | ) | | | | | | | | | | | | | | | | | | | | | |
The amount of S/14.8 million corresponds to the recognition of the translation adjustment from CAM Chile S.A., an indirect subsidiary sold in December 2018. |
The amounts in the above table only represent amounts attributable to the Company’s controlling interest, net of tax. The table below shows the movement in other comprehensive income per year:
| | | | 2016 | | | 2017 | | | 2018 | | | 2018 | | | 2019 | | | 2020 | |
Controlling interest | | | (23,672 | ) | | | (2,215 | ) | | | (949 | ) | | | (949 | ) | | | (6,886 | ) | | | 8,272 | |
Non-controlling interest | | | 4,194 | | | | (3,117 | ) | | | (1,346 | ) | | | (1,346 | ) | | | (1,734 | ) | | | 114 | |
Adjustment for actuarial gains and losses, net of tax | | | (1,121 | ) | | | (2,948 | ) | | | 16,589 | | | | 16,589 | | | | — | | | | — | |
| | | | | | | | | | | | | | | | | | |
Total value in OCI | | | (20,599 | ) | | | (8,280 | ) | | | 14,294 | | | | 14,294 | | | | (8,620 | ) | | | 8,386 | |
| | | | | | | | | | | | | | | | | | |
3231 | CONTINGENCIES, COMMITMENTS, AND WARRANTIES |
In the opinion of managementManagement and its legal advisors, the provisions recorded primarilyregistered mainly for labor and tax claims are sufficient to cover the results of these probable contingencies. (Note 23)22).
a) Tax contingencies
The Company considers that the maximum exposure for tax contingencies of the Corporate amounts to S/147.7 million according to the following detail:
Contentious Administrative Process before the Judiciary regarding the assessment of IGV or VAT tax from 1998 to 2002 for S/0.7 million and for Income Tax and IGV or VAT tax from 2001 for S/3.9 million. For fiscal year 2020, the dispute or claim for these processes has been summarized to the excessive collection of interest due to the time that has elapsed since the beginning of the process to date. In February 2020, a Contentious Administrative Process was started for the results of the audit by VAT tax 2011 amounting to S/0.7 million.
The appeal before SUNAT of income tax assessments from 2013 amounting to S/14 million (S/12.1 million correspond to Cumbra Peru S.A. and S/1.9 million to Viva Negocio Inmobiliario SA), and of income tax assessments from 2014 amounting to S/65.5 million correspond to AENZA S.A.A.
The appeal before the Tax Court regarding VAT tax assessments for:
| | a) | Tax contingenciesIncome tax from 2012, S/40 million to Cumbra Peru S.A.
|
Since the fiscal year 2016, there has been an appeal process before the Tax Court and another contentious-administrative process before the Judicial Branch regarding the results of VAT and Income Tax audits from 1999 to 2002. The maximum exposure amount is S/6.9 million.
| b) | Income Tax 2009, 2010 and 2013, S/12 million to AENZA S.A.A. |
- 106 -
In our subsidiary GyM S.A., as a result of the audit processes corresponding to 1999, 2001 and 2010, SUNAT has issued determination and fine resolutions that together amount to approximately S/19.1 million.
| c) | Income Tax 2013 and 2016, S/6.4 million to Cumbra Ingenieria S.A. |
In the fiscal year 2017, the tax litigation related to the fiscal year 2001 was resolved, in which the Tax Court ordered SUNAT to recalculate its observations, determining an amount lower than that initially claimed. Our subsidiary has decided to accept the conclusions of this resolution and submitted requests for installment payment of the debt amounting S/14.1 million.
Also, at the end of the fiscal year 2017, the contentious-administrative process related to the fiscal year 1999 was resolved through which the Judicial Branch rejected our arguments and confirmed what SUNAT had stated. With respect to this process, there is already a contingency provision of S/5 million accounted for.
The administrative tax process related to the fiscal year 2010 is still ongoing; however, its resolution will not imply an economic loss since it corresponds to a greater return of the balance in favor in 2011 already audited by the Tax Administration.
On the other hand, the Consortiums in which the subsidiary GyM S.A. participates initiated claims before SUNAT for the results of audits with a maximum exposure amount as of December 31, 2018, of S/2.6 million (as of December 31, 2017, S/3 million).
In the fiscal year 2017, Viva GyM challenged the results of the audit process corresponding to the fiscal year 2009, whose determination and fine resolutions as a whole generate a maximum exposure amount as of December 31, 2017, of S/1.5 million. In April 2018, the tax administration declared unfounded the claim for which an appeal has been filed before the Tax Court.
| d) | Income Tax 2009 and 2016, S/4.5 million from Viva Negocio Inmobiliario S.A. |
Management estimates that all of the aboveafore mentioned processes will be favorable considering their characteristics and the evaluation of their legal advisors.
| i) | Civil lawsuits, mainly related to damages, termination of contracts and claims for work accidents amounting to S/. 0.92 million (S/0.86 million correspond to GyM, and S/0.06 million correspond to Morelco).
|
| ii) | Contentious-administrative proceedings amounting to S/13.59 million (S/9.64 million correspond to Consorcio Terminales and GMP; S/2.85 million correspond to GyM; S/1.08 million correspond to GyM Ferrovias, and the remaining S/0.02 million correspond to Las Lomas - Inmobiliaria).
|
| iii) | Administrative processes amounting to S/14.96 million (S/9.88 million correspond to GyM S.A. mainly due to Consorcio Constructor Ductos del Sur; S/1.25 million correspond to Graña y Montero S.A.A.; S/2.13 million correspond to GyM Ferrovias; S/0.85 million correspond to Viva GyM; and, the remaining S/0.85 million correspond to GMP, Terminales del Peru, Consorcio Toromocho, and Concesion Canchaque).
|
| iv) | Labor processes amounting to S/17.25 million (S/14.93 million correspond to GyM, its subsidiaries, and consortia; S/0.69 million correspond to GMP; S/0.33 million correspond to Vial and Vives - DSD; S/0.22 million correspond to Morelco; S/0.50 million correspond to Consorcio Huacho-Pativilca); and, S/0.58 million correspond to Servisel.
|
| v) | Two securities class action lawsuits have been filed against the company and certain current and former officers in New York (“Eastern District of New York”) during the first quarter of 2017. Both actions allege that false and misleading statements were filed during the period. In particular, it is alleged that the defendant failed to disclose, among other things, that: a) the Company knew that its partner Odebrecht was involved in illegal activities; and that, b) the Company profited from such activities in violation of its own corporate governance rules. On March 6, 2018, the Court appointed Treasure Finance Holding Corp. to represent the plaintiffs. The company filed an exception requesting that the Court dismiss the lawsuit because even assuming that the facts alleged in the lawsuit were true, the plaintiffs would not be entitled to sue on the basis that: (a) the failure by the plaintiffs to register alleged unlawful payments would not have a material impact on the company’s financial statements even if they existed; (b) the evidence provided by the plaintiffs should be dismissed by the Court; and (c) the plaintiffs have not alleged that the defendants acted with intent to deceive and to benefit. The court has not yet ruled on that motion, but has granted plaintiffs leave to file a further amended complaint. The procedural issue is expected to be resolved during 2019. After that, the Court may dismiss the lawsuit or admit it. Legal counsel cannot predict the outcome of this class action or how it may impact the Company.
|
- 107 -
| c) | Letters of CreditAdministrative contentious proceedings amounting to S/8.1 million (S/1.7 million correspond to Consorcio Terminales, S/0.6 million to UNNA ENERGIA S.A., S/3.5 million to Tren Urbano de Lima S.A. and S/2.3 million to Cumbra Peru S.A.)
Administrative processes amounting to S/7.8 million (S/5.5 million correspond to Cumbra Peru S.A., S/0.6 million to Viva Negocio Inmobiliario S.A., S/0.5 million to UNNA ENERGIA S.A. and its subsidiary and S/1.2 million to AENZA S.A.A.) Labor dispute processes amounting to S/3 million (S/1.2 million correspond to Morelco S.A.S., S/1.6 million to UNNA ENERGIA S.A. and its subsidiary and Guarantees |
As of December 31, 2018, the Group hasrest to Concar S.A.C.)
c) Letters bonds and guarantees
The Corporate maintains letters of creditguarantee and guarantees in force in various financial entitiesinstitutions guaranteeing operations for US$471.6 and US$13.9US $427.5 million respectively (US$959.7 and US$202.2(US $390 million respectively, as of December 31, 2017), equivalent to S/1,593.5 million and S/46.9 million (S/3,114.2 million and S/656.1 million, respectively, as of December 31, 2017)2019).
3332 | BUSINESS COMBINATIONS |
| a) | Adexus S.A. acquisition
|
In June 2015, the Company acquired 44% of the shares of the Chilean entity Adexus S.A., whose principal economic activity is the provision of information technology solutions. At December 31, 2015, the Company concluded that joint control existed and that the type of joint agreement qualified as a joint venture; therefore, the investment was accounted for using the equity method in the Group’s consolidated financial statements (Note16-b).
In January 2016, the Group acquired an additional shareholding of 8%, reaching a 52% shareholding; the agreed consideration of S/8.3 million was contributed through debt capitalization. The increase in participation did not change the classification of the investment as a joint venture. Subsequently, in August 2016, the Group obtained an additional stake of 39.03%, reaching 91.03% of its capital and obtaining control. The agreed consideration of S/14 million was initially disbursed as debt and then capitalized in the same period.
Losses arising from there-measurement at fair value of the previously held interest amounted to S/6.8 million, which was recognized in the statement of income within “Other income and expenses, net”, at the date of acquisition of that additional interest in 2016 (Note 29).
Upon obtaining control, the Company has applied the acquisition method set forth in IFRS 3 “Business Combinations” to determine the goodwill acquired. In June 2018, the company acquired an additional 8.96% interest and obtained 99.99%. The consideration was S/14 million, which arises from a debt capitalization.
| b) | Morelco S.A.S. acquisition |
On December 23, 2014, the Company acquired control of Morelco S.A.S. (Morelco) through it’sits subsidiary GyMCumbra Peru S.A., with the purchase of 70% of its shares representing the capital stock. Morelco S.A.S. is an entity domiciled in Colombia, whose principal economic activity is the provision of construction and assembly services. This acquisition forms part of the Group’sCorporate’s expansion plans in markets with high growth potential such as Colombia and in attractive industries such as mining and energy.
AtAs of December 31, 2014, the Company determined goodwill on this acquisition based on an estimated purchase price of US$93.7 million (equivalent to S/277.1 million) which included cash payments made of US$78.5 million (S/237.5 million, approximately) and estimated payables of US$15.1 million (equivalent to S/45.7 million), which according to what was agreed between the parties, would be defined after the review of the balance sheet of the acquired entity mainly referring to working capital, cash and financial debt and the determination of the definitive value of the contracted works pending to execute (backlog) of the acquired business. The estimated purchase price was distributed among the provisional fair values of the assets acquired, and liabilities assumed.
- 108 -
As a result of this distribution, a goodwill of US$36.1 million (equivalent to S/105.8 million) was determined.
Non-controlling interest put and call options
In accordance with the shareholders’ agreement entered into for the purchase of Morelco the subsidiary GyM entered into aS.A.S., Cumbra Peru S.A. signed put and call option contract on 30% of the shares of Morelco held by thenon-controlling shareholders. Through this contract, thenon-controlling shareholders obtain a right to sell their shares within the term and amount established in the contract (put options). The period for exercising the option begins on completion of the second year of the purchase and expires in the tenth year. The exercise price is based on a multiple of EBITDA less net financial debt and until the months 51 and 63 from the date of the agreement, a minimum value is set based on the price per share that GyMthe Company paid to acquire 70% of Morelco shares.
The subsidiary GyMCompany obtains the right to purchase the same shares for a period of 10 years and at a determined price similar to that of the aforementioned put options, except that the minimum value applies to the entire term of the option (call options).
UnderInto IFRS framework, the put option represents an obligation for the Company to purchase shares of thenon-controlling interest and, consequently, the GroupCorporation recognizes a liability measured by the fair value of that option.option, as of December 31, 2020, the value of the liability amounts to S/118.6 million (as of December 31, 2019, it was S/106.4 million). Because the GroupCorporation concluded that as a result of this contract, did not acquire the significant risks and rewards inherent to the stock option package, the initial recognition of this liability was charged to an equity account of the controlling stockholders, under the heading of other reserves.reserves (Note 21).
The valueOn April 30, 2019, an addenda No. 01 was signed to the shareholders Agreement, which modifies:
Section 7.3 sale option in favor of the liabilityInitial shareholder, for the put option was estimated by the present value of the expected redemption amounts based on the weighted estimates of Morelco’s financial results and the exercise dates of the option. The Company expects the put options to be exercised on the day following the transfer date of the option. The expected redemption of thenon-controlling interest is as follows: 66.67% in the second year, 33.33% in the fourth year and the remaining shares will be sold in the fifth year from the date of grant of the option. The discount rate used to calculate the present value of the expected redemption amounts reflects the risk-free rate of market participants comparable to the Company and reflects the fact that the Group expects to pay the minimum price of the agreement. following:
As of December 31, 2018,2020 and for a term of six (6) months, the valueinitial shareholder may exercise a selling option, only once, for a number of shares held by the Initial shareholder equivalent to sixty-six point sixty-seven percent (66.67%) of the liability amounts to S/103.7 million applying a discount rateshares held by the Initial shareholder at the time of 2.57% forexercising the first year, 2.55% for the second year and 2.53% for the third year (asLow sale option this sub-clause (sale option 1). As of December 31, 2017,2022 and for a term of six (6) months, the value was S/105.4 million applyingInitial shareholder may at any time exercise a discount rate of 1.79%sale option, for one time only, for the first year, 2.03%totality and not less than the totality of the shares held by the Initial shareholder at the time of exercising the sale option under this subclause, notwithstanding the foregoing, if Cumbra Peru S.A. does not fulfill its obligations subject to
the option of sale 1 within the period indicated in paragraph b of this Section 7.3, the term established for the second yearexercise of option 2 is accelerated and 2.12% formay be exercised by the third year). In 2018, changesInitial shareholder at any time after the day following expiration of said period by sending a Notification of the option of sale to Cumbra Peru S.A., so that in such event Cumbra Peru S.A. will only fulfill its obligations by purchasing one hundred (100%) of the shares held by the previous shareholder.
Section 7.3 (c) is replaced in its entirety by the following:
(c) The price per share in each sale option shall be equal to the base price per share plus an interest charge. The base price per share shall be the result of dividing 5,375 times the EBITDA of the twelve (12) months prior to the date of receipt of the Notification of the option of sale by Cumbra Peru S.A. minus DFN, between (and) all of the shares at the date of receipt of the Notice of option of sale by Cumbra Peru S.A.; however, the corresponding base price per share shall not be less than the price per share corresponding to the purchase price [as that term is defined in the fair valueshare sale Contract). The base price per Minimum action established in this Section 7.3 (c) shall not apply: (a) in a sale option that is triggered by the Cumbra Peru S.A. share provision to a third party, when the Cumbra Peru S.A. Stock provision does not result in a sale of the putCompany, and (b) in an Opt sales ion activated before an Exempt Operation. On the base price per share, remuneration interest will be caused at an annual interest rate composed of two point seventy percent (2.70%) as of (i) February 14, 2018 for option 1; (ii) December 31, 2019 for S/1.77 million had been recognizedsale option 2 and (iii) in both cases, up to the income statement, included in “Other income and expenses, net” and in “financial income and expenses”.effective payment date of the purchase contract price concluded as a result of the exercise of each sale option.
In compliance with certain covenants, the company will not pay dividends for the years 20172019 and 2018,2020, except for transactions withnon-controlling interests described in Note36-d)35-c). Certain of our debt or other contractual obligations may restrict our ability to pay dividends in the future.
- 109 -
3534 | EARNINGS (LOSS)LOSS PER SHARE
|
Basic earningsThe basic loss per common share havehas been calculated by dividing the profit forloss of the year attributable to the Group’sCorporate’s common shareholders by the weighted average of the number of common shares outstanding during thethat year. Diluted earningsNo diluted loss per common share have nothas been calculated because there areis no potential diluent common shares or potential dilutive investment shares (i.e.,(ie, financial instruments or agreements giving the rightthat entitle to obtain common or investment shares); therefore, it is the same as the loss per basic earnings per share. The basic gain (loss)loss per common share resultsis as follows:
| | | | | | | | | | | | |
| | | 2016 | | | 2017
(as Restated) | | | 2018 | |
(Loss) earnings per share attributable to owners of the Company during the year | | | (509,699 | ) | | | 148,738 | | | | (83,188 | ) |
| | | | | | | | | | | | |
Weighted average number of shares in issue at S/1.00 each, at December 31, | | | 660,053,790 | | | | 660,053,790 | | | | 729,434,192 | |
| | | | | | | | | | | | |
Basic (loss) earnings per share (in S/) (*) | | | (0.772 | ) | | | 0.225 | | | | (0.125 | ) |
| | | | | | | | | | | | |
| | | |
| | | 2016 | | | 2017
(as Restated) | | | 2018 | |
(Loss) earnings per share from continuing operations attributable to owners of the Company during the year | | | (604,361 | ) | | | (66,577 | ) | | | (102,486 | ) |
| | | | | | | | | | | | |
Weighted average number of shares in issue at S/1.00 each, at December 31, | | | 660,053,790 | | | | 660,053,790 | | | | 729,434,192 | |
| | | | | | | | | | | | |
Basic (loss) earnings per share (in S/) (*) | | | (0.916 | ) | | | (0.101 | ) | | | (0.154 | ) |
| | | | | | | | | | | | |
| | | | | | | | | | | | | | | | |
| | | | | | 2018 | | | 2019 | | | 2020 | |
Loss attributable to owners of the Company during the year | | | | | | | (83,188 | ) | | | (884,721 | ) | | | (217,871 | ) |
| | | | | | | | | | | | | | | | |
Weighted average number of shares in issue at S/1.00 each, at December 31, | | | | | | | 665,835,490 | | | | 822,213,119 | | | | 871,917,855 | |
| | | | | | | | | | | | | | | | |
Basic loss per share (in S/) | | | ( | *) | | | (0.125 | ) | | | (1.076 | ) | | | (0.250 | ) |
| | | | | | | | | | | | | | | | |
| | | | | | | | | | | | | | | | |
| | | | | | 2018 | | | 2019 | | | 2020 | |
Loss from continuing operations attributable to owners of the Company during the year | | | | | | | (73,506 | ) | | | (884,721 | ) | | | (217,871 | ) |
| | | | | | | | | | | | | | | | |
Weighted average number of shares in issue at S/1.00 each, at December 31, | | | | | | | 665,835,490 | | | | 822,213,119 | | | | 871,917,855 | |
| | | | | | | | | | | | | | | | |
Basic loss per share (in S/) | | | ( | *) | | | (0.110 | ) | | | (1.076 | ) | | | (0.250 | ) |
| | | | | | | | | | | | | | | | |
| (*) | The groupCorporation does not have common shares with dilutive effects atAs of December 31, 2016, 20172018, 2019 and 2018.2020. |
3635 | TRANSACTIONS WITHNON-CONTROLLING INTERESTS |
| | a) | Acquisition of additionalnon-controlling interest |
In May, November and December 2016, GyM Chile SPAS.p.A. acquired 5.43%, 6.77%, and 1.49%, respectively of additional shares in Vial y Vives - Vives—DSD S.A. at a total purchase price of S/21.6 million, S/25.7 million and S/3.8 million, respectively. The carrying values of thenon-controlling interest at the acquisition dates were S/13.9 million, S/17.9 million and S/3.9 million. The GroupCorporation ceased to recognize the correspondingnon-controlling interest, recording a decrease in equity attributable to the owners of the Company of S/15.4 million. AtAs of December 31, 2018,2020, the outstanding balance was S/2327.6 million (S/2222.7 million in 2017)2019) (Note 22)21).
| | b) | Contributions (returns) fromnon-controlling shareholders |
Corresponds to the contributions and returns made by the partners of the subsidiary Viva GyMNegocio Inmobiliario S.A. for the realization of real estate projects. As of December 31, the balances comprise:include:
| | | | | | | | |
| | | 2017 | | | 2018 | |
Viva GyM S.A. | | | | | | | | |
Contributions received | | | 8,654 | | | | 3,399 | |
Returns of contributions | | | (45,053 | ) | | | (87,856 | ) |
| | | | | | | | |
| | | (36,399 | ) | | | (84,457 | ) |
| | | | | | | | |
Plus (less): | | | | | | | | |
Contributions from other subsidiaries | | | 3,202 | | | | 15,120 | |
| | | | | | | | |
Decrease in equity of non controlling parties | | | (33,197 | ) | | | (69,337 | ) |
| | | | | | | | |
In 2018, the contributions correspond mainly to the project Los Parques de Callao for S/3.3 million. Returns correspond mainly to the Klimt projects for S/25.3 million, Los parques de Comas for S/13.4 million, Los parques de San Martin for S/7.5 million, Los Parques de Villa El Salvador for S/4.3 million, liquidation of Los Parques de Piura project for S/8.6 million, Los Parques del Mar for S/11 million, Los Parques de Chiclayo for S/6.2 million and Los Parques de Carabayllo 3 for S/8.2 million (returns in 2017 mainly include “Los Parques de Comas” for S/6.8 million, “Asociacion Parques de Mar” for S/27.8 million and “Klimt” for S/8 million).
| | | | | | | | | | | | |
| | | 2018 | | | 2019 | | | 2020 | |
Contributions received | | | 3,399 | | | | 152 | | | | 18 | |
Returns of contributions | | | (87,841 | ) | | | (33,148 | ) | | | (15,743 | ) |
| | | | | | | | | | | | |
| | | (84,442 | ) | | | (32,996 | ) | | | (15,725 | ) |
| | | | | | | | | | | | |
Plus: | | | | | | | | | | | | |
Contributions from other subsidiaries | | | 15,120 | | | | — | | | | — | |
| | | | | | | | | | | | |
Decrease in equity of non controlling parties | | | (69,322 | ) | | | (32,996 | ) | | | (15,725 | ) |
| | | | | | | | | | | | |
| | c) | Deconsolidation ofnon-controlling interest
|
Correspond to the deconsolidation of thenon-controlling interest due to the sale of subsidiaries Stracon GyM S/29.4 million and Grupo Cam S/18.2 million.
- 110 -
As of December 31, 2016, 20172019 and 2018,2020, dividends of S/25.5 million, S/59.7 million and S/102.8 million, respectively, were distributed to thenon-controlling interest.interest for S/12.8 million and S/82.4 million, respectively.
3736 | DISCONTINUED OPERATIONS AND NON-CURRENT ASSET CLASSIFIEDOF SUBSIDIARY ADEXUS S.A. RECLASSIFIED AS HELD FOR SALECONTINUING OPERATIONS
|
As partof December 31, 2020, the financial information of the non-strategic asset divestment process initiated by the Company in 2017 with the sale of GMD S.A., in 2018, CAM Servicios del Peru S.A. and CAM Chile S.A., and Stracon GyM S.A. were sold (“completed”).
Additionally, information is presented onsubsidiary Adexus S.A., a (hereinafter Adexus) was reclassified as continuous operation. The subsidiary that has been reclassified as a non-current asset available assets held for sale (“planned”) asAs of December 31, 2018, (Note 38-b).
| A. | Discontinued operations
|
i) CAM Servicios del Peru S.A. and CAM Chile S.A.
On December 4, 2018, the Company entered into a purchase and sale agreement for all of its shares (representing 73.16%) of CAM Servicios del Peru S.A. and CAM Chile S.A. The Group received for its participation in CAM Chile S.A. and CAM Servicios del Peru S.A. the sum of (i) US$15.78 million (equivalent to S/51.7 million) for the shares of CAM Chile S.A. and (ii) US$3.0 million (equivalent to S/10.4 million) for the shares of CAM Servicios del Peru S.A., respectively. The net gain on the sale of both subsidiaries amounted to S/31.7 million.
ii) STRACON GyM S.A.
On March 28, 2018, the Company entered into a purchase and sale agreement for all of its shares (representing 87.59%) in STRACON GyM S.A. The sale price was agreed in US$76.8 million (equivalent to S/248.8 million), which is fully paid. The net gain on the sale amounted to S/41.9 million.
iii) GMD S.A.
On June 6, 2017, the Company entered into a sales contract for all of its shares (representing 89.19%) in GMD S.A. The sales price was agreed at US$84.7 million (equivalent to S/269.9 million), which is fully paid. The net gain on the sale amounted to S/218.3 million (US$64.6 million approximately).
| B. | Non-current asset classifiedhas as held for sale
|
At December 31, 2018, non-current assets and liabilities held for sale correspond to investments in the company Adexus S.A., whose main activity is to provide information technology solutions mainly in Chile and Peru. Account balances are classified as assets held for sale taking into accountDespite the fact that the GroupCompany has been committed to a salespan to carry out the sale, the circumstances that arose in the subsidiary during this period, which are explained below, have forced us to change initial plan, defined withinfocusing in negotiating with vendors liabilities terms sale resulting in a viable plan again.
On November 19, 2019, Adexus filed an application for reorganization under law 20720 with the next 12 months.
| | | | |
| | At December 31, 2018
Adexus S.A. | |
| | (planned) | |
Assets
| | | | |
Cash and cash equivalents
| | | 6,074 | |
Trade accounts receivables, net
| | | 157,351 | |
Inventories, net
| | | 3,999 | |
Other accounts receivable
| | | 80,374 | |
| | | | |
Total assets
| | | 247,798 | |
| | | | |
Liabilities
| | | | |
Other accounts payable
| | | 71,810 | |
Accounts payable
| | | 148,817 | |
Deferred income tax liabilities
| | | 5,201 | |
| | | | |
Total liabilities
| | | 225,828 | |
| | | | |
Total net assets
| | | 21,970 | |
| | | | |
AsChilean courts of justice. The Company impaired the total investment value as of December 31, 2017, this item includes Red Eagle Mining Corporation investment representing 6.18% of shares. In2019.
On January and March 2018,9, 2020, the Company soldcommunicated that the creditors committee of Adexus approved with the favorable vote of more than 80% of the pledge creditors and 85% of the unsecured creditors, respectively, the judicial reorganization agreement proposed by Adexus in the framework of the reorganization procedure. According to the terms of the judicial reorganization agreement, Adexus will restructure and pay the total of its shares. The sale price wasreorganized liabilities within a maximum period of six years, according to the new agreed at US$3.99 million (equivalentconditions, being authorized to S/16.24 million), which were paid in full.
- 111 -continue with its commercial activities normally. As a result of the financial protection provided by the Chilean law and with the support of its creditors, Adexus has achieved the restructuring of its liabilities while continuing to serve all its customers. In 2020, Adexus S.A. has complied with the payment schedule agreed with the creditors. On December 28, the creditor’s committee signed a debt reorganization agreement whith pledge creditors and unsecured creditors.
| C. | Consolidated statement of income and consolidated cash flow
|
The Company reclassified financial results and present cash flowCorporation decided that Adexus will be subject to the patrimonial protection law; after achieving this restructuring, the Corporation will focus on honoring it in the terms agreed while finding the right shareholder for the future development of discontinued operations, GMD S.A., Stracon GyM S.A., CAM Servicios del Peru S.A., CAM Chile S.A. (completed) and Adexus S.A. (planned) for 2016 and 2017 as follows:the subsidiary.
| | | | | | | | | | | | | | | | |
| | | Reclassification | |
| | | 2016 | | | discontinued operations | | | 2016 | |
| | | Audited | | | Completed | | | Planned | | | Reclassified | |
Revenues | | | 6,190,317 | | | | (1,939,983 | ) | | | (113,025 | ) | | | 4,137,309 | |
Operating costs | | | (5,633,022 | ) | | | 1,714,498 | | | | 97,304 | | | | (3,821,220 | ) |
| | | | | | | | | | | | | | | | |
Gross profit (loss) | | | 557,295 | | | | (225,485 | ) | | | (15,721 | ) | | | 316,089 | |
| | | | |
Administrative expenses | | | (382,393 | ) | | | 87,855 | | | | 16,235 | | | | (278,303 | ) |
Other (expenses) income, net | | | (13,374 | ) | | | (9,162 | ) | | | 176 | | | | (22,360 | ) |
Gain from the sale of investments | | | 46,336 | | | | — | | | | — | | | | 46,336 | |
| | | | | | | | | | | | | | | | |
Operating profit (loss) | | | 207,864 | | | | (146,792 | ) | | | 690 | | | | 61,762 | |
| | | | |
Financial expenses | | | (221,664 | ) | | | 18,384 | | | | 5,225 | | | | (198,055 | ) |
Financial income | | | 20,645 | | | | (2,420 | ) | | | — | | | | 18,225 | |
| | | | |
Share of the profit or loss in associates and joint ventures | | | (589,710 | ) | | | (356 | ) | | | — | | | | (590,066 | ) |
| | | | | | | | | | | | | | | | |
(Loss) profit before income tax | | | (582,865 | ) | | | (131,184 | ) | | | 5,915 | | | | (708,134 | ) |
Income tax | | | 119,272 | | | | 34,772 | | | | (1,862 | ) | | | 152,182 | |
| | | | | | | | | | | | | | | | |
(Loss) profit from continuing operations | | | (463,593 | ) | | | (96,412 | ) | | | 4,053 | | | | (555,952 | ) |
| | | | | | | | | | | | | | | | |
Profit (loss) from discontinued operations | | | 11,995 | | | | 96,412 | | | | (4,053 | ) | | | 104,354 | |
| | | | | | | | | | | | | | | | |
Loss of the year | | | (451,598 | ) | | | | | | | | | | | (451,598 | ) |
| | | | | | | | | | | | | | | | |
(Loss) earnings per share from continuing operations attributable to owners of the company during the year | | | (0.790 | ) | | | | | | | | | | | (0.916 | ) |
| | | | | | | | |
| | | Discontinued operations | |
| | | Completed | | | Planned | |
Cash flows relating to the discontinued operations are as follows: | | | | | | | | |
| | |
Operating cash flows | | | 125,048 | | | | 39,318 | |
Investing cash flows | | | (73,127 | ) | | | 17,639 | |
Financing cash flows | | | (111,303 | ) | | | 66,886 | |
| | | | | | | | |
Net increase generated in subsidiary | | | (59,382 | ) | | | 123,843 | |
| | | | | | | | |
| | | | | | | | | | | | | | | | |
| | | Reclassification | |
| | | 2017 | | | discontinued operations | | | 2017 | |
| | | Restated (i) | | | Completed | | | Planned | | | Reclassified | |
Revenues | | | 6,080,142 | | | | (1,782,105 | ) | | | (284,024 | ) | | | 4,014,013 | |
Operating costs | | | (5,407,355 | ) | | | 1,656,114 | | | | 239,680 | | | | (3,511,561 | ) |
| | | | | | | | | | | | | | | | |
Gross profit (loss) | | | 672,787 | | | | (125,991 | ) | | | (44,344 | ) | | | 502,452 | |
| | | | |
Administrative expenses | | | (429,181 | ) | | | 73,966 | | | | 32,761 | | | | (322,454 | ) |
Other (expenses) income, net | | | (20,545 | ) | | | (13,159 | ) | | | 835 | | | | (32,869 | ) |
Gain (loss) from the sale of investments | | | 56,099 | | | | (21,554 | ) | | | — | | | | 34,545 | |
| | | | | | | | | | | | | | | | |
Operating profit (loss) | | | 279,160 | | | | (86,738 | ) | | | (10,748 | ) | | | 181,674 | |
| | | | |
Financial expenses | | | (185,445 | ) | | | 23,913 | | | | 10,755 | | | | (150,777 | ) |
Financial income | | | 15,407 | | | | (1,401 | ) | | | (264 | ) | | | 13,742 | |
| | | | |
Share of the profit or loss in associates and joint ventures | | | 1,327 | | | | (854 | ) | | | — | | | | 473 | |
| | | | | | | | | | | | | | | | |
Profit (loss) before income tax | | | 110,449 | | | | (65,080 | ) | | | (257 | ) | | | 45,112 | |
Income tax | | | (59,097 | ) | | | 12,939 | | | | (147 | ) | | | (46,305 | ) |
| | | | | | | | | | | | | | | | |
Profit (loss) from continuing operations | | | 51,352 | | | | (52,141 | ) | | | (404 | ) | | | (1,193 | ) |
| | | | | | | | | | | | | | | | |
Profit from discontinued operations | | | 157,886 | | | | 52,141 | | | | 404 | | | | 210,431 | |
| | | | | | | | | | | | | | | | |
Profit of the year | | | 209,238 | | | | | | | | | | | | 209,238 | |
| | | | | | | | | | | | | | | | |
(Loss) earnings per share from continuing operations attributable to owners of the company during the year | | | (0.014 | ) | | | | | | | | | | | (0.101 | ) |
| | | | | | | | |
| | | Discontinued operations | |
| | | Completed | | | Planned | |
Cash flows relating to the discontinued operations are as follows: | | | | | | | | |
| | |
Operating cash flows | | | 149,687 | | | | 6,083 | |
Investing cash flows | | | (10,377 | ) | | | (19,570 | ) |
Financing cash flows | | | (136,165 | ) | | | 14,059 | |
| | | | | | | | |
Net increase generated in subsidiary | | | 3,145 | | | | 572 | |
| | | | | | | | |
-112 -
Discontinued operations as at December 31, 2018 are as follows:
| | | | | | | | |
| | | Discontinued operations | |
| | | Grupo CAM and
Stracon GyM | | | Adexus S.A. | |
| | | (Completed) | | | (Planned) | |
Revenues | | | 1,010,739 | | | | 302,936 | |
Operating costs | | | (968,375 | ) | | | (263,455 | ) |
| | | | | | | | |
Gross profit | | | 42,364 | | | | 39,481 | |
| | |
Administrative expenses | | | (56,950 | ) | | | (32,730 | ) |
Other (expenses) income, net | | | 860 | | | | (4,519 | ) |
| | | | | | | | |
Operating (loss) profit | | | (13,726 | ) | | | 2,232 | |
| | |
Financial expenses | | | (19,971 | ) | | | (12,786 | ) |
Financial income | | | 6,253 | | | | 611 | |
| | | | | | | | |
Loss before income tax | | | (27,444 | ) | | | (9,943 | ) |
Income tax | | | 7,112 | | | | 2,325 | |
| | | | | | | | |
Loss from discontinued operations | | | (20,332 | ) | | | (7,618 | ) |
| | | | | | | | |
| | |
Cash flows relating to the discontinued operations are as follows: | | | | | | | | |
| | |
Operating cash flows | | | 6,967 | | | | 36,450 | |
Investing cash flows | | | (11,474 | ) | | | (18,141 | ) |
Financing cash flows | | | 526 | | | | (21,422 | ) |
| | | | | | | | |
Net increase generated in subsidiary | | | (3,981 | ) | | | (3,113 | ) |
| | | | | | | | |
3837 | EVENTS AFTER THE DATE OF THE STATEMENT OF FINANCIAL POSITION |
| a) | On April 2, 2019, the Company concluded the capital increase process by completing the subscription of 142,483,663 new common shares. In the private offer completed, 55,291,877 shares were paid in full, and 87,191,786 shares were paid by 50%, both at a price per share of US$0.6136.
|
| b) | On March 15, 2019, the Company communicated that Adexus S.A., subsidiary of Graña y Montero S.A.A., is again available for sale to potential parties interested in its acquisition. Negotiations with Advent International S.A.C., and the obligations assumed within the framework of the potential transaction have been terminated by mutual agreement, without responsibility for the parties. The Company ratifies its intention to continue with the sale plan of Adexus S.A., in order to find the best possible offer for the interests of the Company and its investors.
|
| c) | On March 13, 2019, the Peruvian Tax Court delivered its decision to confirm SUNAT’s rejection to our appeal to SUNAT’s payment orders regarding 2007 and 2008. SUNAT and the Peruvian Tax Court objected to the deduction of the loss of the investment because both consider there is not enough evidence that OPQ S.A. is not an “on-going business”. The Company is currently working on the preparation of a contentious administrative claim. However, according to Peruvian legal framework, SUNAT is entitle to start a coercive collection processes. The Company and its legal counsel believe there are solid legal grounds to consider the contingency remote and obtain a favorable ruling.
|
1. Issuance of Convertible Bonds
-113 -On January 13, 2021, the Board of Directors approved terms and conditions for the issuance of convertible bonds to be placed by private offering, including the registration and delivery dates, for the exercise of the preemptive subscription right, both in the first and second subscription round. The convertible bonds to be issued have not been and will not be registered under the U.S. Securities Act, or under the securities laws of any state or jurisdiction outside Peru.
Additionally, on the same date, a contract was signed with Kallpa Securities Sociedad Agencia de Bolsa S.A., who will act as Representative of the Bondholders for the issuance of the convertible bonds.
The second preferential subscription round of the issuance of the Convertible Bonds in Shares of AENZA S.A.A., by the Company, ended on February 26, 2021. Together with the Subscription Agreements that were subscribed in the first preferential subscription round, in both rounds, Subscription Agreements have been subscribed for a total of 32,721 bonds, for a subscription value that amounts to the total amount of US$32.7 million.
Bonds that were not subscribed during the preemptive subscription rounds may be placed to institutional investors through a private placement offering. As of the date hereof, none of the convertible bonds have been issued, and we cannot guarantee that they will be issued on a timely basis or at all
2. New State of emergency due to COVID
On April 17, 2021, the Peruvian Government extended the State of National Emergency for a period of 30 days as a result of COVID-19. Likewise, certain economic activities are restricted, according to the alert level in each department of Peru, until May 31, 2021. Management considers that the measures taken by the national authorities have no impact on the continuity and development of the operations of the Company because the activities carried out by the Company are within the group of permitted activities and have not been significantly impacted by the pandemic.
The Company’s Management continues to monitor the evolution of the situation and the guidance of the national and international authorities, since events beyond the control of Management may arise that require modifying the established business plan. A further spread of Covid-19 and the consequent measures taken to limit the spread of the disease could affect the ability to conduct business in the normal way and, therefore, affect the financial position and results of operations.
Citizen immobilization, the restriction of activities of strategic companies as well as the paralysis of public entities have affected the execution of investment projects as well as the performance of exploration activities, and until the date of approval of the financial statements, it is not expected that operations and going concern will be affected.
3. Process of a plea bargain agreement
The Company has made significant progress in the negotiation of the plea bargain agreement and expects to be execute the agreement soon. As the negotiation have advanced, it has been able to have more certainty regarding its exposure to the criminal investigations that will be settled by the agreement and, as a result it has been able to adjust its provisions to update its view of the outcome.
Notwithstanding, we cannot assure you that an agreement will be reached in a timely manner or at all and in case an agreement is reached, we can not assure you that it will not contain terms and conditions that are substantially more onerous to the Company that we have foreseen. In addition, any agreement would be subject to further approval by the Peruvian court.
Supplementary Data (Unaudited)
Oil and Gas Producing Activities
In accordance with Financial Accounting Standards Board (FASB) Accounting Standards Codification Topic 932, “ExtractiveActivities-Oil and Gas,” and regulations of the U.S. Securities and Exchange Commission (SEC), our company has included certain supplemental disclosures about its oil and gas exploration and production operations.
All information in the following supplemental disclosures related to Blocks I, III, IV and V. Information with respect to Blocks III and IV has been included from April 5, 2015, when our company began operating these blocks.
| A. | Reserve Quantity Information |
GrañUNNA Energía y Montero Petrolera S.A.’s net proved reserves in the fields in which they operate and changes in those reserves for operations are disclosed below. The net proved reserves represent our company’s best estimate of proved oil and natural gas reserves. For 20172018 and 20182019, reserve estimates have been evaluated by its technical staff (reservoir engineers and geoscience professionals) and submitted to its Reserve Development Committee. The estimates for all years presented conform to the definitions found in FASB ASC paragraph932-10-65-1 and Rule4-10(a) of RegulationS-X.
Proved oil reserves are those quantities of oil, which, by analysis of geosciences and engineering data, can be estimated with reasonable certainty to be economically producible, based on prices used to estimate reserves, from a given date forward from known reservoirs, and under existing economic conditions, operating methods, and government regulation prior to the time at which contracts providing the right to operate expire, unless evidence indicates that renewal is reasonably certain.
The term “reasonable certainty” implies a high degree of confidence that the quantities of oil actually recovered will equal or exceed the estimate. To achieve reasonable certainty, our company’s engineers and independent petroleum consultants relied on technologies that have been demonstrated to yield results with consistency and repeatability. The technologies and economic data used to estimate our company’s proved reserves include, but are not limited to, well logs, geologic maps, seismic data, well test data, production data, historical price and cost information and property ownership interests.
PROVED RESERVES (1)
| | | | Total | | | Peru | | | Total | | | Peru | |
| | | Oil (MBBL) | | | Gas (MMcf) | | | Oil (MBBL) | | | Gas (MMcf) | | | Oil (MBBL) | | | Gas (MMcf) | | | Oil (MBBL) | | | Gas (MMcf) | |
Proved developed and undeveloped reserves, December 31, 2016 | | | 25,191 | | | | 10,521 | | | | 25,191 | | | | 10,521 | | |
Revisions of previous estimates | | | 2,451 | | | | 1,494 | | | | 2,451 | | | | 1,494 | | |
Enhanced oil recovery | | | — | | | | — | | | | — | | | | — | | |
Purchases | | | — | | | | — | | | | — | | | | — | | |
Production (a) | | | (1,146 | ) | | | (2,661 | ) | | | (1,146 | ) | | | (2,661 | ) | |
Sales in place | | | — | | | | — | | | | — | | | | — | | |
Proved developed and undeveloped reserves, December 31, 2017 | | | 26,496 | | | | 9,354 | | | | 26,496 | | | | 9,354 | | |
Revisions of previous estimates(2) | | | 2,332 | | | | 26,481 | | | | 2,332 | | | | 26,481 | | |
Proved developed and undeveloped reserves, December 31,
2018(2)(3) | | | | 27,494 | | | | 33,606 | | | | 27,494 | | | | 33,606 | |
Revisions of previous estimates(4) | | | | 2,660 | | | | (4,365 | ) | | | 2,660 | | | | (4,365 | ) |
Enhanced oil recovery | | | 0 | | | | 0 | | | | 0 | | | | 0 | | | | — | | | | — | | | | — | | | | — | |
Purchases | | | 0 | | | | 0 | | | | 0 | | | | 0 | | | | — | | | | — | | | | — | | | | — | |
Production | | | (1,334 | ) | | | (2,229 | ) | | | (1,334 | ) | | | (2,229 | ) | | | (1,486 | ) | | | (1,771 | ) | | | (1,486 | ) | | | (1,771 | ) |
Sales in place | | | 0 | | | | 0 | | | | 0 | | | | 0 | | | | — | | | | — | | | | — | | | | — | |
Proved developed and undeveloped reserves, December 31, 2018(3)(4) | | | 27,494 | | | | 33,606 | | | | 27,494 | | | | 33,606 | | |
Proved developed and undeveloped reserves, December 31,
2019(2)(3) | | | | 28,668 | | | | 27,470 | | | | 28,668 | | | | 27,470 | |
Revisions of previous estimates(4) | | | | (2,135 | ) | | | 30,486 | | | | | | (2,135 | ) |
Enhanced oil recovery | | | | — | | | | — | | | | — | | | | — | |
Purchases | | | | — | | | | — | | | | — | | | | — | |
Production | | | | (1,287 | ) | | | (1,540 | ) | | | | | (1,287 | ) |
Sales in place | | | | — | | | | — | | | | — | | | | — | |
Proved developed and undeveloped reserves, December 31, 2020 | | | | 25,245 | | | | 56,416 | | | | 25,245 | | | | 56,416 | |
| (1) | Proved reserves estimated in oil and gas properties located in Blocks I, III, IV and V (Talara and Paita) under two service contracts and two license contracts with Perupetro. The rights to produce hydrocarbons expire in December 2021 for Block I, April 2045 for Blocks III and IV, and October 2023 for Block V. The proved reserves estimated in this report constitute all of the proved reserves under contracts by GrañUNNA Energía y Montero Petrolera S.A. |
| (2) | Recategorized from resources to reserves due to the development of a project to transport gas from Block IV to our gas processing plant, which remains ongoing. This includes 12,078 MMcf as proved developed and 13,767 MMcf as proved undeveloped reserves.
|
(3) | The revisions in reserve estimates are based on new information obtained as a result of drilling activities and workovers. During 20172018 and 2018,2019, proved developed reserves of crude oil increased due to drilling activities in Block IV andIV. During 2020, proved developed reserves of crude oil decreased in 1,291 MBls due to mistake in the impactreserves estimation in Block V. Proved developed should be considered until the end of the higher price in reserve estimations.contract and not up the economic limit. |
(4)(3) | As of December 31, 2017, the associated gas reserves were 9,354 MMCF. As of December 31, 2018, 2019 and 2020, the associated gas reserves were 33,606 MMCF.MMCF, 27,460 MMCF and 56,416 MMC, respectively. |
| (4) | In Block III, the gas reserves as of December 31, 2020 were higher than gas reserves as of December 31, 2019, mainly due to gas resources that were converted into proved developed and proved undeveloped reserves following the execution in January 2020 by UNNA Energía and Gasnorp of a contract for sale of natural gas of Block III. In Block I, gas reserves reduced in 2020 as compared to the prior year due to their consumption in production and the scheduled expiration of the Block I contract in December 2021. |
RESERVE QUANTITY INFORMATION
FOR THE YEAR ENDED DECEMBER 31, 20162018
| | | | Total | | | Peru | | | Total | | | Peru | |
| | | Oil (MBBL) | | | Gas (MMCF) | | | Oil (MBBL) | | | Gas (MMCF) | | | Oil (MBBL) | | | Gas (MMCF) | | | Oil (MBBL) | | | Gas (MMCF) | |
Proved developed reserves | | | | | | | | | | | | | | | | |
Beginning of year | | | 9,168 | | | | 23,384 | | | | 9,168 | | | | 23,384 | | | | 8,664 | | | | 9,354 | | | | 8,664 | | | | 9,354 | |
End of year | | | 8,521 | | | | 10,521 | | | | 8,521 | | | | 10,521 | | | | 9,912 | | | | 19,839 | | | | 9,912 | | | | 19,839 | |
Proved undeveloped reserves | | | | | | | | | | | | | | | | |
Beginning of year | | | 14,562 | | | | 26,719 | | | | 14,562 | | | | 26,719 | | | | 17,833 | | | | — | | | | 17,833 | | | | — | |
End of year | | | 16,670 | | | | — | | | | 16,670 | | | | — | | | | 17,582 | | | | 13,767 | | | | 17,582 | | | | 13,767 | |
| RESERVE QUANTITY INFORMATION FOR THE YEAR ENDED DECEMBER 31, 2017 | | | | | | |
| | | | Total | | | Peru | | |
| | | Oil (MBBL) | | | Gas (MMCF) | | | Oil (MBBL) | | | Gas (MMCF) | | |
Proved developed reserves | | | | | | | | | |
Beginning of year | | | 8,521 | | | | 10,521 | | | | 8,521 | | | | 10,521 | | |
End of year | | | 8,664 | | | | 9,354 | | | | 8,663 | | | | 9,354 | | |
Proved undeveloped reserves | | | | | | | | | |
Beginning of year | | | 16,670 | | | | — | | | | 16,670 | | | | — | | |
End of year | | | 17,833 | | | | — | | | | 17,833 | | | | — | | |
| RESERVE QUANTITY INFORMATION FOR THE YEAR ENDED DECEMBER 31, 2018 | | | | | | |
| | | | Total | | | Peru | | |
| | | Oil (MBBL) | | | Gas (MMCF) | | | Oil (MBBL) | | | Gas (MMCF) | | |
Proved developed reserves | | | | | | | | | |
Beginning of year | | | 8,664 | | | | 9,354 | | | | 8,664 | | | | 9,354 | | |
End of year | | | 9,912 | | | | 19,839 | | | | 9,912 | | | | 19,839 | | |
Proved undeveloped reserves | | | | | | | | | |
Beginning of year | | | 17,833 | | | | — | | | | 17,833 | | | | — | | |
End of year | | | 17,582 | | | | 13,767 | | | | 17,582 | | | | 13,767 | | |
| | B. Capitalized Costs Relating to Oil and Gas Producing Activities | | | | | | |
| The following table sets forth the capitalized costs relating to our company’s crude oil and natural gas producing activities for the years indicated: | | |
RESERVE QUANTITY INFORMATION
FOR THE YEAR ENDED DECEMBER 31, 2019
| | | | | | | | | | | | | | | | | | | | |
| | | 2014 | | | 2015 | | | 2016 | | | 2017 | | | 2018 | |
| | | (in US$ thousands) | | | | |
Proved properties | | | | | | | | | | | | | | | | | | | | |
Concessions | | | | | | | | | | | | | | | | | | | | |
Mineral property, wells and related equipment | | | 47,267 | | | | 54,582 | | | | 39,069 | | | | 84,960 | | | | 99,129 | |
Drilling and Works in progress and Replacement Units | | | 11,290 | | | | 5,682 | | | | 6,188 | | | | 10,767 | | | | 11,920 | |
| | | | | | | | | | | | | | | | | | | | |
Total Proved Properties | | | 58,557 | | | | 60,264 | | | | 45,257 | | | | 95,727 | | | | 111,049 | |
Unproved properties | | | 0 | | | | 0 | | | | 0 | | | | 0 | | | | | |
| | | | | | | | | | | | | | | | | | | | |
Total Property, Plant and Equipment | | | 58,557 | | | | 60,264 | | | | 45,257 | | | | 95,727 | | | | 111,049 | |
Accumulated depreciation, depletion, and amortization, and valuation allowances | | | (13,735 | ) | | | (17,875 | ) | | | (17,774 | ) | | | (36,672 | ) | | | (45,426 | ) |
| | | | | | | | | | | | | | | | | | | | |
Net capitalized costs | | | 44,822 | | | | 42,389 | | | | 27,482 | | | | 59,054 | | | | 65,624 | |
| | | | | | | | | | | | | | | | | | | | |
| | | | | | | | | | | | | | | | |
| | | Total | | | Peru | |
| | | Oil (MBBL) | | | Gas (MMCF) | | | Oil (MBBL) | | | Gas (MMCF) | |
Proved developed reserves | | | | | | | | | | | | | | | | |
Beginning of year | | | 9,912 | | | | 13,767 | | | | 9,912 | | | | 9,354 | |
End of year | | | 10,366 | | | | 14,881 | | | | 10,366 | | | | 14,881 | |
Proved undeveloped reserves | | | | | | | | | | | | | | | | |
Beginning of year | | | 17,582 | | | | 13,767 | | | | 17,582 | | | | 13,767 | |
End of year | | | 18,301 | | | | 12,589 | | | | 18,301 | | | | 12,589 | |
RESERVE QUANTITY INFORMATION
FOR THE YEAR ENDED DECEMBER 31, 2020
| | | | | | | | | | | | | | | | |
| | | Total | | | Peru | |
| | | Oil (MBBL) | | | Gas (MMCF) | | | Oil (MBBL) | | | Gas (MMCF) | |
Proved developed reserves | | | | | | | | | | | | | | | | |
Beginning of year | | | 10,366 | | | | 14,881 | | | | 10,366 | | | | 14,881 | |
End of year | | | 9,314 | | | | 18,529 | | | | 9,314 | | | | 18,529 | |
Proved undeveloped reserves | | | | | | | | | | | | | | | | |
Beginning of year | | | 18,301 | | | | 12,589 | | | | 18,301 | | | | 12,589 | |
End of year | | | 15,931 | | | | 37,887 | | | | 15,931 | | | | 37,887 | |
| B. | Capitalized Costs Relating to Oil and Gas Producing Activities |
C. The following table sets forth the capitalized costs relating to our company’s crude oil and natural gas producing activities for the years indicated:
| | | | | | | | | | | | | | | | | | | | |
| | | 2016 | | | 2017 | | | 2018 | | | 2019 | | | 2020 | |
| | | (in US$ thousands) | | | | |
Proved properties | | | | | | | | | | | | | | | | | | | | |
Concessions | | | | | | | | | | | | | | | | | | | | |
Mineral property, wells and related equipment | | | 39,069 | | | | 84,960 | | | | 99,129 | | | | 131,752 | | | | 228,569 | |
Drilling and Works in progress and Replacement Units | | | 6,188 | | | | 10,767 | | | | 11,920 | | | | 4,895 | | | | 3,439 | |
| | | | | | | | | | | | | | | | | | | | |
Total Proved Properties | | | 45,257 | | | | 95,727 | | | | 111,049 | | | | 136,647 | | | | 232,009 | |
| | | | | | | | | | | | | | | | | | | | |
Unproved properties | | | — | | | | — | | | | — | | | | — | | | | | |
| | | | | | | | | | | | | | | | | | | | |
Total Property, Plant and Equipment | | | 45,257 | | | | 95,727 | | | | 111,049 | | | | 136,647 | | | | 232,009 | |
| | | | | | | | | | | | | | | | | | | | |
Accumulated depreciation, depletion, and amortization, and valuation allowances | | | (17,774 | ) | | | (36,672 | ) | | | (45,426 | ) | | | (59,553 | ) | | | (135,308 | ) |
| | | | | | | | | | | | | | | | | | | | |
Net capitalized costs | | | 27,482 | | | | 59,054 | | | | 65,624 | | | | 77,093 | | | | 96,701 | |
| | | | | | | | | | | | | | | | | | | | |
| C. | Costs Incurred in Oil and Natural Gas Property Acquisition, Exploration and Development Activities |
The following table sets forth costs incurred related to our company’s oil and natural gas activities for the years indicated:
| | | | 2014 | | 2015 | | 2016 | | 2017 | | 2018 | | | 2016 | | 2017 | | 2018 | | 2019 | | 2020 | |
| | | (in US$ thousands) | | | (in US$ thousands) | |
Acquisition costs of properties(1) | | | | | | | | | | | | | | | | | | | | |
Proved | | | — | | | | — | | | | — | | | | — | | | | — | | | | — | | | | — | | | | — | | | | — | | | | — | |
Unproved | | | — | | | | — | | | | — | | | | — | | | | — | | | | — | | | | — | | | | — | | | | — | | | | — | |
Total acquisition costs | | | | | | | | | | | | | | | | | | | | |
Exploration costs | | | — | | | | — | | | | — | | | | — | | | (1,121 | ) | | | — | | | | — | | | | (1,121 | ) | | | — | | | | — | |
Development costs | | | (13,126 | ) | | (17,179 | ) | | (19,161 | ) | | (22,905 | ) | | (25,192 | ) | | | (19,161 | ) | | | (22,905 | ) | | | (25,192 | ) | | | (44,612 | ) | | | (13,300 | ) |
| | | | | | | | | | | | | | | | | | | | | | | | | | | | | | |
Total | | | (13,126 | ) | | (17,179 | ) | | (19,161 | ) | | (22,905 | ) | | (26,313 | ) | | | (19,161 | ) | | | (22,905 | ) | | | (26,313 | ) | | | (44,612 | ) | | | (13,300 | ) |
| | | | | | | | | | | | | | | | | | | | | | | | | | | | | | |
| (1) | Our company has not incurred in any cost related to Oil and Gas property acquisition for all years presented. |
| D. | Results of Operations for Oil and Natural Gas Producing Activities |
The results of operations for oil and natural gas producing activities, excluding overhead costs and interest expenses, are as follows for the years indicated:
| | | | Total Peru | | | Total Peru | |
| | | 2014 | | 2015 | | 2016 | | 2017 | | 2018 | | | 2016 | | 2017 | | 2018 | | 2019 | | 2020 | |
| | | (in US$ thousands) | | | (in US$ thousands) | |
Revenues | | | | | | | | | | | | | | | | | | | | |
Additional Revenues of Gas Extraction Services | | | 59,233 | | | 57,938 | | | 50,556 | | | 67,049 | | | 96,543 | | | | 50,556 | | | | 67,049 | | | | 96,543 | | | | 100,042 | | | | 55,919 | |
| | | | | | | | | | | | | | | | |
Total Revenues(1) | | | 59,233 | | | | 57,938 | | | | 50,556 | | | | 67,949 | | | | 96,543 | | |
Total Revenues(1) | | | | 50,556 | | | | 67,949 | | | | 96,543 | | | | 100,042 | | | | 55,919 | |
Production Costs | | | (16,257 | ) | | | (25,976 | ) | | | (24,645 | ) | | | (28,097 | ) | | | (31,431 | ) | | | (24,645 | ) | | | (28,097 | ) | | | (31,431 | ) | | (32,741 | ) | | | (26,344 | ) |
Costs of Labor | | | (1,602 | ) | | | (1,660 | ) | | | (1,767 | ) | | | (2,008 | ) | | | (2,099 | ) | | | (1,767 | ) | | | (2,008 | ) | | | (2,099 | ) | | | (2,571 | ) | | | (3,791 | ) |
Repairs and Maintenance | | | (958 | ) | | | (1,828 | ) | | | (1,563 | ) | | | (2,076 | ) | | | (2,421 | ) | | | (1,563 | ) | | | (2,076 | ) | | | (2,421 | ) | | | (3,343 | ) | | | (2,984 | ) |
Materials, supplies and fuel consumed and supplies utilized | | | (6,486 | ) | | | 10,775 | ) | | | (9,540 | ) | | | (20,253 | ) | | | (9,704 | ) | | | (9,540 | ) | | | (20,253 | ) | | | (9,704 | ) | | | (8,373 | ) | | | (6,170 | ) |
External services, insurances, security and others | | | (3,605 | ) | | | (6,938 | ) | | | (6,388 | ) | | | (6,634 | ) | | | (7,979 | ) | | | (6,388 | ) | | | (6,634 | ) | | | (7,979 | ) | | | (9,684 | ) | | | (8,427 | ) |
Operation office and staff expenses | | | (3,607 | ) | | | (4,776 | ) | | | (5,388 | ) | | | (7,126 | ) | | | (9,228 | ) | | | (5,388 | ) | | | (7,126 | ) | | | (9,228 | ) | | | (8,771 | ) | | | (4,971 | ) |
Additional Natural Gas supply costs after price adjustment Royalties | | | | | (7,982 | ) | | | (7,402 | ) | | | (15,016 | ) | | | (30,892 | ) | |
DD&A Expenses | | | (13,672 | ) | | | (16,931 | ) | | | (17,223 | ) | | | (19,851 | ) | | | (17,690 | ) | |
Income (loss) before income taxes | | | 29,304 | | | | 7,048 | | | | 1,286 | | | | 4,984 | | | | 16,530 | | |
Income tax expense(2) | | | (8,791 | ) | | (1,974 | ) | | (373 | ) | | (1,470 | ) | | (4,876 | ) | |
Results of operations from producing activities | | | 20,513 | | | | 5,075 | | | | 913 | | | | 3,514 | | | | 11,654 | | |
| | | | | | | | | | | | | | | | | | | | |
| | | Total Peru | |
| | | 2016 | | | 2017 | | | 2018 | | | 2019 | | | 2020 | |
| | | (in US$ thousands) | |
Additional Natural Gas supply costs after price adjustment Royalties | | | (7,402 | ) | | | (15,016 | ) | | | (30,892 | ) | | | (31,508 | ) | | | (13,002 | ) |
DD&A Expenses | | | (17,223 | ) | | | (19,851 | ) | | | (17,690 | ) | | | (19,417 | ) | | | (15,719 | ) |
Income (loss) before income taxes | | | 1,286 | | | | 4,984 | | | | 16,530 | | | | 16,376 | | | | 855 | |
Income tax expense(2) | | | (373 | ) | | | (1,470 | ) | | | (4,876 | ) | | | (4,831 | ) | | | (252 | ) |
Results of operations from producing activities | | | 913 | | | | 3,514 | | | | 11,654 | | | | 11,545 | | | | 602 | |
| (1) | Income after deductions for GrañUNNA Energía y Montero Petrolera S.A.’s share of government royalties according to contract obligations. There are no sales or transfers to our company’s other operations. |
| (2) | In 2014, the legal tax rate was 30%. In 2015, the legal tax rate was 28%, and during 2016, the legal tax rate was 27%. In 2017, the Peruvian government increased the legal tax rate to 29.5%. In 2018, the Peruvian government retained the legal tax rate at 29.5%. In 2019, the legal tax rate was 30.25%. In 2020, the legal tax rate was 29.5%.
|
| E. | Standardized Measure of Discounted Future Net Cash Flows |
The standardized measure of discounted future net cash flows, related to the proved reserves is based on estimates of net proved reserves and the period during which they are expected to be produced. Future cash inflows are computed by applying the twelve month period unweighted arithmetic average of the price as of the first day of each month within that twelve month period, unless prices are defined by contractual arrangements, after royalty share of estimated annual future production from proved oil and gas reserves.
Future production and development costs to be incurred in producing and further developing the proved reserves are based on year end cost indicators. Future income taxes are computed by applying year end statutory tax rates.
The following chart shows standardized measures of discounted future net cash flows for the periods indicated:
| | | | 2014 | | 2015 | | 2016 | | 2017 | | 2018 | | | 2016 | | 2017 | | 2018 | | 2019 | | 2020 | |
| | | (in US$ thousands) | | | (in US$ thousands) | |
Future Cash inflows | | | 251,695 | | | | 1,461,565 | | | | 1,106,849 | | | | 1,436101 | | | | 2,041,128 | | | | 1,106,849 | | | | 1,436101 | | | | 2,041,128 | | | | 1,836,895 | | | | 1,718,573 | |
Future production costs | | | (72,857 | ) | | (507,212 | ) | | (285,608 | ) | | (776,847 | ) | | (1,446,949 | ) | | | (285,608 | ) | | | (776,847 | ) | | | (1,446,949 | ) | | | (1,311,758 | ) | | | (968,795 | ) |
Future development costs | | | (37,423 | ) | | (368,873 | ) | | (463,224 | ) | | (221,557 | ) | | (232,432 | ) | | | (463,224 | ) | | | (221,557 | ) | | | (232,432 | ) | | | (338,141 | ) | | | (336,998 | ) |
Future production and development costs | | | (110,280 | ) | | | (876,085 | ) | | | (748,832 | ) | | | (998,404 | ) | | | (1,679,381 | ) | | | (748,832 | ) | | | (998,404 | ) | | | (1,679,381 | ) | | | (1,649,899 | ) | | | (1,305,793 | ) |
Future income tax expenses | | | (37,264 | ) | | (153,178 | ) | | (105,615 | ) | | (129,121 | ) | | (106,715 | ) | | | (105,615 | ) | | | (129,121 | ) | | | (106,715 | ) | | | (52,800 | ) | | | (115,402 | ) |
Future Net cash flows | | | 104,151 | | | | 432,301 | | | | 252,402 | | | | 308,577 | | | | 255,031 | | | | 252,402 | | | | 308,577 | | | | 255,031 | | | | 134,196 | | | | 297,379 | |
10% annual discount for estimates timing of cash flows | | | (29,483 | ) | | (209,039 | ) | | (115,028 | ) | | (168,224 | ) | | (115,518 | ) | | | (115,028 | ) | | | (168,224 | ) | | | (115,518 | ) | | | (62,683 | ) | | | (179,664 | ) |
Standardized measure of discounted Future
Net Cash Flow s | | | 74,668 | | | | 223,262 | | | | 137,374 | | | | 140,353 | | | | 139,514 | | |
Standardized measure of discounted Future Net Cash Flows | | | | 137,374 | | | | 140,353 | | | | 139,514 | | | | 71,512 | | | | 117,715 | |
| (1) | For oil volumes, per barrel prices after deductions of GrañUNNA Energía y Montero Petrolera S.A.’s share government royalties used in determining future cash inflows for the years ended December 31, 2014, 2015, 2016, 2017, 2018, 2019 and 20182020 were US$77.33, US$45.59, US$38.54, US$49.82, US$64.72 and US$64.72,61.19 and US$38.06, respectively. For gas volumes, gas price is linked to the oil price according to the gas purchase contract. |
| (2) | Production costs and developments costs relating to future production of proved reserves are based on the continuation of existing economic conditions. Future estimated decommissioning costs are included. |
| (3) | Taxation is computed using the appropriateyear-end statutory corporate income tax rates. |
| (4) | Future net cash flows from oil production are discounted at 10% regardless of assessment of the risk associated with its production activities. |
F. | F. Changes in Standardized Measure of Discounted Future Net Cash Flows |
The following chart shows changes in standardized measures of discounted future net cash flows for the periods indicated:
| | | | | | | | | | | | | | | | | | | | |
| | | 2014 | | | 2015 | | | 2016 | | | 2017 | | | 2018 | |
| | | (in US$ thousands) | |
Standardized measure of discounted Future Net Cash Flows, beginning of the year. | | | 97,474 | | | | 74,668 | | | | 223,262 | | | | 137,374 | | | | 140,353 | |
Revenue less production and other costs | | | (75,490 | ) | | | (103,058 | ) | | | (75,202 | ) | | | (96,045 | ) | | | (127,974 | ) |
Net changes in future development costs | | | 11,497 | | | | (185,387 | ) | | | (53,464 | ) | | | 94,388 | | | | (6,204 | ) |
Changes in price, net of production costs | | | (53,214 | ) | | | (284,832 | ) | | | 560 | | | | (109,168 | ) | | | (68,095 | ) |
Development cost incurred | | | 13,126 | | | | 17,179 | | | | 19,161 | | | | 22,905 | | | | 29,218 | |
Revisions of previous quantity estimates | | | 23,273 | | | | 674,418 | | | | (54,052 | ) | | | 27,456 | | | | 72,852 | |
Accretion of discount | | | 16,836 | | | | 67,666 | | | | 55,438 | | | | 70,152 | | | | 99,822 | |
Net change in income taxes | | | 9,286 | | | | (53,715 | ) | | | 21,327 | | | | (85 | ) | | | 427 | |
Timing difference and other | | | 31,879 | | | | (16,330 | ) | | | (343 | ) | | | (6,623 | ) | | | (886 | ) |
Standardized measure of discounted Future Net Cash Flows, end of the year | | | 74,668 | | | | 223,262 | | | | 137,374 | | | | 140,353 | | | | 139,514 | |
| | | | | | | | | | | | | | | | | | | | |
| | | 2016 | | | 2017 | | | 2018 | | | 2019 | | | 2020 | |
| | | (in US$ thousands) | |
Standardized measure of discounted Future Net Cash Flows, beginning of the year | | | 223,262 | | | | 137,374 | | | | 140,353 | | | | 139,514 | | | | 71,512 | |
Revenue less production and other costs | | | (75,202 | ) | | | (96,045 | ) | | | (127,974 | ) | | | (132,783 | ) | | | (82,263 | ) |
Net changes in future development costs | | | (53,464 | ) | | | 94,388 | | | | (6,204 | ) | | | (53,324 | ) | | | 3,220 | |
Changes in price, net of production costs | | | 560 | | | | (109,168 | ) | | | (68,095 | ) | | | (55,359 | ) | | | (196,850 | ) |
Development cost incurred | | | 19,161 | | | | 22,905 | | | | 29,218 | | | | 44,612 | | | | 13,300 | |
Revisions of previous quantity estimates | | | (54,052 | ) | | | 27,456 | | | | 72,852 | | | | 9,882 | | | | 256,492 | |
Accretion of discount | | | 55,438 | | | | 70,152 | | | | 99,822 | | | | 87,508 | | | | 76,484 | |
Net change in income taxes | | | 21,327 | | | | (85 | ) | | | 427 | | | | 30,250 | | | | (17,043 | ) |
Timing difference and other | | | (343 | ) | | | (6,623 | ) | | | (886 | ) | | | 1,213 | | | | 7,137 | |
Standardized measure of discounted Future Net Cash Flows, end of the year | | | 137,374 | | | | 140,353 | | | | 139,514 | | | | 71,512 | | | | 117,715 | |
EXHIBIT INDEX
| | |
Exhibit Number | | Description |
| |
1.01*1.01 | | By-Laws of the Registrant, as currently in effect |
| |
2.01** | | Registrant’s Form of American Depositary Receipt |
| |
2.02** | | Deposit Agreement, dated as of December 31, 2018, among the Registrant, The Bank of New York Mellon, as depositary, and all owners and holders from time to time of American depositary shares issued thereunder |
| |
| 8.01 | | Subsidiaries of the Registrant |
| |
10.01*** | | Credit Agreement, dated as of December 10, 2015,July 31, 2019, by and among, inter alia, Graña y Montero,between Aenza, as borrower, and Credit Suisse AG, Cayman Islands Branch,CS Peru Infrastructure Holdings LLC, as administrative agent.initial lender. |
| |
10.01.1*** | | Amendment, No. 1,Waiver and Consent, dated as of December 22, 2015, to the Credit Agreement, dated as of December 10, 2015,February 28, 2020, by and among, inter alia, Graña y Montero,between Aenza, as borrower, and Credit Suisse AG, Cayman Islands Branch,CS Peru Infrastructure Holdings LLC, as administrative agent.initial lender. |
| |
10.01.2*** | | Amendment No. 2, dated as of February 1, 2016, to the Credit Agreement, dated as of December 10, 2015, by and among, inter alia, Graña y Montero, as borrower, and Credit Suisse AG, Cayman Islands Branch, as administrative agent. |
| |
10.01.3*** | | Amendment No. 3, dated as of February 12, 2016, to the Credit Agreement, dated as of December 10, 2015, by and among, inter alia, Graña y Montero, as borrower, and Credit Suisse AG, Cayman Islands Branch, as administrative agent. |
| |
10.01.4*** | | Amendment No. 4, dated as of February 29, 2016, to the Credit Agreement, dated as of December 10, 2015, by and among, inter alia, Graña y Montero, as borrower, and Credit Suisse AG, Cayman Islands Branch, as administrative agent. |
| |
10.01.5*** | | Amendment No. 5, dated as of April 15, 2016, to the Credit Agreement, dated as of December 10, 2015, by and among, inter alia, Graña y Montero, as borrower, and Credit Suisse AG, Cayman Islands Branch, as administrative agent. |
| |
10.01.6***10.01.2 | | Waiver and Amendment No. 6, dated as of September 15, 2016, to the CreditConsent Agreement, dated as of December 10, 2015,23, 2020, by and among, inter alia, Graña y Montero,between Aenza, as borrower, and Credit Suisse AG, Cayman Islands Branch,CS Peru Infrastructure Holdings LLC, as administrative agent. |
| |
10.01.7*** | | Amendment No. 7, dated as of December 16, 2016, to the Credit Agreement, dated as of December 10, 2015, by and among, inter alia, Graña y Montero, as borrower, and Credit Suisse AG, Cayman Islands Branch, as administrative agent. |
| |
10.01.8*** + | | Amendment No. 8, dated as of June 27, 2017, to the Credit Agreement, dated as of December 10, 2015, by and among, inter alia, Graña y Montero, as borrower, and Credit Suisse AG, Cayman Islands Branch, as administrative agent. |
| |
10.01.9*** | | Amendment No. 9, dated as of October 12, 2017, to the Credit Agreement, dated as of December 10, 2015, by and among, inter alia, Graña y Montero, as borrower, and Credit Suisse AG, Cayman Islands Branch, as administrative agent.initial lender. |
| |
10.02*** | | Loan Agreement, dated as of June 27, 2017, by and among, inter alia, Graña y Montero, as borrower, and Natixis, New York Branch, as administrative agent. |
| |
10.02.1*** | | Waiver and Amendment, dated as of March 26, 2018, to the Credit Agreement, dated as of June 27, 2017, by and among, inter alia, Graña y Montero, as borrower, and Natixis, New York Branch, as administrative agent. |
| | |
Exhibit Number
| | Description
|
| |
10.03*** | | English translation of Financial Stability Framework Agreement, dated as of July 31, 2017, by and among, inter alia, Graña y Montero,Aenza, as borrower, and Scotiabank Perú S.A.A., Banco Internacional del Perú S.A.A., BBVA Banco Continental, Banco de Crédito del Perú, Citibank del Perú S.A. and Citibank, N.A., as lenders. |
| |
10.04*10.03*** | | English translation of Section 20 of Concession Agreement, dated as of July 22, 2014, by and among the Peruvian Ministry of Energy and Mines, as contracting authority and the concessionaire party thereto. |
| |
10.05*10.04*** | | English translation of Memorandum of Understanding, dated as of September 26, 2017, by and among Graña y Montero,Aenza, Negocios de Gas S.A., Enagás S.A., Odebrecht S.A., and Inversiones en Infraestructura de Transporte por Ductos S.A.C. |
| |
10.05.1*10.04.1*** | | English translation of Rights Subordination Agreement, dated as of April 29, 2016, by and among Odebrecht Latinvest Peru Ductos, S.A., Odebrecht S.A., Enagás, S.A., Graña y Montero,Aenza, Negocios de Gas S.A., Inversiones en Infraestructura de Transporte por Ductos S.A.C., and Gasoducto Sur Peruano S.A. |
| |
10.05.1.1*10.04.1.1*** | | English translation of Addendum No. 1, dated as of June 24, 2016, to the Rights Subordination Agreement, dated as of April 29, 2016, by and among, inter alia, Odebrecht Latinvest Peru Ductos, S.A., Odebrecht S.A., Enagás, S.A., Graña y Montero, GyM S.A.,Aenza, Cumbra, Negocios de Gas S.A., Inversiones en Infraestructura de Transporte por Ductos S.A.C., Gasoducto Sur Peruano S.A., Odebrecht Perú Ingeniería y Construcción S.A.C., and Constructora Norberto Odebrecht S.A., Sucursal del Perú. |
| |
10.05.1.2*10.04.1.2*** | | English translation of Addendum No. 2 and Assignment Agreement, dated as of August 11, 2016, to the Rights Subordination Agreement, dated as of April 29, 2016, by and among, inter alia, Odebrecht Latinvest Peru Ductos, S.A., Odebrecht S.A., Enagás, S.A., Graña y Montero, GyM S.A.,Aenza, Cumbra, Negocios de Gas S.A., Inversiones en Infraestructura de Transporte por Ductos S.A.C., Gasoducto Sur Peruano S.A., Odebrecht Perú Ingeniería y Construcción S.A.C., and Constructora Norberto Odebrecht S.A., Sucursal del Perú. |
| |
10.05.1.3*10.04.1.3*** | | English translation of Modification to Addendum No. 2 and Assignment Agreement, dated as of October 25, 2016, to the Rights Subordination Agreement, dated as of April 29, 2016, by and among, inter alia, Odebrecht Latinvest Peru Ductos, S.A., Odebrecht S.A., Enagás, S.A., Graña y Montero, GyM S.A.,Aenza, Cumbra, Negocios de Gas S.A., Inversiones en Infraestructura de Transporte por Ductos S.A.C., Gasoducto Sur Peruano S.A., Odebrecht Perú Ingeniería y Construcción S.A.C., and Constructora Norberto Odebrecht S.A., Sucursal del Perú. |
| |
| 10.05** | | Description of Securities Registered Pursuant to Section 12 of the Exchange Act |
| * | Incorporated herein by reference to exhibit 1.01 of the Registrant’s registration statement on Form20-F (FileNo. 333-172855)F-6 filed with the SEC on April 30, 2014.December 10, 2018. |
| ** | Incorporated herein by reference to exhibit 1 to the Registrant’s registration statement on FormF-6 (FileNo. 333-228727)20-F filed with the SEC on December 10, 2018.June 25, 2020. |
| *** | Incorporated herein by reference to the Registrant’s Form20-F (FileNo. 333-172855) filed with the SEC on May 15, 2018. |
| **** | This certification will not be deemed “filed” for purposes of Section 18 of the Exchange Act (15 U.S.C. §78r), or otherwise subject to the liability of that section. Such certification will not be deemed to be incorporated by reference into any filing under the Securities Act or the Exchange Act, except to the extent that the Registrant specifically incorporates it by reference. |
+ | Confidential treatment requested.
|