| | Society | | To ensure at least 25% reduction in weighted average
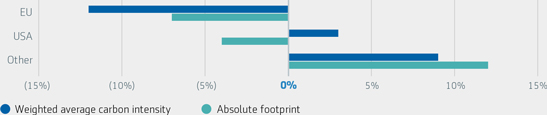
carbon intensity of our general account and investing USD 2.5 billion to help mitigate climate change or adapt to the associated impacts by 2025 (scope 3 emissions). Aegon is also working on reducing its direct operational impact (scope 1 and 2 emissions).Aegon’s impact on climate change adaptation is shaped by how Aegon invests within its existing portfolio and how it approaches future portfolio allocation/asset selection decisions. The main risks identified by Aegon regarding climate change adaptation are, again, related to physical and transition risks, such as the potential impact of extreme weather events on direct operations, infrastructure, assets, and supply chains. Climate change mitigation and adaptation also means actively engaging with the companies in which Aegon invests. Additional information on climate change related risks and opportunities is disclosed in the TCFD section (page 486-498). Policies and commitments Our Group Responsible Investment Policy and Net-Zero Asset Owner Alliance (NZAOA) membership provide a framework and guide our steps on climate change mitigation at the portfolio level. These steps involve assessing the feasibility of our established targets, actively engaging with companies in which Aegon invests, and potentially divesting from sectors with particularly negative impacts. | | | | | | | | Key performance indicator(s) and target(s) | | | | | | | | | KPI(s) | | Target for 2023 | | Performance in 2023 | | Target for 2024 | Weighted average carbon intensity for corporate fixed income and listed
| | 25% reduction by 2025 against 2019 baseline | | Ahead of target. 37% reduction by 2023 against 2019 baseline | | 25% reduction by 2025 against 2019 baseline | | | | | | Amount invested in companies to help mitigate climate change or adapt to the associated impacts by 2025 (USD billion) | | USD 2.5 billion investments by 2025.2025 | | Slightly behind projected budget. USD 1.8 billion invested | | USD 2.5 billion investments by 2025 | | | | | | Number of engagements with the largest corporate carbon emitters in our investment portfolio by 2025 | | Engagement with at least the top 20 corporate carbon emitters by 2025 | | On track. 19 investees were engaged | | Engagement with at least the top 20 corporate carbon emitters by 2025 | | | | | | Carbon intensity of our directly held real estate investments (Scopes 1 and 2) (kgCO2e/m2) | | New target | | Ahead of target. 46% reduction by 2023 against 2019 baseline | | 25% reduction by 2025 against 2019 baseline | | | | | | Absolute operational carbon emissions (Scopes 1 and 2) (metric tons CO2e) | | 25% reduction by 2025 against 2019 baseline | | Ahead of target. 68% reduction by 2023 against 2019 baseline | | 25% reduction by 2025 against 2019 baseline |
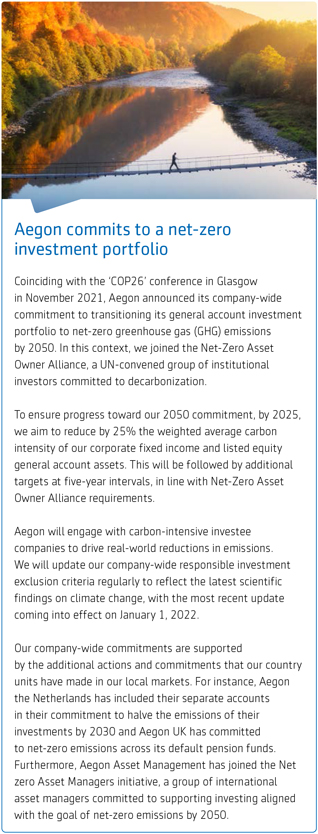
| 1 | Aegon is committed to transitioning its general account* investment portfolio to net-zero greenhouse gas (GHG) emissions by 2050. The commitment includes an intermediate target to reduce the carbon intensity for corporate fixed income and listed equity in our general account by 25% in 2025 compared with 2019. For details on the methodology used, please see the TCFD section (Methodology) on page 498. (* The general account portfolio consists of assets where Aegon can make the investment decisions, taking into account Aegon’s legal obligations under local laws and regulations. A similar approach applies to selected investments where Aegon AM in its capacity as manager makes the investment decisions. For discretionary investments on behalf of third parties and off-balance sheet investments, the investment decisions are driven by the relevant third parties as well as legal and/or fiduciary obligations of Aegon, as required by local laws and regulations.) |
462 | Annual Report on Form 20-F 2023
| | | | | | | | | | | | | | | | | | | | | | | | | | Metrics | | | | | | | | | | | | | | | | | | | | | | | | | | | | | | | | | | | | | unit | | | | | | | | | 2023 | | | | | | 2022 | | | | | | % | | | | | | | | | | | Climate change mitigation and adaptation | | | | | | | | | | | | | | | | | | | | | | | | | | | | | | | | | | Investment footprint | | | | | | | | | | | | | | | | | | | | | | | | | | | | | | | | | | Corporate Fixed Income + Listed Equity (CFI)1) | | | | | | | | | | | | | | | | | | | | | | | | | | | | | | | | | | Total carbon emissions | | tCO2e | | | | | | | | | 2,036,000 | | | | | | 2,640,000 | | | | | | (23% | ) | | | | | | | | | | Carbon footprint | | tCO2e/EURm invested | | | | | | | | | 82 | | | | | | 84 | | | | | | (2% | ) | | | | | | | | | | Total carbon emissions and carbon footprint (coverage) | | % | | | | | | | | | 90% | | | | | | 89% | | | | | | 1pp | | | | | | | | | | | Weighted average carbon intensity | | tCO2e/EURm revenue | | | | | | | | | 338 | | | | | | 428 | | | | | | (21% | ) | | | | | | | | | | Weighted average carbon intensity (coverage) | | % | | | | | | | | | 97% | | | | | | 97% | | | | | | 0pp | | | | | | | | | | | Reduction of weighted average carbon intensity vs 2019 baseline | | % | | | | | | | | | (37% | ) | | | | | (20% | ) | | | | | (17pp | ) | | | | | | | | | | Sovereign Fixed Income (SFI)2) - excluding LULUCF | | | | | | | | | | | | | | | | | | | | | | | | | | | | | | | | | | Total carbon emissions | | tCO2e | | | | | | | | | 1,411,000 | | | | | | n.m. | | | | | | n.m. | | | | | | | | | | | Carbon footprint | | tCO2e/EURm invested | | | | | | | | | 270 | | | | | | n.m. | | | | | | n.m. | | | | | | | | | | | Total carbon emissions and carbon footprint (coverage) | | % | | | | | | | | | 76% | | | | | | n.m. | | | | | | n.m. | | | | | | | | | | | Weighted average carbon intensity3) | | tCO2e/EURm invested | | | | | | | | | 270 | | | | | | n.m. | | | | | | n.m. | | | | | | | | | | | Weighted average carbon intensity (coverage) | | % | | | | | | | | | 76% | | | | | | n.m. | | | | | | n.m. | | | | | | | | | | | Sovereign Fixed Income (SFI)2) - including LULUCF | | | | | | | | | | | | | | | | | | | | | | | | | | | | | | | | | | Total carbon emissions | | tCO2e | | | | | | | | | 1,237,000 | | | | | | n.m. | | | | | | n.m. | | | | | | | | | | | Carbon footprint | | tCO2e/EURm invested | | | | | | | | | 240 | | | | | | n.m. | | | | | | n.m. | | | | | | | | | | | Total carbon emissions and carbon footprint (coverage) | | % | | | | | | | | | 76% | | | | | | n.m. | | | | | | n.m. | | | | | | | | | | | Weighted average carbon intensity3) | | tCO2e/EURm invested | | | | | | | | | 240 | | | | | | n.m. | | | | | | n.m. | | | | | | | | | | | Weighted average carbon intensity (coverage) | | % | | | | | | | | | 76% | | | | | | n.m. | | | | | | n.m. | | | | | | | | | | | Climate change resiliency (ND GAIN rating) | | score | | | | | | | | | 64 | | | | | | n.m. | | | | | | n.m. | | | | | | | | | | | Climate change resiliency (coverage) | | % | | | | | | | | | 100% | | | | | | n.m. | | | | | | n.m. | | | | | | | | | | | Real estate4) | | | | | | | | | | | | | | | | | | | | | | | | | | | | | | | | | | Total carbon emissions | | tCO2e | | | | | | | | | 4,783 | | | | | | n.m. | | | | | | n.m. | | | | | | | | | | | Total floor space | | m2 | | | | | | | | | 78,680 | | | | | | n.m. | | | | | | n.m. | | | | | | | | | | | Carbon intensity | | kgCO2e/m2 | | | | | | | | | 0.08 | | | | | | n.m. | | | | | | n.m. | | | | | | | | | | | Carbon intensity (coverage) | | % | | | | | | | | | 74% | | | | | | n.m. | | | | | | n.m. | | | | | | | | | | | Reduction of carbon intensity vs. 2019 baseline | | % | | | | | | | | | (46% | ) | | | | | n.m. | | | | | | n.m. | | | | | | | | | | | Active ownership | | | | | | | | | | | | | | | | | | | | | | | | | | | | | | | | | | Number of engagements with heaviest emitters (based on WACI)5) | | nr | | | | | | | | | 19 | | | | | | n.m. | | | | | | n.m. | | | | | | | | | | | Investment in companies contributing to climate mitigation and/or adaptation6) | | USDb | | | | | | | | | 1.8 | | | | | | n.m. | | | | | | n.m. | | | | | | | | | | | Operational footprint | | | | | | | | | | | | | | | | | | | | | | | | | | | | | | | | | | Greenhouse gas (GHG) emissions7) | | | | | | | | | | | | | | | | | | | | | | | | | | | | | | | | | | Scope 1 - gas | | tCO2e | | | | | | | | | 1,945 | | | | | | 3,361 | | | | | | (42% | ) | | | | | | | | | | Scope 2 - electricity - location based | | tCO2e | | | | | | | | | 11,301 | | | | | | 11,068 | | | | | | 2% | | | | | | | | | | | Scope 2 - electricity - market based | | tCO2e | | | | | | | | | 229 | | | | | | 335 | | | | | | (32% | ) | | | | | | | | | | Scope 3 - business travel | | tCO2e | | | | | | | | | 10,255 | | | | | | 6,350 | | | | | | 61% | | | | | | | | | | | Air travel - total emissions | | tCO2e | | | | | | | | | 8,301 | | | | | | n.m. | | | | | | n.m. | | | | | | | | | | | Train travel - total emissions | | tCO2e | | | | | | | | | 59 | | | | | | n.m. | | | | | | n.m. | | | | | | | | | | | Car travel - total emissions | | tCO2e | | | | | | | | | 1,895 | | | | | | n.m. | | | | | | n.m. | | | | | | | | | | | Total GHG emissions (location-based) | | tCO2e | | | | | | | | | 23,501 | | | | | | 20,780 | | | | | | 13% | | | | | | | | | | | Total GHG emissions per EURm revenue | | tCO2e/EURm revenue | | | | | | | | | 1.3 | | | | | | 1.1 | | | | | | 14% | | | | | | | | | | | Total GHG emissions per employee8) | | tCO2e/ employee | | | | | | | | | 2.0 | | | | | | 1.8 | | | | | | 12% | | | | | | | | | | | Total GHG emissions (market-based) | | tCO2e | | | | | | | | | 12,429 | | | | | | 10,047 | | | | | | 24% | | | | | | | | | | | Total GHG emissions per EURm revenue | | tCO2e/EURm revenue | | | | | | | | | 0.7 | | | | | | 0.5 | | | | | | 32% | | | | | | | | | | | Total GHG emissions per employee9) | | tCO2e/ employee | | | | | | | | | 1.1 | | | | | | 0.9 | | | | | | 19% | | | | | | | | | | | Total scope 1+2 emissions (location-based) | | tCO2e | | | | | | | | | 13,246 | | | | | | 14,430 | | | | | | (8% | ) | | | | | | | | | | Absolute reduction of scope 1+2 vs. 2019 baseline | | tCO2e | | | | | | | | | (28,551 | ) | | | | | (27,367 | ) | | | | | 4% | | | | | | | | | | | Relative reduction of scope 1+2 vs. 2019 baseline | | % | | | | | | | | | (68.0% | ) | | | | | (65.5% | ) | | | | | (2.5pp | ) | | | | | | | | | | Energy consumption | | | | | | | | | | | | | | | | | | | | | | | | | | | | | | | | | | Total energy (fuel and electricity) | | MWh | | | | | | | | | 40,744 | | | | | | 43,965 | | | | | | (7% | ) | | | | | | | | | | Fuel - gas | | MWh | | | | | | | | | 9,901 | | | | | | 15,284 | | | | | | (35% | ) | | | | | | | | | | Total electricity | | MWh | | | | | | | | | 30,843 | | | | | | 28,680 | | | | | | 8% | | | | | | | | | | | Renewable electricity | | MWh | | | | | | | | | 30,489 | | | | | | 28,105 | | | | | | 8% | | | | | | | | | | | Green tariff/Renewable Energy Certificate (REC) | | MWh | | | | | | | | | 30,489 | | | | | | 28,105 | | | | | | 8% | | | | | | | | | | | Self-generated | | MWh | | | | | | | | | - | | | | | | - | | | | | | - | |
| 1 | | | | | | | | | | Annual Report on Form 20-F 2023 | 463 | | |
Customer satisfaction | | | | |  | | About Aegon Governance and risk management Financial information Sustainability information | | | | | | | | | | |
| | | | | | | | | | | | | | | | | | | | | | | | | | | | | | | | | | | | | unit | | | | | | | | | 2023 | | | | | | 2022 | | | | | | % | | | | | | | | | | | Non-renewable electricity | | MWh | | | | | | | | | 354 | | | | | | 575 | | | | | | (38% | ) | | | | | | | | | | Renewable electricity - % of total electricity | | % | | | | | | | | | 99% | | | | | | 98% | | | | | | 1pp | | | | | | | | | | | Renewable energy - % of total energy | | % | | | | | | | | | 75% | | | | | | 64% | | | | | | 11pp | | | | | | | | | | | Business travel | | | | | | | | | | | | | | | | | | | | | | | | | | | | | | | | | | Air travel - total distance | | million km | | | | | | | | | 53.3 | | | | | | 46.9 | | | | | | 14% | | | | | | | | | | | Economy (as % of total distance) | | % | | | | | | | | | 76% | | | | | | 81% | | | | | | (5pp | ) | | | | | | | | | | Premium (as % of total distance) | | % | | | | | | | | | 24% | | | | | | 19% | | | | | | 5pp | | | | | | | | | | | Short distance (as % of total distance) | | % | | | | | | | | | 4% | | | | | | 6% | | | | | | (2pp | ) | | | | | | | | | | Long distance (as % of total distance) | | % | | | | | | | | | 96% | | | | | | 95% | | | | | | 1pp | | | | | | | | | | | Train travel - total distance | | million km | | | | | | | | | 1.67 | | | | | | n.m. | | | | | | n.m. | | | | | | | | | | | Car travel - total distance | | million km | | | | | | | | | 6.86 | | | | | | n.m. | | | | | | n.m. | |
| 1 | The scope covers global general account assets only. The disclosures are based on Aegon calculations. Relative intensity, weighted average carbon intensity and carbon risk rating are extrapolated in case carbon data is measurednot available. The availability of data for each indicator is expressed in benchmarked Net Promoter Score (SM)
(NPS®
)a coverage ratio as disclosed above. Climate change data availability may change over time and characteristics will vary. Certain information from ©2023 Sustainalytics and MSCI ESG Research L.L.C. is reproduced with permission and is not for further distribution. For more information see the TCFD section in this report. |
| 2 | The scope covers global general account assets only. The disclosures are based on Aegon calculations. The availability of data for each indicator is expressed in a coverage ratio as disclosed above. Data coverage for SFI indicators is based on UNFCCC national emissions inventory. As a result, indicators reflect coverage of available data and are not extrapolated. Climate change data is subject to delays, and availability may change over time and characteristics may vary. Climate change data used to calculate the Climate change resiliency (ND GAIN rating) is subject to its own methodology and may differ from the data used to calculate SFI indicators. For more information, see the TCFD section in this report. LULUCF stands for the sectors Land use, Land-use change, and Forestry. The scope 1 emissions are reported both including and excluding LULUCF. |
| 3 | The weighted average carbon intensity is calculated based on the purchasing power parity (PPP)-adjusted GDP. In previous years, this figure was calculated based on national debt. This change is a result of the revisions to the methodology used to calculate PCAF-financed emissions methodology of December 2022. Figures for previous years are not calculated using this new methodology. Therefore, data for 2022 is disclosed as “not measured”. |
| 4 | This metric covers “fully and jointly owned” commercial and residential real estate of Aegon’s general account portfolio, where Aegon directly owns physical buildings, or in the case of joint ownership, has a 25% or greater share. The indicator includes both landlord controlled and tenant-controlled buildings and areas. It does not include Real Estate Investment Trust (REIT), funds or other listed vehicles which should be captured under listed equity and corporate debt. The metric only covers scope 1 and 2 emissions from these buildings. Currently, data is only available for directly held real estate in Transamerica’s general account holdings. Also due to data limitations, it does not include tenant-related scope 3 emissions resulting from heating and electricity consumption. |
| 5 | Aegon seeks to establish a constructive dialogue with the top 20 heaviest emitters in Aegon’s general account either bilaterally or as part of an investor consortium, as we promote responsible business practices, including the reduction of our carbon footprint. This metric represents the number of companies that have been engaged by Aegon. The ranking of the top emitters is based on the weighted average carbon intensity (WACI) of Aegon’s corporate fixed income assets in the general account. |
| 6 | Climate solution investments are investments in economic activities considered to contribute substantially to climate change mitigation (solutions substantially reducing greenhouse gases by avoiding emissions or sequestering carbon dioxide already in the atmosphere) or climate change adaptation (activity that substantially contributes to enhancing adaptive capacity, strengthening resilience, and reducing vulnerability to climate change). Economic activities making a substantial contribution to the first two objectives must be assessed to ensure they do not cause significant harm to all remaining environmental or social objectives. When reviewing assets for inclusion, the use of proceeds must align with at least one of the stated Climate Solution Themes deemed acceptable by the Net Zero Asset Owners’ Alliance (Pollution Waste, & Water Solutions, Sustainable Land & Marine, Sustainable Transportation, Manufacturing & Industry, ICT Solutions, Green Buildings & Homes, and Renewable Energy). For labelled “Green” or “Sustainability” bonds, Bloomberg data is typically the source used to confirm that the stated use of proceeds meet eligibility criteria. Where available, third-party opinions are considered for support (e.g. Sustainalytics). Note that these investments are held in the Transamerica general account, and are not available for direct investment or co-investment by Transamerica clients. |
| 7 | Operational GHG emissions cover own energy consumption and business travel. Energy consumption data is extrapolated by floorspace for sites where consumption data is missing. A further extrapolation is made for employees working permanently from home by applying an average employee consumption to our office premises for each business unit. Where possible, GHG emissions are calculated on the basis of locally-specific conversion factors. Scope 1 conversion factors for gas consumption are sourced from the UK Department for Environment, Food & Rural Affairs (Defra) using “100% mineral” for the United States, and “5% biofuel blend” for the Netherlands, United Kingdom, Spain, and Hungary. Scope 2 GHG emissions are expressed through both the GHG Protocol “location-based” and “market-based” approaches, with location-based conversion factors for electricity consumption sourced from the US Environmental Protection Agency (eGRID regions), the European Environment Agency for the Netherlands, Spain and Hungary, and Defra for the United Kingdom. For the market-based approach, conversion factors are sourced from individual electricity suppliers. Conversion factors for air travel are sourced solely from Defra as they are applicable to all countries. Conversion factors for car and train travel are sourced from UK Department for Environment, Food & Rural Affairs (Defra), US Environmental Protection Agency, and the European Environment Agency. |
| 8 | Direct employees include employees from Aegon Ltd. and its wholly owned subsidiaries only. |
| 9 | Total GHG emissions (scope 1+2 and scope 3 Business travel) is divided by total revenues, excluding Joint ventures and associates, as presented in the segment results table in the financial statements under “Segment total”. |
SDGs We are committed to contributing to three UN SDGs and their targets related to climate change: 7. Affordable and clean energy Ensure access to affordable, reliable, sustainable, and modern energy for all. Target 7.2 Increase substantially the share of renewable energy in the global energy mix. Target 7.3 Double the global rate of improvement in energy efficiency. 9. Industry, innovation, and infrastructure Build resilient infrastructure, promote inclusive and sustainable industrialization and foster innovation. Target 9.4 Upgrade infrastructure and retrofit industries to make them sustainable, with increased resource-use efficiency and greater adoption of clean and environmentally sound technologies and industrial processes, with all countries taking action in accordance with their respective capabilities. 13. Climate action Take urgent action to combat climate change and its impacts. Target 13.1 Strengthen resilience and adaptive capacity to climate-related hazards and natural disasters in all countries. 464 | Annual Report on Form 20-F 2023
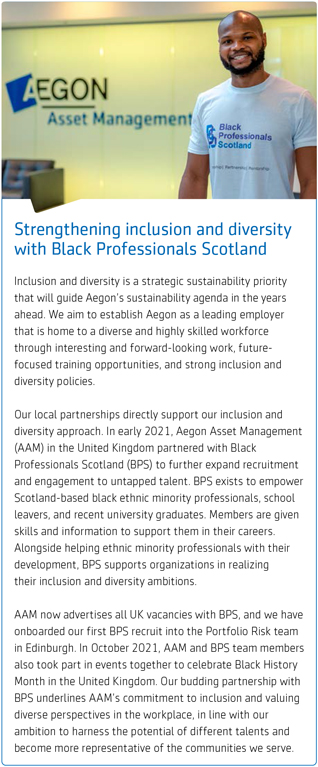
Inclusion and diversity Definition Providing all employees with a safe and fulfilling work environment where people treat each other with respect and dignity. Providing equal opportunities means that employees are selected solely on the basis of their ability to do the job and that there is no distinction, exclusion, or preference made on other grounds, either during the recruitment process or after. Promoting inclusion and diversity in the value chain. Sub-topics | ∎ | | Equal treatment and opportunities for all |
| ∎ | | Diversity (including measures against violence and harassment in the workplace) |
| ∎ | | Gender equality and equal pay for work of equal value |
Impacts, risks, and opportunities Aegon’s vision is to have impact on inclusion and diversity (I&D) by building a fair and inclusive company, where we overcome obstacles to participation and increase our diversity so that everyone belongs and plays a role in fostering inclusion. Our global inclusion and diversity strategy sets out policies and actions for all parts of Aegon to make an active contribution to building a more inclusive and diverse organization through a consistent and coherent way of working across the whole company. Aegon’s inclusion and diversity strategy is led from the top, with Aegon’s senior leadership serving as role models for I&D. They achieve this by sharing their own inclusion stories and actively championing areas of diversity excellence. We focus on five core areas pertinent to our workforce and customers: disability, sexual orientation, gender balance, life stages, and race/ethnicity. Currently our efforts are directed toward addressing the gender imbalance that persists in financial services by refining our hiring practices with a focus on inclusive recruitment, gender diversity within senior management, addressing gaps in our diversity data, and building an inclusive culture. The main risks and opportunities identified by Aegon in relation to inclusion and diversity are Aegon falling behind its peers in terms of customer understanding and talent attraction (business and reputational risk). Furthermore, with the rapid development of artificial intelligence (AI), there is an increasing risk of unintentional discrimination or bias, which could result in damage to (prospective) customers, as well as reputational and financial damage. By welcoming a broader range of perspectives into our workforce, we increase the opportunity to unlock new customer segments from historically underserved communities. We also become a more attractive employer, increasing the chances of securing the best talent for our business. Diversity and the ability to speak up also help us balance our risk profile and continue to support the long-term sustainability of our business. Policies and commitments | ∎ | | Our Statement on Inclusion and Diversity sets out Aegon’s approach to inclusion and diversity to create an environment where employees can bring their authentic selves to work. The statement incorporates Aegon’s commitment to enable this through its actions and inclusive policies in the workplace, the marketplace, and the communities in which it operates. |
| ∎ | | Our Diversity and Inclusion Policy addresses Aegon’s concrete targets for diversity in terms of nationality, age, gender, educational, professional and geographical background, and experience, in order to have a balanced and diverse composition of the Board and Executive Committee. |
| ∎ | | Our Statement on Human Rights provides a framework for Aegon’s ongoing stewardship of human rights, including both the direct impacts of our daily operations as well as the indirect impacts of our business activities. |
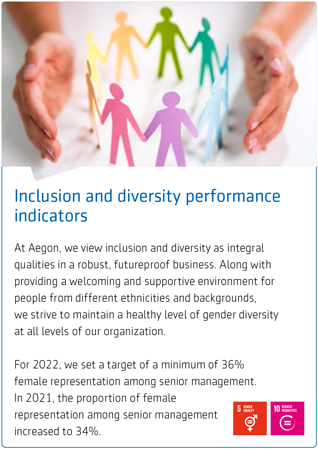
Key performance indicator(s) and target(s) | | | | | | | | KPI(s) | | Target for 2023 | | Performance in 2023 | | Target for 2024 | | | | | Proportion of women in senior management (%) | | Minimum 38% | | On track. 38% | | Minimum 40% |
In this context, senior management includes individuals up to two levels below the CEO (three levels for Corporate Center), provided they have direct reports. If the person has no direct reports, but the job title indicates the required seniority, the individual is also considered part of senior management. People working in the “administration” group are excluded from the list, unless their job title indicates the required seniority. | | | | | | | | | | | Annual Report on Form 20-F 2023 | 465 | | |
| | | | | | | About Aegon Governance and risk management Financial information Sustainability information | | | | | | | | | | |
Metrics | | | | | | | | | | | | | | | | | | | | | | | | | | | | | | | | | | | | | | unit | | | | 2023 | | | | 2022 | | | | % | | | | | | | | | | Equal treatment and opportunities for all | | | | | | | | | | | | | | | | | | | | | | | | | | | | | | | | | | | | | Diversity1) | | | | | | | | | | | | | | | | | | | | | | | | | | | | | | | | | | | | | Female employees | | | nr | | | | | | | | 5,830 | | | | | | | | 5,211 | | | | | | | | 12% | | | | | | | | | | Proportion of female employees | | | % | | | | | | | | 51% | | | | | | | | 48% | | | | | | | | 2pp | | | | | | | | | | Proportion of employees <30 years old | | | % | | | | | | | | 12% | | | | | | | | n.m. | | | | | | | | n.m. | | | | | | | | | | Proportion of employees 30-50 years old | | | % | | | | | | | | 55% | | | | | | | | n.m. | | | | | | | | n.m. | | | | | | | | | | Proportion of employees >50 years old | | | % | | | | | | | | 34% | | | | | | | | n.m. | | | | | | | | n.m. | | | | | | | | | | Work-related incidents (reported) | | | nr | | | | | | | | 53 | | | | | | | | 79 | | | | | | | | (33% | ) | | | | | | | | | Concerning discrimination | | | nr | | | | | | | | 3 | | | | | | | | 10 | | | | | | | | (70% | ) | | | | | | | | | Total amount of material fines penalties and compensations | | | EURm | | | | | | | | - | | | | | | | | - | | | | | | | | - | | | | | | | | | | Gender equality and equal pay for work of equal value | | | | | | | | | | | | | | | | | | | | | | | | | | | | | | | | | | | | | Senior management2) | | | | | | | | | | | | | | | | | | | | | | | | | | | | | | | | | | | | | Number of women in senior management | | | nr | | | | | | | | 164 | | | | | | | | 177 | | | | | | | | (7% | ) | | | | | | | | | Proportion of women in senior management | | | % | | | | | | | | 38% | | | | | | | | 36% | | | | | | | | 2pp | |
| 1 | The diversity figures are based on direct employees of Aegon. Direct employees include employees of Aegon Ltd. and its wholly owned subsidiaries. |
| 2 | In this context, senior management includes individuals up to two levels below the CEO (three levels for Corporate Center), provided they have direct reports. If the person has no direct reports, but the job title indicates the required seniority, the individual is also considered part of senior management. People working in the “administration” group are excluded from the list, unless their job title indicates the required seniority. |
SDGs We are committed to contributing to two UN SDGs and their targets related to inclusion and diversity: 5. Gender equality: Achieve gender equality and empower all women and girls. Target 5.5 Ensure women’s full and effective participation and equal opportunities for leadership at all levels of decision-making in political, economic and public life. 10. Reduced inequalities: Reduce inequality within and among countries. Target 10.2 Empower and promote the social, economic and political inclusion of all, irrespective of age, sex, disability, race, ethnicity, origin, religion or economic or other status. Target 10.4 Adopt policies, especially fiscal, wage and social protection policies, and progressively achieve greater equality. 466 | Annual Report on Form 20-F 2023
Customer empowerment Definition Helping people to live healthy, sustainable lives, and delivering long-term value to our customers by expanding and tailoring our offering to customers’ evolving needs, promoting financial literacy and the financial inclusion of underserved groups. This includes product innovation and social inclusion of our customers, for example by enabling individuals to save for their own retirement, thereby reducing their reliance on public pension systems. It also entails responsible marketing practices, providing transparent product information, fair pricing of products, and offering high levels of customer service, designed around customers’ changing needs. Sub-topics | ∎ | | Social inclusion of customers |
| ∎ | | Access to products and services |
| ∎ | | Responsible marketing practices |
Impacts, risks, and opportunities Aegon has a direct positive impact on its customers by offering a range of investment, retirement, and protection solutions. These encompass workplace and individual solutions, covering life insurance, long-term savings options, pension, and annuity solutions, and mortgages. These offerings work together to ensure the financial security of customers, thereby contributing to their overall financial wellbeing. This, in turn, supports their longevity, physical health, and mental wellbeing. Aegon does this by providing transparent information about our products and promoting financial education, enabling customers to make well-informed decisions about their financial futures. This is where Aegon has one of its greatest impacts, due to the size of the customer base and the number of people it can potentially influence. In its role as a financial institution, Aegon also has the potential to foster positive change through financial inclusion. Bridging gaps in access to financial products can be achieved by incorporating inclusion and diversity principles into product development and strategy. This approach can particularly benefit underserved groups, ethnic minorities, and reduce the gender pension gap. Additional aspects, such as fair pricing and responsible marketing, can contribute to customer empowerment. The main risks identified by Aegon are not attracting potential new customers or losing existing ones by not offering products or services in an appealing way to customers. On the other hand, offering more individualized products can reach a wider consumer base, leading to growth and increased market share, which are opportunities. However, the opportunities for individualized products may be limited by ethical issues such as privacy. As both a pension and life insurance provider, changing demographics have impacts for Aegon. For example, a healthier customer base and the provision of preventative services (for example, offering a free cancer scan to high-risk professionals), could lead to increased longevity whereas an unhealthier population will result in higher mortality. There is also an opportunity to embed I&D in product development, in order to provide financial inclusion to underserved segments of society. For example, products that specifically target women and communities traditionally not targeted by the financial services sector. Policies and commitments | ∎ | | The Pricing and Product Development Policy details Aegon’s approach to pricing and product development. It takes into account, among other things, ensuring a reasonable distribution of return/value to all stakeholders, the fair treatment of customers, and taking into account customer needs, including sustainability preferences, in the product approval process. |
| ∎ | | The Market Conduct Compliance Policy sets out key market conduct requirements, designed to prevent or mitigate customer detriment, support the proper management of conflicts of interest (including acting in the best interests of customers) and ensure that the interests, objectives, and characteristics of customers are duly taken into account. |
Key performance indicator(s) and target(s) | | | | | | | | KPI(s) | | Target for 2023 | | Performance in 2023 | | Target for 2024 | | | | | Significant fines to address cases of mis-selling (EUR) | | 0 EUR | | 0 EUR | | 0 EUR |
Until the end of 2022, customer satisfaction was measured using two KPIs, namely “Significant fines to address cases of mis-selling” and “Net Promoter Score(SM) (NPS®)”. From 2023, we will continue to measure customer satisfaction through the KPI “Significant fines to address cases of mis-selling”, which includes any fines for mis-selling in excess of EUR 100,000. | | | | | | | | | | | Annual Report on Form 20-F 2023 | 467 | | |
| | | | | | | About Aegon Governance and risk management Financial information Sustainability information | | | | | | | | | | |
Metrics | | | | | | | | | | | | | | | | | | | | | | | | | | | | | | | | | | unit | | | | 2023 | | | | 2022 | | | | % | | | | | | | | | Customer service | | | | | | | | | | | | | | | | | | | | | | | | | | | | | | | | Total customers1) | | | million | | | | | | | | 23.9 | | | | 26.8 | | | | | | | | (11%) | | | | | | | | | Americas | | | million | | | | | | | | 10.3 | | | | 10.8 | | | | | | | | (5%) | | | | | | | | | United Kingdom | | | million | | | | | | | | 4.0 | | | | 4.1 | | | | | | | | (0%) | | | | | | | | | International | | | million | | | | | | | | 9.6 | | | | 9.1 | | | | | | | | 6% | | | | | | | | | New customers2) | | | million | | | | | | | | 4.0 | | | | 3.6 | | | | | | | | 9% | | | | | | | | | Customer satisfaction (starting from 2023)3) | | | | | | | | | | | | | | | | | | | | | | | | | | | | | | | | United States - RepTrak | | | % | | | | | | | | 49.0 | | | | n.m. | | | | | | | | n.m. | | | | | | | | | United Kingdom - rNPS® | | | -100 to 100 | | | | | | | | (5 | ) | | | n.m. | | | | | | | | n.m. | | | | | | | | | Customer satisfaction (until 2022)4) | | | | | | | | | | | | | | | | | | | | | | | | | | | | | | | | United States - bNPS® | | | n.a. | | | | | | | | n.m. | | | | = Market Average | | | | | | | | n.m. | | | | | | | | | United Kingdom - bNPS® | | | n.a. | | | | | | | | n.m. | | | | < Market Average | | | | | | | | n.m. | | | | | | | | | Customer complaints5) | | | nr | | | | | | | | 85,133 | | | | 74,368 | | | | | | | | 14% | | | | | | | | | Social inclusion of customers | | | | | | | | | | | | | | | | | | | | | | | | | | | | | | | | Responsible marketing practices | | | | | | | | | | | | | | | | | | | | | | | | | | | | | | | | Significant mis-selling fines6) | | | EURm | | | | | | | | - | | | | - | | | | | | | | - | | | | | | | | | Proportion of compliance with Pricing and product development policy requirements | | | % | | | | | | | | 98 | % | | | 98 | % | | | | | | | 0pp | |
| 1 | Customers are those with individual, group or corporate policies. It also includes those participating in pension plans controlled by trustees or who have white label products serviced by Aegon or Transamerica. Customers of our joint ventures are included on a 100% basis. The customers of our joint venture in Brazil are reported in the segment International. |
| 2 | New customers are those who acquired a product or service during the reporting period (and who were not previously customers of Aegon). Customers of our joint ventures are included on a 100% basis. |
| 3 | In 2023, customer satisfaction in the United States was measured through RepTrak and in the United Kingdom through relationship Net Promoter Score(SM) (NPS®). RepTrak measures customer satisfaction based on the statement: “I would recommend the products & services of Transamerica. Customers can provide a rating between 1 “strongly disagree” and 7 “strongly agree. The outcome represents the percentage of customers who responded with either 6 “agree” or 7 “strongly agree”. rNPS measures customer satisfaction based on the question: ‘How“How likely are you to recommend Aegon/TransamericaAegon UK to a friend or colleague?” It is a single, metric that predicts overall company growth and customer lifetime value.. Customers answer based on a0-10
0 to 10 scale, where those answering 9 or 10 are deemed ‘promoters’“promoters”, those answering 7 or 8 are ‘passive’“passive”, and 0 to 6 to 0 are ‘detractors’“detractors”. The net promoter score is based on % of promoters minus the % of detractors. A negative NPS is calculated by subtracting the percentagerepresents a higher % of detractors fromamongst respondents than promoters. Net promoter score can be anywhere between -100 and +100. |
| 4 | Until the percentageend of promoters.2022, customer satisfaction was measured centrally through benchmarked Net Promoter Score(SM) (NPS®). On an annual basis, we measuremeasured the NPS ofin our core markets (the Netherlands, the United Kingdom, and the United States) and comparecompared findings against peers in each local market. To achieve this,Our target was to ensure that customer satisfaction in each of our core market worked with local research experts who specialize in NPS benchmarking:markets remains at or above the average of our peers. The peer groups were re-assessed each year to ensure a fair representation of the market. |
| 5 | Includes all written and verbal complaints from our customers. |
| 6 | Includes any fines for mis-selling in excess of EUR 100,000. |
SDGs We are committed to contributing to two UN SDGs and their targets related to customer empowerment: 3. Good health and wellbeing Ensure healthy lives and promote wellbeing for all at all ages. Target 3.8 Achieve universal health coverage, including financial risk protection, access to quality essential health-care services and access to safe, effective, quality and affordable essential medicines and vaccines for all. 8. Decent work and economic growth Promote sustained, inclusive, and sustainable economic growth, full and productive employment and decent work for all. Target 8.10 Strengthen the capacity of domestic financial institutions to encourage and expand access to banking, insurance and financial services for all. 468 | Annual Report on Form 20-F 2023
Employee wellbeing Definition Creating a work environment that promotes a state of contentment that allows employees to thrive and achieve their full potential for the benefit of themselves and their organization. It covers talent management, working conditions, and employee engagement. Sub-topics | ∎ | | Talent attraction, development, and retention |
| | ∎ | | NL: In partnership with Ipsos,Social dialog |
Impacts, risks, and opportunities Aegon’s actual positive and negative impacts are spread across various dimensions of talent management and working conditions. These include recruitment and retention, the performance and development cycle, education and training, compensation and benefits, engagement, and the physical and mental health and wellbeing of employees. Aegon aims to amplify its potential impact, contribute to meaningful and fulfilling careers for both young and older talent, and embody the characteristics of a modern and responsible employer. It also includes enhancing employee engagement, creating a vibrant and supportive work environment, providing wider benefits, helping employees to live their best lives and live Aegon’s purpose, promoting physical and mental wellbeing, and fostering entrepreneurial spirit in the company. The main risks identified by Aegon are difficulties in retaining and attracting employees due to a lack of flexibility, quality and relevance of work, career path, and competitive compensation and benefits. In addition to the loss of the human capital itself, a lack of talent could lead to dissatisfied customers and greater pressure on the existing workforce. Furthermore, low employee engagement can affect performance, which can lead to poor customer experience and a lack of innovation. Finally, the lack of availability of qualified staff is exacerbated for insurers competing for skilled talent not just with peers but also with other industries (business risk). By offering strong compensation programs and flexible working policies (hybrid and remote), and by investing in talent attraction, retention, training, and skills development, Aegon is able to create attractive prospects for existing and future employees and contribute to overall engagement and employee development. Policies and commitments | ∎ | | The Talent Principles and Talent Review Framework sets out Aegon’s approach to talent management to ensure we have the aggregated gap to market average score has been calculated as a weighted average of the gaps to market average of the various lines of business in active marketsright people in the Netherlands. Weights areright place to deliver our business ambitions. |
| ∎ | | The Performance and Development Cycle sets out Aegon’s approach to managing the performance of its people, focusing on current performance and future development and growth potential. |
| ∎ | | The Global Health and Safety Statement commits Aegon to achieving and maintaining high health and safety standards in all its business units worldwide, and outlines Aegon’s objectives and expectations. |
| ∎ | | The Global Remuneration Framework details Aegon’s remuneration philosophy and principles, as well as its approach to remuneration in general. The framework is based on the numberprinciple of contracts in each business line.pay for performance and sets out the principles of governance covering both fixed and variable pay. |
Key performance indicator(s) and target(s) | | | | | | | | | | | KPI(s) | | UK: In partnership with Respondi, the required market sample size was obtained from a group of panel participants. The Aegon score was taken from Aegon UK’s own NPS survey using the same questionnaire. The gap to market score is calculated as the difference between the Aegon NPS and the average NPS of all active brands in the market as established by the external research partner. |
| Target for 2023 | | US: In partnership with Qualtrics, the required sample size was collected through an external consumer panel for both the Life and Retirement businesses. The aggregated gap to market average is calculated by weighting the gaps to market average for Life and Retirement. Weights are based on the number of contracts for each product. |
With regards to the definition of “peers” for each core market:
| Performance in 2023 | | InTarget for 2024 | | | | | Result of the Netherlands, the competitive set used per line of business for the survey consisted of 25 brands (life), 37 brands (pension schemes), 22 brands (savings), 30 brands (P&C), 27 brands (mortgages) |
| most recent employee engagement score (%) | | In the UK, the competitive set used for the survey consisted of 10 brands (pension providing peers) |
| At least 72% | | In the United States the competitive set per line of business used for the survey consisted of 25 brands (life) and 19 brands (retirement) |
2 | Employee engagement is measured on a five-point scale (strongly disagree to strongly agree), and it is the average score of four statements:
|
| On track. 77% | | “At least 78% |
The Global Employee Survey is provided through Culture Amp®. All employees, including those in joint ventures, participate in the survey on a voluntary basis. Employee engagement is measured on a five-point scale (strongly disagree to strongly agree), and it is the average score of four statements: | ∎ | | The company motivates me to go beyond expectations”expectations |
| ∎ | | “I am proud to work for this company”company |
| ∎ | | “I see myself still working at this company in two years’ time”time |
| ∎ | | “I would recommend this company as a great place to work”work |
All employees, including those in joint ventures, participate on a voluntary basis. New hires employed for underIn 2023, three months do not participate. In 2021, three engagementemployee surveys were conducted throughout the year (Q1,including a short check-in survey in Q1, a focused I&D survey for most business units, excluding Transamerica, in Q2, and Q3), where thea full employee survey in Q3. The participation rate for the most recent onesurvey was 77%78%. 3 | In this context, senior management includes our Management Board and extends up to two levels below the Management Board (depending on the number of employees in each business or country unit).
|
4 | Aegon will set targets on its General Account investments in line with membership requirements of theNet-Zero
Asset Owner Alliance, following five-year increments of increasing ambition toward achievingnet-zero
greenhouse gas emissions by 2050. For details on the methodology used, please see our TCFD disclosure (Methodology) on page 378. |
Aegon Integrated Annual Report 2021
| | | | | | | | | | | Annual Report on Form 20-F 2023 | 469 | | |
| | | | | | | IntegrationAbout Aegon Governance and monitoring
|
As a company, Aegon is committed to doing business responsibly. We have internal policies, procedures and frameworks setting out how decisions should be made in areas such as procurement, investment, tax, product development, remuneration and information security. Aegon also has a Code of Conduct, which applies to all employees worldwide. The aim of these policies and procedures is to protect stakeholders by ensuring we are aware of all relevant financial andnon-financial
factors in our decision-making. We monitor implementation and take remedial action where necessary to ensure full compliance.The Aegon website includes a dedicated library for our. The following table demonstrates the incorporation of sustainability themes into Aegon’s decision-making processes through specific policies and statements, and provides an overview of the outcomes and our performance against the indicators underpinning them.
The following table shows how various sustainability topics are incorporated into Aegon’s decision-making processes, as well as relevant policies and statements and the outcomes as a result of the actions taken.
| | | | | | | | | | | | | | | (used to monitor compliance
and/or outcomes)
| | Outcome / Performance 2021
| | | | | | | | | | | | | | |
Metrics | | | | | | | | | | | | | | | | | | | | | | | | | | | | | | | | | | | | | Talent attraction, development, and retention | | | unit | | | | | | | | 2023 | | | | | | | | 2022 | | | | | | | | % | | | | | | | | | | Number of employees1) | | | nr | | | | | | | | 15,658 | | | | | | | | 15,478 | | | | | | | | 1% | | | | | | | | | | Americas | | | nr | | | | | | | | 6,967 | | | | | | | | 6,153 | | | | | | | | 13% | | | | | | | | | | United Kingdom | | | nr | | | | | | | | 2,591 | | | | | | | | 2,621 | | | | | | | | (1%) | | | | | | | | | | International | | | nr | | | | | | | | 3,654 | | | | | | | | 4,281 | | | | | | | | (15%) | | | | | | | | | | Asset Management | | | nr | | | | | | | | 1,409 | | | | | | | | 1,464 | | | | | | | | (4%) | | | | | | | | | | Holding and other activities | | | nr | | | | | | | | 1,037 | | | | | | | | 958 | | | | | | | | 8% | | | | | | | | | | Direct employees by business unit2) | | | nr | | | | | | | | 11,526 | | | | | | | | 10,781 | | | | | | | | 7% | | | | | | | | | | Permanent | | | nr | | | | | | | | 11,378 | | | | | | | | n.m. | | | | | | | | n.m. | | | | | | | | | | Americas | | | nr | | | | | | | | 6,319 | | | | | | | | n.m. | | | | | | | | n.m. | | | | | | | | | | United Kingdom | | | nr | | | | | | | | 2,264 | | | | | | | | n.m. | | | | | | | | n.m. | | | | | | | | | | International | | | nr | | | | | | | | 694 | | | | | | | | n.m. | | | | | | | | n.m. | | | | | | | | | | Asset Management | | | nr | | | | | | | | 1,130 | | | | | | | | n.m. | | | | | | | | n.m. | | | | | | | | | | Holding and other activities | | | nr | | | | | | | | 971 | | | | | | | | n.m. | | | | | | | | n.m. | | | | | | | | | | Temporary | | | nr | | | | | | | | 148 | | | | | | | | n.m. | | | | | | | | n.m. | | | | | | | | | | Americas | | | nr | | | | | | | | - | | | | | | | | n.m. | | | | | | | | n.m. | | | | | | | | | | United Kingdom | | | nr | | | | | | | | 75 | | | | | | | | n.m. | | | | | | | | n.m. | | | | | | | | | | International | | | nr | | | | | | | | 13 | | | | | | | | n.m. | | | | | | | | n.m. | | | | | | | | | | Asset Management | | | nr | | | | | | | | 40 | | | | | | | | n.m. | | | | | | | | n.m. | | | | | | | | | | Holding and other activities | | | nr | | | | | | | | 20 | | | | | | | | n.m. | | | | | | | | n.m. | | | | | | | | | | Non-guaranteed | | | nr | | | | | | | | - | | | | | | | | n.m. | | | | | | | | n.m. | | | | | | | | | | Americas | | | nr | | | | | | | | - | | | | | | | | n.m. | | | | | | | | n.m. | | | | | | | | | | United Kingdom | | | nr | | | | | | | | - | | | | | | | | n.m. | | | | | | | | n.m. | | | | | | | | | | International | | | nr | | | | | | | | - | | | | | | | | n.m. | | | | | | | | n.m. | | | | | | | | | | Asset Management | | | nr | | | | | | | | - | | | | | | | | n.m. | | | | | | | | n.m. | | | | | | | | | | Holding and other activities | | | nr | | | | | | | | - | | | | | | | | n.m. | | | | | | | | n.m. | | | | | | | | | | Direct employees by gender2) | | | nr | | | | | | | | 11,526 | | | | | | | | n.m. | | | | | | | | n.m. | | | | | | | | | | Permanent | | | nr | | | | | | | | 11,378 | | | | | | | | n.m. | | | | | | | | n.m. | | | | | | | | | | Male | | | nr | | | | | | | | 5,449 | | | | | | | | n.m. | | | | | | | | n.m. | | | | | | | | | | Female | | | nr | | | | | | | | 5,747 | | | | | | | | n.m. | | | | | | | | n.m. | | | | | | | | | | Other | | | nr | | | | | | | | 66 | | | | | | | | n.m. | | | | | | | | n.m. | | | | | | | | | | Not reported | | | nr | | | | | | | | 116 | | | | | | | | n.m. | | | | | | | | n.m. | | | | | | | | | | Temporary | | | nr | | | | | | | | 148 | | | | | | | | n.m. | | | | | | | | n.m. | | | | | | | | | | Male | | | nr | | | | | | | | 65 | | | | | | | | n.m. | | | | | | | | n.m. | | | | | | | | | | Female | | | nr | | | | | | | | 83 | | | | | | | | n.m. | | | | | | | | n.m. | | | | | | | | | | Other | | | nr | | | | | | | | - | | | | | | | | n.m. | | | | | | | | n.m. | | | | | | | | | | Not reported | | | nr | | | | | | | | - | | | | | | | | n.m. | | | | | | | | n.m. | | | | | | | | | | Non-guaranteed | | | nr | | | | | | | | - | | | | | | | | n.m. | | | | | | | | n.m. | | | | | | | | | | Male | | | nr | | | | | | | | - | | | | | | | | n.m. | | | | | | | | n.m. | | | | | | | | | | Female | | | nr | | | | | | | | - | | | | | | | | n.m. | | | | | | | | n.m. | | | | | | | | | | Other | | | nr | | | | | | | | - | | | | | | | | n.m. | | | | | | | | n.m. | | | | | | | | | | Not reported | | | nr | | | | | | | | - | | | | | | | | n.m. | | | | | | | | n.m. | | | | | | | | | | Non-employee workers in own workforce3) | | | nr | | | | | | | | 3,093 | | | | | | | | n.m. | | | | | | | | n.m. | | | | | | | | | | New hires | | | nr | | | | | | | | 2,333 | | | | | | | | 2,033 | | | | | | | | 15% | | | | | | | | | | Leavers4) | | | nr | | | | | | | | 1,466 | | | | | | | | 2,062 | | | | | | | | (29%) | | | | | | | | | | Proportion of leavers - voluntary | | | % | | | | | | | | 74% | | | | | | | | 83% | | | | | | | | (9pp) | | | | | | | | | | Proportion of leavers - involuntary | | | % | | | | | | | | 26% | | | | | | | | 17% | | | | | | | | 9pp | | | | | | | | | | Turnover rate | | | % | | | | | | | | 13% | | | | | | | | 18% | | | | | | | | (5pp) | | | | | | | | | | Turnover rate - voluntary | | | % | | | | | | | | 10% | | | | | | | | 15% | | | | | | | | (5pp) | | | | | | | | | | Turnover rate - involuntary | | | % | | | | | | | | 3% | | | | | | | | 3% | | | | | | | | 0pp | | | | | | | | | | Proportion of employees participating in performance and development reviews5) | | | % | | | | | | | | 89% | | | | | | | | n.m. | | | | | | | | n.m. | | | | | | | | | | Male | | | % | | | | | | | | 89% | | | | | | | | n.m. | | | | | | | | n.m. | | | | | | | | | | Female | | | % | | | | | | | | 89% | | | | | | | | n.m. | | | | | | | | n.m. | | | | | | | | | | Other | | | % | | | | | | | | 92% | | | | | | | | n.m. | | | | | | | | n.m. | | | | | | | | | | Not reported | | | % | | | | | | | | 92% | | | | | | | | n.m. | | | | | | | | n.m. | | | | | | | | | | Investment in training and career development | | | EURm | | | | | | | | 5.5 | | | | | | | | 6.3 | | | | | | | | (12%) | | | | | | | | | | Average investment in training and career development per employee | | | EUR | | | | | | | | 479 | | | | | | | | 561 | | | | | | | | (14%) | |
470 | Annual Report on Form 20-F 2023
| | | | | | | | | | | | | | | | | | | | | | | | | | | | | | | | | | | | | | | | | | | | | | | | | | | | | | | | | | | | | | | | | | | | | | | | | | | Employee engagement | | | | | | | | | | | | | | | | | | | | | | | | | | | | | | | | | | | | | Global Employee Survey (GES)6) | | | | | | | | | | | | | | | | | | | | | | | | | | | | | | | | | | | | | GES - Engagement | | | % | | | | | | | | 77% | | | | | | | | 70% | | | | | | | | 7pp | | | | | | | | | | GES - Leadership | | | % | | | | | | | | 66% | | | | | | | | 61% | | | | | | | | 5pp | | | | | | | | | | GES - Inclusion | | | % | | | | | | | | 79% | | | | | | | | 78% | | | | | | | | 1pp | | | | | | | | | | GES - Diversity | | | % | | | | | | | | 79% | | | | | | | | 76% | | | | | | | | 3pp | | | | | | | | | | GES - Wellbeing | | | % | | | | | | | | 71% | | | | | | | | n.m. | | | | | | | | n.m. | | | | | | | | | | GES - Participation rate | | | % | | | | | | | | 82% | | | | | | | | 79% | | | | | | | | 3pp | | | | | | | | | | Working conditions | | | | | | | | | | | | | | | | | | | | | | | | | | | | | | | | | | | | | Proportion of employees covered by collective bargaining / labor agreements7) | | | % | | | | | | | | 30% | | | | | | | | n.m. | | | | | | | | n.m. | | | | | | | | | | Americas | | | % | | | | | | | | 0% | | | | | | | | n.m. | | | | | | | | n.m. | | | | | | | | | | United Kingdom | | | % | | | | | | | | 100% | | | | | | | | n.m. | | | | | | | | n.m. | | | | | | | | | | International | | | % | | | | | | | | 13% | | | | | | | | n.m. | | | | | | | | n.m. | | | | | | | | | | Asset Management | | | % | | | | | | | | 55% | | | | | | | | n.m. | | | | | | | | n.m. | | | | | | | | | | Holding and other activities | | | % | | | | | | | | 38% | | | | | | | | n.m. | | | | | | | | n.m. | | | | | | | | | | Proportion of employees covered by workers’ representatives (EEA countries)8) | | | % | | | | | | | | 94% | | | | | | | | n.m. | | | | | | | | n.m. | | | | | | | | | | Proportion of employees covered by social protection9) | | | % | | | | | | | | 98% | | | | | | | | n.m. | | | | | | | | n.m. | | | | | | | | | | Total employment costs | | | EURb | | | | | | | | 1.7 | | | | | | | | 1.7 | | | | | | | | 0.0% | | | | | | | | | | Salary costs | | | EURb | | | | | | | | 1.1 | | | | | | | | 1.1 | | | | | | | | 0.0% | | | | | | | | | | Ratio of CEO compensation to average compensation10) | | | n.a. | | | | | | | | 25:1 | | | | | | | | 23:1 | | | | | | | | n.a. | | | | | | | | | | Proportion of compliance with the Global Remuneration Framework11) | | | % | | | | | | | | 100% | | | | | | | | 95% | | | | | | | | 5pp | | | | | | | | | | Total employee absence12) | | | days | | | | | | | | 24,760 | | | | | | | | 27,937 | | | | | | | | (11.4%) | | | | | | | | | | Employee absence rate | | | % | | | | | | | | 1.9% | | | | | | | | 2.1% | | | | | | | | (0.2pp) | | | | | | | | | | Percentage of employees entitled to take family-related leave13) | | | % | | | | | | | | 87% | | | | | | | | n.m. | | | | | | | | n.m. | | | | | | | | | | Percentage of entitled employees that took family-related leave13) | | | % | | | | | | | | 7% | | | | | | | | n.m. | | | | | | | | n.m. | | | | | | | | | | Male | | | % | | | | | | | | 6% | | | | | | | | n.m. | | | | | | | | n.m. | | | | | | | | | | Female | | | % | | | | | | | | 8% | | | | | | | | n.m. | | | | | | | | n.m. | | | | | | | | | | Other | | | % | | | | | | | | 4% | | | | | | | | n.m. | | | | | | | | n.m. | | | | | | | | | | Not reported | | | % | | | | | | | | 3% | | | | | | | | n.m. | | | | | | | | n.m. | |
| 1 | Number of employees on the last day of the reporting period, including all direct employees of Aegon, tied agents, and employees in Aegon’s subsidiaries and joint ventures. |
| 2 | Direct employees include employees of Aegon Ltd. and its wholly owned subsidiaries only. |
| 3 | Non-employee workers in our own workforce include individuals with a contract with Aegon to supply labour (“self-employed workers”) and workers provided by third-party companies primarily engaged in “employment activities”. Workers hired from third-party companies typically perform the same work as employees, such as workers who fill in for employees who are temporarily absent (due to illness, holiday, parental leave, etc.). |
| 4 | Leavers refer to direct employees whose contract termination date is within the reporting period. Involuntary turnover rate refers to direct employees whose contract termination date is within the reporting period and the reason for leaving is involuntary. The data does not include transfers where employees continue paid employment outside Aegon. In this respect, the divested businesses of Aegon Turkey and Aegon Hungary were not included in the “leavers” figure for 2022, and the divested businesses of Aegon the Netherlands were not included in the “leavers” figure for 2023. Therefore, the difference between new hires and leavers is not consistent with the decrease of direct employees from 2022 to 2023. |
| 5 | Includes direct employees who participated in annual performance and career development reviews. The breakdown by gender provides insight in the proportion of each category (male, female, other and not reported) that participated in performance and development reviews. |
| 6 | The Global Employee Survey is provided by the third-party service provider Culture Amp. All employees, including those in joint ventures, participate in the survey on a voluntary basis. Three employee surveys are conducted during each reporting year (Q1, Q2, and Q3). The results and participation rate disclosed reflect the most recent survey conducted in the third quarter of each year. |
| 7 | The figures include direct employees who are covered by a collective bargaining agreement or a collective labour agreement. Employees in higher salary scales who are not part of these agreements are also included in the coverage, as these salary scales are also determined or influenced by collective bargaining agreements. The split per business unit shows for each unit the proportion of direct employees of that unit covered by collective bargaining / labor agreements. |
| 8 | This includes direct employees covered by the works council. This data point is applicable for our European entities. It does not reflect employees that are member of a trade union. |
| 9 | This includes direct employees covered by social protection against loss of income due to sickness, unemployment, employment injury and acquired disability, maternity leave, and retirement either through government policies or company plans. |
| 10 | The ratio of CEO compensation to average employee compensation is based on the IFRS remuneration expenses for both the CEO and Aegon’s employees in the reporting year. |
| 11 | Policy compliance reflects the extent to which business units comply with specific requirements of those policies. Where there is less than full compliance, this does not indicate a breach of the policy, but rather areas where business units have requested time to further strengthen internal governance. |
| 12 | Employee absence refers to time off from work as a result of illness or injury. It excludes approved leave of absence such as holiday, study/training, maternity or paternity leave, parental leave, and caregiver leave. The absence rate is calculated as follows: (number of days lost to employee absence) / (total days worked by employees multiplied by the direct headcount). The number of days worked is the sum of all offical working days minus national holiday days in the country of operation. The absence rate excludes Transamerica employees, as this type of absence is not registered in the United States, but combined with annual leave. |
| 13 | Family-related leave includes maternity leave, paternity leave, parental leave, and caregiver leave. The breakdown by gender provides insight in the proportion of each category (male, female, other and not reported) that took family related leave. |
SDGs We are committed to contributing to two UN SDGs and their targets related to employee wellbeing: 3. Good health and wellbeing Ensure healthy lives and promote wellbeing for all at all ages. Target 3.4 Reduce by one third premature mortality from non-communicable diseases through prevention and treatment and promote mental health and wellbeing. 8. Decent work and economic growth Promote sustained, inclusive and sustainable economic growth, full and productive employment and decent work for all. Target 8.5 Achieve full and productive employment and decent work for all women and men, including for young people and persons with disabilities, and equal pay for work of equal value. | | | | | | | | | | | Annual Report on Form 20-F 2023 | 471 | | |
| | | | | | | About Aegon Governance and risk management Financial information Sustainability information | | | | | | | | | | |
Data security and privacy Definition Data security entails preserving the confidentiality, integrity, and availability of information assets of Aegon and its customers. It also includes ensuring the data privacy of Aegon’s employees, customers, and other stakeholders. Sub-topics Impacts, risks, and opportunities Data security and privacy is considered a key aspect of Aegon’s business, and Aegon has a duty to uphold strong cybersecurity and privacy measures. Aegon has various policies, procedures, and a set of information security requirements metrics to secure and protect data and to meet regulatory requirements (for example, privacy). Aegon is making a positive impact on this topic by protecting customer and employee data and establishing robust governance designed to prevent cyber issues and minimize the impact of any potential data breach. A breach of data privacy or security obligations may disrupt Aegon’s business, damage Aegon’s reputation, and adversely affect its financial condition and the results of its operations. Aegon’s businesses are subject to various laws and regulations relating to the privacy and/or information security of customers, employees, or others. Aegon relies on a variety of processes and controls to protect confidentiality, integrity, and availability of personal information and other confidential information. If Aegon fails, or its third-party providers fail, to maintain adequate processes and controls or fail to comply with relevant laws and regulations, inappropriate disclosure or misuse of personal information could occur. For more information on Data security and privacy risks, see the Risk factors section on pages 420-426. Advances in data management, analytics and AI are important considerations for Aegon. Data is an asset that helps us support our customers’ needs and preferences in terms of products and services through data-driven decision-making and leveraging emerging technologies. Robust data management and controls are a core foundation for leveraging these capabilities while ensuring we remain within our risk tolerances. Policies and commitments | ∎ | | The Global Information Security Policy sets out Aegon’s approach to cyberthreats and data protection, supported by mandatory training in information security. |
| ∎ | | The Aegon Privacy Control Framework is the basis for measuring privacy maturity at Aegon, which sets out the company’s approach to personal data protection, one of the controls of which is mandatory privacy training. |
| | | | | | | Key performance indicator(s) and target(s) | | | | | | | | | | | KPI(s) | | Target for 2023 | | Performance in 2023 | | Target for 2024 | | | | | Proportion of employees who completed the annual Information Security training (%) | | No target 2023 | | 94% | | No target 2024 |
| | | | | | | | | | | | | | | | | | Metrics | | | | | | | | | | | | | | | | | | | | | | | | | | unit | | | | 2023 | | | | 2022 | | | | % | | | | | | | Data security | | | | | | | | | | | | | | | | | | | | | | Number of employees who received the annual Information security training1) | | | nr | | | | 13,546 | | | | 13,540 | | | | 0% | | | | | | | Proportion of employees who completed the annual Information security training | | | % | | | | 94% | | | | 96% | | | | (2pp) | | | | | | | Number of enterprise-wide phishing campaigns launched during the year2) | | | nr | | | | 4 | | | | 4 | | | | 0% | | | | | | | Privacy | | | | | | | | | | | | | | | | | | | | | | Number of employees who received specific training on data privacy3) | | | nr | | | | 12,754 | | | | 11,905 | | | | 7% | | | | | | | Proportion of employees who completed specific training on data privacy | | | % | | | | 97% | | | | 99% | | | | (2pp) | |
| 1 | Direct employees and eligible contingent workers who are enrolled in Information security training at least annually. The training covers relevant information security topics based on risk assessments, best practices, and appropriate behaviors. Eligible contingent workers are contractors with an (Active Directory) Aegon or Transamerica account who are selected for the training. The selection is performed at the discretion of each business unit. |
| 2 | Enterprise wide phishing campaigns are run on a quarterly basis and covers all direct employees and all contingent workers with an e-mail account on the Aegon or Transamerica network. In addition, targeted campaigns are run periodically with a subset of users based on a common risk profile (e.g., Human Resources). |
| 3 | Direct employees and eligible contingent workers who are enrolled in an annual data privacy training. The training modules are different per region to address specific local legislation. The focus in Europe is on GDPR. Eligible contingent workers are contractors with an (Active Directory) Aegon or Transamerica account and selected for the training. The selection is performed at the discretion of each business unit. |
SDGs We are committed to contributing to one UN SDG and its target related to data security and privacy: 16. Peace, justice, and strong institutions Promote peaceful and inclusive societies for sustainable development, provide access to justice for all and build effective, accountable and inclusive institutions at all levels. Target 16.10 Ensure public access to information and protect fundamental freedoms, in accordance with national legislation and international agreements. 472 | Annual Report on Form 20-F 2023
Externally published document prescribingBusiness conduct Definition Conducting business ethically, with integrity and transparency, includes anti-corruption and anti-bribery measures, and protection for whistleblowers. Corruption is the abuse of power for private gain. Bribery is a form of corruption, and is defined as the offering, giving, receiving, or soliciting of anything of value to improperly influence the actions of another, whether a government official (public bribery) or a private party (commercial bribery). It also covers measures to prevent doing business with people or parties who may be involved in financial crimes. Whistleblowing mechanisms enable individuals to raise concerns about wrongdoing or breaches of the law in the organization’s operations or business relationships, regardless of whether the individuals themselves are harmed or not. Protection means without fear of retaliation. Responsible tax means being transparent about paying the right amount of tax in the right place. Sub-topics | ∎ | | Anti-corruption and anti-bribery, including whistleblower protection |
Impacts, risks, and opportunities Business conduct is a fundamental area where Aegon can make an impact. The subject is heavily influenced by legal requirements and includes aspects such as business ethics, anti-corruption and bribery, whistleblower protection, and responsible tax. At its core, Aegon makes a positive actual impact internally by aligning itself with international governance frameworks and implementing robust policies and procedures to ensure ethical business decisions that cater to stakeholders’ interests. This commitment also involves providing a safe environment for individuals to raise concerns regarding potential misconduct. Externally, Aegon has a positive influence throughout its wider value chain by implementing responsible investment and sourcing policies and managing relationships with various partners, including investee companies, customers, and suppliers. Another aspect of business conduct pertains to corporate culture and enhancing transparency, which includes being clear about Aegon’s products and activities. Business conduct is a fundamental and already well-established element within the business, with a well-established Code of Conduct and regular training on business conduct topics. Trust, transparency, and accountability are necessary for fostering long-term investment, financial stability, and business integrity. For example, the publication of a Global Tax Report provides stakeholders with a comprehensive overview of our approach to tax and our tax contributions on a country-by-country basis. Aegon has identified the following risks associated with doing business in a rapidly changing and highly politicized and regulated landscape. | ∎ | | Reputational risk as a result of increasing stakeholder expectations on business conduct and transparency, and the risk of not meeting or only partially meeting stated commitments if activities are not aligned across the group; |
| ∎ | | Failure to implement robust controls in relation to financial crime can result in regulatory penalties and damage to Aegon’s reputation; |
| ∎ | | Conduct risk as an important operational risk: avoiding conduct risk requires strong systems, processes, and governance; weakness or failure in those systems and processes, errors and omissions, or the loss of key personnel could result in financial loss or adversely affect our customers and reputation; |
| ∎ | | Geopolitical instability, including the challenges of navigating increasingly polarized societies, requires considerable effort to engage and communicate effectively with stakeholders. This can create potential strategic risks for Aegon. |
Ensuring good governance and strengthening internal control and risk management systems can turn these risks into opportunities. For example, by paying close attention to business conduct and risk management, we can proactively manage the risks associated with issues such as money laundering, bribery and corruption, and anti-competitive behavior, forging better relationships with stakeholders by building a reputation for taking action on business conduct and enhancing trust in the Aegon brand; engaging with investee companies, governments, and stakeholders to jointly encourage good business conduct, for example through the Vendor Code of Conduct. Policies and commitments | ∎ | | The Code of Conduct prescribes a mandatory set of conditions for how Aegon employees should conduct business, comply with all applicable laws and regulations, and exercise sound judgment in reachingmaking ethical business decisions in the long-term interests of our stakeholders. Training on |
| ∎ | | Supplementing the Aegon Code of Conduct, is mandatoryAegon Speak Up provides a safe environment for all employees). Aegon also has the Speak Up program, allowing employees and third partiesanyone who wishes to reportraise a concern (“whistleblowing”) about suspected illegal or unethical behavior in confidence.observed misconduct that involves Aegon. |
| ∎ | | The Aegon Code of Conduct provides guidance on the prevention of bribery and corruption (including gifts and entertainment). The internally published Anti-Bribery and Corruption (ABC) Policy provides further principles and guidelines to help Aegon employees make the right decision. |
| | | | | | | | | | | Annual Report on Form 20-F 2023 | 473 | | |
| | | | | | | About Aegon Governance and risk management Financial information Sustainability information | | | | | | | | | | |
● | | | | | ∎ The Aegon Code of Conduct provides guidance on conflicts of interest. The aim of the Conflict of Interest Policy is to provide further guidelines to help Aegon employees recognize a potential conflict of interest and how to handle the situation. ∎ The Global Tax Policy and Principles of Conduct outlines Aegon’s approach to responsible taxpaying, which seeks to align the long-term interests of all our stakeholders, including customers, employees, business partners, investors, and society at large. Aegon aims to pay “fair taxes”, which means paying the right amount of tax in the right place. | |
| | ∎ The Group Anti-Money Laundering & Counter Terrorist Financing Policy aims to protect Aegon and its subsidiaries, assets, clients, and external entities or individuals from being used by criminals to launder their proceeds from criminal activities or to finance terrorist activities. ∎ The Group Anti-Fraud Policy aims to protect Aegon and clients’ assets from fraudulent behavior of clients, business partners, employees, or any other external entity or individual. ∎ The Group Sanctions Policy aims to protect Aegon’s organization, products, and services from being used for prohibited transactions and for the purpose of evading, avoiding, or otherwise circumventing sanctions. |
| | | | | | | | Key performance indicator(s) and target(s) | | | | | | | | | | | KPI(s) | | Target for 2023 | | Performance in 2023 | | Target for 2024 | | | | | Proportion of new employees who completed the Code of Conduct attestation | | 95% | | Ahead of target. 99% | | 95% |
474 | Annual Report on Form 20-F 2023
| | | | | | | | | | | | | | | | | | Metrics | | | | | | | | | | | | | | | | | | | | | | | | | | unit | | | | 2023 | | | | 2022 | | | | % | | | | | | | Corruption and bribery including whistleblower protection | | | | | | | | | | | | | | | | | | | | | | Proportion of new employees who completed the Code of Conduct attestation | | | % | | | | 99% | | | | 99% | | | | (0pp) | | | | | | | Proportion of compliance with Anti-bribery policy requirements | | | % | | | | 100% | | | | 87% | | | | 13pp | | | | | | | Proportion of compliance with Conflict of interest policy requirements | | | % | | | | 97% | | | | 98% | | | | (1pp) | | | | | | | Systematic Integrity Risk Assessment (SIRA)1) | | | | | | | | | | | | | | | | | | | | | | Proportion of actions completed | | | % | | | | 58% | | | | 73% | | | | (16pp) | | | | | | | Proportion of actions completed or progressing within deadline | | | % | | | | 76% | | | | 82% | | | | (5pp) | | | | | | | Fraudulent activity | | | | | | | | | | | | | | | | | | | | | | Incidents - bribery or corruption2) | | | nr | | | | - | | | | n.m. | | | | n.m. | | | | | | | Number of convictions | | | nr | | | | - | | | | n.m. | | | | n.m. | | | | | | | Value of fines | | | EURm | | | | - | | | | n.m. | | | | n.m. | | | | | | | Number of dismissed or disciplined workers | | | nr | | | | - | | | | n.m. | | | | n.m. | | | | | | | Number of contracts with business partners terminated or not renewed | | | nr | | | | - | | | | n.m. | | | | n.m. | | | | | | | Incidents - fraud3) | | | nr | | | | 156 | | | | 584 | | | | (73%) | | | | | | | Employees | | | % | | | | 0.0% | | | | 0.2% | | | | (0.2pp) | | | | | | | Intermediaries | | | % | | | | 15% | | | | 3% | | | | 12pp | | | | | | | Third parties | | | % | | | | 85% | | | | 97% | | | | (11pp) | | | | | | | Responsible tax | | | | | | | | | | | | | | | | | | | | | | Total taxes borne by Aegon4) | | | EURm | | | | 637 | | | | 362 | | | | 76% | | | | | | | Corporate income tax4) | | | EURm | | | | 314 | | | | 32 | | | | n.a. | | | | | | | Americas | | | EURm | | | | 30 | | | | (3) | | | | n.a. | | | | | | | The Netherlands | | | EURm | | | | 263 | | | | 3 | | | | n.a. | | | | | | | United Kingdom | | | EURm | | | | 15.6 | | | | 0.4 | | | | n.a. | | | | | | | Others | | | EURm | | | | 5 | | | | 32 | | | | n.a. | | | | | | | Taxes collected on behalf of others4) | | | EURm | | | | 2,321 | | | | 2,585 | | | | (10%) | |
| 1 | Aegon conducts an annual Systematic Integrity Risk Assessment (SIRA). All regions provide insight into their local anti-fraud programs and indicate that controls with regard to internal, external, and intermediary fraud are properly designed and operating effectively. Aegon takes action to address any gaps in performance. |
| 2 | This includes confirmed incidents of bribery or corruption conducted by employees. Incidents that are still under investigation at the end of the reporting period are excluded. |
| 3 | This includes confirmed incidents of fraud involvingconducted by employees, intermediaries, and third parties •
●
Significant fines (in excess (including customers). Incidents that are still under investigation at the end of EUR 100,000)the reporting period are excluded. |
| 4 | The data covers all entities over which Aegon has management control including divested businesses, up to address casesthe date of mis-selling. ●
Proportionclosing. For corporate income tax, there is often no direct correlation between tax reported on earnings for any given year and amounts paid or received in tax. Part of employees completing mandatory training on the Code of Conduct.explanation for this is that certain tax-deductible items are not recognized in the company’s profit & loss statement but directly in equity. In addition, payments and refunds for prior years can impact the amounts paid or received in the current year. For more information see Aegon’s Global Tax Report. |
SDGs We are committed to contributing to one UN SDG and its target related to business conduct: 16. Peace, justice and strong institutions Promote peaceful and inclusive societies for sustainable development, provide access to justice for all and build effective, accountable and inclusive institutions at all levels. Target 16.6 Develop effective, accountable and transparent institutions at all levels. | | | | | | | | | | ●
Incidents of possible fraud involving employees, intermediaries and third parties: 889 (2020: 4,014).●
No significant fines were imposed (2020: EUR 8.2 million).●
98% of employees completed mandatory Code of Conduct training (2020: 97%).1)
| | Anti-Bribery & Corruption
| | | | | | In addition to the Code of Conduct, Aegon has internal, globally applicable policies addressing the prevention of financial crime (fraud, money laundering, economic sanctions), including our dedicated Anti-Bribery and Corruption policy. | | ●
Policy attestation for Anti-Bribery and Corruption policy | | ●
87% compliance with Aegon Anti-Bribery and Corruption Policy (2020: 86%).2)
| | | | | | | | In addition to the Code of Conduct, Aegon has internal, globally applicable policies addressing the prevention of financial crime (fraud, money laundering, economic sanctions), including our dedicated Conflict of Interest policy. | | ●
Policy attestation for Conflict of Interest policy | | ●
98% compliance with Conflict of Interest Policy (2020: 86%).2)
| | | Charitable Donations Standards
| | | | Externally published set of standards covering Aegon’s objectives with regard to community investment, including key themes (‘financial security and education’ and ‘well-being and longevity’), selection criteria, governance and approval. The Standards also detail Aegon’s contribution to humanitarian aid. | | ●
Cash donations to charities and other good causes.●
Allocation of more than 50% of annual cash donations to the key themes.●
Employee volunteering time for to charities and other good causes.●
Total value of community investment | | ●
Cash donations totaled EUR 9.4 million (2020: EUR 9.5 million).●
Proportion of cash donations to priority areas amounted to 81% (2020: 92%).●
Volunteering totaled 6,806 hours with a value of EUR 0.3 million (2020: 4,399 hours with a value of EUR 0.2 million).•
●
Total value of community investment amounted to EUR 9.7 million and 0.6% of our net result (2020: EUR 9.7 million and 17.6% of our net result). |
| 1 | A rate of (mandatory) completion less than 100% reflects new hires and legitimate circumstances where employees have not yet been through the annual cycle.
|
| 2 | Prior to 2021, compliance with Aegon anti-bribery and corruption policies was expressed as combined metric of the separate Aegon Conflict of Interest and Aegon Gift & Entertainment policies. The latter has since been incorporated into a new unified Aegon Anti-bribery and Corruption policy. As such, there is not a completecomparison of 2021 performance with previous years. Compliance with the Aegon Conflict of Interest is now reported separately as a distinct item, backdated to 2019 on abasis. |
Aegon Integrated Annual Report 2021
| | | | | | | IntegrationAbout Aegon Governance and monitoring
|
| | | | | | | | | | | (used to monitor compliance
and/or outcomes)
| | Outcome /Performance 2021
| | | | | | Data protection | | | Global Information Security Policy
| | | | | | | | | |
Policies and statements Aegon is committed to doing business responsibly. The following table demonstrates the policies and statements related to our material topics as identified through the DMA. Where the policies and statements are available externally, a link to Aegon’s website is provided as well as a link to the relevant principles of the UN Global Compact. | | | | | | | | | | | | | | Material topic | | InternalValue chain dimension | | Related Policy or Statement | | Description | | Link to UN Global Compact principles | | | | | | | Climate change (mitigation and adaptation) | | Investments and asset management | | Aegon Group Responsible Investment Policy | | Externally published policy overseen byacting as the Global Chief Information Security Officer, setting out the company’s approachbasis for how Aegon’s general account assets should be managed, consistent with its responsible investment objectives, relevant laws, and governance standards. (Responsible investment (RI) is an umbrella term that covers various tools and approaches to cyberthreatsincorporate environ- mental, social and data protection.governance (ESG) considerations into investment decision-making processes. It may include ESG integration and active ownership as well as dedicated, RI-focused capabilities.) The policy applies to allthe general account assets of Aegon businesses worldwide (including allbusiness units, entities or joint ventures where Aegon has operational control)management control and can take the investment decisions. Aegon’s Executive Committee has ultimate responsibility for the execution of this policy and for its integration into investment strategy and other relevant company processes and practices. Climate change is supported by mandatory training in dataone of the responsible investment focus areas, which outlines Aegon’s net-zero commitments and cyber security.exclusion criteria for certain activities considered to have significant adverse impacts on climate change. | | ●
Maintenance of an internal IT Control Framework,1, 2, 3, 4, 5, 6 (Human Rights and action items to address gaps in performance are documentedLabour), 7, 8, 9 (Environment), 10 (Anti-Corruption) | | | | | | Inclusion and monitored.•
●
The internal IT Control Framework is regularly mapped and updated to embed new and updated market standards.●
Periodic attestation to the internal IT Control Framework, with certain exceptions as applicable by country unit, for among other reasons adequate implementation timelines. | | ●
Institutions such as Aegon will continue to remain subject to information security attacks. To Aegon’s knowledge, the cyber-security attacks and events it experienced in 2021 were not material in nature. | Inclusion and DiversityOwn operations | | Statement on Inclusion & Diversity | | Externally published statement setting out Aegon’s approach to inclusion and diversity to creatingcreate an environment where ourits employees can bring their authentic selves to work. The statement incorporates ourAegon’s commitment to enablingenable this through ourits actions and inclusive policies.policies in the workplace, the marketplace, and the communities in which it operates. The statement applies to all Aegon businesses worldwide.Aegon UK also publishes its annualas required by the UK Equality Act 2010 (Gender Pay Gap Information) Regulations 2017. | | ●
Balanced representation of women in senior management.•
●
Balanced representation of women across Aegon’s workforce.●
Employee perception of key themes from the Statement are also tracked in the Global Employee Survey. | | | | | | | | | | Diversity and Inclusion Policy | | ●
Against a target of 34% for 2021, women accounted for 34% of Aegon’s senior management (2020: 32%)•
●
Women accounted for 50% of Aegon’s workforce (2020: 50%)•
●
New benchmark set in 2021, based on updated question sets in the Survey. On ‘Openness & Inclusion’ 74% of participants scored favorably, and on ‘Diversity & Equity’ 72% of particpants scored favorably. | Environment | | ExternallyInternally published policy outlining how Aegon seeksAegon’s concrete targets relating to minimizediversity in terms of nationality, age, gender, educational, professional and geographical background, and experience, in order to have a balanced and diverse composition of the negative impacts of its direct business operations on the environment whilst maximizing opportunities for performance improvement.1)
| | ●
Commits Aegon to using renewable or sustainable sources of energy where possible. | | ●
Fuel (gas) consumption: 27,288 MWh (2019: 30,002 MWh)●
Electricity consumption: 49,863 MWh (2019: 83,249 MWh)●
Proportion of renewable electricity consumption: 99% (2019: 98%)●
Renewable electricity generatedon-site
24 MWh (2019: 28 MWh)●
Renewable energy as a proportion of total energy consumption: 64% (2019: 72%) | | | | | | | | | | | ●
Commits Aegon to assessing the impact of air travel. | | ●
Total distance traveled: 16,3 million km (2019: 103.4 million km)●
Travel class as proportion of total distance: Economy 87%, Premium 13%●
Route type as proportion of total distance: <500km 3%, >500km 97% | | | | | | | | | ●
Commits Aegon, to annually reporting environmental impacts and activities and monitoring progress against targets. | | ●
Total (gross / location-based) GHG emissions 24,024 metric tons (2019: 52,536 metric tons).●
Reduction in total (gross / location-based) GHG emissions on 2019 target baseline: 54% |
1 | In line with thenet-zero
commitment announced in November 2021, Aegon has set a supporting GHG reduction target to reduce the carbon footprint of its operational activities by 25% by 2025. While some of these reductions can be traced to our initiatives to stimulate hybrid working – there has also been a temporary benefit from fewer employees in the office due to theCOVID-19
pandemic, which we expect to reverse over time. |
Aegon Integrated Annual Report 2021
| | | | | Integration and monitoring
|
| | | | | | | | | | | (used to monitor compliance
and/or outcomes)
| | Outcome /Performance 2021
| | | | | Human rights | | Statement on Human Rights | | Externally published statement designed to frame Aegon’s ongoing stewardship of human rights, including both the direct impacts of our daily operations as well as the indirect impacts of our business activities. Based on the UNUniversal Declaration of Human Rights, core standards of the International LaborLabour Organization (ILO), and the principles of the UN Global Compact. The statement commits Aegon to upholding international human rights standards at all businesses where the company has sufficient management control and, where possible, to help ensure partners uphold the same standards. ●
Consideration for The statement is supported by a regular human rights is built intorisk assessment, covering Aegon’s Responsible Investment Policy, Vendor Code of Conductbusinesses in the Americas, Europe, and StatementAsia. (Note: Please see below for further information on Inclusion & Diversity. Other company policies also cover aspects ofour approach to human rights, including:- Anti-bribery and corruption
- Distribution Risk management
- Third Party Risk management•
●
Aegon UK also issues a modern slavery statement (in line with the UK government’s 2015 Modern Slavery Act) | | ●
Results1, 2, 3, 4, 5, 6 (Human Rights and Labour). | | | | | | Customer empowerment | | Own operations | | Pricing and Product Development Policy | | Internal policy detailing Aegon’s approach to pricing and product development. It takes into account, among other things, ensuring a reasonable distribution of return/value to all stakeholders, the fair treatment of customers, and taking into account customers’ needs, including sustainability preferences, taking into account in the product approval process. The Global Chief Actuary (GCA) is the owner of the policy. The key requirements of the policy apply to all in-scope products, sold by all of Aegon’s biennial global Human Rights Risk Assessment (conducted internally and based on external sources1)
. The assessment scores Aegon’s countries against a combination of 10 publicly available indicators:- Civil and political rights
| | ●
Our most recent assessment (2020) identified four ‘Aegon’ countries where the operating environment presents a meaningful human rights risk:●
These risks relate essentially to outside political factors. In the United States, the Netherlands and the United Kingdom, Aegon faces little or no significant human rights risk. In Central and Eastern Europe, the environment is potentially more difficult, particularly with regard to corruption. In the Americas, risk is concentrated in Brazil. Again, this relates mainly to corruption.●
•
For those countries with the highest risk, Aegon has recommended preventative or remedial measures for local management2)
focusing on indicatorsstrategic business units where Aegon has operational control. | | Broadly supports Principle 1 (Human Rights). | | | | | | | | Underwriting (insurance related VC) | | Market Conduct Compliance Policy | | Internal policy setting out key requirements regarding market conduct, designed to prevent or mitigate customers detriment, to support the greatest potentialproper management of conflicts of interests (including acting in accordance with the best interests of customers) and to minimizeensure that the human rights facedinterests, objectives and characteristics of customers are duly taken into account. It applies to all strategic business units over which Aegon has operational control. The key requirement of this policy applies to all business units that deal with customers directly or indirectly through distributors, brokers, and vendors. Group oversight is the accountability and responsibility of the Board of Directors, supported by the company. The aim of these measures isExecutive Committee. | | | | | | | | | Employee wellbeing | | Own operations | | Talent principles and talent review framework | | Internal guidelines and processes setting out Aegon’s approach to talent management, to ensure we have the right people in the right place to deliver our business ambitions. | | 3 and 6 (Labour). | | | | | | | | | | Performance and development cycle | | Internal guidelines and processes setting out Aegon’s overall human rights risk remains low.approach to managing the performance of its people, focusing on current performance and future development and growth potential. | | | | | | | | | | | | | InvestmentGlobal Health & Safety Statement | | Responsible Investment Policy
Externally published statement committing Aegon to achieving and maintaining high health and safety standards in all its business units worldwide and outlining Aegon’s objectives and expectations. | | 3, 4, 5, 6 (Labour). |
476 | Annual Report on Form 20-F 2023
| | | | | | | Policies and statements | | | | | Externally published policy acting as the basis for how our assets should be managed consistently with our responsible business objectives and relevant laws and governance standards. It is applicable to all of our proprietary assets globally, regardless of country of operation or whether they are managed by Aegon business units or externally. Local business units within Aegon may implement additional mechanisms to further identify, manage and mitigate ESG risks, within the context of local norms and stakeholder expectations.
The policy covers all major asset classes and sets out minimum social and environmental standards for Aegon’s investments that incorporates exclusions in areas including controversial weapons, tobacco, Arctic or oil sands production and transportation and thermal coal.
| | ●
Total investments in responsible investment solutions (RIS) | ●
Our responsible investment solutions totaled EUR 177.7 billion at the end of 2021 | | | | |
●
Companies engaged with as part of Aegon’s approach to responsible investment | | | | | | | | | | | | | | Material topic | | ●
In 2021, 38% of our engagements addressed corporate governance matters, including corruption, remuneration, and board structure. Social issues addressed included health and well-being (opioids, drug price increases and meat sourcing), and human rights (UN Global Compact principles 1 & 2). Climate change (GHG emission reduction) and pollution were topics most commonly discussed in engagements concerning the environment. Of our engagements related to social themes, 27% of those were related to human rights issues. | | Value chain dimension | | The policy also incorporates a commitment tonet-zero
emissions, to ensure the reduction in the weighted average carbon intensity of the company’s investment portfolio is aligned with itsnet-zero
ambitions.Related Policy or Statement | | ●
Weighted average carbon intensity of the company’s investment portfolio | | ●
In 2021, the weighted average carbon intensity of our corporate fixed income and listed equity investments remained flat at 490 metric tons CO2
e/EURm revenue), no changeon 2019. At the end of 2021, our business units ensured our new commitment was captured in their investment mandates, as a first step towards ournet-zero
commitment. |
1 | The methodology for Aegon’s Human Rights Risk Assessment is derived from theLink to UN Declaration of Human Rights. The assessment uses publicly available data from 10 non-governmental
organizations specializing in human rights and which have a reputation for conducting fair and appropriate assessments. These organizations include Freedom House, Transparency International, UN Development Program, the World Bank and the World Health Organization. |
2 | These remedial measures include effective access to Speak Up, raising employees’ awareness of human rights risk, ensuring basic healthcare and financial services for employees, suggesting alternative employee representation where there is no independent trade union, ensuring neutrality at times of regime change and enforcing a zero tolerance approach to corruption and discrimination in the workplace.
|
Aegon Integrated Annual Report 2021
| | Global Compact principles | | | | Integration and monitoring
| | | | | | | | | | | | | | | (used to monitor compliance
and/or outcomes)
| | Outcome / Performance 2021
| | | | | | | Global Remuneration Framework | | The externally published Vendor Code of Conduct contains the standards for the business relationship between Aegon and its vendors in order to enable Aegon manage the most material business conduct, social and environmental risks (also referred to as sustainability risks) associated with its procurement of goods and services. The code sets the standards for the business relationship between Aegon and its vendors to enable Aegon to manage the most material environ-ment, social and governance (ESG) risks associated with our procurement of goods and services under the following categories:
- Labor rights and good health and well-being
- Climate change and biodiversity
Aegon requires its vendors to comply with the Code and assesses the ESG-related performance of those vendors against its standards.
| | ●
Top 250 suppliers by spend(in-scope
suppliers) scored for ESG performance through the EcoVadis rating platform. | | ●
Spend with‘in-scope’
suppliers comprised 86% of overall procurement spend in 2021 (2020:85%)•
●
By the end of 2021, 59% of Aegon’s‘in-scope’
spend had been assessed for ESG performance through the implementation of the EcoVadis rating platform (2020:56%) | | | | | | | Global Health & Safety Statement
Externally published statement committing Aegon to provide and maintain high health and safety standards across all its business units worldwide, outlining our objectives and expectations.
| | ●
Aim to limit absentee rate to an absolute minimum. | | ●
Employee absenteeism: 1.7% (2020: 1.7%) | | | | | | | Pricing and Product Development Policy
Internal policy setting out market conduct principles, aimed at ensuring fair treatment of customers and reasonable distribution of returns between customers, intermediaries and shareholders.
| | ●
Policy attestation for terms of Pricing and Product Development Policy | | ●
97% compliance with Pricing and Product Development Policy (2020: 93%) | | | | | Remuneration | | Global Remuneration Framework
Internal framework, detailing the company’sAegon’s remuneration philosophy and principles, as well as its approach to pay.remuneration in general. The Framework is based on the principle of pay for performance setting downand sets out the principles of governance covering both fixed and variable pay. OnThe variable pay, remuneration for Aegon executives and other senior management is based on both financial and non-financial performance metrics (including employee engagementmetrics. It contains general guidelines that apply to all staff within Aegon Group. In addition, there are specific policies that detail, among other things, the compensation structure and customer loyalty scores). | | ●
Broadly supports Principle 6 (Labour). | | | | | | | Data security and privacy | | Own operations | | Global Information Security Policy attestation for terms of | | Internal policy setting out Aegon’s approach to cyberthreats and data protection, supported by mandatory training in information security. The policy applies to all Aegon businesses worldwide (including all units, entities, or joint ventures where Aegon has operational control) and is owned and maintained by the Global Remuneration FrameworkChief Information Security Officer. | | ●
95% compliance with requirements of the Global Remuneration Framework (2020: 95%)1)
| | | | | | | | | | | TaxAegon Privacy Control Framework | | The Aegon Privacy Control Framework is the basis for measuring Privacy maturity at Aegon, which sets out the company’s approach to personal data protection where one of the controls is mandatory privacy training. | | | | | | | | | Business conduct | | Own operations | | Code of Conduct | | Externally published document prescribing a mandatory set of conditions for how Aegon employees should conduct business, comply with all applicable laws and regulations, and exercise sound judgment in making ethical business decisions in the long-term interests of our stakeholders. Training on the Code of Conduct is mandatory for all employees. The Code of Conduct applies to all Directors, officers, and employees of all Aegon companies, including the Board members. It also applies to employees who represent Aegon at associate companies, joint ventures and other cooperative ventures. | | 1, 2, 3, 4, 5, 6 (Human Rights and Labour). | | | | | | | | | | Speak Up | | Externally published policy supplementing the Aegon Code of Conduct. Aegon Speak Up provides a safe environment for anyone who wishes to raise a concern about suspected or observed misconduct that involves Aegon. The policy applies to all Aegon businesses worldwide (including all business units, subsidiaries and joint ventures that are majority owned, and controlled by Aegon). It also extends to customers, business partners, shareholders and the public in general. | | 10 (Anti-Corruption). | | | | | | | | | | Anti-Bribery & Corruption (ABC) Policy | | The Aegon Code of Conduct provides guidance on the prevention of bribery and corruption (including gifts and entertainment). The internally published Aegon Anti-Bribery and Corruption (ABC) Policy provides further principles and guidelines to help Aegon employees to make the right decision. The policy applies to all Aegon business units. | | 10 (Anti-Corruption). | | | | | | | | | | Conflict of Interest Policy | | The Aegon Code of Conduct provides guidance on conflicts of interest. The internally published Aegon Conflict of Interest Policy defines the principles regarding potential conflicts of interest that apply to all Aegon business units, and should be implemented in their local unit. The aim of the policy is to provide further guidelines to help Aegon employees recognize a potential conflict of interest and to help them handle the situation. | | | | | | | | | | | | Global Tax Policy and Principles of Conduct | | Externally published policy outlining Aegon’s approach to responsible taxpaying, which seeks to align the long-term interests of all our stakeholders, including customers, employees, business partners, investors, and wider society.society at large. Aegon seeksaims to pay ‘fair taxes’“fair taxes”, which means paying the right amount of taxtaxes in the right places. | | ●
Applying global tax reporting standards that support public disclosure of the company’s tax policies and tax contributions on abasis. | | | | | | | | | | Anti-Money Laundering & Counter Terrorist Financing Policy (AML & CTF) | | ●
AnnualInternally published policy aiming to protect Aegon Global Tax Report2)
•
●
Total taxes borneand its subsidiaries, assets, clients, and external entities or individuals from being used by Aegon:●
Taxes collected on behalf of others: |
1 | The assessment of compliance against the Global Remuneration Framework was limitedcriminals to our largestlaunder their proceeds from criminal activities, or being used to finance terrorist activities. It applies to all entities and business units only (Aegon NL,of Aegon UKproviding products or services subject to (local) legal AML & CTF requirements. It also includes arrangements where Aegon has a controlling interest in other Aegon entities, entities or joint ventures delivering these products or services. It also applies to all employees, including temporary staff and Transamerica)Board members.
| | 10 (Anti-Corruption). | | | | | | | | | | Anti-Fraud Policy | | Internally published policy aiming to protect Aegon and clients’ assets from fraudulent behavior by clients, business partners, employees, or any other external entity or individual. It covers all Aegon entities. This includes arrangements where Aegon has a controlling interest in other Aegon entities, entities or joint ventures. It also covers all employees, including temporary staff and Board members. | | 10 (Anti-Corruption). | | | | | | | | | | Sanctions Policy | | Internally published policy aiming to protect Aegon’s organization, its products, and services from being used for prohibited transactions and for the purposes of evading, avoiding or otherwise circumventing sanctions. It covers all Aegon business units and all wholly owned (directly or indirectly) Aegon entities, as well as arrangements where Aegon has a controlling interest in other business entities or joint ventures. It also covers all employees, including temporary staff and Board members. | | 10 (Anti-Corruption). |
2 | Developed in accordance with the GRI 207: Tax standard of GRI Sustainability Reporting Standards, and which provides Aegon’s tax contributions on abasis. |
Aegon Integrated Annual Report 2021
| | | | | | | | | | | Annual Report on Form 20-F 2023 | 477 | | |
| | | | | | | About Aegon Governance and risk management Financial information Sustainability information | | | | | | | | | | |
Policies and statements related to other topics are also included as a separate table below. | | | | | | | | | | | | | | Other (non-mate- rial) topics | | Value Chain dimension | | Related Policy / Statement / Procedures | | Description | | Link to UN Global Compact (UNGC) principles | | | | | | | Human rights | | Investments and asset management | | Aegon Group Responsible Investment Policy | | Externally published policy acting as the basis for how Aegon’s general account assets should be managed, consistent with its responsible investment objectives, relevant laws, and governance standard. (Responsible investment (RI) is an umbrella term that covers various tools and approaches to incorporating environmental, social and governance (ESG) considerations into investment decision-making processes. It may include ESG integration and active ownership as well as dedicated, RI-focused capabilities.) The policy applies to the general account assets of Aegon business units, where Aegon has management control and can take the investment decisions. Aegon’s Executive Committee has ultimate responsibility for the execution of this policy and for its integration into investment strategy and other relevant company processes and practices. | | 1, 2, 3, 4, 5, 6 (Human Rights and Labour), 7, 8, 9 (Environment), 10 (Anti-Corruption). | | | | | | | | Own operations | | Code of Conduct | | Externally published document prescribing a mandatory set of conditions for how Aegon employees should conduct business, comply with all applicable laws and regulations, and exercise sound judgment in making ethical business decisions in the long-term interests of our stakeholders. Training on the Code of Conduct is mandatory for all employees. The Code of Conduct applies to all Directors, officers, and employees of all Aegon companies, including the Board members. It also applies to employees who represent Aegon at associate companies, joint ventures and other cooperative ventures. | | 1, 2, 3, 4, 5, 6 (Human Rights and Labour). | | | | | | | | | | Statement on Inclusion & Diversity | | Externally published statement setting out Aegon’s approach to inclusion and diversity to create an environment where its employees can bring their authentic selves to work. The statement incorporates Aegon’s commitment to enable this through its actions and inclusive policies in the workplace, the marketplace, and the communities in which it operates. The statement applies to all Aegon businesses worldwide. | | 1, 2, 3, 4, 5, 6 (Human Rights and Labour). | | | | | | | | | | Statement on Human Rights | | Externally published statement designed to frame Aegon’s ongoing stewardship of human rights, including both the direct impact of our daily operations as well as the indirect impacts of our business activities. Based on the Universal Declaration of Human Rights, core standards of the International Labour Organization (ILO), and the principles of the UN Global Compact. The statement commits Aegon to upholding international human rights standards at all businesses where the company has sufficient management control and, where possible, to help ensure partners uphold the same standards. The statement is supported by a regular human rights risk assessment, covering Aegon’s businesses in the Americas, Europe, and Asia. (Note: Please see below for further information on our approach to human rights.) | | 1, 2, 3, 4, 5, 6 (Human Rights and Labour). | | | | | | | Responsible sourcing | | Supply chain | | Vendor Code of Conduct | | Externally published document that sets out the standards for the business relationship between Aegon and its vendors in order to enable Aegon to manage business conduct, social, and environmental risks (also referred to as sustainability risks) associated with the procurement of goods and services under the following categories: - Corporate governance - Human rights - Labor rights and good health and wellbeing - Climate change and biodiversity Aegon requires its vendors to comply with the code and assesses the ESG-related performance of those vendors against its standards. | | 1, 2, 3, 4, 5, 6 (Human Rights and Labour), 7, 8, 9 (Environment). | | | | | | | Community investment | | Own operations | | Charitable Donations Standards | | Externally published set of standards covering Aegon’s objectives with regard to community investment, including key themes (“financial security and education” and “wellbeing and longevity”), selection criteria, governance and approval. The Standards also detail Aegon’s contribution to humanitarian aid. In 2023, Aegon published its Global Community investment framework, which is aligned with its purpose and key priorities. This framework will guide Aegon’s community investment approach. | | Broadly supports various principles through community engagement and support. |
478 | Annual Report on Form 20-F 2023
RegulationHuman Rights Aegon has an externally published Statement on Human Rights, which represents our overarching position and compliance The importanceapproach to the responsible stewardship of non-financial
factors in underpinning long-term financial value creation is widely recognized. human rights. This includes both the identification and mitigationdirect impacts of aspects of economic activities that erodenon-financial
value,our daily operations as well as the identificationindirect impacts of our business activities.Aegon’s Statement on Human Rights is based on the Universal Declaration of Human Rights, core standards of the International Labour Organization (ILO), and capitalizationthe principles of the UN Global Compact. The statement commits Aegon to upholding international human rights standards at all businesses where the company has sufficient management control and, where possible, to encourage partners to uphold the same standards. In addition to our Human Rights Statement, human rights considerations are built into Aegon’s Responsible Investment Policy, Vendor Code of Conduct, and Statement on opportunitiesInclusion and Diversity. Aspects of human rights are also covered by our Code of Conduct, our Speak Up program, and our policies including Anti-bribery and Corruption, Conflict of Interest, Employment Screening, Anti-Money Laundering, Sanctions, Anti-Fraud, Distribution Risk Management, and Third Party Risk Management. Aegon UK also issues a modern slavery statement (in line with the UK government’s 2015 Modern Slavery Act). Indicators Results of Aegon’s biennial global Human Rights Risk Assessment (conducted internally and based on external sources). The assessment scores Aegon’s countries against a combination of 10 publicly available indicators including: Civil and political rights, Corruption, Human development, Health coverage, Property rights, Illicit economy, Gender development, Working conditions, Rule of law, and Internet inclusion. Outcome / Performance 2023 In 2022, we carried out our biennial Human Rights Risk Assessment (HRRA). Aegon also annually assesses ethics and culture via the Systematic Integrity Risk Assessments (SIRA), part of which is to create value. Reflecting this understanding, thereassure it is not directly or indirectly violating the principles in the Code of Conduct and our core values. 2023 SIRA results indicate adequate controls are in place and residual risk is minimal in terms of non-compliance with the Code of Conduct and underlying procedures.The findings from these assessments indicate that the operating environment of most Aegon units poses little or no significant human rights risk. In the Americas, corruption is a clearconcern, as well as the working conditions. We face human rights risks in China, although these risks are related to external political factors. Compliance and increasing global trend of capital allocation toward economic activitiesrisk leaders in countries with higher risk levels were asked to assess the local environment and develop action plans to address identified risks. Preventative and remedial measures were recommended to local management in higher risk countries, and the 2022 HRRA concluded that manage non-financial
value most effectively.the necessary measures are in place to address specific risks. | | | | | | | | | | | Annual Report on Form 20-F 2023 | 479 | | |
| | | | | | | About Aegon Governance and risk management Financial information Sustainability information | | | | | | | | | | |
Regulation and compliance Around the world, governments are passing regulationlegislation to drive transparencymake sure that companies are more transparent about the sustainability of their economic activities. This is also in the non-financial
value aspects of any given economic activity, for better-informed risk assessment and decision-making inline with their strategies to finance the allocation of financial capital.transition to a more sustainable economy. For example, the EUEU’s Sustainable Finance Disclosure Regulation (SFDR) is driving morepromotes greater transparency regardingon how financial market participants and financial advisors integrate sustainability risks and, where appropriate, sustainability factors (the impact of economic activities on people and the environment) into their investment decisions or insurance advice. FinancialAccording to the SFDR, financial market participants should disclose information on thosethese procedures and descriptions, andas well as the impact of sustainability risks on the performance of the financial products.products, and, where appropriate, the impact of these products on people and the environment. To do sothis, they need sustainability-related information about their investees (companies). This is why the European Union has been developing two other key pieces of legislation, namely the Corporate Sustainability Reporting Directive (CSRD)CSRD and the EU Taxonomy. The CSRD and EU Taxonomy, which aim to ensure that investees(investee) companies report on these topics, so that financial institutions can use this information in return. The 2021 reporting year is the first step in the implementation of the EU Taxonomy. For more information on the EU Taxonomy please refer to the section ‘EU Taxonomy Regulation’ on page 359. EU Non-Financial Reporting Directive (NFRD)
reporting has been a regulatory requirement for Aegon since the implementation of EU Directive 2014/95/ EU on non-financial reporting, hereafter referred to as the EU Non-Financial Reporting Directive for(NFRD), as of the 2018 reporting year. The NFRD requirements applicable to Aegon N.V.Ltd. are included in article 29a of Directive 2013/34/EU (Accounting Directive). In the Netherlands, article 29a of the Accounting Directive is implemented in Dutch law on the basis of article 391 of Book 2 of the Dutch Civil Code in the Decree on the contents of the management report (Besluit inhoud bestuursverslag
), in the Decree on the establishment of further provisions on the content of the Annual Report (Besluit tot vaststelling van nadere voorschriften omtrent de inhoud van het jaarverslag
) and in the Decree on the publication ofnon-financial
information (Besluit bekendmaking niet-financiële informatie
).by two decrees.The NFRD requires ‘large companies’companies such as Aegon to disclose information regarding the way they operate and manage social and environmental challenges. More specifically, itthe NFRD requires companies to report on social, employee, and environmental matters (including climate change), human rights, bribery, and anti-corruption, as well as to disclose information on board diversity. Information on board diversity is included in the diversity section of Aegon’s Corporate Governance Statement
(page 17).
On the basis of the above-mentioned Decrees, Aegon is required to publish non-financial (sustainability) information in a (consolidated) non-financial statement. To this end, the table below detailson the next page references the required disclosures, required, additionally referencing the corresponding requirement of the NFRD itself andper the corresponding requirements inof the Dutch decrees.Aegon IntegratedNFRD.From January 1, 2024, the CSRD will replace the NFRD and will apply to Aegon’s 2024 Annual Report 2021to be published in 2025. Aegon is preparing for this change. EU Taxonomy disclosures are already required based on article 8 of the EU Taxonomy Regulation. Disclosures related to the EU Taxonomy can be found on pages 499-505. 480 | Annual Report on Form 20-F 2023
EU Non-Financial Reporting Directive (NFRD) requirement1) | | | | | | | | EUNon-Financial
Reporting Directive | | | | Topic | | Sub-topic | | Section Reference (AR 20-F 2023) | | Equivalent
requirement | | | Business model | | Brief description of company’s business model | | Our strategy and(pages 9-13) How we create value creationfor our stakeholders (pages16-34)
Value creation (pages24-25)
| | Decreenon-financial information (article 3.1.a) | | Relevant environmental matters (e.g. climate-related impacts) | | Description of policies relating to environmental matters (including due diligence processes implemented) | | Sustainability (pages 14-18) Table in section “Policies and Statements” (pages 476-477) TCFD (pages 486-498) | | Decree non-financial information (article 3.1.b) | | The outcome of these policies | | Sustainability (pages 14-18) Sharing value with our stakeholders in 2023 (pages 24-35) TCFD (pages 486-498) Our material topics/Climate change mitigation and adaptation (pages 462-464) | | | | | | | | | Description of the principal risks (in own operations and in value chain) and how these risks are managed | | Our material topics/Climate change mitigation and adaptation (pages 462-464) TCFD (pages 486-498) Risk management (pages 79-84) Risk factors Aegon Ltd. (pages 420-426) | | Decree non-financial information (article 3.1.c) | | | | | | | Non-financial key performance indicators relating to environmental matters | | KPIs and targets table and Metrics table under the section: Our material topics/Climate change mitigation and adaptation (pages 462-464) TCFD (pages 486-498) | | Decree non-financial information (article 3.1.d) | | | | | | Relevant social and employee matters | | Description of the policies relating to social and employee matters (including due diligence processes implemented) | | Sustainability (pages 14-18) Table in section “Policies and Statements” (pages 476-477) | | Decree non-financial information (article 3.1.b) | | | The outcome of these policies | | Sustainability (pages 14-18) Sharing value with our stakeholders in 2023 (pages 24-35) Our material topics/Inclusion and diversity (pages 465-466) Our material topics/Customer empowerment (pages 467-468) Our material topics/Employee wellbeing (pages 469-471) Our material topics/Data security and privacy (page 472) | | | | | | | Description of the principal risks (in own operations and in value chain) and how these risks are managed | | Our material topics/Inclusion and diversity (pages 465-466) Our material topics/Customer empowerment (pages 467-468) Our material topics/Employee wellbeing (pages 469-471) Our material topics/Data security and privacy (page 472) Risk management (pages 79-84) Risk factors Aegon Ltd. (pages 420-426) | | Decree non-financial information (article 3.1.c) | | | | | | | Non-financial key performance indicators relating to social and employee matters | | KPIs and targets tables and Metrics tables under the sections: Our material topics/Inclusion and diversity (pages 465-466) Our material topics/Customer empowerment (pages 467-468) Our material topics/Employee wellbeing (pages 469-471) Our material topics/Data security and privacy (page 472) | | Decree non-financial information (article 3.1.d) |
| | | | | | | | | | | Annual Report on Form 20-F 2023 | 481 | | |
| | | | | | | About Aegon Governance and risk management Financial information Sustainability (page20-23)
Table under ‘Policies and Procedures’(pages 353-356)information
| | | | | | | | | | |
| | | | | | | | | | | | Topic | | Sub-topic | | Section Reference (AR 20-F 2023) | | Equivalent
requirement
under Dutch
law2) | | | | | | Relevant matters with respect for human rights | | Description of policies relating to respect for human rights (including due diligence processes implemented) | | Table in section “Policies and Statements” (pages 476-477) Additional table in section “Policies and Statements” (pages 478-479) | | Decree non-financial information (article 3.1.b) | | | | | | | The outcome of these policies | | Policies and statements/Human rights (page 479) | | | | The outcome of these policies
| | | | | Sustainability (pages20-23)
Sharing value with our stakeholders (pages26-32)
Table under ‘Policies and Procedures’ (pages353-356)
Tables under ‘Value Created’:
Business partners/Goods and services, (page 386)
Society/ Investment footprint, and Operational footprint (pages388-392)
| | Decreenon-financial
information | Description of the principal risks (in own operations and in value chain) and how these risks are managed | | Policies and statements/Human rights (page 479) | | Decree non-financial information (article 3.1.c) | | | | | | | Non-financial key performance indicators relating to human rights matters | | Policies and statements/Human rights (page 479) KPIs and targets table and Metrics tables under the section: Our material topics/Inclusion and diversity (pages 465-466) Voluntary information/Extra metrics/RI solutions by Aegon AM (page 506) | | Decree non-financial information (article 3.1.d) | | | | | Relevant matters with respect to anti-corruption and bribery | | Description of policies relating tosocial anti- corruption and employee
| | SustainabilityTable in section “Policies and Statements” (pages20-23)
Table under ‘Policies476-477)Governance and Procedures’risk management 2023/Code of conduct (page 93) | | Decree non-financial information (article 3.1.b) | | The outcome of these policies | | Our material topics/Business conduct (pages 353-356)
473-475) | | | The outcome of these policies
| | Sustainability (pages20-23)
Sharing value with our stakeholders (pages26-32)
Table under ‘Policies and Procedures’ (pages353-356)
Tables under ‘Value Created’:
Employees/Inclusion and diversity, Recruitment and retention, Health and safety, Training and development and Engagement (pages383-385)
Business partners/Goods and services (page 386) Society/Responsible investment, Tax transparency, Community investment (pages388-392)
| | Decreenon-financial
information | Description of policies relating to(including due diligence processes implemented) | | Sustainability (pages20-23)
Table under ‘Policies and Procedures’ (pages353-356)
| | | The outcome of these policies
| | Table under ‘Policies and Procedures’ (pages20-23)
Sharing value with our stakeholders (pages26-32)
Tables under ‘Value Created’:
Employees/Inclusion and diversity, Health and safety, and Engagement (pages383-385)
Business partners/Goods and services (page 386)
Society/Responsible investment (pages388-392)
| | Decreenon-financial
information | Description of policies relating toanti-corruption and bribery
matters (including due diligence processes implemented) | | Code of Conduct (page 88)
Table under ‘Policies and Procedures’ (pages353-356)
| | Decreenon-financial
information | The outcome of these policies
| | Sharing value with our stakeholders (pages26-32)
Table under ‘Policies and Procedures’ (pages353-356)
Tables under ‘Value Created’:
Business partners/Goods and services (page 386)
Society/Responsible investment, and Compliance (pages388-392)
| | Decreenon-financial
information | Description of the principal risks with regard to environmental, social and employee matters, respect for human rights, and the fight against corruptionanti-corruption and bribery; and, how these risks are managed | | Our business environmentSharing value with our stakeholders in 2023 (pages8-13)
Our strategy and value creation (pages16-34)
Business environment scan (page 10)
24-35)Risk management (pages73-77)
79-84) | | Decree non-financial information (article 3.1.c) | | | | | Risk factors Aegon N.V.Ltd. (pages326-348)
Task Force on Climate-related Disclosures
| | | Decreenon-financial
information | key performance indicators relating to environmental, socialanti-corruption and employee matters, respect for human rights,bribery | | KPIs and targets table and Metrics table under the section: Our material topics/Business conduct (pages 473-475) | | Decree non-financial information (article 3.1.d) | | | | | | Diversity | | Diversity of the Board of Directors and the fight against corruption and briberyExecutive Committee | | Performance in 2021Report of the Board of Directors (pages33-34)
56-57)Sharing value with our stakeholders in 2023/Employees (pages26-32)
Table under ‘Policies and Procedures’ (pages353-356)
Tables under ‘Value Created’:
Employees/Inclusion and diversity, Recruitment and retention, Health and safety, Training and development, and Engagement (pages383-385)
Business partners/Goods and services (page 386)
Society/Responsible investment, Investment footprint, Tax transparency, Community investment, Compliance, and Operational footprint (pages388-392)
| | Decreenon-financial
information | Diversity of the Management Board and Supervisory Board
| | Diversity section ofAegon’s Corporate Governance Statement
(page 17).Tables under ‘Value Created’:
Employees/Inclusion and diversity (pages383-385)
Investors/Corporate Governance (page 387)
| | Decree content of the management report |
| 1 | As included in the EU Accounting Directive |
| 2 | The EU Non-Financial Reporting Directive was transposed into Dutch law through two decrees relating respectively to non-financial information and diversity policy (Besluit(Besluit bekendmaking niet-financiële informatie/Besluit Bekendmaking diversiteitsbeleid,
, included in the Besluit tot vaststelling nadere voorschriften omtrent de inhoud van het jaarverslag )jaarverslag). |
482 | Annual Report on Form 20-F 2023 Aegon Integrated Annual Report 2021
Our commitments Aegon applies over-arching and sector-specific global sustainability frameworks and initiatives, both to align with and to report against its sustainability strategy, policies, and performance. We understand that we cannot achieve our sustainability ambitions on our own. We are therefore contributing towards a number of over-arching international initiatives, including the United Nations Global Compact (UNGC), the UN SDGs, and the Task Force on Climate-related Financial Disclosures (TCFD). These initiatives guide our internal practices and policies and help shape our overall approach to sustainability. In addition, Aegon has signed up and committed to sector-specific initiatives, including the UNEP-FI Principles for Sustainable Insurance, and the Principles for Responsible Investment (PRI). A full list of our commitments is available on our website. Net-Zero Asset Owner Alliance Aegon became a member of the Net-Zero Asset Owner Alliance in 2021. The NZAOA is a UN-convened group of institutional investors committed to transitioning their portfolios to net-zero greenhouse gas emissions by 2050. As a member, we have committed to transitioning our general account investment portfolio1 to net-zero greenhouse gas (GHG) emissions by 2050, with clear medium-term targets for 2025. For more information on our targets please see page 16. United Nations Global Compact In 2021, Aegon became a signatory of the UNGC, thereby committing to implement universal sustainability principles in the fields of human rights, labor, environment, and anti-corruption, as well as taking steps to support the UN goals; currently the SDGs. As a signatory, Aegon is committed to disclosing its progress annually via a Communication on Progress (COP) submission, which can be accessed here. United Nations Sustainable Development Goals In 2015, the United Nations adopted 17 SDGs. These goals cover poverty reduction, education, gender equality, climate change, and health. Accompanying each of these goals is a series of targets and indicators. At Aegon, we are committed to supporting the UN SDGs, both as a financial services provider and as an investor. We recognize that sustainable development is in the long- term interest of business and the global economy, but that a sustainable future for people and the planet will not be attainable without cooperation between the public and private sectors. We have linked our contributions to the SDGs relating to our material topics in the “Our material topics” section. UNEP-FI Principles for Sustainable Insurance Aegon is one of the founding signatories of the UNEP-FI PSI. The aim of the PSI is to make sure sustainability becomes “business as usual”. The PSI comprises four basic principles. As a signatory, Aegon reports annually on the actions taken to implement the PSI’s four principles on its website. The following table summarizes actions taken towards implementing the principles in 2023. | 1 | The general account portfolio consists of assets where Aegon can take the investment decisions, considering the legal obligations of Aegon as prescribed by local laws and regulations. A similar approach applies to selected investments where Aegon Asset Management in its capacity of manager takes the investment decisions. For discretionary investments for account of third parties and off-balance sheet investments, the investment decisions are driven by the relevant third parties as well as the legal and/or fiduciary obligations of Aegon, as prescribed by local laws and regulations. |
| | | | | | | | | | | Annual Report on Form 20-F 2023 | 483 | | |
| | | | | | | About Aegon Governance and risk management Financial information Sustainability information | | | | | | | | | | |
| | | | | | | | | Principles | | Our Goals | | Our progress (as of 2023) | | | | 1. We will embed in our decision-making environmental, social and governance (ESG) issues relevant to the insurance business. | | Streamline the group- wide sustainability governance. | | ∎ In 2022, the Global Sustainability Board (GSB) oversaw our sustainability approach, including the strategic measures we are undertaking to fulfill our sustainability ambitions. ∎ In 2023, the Responsible Working Group marked a significant milestone by consolidating the previous PRI and Active Management Working Groups, streamlining Aegon’s approach to Responsible Investment (RI). In line with our sustainability approach, we also established an Inclusion and Diversity (I&D) Working Group to intensify our focus on this priority theme for Aegon. | | | | | | Integrate ESG issues into key stakeholder discussions, decision- making, risk management, underwriting, and capital adequacy decision-making processes. | | ∎ In 2023, building on our first DMA in 2022, Aegon conducted a second double materiality assessment to prepare for the European Union’s Corporate Sustainability Reporting Directive (CRSD), which will apply to Aegon from the 2024 reporting year. Aegon’s 2023 DMA was guided by the European Sustainability Reporting Standards (ESRS) adopted by the European Commission in July 2023. Aegon was supported by external advisors in the development of its DMA process. The methodology will be enhanced further in coming years to expand stakeholder consultation and refine our value chain analysis. | | | | | | Develop products and services which reduce risk, have a positive impact on ESG issues, and encourage better risk management. | | ∎ In Q1 2023, Aegon Asset Management increased access to sustainability products with clients, citing EUR 100 million inflows to its Short Dated Climate Fund. ∎ In Q1 2023 Aegon THTF launched “Aegon THTF YiXinAn critical illness insurance product”, to fill an existing gap between the need for health insurance and the high-cost threshold of existing commercial health insurance. ∎ In Q1 and Q2 2023, Transamerica expanded choice for clients by incorporating ESG into its product offering and launched a series of ESG sustainable funds. ∎ In Q2 2023, Aegon expanded its 2025 climate targets to support its commitment to achieving net-zero emissions by 2050. ∎ In Q3 2023, Aegon UK was accepted as a signatory to the Financial Reporting Council’s UK Stewardship Code. ∎ In 2023 Aegon AM began the process of reclassifying the Aegon Global Sustainable Sovereign Bond Fund (GSSF) from article 8 to article 9 under the SFDR, thereby certifying that the fund has as its objective sustainable investment in line with the UN Sustainable Development Goals. | | | | | | Establish processes to identify and assess ESG issues inherent in the portfolio and be aware of potential ESG-related consequences of the company’s transactions. | | ∎ Aegon worked with Ortec Finance in 2023 to perform a systematic climate risk assessment for the General and Separate Account assets of all business units within Aegon. ∎ In 2023, Aegon AM started our Top Emitter Engagement Program, through which we identified the top 20 corporate GHG emitters within the Aegon General Account to encourage them to set science-based net-zero targets. ∎ In 2023, Transamerica added new climate-related investments to its portfolio as part of its USD 2.5 billion commitment to invest in climate solutions. This included Commercial Property Assessed Clean Energy (C-PACE) asset-backed securities, which address the need to engage ordinary households and individuals in the transition to a more climate-conscious society. C-PACE is a financing structure in which building owners borrow money to finance projects related to energy efficiency, renewable energy, or energy storage, for example, or storm and seismic hardening. | | | | 2. We will work together with our clients and business partners to raise awareness of ESG issues, manage risk and develop solutions. | | Establish the company’s expectations and requirements on ESG issues. | | ∎ In 2023, Aegon’s sustainability approach set clear expectations and requirements for the company’s priority themes, climate change and promoting inclusion and diversity. The sustainability approach is guided by a robust governance structure ensuring alignment with Aegon’s sustainability goals across the business. | | Integrate ESG issues into tender, and selection processes for suppliers. | | ∎ We integrate all applicable laws, regulations, and ethical business practices into our selection process for vendors and apply a risk-based approach to assess performance and compliance with these minimum standards and preferred behaviors. ∎ In 2023, we expanded the reach of our EcoVadis assessment program to drive alignment with our suppliers and maintained our requirement for suppliers to adhere to our Vendor Code of Conduct. ∎ In 2023, Aegon’s businesses around the world continued to work closely with their supplier base on topics related to sustainability. In the United Kingdom, Aegon increased the number of existing suppliers with whom it aims to work on sustainability issues from 46 to 50. This cohort now includes critical suppliers, high-spend suppliers, and high-risk facility suppliers. ∎ In 2023, Transamerica took action to expand and broaden its distribution network to serve more diverse customer groups. The approach included recruiting World Financial Group agents from diverse communities who can meet the needs of customer groups traditionally underserved by financial services, such as minorities. ∎ In 2023, Aegon UK became a signatory to the UK Stewardship Code, a voluntary set of guidelines aimed at raising the standard of stewardship practices used by asset owners, managers and service providers. During the year, the business also continued to encourage critical and local suppliers to become Living Wage Employers, meaning that they are accredited by the Living Wage Foundation for their commitment to pay employees in line with the current cost of living. | | | | | | Support the inclusion of ESG issues in professional education, and ethical standards in the insurance industry. | | ∎ In Q4 2023, Aegon launched its Sustainability Academy, a global, company-wide initiative to increase awareness of sustainability and the company’s purpose and sustainability ambitions. ∎ In 2023, Aegon UK organized training for its procurement and supplier management teams through the Carbon Literacy Project. The training aimed to raise employees’ awareness of climate change and mitigation and adaptation strategies. Twenty-nine employees were accredited as being carbon literate through the program. |
484 | Annual Report on Form 20-F 2023
| | | | | | | | | Principles | | Our Goals | | Our progress (as of 2023) | | | | 3. We will work together with governments, regulators and other key stakeholders to promote widespread action across society on ESG issues. | | Advocate for issues and initiatives that benefit our customers, employees, wider society, and our businesses. | | ∎ Our Global Government & Public Affairs department works to support regulators and lawmakers by advocating worldwide for access to insurance and financial services, opportunities for flexible employment in old age, and government planning for citizens in an era of increasing longevity. ∎ In 2023, as a long-standing member of the Institutional Investors Group on Climate Change, Aegon AM also participated in the Net Zero Engagement Initiative. Launched in 2023, the initiative aims to build on and extend the reach of investor engagement beyond the Climate Action 100+ focus list, focusing on companies that are heavy users of fossil fuels. ∎ In 2023, Transamerica continued its partnership with Junior Achievement, a nationwide charitable organization dedicated to helping students of all backgrounds develop financial literacy and career readiness skills. Transamerica continued to present the organization’s experiential program, JA Finance Park, a Harvard-accredited financial literacy program that helps middle- and high-school students build financial skills for life. ∎ In Q1 2023, Aegon donated EUR 100,000 to UNICEF to support relief efforts following the earthquakes in Turkey and Syria. ∎ In Q1 2023, Aegon NL donated EUR 115,000 to “Geldfit” to aid those suffering from “poverty due to an energy crisis.” ∎ In Q2 2023, Aegon and Transamerica organized the company’s first-ever global Force for Good Week to assist people in local communities in living their best lives. ∎ In Q3 2023, Aegon collaborated with Aidsfonds to conduct a company-wide fundraiser in honor of the Amsterdam Canal Pride Parade. | | | | | | Support prudential policy and regulatory and legal frameworks that enable risk reduction, innovation, and better management of ESG issues. | | ∎ We are active in many international projects that aim to fulfill this goal; for example, a working group of the Organisation for Economic Cooperation and Development (OECD) working group on the future of work, and the Living, Learning and Earning Longer initiative led by the World Economic Forum. ∎ In 2023, we continued preparations for the European Union’s Corporate Sustainability Reporting Directive (CSRD), which will apply to Aegon from the 2024 reporting year. Aegon’s 2023 DMA was guided by the European Sustainability Reporting Standards (ESRS) adopted by the European Commission in July 2023. | | | | | | Convey dialogue and participate in research initiatives (inc. academia and scientific community) with business, and industry associations to better understand and manage ESG issues across industries and geographies. | | ∎ In 2023 we contributed to research by the Geneva Association (publication pending) on Climate Tech for Industrial Decarbonisation. ∎ To gain a better understanding of how longevity interacts with various aspects of people’s lives, Aegon undertook various research projects. One piece of research in 2023 was carried out by Glocalities for Aegon in five of our markets around the world and incorporates findings from an MIT AgeLab report in the United States. | | | | | | Convey dialogues with governments and regulators to develop integrated risk management approaches, and risk transfer solutions. | | ∎ No relevant engagement in 2023. | | | | | | Encourage media incentives and publish resources available to media to promote public awareness of ESG issues and sound risk management. | | ∎ We regularly publish research on financial planning, retirement, health, and insurance issues so society at large can effectively plan for longer, and more active retirement. | | | | 4. We will demonstrate accountability and transparency in regularly disclosing publicly our progress in implementing the Principles. | | Assess, measure, and monitor our progress in managing ESG issues, and proactively, and regularly disclose this information publicly. | | ∎ In 2023, building on our first DMA in 2022, Aegon conducted a second double materiality assessment to prepare for the European Union’s Corporate Sustainability Reporting Directive (CRSD). Aegon monitors our material sustainability topics through a set of metrics, and KPIs disclosed in our annual reports. ∎ Each year, we publicly publish our progress against the PSI principles. | | Participate in relevant disclosure or reporting frameworks, and are open to dialogue with clients, regulators, rating agencies, and other stakeholders to gain a mutual understanding of the value of disclosure through the Principles. | | ∎ In 2023 we submitted our second Communication on Progress (COP) report for the UNGC. ∎ In 2023 we began preparations for our first public assessment against the Principles for Responsible Investment taking place in 2024. ∎ In 2023, we continued preparations for implementing the ESRS standards. ∎ We engage with rating agencies, regulators, investors, and other stakeholders on a regular basis. We publish our progress on ratings publicly. |
| | | | | | | | | | | Annual Report on Form 20-F 2023 | 485 | | |
| | | | | | | About Aegon Governance and risk management Financial information Sustainability information | | | | | | | | | | |
Task Force on Climate-related Financial Disclosures Introduction Climate change represents one of the biggest risks to society, the economy, and financial institutions. Mitigating climate change, including the reduction of greenhouse gas (GHG) emissions, and adapting to climate change are major global challenges. The present disclosure builds on earlier disclosures made since 2017. It is made on behalf of Aegon Ltd., an international financial services group, as both an asset owner and an asset manager. Similar to previous years, it follows the Task Force on Climate-related Financial Disclosures (TCFD)’s four-pillar framework to facilitate disclosure. It also details progress on targets Aegon has set in line with its Net-Zero Asset Owner Alliance (NZAOA) membership. Aegon strives to continuously enhance its reporting and business practices and welcomes feedback from stakeholders on the appropriateness and relevance of this disclosure. Governance Aegon’s Board of Directors has ultimate oversight over climate-related risks and opportunities. Through its Nomination and Governance Committee, the Board of Directors is advised and kept appraised of business and regulatory developments regarding sustainability, including climate change. An update is provided at least once per year on Aegon’s sustainability approach, which includes climate change as a priority theme. The CEO, supported by the Executive Committee, is responsible for annually approving the double materiality assessment process, including related climate considerations, and setting Aegon’s broader sustainability strategy via Aegon’s sustainability approach. The CEO and Executive Committee receive at least an annual update on progress made against the approach and the climate ambitions included therein. They are also responsible for approving any additional climate ambitions and targets that are set at the group level. The Global Sustainability Board (GSB) advises the Executive Committee on Aegon’s strategic sustainability approach, including climate change as a priority theme, and meets quarterly. The GSB is supported by the Corporate Sustainability Team. The GSB is a senior management committee, established in December 2021 to enhance overall governance and oversight of Aegon’s company-wide approach to sustainability. It monitors progress made on climate targets and ambitions on a quarterly basis and, if insufficient progress is made, the GSB can escalate this to the Executive Committee. The GSB is chaired by the CEO of the Americas and consists of senior-level representatives from across the company, including five members of the Executive Committee. The GSB is supported by local sustainability boards across Aegon’s business units. From a risk perspective, the Group Risk & Capital Committee (GRCC) oversees Financial Risk Management’s climate scenarios that analyze the potential impacts of climate change on Aegon’s financial accounts. The Non-Financial Risk Committee (NFRC) oversees Risk Governance’s annual climate risk assessment that identifies possible physical and transition risks that could impact Aegon. Strategy At a company-wide level, Aegon identifies the key risks and opportunities related to climate change through its overarching risk processes and through engaging with its key stakeholders, including customers, employees, investors, suppliers, and other business partners. The findings of these stakeholder engagements are captured in Aegon’s double materiality assessment, which identifies the most material sustainability topics (based on a double materiality lens), including climate change mitigation and adaptation, and the corresponding key risks and opportunities. Subsequently, Aegon prioritizes climate issues in its global sustainability approach. This approach prioritizes goals and targets with corresponding action plans and is then translated into 486 | Annual Report on Form 20-F 2023
| | | | | | | Task Force on Climate-related Financial Disclosures | | | | | | | | | | |
Aegon’s regular three-year strategy and financial planning process called the Budget and Medium-Term Plan (B/MTP). Risks Our strategic approach The relevant timeframe for climate change developments stretches from the short-term – where society is already feeling the impacts of climate change – to the medium- and long-term horizon, with a dependency on GHG emission pathways. This creates the challenge of assessing the relevance of, in particular, the far-out developments to the generally shorter-term organizational strategy timeframe, which, in the case of Aegon, are closely linked to our three-year B/MTP cycle. Complicating factors for the assessment include differing potential climate change pathways, as well as data availability. One of the ways we assess climate-related risks is by conducting a qualitative company-wide climate risk assessment (CRA) that categorizes risks into four occurrence timeframes: imminent, near future (1-5 years), middle future (5-10 years), and distant future (>10 years). Our CRA shows that climate risks are most relevant for our investment and operational risk categories and are expected to increasingly occur in the near- to middle-future. These risks have the potential for significant impact, such as asset devaluation or stranded assets in the case of investment risk; or mis-selling of products in the case of operational risk, with moderate possibilities for mitigation. From an underwriting risk perspective, climate-related risks have been identified in possible changes to future rates of mortality and morbidity. Aegon’s insurance products can have exposures to both an increase or decrease in these rates. At the same time, climate change can also lead to an increase or decrease in these rates, and impacts from climate change can therefore have both positive or negative financial consequences for Aegon. It is possible to distinguish between short-term and long-term risks, where short-term risks are driven by large catastrophic events that cause many deaths, long-term risks can lead to gradual changes in average mortality and morbidity rates over time. From a financial risk perspective, we quantitatively assess climate scenarios and their impacts on our investment portfolio using a 2050 timeframe, in line with the Paris Agreement. This is detailed in the following sections. Approach to quantitative climate risk assessment Aegon conducts an extensive and systematic quantitative climate risk assessment on an annual basis. The scope of this assessment covers our insurance business units1, encompassing both general account (GA) and separate account (SA) assets2. To conduct the 2023 annual assessment, Aegon continued its collaboration with Ortec Finance, using the company’s Climate MAPS solution, a scenario-based tool. This assessment consists of different stages (listed in order of sequence): | ∎ | | Climate pathways development with scenarios differing in terms of policy and technology changes, physical risks, and pricing-in changes. |
| ∎ | | Macroeconomic modeling, where scenario assumptions drive macroeconomic changes per region, per sector (e.g. country Gross Domestic Product (“GDP”), inflation, and sector Gross Value Added (“GVA”)). |
| ∎ | | Financial modeling, wheremacroeconomic impacts are translated to financial variables and pricing dynamics are modeled. Climate MAPS translates climate-GDP/GVA and CPI shocks over time to 600+ financial and economic variables. |
| ∎ | | Apply mapping, where Aegon’s assets, encompassing both securities and funds, are mapped to asset benchmarks available in Climate MAPS. The end-model output is climate-adjusted risk-return metrics for Aegon’s asset portfolios up to 40 years ahead over the different climate pathways. |
The first three stages above form part of Ortec Finance’s Climate MAPS solution with the final mapping stage conducted by Aegon. Climate pathways For our climate risk assessment, we consider four plausible climate pathways which are as follows: | ∎ | | An orderly Net Zero pathway (“Net Zero” / “NZ”); |
| ∎ | | A disorderly Net Zero pathway (“Net Zero Financial Crisis” / “NZFC”); |
| ∎ | | An orderly but limited transition (“Limited Action” / “LA”); |
| ∎ | | A failed transition pathway (“High Warming” / “HW”). |
| 1 | Aegon Asset management is out of the scope of analysis. |
| 2 | Reinsurance assets excluded. |
| | | | | | | | | | | Annual Report on Form 20-F 2023 | 487 | | |
| | | | | | | About Aegon Governance and risk management Financial information Sustainability information | | | | | | | | | | |
| | | | These pathways allow us to explore potential future climate policies, interventions, and the consequences of the world failing to mitigate change. | | These pathways are in line with industry standards set by the Intergovernmental Panel on Climate Change (IPCC) and the Network of Central Banks and Supervisors for Greening the Financial System (NGFS). This is demonstrated in the “Global temperature change (°C)” graph, where a comparison versus the IPCC scenarios is provided. |
| | | | | | | | | | | | Net Zero | | Net Zero Financial Crisis | | Limited Action | | High Warming | | | | | | Explores an orderly net zero transition (av. global warming of 1.5°C) | | Explores disruptive reaction from financial markets (avg. global warming of 1.5°C) | | Explores an orderly but limited transition (avg. global warming of 2.8°C) | | Explores severe physical climate risks (avg. global warming of 4.2°C) | | | | | ∎ Early and smooth transition ∎ Market pricing-in dynamics occur smoothed out in the first 3 years ∎ Locked-in physical impacts | | ∎ Sudden disinvestments in 2025 to align portfolios to the Paris Agreement goals have disruptive effects on financial markets with sudden repricing followed by stranded assets and a sentiment shock ∎ Locked-in physical impacts | | ∎ Policymakers implemented limited NDCs and fall short of meeting the Paris Agreement goals ∎ High gradual physical & extreme weather impacts ∎ Markets price in physical risks of the coming 40 years over 2026-2030, and risks of 40-80 years over 2036-2040 | | ∎ The world fails to meet the Paris Agreement goals and global warming reaches 4.2°C above pre-industrial levels by 2100 ∎ Very severe gradual physical & extreme weather impacts ∎ Markets price in physical risks of the coming 40 years over 2026-2030, and risks of 40-80 years over 2036-2040 | | | | | | Proprietary Ortec scenario aligned to: | | Proprietary Ortec scenario aligned to: | | Proprietary Ortec scenario aligned to: | | Proprietary Ortec scenario aligned to: | | | | | | Average temperature increase by 2100 of 1.5°C | | Average temperature increase by 2100 of 1.5°C | | Average temperature increase by 2100 of 2.8°C | | Average temperature increase by 2100 of 4.2°C | ~ ‘very low emissions’ IPCC scenario: SSP1-RCP1.9 ~50% probability of limiting warming to 1.5°C | | ~ ‘very low emissions’ IPCC scenario: SSP1-RCP1.9 ~50% probability of limiting warming to 1.5°C | | ~ ‘intermediate emissions’ IPCC scenario: SSP2-RCP4.5 Very likely 2.1°C – 3.5°C warming by 2100 | | ~ ‘high emissions’ IPCC scenario: SSP3-RCP7.0 Very likely 3.4°C – 5.6°C warming by 2100 |
Global temperature change (°C) 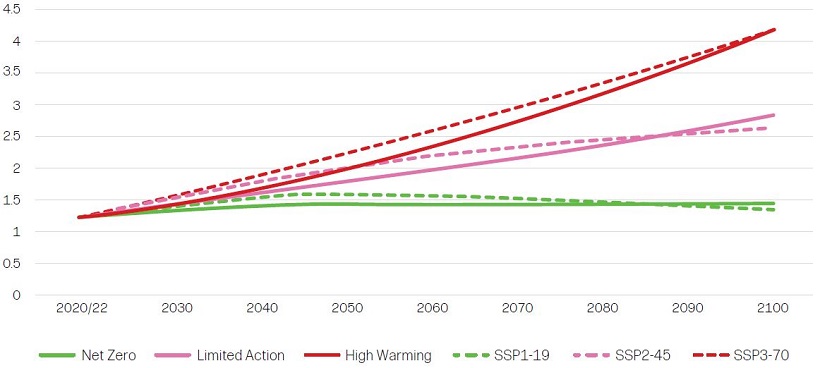
488 | Annual Report on Form 20-F 2023
| | | | | | | Task Force on Climate-related Financial Disclosures | | | | | | | | | | |
Macroeconomic modeling The climate pathway assumptions drive macroeconomic changes per region and sector (e.g. GDP, inflation, and sector GVA). These changes/impacts are measured versus a climate-uninformed baseline outlook. As an example, in the “Cumulative US GDP impacts and contribution by year, risk driver, and pathway“ graph, the projected cumulative impact on US GDP is shown for each pathway, together with the risk driver contribution from transition risks (i.e. policy & technological changes) and physical risk (i.e. gradual impact and extreme weather events). It illustrates firstly the greatest ultimate cumulative GDP impacts for the High Warming (HW) pathway and the Limited Action (LA) pathway. In these pathways we notice physical risks are particularly prominent with gradual physical risk impacts increasing significantly over time. In the Net Zero and Net Zero Financial Crisis (NZ & NZFC) pathways that follow, the ultimate cumulative GDP impacts are smaller having successfully transitioned to a net-zero world by 2050. Nevertheless, locked-in physical impacts still emerge in these pathways. Cumulative US GDP impacts and contribution by year, risk driver, and pathway Risk driver ∎ Extreme Weather ∎ Gradual Physical ∎ Transition ∎ Sentiment Shock  Total Total 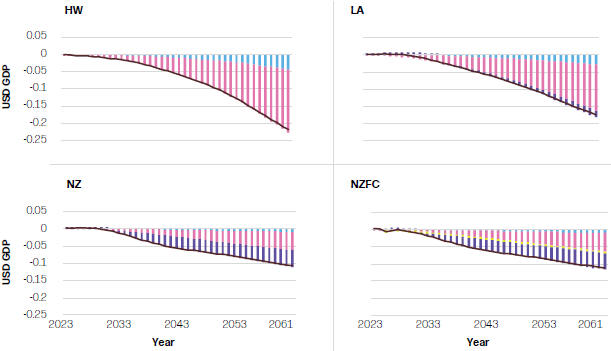
Financial modeling The next step in the modeling involves employing financial modeling to translate the macroeconomic impacts to financial variables and capture pricing dynamics. In particular, Climate MAPS translates climate-GDP/GVA and CPI shocks over time to 600+ financial and economic variables. These variables have a high degree of granularity differing by country/sector/ year for each pathway. As an example, in the graph “US equity impact by year and pathway”, the projected cumulative impact on US Equities is shown for each pathway. This figure illustrates, in the case of the High Warming (HW) and Limited Action (LA) pathway, two pricing-in periods that cause meaningful negative equity impacts. In these periods, financial markets price in physical risks for the coming 40 years during 2026-2030, and risks of 40-80 years during 2036-2040. Moving to the Net Zero pathway, we see the pricing-in dynamics smoothed out in the first three years of the projection given the early and smooth transition to a net-zero world. In contrast, in the Net Zero Financial Crisis pathway, a severe negative impact is concentrated in 2025 when sudden disinvestments, to align portfolios to the Paris Agreement goals, have disruptive effects on financial markets, with sudden repricing followed by stranded assets and a sentiment shock. | | | | | | | | | | | Annual Report on Form 20-F 2023 | 489 | | |
| | | | | | | About Aegon Governance and risk management Financial information Sustainability information | | | | | | | | | | |
US equity impact by year and pathway 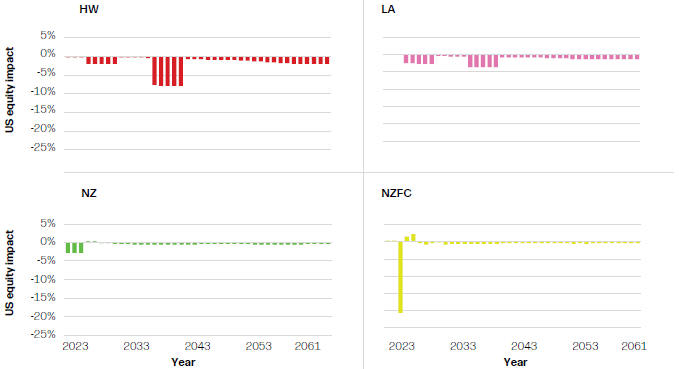
Mapping to Aegon exposures In this final stage, we apply mapping where Aegon’s assets, encompassing both securities and funds, are mapped to asset benchmarks available in Climate MAPS. The Climate MAPS solution has a large suite of asset benchmarks available with a high level of granularity by asset class, region, and rating thus facilitating a strong level of mapping versus Aegon’s actual asset portfolio. In this step, we need to make assumptions about how the GA and SA asset portfolios evolve over time. In the results generated, we assume a constant portfolio asset allocation over time. Furthermore, we assume that the GA portfolio is modeled as a static portfolio, and that its value therefore rises and falls with investment returns but does not take account of other external dynamics; for example, new money inflows, claims outflows, etc. It is worth noting that, for fixed income (FI) credit, the asset exposure is mapped to a combination of corporate bond benchmarks with specific credit ratings. Given we assume a constant asset allocation over time this implicitly assumes a regular rebalancing of the exposure, as defaults and migrations emerge, to maintain the initial credit rating split. An alternative modeling approach would be to assume less dynamic management of the FI assets where we buy and hold the securities. Results of the quantitative climate risk assessment Following the application of the mapping, the end-model output is climate-adjusted risk-return metrics for Aegon’s asset portfolios up to 40 years ahead over the different climate pathways. An example of this output is shown in the graph “Return impact versus baseline (cumulative) by year and scenario”, which illustrates the 2023 results in respect of the overall GA asset portfolio. Results are shown as a return impact versus a climate-uninformed baseline outlook. The chart illustrates that the High Warming pathway has the greatest ultimate cumulative impact on the portfolio where the impacts develop more gradually but accelerate later following the significant physical risks of this path being priced in by the financial markets. In the case of the Limited Action pathway, we see a similar shape to the impacts, though they are less severe than the High Warming. The Net Zero pathways, in line with expectations, have a smaller ultimate cumulative impact versus High Warming and Limited Action. However, in the case of Net Zero Financial Crisis, significant return volatility is observed in the short term. 490 | Annual Report on Form 20-F 2023
| | | | | | | Task Force on Climate-related Financial Disclosures | | | | | | | | | | |
Return impact versus baseline (cumulative) by year and scenario 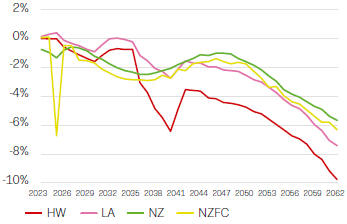
Return impact versus baseline (cumulative) by year and scenario (sensitivity analysis) 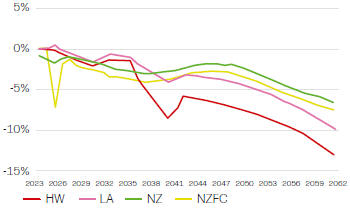
Return impact versus baseline (cumulative) by year and scenario (sensitivity analysis) + 10% equity 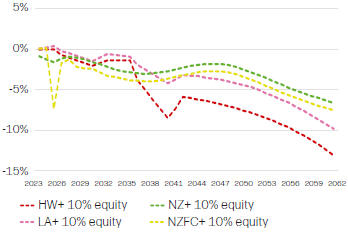
Return impact versus baseline (cumulative) by year and scenario (analysis of change versus 2022) 
The projections in the graph “Return impact versus baseline (cumulative) by year and scenario” demonstrate good resilience in the value of the GA portfolio against key systemic climate risk drivers over a 40-year horizon. This is largely attributed to the high allocation of fixed income assets in the GA (in this analysis c. 87% of the GA exposure is mapped to Fixed Income asset class and within this c. 50% of the GA exposure is mapped to US corporate bonds), which serves to limit the cumulative climate-related impact on returns. The expected return from the fixed income asset class is forecasted to be less exposed than equities, real estate, or other asset classes to climate risks. Despite the above assessment it is important to recognize the high degree of uncertainty with respect to outcomes projected above. Climate risk scenario modeling is a very challenging topic involving a significant number of assumptions and the need for modeling complex interactions. Furthermore, it is important to recognize the projected outcomes show only the median outcome under the modeled pathway, and not the uncertainty or variance underlying the point estimate. In recognition of this and other modeling choices (e.g. assume constant rebalancing in management of Fixed Income portfolio) we show in graph “Return impact versus baseline (cumulative) by year and scenario (sensitivity analysis)” the results of a sensitivity analysis, whereby we assume that 10% of the mapped US corporate bond exposure is mapped to equity. As highlighted by the chart above, this results in a more onerous cumulative return impact on the GA of -13.1% in the High Warming pathway. The graph “Return impact versus baseline (cumulative) by year and scenario (analysis of change versus 2022)” provides an analysis of change for the GA results comparing the 2023 climate pathways versus the 2022 equivalents, namely Disorderly Net Zero (dNZ) versus Net Zero Financial Crisis (NZFC), Orderly Net Zero (oNZ) versus Net Zero (NZ), and Failed Transition (FT) versus High Warming (HW). The graph illustrates broadly similar outcomes when comparing the 2023 pathways (solid lines) versus their 2022 equivalent (dashed lines). This result is not unexpected, with the assumptions underlying the 2022 and 2023 pathways being broadly similar. | | | | | | | | | | | Annual Report on Form 20-F 2023 | 491 | | |
| | | | | | | About Aegon Governance and risk management Financial information Sustainability information | | | | | | | | | | |
The results provide an initial directional signal; however, climate-related risks are dynamic in nature. Transition risks are expected to dominate in the near to medium term (particularly to 2030) if society is to achieve the net-zero objectives while physical risks may materialize at any time as global temperatures continue to rise. As a result, continuing to monitor developments in climate science, policy, technology, and consumer sentiment is critical for understanding and adapting to the future. Opportunities As an investor, Aegon has an important role to play in supporting the climate transition. In 2021, Aegon committed to transitioning its general account investment portfolio to net-zero GHG emissions by 2050 and joined the Net-Zero Asset Owner Alliance. Underpinned by its Responsible Investment Policy and as part of its broader net-zero ambitions, Transamerica has committed to investing USD 2.5 billion in climate solutions by 2025. To reach this goal, Transamerica has scaled up investments in economic activities that substantially contribute to climate change Risk management Identification and assessment Aegon’s Enterprise Risk Management (ERM) framework is a comprehensive structure that encompasses various components such as risk appetite, risk tolerance, risk identification, risk assessment, risk response, risk reporting and monitoring, and risk control. Within this framework, sustainability, including climate risk, is explicitly integrated. Climate risk is recognized within the framework; however, it is not identified as a separate risk type but as a risk driver that impacts multiple risks across different aspects of Aegon’s operations, including financial risk, underwriting risk, and operational risk. Measuring risks is crucial for effective risk management. However, compared to other risks, data availability for climate risk, given its evolving nature, remains a challenge. Accurate measurement requires a diverse range of data, including forward-looking climate models, historical weather data, information on physical geography, adaptive infrastructure, market responses, cross-correlations, and distributions. mitigation (solutions substantially reducing greenhouse gases by avoiding emissions or sequestering carbon dioxide already in the atmosphere) and adaptation (activities that contribute to enhancing adaptive capacity, strengthening resilience, and reducing vulnerability to climate change). As part of its assessment of climate-related investment opportunities, Aegon reviews the assets’ alignment to at least one of the stated sectoral themes outlined by the NZAOA and, in the case of “green” or “sustainability” bonds, that the use of proceeds meets the eligibility criteria of leading standards and methodologies. More broadly, Aegon has incorporated climate change in its strategy, through its sustainability approach goals and B/MTP. This includes its products and services, where different business units include climate considerations in their financial products in line with customer preferences. Examples of this include Aegon Asset Management’s Global Short Dated Climate Transition Fund and Aegon UK’s workplace default pension funds that have net-zero goals. To enhance our understanding of climate risk, Group Risk undertakes an annual qualitative company-level climate risk assessment (CRA) across Aegon’s three risk categories as outlined in the table “Aegon risk categories”. The qualitative assessment aims to identify relevant climate risks for Aegon and gauge their severity and manageability. The company-wide assessment builds on local assessments by experts in the business units. Through a structured CRA template, the local experts provide their scores on identified climate risks in terms of likelihood, impact, mitigation, and speed of occurrence. They also provide information on current and planned management actions to mitigate the identified risks. These individual assessments are then analyzed, weighted, and aggregated to create the company-level CRA. By following this defined assessment process, Aegon gains qualitative insights into the climate-related risks that it is exposed to. This information serves as input for strategic decision-making, risk management, and planning efforts at both global and local levels. It allows Aegon to proactively address climate risks and develop appropriate mitigation strategies to safeguard our assets and operations. 492 | Annual Report on Form 20-F 2023
| | | | | | | Task Force on Climate-related Financial Disclosures | | | | | | | | | | |
Aegon risk categories | | | | | | | | Aegon risk category | | Climate risk impact | | Climate-risk related risks | | | | Investment risk | | Physical | | 1. Asset devaluation related to increases in frequency and severity of physical climate change-related events. | | | | | | Transition | | 2. Asset devaluation related to the transition to a low-carbon (and other greenhouse gasses) intensity economy (from both (i) Orderly and (ii) Disorderly/Failed perspectives). | | | | Underwriting risk | | Physical | | 3. More frequent, temporary spikes in mortality and/or morbidity (and claims experience) related to increase in frequency and severity of physical climate change-related events. | | | | | | Physical | | 4. Change in life expectancy trend (and claim experience) related to structural climate changes. | | | | Operational risk | | Physical | | 5. Business disruption risk due to damage to Aegon or 3rd party physical assets related to increased frequency and severity of climate change-related events. | | | | | | Transition | | 6. Inability to act or – actual or perceived – lack of action to react to changes in the sustainability domain, including climate change. | | | | | | | | 8. People Risk: Material increase in difficulty to attract and retain (specialist) talent due to Aegon’s image/stance on sustainability/climate change. | | | | | | | | 9. Non-compliance with regulations. | | | | | | | | 10. Mis-selling of products/greenwashing risk. |
High-level assessment findings of our group-level climate risk assessment are that: | 1. | Investment risks potentially have a significant inherent impact, with medium mitigation possibilities. |
| 2. | Mortality spikes related to physical climate events are likely but would have a small impact. Changes in life expectancy trends due to climate change are assessed as unlikely, with a small impact. |
| 3. | Mis-selling of products / greenwashing risk is assessed as the most significant, short-term operational risk, which could have a significant inherent impact but with high mitigation possibilities if managed well. |
Processes for managing climate-related risks At Aegon, climate-related risks are managed through a comprehensive approach that includes qualitative and quantitative assessments and analysis, tracking of climate-related targets and commitments, compliance with applicable risk policy requirements, engagement with investee companies, and the implementation of investment criteria and exclusions. One of the cornerstones of climate-related risk management is good-quality data. We prioritize the analysis of good-quality data to assess and mitigate climate-related risks across our investment portfolio. This includes tracking of key performance indicators related to climate targets and commitments, and pursuing alignment with international standards and best practices. Moreover, we actively engage with investee companies to encourage climate-conscious strategies and initiatives, fostering transparency and accountability within our investment ecosystem. We also consider climate-related risks as part of our investment decision making. Further, Aegon applies a broad range of day-to-day processes, within a framework of applicable policies, to manage climate-related risks. Such processes include, but are not limited to: | ∎ | | Adapting investment strategies and exposures. |
| ∎ | | De-risking through net-zero commitments. |
| ∎ | | Scenario analysis and stress testing. |
| ∎ | | Product development and redesign. |
| ∎ | | Adapting pricing and underwriting. |
| ∎ | | Guardrails on marketing materials. |
| ∎ | | Use of greenwashing checklists. |
| ∎ | | Leasing, not owning property. |
| ∎ | | Business continuity plans. |
| ∎ | | Third-party due diligence. |
| ∎ | | Tracking regulatory landscape, trends, and scientific developments. |
| ∎ | | Implementing new regulatory requirements. |
| ∎ | | Ensuring robust non-financial reporting processes and controls. |
With these measures, we are dedicated to safeguarding our business against climate-related threats while promoting sustainable processes that align with our long-term financial objectives. As Aegon is primarily a life insurance company, there is less exposure to the direct consequences of increasing frequency and severity of climate-related events. Any climate-related risks are expected to mostly materialize over time through shifts in the average mortality and morbidity rates. These developments are highly uncertain, and there has always been a continuous shift in mortality and morbidity rates, with underlying driving factors influencing these rates up and down. Historically we have largely seen on aggregate how mortality has decreased and people are living longer, mostly through the advancement of science, while behavioral | | | | | | | | | | | Annual Report on Form 20-F 2023 | 493 | | |
| | | | | | | About Aegon Governance and risk management Financial information Sustainability information | | | | | | | | | | |
| | | changes such as obesity and drug addiction are examples of drivers that cause higher mortality. Climate change is likely to be an additional driver that can impact mortality both positively or negatively depending on the situation. Aegon manages these risks by setting expectations for mortality and morbidity risks, based on historical experience and sets future improvements by combining historical data with expectations about the future. Climate change is a risk that has not manifested in the past to any notable degree and therefore requires an approach where more emphasis is put on future expectations. In 2023, we conducted our first high-level assessment of climate risk in our underwriting, referencing academic literature that translates IPCC scenarios to increases in mortality. Initial findings of the assessment indicate that the financial impact for Aegon is limited. Integration of climate-related risk management into overall risk management At Aegon, sustainability risk, and by extension climate risk, is not considered a separate risk type, but rather is a risk driver that impacts multiple risks. Sustainability is embedded in Aegon’s Enterprise Risk Management (ERM) framework and incorporated in relevant risk policies. In 2022, a comprehensive exercise was conducted to embed sustainability in the applicable risk policy documents. In 2023, refinements were made in the context of regular policy document updates. As part of our risk management practices, we conduct an emerging risk assessment process. The findings from this process are used to inform strategic and financial planning, scenario analyses, watch lists, management discussions, and actions, as well as external and internal reporting. The CRA serves multiple purposes here, including identifying relevant climate risks for the organization, gaining an understanding of their severity and manageability, and providing recommendations for necessary actions. The outcomes of the global CRA process are integrated into the broader ORSA processes. To foster the appropriate management of climate risk within its overall risk management framework, Aegon is in the process of developing a global sustainability risk appetite. This risk appetite will be aligned with the organization’s overall risk appetite framework and take into account existing strategies, requirements, and commitments. As we gather more data and insights, the sustainability risk appetite will evolve and mature accordingly. Through these efforts, Aegon is committed to effectively integrating sustainability and climate risk considerations into our risk management processes, thereby ensuring the organization is well-prepared to navigate the challenges and opportunities presented by a dynamic and ever-changing world. | | Active Ownership Engagement with corporates As an institutional investor, Aegon expects investee companies to work toward reducing their environmental impact and associated risks. Executed through our asset manager, we engage with the companies in which we invest to encourage better climate-related risk practices, including emissions measurement, disclosure, target setting, and reporting in line with the TCFD recommendations. Our engagements aim to stimulate structural and sectoral change by requesting the reduction of the carbon footprint and carbon intensity of an investee company as well as by motivating the company to increase the share of renewable energy it generates or purchases to mitigate negative impacts of climate change. We use a variety of approaches to engage with our investee companies, including bilateral and collaborative approaches. Among investee companies in our general account, we aim to engage with at least the 20 largest corporate carbon emitters by absolute emissions by 2025. We directly engage with them and encourage them to set science-based targets. In terms of collaborative initiatives and investor-led campaigns, Aegon participated in CDP’s Non-Disclosure Campaign. The campaign promotes engagement with non-disclosing companies that have a significant environmental impact and encourages them to provide specified measurable data on emissions, water, and forests. We also joined CDP’s science-based targets campaign, an investor-led initiative that urges more than 1,000 high-impact companies to set 1.5°C aligned science-based emissions reduction targets. Additionally, we joined CDP’s new Green Finance Accelerator to reduce the information gap on sustainable finance taxonomies and adverse impacts. Finally, as a member of the Dutch investor association, Eumedion, and the UK Investor Forum, we increasingly discuss board-level incentives linked to climate action plans with companies from different sectors and raise related expectations for transparency and disclosure in remuneration reports. Engagement with policymakers Aegon acknowledges the importance and necessity of government action in addressing climate change. Engagement with policymakers is critical to shaping our investment environment, and we work independently and in collaboration with industry groups to engage on key climate issues. At the European level, Aegon supports the goals of the EU strategy for financing the transition to a sustainable economy and recognizes the important role financial actors play in the transition. Aegon has engaged with officials and contributed to consultations on the corresponding regulations on sustainable taxonomy and sustainability disclosures, the incorporation of sustainability risks into the Solvency |
494 | Annual Report on Form 20-F 2023
| | | | | | | Task Force on Climate-related Financial Disclosures | | | | | | | | | | |
II regulatory regime, and the development of standards for the reporting of non-financial information. Aegon has also continued to advocate for action to complete the Capital Markets Union to unlock capital from institutional and cross-border investors to fund sustainable transition projects in Europe. In the United States, Aegon has engaged with policymakers at both the federal and state levels to advocate for appropriate climate-related regulation. Aegon has supported regulatory measures that appropriately differentiate between the climate exposures of life insurers and property-casualty insurers. At both the federal and state levels, Aegon has supported TCFD-based disclosure standards that would provide uniform and consistent information to stakeholders, while reducing the potential for duplication and redundancy. Aegon expects that these efforts will support the transition to a more sustainable economy. In Bermuda, Aegon has begun engaging with the Bermuda Money Authority on climate issues, including general support for potential disclosure of risks and opportunities in line with TCFD reporting. Metrics and targets Own operations Aegon does not maintain energy- or resource-intensive processes as part of its direct business operations, and its operational carbon footprint is small relative to the scope of its investment activities. Nevertheless, we have set targets to reduce the carbon footprint of our operations related to greenhouse gas emissions from the natural gas and electricity used by our offices. The first phase of our targets covers the period up to December 31, 2024. The second phase of Aegon’s near-term emissions reduction plan will cover the period from 2025 to 2030, and the corresponding targets will be finalized in 2024. By the end of 2023, Aegon had achieved a 68% reduction in its operational carbon footprint compared to the 2019 baseline, well ahead of the target of a 25% reduction by the end of 2024. The impact of less operational properties together with changing work patterns has had a significant impact in reducing our overall facilities footprint. We will continue to monitor the impact of hybrid working on our carbon footprint. Own investments Targets In 2021, as part of its commitment to the Net-Zero Asset Owner Alliance, Aegon set initial targets for its investments. Following the guidance in the NZAOA Target Setting Protocol, for 2025, Aegon intends to reduce the weighted average carbon intensity (WACI) of corporate fixed income and listed equity in its general account by 25% against a 2019 baseline. In 2023, the WACI of our corporate fixed income and equity investments reduced by 37% compared to 2019. Since 2023, the WACI reduction target has also been included in executive remuneration to ensure that corporate action at a leadership level is aligned with our net-zero commitment. Weighted average carbon intensity of corporate fixed income and listed equity. | | | | | | | | | | | | | | | | | | | | | | | | | Metric | | Unit | | | 2023 | | | | 2022 | | | | 2019 | | | | Progress against 2019 baseline | | | | | | | | Weighted average carbon
intensity | | tCO2e/EURm revenue | | 338 | | | 428 | | | 534 | | | (37%) | |
| 1 | Source: Aegon calculation. Values on December 31, 2023. Climate metrics calculated per Methodology section below. Climate change data availability may change over time and characteristics will vary. Certain information ©2024 Sustainalytics, MSCI ESG Research L.L.C. Reproduced with permission. Not for further distribution. |
In June 2023, we also set an additional target for our direct real estate investments, committing to reducing the scope 1 and 2 carbon intensity of our directly-held real estate investments by 25% (kgCO2e/m2) by 2025, against a 2019 baseline. At the end of 2023, the carbon intensity had fallen by 46% compared to 2019. Carbon intensity of direct real estate investments | | | | | | | | | | | | | | | | | | | | | | | | | Metric | | Unit | | | 2023 | | | | 2022 | | | | 2019 | | | | Progress against 2019 baseline | | | | | | | | | Carbon intensity | | kgCO2e/m2 | | 0.08 | | | n.m. | | | 0.15 | | | (46%) | |
| 1 | Source: below. Climate change data availability may change over time and characteristics will vary. |
Complementing efforts to reduce GHG emissions in our general account portfolio, we leverage investments and engagement strategies as additional levers to meet our net-zero commitments and actively manage the positioning of our portfolio in relation to the climate transition. To that end, Transamerica has committed to two intermediate targets by 2025, which further commit the company to investing USD 2.5 billion in opportunities that help mitigate climate change or adapt to the associated impacts and engaging with at least the top 20 corporate carbon emitters in the portfolio. | | | | | | | | | | | Annual Report on Form 20-F 2023 | 495 | | |
| | | | | | | About Aegon Governance and risk management Financial information Sustainability information | | | | | | | | | | |
Additional climate-related targets set on Aegon’s general account | | | | | | | | | | | | | | | | | | | | | | | | | Target | | Unit | | | 2023 | | | | 2022 | | | | 2019 | | | | Progress against 2025 target | | | | | | | | Financing the transition | | USDm | | | 1,850 | | | | n.m. | | | | - | | | | 74 | % | | | | | | | Engagements | | number | | | 19 | | | | n.m. | | | | - | | | | 95 | % |
| 1 | Source: Aegon calculation. Values on December 31, 2023. |
Disclosures We also disclosed supplementary metrics on the carbon footprint of our investments for our global general account holdings. A breakdown of our general account by asset class can be found below. Global general account by asset class 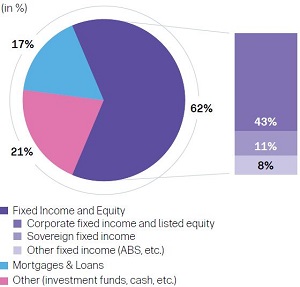
Source: Aegon calculation. Values are as of December 31, 2023 and may not add up to 100% due to rounding. Global general account – Corporate fixed income and listed equity | | | | | | | | | | | | | | | Metrics | | Unit | | | Corporate FI | | | | Coverage | | | | | | Total carbon emissions | | tCO2e | | | 2,036,000 | | | | 90% | | | | | | Carbon footprint | | tCO2 e/EURm
invested | | | 82 | | | | 90% | | | | | | Weighted average carbon intensity | | tCO2 e/EURm
revenue | | | 338 | | | | 97% | |
| 1 | Source: Aegon calculation. Values on December 31, 2023. Climate metrics calculated per Methodology section below. The weighted average carbon intensity is extrapolated when underlying carbon data is not available. The availability of data for each indicator is expressed in a coverage ratio as disclosed above. Climate change data availability may change over time and characteristics will vary Certain information ©2024 Sustainalytics, MSCI ESG Research L.L.C. Reproduced with permission. Not for further distribution. |
Corporate fixed income and listed equity results are dominated by holdings in the utilities, energy, and materials sectors where their contribution to the total carbon emissions and intensity of the account greatly outweighs their financial position. The graph “Active contribution by sector (in %)” indicates how Aegon’s sector exposures impact the weighted average carbon intensity and total carbon emissions, relative to their financial positions. 496 | Annual Report on Form 20-F 2023
| | | | | | | Task Force on Climate-related Financial Disclosures | | | | | | | | | | |
Active contribution by sector 
Global general account - Sovereign fixed income | | | | | | | | | | | | | | | Metrics | | Unit | | | Sovereign FI | | | | Coverage | | | | | | Including land use, land-use change, and forestry (LULUCF) emissions | | | | | | | | | | | | | | | Total carbon emissions | | tCO2 e | | | 1,237,000 | | | | 76% | | | | | | Carbon footprint | | tCO2 e/EURm invested | | | 240 | | | | 76% | | | | | | Weighted average carbon intensity | | tCO2 e/EURm invested | | | 240 | | | | | | | | | | Excluding LULUCF emissions | | | | | | | | | | | | | | | Total carbon emissions | | tCO2 e | | | 1,411,000 | | | | 76% | | | | | | Carbon footprint | | tCO2 e/EURm invested | | | 270 | | | | 76% | | | | | | Weighted average carbon intensity | | tCO2 e/EURm invested | | | 270 | | | | 76% | | | | | | Risk metric | | | | | | | | | | | | | | | Climate change resiliency | | ND GAIN rating | | | 64 | | | | 100% | |
| 1 | Source: Aegon calculation. Values on December 31, 2023. Climate metrics calculated per Methodology section below. WACI prepared in line with PPP-adjusted GDP as per PCAF. Climate change data availability may change over time and characteristics will vary. |
In light of the a.s.r. transaction, the general account of Aegon’s Dutch business is no longer included in our sovereign fixed income holdings. The transaction has led to a significant shift in financial weightings and, in 2023, our largest sovereign holdings are now in US-issued bonds. The results are dominated by our US holdings, where their contribution to the footprint and intensity of the account outweighs their financial position. The graph “Active contribution by region (in %)” provides an indicates how Aegon’s regional exposures impact the weighted average carbon intensity and total carbon emissions, relative to their financial positions. | | | | | | | | | | | Annual Report on Form 20-F 2023 | 497 | | |
| | | | | | | About Aegon Governance and risk management Financial information Sustainability information | | | | | | | | | | |
Active contribution by region 
Methodology In July 2023, Aegon completed the transaction to combine its Dutch pension, life and non-life insurance, banking, and mortgage origination activities with a.s.r., which led to a restatement of its 2019 baseline figures to exclude the Dutch business but not an adjustment to the ambition of our targets. Corporate fixed income and listed equity metrics were calculated following the Partnership for Carbon Accounting Financials (PCAF) guidelines and include scope 1 and 2 emissions. For sovereign assets, Aegon changed the methodology in 2023 to align with the PCAF guidelines to now reflect Purchase Power Parity (PPP) adjusted Gross Domestic Product (GDP). We also introduced a split for reporting sovereign assets: including and excluding the land use, land-use change, and forestry (LULUCF) emissions. The WACI was calculated in line with the TCFD’s recommendations. The direct real estate metrics are calculated in line with PCAF guidelines and include scope 1 and 2 location-based emissions of those properties. Floorspace and carbon data are relatively challenging to obtain, so the target is set on properties with available floorspace and carbon data. The amount for financing the transition investments is based on the IFRS book value of Transamerica’s general account, accounting for the use of proceeds specifically tied to climate change mitigation and/or climate change adaptation activities. The use of proceeds must align with at least one of the stated sectoral themes outlined by the NZAOA. For labeled “green” or “sustainability” bonds, standards such as Bloomberg, as well as third-party opinions, are typically used to confirm that the stated use of proceeds meets eligibility criteria. Regarding engagements, Aegon aims to engage with at least the top 20 corporate carbon emitters based on WACI. For 2023, Aegon is no longer reporting on the Sustainalytics Carbon Risk Rating, due to a change in data contracts. Climate vulnerability for sovereign issues is measured using the Notre Dame Global Adaptation Initiative (ND-GAIN) Country Index. Target figures are set in line with Net-Zero Asset Owner Alliance guidance. Next steps Aegon will seek to continue to improve its climate change strategy, governance, approach to risk and opportunity measurement, and implementation in the coming years. In 2024, we will work toward setting new climate-related investment and operational targets toward 2030. 498 | Annual Report on Form 20-F 2023
EU Taxonomy EU Taxonomy Regulation The EU Taxonomy Regulation has beenwas adopted by the EUEuropean Union in 2021 and is one of the cornerstones of the EU Action planPlan on financing sustainable growth. The EU taxonomyTaxonomy is a classification system to define environmentally sustainable economic activities, based on the following criteria: | a. | | Substantially contributing to one of the six EU environmental objectives: |
- Climate change mitigation
- Climate change adaptation
- Sustainable use and protection of water and marine resources
- Pollution prevention and control
- Protection and restoration of biodiversity and ecosystems
| | 1. | Climate change mitigation |
| 2. | Climate change adaptation |
| 3. | Sustainable use and protection of water and marine resources |
| 4. | Transition to a circular economy |
| 5. | Pollution prevention and control |
| 6. | Protection and restoration of biodiversity and ecosystems |
| b. | Doing no significant harm to any of the other objectives, and |
| c. | | Meeting minimum safeguards, including OECD Guidelines for Multinational Enterprises and the UN Guiding Principles on Business and Human Rightssafeguards. |
For each of the six environmental objectives, delegated acts are being developedadopted at EU level. Thus far, one delegated act for two objectives, climate change adaptation and climate change mitigation, has been finalized and is in effect. The delegated acts concerning the other four environmental objectives are expected to be published by the EU during 2022. Related eligibility disclosures are expected to follow in our IAR 2022. Article 8 of the EU Taxonomy Regulation
level.Article 8 of the EU Taxonomy Regulation requires undertakingscompanies to report how and to what extent the undertaking’stheir activities are associated with economic activities that qualify as environmentally sustainable. The requirements apply to companies that are applicable for undertakings which are subject to an obligationobliged to publish non-financial information in accordance with the NFRD, such as Aegon N.V. The information should be included in thenon-financial
statement or consolidatednon-financial
statement information. Article 8 of the EU Taxonomy Regulation aims to ensure that large public-interest entities (such as Aegon) report on these topics, so financial institutions and other stakeholders can use this information in return. The 2021 reporting year is the first step in the implementation of article 8 of the EU Taxonomy Regulation.
EU Corporate Sustainability Reporting Directive
From January 1, 2024, the Corporate Sustainability Reporting Directive (CSRD) is expected to replace the NFRD and as mentioned under section ‘Reporting process fornon-financial
data’ on page 350, at Aegon we are preparing internally for this change. The CSRD will require companies, including Aegon N.V., to include in their management report information necessary to understand their impacts on sustainability matters, and how sustainability matters affect their development, performance and position, including the information that they are required to disclose pursuant to article 8 of the Taxonomy Regulation.The EU Taxonomy is linked to the CSRD. While the EU Taxonomy is currently focused on environmental objectives only, the CSRD will set sustainability standards based on a broader, ESG+, definition. We expect that the CSRD will adopt an integrated perspective to reporting and that disclosures should cover key performance indicators around ESG matters and other ‘intangibles’ or value creators.
NFRD.Disclosure of EU Taxonomy-eligible and Taxonomy-aligned economic activities and investments The European Commission has adopted a phased approach to give companies more time to comply with the EU Taxonomy disclosure requirements. In the IARfirst two years of application, in 2021 Aegon mustand 2022, financial undertakings were required to disclose the proportionportion of Taxonomy-eligibletheir eligible economic activities and investments related to climate change mitigation and climate change adaptation only. When estimates and proxiesadaptation. Financial undertakings were granted a two-year phase-in period for reporting on alignment with the EU Taxonomy. Alignment disclosures are used, disclosures under Article 8mandatory for the 2023 reporting year. Aegon is therefore required in this year’s Annual Report to disclose the extent to which its activities are Taxonomy-aligned. The scope of the Taxonomy Regulation may not be classified as ‘mandatory’alignment disclosure is climate change mitigation and should be classified as ‘voluntary’. To assess the eligibility of our investments, we are often dependent on the information provided by our investees. In many cases, this information is not yet available. Therefore, we have used alternative methods and estimates which we describe below under ‘Assumptions and data limitations’. These investments are included in the voluntary disclosures. Only for our underwriting activities and investments in mortgage loans and real estate is actual information currently available to assess eligibility.
Therefore, these investments and activities form the mandatory disclosures. The distinction between ‘mandatory’ and ‘voluntary’ disclosures is explicitly mentioned in the EU Taxonomy tables below.
‘Eligible’“Eligible” means that an economic activity is described in one of the delegated acts as mentioned above, irrespective of whether that economic activity meets any or all of the technical screening criteria laid down in those delegated acts to qualify as sustainable. ‘Alignment’“Alignment” means that an eligible economic activity meets the technical screening criteria to qualify as sustainable. Aegon N.V. needs to disclose To assess the eligibility and alignment of its economic activitiesinvestments, Aegon often relies on the information reported by its investees. When estimates and proxies are used, the disclosures under article 8 of the Taxonomy Regulation may not be classified as “mandatory” and should be classified as “voluntary”. This year’s Annual Report does not include voluntary EU Taxonomy information. The information presented in its IAR 2023. the EU Taxonomy tables is based on reported information.Scope of assets and activities covered by the EU Taxonomy disclosures Aegon’s EU Taxonomy performance indicators are split between underwriting activities andon-balance
investments.To calculate the proportion of Taxonomy-eligible and Taxonomy-aligned investments, the total of covered investments is used as the denominator, which includes General Accountgeneral account investments, investments infor accounts of policyholders, derivatives, cash and cash equivalents, and real estate for own use. The total covered assets in proportionExposures to the total balance sheet is 82% (EUR 385 billion out of EUR 469 billion). Aegon Integrated Annual Report 2021
We also include incentral governments, central banks, and supranational issuers are excluded from the covered assets, on a voluntary basis, investments in undertakingsassets. Derivatives and investees that are not obliged to publish non-financial information unlessare also excluded from the data isnumerator of the mandatory EU Taxonomy disclosures and therefore do not availablecount in the alignment. This refers to assess Taxonomy-eligibility. Thissmall- and medium-sized companies, non-public interest companies based in the EU, and non-EU-based companies. The disclosure in the EU Taxonomy alignment table relating to the exposure to other counterparties includes investments in companies established outside the EU.loans to individuals such as private loans and mortgages and other assets such as real estate as well as real estate for own use.Own activities TheIn last year’s annual report, Aegon’s underwriting disclosure includesdisclosures included an assessment of all non-life business as prescribed by the EU Taxonomy. Non-life
As Aegon the Netherlands was divested in 2023, there are no non-lifebusiness only relates to the EU Climate Change Adaptation objective, as these products can significantly contribute to the protection of policyholders for the negative impact of climate change, but do not contribute to the Climate Change Mitigation objective.We have onlyactivities that could be classified non-life
activities as eligible, when there is a reference in the policy conditionsnor aligned. Therefore, this report does not include disclosures related to one or more of the climate-related perils as defined by the EU Taxonomy Climate Delegated Act (such as storm, flood, cold wave/frost, or drought). We have assessed that this is applicable to our motor vehicle, other motor and property insurance. As a consequence, we have classified our medical expense, income protection and worker’s compensation insurance products asunderwriting.non-eligible.
| | | | | | | | | | | Annual Report on Form 20-F 2023 | 499 | | |
The Taxonomy Regulation allows different methods to measure the total premium of eligible products. The total premium of eligible products can be calculated at line of business level, product level or coverage level. Aegon takes a product-level approach, which means that the total gross written premium of all eligible products is taken into account. | | | | | | | About Aegon Governance and risk management Financial information Sustainability information | | | | | | | | | | |
Assumptions and data limitations To determineFor the 2023 disclosures on alignment and eligibility, of our investments in 2021 we used publicly available sectorAegon uses reported information (referredfrom the underlying investee companies to as NACE codes),assess eligibility and alignment percentages. This information is primarily collected bythrough an external data vendorvendor. Where this data was not available we have assessed this as non-eligible and non-aligned. Where data was not available to map the investments in shares, debt securities and part of our private loans to the EU Taxonomy. We have measured eligible investments for the full carrying amount. Insplit the alignment phase in 2023between transitional and enabling activities we willleft this blank. To determine which investees are obliged to publish non-financial information, we also make use of actual information from the underlying companiesdata vendor. Where this data is not available, but we know the place of domicile, we have determined that investees outside the EU are not obliged to assesspublish non-financial information. When none of this information was available, we intentionally left it blank. These data limitations contribute to the alignment percentage, which will likely be lower than 100%low percentages of theexposures to financial and non-financial undertakings subject to and not subject to articles 19a and 29a of Directive 2013/34/EU. The investments in our EU Taxonomy disclosures include accrued interest and are valued according to its IFRS value for most investments. Book Value.Our mortgage and real estate portfolioportfolios are classified as 100% eligible in line with the EU Taxonomy. We expect that not all properties willDue diligence procedures have been carried out to understand and assess whether these assets meet the screening criteria in 2023, whichfor alignment. This is in large partlargely based on the energy labelenergy-label information of the underlying properties. As a result, we expect thatIn cases where there is no data available, these assets are disclosed as non-aligned. Assessing the actualeligibility and alignment of our mortgage and real estate portfolio in 2023 will also be lower than 100%. The eligibility assessment of our investment funds is more difficult since we are dependentdue to the heavy reliance on external asset managers to provide relevant sustainability information on the underlying companies. Aegon uses a look-through approach for investment funds, which entails assessing the eligibility and alignment of the underlying companies.investments in these funds. As in previous years, Aegon has encountered significant data limitations for investment funds. For 2021 we have alisted funds, reported data limitation to assess the eligibility of our investment funds.collected by an external data vendor is used. For unlisted funds, Aegon has performed its own due diligence. As a result we have classified these investments asnon-eligible.
of data limitations, the data coverage of the unlisted investment funds is insignificant. This mainly impacts the eligibilitydisclosure of Investmentsinvestments for the account of policyholders. For our 2021 disclosuresreporting on alignment and nuclear and fossil gas activities, Aegon uses the reporting templates as prescribed by the EU Taxonomy, whereby templates 2 and 3 are split between CAPEX and Turnover. For reporting on eligibility including all six additional environmental objectives, there is no prescribed format. As in previous years, the environmental objectives are combined and broken down into eligible and non-eligible investments relative to the assets covered. There are also data limitations in assessing eligibility, as not all investee companies report on eligibility for all six environmental objectives. Where data was not available, this was classified as non-eligible. We expect the eligibility and alignment percentages to increase over time as more data becomes available. However, due to the relative large amount of investments outside the EU, we do not make a distinction between the two climate objectives Climate Change Mitigation and Climate Change Adaptation. For investments the distinction becomes relevant in the alignment phase as the screening criteriaexpect these percentages will remain low for Mitigation are different than those for Adaptation. In thecoming years. EU Taxonomy eligibility phase these categories are very similar and the information to make a distinction is not yet available. As mentioned above, non-life | | | | | | | | EU Taxonomy eligibility1) | | Percentage of investments covered | | Absolute amount (EUR million) | Eligible investments (numerator) | | 5% | | 13,905.63 | | | | Non-eligible investments (numerator) | | 95% | | 245,516.10 | | | | | Total investments covered (denominator) | | 100% | | 259,421.73 |
| 1 | EU Taxonomy eligibility for six environmental objectives: climate change mitigation, climate change adaptation, sustainable use and protection of water and marine resources, transition to a circular economy, pollution prevention and control, protection and restoration of biodiversity and ecosystems |
activities are all related to Climate Change Adaptation. 500 | Annual Report on Form 20-F 2023 Aegon Integrated Annual Report 2021
| | | | | | | | | | | | Eligibility based on actual information | | | | | | | | | | | | | Eligible non-life activities | | 270 | | 13% | | | | | | | 13 | | | | | | | | | 1,774 | | 87% | | | | | | | | | | | | | |
| | | | | | | | | | EU Taxonomy investment (on-balance) | | Eligibility based on actual information
(mandatory disclosure) | | Eligibility including estimates
(mandatory and voluntary disclosure) | | | | | | | | | | | | | | | | | Eligible investments (numerator) | | 44,015 | | 11% 1) | | 59,471 | | 15% | | | | | | | - Of which General Account investments | | 43,267 | | | | 55,898 | | | | | | | | | - Of which Investments for account | | 563 | | | | 3,388 | | | | | | | | | | | | | | | | | | | | | | | | - Of which real estate for own use | | 185 | | | | 185 | | | | | | | | | Non-eligible investments (numerator) | | 320,555 | | 83% | | 305,099 | | 79% | | | | | | | Excluded from numerator only: | | 8,827 | | 2% | | 8,827 | | 2% | | | | | | | | | | | | | | | | | | | | | | Excluded from numerator only: | | 11,304 | | 3% | | 11,304 | | 3% | | | | | | | | exposures to undertakings that are not obliged to publish non-financial information pursuant to Article 19a or 29a of Directive 2013/34/EU and data is not available | | | | | | | | | | | | | | | Total investments covered (denominator) | | | | | | | | | | | | | | | | Excluded from numerator and denominator: exposures to central governments, central banks and supranational issuers | | 33,727 | | | | 33,727 | | | | | | | | | Total investments in scope | | | | | | | | | | | | | | | | | | | | | | | | | | | | | | - Investments General Account | | 158,463 | | | | 158,463 | | | | | | | | | - Investments for account | | 250,953 | | | | 250,953 | | | | | | | | | | | | | | | | | | | | | | | | | | 8,827 | | | | 8,827 | | | | | | | | | - Real estate for own use | | 185 | | | | 185 | | |
1 The percentage of eligible investments of total investments is 11% (44,015/418,428) and over total assets is 9% (44,015/468,884)
Note: When estimates and proxies are used, disclosures under Article 8 of the Taxonomy Regulation may not be classified as ‘mandatory’ and should be classified as ‘voluntary’. Only for our investments in mortgage loans and real estate, actual information is currently available to assess the eligibility. Therefore, these investments form the mandatory disclosures.
Aegon Integrated Annual Report 2021
| | | | | | | | | | | | | | | | | | | | Eligibility per investment class covered | | | Eligibility determined
based on actual
information
(part of mandatory
disclosure) | | Eligibility determined
based on estimates
(part of voluntary
disclosure) | | | | | | | | | | | | | | | | | | | | | | | | | | | | | | | | | | | | 71 | | | | 644 | | | | 11% | | | No | | Yes | | | | 10,595 | | | | 62,956 | | | | 17% | | | No | | Yes | | | | 40,624 | | | | 40,624 | | | | 100% | | | Yes | | No | | | | 1,910 | | | | 4,886 | | | | 39% | | | No | | Yes | | | | - | | | | 1,893 | | | | 0% | | | No | | Yes | | | | 2,643 | | | | 2,643 | | | | 100% | | | Yes | | No | | | | 55 | | | | 5,681 | | | | 1% | | | No | | Yes | | | | | | | | | | | | | | | | | | of policyholders in scope: | | | | | | | | | | | | | | | | | | | | 2,155 | | | | 15,604 | | | | 14% | | | No | | Yes | | | | 581 | | | | 6,098 | | | | 10% | | | No | | Yes | | | | | | | | | | | 89 | | | | 208,976 | | | | 0% | | | No | | Yes | | | | | | | | | | | | | | | | | | | | | 563 | | | | 563 | | | | 100% | | | Yes | | No | | | | - | | | | 6,344 | | | | 0% | | | No | | Yes | | | | | | | | | | | | | | | | | | | | | | | | | | | | | | | | | | |
1 | Mainly includes deposits with financial institutions and money market funds which do not qualify for eligibility.
|
Aegon Integrated Annual Report 2021
| | Frameworks and initiatives
|
Frameworks and initiativesAegon uses various general and sector-specific global sustainability frameworks and initiatives, both to align with and to report its sustainability strategy, policies, and performance against.
As mentioned above, the Integrated Reporting <IR> Framework of the International Integrated Reporting Council (IIRC)1) provides the basis of preparation of this IAR.
The Integrated Reporting <IR> Framework
The table below shows Aegon’s compliance with the ‘Guiding Principles’ and the ‘Content Elements’ of the <IR> Framework.
| | | | | | | | | | | | Page reference
2)
(or details of omissions if applicable)
| | | | Guiding principles | | Strategic focus and future orientation | | Our business environment (pages8-13)
| | | | Our strategy and value creation (pages16-34)
| | Sustainability (pages20-23)
| | Connectivity of information
| | The topics mentioned in Our busines environment (pages8-13)
and Business Environment Scan (page 12) are linked to risks and opportunities, which are considered for Our strategy and value creation (page 18) | | Stakeholder relationships
| | Sharing value with our stakeholders (pages26-32)
| | | | Basis of preparation (pages350-351)
| | | | Pages1-34
are structured around our material topics, risks, opportunities and strategy, as well as the performance and value associated with these. We have also applied the materiality principle to define the content of this IAR (pages350-351)
| | Reliability and completeness
| | Basis of preparation (pages350-351)
| | | EU Taxonomy | | | | | Consistency and comparability
| | This Integrated Annual Report (IAR) is prepared in accordance with the International Financial Reporting Standards (IFRS), as adopted by the European Union, as well as the Integrated Reporting Framework (<IR> Framework) of the International Integrated Reporting Council (IIRC). Aegon has used the <IR> Framework since 2014. We are making the shift to integrating more material frameworks; like that of the Task Force on Climate-related Financial Disclosures (pages372-378).
| | | Content elements | | Organizational overview and external environment
| | | | | Our business environment (pages8-13)
| | | |
EU Taxonomy alignment | | | | | | | | | | EU Taxonomy alignment1) | | Percentage of investments covered | | | | Absolute value (EUR million) | | The weighted average value of all the investments of insurance or reinsurance undertakings that are directed at funding, or are associated with Taxonomy-aligned economic activities relative to the value of total assets covered by the KPI, with the following weights for investments in undertakings per below: | | | | The weighted average value of all the investments of insurance or reinsurance undertakings that are directed at funding, or are associated with Taxonomy- aligned economic activities, with following weights for investments in undertakings per below: | | | | | Turnover-based: | | 0.07% | | Turnover-based: | | | 180 | | Capital expenditures-based: | | 0.11% | | Capital expenditures-based: | | | 277 | | The percentage of assets covered by the KPI relative to total investments of insurance or reinsurance undertakings (total AuM). Excluding investments in sovereign entities. | | | | The monetary value of assets covered by the KPI. Excluding investments in sovereign entities. | | | | | Coverage ratio: | | 96% | | Coverage: | | | 259,422 | | | Additional, complementary disclosures: breakdown of denominator of the KPI | | | | | | | | | | The percentage of derivatives relative to total assets covered by the KPI. | | (0.38%) | | The value in monetary amounts of derivatives. | | | (975 | ) | The proportion of exposures to financial and non-financial undertakings not subject to articles 19a and 29a of Directive 2013/34/EU over total assets covered by the KPI: | | | | Value of exposures to financial and non-financial undertakings not subject to articles 19a and 29a of Directive 2013/34/EU: | | | | | For non-financial undertakings: | | 11.55% | | For non-financial undertakings: | | | 29,965 | | For financial undertakings: | | 6.12% | | For financial undertakings: | | | 15,879 | | The proportion of exposures to financial and non-financial undertakings from non-EU countries not subject to articles 19a and 29a of Directive 2013/34/EU over total assets covered by the KPI: | | | | Value of exposures to financial and non-financial undertakings from non-EU countries not subject to articles 19a and 29a of Directive 2013/34/EU: | | | | | For non-financial undertakings: | | 11.29% | | For non-financial undertakings: | | | 29,284 | | For financial undertakings: | | 5.51% | | For financial undertakings: | | | 14,282 | | The proportion of exposures to financial and non-financial undertakings subject to articles 19a and 29a of Directive 2013/34/EU over total assets covered by the KPI: | | | | Value of exposures to financial and non-financial undertakings subject to articles 19a and 29a of Directive 2013/34/EU: | | | | | For non-financial undertakings: | | 0.73% | | For non-financial undertakings: | | | 1,883 | | For financial undertakings: | | 0.75% | | For financial undertakings: | | | 1,945 | | The proportion of exposures to other counterparties over total assets covered by the KPI: | | 4.17% | | Value of exposures to other counterparties: | | | 10,815 | | The proportion of the insurance or reinsurance undertaking’s investments other than investments held in respect of life insurance contracts where the investment risk is borne by the policy holders, that are directed at funding, or are associated with, Taxonomy-aligned economic activities: | | 27.22% | | Value of insurance or reinsurance undertaking’s investments other than investments held in respect of life insurance contracts where the investment risk is borne by the policy holders, that are directed at funding, or are associated with, Taxonomy-aligned economic activities: | | | 70,627 | | The value of all the investments that are funding economic activities that are not Taxonomy-eligible relative to the value of total assets covered by the KPI: | | 94.64% | | Value of all the investments that are funding economic activities that are not Taxonomy-eligible: | | | 245,516 | | The value of all the investments that are funding Taxonomy eligible economic activities, but not Taxonomy-aligned relative to the value of total assets covered by the KPI: | | 5.18% | | Value of all the investments that are funding Taxonomy eligible economic activities, but not Taxonomy- aligned: | | | 13,448 | | | Additional, complementary disclosures: breakdown of numerator of the KPI | | | | | | | | | | The proportion of Taxonomy-aligned exposures to financial and non-financial undertakings subject to articles 19a and 29a of Directive 2013/34/EU over total assets covered by the KPI: | | | | Value of Taxonomy-aligned exposures to financial and non-financial undertakings subject to articles 19a and 29a of Directive 2013/34/EU: | | | | | For non-financial undertakings: | | | | For non-financial undertakings: | | | | | Turnover-based: | | 0.07% | | Turnover-based: | | | 180 | | Capital expenditures-based: | | 0.11% | | Capital expenditures-based: | | | 277 | | For financial undertakings: | | | | For financial undertakings: | | | | | Turnover-based: | | 0.00% | | Turnover-based: | | | - | | Capital expenditures-based: | | 0.00% | | Capital expenditures-based: | | | 0.06 | | The proportion of the insurance or reinsurance undertaking’s investments other than investments held in respect of life insurance contracts where the investment risk is borne by the policy holders, that are directed at funding, or are associated with, Taxonomy-aligned: | | | | Value of insurance or reinsurance undertaking’s investments other than investments held in respect of life insurance contracts where the investment risk is borne by the policy holders, that are directed at funding, or are associated with, Taxonomy-aligned: | | | | | Turnover-based: | | 0.03% | | Turnover-based: | | | 78 | | Capital expenditures-based: | | 0.04% | | Capital expenditures-based: | | | 99 | | The proportion of Taxonomy-aligned exposures to other counterparties over total assets covered by the KPI: | | | | Value of Taxonomy-aligned exposures to other counterparties over total assets covered by the KPI: | | | | | Turnover-based: | | 0.00% | | Turnover-based: | | | - | | Capital expenditures-based: | | 0.00% | | Capital expenditures-based: | | | - | |
| 1 | EU Taxonomy alignment for two environmental objectives: climate change mitigation and climate change adaptation |
Business Environment Scan (page 10)
| | | | | | | |
| | | | Corporate governance (pages38-41)
| | Annual Report on Form 20-F 2023 | 501 | | | Value creation (pages24-25)
| | | Our business environment (pages8-13)
|
| Business Environment Scan (page 10)
|
| Strategy and resource allocation
| | Our strategy and value creation (pages16-34)
|
| Sharing value with our stakeholders (pages26-32)
|
| | | Performance in 2021 (pages33-34)
|
| Value created (pages24-25)
|
| | | Our business environment (page8-13)
|
| Performance in 2021 (pages33-34)
|
| Basis of preparation and presentation
| | Basis of preparation (pages350-351)
|
1 | In June 2021, the IIRC merged with the Sustainability Accounting Standards Board (SASB) to form the Value Reporting Foundation (VRF).
|
2 | All page numbers in this table refer to Aegon’s Integrated Annual Report 2021, unless otherwise stated. Where there are several examples, we have included principal references only.
|
Aegon Integrated Annual Report 2021
| | | | |
| | Frameworks and initiatives
|
Aegon has signed up and committed to severalnon-sector
specific international initiatives, including the United Nations Global Compact (UNGC), the UN Sustainable Development Goals (SDGs), and the Task Force on Climate-related Financial Disclosures (TCFD). These initiatives guide our internal practices and policies, and help shape our overall approach to sustainability.United Nations Global Compact
In 2021, Aegon N.V. became a signatory of the UNGC, thereby committing to implement universal sustainability principles in the fields of human rights, labor, environment, and anti corruption, as well as taking steps to support the UN goals; currently the SDGs. As a signatory, Aegon is committed to disclosing its progress annually. In addition to integrating the measurement of the outcomes under the UNGC Principles into our annual reporting cycle, we have detailed Aegon’s policies and procedures to support each Principle and of how we align and implement them. For measured outcomes against the SDGs, please see ‘United Nations Sustainable Development Goals’ on pages367-371.
The Aegon website includes a dedicated library for our. See also pages353-356
‘Non-financial
policies, procedures and outcomes’ for an overview of our performance against the indicators of these policies. | | |
| | Policy and implementation
|
| | |
1. Businesses should support and respect the protection of internationally proclaimed human rights; and
| | Aegon’s Statement on Human Rights commits the company to upholding international human rights standards at all businesses whereAbout Aegon has sufficient management control and, where possible, to ensure partners live up to the same standards. Consideration for human rights is also built into Aegon’s Code of Conduct, Aegon’s Responsible Investment Policy, Vendor Code of Conduct, and Aegon’s Statement on Inclusion and Diversity.
We have committed to several global initiatives to support the development of human rights, including the UN Declaration of Human Rights, the core labor and human rights standards of the International Labor Organization (ILO) andUNEP-FI’s
Principles for Sustainable Insurance (PSI). |
2. make sure that they are not complicit in human rights abuses.
| | Aegon’s Statement on Human Rights commits the company to upholding international human rights standards. Consideration for human rights is also built into Aegon’s Code of Conduct, Aegon’s Responsible Investment Policy, Vendor Code of Conduct and Aegon’s Statement on Inclusion and Diversity.
We carry out a biennial Human Rights Risk Assessment, through which we aim to identify, prevent, and mitigate adverse human rights impacts that may be linked to our operations, products, and services.
|
| | |
3. Businesses should uphold the freedom of association and the effective recognition of the right to collective bargaining;
| | Aegon adheres to local laws regarding the freedom of association and the right to collective bargaining. For example, freedom of association and effective recognition of the right to collective bargaining are covered under the Aegon N.V. Responsible Investment Policy and the Aegon N.V. Vendor Code of Conduct.
|
4. the elimination of all forms of forced and compulsory labour;
| | Aegon’s Statement on Human Rights commits the company to upholding international human rights. Consideration for human rights, and more specifically those related to forced and compulsory labor, is also built into Aegon’s Responsible Investment Policy and Vendor Code of Conduct.
In line with our Responsible Investment Policy and Framework, we engage with our portfolio companies on issues related to human rights, including those related to forced and compulsory labor.
In line with our Vendor Code of Conduct, we score our suppliers for sustainability performance through the EcoVadis rating platform, which covers forced and compulsory labor.
|
Aegon Integrated Annual Report 2021
| | |
| | Frameworks and initiatives
|
| | |
| | Policy and implementation
|
5. the effective abolition of child labour; and
| | Aegon’s Statement on Human Rights commits us to upholding international human rights. Consideration for human rights, and more specifically those related to effective abolition of child labor, is also built into Aegon’s Responsible Investment Policy and Vendor Code of Conduct.
In line with our Responsible Investment Policy and Framework, we engage with our portfolio companies on issues related to human rights, including those related to forced and compulsory labor.
In line with our Vendor Code of Conduct, we score our suppliers for sustainability performance through the EcoVadis rating platform, which covers effective abolition of child labor.
|
6. the elimination of discrimination in respect of employment and occupation.
| | Aegon’s Statement on Human Rights commits us to upholding international human rights standards. Consideration for human rights, and more specifically those related to elimination of discrimination in respect of employment and occupation, is also built into Aegon’s Code of Conduct, Aegon’s Responsible Investment Policy, Vendor Code of Conduct, and Aegon’s Statement on Inclusion and Diversity.
Aegon considers certain human rights fundamental and universal for its workforce. All Aegon employees are educated on the company’s Code of Conduct and acknowledge that they will abide by these standards.
In line with our Responsible Investment Policy and Framework, we engage with our portfolio companies on issues related to human rights, including those related to discrimination.
Our Vendor Code of Conduct sets clear expectations for our vendors, which are subject to due diligence and monitoring procedures as per the Third Party Risk Management Policy.
|
| | |
7. Businesses should support a precautionary approach to environmental challenges;
| | As an insurance company, Aegon can support the transition to a climate-resilient economy and anet-zero
world using both sides of our balance sheet. We finance the upside through our investment activities, while helping to mitigate the downside by managing our operational carbon footprintGovernance and risk management processes, and the savings and protection solutions we provide. The influence, both positive and negative, that we can have as an investor is particularly significant, and Aegon has committed to transitioning our General Account investment portfolio tonet-zero
GHG emissions by 2050.As an office-based company serving the financial sector, Aegon does not operate energy and resource-intensive processes as part of its business operations, for example those typical of manufacturing industries, and is not aware of any incidents relating to these activities impacting the natural environment. Energy consumption at our office buildings makes up by far the largest portion of our energy use, followed by our data centers. Our business operations have been carbon-neutral since 2019, which has been achieved by substituting our energy consumption with renewable sources and offsetting our remaining carbon emissions. In line with thenet-zero
commitment announced in November 2021, Aegon has set a supporting operational greenhouse gas emission reduction target to reduce the carbon footprint of its operational activities by 25% by 2025 from a 2019 baseline. Energy consumption at our office buildings makes up by far the largest portion of our energy use, followed by our data centers. and while our own operational footprint as a business is relatively small, it is important that we set a good example. |
Aegon Integrated Annual Report 2021
| | |
| | Frameworks and initiatives
|
| | |
| | Policy and implementation
|
8. undertake initiatives to promote greater environmental responsibility; and
| | In line with our Responsible Investment Policy, through our investments, we encourage the development and diffusion of technologies that offer solutions to environmental issues, including those which reduce GHG emissions. With ournet-zero
commitment, we will engage with carbon-intensive investee companies to drive real-world reductions in emissions. |
9. encourage the development and diffusion of environmentally friendly technologies.
| | In line with our Responsible Investment Policy, through our (impact) investments, we encourage the development and diffusion of technologies that offer solutions to environmental issues, including those which reduce GHG emissions.
|
| | |
10. Businesses should work against corruption in all its forms, including extortion and bribery.
| | Aegon’s Code of Conduct sets out rules and guidelines that shape and govern the actions of all our employees. It also commits us to complying with all legal and regulatory requirements and to prevent insider dealing, corruption, and bribery.
In addition, in line with our Responsible Investment Policy and Framework, we engage with our portfolio companies on issues related to governance, including anti-corruption.
In line with our Vendor Code of Conduct, we score our suppliers for sustainability performance through the EcoVadis rating platform, which covers anti-corruption.
Aegon also has several relevant internal policies: Conflict of Interest Policy, Anti-Bribery and Corruption Policy, Financial Crime and Corruption Risk Policy, Insider Dealing Policy.
|
Aegon Integrated Annual Report 2021
| | |
| | Frameworks and initiatives
|
United Nations Sustainable Development Goals (SDGs)
In 2015, the United Nations adopted 17 Sustainable Development Goals (SDGs). These goals cover poverty reduction, education, gender equality, climate change and health. Accompanying each of these goals is a series of targets and indicators.
At Aegon, we are committed to supporting the UN SDGs, both as a financial services provider and as an investor. We recognize
that sustainable development is in the long-term interest of business and the global economy, but that a sustainable future for people and the planet will not be attainable without cooperation between the public and private sectors. Climate change and inclusion & diversity have been selected as priority themes in our sustainability vision, and as such our contributions to the SDGs relating to these themes have been detailed most comprehensively.
| | | | | | |
Sustainable Development Goal
| | Aegon’s contribution to relevant SDG targets in 2021 (examples)
|
| | End poverty in all its forms everywhere
| | | | By 2030, ensure that all men and women, in particular the poor and the vulnerable, have equal rights to economic resources, as well as access to basic services, ownership and control over land and other forms of property, inheritance, natural resources, appropriate new technology and financial services, including microfinance.
●
Aegon UK has partnered with the Initiative for Financial Wellbeing and Edinburgh University to launch the Financial Wellbeing Index, which helps advisors and employee benefits consultants provide personalized, needs-based advice toend-customers.
(Strengthening engagement and trust, page 27)●
As was the case in 2020, we prioritized helping our most vulnerable communities navigate theCOVID-19
pandemic and its economic consequences, with a specific focus on people who needed help handling their finances. (Investing in our communities, page 32) |
| | | | | |
| | | | | |
| | | | | | | | | | |
| | | |
Taxonomy-aligned activities – provided‘do-not-significant- harm’(DNSH) and social safeguards positive assessment: | |
| Percentage of
investments covered |
| | | |
| Percentage of
investments covered |
|
(1) Climate change mitigation | | | | | | | | | | |
| | | |
Turnover: | | | 0.07% | | | Transitional activities: (Turnover) | | | 0.00% | |
| | | |
CapEx: | | | 0.10% | | | Transitional activities: (CapEx) | | | 0.01% | |
| | | |
| | | | | | Enabling activities: (Turnover) | | | 0.04% | |
| | | |
| | | | | | | Enabling activities: (CapEx) | | | 0.05% | |
(2) Climate change adaptation | | | | | | | | | | |
| | | |
Turnover: | | | 0% | | | Enabling activities: (Turnover) | | | 0% | |
| | | |
CapEx: | | | 0% | | | Enabling activities: (CapEx) | | | 0% | |
| | | |
Template 1: Nuclear and fossil gas related activities | | | | | | | | | | |
| | | |
Nuclear energy related activities: | | | | | | | | | | |
| |
The undertaking carries out, funds or has exposures to research, development, demonstration and deployment of innovative electricity generation facilities that produce energy from nuclear processes with minimal waste from the fuel cycle. | | | Yes | |
The undertaking carries out, funds or has exposures to construction and safe operation of new nuclear installations to produce electricity or process heat, including for the purposes of district heating or industrial processes such as hydrogen production, as well as their safety upgrades, using best available technologies. | | | Yes | |
The undertaking carries out, funds or has exposures to safe operation of existing nuclear installations that produce electricity or process heat, including for the purposes of district heating or industrial processes such as hydrogen production from nuclear energy, as well as their safety upgrades. | | | Yes | |
Fossil gas related activities: | | | | |
The undertaking carries out, funds or has exposures to construction or operation of electricity generation facilities that produce electricity using fossil gaseous fuels. | | | Yes | |
The undertaking carries out, funds or has exposures to construction, refurbishment, and operation of combined heat/cool and power generation facilities using fossil gaseous fuels. | | | Yes | |
The undertaking carries out, funds or has exposures to construction, refurbishment and operation of heat generation facilities that produce heat/cool using fossil gaseous fuels. | | | Yes | |
| | | | | | | | | | | | | | | | | | | | | | | | |
| | | |
Template 2: Taxonomy-aligned economic activities (denominator) - CAPEX | | | CCM + CCA | | |
| Climate change mitigation
(CCM) |
| |
| Climate change adaptation
(CCA) |
|
| | | | | | |
Economic activities: | |
| Absolute
amount (EUR
million) |
| |
| Percentage of
investments
covered |
| |
| Absolute
amount (EUR
million) |
| |
| Percentage of
investments
covered |
| |
| Absolute
amount (EUR
million) |
| |
| Percentage of
investments
covered |
|
Amount and proportion of Taxonomy-aligned economic activity referred to in Section 4.26 of Annexes I and II to Delegated Regulation 2021/2139 in the denominator of CAPEX | | | - | | | | 0% | | | | - | | | | 0% | | | | - | | | | 0.0% | |
| | | | | | |
Amount and proportion of Taxonomy-aligned economic activity referred to in Section 4.27 of Annexes I and II to Delegated Regulation 2021/2139 in the denominator of CAPEX | | | 2.45 | | | | 0% | | | | 2.45 | | | | 0% | | | | - | | | | 0.0% | |
| | | | | | |
Amount and proportion of Taxonomy-aligned economic activity referred to in Section 4.28 of Annexes I and II to Delegated Regulation 2021/2139 in the denominator of CAPEX | | | 20.30 | | | | 0.01% | | | | 20.30 | | | | 0.01% | | | | - | | | | 0.0% | |
| | | | | | |
Amount and proportion of Taxonomy-aligned economic activity referred to in Section 4.29 of Annexes I and II to Delegated Regulation 2021/2139 in the denominator of CAPEX | | | 0.01 | | | | 0% | | | | 0.01 | | | | 0% | | | | - | | | | 0.0% | |
| | | | | | |
Amount and proportion of Taxonomy-aligned economic activity referred to in Section 4.30 of Annexes I and II to Delegated Regulation 2021/2139 in the denominator of CAPEX | | | 0.01 | | | | 0% | | | | 0.01 | | | | 0% | | | | - | | | | 0.0% | |
| | | | | | |
Amount and proportion of Taxonomy-aligned economic activity referred to in Section 4.31 of Annexes I and II to Delegated Regulation 2021/2139 in the denominator of CAPEX | | | - | | | | 0% | | | | - | | | | 0% | | | | - | | | | 0.0% | |
| | | | | | |
Amount and proportion of other Taxonomy-aligned economic activities not referred to in rows 1 to 6 above in the denominator of CAPEX | | | 259,398.95 | | | | 99.99% | | | | 259,390.32 | | | | 99.99% | | | | 8.63 | | | | 0.0% | |
Total applicable KPI - CAPEX | | | 259,421.73 | | | | 100.0% | | | | 259,413.09 | | | | 100.00% | | | | 8.63 | | | | 0.0% | |
502 | Annual Report on Form 20-F 2023
| | | | |
| | By 2030, build the resilience of the poor and those in vulnerable situations and reduce their exposure and vulnerability to climate-related extreme events and other economic, social and environmental shocks and disasters.
●
Together with the Aegon Transamerica Foundation in the United States, Aegon donated EUR 300,000 to supportCOVID-19
relief efforts in India. (Society, SupportingCOVID-19
relief efforts in India, page 31) |
| | To end hunger, achieve food security and improved nutrition and promote sustainable agriculture
| | | | By 2030, end hunger and ensure access by all people, in particular the poor and people in vulnerable situations, including infants, to safe, nutritious and sufficient food all year round.
●
Aegon UK supports five schools in Edinburgh with breakfast clubs, which provide children meals in the morning before school starts. (Aegon Integrated Annual Report 2020,, page 5) |
| | 3. Good health and well-being
Ensure healthy lives and promote well-being for all at all ages
| | | | By 2030, reduce by one third premature mortality fromnon-communicable
diseases through prevention and treatment and promote mental health and well-being.●
Aegon has developed a Future Ways of Working plan, covering most of Aegon’s global business units to help our people achieve a healthy and productive balance between office-based and remote working. The approach is based on globally agreed principles – hybrid working, office utilization and location, and employee benefits – that are translated locally. (Employees, page 27, Introducing our hybrid working model, page 28)EU Taxonomy |
| | | | | |
| | | | | |
| | | | | | | | | | | | | | | | | | | | | | | | |
| | | |
Template 2: Taxonomy-aligned economic activities (denominator) - turnover | | | CCM + CCA | | |
| Climate change mitigation
(CCM) |
| |
| Climate change adaptation
(CCA) |
|
| | | | | | |
Economic activities: | |
| Absolute
amount (EUR million) |
| |
| Percentage of
investments covered |
| |
| Absolute
amount (EUR million) |
| |
| Percentage of
investments covered |
| |
| Absolute
amount (EUR million) |
| |
| Percentage of
investments covered |
|
Amount and proportion of Taxonomy-aligned economic activity referred to in Section 4.26 of Annexes I and II to Delegated Regulation 2021/2139 in the denominator of turnover | | | - | | | | 0% | | | | - | | | | 0% | | | | - | | | | 0% | |
| | | | | | |
Amount and proportion of Taxonomy-aligned economic activity referred to in Section 4.27 of Annexes I and II to Delegated Regulation 2021/2139 in the denominator of turnover | | | - | | | | 0% | | | | - | | | | 0% | | | | - | | | | 0% | |
| | | | | | |
Amount and proportion of Taxonomy-aligned economic activity referred to in Section 4.28 of Annexes I and II to Delegated Regulation 2021/2139 in the denominator of turnover | | | 17.04 | | | | 0.01% | | | | 17.04 | | | | 0.01% | | | | - | | | | 0% | |
| | | | | | |
Amount and proportion of Taxonomy-aligned economic activity referred to in Section 4.29 of Annexes I and II to Delegated Regulation 2021/2139 in the denominator of turnover | | | 0.02 | | | | 0% | | | | 0.02 | | | | 0% | | | | - | | | | 0% | |
| | | | | | |
Amount and proportion of Taxonomy-aligned economic activity referred to in Section 4.30 of Annexes I and II to Delegated Regulation 2021/2139 in the denominator of turnover | | | 0.01 | | | | 0% | | | | 0.01 | | | | 0% | | | | - | | | | 0% | |
| | | | | | |
Amount and proportion of Taxonomy-aligned economic activity referred to in Section 4.31 of Annexes I and II to Delegated Regulation 2021/2139 in the denominator of turnover | | | - | | | | 0% | | | | - | | | | 0% | | | | - | | | | 0% | |
| | | | | | |
Amount and proportion of other Taxonomy-aligned economic activities not referred to in rows 1 to 6 above in the denominator of turnover | | | 259,404.66 | | | | 99.99% | | | | 259,400.96 | | | | 99.99% | | | | 3.70 | | | | 0% | |
| | | | | | |
Total applicable KPI - turnover | | | 259,421.73 | | | | 100% | | | | 259,418.03 | | | | 100% | | | | 3.70 | | | | 0% | |
| | | | | | | | | | | | | | | | | | | | | | | | |
| | | |
Template 3: Taxonomy-aligned economic activities (numerator) - CAPEX | | | CCM + CCA | | |
| Climate change mitigation
(CCM) |
| |
| Climate change adaptation
(CCA) |
|
| | | | | | |
Economic activities: | |
| Absolute
amount (EUR
million) |
| |
| Percentage of
investments
covered |
| |
| Absolute
amount (EUR
million) |
| |
| Percentage of
investments
covered |
| |
| Absolute
amount (EUR
million) |
| |
| Percentage of
investments
covered |
|
Amount and proportion of Taxonomy-aligned economic activity referred to in Section 4.26 of Annexes I and II to Delegated Regulation 2021/2139 in the numerator of CAPEX | | | - | | | | 0% | | | | - | | | | 0% | | | | - | | | | 0% | |
| | | | | | |
Amount and proportion of Taxonomy-aligned economic activity referred to in Section 4.27 of Annexes I and II to Delegated Regulation 2021/2139 in the numerator of CAPEX | | | 2.45 | | | | 1% | | | | 2.45 | | | | 1% | | | | - | | | | 0% | |
| | | | | | |
Amount and proportion of Taxonomy-aligned economic activity referred to in Section 4.28 of Annexes I and II to Delegated Regulation 2021/2139 in the numerator of CAPEX | | | 20.30 | | | | 7% | | | | 20.30 | | | | 7% | | | | - | | | | 0% | |
| | | | | | |
Amount and proportion of Taxonomy-aligned economic activity referred to in Section 4.29 of Annexes I and II to Delegated Regulation 2021/2139 in the numerator of CAPEX | | | - | | | | 0% | | | | - | | | | 0% | | | | - | | | | 0% | |
| | | | | | |
Amount and proportion of Taxonomy-aligned economic activity referred to in Section 4.30 of Annexes I and II to Delegated Regulation 2021/2139 in the numerator of CAPEX | | | - | | | | 0% | | | | - | | | | 0% | | | | - | | | | 0% | |
| | | | | | |
Amount and proportion of Taxonomy-aligned economic activity referred to in Section 4.31 of Annexes I and II to Delegated Regulation 2021/2139 in the numerator of CAPEX | | | - | | | | 0% | | | | - | | | | 0% | | | | - | | | | 0% | |
| | | | | | |
Amount and proportion of other Taxonomy-aligned economic activities not referred to in rows 1 to 6 above in the numerator of CAPEX | | | 254.30 | | | | 92% | | | | 245.67 | | | | 89% | | | | 8.63 | | | | 3% | |
| Total amount and proportion of Taxonomy-aligned economic activities in the numerator of CAPEX | | | 277.05 | | | | 100% | | | | 268.42 | | | | 97% | | | | 8.63 | | | | 3% | |
| | | | | | |
| | | Strengthen the implementation of the World Health Organization Framework Convention | Annual Report on Tobacco Control in all countries, as appropriate.●
Aegon N.V. has excluded tobacco from its investments to help address health concerns over smoking. (Policies and procedures, Aegon N.V. Responsible Investment Policy, page 355) |
| Form 20-F 2023 | 503 | | | Ensure inclusive and quality education for all and promote lifelong learning
| | | By 2030, ensure that all youth and a substantial proportion of adults, both men and women, achieve literacy and numeracy.
●
In 2021 Aegon contributed EUR 1.6 million towards financial education and literacy projects in the communities of our customers and employees. (Value created - Society - Corporate citizenship, page 355) |
| | Achieve gender equality and empower all women and girls
| | | | End all forms of discrimination against all women and girls everywhere.
●
Aegon N.V. has explicitly incorporated the theme of ‘Gender development’ into its biennial Human Rights Risk Assessment process. Consideration for gender equality is incorporated into numerous Aegon policies including the Code of Conduct and Aegon N.V. Responsible Investment Policy as a fundamental element of human rights. (Policies and procedures, Aegon N.V. Statement on Human Rights, Aegon N.V. Responsible Investment Policy, page 355) |
Aegon Integrated Annual Report 2021
| | | | |
| | FrameworksAbout Aegon Governance and initiatives
|
| | | | | | |
Sustainable Development Goal
| | Aegon’s contribution to relevant SDG targets in 2021 (examples)
|
| | 5. Gender equality (continued)
| | | | Ensure women’s full and effective participation and equal opportunities for leadership at all levels of decision-making in political, economic and public life.
|
| | | | | | ●
In June 2021, Aegon N.V. CEO Lard Friese pledged to the G20 EMPOWER (Alliance for Empowerment and Progression of Women’s Economic Representation) Initiative. (Inclusion and diversity, page 21) |
| | | | | | ●
Following Aegon surpassing its target for female representation in seniorrisk management in 2020 (32% representation against a 30% target), a higher target of 34% was set for 2021. Aegon reached this target by the end of the year, with 34% female representation. A renewed target of 36% has been set for 2022. Financial information Sustainability Inclusion and diversity, page 22) |
| | | | | |
| | | | | |
| | | | | | | | | | | | | | | | | | | | | | | | |
Template 3: Taxonomy-aligned economic activities (numerator) - turnover | | CCM + CCA | | | Climate change mitigation (CCM) | | | Climate change adaptation (CCA) | |
| Economic activities: | | Absolute
amount (EUR
million) | | | Percentage of
investments
covered | | | Absolute
amount (EUR
million) | | | Percentage of
investments
covered | | | Absolute
amount (EUR
million) | | | Percentage of
investments
covered | |
| | | | | | |
Amount and proportion of Taxonomy-aligned economic activity referred to in Section 4.26 of Annexes I and II to Delegated Regulation 2021/2139 in the numerator of turnover | | | - | | | | 0% | | | | - | | | | 0% | | | | - | | | | 0% | |
| | | | | | |
Amount and proportion of Taxonomy-aligned economic activity referred to in Section 4.27 of Annexes I and II to Delegated Regulation 2021/2139 in the numerator of turnover | | | - | | | | 0% | | | | - | | | | 0% | | | | - | | | | 0% | |
| | | | | | |
Amount and proportion of Taxonomy-aligned economic activity referred to in Section 4.28 of Annexes I and II to Delegated Regulation 2021/2139 in the numerator of turnover | | | 14.66 | | | | 8% | | | | 14.66 | | | | 8% | | | | - | | | | 0% | |
| | | | | | |
Amount and proportion of Taxonomy-aligned economic activity referred to in Section 4.29 of Annexes I and II to Delegated Regulation 2021/2139 in the numerator of turnover | | | - | | | | 0% | | | | - | | | | 0% | | | | - | | | | 0% | |
| | | | | | |
Amount and proportion of Taxonomy-aligned economic activity referred to in Section 4.30 of Annexes I and II to Delegated Regulation 2021/2139 in the numerator of turnover | | | 0.01 | | | | 0% | | | | 0.01 | | | | 0% | | | | - | | | | 0% | |
| | | | | | |
Amount and proportion of Taxonomy-aligned economic activity referred to in Section 4.31 of Annexes I and II to Delegated Regulation 2021/2139 in the numerator of turnover | | | - | | | | 0% | | | | - | | | | 0% | | | | - | | | | 0% | |
| | | | | | |
Amount and proportion of other Taxonomy-aligned economic activities not referred to in rows 1 to 6 above in the numerator of turnover | | | 165.65 | | | | 92% | | | | 161.95 | | | | 90% | | | | 3.70 | | | | 2% | |
| | | | | | |
| Total amount and proportion of Taxonomy-aligned economic activities in the numerator of turnover | | | 180.31 | | | | 100% | | | | 176.61 | | | | 98% | | | | 3.70 | | | | 2% | |
504 | Annual Report on Form 20-F 2023
| | | | |
| | Adopt and strengthen sound policies and enforceable legislation for the promotion of gender equality and the empowerment of all women and girls at all levels.•
●
Aegon UK publishes its annual gender pay gapas required by the UK Equality Act 2010 (Gender Pay Gap Information) Regulations 2017. |
| | 6. Clean water and sanitation
Ensure availability and sustainable management of water and sanitation for all
| | | | By 2020, protect and restore water-related ecosystems, including mountains, forests, wetlands, rivers, aquifers and lakes.•
●
The Aegon N.V. Responsible Investment Policy incorporates the company position on biodiversity, which specifically covers management for availability of water resources and their pollution. Furthermore, the Aegon N.V. Vendor Code of Conduct sets the standards for the business relationship between Aegon and its vendors in order to enable Aegon manage the most material ESG risks associated with our procurement of goods and services, specifically including biodiversity. (Policies and procedures, pages 355 and 356) |
| | 7. Affordable and clean energy
Ensure access to affordable, reliable, sustainable and modern energy for all
| | | | By 2030, ensure universal access to affordable, reliable and modern energy services.•
●
Aegon the Netherlands has introduced a new ‘green’ mortgage to help people finance energy-efficient home improvements. (2021 milestones, page 4, Enhancing our propositions, page 26) |
| | 8. Decent work and economic growth
Promote sustained, inclusive and sustainable economic growth, full and productive employment and decent work for all
| | | | Promote development-oriented policies that support productive activities, decent job creation, entrepreneurship, creativity and innovation, and encourage the formalization and growth ofmicro-,
small- and medium-sized enterprises, including through access to financial services.●
Knab, Aegon the Netherlands’ digital banking platform provides entrepreneurs with an extensive online library for topics related to finance and entrepreneurship through their Knab Bieb. (Strengthening engagement and trust, page 27) |
| | | | | | By 2030, achieve full and productive employment and decent work for all women and men, including for young people and persons with disabilities, and equal pay for work of equal value.
●
Aegon UK publishes its annual gender pay gapas required by the UK Equality Act 2010 (Gender Pay Gap Information) Regulations 2017.●
In the Netherlands, Aegon runs ‘Silver Starters’, a learning program for entrepreneurs aged 50 and over.(Society - Adapting to the modern retirement landscape, page 32) |
| | | | | | Take immediate and effective measures to eradicate forced labour, end modern slavery and human trafficking and secure the prohibition and elimination of the worst forms of child labour, including recruitment and use of child soldiers, and by 2025 end child labour in all its forms.
EU Taxonomy |
| | | | | |
| | | | | |
●
Aegon N.V. has explicitly incorporated the themes of forced and child labor into its Statement on Human Rights and biennial Human Rights Risk Assessment process. Consideration for these specific themes (and wider human rights concerns) are also incorporated into numerous Aegon policies including the Code of Conduct, Aegon N.V. Responsible Investment Policy and the Vendor Code of Conduct. (Policies and procedures, Aegon N.V. Statement on Human Rights, Aegon N.V. Responsible Investment Policy, Aegon N.V. Vendor Code of Conduct pages353-356)