As filed with the Securities and Exchange Commission on
April 29
●
] 2024UNITED STATES SECURITIES AND EXCHANGE COMMISSION
Washington, DC 20549
FORM
20-F
☐
REGISTRATION STATEMENT PURSUANT TO SECTION 12(b) OR (g) OF THE SECURITIESEXCHANGE
ACT OF 1934or
☒
ANNUAL REPORT PURSUANT TO SECTION 13 OR 15(d) OF THE SECURITIES EXCHANGE ACT OF 1934For the fiscal year
ended December 31, 2021
2023 oror
☐
TRANSITION REPORT PURSUANT TO SECTION 13 OR 15 (d) OF THE SECURITIES EXCHANGE ACT OF 1934
or
☐
SHELL COMPANY REPORT PURSUANT TO SECTION 13 OR 15(d) OF THE SECURITIES EXCHANGE ACT OF 1934
Date of event requiring this shell company report______________report
For the transition period from _______________ ________________
to
Commission file number:
1-16269
AMÉRICA MÓVIL, S.A.B. DE C.V.
(exact name of registrant as specified in its charter)
America Mobile
(translation of registrant’s name into English)
United Mexican States
(jurisdiction of incorporation)
Lago Zurich 245, Plaza Carso / Edificio Telcel, Colonia Ampliación Granada, Miguel Hidalgo, 11529, Mexico City, Mexico
(address of principal executive offices)
Daniela Lecuona Torras
Lago Zurich 245,
Plaza Carso
/ Edificio Telcel, Piso 16, Colonia Ampliación Granada, Miguel Hidalgo 11529 Mexico City, Telephone:E-mail:
daniela.lecuona@americamovil.com(name, telephone,
e-mail
and/or facsimile number and address of company contact person)Securities registered pursuant to Section 12(b) of the Act:
Shares, without par value | New York Stock Exchange | |||
3.625% Senior Notes Due 2029 | AMX29 | New York Stock Exchange | ||
2.875% Senior Notes | AMX30 | New York Stock Exchanget | ||
| 4.700% Senior Notes Due 2032 | AMX32 | New York Stock Exchange | ||
6.375% Senior Notes Due 2035 | AMX35 | New York Stock Exchange | ||
6.125% Senior Notes Due 2037 | AMX37 | New York Stock Exchange | ||
6.125% Senior Notes Due 2040 | AMX40 | New York Stock Exchange | ||
4.375% Senior Notes Due 2042 | AMX42 | New York Stock Exchange | ||
4.375% Senior Notes Due 2049 | AMX49 | New York Stock Exchange |
Securities registered pursuant to Section 12(g) of the Act: None
Securities for which there is a reporting obligation pursuant to Section 15(d) of the Act: None
The number of outstanding shares of each of the registrant’s classes of capital or common stock as of December 31, 2021:2023:
| Indicate by check mark if the registrant is a well-known seasoned issuer, as defined in Rule 405 of the Securities Act. | X | |||||||||
| No | ||||||||||
If this report is an annual or transition report, indicate by check mark if the registrant is not required to file reports pursuant to Section 13 or 15(d) of the Securities Exchange Act of 1934. | Yes | No | ||||||||
Indicate by check mark whether the registrant: (1) has filed all reports required to be filed by Section 13 or 15(d) of the Securities Exchange Act | Yes | No | ||||||||
Indicate by check mark whether the registrant has submitted electronically every Interactive Data File required to be submitted pursuant to Rule 405 of Regulation S-T (§ 232.405 of this Chapter) during the preceding 12 months (or for such shorter period that the registrant was required to submit such files). | X | |||||||||
| No | ||||||||||
Indicate by check mark whether the registrant is a large accelerated filer, an accelerated filer, a non-accelerated filer, or an emerging growth company. See the definitions of “large accelerated filer,” “accelerated filer,” and “emerging growth company” in Rule 12b-2 of the Exchange Act | ||||||||||
X | ||||||||
Large accelerated filer |
| Accelerated filer | Non-accelerated filer | Emerging | ||||||||||||||
Indicate by check mark whether the registrant has filed a report on and attestation to its management’s assessment of the effectiveness of its internal | Yes | No | ||||||
If securities are registered pursuant to Section 12(b) of the Act, indicate by check mark whether the financial statements of the registrant included in the filing reflect the correction of an error to previously issued financial statements. | Yes | No | X | |||||
Indicate by check mark whether any of those error corrections are restatements that required a recovery analysis of incentive-based compensation received by any of the registrant’s executive officers during the relevant recovery period pursuant to § 240.10D-1(b). | Yes | No | X | |||||
Indicate by check mark which basis of accounting the registrant has used to prepare the financial statements
included
in this filingU.S. GAAP
5   We prepared our audited consolidated financial statements included in this annual report in accordance with International Financial Reporting Standards as issued by the International Accounting Standards Board (“IFRS”). The selected financial information should be read in conjunction with, and is qualified in its entirety by reference to, our audited consolidated financial statements. We present our audited consolidated financial statements in Mexican pesos (“Ps.”). This annual report contains translations of various Mexican peso amounts into U.S. dollars at specified rates solely for your convenience. You should not construe these translations as representations that the Mexican peso amounts actually represent the U.S. dollar amounts or could be converted into U.S. dollars at the rate indicated. Unless otherwise indicated, we have translated U.S. dollar amounts from Mexican pesos at the exchange rate of Ps.16.8935 to U.S.$1.00, which was the rate reported by Banco de México on December 29, 2023, as published in the Official Gazette of the Federation ( Diario Oficial de la Federación
6

7   Table of Contents    HISTORY AND CORPORATE INFORMATION  América Móvil, S.A.B. de C.V. (“América Móvil,” “we” or the “Company”) is a Sociedad Anónima Bursátil de Capital Variable organized under the laws of Mexico. We were established in 2000 when Teléfonos de México, S.A.B. de C.V. (“Telmex”), a fixed-line Mexican telecommunications operator privatized in 1990, spun off to us its wireless operations in Mexico and other countries. We have made significant acquisitions throughout Latin America, the United States, the Caribbean and Europe, and we have also expanded our businesses organically. Our principal executive offices are located at Lago Zurich 245, Plaza Carso / Edificio Telcel, Colonia Ampliación Granada, Miguel Hidalgo, 11529, Mexico City, Mexico. Our telephone number at this location is (5255) 2581-3700. BUSINESS OVERVIEW We provide telecommunications services in Our largest operations are in Mexico and Brazil, which together account for over half of our total RGUs and where we have the largest market share based on RGUs. We We 10 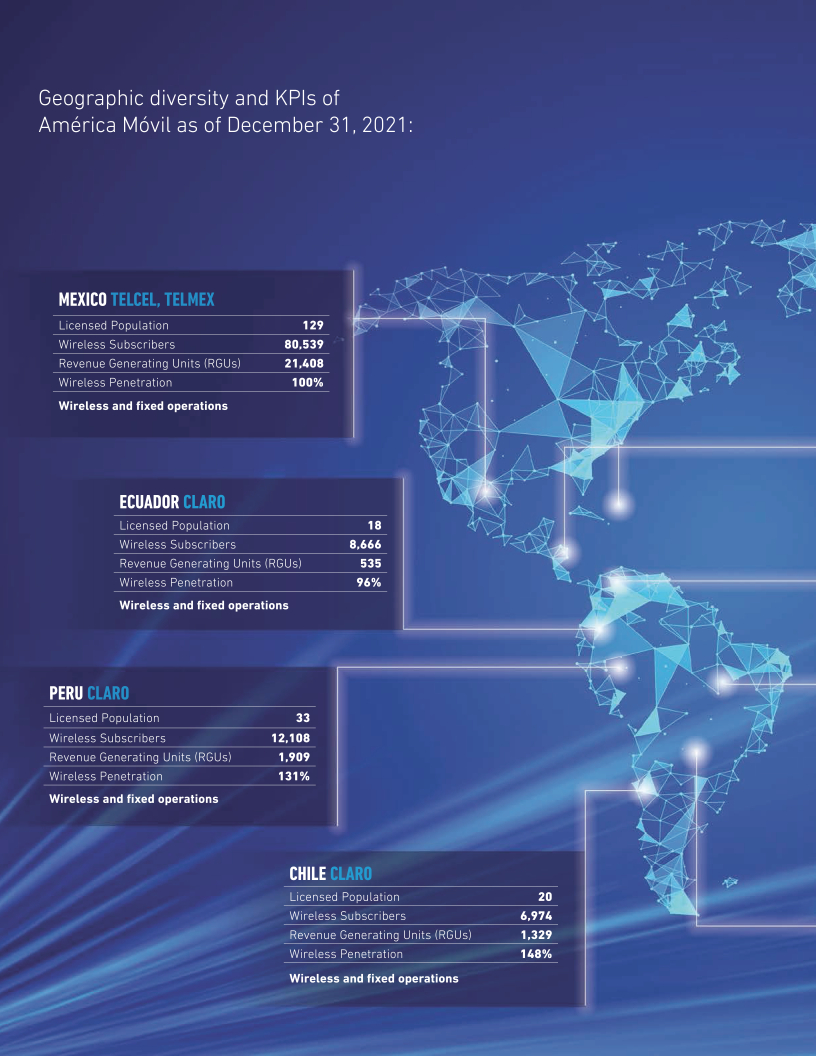  11  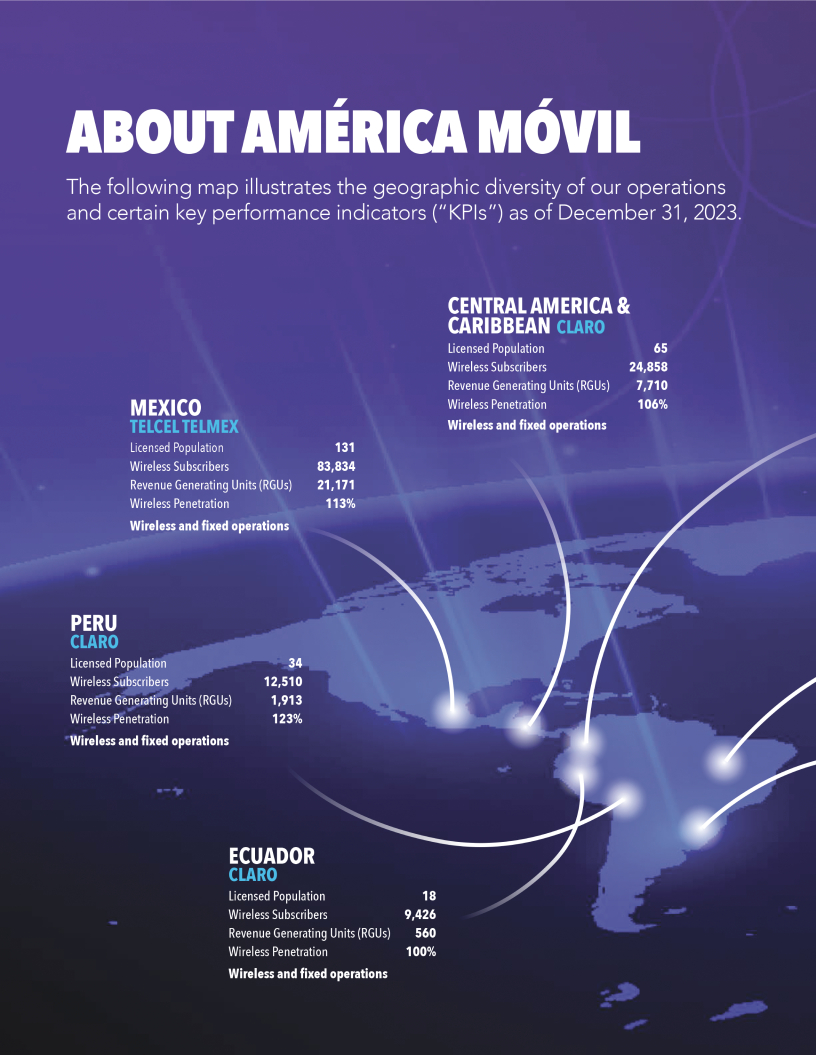 12 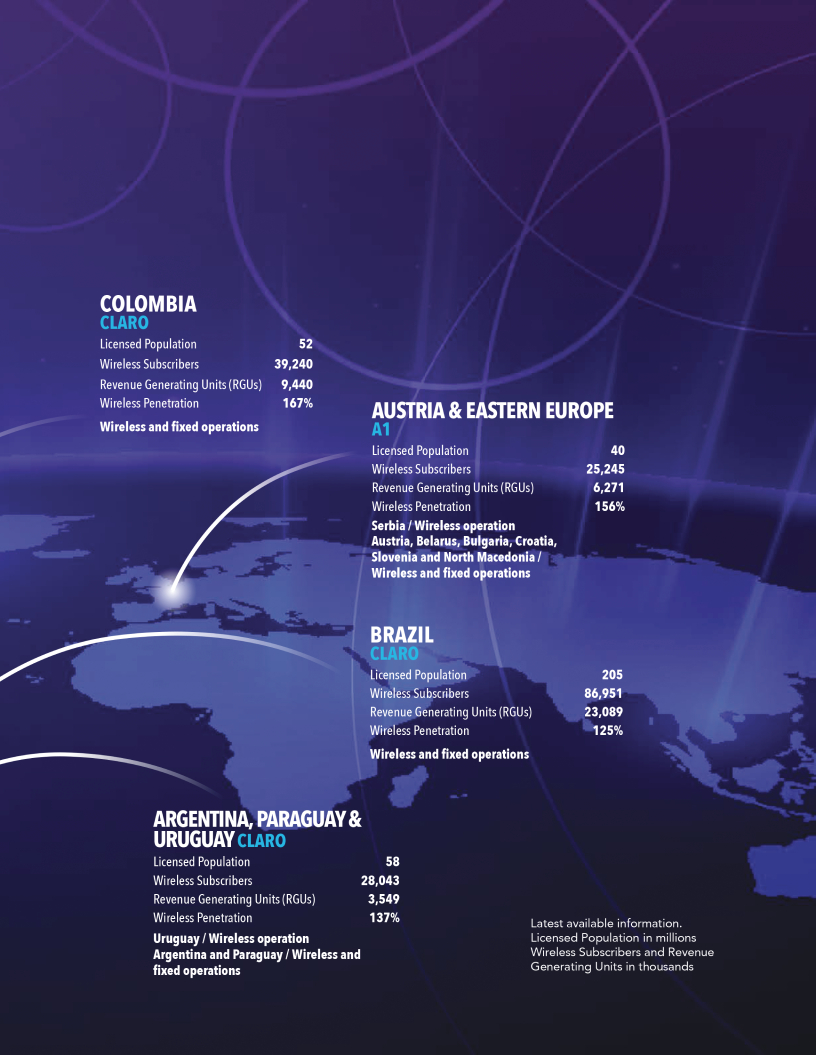 13  KEY PERFORMANCE INDICATORS Our customers generate revenue for us by purchasing one or more of our services. We perservice basis. Each wireless subscription, which includesMexico Wireless; Mexico Fixed; Brazil; Colombia; Southern Cone (Argentina) Southern Cone Andean Region (Ecuador and Peru); Central America (Costa Rica, El Salvador, Guatemala, Honduras the Caribbean (the Dominican Republic and Puerto Rico); and Europe (Austria, Belarus, Bulgaria, Croatia, North Macedonia, Serbia and Slovenia).
PRINCIPAL BRANDS We operate in all of our geographic segments under the Claro brand name, except in Mexico and Europe, where we principally do business under the brand names listed below.
14  SERVICES AND PRODUCTS We offer, and derive revenues from, a wide range of services and products that vary by market, including wireless voice, wireless data and value-added services, fixed voice, fixed data, broadband and over-the-top Wireless Operations In Revenues from wireless voice services primarily include charges from monthly subscriptions, usage charges billed to customers and usage charges billed to other service providers for calls completed on our network. The primary drivers of revenues from monthly subscription charges are the number of total RGU’s and the price of our service packages. The primary drivers of revenues from usage charges are airtime, international and long-distance calls and interconnection fees. Revenues from wireless data services primarily include charges for data, cloud, internet, machine-to-machine, VOICE AND DATA. Our wireless subsidiaries provide voice communication services across the countries in which they operate. We offer international roaming services to our wireless subscribers through a network of cellular service providers with which our wireless subsidiaries have entered into international roaming agreements around the world, and who provide GSM, 3G, 4G-LTE and 5G roaming services.The voice and data plans are either “postpaid,” where the customer is billed monthly for the previous month, or “prepaid,” where the customer pays in advance for a specified volume of use over a specified period. Postpaid plans increased as a percentage of the wireless base from Our wireless voice services are offered under a variety of plans to meet the needs of different market segments. In addition, we often bundle wireless data communications services together with wireless voice services. Our wireless subsidiaries had approximately  2023. Prepaid customers typically generate lower levels of usage and are often unwilling or financially ineligible to purchase postpaid plans. Our prepaid plans have been instrumental to increase wireless penetration in Latin America and Eastern Europe to levels similar to those of developed markets. Additionally, prepaid plans entail little to no risk of non-payment, as well as lower customer acquisition costs and billing expenses, compared to the average postpaid plan.In general, our average rates per minute of wireless voice (“ARPM”) are very competitive for both prepaid and postpaid plans. In addition, the plans we offer our retail customers include selective discounts and promotions that reduce the rates our customers pay. VALUE-ADDED SERVICES. As part of our wireless data business, our subsidiaries offer value-added services that include Internet access, messaging and other wireless entertainment and corporate services through GSM/EDGE, 3G, Internet services include roaming capability and wireless Internet connectivity for feature phones, smartphones, tablets and laptops, including data transmission, e-mail services, instant messaging, content streaming and interactive applications. For example, in Mexico, our website for our wireless services (www.telcel.com) through Radiomóvil Dipsa, S.A. de machine-to-machine Fixed Operations In 15 fixed operations represented approximately Revenues from fixed voice services primarily include charges from monthly subscriptions, usage charges billed to customers and usage charges billed to other service providers for calls completed on our network. The primary drivers of revenues from monthly subscription charges are the number of total RGU’s and the price of our service packages. The primary drivers of revenues from usage charges are airtime, international and long-distance calls and interconnection fees. Revenues from fixed data services primarily include charges for data, cloud, broadband, machine-to-machine VOICE. Our fixed voice services include local, domestic and international long-distance, under a variety of plans to meet the needs of different market segments, specifically tailored to our residential and corporate clients. DATA. We offer data services, including data centers, data administration and hosting services to our residential and corporate clients under a variety of plans. BROADBAND. We provide residential broadband access through hybrid fiber-coaxial fiber-optic cable. These services are typically bundled with voice services and are competitively priced as a function of the desired or available speed. As a complement to these services, we offer a number of products such as home networking and smart home services.IT SOLUTIONS. Our subsidiaries provide a number of different IT solutions for small businesses and large Pay TV We offer Pay TV through cable and satellite TV subscriptions to both retail and corporate customers under a variety of plans. As of December 31, Pay TV revenues consist primarily of charges from subscription services, additional programming, including OTT Services We sell video, audio and other media content that is delivered through the internet directly from the content provider to the viewer or end user. Our most important service is ClaroVideo, an on-demand internet streaming video provider with more than Subscription video on demand, providing unlimited access to Transactional video on demand and electronic sell-through, offering the option to rent or buy new content releases; and Add-on services such as subscription and other OTT services through a platform payment system, including access to FOX, HBO, Noggin and Paramount+, among others.We also offer an advertised and unlimited music streaming and downloading service in Sales of Equipment and Accessories Sales of equipment and accessories, and associated revenues, include the sale of handsets, accessories, IoT devices, and other equipment such as smart devices. Other Services Other services, and revenues from such services, include other businesses such as software development, call center services, entertainment content and news, telephone directories, advertising, cybersecurity services, mobile banking and corporate IT solutions. 16 Services and Products by Country The following table is a summary of our principal services rendered and products produced as of December 31,
  Our networks are one of our main competitive advantages. Today, we own and operate one of the largest integrated platforms based on our covered population across INFRASTRUCTURE For the year ended December 31, As of December 31, Cell sites: 110,824 sites with 2G, 3G, spin-off to Sitios Latam of our telecommunications towers and other related passive infrastructure in Latin America outside of spin-off. Between February and July 2023, we completed the sale of all of our telecommunications towers in the Dominican Republic and Peru. See “Acquisitions, Other Investments and Divestitures.”Fiber-optic network: More than Submarine cable systems: Capacity in more than 197 thousand km of submarine cables, including the AMX-1 submarine cable that extends Satellites: Five. Star One S.A. (“Star One”) has the most extensive satellite system in Latin America, with a fleet that covers the United States, Mexico, Central America and South America. We use these satellites to supply capacity for DTH services for Claro TV throughout Brazil and in other DTH Operations, as well as cellular backhaul, video broadcast and corporate data networks. Data centers: 43. We use our data centers to manage a number of cloud solutions, such as Infrastructure as a
TECHNOLOGY Our primary wireless networks use GSM/EDGE, 3G, We transmit wireless calls and data through radio frequencies that we use under spectrum licenses. Spectrum is a limited resource, and, as a result, we may face spectrum and capacity constraints on our wireless network. We continue to invest significant capital in expanding our network capacity and reach and to address spectrum and capacity constraints on a market-by-market The table below presents a summary of the population covered by our network, by country, as of December 31,
  We operate in an intensely competitive industry. Competitive factors within our industry include pricing, brand recognition, service and product offerings, customer experience, network coverage and quality, development and deployment of technologies, availability of additional spectrum licenses and regulatory developments. Our principal competitors differ, depending on the geographical market and the types of service we offer. We compete against other providers of wireless, broadband and Pay TV that operate on a multi-national level, such as AT&T Inc., Teléfonica and Millicom, as well as various providers that operate on a nationwide level, such as Telecom Argentina in Argentina and Telecom Italia in Brazil. Competition remains intense as a result of saturation in the fixed and wireless market, increased network investment by our competitors, the development and deployment of new technologies, the introduction of new products and services, new market entrants, the availability of additional spectrum, both licensed and unlicensed, and regulatory changes. The effects of competition on our subsidiaries depend, in part, on the size, service offerings, financial strength and business strategies of their competitors, regulatory developments and the general economic and business climate in the countries in which they operate, including demand growth, interest rates, inflation and exchange rates. The effects could include loss of market share and pressure to reduce rates. See “Regulation” under Part VI and “Risk Factors” under Part III of this annual report.   Geographic diversification has been a key to our financial success, as it has provided for greater stability in our cash flow and profitability and has contributed to our strong credit ratings. In recent years, we have been evaluating the expansion of our operations to regions outside of Latin America. We believe that Europe and other areas beyond Latin America present opportunities for investment in the telecommunications sector that could benefit us and our shareholders over the long term. We continue to seek ways to optimize our portfolio, including by finding investment opportunities in telecommunications and related companies worldwide, including in markets where we are already present, and we often have several possible acquisitions under consideration. We may pursue opportunities in Latin America or in other areas in the world. Some of the assets that we acquire may require significant funding for capital expenditures. We can give no assurance as to the extent, timing or cost of such investments. We also periodically evaluate opportunities for dispositions, in particular for businesses and in geographies that we no longer consider strategic. In December 2020, our Brazilian subsidiary, Claro S.A. (“Claro Brasil”), together with two other
On August 8, 2022, we completed the spin-off  
On catch-up right on or before August 1, 2024 to cure any failure to fund our or LLA’s respective portions of the Commitment in order to maintain ClaroVTR as a
On February 6, 2023, we entered into a definitive agreement with Österreichische Beteiligungs AG (“OBAG”) with respect to OBAG’s and América Móvil’s participations in Telekom Austria AG (“Telekom Austria” or “TKA”) (the “TKA Shareholders Agreement”), which became effective on February 6, 2023. The 10-year term from February 2, 2023 and ensures América Móvil’s leadership and control over Telekom Austria Group by providing América Móvil with the spin-off of the mobile towers in most of the countries in which TKA operates, including € 500 million, five-year bullet loan on behalf of EuroTeleSites AG (“EuroTeleSites”), the company designated to own TKA’s towers after thespin-off. On July 6, 2023, EuroTeleSites launched a€ 500 million 5.25% five-year bond. The five-year bullet loan and spin-off of TKA’s tower business, in all countries in which TKA operates, other than Belarus, was approved by the shareholders of TKA in an extraordinary shareholders’ meeting on August 1, 2023. On September 22, 2023, TKA completed thespin-off of its telecommunications towers and other related passive infrastructure in all countries in which TKA operates, other than Belarus, and listed the shares of EuroTeleSites on the Vienna Stock Exchange. As part of thespin-off, TKA contributed to EuroTeleSites net total assets of€ 290 million in the form of capital stock, assets and liabilities, mainly consisting of the shares of TKA’s subsidiary. Both of TKA and EuroTeleSites are indirect subsidiaries of América Móvil over which América Móvil retains a controlling interest.For additional information on our acquisitions and investments, see Note 12 to our audited consolidated financial statements included in this annual report.   MARKETING We advertise our services and products through different channels with consistent and distinct branding and targeted marketing. We advertise via print, radio, television, digital media, sports event sponsorships and other outdoor advertising campaigns. In We build on the strength of our well-recognized brand names to increase consumer awareness and customer loyalty. Building brand recognition is crucial for our business, and we have managed to position our brands as those of a premium carrier in most countries where we operate. According to the year-end SALES AND DISTRIBUTION Our extensive sales and distribution channels help us attract new customers and develop new business opportunities. We primarily sell our services and products through a network of retailers and service centers for retail customers and a dedicated sales force for corporate customers, with more than CUSTOMER SERVICE We give priority to providing our customers with quality customer care and support. We focus our efforts on constantly improving our customers’ experience by leveraging our commercial offerings and our sales and distribution networks. Customers may make inquiries by calling a toll-free telephone number, accessing our subsidiaries’ web sites and social media accounts or visiting one of the customer sales and service centers located throughout the countries we serve.  21      Discontinued Operations On November 23, 2021, we completed the sale of our U.S. operations to Verizon, as previously disclosed in our press release furnished on a report on Form 6-K on November 23, 2021. As a result of the sale of TracFone, in accordance with IFRS 5, the operations of TracFone are classified as discontinued operations for the reporting periods prior to 2022 presented in the consolidated financial information included in this annual report. Accordingly, results are presented in the “profit (loss) after tax for the year from discontinued operations” in the consolidated financial information included in this annual report. Operating and financial information presented herein therefore excludes TracFone, including for periods prior to the sale.On July 1, 2022, we completed the sale of our Panamanian operations to Cable & Wireless Panama, S.A., an affiliate of LLA, as previously disclosed in our press release furnished on a report on Form 6-K on July 1, 2022. As a result of the sale of Claro Panama, in accordance with IFRS 5, the operations of Claro Panama are classified as discontinued operations for the reporting periods prior to 2023 presented in the consolidated financial information included in this annual report. Accordingly, where applicable, results are presented in the “profit (loss) after tax for the year from discontinued operations” in the consolidated financial information included in this annual report. Operating and financial information presented herein therefore excludes Claro Panama, including for periods prior to the sale.On October 6, 2022, we entered into an agreement to combine our Chilean operations with LLA in order to create ClaroVTR, a 50:50 joint venture, as a result of which Claro Chile ceased to be our wholly owned subsidiary, as previously disclosed in our press release furnished on a report on Form Segments We have operations in The factors that drive our financial performance differ in the various countries where we operate, including Constant Currency Presentation Our financial statements are presented in Mexican pesos, but our operations outside Mexico account for a significant portion of our operating revenues. Currency variations between the Mexican peso and the currencies of our non-Mexican subsidiaries, especially the Euro, U.S. dollar, Brazilian real, Colombian peso and Argentine peso, affect our results of operations as reported in Mexican pesos. In the following discussion regarding our operating results, we include adiscussion of the change in the different components of our revenues between periods at constant exchange rates, i.e., using the same exchange rate from the year end of the prior fiscal year to translate the local-currency results of our non-Mexican operations for both periods. We believe that this additional information helps investors better understand the performance of ournon-Mexican operations and their contribution to our consolidated results.All comparisons at constant exchange rates in our consolidated figures exclude Argentina. Our Argentine subsidiary is subject to the accounting guidelines applicable to hyperinflationary economies, with all the accounting variables expressed in real terms at constant Argentine pesos. Pursuant to IFRS rules, for consolidation purposes in our consolidated financial statements—with no other economy considered hyperinflationary—Argentine peso figures expressed in constant Argentine peso terms at the prevailing prices at the end of a reporting period must be converted into Mexican pesos at the exchange rate observed at the end of such reporting period. Due to hyperinflationary conditions in Argentina and the magnitude of the Argentine peso’s depreciation, the application of the above-referenced norm generates unusual effects. Therefore, we exclude Argentina from all consolidated figures cited at constant exchange rates. 24  Effects of Exchange Rates Our results of operations are affected by changes in currency exchange rates. In Since most of our debt is issued by América Móvil out of Mexico, to the extent that our functional currency, the Mexican peso, appreciates or depreciates against the currencies in which our indebtedness is denominated, we may incur foreign exchange gains or losses that are recorded as Changes in exchange rates also affect the fair value of derivative financial instruments that we use to manage our currency-risk exposure, which are generally not accounted for as hedging instruments. In Effects of Regulation We operate in a regulated industry. Our results of operations and financial condition have been, and will continue to be, affected by regulatory actions and changes. Significant regulatory developments are presented in more detail in “Regulation” under Part VI and “Risk Factors” under Part III of this annual report. Comparison of Results of Operations Between Discussions of year-over-year comparisons between 20-F for the fiscal year ended December 31, No. 001-16269). Due to classifying Claro Panama’s and Claro Chile’s operations as discontinued operations for all years prior to 2023 presented in the consolidated financial information included in this report, the year-over-year comparisons presented in our Form20-F for the fiscal year ended December 31, 2022, as filed on May 1, 2023, may not align with the figures presented herein for the same periods. Composition of Operating Revenues In Pay TV, Seasonality of our Business Our business is subject to a certain degree of seasonality, characterized by a higher number of new customers during the fourth quarter of each year. We believe this seasonality is mainly driven by the Christmas shopping season. General Trends Affecting Operating Results Our results of operations in intense competition, with growing costs for marketing and subscriber acquisition and retention, as well as developments in the telecommunications regulatory environment; growing demand for data services over fixed and wireless networks, as well as for smartphones and devices with stronger data service capabilities; declining demand for voice services; declining demand for traditional Pay TV services; increasing capital expenditures our continued strategic focus on instability in economic conditions caused by political uncertainty, inflation and volatility in financial markets and exchange rates. These trends are broadly characteristic of our businesses in all regions in recent years, and they have affected comparable telecommunications providers as well.   CONSOLIDATED RESULTS OF OPERATIONS FOR As described above under “Constant Currency Presentation,” due to hyperinflationary conditions in Argentina, for comparative purposes, our consolidated results of operations at constant exchange rates exclude Argentina. Operating Revenues Total operating revenues for SERVICE REVENUES. Service revenues for SALES OF EQUIPMENT. Sales of equipment revenues for Operating Costs and Expenses TOTAL OPERATING COSTS AND EXPENSES. Total operating costs and expenses for COST OF SALES AND SERVICES. Cost of sales and services higher-end smartphones corporate network, IT services and network maintenance COMMERCIAL, ADMINISTRATIVE AND GENERAL EXPENSES. Commercial, administrative and general expenses for rights-of-use (i.e., concessions), improvements to customer service centers and advertising.OTHER EXPENSES. Other expenses for DEPRECIATION AND AMORTIZATION. Depreciation and amortization for rights-of-use Operating Income Operating income for Non-Operating ItemsNET INTEREST EXPENSE. Net interest expense (interest expense less interest income) for FOREIGN CURRENCY EXCHANGE 26  currencies against the VALUATION OF DERIVATIVES, INTEREST COST FROM LABOR OBLIGATIONS AND OTHER FINANCIAL ITEMS, NET. We recorded a net loss of INCOME TAX. Our income tax expense Our effective corporate income tax rate as a percentage of profit before income tax was Net Profit We recorded a net profit of our continuing operations of SEGMENT RESULTS OF OPERATIONS We discuss below the operating results of each reportable segment. Notes 2. z) and 23 to our audited consolidated financial statements describe how we translate the financial statements of our non-Mexican subsidiaries. Exchange rate changes between the Mexican peso and the currencies in which our subsidiaries operate affect our reported results in Mexican pesos and the comparability of reported results between periods.The following table sets forth the exchange rates used to translate the results of our most significant non Mexican operations, as expressed in Mexican pesos per foreign currency unit, and the change from the rate used in the prior
The tables below set forth operating revenues and operating income for each of our segments for the years indicated.

The following discussion addresses the financial performance of each of our reportable segments by comparing results for Each reportable segment includes all income, cost and expense eliminations that occurred between subsidiaries within the reportable segment. The Mexico Wireless segment also includes corporate income, costs and expenses. revenues, segment operating income and segment operating margin, respectively, minus (i) certain intersegment transactions, (ii) for our non-Mexican segments, the effects of non-IFRS financial measures, presented herein to the most directly comparable financial measures calculated and presented in accordance with IFRS. We have provided thenon-IFRS financial measures herein, which are not calculated or presented in accordance with IFRS, as supplemental information and in addition to the financial measures that are calculated and presented in accordance with IFRS.These supplemental non-IFRS financial measures are presented because management has evaluated our financial results both including and excluding the adjusted items and believes that the supplementalnon-IFRS financial measures presented provide additional perspective and insights when analyzing our core operating performance from period to period and trends in our historical operating results. These supplementalnon-IFRS financial measures should not be considered superior to, as a substitute for or as an alternative to, and should be considered in conjunction with, the IFRS financial measures presented herein.Except for the Southern Cone – Argentina segment, comparisons in the following discussion are calculated using figures in Mexican pesos. For the Southern Cone – Argentina segment only, due to hyperinflationary conditions in Argentina, comparisons in the following discussion are calculated using figures in constant Argentine peso terms, i.e., adjusted for inflation in accordance with International Accounting Standard (“IAS”) 29 Financial Reporting in Hyperinflationary Economies (“IAS 29”), and must be converted into Mexican pesos at the exchange rate observed at the end of the period per IFRS rules, as described above under “Constant Currency Presentation.” Discussions of year-over-year comparisons between 20-F for the fiscal year ended December 31,  2023 COMPARED TO 2022 Mexico Wireless The number of prepaid wireless Segment operating revenues for Segment operating income for Segment operating margin was Mexico Fixed The number of fixed voice RGUs in Mexico for Segment operating revenues for principally reflects Segment operating income for Segment operating margin was Brazil The number of prepaid wireless Segment operating revenues for 2023 decreased by 2.4% over 2022. Adjusted segment operating revenues were Ps.178.2 billion in 2023 and Ps.166.0 billion in 2022, after giving effect to adjustments of Ps.11.5 billion and Ps.(4.9) billion, respectively, for intersegment transactions and the effects of foreign currency translation. This represents an increase of 7.4% in adjusted segment operating revenues in 2023 as compared to 2022, which principally reflects stronger performance in prepaid, postpaid, and broadband services, partially offset by fixed voice and Pay TV.  Segment operating Segment operating margin was Colombia The number of prepaid wireless Segment operating revenues for Segment operating income for Segment operating margin was fluctuations on U.S. dollar-denominated costs such as content and network maintenance, and expenses linked to inflation, such as electric energy costs. Southern Cone – Argentina As described above under “Interperiod Segment Comparisons,” due to hyperinflationary conditions in Argentina, comparisons in the following discussion are calculated using figures in constant Argentine peso terms, i.e., adjusted for inflation in accordance with IAS 29. The number of prepaid wireless subscriptions for 2023 increased by 5.2% over 2022, and the number of postpaid wireless subscriptions increased by 3.2%, resulting in an Segment operating revenues for 2023 decreased by 8.2% over 2022. Adjusted segment operating revenues were Ps.18.9 billion in 2023 and Segment operating income for 2023 decreased by 38.6% over 2022. Adjusted segment operating income was Ps.6.2 billion in 2023 and Ps.6.6 billion in 2022, after giving effect to adjustments of Ps.5.7 billion and Ps.4.0 billion, respectively, for intersegment transactions and the effects of foreign currency translation. This represents a decrease of 5.9% in adjusted segment operating income in 2023 as compared to 2022. Segment operating margin was 8.5% as compared to 12.7% in 2022. Adjusted segment operating margin was 32.9% in 2023, as compared to 32.1% in 2022. This increase in adjusted operating margin principally reflects an increase in fixed line platform (broadband and PayTV), which was offset by decreases in equipment revenue and mobile services.30  Southern Cone The number of prepaid wireless Segment operating revenues for Segment operating Segment operating margin was Andean Region The number of prepaid wireless Region segment of Segment operating revenues for Segment operating income for Segment operating margin was Central America - Guatemala, El Salvador, Honduras, Nicaragua The number of prepaid wireless 31  Segment operating revenues for Segment operating income for Segment operating margin was Caribbean Republic The number of prepaid wireless Segment operating revenues for Puerto Rico. We analyze segment results in U.S. dollars because it is the functional currency of our operations in Puerto Rico. Segment operating income and segment operating margin for Segment operating margin Europe The number of prepaid wireless Segment operating revenues for Segment operating income for   Ps.79.6 million, respectively, for intersegment transactions and the effects of foreign currency translation. This represents an increase of 7.7% in adjusted segment operating income in 2023 as compared to 2022. Segment operating margin was 15.6% in 2023 as compared to 15.2% in 2022. Adjusted segment operating margin was 15.7% in 2023, as compared to 15.3% in 2022. This increase in adjusted segment operating margin principally reflects the effects of our cost savings program and improved performance in all countries in our Europe segment, partially offset by increases in network maintenance and electric energy costs. 33  FUNDING REQUIREMENTS We generate substantial cash flows from our operations. On a consolidated basis, our cash flows from operating activities were We use the cash that we generate from our operations and from borrowings principally for the following purposes: Capital expenditures - We make substantial capital expenditures to continue expanding and improving our networks in each country in which we operate. Our capital expenditures on plant, property and equipment and acquisition or renewal of licenses were Acquisitions - our overall ownership in TKA is equal to Short-term debt and contractual obligations - Long-term debt and contractual obligations -
Dividends - Share repurchases - BORROWINGS In addition to cash flows generated from operations, we rely on a combination of borrowings from a range of different sources, including the international capital markets, the local capital markets in Mexico and other countries where we operate, international and local banks, equipment suppliers and export credit agencies. We seek to maintain access to diverse sources of funding. In managing our funding, we generally seek to keep our leverage, as measured by the ratio of net debt to EBITDA, at a level that is consistent with maintaining the ratings given to our debt by the principal credit rating agencies. Net debt isdefined as total debt (determined as short-and long-term debt; as shown in the below table) minus (i) cash and cash equivalents, (ii) equity investments at fair value through other comprehensive income (“OCI”)34  and other short-term investments and (iii) debt instruments at fair value through OCI. EBITDA is defined as operating income plus depreciation (which includes both depreciation of right-of-use assets and other depreciation). The following discussions provide a quantification of net debt, presented herein to the most directly comparable financial measures calculated and presented in accordance with IFRS. We do not utilize EBITDA to report financial figures in the body of this annual report. Our total consolidated indebtedness as of December 31, 2022. At December 31, Ps.26.6 billion, equity investments at fair value through OCI and other short-term investments of Ps.73.8 billion and Ps.14.9 billion in debt instruments at fair value through OCI. Without taking into account the effects of derivative financial instruments that we use to manage our interest rate and currency risk, approximately Mexican pesos (approximately non-Mexican peso debt was in U.S. dollars and The weighted average cost of all our third-party debt at December 31, Our major categories of indebtedness at December 31,
35 
Additional information about certain categories of our indebtedness is provided Mexican peso-denominated international Our 8.46% senior notes due 2036 are denominated in Mexican pesos, but all amounts in respect of the notes are payable in U.S. dollars, unless a holder of notes elects to receive payment in Mexican pesos in accordance with specified procedures. In contrast, notes issued under our global peso notes program (as described below) are denominated and payable in Mexican pesos only. Under our global peso notes program, we have historically issued Mexican peso-denominated notes that can be distributed and traded in Mexico and internationally. The notes are registered with the SEC in the United States and with the CNBV in Mexico. On July 6, 2023, we issued a Ps.17 billion (approximately U.S.$ 1 billion) 9.500% sustainable bond maturing in January 2031. On February 1, 2024, we issued a Ps.20 billion (approximately U.S.$1.1 billion) 10.300% sustainable bond maturing in 2034. Proceeds obtained from these two series of notes may be used, in whole or in part, to finance or refinance expenditures and investments in new or existing environmental and high impact social projects under our sustainable finance framework. Mexican peso-denominated domestic notes. Our domestic senior notes ( certificados bursátiles unidades de inversion papel comercial 10-year note in the papel comercial International notes. We have outstanding debt securities in the international markets denominated in U.S. dollars, pounds sterling and euros. We have also issued debt securities in the local market in Japan. Bank loans. At December 31, sustainability-linked framework. As long as the facilities are committed, a commitment fee is paid. As of December 31, Telekom Austria has an undrawn revolving syndicated credit facility for € 1.0 billion (the “TKA Facility”) expiring in July 2026. The TKA Facility includes covenants that limit Telekom Austria’s ability to incur secured debt, effect certain mergers or sell substantially all of its assets and our ability to transfer control over, or reduce our share ownership in, Telekom Austria. For more information, see Note 14 to our audited consolidated financial statements included in this annual report. 36  Bonds exchangeable for KPN shares. On March 2, 2021, our wholly-owned Dutch subsidiary, América Móvil B.V., issued approximately EUR 2.1 billion principal amount of senior unsecured bonds. The bonds Euro-denominated commercial paper program. From time to time, we have issued commercial paper under our euro-denominated commercial paper program. At December 31, As of December 31, GUARANTOR FINANCIAL INFORMATION Some of the public securities issued by América Móvil in international and Mexican capital markets are guaranteed by Telcel, a wholly-owned subsidiary. As of December 31, The following tables present summarized unconsolidated financial information for the Company and Telcel after eliminating transactions and balances between them.
RISK MANAGEMENT We regularly assess our interest rate and currency exchange exposures in order to determine how to manage the risk associated with these exposures. We have indebtedness denominated in currencies other than the currency of our operating environments, and we have expenses for operations and for capital expenditures in a variety of currencies. We use derivatives to manage the resulting exchange rate and interest rate exposures. We do not use derivatives to hedge the exchange rate exposures that arise from having operations in different countries. For additional information on market risk, see Note 2 v(ii) to our audited consolidated financial statements included in this annual report. Our practices vary from time to time depending on our judgment of the level of risk, expectations as to exchange rate or interest rate movements and the costs of using derivative financial instruments. We may stop using derivative financial instruments or modify our practices at any time. As of December 31,       RISKS RELATING TO OUR OPERATIONS Competition in the telecommunications industry is intense and could adversely affect the revenues and profitability of our operations Our businesses face substantial competition. We expect that competition will intensify in the future as a result of the entry of new competitors, the development of new technologies, products and services and convergence. We also expect consolidation in the telecommunications industry, as companies respond to the need for cost reduction and additional spectrum. This trend may result in larger competitors with greater financial, technical, promotional and other resources to compete with our businesses. Among other things, our competitors could: provide higher handset subsidies; offer higher commissions to retailers; provide free airtime or other services (such as internet access); offer services at lower costs through double, triple and quadruple play packages or other pricing strategies; expand their networks faster; or develop and deploy improved technologies faster, such as 5G LTE technology. Competition can lead us to increase advertising and promotional spending and to reduce prices for services and handsets. These developments may lead to lower operating margins, greater choices for customers and increasing movement of customers among competitors, which may make it difficult for us to retain or add new customers. The cost of adding new customers may also continue to increase, reducing profitability even if customer growth continues. Our ability to compete successfully will depend on our coverage, the quality of our network and service, our rates, customer service, effective marketing, our success in selling double, triple and quadruple play packages and our ability to anticipate and respond to various competitive factors affecting the telecommunications industry, including new services and technologies, changes in consumer preferences, demographic trends, economic conditions and discount pricing strategies by competitors.If we are unable to respond to competition and compensate for declining prices by adding new customers, increasing usage and offering new services, our revenues and profitability could decline. Governmental or regulatory actions could adversely affect our operations Our operations are subject to extensive government regulation and can be adversely affected by changes in law, regulation or regulatory policy. The licensing, construction, operation, sale, resale and interconnection arrangements of telecommunications systems in Latin America and elsewhere are regulated to varying degrees by government or regulatory authorities. Any of these authorities having jurisdiction over our businesses could adopt or change regulations or take other actions that could adversely affect our operations. In particular, the regulation of prices that operators may charge for their services and environmental matters, including renewable energy and climate change regulation, could have a material adverse effect by reducing our profit margins. See “Regulation” under Part VI for a discussion on the functional separation of Telmex and Telnor wholesale services, “Legal Proceedings” under Part VII and Note 17 to our audited consolidated financial statements included in this annual report. In addition, changes in political administrations could lead to new regulation and the adoption of policies that could adversely affect our operations, including those concerning competition and taxation of communications services. For example, since 2013, Mexico has implemented reforms to the telecommunications sector that aim to promote more competition and investment by imposing asymmetric regulation upon economic agents deemed “preponderant or dominant.” The asymmetric regulations that are applicable to us, which have adversely affected the results of our Mexican operations, may be reviewed every two years. We are unable to anticipate the effect of an amendment on existing asymmetric regulations, or the imposition of new ones, on our results or operations in Mexico. In other countries, we could also face policies such as preferences for local over foreign ownership of communications licenses and assets or for government over private ownership, which could make it more cumbersome or impossible for us to continue to develop our businesses. Restrictions such as those described above could result in lower revenues Our failure to meet or maintain quality of service goals and standards could result in fines and other adverse consequences The terms of the concessions under which our subsidiaries operate require them to meet certain service quality goals, including, for example, minimum call completion rates, maximum busy circuits rates, operator availability and responsiveness to repair requests. Failure to meet service quality obligations in the past has resulted in the imposition of material fines by regulatory entities. We are also subject to and may be subject to additional claims by customers, including class actions, seeking remedies for 40  service problems. Our ability to comply with these obligations in the future may be affected by factors beyond our control and, accordingly, we cannot assure that we will be able to comply with them. Dominant carrier related regulations could adversely affect our business by limiting our ability to pursue competitive and profitable strategies Our regulators are authorized to impose specific requirements as to rates (including termination rates), quality of service, access to active or passive infrastructure and information, among other matters, on operators that are determined to have substantial market power in a specific market. We cannot predict what steps regulatory authorities might take in response to determinations regarding substantial market power in the countries in which we operate. However, adverse determinations against our subsidiaries could result in material restrictions on our operations. We may also face additional regulatory restrictions and scrutiny as a result of our provision of combined services. If dominant carrier regulations are imposed on our business in the future, they could likely reduce our flexibility to adopt competitive market policies and impose specific tariff requirements or other special regulations on us, such as additional requirements regarding disclosure of information or quality of service. Any such new regulation could have a material adverse effect on our operations. We must continue to acquire additional radio spectrum capacity and upgrade our networks in order to expand our customer base and maintain the quality of our wireless services Licensed radio spectrum is essential to our growth and the quality of our wireless services and for the operation and deployment of our networks, including new generation networks such as 5G LTE technology, to offer improved data and value-added services. We obtain most of our radio spectrum through auctions conducted by governments of the countries in which we operate. Participation in spectrum auctions in most of these countries requires prior government authorization, and we may be subject to caps on our ability to acquire additional spectrum. Our inability to acquire additional radio spectrum capacity could affect our ability to compete successfully because it could result in, among other things, a decrease in the quality of our network and service and in our ability to meet the demands of our customers. In the event we are unable to acquire additional radio spectrum capacity, we can increase the density of our network by building more cell and switch sites, but such measures are costly and may be subject to local restrictions and regulatory approvals, and they would not meet our needs as effectively. We have concessions and licenses for fixed terms, and the government may revoke or terminate them as well as reacquire the assets under our concession under various circumstances, some of which are beyond our control Our concessions and licenses have specified terms, ranging typically from five to 20 years, and are generally subject to renewal upon payment of a fee, but renewal is not assured. The loss of, or failure to renew, any one concession could have a material adverse effect on our business and results of operations. Our ability to renew concessions and the terms of renewal are subject to a number of factors beyond our control, including the prevalent regulatory and political environment at the time of renewal. Fees are typically established at the time of renewal. As a condition for renewal, we may be required to agree to new and stricter terms and service requirements. In some of the jurisdictions where we operate and under certain circumstances, mainly in connection with fixed services, we may be required to transfer certain assets covered by some of our concessions to the government pursuant to valuation methodologies that vary in each jurisdiction. It is uncertain whether reversion would ever be applied in many of the jurisdictions where we operate and how reversion provisions would be interpreted in practice. For further information, see “Regulation” under Part VI of this annual report and Note 17 to our audited consolidated financial statements included in this annual report. In addition, the regulatory authorities in the jurisdictions in which we operate can revoke our concessions under certain circumstances. In Mexico, for example, the Federal Law on Telecommunications and Broadcasting gives the government the right to temporarily seize our concessions or to take over the management of our networks, facilities and personnel in cases of failures to meet obligations under our concession agreements, imminent danger to national security, internal peace or the national economy, natural disasters and public unrest. See “Regulation” under Part VI of this annual report. We continue to look for acquisition opportunities, and any future acquisitions and related financing could have a material effect on our business, results of operations and financial condition We continue to look for investment opportunities in telecommunications and related companies worldwide, including in markets where we are already present, and we often have several possible acquisitions under 41 consideration. Any future acquisitions, and related financing and acquired indebtedness, could have a material effect on our business, results of operations and financial condition, but we cannot provide assurances that we will complete any of them. In addition, we may incur significant costs and expenses as we integrate these companies in our systems, controls and networks. We are subject to significant litigation Some of our subsidiaries are subject to significant litigation that, if determined adversely to our interests, may have a material adverse effect on our business, results of operations, financial condition or prospects. Our significant litigation is described in “Regulation” under Part VI and in Note 17 to our audited consolidated financial statements included in this annual report. We are contesting significant tax assessments We and some of our subsidiaries have been notified of tax assessments for significant amounts by the tax authorities of the countries in which we operate, especially in Brazil, Mexico and Colombia. The tax assessments relate to, among other things, alleged improper deductions and underpayments. We are contesting these tax assessments in several administrative and legal proceedings, and our challenges are at various stages. The amounts claimed by the tax authorities in these matters are significant. In many cases, we have not established a provision in our audited financial statements for these matters, or the amount claimed may be significantly in excess of any reserve established. We evaluate income tax contingencies applying IAS 12 Income Taxes and IFRIC Failure to comply with anti-corruption, We operate in multiple jurisdictions and are subject to complex regulatory frameworks with increased enforcement activities worldwide. Our governance and compliance processes may not prevent future breaches of legal, accounting or governance standards and regulations. We may be subject to breaches of our code of ethics, anti-corruption policies and business conduct protocols and to instances of fraudulent behavior, corrupt practices and dishonesty by our employees, contractors or other agents. Our or our contractors’ failure to comply with applicable laws and other regulatory requirements, including those relating to anti-corruption, anti-bribery and anti-money laundering laws and economic and trade sanctions, could harm our reputation, subject us to substantial fines, sanctions or penalties and adversely affect our business and ability to access financial markets. A system failure could cause delays or interruptions of service, which could have an adverse effect on our operations We need to continue to provide our subscribers with a reliable service over our network. Some of the risks to our network and infrastructure include the following: physical damage to access lines and fixed networks; power surges or outages; natural disasters; climate change; malicious actions, such as theft or misuse of customer data; limitations on the use of our radio bases; software defects; human error; and other disruptions beyond our control, including as a result of civil unrest in the regions where we operate. In Brazil, for example, our satellite operations may be affected if we experience a delay in launching new satellites to replace those currently in use when they reach the end of their operational lives. Such delay may occur because of, among other reasons, construction delays, unavailability of launch vehicles and/ or launch failures. In addition, our operations have been disrupted by natural disturbances such as hurricanes and earthquakes. We have instituted measures to reduce these risks. However, there is no assurance that any measures we implement will be effective in preventing system failures under all circumstances. System failures may cause interruptions in services or reduced capacity for our customers, either of which may have an adverse effect on our operations due to, for example, increased expenses, potential legal liability, loss of existing and potential subscribers, reduced user traffic, decreased revenues and reputational harm. 42  Our financial condition and results of operations may be adversely affected by the occurrence of severe weather, natural or man-made disasters and other catastrophic events, including war, terrorism and other acts of violence, and diseaseOur operations can be disrupted by unforeseen events, including war, terrorism, and other international, regional, or local instability or conflicts (including labor issues), embargos, public health issues (including tainted food, food-borne illnesses, food tampering, tampering with or failure of water supply or widespread or pandemic illness such as coronavirus (“COVID-19”), Ebola, the avian or H1N1 flu, MERS), and natural disasters such as earthquakes, tsunamis, hurricanes, or other adverse weather and climate conditions in the countries in which we operate. These events coulddisrupt or prevent our ability to perform functions and otherwise impede our ability to continue business operations in a continuous manner, which in turn may materially and adversely impact our business and operating results. Effects of climate change may impose risk of damage to our infrastructure and our ability to provide services, all of which Extreme weather events precipitated by long-term climate change have the potential to directly damage network facilities or disrupt our ability to build and maintain portions of our network and could potentially disrupt suppliers’ ability to provide products and services required to provide reliable network coverage. Any such disruption could delay network deployment plans, interrupt service for our customers, increase our costs and have a negative effect on our operating results. The potential physical effects of climate change, such as increased frequency and severity of storms, floods, fires, freezing conditions, sea-level rise, and other climate-related events, could adversely affect our operations, infrastructure, and financial results. Operational impacts resulting from the potential physical effects of climate change, such as damage to our network infrastructure, could result in increased costs and loss of revenue. We could incur significant costs to improve the climate resiliency of our infrastructure and otherwise prepare for, respond to, and mitigate such physical effects of climate change. We are not able to accurately predict the materiality of any potential losses or costs associated with the physical effects of climate change.Public health crises We are subject to risks related to public health crises, COVID-19 is based on our ability to provide products and services to customers COVID-19 pandemic, that significantly impacts the way customers use and are able to pay for our products and services, the way our employees are able to provide services to our customers, and the ways that our partners and suppliers are able to provide products and services to us. Many of our employees are unionized and increases in labor and employee benefit costs may reduce our profitability, increase our funding requirements and could have an adverse impact on our operations Many of our employees are members of labor unions with which we conduct collective negotiations on wages, benefits and working conditions. We use actuarial methodologies and assumptions such as discount rate, salary increase and mortality, among others, for the determination and valuation of our employee benefits, including retirement benefits. We evaluate from time to time, with the support of specialists, our actuarial methodologies and assumptions, as well as the valuation of the assets related to these benefits. Our labor costs and the costs of maintaining employee benefits are substantial, and could be affected by several factors, including legislative and regulatory changes, work stoppages, subsequent negotiations, increases in healthcare costs or in minimum wages, decreases in investment returns on the assets held in funds to support the payment of certain employee benefits and changes in the discount rate and mortality assumptions. An increase in labor and employee benefit costs could reduce our profitability, increase our funding requirements and have an adverse impact on our operations. Inflationary pressures on costs may impact our network construction, financial condition and results of operations As a provider of telecommunications and technology services, we sell handsets, wireless data cards, wireless computing devices and customer premises equipment manufactured by various suppliers. We depend on suppliers to provide us, directly or through other suppliers, with items such as network equipment, customer premises equipment, and wireless-related 43 equipment such as mobile hotspots, handsets, wirelessly enabled computers, wireless data cards and other connected devices for our customers. In Although we are unable to predict the impact on our ability to source materials in the future, we expect these supply pressures to continue into Our attempts to offset these cost pressures, such as through increases in the selling prices of some of our products and services, may not be successful. Higher product prices may result in reductions in sales volume. Consumers may be less willing to pay a price differential for our products and may increasingly purchase lower-priced offerings, or may forego some purchases altogether, during an economic downturn. To the extent that price increases are not sufficient to offset these increased costs adequately or in a timely manner, and/or if they result in significant decreases in sales volume, our business, financial condition or operating results may be adversely affected. Furthermore, we may not be able to offset any cost increases through productivity and cost-saving initiatives. In addition, widespread inflation may reduce the purchasing power of consumers for our products and services. We rely on highly skilled personnel throughout all levels of our business. Our business could be harmed if we are unable to retain or motivate key personnel, hire qualified personnel or maintain our corporate culture The market for highly skilled workers and leaders in our industry is extremely competitive. We believe that our future success depends in substantial part on our ability to recruit, hire, motivate, develop, and retain talented personnel for all areas of our organization, including our CEO and the other members of our senior leadership team. Our inability to retain these employees or to replace them with qualified and capable successors could hinder our strategic planning and execution. If key employees depart, our business could be negatively impacted. We may incur significant costs in identifying, hiring and replacing departing employees and may lose significant expertise and talent. As a result, we may not be able to meet our business plan and our revenue growth and profitability may be materially adversely affected. Cybersecurity incidents and other breaches of network or information technology security could have an adverse effect on our business and our reputation Cybersecurity incidents, and other tactics designed to gain access to and exploit sensitive information by breaching critical systems of large companies, are evolving and have been increasing in both sophistication and occurrence in recent years. While we employ a number of measures to prevent, detect and mitigate such incidents, there is no guarantee that we will be able to adequately anticipate or prevent one. Cybercrime, including attempts to overload our servers with denial-of-service In the event that our systems are breached or damaged for any reason, we may suffer loss or unavailability of data and interruptions to our business operations. If such an event occurs, the unauthorized disclosure, loss or unavailability of data and the disruption to our fixed-line or wireless networks may have a material adverse effect on our business and results of operations. The costs associated with a cybersecurity incident could include increased expenditures on information and cybersecurity measures, damage to our reputation, loss of existing customers and business partners and lead to financial losses from remedial actions and potential liability, including possible litigation and sanctions. Any of these occurrences may result in a material adverse effect on our results of operations and financial condition. Failure to achieve proper data governance could lead to data mismanagement We process large amounts of personally identifiable information of customers and employees and are subject to various compliance, security, privacy, data quality and regulatory requirements. Failure to achieve proper data 44  governance could lead to data mismanagement which in turn could result in data loss, regulatory investigations or sanctions, and cybersecurity risk. We are subject to data privacy regulations in the countries where we operate. Complying with such regulations may expose us to increased costs and limit our ability to transfer data between certain jurisdictions, which may adversely affect our operations. If our churn rate increases, our business could be negatively affected The cost of acquiring a new subscriber is much higher than the cost of maintaining an existing subscriber. Accordingly, subscriber deactivations, or “churn,” could have a material negative impact on our operating income, even if we are able to obtain one new subscriber for each lost subscriber. A substantial majority of our subscribers are prepaid, and we do not have long-term contracts with them. Our average churn rate on a consolidated basis was We rely on key suppliers to provide equipment that we need to operate our business We rely upon various key suppliers to provide us with handsets, network equipment or services, which we need to expand and operate our business. Our key suppliers include Huawei, Ericsson and Government or regulatory actions with respect to certain suppliers may impact us. For example, the U.S. Federal Communications Commission adopted rules blocking the importation or sale of certain technology products that it said pose security risks to U.S. critical infrastructure, including products of Chinese technology suppliers. The government of the United States Our ability to pay dividends and repay debt depends on our subsidiaries’ ability to pay dividends and make other transfers to us We are a holding company with no significant assets, other than the shares of our subsidiaries and our holdings of cash and cash equivalents. Our ability to pay dividends and repay debt depends on the continued transfer to us of dividends and other income from our subsidiaries. The ability of our subsidiaries to pay dividends and make other transfers to us may be limited by various regulatory, contractual and legal constraints that affect them. We may fail to realize the benefits anticipated from acquisitions, divestments and significant investments we make from time to time The business growth opportunities, revenue benefits, cost savings and other benefits we anticipated to result from our acquisitions, divestments and significant investments may not be achieved as expected or may be delayed. Our divestments may also adversely affect our prospects. For example, we may be unable to fully implement our business plans and strategies for the combined businesses due to regulatory limitations, and we may face regulatory restrictions in our provision of combined services in some of the countries in which we operate. To the extent that we incur higher integration costs or achieve lower revenue benefits or fewer cost savings than expected, or if we are required to recognize impairments of acquired assets, investments or goodwill, our results of operations and financial condition may suffer. A downgrade of Mexico’s credit rating could affect us Credit rating agencies regularly evaluate Mexico and its sovereign rating based on various factors including macroeconomic trends, tax and budgetary conditions and indebtedness metrics. If Mexico’s sovereign credit rating is downgraded by credit rating agencies, the rating of our securities may also be downgraded, which could negatively affect our financing costs and the market price of our securities. Changing expectations from stakeholders with respect to our environmental, social and governance practices may impose additional costs on us or expose us to new or additional risks 45 condition or stock price could be materially and adversely affected. Views about ESG are diverse and rapidly changing, and there is currently no market consensus on what precise attributes are required for a particular project to be defined as “green,” “social” or “sustainable.” Therefore, no assurance can be provided that any projects considered by us as “green,” “social” or “sustainable” will meet all stakeholder expectations regarding social, environmental or sustainability performance. There can be no guarantee that our projects will deliver environmental, social and/ or sustainability benefits as anticipated, or that adverse environmental, social and/or sustainability impacts will not occur during the operation of such projects. If we do not meet our stakeholders’ expectations or we are not effective in addressing ESG matters or achieve relevant sustainability goals, trust in our brand may suffer and our business or our ability to access capital could be harmed. Negative or inaccurate information on social media or elsewhere could adversely affect our reputation Negative or inaccurate information concerning or affecting us or our trademarks may be posted at any time on social media and similar platforms, including weblogs (blogs), social media websites, and other forms of Internet-based communications which allow individual access to a broad audience of consumers and other interested persons. This information may harm our reputation without affording us an opportunity for redress or correction, which could in turn have a material adverse effect on our business, financial condition and results of operations. We cannot be certain that additional material weaknesses will not develop or be discovered in the future. There is also a risk that there could be accounting errors in our financial reporting. If our efforts to remediate any material weakness are unsuccessful, we may be unable to report our results of operations for future periods accurately and in a timely manner and make our required filings with government authorities, including the SEC. Any of these occurrences could adversely affect our results of operation and financial condition. RISKS RELATING TO THE TELECOMMUNICATIONS INDUSTRY GENERALLY Changes in the telecommunications industry could affect our future financial performance The telecommunications industry continues to experience significant changes as new technologies are developed that offer subscribers an array of choices for their communications needs. These changes include, among others, regulatory changes, evolving industry standards, ongoing improvements in the capacity and quality of digital technology, shorter development cycles for new products, evolving renewable energy and clean technologies, the development and adoption of artificial intelligence technology and changes in end-user needs and preferences. There is uncertainty as to the pace and extent of growth in subscriber demand, and as to the extent to which prices for airtime, broadband access, Pay TV and fixed-line rental may continue to decline. Our ability to compete in the delivery of high-quality internet and broadband services is particularly important, given the increasing contribution of revenues from data services to our overall growth. If we are unable to meet future advances in competing technologies on a timely basis or at an acceptable cost, we could lose subscribers to our competitors. In general, the development of new services in our industry requires us to anticipate and respond to the varied and continually changing demands of our subscribers. It also requires significant capital expenditure, including investment in the continual maintenance and upgrading of our networks, in order to expand coverage, increase our capacity to absorb higher bandwidth usage and adapt to new technologies. We may not be able to accurately predict technological trends or the success of new services in the market. In addition, there could be legal or regulatory restraints to our introduction of new services. If these services fail to gain acceptance in the marketplace, or if costs associated with implementation and completion of the introduction of these services materially increase, our ability to retain and attract subscribers could be adversely affected. This is true across many of the services we provide, including wireless and cable technology.46  The intellectual property used by us, our suppliers or service providers may infringe on intellectual property rights owned by others Some of our products and services use intellectual property that we own or license from others. We also provide content we receive from content producers and distributors, such as ringtones, text games, video games, video, including TV programs and movies, wallpapers or screensavers, and we outsource services to service providers, including billing and customer care functions, distributors and service providers have received, and may receive in the future, assertions and claims from third parties that the content, products or software utilized by us or our suppliers, content producers and distributors and service providers infringe on the patents or other intellectual property rights of these third parties. These claims could require us or an infringing supplier, content distributor or service provider to cease engaging in certain activities, including selling, offering and providing the relevant products and services. Such claims and assertions also could subject us to costly litigation and significant liabilities for damages or royalty payments or require us to cease certain activities or prevent us from selling certain products or services. Concerns about health risks relating to the use of wireless handsets and base stations may adversely affect our business Portable communications devices have been alleged to pose health risks, including cancer, due to radio frequency emissions. Lawsuits have been filed in the United States against certain participants in the wireless industry alleging various adverse health consequences as a result of wireless phone usage, and our subsidiaries may be subject to similar litigation in the future. Government authorities could increase regulation on electromagnetic emissions of mobile handsets and base stations, which could have an adverse effect on our business, financial condition and results of operations. Research and studies are ongoing, and there can be no assurance that further research and studies will not demonstrate a link between radio frequency emissions and health concerns. Any negative findings in these studies could adversely affect the use of wireless technology and, as a result, our future financial performance. Developments in the telecommunications sector have resulted, and may result, in substantial Where the circumstances require, we review the carrying value of each of our assets, subsidiaries and investments in associates to assess whether those carrying values can be supported by the future discounted cash flows expected to be derived from such assets. Whenever we consider that due to changes in the economic, regulatory, business or political environment, our goodwill, investments in associates, intangible assets or fixed assets may be impaired, we consider the necessity of performing certain valuation tests, which may result in impairment charges. The recognition of impairments of tangible, intangible and financial assets could adversely affect our results of operations. RISKS RELATING TO OUR CONTROLLING SHAREHOLDERS, CAPITAL STRUCTURE AND TRANSACTIONS WITH AFFILIATES Members of one family may be deemed to control us and may exercise their control in a manner that may differ from the interest of other shareholders Based on reports of beneficial ownership of our shares filed with the SEC, Carlos Slim Helú, together with his sons, daughters and grandchildren (together, the “Slim Family”) may be deemed to control us. The Slim Family may be able to elect a majority of the members of our Board of Directors and to determine the outcome of other actions requiring a vote of our shareholders. The interests of the Slim Family may diverge from the interests of our other investors. We have significant transactions with affiliates We engage in various transactions with Telesites, S.A.B. de C.V. (“Telesites”), Sitios Latam and certain subsidiaries of Grupo Carso, S.A.B. de C.V. (“Grupo Carso”) and Grupo Financiero Inbursa, S.A.B. de C.V. (“Grupo Financiero Inbursa”), all which may be deemed for certain purposes to be under common control with América Móvil. These transactions occur in the ordinary course of business. Transactions with affiliates may create the potential for conflicts of interest. We also make investments together with related parties, sell investments to related parties and buy investments from related parties. For more information about our transactions with affiliates, see “Related Party Transactions” under Part IV of this annual report. Our bylaws restrict transfers of shares in some circumstances Our bylaws provide that any acquisition or transfer of 10.0% or more of our capital stock by any person or group of persons acting together requires the approval of our Board of Directors. You may not acquire or transfer 47 10.0% or more The protections afforded to minority shareholders in Mexico are different from those in the United States Under Mexican law, the protections afforded to minority shareholders are different from those in the United States. In particular, the law concerning fiduciary duties of directors is not as fully developed as in other jurisdictions, the procedure for class actions is different, and there are different procedural requirements for bringing shareholder lawsuits. As a result, in practice it may be more difficult for minority shareholders of América Móvil to seek remedies against us or our directors or controlling shareholders than it would be for shareholders of a company incorporated in another jurisdiction, such as Delaware. Holders of ADSs are not entitled to attend shareholders’ meetings, and they may only vote through the depositary Under our bylaws, a shareholder is required to deposit its shares with a custodian in order to attend a shareholders’ meeting. A holder of ADSs will not be able to meet this requirement and, accordingly, is not entitled to attend shareholders’ meetings. A holder of ADSs is entitled to instruct the depositary as to how to vote the shares represented by ADSs, in accordance with procedures provided for in the deposit Our bylaws may only be enforced in Mexico Our bylaws provide that legal actions relating to the execution, interpretation or performance of the bylaws may be brought only in Mexican courts. As a result, it may be difficult for non-Mexican shareholders to enforce their shareholder rights pursuant to the bylaws.It may be difficult to enforce civil liabilities against us or our directors, officers and controlling persons América Móvil is organized under the laws of Mexico, with its principal place of business in Mexico City, and most of our directors, officers and controlling persons reside outside the United States. In addition, all or a substantial portion of our assets and their assets are located outside of the United States. As a result, it may be difficult for investors to effect service of process within the United States on such persons or to enforce judgments against them, including in any action based on civil liabilities under U.S. federal securities laws. There is doubt as to the enforceability against such persons in Mexico, whether in original actions or in actions to judgments of U.S. courts, of liabilities based solely on U.S. federal securities laws. You may not be entitled to participate in future preemptive rights offerings Under Mexican law, if we issue new shares for cash as part of certain capital increases, we must grant our shareholders the right to purchase a sufficient number of shares to maintain their existing ownership percentage in América Móvil. Rights to purchase shares in these circumstances are known as preemptive rights. Pursuant to Mexican Securities Market Law our shareholders may delegate to our Board of Directors the right to approve certain capital increases as well as the exclusion of preemptive rights over these capital increases. Our shareholders do not have preemptive rights in certain circumstances such as mergers, convertible debentures, public offers and placement of repurchased shares. We may not be legally permitted to allow holders of ADSs or holders of We cannot assure you that we will file a registration statement with the SEC to allow holders of ADSs or U.S. holders of RISKS RELATING TO DEVELOPMENTS IN MEXICO AND OTHER COUNTRIES Economic, political and social conditions in Latin America, the Caribbean and Europe may adversely affect our business Our financial performance may be significantly affected by general economic, political and social conditions in the markets where we operate. Many countries in Latin America and the Caribbean, including Mexico, Brazil and Argentina, have undergone significant economic, political and social crises in the past, and these events may occur again in the future. We cannot predict whether changes in political administrations will result in changes in governmental policy and whether such changes will affect 48  our business. Factors related to economic, political and social conditions that could affect our performance include: significant governmental influence over local economies; substantial fluctuations in economic growth; high levels of inflation, including hyperinflation; changes in currency values; exchange controls or restrictions on expatriation of earnings; high domestic interest rates; price controls; changes in governmental economic, tax, labor or other policies; imposition of trade barriers; changes in law or regulation; imposition of local requirements or orders, including potential censorship or requirements to provide user information; and overall political, social and economic instability and civil unrest. Adverse economic, political and social conditions in Latin America, the Caribbean or in Europe may inhibit demand for telecommunication services and create uncertainty regarding our operating environment or may affect our ability to renew our licenses and concessions, to maintain or increase our market share or profitability and may have an adverse impact on future acquisitions, which could have a material adverse effect on our company. In addition, the perception of risk in the countries in which we operate may have a negative effect on the trading price of our shares and ADSs and may restrict our access to international financial markets. Our business may also be especially affected by conditions in Mexico and Brazil, two of our largest markets. For example, Additionally, in Mexico, economic conditions are strongly impacted by those of the United States. In the context of an international transition to market-based reference rates, in Mexico, the Central Bank ( Banco de México ) has lead an effort to migrate to a new reference rate, “Funding TIIE” (TIIE de Fondeo ). Since January 1, 2024, use of the existing TIIE rate has been restricted for new agreements and, for existing agreements, the TIIE’s calculation methodology was adjusted in accordance with the new Funding TIIE.Changes in exchange rates could adversely affect our financial condition and results of operations We are affected by fluctuations in the value of the currencies in which we conduct operations compared to the currencies in which our indebtedness is denominated. Such changes result in exchange losses or gains on our net indebtedness and accounts payable. In In addition, currency fluctuations between the Mexican peso and the currencies of our non-Mexican subsidiaries affect our results as reported in Mexican pesos. Currency fluctuations are expected to continue to affect our financial income and expense.Major depreciation of the currencies in which we conduct operations could cause governments to impose exchange controls that would limit our ability to transfer funds between us and our 49 principal on our indebtedness. The government of Argentina has adopted exchange controls and restrictions on the movement of capital and has taken other measures in response to capital flight and the significant depreciation of the Argentine peso. In addition, although the Mexican government does not currently restrict, and for many years has not restricted, the right or ability of Mexican or foreign persons or entities to convert Mexican pesos into U.S. dollars or to transfer other currencies out of Mexico, it could institute restrictive exchange rate policies in the future. Similarly, the Brazilian government may impose temporary restrictions on the conversion of Brazilian reais into foreign currencies and on the remittance to foreign investors of proceeds from investments in Brazil whenever there is a serious imbalance in Brazil’s balance of payments or a reason to foresee a serious imbalance. Developments in other countries may affect the market price of our securities and adversely affect our ability to raise additional financing The market value of securities of Mexican companies is, to varying degrees, affected by economic and market conditions in other countries, including the United States, the European Union (the “EU”) and emerging market countries. Although economic conditions in such countries may differ significantly from economic conditions in Mexico, investors’ reactions to developments in any of these other countries may have an adverse effect on the market value of securities of Mexican issuers. Crises in the United States, the EU and emerging market countries may diminish investor interest in securities of Mexican issuers. For example, in response to the ongoing military conflict involving Russia and Ukraine, the United States, other North Atlantic Treaty Organization member states, as well as non-member states, have announced targeted economic sanctions on Russia, certain Russian citizens and enterprises. The continuation of the conflict may trigger a series of additional economic and other sanctions enacted by the United States, other North Atlantic Treaty Organization member states, and other countries. This could materially and adversely affect economic conditions, the market price of our securities and our operations in Belarus, and could also make it more difficult for us to access the capital markets and finance our operations in the future on acceptable terms or at all. The ongoing military conflict in the Middle East is also a source of uncertainty. The conflict could bring about disruption, instability and volatility in global markets and supply chains, which could in turn adversely affect our business operations and financial performance.      The following table sets forth our capital structure as of March 31,
According to reports of beneficial ownership of our shares filed with the SEC, as of March 31, 2024, the Slim Family may be deemed to control us through their interests in a Mexican trust that holds The following table identifies owners of more than 5.0% of
As of March 31, We have no information concerning the number of holders with registered addresses in the United States that  Our subsidiaries purchase materials or services from a variety of companies that may be deemed for certain purposes to be under common control with us, including Telesites, Sitios Latam, Grupo Carso, Grupo Financiero Inbursa and their respective subsidiaries. These services include insurance and banking services provided by Grupo Financiero Inbursa and its subsidiaries. In addition, we sell products in Mexico through the Sanborns and Sears Operadora México, S.A. de C.V. store chains. Some of our subsidiaries also purchase network construction services and materials from subsidiaries of Grupo Carso. Our subsidiaries purchase these materials and services on terms no less favorable than they could obtain from unaffiliated parties, and would have access to other sources if our related parties ceased to provide them on competitive terms. We and Telesites have entered into an agreement providing for site usage fees, annual price escalations and fixed annual charges that permit us to install a pre-determined amount of equipment at the fee payments if capacity use is exceeded. The principal Instituto Federal de Telecomunicaciones Our subsidiaries have entered into master service agreements and site agreements with Sitios Latam in each of the countries where Sitios Latam operates pursuant to which Sitios Latam will build, install, maintain and provide access to its towers and other support structures, as well as physical space for the location of towers and other non-electronic components. Most of the master service agreements are for a mandatory initial term of five (5) to ten (10) years and will renew automatically for an additional term of the same number of years unless the carrier notifies Sitios Latam of its intent not to renew.We enter into a number of transactions with related parties in the ordinary course of our business. We believe that these transactions are on terms comparable to those that could be obtained in arm’s length negotiations with unaffiliated third parties. Note 6 and Note 15 to our audited consolidated financial statements included in this annual report set forth information on related party transactions for the three year period set forth therein. We do not regard any of these transactions as material to us. In accordance with Mexican law, an independent non-material, are within the ordinary course of business, or are on anarm’s-length basis, do not require specific board approval, if consistent with the guidelines approved by the Board of Directors. 54  We regularly pay cash dividends on our shares. The table below sets forth the nominal amount of dividends paid per share on each date indicated, in Mexican pesos and translated into U.S. dollars at the exchange rate reported by Banco de México, as published in the Official Gazette, for each of the respective payment dates.
On April The declaration, amount and payment of dividends by América Móvil is determined by majority vote of the holders of i.e., all of our shareholders), generally on the recommendation of the Board of Directors, and depends on Our bylaws provide that holders of i.e., all of our shareholders) participate equally on aper-share basis in dividend payments and other    Our shares and ADSs are listed on the following markets:
 | |||||||||||||||||||||||||||||||||||||||||||||||||||||||||||||||||||||||||||||||||||||||||||||||||||||||||||||||||||||||||||||||||||||||||||||||||||||||||||||||||||||||||||||||||||||||||||||||||||||||||||||||||||||||||||||||||||||||||||||||||||||||||||||||||||||||||||||||||||||||||||||||||||||||||||||||||||||||||||||||||||||||||||||||||||||||||||||||||||||||||||||||||||||||||||||||||||||||||||||||||||||||||||||||||||||||||||||||||||||||||||||||||||||||||||||||||||||||||||||||||||||||||||||||||||||||||||||||||||||||||||||||||||||||||||||||||||||||||||||||||||||||||||||||||||||||||||||||||||||||||||||||||||||||||||||||||||||||||||||||||||||||||||||||||||||||||||||||||||||||||||||||||||||||||||||||||||||||||||||||||||||||||||||||||||||||||||||||||||||||||||||||||||||||||||||||||||||||||||||||||||||||||||||||||||||||||||||||||||||||||||||||||||||||||||||||||||||||||||||||||||||||||||||||||||||||||||||||||||||||||||||||||||||||||||||||||||||||||||||||||||||||||||||||||||||||||||||||||||||||

We are aorganized under Mexican law. For a description of our AA Shares, A Shares and L Shares,shares, and a brief summary of certain significant provisions in our current bylaws and Mexican law, see “Description of Securities Registered Under Section 12 of the Exchange Act,” filed as Exhibit 2.1 with this annual report. For a description of our Board of Directors, Executive and Audit and Corporate Practices Committees and External Auditor, see “Management” under Part V of this annual report.
Sociedad Anónima Bursátil de Capital Variable


In our 2022 annual ordinary shareholders’ meeting, our shareholders authorized an increase to the buyback program by an amount equal to Ps.26 billion, which after the increase amounted to Ps.36,539 billion to repurchase shares from April 2022 to April 2023.
In our 2023 annual shareholders’ meeting, our shareholders authorized the allocation of an amount equal to Ps.20 billion for the buyback program for the April 2023 to April 2024 period. In our 2024 annual shareholders’ meeting, our shareholders authorized the allocation of an amount equal to Ps.15 billion for the buyback program for the April 2024 to April 2025 period, adding to such amount the buyback program balance, if any, as of the date of the shareholders’ meeting. We expect to continue to periodically repurchase at our discretion our L Shares and A Sharesshares on the open market pursuant to guidelines approved by our Board of Directors, using funds up to an amount authorized by our shareholders specifically for the repurchase of L Shares and A Shares. Our shareholders authorized the allocation of up to Ps.6 billion in February 2021, Ps.25 billion in April 2021 and Ps.26 billion in November 2021, in each case to repurchase L Shares and A Shares. In our 2022 annual ordinary shareholders’ meeting, our shareholders authorized increase to the buyback program fund by an amount equal to Ps.26 billion, which after the increase amounts to Ps.36.539 billion to repurchase L Shares and A Shares from April 2022 to April 2023.shareholders.
The following table sets out information concerning purchases of our L Sharesshares by us and our affiliated purchasers in 2021. We did not repurchase our L Shares other than through the share repurchase program, and we did not repurchase any A Shares.2023.
PERIOD | TOTAL NUMBER OF SHARES PURCHASED (1) | AVERAGE PRICE PER SHARE | TOTAL NUMBER OF SHARES PUR- CHASED AS PART OF PUBLICLY AN- NOUNCED PLANS OR PROGRAMS | APPROXIMATE MEXICAN PESO VALUE OF SHARES THAT MAY YET BE PURCHASED UNDER THE PLANS OR PROGRAMS (2) | ||||||||||||
January 2023 | 41,000,000 | Ps. 19.29 | 41,000,000 | Ps. 19,624,826,102.31 | ||||||||||||
February 2023 | 38,000,000 | 18.93 | 38,000,000 | 18,909,717,139.46 | ||||||||||||
March 2023 | 22,500,000 | 19.38 | 22,500,000 | 18,476,148,690.44 | ||||||||||||
April 2023 | 13,725,000 | 19.32 | 13,725,000 | 19,798,706,951.27 | ||||||||||||
May 2023 | 19,775,000 | 19.40 | 19,775,000 | 19,417,290,615.94 | ||||||||||||
June 2023 | 24,750,000 | 19.12 | 24,750,000 | 18,946,772,568.15 | ||||||||||||
July 2023 | 42,750,000 | 18.02 | 42,750,000 | 18,180,887,206.71 | ||||||||||||
August 2023 | 135,040,000 | 16.31 | 135,040,000 | 15,990,885,465.78 | ||||||||||||
September 2023 | 108,460,000 | 15.53 | 108,460,000 | 14,316,726,519.56 | ||||||||||||
October 2023 | 139,000,000 | 15.16 | 139,000,000 | 12,221,125,972.78 | ||||||||||||
November 2023 | 110,000,000 | 15.34 | 110,000,000 | 10,543,142,289.67 | ||||||||||||
December 2023 | 180,000,000 | 16.03 | 180,000,000 | 7,674,539,433.33 | ||||||||||||
Total Shares (3) | 875,000,000 | 875,000,000 | ||||||||||||||
(1) This includes purchases by us and our affiliated purchasers in 2023. | ||||||||
(2) This is the approximate Mexican peso amount available at the end of the period for purchases of our shares pursuant to our share repurchase program. | ||||||||
(3) Prior to March 16, 2023, we periodically repurchased at our discretion our L Shares and A Shares on the open market. | ||||||||
PERIOD | TOTAL NUMBER OF SHARES PURCHASED (1) | AVERAGE PRICE PER SHARE | TOTAL NUMBER OF SHARES PURCHASED AS PART OF PUBLICLY ANNOUNCED PLANS OR PROGRAMS | APPROXIMATE MEXICAN PESO VALUE OF SHARES THAT MAY YET BE PURCHASED UNDER THE PLANS OR PROGRAMS (2) | ||||||||||||
January 2021 | 58,300,000 | Ps. | 14.70 | 58,300,000 | Ps. | 137,547,600.71 | ||||||||||
February 2021 | 83,000,000 | 13.76 | 83,000,000 | 5,002,342,621.26 | ||||||||||||
March 2021 | 180,000,000 | 14.11 | 180,000,000 | 2,476,906,037.20 | ||||||||||||
April 2021 | 169,345,689 | 14.42 | 169,345,689 | 24,433,023,601.16 | ||||||||||||
May 2021 | 132,896,900 | 14.86 | 132,896,900 | 22,469,536,093.00 | ||||||||||||
June 2021 | 141,528,312 | 15.63 | 141,528,312 | 20,270,462,806.00 | ||||||||||||
July 2021 | 184,489,748 | 15.81 | 184,489,748 | 17,370,881,547.05 | ||||||||||||
August 2021 | �� | 214,000,000 | 17.87 | 214,000,000 | 13,568,848,403.30 | |||||||||||
September 2021 | 249,000,000 | 18.64 | 249,000,000 | 8,954,740,926.13 | ||||||||||||
October 2021 | 273,600,000 | 18.14 | 273,600,000 | 4,020,009,413.98 | ||||||||||||
November 2021 | 285,400,000 | 18.70 | 285,400,000 | 24,714,680,611.87 | ||||||||||||
December 2021 | 201,259,367 | 20.50 | 201,259,367 | 20,612,674,146.83 | ||||||||||||
Total L Shares | 2,172,820,016 | 2,172,820,016 | ||||||||||||||
(1) This includes purchases by us and our affiliated purchasers in 2021.(2) This is the approximate peso amount available at the end of the period for purchases of both L Shares and A Shares pursuant to our share repurchase program. | ||||||||||||||||


The following summary contains a description of certain Mexican federal and U.S. federal income tax consequences of the acquisition, ownership and disposition of LB Shares A Shares, L Share ADSs or AB Share ADSs but it does not purport to be a comprehensive description of all of the tax considerations that may be relevant to a decision to purchase, hold or sell sharesB Shares or B Share ADSs.
This discussion does not constitute, and should not be considered as, legal or tax advice to holders. The discussion is for general information purposes only and is based upon the federal tax laws of Mexico, (includingincluding the Mexican Income Tax Law (), and the United States in effect on the date of this annual report, including the Convention for the Avoidance of Double Taxation and the Prevention of Fiscal Evasion and the protocols thereto between the United States and Mexico currently in force (together, the "Tax Treaty"“Tax Treaty”) and the agreement between the United States and Mexico concerning the exchange of information with respect to tax matters. The Tax Treaty is subject to change, and such changes may have retroactive effects. Holders of sharesB Shares or B Share ADSs should consult their own tax advisors as to the Mexican, U.S. or other tax consequences of the purchase, ownership and disposition of sharesB Shares or B Share ADSs, including, in particular, the effect of any foreign, state or local tax laws.
Ley del Impuesto sobre la Renta
MEXICAN TAX CONSIDERATIONS
The following is a general summary of the principal consequences under the Mexican Income Tax Law and the rules and regulations thereunder, as currently in effect, of an investment in sharesSeries B Shares or B Share ADSs by a holder that is not a resident of Mexico and that will not hold sharesSeries B Shares or B Share ADSs or a beneficial interest therein in connection with the conduct of a trade or business through a permanent establishment in Mexico (a "nonresident holder"“nonresident holder”).
For purposes of Mexican taxation, the definition of residence is highly technical and residence arises in several situations. Generally, an individual is a resident of Mexico if he or she has established his or her home or center of vital interests in Mexico, and a corporation is considered a resident if it has its place of effective management in Mexico. However, any determination of residence should take into account the particular situation of each person or legal entity.
If a legal entity or an individual is deemed to have a permanent establishment in Mexico for Mexican tax purposes, all income attributable to that permanent
establishment will be subject to Mexican income taxes, in accordance with applicable tax laws.
This summary does not purport to be a comprehensive description of all the Mexican tax considerations that may be relevant to a decision to purchase, own or dispose of the shares. In particular, this summary (i) does not describe any tax consequences arising under the laws of any state, locality, municipality or taxing jurisdiction other than certain federal laws of Mexico and (ii) does not address all of the Mexican tax consequences that may be applicable to specific holders of the shares, including a holder:
whose shares were not acquired through the Mexican Stock Exchange or other markets authorized by the Ministry of Finance and Public Credit (Secretarí(Secretaría de Hacienda y Crédito Público)blico) or the Mexican Federal Tax Code;
of sharesSeries B Shares or B Share ADSs that control us;
that holds 10.0% or more of our shares;
that is part of a group of persons for purposes of Mexican law that controls us (or holds 10.0% or more of our shares); or
that is a resident of Mexico or is a corporation resident in a tax haven (as defined by the Mexican Income Tax Law).
Tax Treaties
Provisions of the Tax Treaty that may affect the taxation of certain U.S. holders (as defined below) are summarized below.
The Mexican Income Tax Law has established procedural requirements for a nonresident holder to be entitled to benefits under any of the tax treaties to which Mexico is a party, including on dispositions and dividends. These procedural requirements include, among others, the obligation to (i) prove tax treaty residence, (ii) file tax calculations made by an authorized certified public accountant or an informational tax statement, as the case may be, and (iii) appoint representatives in Mexico for taxation purposes. Parties related to the issuer may be subject to additional procedural requirements.
Payment of Dividends
Dividends, either in cash or in kind, paid with respect to LSeries B Shares A Shares, L Share ADSs or AB Share ADSs will generally be subject to a 10.0% Mexican withholding tax (provided that no Mexican withholding tax will apply to distributions of net taxable profits generated before 2014). Nonresident holders could be subject to a lower tax rate, to the extent that they are eligible for benefits under an income tax treaty to which Mexico is a party.
Taxation of Dispositions
The tax rate on income realized by a nonresident holder from a disposition of shares through the Mexican Stock
57
Exchange is generally 10.0%, which is applied to the net gain realized on the disposition. This tax is payable through withholding made by intermediaries. However, such withholding does not apply to a nonresident holder who certifies that the holder is resident in a country with which Mexico has entered into an income tax treaty.
The sale or other transfer or disposition of shares not carried out through the Mexican Stock Exchange and not held in the form of B Share ADSs will be subject to a 25% tax rate in Mexico, which is applicable to the gross proceeds realized from the sale.
Alternatively, a nonresident holder may, subject to certain requirements, elect to pay taxes on the net gain realized from the sale of shares at a rate of 35%.
The sale or disposition of B Share ADSs through securities exchanges or markets recognized under the Mexican federal tax code (which includes the NYSE) by nonresidents who are residents of a country with which Mexico has entered into an income tax treaty is not subject to income tax in Mexico under the current tax rules. The tax treatment of such transfer of B Share ADSs by nonresidents who are also not residents of a country with which Mexico has entered into an income tax treaty is not clear under the current Mexican tax rules.
Pursuant to the Tax Treaty, gains realized by a U.S. resident that is eligible to receive benefits pursuant to the Tax Treaty from the sale or other disposition of sharesSeries B Shares or B Share ADSs, even if the sale or disposition is not carried out under the circumstances described in the preceding paragraphs, will not be subject to Mexican income tax, provided that the gains are not attributable to a permanent establishment or a fixed base in Mexico, and further provided that such U.S. holder owned less than 25% of the shares representing our capital stock (including B Share ADSs), directly or indirectly, during the
12-month
period preceding such disposition. U.S. residents should consult their own tax advisors as to their possible eligibility under the Tax Treaty.Gains and gross proceeds realized by other nonresident holders that are eligible to receive benefits pursuant to other income tax treaties to which Mexico is a party may be exempt from Mexican income tax, in whole or in part.
Non-U.S.
holders should consult their own tax advisors as to their possible eligibility under such treaties.Other Mexican Taxes
A nonresident holder generally will not be liable for estate, inheritance or similar taxes with respect to its holdings of sharesSeries B Shares or B Share ADSs; provided, however, that gratuitous transfers of sharesSeries B Shares or B Share ADSs may, in certain circumstances, result in the imposition of a Mexican tax upon the recipient.
There are no Mexican stamp, issue registration or similar taxes payable by a nonresident holder with respect to sharesSeries B Shares or B Share ADSs.
U.S. FEDERAL INCOME TAX CONSIDERATIONS
The following is a summary of certain U.S. federal income tax consequences to U.S. holders (as defined below) of the acquisition, ownership and disposition of shares or ADSs. The summary does not purport to be a comprehensive description of all of the tax consequences of the acquisition, ownership or disposition of shares or ADSs. The summary applies only to U.S. holders that will hold their shares or ADSs as capital assets and does not apply to special classes of U.S. holders, such as regulated investment companies, real estate investment trusts, brokers or dealers in securities or currencies, U.S. holders (defined below) with a functional currency other than the U.S. dollar, holders of 10.0% or more of our shares measured by vote or value (whether held directly or through ADSs or both),theany alternative minimum tax, securities traders electing to account for their investment in their shares or ADSs on abasis, entities that are treated for U.S. federal income tax purposes as partnerships or other pass-through entities or equity holders therein and persons holding their shares or ADSs in a hedging transaction or as part of a straddle“straddle” or conversion transaction.transaction or as part of a “synthetic security” or other integrated financial transaction, certain U.S. expatriates and taxpayers using a taxable year other than the calendar year or U.S. holders that are engaged in a trade or business or have a permanent establishment in Mexico.
tax-exempt
organizations, banks, insurance companies or other financial institutions, holders liable for mark-to-market
For purposes of this discussion, a "U.S. holder"“U.S. holder” is a holder of shares or ADSs that is:
a citizen or resident of the United States of America,
a corporation (or other entity taxable as a corporation) organized under the laws of the United States of America or any state thereof or
otherwise subject to U.S. federal income taxation on a net income basis with respect to the shares or ADSs.
Each U.S. holder should consult such holder’s own tax advisor concerning the overall tax consequences to it of the ownership or disposition of shares or ADSs that may arise under foreign, state and local laws.
Treatment of ADSs
In general, a U.S. holder of ADSs will be treated as the owner of the shares represented by those ADSs for U.S. federal income tax purposes. Deposits or withdrawals of shares by U.S. holders in exchange for ADSs will not result in the realization of gain or loss for U.S. federal income tax
58

purposes. U.S. holders that withdraw any shares should consult their own tax advisors regarding the treatment of any foreign currency gain or loss on any Mexican pesos received in respect of such shares.
TAXATION OF DISTRIBUTIONS.
In general, a U.S. holder will treat the gross amount of distributions we pay, without reduction for Mexican withholding tax, as dividend income for U.S. federal income tax purposes to the extent of our current and accumulated earnings and profits. Because we do not expect to maintain calculations of our earnings and profits under U.S. federal income tax principles, it is expected that distributions paid to U.S. holders generally will be reported as dividends. In general, the gross amount of any dividends will be includible in the gross income of a U.S. holder as ordinary income on the day on which the dividends are received by the U.S. holder, in the case of shares, or by the depositary, in the case of ADSs.
Dividends will be paid in Mexican pesos and will be includible in the income of a U.S. holder in a U.S. dollar amount calculated by reference to the exchange rate in effect on the date that they are received by the U.S. holder, in the case of shares, or by the depositary, in the case of ADSs (regardless of whether such Mexican pesos are in fact converted into U.S. dollars on such date). If such dividends are converted into U.S. dollars on the date of such receipt, a U.S. holder generally should not be required to recognize foreign currency gain or loss in respect of the dividends. U.S. holders should consult their own tax advisors regarding the treatment of foreign currency gain or loss, if any, on any Mexican pesos received by a U.S. holder or depositary that are converted into U.S. dollars on a date subsequent to receipt. Dividends paid by us will not be eligible for the dividends-received deduction allowed to corporations under the U.S. Internal Revenue Code of 1986, as amended (the "Code"“Code”).
Subject to certain exceptions for short-term and hedged positions, the U.S. dollar amount of dividends received by an individual with respect to the shares orand ADSs will be subject
to taxation at reduced rates if the dividends are "qualified“qualified dividends."” Dividends paid on the shares orand ADSs will be treated as qualified dividends if (i) (A) the shares orand ADSs are readily tradable on an established securities market in the United States or (B) we are eligible for the benefits of a comprehensive tax treaty with the United States which the U.S. Treasury determines is satisfactory for purposes of this provision and which includes an exchange of information program, and (ii) we were not, in the year prior to the year in which the dividend was paid, and are not, in the year in which the
dividend is paid, a passive foreign investment company ("PFIC"(“PFIC”). The B Share ADSs are listed on the NYSE, and will qualify as readily tradable on an established securities market in the United States so long as they are so listed. In addition, the U.S. Treasury has determined that the Tax Treaty meets the requirements for reduced rates of taxation, and we believe we are eligible for the benefits of the Tax Treaty. Based on our audited consolidated financial statements and relevant market data, we believe that we were not treated as a PFIC for U.S. federal income tax purposes with respect to the 20202022 and 20212023 taxable years. In addition, based on our audited consolidated financial statements and our current expectations regarding the value and nature of our assets, the sources and nature of our income and relevant market data, we do not anticipate becoming a PFIC for the 20222024 taxable year. Holders of shares or ADSs should consult their own tax advisors regarding the availability of the reduced dividend tax rate in the light of their own particular circumstances.
Subject to generally applicable limitations and conditions (including a minimum holding period requirement), Mexican dividend withholding tax paid at the appropriate rate applicable to the U.S. holder may be eligible for a credit against such U.S. holder’s U.S. federal income tax liability. These generally applicable limitations and conditions include new requirements recently adopted by the U.S. Internal Revenue Service (“IRS”) in regulations promulgated in December 2021 and any Mexican tax will need to satisfy these requirements in order to be eligible to be a creditable tax for a U.S. holder. In the case of a U.S. holder that either (i) is eligible for, and properly elects, the benefits of the Tax Treaty, or (ii) consistently elects to apply a modified version of these rules under recently issued temporary guidance and complies with specific requirements set forth in such guidance, the Mexican tax on dividends will be treated as meeting the new requirements and therefore as a creditable tax. In the case of all other U.S. holders, the application of these requirements to the Mexican tax on dividends is uncertain and we have not determined whether these requirements have been met. If the Mexican dividend tax is not a creditable tax for a U.S. holder or the U.S. holder does not elect to claim a foreign tax credit for any foreign income taxes paid or accrued in the same taxable year, the U.S. holder may be able to deduct the Mexican tax in computing such U.S. holder’s taxable income for U.S. federal income tax purposes. Dividend distributions will constitute income from sources without the United States and, for U.S. holders that elect to claim foreign tax credits, generally will constitute “passive category income” for foreign tax credit purposes.
59
The availability and calculation of foreign tax credits and deductions for foreign taxes depend on a U.S. holder’s particular circumstances and involve the application of complex rules to those circumstances. The temporary guidance discussed above also indicates that the Treasury and the IRS are considering proposing amendments to the December 2021 regulations and that the temporary guidance can be relied upon until additional guidance is issued that withdraws or modifies the temporary guidance. U.S. holders should consult their own tax advisors regarding the application of these rules to their particular situations. Distributions of additional shares or ADSs to U.S. holders with respect to their shares or ADSs that are made as part of a pro rata distribution to all of our shareholders generally will not be subject to U.S. federal income tax.
TAXATION OF DISPOSITIONS.
A U.S. holder generally will recognize capital gain or loss on the sale or other taxable disposition of the shares or ADSs in an amount equal to the difference between the U.S. holder’s basis in such shares or ADSs (in U.S. dollars) and the amount realized on the disposition (in U.S. dollars, determined at the spot rate on the date of disposition if the amount realized is denominated in a foreign currency). Gain or loss recognized by a U.S. holder on such sale or other taxable disposition generally will be long-term capital gain or loss if, at the time of disposition, the shares or ADSs have been held for more than one year. Long-term capital gain recognized by a U.S. holder that is an individual is taxable at reduced rates. The deductibility of a capital loss is subject to limitations.
above also indicates that the Treasury and the IRS are considering proposing amendments to the December 2021 regulations and that the temporary guidance can be relied upon until additional guidance is eligible for and electsissued that withdraws or modifies the benefits of the Tax Treaty.temporary guidance. U.S. holders should consult their own tax advisors regarding the application of the foreign tax credit rules to their investment in, anda sale or other taxable disposition of, the shares or ADSs.ADSs and any Mexican tax imposed on such sale or disposition.
INFORMATION REPORTING AND BACKUP WITHHOLDING.
Dividends on, and proceeds from the sale or other disposition of, the shares or ADSs paid to a U.S. holder generally may be subject to the information reporting requirements of the Code and may be subject to backup withholding unless the holder:
establishes that it is an exempt recipient, if required, or
provides an accurate taxpayer identification number on a properly completed Internal Revenue ServiceIRS Form
W-9
and certifies that no loss of exemption from backup withholding has occurred.The amount of any backup withholding from a payment to a holder will be allowed as a credit against the U.S. holder’s U.S. federal income tax liability and may entitle such holder to a refund, provided that certain required information is timely furnished to the Internal Revenue Service.IRS.
U.S. Tax Consequences forholdersHolders
Non-U.S.
DISTRIBUTIONS.
A holder of shares or ADSs that is, with respect to the United States, a foreign corporation or a nonresident alien individual (a
“non-U.S.
holder”) will generally not be subject to U.S. federal income or withholding tax on dividends received on shares or ADSs, unless such income is effectively connected with the conduct by the holder of a U.S. trade or business.DISPOSITIONS.
A
non-U.S.
holder of shares or ADSs will not be subject to U.S. federal income or withholding tax on gain realized on the sale of shares or ADSs, unless:gain is effectively connected with the conduct by the holder of a U.S. trade or business or
in the case of gain realized by an individual holder, the holder is present in the United States for 183 days or more in the taxable year of the sale and certain other conditions are met.
INFORMATION REPORTING AND BACKUP WITHHOLDING.
Although
non-U.S.
holders generally are exempt from backup withholding, anon-U.S.
holder may be required to comply with certification and identification procedures in order to establish its exemption from information reporting and backup withholding.60


DIRECTORS
Our Board of Directors has broad authority to manage our company. Our bylaws provide for the Board of Directors to consist of between 5 and 21 directors and allow for the election of an equal number of alternate directors. Directors need not be shareholders. A majority of our directors and a majority of the alternate directors must be Mexican citizenscitizens.
B Shares represent our only class of shares, and elected by Mexican shareholders.
In accordance with the Mexican Securities Market Law (Ley(Ley del Mercado de Valores)Valores), the determination as to the independence of our directors is made by our shareholders, though the CNBV may challenge this determination. Pursuant to our bylaws and the Mexican Securities Market Law, at least 25.0% of our directors must be independent. In order to have a quorum for a meeting of the Board of Directors, a majority of those present must be Mexican nationals.
At a shareholders’ meeting held on November 22, 2021, Claudia Jañez Sanchez and Gisselle Morán Jiménez were designated as independent members of our Board of Directors. At the annual ordinary shareholders’ meeting held on April 20, 2022, except for Mr. Elías Ayub,29, 2024, the current members of the Board of Directors and the Executive Committee and the Audit and Corporate Practices Committee were reelected, and the Corporate Secretary and the Corporate Pro Secretary were reappointed, and Claudia Jañez Sánchez was designated as a member of the Audit and Corporate Practices Committee together with 12the former members of the Audit and Corporate Practices Committee who were reelected. All directors were elected at the annual shareholders’ meeting by the AA Shares and A Shares voting together and 2 directors elected by the L Shares.holders of our shares. 9 (approximately 64%) of the members of the Board of Directors are independent, and 3 (approximately 21%) are women.
Our bylaws provide that the members of the Board of Directors are elected for a term of one year. Pursuant to Mexican law, members of the Board continue in their positions after the expiration of their terms for up to an additional
30-day
period if new members are not elected. Furthermore, in certain circumstances provided under the Mexican Securities Market Law, the Board of Directors may elect temporary directors who then may be elected or replaced at the shareholders’ meetings.The names and positions of the members of the Board reelected or elected for the first time at the 20222024 annual general shareholders’ meeting, meeting—their term expiring in 2025—their year of birth, and information
concerning their
committee
membership and principal business activities outside América Móvil are set forth below:CARLOS SLIM DOMIT | ||
Chairman of the Board and the Executive Committee | ||
Born: | 1967 | |
First elected: | 2011 | |
Principal occupation: | Chairman of the Board of América Móvil | |
Other directorships: | Chairman of the Board of Grupo Carso and its affiliates | |
Business experience: | Chief Executive Officer of Sanborn Hermanos | |
PATRICK SLIM DOMIT | ||
Born: | 1969 | |
First elected: | 2004 | |
Principal occupation: | Cochairman of | |
Other directorships: | Director of Grupo Carso and its affiliates | |
Business experience: | Chief Executive Officer of Grupo Carso and Vice | |
DANIEL HAJJ ABOUMRAD | ||
Director and Member of the Executive Committee | ||
Born: | 1966 | |
First elected: | 2000 | |
Principal occupation: | Chief Executive Officer of América Móvil | |
Other directorships: | Director of Grupo Carso and Telmex | |
Business experience: | Chief Executive Officer of Compañía Hulera Euzkadi | |
LUIS ALEJANDRO SOBERÓN KURI | ||
Director | ||
Born: | 1960 | |
First elected: | 2000 | |
Principal occupation: | Chief Executive Officer and Chairman of the Board of | |
Other directorships: | Director of | |
Business experience: | Various positions at CIE and its affiliates | |


 ]
]