| ☐ | REGISTRATION STATEMENT PURSUANT TO SECTION 12(b) OR (g) OF THE SECURITIES EXCHANGE ACT OF 1934 |
| ☒ | ANNUAL REPORT PURSUANT TO SECTION 13 OR 15(d) OF THE SECURITIES EXCHANGE ACT OF 1934 |
| ☐ | TRANSITION REPORT PURSUANT TO SECTION 13 OR 15(d) OF THE SECURITIES EXCHANGE ACT OF 1934 |
| ☐ | SHELL COMPANY REPORT PURSUANT TO SECTION 13 OR 15(d) OF THE SECURITIES EXCHANGE ACT OF 1934 |
Title of each class: | Trading Symbol | Name of each exchange on which registered: | ||
Class A common shares, nominal value of US$0.0001 | VTEX | New York Stock Exchange |
| Large accelerated filer | ☐ | Accelerated filer | Non-accelerated filer | |||||||
| Emerging growth company | ☒ | |||||||||
| U.S. GAAP ☐ | International Financial Reporting Standards as issued | |||||||
by the International Accounting Standards Board ☒ | Other ☐ |
TABLE OF CONTENTS
1
A. | Offer and Listing Details | |||||
B. | Plan of Distribution | |||||
C. | Markets | |||||
D. | Selling Shareholders | |||||
E. | Dilution | |||||
F. | Expenses of the Issue | |||||
| ||||||
A. | Share Capital | |||||
B. | Memorandum and Articles of Association | |||||
C. | Material Contracts | |||||
D. | Exchange Controls | |||||
E. | Taxation | |||||
F. | Dividends and Paying Agents | |||||
G. | Statement by Experts | |||||
H. | Documents on Display | |||||
I. | Subsidiary Information | |||||
| Annual Report to Security Holders | 133 | ||||
Item 11. | ||||||
| ||||||
A. | Debt Securities | |||||
i
2
| ||||||
| ||||||
| ||||||
| ||||||
Item 16J. | Insider Trading Policies | 140 | ||||
Item 16K. | Cybersecurity | 140 | ||||
| 144 | ||||||
| 144 | |||||
| 144 | |||||
| 144 | |||||
ii3
PartPART I
INTRODUCTION
Forward-Looking Statements
This annual report on Form 20-F contains information that constitute forward-looking statements within the meaning of Section 27A of the Securities Act, and Section 21E of the Securities Exchange Act of 1934, as amended, or Exchange Act, that are not based on historical facts and are not assurances of future results and as such, are subject to risks and uncertainties. Many of the forward-looking statements in this annual report on Form 20-F can be identified based on forward-looking words such as “aim,” “anticipate,” “believe,” “can,” “continue,” “estimate,” “expect,” “intend,” “likely,” “may,” “might,” “plan,” “potential,” “project,” “seek,” “should,” “target,” “would,” or the opposite of these terms or other similar expressions.
Readers are cautioned not to place undue reliance on these forward-looking statements, which speak only as of the date on which they are made. There is no assurance that the expected events, trends or results will actually occur and we undertake no obligation to update publicly or revise any forward-looking statements and estimates whether as a result of new information, future events or otherwise.
Forward-looking statements include, but are not limited to, statements regarding our current belief or expectations as of the date of this annual report and estimates on future events and trends that affect or may affect our business, financial condition, results of operations, liquidity, prospects and the trading price of our Class A common shares. Although such forward-looking statements are based on assumptions and information currently available to us, which we believe to be reasonable, none of the forward-looking statements, whether expressed or implied, are indicative of or guarantee future results. Given such limitations, investors should not make any investment decision on the basis of the forward-looking statements contained herein.
our ability to attract new customers, retain existing customers and increase sales to both new or existing customers in a cost-effective manner;
|
our ability to innovate and respond to technological advances in a manner that responds to our customers’ evolving needs or preferences;
our ability to effectively develop and expand our marketing and sales capabilities and our ability to increase our customer base and achieve broader market acceptance of our platform;
our failure to enhance and maintain our brand recognition or maintain a positive public image;
the inherent risks related to the SaaS market, such as the interruption, failure or breach of our third-party service providers’ computer or information technology systems, resulting in the degradation of the quality or a decline in the use of the products and services we offer;
our ability to successfully acquire new businesses as clients, acquire clients in new industry verticals and appropriately manage our international expansion;
our ability to meet our contractual commitments with our customers and to offer high quality customer support;
general economic, political and business conditions in Latin America and their impact on our business, notably with respect to inflation and interest rates and their impact on the discretionary spending of businesses;
risks associated with macroeconomic uncertainty and geopolitical risk, including the consequences and the impacts of the ongoing conflicts between Russia-Ukraine and Hamas-Israel in the Gaza Strip, which could limit our ability to grow our business and expand to new countries;
1
the impact of substantial and increasing competition in our market, innovation by our competitors, and our ability to compete effectively;
our compliance with applicable regulatory and legislative developments and regulations and legislation that currently apply or become applicable to our business as we continue to grow;
our ability to attract and retain qualified personnel while controlling our personnel related expenses;
our ability to obtain, maintain, protect, enforce and enhance our brand and intellectual property and proprietary rights;
our ability to maintain our classification as an emerging growth company under the JOBS Act;
|
health crises, including due to pandemics and government measures taken in response thereto;
other factors that may affect our financial condition, liquidity and results of operations; and
| • | the other factors discussed under section “Risk factors” in this annual report on Form 20-F. |
Prospective investors are cautioned that any such forward-looking statements are not guarantees of future performance and involve risks and uncertainties, and that actual results may differ materially from those in the forward-looking statements. The accompanying information contained in this annual report on Form 20-F, including without limitation the information set forth under the heading “Item 5. Operating and Financial Review and Prospects,” identifies important factors that could cause such differences. In light of the risks, uncertainties and assumptions associated with forward-looking statements, investors should not place undue reliance on any forward-looking statements. Additional risks that we may currently deem immaterial or that are not presently known to us could also cause the forward-looking events discussed in this annual report on Form 20-F not to occur.
Our forward-looking statements speak only as of the date of this annual report on Form 20-F, and we do not undertake any obligation to update them in light of new information or future developments or to release publicly any revisions to these statements in order to reflect later events or circumstances or to reflect the occurrence of unanticipated events.
Certain Definitions
Unless otherwise indicated or the context otherwise requires, all references in this annual report to “VTEX” or the “Company,” “we,” “our,” “ours,” “us” or similar terms refer to VTEX.
The term “Brazil” refers to the Federative Republic of Brazil and the phrase “Brazilian government” refers to the federal government of Brazil. “Central Bank” refers to the Brazilian Central Bank (Banco Central do Brasil). References in the annual report to “real,” “reais” or “R$” refer to the Brazilian real, the official currency of Brazil and references to “U.S. dollar,” “U.S. dollars” or “US$” refer to U.S. dollars, the official currency of the United States.
Active online stores means the number of unique domains generating gross merchandise value.
APIs means application programming interfaces, a set of clearly defined methods of communication between different software components, which, together with our SDKs and other tools, enables third parties to create applications that can easily connect and integrate with our technology platform;
ARR means annual recurring revenue, calculated as subscription revenue in the most recent quarter multiplied by four;
2
Black Friday means the day after Thanksgiving, regarded as the first day of the traditional Christmas shopping season on which retailers offer special reduced prices;
2
Black November means the commercial sale season introduced by Brazilian ecommerce websites in 2010, that is the long equivalent of Black Friday;
BNDES means the Brazilian Economic and Social Development Bank (Banco Nacional de Desenvolvimento Econômico e Social);
Brick-and-mortar means a business that operates physically in a building or other structure;
Business to business (“B2B”) means a form of transaction where businesses sell products to other businesses;
Business to consumer (“B2C”) means a form of transaction where businesses sell products to end consumers or individuals;
CCPA means the California Consumer Privacy Act;
CDI means the Brazilian interbank deposit (certificado de deposito interbancário) rate, which is an average of interbank overnight rates in Brazil;
CPG means consumer packaged goods that require routine replacement or replenishment, such as food, beverages, clothes, tobacco, makeup and household products;
Digitally native brands (“DNBs”) means businesses that have only existed in the digital world primarily or entirely selling its products through an online channel;
Cohort means a group of customers that received the first invoice of our VTEX platform in the prior year;preceding 18 months, to account for average implementation and ramp-up times;.
Collaborative Commerce means an innovative approach that embraces digital collaboration with suppliers and partners enabling our customers to integrate their own proprietary software with our software and our deep network of solutions from best-of-breed partners and digital marketplaces;
Composable Commerce means our low-code development platform with a customizable and flexible back-end, decoupled storefront and pre-built integrations;
Consumers means our customers’ clients;
Content Management System (“CMS”) means a software that enables businesses to create, edit and publish digital website content without writing any code.
Conversational Commerce means ecommerce done via various means of conversation, such as live support on ecommerce websites, online chat using messaging apps, chatbots on messaging apps or websites, voice assistants.
Customer acquisition costs (“CAC”) means the total sales and marketing expenses incurred during the four quarters preceding the quarter in which the calculation is made;
Customer relationship management (“CRM”) means the technology for managing a company’s relationships and interactions with existing and potential new customers;
Customers means companies ranging from small and medium-sized businesses to larger enterprises that pay to use VTEX’s platform;
3
FCPA means the Foreign Corrupt Practices Act, a law enacted in 1977 for the purposes of making it unlawful for certain classes of persons and entities to make payments to foreign government officials to assist in obtaining or retaining business;
3
FX neutral means a way of using the average monthly exchange rates for each month during the previous year, adjusted by inflation in countries with hyper-inflation, and applying them to the corresponding months of the current year, so as to calculate what results would have been had exchange rates remained stable from one year to the next;
GDPR means General Data Protection Regulation, a law enacted in 2016 on data protection and privacy in the European Union and the European Economic Area;
Graphical user interface (“GUI”) means a computer program that enables a person to communicate with a computer through the use of symbols, visual metaphors, used by most modern operating systems.
Gross merchandise value (“GMV”) means the total value of the orders processed through our platform, including value-added taxes and shipping. Our GMV does not include the value of orders processed by our SMB platform customers or B2B transactions;
Headless means the decoupling of the front-end customer experiences from back-end commerce services giving companies the flexibility and freedom to build commerce experiences that are aligned with their business and end-consumer;
Hyperinflation means the rapid increase in monetary inflation;
Independent Software Vendor (“ISVs”) means business partners focused on developing, marketing, and selling software products independently of hardware or platform providers, creating applications, solutions, or services tailored to meet specific business or consumer needs;
Internet of Things (“IoT”) means the network of interrelated, internet-connected objects that are able to collect and transfer data over a wireless network without human intervention;
Live Shopping means the combination of video livestream, ecommerce and social media. It is interactive and shoppable content that allows merchants to bring the in-store experience online where brands can promote and sell products through livestreams on digital platforms.
Low-code development means a platform providing a development environment used to create application software through graphical user interfaces and configuration instead of traditional computer programming;
LTV means lifetime value, calculated as gross profit from new sales during the four quarters of any given period divided by the subscription churn rate of the last 12 months;
Marketplaces means online businesses that connect sellers with buyers and manage all transactions;
Multi-tenant architecture means software architecture in which a single instance of a software application serves multiple groups of customers that share a single codebase;
NRR means net revenue retention, calculated on a monthly basis by dividing the subscription revenue from our platform during the current period by the subscription revenue in the same period of the previous year for the same base of online stores that were active in the same period of the previous year;
Order management system (“OMS”) means the VTEX platform feature designed to provide a 360-degree view of inventory and orders, allowing a customer to orchestrate sellers, manage inventory and develop tailor-made shipping strategies across a series of fulfillment scenarios;
Partners means the VTEX’s ecosystem of technology businesses that embed our solutions into their own offerings allowing our customers to conduct commerce more conveniently and include providers for shipping, marketplaces, point-of-sale, omnichannel, marketing automation, search, merchandising, system integrators, agencies, payment solutions, anti-fraud and lending;
4
Payment solutions means businesses that offer technology needed to accept an end-consumer transaction on a customer’s website;
PCI acquirers means payment card industry acquirer, typically a financial institution, that processes payment card transactions for merchants and is defined by a payment brand as an acquirer;
SKUs mean stock keeping unit, a distinct type of item for sale such as a product or service;
Small-to-medium-sized businesses (“SMBs”) means businesses that utilize our Loja Integrada on-demand commerce platform;
SSS means same-store-sales calculated on a yearly basis by dividing the GMV of active online stores in the current period by the GMV of the same active online same stores in the prior period;
Subscription churn rate means the annual turnover of our customers;
Suppliers means businesses supplying materials to our customers;
System integrators (“SIs”) means business partners focused on optimizing back-end system performance;
Take rate means the percentage of the total value of the orders processed through our platform, including value-added taxes and shipping;
Two-factor authentication means a security process in which users provide two different authentication factors to verify themselves;
VTEX IO means our low-code server-less environment for our customers’ technology teams to extend our core components and build new components in an integrated environment with best-in-class scalability and security; and
VTEX Lab means our university partnership program that provides students with an immersive experience of continued learning.
Financial Information
VTEX was incorporated on July 25, 2018, as a Cayman Islands exempted company with limited liability duly registered with the Cayman Islands Registrar of Companies.
We maintain our books and records in U.S. dollars, the functional currency of our operations and the presentation currency for our financial statements. Unless otherwise noted, the financial information presented herein has been derived from our audited consolidated financial statements as of December 31, 20222023 and 20212022 and for the three years ended December 31, 2023, 2022 2021 and 2020,2021, together with the accompanying notes thereto, prepared in accordance with IFRS Accounting Standards as issued by IASB and included elsewhere in this annual report, or our consolidated financial statements
Certain amounts and percentages included in this annual report have been rounded for ease of presentation. Percentage figures included in this annual report have not been calculated in all cases on the basis of the rounded figures but on the basis of the original amounts prior to rounding. For this reason, certain percentage amounts in this annual report may vary from those obtained by performing the same calculations using the figures in our audited consolidated financial statements. The tables included in this annual report may not total due to rounding.
5
Special Note Regarding Non-GAAP Financial Measures
This annual report presents certain Non-GAAP financial measures, which are not recognized under IFRS Accounting Standards, specifically Free Cash Flow and FX Neutral measures. These Non-GAAP financial measures are provided to enhance investors’ overall understanding of our current financial performance and its prospects for the future. Specifically, we believe the Non-GAAP financial measures provide useful information to both management and investors by giving effect to certain adjustments that may not be indicative of our core operating results and business outlook.
5
Free Cash Flow and FX Neutral measures have limitations as analytical tools, and you should not consider them in isolation or as substitutes for analysis of our results of operations presented in accordance with IFRS.IFRS Accounting Standards. Additionally, our calculations of Free Cash Flow and FX Neutral measures may be different from the calculation used by other companies, including our competitors, and therefore, our measures may not be comparable to those of other companies.
Free Cash Flow
We calculate Free Cash Flow as our net cash provided by (used in) operating activities minus acquisition of property and equipment and intangibles related to acquisitions. In the future, we will adjust Free Cash Flow also by the capitalization of internally developed software; however, currently we do not capitalize internally developed software. Free Cash Flow is a measure used by management to understand and evaluate our liquidity and to generate future operating plans. The reduction of capital expenditures facilitates comparisons of our liquidity on a period-to-period basis and excludes items that we do not consider to be indicative of our liquidity. We believe that Free Cash Flow is a measure of liquidity that provides useful information to investors and others in understanding and evaluating the strength of our liquidity and future ability to generate cash that can be used for strategic opportunities or investing in our business in the same manner as our management and board of directors. Further, our definition of Free Cash Flow may differ from the definitions used by other companies and therefore comparability may be limited. Investors should consider Free Cash Flow alongside our other IFRS-basedIFRS Accounting Standards-based financial performance measures, such as net cash provided by (used in) operating activities, and our other IFRS Accounting Standards financial results.
FX Neutral measures
We provide certain metrics on an FX Neutral basis to enhance overall understanding of our current financial performance and its prospects for the future, and we understand that this measure provides useful information to both our management and investors. In particular, we believe that those FX Neutral measures provide useful information to both our management and investors by excluding the foreign currency exchange rate impact that may not be indicative of our core operating results and business outlook.
The FX Neutral measures were calculated by using the average monthly exchange rates for each month during 2020, 2021, 2022 and 2022,2023, adjusted by inflation in countries with hyper-inflation, and applying them to the corresponding months in 20212022 and 2022,2023, as applicable, so as to calculate what our results would have been had exchange rates remained stable from one year to the next.
Market Data
This annual report contains data related to economic conditions in the market in which we operate. The information contained in this annual report concerning economic conditions is based on publicly available information from third-party sources that we believe to be reliable. Market data and certain industry forecast data used in this annual report were derived from our management’s knowledge and our experience in the industry, internal reports and studies, where appropriate, as well as estimates, market research, publicly available information and industry publications. We obtained the information included in this annual report relating to the Brazilian payment solutions markets, and more broadly, the industry in which we operate, as well as the estimates concerning market shares, through internal research, public information and publications on the industry prepared by official public sources, such as the Central Bank, Getúlio Vargas Foundation (Fundação Getúlio Vargas), or FGV, Brazilian Institute for Geography and Statistics (Instituto Brasileiro de Geografia e Estatística), or IBGE, International Data Corporation, or IDC MarketScape, Gartner, Inc., or Gartner, Insider Intelligence, Digital Commerce 360, Fitch, Statista, amongst others.
6
The sources of certain statistical data, estimates, and forecasts contained in this annual report are derived from the following independent industry publications or reports:
IDC MarketScape: Worldwide B2CMidMarket B2B Digital Commerce Platforms 2020Applications 2023–2024 Vendor Assessment, doc #US45741420, September 2020;#US49742523, December 2023;
| • | 2023 Gartner® |
|
2023 Paradigm B2B Combine: Enterprise and Midmarket Editions, July 2023;
| • | The |
Paradigm B2B Combine 2022 Digital Commerce Solutions for B2B, Midmarket edition, July 2022;
|
Insider Intelligence Inc.: Latin America Retail Ecommerce Update; JanuaryDecember 2023; and
Fitch Solutions: Global Economic Outlook, JanuaryDecember 2023.; and
Statista: Latin America and the Caribbean: Gross domestic product (GDP) from 2018 to 2028, October 2023.
Gartner does not endorse any vendor, product or service depicted in its research publications and does not advise technology users to select only those vendors with the highest ratings or other designation. Gartner research publications consist of the opinions of Gartner’s research organization and should not be construed as statements of fact. Gartner disclaims all warranties, expressed or implied, with respect to its research, including any warranties of merchantability or fitness for a particular purpose.
Gartner®, Magic Quadrant and Peer Insights™ are trademarks of Gartner, Inc. and/or its affiliates. All rights reserved. Gartner® Peer InsightsInsightsTM content consists of the opinions of individual end users based on their own experiences, and should not be construed as statements of fact, nor do they represent the views of Gartner or its affiliates. Gartner does not endorse any vendor, product or service depicted in this content nor makes any warranties, expressed or implied, with respect to itsthis content, about its accuracy or completeness, including any warranties of merchantability or fitness for a particular purpose.
Industry publications, governmental publications and other market sources, including those referred to above, generally state that the information they include has been obtained from sources believed to be reliable, but that the accuracy and completeness of such information is not guaranteed. We have no reason to believe any of this information or these reports are inaccurate in any material respect and believe and act as if they are reliable. We have not independently verified it and they are subject to change based on various factors, including those discussed in “Item 3. Key Information—D. Risk Factors.” Estimates of market and industry data are based on statistical models, key assumptions and limited data sampling, and actual market and industry data may differ significantly from estimated industry data. In addition, the data that we compile internally and our estimates have not been verified by an independent source. Information derived from management’s knowledge and our experience is presented on a reasonable, good faith basis. Except as disclosed in this annual report, none of the publications, reports or other published industry sources referred to in this annual report were commissioned by us or prepared at our request. Except as disclosed in this annual report, we have not sought or obtained the consent of any of these sources to include such market data in this annual report.
The information set forth herein derived from Fitch Solutions is subject to the Fitch Solutions Terms of Use available at: https://www.fitch.group/terms-of-use#Terms-Solutions. Information contained on this website is not incorporated by reference into this annual report, and investors should not consider the information contained on this website to be part of this annual report or in deciding whether to invest in our Class A common shares.
7
Emerging Growth Company Status
We are an “emerging growth company,” as defined in Section 2(a) of the Securities Act of 1933, as amended, or the Securities Act, as modified by the Jumpstart Our Business Startups Act of 2012, or the JOBS Act. We will remain an emerging growth company until the earlier of (1) the last day of the fiscal year (a) following the fifth anniversary of the date of our first sale of our common equity securities pursuant to an effective registration statement under the Securities Act, (b) in which we have total annual revenues of at least US$1.235 billion, or (c) in which we are deemed to be a large accelerated filer, which means the market value of our common shares that is held by non-affiliates exceeds US$700.0 million as of the prior June 30 (the end of our second fiscal quarter), and (2) the date on which we have issued more than US$1.0 billion in non-convertible debt during the prior three-year period. As an emerging growth company, we are eligible to take advantage of certain exemptions from various reporting requirements that are applicable to other public companies that are not emerging growth companies, including, but not limited to, exemptions from the auditor attestation requirements of Section 404 -bof the Sarbanes-Oxley Act of 2002, or the Sarbanes-Oxley Act, and any Public Company Accounting Oversight Board, or PCAOB, rules, including any future audit rule promulgated by the PCAOB (unless the SEC determines otherwise). Accordingly, the information about us available to investors will not be the same as, and may be more limited than, the information available to shareholders of a non-emerging growth company.
IDENTITY OF DIRECTORS, SENIOR MANAGEMENT AND ADVISERS |
Not applicable.
Directors and senior management |
Not applicable.
| B. | Advisers |
Not applicable.
| C. | Auditors |
Not applicable.
| ITEM 2. | OFFER STATISTICS AND EXPECTED TIMETABLE |
Not applicable.
Offer statistics. |
Not applicable.
| B. | Method and expected timetable |
Not applicable.
| ITEM 3. | KEY INFORMATION |
| A. | [Reserved] |
| B. | Capitalization and Indebtedness |
Not applicable.
8
| C. | Reasons for the Offer and Use of Proceeds |
Not applicable.
| D. | Risk Factors |
Certain Risks Relating to Our Business and Industry
Although we have experienced significant growth in recent periods, we have recorded net losses since 2019. We may record net losses for the foreseeable future as we continue to implement our growth strategy with a high-efficiency mindset. Consequently, we may not be able to generate sufficient revenue to achieve and sustain profitability; our recent levels of growth may not be indicative of our future growth and will depend on our ability to attract new customers, retain existing customers, and increase sales to both new and existing customers, particularly if theecommerce growth in ecommerce during the COVID-19 pandemic fails to continue after the COVID-19 pandemic endsceases or consumer spending is adversely impacted by a challenging macroeconomic environment or general economic downturns.
Since 2019, we have recorded a net loss, and we expect to continue to record a net loss for the foreseeable future as we continue to implement our growth strategy. Consequently, we may not be able to generate sufficient revenue to achieve and sustain profitability. We incurred a net loss of US$52.413.7 million, US$60.552.4 million and US$0.860.5 million in the years ended December 31, 2023, 2022 2021 and 2020,2021, respectively. However, we experienced
8
resilient growth in revenue, recording a 25.3%27.8% increase in total revenue to US$201.5 million in the year ended December 31, 2023, from US$157.6 million in the year ended December 2022, and 25.3% increase in total revenue in the year ended December 31, 2022, from US$125.8 million in the year ended December 2021, and 27.5% increase in total revenue to US$125.8 million in the year ended December 31, 2021, from US$98.7 million in the year ended December 31, 2020.2021. We principally generate revenues through subscriptions plans, where we have a fixed fee and a revenue-sharing component based on a percentage charged on the customer’s GMV. Our subscription plans typically have 12-to-36-month terms. Our customers have no obligation to renew their subscriptions after their subscription term expires and have the ability to terminate their subscriptions upon short notice. As a result, even though the number of customers using our platform has grown rapidly in recent years, there can be no assurance that we will attract new customers, retain existing customers or increase sales to both new and existing customers. In addition, our results may be affected if we lose or forego income derived from commission fees charged to marketplace partners, payment providers and any other service provided through our app store with which we operate.
Our ability to grow and generate incremental revenue also depends, in part, on our ability to maintain and grow our relationships with existing customers (including any customers acquired in connection with our acquisitions) and to have them increase their usage of our platform. If our customers do not increase their use of our products, our revenue may decline, and our results of operations may be harmed. Customers are charged based on the usage of our products. Most of our customers do not have long-term contractual arrangements with us, and, therefore, most of our customers may reduce or cease their use of our products at any time without penalty or termination charges. Customers may terminate or reduce their use of our products for any number of reasons, including if they are not satisfied with our products, the value proposition of our products or our ability to meet their needs and expectations. The loss of customers or reductions in their usage levels of our products may have a negative impact on our business, results of operations and financial condition. If a significant number of customers cease using or reduce their usage of our products, we may be required to spend significantly more on sales and marketing than we currently plan to spend in order to maintain or increase revenue from customers. Such additional sales and marketing expenditures could adversely affect our business, results of operations and financial condition.
Furthermore, in future periods, we may not be able to attract new customers and sustain revenue growth consistent with our recent growth, or at all. We believe our ability to attract new customers and our revenue growth depends on a number of factors, including:
reductions in our current or potential customers’ spending levels;
competitive factors affecting the software as a service, or SaaS, business software applications market, including the introduction of competing platforms, discount pricing and other strategies that may be implemented by our competitors;
9
our ability to execute our growth strategy and operating plans;
a decline in our customers’ level of satisfaction with our platform and customers’ usage of our platform;
changes in our relationships with third parties, including our business partners, app developers, theme designers, referral sources and payment processors;
the timeliness and success of our solutions;
the frequency and severity of any system outages;
technological change;
our ability to adequately obtain, maintain, protect and enforce our intellectual property and proprietary rights;
concerns relating to actual or perceived privacy or security breaches;
9
| • | the continued willingness of the end-consumers of our customers to use the internet for commerce; and |
our focus on long-term value over short-term results, through strategic decisions that may not maximize our short-term revenue or profitability if we believe that the decisions are consistent with our mission and will improve our financial performance over the long term.
As a result of the foregoing factors, it is difficult for us to forecast our future revenue or revenue growth. If our assumptions are incorrect or change in reaction to changes in our market, or if we are unable to maintain consistent revenue or revenue growth, the price of our Class A common shares could be volatile, and it may be difficult to achieve and maintain profitability. Investors should not rely on our revenue for any prior periods as any indication of our future revenue or revenue growth.
The restrictions imposed by the COVID-19 pandemic have prompted a shift in sales from traditional brick-and-mortar commerce to ecommerce that benefited our business in 2020. Even though the online purchasing trend demonstrated to have staying power through 2021 and 2022, we started to see a mean reversion towards the pre-pandemic ecommerce levels of growth and , there can be no assurance that once the COVID-19 pandemic is sufficiently controlled, this current ecommerce levels of growth will continue and that we will continue to benefit from it. For further information, see “—The COVID-19 pandemic could materially adversely affect our business, financial condition and results of operations.”
Also, to the extent there is a challenging macroeconomic environment or sustained general economic downturn which adversely impact consumer spending in the countries in which we operate or our software is perceived by customers and potential customers as costly, or too difficult to deploy or migrate to, our revenue may be disproportionately affected. Our revenue may also be disproportionately affected by delays or reductions in general information technology spending. Competitors, many of whom are larger and more established than we are, may respond to market conditions by lowering prices and attempting to lure away our customers. We cannot predict the timing, strength, or duration of any economic slowdown, instability, or recovery, generally or within any particular industry. If macroeconomic conditions of or the markets in which we operate worsen from present levels, our business, results of operations and financial condition could be materially and adversely affected.
If we are unable to attract new customers in a cost-effective manner, then our business, results of operations and financial condition would be adversely affected.
We may be unable to attract new customers in a cost-effective manner. We use a variety of marketing channels to promote our products and platform, such as participating in and sponsoring industry events, developer events and developer evangelism, as well as search engine marketing and optimization. We periodically adjust the mix of our other marketing initiatives such as regional customer events, email campaigns, billboard advertising and public relations initiatives. If the cost of the marketing channels we use increase dramatically, then we may choose to use alternative and less expensive channels, which may not be as effective as the channels we currently use. As we add to, or change, the mix of our marketing strategies, we may also need to expand into more expensive channels than those we are currently in, which could adversely affect our business, results of operations and financial condition. We incur marketing expenses before we are able to recognize any revenue that the related marketing initiatives may generate, and these expenses may not result in increased revenue or brand awareness. We have made in the past, and may make in the future, significant expenditures and investments in new marketing campaigns, and we cannot guarantee that any such investments will lead to the cost-effective acquisition of new customers. If we are unable to maintain effective marketing initiatives, our ability to attract new customers could be materially and adversely affected, our advertising and marketing expenses could increase significantly, and our results of operations may suffer.
10
The COVID-19 pandemic could materially adversely affect our business, financial condition and results of operations.
The COVID-19 pandemic, the measures attempting to contain and mitigate the effects of the COVID-19 pandemic, including stay-at-home, business closure, and other restrictive orders, and the resulting changes in consumer behavior, have disrupted our normal operations and impacted our employees, suppliers, partners and customers. In response to the COVID-19 pandemic, we have taken a number of actions that have impacted, and continue to impact, our business, including transitioning employees across all our offices (including our corporate headquarters) to remote work-from-home arrangements and imposing travel and other related restrictions. Given the continued spread of the COVID-19 pandemic and the resulting personal, economic and governmental reactions, we may have to implement additional measures in the future that could harm our business, financial condition and results of operations. We continue to monitor the impacts of the COVID-19 pandemic and may adjust our current policies as more information and guidance become available. For instance, during the course of the pandemic we have taken several measures to monitor and mitigate the effects of COVID-19, such as safety and health measures for our directors and employees (such as social distancing and working from home).
In response to the COVID-19 pandemic, in 2020 and 2021, governments across the countries in which we operate have instituted lockdowns, social distancing, and similar measures to slow infection rates. These restrictions have prompted shifts in sales from traditional brick-and-mortar commerce to ecommerce, which has increased the usage of our services. Even though the online purchasing trend demonstrated to have staying power through 2021 and 2022, we started to see a mean reversion towards the pre-pandemic ecommerce levels of growth. Our customer’s online channels experienced a decrease in growth rates, which affected our business growth, financial condition, and operating results.
The full impact of the pandemic on our business will continue to depend on future developments, including but not limited to the emergence of new coronavirus variants, the duration of the pandemic, the actions undertaken to contain the virus or mitigate its impacts, including actions mandated by federal, state and local governments and health authorities, changing public health directives or restrictions, vaccine efficacy against COVID-19 variants, current or future travel restrictions, and how quickly and to what extent normal global economic and operating conditions can or will resume. All of these factors are rapidly evolving and are difficult to predict, and as a result, it is uncertain what the future holds for our business and the industry as a whole.
If we fail to improve, enhance or innovate the features, functionality, performance, reliability, design, security and scalability of our platform in a manner that responds to our customers’ evolving needs or preferences, our business may be adversely affected and we may become subject to performance or warranty claims, and we may incur significant costs. Our services must also integrate with a variety of operating systems, software, hardware and networks. If we are unable to ensure that our services or hardware interoperate with such operating systems, software, hardware and networks, our business may be materially and adversely affected.
The markets in which we compete are characterized by constant change and innovation, and we expect them to continue to evolve rapidly. Our success has been based primarily on our ability to identify and anticipate the needs of our customers and design a platform that provides them with the tools they need to operate and grow their businesses by giving them the ability to access our platform 24 hours a day, 7 days a week, without interruption or performance degradation. Our ability to attract new customers, retain existing customers and increase sales to both new and existing customers will depend in large part on our ability to continue to improve and enhance the functionality, performance, reliability, design, security and scalability of our platform, as well as offering new solutions that appeal to our customers as their business needs evolve.
Our platform must also integrate with a variety of third-party network, hardware, mobile, and software platforms and technologies. We need to continuously modify, enhance and introduce new features to our platform to adapt to changes and innovation in these technologies. Any changes in these systems or networks that degrade the functionality of our platform, impose additional costs or requirements on us, or give preferential treatment to competitive services, including their own services, could materially and adversely affect usage of our platform. If businesses widely adopt new ecommerce technologies, we would have to develop new functionalities for our platform to be compatible with those new technologies, which we may not be able to do in a timely and cost-effective manner. These development efforts may require significant engineering, marketing and sales resources, all of which would affect our business and operating results, and there can be no assurance that such efforts will be successful. Any failure of our platform to operate effectively with future technologies could reduce the demand for our platform. If we are unable to respond to these changes in a cost-effective manner, our platform may become less marketable and less competitive or obsolete, and our operating results may be negatively affected.
11
Our customers use our services for processes that are critical to their businesses. Errors, defects, security vulnerabilities, service interruptions or software bugs in our platform, whether in connection with day-to-day operation, upgrades or otherwise, could result in losses to our customers, harm our reputation, and result in reduced sales or a loss of, or delay in, the market acceptance of our solutions. Prolonged interruption in the availability, or the reduction in functionality, of our platform or solutions, or frequent or persistent interruptions in accessing our platform, could cause customers to believe that our platform is unreliable and could materially harm our reputation and business. Our customers may seek significant compensation from us for any losses they suffer in connection with such performance issues or cease conducting business with us altogether by terminating their contracts or electing not to renew their subscriptions. Further, a customer could share information about bad experiences on social media, which could result in damage to our reputation and loss of future sales. There can be no assurance that provisions typically included in our agreements with our customers that attempt to limit our exposure to claims related to our platform would be enforceable or adequate or would otherwise protect us from liabilities or damages with respect to any particular claim, and our insurance policies may be insufficient to cover such claims. Even if not successful, a claim brought against us by any of our customers would likely be time-consuming and costly to defend and could seriously damage our reputation and brand, making it harder for us to sell our solutions.
From time to time, we have found defects or errors in our platform and may discover additional defects or errors in the future that could result in, among other issues, data unavailability, unauthorized access to, loss, corruption, or other harm to our customers’ data. We may not be able to detect and correct defects or errors before the release of solutions on our platform. Consequently, we or our customers may discover defects or errors after such solutions have been released on our platform. We implement bug fixes and upgrades as part of our regularly scheduled system maintenance, but such maintenance may adequately address all defects or errors in our platform.
11
Furthermore, if we do not complete this maintenance according to schedule or if customers are otherwise dissatisfied with the frequency and/or duration of our maintenance services and related system outages, customers could terminate their contracts, or delay or withhold payment to us, or cause us to issue credits, make refunds, or pay penalties. The costs incurred or delays resulting from the correction of defects or errors in our software or other performance problems may be substantial and could adversely affect our operating results.
In such events, we may also be required, or may choose, for customer relations or other reasons, to expend additional resources in order to help correct the problem. In addition, we may not carry insurance sufficient to compensate us for any losses that may result from claims arising from defects or disruptions in our products. As a result, our reputation and our brand could be harmed, and our business, results of operations and financial condition may be adversely affected.
Failure to effectively develop and expand our marketing and sales capabilities could harm our ability to increase our customer base and achieve broader market acceptance of our platform. If we are not able to hire, develop and retain talented marketing personnel, or if our new marketing personnel are unable to develop and execute efficient inbound and branding marketing programs in a reasonable period of time, or if our sales and marketing strategies are not effective to generate traffic and build a top of mind brand, our ability to attract new customers may be impaired.
Our ability to increase our customer base and achieve broader market acceptance of our platform will depend on our ability to expand our marketing and sales operations. We plan to continue expanding our sales force and strategic business partners, both domestically and internationally. We may not achieve anticipated revenue growth from expanding our sales force if we are unable to hire, develop and retain talented sales personnel, if our new sales personnel are unable to achieve desired productivity levels in a reasonable period of time, or if our sales and marketing programs are not effective. Our business and operating results may be adversely affected if our sales and marketing efforts do not generate a corresponding increase in revenue.
We also plan to dedicate significant resources to sales and marketing programs, including search engine and other online advertising with respect to our small and medium business, or SMB platform, online stores, which represented less than 7.0% of our revenues in the year ended December 31, 2022.2023. The effectiveness of our online advertising may continue to vary due to competition for key search terms, changes in search engine use, and changes in search algorithms used by major search engines and other digital marketing platforms. If the cost of marketing our platform over search engines or other digital marketing platforms increases, our business and operating results could be adversely affected. Competitors also may bid on the search terms that we use to drive traffic to our website. Such actions could increase our marketing costs and result in decreased traffic to our website
12
If we fail to maintain or grow our brand recognition, our ability to expand our customer base will be impaired and our financial condition may suffer.
We believe that maintaining and growing the VTEX brand is important to supporting continued acceptance of our existing and future solutions, attracting new customers to our platform, and retaining existing customers. We also believe that the importance of brand recognition will increase as competition in our market increases. Successfully maintaining our brand will depend largely on the effectiveness of our marketing efforts, our ability to foster brand advocates from customers, partners and top-tier analyst firms, our ability to provide a reliable and useful platform to meet the needs of our customers at competitive prices, our ability to maintain our customers’ trust, our ability to continue to develop new functionalities and solutions, and our ability to successfully differentiate our platform from competitive products and services. Additionally, our business partners’ performance may affect our brand and reputation if customers do not have a positive experience. Our efforts to build and maintain our brand have involved and will continue to involve significant expenses. Brand promotion activities may not generate customer awareness or yield increased revenue. Even if they do, any increased revenue may not offset the expenses we incurred in building our brand. We strive to establish and maintain our brand in part by obtaining trademark rights. However, if our trademarks are not adequately protected, we may not be able to build name recognition in our markets of interest and our competitive position may be harmed. If we fail to successfully promote, protect and maintain our brand, we may fail to attract enough new customers or retain our existing customers to realize a sufficient return on our brand-building efforts, and our business could suffer.
12
We face intense competition, especially from well-established companies offering solutions and related applications. We may lack sufficient financial or other resources to maintain or improve our competitive position, which may harm our ability to add new customers, retain existing customers and grow our business.
The market for ecommerce solutions is evolving and highly competitive. We expect competition to increase in the future from established competitors and new market entrants. WithWe expect competition to persist and intensify in the future with the introduction of new technologies (such as artificial intelligence) and the entry of new companies into the market, we expect competition to persist and intensify in the future.market. This could harm our ability to increase sales, maintain or increase renewals and maintain our prices. We face intense competition from other software companies that may offer related ecommerce platform software solutions and services. Our competitors include larger companies that have acquired ecommerce platform solution providers in recent years. We also compete with custom software internally developed within ecommerce businesses. Our primary competitors are SAP Hybris, Oracle Commerce, Magento (an Adobe company), Salesforce Commerce Cloud (formerly known as Demandware), and Shopify Plus. In addition, we face competition from niche companies that offer point products that attempt to address certain of the problems that our platform solves.
Many of our existing competitors have, and our potential competitors could have, substantial competitive advantages such as greater name recognition, longer operating histories, larger sales and marketing budgets and resources, greater customer support resources, lower labor and development costs, larger and more mature intellectual property portfolios, and substantially greater financial, technical and other resources.
Some of our larger competitors also have substantially broader product lines that may allow them to offer a broader suite of products to retailers than we can. Conditions in our market could change rapidly and significantly as a result of technological advancements, partnering by our competitors, or continuing market consolidation. New start-up companies that innovate, and large companies that are making significant investments in research and development, may invent similar or superior products and technologies that compete with our platform.
Mergers and acquisition activity in the technology industry could increase the likelihood that we compete with other large technology companies. In addition, some of our competitors may enter into new alliances with each other or may establish or strengthen cooperative relationships with agency partners, technology and application providers in complementary categories, or other parties. Furthermore, ecommerce on large online marketplaces could increase as a percentage of all ecommerce activity, thereby reducing customer traffic to individual customer websites. Any such consolidation, acquisition, alliance or cooperative relationship could lead to pricing pressure, a loss of market share, or a smaller addressable share of the market. It could also result in a competitor with greater financial, technical, marketing, service and other resources, all of which could harm our ability to compete.
13
Some of our larger competitors use broader product offerings to compete by bundling their product, or by closing access to their technology platform. Our potential customers may worry about disadvantages associated with switching platform providers, such as a loss of accustomed functionality, increased costs and business disruption. As a result, certain potential customers may resist changing vendors. We will seek to overcome this resistance through strategies such as making investments to improve the functionality of our solutions vis-à-vis the products and solutions offered by our competitors. However, there can be no assurance that our strategies for overcoming potential customers’ reluctance to change vendors will be successful, and this resistance may adversely affect our growth plans. These competitive pressures in our market, or our failure to compete effectively, may result in price reductions, less orders, reduced revenue and gross margins, increased net losses and loss of market share. Any failure to meet and address these factors could harm our business, results of operations and financial condition.
We may need to reduce or change our pricing model to remain competitive.
We price our fixed subscription fee and our transaction-based fee with our customers based on a combination of GMV they transact on our platform. We expect that we may need to change our pricing from time to time. As new or existing competitors introduce products that compete with ours or reduce their prices, we may be unable to attract new customers or retain existing customers. We must also determine the appropriate price to enable us to compete effectively internationally. Small, mid-market and large enterprise customers may demand substantial price discounts as part of the negotiation of sales contracts. As a result, we may be required or choose to reduce our prices or otherwise change our pricing model, which could adversely affect our business, operating results and financial condition.
Our sales cycle with our customers can be long and unpredictable, and our sales efforts require considerable time and expense.
The timing of our sales with our customers and related revenue recognition is difficult to predict because of the length and unpredictability of the sales cycle for these customers. Mid-market and large enterprise customers, particularly those in highly regulated industries and those requiring customized applications, may have an even further lengthy sales cycle for the evaluation and implementation of our platform. This caused and may continue to cause a delay between increasing operating expenses for such sales efforts and, upon successful sales, the generation of corresponding revenue. We are often required to spend significant time and resources to better educate our potential customers and familiarize them with our platform. Our sales cycle for these customers, from initial evaluation to contract execution, is generally 8 to 12 months for large enterprise customers and 4 to 8 months for small and mid-market customers, but can vary substantially.
In 2022, the challenging and uncertain macroeconomic environment influenced our customers’ planning and decision-making processes. Consequently, our sales cycle has been at the high end of the sales cycle ranges, while we also experienced an increase in the average time to implement the VTEX platform with our customers. Additionally, towards the end of the year, we also faced longer than usual ramp-up times from customers that recently implemented the VTEX platform.
As a result, a significant portion of our revenue is generated from the recognition of contract liabilities from contracts entered into with customers during prior periods. Customers often view our revenue sharing arrangements and subscription to our ecommerce platform and services as a strategic decision requiring significant investment. As a result, customers frequently require considerable time to evaluate, test and qualify our platform prior to entering into or expanding a subscription. During the sales cycle, we spend significant time and resources on sales and marketing and contract negotiation activities, which may not result in a sale. Additional factors that may influence the length and variability of our sales cycle include:
|
1413
the discretionary nature of purchasing and budget cycles and decisions;
the obstacles placed by customers’ procurement process;
|
customers’ integration complexity;
customers’ familiarity with SaaS ecommerce solutions;
customers’ evaluation of competing products during the purchasing process; and
evolving customer demands.
Given these factors, it is difficult to predict whether and when a sale will be completed, and when revenue from a sale will be recognized. Consequently, a shortfall in demand for our solutions and services or a decline in new or renewed contracts in a given period may not significantly reduce our revenue for that period but could negatively affect our revenue in future periods.
The estimates of market opportunity and forecasts of market growth included in this annual report may prove to be inaccurate. Even if the market in which we compete achieves the forecasted growth, our business could fail to grow at similar rates, if at all.
The market for ecommerce solutions is relatively new and will experience changes over time. Ecommerce market estimates and growth forecasts are uncertain and based on assumptions and estimates that may be inaccurate. Our addressable market depends on a number of factors, including businesses’ desire to differentiate themselves through ecommerce, partnership opportunities, changes in the competitive landscape, technological changes, data security or privacy concerns, customer budgetary constraints, changes in business practices, changes in the regulatory environment, and changes in economic conditions. Our estimates and forecasts relating to the size and expected growth of our market may prove to be inaccurate and our ability to produce accurate estimates and forecasts may in the future be impacted by the macroeconomic uncertainty. Even if the market in which we compete meets the size estimates and growth rates we forecast, our business could fail to grow at similar rates, if at all.
Our business is susceptible to risks associated with international sales and the use of our platform in various countries.
We currently have customers in 3843 countries. In the years ended December 31, 20222023 and 20212022 we generated 45.4%45.7% and 47.2%45.4% of our total revenue from customers outside Brazil. Besides Brazil, we currently have customers in Argentina, Chile, Colombia, France, Italy, Mexico, Peru, Portugal, Romania, Singapore, Spain, the United Kingdom and the United States, among other 2429 countries. We are continuing to adapt and develop strategies to address international markets, but such efforts may not be successful. In addition, the COVID-19 pandemic and related stay-at-home, business closures, and other restrictive orders and travel restrictions in some countries may pose additional challenges for international expansion and may impact our ability to launch into new regions and further expand geographically.
In addition, part of our growth strategy is to further expand our operations and customer base internationally. Business expansion and development in new jurisdictions may expose us to risk related to staffing and managing cross border operations, reduced brand awareness in new markets and lack of acceptance of our products and services, competition with established local competitors and increased costs and difficulty protecting intellectual property and sensitive data, tariffs and other trade barriers, differing and potentially adverse tax consequences, increased and conflicting regulatory compliance requirements (including with respect to privacy, security and labor), challenges caused by distance, language and cultural differences, exchange rate risk and political instability. Accordingly, our efforts to develop and expand the geographic footprint of our operations may not be successful, which could limit our ability to grow our business.
15
Our sales and the use of our platform in various countries subject us to risks that include, but are not limited to:
the difficulty of managing and staffing international operations and the increased operations, travel, infrastructure and legal compliance costs associated with servicing international customers and operating numerous international locations;
difficulties in managing systems integrators and technology partners;
differing technology standards;
our ability to effectively price our products in competitive international markets;
new and different sources of competition or other changes to our current competitive landscape;
understanding and reconciling different technical standards, data privacy and telecommunications regulations, registration and certification requirements outside of Brazil, which could prevent customers from deploying our products or limit their usage;
| • | our ability to comply with Brazilian Federal Law No. 13,709/2018, as amended (Lei Geral de Proteção de Dados Pessoais), or the LGPD, and laws, regulations and industry standards relating to data privacy, data localization and security enacted in countries and other regions in which we operate or do business; |
14
potentially greater difficulty collecting trade receivable and longer payment cycles;
higher or more variable network service provider fees outside of Brazil;
the need to adapt and localize our products for specific countries;
the need to offer customer support in various languages;
lack of familiarity and burdens and complexity involved with complying with multiple, conflicting and changing foreign laws, standards, regulatory requirements, tariffs, export controls and other barriers;
greater difficulty in enforcing contracts, including our universal terms of service and other agreements;
differing labor regulations, where labor laws are generally more advantageous to employees as compared to the United States, including deemed hourly wage and overtime regulations in these locations;
reduced or uncertain protection for intellectual property rights in some countries;
compliance with various anti-bribery and anti-corruption laws such as the U.S. Foreign Corrupt Practices Act, the U.S. domestic bribery statute contained in 18 U.S.C. § 201, the U.S. Travel Act, the Brazilian Federal Law No. 12,846/2013, as amended, or the Brazilian Anticorruption Law, the UK Bribery Act of 2010, the UK Proceeds of Crime Act 2002, and similar laws and regulations in other jurisdictions;
| • | changes in international trade policies, tariffs and other non-tariff barriers, such as quotas and local content rules; |
16
more limited protection for intellectual property rights in some countries;
compliance with (1) tax regulations in the countries in which we operate, including the complexities of foreign value-added tax (or other tax) systems and restrictions on the repatriation of earnings, which may lead to unintended abusive planning, penalties and reputational risk, or being deemed a permanent establishment and (2) payment obligations of tax on digital services in jurisdictions where we do not have legal presence;
currency exchange rate fluctuations and the resulting effect on our revenue and expenses, and the cost and risk of entering into hedging transactions if we chose to do so in the future;
restrictions on the transfer of funds;
deterioration of political relations between Brazil and other countries;
|
the impact of natural disasters and public health epidemics on employees, contingent workers, partners, travel and the global economy and the ability to operate freely and effectively in a region that may be fully or partially on lockdown; and
political or social unrest or economic instability in a specific country or region in which we operate, which could have an adverse impact on our operations in that location.
impact and effects arising from the conflict between Russia and Ukraine.Ukraine and the recent attack by Hamas on Israel from the Gaza Strip.
15
These factors may cause our international costs of doing business to exceed our comparable domestic costs and may also require significant management attention and financial resources. Our future expansion efforts that we undertake may not be successful. Our failure to manage any of these risks successfully could harm our international operations, and adversely affect our business, results of operations and financial condition. If we invest substantial time and resources to expand our international operations and are unable to do so successfully, our business and operating results will suffer.
In addition, our business involves interactions with various third parties, and our customers have international operations, being subject to the aforementioned risks. Third-party entities, including service providers, suppliers, and distributors, may encounter difficulties in delivering essential services, products, or technologies within stipulated timeframes, potentially causing disruptions that could adversely affect our business and reputation. These risks may also influence our customers’ demand for our products, services, and solutions. Moreover, a disturbance in global financial markets poses a potential threat to our banking partners, critical for our operational cash management and capital market transactions. Such disruptions could further have adverse consequences, potentially hindering our customers’ ability to fulfill payment obligations due to delays or limitations in accessing their existing cash reserves.
We provide service or experience level commitments under our customer agreements. If we fail to meet these contractual commitments, our business, results of operations and financial condition could be adversely affected.
Our agreements with customers typically provide for service or experience level commitments that contain guarantees on certain performance metrics, such as uptime starting from 99.7% and maximum latency. If we suffer extended periods of downtime for our products or platform and we are unable to meet these commitments, we are contractually obligated to provide our customer a service credit of up to 20% of the monthly fees payable to us by such customer. In addition, the performance and availability of our third-party service providers, including Amazon Web Services, or AWS, which provides our cloud infrastructures, is outside of our control and, therefore, we are not in full control of whether we can meet our service level commitments. Any of the above circumstances or events may harm our reputation, cause customers to terminate their agreements with us, impair our ability to grow our customer base, subject us to contractual penalties in the form of service credits under our service level agreements, or SLAs, and otherwise harm our business, results of operations and financial condition.
If we fail to offer high-quality customer support, our business and reputation could suffer.
Our customers rely on our personnel for support related to their subscription and customer solutions. High-quality support is important for the renewal and expansion of our agreements with existing customers. The importance of high-quality support, including with respect to multiple cloud support, will increase as we expand our business and pursue new customers, particularly mid-market and large enterprise customers. If we do not help our customers quickly resolve issues and provide effective ongoing support, our ability to sell new software to existing and new customers could suffer and our reputation with existing or potential customers could be harmed.
17
If we are unable to hire, retain and motivate qualified personnel, our business will suffer.
Our future success depends, in part, on our ability to continue to attract and retain highly skilled personnel. The inability to attract or retain qualified personnel or delays in hiring required personnel may seriously harm our business, financial condition and operating results. Our ability to continue to attract and retain highly skilled personnel, specifically employees with technical and engineering skills and employees with high levels of experience in designing and developing software and internet-related services, will be critical to our future success. Competition for highly skilled personnel in Brazil and some of the countries in which we operate can be intense due in part to the more limited pool of qualified personnel as compared to other places in the world, and we have experienced difficulties hiring employees from foreign jurisdictions to work in our offices. In addition, to the extent we hire personnel from competitors, we may be subject to allegations that they have been improperly solicited by us or divulged proprietary or other confidential information to us.
16
As our operations expand, we will require additional engineering support staff to sustain the increased use of our platform and services. If we are unable to adequately and timely grow our engineering support team or the overall quality of our current team diminishes significantly, our resources may be diverted to fixing existing errors, defects, security vulnerabilities, service interruptions or software bugs, instead of providing additional services to customers. While we may enhance our offering through acquisitions, the overall quality and cohesiveness of our product may be impaired. Failure to properly integrate the engineering support staff and activities of any of our acquired companies may result in the diversion of attention of staff to migrations and integration issues rather than focusing on the continued improvement of our platform and services.
While we issue stock options or other equity awards as key components of our overall compensation and employee attraction and retention efforts, we are required under IFRS Accounting Standards to recognize compensation expense in our operating results for employee stock-based compensation under our equity grant programs, which may increase the pressure to limit stock-based compensation and jeopardize our ability to hire, retain and motivate qualified personnel.
The loss of our qualified personnel, as well as any difficulty to attract and replace them in a timely manner, may cause an adverse effect on our business and results of operations.
We are dependent on the continued services and performance of our senior management and other key employees, the loss of any of whom could adversely affect our business, operating results and financial condition.
Our future performance depends on the continued services and contributions of our senior management, including our Founders and Co-Chief Executive Officers, Geraldo do Carmo Thomaz Júnior and Mariano Gomide de Faria, and other key employees to execute on our business plan and to identify and pursue new opportunities and product innovations. The loss of one or more of our executive officers or key employees could have a serious adverse effect on our business causing significant delays or prevent the achievement of our strategic objectives. We do not have employment agreements with our executive officers or other key personnel that require them to continue to work for us for any specified period; therefore, they could terminate their employment with us at any time. In addition, some of the members of our current senior management team have only been working together for a short period of time, which could adversely impact our ability to achieve our goals. From time to time, there may be changes in our senior management team resulting from the hiring or departure of executives, which could disrupt our business. The loss of the services of one or more of our senior management or other key employees for any reason could adversely affect our business, financial condition and operating results and require significant amounts of time, training and resources to find suitable replacements and integrate them within our business, and could affect our corporate culture. In addition, if the perceived value of our stock awards declines, it may adversely affect our ability to recruit and retain highly skilled employees. If we fail to attract new personnel or fail to retain and motivate our current personnel, it could adversely affect our business and future growth prospects.
18
Our success depends in part on our business partner-centric strategy. Our business would be harmed if we fail to maintain or expand our partner relationships.
Strategic technology business partnerships are essential to our competitive strategy. A significant percentage of our customers choose to integrate our ecommerce platform with third-party application providers using our open APIs and software development kits. The functionality and popularity of our platform depends, in part, on our ability to integrate our platform with third-party applications and platforms, including marketplaces and social media sites. We are dependent on strategic technology partner solutions for major ecommerce categories, including payments (through providers such as Paypal, Adyen, Stripe, Mercado Pago and EBANX), shipping, tax, accounting, ERP, marketing, fulfillment, cross-channel commerce and point of sale system, or POS. We will continue to depend on various third-party relationships to sustain and grow our business. Third-party application providers may change the features of their applications and platforms, alter their governing terms, and restrict our ability to add, customize or integrate systems, functionality and consumer experiences. Such changes could limit or terminate our ability to use these third-party applications and platforms as part of our effort to provide our customers a highly extensible and customizable experience. This could negatively impact our offerings and harm our business. Marketplaces or social networks that have allowed limited integration into their platforms, such as Dafiti, Mercado Libre, Amazon, Tik Tok, Facebook and Instagram, may discontinue our access or allow other platforms to integrate with their platforms more easily, which would increase competition for ecommerce platforms across their solutions. Our business will be negatively impacted if we fail to retain our technology partner relationships for any reason, including contractual disputes, failure to support their or our technology or integrations, errors, bugs, or defects in our or their technology, or changes in our or their platforms. Any failure to maintain such relationships could harm our relationship with our customers, our reputation and brand, our revenue, our business and our results of operations.
17
Strategic technology partners and third parties may not be successful in building integrations, co-marketing our platform to provide a significant volume and quality of lead referrals, or continuing to work with us as their products evolve. Identifying, negotiating and documenting relationships with additional strategic technology of partners requires significant resources. Integrating third-party technology can be complex, costly and time-consuming, and third parties may be unwilling to build such necessary integrations. Consequently, we may be required to devote additional resources to develop integrations for business applications on our own. Providers of business applications with which we have integrations may decide to compete with us or enter into arrangements with our competitors, resulting in such providers withdrawing support for our integrations. Any failure of our platform to operate effectively with third-party business applications could reduce the demand for our platform, resulting in customer dissatisfaction and harm to our business. If we are unable to respond to these changes or failures in a cost-effective manner, our platform may become less marketable, less competitive, or obsolete, and our results of operations may be negatively impacted.
We also leverage the sales and referral resources of agency and referral partners through a variety of programs. If we are unable to effectively utilize, maintain and expand these relationships, our revenue growth would slow, we would need to devote additional resources to the development, sales and marketing of our platform, and our financial results and future growth prospects would be harmed. Our referral partners may also demand greater referral fees or commissions, which would increase our costs.
A cyberattack, security breach or other unauthorized access or interruption to our information technology systems or those of our third-party service providers could delay or interrupt service to our customers and their customers, harm our reputation or subject us to significant liability.
We collect, transmit, use, disclose, store and process personal information, including credit card information and other confidential information, of our employees, our business partners, our customers and their end-consumers. Third-party applications may also collect, transmit, use, disclose, store and process such personal information, credit card information and other confidential information. In addition, third-party applications may run arbitrary code within our infrastructure without our consent or knowledge to extend access to our platform. We cannot and do not proactively monitor the content that our customers upload or the information provided to us through the applications integrated with our ecommerce platform; therefore, we do not control the substance of the content on our servers, which may include personal information. Although we require users of our ecommerce platform to adopt and secure credentials in order to access it and use encryption and authentication technologies to secure the transmission and storage of data, these security measures may be compromised as a result of illegal activities by unauthorized persons, employee error, malfeasance, faulty credential management, or other irregularity which may cause unauthorized access to our customers’ - and their end consumers’ - data in our platform. Also, our employees customers, or customers contractors may inadvertently or be fraudulently instructed by third parties to disclose credentials, usernames, passwords or other access keys , which may, in turn, be used to access our ecommerce platform, commit identity theft or carry out other prohibited activities, including the irregular collection and use of personal information of our customers and their end-consumers.
19
We also use third-party service providers and subprocessors to help us deliver services to customers and their end-consumers. These service providers and subprocessors may also collect, transmit, use, disclose, store and process personal information, credit card information and/or other confidential information of our employees and customers. Additionally, while we believe we comply with Payment Card Industry Data Security Standard, or PCI DSS, our subprocessors may not. This information, and the information technology systems that store such information, have in the past and may in the future be the target of unauthorized access or intrusion, or subject to security breaches and other incidents, including as a result of third-party action, employee or contractor error, nation state malfeasance, malware, phishing, computer hackers, system error, software bugs or defects, process failure or otherwise. Cybersecurity threats, privacy breaches, insider threats or other incidents and malicious internet-based activity continue to increase, evolve in nature and become more sophisticated. Information security risks for companies such as ours have significantly increased in recent years in part because of the proliferation of new technologies, the use of internet and telecommunications technologies to conduct financial transactions, and the increased sophistication and activities of organized crime, hackers, terrorists and other external parties, as well as
18
nation-state and nation-state-supported actors. For example, in February 2021, our subsidiary, Ciashop Soluções para Comércio Eletrônico S.A., or Ciashop, was subject to a ransomware attack that corrupted certain operating system files. Ciashop’s site reliability engineering team was ultimately able to restore all services and applications and recover the corrupted data and Ciashop adopted a number of actions in an effort to prevent future incidents, including, among others, upgrading its antivirus software, a review of firewall rules of its production environment and a scan for vulnerabilities in its environment. While our platform was not affected as it is segregated from that of Ciashop’s, we cannot guarantee that any similar incidents may not occur again and adversely affect our operations.
Many companies that provide services similar to ours have also reported a significant increase in cyberattack activity since the beginning of the COVID-19 pandemic. In addition, in the past, some of our customers have been subject to distributed denial of service, or DDoS, attacks, a technique used by hackers to take an internet service offline by overloading its servers. Our platform may be subject to similar DDoS attacks in the future. In addition, because we leverage third-party partners and service providers, including cloud, software, data center and other critical technology vendors to deliver our solutions, we rely heavily on the data security practices and policies adopted by these third-party service providers. Our ability to monitor our third-party service providers’ data security is limited. A vulnerability in our third-party service providers’ software or systems, a failure of our third-party service providers’ safeguards, policies or procedures, or a breach of a third-party service provider’s software or systems could result in the compromise of the confidentiality, integrity or availability of our systems or the data housed in our third-party solutions. In addition, we may also become liable in the event our third-party service providers and subprocessors are subject to security breaches, privacy breaches or other cybersecurity threats. For example, in May 2021, the server of one of our third-party service providers in Chile that stores, among other things, certain of our customer’s consumer personal information processed through our platform, was accidentally made publicly available on the internet and data of approximately 3,500 of one of our customer’s consumers became accessible without authorization. Although our customer is the data controller of its consumers’ data and ultimately responsible for any privacy or security breaches involving such personal data, as our customer’s data processor, we may be held jointly or severally liable if we (or our third-party service provider) are found to not have instituted adequate data security measures on our platform. As of the date of this annual report, we concluded the investigation regarding this incident and we confirmed that unauthorized third parties did not access the exposed consumer personal information. Additionally we adopted measures to address the security flaw with this third-party service provider. We cannot guarantee that any similar incidents may not occur again and adversely affect our operations. We and our third-party service providers and partners may be unable to anticipate or prevent techniques used in the present or in future to obtain unauthorized access or to sabotage systems and cannot guarantee that applicable recovery systems, security protocols, network protection mechanisms, authentication processes and other procedures are or will be adequate to prevent network and service interruption, system failure or data loss. Since techniques used to obtain unauthorized access change frequently and the sophistication and size of DDoS and other cybersecurity attacks is increasing, we may be unable to implement adequate preventative measures or stop the attacks while they are occurring. Any actual or perceived DDoS attack or other security breach or incident could delay or interrupt service to our customers and their customers, could result in loss, compromise, corruption or disclosure of confidential information, intellectual property and sensitive and personal data or data we rely on to provide our solutions, may deter consumers from visiting our customers’ shops, damage our reputation and brand, expose us to a risk of litigation, indemnity obligations and damages for breach of contract, cause us to incur significant liability and financial loss and be subject to regulatory scrutiny, investigations, proceedings and penalties, and require us to expend significant capital and other resources to alleviate problems caused by any such DDoS attack or other security breach or incident and implement additional security measures.
20
Some jurisdictions, including Brazil and all 50 states in the United States, have enacted laws requiring companies to notify individuals of data security breaches involving certain types of personal data, and our agreements with certain customers require us to notify them in the event of a security incident. Such mandatory disclosures – and associated data security breaches - could-could lead to negative publicity and may cause our customers to lose confidence in the effectiveness of our data security measures and controls. Moreover, if a high-profile security breach occurs with respect to another SaaS provider, customers may lose trust in the security of the SaaS business model generally, which could adversely impact our ability to retain existing customers or attract new ones. In addition, if our security measures fail to protect credit card information adequately, we could be liable to our business partners, the payment card associations, our customers, their end-consumers and consumers with whom we have a direct relationship. We could be subject to fines and higher transaction fees, we could face regulatory or other legal action, and our customers could end their relationships with us. The limitations of liability in our contracts may
19
not be enforceable or adequate or would otherwise protect us from any such liabilities or damages with respect to any particular claim. Our failure to comply with legal, contractual, or standards-based requirements around the security of personal information could lead to significant fines and penalties, as well as claims by our customers, their end-consumers, or other stakeholders. These proceedings or violations could force us to spend money in defense or settlement of these proceedings, result in the imposition of monetary liability or injunctive relief, divert management’s time and attention, increase our costs of doing business, and materially adversely affect our reputation and the demand for our platform.
We currently do not maintain cybersecurity insurance for limited clients in the US and for the EU subsidiaries, but not a global coverage, and in the event we were to seek to obtain such insurance coverage, it may not be available on acceptable terms or may not be available in sufficient amounts to cover one or more large claims in connection with cybersecurity liabilities. Insurers could also deny coverage as to any future claim. The successful assertion of one or more large claims against us, or changes in any insurance policies we may enter into, including premium increases or the imposition of large deductible or co-insurancecoinsurance requirements, could have an adverse effect on our business, financial condition and results of operations.
We are also subject to federal, state and foreign laws regarding cybersecurity and the protection of data. See “—Our business is subject to Brazilian,the APAC region, the European Union and United StatesKingdom, Latam and other foreign data privacy,the United States., data protection and information security laws, regulations, rules, standards, policies and contractual and other legal obligations, and our customers may also be subject to such laws and regulations. Any actual or perceived failure of our products to comply with or enable our customers to comply with such applicable laws and regulations would harm our business, results of operations and financial condition.condition.”
See “Item 16K. Cybersecurity—Cybersecurity Risk Management.”
We depend on third-party data hosting and transmission services. Increases in cost, interruptions or delays in service, latency, or poor service from our third-party data center or internet service providers could impair the functionality of our platform. This could result in customer or consumer dissatisfaction, damage to our reputation, loss of customers, limited growth and reduction in revenue.
We currently host the majority of our platform functions on third-party data center hosting facilities operated by AWS, located in the United States of America. Our ability to deliver our solutions also depends on the development and maintenance of internet infrastructure by third parties, including the maintenance of reliable networks with the necessary speed, data capacity and bandwidth. Our platform is deployed to multiple data centers primarily located in the United States in multiple locations, including some for the purpose of disaster recovery. However, despite precautions taken and disaster recovery arrangements we have in place at our data centers or those of our third-party service providers, natural disaster, acts of terrorism, vandalism, fraud, security attacks or sabotage, closure of a facility by public authorities without adequate notice, or other unanticipated problems could result in lengthy interruptions or performance degradation of our platform. Our third-party service providers are ultimately responsible for maintaining their own network security, disaster recovery and system management procedures, and our review processes for such providers may be insufficient to identify, prevent or mitigate adverse events. The owners and operators of our current and future hosting facilities do not guarantee that our customers’ access to our solutions will be uninterrupted, error-free or secure. Our operations depend, in part, on our third-party providers’
21
protection of their facilities and infrastructure against damage, interruption and other performance problems, including from natural disasters, power or telecommunications failures, criminal acts, infrastructure changes, human or software errors, cybersecurity attacks, or similar events (such as the COVID-19 pandemic).events. If any of our third-party service providers experience disruptions or service lapses, or if our third-party infrastructure services agreements are terminated, we could experience interruptions in our platform, latency, as well as delays and additional expenses in arranging new facilities and services. Any prolonged service disruption affecting our platform caused by our third-party service providers could result in lengthy interruptions in the delivery of our platform and solutions, cause system interruptions, damage our reputation with current and potential customers, expose us to liability, cause us to lose customers, cause the loss of critical data, prevent us from supporting our platform and otherwise harm our business.
Our customers often draw significant numbers of end-consumers to their online stores over short periods of time, including from events such as new product releases, holiday shopping seasons and flash sales, which significantly increases the traffic on our servers and the volume of transactions processed on our platform. Our servers may be unable to achieve or maintain data transmission capacity sufficient for timely service of increased
20
traffic or order processing and the failure of data centers, internet service providers or other third-party service providers to meet our capacity requirements could result in interruptions or delays in access to our platform and inhibit our ability to grow our business and scale our operations. Our failure to achieve or maintain sufficient and performant data transmission capacity could significantly reduce demand for our platform. In the future, we may be required to allocate resources, including spending substantial amounts of money, to build, purchase or lease additional data centers and equipment and upgrade our technology and network infrastructure in order to handle the increased load. If one of these third parties suffers from capacity constraints, our business may be adversely affected. In addition, because we and our customers generate a disproportionate amount of revenue in the fourth quarter as a result of customary seasonality, any disruption in our customers’ ability to process and fulfill customer orders in the fourth quarter could have a disproportionately negative effect on our operating results.
Furthermore, a significant portion of our operating cost is from our third-party data hosting and transmission services. If the costs for such services increase due to vendor consolidation, regulation, contract renegotiation or otherwise, we may not be able to increase the fees for our ecommerce platform or professional services to cover the changes. As a result, our operating results may be significantly worse than forecasted.
We rely on third-party and open source software for our platform. Our inability to obtain third-party licenses for such software, or obtain them on favorable terms, or any errors or failures caused by such software could adversely affect our business, results of operations and financial condition. In addition, our use of open source software could negatively affect our ability to sell our products and subject us to possible litigation.
Some of our offerings include software or other intellectual property licensed from third parties. It may be necessary in the future to renew our license agreements relating to various aspects of our offerings or to seek new licenses for existing or new offerings. Necessary licenses may not be available on acceptable terms that allow our platform and offerings to remain competitive, or at all. In addition, a third party may assert that we or our customers are in breach of the terms of a license, which could, among other things, give to such third party the right to terminate a license or seek damages from us, or both. Our inability to obtain certain licenses or other rights, or to obtain such licenses or rights on favorable terms, could result in delays in product releases until equivalent technology can be identified, licensed or developed, if at all, and integrated into our platform, which may have a material adverse effect on our business, results of operations and financial condition. In addition, we may be subject to liability if third-party software that we license is found to infringe, misappropriate or otherwise violate intellectual property rights of others. Third parties may also allege that we are infringing, violating or otherwise misappropriating their intellectual property rights and that additional licenses are required for our use of their software or intellectual property, and we may be unable to obtain such licenses on commercially reasonable terms or at all. The inclusion in our offerings of software or other intellectual property licensed from third parties on a non-exclusive basis could also limit our ability to differentiate our offerings from those of our competitors. To the extent that our platform depends upon the successful operation of third-party software, any undetected errors or defects in, or failures of, such third-party software could also impair the functionality of our platform, delay new feature introductions, result in a failure of our platform, and injure our reputation. Many third-party software providers attempt to impose limitations on their liability for such errors, defects or failures, and if enforceable, we may have additional liability to our customers that could harm our reputation and increase our operating costs.
22
In addition, our platform and some of our products incorporate open source software, and we expect to continue to incorporate open source software in our products and platform in the future. Open source software is generally freely accessible, usable and modifiable. Few of the licenses applicable to open source software have been interpreted by courts, and there is a risk that these licenses could be construed in a manner that could impose unanticipated conditions or restrictions on our ability to commercialize our products and platform. Moreover, although we have implemented policies to regulate the use and incorporation of open source software into our products and platform, we cannot be certain that we have not incorporated open source software in our products or platform in a manner that is inconsistent with such policies. If we fail to comply with open source licenses, we may be subject to certain requirements, including requirements that we offer our products that incorporate the open source software for no cost, that we discontinue our products that incorporate the open source software, that we make available source code for modifications or derivative works we create based upon, incorporating or using the open source software and that we license such modifications or derivative works under the terms of applicable open source licenses. If an author or other third party that distributes such open source software were to allege that we had not complied with the conditions of one or more of these licenses, we could be required to incur significant legal
21
expenses defending against such allegations and could be subject to significant damages, enjoined from generating revenue from customers using products that contained the open source software and required to comply with onerous conditions or restrictions on these products. In any of these events, we and our customers could be required to seek licenses from third parties in order to continue offering our products and platform and to re-engineer our products or platform or discontinue offering our products to customers in the event we cannot re-engineer them on a timely basis. Any of the foregoing could require us to devote additional research and development resources to re-engineer our products or platform, could result in customer dissatisfaction and may adversely affect our business, results of operations and financial condition. Additionally, the use of certain open source software can lead to greater risks that the use of third-party commercial software, as open source licensors generally make their open source software available “as-is” and do not provide updates, warranties, support, indemnities or other contractual protections regarding infringement claims or quality of the code.
We could incur substantial costs in maintaining, enforcing, protecting or defending our intellectual property and proprietary rights. Failure to adequately obtain, maintain, enforce and protect our intellectual property and proprietary rights could impair our competitive position and cause us to lose valuable assets, experience reduced revenue and incur costly litigation.
Our success is dependent, in part, upon obtaining, maintaining, protecting and enforcing our proprietary technology and other intellectual property. We rely on a combination of trade secret laws, contractual provisions with our employees, consultants, independent contractors and third parties with whom we have relationships, trademarks, service marks and copyrights in an effort to establish and protect our intellectual property and proprietary rights. However, the steps we take to protect our intellectual property and intellectual property laws may be inadequate, breached, may offer only limited protection and may not adequately permit us to gain or keep any competitive advantage. Despite our efforts, third parties have in the past and may in the future attempt to disclose, obtain, copy or use our intellectual property or other proprietary rights or technology without our authorization. To the extent we expand our international activities, our exposure to unauthorized copying and use of our platform and proprietary information may increase. Moreover, effective trademark, copyright, patent and trade secret protection may not be available or commercially feasible in every country in which we conduct business, as the laws of certain foreign countries may not protect intellectual property rights and technology to the same extent as the laws of the United States. Further, intellectual property law, including statutory and case law, is constantly developing and changes in, or unexpected interpretations of, intellectual property laws could make it harder for us to enforce our rights. Third parties may also legitimately and independently develop products, services and technology similar to or duplicative of our products and solutions.
23
The process of obtaining trademark, copyright and patent protection is expensive and time-consuming, and may not always be successful depending on the intellectual property laws of the applicable jurisdiction in which we seek protection or other circumstances, in which case we may be unable to secure intellectual property protection for all of our technology. We may not be able to obtain protection for our technology and even if we are successful in obtaining effective patent, copyright, trademark and trade secret protection, it is expensive to maintain these rights, both in terms of application and maintenance costs and the time and cost required to defend our rights. If we elect to file patent applications in the future, we may be unable to obtain patent protection for technology covered in our patent applications or obtain the coverage originally sought. In addition, any patents issued in the future may not provide us with competitive advantages or may be successfully challenged by third parties, which could result in them being narrowed in scope or declared invalid or unenforceable. It is also possible that third parties, including our competitors, may obtain patents relating to technologies that overlap or compete with our technology. If third parties obtain patent protection with respect to such technologies, they may assert that our technology infringes their patents and seek to charge us a licensing fee or otherwise preclude the use of our technology or file suit against us. Any of our patents, trademarks or other intellectual property rights may lapse, be abandoned, be challenged or circumvented by others or invalidated through administrative process or litigation. We also may be unable to obtain trademark protection for our products and brands, and our existing trademark registrations and applications, and any trademarks that may be used in the future, may not provide us with competitive advantages or distinguish our products and services from those of our competitors. In addition, our trademarks may be contested or found unenforceable, weak or invalid, and we may not be able to prevent third parties from infringing or otherwise violating them. Our failure to develop and properly manage and protect our intellectual property could hurt our market position and business opportunities. We also may choose not to pursue registrations in every jurisdiction or allow certain of our registered intellectual property rights, or our pending applications for intellectual property
22
rights, to lapse or to become abandoned if we determine that obtaining or maintaining the applicable registered intellectual property rights is not worthwhile. Despite our efforts to protect our intellectual property and proprietary rights, there can be no guarantee that such rights will be sufficient to protect against others offering products or services that are substantially similar to ours, independently developing similar products, duplicating any of our products, other adopting trade names similar to ours, competing with our business or attempting to copy aspects of our technology and using information that we consider proprietary, thereby impeding our ability to promote our platform and possibly leading to customer confusion.
In addition to registered intellectual property rights, we rely on non-registered proprietary information and technology. We make business decisions about when to seek patent protection for a particular technology and when to rely upon trade secret protection and the approach we select may ultimately prove to be inadequate. In order to protect our proprietary information and technology, we rely in part on invention assignment and confidentiality agreements with our employees, consultants and other parties who create intellectual property on our behalf and enter into confidentiality agreements with our employees, consultants, strategic and business partners and other parties who have access to our confidential information. However, these agreements may not be effective in controlling access to and distribution of our proprietary information and intellectual property, may not be self-executing, sufficient in scope or enforceable, and these agreements do not prevent our competitors or partners from independently developing technologies that are equivalent or superior to our platform. We also cannot guarantee that we have entered into such agreements with all parties who may have or have had access to our proprietary and confidential information or otherwise developed intellectual property for us or that the agreements we have entered into will not be breached. Enforcing a claim that a third party illegally disclosed or misappropriated our proprietary information is difficult, expensive and time-consuming, and the outcome is unpredictable. In addition, some courts inside and outside the United States are less willing or unwilling to protect trade secrets. If any of our trade secrets were to be unlawfully obtained or independently developed by a competitor or other third party, we would have no right to prevent them from using that technology or information to compete with us, which could harm our competitive position, business, financial condition, results of operations and prospects.
Despite our efforts to protect our intellectual property, third parties have in the past and may in the future infringe, misappropriate or otherwise violate our intellectual property and proprietary rights and we may be required to spend significant resources to monitor, protect and enforce our intellectual property rights. Policing unauthorized use of our technologies, trade secrets and intellectual property is difficult, expensive and time-consuming, particularly in foreign countries where the laws may not be protective of intellectual property rights and where mechanisms for enforcement of intellectual property rights may be weak. We have in the past and may in the future also be subject to claims by third parties that we have infringed, misappropriated or otherwise violated their intellectual property. Litigation may be necessary to enforce our intellectual property rights and protect our trade secrets. Litigation brought to defend, protect or enforce our intellectual property rights could be costly, time-consuming and distracting to management, regardless of the outcome. Enforcement of our intellectual property rights may be met with defenses, counterclaims and countersuits attacking the validity and enforceability of our intellectual property. Such litigation could result in the impairment or loss of portions of our intellectual property
24
and require us to, among other things, redesign or stop providing our products, pay substantial amounts to satisfy judgments or settle claims or lawsuits, pay substantial royalty or licensing fees, or satisfy indemnification obligations that we have with certain parties with whom we have commercial relationships. In addition, many companies may have the capability to dedicate greater resources to enforce their intellectual property rights and to defend claims that may be brought against them. In addition, because of the substantial discovery required in connection with intellectual property litigation, our confidential or sensitive information could be compromised by disclosure in such litigation. There could also be public announcements regarding the results of such litigation and if securities analysts or investors perceive these results to be negative, it could have a substantial adverse effect on the price of our Class A common shares.
Our inability to protect our proprietary technology against unauthorized copying or use, as well as any costly litigation or diversion of our management’s attention and resources in connection with intellectual property related disputes, could delay further sales or the implementation of our platform, impair the functionality of our platform, delay introductions of new functionality to our platform, result in the substitution of inferior or more costly technologies into our platform, or injure our reputation. We will not be able to protect our intellectual property if we are unable to adequately maintain and enforce our rights or if we do not detect unauthorized use of our intellectual property. If we fail to meaningfully protect our intellectual property and proprietary rights, our business, operating results and financial condition could be adversely affected.
23
Evolving global laws, regulations and standards, including data privacy regulations and data localization requirements, may limit the use and adoption of our services, expose us to liability, or otherwise adversely affect our business.
Federal, state, or foreign governmental bodies or agencies have in the past adopted, and may in the future adopt, laws and regulations affecting the use of the internet as a commercial medium. These laws and regulations could impact taxation, internet neutrality, tariffs, content, copyright protection, distribution, electronic contracts and other communications, consumer protection and data privacy, and the characteristics and quality of services we offer. Legislators and regulators may make legal and regulatory changes or apply existing laws in ways that require us to incur substantial costs, expose us to unanticipated civil or criminal liability, or cause us to change our business practices. Also, such laws and regulations are often inconsistent and may be subject to amendment or re-interpretation, which may cause us to incur significant costs and expend significant effort to ensure compliance. These laws and regulations and resulting increased compliance and operational costs could materially harm our business, results of operations and financial condition.
For instance, we continue to see jurisdictions imposing data localization laws, which require personal information, or certain subcategories of personal information, to be stored in the jurisdiction of origin. These regulations may inhibit our ability to expand into those markets or prohibit us from continuing to offer services in those markets without significant additional costs.
As we expand into new industries and regions, we will likely need to comply with new requirements to compete effectively. The uncertainty and changes in the requirements of multiple jurisdictions may increase the cost of compliance, delay or reduce demand for our services, restrict our ability to offer services in certain locations, impact our customers’ ability to deploy our solutions in certain jurisdictions, or subject us to sanctions regulators, all of which could harm our business, financial condition and results of operations. Additionally, although we endeavor to have our products and platform comply with applicable laws and regulations, these and other obligations may be modified, they may be interpreted and applied in an inconsistent manner from one jurisdiction to another, and they may conflict with one another, other regulatory requirements, contractual commitments or our internal practices.
25
Our business is subject to Brazilian,the APAC region, the European Union and United StatesKingdom, Latam and other foreignthe United States., data privacy, data protection and information security laws, regulations, rules, standards, policies and contractual and other legal obligations, and our customers may also be subject to such laws and regulations. Any actual or perceived failure of our products to comply with or enable our customers to comply with such applicable laws and regulations would harm our business, results of operations and financial condition.
The privacy and security of personally identifiable, personal, sensitive, regulated or confidential information is a major focus in our industry and we and our customers that use our products are subject to federal, state, local and foreign privacy and data protection-related laws and regulations that impose obligations in connection with the collection, storage, use, processing, disclosure, protection, transmission, retention and disposal of confidential or sensitive information, including personal data, such as financial data, health or other similar data. Laws and regulations governing data privacy, data protection and information security are constantly evolving and there has been an increasing focus on privacy and data protection issues with the potential to affect our business. The nature of our business exposes us to risks related to compliance with data protection and information security laws and regulations. Any perceived or actual failure to comply with any of these laws and regulations could result in litigation, enforcement actions, damages, fines and penalties and could harm our reputation and impair our ability to attract and retain our customers, any of which could have a material adverse effect on our business, financial condition, results of operations or prospects.
For example, in Brazil, current practices involving the treatment of personal data are governed by certain sector laws, such as Law No. 8,078/1990, or the Brazilian Consumer Defense Code, and Law No. 12,965/2014, or the Brazilian Civil Rights Framework for the Internet. In addition, LGPD came into force on September 18, 2020 to regulate the processing of personal data. The LGPD applies to individuals or legal entities and private or government entities who process personal data in Brazil or collect personal data in Brazil or, further, when their
24
processing activities have the purpose of offering or supplying goods or services to data subjects located in Brazil. The LGPD establishes detailed rules for processing personal data, which includes the collection, use, transfer and storage of personal data and affects all economic sectors, including the relationship between clients and suppliers of goods and services, employees and employers and other relationships in which personal data is collected, whether in a digital or physical environment.
The LGPD requires us to adapt our data processing activities to comply with this regime, and we have implemented changes with respect to our policies and procedures designed to facilitate our compliance with the relevant requirements under the LGPD. However, the interpretation and application of the LGPD is still uncertain.
The penalties and fines for violations of the LGPD include: warnings, with the imposition of a deadline for the adoption of corrective measures; a daily fine, up to a maximum amount of R$50.0 million per violation; the restriction of access to the personal data to which the violation relates up to a six-month period, which can be extended until the processing activities are compliant with the regulation; and in case of repetition of the violation, a temporary block and/or deletion of the relevant personal data, and a partial or complete prohibition of processing activities and a fine of up to 2.0% of gross sales of the company or group of companies in violation, up to a maximum amount of R$50.0 million per violation. Pursuant to the LGPD, security breaches that may result in significant risk or damage to personal data must be reported to the National Data Protection Authority (Autoridade Nacional de Proteção de Dados), or ANPD, Brazil’s data protection regulatory body, within a reasonable time period. The notice to the ANPD must include a description of the nature of the personal data affected by the breach; the affected data subjects; the technical and security measures adopted by the impacted entity; the risks related to the breach; the reasons for any delays in reporting the breach, if applicable; and the measures adopted to revert or mitigate the effects of the damage caused by the breach. Moreover, the ANPD could establish additional obligations related to data protection in the future. The LGPD and any additional privacy laws or regulations enacted or approved in Brazil or in other jurisdictions in which we operate could significantly impact our business, financial condition or results of operations.
Similarly, many foreign countries and governmental bodies, including in the countries in which we currently operate, have laws and regulations concerning the collection, use and other processing of sensitive and personal data obtained from individuals located in their jurisdiction or by businesses operating within their jurisdiction. Laws and regulations in these jurisdictions apply broadly to the collection, use, storage, disclosure, transmission, processing and security of personal data that identifies or may be used to identify an individual, such as names, telephone numbers, email addresses and, in some jurisdictions, IP addresses and other online identifiers. For example, the General Data Protection Regulation, or the GDPR, went into effect in May 2018 and implemented more stringent administrative requirements for controllers and processors of personal data of EU residents, including, for example, data breach notification requirements, limitations on retention of information, and rights for individuals over their personal data, and creates a range of new compliance obligations. The GDPR also provides that EU member states may make their own further laws and regulations limiting the processing of personal data. Ensuring compliance with the GDPR is an ongoing commitment that involves substantial costs, and despite our efforts, governmental authorities or others may assert that our business practices fail to comply with its
26
requirements. If our operations are found to violate GDPR requirements, we may incur substantial fines and other penalties, including bans on processing and transferring personal data, have to change our business practices, and face reputational harm, any of which could have an adverse effect on our business. In particular, serious breaches of the GDPR can result in administrative fines of up to 4.0% of annual worldwide revenues or up to €20 million, whichever is higher. Fines of up to 2.0% of annual worldwide revenues can be levied for other specified violations, and violations of the GDPR may also lead to damages claims by data controllers and data subjects. Such penalties are in addition to any civil litigation claims by data controllers, customers and data subjects. Recent legal developments in Europe have created compliance uncertainty regarding transfers of personal data from Europe to the United States. In July 2020, the Court of Justice of the European Union, or CJEU, invalidated the EU-U.S. Privacy Shield Framework, a mechanism for the transfer of personal information from the EU to the United States, and made clear that reliance on Standard Contractual Clauses, an alternative mechanism for the transfer of personal information outside of the EU alone may not be sufficient in all circumstances. Following the United Kingdom’s withdrawal from the EU on January 31, 2020, the data protection obligations of the GDPR continue to apply to United Kingdom-related processing of personal data in substantially unvaried form by virtue of section 3 of the European Union (Withdrawal) Act 2018, as amended, which, together with the amended UK Data Protection Act of 2018, retains the GDPR in UK national law. On June 28, 2021, the European Commission adopted an adequacy decision under the GDPR which recognized that the United Kingdom provides an essentially equivalent level of personal data protection to that guaranteed under the GDPR, ensuring free flows of personal data between the United Kingdom and the EEA and minimizing risk of future divergence.
25
In the United States, California enacted the California Consumer Privacy Act, or CCPA, which took effect in January 2020 and imposes several obligations on companies that do business in California that are different from the obligations set forth in the GDPR. For example, the CCPA provides that covered companies must provide new disclosures to California consumers and afford such consumers new data privacy rights that include the right to request a copy from a covered company of the personal information collected about them, the right to request deletion of such personal information, and the right to request to opt-out of certain sales of such personal information. The California Attorney General can enforce the CCPA, including seeking an injunction and civil penalties for violations. The CCPA also provides a private right of action for certain data breaches, which is expected to increase data breach litigation. Further, in November 2020, California voters passed the California Privacy Rights and Enforcement Act, or the CPRA. Effective beginning January 1, 2023, the CPRA imposes additional obligations on companies covered by the legislation and will significantly modify the CCPA, including by expanding California residents’ rights with respect to certain sensitive personal information. The CPRA also creates a new state agency that will be vested with authority to implement and enforce the CCPA and CPRA. It remains unclear how various provisions of the CCPA and CPRA will be interpreted and enforced, and we may be required to modify our data practices and policies and incur substantial costs in an effort to comply. Certain other state laws, including the recently enacted Virginia Consumer Data Protection Act, impose similar privacy obligations and all 50 states have laws including obligations to provide notification of certain security breaches to affected individuals, state officials and others.
In the APAC region, Data Protection Authorities have applied substantial penalties in case of privacy or security breaches. For example, the Australian Data Protection Authority (ACMA) collected approximately USD 6.6 million in fines for certain privacy violations (e.g. for unsolicited marketing emails) in 2023. In South Korea, there are multiple laws governing protection of personal data, cybersecurity infrastructure such as cloud computing, and cybersecurity measures. South Korean privacy laws provide not only administrative penalties up to 3% a company’s annual revenue, but also to criminal liability (maximum of 10 years of imprisonment) and punitive damages in the amount of five times the damages suffered by the data subject. Singapore has been going through several reforms on its data protection law and cybersecurity acts, adopting mandatory notification in case of breach and creating new types of privacy offenses, which can trigger penalties of up to 10% of a company’s annual turnover. As our operations grow in the region we may become increasingly more exposed to the regulatory reach of these authorities. In addition a number of countries in the APAC region have adopted rules for international data transfers from countries in the APAC region that resemble the framework of the GDPR in terms of requirements of adequacy decisions, proper legal basis and cross border security measures. In this heavily regulated scenario, any perceived lack of ability to comply with local laws may negatively affect our ability to attract new customers in the region.
We also may be bound by contractual obligations relating to our collection, use, processing and disclosure of personal, financial and other data or may find it necessary or desirable to join industry or other self-regulatory bodies or other privacy or data protection-related organizations that require compliance with their rules pertaining to privacy and data protection.
While we strive to comply with all applicable privacy, data protection and information security laws and regulations, as well as our contractual obligations, posted privacy policies and applicable industry standards, such laws, regulations, obligations and standards continue to evolve and are becoming increasingly complex, and sometimes conflict among the various jurisdictions and countries in which we operate, which makes compliance challenging and expensive. We expect that there will continue to be new proposed laws, rules of self-regulatory bodies, regulations and industry standards concerning privacy, data protection and information security in Brazil and other jurisdictions, and we cannot yet determine the impact such future laws, rules, regulations and standards may have on our business. Moreover, existing Brazilian and foreign privacy and data protection-related laws and regulations are evolving and subject to potentially differing interpretations, and various legislative and regulatory bodies may expand current or enact new laws and regulations regarding privacy and data protection-related matters. Additionally, our customers may be subject to differing privacy laws, rules and legislation, which may mean that they require us to be bound by varying contractual requirements application to certain other jurisdictions. Because
27
global laws, regulations and industry standards concerning privacy and data security have continued to develop and
26
evolve rapidly, it is possible that we or our products or platform may not be, or may not have been, compliant with each such applicable law, regulation and industry standard and compliance with such new laws or to changes to existing laws may impact our business and practices, require us to expend significant resources to adapt to these changes, or to stop offering our products in certain countries. These developments could adversely affect our business, results of operations and financial condition.
Any failure or perceived failure by us, or any third parties with whom we do business, to comply with laws, regulations, policies, industry standards or contractual or other legal obligations relating to privacy, data protection or information security may result in governmental investigations, inquiries, enforcement actions and prosecutions, private litigation, fines and penalties, adverse publicity or potential loss of business. Future restrictions on the collection, use, processing, storage, sharing or disclosure of sensitive or personal information could require us to incur additional costs or modify our platform, and could limit our ability to develop new functionality. Complying with these requirements and changing our policies and practices may be onerous and costly, and we may not be able to respond quickly or effectively to regulatory, legislative or other developments. Any of the foregoing could adversely affect our business and operating results.
There are risks for which our insurance policies may not adequately cover or for which we have no insurance coverage. Insufficient insurance coverage or the materialization of such uninsured risks could adversely affect us.
Our insurance policies may not adequately cover all risks to which we are exposed. In addition, we cannot guarantee that we will be able to maintain our insurance policies in the future or that we will be able to renew them at reasonable prices or on acceptable terms, which may adversely affect our business and the trading price of our Class A common shares. Moreover, we are subject to risks for which we are uninsured, such as war, acts of God, including hurricanes, other force majeure events and breaches of the security of our systems by hackers. The occurrence of a significant loss that is not insured or compensable, or that is only partially insured or compensable, may require us to commit significant cash resources to cover such losses, which may adversely affect us.
Our operating results are subject to seasonal fluctuations.
Our subscription revenues are directly linked to the level of GMV that our customers process through our platform. Our customers historically have processed additional GMV during the holiday season. As a result, we have historically generated higher subscription revenues in the fourth quarter in each year compared to other quarters. While we believe that this seasonality has affected and will continue to affect our quarterly results, our rapid growth has largely masked seasonal trends to date. However, as a result of the continued growth of our subscription revenue offerings, we believe that our business may become more seasonal in the future and that historical patterns in our business may not be a reliable indicator of our future sales activity or performance. For further information “Item 5. Operating and Financial Review and Prospects—A. Operating Results—Seasonality and Quarterly Results of Operations.”
We face exposure to foreign currency exchange rate fluctuations, and such fluctuations could adversely affect our business, results of operations and financial condition.
As our international operations expand, our exposure to the effects of fluctuations in currency exchange rates grows. For example, global political events, including the conflict between Russia and Ukraine and the recent attack by Hamas on Israel from the Gaza Strip, trade tariff developments and other geopolitical events have caused global economic uncertainty and variability in foreign currency exchange rates. While we have primarily transacted with customers and business partners in Brazilian reais, in light of our international expansion we expect to transact with customers in Argentine pesos, Colombian pesos and British pounds, among others. We expect to significantly expand the number of transactions with customers that are denominated in foreign currencies in the future as we continue to expand our business internationally. We also incur expenses for some of our network service provider costs outside of Brazil in local currencies and for employee compensation and other operating expenses at our non-Brazil locations in the local currency for such locations. Fluctuations in the exchange rates between the Brazilian real and other currencies could result in an increase to the Brazilian equivalent of such expenses.
2827
In addition, our international subsidiaries may maintain net assets that are denominated in currencies other than the functional operating currencies of these entities. As we continue to expand our international operations, we become more exposed to the effects of fluctuations in currency exchange rates. The results of operations in the countries where we operate are exposed to foreign exchange rate fluctuations as the financial results of the applicable subsidiaries are translated from the local currency into U.S. dollars upon consolidation. If the U.S. dollar weakens against foreign currencies, the translation of these foreign-currency-denominated transactions will result in increased revenues, operating expenses and net income. Similarly, our revenues, operating expenses and net income will decrease if the U.S. dollar strengthens against foreign currencies. In the years ended December 31, 2023 and 2022, 20.3% and 2021, 15.6% and 17.3% of our revenues were denominated in, or linked to, U.S. dollars, respectively. Although total revenue in the years ended December 31, 2023 and 2022 grew 27.8% and 2021 grew 25.3% and 27.5% in U.S. dollars, our reporting and functional currency, and 22.3%23.7% and 29.8%22.3% on an FX neutral basis, the foreign currency exchange rates in 2023 relative to 2022 and 2022 relative to 2021 and 2021 relative to 2020 resulted in an increase of 2.4%3.3% and a decreasein an increase of 1.8%2.4% in our revenue growth, respectively.
Accordingly, changes in the value of foreign currencies relative to the U.S. dollar can affect our results of operations due to transactional and translational remeasurements. As a result of such foreign currency exchange rate fluctuations, it could be more difficult to detect underlying trends in our business and results of operations. In addition, to the extent that fluctuations in currency exchange rates cause our results of operations to differ from our expectations or the expectations of our investors and securities analysts who follow our stock, the trading price of our Class A common shares could be adversely affected.
We do not currently maintainAlthough we have implemented a program to hedge transaction exposures in some foreign currencies. However, in the future,currencies And we may useemploy derivative instruments such aslike foreign currency forward and option contracts to hedge certainspecific exposures to fluctuations in foreign currency exchange rates. Therates, the use of such hedging activities may not fully offset any or more than a portion of the adverse financial effects ofimpacts resulting from unfavorable movements in foreign exchange rates overwithin the limited time theduration of these hedges while they are in place.active. Moreover, the use of hedging instruments may introduce additional risks if we are unable to structure effective hedges with such instruments. See “—Certain Risks RelatedRelating to Latin America—America —Significant foreign currency exchange controls and currency devaluation in certain countries in which we operate which may have adverse effects on the economies of such countries, us and the price of our Class A common shares.shares.”
We rely on search engines and social networking sites to attract a meaningful portion of our SMB customers. If we are not able to generate traffic to our website through search engines and social networking sites, our ability to attract new SMB customers may be impaired. In addition, if our customers are not able to conclude their online store setup and generate traffic to their online stores through search engines and social networking sites, their ability to attract consumers may be impaired.
Many of our customers locate our website through internet search engines, such as Google, and advertisements on social networking sites, such as Facebook. The prominence of our website in response to internet searches is a critical factor in attracting potential customers to our platform. If we are listed less prominently or fail to appear in search results for any reason, visits to our website could decline significantly, and we may not be able to replace this traffic.
Similarly, many consumers locate our customers’ shops through internet search engines and advertisements on social networking sites. If our customers’ shops are listed less prominently or fail to appear in search results for any reason, visits to our customers’ shops could decline significantly. As a result, our customers’ businesses may suffer, which would affect the GMV that they process through our platform and could affect the ability of such customers to pay for our solutions.
Search engines revise their algorithms from time to time in an attempt to optimize their search results. If search engines modify their algorithms, our website and our customers’ shops may appear less prominently or not at all in search results, which could result in reduced traffic to our website and to our customers’ shops.
2928
Additionally, if the price of marketing our solutions over search engines or social networking sites increases, we may incur additional marketing expenses or may be required to allocate a larger portion of our marketing spend to search engine marketing and our business and operating results could be adversely affected. Furthermore, competitors may in the future bid on the search terms that we use to drive traffic to our website. Such actions could increase our marketing costs and result in decreased traffic to our website. In addition, search engines or social networking sites may change their advertising policies from time to time. If any change to these policies delays or prevents us from advertising through these channels, it could result in reduced traffic to our website and sales of our solutions. As well, new search engines or social networking sites may develop, particularly in specific jurisdictions, that reduce traffic on existing search engines and social networking sites, and if we are not able to achieve prominence through advertising or otherwise, we may not achieve significant traffic to our website through these new platforms and our business and operating results could be adversely affected.
We are dependent upon customers’ and their end-consumer willingness to use the internet for commerce.
Our success depends upon the general public’s continued willingness to use the internet as a means to pay for purchases, communicate, access social media, research and conduct commercial transactions, including through mobile devices. If customers and their consumers become unwilling or less willing to use the internet for commerce for any reason, including lack of access to high-speed communications equipment, congestion of traffic on the internet, internet outages or delays, disruptions or other damage to customers’ and end-consumers’ computers, increases in the cost of accessing the internet and security and privacy risks or the perception of such risks, our customers and prospective customers could be less inclined to adopt the services offered by a SaaS company like us, and our business prospects could be adversely affected.
In 2020, due to the restrictions imposed by the COVID-19 pandemic, ecommerce benefited from exponential growth. Both in 2021 and 2022, as the restrictions eased, consumers behavior shift towards online purchasing demonstrated staying power, with ecommerce penetration continuing to increase, though at a lower pace. We cannot assure this consumer trend will continue once the COVID-19 pandemic is sufficiently controlled, or if the macroeconomic environment worsens. For further information, see “—The COVID-19 pandemic could materially adversely affect our business, financial condition and results of operations.”
Activities of customers or the content of their shops could damage our brand, subject us to liability and harm our business and financial results.
Our terms of service prohibit our customers from using our platform to engage in illegal activities and our terms of service permit us to take down a customer’s online shop if we become aware of such illegal use. Customers may nonetheless engage in prohibited or illegal activities or upload store content in violation of applicable laws, which could subject us to liability. We could also be subject to liability under applicable law, which may not be fully mitigated by our terms of service. Any liability attributed to us could adversely affect our brand, reputation, ability to expand our subscriber base, and financial results. Furthermore, our brand may be negatively impacted by the actions of customers that are deemed to be hostile, offensive, inappropriate or illegal. We do not proactively monitor or review the appropriateness of the content of our customers’ shops and we do not have control over customer activities. The safeguards we have in place may not be sufficient for us to avoid liability or avoid harm to our brand, especially if such hostile, offensive, inappropriate or illegal use is high profile, which could adversely affect our business and financial results.
If we are unable to maintain our corporate culture as we grow, we could lose the innovation, teamwork, passion and focus on execution that we believe contribute to our success, and our business may be harmed.
We believe a critical component to our success has been our corporate culture. We have invested substantial time and resources in building our team. As we grow and develop our infrastructure as a public company, our operations may become increasingly complex. We may find it difficult to maintain these important aspects of our corporate culture. We maintain work-from-home arrangements for a growing number of our employees, which may impact our ability to preserve our corporate culture. Any failure to preserve our culture could negatively affect our future success, including our ability to retain and recruit personnel, and to effectively focus on and pursue our corporate objectives.
30
We have in the past made, and may in the future make, acquisitions and investments, which could divert management’s attention, result in operating difficulties and dilution to our shareholders and otherwise disrupt our operations and adversely affect our business, operating results or financial position.
From time to time, we evaluate potential strategic acquisition or investment opportunities. Any transactions that we enter into could be material to our financial condition and results of operations. The process of acquiring and integrating another company or technology could create unforeseen operating difficulties and expenditures. We may also experience difficulties integrating personnel of the acquired company into our business and culture. Acquisitions may also disrupt our business, divert our resources and require significant management attention that would otherwise be available for development of our existing business. Key personnel of the acquired companies
29
may choose not to work for us, their software may not be easily adapted to work with ours, or we may have difficulty retaining the customers of any acquired business due to changes in ownership, management, or otherwise. The anticipated benefits of any acquisition, investment, or business relationship may not be realized or we may be exposed to unknown risks or liabilities, such as:
use of resources that are needed in other areas of our business;
in the case of an acquisition, implementation or remediation of controls, procedures and policies of the acquired company;
in the case of an acquisition, difficulty integrating the accounting systems and operations of the acquired company, including potential risks to our corporate culture;
in the case of an acquisition, coordination of product, engineering and selling and marketing functions, including difficulties and additional expenses associated with supporting legacy services and products and hosting infrastructure of the acquired company and difficulty converting the customers of the acquired company onto our platform and contract terms, including disparities in the revenues, licensing, support or professional services model of the acquired company;
in the case of an acquisition, retention and integration of employees from the acquired company;
unforeseen costs or liabilities;
adverse effects to our existing business relationships with partners and customers as a result of the acquisition or investment;
the possibility of adverse tax consequences;
litigation or other claims arising in connection with the acquired company or investment; and
in the case of foreign acquisitions, the need to integrate operations across different cultures and languages and to address the particular economic, currency, political and regulatory risks associated with specific countries.
In addition, a significant portion of the purchase price of companies we acquire may be allocated to acquired goodwill and other intangible assets, which must be assessed for impairment at least annually. In the future, if our acquisitions do not yield expected returns, we may be required to take charges to our operating results based on this impairment assessment process, which could adversely affect our results of operations.
Acquisitions and investments may also result in dilutive issuances of equity securities, which could adversely affect our share price, or result in issuances of securities with superior rights and preferences to our Class A common shares or the incurrence of debt with restrictive covenants that limit our future uses of capital in pursuit of business opportunities.
31
Also, in the context of our acquisitions, we may face contingent liabilities in connection with, among others things, (1) judicial and/or administrative proceedings of the business we acquire, including civil, regulatory, tax, labor, social security, environmental and intellectual property proceedings, and (2) financial, reputational and technical issues, including with respect to accounting practices, financial statement disclosures and internal controls, as well as other regulatory matters, all of which may not be sufficiently indemnifiable under the relevant acquisition agreement and may impact our financial reporting obligations and the preparation of our consolidated financial statements, resulting in delays to such preparation.
We may not be able to identify acquisition or investment opportunities that meet our strategic objectives, or to the extent such opportunities are identified, we may not be able to negotiate terms with respect to the acquisition or investment that are acceptable to us. At this time we have made no commitments or agreements with respect to any such transaction.
30
Our holding company structure makes us dependent on the operations of our subsidiaries.
We are a Cayman Islands exempted company with limited liability. Our material assets are our direct and indirect equity interests in our subsidiaries. We are, therefore, dependent upon payments, dividends and distributions from our subsidiaries for funds to pay our holding company’s operating and other expenses and to pay future cash dividends or distributions, if any, to holders of our Class A common shares. The amount of any dividends or distributions which may be paid to us from time to time will depend on many factors including, for example, such subsidiaries results of operations and financial condition; limits on dividends under applicable law; its constitutional documents; documents governing any indebtedness; applicability of tax treaties; and other factors which may be outside our control. Furthermore, exchange rate fluctuation will affect the U.S. dollar value of any distributions our subsidiaries (which are currently mostly located in Brazil, Argentina and Colombia) make with respect to our equity interests in those subsidiaries. See “—Certain Risks RelatedRelating to Latin America—Significant foreign currency exchange controls and currency devaluation in certain countries in which we operate which may have adverse effects on the economies of such countries, us and the price of our Class A common shares,” “The“The ongoing economic uncertainty and political instability in Brazil and the other countries in which we operate may harm us and the price of our Class A common shares”shares” and “Dividends and Dividend Policy.”
We may require additional financing to support our future capital requirements. Our ability to timely raise capital in the future may be limited, or may be unavailable on acceptable terms, if at all. Our failure to raise capital when needed could harm our business, operating results and financial condition. Debt or equity issued to raise additional capital may reduce the value of our Class A common shares.
We have funded our operations since inception primarily through equity financings and payments by our customers for use of our platform and related services. We cannot be certain when or if our operations will generate sufficient cash to fund our ongoing operations or the growth of our business.
We intend to continue to make investments to support our business and may require additional funds. In particular, we may seek additional funds to develop new products and enhance our platform and existing products, expand our operations, including our sales and marketing organizations and our presence outside of Brazil, improve our infrastructure or acquire complementary businesses, technologies, services, products and other assets. Accordingly, we may need to engage in equity or debt financings to secure additional funds. Additional financing may not be available on favorable terms, if at all. If adequate funds are not available on acceptable terms, we may be unable to invest in future growth opportunities, which could harm our business, operating results and financial condition. If we incur additional debt, the debt holders could have rights senior to holders of Class A common shares to make claims on our assets. If we raise additional funds through future issuances of equity or convertible debt securities, our shareholders may experience dilution, and the new equity securities could have rights senior to those of our Class A common shares. Because our decision to issue securities in the future offering will depend on numerous considerations, including factors beyond our control, we cannot predict or estimate the amount, timing or nature of any future issuances of debt or equity securities. As a result, our shareholders bear the risk of future issuances of debt or equity securities reducing the value of our Class A common shares and diluting their interest.
32
Payment transactions on our commerce platform subject us to regulatory requirements and other risks that could be costly and difficult to comply with or that could harm our business.
We are required by our payment processors to comply with payment card network operating rules and standards and we have agreed to reimburse our payment processors for any fees or fines they are assessed by payment card networks as a result of any rule violations by us or our customers. We may also be directly liable to the payment card networks for rule violations. Payment card networks set and interpret such operating rules and standards, which govern a variety of areas, including how customers may use their cards, the security features of cards, security standards for processing, data protection and information security and allocation of liability for certain acts or omissions, including liability in the event of a data breach. Participants are subject to audit by the payment card networks to ensure compliance with applicable rules and standards. The payment card networks could adopt new operating rules or interpret or reinterpret existing rules that we or our processors might find difficult or even impossible to follow or costly to implement.
31
Our subsidiary, Loja Integrada Tecnologia para Software LTDA, or Loja Integrada, utilizes our platform, which we believe currently complies with the PCI DSS, to process payments of its customers’ consumers. However, Loja Integrada does not use our platform to process payments of its customers’ subscription fees, and maintains its customers’ payment information in an encrypted database managed by Loja Integrada that is not compliant with PCI DSS. Loja Integrada is in the process of migrating its entire billing system to a PCI DSS compliant third-party payment processing service provider.
If we or any of our subsidiaries fail to migrate our billing system to a PCI DSS compliant third-party payment processing service provider, and/or otherwise fail to comply with applicable payment card network rules, including the PCI DSS, and those of each of the credit card brands, we could breach our contractual obligations to our payment processors, financial institutions, partners and customers. Such a failure may subject us to fines, penalties, damages, higher transaction fees, and civil liability and prevent us from processing or accepting payment cards or lead to a loss of payment processor partners, even if customer or end-consumer information has not been compromised. This would have an adverse effect on our business, financial condition and operating results.
We provide our ecommerce platform to businesses in highly regulated industries, which subjects us to a number of challenges and risks.
We provide our ecommerce platform to customers in highly regulated industries, such as pharmaceuticals, insurance, healthcare and life sciences, and we may have customers in other highly regulated industries in the future. Providing our ecommerce platform to such entities subjects us to a number of challenges and risks. Selling to such entities can be highly competitive, expensive and time consuming, often requiring significant upfront time and expense without any assurance that these efforts will generate a sale. Customers in highly regulated industries may demand shorter subscription periods or other contract terms that differ from our standard arrangements, including terms that can lead those customers to obtain broader rights in our offerings than would be standard. Such entities may have statutory, contractual, or other legal rights to terminate contracts with us or our business partners due to a default or for other reasons. Any such termination may adversely affect our reputation, business, results of operations and financial condition. Additionally, due to the heightened regulatory environment in which they operate, potential customers in these industries may encounter additional difficulties when trying to move away from legacy ecommerce platforms to an open SaaS platform like the one we provide.
Our sales cycle with our customers can be long and unpredictable, and our sales efforts require considerable time and expense.
The timing of our sales with our customers and related revenue recognition is difficult to predict because of the length and unpredictability of the sales cycle for these customers. Mid-market and large enterprise customers, particularly those in highly regulated industries and those requiring customized applications, may have an even further lengthy sales cycle for the evaluation and implementation of our platform. This caused and may continue to cause a delay between increasing operating expenses for such sales efforts and, upon successful sales, the generation of corresponding revenue. We are often required to spend significant time and resources to better educate our potential customers and familiarize them with our platform. Our sales cycle for these customers, from initial evaluation to contract execution, is generally 8 to 12 months for large enterprise customers and 4 to 8 months for small and mid-market customers, but can vary substantially.
The challenging and uncertain macroeconomic environment influenced our customers’ planning and decision-making processes. Consequently, in 2022 our sales cycle has been at the high end of the sales cycle ranges, while we also experienced an increase in the average time to implement the VTEX platform and longer than usual ramp-up times from customers that recently implemented the VTEX platform.
Our sale cycle stabilized during the course of 2023 with marginal improvements in the implementation and ramp-up times compared to 2022. However our sale cycle remains inherently uncertain and challenging to predict and we cannot guarantee that the positive trends we experienced during 2023 will be maintained in the future.
32
As a result, a significant portion of our revenue is generated from the recognition of contract liabilities from contracts entered into with customers during prior periods. Customers often view our revenue sharing arrangements and subscription to our ecommerce platform and services as a strategic decision requiring significant investment. As a result, customers frequently require considerable time to evaluate, test and qualify our platform prior to entering into or expanding a subscription. During the sales cycle, we spend significant time and resources on sales and marketing and contract negotiation activities, which may not result in a sale. Additional factors that may influence the length and variability of our sales cycle include:
| • | the effectiveness of our sales force, as we hire and train our new salespeople to sell to mid-market and large enterprise customers; |
the discretionary nature of purchasing and budget cycles and decisions;
the obstacles placed by customers’ procurement process;
customers’ integration complexity;
customers’ familiarity with SaaS ecommerce solutions;
customers’ evaluation of competing products during the purchasing process; and
evolving customer demands.
Due to these uncertainties, predicting the completion of a sale or revenue recognition timing remains challenging. While a decrease in current-period revenue might not be substantial, it could adversely influence future revenue if demand for our solutions and services or contract renewals declines.
Changes in tax laws or regulations or differing interpretations may be applied adversely to us or our customers. We may be subject to tax liability for past sales or become subject to tax laws or regulations that are applied adversely to us or our customers, which could harm our business.
New income, sales, use, or other tax laws, statutes, rules, regulations, or ordinances could be enacted at any time in the jurisdictions in which we operate. Any new taxes could adversely affect our domestic and international business operations and our business and financial performance. Existing tax laws, statutes, rules, regulations, or ordinances could be interpreted, changed, modified or applied adversely to us. These events could require us or customers using our ecommerce platform to pay additional tax amounts on a prospective or retroactive basis. They could require us or our customers to pay fines and/or penalties and interest for past amounts deemed to be due. If we raise our prices to offset the costs of these changes, existing and potential future customers may elect not to continue to subscribe or elect not to subscribe to our ecommerce platform in the future. Additionally, new or modified tax laws could increase our customers’ and our compliance, operating and other costs, as well as the costs of our platform. Any or all of these events could adversely impact our business and financial performance.
33
Moreover, our application of certain tax laws may be subject to controversial interpretation by tax authorities. In the event that tax authorities interpret tax laws in a manner that is inconsistent with our interpretation, we may be adversely affected.
With sales in various countries, we are subject to taxation in several jurisdictions around the world with increasingly complex tax laws, the application of which can be uncertain. The amount of taxes we pay in these jurisdictions could increase substantially as a result of changes in the applicable tax principles, including increased tax rates, new tax laws or revised interpretations of existing tax laws and precedents, which could have an adverse impact on our liquidity and results of operations.
33
In addition, we may be subject to additional obligations to collect and remit sales tax and other taxes. The jurisdictions in which we operate have differing rules and regulations governing sales, use, value-added and other taxes, and these rules and regulations are subject to varying interpretations that may change over time. In particular, the applicability of such taxes to our ecommerce platform in various jurisdictions is unclear (especially with respect to taxes on digital services in jurisdictions where we do not have legal presence). These jurisdictions’ rules regarding tax nexus are complex and vary significantly. As a result, we could face tax assessments and audits. Our liability for these taxes and associated penalties could exceed our original estimates. Jurisdictions in which we have not historically collected or accrued sales, use, value-added, or other taxes could assert our liability for such taxes. This could result in substantial tax liabilities and related penalties for past sales. It could also discourage customers from using our platform or otherwise harm our business and operating results.
Our future effective tax rates could be subject to volatility or adversely affected by a number of factors, including:
changes in the valuation of our deferred tax assets and liabilities;
expected timing and amount of release of any tax valuation allowances;
tax effects of stock-based compensation;
costs related to intercompany restructurings;
changes in tax laws, regulations or interpretations thereof; or
future earnings being lower than anticipated in countries where we have lower statutory tax rates and higher than anticipated in countries where we have higher statutory tax rates.
We currently conduct activities in multiple jurisdictions through our subsidiaries pursuant to transfer pricing arrangements and may in the future conduct operations in other jurisdictions pursuant to similar arrangements. If two or more affiliated companies are located in different countries, the tax laws or regulations of each country generally will require that transfer prices be the same as those between unrelated companies dealing at arm’s length. While we believe that we operate in compliance with applicable transfer pricing laws and intend to continue to do so, our transfer pricing procedures are not binding on applicable tax authorities. If tax authorities in any of these countries were to successfully challenge our transfer prices as not reflecting arm’s length transactions, they could require us to adjust our transfer prices and thereby reallocate our income to reflect these revised transfer prices, which could result in a higher tax liability to us.
34
Loss of, or adverse modifications to, certain tax benefits that we enjoy in Brazil and Argentina could have a negative impact on our operating results and profitability.
Our Brazilian subsidiaries enjoy a social contribution benefit introduced by the Brazilian government in 2011 as a stimulus to labor intensive companies pursuant to Brazilian Federal Law 12,546/11, named Contribuição Previdenciária sobre a Receita Bruta (CPRB). Under this benefit, employers of specific business segments can elect to pay their share of social contribution at rates of up to 4.5% on gross revenues instead of 20.0% on payroll. This benefit was originally designed to be effective for a limited period of time but, due to strong pressure from taxpayers, it has been extended several times since its introduction. Accordingintroduction and was meant to the latest extension, the benefit will beremain in force until December 31, 2023. If this2027. However, in December 2023, the Brazilian Federal Government adopted Provisional Measure 1202, revoking the benefit and restoring the social contribution tax rates at 20% on payroll effective April 2024, although recognizing a relief through 2027 for taxpayers that commit to keep the existing job positions. The Provisional Measure is discontinued orexpected to be reviewed by the Brazilian Congress during the first quarter of 2024, and if approved it will adversely modified in the future,affect the results of operations of VTEX Brasil will be adversely affected.Brasil.
Also, VTEX Brasil has benefited in 2020benefits from research and development, or R&D, tax credits that significantly reducedreduce its income tax liability pursuant to Brazilian Federal Law 11,196/05, or Lei do Bem. In 2021 and 2022, considering that VTEX Brasil was in a loss position, the R&D benefit did not apply.Bem. If the relevant R&D tax benefit is terminated, the tax liability of VTEX Brasil could be significantly increased when it resumes its profitability position.increased.
VTEX Informatica S.A., our Argentine subsidiary, is partially exempt from an indirect tax due in the city of Buenos Aires that applies on gross revenues at approximately 4.0%. This exemption applies to technology companies in general which are located in a technological district and will be in force until 2035. Failure to comply with the relevant requirements or an early termination of this exemption will significantly adversely affect the results of operations of VTEX Informatica S.A.
34
We are subject to anti-corruption, anti-bribery, anti-money laundering and similar laws. Non-compliance with such laws can subject us to criminal and/or civil liability and harm our business.
We are subject to the FCPA, the U.S. domestic bribery statute contained in 18 U.S.C. § 201, the U.S. Travel Act, the Brazilian Anticorruption Law, the UK Bribery Act of 2010, the UK Proceeds of Crime Act 2002, and other anti-bribery and anti-money laundering laws in the countries in which we conduct activities. Anti-corruption and anti-bribery laws have been enforced aggressively in recent years. These laws are interpreted broadly to prohibit companies and their employees and third-party intermediaries from authorizing, promising, offering, or providing, directly or indirectly, improper payments or anything else of value to recipients in the public or private sector. As we increase our international sales and business and sales to the public sector, we may engage with partners and third-party intermediaries to market our services and to obtain necessary permits, licenses and other regulatory approvals. In addition, we or our third-party intermediaries may have direct or indirect interactions with officials and employees of government agencies or state-owned or affiliated entities. We can be held liable for corrupt or other illegal activities of these third-party intermediaries, our employees, representatives, contractors, partners and agents, even if we do not explicitly authorize such activities.
While we have policies and procedures to address compliance with such laws, our employees and agents could violate our policies and applicable law, for which we may be ultimately held responsible. As we increase our international sales and business, our risks under these laws may increase.
Non-compliance with anti-corruption, anti-bribery, or anti-money laundering laws could subject us to whistleblower complaints, investigations, sanctions, settlements, prosecution, other enforcement actions, disgorgement of profits, significant fines, damages, other civil and criminal penalties or injunctions, suspension and/or debarment from contracting with certain persons, the loss of export privileges, reputational harm, adverse media coverage and other collateral consequences. If any subpoenas or investigations are launched, or governmental or other sanctions are imposed, or if we do not prevail in any possible civil or criminal litigation, our business, results of operations and financial condition could be materially harmed. Responding to any action will likely result in a materially significant diversion of management’s attention and resources and significant defense costs and other professional fees. Enforcement actions and sanctions could further harm our business, results of operations and financial condition.
35
In preparing our consolidated financial statements, weWe have identified a material weakness in our internal control over financial reporting and, ifin preparing our consolidated financial statements in the past. If we identify new material weaknesses in the future or we fail to implement and maintain effective internal controls over financial reporting, we may be unable to accurately report our results of operations, meet our reporting obligations or prevent fraud.fraud, which may adversely affect our business and stock price or cause our access to the capital market to be impaired.
As discussed in Item 15 of this annual report, we have previously identified a material weakness in our internal controls over financial reporting as of December 31, 2022 reporting related to failure to maintain controls related to restrict access management procedures, regarding granting, revoking and reviewing access and segregation of duties. A material weakness is a deficiency, or combination of control deficiencies, in internal control over financial reporting, such that there is a reasonable possibility that a material misstatement of a company’s annual or interim financial statements will not be prevented or detected on a timely basis. If we fail to implement and maintain effective internal control over financial reporting, this could result in errors in our financial statements that could result in a material restatement of our financial statements, we could fail to meet our public reporting obligations or fail to prevent fraud, which would likely cause investors to lose confidence in our reported financial information and cause a decline in the price of our Class A common shares. Additionally, failure to implement and maintain effective internal control over financial reporting could also subject us to potential delisting from the NYSE or to other regulatory investigations and civil or criminal sanctions.
As a public company, we are subject to the reporting requirements of the Exchange Act, the Sarbanes-Oxley Act of 2002, or the Sarbanes-Oxley Act, and the rules and regulations and the listing standards of the NYSE. The Sarbanes-Oxley Act requires, among other things, that we evaluate the effectiveness of our disclosure controls and procedures and internal control over financial reporting. This assessment must include disclosure of any material weaknesses identified by management in internal controls over financial reporting. We have incurred and expect to continue to incur substantial accounting and auditing expenses and to expend significant management time in complying with these requirements.
35
In addition, until we cease to be an “emerging growth company” as such term is defined in the JOBS Act, which may not be until after five full fiscal years following the date of our initial public offering, our independent registered public accounting firm is not required to attest to and report on, and did not attest to and report on, the effectiveness of our internal control over financial reporting. In addition, our current reporting obligations as a SEC-reporting company may place a significant strain on our management, operational and financial resources, and systems for the foreseeable future. We mayThere can be unable to timely complete our evaluation testing and any required remediation. In addition, if we fail to maintain the adequacy of our internal control over financial reporting, as these standards are modified, supplemented, or amended from time to time, we may not be able to conclude on an ongoing basis that we have effective internal control over financial reporting in accordance with Section 404 of the Sarbanes-Oxley Act of 2002. If we fail to achieve and maintain an effective internal control environment, we could suffer material misstatements in our financial statements, fail to meet our reporting obligations or fail to prevent fraud, which would likely cause investors to lose confidence in our reported financial information. This could, in turn, limit our access to capital markets, harm our results of operations and lead to a decline in the trading price of our Class A common shares. Additionally, ineffective internal control over financial reporting could expose us to increased risk of fraud or misuse of corporate assets and subject us to potential delisting from the New York Stock Exchange, or NYSE, regulatory investigations, and civil or criminal sanctions.
We identified a material weakness in our internal controls over financial reporting as of December 31, 2022. The material weakness identified relates to the failure to maintain controls over restricted access management procedures regarding granting, revoking, and reviewing access and segregation of duties. A material weakness is a deficiency, or combination of control deficiencies, in internal control over financial reporting, such that there is a reasonable possibility that a material misstatement of our annual or interim financial statements will not be prevented or detected on a timely basis. This material weakness did not result in a material misstatement of our consolidated financial statements. See “Item 15. Controls and Procedures — B. Management’s Annual Report on Internal Control Over Financial Reporting” for additional details.
The material weakness described above involves control deficiencies that could result in a misstatement of one or more account balances or disclosures that would result in a material misstatement to the annual or interim consolidated financial statements that would not be prevented or detected, and, accordingly, we determined that these control deficiencies constitute a material weakness.
Although we have adopted several measures that we expect will improve our internal control over financial reporting and address the underlying cause of this material weakness, we cannot assure that our efforts will be effective or prevent any future material weakness or significant deficiency in our internal control over financial reporting. For details of the remediation plan to address this material weakness, see “Item 15. Controls and Procedures — B. Management’s Annual Report on Internal Control Over Financial Reporting.”
36
In addition, we cannot be certain that we have identified all material weaknesses in our internal control over financial reporting, orno assurance that in the future we will not have additional material weaknesses in our internal control over financial reporting Moreover, while we currently do not expect that the costs we will have to incur to remediate the above referred material weaknesses will adversely affect our business, we may incur in unforeseen expenses.reporting.
Our risk management policies and procedures may not be fully effective in mitigating our risk exposure in all market environments or against all types of risks, including risk of fraud, which could expose us to losses and liability and otherwise adversely affect our business.
We operate in a rapidly changing industry, and we have experienced significant growth in recent years. Accordingly, our risk management policies and procedures may not be fully effective in identifying, monitoring and managing our risks. Some of our risk evaluation methods depend upon information provided by others and public information regarding markets, customers or other matters that are otherwise inaccessible by us. In some cases, however, that information may not be accurate, complete or up-to-date. If our policies and procedures are not fully effective or we are not always successful in capturing all risks to which we are or may be exposed, we may suffer harm to our reputation or be subject to litigation or regulatory actions that could have a material adverse effect on our business, financial condition and results of operations.
We offer our platform to a large number of customers, and we are responsible for vetting and monitoring these customers and determining whether the transactions we process for them are lawful and legitimate. When our products and services are used to process illegitimate transactions, and we settle those funds to customers and are unable to recover them, we suffer losses and liability. For instance, we face risk of fraud with respect to our SMB platform business, as our customers may use our platform to create online stores that sell goods to end-consumers without actually delivering them or may use our platform to test illegally obtained credit card data. If we are unable to prevent these illicit uses of our platform, our business, financial condition, operating result and reputation may be adversely affected. These types of illegitimate, as well as unlawful, transactions can also expose us to governmental and regulatory sanctions, including outside of Brazil (e.g., U.S. AML and economic sanctions violations). The highly automated nature of, and liquidity offered by, our payments services make us a target for illegal or improper uses, including fraudulent or illegal sales of goods or services, money laundering and terrorist financing. Identity thieves and those committing fraud using stolen or fabricated credit card or bank account numbers, or other deceptive or malicious practices, potentially can steal significant amounts of money from businesses like ours. In configuring our payments services, we face an inherent trade-off between security and customer convenience. Our risk management policies, procedures, techniques and processes may not be sufficient to identify all of the risks to which we are exposed, to enable us to mitigate the risks we have identified, or to identify additional risks to which we may become subject in the future. In addition, when we introduce new services, focus on new business types, or begin to operate in markets in which we have a limited history of fraud loss, we may be less able to forecast and reserve accurately for those losses. Furthermore, if our risk management policies and processes contain errors or are otherwise ineffective, we may suffer large financial losses, we may be subject to civil and criminal liability, and our business may be materially and adversely affected.
In 2020, we made public statements as to our historical profitability, despite incurring in a net loss in 2020 and 2019.
In 2020, we made public statements as to our historical profitability, despite incurring in a net loss of US$0.8 million and US$4.6 million in the years ended December 31, 2020 and 2019, respectively. Such public statements may be viewed as inaccurate and were contemporaneous with the closing of a round of private financing with certain investors. Any such investor may attempt to assert claims against us for any losses incurred in reliance on any such public statements made by us. Any such claims can be time-consuming, divert management’s attention and resources and cause us to incur significant expenses, and it could also adversely affect our reputation, business, financial condition or results of operation.
3736
We may be subject to various legal proceedings which could adversely affect our business, financial condition or results of operations.
We may be involved in various legal proceedings, investigations and similar matters from time to time arising from tax, civil and labor claims, amongst others. Such matters can be time-consuming, divert management’s attention and resources and cause us to incur significant expenses. Any insurance or indemnities that we may have may not cover all claims that may be asserted against us, and any claims asserted against us, regardless of merit or eventual outcome, may harm our reputation. If we are unsuccessful in our defense in these legal proceedings, we may be forced to pay damages or fines, enter into consent decrees or change our business practices, any of which could adversely affect our business, financial condition or results of operations. In addition, certain legal proceedings may result in negative publicity or affect our reputation. We are currently a party to a legal proceeding relating to alleged misappropriation and/or retention of confidential and proprietary information. For further information “Item 8. Financial Information—A. Consolidated Statements and Other Financial Information—Legal and Administrative Proceedings.”
In addition, media coverage and public statements that insinuate improper actions by us or our subsidiaries, regardless of their factual accuracy or truthfulness, may result in negative publicity or legal proceedings. Addressing negative publicity and any resulting legal proceeding may distract management, increase costs and divert resources. Negative publicity may have an adverse impact on our reputation or the morale of our employees, which could adversely affect our business, financial condition and results of operations.
Certain Risks Related ToRelating to Latin America
Governments have a high degree of influence in Brazil and the other economies in which we operate. The effects of this influence and political and economic conditions in Brazil and Latin America could harm us and the trading price of our Class A common shares.shares.
Governments in many of the markets in which we currently, or may in the future, operate frequently exercise significant influence over their respective economies and occasionally make significant changes in policy and regulations. Government actions to control inflation and other policies and regulations have often involved, among other measures, increases or decreases in interest rates, changes in fiscal policies, wage and price controls, foreign exchange rate controls, blocking access to bank accounts, currency devaluations, capital controls and import and export restrictions. We have no control over and cannot predict what measures or policies governments may take in the future. We and the market price of our securities may be harmed by changes in government policies, as well as general economic factors, including, without limitation:
growth or downturn of the relevant economy;
interest rates and monetary policies;
exchange rates and currency fluctuations;
inflation;
liquidity of the capital and lending markets;
import and export controls;
exchange controls and restrictions on remittances abroad and payments of dividends;
modifications to laws and regulations according to political, social and economic interests;
37
fiscal policy and changes in tax laws and related interpretations by tax authorities;
economic, political and social instability, including general strikes and mass demonstrations;
the regulatory framework governing our industry;
labor and social security regulations;
38public health, including as a result of epidemics and pandemics;
|
changes in demographics; and
other political, diplomatic, social and economic developments in or affecting Latin America.
Uncertainty over whether Brazil and other Latin American governments will implement reforms or changes in policy or regulation affecting these or other factors in the future may affect economic performance and contribute to economic uncertainty in Latin America, such as increased tax uncertainty regarding the tax authorities’ interpretations of applicable tax laws and exemptions, which may have an adverse effect on our activities and consequently our operating results, and may also adversely affect the trading price of our Class A common shares.
In addition, recent economic and political instability in Brazil in general has led to a negative perception of the Brazilian economy and higher volatility in the Brazilian securities markets, which also may adversely affect us and our Class A common shares. See “—The ongoing economic uncertainty and political instability in Brazil and the other countries in which we operate, may harm us and the price of our Class A common shares”shares” and “Item 5. Operating and Financial Review and Prospects—A. Operating Results— Latin American Macroeconomic Environment.”
Significant foreign currency exchange controls and currency devaluation in certain countries in which we operate which may have adverse effects on the economies of such countries, us and the price of our Class A common shares.
Certain Latin American economies have experienced shortages in foreign currency reserves and their respective governments have adopted restrictions on the ability to transfer funds out of the country and convert local currencies into U.S. dollars. This may increase our costs and limit our ability to convert local currency into U.S. dollars and transfer funds out of certain countries, including for the purchase of dollar-denominated inputs, the payment of dividends or the payment of interest or principal on our outstanding debt. In the event that any of our subsidiaries are unable to transfer funds to us due to currency restrictions, we are responsible for any resulting shortfall.
SinceSpecifically in the case of Argentina, since September 2019, the current Argentine government has tightened restrictions on capital flows and imposed foreign exchange controls and transfer restrictions, substantially limiting the ability of companies to retain foreign currency or make payments outside of Argentina. Furthermore, the Central Bank of Argentina implemented regulations requiring its prior approval for certain foreign exchange transactions otherwise authorized to be carried out under the applicable regulations, such as dividend payments or repayment of principal of inter-company loans as well as the import of goods. As a consequence of the re-imposition of exchange controls, the spread between the official exchange rate and other exchange rates resulting implicitly from certain capital market operations usually effected to obtain U.S. dollars has broadened significantly, reaching a value of approximately 89%26% above the official exchange rate as of March 1, 2023.February 26, 2024. Also, in the course of 2023, the rate and reach of the so-called Impuesto PAIS (Impuesto Para una Argentina Inclusiva y Solidaria), an emergency tax created to tax the purchase of foreign currency, was broadened. The implementation of the above-mentioned measures, could impactor additional future measures, significantly impacts our ability and costs to transfer funds outside of Argentina and may preventprevents or delaydelays payments that our Argentine subsidiary is required to make outside Argentina. As a result, if we are prohibited from transferring funds out of Argentina, or if
If we become subject to similar restrictions in other countries in which we operate, our results of operations and financial condition could be materially adversely affected.
38
In addition, the Brazilian, Mexican and Argentinian currencies (as well as the currency of other countries in which we operate) have been historically volatile and have devalued frequently over the past three decades. The continuing devaluation of the Argentine peso since the end of 2015 has led to higher inflation levels, has significantly reduced competitiveness, real wages and consumption and has had a negative impact on businesses whose success is dependent on domestic market demand and supplies payable in foreign currency. Further currency devaluations in any of the countries in which we operate could have a material adverse effect on our results of operations and financial condition.
In addition, the Brazilian, Mexican and Argentinian currencies (as well as the currency of other countries in which we operate) have been historically volatile and have devalued frequently over the past three decades.
39
Throughout this period, for example, the Brazilian government has implemented various economic plans and used various exchange rate policies, including sudden devaluations, periodic mini-devaluations (during which the frequency of adjustments has ranged from daily to monthly), exchange controls, dual exchange rate markets and a floating exchange rate system. In 2017, the real depreciated by 1.5%, with the exchange rate reaching R$3.308 per US$1.00 on December 31, 2017. In 2018, the real depreciated an additional 17.1%, to R$3.875 per US$1.00 on December 31, 2018. The real/U.S. dollar exchange rate reported by the Central Bank was R$4.031 per US$1.00 on December 31, 2019, which reflected a 4.0% depreciation of the real against the U.S. dollar for the year. Recently, due to the COVID-19 and the economic and political instability, the real depreciated 47.2% against the U.S. dollar since December 31, 2019, and reached R$5.937 per US$1.00 as of May 14, 2020, its lowest level since the introduction of the currency in 1994.. The exchange rate reported by the Central Bank was R$5.581 per US$1.00 on December 31, 2021, R$5.218 per US$1.00 on December 31, 2022, and R$5,2074.841 per US$1.00 on March 1, 2023.December 31, 2023 and R$4.9813 per US$1.00 on February 26, 2024. There can be no assurance that the real will not again depreciate against the U.S. dollar or other currencies in the future.
The value of the Mexican peso has also been subject to significant fluctuations with respect to the U.S. dollar in the past and may be subject to significant fluctuations in the future. In 2020, 2021, 2022 and 2022,2023, the Mexican peso depreciated 5.5%2.7%, 2.7% and appreciated 4.7% and 13.1% respectively, against the U.S. dollar in nominal terms. There can be no assurance that the Mexican peso will not again depreciate against the U.S. dollar or other currencies in the future.
The value of the Colombian peso has also been subject to significant fluctuations with respect to the U.S. dollar in the past and may be subject to significant fluctuations in the future. In 2020, 2021, 2022 and 20222023 the Colombian peso depreciated 4.6%18.3%, 18.3%19.1% and 19.1%appreciated 20.1% respectively, against the U.S. dollar in nominal terms. There can be no assurance that the Colombian peso will not again depreciate against the U.S. dollar or other currencies in the future.
The value of the Argentine peso has been subject to significant devaluation against the U.S. Dollar in the past. In 2020, 2021, 2022 and 20222023 the Argentine peso depreciated 40.5%22.0%, 22.0%72.5%, and 72.5%356.5% respectively, against the U.S. dollar in nominal terms. There can be no assurance that the Argentine peso will not again depreciate against the U.S. dollar or other currencies in the future.
See “—We face exposure to foreign currency exchange rate fluctuations, and such fluctuations could adversely affect our business, results of operations and financial condition.condition.”
The ongoing economic uncertainty and political instability in Brazil and the other countries in which we operate, may harm us and the price of our Class A common shares.
The Brazilian political environment influenced and continues to influence the economic performance of the country. The political crises affected and continue to affect the trust of investors and the general public, causing economic slowdowns and an increase in volatility of securities issued by Brazilian companies.
Political instability has been exacerbated by the Brazilian polarized presidential election held in October 2022. After having his criminal convictions related to Operação Lava Jato overturned and his political rights restored by the Brazilian Supreme Court, former Brazilian president Luiz Inácio Lula da Silva ran for office in the presidential election and narrowly defeated President Bolsonaro. Luiz Inácio Lula da Silva took office on January 1, 2023. In the aftermath of the November 2022 presidential election, there have been countrywide roadblocks and protests by supporters of former president Jair Bolsonaro disputing the election results, culminating, on January 8, 2023, in riots in the country’s federal capital, Brasilia, where protesters stormed government buildings, including the Congress, the Supreme Court and the Presidential Palace. It is unclear whether this heightened state of political and social tension will dissipate or intensify in following months and what resulting impacts may occur to adversely affect our business operations or the safety of our employees, our customers, and the communities in which we operate.
Furthermore, the federalFederal government’s difficulty in having a majority in the National Congress could result in a deadlock, political unrest and massive demonstrations and/or strikes, which may adversely affect our business, financial condition and results of operations. Uncertainties regarding the current government’s implementation of changes in monetary, fiscal and social security policies, as well as the relevant legislation, may contribute to economic instability. These uncertainties and new measures may increase the volatility of the Brazilian securities market.
40
The president of Brazil has the power to establish policies and perform governmental acts related to the conduction of the Brazilian economy and, consequently, affect the operations and financial performance of companies, including ourselves. We cannot predict which policies the President will adopt, much less whether such policies or changes in current policies could have an adverse effect on us or on the Brazilian economy.
39
Additionally, on November 19, 2023, the second round of the general Argentina presidential elections took place and candidate Javier Milei was elected over the current Argentine Minister of Economy, Sergio Massa. Javier Milei took office on December 10, 2023 and after a series of proposed measures during his candidacy, which included plans to dollarize the Argentine economy and closing the local Central Bank, one of his first immediate official actions was the devaluation of Argentine peso of 54% against the U.S. dollar, which could substantially impact Argentine inflation and economy. See “—Inflation and certain government measures to curb inflation may have adverse effects on the economies of the countries where we operate, our business and the price of our Class A common shares.” We cannot predict what other controversial measures Javier Milei will effectively adopt, which could have a material adverse effect on the Argentine economy and could affect our financial condition and results of our operations.
Any of the above factors may create additional political uncertainty, which could harm the Brazilian and other Latin American countries’ economy and, consequently, our business, and could adversely affect our financial condition, results of operations and the trading price of our Class A common shares.
Uncertainty and instability resulting from the conflict between Russia and Ukraine and the recent attack by Hamas on Israel from the Gaza Strip could adversely affect our business, financial condition and operations.
Global markets have recently experienced volatility and disruption following the escalation of geopolitical tensions, the start of military conflict between Russia and Ukraine and the recent attack by Hamas on Israel from the Gaza Strip.
In late February 2022, Russian military forces launched significant military action against Ukraine, and continued sustained conflict and disruption in the region is likely. It is not possible to predict the broader or longer-term consequences of this conflict, which could include further sanctions, embargoes, regional instability, geopolitical shifts and adverse effects on macroeconomic conditions, security conditions, currency exchange rates and financial markets. In response to Russia’s invasion of Ukraine, the United States, the European Union, the United Kingdom and several other countries have imposed or are imposing far-reaching sanctions and export control restrictions on Russian entities and individuals. These and any additional sanctions, as well as any counter responses by the governments of Russia or other jurisdictions, and prolonged unrest, intensified military activities and/or the implementation of more extensive sanctions could adversely affect the global financial markets generally and levels of economic activity as well as increase financial markets volatility.
On October 7, 2023, Hamas militants and members of other terrorist organizations infiltrated Israel’s southern border from the Gaza Strip and conducted a series of terror attacks on civilian and military targets. Thereafter, these terrorists launched extensive rocket attacks on Israeli population and industrial centers located along the Israeli border with the Gaza Strip. Shortly following the attack, Israel’s security cabinet declared war against Hamas. The intensity and duration of Israel’s current war against Hamas is difficult to predict, as are the implications such war’s economic implications on our business and operations and on the global geopolitical instability, particularly if the war expands to other fronts, such as Lebanon, Syria and the West Bank.
Although we do not have any employees, staff, consultants, operations, materials or equipment located in Ukraine, Russia, Belarus, or Belarus,Israel, some of our customers, suppliers and partners may have employees, staff, consultants, operations, materials or equipment located in Ukraine, Russia or Belarus which could adversely affect our business or the services being provided to us.
Cybersecurity organizations in many countries have published warnings of increased cybersecurity threats to businesses, and external events, like the conflict between Russia and Ukraine, may increase the likelihood of cybersecurity attacks. We or our customers, suppliers and partners may be subject to retaliatory cyberattacks perpetrated by Russia or others at its direction in response to economic sanctions and other actions taken against Russia as a result of its invasion of Ukraine. In addition, we are taking additional extensive measures of monitoring any potential abnormal behavior coming from Russia, Ukraine or Belarus that may directly or indirectly affect us. Any failure or security breach of information systems or data could result in a violation of applicable privacy and other laws, significant legal and financial exposure, damage to our reputation or a loss of confidence in our security measures, which could also adversely affect our business.
40
These and other global and regional conditions may adversely affect our business, financial condition and results of operations.
Inflation and certain government measures to curb inflation may have adverse effects on the economies of the countries where we operate, our business and the price of our Class A common shares.
Most Latin American countries have historically experienced, and may continue to experience in the future, high rates of inflation, which could lead to further government intervention in the economy, including the introduction of government policies that could adversely affect our results of operations. In countries with high rates of inflation, such as Brazil, or with hyperinflation, such as Argentina, we may not be able to adjust the price of our services sufficiently to offset the effects of inflation on our cost structures. A high inflation environment would also have negative effects on the level of economic activity, employment and adversely affect our business and results of operations.
In the past, Brazil has experienced extremely high rates of inflation. Inflation and some of the measures taken by the Brazilian government in an attempt to curb inflation have had significant negative effects on the Brazilian economy generally. Inflation policies adopted to curb inflationary pressures and uncertainties regarding possible future governmental intervention have contributed to economic uncertainty and heightened volatility in the Brazilian capital markets.
41
According to the National Consumer Price Index (Í(Índice Nacional de Preços ao Consumidor Amplo)Amplo), or IPCA, which is published by the Brazilian Institute for Geography and Statistics (Instituto(Instituto Brasileiro de Geografia e Estatística)stica), or IBGE, Brazilian inflation rates were 5.8%4.6%, 10.1%5.8% and 4.6%10.1% for the years ended December 31, 2023, 2022 2021 and 2020,2021, respectively. Brazil may experience high levels of inflation in the future and inflationary pressures may lead to the Brazilian government’s intervening in the economy and introducing policies that could harm our business and the price of our Class A common shares. One of the tools used by the Brazilian government to control inflation levels is its monetary policy, specifically in regard to the official Brazilian interest rate. An increase in the interest rate restricts the availability of credit and reduces economic growth, and vice versa. During recent years, there has been significant volatility in the official Brazilian base interest rate, which ranged from 14.25%, on December 31, 2015 to 2.00% on December 31, 2020, increasing to 9.25% on December 31, 2021, and 13.75% on December 31, 2022.2022 and 11.75% on December 31, 2023. As of the date of this annual report, the official Brazilian base interest rate is 13.75%11.75%. This rate is set by the Monetary Policy Committee of the Central Bank of Brazil (Comitê de Política Monetária), or COPOM. Any change in interest rate, in particular any volatile swings, can adversely affect our growth, indebtedness and financial condition.
In recent years, Argentina’s foreign debt rating has been downgraded on multiple occasions based on concerns regarding economic conditions and rising fears of increased inflationary pressures and their ability to serve their debt obligations. The IMF and the Argentine authorities have reached an understanding on key policies as part of their ongoing discussions of an IMF-supported program in order to renegotiate the principal maturities of the US$44.1 billion under a stand-by arrangement. On March 25, 2022, the IMF approved the execution of the financing agreement (the “IMF Agreement”) with Argentina for a total amount of US$44.0 billion, which includes a disbursement of US$9.6 billion. We cannot assure that the conditions of the IMF Agreement will not affect Argentina’s ability to implement reforms and public policies and boost economic growth, nor the impact that the IMF Agreement may have in Argentina’s ability to access international capital markets (and indirectly in our ability to access those markets). Moreover, the long-term impact of these measures and any future measures taken by the government on the Argentine economy remains uncertain. It is possible that reforms could be disruptive to the economy and adversely affect the Argentine economy and our business, results of operations and financial condition. We are also unable to predict the measures that the Argentine government may adopt in the future, and how they will impact on the Argentine economy and our results of operations and financial condition.
The increasing level of inflation in Argentina has generated pressure for further depreciation of the Argentine peso, which depreciated against the U.S. dollar by 40.5%, 22.0% and 72.5% in 2020, 2021 and 2022, respectively. Argentina’s newly elected president, Javier Milei, took office on December 10, 2023, and one of his first official measure as president was to devaluate the Argentine peso in 54% against the U.S. dollar, making the official exchange rate reach 800 Argentine pesos per US$1.00, from 365 Argentine pesos per US$1.00, in the day immediate following the adoption of the measure. As a result, accumulated depreciation of the Argentine peso
41
against the U.S. dollar was of 356.5% in 2023. This strategy, however, was adopted without any plans from the Argentine government to contain price increases, which could potentially lead to extreme inflation levels in the near future. If the current Argentine government is unable to address Argentina’s structural inflationary imbalances, the prevailing high rates of inflation may continue, which would have an adverse effect on Argentina’s economy.economy and our business.
Any further downgrading of the credit rating of Brazil or of other countries in which we operate could reduce the trading price of our Class A common shares.
We may be harmed by investors’ perceptions of risks related to the sovereign debt credit rating. Rating agencies regularly evaluate the credit rating of the countries in which we operate and their respective sovereign ratings, which are based on a number of factors, including macroeconomic trends, fiscal and budgetary conditions, indebtedness metrics and the perspective of changes in any of these factors. In recent years, the sovereign credit ratings of some of the countries in which they operate have experienced negative trends, with ratings deteriorating in Argentina, Brazil and Colombia.
As of December 31, 2022,2023, the sovereign credit ratings for Argentina were CCC+CCC-, Ca and CCC,CCC-, as set by Standard & Poor’s, Moody’s Investors Service and Fitch Ratings, respectively.
As of December 31, 2022,2023, the sovereign credit ratings for Brazil were BB-,BB, Ba2 and BB-,BB, as set by Standard & Poor’s, Moody’s Investors Service and Fitch Ratings, respectively.
42
As of December 31, 2022,2023, the sovereign credit ratings for Colombia were BB+, Baa2Ba2 and BB+, as set by Standard & Poor’s, Moody’s Investors Service and Fitch Ratings, respectively.
Sovereign credit ratings of Argentina, Brazil and Colombia are currently rated below investment grade by Standard & Poor’s and Fitch credit rating agencies; Argentina and Brazil are currently rated below investment grade by Moody’s and Colombia is currently rated as investment grade by it. Consequently, the prices of securities offered by companies with significant operations in Argentina, Brazil and Colombia have been negatively affected. A prolongation or worsening of the current economic and political, among other factors, could lead to ratings downgrades. Any downgrade of Argentina, Brazil and Colombian sovereign credit ratings, or of any other country in which we operate, could heighten investors’ perception of risk and, as a result, cause the trading price of our Class A common shares to decline.
Infrastructure and workforce deficiency in many of the countries in Latin America in which we operate may impact economic growth and have a material adverse effect on us.
Our performance currently depends on the overall health and growth of the economies in which we operate in Latin America. On an aggregate, real GDP growth in FX Neutral of Latin American countries has fluctuated over the past few years, with a contraction of 0.9% CAGR2.4% compound annual growth rate (CAGR) between 20162019 and 2020,2023, according to Fitch. Growth is limited by inadequate infrastructure, including potential energy shortages and deficient transportation, logistics and telecommunication sectors, general strikes, the lack of a qualified labor force (particularly developers), and the lack of private and public investments in these areas, which limit productivity and efficiency. Additionally, despite the business continuity and crisis management policies currently in place, travel restrictions or potential impacts on personnel due to COVID-19 pandemic may disrupt our business and the markets in which we operate. Any of these factors could lead to labor market volatility and generally impact income, purchasing power and consumption levels, which could limit growth and ultimately have a material adverse effect on us.
Developments and the perceptions of risks in other countries, including other emerging markets, the United States and Europe, may harm the economy of Brazil and the other countries in which we operate and the trading price of our Class A common shares.
The market for securities offered by companies with significant operations in Brazil and Latin America is influenced by political, economic and market conditions in the region and, to varying degrees, market conditions in other emerging markets, as well as the United States, Europe and other countries. To the extent the conditions of the global markets or economy deteriorate, the business of companies with significant operations in Brazil and Latin America may be harmed. The weakness in the global economy has been marked by, among other adverse factors,
42
lower levels of consumer and corporate confidence, decreased business investment and consumer spending, increased unemployment, reduced income and asset values in many areas, reduction of China’s growth rate, currency volatility and limited availability of credit and access to capital, in addition to significant uncertainty results from the current COVID-19 pandemic in some important countries such as China.capital. Developments or economic conditions in other emerging market countries have at times significantly affected the availability of credit to companies with significant operations in Latin America and resulted in considerable outflows of funds from Latin American countries, decreasing the amount of foreign investments in the region.
Crises and political instability in other emerging market countries, the United States, Europe or other countries, including increased international trade tensions and protectionist policies, could decrease investor demand for securities offered by companies with significant operations in Brazil and Latin America, such as our Class A common shares. For example, in 2019, political and social unrest in Latin American countries, including Ecuador, Chile, Bolivia and Colombia, sparked political demonstrations and, in some instances, violence. In October 2019, presidential elections were held in Bolivia, Uruguay and Argentina. Controversial outcomes in Bolivia and Uruguay led to violent protests and claims of fraudulent elections in Bolivia and a runoff election in Uruguay. Similarly, Chile experienced political unrest and social strife, including a wave of protests and riots, beginning on October 18, 2019, sparked by an increase in the subway fare of the Santiago Metro and widened to reflect anger over living costs and inequality. In June 2016, the United Kingdom held a referendum in which the majority voted for the United Kingdom to leave the European Union (so called “Brexit”), and the British government will continue to negotiate the terms of its withdrawal.. The exit officially occurred on January 31, 2020. Brexit has created significant economic uncertainty in the UK and in Europe, the Middle East and Asia. In addition, the terms of Brexit could
43
potentially disrupt the markets we serve and the tax jurisdictions in which we operate and adversely change tax benefits or liabilities in these or other jurisdictions, and may cause us to lose investors, investment opportunities and employees. In addition, Brexit may lead to legal uncertainty and potentially divergent national laws and regulations as the UK determines which EU laws to replace or replicate. These developments, as well as potential crises and other forms of political instability or any other as of yet unforeseen development, may harm our business and the trading price of our Class A common shares. Additionally, on November 7, 2020, Joseph Biden won the presidential election in the United States and assumed office as the 46th President of the United States on January 20, 2021. The U.S. president has considerable influence, which may materially and adversely affect global economy and political stability. We cannot ensure that the Biden administration will adopt policies designed to promote macroeconomic stability, fiscal discipline, as well as domestic and foreign investment, which may materially and adversely impact the trading price of securities of Brazilian issuers, including our Class A common shares. In addition, the U.S. presidential elections are scheduled to take place in November 2024. The result of elections may lead to changes in government policies which may materially and adversely impact the trading price of our Class A common shares. We cannot give you any assurance as to whether any such changes will occur or as to their timing, nor can we estimate the impact they may have on our business. Growing economic uncertainty and news of a potentially recessive economy in the United States may also create uncertainty in the Brazilian economy. These developments, as well as potential crises and forms of political instability arising therefrom or any other as of yet unforeseen development, may harm our business and the price of our Class A common shares. See “—Our business is susceptible to risks associated with international sales and the use of our platform in various countries.”
Further increases in interest rates in other countries, especially the United States, may reduce global liquidity and investors’ interest in securities issued by companies with significant operations in Latin America, adversely affecting the price of our Class A common shares. Interest rates have increased rapidly in the United States in the year ended December 31, 2022. For instance, in March 2022, the U.S. Federal Reserve raised its benchmark federal funds rate by 0.25% to a range between 0.25% and 0.50%, the first increase since December 2018. Throughout 2022 and 2023, the U.S. Federal Reserve increased rates 11 times as a measure to curb inflation. Since then,the last raise in July 2023, the U.S. Federal Reserve raised the benchmark federal funds to a range between 4.25%5.25% and 4.50%5.50%. This, in turn, may redirect the flow of capital from emerging markets into the United States because investors may be able to obtain greater risk-adjusted returns in larger or more developed economies. Thus, companies in emerging market economies could find it more difficult and expensive to borrow capital and refinance existing debt. This may negatively affect our potential for economic growth and our ability to refinance our existing debt and could materially adversely affect our business, financial condition, results of operations, cash flows, prospects and the market price of our shares. Technology companies have been sensitive to the effects as investors may look to higher yield short-term investment options rather than wait for technology companies to generate long-term growth and expected future cash flows.
43
Furthermore, global markets are currently operating in a period of economic uncertainty, volatility and disruption, following Russia’s full-scale invasionincluding as a result of Ukraine on February 24, 2022. The ongoingthe current war between Ukraine and Russia and the war between Hamas and Israel in the Gaza Strip. The Ukraine war has provoked strong reactionscaused market turmoil and led oil prices to soar, reaching the highest level in almost 14 years, thus affecting the market commodities and energy in Brazil and in the world, which could raise our operational costs and consumer expenses and, therefore, adversely affect our operational results and financial condition. In addition, the war between Hamas and Israel in the Gaza Strip, an escalation in political tensions between the United States, Iran and Iraq, as well as other related conflicts in the Middle East, and imposition of additional sanctions from the United States, Iran, Iraq and European countries could cause the UK,price of oil to increase even further. Further, trade disputes between countries, in particular the EUcurrent dispute between the United States and various other countries around the world, including from the members of the North Atlantic Treaty Organization (NATO). Following Russia’s invasion of Ukraine beginning on February 24, 2022,China, crisis in the United States, the UK,European Union or in emerging countries and global tensions, including conflicts involving the EUoccurrence of Brexit, have generated political and other countries announced broad economic sanctions against Russia, including financial measuresinstability around the world, producing several effects that, directly or indirectly, adversely impact the Latin American capital markets and economy, such as freezing Russia’s central bank assets and limiting its ability to access its U.S. dollar reserves. Whilefluctuations in the precise effectprice of securities issued by listed companies, reductions in the supply of credit, deterioration of the ongoing war and these sanctions on the Russian and global economies remains uncertain, they have already resultedeconomy, fluctuations in significant volatility in financial markets, depreciation of the Russian ruble and the Ukrainian hryvnia against the U.S. dollar and other major currencies, as well as an increase in energy and commodity prices globally. Should the conflict continue to increase, markets may face continued volatility as well as economic and security consequences including, but not limited to, supply shortages of different kinds, further increases in prices of commodities, including piped natural gas, oil and agricultural goods, among others. Although the length and impact of the ongoing military conflict is highly unpredictable, the conflict in Ukraine and any other geopolitical tensions could have an adverse effect on the economy and business activity globally and lead to (i) credit and capital market disruptions, (ii) increase in interestforeign exchange rates and inflation, among others.
The weakness in the global economy has been marked by, among other adverse factors, lower levels of consumer and corporate confidence, decreased business investment and consumer spending, increased unemployment, reduced income and asset values in many areas, reduction of China’s growth rate, currency volatility and limited availability of credit and access to capital, in addition to the global financial systems crisis in early 2023.
Given our exposure to Latin American economies, any such factors can reduce investor interest in our securities. Developments, crises, political instability or economic conditions in other countries may significantly affect the perceptions of risks inherent to Latin America and the availability of credit to companies with significant operations in Latin America, which could result in considerable outflows of funds from Latin America and make it more difficult for us to access the capital markets and finance our operations in which we operate, (iii) lower or negative global growth, among othersthe future.
We are continuing to monitor the situation in Russia, Ukraine and globally and assess its potential impact on our business. Any of the abovementioned factors could adversely affect our business, prospects, financial condition, and operating results. The extent and duration of the military action, sanctions and resulting market disruptions are impossible to predict, but could be substantial. Any such disruptions may also magnify the impact of other risks described elsewhere in this annual report.
44
Certain Risks RelatedRelating to Our Class A Common Shares
An active trading market for our Class A common shares may not be sustainable. If an active trading market is not maintained, investors may not be able to resell their shares and our ability to raise capital in the future may be impaired.
Although our Class A common shares are listed and being traded on the NYSE, an active trading market for our Class A common shares may not be maintained. Consequently, investors may not be able to sell our Class A common shares at prices equal to or greater than the price paid by such investor. In addition to the risks described above, the market price of our Class A common shares may be influenced by many factors, some of which are beyond our control, including:
technological innovations by us or competitors;
the failure of financial analysts to cover our Class A common shares after our initial public offering or changes in financial estimates by analysts;
actual or anticipated variations in our operating results;
changes in financial estimates by financial analysts, or any failure by us to meet or exceed any of these estimates, or changes in the recommendations of any financial analysts that elect to follow our Class A common shares or the shares of our competitors;
announcements by us or our competitors of significant contracts or acquisitions;
future sales of our shares;
investor perceptions of us and the industries in which we operate; and
44
difficulties experienced by our parent company and/or by any of our associate companies in Brazil, or direct or indirect subsidiaries of our parent company.
In addition, the stock market in general has experienced substantial price and volume fluctuations that have often been unrelated or disproportionate to the operating performance of particular companies affected. These broad market and industry factors may materially harm the market price of our Class A common shares, regardless of our operating performance. In the past, following periods of volatility in the market price of certain companies’ securities, securities class action litigation has been instituted against these companies. Any such litigation, if instituted against us, could adversely affect our financial condition or results of operations. If a market does not develop or is not maintained, the liquidity and price of our Class A common shares could be materially adversely affected.
The market price of our shares may be volatile or may decline sharply or suddenly, regardless of our operating performance, and we may not be able to meet investors’ or analysts’ expectations. Investors may not be able to resell their shares at a price equal or greater than the price paid by such investor and may lose all or part of their investment.
The market price of our Class A common shares may fluctuate or decline significantly in response to a number of factors, many of which are beyond our control, including, but not limited to:
actual or forecast fluctuations in revenue or in other operating and financial results;
variations between our actual operating results and the expectations of securities analysts, investors and the financial community;
45
action by securities analysts who begin or continue to cover us, changes in the financial estimates of any securities analysts who follow our company or our failure to meet these estimates or investors’ expectations;
announcements by us or by our competitors of significant products or features, technical innovations, acquisitions, strategic partnerships, joint ventures or capital commitments;
negative media coverage or publicity affecting us or our parent company, whether true or not;
changes in the operating performance and stock market valuations of SaaS ecommerce companies in general, including our competitors;
fluctuations in the price and volume of the stock market in general, including as a result of trends in the economy as a whole;
threats of lawsuits and actions brought against us or decided against us;
developments in the legislation or regulatory action, including interim or final decisions by judicial or regulatory bodies;
changes in accounting standards, policies, guidelines, interpretations or principles;
any significant changes to our board of directors or management;
any security incidents or public reports of security incidents that occur in our platform or in our sector;
statements, comments or opinions from public officials that our product offerings are or may be illegal, regardless of interim or final decisions of judicial or regulatory bodies; and
45
other events or factors, including those resulting from war, terrorist incidents, natural disasters or responses to such events.
In addition, price and volume fluctuations in the stock markets have affected and continue to affect the stock prices of many CPaaS companies. Often, their stock prices fluctuate in ways that are unrelated or disproportionate to the operating performance of companies. In some instances, shareholders have filed a class action lawsuit after periods of market volatility. If we are involved in litigation regarding securities, this could subject us to substantial costs, divert resources and management attention from our business and seriously undermine our business. In addition, the occurrence of any of the factors listed above, along with others, may cause our share price to drop significantly and there is no guarantee that our share price will recover. As a result, investors may not be able to sell their Class A common shares at a price equal or greater than the price paid by such investor and may lose some or all of their investment.
Requirements associated with being a public company in the United States demand significant company resources and management attention.
We have incurred, and expect to continue incurring, significant additional legal, accounting, reporting and other expenses as a result of having publicly traded Class A common shares. We also have incurred, and expect to continue incurring costs, including, but not limited to, directors’ fees, increased directors’ and officers’ insurance, investor relations, and various other costs of a public company.
We have incurred, and expect to continue incurring, costs associated with corporate governance requirements, including requirements under the Exchange Act, the Sarbanes-Oxley Act, the Dodd-Frank Wall Street Reform and the Consumer Protection Act, listing requirements and other rules and regulations applying to companies with publicly listed securities. We expect these rules and regulations to increase our legal and financial compliance costs and make some management and corporate governance activities more difficult, time consuming and costly, particularly after we are no longer an “emerging growth company,” increasing the demands on our systems and resources. Among other things, the SEC rules applying to us, require we file annual and current reports on our business and operating results.
46
These rules and regulations may make it more difficult and more expensive for us to obtain director and officer liability insurance, and we may be required to accept reduced policy limits and coverage or incur substantially higher costs to obtain the same or similar coverage. This could have an adverse impact on our ability to recruit and bring on a qualified independent board.
Most members of our management team have limited experience managing a publicly traded company, interacting with public company investors and complying with the increasingly complex laws pertaining to public companies in the United States. The additional demands associated with being a public company in the United States may disrupt regular operations of our business by diverting the attention of some of our senior management team away from revenue producing activities to management and administrative oversight, adversely affecting our ability to attract and complete business opportunities and increasing the difficulty in both retaining professionals and managing and growing our businesses. Our management team may not successfully or efficiently manage our transition to being a public company subject to significant regulatory oversight and reporting obligations under the U.S. federal securities laws and the continuous scrutiny of securities analysts and investors.
In addition, the public reporting obligations associated with being a public company in the United States may subject us to litigation as a result of increased scrutiny of our financial reporting. If we are involved in litigation regarding our public reporting obligations, this could subject us to substantial costs, divert resources and management attention from our business and seriously undermine our business.
46
Our controlling shareholders, in the aggregate, directly or indirectly hold 65.7%66.0% of our outstanding Class B common shares, which representand approximately 61.2%61.6% of the voting power of our issued capital and 39.1%38.6% of our total equity ownership, and control all matters requiring shareholder approval. Our controlling shareholders also have the right to nominate a majority of our board of directors and consent rights over certain corporate transactions. This concentration of ownership limits investors’ ability to influence corporate matters.
Our controlling shareholders directly or indirectly hold 65.7%66.0% of our Class B common shares, resulting in their ownership of 39.1%38.6% of our outstanding shares and 61.2%61.6% of the combined voting power of our Class A and Class B common shares. See “Item 7. Major Shareholders and Related Party Transactions—A. Major Shareholders.” These shareholders may control a majority of our voting power and have the ability to control matters affecting, or submitted to a vote of, our shareholders. As a result, these shareholders may be able to elect the members of our board of directors and set our management policies and exercise overall control over us. In addition, the rights granted pursuant to our Articles of Association mean that our controlling shareholders may be able to appoint a majority of our board despite owning a non-proportionate number of shares until they own less than 25.0% of the total voting power. See “Item 10. Additional Information—B. Memorandum and Articles of Association—Description of Share Capital.” for more information.
The interests of these shareholders may conflict with, or differ from, the interests of other shareholders. For example, our current controlling shareholders may cause us to make acquisitions that increase the amount of our indebtedness or outstanding shares, sell revenue-generating assets or inhibit change of control transactions that benefit other shareholders. Our controlling shareholders’ decisions on these matters may be contrary to your expectations or preferences, and they may take actions that could be contrary to your interests. Our controlling shareholder will be able to prevent any other shareholders from blocking these actions. For further information regarding shareholdings in our company, see “Item 7. Major Shareholders and Related Party Transactions—A. Major Shareholders.” So long as these shareholders continue to own a substantial number of our shares, they will significantly influence all our corporate decisions and together with other shareholders, they may be able to effect or inhibit changes in the control of our company.
47
The disparity in voting rights among classes of our shares may have a potential adverse effect on the price of our Class A common shares, and may limit or preclude the investors’ ability to influence corporate matters.
Each Class A common share will entitle its holder to one (1) vote per share on all matters submitted to a vote of our shareholders. Each holder of our Class B common shares will be entitled to ten (10) votes per Class B common share so long as the Class B common shares represent is at least 10% of our outstanding shares. The difference in voting rights could adversely affect the value of our Class A common shares by, for example, delaying or deferring a change of control or, if investors view or any potential future purchaser of our company views, the superior voting rights of the Class B common shares have value. Given the ten-to-one voting ratio between our Class B ordinary and Class A common shares, the holders of our Class B common shares collectively will continue to control a majority of the combined voting power of our shares and therefore be able to control all matters submitted to our shareholders so long as the Class B common shares represent at least 10% of all outstanding shares of our Class A and Class B common shares in addition to certain other rights to which our controlling shareholders are entitled (see risk factor immediately above and “Item 10. Additional Information—B. Memorandum and Articles of Association—Description of Share Capital.” This concentrated control will limit or preclude the investors’ ability to influence corporate matters for the foreseeable future.
Future transfers by holders of Class B common shares will generally result in those shares converting to Class A common shares, subject to limited exceptions, such as certain transfers effected to permitted transferees (including certain transfers between our controlling shareholders) or for estate planning or charitable purposes as well as transfers between our controlling shareholders. The conversion of Class B common shares to Class A common shares will have the effect, over time, of increasing the relative voting power of those holders of Class B common shares who retain their shares in the long term. For a description of our dual class structure, see “Item 10. Additional Information—B. Memorandum and Articles of Association—Description of Share Capital.”
Our Class A common shares may not be a suitable investment for all investors, as investment in our Class A common shares presents risks and the possibility of financial losses.
The investment in our Class A common shares is subject to risks. Investors who wish to invest in our Class A common shares are thus subject to asset losses, including loss of the entire value of their investment, as well as other risks, including those related to our Class A common shares, us, the sector in which we operate, our shareholder structure and the general macroeconomic environment in Brazil, among other risks.
47
Each potential investor in our Class A common shares must therefore determine the suitability of that investment in light of its own circumstances. In particular, each potential investor should:
have sufficient knowledge and experience to make a meaningful evaluation of our Class A common shares, the merits and risks of investing in our Class A common shares and the information contained in this annual report;
have access to, and knowledge of, appropriate analytical tools to evaluate, in the context of its particular financial situation, an investment in our Class A common shares and the impact our Class A common shares will have on its overall investment portfolio;
have sufficient financial resources and liquidity to bear all of the risks of an investment in our Class A common shares;
understand thoroughly the terms of our Class A common shares and be familiar with the behavior of any relevant indices and financial markets; and
be able to evaluate (either alone or with the help of a financial adviser) possible scenarios for economic, interest rate and other factors that may affect its investment and its ability to bear the applicable risks.
48
Class A common shares eligible for future sale may cause the market price of our Class A common shares to drop significantly.
The market price of our Class A common shares may decline as a result of sales of a large number of our Class A common shares in the market after our initial public offering (including Class A common shares issuable upon conversion of Class B common shares) or the perception that these sales may occur. These sales, or the possibility that these sales may occur, also might make it more difficult for us to sell equity securities in the future at a time and at a price that we deem appropriate.
As of December 31, 20222023 we had 81,143,03577,392,906 outstanding Class A common shares and 107,849,494106,634,102 Class B common shares.
Our controlling shareholders or entities controlled by them or their permitted transferees will be able to sell their shares in the public market from time to time without registering them, subject to certain limitations on the timing, amount and method of those sales imposed by regulations promulgated by the SEC. If our controlling shareholders, the affiliated entities controlled by them or its permitted transferees were to sell a large number of Class A common shares, the market price of our Class A common shares may decline significantly. In addition, the perception in the public markets that sales by them might occur may also cause the trading price of our Class A common shares to decline.
We may lose our foreign private issuer status which would then require us to comply with the Exchange Act’s domestic reporting regime and cause us to incur significant legal, accounting and other expenses.
In order to maintain our current status as a foreign private issuer, either (a) more than 50% of our Class A common shares must be either directly or indirectly owned of record by nonresidents of the United States or (b)(1) a majority of our executive officers or directors may not be U.S. citizens or residents, (2) more than 50% of our assets cannot be located in the United States and (3) our business must be administered principally outside the United States. If we lose this status, we would be required to comply with the Exchange Act reporting and other requirements applicable to U.S. domestic issuers, which are more detailed and extensive than the requirements for foreign private issuers. We may also be required to make changes in our corporate governance practices in accordance with various SEC rules and regulations. The regulatory and compliance costs to us under U.S. securities laws if we are required to comply with the reporting requirements applicable to a U.S. domestic issuer may be significantly higher than the costs we will incur as a foreign private issuer.
48
Our status as a controlled company and a foreign private issuer exempts us from certain of the corporate governance standards of the NYSE, limiting the protections afforded to investors.
We are a “controlled company” and a “foreign private issuer” within the meaning of the corporate governance standards. Under the rules, a controlled company is exempt from certain corporate governance requirements. In addition, a foreign private issuer may elect to comply with the practice of its home country and not to comply with certain corporate governance requirements, including the requirements that (1) a majority of the board of directors consists of independent directors, (2) a nominating and corporate governance committee be established that is composed entirely of independent directors and has a written charter addressing the committee’s purpose and responsibilities, (3) a compensation committee be established that is composed entirely of independent directors and has a written charter addressing the committee’s purpose and responsibilities, and (4) an annual performance evaluation of the nominating and corporate governance and compensation committees be undertaken. Although we have similar practices, they do not entirely conform to the requirements; therefore, we currently use these exemptions and intend to continue using them. Accordingly, investors will not have the same protections provided to shareholders of companies that are subject to all corporate governance requirements.
49
Our Articles of Association contain anti-takeover provisions that may discourage a third party from acquiring us and adversely affect the rights of holders of our Class A common shares.
Our Articles of Association contain certain provisions that could limit the ability of others to acquire our control, including a provision that grants authority to our board of directors to establish and issue from time to time one or more series of preferred shares without action by our shareholders and to determine, with respect to any series of preferred shares, the terms and rights of that series. These provisions could have the effect of depriving our shareholders of the opportunity to sell their shares at a premium over the prevailing market price by discouraging third parties from seeking to obtain our control in a tender offer or similar transactions.
We have not adopted a dividend policy with respect to future dividends. If we do not declare any dividends in the future, investors will have to rely on the price appreciation of our Class A common shares in order to achieve a return on their investment.
We have not adopted a dividend policy with respect to future dividends. The amount of any distributions will depend on many factors such as our results of operations, financial condition, cash requirements, prospects and other factors deemed relevant by our board of directors or, where applicable, our shareholders. We may retain our future earnings, if any, for the foreseeable future, to fund the operation of our business and future growth.
Accordingly, if we do not declare dividends in the future, investors will most likely have to rely on sales of their Class A common shares, which may increase or decrease in value, as the only way to realize cash from their investment. There is no guarantee that the price of our Class A common shares will ever exceed the price that investors pay.
Our dual-class structure may result in a lower or more volatile market price of our Class A common shares. Our dual-class capital structure means our shares will not be included in certain stock indices. We cannot predict the impact this may have on our Class A common share price.
We cannot predict whether our dual-class structure, combined with the concentrated control of our Company (see “Item 7. Major Shareholders and Related Party Transactions—A. Major Shareholders.”) will result in a lower or more volatile market price of our Class A common shares or in adverse publicity or other adverse consequences. FTSE Russell, S&P Dow Jones and MSCI announced changes to their eligibility criteria for the inclusion of shares of public companies on certain indices, namely, to exclude companies with multiple classes of common shares. FTSE Russell requires greater than five percent of the company’s voting rights (aggregated across all of its equity securities, including, where identifiable, those not listed or trading) in the hands of public shareholders whereas S&P Dow Jones announced that companies with multiple share class structures, such as ours,
49
will not be eligible for inclusion in the S&P 500, S&P MidCap 400 and S&P SmallCap 600, which together comprise the S&P Composite 1500. MSCI also announced its review of no-vote and multi-class structures and temporarily barred new multi-class listings from its ACWI Investable Market Index and U.S. Investable Market 2500 Index.Index; however, MSCI has since announced its decision to include equity securities “with unequal voting structures” in its indices and to launch a new index that specifically includes voting rights in its eligibility criteria. We cannot guarantee that other stock indices will not take a similar approach to FTSE Russell, S&P Dow Jones and MSCI in the future. Pursuant to these policies, our dual-class structure makes our Class A common shares ineligible for inclusion in such indices and mutual funds, exchange-traded funds and other investment vehicles that attempt to passively track these indices will not invest in our stock. Any such exclusion from indices could result in a less active trading market for our Class A common shares and depress the valuations of publicly traded companies excluded from the indices compared to those of similar companies that are included. In addition, several shareholder advisory firms have announced their opposition to the use of multiple share class structures. As a result, our dual-class structure may cause shareholder advisory firms to publish negative commentary about our corporate governance practices or otherwise seek to cause us to change our capital structure. Any actions or publications by shareholder advisory firms critical of our corporate governance practices or capital structure could also adversely affect the value of our Class A common shares.
If securities or industry analysts do not publish reports, or publish inaccurate or unfavorable reports about our business, the price of our Class A common shares and our trading volume could decline.
The trading market for our Class A common shares will depend in part on the research and reports that securities or industry analysts publish about us or our business. Securities and industry analysts currently cover our parent company, but they do not, and may never, publish research on our company. If no or too few securities or industry analysts commence coverage of our company, the trading price for our Class A common shares would likely be negatively affected. If one or more of the analysts who cover us downgrade their target price for our Class A common shares or publish inaccurate or unfavorable reports about our business, the price of our Class A common shares would likely decline. If one or more of these analysts cease coverage of our company or fail to publish reports on us regularly, demand for our Class A common shares could decrease, which might cause the price of our Class A common shares and trading volume to decline.
50
We may need to raise additional capital in the future by issuing securities, use our Class A common shares as acquisition consideration, or may enter into corporate transactions with an effect similar to a merger, which may dilute investors’ interest in our share capital, change the nature of our business and/or affect the trading price of our Class A common shares.
We may need to raise additional funds to grow our business, including through acquisitions, and implement our growth strategy going forward by engaging in public or private issuances of common shares or securities convertible into, or exchangeable for, our common shares, which may dilute investors’ interest in our share capital or result in a decrease in the market price of our common shares. Any fundraising through the issuance of shares or securities convertible into or exchangeable for shares, the use of our Class A common shares as acquisition consideration, or the participation in corporate transactions with an effect similar to a merger, may dilute investors’ interest in our share capital, change the nature of our business from the business that investors originally invested in (including as a result of merger or acquisition transactions) and/or result in a decrease in the market price of our Class A common shares.
As a foreign private issuer and an “emerging growth company” (as defined in the JOBS Act), we will have different disclosure and other requirements from U.S. domestic registrants and non-emerging growth companies. We may take advantage of exemptions from certain corporate governance regulations of the NYSE, and this may result in less protection for the holders of our Class A common shares.
As a foreign private issuer and emerging growth company, we may be subject to different disclosure and other requirements than domestic U.S. registrants and non-emerging growth companies. For example, as a foreign private issuer, in the United States, we are not subject to the same disclosure requirements as a domestic U.S. registrant under the Exchange Act, including the requirements to prepare and issue quarterly reports on Form 10-Q or to file current reports on Form 8-K upon the occurrence of specified significant events, the proxy rules applicable to domestic U.S. registrants under Section 14 of the Exchange Act or the insider reporting and short swing profit rules applicable to domestic U.S. registrants under Section 16 of the Exchange Act. In addition, we intend to rely on exemptions from certain U.S. rules which will permit us to follow Cayman Islands legal requirements rather than certain of the requirements that are applicable to U.S. domestic registrants.
50
We will follow Cayman Islands laws and regulations that are applicable to Cayman Islands companies. However, Cayman Islands laws and regulations applicable to Cayman Islands companies do not contain any provisions comparable to the U.S. proxy rules, the U.S. rules relating to the filing of reports on Form 10-Q or 8-K or the U.S. rules relating to liability for insiders who profit from trades made in a short period of time, as referred to above.
Furthermore, foreign private issuers are required to file their annual report on Form 20-F within 120 days after the end of each fiscal year, while U.S. domestic issuers that are accelerated filers are required to file their annual report on Form 10-K within 75 days after the end of each fiscal year. Foreign private issuers are also exempt from Regulation Fair Disclosure, aimed at preventing issuers from making selective disclosures of material information, although we will be subject to Cayman Islands laws and regulations having substantially the same effect as Regulation Fair Disclosure. As a result of the above, even though we are required to file reports on Form 6-K disclosing the limited information which we have made or are required to make public pursuant to Cayman Islands law, or are required to distribute to shareholders generally, and that is material to us, investors may not receive information of the same type or amount that is required to be disclosed to shareholders of a U.S. company.
In addition, according to the equity rules of the NYSE, listed companies are required, among other things, to have a majority of independent board members, and to have independent director oversight of executive compensation, nomination of directors and corporate governance matters. As a foreign private issuer, however, we are permitted to, and we will, follow home country practice in lieu of the above requirements. For more information, see the section “Item 10. Additional Information—B. Memorandum and Articles of Association—Description of Share Capital.”
51
The JOBS Act contains provisions that, among other things, relax certain reporting requirements for emerging growth companies. Under this act, as an emerging growth company, we will not be subject to the same disclosure and financial reporting requirements as non-emerging growth companies. For example, as an emerging growth company we are permitted to, and intend to, take advantage of certain exemptions from various reporting requirements that are applicable to other public companies that are not emerging growth companies. Also, we will not have to comply with future audit rules promulgated by the U.S. Public Company Accounting Oversight Board, or PCAOB (unless the SEC determines otherwise), and our auditors will not need to attest to our internal controls under Section 404(b) of the Sarbanes-Oxley Act. We may follow these reporting exemptions until we are no longer an emerging growth company. As a result, our shareholders may not have access to certain information that they deem important. We will remain an emerging growth company until the earlier of (1) the last day of the fiscal year (a) following the fifth anniversary of the completion of our initial public offering, (b) in which we have total annual revenue of at least US$1.235 billion, or (c) in which we are deemed to be a large accelerated filer, which means the market value of our Class A common shares that is held by non-affiliates exceeds US$700.0 million as of the prior June 30, and (2) the date on which we have issued more than US$1.00 billion in non-convertible debt during the prior three-year period. Accordingly, the information about us available to investors will not be the same as, and may be more limited than, the information available to shareholders of a non-emerging growth company. We could be an “emerging growth company” for up to five years, although circumstances could cause us to lose that status earlier, including if the market value of our Class A common shares held by non-affiliates exceeds US$700 million as of any June 30 (the end of our second fiscal quarter) before that time, in which case we would no longer be an “emerging growth company” as of the following December 31 (our fiscal year end).
We cannot predict if investors will find our Class A common shares less attractive because we may rely on these exemptions. If some investors find our Class A common shares less attractive as a result, there may be a less active trading market for our Class A common shares and the price of our Class A common shares may be more volatile.
51
Our shareholders may face difficulties in protecting their interests because we are a Cayman Islands exempted company.
Our corporate affairs will be governed by our amended and restated memorandum and articles of association, or Articles of Association, the Companies Act (Revised) of the Cayman (“Companies Act”) and the common law of the Cayman Islands. We will also be subject to the federal securities laws of the United States. The rights of shareholders to take action against the directors, actions by minority shareholders and the fiduciary responsibilities of our directors to us under Cayman Islands law are to a large extent governed by the common law of the Cayman Islands. The common law of the Cayman Islands is derived in part from comparatively limited judicial precedent in the Cayman Islands as well as from English common law, the decisions of whose courts are of persuasive authority, but are not binding on a court in the Cayman Islands. The rights of our shareholders and the fiduciary responsibilities of our directors under Cayman Islands law are different from what they would be under statutes or judicial precedent in some jurisdictions in the United States. In particular, the Cayman Islands has a different body of securities laws as compared to the United States, and certain states, such as Delaware, may have more fully developed and judicially interpreted bodies of corporate law.
While Cayman Islands law allows a dissenting shareholder to express the shareholder’s view that a court sanctioned reorganization of a Cayman Islands company would not provide fair value for the shareholder’s shares, Cayman Islands statutory law does not specifically provide for shareholder appraisal rights in connection with a merger or consolidation of a company that takes place by way of a scheme of arrangement. This may make it more difficult for investors to assess the value of any consideration investors may receive in a merger or consolidation that takes place by way of a court approved scheme of arrangement or to require that the acquirer gives investors additional consideration if investors believe the consideration offered is insufficient. However, Cayman Islands statutory law provides a mechanism for a dissenting shareholder in a merger or consolidation that does not take place by way of a scheme of arrangement to apply to the Grand Court for a determination of the fair value of the dissenter’s shares if it is not possible for the company and the dissenter to agree on a fair price within the time limits prescribed.
52
Shareholders of Cayman Islands exempted companies (such as us) have no general rights under Cayman Islands law to inspect corporate records and accounts or to obtain copies of lists of shareholders. Our directors have discretion under our Articles of Association to determine whether or not, and under what conditions, our corporate records may be inspected by our shareholders, but are not obliged to make them available to our shareholders. This may make it more difficult for investors to obtain information needed to establish any facts necessary for a shareholder motion or to solicit proxies from other shareholders in connection with a proxy contest.
Subject to limited exceptions, under Cayman Islands law, a minority shareholder may not bring a derivative action against the board of directors. Our Cayman Islands counsel is not aware of any reported class actions having been brought in a Cayman Islands court.
United States civil liabilities and certain judgments obtained against us by our shareholders may not be enforceable.
We are a Cayman Islands exempted company and substantially all of our assets are located outside of the United States. In addition, the majority of our directors and officers are nationals and residents of countries other than the United States. A substantial portion of the assets of these persons is located outside of the United States. As a result, it may be difficult to effect service of process within the United States upon these persons. It may also be difficult to enforce in U.S. courts judgments obtained in U.S. courts based on the civil liability provisions of the U.S. federal securities laws against us and our officers and directors who are not resident in the United States and the substantial majority of whose assets are located outside of the United States.
We have been advised by our Cayman Islands legal counsel, Campbells LLP, that the courts of the Cayman Islands are unlikely (1) to recognize or enforce against us judgments of courts of the United States predicated upon the civil liability provisions of the securities laws of the United States or any State; and (2) in original actions brought in the Cayman Islands, to impose liabilities against us predicated upon the civil liability provisions of the securities laws of the United States or any State, to the extent that the liabilities imposed by those provisions are penal in nature. In those circumstances, although there is no statutory enforcement in the Cayman Islands of
52
judgments obtained in the United States, the courts of the Cayman Islands will recognize and enforce a foreign money judgment of a foreign court of competent jurisdiction without retrial on the merits based on the principle that a judgment of a competent foreign court imposes upon the judgment debtor an obligation to pay the sum for which judgment has been given provided certain conditions are met. For a foreign judgment to be enforced in the Cayman Islands, such judgment must be final and conclusive, and must not be in respect of taxes or a fine or penalty, inconsistent with a Cayman Islands judgment in respect of the same matter, impeachable on the grounds of fraud or obtained in a manner, and or be of a kind the enforcement of which is, contrary to natural justice or the public policy of the Cayman Islands (awards of punitive or multiple damages may well be held to be contrary to public policy). A Cayman Islands Court may stay enforcement proceedings if concurrent proceedings are being brought elsewhere.
Judgments of Brazilian courts to enforce our obligations with respect to our Class A common shares may be payable only in reais. The exchange rate in force at the time may not offer non-Brazilian investors full compensation for any claim arising from our obligations.
Most of our assets are located outside of the United States; the majority of them are located in Brazil. If proceedings are brought in the courts of Brazil seeking to enforce our obligations in respect of our Class A common shares, we may not be required to discharge our obligations in a currency other than the real. Under Brazilian exchange control laws, an obligation in Brazil to pay amounts denominated in a currency other than the real may only be satisfied in Brazilian currency at the exchange rate, as determined by the Central Bank, in effect on the date (1) of actual payment, (2) on which such judgment is rendered, or (3) on which collection or enforcement proceedings are started against us, and such amounts are then adjusted to reflect exchange rate variations through the effective payment date. The then prevailing exchange rate may not afford non-Brazilian investors with full compensation for any claim arising out of or related to our obligations under the Class A common shares.
53
We are a Cayman Islands exempted company with limited liability. The rights of our shareholders, including with respect to fiduciary duties and corporate opportunities, may be different from the rights of shareholders governed by the laws of U.S. jurisdictions.
We are a Cayman Islands exempted company with limited liability. Our corporate affairs are governed by our Articles of Association, the Companies Act and by the laws of the Cayman Islands. The rights of shareholders and the responsibilities of members of our board of directors may be different from the rights of shareholders and responsibilities of directors in companies governed by the laws of U.S. jurisdictions. In particular, as a matter of Cayman Islands law, directors and officers owe the following fiduciary duties: (1) duty to act in good faith in what the director or officer believes to be in the best interests of the company as a whole; (2) duty to exercise powers for the purposes for which those powers were conferred and not for a collateral purpose; (3) duty not to fetter the exercise of future discretion; (4) duty to exercise powers fairly as between different sections of shareholders; (5) duty to exercise independent judgment; and (6) duty not to put themselves in a position in which there is a conflict between their duty to the company and their personal interests. With respect to the duty of directors to avoid conflicts of interest, our Articles of Association vary from the applicable provision of Cayman Islands law mentioned above by providing that a director must disclose the nature and extent of his or her interest in any contract or arrangement, and following such disclosure and subject to any separate requirement under applicable law or the listing rules of the NYSE, and unless disqualified by the chairman of the relevant meeting, such director may vote in respect of any transaction or arrangement in which he or she is interested and may be counted in the quorum at the meeting. In addition to the above, under Cayman Islands law, directors also owe a duty of care which is not fiduciary in nature. This duty has been defined as a requirement to act as a reasonably diligent person having both the general knowledge, skill and experience that may reasonably be expected of a person carrying out the same functions as are carried out by that director in relation to the company and the general knowledge, skill sets and experience which that director has. As set out above, directors have a duty not to put themselves in a position of conflict and this includes a duty not to engage in self-dealing, or to otherwise benefit as a result of their position. However, in some instances what would otherwise be a breach of this duty can be forgiven and/or authorized in advance by the shareholders; provided, that there is full disclosure by the directors. This can be done by way of permission granted in the memorandum and articles of association or alternatively by shareholder approval at general meetings. Accordingly, as a result of multiple business affiliations, our officers and directors may have similar legal obligations relating to presenting business opportunities meeting the above-listed criteria to multiple entities. In addition, conflicts of interest may arise when our board evaluates a particular business opportunity with respect to the above-listed criteria We cannot guarantee that any of the above mentioned conflicts will be resolved in
53
our favor. Furthermore, each of our officers and directors may have pre-existing fiduciary obligations to other businesses of which they are officers or directors. Conversely, under Delaware corporate law, a director has a fiduciary duty to the corporation and its shareholders (made up of two components) and the director’s duties prohibit self-dealing by a director and mandate that the best interest of the corporation and its shareholders take precedence over any interest possessed by a director, officer or controlling shareholder and not shared by the shareholders generally. For more information, see “Item 10. Additional Information—B. Memorandum and Articles of Association— Description of Share Capital—Principal Differences between Cayman Islands and U.S. Corporate Law.”
The Cayman Islands Economic Substance Acts may affect our operations.
In 2021 the Cayman Islands enacted the International Tax Co-operation (Economic Substance) Act (As Revised), or the Cayman Economic Substance Act. We are required to comply with the Cayman Economic Substance Act. As we are a Cayman Islands company, compliance obligations include filing annual notifications for us, which need to state whether we are carrying out any relevant activities and, if so, whether we have satisfied economic substance tests to the extent required under the Cayman Economic Substance Act. As it is a relatively new regime, it is anticipated that the Cayman Economic Substance Act will evolve and be subject to further clarification and amendments. We may need to allocate additional resources to keep updated with these developments, and may have to make changes to our operations in order to comply with all requirements under the Cayman Economic Substance Act. Failure to satisfy these requirements may subject us to penalties under the Cayman Economic Substance Act.
The Cayman Islands Tax Information Authority shall impose a penalty of CI$10,000 (or US$12,500) on a relevant entity for failing to satisfy the economic substance test or CI$100,000 (or US$125,000) if it is not satisfied in the subsequent financial year after the initial notice of failure. Following failure after two consecutive years the Grand Court of the Cayman Islands may make an order requiring the relevant entity to take specified action to satisfy the economic substance test or ordering it that it is defunct or be struck off.
54
INFORMATION ON THE COMPANY |
| A. | History and Development of the Company |
VTEX started its journey in 2000, founded by Geraldo do Carmo Thomaz Júnior and Mariano Gomide de Faria. The first 10 years of our company was a moment of learning and pivoting our business model until consolidating as a SaaS Commerce Platform in 2010.
Until 2012, we focused on building our leadership position in Brazil. By 2013, we started expanding across Latin America and more recently, we expanded outside of Latin America, into the US and Europe, becoming a global company.
On July 25, 2018, VTEX, our ultimate holding company was incorporated as a Cayman Islands exempted company with limited liability duly registered with the Cayman Islands Registrar of Companies. VTEX is a publicly-held company listed on the NYSE since July 2021, and therefore subject to certain reporting requirements of the Exchange Act.
Our principal executive office is located at 125 Kingsway, London, England – WC2B 6NH, UK. Our registered office is located at 4th floor, Harbour Place, 103 South Church Street, PO Box 10240, Grand Cayman, KYI-1002, Cayman Islands.
| B. | Business Overview |
VTEX is the enterprise digital commerce platform where global brands and retailers run their world of commerce. Our platform is designed to be the operating system for the commerce ecosystem, enabling enterprise brands and retailers to orchestrate their complex network of consumers, business partners, suppliers, and fulfillment providers in one place. VTEX puts its customers’ business on a fast path to growth with a complete Commerce, Marketplace, and OMS solution. We help global companies build, manage and deliver native and advanced B2B, B2C, and Marketplace commerce experiences with competitive time-to-market and without complexity so they can stay relevant for the modern, convenience driven consumer.
54
Our platform enables our customers to execute their commerce strategy, including building online stores, integrating and managing orders across channels, and creating marketplaces to sell products from third-party vendors. VTEX has been a leader in accelerating the digital commerce transformation in Latin America and is expanding globally. Our platform is engineered to enterprise-level standards and functionality with approximately 84%86% of our GMV coming from large, blue-chip companies (i.e. customers with more than US$10 million of GMV per year). We are trusted by more than 2,6002.6 thousand customers with over 3,4003.5 thousand active online stores across 3843 countries to connect with their consumers in a meaningful way.
We benefit from the acceleration of digitalization globally, and in particular in Latin America, where ecommerce is still underpenetrated. Accelerating ecommerce growth, evolving consumer expectations and the proliferation of digital shopping alternatives are raising the bar for brands and retailers to stay relevant. Legacy structures developed over years force enterprises to choose between deep customization and speed to market. Our technology combined with our ecosystem of partners solves this problem. We deliver flexibility and simplicity to complex, mission critical commerce operations.
We enable our customers to implement multiple go-to-market strategies. Our platform natively combines commerce, order management and marketplace functionality, allowing enterprises to sell a wider assortment of products across more channels than ever before. By integrating with suppliers, distributors, third-party vendors, franchisees, warehouses, and brick-and-mortar stores, enterprises can rapidly implement new business models and digital experiences, including direct-to-consumer, marketplace, ship from store, endless aisle, drop-ship, conversational commerce and live shopping. We call this set of deep integrations “Collaborative Commerce.”
55
Our Collaborative Commerce approach benefits from a powerful ecosystem with significant network effects. Our ecosystem includes more than 3,000 integrated solutions,6,000 VTEX IO extensions created by third parties, 1,000 systems integrators, 300SIs and ISVs, 330 marketplaces, 150180 payments solutions and 90 logistics companies. Our partners’ solutions are embedded within our platform, allowing our customers to seamlessly execute their commerce vision and strategy. The more customers adopt our platform and partners join our network, the more efficiently we can help facilitate the future of commerce.
Our technology is flexible and extensible. Our open, API-first, multi-tenant commerce platform allows enterprises to adopt new commerce capabilities with minimal risk. Combined with our low-code development platform, VTEX IO, we enable our customers to build proprietary technology, seamlessly integrated with extensive out-of-the-box functionality. In essence, our “Composable Commerce” approach allows enterprises to leverage the knowledge of highly specialized talents from the VTEX ecosystem while focusing their own talent on what makes them unique. Composable Commerce enables our customers to rapidly deploy our solutions and quickly iterate and customize the entire commerce experience at scale.
We serve a diversified mix of global enterprise brands and retailers executing on innovative opportunities. We enable manufacturers and CPG companies to execute their direct-to-consumer strategy on a global scale. We help fashion, grocery and other retailers to expand their reach through omnichannel, marketplace and drop-ship models. Our platform offers a variety of capabilities, including web, mobile, conversational commerce, live shopping and in-store sales, distributed order management, channel management, seller management, content and catalog management and fulfillment channel integrations. We help our customers rapidly execute their bespoke commerce strategies, and provide unprecedented time to revenue. We
In the year 2023, our company achieved several recognitions and acknowledgments. Commencing the year, we were recognized as “Established” in Gartner’s Peer Insights Voice of the Customer: Digital Commerce. In the second quarter, IDC’s acknowledged us as a Major Player and we achieved medals in all 24 categories of the 2023 Paradigm B2B Combine, being the exclusive vendor to secure a gold medal for marketplace product capability. In the third quarter, we were named a Visionary in Gartner’s Magic Quadrant for Digital Commerce, and became the only vendor-rated top 5 for all use cases in the 2023 Gartner Critical Capabilities for Digital Commerce Report. In the fourth quarter, we were recognized as a ‘Leader’ in IDC’s Marketscape: Worldwide Midmarket Growth B2B Digital Commerce Applications 2023-2024 Vendor Assessment.
55
In January 2024, VTEX was the exclusive vendor recognized as a Customers’ Choice in the 2024 Gartner® Voice of the Customer for Digital Commerce. According to the report, 98% of VTEX customers expressed their willingness to recommend the ecommerce platform to their peers. Additionally in February 2024, we were recognized as the top leader in the IDC MarketScape:MarketScape Worldwide B2C Digital Commerce Platforms 2020for Midmarket Growth Vendor Assessment study. Rated the highest out of 25 vendors, we stood out for our comprehensive solutions and a “Strong Performer” in the Gartner Peer Insights ‘Voice of the Customer’: Digital Commerce, January 2022 report. We were also recognized as Visionary in the Gartner® Magic Quadrant™ for Digital Commerce, August 2022 report. Additionally, we were named a “Contender” in The Forrester Wave™:strategic focus on B2C Commerce Solutions and VTEX was awarded medals in each one of the 12 categories evaluated in the “Paradigm B2B Combine 2022 Digital Commerce Solutions for B2B, Midmarket edition.”excellence.
We have succeeded in attracting, developing and accelerating the careers of top talent from Latin America and across the globe. Throughout our history, we have carefully developed a high-performance culture that creates the conditions for individual growth and values the diversity of perspectives that challenges the status quo. Beyond attracting, we cultivate new talent through key partnership programs with top universities and world-class educational initiatives on digital commerce. We are proud to positively impact our society through education, nurturing a new generation of global digital citizens.
We guide our customers to success. Enterprises choose us as a strategic partner to accelerate their digital commerce transformation and deliver on revenue-generating initiatives. We deliver our platform through a subscription revenue model that includes both fixed and GMV-based variable components. This revenue model strategically aligns us with our customers: we grow by enabling them to grow. In the years ended December 31, 20222023 and 2021,2022, our customers generated US$12.716.5 billion and US$9.712.7 billion of GMV within our platform. Our GMV grew 30.2% and 31.3% in 2023 and 29.1% in 2022 and 2021 respectively on top of a growth of 95.0%29.1% in 20202021 in U.S. dollars, which represents a growth of 26.8%25.3%, 31.1%26.8% and 134.9%31.1% respectively on an FX neutral basis.
We have achieved a number of significant milestones marking our expansion throughout our history:
56
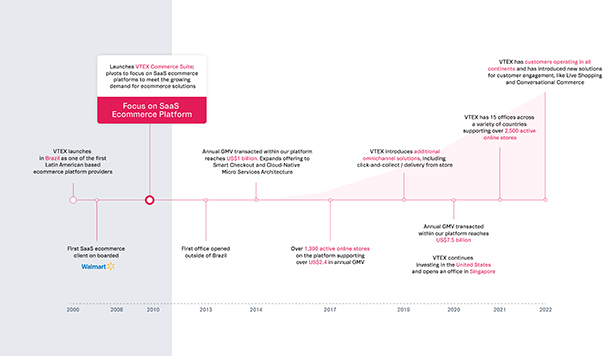

We have a deep history of delivering world-class commerce solutions throughout Brazil and the broader Latin America region. We are expanding our presence internationally and today we serve large blue-chip enterprises. The majority of customers we serve are business-to-consumer, or B2C, enterprises powered through our core VTEX platform and represented 85.7%86.2% and 84.8%85.7% of our revenues for the years ended December 31, 20222023 and December 31, 2021,2022, respectively. We help our customers operate over 3,4003.5 thousand active online stores, defined as unique domains generating GMV, across 3843 countries globally. The number of active online stores we service increased by 6.0%3.8% from December 31, 20212022 to December 31, 2022.2023. As of December 31, 2022, 28.0%2023, 35.1% of the active online stores on our platform generated annual recurring revenue, or ARR (calculated as subscription revenue in the most recent quarter multiplied by four) of US$25 thousand or more, representing 85.0%86.4% of our ARR and with an average ARR per active online store of US$138.2133.6 thousand, demonstrating our enterprise focus.
56
In addition, we also serve small-to-medium sized businesses, or SMBs, on a separate on-demand platform that represented 6.4%6.8% of our revenues in the year ended December 31, 2022.2023. Our extensible and scalable platform also serves a smaller segment of business-to-business enterprises, or B2B. The remaining 8.0%7.0% of revenue in the year ended December 31, 20222023 represented 5.8%5.6% service revenue and 2.2%1.5% other revenues, comprising VTEX platform adjacencies, including payment, logistics and tracking solutions.
Our largest customer represented less than 3.0% of our revenue and our 10 largest customers represented less than 14.0%16.0% of our revenue in the year ended December 31, 2022.2023.
Our go-to-market strategy is focused on acquiring new customers and driving continued use of our platform for existing customers. We primarily focus our selling efforts on large organizations and sell our platform through a direct sales force, which targets technical and business leaders who are leveraging ecommerce to improve their business performance. Our sales organization consists of business development representatives, account executives, and solution engineers. Our new customers in Latin America are well balanced between having VTEX as their first ecommerce platform and those switching to VTEX from other ecommerce solutions. Once our platform has been adopted, we focus on enabling GMV growth for our customers to drive increased transaction-based revenue, as evidenced by our net revenue retention rate.
57
We offer access to our platform on a subscription basis, which accounted for 94.2%94.4% and 94.2% of our revenue for the year ended December 31, 20222023 and December 31, 2021,2022, respectively. Our subscription revenue is based on a fixed subscription fee and a transaction-based fee. The transaction-based fee accounts for most of our subscription revenues and is primarily structured as a take rate or percentage of the total value of the orders processed through our platform, including value added taxes and shipping, which we refer to as our GMV. Our transaction-based fee model aligns our success with our customers’ success and our revenue grows as our customers’ GMV grows. While historically the proportion of revenues from fixed fees and transaction-based fees has remained relatively stable, the revenue from transaction-based fees increased as a percentage of total revenue in 2020 as a result of the significant increase in GMV during the period. We serve customers with multiple tiers of subscription plans and transaction-based fees based on the size of the customer and their expected GMV. Our tiered pricing model allows customers that are generating higher GMV to move up and pay higher fixed fees and lower transaction-based fees, even though transaction-based fees continue to be the most significant portion of our subscription revenue.
In the year ended December 31, 2022,2023, our revenue increased to US$157.6201.5 million from US$125.8157.6 million in the year ended December 31, 20212022 representing an increase of 25.3% and 27.5%27.8% in U.S. dollars, and 22.3% and 29.8%23.7% on an FX neutral basis, respectively. In the same respective periods, we generated net losses of US$52.413.7 million and US$60.552.4 million, net cash provided by operating activities of US$4.3 million and net cash used byin operating activities of US$29.2 million, and US$53.0 million, and negativepositive Free Cash Flow of US$3.8 million and negative US$29.6 million, and US$54.8 million, respectively.
Initial Public Offering
On July 21, 2021, VTEX completed its IPO, offering 21,850,000 of its Class A common shares, of which 16,726,702 new shares were offered by us in a primary offering and other 5,123,298 shares were offered by the selling shareholders.
The initial offering price was US$19.00 per Class A common share, resulting in gross proceeds of US$317.8 million. We received net proceeds of US$296.3 million after deducting US$19.9 million in underwriting discounts and commissions and US$1.6 million of other offering expenses. We also recognized in the profit and loss the amount of US$1.3 million related to shares offered by the selling shareholders and other expenses not directly related to the initial public offering.
The Class A common shares offered and sold in our initial public offering were registered under the Securities Act pursuant to the Company’s Registration Statement on Form F-1 (Registration No. 333-257400), which was declared effective by the Securities and Exchange Commission, or SEC, on July 21, 2021. Our Class A common shares began trading on the NYSE on July 21, 2021, under the symbol “VTEX.”
57
Our RecentPast 3-Years Acquisitions
WebLinc Corp
On January 29, 2021, we acquired 100% of WebLinc Corp, or WorkArea, a U.S. based cloud commerce platform provider, to strengthen our presence in the U.S. and Canadian market.
Suiteshare Tecnologia da Informação Ltda.
On May 28, 2021, we acquired 100% of the capital of Suiteshare Tecnologia da Informação Ltda., or Suiteshare, a company that offers a conversational commerce solution enabling brands to connect with their customers via WhatsApp to perform support and sales.
Guava Desenvolvimento de Software Ltda.
On August 04, 2021, we acquired 100% of the capital of Guava Desenvolvimento de Software Ltda., or Guava. This acquisition was designed to bring Guava’s key employees for the VTEX design and software teams.
58
Our Competitive Strengths
We built our modern platform from the ground up to address the growing needs of enterprises, with the aim of creating simple, yet not simplistic, solutions. We guide our customers to success. Enterprises choose us as a strategic partner to accelerate their digital commerce transformation and deliver on revenue-generating initiatives. Our core strengths are:
Market leadership in Latin America. We are the largest provider of digital commerce technology in Latin America. Our market leadership is driven by the strength and functionality of our platform and our expertise in delivering solutions that accommodate differences across regions, tax jurisdictions, and specific local consumer preferences. We are leveraging our regional expertise to enable our customers to reach global markets.
Highly embedded, deep relationships with enterprises. We have a large, blue-chip customer base across a broad range of end markets, with over 2,6002.6 thousand customers across 3843 countries. 85.0%86.4% of our ARR is derived from enterprise customers with active online stores, each generating more than US$25 thousand in ARR and with an average ARR per active online store of US$138.2133.6 thousand as of December 31, 2022.2023. Additionally, 84.2%88.9% of our enterprise revenues came from customers who have been on the VTEX platform for over one year, for the year ended December 31, 2022.2023.
| • | Strong alignment with our customers’ success. We deliver our platform through a subscription revenue model that includes both fixed and GMV-based variable components. This revenue model strategically aligns us with our customers: we grow as they grow. |
Collaborative Commerce provides deep network effects from a powerful ecosystem of partners. We help unlock new revenue streams for our customers through collaborative opportunities with their suppliers and partners, as well as a rich ecosystem of hundreds of integrated solutions, SIs, and payments solutions. Our partners’ solutions are embedded within our platform, allowing our customers to seamlessly execute their commerce vision and strategy, and build valuable networks and effective marketplaces. It also lowers our customer acquisition costs through organic lead generation.
| • | Composable Commerce enables rapid adaptability in a digital world and faster time to market. We provide our customers with a platform that is flexible, fast and easy to scale. We have a low-code development platform with fully extensible API-first business capabilities. Our customers operate on a single, global, continuously deployed, multi-tenant architecture that ensures that they are always using the latest technology. |
High-performance culture based on commitment to innovation and execution. A strong passion for success motivates our team, and we embrace cooperation and collaboration to achieve our business goals. Our high-performance culture is driven by a commitment to listening, learning and diversity of perspectives that challenges the status quo.
58
Our Growth Strategies
We have strong market leadership in Latin America, and expect to continue scaling with enterprise customers in high-growth markets across the broader Latin America region and across the world. Building on our distinctive heritage, we expect to continue our growth on multiple dimensions. Our growth strategy is driven by our mission to accelerate commerce transformation. Key elements of our strategy include:
| • | Grow our customer base. We believe that we have a significant opportunity to increase the size of our current customer base. We intend to continue to strategically invest in sales and marketing programs that enhance our customer reach as well as increase the awareness of our brand. We believe it is important to establish strong relationships with new customers. |
59
| • | Grow GMV within the existing customer base. Our goals are closely aligned with the goals of our customers. Our subscription revenue model includes both fixed and GMV-based variable components such that the more revenue our customers generate using our platform, the more revenue we generate. We grow with our existing customers in two primary ways: (1) we help our customers grow their GMV from existing online stores; and (2) we enable our customers to expand across regions or across brands by opening additional online stores. |
| • | Continuous innovation and expansion. We have invested and intend to continue to invest in our platform, including broadening our capabilities to meet the future needs of enterprises and their brands. Our ability to incorporate innovations that improve our platform is critical to ensure that the enterprises we support have the necessary capabilities to adapt to the influx of disruptive technologies impacting commerce. We help our customers incorporate cutting edge technologies and capabilities that emerge from our partners and the broader commerce ecosystem and therefore, meet the evolving needs of consumers. |
| • | Geographic expansion: We support the growth of our customers around the world by delivering a world-class platform and by expanding our regional capabilities including sales and marketing, development and operations. Given our strong brand awareness and market position, we have historically focused geographic expansion to other regions within Latin America and believe that most of our growth will continue to come from Latin America. Over time, we believe our platform can compete successfully around the world, and, as such, we plan to continue investing in our operations across the United States and Europe. |
| • | Continue to grow and develop our ecosystem. We have a thriving third-party ecosystem, including providers for shipping, marketplaces, point-of-sale, omnichannel, marketing automation, search, merchandising, SIs, agencies, payments, anti-fraud and lending. We have built a strong network ecosystem with over |
Industry Overview
Ecommerce has evolved to meet the needs of the modern day customer. Early solutions had limited functionality to receive orders and fulfill deliveries. Today’s scalable platforms enable bespoke frameworks for customization and are often supported by a deep ecosystem of third-party functionality. Additionally, brands are seeing the importance of a direct-to-consumer channel that helps them control the consumer relationship and brand messaging. The impact of the COVID-19 pandemic accelerated the adoption of ecommerce, shifting significant shopping behavior from offline to online, forcing retailers to ramp up investment in ecommerce, embracing a digital-first approach. Consumers now expect brands to make the shopping experience as convenient and seamless as possible across product discovery, purchasing and fulfillment. As such, retailers require enablement platforms with the scalability and flexibility to serve their consumer.
59
Rapidly changing consumer preferences driving need for retailers to innovate
How consumers discover, learn about and ultimately purchase products is evolving due to digital transformation and advances in technology. A consumer may discover a product on social media, read reviews and blogs using a tablet, visit a nearby brick-and-mortar store to see the product in person, compare prices using a mobile phone and end up purchasing the product from yet a different merchant or through an online marketplace. The internet has enabled consumers to interact with merchants around the globe to find and purchase products that fit their specific needs and tastes. According to Insider Intelligence, in 2022, 19.7%2023, 19.5% of all retail spend was made through a digital channel.
60
Enterprises must address the breadth of consumer interaction points and potential sales channels, ensuring a satisfying consumer experience from discovery through delivery. The consumer expects a seamless experience, convenient and simple, yet not simplistic. Without an effective digital presence, retailers are often overlooked by consumers, lag behind competitors and have difficulty generating growth. Retailers of all sizes are required to invest in digital transformation to build out and test new business models and strategies. Robust omnichannel solutions are now standard for an effective digital transformation strategy. However, significant ongoing innovation across marketing, inventory, payments and delivery are required to ensure enterprises are empowered to meaningfully connect with consumers and deliver seamless brand experiences across the entire shopping lifecycle.
Convenience-driven economy requires deep changes to complex, legacy supply chain networks
Consumers seek frictionless online experiences and the convenience and speed provided by on-demand delivery. Growing expectations for shorter on-demand delivery times require significant planning, coordination and execution to ensure supply chain networks are aligned to meet distribution and fulfillment. According to The demand forBusiness Research Company’s report “Same-day Delivery Services Global Market Report 2024” the global same-day delivery is increasing, accordingservices market grew from $6.44 billion in 2022 to Statista’s report “Global same-day delivery market size forecast 2021-2027.” The market is expected$7.93 billion in 2023, implying a CAGR of 23.1%. Projections indicate further growth to reach US$12.3$15.8 billion by 2023 and double2027, with a CAGR of 18.8%. This demonstrated that by 2027. Same-daysame-day delivery is becoming increasingly popular among online shoppers and is known to improve customer satisfaction, efficiency, and trust, while also reducing shipping and vehicle expenses. The intense competition in retail, both online and in-store, is causing businesses to meet the needs of consumers by offering on-demand delivery to their homes or workplaces.
The technical requirements for fulfillment are complex and involve the synchronization of back-end systems, including those related to customer information, inventory, orders, products, payments and other data that originate in different sales channels. Brands and retailers have historically operated in silos based mostly on direct buy and sell transactions, and did not have the tools to collaborate in real-time around complex value chains. Additionally, many brands and retailers have supply chains with existing networks of in-store and warehouse distribution facilities, adding another level of complexity to optimize operational efficiency. As brands and retailers navigate these deep challenges, digital collaboration has emerged as a potential path for brands, retailers, suppliers and third-party providers to stay in constant contact with consumers to ensure frictionless distribution and fulfillment.
The need to deliver an authentic brand experience requires platforms that enable retailers to customize, build and scale businesses
Increasingly, consumers seek personalized experiences with brands, not just a point of sale for purchase. This has created a need for retailers to focus on design, simplicity and experience. Ecommerce has driven the proliferation of more personalized, direct-to-consumer brands. Vertically-integrated digitally native brands, or DNBs, sell products directly to consumers online, frequently bypassing third-party distribution and retailers, and often obviating the need for their own brick-and-mortar stores.
The growth in DNBs has corresponded with demand for turnkey ecommerce platforms that support both rapid product launch and scaling. Brands now have greater control over the narrative and image they convey to their customers. The proliferation of DNBs is driving the need for existing manufacturing brands to innovate in order to effectively compete. Strong manufacturing brands are generally ill-equipped to go direct-to-consumer. However, through collaboration and effective partnerships across areas including payments, shipping, marketplace and POS, these retailers can remain competitive in delivering authentic brand experiences.
60
Legacy software solutions are inadequate to serve the needs of 21st century brands and retailers
Legacy approaches to ecommerce software, consisting of open sourced licensed, owned, and/or managed technology behind their ecommerce sites, are still prevalent in enterprises. We believe that while the market for digital commerce software solutions may be large and growing, the legacy solutions for enterprises do not effectively address the needs of digitizing brands, manufacturers and retailers in a fast-paced, evolving and competitive environment. Legacy solutions are largely characterized as:
| • | On-premise. Legacy on-premise solutions lack the flexibility and adaptability of SaaS solutions. These solutions are challenging, time intensive and expensive to update. Businesses of all sizes often lack the time and resources required to upgrade, patch, and modernize their legacy software to address consumer and technology trends. |
61
| • | Lengthy deployment cycle. Traditional enterprise solutions typically have long and costly deployment cycles. In addition, legacy solutions tend to become overly complex and are not nimble enough to adapt to evolving market trends, new software requirements and emerging technologies. |
| • | Static. Enterprises test strategies and evolve rapidly as they transform digitally and discover new ways to engage and convert customers. Even the most basic ecommerce sites require a wide range of integrated third-party applications, including payments, anti-fraud, and shipping. More sophisticated enterprises will often incorporate dozens of integrated third-party applications. Legacy solutions lack the flexibility to adapt to these requirements. |
| • | Disparate point solutions. Brands and retailers need integrated, seamless solutions that leverage data across multiple sources to optimize operational efficiencies. Legacy vendors typically provide point solutions that often fail to provide multi-channel sales capabilities. As enterprises scale and require greater functionality, they are forced to stitch together multiple products, creating a complex patchwork of disparate technologies, which can often be cumbersome, time-consuming and result in disjointed consumer experiences. |
| • | Security vulnerabilities: Security threats have become more sophisticated and continue to evolve such that enterprises continually face new and emerging security threats. Legacy solutions were not designed to handle these evolving threats. The approaches used by hackers are ever more clever and intelligent. Legacy software solutions are more vulnerable as their security protocols were not designed to handle the security threats of today. As a result, upgrading the protections in legacy software is challenging. |
Our Market Opportunity
Market opportunity in Latin America
Latin America is one of the largest and most diverse regions in the world. It is also among the largest growing economies in the world, with an estimated GDP growth rate of 18.6%6.6% to US$6.57.9 trillion by 2026,2027, according to Fitch,Statista, driven by technological advances and an emerging middle class. Comprised of over 20 countries with a total population of over 616665 million, the region encompasses multiple languages, currencies and regulatory regimes. The size and complexity of the region present us with a significant opportunity as the geographic incumbent leader and a competitive advantage relative to solution providers that are less familiar with the intricacies of the region.
Latin America ecommerce is growing rapidly, yet still represents a small fraction of the total retail market. According to Insider Intelligence, ecommerce in Latin America grew to US$167.0144.7 billion in 2022,2023, a growth rate of 18.8%14.3% over 2021,2022, making it one of the fastest-growing region among all major world regions. At the same time, it represents only approximately 12.4%10.1% of all total retail sales in Latin America, a lag of 45 years compared to current global ecommerce penetration of 19.7%19.5%, presenting an enormous opportunity and runway for growth as more sales shift online. This shift in online sales reflects expected growth in digital audiences from an expanding middle class and ongoing innovations in ecommerce payments systems and logistics in the region. Insider Intelligence estimates the Latin America ecommerce market will grow to US$257.3226.5 billion by 2026.2027.
6261
20222023 ecommerce growth year-over-year per region
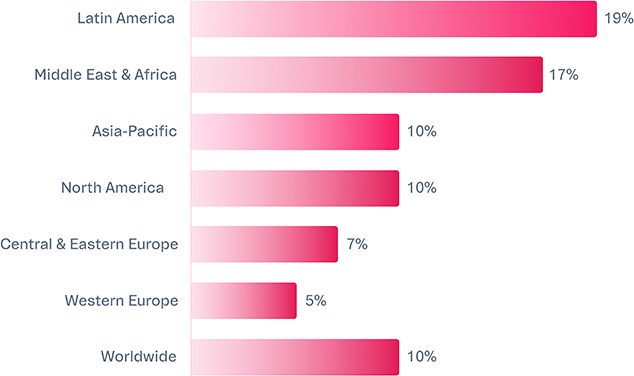

Source: Insider Intelligence
Market opportunity globally
The global ecommerce market has experienced rapid growth, driven by an acceleration of online penetration over the past 15 years. The impact of the COVID-19 pandemic further accelerated the adoption of ecommerce, which drove broader business growth while brick-and-mortar stores were closed and consumers increased their ecommerce spending due to extensive stay at home orders.
6362
Projected global ecommerce growth
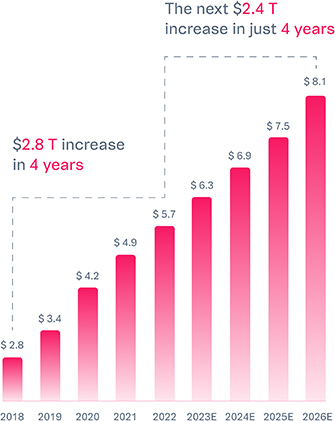

Source: Insider Intelligence
Global GMV was estimated to be approximately US$5.75.8 trillion in 2022,2023, and is expected to grow to approximately US$8.18.0 trillion by 2026,2027, according to Insider Intelligence. In the years ended December 31, 20222023 and 2021,2022, our platform processed US$12.716.5 billion, and US$9.712.7 billion. As we continue to expand our platform offerings as well as our global reach, we expect to capture more of this GMV. We believe that our market will expand as consumers continue to shift purchases to online channels and brands and retailers adapt to evolving consumer preferences.
Our Solution
VTEX providesoffers a SaaS digital commerce platform tailored for enterprise brands and retailers. Our platform enables ouris designed to be composable and complete, enabling customers to execute their commerce strategy, including building online stores,seamlessly implement, optimize, test, and expand both B2C and B2B digital experiences. By integrating and managing orders across channels, and creating marketplaces to sell products from third-party vendors. Our platform fully integrates commerce, marketplace, and OMS solutions that enable ourinto a unified platform, we empower customers to manage product catalogs, optimize inventory, process ordersharness omnichannel capabilities and payments,devise innovative strategies for customer engagement. The platform’s flexibility and build even stronger brands that connect with their customers.low-maintenance design aid customers in optimizing IT investments while ensuring agility, ultimately fostering profit growth. We provide our customers withdeliver an innovative platform that:
| • | Drives comprehensive digital transformation. We provide a robust omnichannel commerce platform that can optimize existing in-store and distribution networks, integrate and manage multiple sales channels and seamlessly connect multiple fulfillment points. Through our platform, we help our customers build out and test new business models and strategies and incorporate physical and online points of sale in personalized ways. We deliver our solution through a Composable Commerce architecture that comprises a low-code development platform with a customizable and flexible back-end, decoupled storefront and pre-built integrations. Our fully extensible, API-first business capabilities enable customers to rapidly deploy commerce solutions and provide flexibility to build and customize the entire commerce experience at scale. |
64
| • | Collaborates with suppliers and partners. We provide a commerce platform that embraces digital collaboration to fuel growth, power innovation and build relationships online. Our solutions enable our customers to digitally collaborate with suppliers and partners, to expand product assortment, test new products, explore new markets and attract new customers by coordinating with third-party suppliers and drop-ship partners for inventory and fulfillment. |
63
| • | Strengthens the relationship between brands and their consumers. Our platform enables brands to offer compelling and consistent digital experiences across multiple channels and deliver their full brand experience directly to consumers. Our platform also offers the opportunity for manufacturers to build their own direct to consumer commerce capabilities to leverage the trust inspired by their products and reduce reliance on retailers for sales. |
| • | Provides a centralized technology hub. We provide a single point of control platform that integrates data across operations and through our distributed OMS solution, we provide a 360-degree view of inventory and orders. Our platform enables our customers to manage their ecommerce operations with a seamless, easy-to-use interface to provide a holistic view of our customers’ business operations across CMS, pricing and promotions management and distributed OMS. Data generated by a direct digital commerce channel can be leveraged to increase sales, add new customers and maintain tighter control of a customer’s brand portfolio. |
| • | Provides security, scalability, and reliability. Our pricing model, cloud infrastructure and built-in developer tooling helps ensure the VTEX platform is prepared to support our customers’ growth. The power of the VTEX platform comes from an auto-scaling, elastic cloud infrastructure that helps brands and retailers respond to market changes and customer demands in real-time. The platform is designed to be highly isolated and secure. We use firewalls, denial of service mitigation appliances, encryption, intrusion detection systems, two-factor authentication and other technology in an effort to keep our platform and customers’ data secure. |
The VTEX Platform
We built oura modern, cloud-native, complete and composable platform based on open, multi-tenant architecture to address the growing challenges facing enterprises and with the aim of making previously complex tasks simple. The VTEX platform has been engineered to enterprise-level standards, functionality and support. The key capabilities of our single control panel platform are illustrated and summarized below.
65


| (1) |
|
64
| • | Web: VTEX customers can leverage our website store framework to quickly and efficiently launch and evolve web stores tailor-made for their business. We continually evolve our store framework to ensure that it delivers a superior web experience and performance for consumers. We offer more than |
| • | Mobile: Our customers can leverage store framework mobile-first components to create progressive web apps with the same look and feel as their web store. Customers can also build more sophisticated native apps by using our APIs and commerce micro-services together with their preferred mobile native or hybrid development framework. |
| • | Brick-and-mortar stores/field sales: Our VTEX |
|
| • | Marketplace: We build technology that powers enterprise customers to launch their own marketplaces as well as to sell on third-party marketplace sites with ease. We offer a single platform for commerce that can launch an ecommerce marketplace by easily onboarding new sellers and automatically synchronizing products and inventory across both suppliers and brand partners. |
| • | Live Shopping: |
66
| • | Conversational Commerce: |
| • | Social Commerce: |
Extension hub: Retailers have the opportunity to broaden their range of offerings by incorporating partner-developed solutions through VTEX IO. This integrated system allows retailers to seamlessly discover, configure, and acquire partner solutions without navigating away from the VTEX Admin interface. Moreover, the consolidated payment system enables retailers to include these solutions in their VTEX invoices. This initiative empowers retailers to manage integrations in a scalable and secure manner, aligning with VTEX’s overarching vision of constructing a dynamic and interconnected ecosystem. This advancement signifies a significant stride toward realizing VTEX’s mission of creating a vibrant and interconnected platform.
65
| • | Headless possibilities: From product catalog and CMS to checkout, VTEX offers a complete, well-documented, easy-to-use catalog of APIs with hundreds of endpoints to integrate any IoT and innovative new sales channels. |
| (2) |
|
| • | Content management |
| • | Product catalog: Customers can upload thousands of SKUs and maintain data quality seamlessly. They can create and manage categories, brands, collections and extend product attributes with custom fields. |
| • | Pricing: Customers have flexibility in setting price rules based on distribution and marketing strategies. Multiple price tables can be created and used to achieve discriminating pricing in multiple business contexts. |
| • | Promotion: The VTEX platform offers a comprehensive module to manage multiple promotion use-cases for retail and CPG companies, such as “buy together bundles,” “more for less,” “progressive discounts” and “buy one get one free.” The module also allows our customers to create audiences, coupons, and gift cards. |
| • | Site editor: |
| • | Distributed order management |
| • | Orchestrating sellers: Customers can invite, onboard and manage new sellers with our third-party sellers and marketplaces modules. Product catalogs can be shared with sellers and sellers can send and link their offers to the customer. |
| • | Managing inventory: Customers can manage and have an integrated view of inventory across fulfillment points, including distribution centers, traditional brick-and-mortar stores and dark stores. Customers can also allocate specific inventory to sell on a specific external marketplace. |
67
| • | Shipping strategies: The VTEX platform offers flexibility to develop tailor-made shipping strategies. Our platform allows our customers to set up multiple docks and warehouses where inventory is allocated as needed. In addition, we create and link shipping policies with selected carriers to serve these fulfillment nodes. |
| • | Customer relationship management |
| • | Customer management: Our solution registers consumer information and allows our customers to include new attributes they believe are relevant for their relationship with consumers. Our customers can also track customer orders and their purchase history and manage relationships and conversations with customers in a simple GUI. |
66
| • | Behavioral emails: The VTEX platform offers behavioral emails according to important shopping triggers, including order placement and cart abandonment. |
| • | Ecosystem of apps |
We have business partners located in more than 1520 countries that design and customize storefronts, develop apps and enable third-party integration for customers on the VTEX platform. Our partners span the following key areas: Payment, Shipping; Fraud & Lending; Marketplace; POS & Omnichannel; Search & Merchandising; and Marketing Automation.
| (3) |
|
| • | First party fulfillment: The VTEX platform allows retailers to natively configure shipping policies and carriers to perform fulfillment and integrate with multiple warehouses and loading docks where inventory can be allocated. This modularity allows for highly personalized logistics and fulfillment setups and possibilities critical to enterprise retailers. |
| • | Ship from store: The VTEX platform allows retailers to connect multiple stores to their digital commerce network, share or empower stores to run their catalog and set their own inventory and configure fulfillment nodes for last-mile carrier pick-up orders from stores, in order to deliver to consumers at their shipping addresses. |
| • | Pick-up in-store: The VTEX Platform allows retailers to connect their brick-and-mortar stores network to their digital commerce platform and offer pick-up solutions integrated to our OMS to run frictionless operations. |
| • | Third-party seller/drop-shipping: The VTEX platform offers a simple seller portal with a smooth seller onboarding process to connect multiple, third-party sellers with our retail customers’ digital commerce platform. These sellers can leverage the retailer’s catalog, configure inventory and shipping policies. |
| • | Fulfillment integration protocols: Through our APIs, we offer a fulfillment integration protocol to connect any innovative fulfillment channels a customer may have. As an example, we used these protocols to integrate with Amazon’s Multichannel Fulfillment, or “MCF,” to customers. |
| • | Fulfillment partners: We also offer multiple fulfillment business partners, leaders in the regions we operate, that are integrated into the VTEX platform so our enterprise customers have the optionality to leverage them when it makes sense for their business needs. |
68
Customer experience/support
We provide 24/7 support options to our enterprise customers. We offer three types of support plans: standard support is included on all subscriptions; express routing for mid-tiered enterprise customers, and priority support for the highest-tiered enterprise customers. Our support team achieved a strong average customer satisfaction score of 98.0%97.6% for the year ended December 31, 2022.2023.
We also offer our customers three types of technical support: basic problem solving and solutions involving platform functionality; advanced solutions involving platform functionality, third-party applications or API integrations; and product support engineering for complex API or third-party integrations, developer inquiries and bug identification and triage.
67
Professional services
VTEX offers paid professional services that complement the capabilities of our customers and their implementation partners. Our services help speed customers’ time-to-market and improve the success and growth of their businesses. Optional services include project management, solutions architecting, and implementation consulting. We usually offer these services to our largest and most complex new enterprise customers. Regular enterprise customers generally rely on our ecosystem of partners across system integrators, agencies and implementation companies to implement our platform. Our professional service fees, charged mostly to help selected customers on the implementation of our platform, accounted for 5.8%5.6%, 5.8% and 5.4%5.8% of our total revenue for the years ended December 31, 2023, 2022 and 2021, and 2020, respectively.
Our Customers
Our cloud-based platform accelerates the digital transformation of global enterprises powering over 3,400 other3.5 thousand active online stores in 3843 countries. We have a large, blue-chip customer base with over 2,6002.6 thousand customers. For the year ended December 31, 2022,2023, approximately 85.0%86.4% of our ARR was derived from active online stores on our platform that generated ARR of US$25.0 thousand or more and with an average ARR per active online store of US$138.2133.6 thousand. Our platform is extensible across a wide range of end markets, including Home Appliances, Apparel & Accessories, Beauty & Health, Electronics, Grocery, Department Stores, Toys & Hobbies, and Home, Furniture & Decoration.
69
20222023 revenue by vertical
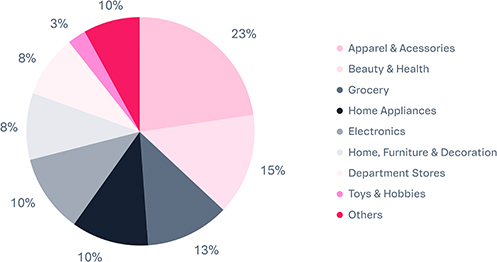
Our Ecosystem of Technology Partners and Applications Driving Positive Network Effects
We have built a strong network ecosystem with over 3,000 integrated solutions,6,000 VTEX IO extensions created by third parties, 1,000 SIs 300and ISVs, 330 marketplaces, 150180 payments solutions and 90 logistics companies. While our core platform is homogenous, we have developed it with low-code, serverless capabilities and fully extensible API-first capabilities, allowing enterprise customers to push code into our core platform and customize to their needs as well as allowing ecosystem partners to develop applications that run directly on our platform. This ecosystem includes app developers, theme designers, SIs, agencies, payment providers, marketplaces and other partners who are deeply embedded within our platform. We have business partners located in more than 1520 countries that design and customize storefronts, develop apps and enable third-party integration for customers on the VTEX platform. Our partners span the following key areas:
68
Payment;
Shipping;
Fraud & lending;
Marketplace;
POS & omnichannel;
Search & Merchandising; and
Marketing automation.
Sales and Marketing
The VTEX sales team partners with companies globally to plan and implement transformative digital projects with VTEX’s solutions and products. Our sales team is structured across three key areas: business development representatives who discover and build target pipelines, account executives who engage with potential customers, and solution engineers who provide technical expertise and advice. As of December 31, 2022,2023, we had a team of 377344 sales and marketing professionals, being 47.5%50.0% in Brazil, 31.3%31.7% in Latin America, excluding Brazil, and 21.2%18.3% outside of Latin America.
70
We generate leads through three main channels: referrals and leads from existing customers and ecosystem partners; VTEX publications and events; and paid digital marketing campaigns. Our partner ecosystem generates significant new customer leads given the depth of our network. Our sales team focuses on top tier target customers. Our new customers in Latin America are well balanced between those who are choosing VTEX as their first ecommerce platform and those that had existing ecommerce solutions before switching to ours. Our strategy with the latter group of customers is to highlight and resolve pain points with their existing platforms. VTEX’s entry into new markets is driven by our assessment of the region’s addressable market and our ability to win new flagship accounts. We will often expand into new geographies at the request of existing multinational customers that have operations in regions where VTEX does not currently operate. We have been successful at leveraging these deep relationships historically.
Technology, Infrastructure and Operations
The VTEX platform is a multi-tenant SaaS, cloud-based system engineered for high security, scalability, reliability and performance. It is hosted on cloud-based servers and infrastructure. Maintaining the integrity and security of our technology infrastructure is critical to our business, and we plan to invest further in failovers, active monitoring, and computing, storage and network infrastructure to meet our customers’ needs and maintain their trust. The key attributes of the VTEX platform are as follows:
| • | Security: The platform is designed to have isolated sensitive data. We use firewalls, denial of service mitigation appliances, encryption, intrusion detection systems, two-factor authentication and other technology in an effort to keep our platform and customers’ data secure. |
| • | Scalability: Our cloud-based platform is highly flexible and scalable. It can adjust processing capacity, storage, and other attributes, up or down depending on customers’ needs and requirements. |
| • | Reliability: Our platform includes servers in geographically dispersed, co-located data centers that are fault-tolerant in an effort to ensure that our platform is highly reliable. We employ a highly redundant, horizontally scalable, shared architecture to promote resiliency and high availability. Our platform is built to handle large spikes in traffic that accompany events such as new product releases, holiday shopping seasons and flash sales. Being cloud-native and tightly integrated with Amazon Web Services allows us to leverage Amazon’s global network to enhance performance and reliability. We scale our platform on demand to ensure ample capacity is available for our customers. |
69
While our core platform is homogenous, allowing us to have a true multi-tenant SaaS business model and provide quick go-live to enterprise customers, we have developed it with low-code serverless capabilities and fully extensible API-first capabilities, allowing enterprise customers to push code into our core platform and customize for their needs as well as allowing ecosystem partners to develop applications that run directly on our platform. Our platform, VTEX IO, provides accelerator front-end components tightly integrated with our headless services, low-code development, composable back-end, and auto scalable cloud infrastructure. We typically integrate with our customers’ code and applications within six months.
71
The design of the VTEX ecommerce platform
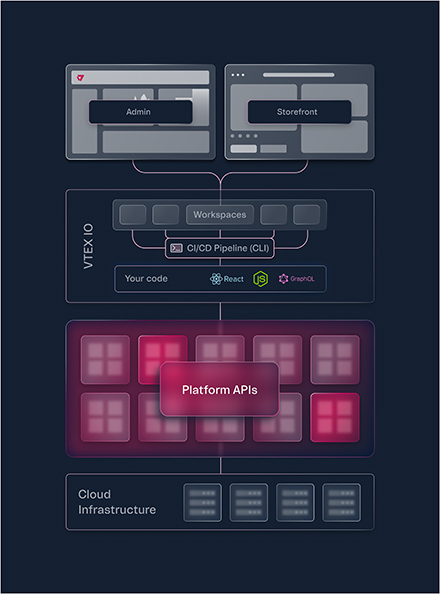

Based on our Composable Commerce approach, we offer a mix of computing and usability paradigms for customers to build on top of VTEX:
| • | VTEX Core Capabilities RESTful APIs: All our core commerce capabilities are exposed through well-documented APIs. Our catalog of APIs offers hundreds of interfaces for enterprise customers to customize based on their specific business needs and complex enterprise architectures. |
| • | VTEX Admin: Our VTEX Admin offers GUI so business users can easily manage all digital commerce core functions. VTEX admin offers modules for operators such as OMS GUI for call center operators or catalog operators to manage their product catalogs; for creators, such as our site-editors for marketing creators, building distinctive customer journeys; and for business and management to track business metrics and growth. |
| • | VTEX IO: VTEX IO offers a low-code serverless environment for our customers’ technology teams to extend our core components and build new components in an integrated environment with best-in-class scalability and security. All VTEX storefronts and VTEX Admin can be customized and extended through VTEX IO. |
7270
| • | VTEX Data Services: VTEX data services offer an environment to extend and evolve our platform data modeling in a scalable and secure environment. Our data entities, such as customers and orders, can be extended and have new attributes added, and new entities can be created. These new entities can also be accessed by APIs and allow conceptual extensibility to serve edge cases and new industries, particularly where new and distinct data entities are needed. |
Our infrastructure is supported by a research and development team consisting of architects, software engineers and designers. As of December 31, 20222023 we had 438417 employees in our research and developmentR&D organization. Over the last year we have spent US$57.260.1 million in R&D to scale this organization. We intend to continue to invest in our research and development capabilities to extend our platform.
International Presence
We currently power over 3,4003.5 thousand active online stores in 3843 countries. Our platform enables businesses to create online stores in the consumer-facing language and currency of their choice. For the administrative control panel used by our customers to create and manage their stores, we currently allow our customers to select among a range of languages, including English, Portuguese, Spanish, Italian, Romanian and Japanese. We plan to add additional languages as we continue to expand internationally.
VTEX was founded in Rio de Janeiro. In Brazil, we have operations in Rio de Janeiro, Curitiba, João Pessoa, São Paulo, Porto Alegre, Recife, Rio de Janeiro, São Paulo, and Teresópolis. As of December 31, 2022,2023, approximately 71.2%73.1% of our employees are located in Brazil, primarily in our R&D department. In Latin America, excluding Brazil, we have operations in Bogotá, Buenos Aires, Lima, Medellín, Santiago andMedelin, Mexico City, and Santiago, where approximately 16.2%16.1% of our employees are located. Outside of Latin America, we have operations in Barcelona, Bucharest, Lisbon, London, Milan, Paris, Singapore, andMumbai, New York, Paris, Sidney, and Singapore, where approximately 12.5%10.8% of our employees are located. Outside of Brazil, most of our employees are part of our sales & marketing and customer experience departments.
For the years ended December 31, 2023, 2022 2021 and 2020,2021, purchases originated from customers located in: (1) Brazil represented 54.6%54.3%, 52.8%54.6% and 57.2%52.8% of our total revenue, respectively; (2) Latin America (excluding Brazil) represented 35.4%34.9%, 38.2%35.4% and 37.0%38.2% of our total revenue, respectively; and (3) the rest of world represented 10.0%10.8%, 9.0%10.0% and 5.8%9.0% of our total revenue, respectively. Given our brand awareness and market position, we have historically focused geographic expansion to other regions within Latin America and believe that most of our growth will continue to come from Latin America. We believe our platform can compete successfully around the world over time. As such, we plan to continue investing in our operations across the United States and Europe, although only limited growth may result from this region in the short to medium term.
Culture and Values
A powerful network of conversations that move action forward
VTEX is built on a foundation of mutual trust. We discovered very soon that great people thrive in an environment where alignment enables autonomy. We trust these individuals to act in the best interests of the Company because we provide them with the conditions for their accelerated self-development as independent decision makers. We are able to make consistent decentralized decisions thanks to our extraordinary commitment to a shared bold future.
We are eager to have difficult conversations. We actively communicate when promises made cannot be kept, dealing with the consequences and inviting impacted people to the playing field to face the brutal facts. We are not complainers; we are proposal makers and we are doers. We listen to each other with commitment, open to the possibility that a diverse perspective might lead us beyond what is predictable. It is everyone’s responsibility to create this environment.
73
We aim to build the VTEX that kills VTEX
We think differently about the same problems in order to achieve transformative solutions. The same mindset applies to our culture: we continue to learn and to expand our capacity to comprehend and impact the world.
71
We are fascinated by the amount of impact that applying technology to business can have. For us, customers are bearers of exciting opportunities: we make ourselves responsible for their growth and success.
Diversity is key to this continued success: we choose to be able to add value in a diverse ecosystem and adapt to other cultures rather than imposing our views. With the help from the different perspectives we get from our peers, partners and customers, we are continuously invited to see beyond our biases. Collaborating with people that challenge the status quo—instead of fitting into it—is paramount for our continued success. We are rebels at heart.
Our Competition
Our primary competitors are SAP Hybris, Oracle Commerce, Magento (an Adobe company), Salesforce Commerce Cloud (formerly known as Demandware) and Shopify Plus. Our industry is highly competitive, yet enterprises are forced to choose between two paths to execute their commerce strategies:
| • | Easy to use yet rigid software: software designed for smaller and medium businesses are typically restricted to limited use cases. The need for customization is absorbed by integration marketplaces with a wide range of partners, yet with varying standards of quality. Users face a difficult choice: remain simple or combine capabilities from multiple vendors with the risk of disrupted experiences and lack of scalability. We believe we compete favorably based on the following competitive factors: |
Ability to manage all experiences in one place through a single control panel connecting all sales and fulfillment channels;
Ability to explore new strategies such as marketplace and omnichannel through a set of comprehensive functionalities;
| • | Ability to scale through pre-built integrations and an auto-scalable cloud infrastructure. |
| • | Heavy customization which leads to slower evolution: on-premise and open-source platforms require a higher initial investment and time-consuming customization and integration periods, which leads to higher developer dependency and increasing total cost of ownership. Once implemented, re-platforming is complex, yet unavoidable as consumers’ demands increase over time. We believe we compete favorably based on the following factors: |
| • | Ability to quickly implement new strategies through a set of comprehensive functionalities (commerce, order management and marketplace) and pre-built integrations with channels and partner solutions; |
| • | Ability to custom-build capabilities and extend the platform through an open, API-first architecture and a proprietary low-code development platform, the VTEX IO; |
Ability to continuously evolve through a multi-tenant, homogeneous platform;
| • | Ability to enter highly complex markets through a platform with proven product-fit in Latin America. |
While we believe we currently compare favorably to our competitors, we expect competition to increase in the future. We face intense competition, especially from well-established companies offering solutions and related applications. We may lack sufficient financial or other resources to maintain or improve our competitive position, which may harm our ability to add new customers, retain existing customers, and grow our business.”
We believe we offer a unique combination for our customers. Our platform delivers fast time-to-market and ease of use, while providing customization and extensibility for each of our customers.
7472
Intellectual Property
Our intellectual property and proprietary rights are important to our business. In our efforts to safeguard them, we rely on a combination of copyrights, trade secrets, trademarks and other proprietary rights in several jurisdictions in which we conduct our business, including Brazil, the United States, Latin America, India, the United Kingdom and certain European countries. We also control access to our intellectual property and confidential information through internal and external controls. We rely on confidentiality and/or license agreements with employees, contractors, customers, vendors, distributors and other third parties, which limit access to and use of our proprietary intellectual property. We also require our employees and independent contractors to enter agreements assigning to us any inventions, trade secrets, works of authorship and other technology and intellectual property created for us. Though we rely, in part, upon these legal and contractual protections, we believe that factors such as the skills and ingenuity of our employees, as well as the functionality and frequent enhancements to our platform, make our intellectual property difficult to replicate.
As of December 31, 2022,2023, we have been issued trademark registrations in Brazil covering trademarks including “VTEX”, “VTEX Day”, “TETRIX”, “Bora Vender”, “#BoraVender”, “Go Commerce”, “Bora Varejo”, “Bora Doar”, “Smartcheckout”, “True Cloud Commerce”, “Ciashop”, “Integrando-se”, “Loja Integrada”, “Xtech Commerce”, “Commerce Society”, “Time to Revenue”, “Indeva” and “Hiring Coders”. We have also been issued trademark registrations in the United States of America covering trademarks including “VTEX”, “Smart QR”, “Work Area” and “Workarea”. We have also been issued trademark registrations in Mexico, Argentina, Colombia, Chile, India, Peru, United Kingdom and Europe covering certain of our trademarks and have additional trademarks applications pending in several of these jurisdictions.
Regulatory Considerations
Data protection and privacy
The customer data that our platform uses, collects, stores, transmits and processes to run our business is an integral part of our business model. As a result, our compliance with federal, state and foreign laws and regulations dealing with the use, collection, storage, transmission, disclosure, disposal and other processing of personal data is core to the operation of our business. Regulators around the world have adopted or proposed requirements regarding the collection, use, transfer, security, storage, destruction, and other processing of personal data. The applicability of these laws and regulations to us, and their scope and interpretation, are constantly evolving, often uncertain, and may conflict between jurisdictions, and we anticipate the number of data privacy laws and the scope of individual data privacy and protection rights will increase, and as a result, the associated compliance burdens and costs could increase in the future. It may be costly to implement security or other measures designed to comply with these laws and regulations, as well as any new or updated laws or regulations. Any actual or perceived failure to safeguard data adequately, destroy data securely, or otherwise comply with the requirements of these laws and regulations, may subject us to litigation, regulatory investigations or enforcement actions under federal, state or foreign data security, unfair practices or consumer protection laws and contractual penalties, and result in monetary damages, damage to our reputation or adversely affect our ability to retain customers or attract new customers.
A number of the jurisdictions in which we operate have adopted or are considering adopting data protection and privacy laws and regulations, including, among others, Brazil, the United States,APAC region, the European Union and United Kingdom, Latam and the United Kingdom.States.
BrazilAPAC region
Even though our operations in the APAC region are still in their early stages, they may expand to countries in the region in which Data Protection Authorities are very active and enforce substantial penalties in case of privacy or security breaches.
In September 2020, Brazilian Federal Law No. 13,709/2018,some jurisdictions, such as in Australia, the Brazilian General Data Protection Law (Lei Geral de Proteção de Dados Pessoais), or LGPD, came into effect to regulate the processingAuthority (ACMA) collected approximately USD 6.6 million in fines for certain privacy violations (e.g. for unsolicited marketing emails). In South Korea, there are multiple laws governing protection of personal data, in Brazil. The LGPD establishes general principles, obligationscybersecurity infrastructure such as cloud computing, and detailed rules to be observed by individuals or public or private companies in operations involving processing of personal data in Brazil, including the collection, use, processing and storage of personal data, which affects all economic sectors, including the relationship between customers and suppliers of goods and services, employees and employers and other relationships in which personal data is processed, whether in a digital or physical environment. The LGPD provides for, among others, the rights of holders of personal data, the legal bases applicable to the processing of personal data, the requisites to obtain consent, the obligations and requisites related to security incidents and leakages and transfers of data, either Brazilian or international, as well as the creation of the National Authority for Data Protection (Autoridade Nacional de Proteção de Dados), or ANPD, responsible for the inspection, promotion, disclosure, regulation, establishment of guidelines and application of the law.
7573
Recently, Law No. 14,010/2020 amended certain provisionscybersecurity measures. South Korean privacy laws provide not only administrative penalties up to 3% a company’s annual revenue, but also to criminal liability (maximum of 10 years of imprisonment) and punitive damages in the LGPD,amount of five times the damages suffered by the data subject. Singapore has been going through several reforms on its data protection law and postponed the administrative sanctions effectiveness to August 2021. However, because the LGPD also allows for a private right of action, we may still be subject to individual claims for violations of the LGPD as of its enactment. Incybersecurity acts, adopting mandatory notification in case of noncompliance with the LGPD, webreach and creating new types of privacy offenses, which can be subject to administrative sanctions applicable by the ANPD from August 1, 2021 onwards, on an isolated or cumulative basis, that can range from a warning, obligation to disclose incidents, temporary blocking and/or elimination of personal data related to the infraction, a simple finetrigger penalties of up to 2.0%10% of our revenue, or revenuea company’s annual turnover.
Rules for international data transfers from countries in the APAC region to other countries widely resemble the framework of the CompanyGeneral Data Protection Regulation 2016/679, or groupthe GDPR, in terms of companies in Brazil for the last fiscal year, excluding taxes, up to the global amountrequirements of R$50 million per violation, a daily fine, up to the aforesaid global limit, suspension of the operation of the database related to the infraction for a maximum period of six months, which can be extended for an equal period, up to the regularization of the processing by the controlling shareholder, suspension of activities related to processing of personal data related to the infraction for a period of six months, which can be extended for an equal period,adequacy decisions, proper legal basis and partial or total prohibition to exercise activities related to data processing.
The fact that the administrative sanctions of the LGPD will only be enforceable by the ANPD beginning in August 2021 does not prevent the imposition of administrative sanctions set forth by other laws that address issues related to data privacy and protection, such as the Brazilian Code of Consumer Defense and the Brazilian Civil Rights Framework for the Internet. These administrative sanctions can be applied by other public authorities, such as the Attorney General’s Office and consumer protection agencies. We can also be subject to civil liabilities for violation of these laws.
In addition to the administrative sanctions due to the noncompliance with the obligations established by the LGPD, we can be held liable for individual or collective material damages, and non-material damages caused to holders of personal data, including when caused by service providers, including SaaS partners, that serve as operators of personal data on our behalf.cross border security measures.
European Union and the United Kingdom
The General Data Protection Regulation 2016/679, or the GDPR became effective in May 2018, and is applicable to companies processing personal data of individuals in the European Union, or the EU, and the European Economic Area, or the EEA. The GDPR is wide-ranging in scope and implements stringent requirements in relation to the collection, use, retention, protection, disclosure, transfer and other processing of personal data relating to EU individuals, with substantial monetary penalties for violations. Personal data as defined under the GDPR includes any type of information that can identify a living individual, including name, identification number, email address, location, internet protocol addresses, and cookie identifiers. Among other requirements, the GDPR mandates more stringent administrative requirements for controllers and processors of personal data, including, for example, notice of and a lawful basis for data processing activities, data protection impact assessments, a right to “erasure” of personal data, and data breach reporting. If we do not comply with our obligations under the GDPR, we could be exposed to significant fines of up to €20 million or up to 4.0% of the total worldwide annual turnover of the preceding financial year, whichever is higher. The GDPR also provides that EU member states may enact their own additional laws and regulations in relation to certain data processing activities. Recent legal developments in the EU have also created complexity and uncertainty regarding transfers of personal information from the EU to “third countries,” especially the United States. For example, last year, the Court of Justice of the European Union, or CJEU, invalidated the EU-U.S. Privacy Shield Framework, a mechanism for the transfer of personal information from the EU to the United States, and made clear that reliance on Standard Contractual Clauses, an alternative mechanism for the transfer of personal information outside of the EU alone may not be sufficient in all circumstances.
Further, the United Kingdom’s withdrawal from the European Union and ongoing developments in the United Kingdom have created uncertainty regarding data protection regulation in the United Kingdom. Following the United Kingdom’s withdrawal from the EU on January 31, 2020, pursuant to the transitional arrangements agreed to between the United Kingdom and European Union, the GDPR continued to have effect in law in the
76
United Kingdom, and continued to do so until December 31, 2020 as if the United Kingdom remained a member state of the EU for such purposes. Following December 31, 2020, and the expiry of those transitional arrangements, the data protection obligations of the GDPR continue to apply to United Kingdom-related processing of personal data in substantially unvaried form by virtue of section 3 of the European Union (Withdrawal) Act 2018, as amended, which, together with the amended UK Data Protection Act of 2018, retains the GDPR in UK national law. However, going forward, there may be increasing scope for divergence in application, interpretation and enforcementOn June 28, 2021, the European Commission adopted an adequacy decision under the GDPR which recognized that the United Kingdom provides an essentially equivalent level of thepersonal data protection law asto that guaranteed under the GDPR, ensuring free flows of personal data between the United Kingdom and the EEA and minimizing risk of future divergence.
Latam
In September 2020, Brazilian Federal Law No. 13,709/2018, the Brazilian General Data Protection Law (Lei Geral de Proteção de Dados Pessoais), or LGPD, came into effect to regulate the processing of personal data in Brazil. The LGPD establishes general principles, obligations and detailed rules to be observed by individuals or public or private companies in operations involving processing of personal data in Brazil, including the collection, use, processing and storage of personal data, which affects all economic sectors, including the relationship between customers and suppliers of goods and services, employees and employers and other relationships in which personal data is processed, whether in a digital or physical environment. The LGPD provides for, among others, the United Kingdomrights of data subjects, the legal bases applicable to the processing of personal data, the requisites to obtain consent, the obligations and requisites related to security incidents and leakages and transfers of data, either Brazilian or international, as well as the creation of the National Authority for Data Protection (Autoridade Nacional de Proteção de Dados), or ANPD, responsible for the inspection, promotion, disclosure, regulation, establishment of guidelines and application of the law.
74
In case of noncompliance with the LGPD, we can be subject to administrative sanctions applicable by the ANPD from August 1, 2021 onwards, on an isolated or cumulative basis, that can range from a warning, obligation to disclose incidents, temporary blocking and/or elimination of personal data related to the infraction, a simple fine of up to 2.0% of our revenue, or revenue of the Company or group of companies in Brazil for the last fiscal year, excluding taxes, up to the global amount of R$50 million per violation, a daily fine, up to the aforesaid global limit, suspension of the operation of the database related to the infraction for a maximum period of six months, which can be extended for an equal period, up to the regularization of the processing by the controlling shareholder, suspension of activities related to processing of personal data related to the infraction for a period of six months, which can be extended for an equal period, and partial or total prohibition to exercise activities related to data processing.
In Brazil administrative sanctions can be enforced not only by the ANPD, but also by other public authorities in charge of overseeing other laws that addressing data privacy and protection, such as the Brazilian Code of Consumer Defense and the EEABrazilian Civil Rights Framework for the Internet. These administrative sanctions can be applied by other public authorities, such as the Attorney General’s Office and consumer protection agencies. We can also be subject to civil liabilities for violation of these laws.
Other Latam countries in relation to certain aspects ofwhich VTEX operates have also adopted data protection law remains uncertain.legislation influenced by the GDPR. Such legislation is comprehensive, covering all economic sectors. Some jurisdictions, like Chile, have approved a bill to update their current data protection laws, creating a local Data Protection Authority in charge of inspecting privacy breaches and enforcing penalties for noncompliance.
In addition to the administrative sanctions due to the noncompliance with the obligations established by the local privacy laws in Latam we can be held liable for individual or collective material damages, and non-material damages caused to data subjects, including when caused by service providers, including SaaS partners, that serve as subprocessors of personal data on our behalf.
United States
In the United States, various laws and regulations apply to the security, collection, storage, use, disclosure and other processing of certain types of data. For example, California adopted the California Consumer Privacy Act, or CCPA, which became effective in January 2020. The CCPA establishes a privacy framework for covered businesses, including an expansive definition of personal information and data privacy rights for California residents. Among other requirements, the CCPA mandates new disclosure to California consumers and allows California consumers to request a copy of the personal information collected about them, request deletion of their personal information and request to opt out of certain sales of personal information. The CCPA includes a framework with potentially severe statutory damages and private rights of action. Further, in November 2020, California voters passed the California Privacy Rights Act, or CPRA, which expands the CCPA with additional data privacy compliance requirements and establishes a regulatory agency dedicated to enforcing those requirements. In addition, other states, such as Virginia, have also adopted or are considering adopting similar data privacy laws and all 50 states have adopted laws requiring notice to consumers of a security breach involving their personal information. In July 2023 the European Commission adopted an adequacy decision under the GDPR, the “Data Privacy Framework”, which recognized that the United States provides an essentially equivalent level of personal data protection to that guaranteed under the GDPR, ensuring free flows of personal data between the United States and the EEA and minimizing risk of future divergence.
Anti-corruption and sanctions
We are subject to anti-corruption, anti-bribery, anti-money laundering and sanction laws and regulations, including the Brazilian Federal Law No. 12,846/2013, or the Clean Company Act, and the United States Foreign Corrupt Practices Act of 1977, as amended, or the FCPA. Both the Clean Company Act and the FCPA prohibits corporations and individuals from engaging in improper activities to obtain or retain business or to influence a person working in an official capacity. It prohibits, among other things, providing, directly or indirectly, anything of value to any foreign government official, or any political party or official thereof, or candidate for political influence to improperly influence such a person. Similar laws exist in other countries, such as the UK, that restrict improper payments to persons in the public or private sector. Many countries have laws prohibiting these types of payments within the respective country. Historically, technology companies have been the target of FCPA and other anti-corruption investigations and penalties.
75
In addition, we are subject to U.S. and foreign laws and regulations that restrict our activities in certain countries and with certain persons. These include the economic sanctions regulations administered by the U.S. Treasury Department’s Office of Foreign Assets Control and the export control laws administered by the U.S. Commerce Department’s Bureau of Industry:Industry.
C. Organizational Structure
| C. | Organizational Structure |
The following is a chart of our current corporate structure as of the date of this annual report:
77


| (1) | For more details on the subsidiaries, please refer to note 1 to our consolidated financial statements. |
| (2) | Based on a statement on Amendment No. 2 to Schedule 13G jointly filed on February |
| (3) | Based on a statement on Amendment No. 1 to Schedule 13D filed on April 11, 2023, by SoftBank Group Corp., the date of the last available Schedule 13D filed by such person with the SEC. Consists of common shares held by LA Holdings DE LLC. |
| (4) | Consists of common shares held by Data Center Holding II LLC, IT Brazil Group II LLC, RCP II Brazil Holdings LLC and RCP II (Parallel B) Brazil Holdings LLC, based on a statement on Schedule 13D jointly filed on |
D. Property, Plant and Equipment |
Our Properties
We are headquartered in the United Kingdom. Our largest office is based in Rio de Janeiro, Brazil. We lease all of our facilities and do not own any real property. The following table outlines significant properties (with over 100 square meters) that we currently lease for office space:
Location | Square meters (m2) | Lease Expiration Date | ||||||||||||
João Pessoa, Brazil | 235 | 03/31/ | ||||||||||||
New York, USA | 719 | 02/28/2025 | ||||||||||||
Rio de Janeiro, Brazil | 05/ | |||||||||||||
São Paulo, Brazil | 09/30/2027 | |||||||||||||
| ||||||||||||||
76
We believe that our facilities are adequate for our current needs and anticipate that suitable additional space will be readily available to accommodate any foreseeable expansion of our operations. We also believe we will be able to obtain additional facilities on commercially reasonable terms.
78
| Item 4.A. |
|
None.
OPERATING AND FINANCIAL REVIEW AND PROSPECTS |
| A. | Operating Results |
The following discussion of our financial condition and results of operations should be read in conjunction with our audited consolidated financial statements for the three years ended December 31, 2023, 2022 2021 and 2020,2021, and the notes thereto, included elsewhere in this annual report, as well as the information presented under “Presentation of Financial and Other Information.”
Key Metric—Gross Merchandise Value
The key metric we use to measure our performance, identify trends affecting our business, formulate our business plan projections and support our strategic decisions is GMV. Due to the seasonality of ecommerce and the foreign exchange effects resulting from the volatility of the currencies of the jurisdictions where we operate (particularly Latin America countries) vis-à-vis the U.S. Dollar (which is our functional currency), our management compares GMV on a year-over-year and foreign exchange neutral basis. The foreign exchange neutral measures are calculated by using the average monthly exchange rates for each month during the previous year and applying them to the corresponding months of the current year, so as to calculate what our results would have been had exchange rates remained stable from one year to the next.
GMV is the total value of customer orders processed through our platform, including value added taxes and shipping. Our GMV does not include the value of orders processed by our SMB customers or B2B transactions. Due to our transaction-based subscription model, we believe that GMV growth is linked with our revenue growth and we track GMV as an indicator of the success of our customers, the performance of the platform and our market share.
| Q1 2021 | Q2 2021 | Q3 2021 | Q4 2021 | Q1 2022 | Q2 2022 | Q3 2022 | Q4 2022 | |||||||||||||||||||||||||||||||||||||||||||||||||||||||||
| Q1 2022 | Q2 2022 | Q3 2022 | Q4 2022 | Q1 2023 | Q2 2023 | Q3 2023 | Q4 2023 | |||||||||||||||||||||||||||||||||||||||||||||||||||||||||
| (in millions of U.S. Dollars, unless otherwise indicated) | (in millions of U.S. Dollars, unless otherwise indicated) | |||||||||||||||||||||||||||||||||||||||||||||||||||||||||||||||
GMV | 2,036.1 | 2,439.3 | 2,284.8 | 2,905.6 | 2,714.6 | 3,111.9 | 2,957.5 | 3,903.7 | 2,714.6 | 3,111.9 | 2,957.5 | 3,903.7 | 3,303.7 | 3,838.5 | 3,999.3 | 5,382.7 | ||||||||||||||||||||||||||||||||||||||||||||||||
GMV Growth FX Neutral (%) | 142.3 | % | 25.4 | % | 4.2 | % | 16.1 | % | 27.9 | % | 21.0 | % | 28.7 | % | 29.2 | % | 27.9 | % | 21.0 | % | 28.7 | % | 29.2 | % | 20.6 | % | 21.2 | % | 27.8 | % | 29.9 | % | ||||||||||||||||||||||||||||||||
Key Factors Affecting our Performance
We believe our future performance will depend on many factors, including the following:
Continued growth of ecommerce globally
The ecommerce market has experienced rapid growth over the past several years. Widespread access to the internet, the introduction of digital payment methods, and the increased use of smartphones have made online shopping more convenient worldwide, catalyzing the growth of the global ecommerce market. The impact of the COVID-19 pandemic further accelerated the adoption of ecommerce, which drove broader business growth while brick-and-mortar stores were closed, and consumers increased their ecommerce spending due to extended stay-at-home orders and restrictions on movements. According to Insider Intelligence, the global ecommerce market grew to more than US$5.75.8 trillion in 20222023 and is estimated to grow to more than US$8.18.0 trillion by 2026.2027. In Latin America specifically, the ecommerce market grew to US$167.0144.7 billion in 20222023 and, according to Insider Intelligence, is estimated to grow to almost US$257.3226.5 billion by 2026.2027. The Latin American market was the second fastest-growing regional retail ecommerce market in 2022,2023, only after the Middle East & Africa, and there remains a significant runway for penetration. Insider Intelligence estimates Latin America ecommerce penetration was 12.4% 10.1%
77
in 2022,2023, lagging US penetration of 14.9%15.2% and 45 years behind global ecommerce penetration of 19.7%19.5% within the same period. The region is forecasted to reach 17.7%12.9% penetration in 2026,2027, reflecting a 43.3%2.8 percentage points increase in penetration in ecommerce in a region with overalmost twice the amount of population size of the United States. The size of the market, coupled with the relatively low level of penetration, presents a significant opportunity for continued growth.
79
Our business is dependent on the continued adoption of ecommerce globally and in Latin America in particular. As more enterprises choose to introduce and grow their ecommerce businesses, we expect to attract more customers and stores to our platform. Additionally, due to our shared success transaction-based fee model, our revenue is dependent on GMV transacted on our platform, which we believe will grow as our existing and new customers grow their ecommerce businesses, driven by continued growth in consumer demand.
Retention and growth of our existing customers
Our current business and long-term revenue growth are directly correlated with the success and growth in GMV of our existing customers’ online stores. We strive to maintain industry-leading platform capabilities to maximize customer success and retention. As our customers’ online stores generate more GMV, we directly generate more transaction-based fees and indirectly generate more fixed subscription fees through continuing to enhance platform functionality.
Our ability to help our customers increase their ecommerce revenue within their online stores is also demonstrated by our customers’ SSS, calculated on a yearly basis by dividing the GMV of active online stores in the current period by the GMV of the same active online stores in the prior period. In 2022,2023, our SSS were up 17.2%14.6% on a FX Neutral basis, on top of 2022 and 2021 SSS growth of 17.2% and 11.8% on a FX Neutral basis. We believe that given the acceleration of ecommerce caused by the COVID-19 pandemic in 2021 and the natural reopening of physical stores in 2021, our SSS results during this period should also be analyzed on a three-year compound average growth rate, which would result in 35.5%. In 2019 our SSS surpassed 25% on a FX Neutral basis, historical rate.respectively.
We also measure the retention and growth of our revenue from existing customers and their online stores through our customer’s NRR, which we calculate on a monthly basis by dividing the subscription revenue from our platform during the current period by the subscription revenue in the same period of the previous year for the same base of online stores that were active in the same period of the previous year. Our NRR includes the effect on subscription revenue of any online stores including renewals, expansion, contraction, and churn. Our calculation of NRR excludes any revenue from our SMB platform customers. Our NRR was 105.3%107.4%, 105.1%105.3% and 171.9%105.1% on a FX Neutral basis for the years ended December 31, 2023, 2022 2021 and 2020,2021, respectively.
Due to the effects of COVID-19, bothBoth our SSS and NRR for the year endedfiscal years ending December 31, 2020 were positively impacted as total or partial lock-downs were imposed globally, forcing our customers2021, and 2022 experienced adverse effects due to shift mostly all their volumes online. The aforementioned, negatively impacted 2021 SSS and NRR metrics, especially as we witnessed the gradual reopening of brick-and-mortar stores, enablingfacilitating the adoption of omni-channel strategies, which resulted in our customers partly migratingstrategies. This led to a partial migration of volumes back some of their volumes into theirto brick-and-mortar channels, especially thoseparticularly among customers who have relevant brick-and-mortarwith substantial physical presence. By the second half of 2021 some additional headwinds as inventory shortages and supply chain challenges impacted some verticals such as electronics and home appliances, which already started to normalize by the end of the year. During 2022 we witnessed a gradual improvement ofIn 2023, our SSS and NRR metrics leadingwere affected by the deteriorating macroeconomic environment. As we look ahead to a normalization in line with our historical rates. In 2023, we expect2024, predicting our SSS and NRR becomes challenging due to be in-line withvolatility in the performance we witnessed during the second half of 2022.macroeconomic landscape.
Given our subscription-based model, we generate most of our revenues in any given year from existing customers. For the years ended December 31, 2023, 2022 2021 and 2020,2021, we generated 84.2%88.9%, 81.8%84.2% and 85.6%81.8% of the revenue derived from the VTEX platform from customers who have been on our platform for over one year, respectively. For the year ended December 31, 2022, 53.7%2023, 60.1% of the revenue derived from the VTEX platform was generated from customers who have been on our platform for over three years.
We believe the strength of our value proposition to enterprises is also evidenced by our customer cohorts, which show revenue retention and growth over the past fourseven years through 2020.2023. For purposes of the following chart, we define net revenue retention as the percentage of the revenue, on a FX neutral basis, generated by a yearly cohort of customers in 2022,2023, relative to the revenue generated in 2017, the reference year, or yearly vintage of such yearly cohort of customers. We define a yearly cohort of customers as the group of customers that received the first invoice of our VTEX platform in the priorpreceding 18 months from the last day of the relevant fiscal year.
8078
Revenue by Cohort
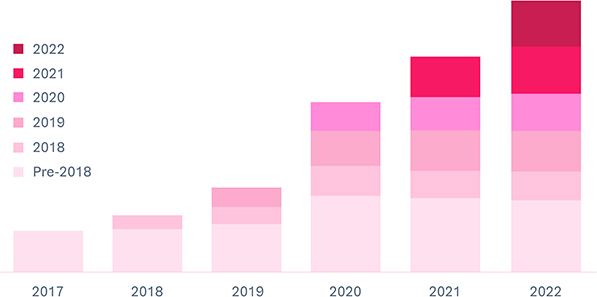

Our business is also affected by our customers’ ability to launch additional online stores to serve additional brands, geographies, or use cases. As an example, our top 100 customers have more than doubledalmost tripled their number of online stores per customer from 2.2 in 2017 to 5.96.0 in 2022.2023. These top 100 customers have almost tripled their geographic presence with us from 13 to 3439 countries over the same time period. The average ARR per customer across our top 100 customers has more than tripled from 2017 to 2022.2023. We believe that our ability to continue to drive faster go-lives and expand the online store presence, regionally and globally, of our customers will drive revenue growth. As of December 31, 2022,2023, only 8.5%11.0% of our enterprise customers had two or more stores, highlighting a significant opportunity for further expansion.
Efficient acquisition of new customers
Increasing our customer base is important to our continued revenue growth. We believe we are positioned to grow significantly through a combination of our own sales and marketing initiatives, customer referrals, agency and technology partner referrals, and word-of-mouth referrals from existing customers.
We measure the efficiency of new customer acquisition by comparing the lifetime value, or LTV, of newly-acquired enterprise customers to the customer acquisition costs, or CAC, of the associated time period to get an “LTV/CAC ratio.” We calculate LTV as the gross profit from new sales during the four quarters of any given period divided by the subscription churn rate of the last 12 months. We calculate CAC as total sales and marketing expenses incurred during the four quarters preceding the quarter in which the calculation is made. This calculation assumes that the actual subscription churn rate for the period will remain consistent in future years. For instance, the LTV/CAC ratio for 20222023 includes the LTV for the year ended December 31, 20212022 and CAC for the four quarters ended September 30, 2022.2023. On this basis, we estimate that our annual LTV/CAC ratio is over 6x in 20212023 and 2022.
81
Evolution of our business partner ecosystem
A key part of our strategy is to build a thriving technology partner ecosystem. The ecosystem around our platform is connected to over 3,000 integrated solutions,6,000 VTEX IO extensions created by third parties, 1,000 SIs 300and ISVs, 330 marketplaces, 150180 payments solutions and 90 logistics companies, which use or embed our solutions into their own offerings to enable our customers to conduct commerce more conveniently. These integrated business partners include providers for shipping, marketplaces, point-of-sale, omnichannel, marketing automation, search, merchandising, SIs, agencies, payments, anti-fraud and lending services. We focus on collaborating with business partners in our ecosystem, by establishing mutually beneficial relationships, rather than competing with them. For instance, by allowing our customers to seamlessly start accepting online payments through one of our payment solutions partners, we are collaborating with our ecosystem and quickly generating revenue to our payments solutions partners and us. Our
79
customers benefit from the expertise and best-of-breed offerings of our business partners, the flexibility to choose the best offerings for their needs, and the tailored programs developed with our strategic business partners. Our ecosystem of integrated applications and technology solutions is among the largest of any ecommerce platform and helps drive the growth of our customer base, which in turn accelerates growth of the ecosystem. We believe VTEX continues to innovate in an industry where many companies are providing outdated services.
Our ability to retain and grow our customers’ online stores often depends on the continuous improvement of our platform and the expansion of the capabilities of our strategic technology partners, including SIs, agencies and payment solutions to provide revenue generating services to our customers. As a result of our strong ecosystem and product capabilities, nearly a third of the revenue potential of new contracts signed in the year ended December 31, 20222023 was originated organically or through the ecosystem, including referrals, customers’ requests, or through partners and resellers.
Investment in innovation and growth
We have invested and intend to continue to invest in our platform, including broadening our capabilities to meet the future needs of enterprise customers and their brands. Our ability to incorporate innovative tools and features that improve our platform is critical to ensuring that the enterprises we support have the necessary capabilities to adapt to the influx of disruptive technologies impacting commerce and the enterprise, to incorporate cutting edge technologies and capabilities that emerge from our partners and the broader commerce ecosystem and to meet the evolving needs of consumers. As a result, we intend to use our Composable Commerce framework to expand our features, capabilities and partner integrations, including facilitating the extension of our platform to address the evolving needs of enterprises and to accelerate their commerce transformation as our customers expand their global commerce footprint. We also intend to continue to invest in enhancing awareness of our brand as we grow our enterprise customer base throughout Latin America and the rest of the world. We believe this strategy will provide new avenues for growth and allow us to continue to deliver differentiated, high-value outcomes to our customers, their consumers and stockholders.
In 2021 we increased investments as part of our commitment to invest in innovation and growth. We invested in (1) research and development to further bolster our platform and extend our capabilities; (2) sales and marketing, to promote our innovative platform to new and existing customers and in existing and expanded geographies; (3) professional services to ensure the success of our customers’ implementations of our platform; and (4) other operational and administrative functions to support our expected growth and our transition to a public company.
In 2022, VTEX announced a new step towards its efficiency-driven expansion. We prioritized the most relevant opportunities created in 2021, such as B2B, in-store solutions, live shopping, and conversational commerce, among others. In 2023, VTEX maintained operational efficiency, achieving significant leverage and global momentum. VTEX launched innovative solutions focused on the omnichannel experience for retailers, such as the VTEX Sales App, VTEX Pick and Pack, VTEX Personal Shopper, and the Extensions Hub, among others.
We believe our current organizational structure is able to deliver high-efficiency growth in an industry whichthat we believe maintains attractive underlying long-term trends.trends, as demonstrated in 2023. We expect our total operating expenses to leverage more gradually over time. We also intend to continue to evaluate strategic acquisitions and investments in businesses and technologies to improve our platform and accelerate our market expansion. Our future success is dependent, in part, on our ability to successfully develop, market, and sell our platform to new and existing customers and to help our customers capture omnichannel commerce opportunities both regionally and globally.
82
Successful rollout of new geographies
We are investing in the expansion of our regional sales and marketing capabilities in order to grow our business within new regions in Latin America and the rest of the world. In some cases, we are expanding with existing customers to new geographies. For instance, a global electronics brand manufacturer uses the VTEX platform to power its ecommerce direct to consumer initiatives in 2023 countries. We started our operations in Brazil in 2000, opened our first office outside of Brazil in 2013 and expanded outside of Latin America to the United States in 2017. We have operations in seven cities in Brazil, six cities in Latin America and eightten cities in the rest of the world with 961, 219,934, 205, and 169138 employees, respectively, as of December 31, 2022.2023.
80
For the years ended December 31, 20222023 and 2021,2022, purchases originated from customers in Brazil represented 54.6%54.3% and 52.8%54.6% of our total revenue, respectively, compared to 57.2%%52.8% for the year ended December 31, 2020, and 70.8% for the year ended December 31, 2019,2021, highlighting our growing diversification outside of Brazil, in Latin America and the rest of the world. For the years ended December 31, 20222023 and 2021,2022, our revenues in Brazil increased year-over-year 29.5%27.2% and 17.7%29.5% in U.S. dollars and 23.7%22.7% and 24.4%23.7% on an FX neutral basis, respectively. For the years ended December 31, 20222023 and 2021,2022, revenues in Latin America, excluding Brazil, increased 26.1% and 16.1% and 31.7%21.0% and 14.4% and 27.6% on an FX neutral basis, respectively. Revenues from the rest of the world increased 37.8% and 40.0% and 97.5%37.3% and 47.0% and 97.6% on an FX neutral basis in the same periods, respectively. Revenues from Latin America, excluding Brazil, and the rest of the world represented 35.4%34.9% and 10.0%10.8%, of our total revenues for the year ended December 31, 2022,2023, from 38.2%35.4% and 9.0%10.0% for the year ended December 31, 2021.2022.
This rapid growth highlights the success of our platform’s expansion beyond Brazil. Although we believe our platform can compete successfully globally, we have historically focused on Latin America. Given our brand awareness and market position, we believe that most of our growth in the short to medium term will continue to come from Latin America where we have a leadership position and ecommerce is expected to accelerate given its current under penetration. Over the past several years we have invested, and plan to continue disciplined investing, in our operations in the United States and Europe, although only limited growth may result from these regions in the short to medium term.
Latin American Macroeconomic Environment
We operate across various countries, and in particular a number of emerging economies in Latin America. As a result, our revenues and profitability may be affected by political and economic developments in these countries and the effect that these factors have on the availability of credit, disposable income, employment rates, and average wages in these countries. Although we believe the ongoing secular shift to ecommerce strongly benefit our business, our operations may be impacted by changes in economic conditions in each of the countries in which we operate.
As of December 31, 2022,2023, Latin America had an estimated total GDP of US$5.46.5 trillion, according to Fitch,Statista, over 616665 million inhabitants, with an average GDP per capita of US$8,840.$8,808, according to Fitch. Important industries have consolidated their presence in the region and acquired scale, the most notable being retail, manufacturing, financial services, transportation and communication, construction, agribusiness and mining.
Brazil is the largest economy in Latin America, as measured by GDP, and we have historically carried out the majority of our operations in Brazil. While we have been growing our revenues outside of Brazil, our revenues and profitability may be affected by political and economic developments in Brazil and the effect that these factors have on the availability of credit, disposable income, employment rates and average wages in the country. Our operations in Brazil, and the financial services industry in general, are particularly sensitive to changes in Brazilian economic conditions. The real/U.S. dollar exchange rate reported by the Central Bank was R$5.5815.218 per US$1.00 on December 31, 2021,2022, which reflected a 7.4%6.5% depreciation of the real against the U.S. dollar during 20212022 due primarily to increasedelection and post-election concerns and speculations over increases in government expenditures related to Covid-19 assistance programs and negative real interest rates caused by high inflation in 2021.expenditure. The exchange rate reported by the Central Bank was R$5.2184.841 per US$1.00 on December 31, 20222023 and R$5,2074.9813 per US$1.00 on March 1, 2023.February 26, 2024. There can be no assurance that the real will not appreciate or depreciate against the U.S. dollar or other currencies in the future.
83
As for the business cycle, the Latin American region experienced a substantial slowdown after the end of the commodity super-cycle and poorer economic policies in large economies, notably Brazil. The real rate of GDP growth across Latin America trended down from growth of 4.6% in 2011 to a 1.2% contraction in 2016, according to Fitch. Since 2016, a combination of new governments pursuing better policies, further stabilizing reforms and improving terms of trade, has produced a gradual turnaround. Gradual economic expansion has been taking place since 2017, even with the recent market declines and increased volatility caused by COVID-19.
81
While these adverse shifts in general economic conditions may have a negative impact on our results of operations, the ongoing secular shift to ecommerce, as well as other industry trends, may offset most of this impact.
Impacts of the COVID-19 Pandemic
As a result of the COVID-19 pandemic, which was declared a global pandemic by the World Health Organization in March 2020, the ecommerce market experienced a surge in growth. Governments encouraged consumers to stay at home for extended periods of time, and retail purchases shifted from offline and brick-and-mortar purchases to online ecommerce, as companies accelerated the digitalization of their businesses. Consequently, ecommerce sales in our major markets have increased significantly. Our business responded to the shifting commerce dynamics and enabled our customers to rapidly scale and digitally transform their businesses during the COVID-19 pandemic. This increase in GMV of our customers has resulted in significant revenue growth for us, driven predominantly by increases in our transaction-based fees.
Even though the online purchasing trend demonstrated to have staying power through 2021 and 2022, we started to see a mean reversion towards the pre-pandemic ecommerce levels of growth. Our customer’s online channels experienced a decrease in growth rates, which affected our business growth, financial condition, and operating results. As the COVID-19 pandemic is increasingly controlled, we expect that the decrease in such growth rates will continue. While we believe that the structural shifts that favor ecommerce will continue as the world recovers from COVID-19, we do not expect to experience the same growth in our business going forward. For example, in the year ended December 31, 2022, our revenue increased 25.3% in U.S. dollars compared to 2021 (22.3% on an FX neutral basis), while revenues increased 27.5% in U.S. dollars (29.8% on an FX neutral basis) in December 31, 2021 compared to 2020. We expect that our total revenue may be subject to increased fluctuations in the near-term as a result. See “Item 3. Key Information—D. Risk Factors—The COVID-19 pandemic could materially adversely affect our business, financial condition and results of operations.”
Components of Our Results of Operations
The following is a summary of the principal line items comprising consolidated statements of profit or loss.
Total revenue
Our total revenue consists of (1) subscription and support revenue, arising from a multichannel cloud and SaaS-based platform focused on ecommerce; and (2) revenue from professional services and other, arising substantially from consulting services.
Subscription revenue
Subscription revenue consists of revenue derived from (1) a mix of transaction-based fees and fixed subscription fees, in each case derived from customers using our platform; (2) our SMB business; and (3) other business units that generate recurring revenue to us.
Transaction-based fees comprise (a) subscription fees charged to customers based on a percentage of the GMV or a fee per order processed on our platform; and (b) subscription fees charged to marketplace partners, payment providers, and any other services provided through our app store.
84
Fixed subscription fees comprise (a) yearly or multi-year upfront fees paid by merchants to reduce future variable fees. In case of early termination of the annual upfront fees, we refund merchants for the remaining term of the contract; and (b) fixed monthly fee for using our platform in any given month. Fixed fees are paid to us at the beginning of the applicable subscription period, regardless of the length of the subscription period. As subscription fees are received in advance of providing the related services, we record deferred revenue on our consolidated balance sheet for the unearned revenue and recognize revenue ratably over the related subscription period.
Services revenue
Services revenue consists primarily of revenue derived from consulting services which are recognized over time during the period that services are performed. Services revenue represented 5.8%5.6%, 5.8% and 5.4%5.8% of our revenue for the years ended December 31, 2023, 2022 2021 and 2020,2021, respectively.
Cost of revenue
Our total cost consists of (1) subscription cost; and (2) services cost.
Subscription cost of revenue
Subscription cost consists mainly of costs related to hosting and customer support. The hosting related costs include third-party providers, software related platform operating costs, and compensation for our infrastructure team. Support costs are mostly driven by personnel cost, and represent expenses related to the support we provide to our customers.
Services cost of revenue
Services cost consist mainly of personnel costs and/or third-party expenses to provide the professional services advisory for a specific project of a customer project.
82
Operating expenses
Our operating expenses consist of general and administrative expenses, sales and marketing expenses, and research and development expenses.
General and administrative expenses consist primarily of (1) personnel-related expenses (including stock-based compensation) for our finance, support operation departments, legal and compliance teams; (2) corporate expenses; and (3) corporate overhead allocation. General and administrative expenses also include costs related to business acquisitions, legal and other professional services fees and depreciation and amortization. We expect administrative expenses to increase as a result of becoming a publicly traded company and compliance requirements derived from the Sarbanes-Oxley Act. Public company costs include expenses associated with annual and quarterly reporting, investor relations, register and transfer agent fees, incremental insurance costs, accounting and legal services, and other investments to strengthen corporate governance and internal controls.
Sales and marketing expenses consist primarily of (1) personnel-related expenses (including stock-based compensation) and commissions paid to the direct sales team, the success team, partnership sales team and sales enablement team; (2) travel-related expenses; (3) marketing and events expenses; (4) finder fee commissions; and (5) the allocation of corporate overhead. We plan to continue to incur sales and marketing expenses in the regions that we currently have a presence as well as in new regions over time in order to continue to enhance our brand to attract new customers.
Research and development expenses consist primarily of (1) personnel-related expenses (including stock-based compensation) for product development, product management and product design; (2) software subscription costs related to the product; and (3) the allocation of corporate overhead. We expect to increase the research and development expenses to continue investing in product innovation, and in the development of new products.
85
Financial result, net
Financial result, net consist of financial income and financial expenses. Financial income consists of interest earned on financial instruments, foreign exchange gains, gains from fair value of financial instruments and other financial income. Finance expense consists mostly of foreign exchange losses, financial losses from fair value of derivative and financial instruments, interest on lease liabilities and adjustment of hyperinflation in Argentina.
Income tax
Provision for income taxes consists primarily of income taxes, current and deferred, in certain foreign jurisdictions in which we conduct business. The current and deferred income taxes are calculated on the basis of the tax laws enacted or substantively enacted at the end of the reporting period in the countries in which we operate and generate taxable income. Our effective tax rate is mostly impacted by permanent book-to-tax differences and the lack of recognition of a deferred tax asset at the level of certain legal entities.
83
Historical Consolidated Results of Operations
Comparison of Results of Operations for the Years Ended December 31, 2023 and 2022
The following table sets forth our consolidated statements of profit or loss for the years ended December 31, 2023 and 2022. The period-to-period comparison of financial results is not necessarily indicative of future results.
| For the year ended December 31, | ||||||||||||
| 2023 | 2022 | Variation | ||||||||||
(in millions of U.S. Dollars, | % | |||||||||||
Subscription revenue | 190.3 | 148.5 | 28.2 | % | ||||||||
Services revenue | 11.2 | 9.1 | 22.6 | % | ||||||||
Total revenue | 201.5 | 157.6 | 27.8 | % | ||||||||
Subscription cost(1) | (45.4 | ) | (41.4 | ) | 9.7 | % | ||||||
Services cost(1) | (15.5 | ) | (11.4 | ) | 35.9 | % | ||||||
Total cost | (60.9 | ) | (52.8 | ) | 15.4 | % | ||||||
Gross Profit | 140.6 | 104.8 | 34.1 | % | ||||||||
Operating Expenses | ||||||||||||
General and administrative(1) | (33.7 | ) | (28.3 | ) | 18.8 | % | ||||||
Sales and marketing(1) | (59.5 | ) | (67.8 | ) | (12.3 | )% | ||||||
Research and development(1) | (60.1 | ) | (57.2 | ) | 5.1 | % | ||||||
Other losses | (1.9 | ) | (1.4 | ) | 41.6 | % | ||||||
Loss from operations | (14.6 | ) | (49.9 | ) | (70.7 | )% | ||||||
Financial result, net | 3.0 | (7.6 | ) | n/a | ||||||||
Equity results | 1.0 | 1.1 | (8.9 | )% | ||||||||
Loss before income taxes | (10.6 | ) | (56.4 | ) | (81.2 | )% | ||||||
Income tax | (3.1 | ) | 4.0 | n/a | ||||||||
Net loss for the year | (13.7 | ) | (52.4 | ) | (73.9 | )% | ||||||
| (1) | Includes stock-based compensation expense allocated as follows: |
| For the year ended December 31, | ||||||||
| 2023 | 2022 | |||||||
| (in millions of U.S. Dollars, unless otherwise indicated) | ||||||||
Subscription cost | (0.2 | ) | (0.5 | ) | ||||
Services cost | (0.5 | ) | (0.2 | ) | ||||
General and administrative | (7.3 | ) | (4.4 | ) | ||||
Sales and marketing | (4.4 | ) | (2.9 | ) | ||||
Research and development | (7.4 | ) | (4.8 | ) | ||||
Total stock-based compensation | (19.7 | ) | (12.8 | ) | ||||
Total revenue
The components of our total revenue during the years ended December 31, 2023 and 2022 were as follows:
| For the year ended December 31, | ||||||||||||
| 2023 | 2022 | Variation | ||||||||||
| (in millions of U.S. Dollars, unless otherwise indicated) | % | |||||||||||
Subscription revenue | 190.3 | 148.5 | 28.2 | % | ||||||||
Services revenue | 11.2 | 9.1 | 22.6 | % | ||||||||
Total revenue | 201.5 | 157.6 | 27.8 | % | ||||||||
Total revenue for the year ended December 31, 2023 was U$201.5 million, an increase of US$43.9 million, or 27.8% in US$ or 23.7% on an FX neutral basis, from US$157.6 million in 2022. The increase in total revenue was primarily driven by: (1) an increase in GMV of 30.2% in US$ or 25.3% on an FX neutral basis to US$16.5
84
billion in 2023, from US$12.7 billion in 2022, which also resulted in higher revenues from transaction-based fees as percentage of total subscription revenues; (2) an increase of 3.8% in the number of active online stores using our platform during the year which we believe is mainly attributable to the impacts of the increased penetration of ecommerce accelerating the digitalization plan of enterprises as a result of changing end-consumer purchase behavior (to favor online purchases); and (3) the expansion of our operations outside of Latin America.
Total cost
The components of our total cost during the years ended December 31, 2023 and 2022 were as follows:
| For the year ended December 31, | ||||||||||||
| 2023 | 2022 | Variation | ||||||||||
| (in millions of U.S. Dollars, unless otherwise indicated) | % | |||||||||||
Subscription cost | (45.4 | ) | (41.4 | ) | 9.7 | % | ||||||
Services cost | (15.5 | ) | (11.4 | ) | 35.9 | % | ||||||
Total costs | (60.9 | ) | (52.8 | ) | 15.4 | % | ||||||
Total cost for the year ended December 31, 2023 increased by US$8.1 million, or 15.4%, to US$60.9 million in 2023 from US$52.8 million in 2022, mainly due to an increase in the total cost of subscription by US$4.0 million given the increase in transactions and the GMV processed on our platform, and an increase in the total cost of services by US$4.1 million mainly due to implementation projects for new customers in the United States and Europe.
Gross profit
As a result of the above, our gross profit increased by US$35.8 million, or 34.1% to US$140.6 million in 2023 from US$104.8 million in 2022. As a percentage of our total revenue, our gross profit increased to 69.8% in 2023 from 66.5% in 2022, mainly due to operational hosting cost efficiencies.
Operating expenses
General and administrative
General and administrative expenses during the years ended December 31, 2023 and 2022 were as follows:
| For the year ended December 31, | ||||||||||||
| 2023 | 2022 | Variation | ||||||||||
| (in millions of U.S. Dollars, unless otherwise indicated) | % | |||||||||||
General and administrative | (33.7 | ) | (28.3 | ) | 18.8 | % | ||||||
Percentage of total revenue | 16.7 | % | 18.0 | % | ||||||||
Our general and administrative expenses increased by US$5.3 million in 2023, or 18.8%, to US$33.7 million in 2023, from US$28.3 million in 2022, primarily due to personnel salary increases and other employee-related expenses.
Sales and marketing
Sales and marketing expenses during the years ended December 31, 2023 and 2022 were as follows:
| For the year ended December 31, | ||||||||||||
| 2023 | 2022 | Variation | ||||||||||
| (in millions of U.S. Dollars, unless otherwise indicated) | % | |||||||||||
Sales and marketing | (59.5 | ) | (67.8 | ) | (12.3 | )% | ||||||
Percentage of total revenue | 29.5 | % | 43.0 | % | ||||||||
85
Our sales and marketing expenses decreased by US$8.3 million, or 12.3%, to US$59.5 million in 2023 from US$67.8 million in 2022, primarily due to the reduction of our Sales and Marketing headcount, made during the second half of 2022. Although our Sales and Marketing workforce decreased, we will continue investing in regions such as the United States, Europe, and Latin America.
Research and development
Research and development expenses during the years ended December 31, 2023 and 2022 were as follows:
| For the year ended December 31, | ||||||||||||
| 2023 | 2022 | Variation | ||||||||||
| (in millions of U.S. Dollars, unless otherwise indicated) | % | |||||||||||
Research and development | (60.1 | ) | (57.2 | ) | 5.1 | % | ||||||
Percentage of total revenue | 29.8 | % | 36.3 | % | ||||||||
Our research and development expenses increased by US$2.9 million, or 5.1%, to US$60.1 million in 2023 from US$57.2 million in 2022, primarily due to the increase of expenses related to share-based compensation and outsourcing of R&D related expenses.
Financial result, net
The components of our financial result during the years ended December 31, 2023 and 2022 were as follows:
| For the year ended December 31, | ||||||||||||
| 2023 | 2022 | Variation | ||||||||||
| (in millions of U.S. Dollars, unless otherwise indicated) | % | |||||||||||
Finance income | 46.4 | 23.8 | 95.1 | % | ||||||||
Finance expense | (43.4 | ) | (31.4 | ) | 38.1 | % | ||||||
Finance result, net | 3.0 | (7.6 | ) | n/a | ||||||||
Our finance result amounted to an income of US$3.0 million in 2023 compared to an expense of US$7.6 million in 2022, as a result of the following:
Financial income
Financial income increased by US$22.6 million, or 95.1%, to US$46.4 million in 2023 from US$23.8 million in 2022, mainly due to an increase in interest and dividend earned on bank deposits and financial investments to US$23.8 million on December 31, 2023 from US$2.3 million on December 31, 2022.
Financial expense
Our financial expense increased by US$12.0 million, or 38.1%, to US$43.4 million in 2023 from US$31.4 million in 2022, mainly due to (1) an increase in the adjustment of hyperinflation to US$19.4 million on December 31, 2023 from US$5.2 million on December 31, 2022. (2) an increase in foreign exchange losses to US$16.9 million on December 31, 2023 from US$8.5 million on December 31, 2022, partially offset by a decrease in losses from short and long-term investments to US$1.6 million on December 31, 2023 from US$13.8 million on December 31, 2022.
Income tax
Our income tax amounted to an expense of US$3.1 million in 2023 from an income of US$4.0 million in 2022, primarily attributable to the increase of taxable income in countries with higher tax rates, and to a lower amount of deferred tax assets booked with respect to certain tax loss carried forward and temporary differences.
86
Net loss for the year
As a result of the above, our net loss amounted to US$13.7 million in 2023, compared to US$52.4 million in 2022.
Comparison of Results of Operations for the Years Ended December 31, 2022 and 2021
The following table sets forth our consolidated statements of profit or loss for the years ended December 31, 2022 and 2021. The period-to-period comparison of financial results is not necessarily indicative of future results.
| For the year ended December 31, | ||||||||||||||||||||||||
| 2022 | 2021 | Variation | For the year ended December 31, | |||||||||||||||||||||
| 2022 | 2021 | Variation | ||||||||||||||||||||||
| (in millions of US$) | % | (in millions of U.S. Dollars, unless otherwise indicated) | % | |||||||||||||||||||||
Subscription revenue | 148.5 | 118.5 | 25.3 | % | 148.5 | 118.5 | 25.3 | % | ||||||||||||||||
Services revenue | 9.1 | 7.3 | 24.7 | % | 9.1 | 7.3 | 24.7 | % | ||||||||||||||||
Total revenue | 157.6 | 125.8 | 25.3 | % | 157.6 | 125.8 | 25.3 | % | ||||||||||||||||
Subscription cost(1) | (41.4 | ) | (38.4 | ) | 7.8 | % | (41.4 | ) | (38.4 | ) | 7.8 | % | ||||||||||||
Services cost(1) | (11.4 | ) | (11.2 | ) | 1.8 | % | (11.4 | ) | (11.2 | ) | 1.8 | % | ||||||||||||
Total cost | (52.8 | ) | (49.6 | ) | 6.5 | % | (52.8 | ) | (49.6 | ) | 6.5 | % | ||||||||||||
Gross Profit | 104.8 | 76.2 | 37.5 | % | 104.8 | 76.2 | 37.5 | % | ||||||||||||||||
Operating Expenses | ||||||||||||||||||||||||
General and administrative(1) | (28.3 | ) | (31.9 | ) | (11.3 | )% | (28.3 | ) | (31.9 | ) | (11.3 | )% | ||||||||||||
Sales and marketing(1) | (67.8 | ) | (63.5 | ) | 6.8 | % | (67.8 | ) | (63.5 | ) | 6.8 | % | ||||||||||||
Research and development(1) | (57.2 | ) | (45.2 | ) | 26.5 | % | (57.2 | ) | (45.2 | ) | 26.5 | % | ||||||||||||
Other losses | (1.4 | ) | (1.5 | ) | (6.7 | )% | (1.4 | ) | (1.5 | ) | (6.7 | )% | ||||||||||||
Loss from operations | (49.9 | ) | (65.9 | ) | (24.3 | )% | (49.9 | ) | (65.9 | ) | (24.3 | )% | ||||||||||||
Financial result, net | (7.6 | ) | (4.6 | ) | 65.2 | % | (7.6 | ) | (4.6 | ) | 65.2 | % | ||||||||||||
Equity results | 1.1 | 0.6 | 83.3 | % | 1.1 | 0.6 | 83.3 | % | ||||||||||||||||
Loss before income taxes | (56.4 | ) | (70.0 | ) | (19.4 | )% | (56.4 | ) | (70.0 | ) | (19.4 | )% | ||||||||||||
Income tax | 4.0 | 9.5 | (57.9 | )% | 4.0 | 9.5 | (57.9 | )% | ||||||||||||||||
Net loss for the year | (52.4 | ) | (60.5 | ) | (13.4 | )% | (52.4 | ) | (60.5 | ) | (13.4 | )% | ||||||||||||
| (1) | Includes stock-based compensation expense allocated as follows: |
86
| For the year ended December 31, | ||||||||
| 2022 | 2021 | |||||||
| (in millions of US$) | ||||||||
Subscription cost | (0.5 | ) | (0.7 | ) | ||||
Services cost | (0.2 | ) | (0.4 | ) | ||||
General and administrative | (4.4 | ) | (7.1 | ) | ||||
Sales and marketing | (2.9 | ) | (5.5 | ) | ||||
Research and development | (4.8 | ) | (5.9 | ) | ||||
Total stock-based compensation | (12.8 | ) | (19.6 | ) | ||||
Total revenue
The components of our total revenue during the years ended December 31, 2022 and 2021 were as follows:
| For the year ended December 31, | ||||||||||||||||||||||||
| 2022 | 2021 | Variation | For the year ended December 31, | |||||||||||||||||||||
| 2022 | 2021 | Variation | ||||||||||||||||||||||
| (in millions of US$) | % | (in millions of U.S. Dollars, unless otherwise indicated) | % | |||||||||||||||||||||
Subscription revenue | 148.5 | 118.5 | 25.3 | % | 148.5 | 118.5 | 25.3 | % | ||||||||||||||||
Services revenue | 9.1 | 7.3 | 24.7 | % | 9.1 | 7.3 | 24.7 | % | ||||||||||||||||
|
|
| ||||||||||||||||||||||
Total revenue | 157.6 | 125.8 | 25.3 | % | 157.6 | 125.8 | 25.3 | % | ||||||||||||||||
|
|
| ||||||||||||||||||||||
87
Total revenue for the year ended December 31, 2022 was U$157.6 million, an increase of US$31.8 million, or 25.3% in US$ or 22.3% on an FX neutral basis, from US$125.8 million in 2021. The increase in total revenue was primarily driven by: (1) an increase in GMV of 31.3% in US$ or 26.8% on an FX neutral basis to US$12.7 billion in 2022, from US$9.7 billion in 2021, which also resulted in higher revenues from transaction-based fees as percentage of total subscription revenues; (2) an increase of 6.0% in the number of active online stores using our platform during the year which we believe is mainly attributable to the impacts of the increased penetration of ecommerce accelerating the digitalization plan of enterprises as a result of changing end-consumer purchase behavior (to favor online purchases); and (3) the expansion of our operations outside of Brazil.
Total cost
The components of our total cost during the years ended December 31, 2022 and 2021 were as follows:
| For the year ended December 31, | ||||||||||||||||||||||||
| 2022 | 2021 | Variation | For the year ended December 31, | |||||||||||||||||||||
| 2022 | 2021 | Variation | ||||||||||||||||||||||
| (in millions of US$) | % | (in millions of U.S. Dollars, unless otherwise indicated) | % | |||||||||||||||||||||
Subscription cost | (41.4 | ) | (38.4 | ) | 7.8 | % | (41.4 | ) | (38.4 | ) | 7.8 | % | ||||||||||||
Services cost | (11.4 | ) | (11.2 | ) | 1.8 | % | (11.4 | ) | (11.2 | ) | 1.8 | % | ||||||||||||
|
|
| ||||||||||||||||||||||
Total costs | (52.8 | ) | (49.6 | ) | 6.5 | % | (52.8 | ) | (49.6 | ) | 6.5 | % | ||||||||||||
|
|
| ||||||||||||||||||||||
Total cost for the year ended December 31, 2022 increased by US$3.2 million, or 6.5%, to US$52.8 million in 2022 from US$49.6 million in 2021, principally due to an increase in IT and hosting expenses, which increased by US$1.9 million, or 6.8%, to US$29.2 million in 2022 from US$27.4 million in 2021 given the increased number of online stores and GMV processed on our platform and an increase in expenses related to compensation of our infrastructure team.
87
Gross profit
As a result of the above, our gross profit increased by US$28.6 million, or 37.5% to US$104.8 million in 2022 from US$76.2 million in 2021. As a percentage of our total revenue, our gross profit increased to 66.5% in 2022 from 60.6% in 2021, mainly due to operational hosting cost efficiencies.
Operating expenses
General and administrative
General and administrative expenses during the years ended December 31, 2022 and 2021 were as follows:
| For the year ended December 31, | ||||||||||||||||||||||||
| 2022 | 2021 | Variation | For the year ended December 31, | |||||||||||||||||||||
| 2022 | 2021 | Variation | ||||||||||||||||||||||
| (in millions of US$, except as otherwise provided) | % | (in millions of U.S. Dollars, unless otherwise indicated) | % | |||||||||||||||||||||
General and administrative | (28.3 | ) | (31.9 | ) | (11.3 | )% | (28.3 | ) | (31.9 | ) | (11.3 | )% | ||||||||||||
Percentage of total revenue | 18.0 | % | 25.4 | % | 18.0 | % | 25.4 | % | — | |||||||||||||||
Our general and administrative expenses decreased by US$3.5 million in 2022, or 11.3%, to US$28.3 million in 2022, from US$31.9 million in 2021, primarily due to the decrease in outsourcing expenses as a result of the non-recurrence in 2022 of expenses with IPO readiness services and the decrease in expenses related to share-based compensation.
88
Sales and marketing
Sales and marketing expenses during the years ended December 31, 2022 and 2021 were as follows:
| For the year ended December 31, | ||||||||||||||||||||||||
| 2022 | 2021 | Variation | For the year ended December 31, | |||||||||||||||||||||
| 2022 | 2021 | Variation | ||||||||||||||||||||||
| (in millions of US$, except as otherwise provided) | % | (in millions of U.S. Dollars, unless otherwise indicated) | % | |||||||||||||||||||||
Sales and marketing | (67.8 | ) | (63.5 | ) | 6.8 | % | (67.8 | ) | (63.5 | ) | 6.8 | % | ||||||||||||
Percentage of total revenue | 43.0 | % | 50.5 | % | 43.0 | % | 50.5 | % | — | |||||||||||||||
Our sales and marketing expenses increased by US$4.3 million, or 6.8%, to US$67.8 million in 2022 from US$63.5 million in 2021, primarily due to the investments we made in the first half of 2022, partially offset by the reduction of our Sales and Marketing headcount, made during the second half of 2022. Although our Sales and Marketing workforce decreased, we will continue to invest in new regions in the Latin America region, such as Mexico, as well as other geographies, including Europe and the United States.
Research and development
Research and development expenses during the years ended December 31, 2022 and 2021 were as follows:
| For the year ended December 31, | ||||||||||||||||||||||||
| 2022 | 2021 | Variation | For the year ended December 31, | |||||||||||||||||||||
| 2022 | 2021 | Variation | ||||||||||||||||||||||
| (in millions of US$, except as otherwise provided) | % | (in millions of U.S. Dollars, unless otherwise indicated) | % | |||||||||||||||||||||
Research and development | (57.2 | ) | (45.2 | ) | 26.5 | % | (57.2 | ) | (45.2 | ) | 26.5 | % | ||||||||||||
Percentage of total revenue | 36.3 | % | 35.9 | % | 36.3 | % | 35.9 | % | — | |||||||||||||||
Our research and development expenses increased by US$12.0 million, or 26.5%, to US$57.2 million in 2022 from US$45.2 million in 2021, primarily due to the investments we made in the first half of the 2022, partially offset by the reduction of our R&D headcount, made during the second half of 2022.
88
Financial result, net
The components of our financial result during the years ended December 31, 2022 and 2021 were as follows:
| For the year ended December 31, | ||||||||||||||||||||||||
| 2022 | 2021 | Variation | For the year ended December 31, | |||||||||||||||||||||
| 2022 | 2021 | Variation | ||||||||||||||||||||||
| (in millions of US$) | % | (in millions of U.S. Dollars, unless otherwise indicated) | % | |||||||||||||||||||||
Finance income | 23.8 | 7.4 | 221.0 | % | 23.8 | 7.4 | 221.0 | % | ||||||||||||||||
Finance expense | (31.4 | ) | (12.0 | ) | 160.8 | % | (31.4 | ) | (12.0 | ) | 160.8 | % | ||||||||||||
|
|
| ||||||||||||||||||||||
Finance result, net | (7.6 | ) | (4.6 | ) | 64.3 | % | (7.6 | ) | (4.6 | ) | 64.3 | % | ||||||||||||
|
|
| ||||||||||||||||||||||
Our finance result decreased by US$3.0 million, or 64.3%, to an expense of US$7.6 million in 2022 from an expense of US$4.6 million in 2021, as a result of the following:
Financial income
Financial income increased by US$16.4 million, or 221.0%, to US$23.8 million in 2022 from US$7.4 million in 2021, mainly due to (1) an increase in marketable securities and short term investments gains to US$9.1 million in December 31, 2022 from US$1.6 million in December 31, 2021; (2) an increase in gains from fair value of financial instruments to US$4.8 million in December 31, 2022 from US$2.3 million in December 31, 2021 and; (3) an increase in foreign exchange gains to US$7.3 million in December 31, 2022 from US$3.0 million in December 31, 2021.
89
Financial expense
Our financial expense increased by US$19.3 million, or 160.8%, to US$31.4 million in 2022 from US$12.0 million in 2021, mainly due to (1) mark-to-market losses given rising interest rates affected our cash, marketable securities and short-term investments; (2) an increase in foreign exchange losses to US$8.5 million in December 31, 2022 from US$4.2 million in December 31, 2021, and; (3) an increase in the adjustment of hyperinflation to US$5.2 million in December 31, 2022 from US$2.3 million in December 31, 2021.
Income tax
Our income tax income decreased by US$5.4 million, to an income of US$4.0 million in 2022 from an income of US$9.5 million in 2021, primarily attributable to lower amount of deferred tax assets booked inwith respect to certain tax loss carried forward and temporary differences.
Net loss for the year
As a result of the above, our net loss amounted to US$52.4 million in 2022, compared to US$60.5 million in 2021.
Comparison of Results of Operations for the Years Ended December 31, 2021 and 2020
The following table sets forth our consolidated statements of profit or loss for the years ended December 31, 2021 and 2020. The period-to-period comparison of financial results is not necessarily indicative of future results.
89
| For the year ended December 31, | ||||||||||||
| 2021 | 2020 | Variation | ||||||||||
| (in millions of US$) | % | |||||||||||
Subscription revenue | 118.5 | 93.4 | 26.9 | % | ||||||||
Services revenue | 7.3 | 5.3 | 37.7 | % | ||||||||
Total revenue | 125.8 | 98.7 | 27.5 | % | ||||||||
Subscription cost(1) | (38.4 | ) | (27.8 | ) | 38.1 | % | ||||||
Services cost(1) | (11.2 | ) | (7.1 | ) | 57.7 | % | ||||||
Total cost | (49.6 | ) | (34.9 | ) | 42.1 | % | ||||||
Gross Profit | 76.2 | 63.8 | 19.4 | % | ||||||||
Operating Expenses | ||||||||||||
General and administrative(1) | (31.9 | ) | (14.0 | ) | 127.9 | % | ||||||
Sales and marketing(1) | (63.5 | ) | (23.8 | ) | 166.8 | % | ||||||
Research and development(1) | (45.2 | ) | (19.0 | ) | 137.9 | % | ||||||
Other losses | (1.5 | ) | (0.5 | ) | 200.0 | % | ||||||
Income (loss) from operations | (65.9 | ) | 6.5 | n/a | ||||||||
Financial result, net | (4.6 | ) | (3.1 | ) | 48.4 | % | ||||||
Equity results | 0.6 | 0.1 | 500.0 | % | ||||||||
Income (loss) before income taxes | (70.0 | ) | 3.5 | n/a | ||||||||
Income tax | 9.5 | (4.3 | ) | (320.9 | )% | |||||||
Net loss for the year | (60.5 | ) | (0.8 | ) | n/a | |||||||
|
| For the year ended December 31, | ||||||||
| 2021 | 2020 | |||||||
| (in millions of US$) | ||||||||
Subscription cost | (0.7 | ) | (0.1 | ) | ||||
Services cost | (0.4 | ) | (0.1 | ) | ||||
General and administrative | (7.1 | ) | (1.0 | ) | ||||
Sales and marketing | (5.5 | ) | (1.0 | ) | ||||
Research and development | (5.9 | ) | (1.1 | ) | ||||
|
|
|
| |||||
Total stock-based compensation | (19.6 | ) | (3.3 | ) | ||||
|
|
|
| |||||
Total revenue
The components of our total revenue during the years ended December 31, 2021 and 2020 were as follows:
| For the year ended December 31, | ||||||||||||
| 2021 | 2020 | Variation | ||||||||||
| (in millions of US$) | % | |||||||||||
Subscription revenue | 118.5 | 93.4 | 26.9 | % | ||||||||
Services revenue | 7.3 | 5.3 | 37.7 | % | ||||||||
|
|
|
|
|
| |||||||
Total revenue | 125.8 | 98.7 | 27.5 | % | ||||||||
|
|
|
|
|
| |||||||
Total revenue for the year ended December 31, 2021 was U$125.8 million, an increase of US$27.1 million, or 27.5% (on a non-FX neutral basis) or 29.8% (on an FX neutral basis), from US$98.7 million in 2020. The increase in total revenue was primarily driven by: (1) an increase in GMV of 29.1% (on a non-FX neutral basis) or 31.1% (on an FX neutral basis) to US$9.7 billion in 2021, from US$7.5 billion in 2020, which also resulted in higher revenues from transaction-based fees as percentage of total subscription revenues; (2) an increase of 25.3% in the number of active online stores using our platform during the year which we believe is mainly attributable to the impacts of the increased penetration of ecommerce accelerating the digitalization plan of enterprises as a result of changing end-consumer purchase behavior (to favor online purchases); and (3) the expansion of our operations outside of Brazil. The increase was partially offset by exchange rate effects resulting from the appreciation of the U.S. Dollar against the currencies of the principal countries in which we operate, mostly in Brazil.
90
Total cost
The components of our total cost during the years ended December 31, 2021 and 2020 were as follows:
| For the year ended December 31, | ||||||||||||
| 2021 | 2020 | Variation | ||||||||||
| (in millions of US$) | % | |||||||||||
Subscription cost | (38.4 | ) | (27.8 | ) | 38.1 | % | ||||||
Services cost | (11.2 | ) | (7.1 | ) | 57.7 | % | ||||||
|
|
|
|
|
| |||||||
Total costs | (49.6 | ) | (34.9 | ) | 42.1 | % | ||||||
|
|
|
|
|
| |||||||
Total cost for the year ended December 31, 2021 increased by US$14.7 million, or 42.1%, to US$49.6 million in 2021 from US$34.9 million in 2020, principally due to (1) an increase in IT and hosting expenses, which increased by US$8.0 million, or 41.5%, to US$27.4 million in 2021 from US$19.4 million in 2020 given the increased number of online stores and GMV processed on our platform; (2) an increase in personnel expenses, which increased by US$3.0 million, or 27.7%, to US$13.7 million in 2021 from US$10.7 million in 2020 to support our growth, which was partially offset by exchange rate effects resulting from the appreciation of the U.S. Dollar against the currencies of the principal countries in which we operate, mainly in Brazil.
Gross profit
As a result of the above, our gross profit increased by US$12.4 million, or 19.4% to US$76.2 million in 2021 from US$63.8 million in 2020. As a percentage of our total revenue, our gross profit decreased to 60.6% in 2021 from 64.7% in 2020, mainly due to the increase in hosting costs, impacting the subscription gross profit.
Operating expenses
General and administrative
General and administrative expenses during the years ended December 31, 2021 and 2020 were as follows:
| For the year ended December 31, | ||||||||||||
| 2021 | 2020 | Variation | ||||||||||
| (in millions of US$, except as otherwise provided) | % | |||||||||||
General and administrative | (31.9 | ) | (14.0 | ) | 127.9 | % | ||||||
Percentage of total revenue | 25.4 | % | 14.1 | % | — | |||||||
Our general and administrative expenses increased by US$17.9 million in 2021, or 127.9%, to US$31.9 million in 2021, from US$14.0 million in 2020, primarily due to the increase in personnel expenses as our general and administrative workforce increased to 245 employees in 2021 from 192 employees in 2020 to support our growth globally.
Sales and marketing
Sales and marketing expenses during the years ended December 31, 2021 and 2020 were as follows:
| For the year ended December 31, | ||||||||||||
| 2021 | 2020 | Variation | ||||||||||
| (in millions of US$, except as otherwise provided) | % | |||||||||||
Sales and marketing | (63.5 | ) | (23.8 | ) | 166.8 | % | ||||||
Percentage of total revenue | 50.5 | % | 24.2 | % | — | |||||||
Our sales and marketing expenses increased by US$39.7 million, or 166.8%, to US$63.5 million in 2021 from US$23.8 million in 2020, primarily due to personnel expenses as our sales and marketing workforce increased to 553 employees in 2021 from 262 employees in 2020 to support our growth. We invested mainly in new regions in the Latin America region, such as Colombia and Mexico, as well as other geographies, including Europe and the United States.
91
Research and development
Research and development expenses during the years ended December 31, 2021 and 2020 were as follows:
| For the year ended December 31, | ||||||||||||
| 2021 | 2020 | Variation | ||||||||||
| (in millions of US$, except as otherwise provided) | % | |||||||||||
Research and development | (45.2 | ) | (19.0 | ) | 137.9 | % | ||||||
Percentage of total revenue | 35.9 | % | 19.3 | % | — | |||||||
Our research and development expenses increased by US$26.1 million, or 137.9%, to US$45.2 million in 2021 from US$19.0 million in 2020, primarily due to the increase in personnel expenses as our research and development workforce increased to 592 employees in 2021 from 375 employees in 2020 to support our growth, and the increase in certain other employee-related expenses.
Financial result, net
The components of our financial result during the years ended December 31, 2021 and 2020 were as follows:
| For the year ended December 31, | ||||||||||||
| 2021 | 2020 | Variation | ||||||||||
| (in millions of US$) | % | |||||||||||
Finance income | 7.4 | 3.9 | 89.7 | % | ||||||||
Finance expense | (12.0 | ) | (7.0 | ) | 71.4 | % | ||||||
|
|
|
|
|
| |||||||
Finance result, net | (4.6 | ) | (3.1 | ) | 48.4 | % | ||||||
|
|
|
|
|
| |||||||
Our finance result decreased by US$1.5 million, or 48.4%, to an expense of US$4.6 million in 2021 from an expense of US$3.1 million in 2020, as a result of the following:
Financial income
Financial income increased by US$3.5 million, or 89.7%, to US$7.4 million in 2021 from US$3.9 million in 2020, primarily due to an increase in gains from fair value of derivative financial instruments to US$2.3 million in December 31, 2021 from US$0.2 million in December 31, 2020, which was partially offset by losses from fair value of derivative financial instruments as detailed below.
Financial expense
Our financial expense increased by US$5.0 million, or 71.4%, to US$12.0 million in 2021 from US$7.0 million in 2020, primarily due to (1) an increase in adjustment of hyperinflation to US$2.3 million from US$0.8 million; and (2) an increase in losses from fair value of derivative financial instruments to US$2.5 million in December 31, 2021 from US$0.6 million in December 31, 2020, which was partially offset by gains from fair value of derivative financial instruments as detailed above.
Income tax
Our income tax expense decreased by US$13.8 million, to an income of US$9.5 million in 2021 from an expense of US$4.3 million in 2020, primarily attributable to the loss position experienced in 2021 and the booking of deferred tax assets in respect to certain tax loss carried forward. The effect of minor income tax expenses accrued in 2021 was offset by a higher deferred tax asset recognized.
92
Net loss for the year
As a result of the above, our net loss amounted to US$60.5 million in 2021, compared to US$0.8 million in 2020.
Reconciliation of Non-GAAP Financial Measures
This annual report presents certain non-GAAP financial measures, which are not recognized under IFRS Accounting Standards, specifically Free Cash Flow and FX Neutral measures. These non-GAAP financial measures are used by our management for decision-making purposes and to assess our financial and operating performance, generate future operating plans and make strategic decisions regarding the allocation of capital. For additional information on our Non-GAAP measures see “Part I—Introduction—Special Note Regarding Non-GAAP Financial Measures.”
Free Cash Flow
The following table presents a reconciliation of our Free Cash Flow to Net cash provided by operating activities for the following periods:
| For the year ended December 31, | ||||||||||||||||||||||||
| 2022 | 2021 | 2020 | For the year ended December 31, | |||||||||||||||||||||
| 2023 | 2022 | 2021 | ||||||||||||||||||||||
| (in US$ millions) | (in millions of U.S. Dollars, unless otherwise indicated) | |||||||||||||||||||||||
| Net cash provided by (used in) operating activities | (29.2) | (53.0) | 11.2 | 4.3 | (29.2 | ) | (53.0 | ) | ||||||||||||||||
Acquisition of intangibles related to acquisitions | — | (0.4 | ) | — | — | — | (0.4 | ) | ||||||||||||||||
Acquisitions of property and equipment | (0.3 | ) | (1.4 | ) | (1.6 | ) | (0.5 | ) | (0.3 | ) | (1.4 | ) | ||||||||||||
|
|
| ||||||||||||||||||||||
Free Cash Flow | (29.5 | ) | (54.8 | ) | 9.6 | 3.8 | (29.5 | ) | (54.8 | ) | ||||||||||||||
|
|
| ||||||||||||||||||||||
90
FX Neutral measures
The following tables set forth selected income statement line items on an FX Neutral basis for the years ended December 31, 2023, 2022 2021 and 2020:2021:
| For the year ended December 31, | ||||||||||||||||||||||||
| As reported | On an FX Neutral basis(1) | |||||||||||||||||||||||
| 2022 | 2021 | % variation | 2022 | 2021 | % variation | |||||||||||||||||||
| (in US$ millions except as otherwise indicated) | ||||||||||||||||||||||||
Subscription revenue | 148.5 | 118.5 | 25.3 | % | 144.0 | 118.5 | 21.6 | % | ||||||||||||||||
Services revenue | 9.1 | 7.3 | 24.7 | % | 9.7 | 7.3 | 33.2 | % | ||||||||||||||||
Total revenue | 157.6 | 125.8 | 25.3 | % | 153.8 | 125.8 | 22.3 | % | ||||||||||||||||
Subscription cost | (41.4 | ) | (38.4 | ) | 7.8 | % | (41.7 | ) | (38.4 | ) | 8.8 | % | ||||||||||||
Services cost | (11.4 | ) | (11.2 | ) | 1.8 | % | (11.9 | ) | (11.2 | ) | 6.5 | % | ||||||||||||
Total cost | (52.8 | ) | (49.6 | ) | 6.5 | % | (53.7 | ) | (49.6 | ) | 8.2 | % | ||||||||||||
Gross profit | 104.8 | 76.2 | 37.5 | % | 100.1 | 76.2 | 31.4 | % | ||||||||||||||||
Operating expenses | (154.7 | ) | (142.1 | ) | 8.9 | % | (154.5 | ) | (142.1 | ) | 8.7 | % | ||||||||||||
|
|
|
|
|
|
|
|
|
|
|
| |||||||||||||
Loss from operation | (49.9 | ) | (65.9 | ) | (24.3 | )% | (54.4 | ) | (65.9 | ) | (17.5 | )% | ||||||||||||
|
|
|
|
|
|
|
|
|
|
|
| |||||||||||||
93
| For the year ended December 31, | ||||||||||||||||||||||||
| As reported | On an FX Neutral basis(1) | |||||||||||||||||||||||
| 2021 | 2020 | % variation | 2021 | 2020 | % variation | |||||||||||||||||||
| (in US$ millions except as otherwise indicated) | ||||||||||||||||||||||||
Subscription revenue | 118.5 | 93.4 | 26.9 | % | 120.7 | 93.4 | 29.2 | % | ||||||||||||||||
Services revenue | 7.3 | 5.3 | 37.7 | % | 7.4 | 5.3 | 39.4 | % | ||||||||||||||||
|
|
|
|
|
|
|
|
|
|
|
| |||||||||||||
Total revenue | 125.8 | 98.7 | 27.5 | % | 128.1 | 98.7 | 29.8 | % | ||||||||||||||||
Subscription cost | (38.4 | ) | (27.8 | ) | 38.1 | % | (38.4 | ) | (27.8 | ) | 38.3 | % | ||||||||||||
Services cost | (11.2 | ) | (7.1 | ) | 57.7 | % | (11.1 | ) | (7.1 | ) | 56.9 | % | ||||||||||||
|
|
|
|
|
|
|
|
|
|
|
| |||||||||||||
Total cost | (49.6 | ) | (34.9 | ) | 42.1 | % | (49.5 | ) | (34.9 | ) | 42.0 | % | ||||||||||||
|
|
|
|
|
|
|
|
|
|
|
| |||||||||||||
Gross profit | 76.2 | 63.8 | 19.4 | % | 78.5 | 63.8 | 23.1 | % | ||||||||||||||||
Operating expenses | (142.1 | ) | (57.3 | ) | 148.0 | % | (141.8 | ) | (57.3 | ) | 147.4 | % | ||||||||||||
|
|
|
|
|
|
|
|
|
|
|
| |||||||||||||
Income (loss) from operation | (65.9 | ) | 6.5 | — | (63.2 | ) | 6.5 | n/a | ||||||||||||||||
|
|
|
|
|
|
|
|
|
|
|
| |||||||||||||
| For the year ended December 31, | ||||||||||||||||||||||||
| As reported | On an FX Neutral basis(1) | |||||||||||||||||||||||
| 2023 | 2022 | % variation | 2023 | 2022 | % variation | |||||||||||||||||||
| (in US$ millions except as otherwise indicated) | ||||||||||||||||||||||||
Subscription revenue | 190.3 | 148.5 | 28.2 | % | 184.0 | 148.5 | 23.9 | % | ||||||||||||||||
Services revenue | 11.2 | 9.1 | 22.6 | % | 11.0 | 9.1 | 20.3 | % | ||||||||||||||||
Total revenue | 201.5 | 157.6 | 27.8 | % | 195.0 | 157.6 | 23.7 | % | ||||||||||||||||
Gross profit | 140.6 | 104.8 | 34.1 | % | 134.7 | 104.8 | 28.5 | % | ||||||||||||||||
Loss from operation | (14.6 | ) | (49.9 | ) | (70.7 | )% | (17.3 | ) | (49.9 | ) | (65.4 | )% | ||||||||||||
| 2022 | 2021 | % variation | 2022 | 2021 | % variation | |||||||||||||||||||
| (in US$ millions except as otherwise indicated) | ||||||||||||||||||||||||
Subscription revenue | 148.5 | 118.5 | 25.3 | % | 144.0 | 118.5 | 21.6 | % | ||||||||||||||||
Services revenue | 9.1 | 7.3 | 24.7 | % | 9.7 | 7.3 | 33.2 | % | ||||||||||||||||
Total revenue | 157.6 | 125.8 | 25.3 | % | 153.8 | 125.8 | 22.3 | % | ||||||||||||||||
Gross profit | 104.8 | 76.2 | 37.5 | % | 100.1 | 76.2 | 31.4 | % | ||||||||||||||||
Loss from operation | (49.9 | ) | (65.9 | ) | (24.3 | )% | (54.4 | ) | (65.9 | ) | (17.5 | )% | ||||||||||||
| (1) | We calculate FX Neutral measures by using the average monthly exchange rates for each month during |
The following tables set forth the average of monthly exchange rates vis-à-vis the U.S. dollar for the years ended December 31, 2023, 2022 and 2021:
| For the year ended December 31, | ||||||||||||||||||||||||||||||||||||
| 2023 | 2022 | 2021 | ||||||||||||||||||||||||||||||||||
| High(1) | Low(2) | Average(3) | High(1) | Low(2) | Average(3) | High(1) | Low(2) | Average(3) | ||||||||||||||||||||||||||||
| (to 1.00 US$) | ||||||||||||||||||||||||||||||||||||
Argentinean peso(4) | 808.5 | 186.9 | 317.1 | 177.1 | 105.0 | 133.6 | 102.7 | 8.5 | 47.0 | |||||||||||||||||||||||||||
Brazilian reais | 5.2 | 4.8 | 5.0 | 5.5 | 4.8 | 5.2 | 5.7 | 5.0 | 5.4 | |||||||||||||||||||||||||||
British pound | 0.8 | 0.8 | 0.8 | 0.9 | 0.7 | 0.8 | 0.8 | 0.7 | 0.7 | |||||||||||||||||||||||||||
Chilean peso | 925.6 | 797.8 | 839.7 | 956.6 | 798.3 | 873.1 | 850.3 | 707.8 | 759.9 | |||||||||||||||||||||||||||
Colombian peso | 4,809.4 | 3,943.3 | 4,319.9 | 4,918.2 | 3,797.9 | 4255.3 | 3,967.5 | 3,502.6 | 3,745.9 | |||||||||||||||||||||||||||
Euro | 0.9 | 0.9 | 0.9 | 1.0 | 0.9 | 1.0 | 0.9 | 0.8 | 0.8 | |||||||||||||||||||||||||||
Mexican peso | 19.0 | 16.9 | 17.7 | 20.5 | 19.5 | 20.1 | 20.9 | 19.9 | 20.3 | |||||||||||||||||||||||||||
Peruvian sol | 3.8 | 3.6 | 3.7 | 4.0 | 3.7 | 3.8 | 4.1 | 3.6 | 3.9 | |||||||||||||||||||||||||||
Romanian leu | 4.7 | 4.5 | 4.6 | 5.0 | 4.4 | 4.7 | 4.4 | 4.0 | 4.2 | |||||||||||||||||||||||||||
| (1) | High Average Monthly Exchange Rate is based on the highest average monthly exchange rate (i.e. the exchange rate on the closing of each day during any given month) of any given fiscal year, except with respect to Argentina, where the High Average Monthly Exchange Rate is based on the highest exchange rate reported on the last calendar day of any given month. See note 2.25 to our consolidated financial statements. |
| (2) | Low Average Monthly Exchange Rate is based on the lowest average monthly exchange rate of any given fiscal year (i.e. the exchange rate on the closing of each day during any given month), except with respect to Argentina, where the Low Average Monthly Exchange Rate is based on the lowest exchange rate reported on the last calendar day of any given month. See note 2.25 to our consolidated financial statements. |
| (3) | The Average of Average Monthly Exchange Rates is calculated by the sum of Average Monthly Exchange Rates of any given fiscal year divided by twelve, except with respect to Argentina, where the Average of Average Monthly Exchange Rate is based on the average exchange rate reported on the last calendar day of any given month, in accordance with the guidance of IAS 29. See note 2.25 to our consolidated financial statements. |
| (4) | The monthly inflation in Argentina during the specified period 2023 and 2022, ranged between 6.0% and 25.5%, with a monthly average of 10.0% and between 3.9%, and 7.4%, with a monthly average of 5.7%, respectively. |
91
| B. | Liquidity and Capital Resources |
The following discussion of our liquidity and capital resources is based on the financial information derived from our consolidated financial statements included elsewhere in this annual report.
Liquidity
Our cash and cash equivalents include cash on hand, immediate demand deposits with financial institutions and other short-term highly liquid investments, which have an immaterial risk of change in value. As of December 31, 20222023 and December 31, 2021,2022, our cash and cash equivalents amounted to US$24.428.0 million and US$121.024.4 million, respectively.
We regularly evaluate opportunities to enhance our financial flexibility through a variety of methods, including, without limitation, through loans and financing. As a result of any of these actions, we may be subject to restrictions and covenants in the agreements governing these transactions that may place limitations on us, and we may be required to pledge collateral to secure such instruments. See “—Indebtedness” for additional information.
We intend to slightly increase our capital expenditures to support the growth in our business and operations. We believe that our existing cash and cash equivalents and the liquidity provided from other sources of funds will be sufficient to meet our anticipated cash needs for at least the next 12 months, considering organic growth, including the working capital necessary for our present requirements. However, our liquidity assumptions may prove to be incorrect, and we could exhaust our available financial resources sooner than we currently expect. We may seek to raise additional funds at any time through equity, equity-linked or debt financing arrangements. Our future capital requirements and the adequacy of available funds will depend on many factors, including those described in “Item 3. Key Information—D. Risk Factors.” We may not be able to secure additional financing to meet our operating requirements on acceptable terms, or at all.
As of December 31, 2022,2023, we did not have any off-balance sheet arrangements.
94
Consolidated Statements of Cash Flows
The following table sets forth certain consolidated cash flow information for the periods indicated:
| For the Year Ended December 31, | ||||||||||||||||||||||||
| 2022 | 2021 | 2020 | For the Year Ended December 31, | |||||||||||||||||||||
| 2023 | 2022 | 2021 | ||||||||||||||||||||||
| (in millions of US$) | (in millions of U.S. Dollars, unless otherwise indicated) | |||||||||||||||||||||||
Net cash provided by (used in) operating activities | (29.2 | ) | (53.0 | ) | 11.2 | 4.3 | (29.2 | ) | (53.0 | ) | ||||||||||||||
Net cash used in investing activities | (43.4 | ) | (166.8 | ) | (6.1 | ) | ||||||||||||||||||
Net cash provided by (used in) investing activities | 38.4 | (43.4 | ) | (166.8 | ) | |||||||||||||||||||
Net cash provided by (used in) financing activities | (19.6 | ) | 283.7 | 25.0 | (38.4 | ) | (19.6 | ) | 283.7 | |||||||||||||||
Increase (decrease) in cash and cash equivalents | (92.2 | ) | 63.9 | 30.0 | ||||||||||||||||||||
Net increase (decrease) in cash and cash equivalents | 4.3 | (92.2 | ) | 63.9 | ||||||||||||||||||||
Net cash provided by (used in) operating activities
For the year ended December 31, 2023, net cash provided by operating activities amounted to US$4.3 million when compared to US$29.2 million of net cash used in operating activities in the year ended December 31, 2022, primarily as a result of:
a decrease in net loss of the year to US$13.7 million for the year ended December 31, 2023, from a net loss of the year of US$52.4 million for the year ended December 31, 2022;
92
changes in operating liabilities which consisted mainly of US$6.9 million increase in deferred revenue for the year ended December 31, 2023, compared to an increase of US$1.2 million for the year ended December 31, 2022, and a increase in taxes payable in the amount of US$7.3 million for the year ended December 31, 2023, compared to an decrease of US$1.5 million for the year ended December 31, 2022;
partially offset by changes in operating assets which consisted mainly of an increase in trade receivables in the amount of US$13.1 million for the year ended December 31, 2023, compared to an increase of US$3.6 million for the year ended December 31, 2022, and an increase in prepaid expenses in the amount of US$0.6 million for the year ended December 31, 2023, compared to a decrease of US$3.9 million for the year ended December 31, 2022.
For the year ended December 31, 2022, net cash used in operating activities decreased by US$23.8 million to US$29.2 million of net cash used in operating activities in the year ended December 31, 2022 from US$53.0 million of net cash used by operating activities in the year ended December 31, 2021, primarily as a result of:
a decrease in net loss of the year to US$52.4 million for the year ended December 31, 2022, from a net loss of the year of US$60.5 million for the year ended December 31, 2021;
changes in operating assets which consisted mainly of an increase in trade receivables in the amount of US$3.6 million for the year ended December 31, 2022, compared to an increase of US$16.7 million for the year ended December 31, 2021, and a decrease in prepaid expenses in the amount of US$3.9 million for the year ended December 31, 2022, compared to an increase of US$2.7 million for the year ended December 31, 2021. This was partially offset by:
Changes in operating liabilities which consisted mainly of US$1.2 million increase in deferred revenue for the year ended December 31, 2022, compared to an increase of US$12.3 million for the year ended December 31, 2021, and a decrease in taxes payable in the amount of US$1.5 million for the year ended December 31, 2022, compared to an increase of US$3.1 million for the year ended December 31, 2021.
For the year ended December 31, 2021, net cash used in operating activities changed by US$64.2 million to US$53.0 million of net cash used in operating activities in the year ended December 31, 2021 from US$11.2 million of net cash provided by operating activities in the year ended December 31, 2020, primarily as a result of:
working capital adjustments which consisted mainly of: (1) an increase of trade receivables in the amount of US$16.7 million for the year ended December 31, 2021, compared to an increase of US$10.1 million for the year ended December 31, 2020; and (2) an increase in deferred revenue in the amount of US$12.3 million for the year ended December 31, 2021, compared to an increase of US$9.6 million for the year ended December 31, 2020; and
(1) an increase in net loss of the year to US$60.5 million for the year ended December 31, 2021, from a net loss of the year of US$0.8 million for the year ended December 31, 2020, primarily due to the expansion of our workforce.
Net cash provided by (used in) investing activities
For the year ended December 31, 2023, net cash provided by investing activities amounted to US$38.4 million in the year ended December 31, 2023, from a net cash used in investing activities of US$43.4 million in the year ended December 31, 2022.The change in net cash from investing activities is primarily attributable to an increase in the redemption of short-term investment to US$171.2 million for the year ended December 31, 2023, from US$78.0 million for the year ended December 31, 2022, partially offset by an increase in the purchase of short and long term investment to US$135.4 million for the year ended December 31, 2023, from US$120.6 million for the year ended December 31, 2022.
For the year ended December 31, 2022, net cash used in investing activities decreased by US$123.4 million to US$43.4 million in the year ended December 31, 2022, from US$166.8 million in the year ended December 31, 2021, primarily as a result of (1) a decrease in the purchase of short term investment to US$111.6120.6 million for the year ended December 31, 2022, from US$177.8 million for the year ended December 31, 2021; and (2) an increase in the redemption of marketable securities and short-term investment to US$78.0 million for the year ended December 31, 2022, from US$17.9 million for the year ended December 31, 2021.
95
For the year ended December 31, 2021, net cash used in investing activities increased by US$160.7 million to US$166.8 million in the year ended December 31, 2021, from US$6.1 million in the year ended December 31, 2020, primarily as a result of (1) an increase in the amount of US$177.8 million in the purchase of short-term investments to US$177.8 million for the year ended December 31, 2021, from nil for the year ended December 31, 2020 (2) an increase in the amount of US$14.9 million in the redemption of marketable securities to US$16.9 million for the year ended December 31, 2021, from US$2.0 million for the year ended December 31, 2020, (3) a decrease in the amount of US$3.8 million in purchase of marketable securities to nil for the year ended December 31, 2021, from US$3.8 million for the year ended December 31, 2020, which was partially offset by an increase of US$2.1 million in the amounts invested in business combinations that resulted in an increase in the acquisition of subsidiaries net of cash acquired to US$5.7 million for the year ended December 31, 2021 from US$3.6 million for the year ended December 31, 2020.
Net cash provided by (used in) financing activities
Net cash used in financing activities amounted to US$38.4 million for the year ended December 31, 2023 from a net cash used in financing activities of US$19.6 million for the year ended December 31, 2022. The increase in net cash used in financing activities is primarily attributable to the increase in cash used to buyback shares, to US$35.2 million for the year ended on December 31, 2023 from US$12.8 million for the year ended on December 31, 2022, as part of our repurchase of shares program, partially offset by a decrease in payment of loans and financing to US$1.2 million for the year ended December 31, 2023, from US$2.7 million for the year ended December 31, 2022.
93
Net cash used in financing activities amounted to US$19.6 million for the year ended December 31, 2022 from a net cash provided by financing activities of US$283.7 million for the year ended December 31, 2021. The change in net cash from financing activities is primarily attributable to (1) decrease in equity raises, which decreased to nil for the year ended December 31, 2022 from US$296.3 million for the year ended December 31, 2021 as a result of the consummation of our initial public offering; and (2) increase in cash used to buyback shares, to US$12.8 million for the year ended on December 31, 2022 from US$2.4 million for the year ended on December 31, 2021, as part of our repurchase of shares program, partially offset by a decrease in payment of loans and financing to US$2.7 million for the year ended December 31, 2022, from US$10.9 million for the year ended December 31, 2021.
Net cash provided by financing activities increased by US$258.7 million, to US$283.7 million for the year ended December 31, 2021 from US$25.0 million for the year ended December 31, 2020. This increase is primarily attributable to: (1) an increase in the amounts raised from capital increases to US$297.3 million (including US$296.3 million of proceeds from initial public offering) for the year ended December 31, 2021 from US$156.7 million for the year ended December 31, 2020; (2) a decrease in the buyback of shares to US$2.4 million for the year ended December 31, 2021, compared to the amount of US$129.0 million in the year ended December 31, 2020; which was partially offset by an increase in the payment of loans and financing to US$10.9 million for the year ended December 31, 2021 from US$3.0 million for the year ended December 31, 2020.
Capital Expenditures
Our capital expenditures, consisting of purchase of intangibles and property and equipment, for the years ended December 31, 2023, 2022 2021 and 2020,2021, amounted to US$0.30.5 million, US$1.80.3 million and US$1.61.8 million, respectively, representing 0.2%, 1.4%0.2% and 1.7%1.4% of our total revenue for the years ended December 31, 2023, 2022 2021 and 2020,2021, respectively.
For 2023,2024, we expect to maintain the capital expenditures as a percentage of our total revenue in line with the ratios we delivered in 2022.2023. We expect to meet our capital expenditure needs for at least the next 12 months from our net cash provided by operating activities and our existing cash and cash equivalents. Our future capital requirements will depend on several factors, including those described in “Item 3. Key Information—D. Risk Factors.”
Indebtedness
WeAs of December 31, 2023 we had totalno outstanding indebtedness (consisting of loans and financings). We had total indebtedness in the amount of US$1.2 million, US$3.3 million and US$6.43.3 million as of December 31, 2022 2021 and 2020,2021, respectively. The decrease in indebtedness is primarily due to principal repayments to Itaú, Unibanco S.A, BNDES and Totvs S.A. which occurred in 2020, 2021, 2022 and in 2022.
96
The table below sets forth selected information regarding our material outstanding indebtedness as of December 31, 2022:
| ||||
| ||||
| ||||
| ||||
| ||||
BNDES Credit Facility
On March 13, 2017, we entered into a credit facility with BNDES, in the amount of R$15.6 million, to finance the development of new ecommerce technologies. The credit facility accrues interest at 8.5% per annum. Principal is repayable in 48 equal monthly installments, with an additional 25 months grace period. This credit facility is scheduled to mature on March 15, 2023 and is secured by a bank guarantee equivalent to 100% of the total borrowed amount.
Itaú Unibanco S.A. Working Capital Loan
On June 14, 2019, we entered into a working capital loan agreement with Itaú Unibanco S.A. in the amount of €6.9 million. On the same date, a swap was contracted to hedge against foreign exchange rate, converting the financial charges of the loan (1.77% per annum) into an effective annual rate of CDI + 2.65%, designating the financial instrument as fair value hedge. The hedge was also contracted with Itaú Unibanco S.A., where payments are due on quarterly basis, with the last installment maturing in May 2023.
Under the terms of the working capital loan agreement, we are required to comply with the following financial covenant:
Net debt/EBITDA ratio must be not less than:
2021: 1.2x; and
2022: 1x.
As of December 31, 2022 and 2021, we were in compliance with this covenant.
| C. | Research and Development, Patents and Licenses, etc. |
As of the date of this annual report, we had no issued patents and one patent application pending in the USA. We own approximately 122119 trademark registrations worldwide. As of December 31, 2022,2023, we owned approximately 5253 registered domain names in Brazil and 102103 outside of Brazil. We also have approximately 1511 pending trademark applications in Brazil as of the date of this annual report, 9293 pending trademarks applications outside of BrazilBrazil.
| D. | Trend Information |
Other than as disclosed elsewhere in this annual report, we are not aware of any other trends, uncertainties, demands, commitments or events for the year ended December 31, 20222023 that are reasonably likely to have a material and adverse effect on our net revenues, income, profitability, liquidity or capital resources, or that would cause the disclosed financial information to be not necessarily indicative of future results of operations or financial conditions.
97
Seasonality and Quarterly Unaudited Results of Operations
Due to our transaction-based subscription model, similar to most retail businesses, we experience seasonal fluctuations in our net sales and operating results. Historically, we have generated higher net sales in the fourth quarter, which includes the “Black November” period in Brazil (a commercial sales season, a month-long, introduced by Brazilian ecommerce websites in 2010 and equivalent to Black Friday in the United States) and
94
other ecommerce events in Latin American countries. The first quarter of the year is our slowest period, as the months of January, February and March correspond to vacation time in Brazil and other Latin American countries, and the first quarter is impacted by Carnival in Brazil. See “Item 3. Key Information—D. Risk Factors—Our operating results are subject to seasonal fluctuations.”
The following table sets forth our unaudited quarterly consolidated statement of profit or loss data for each of the last eight quarters of the period ended December 31, 2022.2023. The unaudited consolidated statement of profit or loss data below has been prepared on the same basis as the audited consolidated financial statements included elsewhere in this annual report on Form 20-F and, in our opinion, reflects all necessary adjustments, consisting only of ordinary course recurring adjustments, necessary to fairly and accurately state this information. These historical unaudited quarterly results of operations are not necessarily indicative of the results of operations for a full year or any future period. In particular, our quarterly results of operations have been positively affected by a significant growth in ecommerce sales in the markets in which we operate due to the widespread closure of brick-and-mortar stores and behavioral changes associated with social distancing as a result of the COVID-19 pandemic. This increase in sales has bolstered our total revenue, driven predominantly by increases in our customer sales and revenue. We believe that the expansion of ecommerce may normalize once the COVID-19 pandemic is sufficiently controlled, which may adversely affect our financial performance and operating metrics in the future. See below “—Impacts of the COVID-19 Pandemic.”
| For the Three Months ended (unaudited) | ||||||||||||||||||||||||||||||||
| March 31, 2021 | June 30, 2021 | September 30, 2021 | December 31, 2021 | March 31, 2022 | June 30, 2022 | September 30, 2022 | December 31, 2022 | |||||||||||||||||||||||||
| (in US$ millions) | ||||||||||||||||||||||||||||||||
Subscription revenue | 24.7 | 29.7 | 29.6 | 34.5 | 32.6 | 36.6 | 36.5 | 42.7 | ||||||||||||||||||||||||
Services revenue | 1.3 | 1.2 | 2.2 | 2.6 | 2.1 | 2.1 | 2.2 | 2.8 | ||||||||||||||||||||||||
|
|
|
|
|
|
|
|
|
|
|
|
|
|
|
| |||||||||||||||||
Total revenue | 25.9 | 30.9 | 31.9 | 37.1 | 34.7 | 38.7 | 38.8 | 45.5 | ||||||||||||||||||||||||
|
|
|
|
|
|
|
|
|
|
|
|
|
|
|
| |||||||||||||||||
Subscription cost | (8.7 | ) | (9.5 | ) | (9.7 | ) | (10.5 | ) | (10.0 | ) | (10.2 | ) | (9.8 | ) | (11.5 | ) | ||||||||||||||||
Services cost | (2.1 | ) | (2.8 | ) | (3.1 | ) | (3.3 | ) | (2.6 | ) | (2.8 | ) | (2.9 | ) | (3.1 | ) | ||||||||||||||||
|
|
|
|
|
|
|
|
|
|
|
|
|
|
|
| |||||||||||||||||
Total cost | (10.8 | ) | (12.2 | ) | (12.8 | ) | (13.8 | ) | (12.6 | ) | (13.0 | ) | (12.6 | ) | (14.6 | ) | ||||||||||||||||
|
|
|
|
|
|
|
|
|
|
|
|
|
|
|
| |||||||||||||||||
Gross profit | 15.1 | 18.7 | 19.1 | 23.4 | 22.1 | 25.7 | 26.1 | 30.9 | ||||||||||||||||||||||||
|
|
|
|
|
|
|
|
|
|
|
|
|
|
|
| |||||||||||||||||
Operating expenses | ||||||||||||||||||||||||||||||||
General and administrative | (7.2 | ) | (7.8 | ) | (9.9 | ) | (6.9 | ) | (6.9 | ) | (7.4 | ) | (6.9 | ) | (7.1 | ) | ||||||||||||||||
Sales and marketing | (11.0 | ) | (15.7 | ) | (19.3 | ) | (17.5 | ) | (17.9 | ) | (21.3 | ) | (16.2 | ) | (12.4 | ) | ||||||||||||||||
Research and development | (8.4 | ) | (10.7 | ) | (14.2 | ) | (11.9 | ) | (13.9 | ) | (15.4 | ) | (13.8 | ) | (14.1 | ) | ||||||||||||||||
Other income (losses) | (0.4 | ) | (0.9 | ) | 0.0 | (0.2 | ) | 0.0 | (0.5 | ) | (0.5 | ) | (0.4 | ) | ||||||||||||||||||
Loss from operation | (12.0 | ) | (16.4 | ) | (24.4 | ) | (13.1 | ) | (16.7 | ) | (18.9 | ) | (11.3 | ) | (3.0 | ) | ||||||||||||||||
|
|
|
|
|
|
|
|
|
|
|
|
|
|
|
| |||||||||||||||||
Financial result, net | (1.4 | ) | (1.4 | ) | (0.6 | ) | (1.4 | ) | (4.7 | ) | (5.4 | ) | (0.2 | ) | 2.7 | |||||||||||||||||
Equity results | 0.1 | 0.1 | 0.2 | 0.2 | 0.2 | 0.3 | 0.3 | 0.3 | ||||||||||||||||||||||||
|
|
|
|
|
|
|
|
|
|
|
|
|
|
|
| |||||||||||||||||
Income (loss) before income tax | (13.3 | ) | (17.6 | ) | (24.8 | ) | (14.3 | ) | (21.2 | ) | (24.1 | ) | (11.2 | ) | 0.0 | |||||||||||||||||
|
|
|
|
|
|
|
|
|
|
|
|
|
|
|
| |||||||||||||||||
Income tax | 0.8 | 2.1 | 2.8 | 3.7 | 2.1 | 2.6 | (0.3 | ) | (0.3 | ) | ||||||||||||||||||||||
|
|
|
|
|
|
|
|
|
|
|
|
|
|
|
| |||||||||||||||||
Net loss for the period | (12.5 | ) | (15.5 | ) | (22.0 | ) | (10.6 | ) | (19.1 | ) | (21.5 | ) | (11.5 | ) | (0.3 | ) | ||||||||||||||||
|
|
|
|
|
|
|
|
|
|
|
|
|
|
|
| |||||||||||||||||
98
| For the Three Months ended (unaudited) | ||||||||||||||||||||||||||||||||
| March 31, 2022 | June 30, 2022 | September 30, 2022 | December 31, 2022 | March 31, 2023 | June 30, 2023 | September 30, 2023 | December 31, 2023 | |||||||||||||||||||||||||
| (in millions of U.S. Dollars, unless otherwise indicated) | ||||||||||||||||||||||||||||||||
Subscription revenue | 32.6 | 36.6 | 36.5 | 42.7 | 39.8 | 44.8 | 47.5 | 58.2 | ||||||||||||||||||||||||
Services revenue | 2.1 | 2.1 | 2.2 | 2.8 | 2.5 | 3.1 | 3.1 | 2.5 | ||||||||||||||||||||||||
Total revenue | 34.7 | 38.7 | 38.8 | 45.5 | 42.3 | 47.9 | 50.6 | 60.7 | ||||||||||||||||||||||||
Subscription cost | (10.0 | ) | (10.2 | ) | (9.8 | ) | (11.5 | ) | (10.4 | ) | (11.2 | ) | (11.4 | ) | (12.5 | ) | ||||||||||||||||
Services cost | (2.6 | ) | (2.8 | ) | (2.9 | ) | (3.1 | ) | (4.2 | ) | (4.4 | ) | (3.6 | ) | (3.4 | ) | ||||||||||||||||
Total cost | (12.6 | ) | (13.0 | ) | (12.6 | ) | (14.6 | ) | (14.6 | ) | (15.5 | ) | (15.0 | ) | (15.9 | ) | ||||||||||||||||
Gross profit | 22.1 | 25.7 | 26.1 | 30.9 | 27.7 | 32.4 | 35.6 | 44.9 | ||||||||||||||||||||||||
Operating expenses | ||||||||||||||||||||||||||||||||
General and administrative | (6.9 | ) | (7.4 | ) | (6.9 | ) | (7.1 | ) | (7.9 | ) | (8.2 | ) | (8.4 | ) | (9.1 | ) | ||||||||||||||||
Sales and marketing | (17.9 | ) | (21.3 | ) | (16.2 | ) | (12.4 | ) | (14.8 | ) | (14.4 | ) | (15.1 | ) | (15.1 | ) | ||||||||||||||||
Research and development | (13.9 | ) | (15.4 | ) | (13.8 | ) | (14.1 | ) | (14.0 | ) | (16.3 | ) | (15.5 | ) | (14.3 | ) | ||||||||||||||||
Other income (losses) | 0.0 | (0.5 | ) | (0.5 | ) | (0.4 | ) | (0.8 | ) | (0.5 | ) | (0.1 | ) | (0.6 | ) | |||||||||||||||||
Income (loss) from operation | (16.7 | ) | (18.9 | ) | (11.3 | ) | (3.0 | ) | (9.7 | ) | (7.1 | ) | (3.5 | ) | 5.7 | |||||||||||||||||
Financial result, net | (4.7 | ) | (5.4 | ) | (0.2 | ) | 2.7 | 1.5 | 0.1 | 1.1 | 0.4 | |||||||||||||||||||||
Equity results | 0.2 | 0.3 | 0.3 | 0.3 | 0.3 | 0.4 | 0.3 | — | ||||||||||||||||||||||||
Income (loss) before income tax | (21.2 | ) | (24.1 | ) | (11.2 | ) | 0.0 | (7.9 | ) | (6.6 | ) | (2.1 | ) | 6.1 | ||||||||||||||||||
Income tax | 2.1 | 2.6 | (0.3 | ) | (0.3 | ) | (0.0 | ) | 0.0 | (0.3 | ) | (2.9 | ) | |||||||||||||||||||
Net income (loss) for the period | (19.1 | ) | (21.5 | ) | (11.5 | ) | (0.3 | ) | (7.9 | ) | (6.6 | ) | (2.4 | ) | 3.2 | |||||||||||||||||
The following table sets forth selected unaudited consolidated statements of profit or loss data for each of the periods indicated as a percentage of total revenue.
| For the Three Months ended (unaudited) | For the Three Months ended (unaudited) | |||||||||||||||||||||||||||||||||||||||||||||||||||||||||||||||
| March 31, 2021 | June 30, 2021 | September 30, 2021 | December 31, 2021 | March 31, 2022 | June 30, 2022 | September 30, 2022 | December 31, 2022 | March 31, 2022 | June 30, 2022 | September 30, 2022 | December 31, 2022 | March 31, 2023 | June 30, 2023 | September 30, 2023 | December 31, 2023 | |||||||||||||||||||||||||||||||||||||||||||||||||
Total revenue | 100.0 | % | 100.0 | % | 100.0 | % | 100.0 | % | 100.0 | % | 100.0 | % | 100.0 | % | 100.0 | % | 100.0 | % | 100.0 | % | 100.0 | % | 100.0 | % | 100.0 | % | 100.0 | % | 100.0 | % | 100.0 | % | ||||||||||||||||||||||||||||||||
|
|
|
|
|
|
|
| |||||||||||||||||||||||||||||||||||||||||||||||||||||||||
Subscription cost | (33.6 | )% | (30.6 | )% | (30.6 | )% | (28.2 | )% | (28.8 | )% | (26.4 | )% | (25.3 | )% | (25.3 | )% | (28.8 | )% | (26.4 | )% | (25.3 | )% | (25.3 | )% | (24.6 | )% | (23.3 | )% | (22.5 | )% | (20.5 | )% | ||||||||||||||||||||||||||||||||
Services cost | (8.1 | )% | (8.9 | )% | (9.6 | )% | (8.9 | )% | (7.5 | )% | (7.2 | )% | (7.5 | )% | (6.8 | )% | (7.5 | )% | (7.2 | )% | (7.5 | )% | (6.8 | )% | (9.9 | )% | (9.1 | )% | (7.2 | )% | (5.6 | )% | ||||||||||||||||||||||||||||||||
|
|
|
|
|
|
|
| |||||||||||||||||||||||||||||||||||||||||||||||||||||||||
Total cost | (41.8 | )% | (39.6 | )% | (40.1 | )% | (37.1 | )% | (36.3 | )% | (33.6 | )% | (32.5 | )% | (32.1 | )% | (36.3 | )% | (33.6 | )% | (32.5 | )% | (32.1 | )% | (34.4 | )% | (32.4 | )% | (29.7 | )% | (26.1 | )% | ||||||||||||||||||||||||||||||||
|
|
|
|
|
|
|
| |||||||||||||||||||||||||||||||||||||||||||||||||||||||||
Gross profit | 58.2 | % | 60.4 | % | 59.9 | % | 62.9 | % | 63.7 | % | 66.4 | % | 67.3 | % | 67.9 | % | 63.7 | % | 66.4 | % | 67.3 | % | 67.9 | % | 65.6 | % | 67.6 | % | 70.3 | % | 73.9 | % | ||||||||||||||||||||||||||||||||
Operating expenses | ||||||||||||||||||||||||||||||||||||||||||||||||||||||||||||||||
General and administrative | (27.9 | )% | (25.3 | )% | (31.2 | )% | (18.6 | )% | (19.9 | )% | (19.1 | )% | (17.8 | )% | (15.6 | )% | (19.9 | )% | (19.1 | )% | (17.8 | )% | (15.6 | )% | (18.7 | )% | (17.2 | )% | (16.5 | )% | (15.0 | )% | ||||||||||||||||||||||||||||||||
Sales and marketing | (42.6 | )% | (50.9 | )% | (60.7 | )% | (47.0 | )% | (51.6 | )% | (55.0 | )% | (41.8 | )% | (27.3 | )% | (51.6 | )% | (55.0 | )% | (41.8 | )% | (27.3 | )% | (35.0 | )% | (30.2 | )% | (29.8 | )% | (24.9 | )% | ||||||||||||||||||||||||||||||||
Research and development | (32.5 | )% | (34.6 | )% | (44.5 | )% | (32.1 | )% | (40.1 | )% | (39.8 | )% | (35.6 | )% | (31.0 | )% | (40.1 | )% | (39.8 | )% | (35.6 | )% | (31.0 | )% | (33.0 | )% | (34.0 | )% | (30.6 | )% | (23.6 | )% | ||||||||||||||||||||||||||||||||
Other income (losses) | (1.7 | )% | (2.8 | )% | 0.0 | % | (0.6 | )% | 0.0 | % | (1.3 | )% | (1.3 | )% | (0.9 | )% | ||||||||||||||||||||||||||||||||||||||||||||||||
Loss from operation | (46.4 | )% | (53.1 | )% | (76.5 | )% | (35.4 | )% | (48.1 | )% | (48.8 | )% | (29.1 | )% | (6.6 | )% | ||||||||||||||||||||||||||||||||||||||||||||||||
Financial result | (5.2 | )% | (4.4 | )% | (1.8 | )% | (3.7 | )% | (13.5 | )% | (14.0 | )% | (0.5 | )% | 5.9 | % | ||||||||||||||||||||||||||||||||||||||||||||||||
|
|
|
|
|
|
|
| |||||||||||||||||||||||||||||||||||||||||||||||||||||||||
Equity results | 0.4 | % | 0.5 | % | 0.5 | % | 0.5 | % | 0.6 | % | 0.8 | % | 0.8 | % | 0.7 | % | ||||||||||||||||||||||||||||||||||||||||||||||||
Income (loss) before income tax | (51.3 | )% | (57.0 | )% | (77.7 | )% | (38.6 | )% | (61.1 | )% | (62.3 | )% | (28.9 | )% | 0.0 | % | ||||||||||||||||||||||||||||||||||||||||||||||||
|
|
|
|
|
|
|
| |||||||||||||||||||||||||||||||||||||||||||||||||||||||||
Income tax | 3.2 | % | 6.9 | % | 8.8 | % | 10.0 | % | 6.1 | % | 6.7 | % | (0.8 | )% | (0.7 | )% | ||||||||||||||||||||||||||||||||||||||||||||||||
|
|
|
|
|
|
|
| |||||||||||||||||||||||||||||||||||||||||||||||||||||||||
Net loss of the period | (48.1 | )% | (50.1 | )% | (68.9 | )% | (28.6 | )% | (55.0 | )% | (55.6 | )% | (29.6 | )% | (0.7 | )% | ||||||||||||||||||||||||||||||||||||||||||||||||
|
|
|
|
|
|
|
| |||||||||||||||||||||||||||||||||||||||||||||||||||||||||
95
| For the Three Months ended (unaudited) | ||||||||||||||||||||||||||||||||
| March 31, 2022 | June 30, 2022 | September 30, 2022 | December 31, 2022 | March 31, 2023 | June 30, 2023 | September 30, 2023 | December 31, 2023 | |||||||||||||||||||||||||
Other income (losses) | 0.0 | % | (1.3 | )% | (1.3 | )% | (0.9 | )% | (1.8 | )% | (1.1 | )% | (0.2 | )% | (0.9 | )% | ||||||||||||||||
Loss from operation | (48.1 | )% | (48.8 | )% | (29.1 | )% | (6.6 | )% | (23.0 | )% | (14.9 | )% | (6.9 | )% | 9.4 | % | ||||||||||||||||
Financial result | (13.5 | )% | (14.0 | )% | (0.5 | )% | 5.9 | % | 3.4 | % | 0.2 | % | 2.1 | % | 0.6 | % | ||||||||||||||||
Equity results | 0.6 | % | 0.8 | % | 0.8 | % | 0.7 | % | 0.8 | % | 0.8 | % | 0.6 | % | 0.0 | % | ||||||||||||||||
Income (loss) before income tax | (61.1 | )% | (62.3 | )% | (28.9 | )% | 0.0 | % | (18.7 | )% | (13.9 | )% | (4.2 | )% | 10.0 | % | ||||||||||||||||
Income tax | 6.1 | % | 6.7 | % | (0.8 | )% | (0.7 | )% | (0.0 | )% | 0.1 | % | (0.5 | )% | (4.7 | )% | ||||||||||||||||
Net income (loss) for the period | (55.0 | )% | (55.6 | )% | (29.6 | )% | (0.7 | )% | (18.8 | )% | (13.8 | )% | (4.7 | )% | 5.3 | % | ||||||||||||||||
Total revenue
DespiteIn 2023, despite the macroeconomic scenario remains uncertain, we witnessed a worsening global macroeconomic conditions that generated volatility in our existing customers’stabilization of the sales impacted in ourcycles, new stores’ average time to implement the VTEX Platform, and slowed our new customer’s GMV ramp-up times versus the prior year. This stabilization of extended cycles had a positive impact on our GMV, resulting in a new stores GMV that surpassed expectations. Consequently, our net revenues maintained itscontinued their growth trajectory duringfor the year endedending December 31, 2022, primarily as a result of an increase in our GMV.2023.
Our sources of revenues are denominated 18.6%24.2% in U.S. dollars or Euros and 81.4%75.8% in local currencies for the year ended December 31, 2022. The weak macroeconomic environment in certain countries in which we operate, including as a result of COVID-19, coupled with the devaluations of certain local currencies in those countries against the U.S. dollar, caused a decline in year-over-year revenues in certain countries we operate, measured in U.S. dollars.2023.
We continue to monitor the progress of the macroeconomic conditions and its effects in consumption and our customers’ operations, and will take additional measures to navigate any macroeconomic environment and comply with the rapidly changing regulations of the countries where we operate. In addition, the devaluation of certain local currencies in those countries against the U.S. dollar, may cause a decline in year-over-year revenues in certain countries we operate, measured in U.S. dollars. However, we may not be able to predict the negative impacts a worsening in the macroeconomic environment will have on our business in the future.
Gross profit
Our gross profit trends are directly affected by our total revenue and our total cost. The main components of our subscription cost are hosting costs and customer support costs. The hosting related costs include third-party providers, software related platform operating costs, and compensation for our infrastructure team. Customer support costs are mostly driven by personnel cost related to the support we provide to our customers. The main components of our services cost are personnel costs and/or third-party costs to provide the professional services advisory for specific customer projects.
For the year ended December 31, 2023 and for the year ended December 31, 2022 2021 our gross profit was US$104.8140.6 million and US$76.2104.8 million, respectively, representing a year-over-year increase of 37.6%34.1%. Our gross profit year-over-year growth was lower than our total revenue growth as a reflection of incremental investments in cybersecurity, privacy and compliance mostly related to our global expansion and becoming a public company, partially offset by our efforts to increase efficiencies in hosting costs.
99
Operating expenses
Our operating expenses consist of general and administrative expenses, sales and marketing expenses, and research and development expenses.
96
We expect administrative expenses to increase as a result of becoming a publicly traded company and compliance requirements derived from the Sarbanes-Oxley Act. Public company costs include expenses associated with annual and quarterly reporting, investor relations, registrar and transfer agent fees, incremental insurance costs, accounting and legal services, and other investments to strengthen corporate governance and internal controls. In addition, we plan to continue to incur sales and marketing expenses in the regions that we currently have a presence as well as in new regions over time in order to continue to enhance our brand to attract new customers. Finally, we expect to increase the research and development expenses to continue investing in product innovation, and in the development of new products.
As we continue to grow and focus on expanding our leadership in Latin America and our reach in new regions globally, we will continue to invest in sales, marketing, product development and human resources in order to promote our services and capture long-term business opportunities.
The worsening of the macroeconomic environment could also have negative impacts on our results of operations if we fail to closely monitor operating expenses on demand patterns. Our operating expenses are not adjusted in order to appropriately represent our actual rate of business development.
For the year ended December 31, 2022,2023, our operating expenses increased 9.1%demonstrated a marginal increase of 0.3%. This increase is primarily duestability in expenses, when compared to the increase of sales and marketing expenses and R&D expenses caused by investments we didfigures from 2022, reflects an organizational structure, which remained largely unchanged, experiencing only a modest 5.3% reduction in the first half of 2022, partiallytotal headcount. This reduction was offset by factors such as salary increases and other expenses, effectively counterbalancing the organizational restructuringdecline in the second half of 2022.headcount.
| E. | Critical Accounting Estimates |
See notes 2 and 4 to our consolidated financial statements for a description of our critical estimates and accounting judgments and significant accounting policies.
DIRECTORS, SENIOR MANAGEMENT AND EMPLOYEES |
| A. | Directors and Senior Management |
We are managed by our board of directors and by our senior management, pursuant to our Articles of Association and the Companies Act (Revised) of the Cayman Islands.
Board of Directors
We are managed by our board of directors. Our Articles of Association provide that, unless otherwise determined by an ordinary resolution of shareholders, the board of directors will be composed of four to eleven directors, with the number being determined by a majority of the directors then in office.
Each director holds office for the term, if any, fixed by the shareholders or board of directors that appoints such director, or, if no term is fixed on the appointment of the director, until the earlier of his death, resignation or removal. Our directors do not have a retirement age requirement under our Articles of Association.
Our Articles of Association provide that directors shall be elected by an ordinary resolution of our shareholders, which requires the affirmative vote of a simple majority of the votes cast on the resolution by the shareholders entitled to vote who are present, in person or by proxy, at the meeting. Each director shall be appointed and elected for such term as the resolution appointing him or her may determine or until his or her death, resignation
100
or removal. Notwithstanding the foregoing, our controlling shareholders may appoint: (1) a majority of the total number of directors rounded upward to the nearest whole number, for so long as they hold at least 25% of our outstanding voting power; (2) 25% total number of directors rounded upward to the nearest whole number, for so long as they hold at least 10% of our outstanding voting power; and (3) 10% total number of directors rounded upward to the nearest whole number, for so long as less they hold less than 10% but more than 5% of our outstanding voting power. The controlling shareholders may in like manner remove such director(s) appointed by them and appoint such replacement director(s).
97
Our Articles of Association provide that from and after the date on which our controlling shareholders (and/or their respective affiliates) no longer constitute a group that beneficially owns more than 50% of our outstanding voting power, or the classifying date, the directors shall be divided into three classes designated Class I, Class II, and Class III. Each director shall serve for a term ending on the date of the third annual general meeting of the shareholders following the annual general meeting of the shareholders at which such director was elected as subject to the provisions of our Articles of Association. The founding directors shall be allocated to the longest duration classes unless otherwise determined by the controlling shareholders.
The table set forth below presents the name, age and title of the current members of our board of directors:
Name | Age | Position | ||
| Geraldo do Carmo Thomaz Júnior | Co-Chairman | |||
| Mariano Gomide de Faria | Co-Chairman | |||
| Francisco Alvarez-Demalde | Board Member | |||
| Alejandro Raul Scannapieco | Independent Board Member | |||
| Arshad Matin | Independent Board Member | |||
| Benoit Fouilland | Independent Board Member | |||
| Silvia Mazzucchelli | 52 | Independent Board Member |
The following is a summary of the professional experience of our current directors. Unless otherwise indicated, the current business addresses of all members of our board of directors is 125 Kingsway, WC2B 6NH London, United Kingdom.
Geraldo do Carmo Thomaz Júnior. Mr. Thomaz is our Founder and Co-Chief Executive Officer, a position he has held since our inception. Mr. Thomaz is also the co-chairman of our board of directors, a position he has held since 2019. Graduated in Mechanical Engineering at Universidade Federal do Rio de Janeiro (UFRJ). Geraldo developed the VTEX platform under the SaaS model, providing systems, servers, security and infrastructure for enterprise-level companies. Since 2021, he has also served as a board member for Instituto Reditus, a non-profit organization in Brazil. He currently also leads the Research & Development.Development teams. We believe that Mr. Thomaz is qualified to serve on our board of directors due to his considerable business experience in the technology industry and his experience serving as a director of other companies.
Mariano Gomide de Faria.Mr. Gomide de Faria is our Founder and Co-Chief Executive Officer, a position he has held since our inception. Mr. Gomide de FariaHe is primarily responsible for overseeing the company’s global growth strategy encompassing marketing, sales, delivery support, and global go-to-market operations teams. He is also the co-Chairman of ourthe board of directors, a positionrole he has heldfulfilled since 2019. GraduatedMariano is graduated in Mechanical Engineering at UFRJ. Mariano currently leads VTEX’s Sales and Marketing teams, overseeing the UK and Asia markets. He isMoreover, he actively engages as a teacher and lecturer for events like ecommerce Day, Internet Retailer, eShow, and UNCTAD ecommerce Week.Week and EICOM Institute. We believe that Mr. Gomide de Faria is qualified to serve on our board of directors due to his considerablesubstantial business experience in the technology industry and his experience serving as a director of other companies.extensive leadership roles within the company.
Francisco Alvarez-Demalde. Mr. Alvarez-Demalde is a member of our board of directors, a position he has held since 2019. He is a co-founderCo-Founder and co-managing partnerManaging Partner of Riverwood Capital, aone of the leading growth-capital private equity firm focused on the globalinvestment firms solely dedicated to technology industry,growth and scalability, and one of the largest early investors in VTEX, since 2014. Before startingPrior to establishing Riverwood, Capital, Mr. Alvarez-Demalde was an investment executive at Kohlberg Kravis Roberts & Co. (KKR), where he focused on leveraged buyouts in the technology industry and other sectors, and wassectors. He also previously held roles with Eton Park Capital Management and Goldman Sachs & Co. Mr. Alvarez-Demalde has invested and been actively involved in the development, operations, and growth of several successful businesses across North America, Latin America and other geographies. Mr. Alvarez-Demalde earned a Licentiate (Honors) in Economics from Universidad de San Andres, Argentina (including an exchange program at the Wharton School). He has led investments in or is a current or former Director or current directorAdvisor of several technology companies, including 99, Alog Data Centers do Brasil, Billtrust (NASDAQ:(Nasdaq: BTRS), Conductor,Cloudblue, Dock, Globant (NYSE: GLOB), GOintegro, Greenhouse, Industrious, Insider, LAVCA, Mandic, MotionPoint, Navent, Nubox, Pixeon, RD Station, SecurityScorecard, Shiphero, Technisys, among others. Mr. Alvarez-Demalde holds a
101
bachelor’s degree in economics from Universidad de San Andrés, Argentina, which included an exchange program at the Wharton School at the University of Pennsylvania. Mr. Alvarez-Demalde is also a Global Ambassador with Endeavor and interested in non-profit initiatives related to education. We believe that Mr. Alvarez-Demalde is qualified to serve on our board of directors due to his considerable business experience in the technology industry and his experience serving as a director of other companies.
98
Alejandro Raul Scannapieco. Mr. Scannapieco is an independent member of our board of directors and co-chairman of our audit committee,the Audit Committee, positions he has held since May 2021. Currently, he is the CEO of LaLiga Tech, a joint venture between Globant and La Liga Española. Prior to that, he was the managing director of the Business HackingHack-ing Studio the strategic consulting arm at Globant.Globant from 2019 to 2022. Prior to that, he led the U.S. East Region for Globant and was the chief financial officer from 2008-2018, leading the IPO process at the NYSE in 2014.2008-2018. Prior to joining Globant in 2008, Alejandro served as chief financial officer at Microsoft South Cone (2002-2008) and Patagon.com South America (1999-2002), an internet startup that was sold to Santander Bank. He also served as Senior Finance Analyst at JP Morgan (1994-1999) and Senior Auditor at EY (1990-1994). Mr. Scannapieco currently serves as a board member for RetailApp Inc., a performance management platform for retailers, a position he has held since 2016. Mr. Scannapieco holds a postgraduate degree in capital markets, a degree in public accounting and a bachelor’s degree in business administration from the Pontificia Universidad Católica Argentina. He has also completed a postgraduate degree in finance from Torcuato Di Tella University.
Arshad Matin. Mr. Matin is an independent member of our board of directors, a position he has held since May 2021. Mr. Matin is the president and chief executive officer of Avetta, LLC, a private company providing cloud-based supply chain risk management solutions which he joined in October 2019. From November 2018 to September 2019, he was an entrepreneur-in-residence with Warburg Pincus LLC, a private equity firm. From 2013 to October 2018, he was the president, chief executive officer and a board member of Paradigm Ltd., a leading developer of software solutions to the global oil and gas industry, when it was acquired by Emerson Electric Co. From January 2012 to April 2013, Mr. Matin was executive vice president of IHS Inc., a publicly-traded company that is a leading global source of information and analytics. Mr. Matin joined IHS through the acquisition of Seismic Micro-Technology, Inc., or SMT, a global leader in the geology and geophysics software market. He joined SMT in July 2007 and was its president, chief executive officer and a board member. Before joining SMT, Mr. Matin was general manager of the enterprise security business unit at Symantec Corporation, which he joined in January 2006 upon the company’s acquisition of BindView Corporation, a global provider of agentless IT security compliance software. Mr. Matin also served as a partner of McKinsey & Company from 1995 to 2004 in their Houston offices. Mr. Matin also serves as chairman of the board of directors of NYSE-listed ASGN, a provider of information technology and professional services in the technology, digital, creative, engineering and life sciences fields across commercial and government sectors. Mr. Matin also served as a member of the board of directors of RS Energy Group, a Canadian company supporting companies in the oil and gas industry with its data analytics and forensic research, from December 2018 to January 2021.2020. In addition, Mr. Matin serves as a board member or trustee on non-profit organizations including the Houston Endowment, Texas Children’s Hospital and Asia Society Texas Center. Mr. Matin brings extensive experience managing and advising public and private high-technology companies. Mr. Matin holds an MBA from the University of Pennsylvania – The Wharton School, a master’s degree in computer engineering from the University of Texas at Austin, and a bachelor’s of degree in electrical engineering from Regional Engineering College in India.
Benoit Fouilland. Mr. Fouilland is an independent member of our board of directors and co-chairman of our audit committee, a position he has held since May 2021. Mr. Fouilland is currently chief financial officer of Contentsquare, an AI-powered digital experience analytics platform. Prior to that, from September 2020 to May 2023, he served as chief financial officer of Firmenich, one of the world’s largest fragrance and taste companies. From March 2012 to July 2020, he served as chief financial officer of Criteo SA, a global advertising technology company (NASDAQ: CRTO). From September 2009 to March 2012, he served as senior vice president and chief financial officer for the Europe, Middle East and Africa (EMEA) region of SAP AG, a multinational software corporation. From April 2008 to September 2009, Mr. Fouilland was the chief financial officer of Business Objects S.A., an enterprise software company which was acquired by SAP AG in 2007. Mr. Fouilland holds an MBA from INSEAD, a Diplôme d’Études Supérieures Spécialisées degree in Financial Audit from Université Paris Dauphine and a Business degree from the ESLSCA Graduate School of Business in Paris.
Silvia Mazzucchelli. Silvia Mazzucchelli is an independent member of our board of directors and member of the Audit Committee, a position she has held since July 2023. Ms. Mazzucchelli is currently a senior advisor, specialized in retail and consumer brands, to The Boston Consulting Group, and serves as chair of the board of Coyuchi, a sustainable home textiles brand, and director of Carbon38, a Footlocker-backed activewear brand. She previously served as Chair of the board of Sequential Brands Group, Inc. (Nasdaq: SQBG), a brand management company with a portfolio of lifestyle brands, as director of PAS Group Ltd. (ASX: PGR), a leading Australian fashion retailer, and two KKR portfolio companies.Ms. Mazzucchelli’s contributions to strategy development, scaling consumer and retail brands, and digital transformations leverage 25+ years of track record as a consumer
102
99
and retail business leader and advisor. Most recently, Ms. Mazzucchelli served as CEO of the Collected Group, a KKR company owner of luxury brands Joie, Equipment, and Current Elliott, and Chief Executive Officer for ModCloth, a Walmart e-commerce portfolio company, from 2019 to 2020. Prior to that, Ms Mazzucchelli held a variety of senior executive roles at American Apparel, Gildan Activewear, Toms Shoes, Guess? Inc. Silvia began her career at The Boston Consulting Group where she spent over 12 years assisting Fortune 500 clients in Consumer and Retail across North America and Europe. Ms. Mazzucchelli graduated with an MBA from the Anderson School of Management at UCLA, and holds a BSBA degree from Bocconi University in Italy and an International Business Diploma from the Stockholm School of Economics.
Executive Officers
Our executive officers are primarily responsible for the day-to-day management of our business and for implementing the general policies and directives established by our board of directors.
The table set forth below presents the name, age and title of current executive officers:
Name | Age | Position | ||
Geraldo do Carmo Júnior | 47 | Co-Chief Executive Officer | ||
| Mariano Gomide de Faria | 46 | Co-Chief Executive Officer | ||
| ||||
| Chief Financial Officer | |||
André Spolidoro Ferreira Gomes | Chief Strategy Officer | |||
| ||||
| Chief Revenue | |||
|
Geraldo do Carmo Thomaz Júnior. See “—Board of Directors.”
Mariano Gomide de Faria. See “—Board of Directors.”
Ricardo Camatta Sodré. Mr. Sodré is our Chief Financial Officer, a position he has held since November 2022. He previouslyMr. Sodré priorly served the companyVTEX as Finance Executive Officer, a position he held sincefrom February 2021.2021 to November 2022. Previously, Mr. Sodré was a private equity investor at Advent International, where he joined as a trainee in 2009 before leaving as a director in January 2021. During his years at Advent, Mr. Sodré actively participated in more than 10 private equity investments, including CETIP, CCC Information ServicesIntelligent Solutions and StoneCo, and in recent years he was a board member at Prisma Medios de Pago S.A., a leading payments company in Latin America, and GTM Holdings, a leading chemical distributor with presence in 11 countries in Latin America, where he was also a member of the Audit, Finance and M&A committees. Mr. Sodré holds a degree in Mechanical-Aeronautical Engineering with honors from Instituto Tecnológico de Aeronáutica (“ITA”) and an MBA from Harvard Business School.
André Spolidoro Ferreira Gomes. Mr. Spolidorois our Chief Strategy Officer, a position he has held since November 2022, previously he2022. Mr. Spolidoro priorly served VTEX as our Chief Financial Officer, a position he held sincefrom January 2016.2016 to November 2022. Mr. Spolidoro worked from 1998 to 2015 in asset management firms as Equity Portfolio Manager where he consolidated his solid knowledge in finance, financial market, equity analysis and business. Mr. Spolidoro holds a B.S. degree in Mechanical Engineering at UFRJ and a graduate degree in finance and capital markets at PUC RJ School of Business.
Fernanda Weiden. Mrs. Weiden is our Chief Technology Officer, a position she has held since January 2022. Prior to joining us as our Chief Technology Officer, Mrs. Weiden was one of our advisors from September 2020 to December 2021. Prior to that, she was vice-president of Engineering at Unico IDtech from 2020 to 2021. From 2012 to 2019 she worked at Facebook Inc., in a number of roles including as a production engineering director.
Santiago Naranjo Alvarez. Mr. Naranjo is our Chief Revenue Officer, a position he has held since MayJune 2022. He previouslyMr. Naranjo served the company as LatAm Growth Officer, from June 2020 to May 2022, and as Country Manager of Colombia from 2016 to 2020. Before joining VTEX, he served as Marketing Manager in Offcorss (CI Hermeco) for 10 years. Mr. Naranjo is a financial engineer and retail expert, passionate about Omnichannel and Cross Border ecommerce with more than 15 years of experience in ecommerce and retail, and 10 years of expertise leading the creation and expansion of successful brands, both physical and digital. Mr. Naranjo has also been a board member of the Colombian Chamber of Electronic Commerce (“CCCE”) since 2016 as a trusted advisor who shares knowledge that powers the ecommerce industry in Latin America. Santiago holds a B.S. degree in financial engineering with marketing at Universidad de Medellín.
103100
Rafael do Amaral Forte. Mr. Forte is the Brazil Growth Officer, a position he has held since 2019. From 2001 to 2011 he was the co-founder and Director of WX7, where he co-led the company’s growth and subsequent acquisition by VTEX. From 2016 to 2019, Mr. Forte served as our Head of Sales in Brazil. Mr. Forte is the chairman of the board of directors of our joint-venture with Totvs, VT Comércio Digital S.A., a position he has held since 2019. Mr. Forte holds a law degree from the University of São Judas, a MBA in Ecommerce Strategic Management from Anhembi University and a MBA in Strategic and Economic Business Management from FGV University. Mr. Forte is also a guest lecturer at the MBA in Strategic Retail Management at Ibmec University.
Family Relationships
There are no family relationships between our directors and executive officers and shareholders.
| B. | Compensation |
Under Cayman Islands law, we are not required to disclose compensation paid to our senior management on an individual basis and we have not otherwise publicly disclosed this information elsewhere.
Our directors, executive officers and management in general receive fixed and variable compensation. They also receive benefits generally in line with market practice in Brazil or elsewhere where we operate. The fixed component of their compensation is set on market terms and adjusted annually.
The variable component consists of cash bonuses according to financial (company level), collective and individual results and awards of shares (or the cash equivalent). Cash bonuses are paid to executive officers and members of our management based on previously agreed targets for the business. Shares are awarded under our equity incentive plan, as discussed below.
For the years ended December 31, 2023, 2022 2021 and 2020,2021, the aggregate compensation expense for the members of the board of directors and our executive officers for services in all capacities was US$10.1million, US$8.2 million, US$8.3 million and US$3.48.3 million, respectively, which includes both salaries and bonuses paid in kind and compensation. For further information, see note 22 to our consolidated financial statements.
Equity Incentive Plans
Prior to November 2021, certain members of our management, outside directors, consultants and our employees received share-based compensation under a share option plan and a restricted share plan, or the Pre-IPO Plans. Although grants made pursuant to the Pre-IPO Plans prior to the adoption of the 2021 Share Plan (as defined below) remain valid, the outstanding pools of the Pre-IPO Plans have been canceled and no additional grants may be made. We have awarded 6,368,130 stock options and 1,441,305 restricted share units under the Pre-IPO Plans that are currently outstanding and not exercised or settled. For further information, see note 25 to our consolidated financial statements.
On November 11, 2021, our board of directors approved the VTEX 2021 share plan, or the 2021 Share Plan, substituting the Pre-IPO Plans.
Eligible participants of the 2021 Share Plan include certain members of our management and our employees. Beneficiaries under 2021 Share Plan may be granted stock options and/or restricted shares units on certain determined criteria. The final eligibility of any beneficiary to participate in the 2021 Share Plan is determined by our board of directors.
104
On November 7, 2022, our board of directors amended and restated the 2021 Share Plan and authorized an increase of the number of shares that are available to be issued under the 2021 Share Plan (any such number of shares available to be issued the “Plan“Plan Share Reserve”Reserve”) to include an additional 2,600,000 Class A common shares to be reserved for issuance to offset an aggregate of approximately 2,600,000 stock options and restricted stock units that were previously granted under Pre-IPO Plans and have been forfeited. Also on November 7, 2022, our board of directors approved the modification of some stock option instruments, changing the original vesting period and exercise price, and the migration of some stock option instruments to RSUs. Such modifications were carried out to reflect the recent fall in ’ourour share price. For further information, see note 25 to our consolidated financial statements.
As of December 31, 2022 the date of this annual report,2023, we have awarded 3,345,6164,951,689 stock options and 2,067,8892,879,265 restricted share units under the 2021 Share Plan that are currently outstanding and have not been exercised. Pursuant to the terms of the 2021 Share Plan, the Plan Share Reserve automatically renews on the first day of each fiscal year, by a number of Class A common shares equal to (1) 1.8% of our outstanding share capital on the last day of the immediately preceding fiscal year or (2) a number of Class A common shares as otherwise determined by our board of directors.
101
On January 1, 2023,2024, our Plan Share Reserved was renewed by 3,401,866,3,751,921 which represented 1.8% of our outstanding share capital on December 31, 20222023 and as of the date of this annual report, we have 515,177a total of 3,751,921 Class A common shares available for issuance under the 2021 Share Plan.
| C. | Board Practices |
Duties of Directors
As a matter of Cayman Islands law, a director of a Cayman Islands company is considered a fiduciary of the company. Accordingly, directors owe fiduciary duties to their companies to act in accordance with the best interests of the company, to exercise their powers for the purposes for which they are conferred and not to place themselves in a position where there is a conflict between their personal interests and their duty to the company. Accordingly, a director owes a company a duty not to make a profit based on his or her position as director (unless the company permits him or her to do so) and a duty not to put himself or herself in a position where the interests of the company conflict with his or her personal interests or his or her duties to a third-party. However, a company’s articles of association may permit a director to vote on a matter in which he or she has a personal interest if he or she has disclosed the nature of his or her interest to the board of directors. Our Articles of Association provide that a director must disclose the nature and extent of any material interests in any contract or arrangement, and that he or she may vote at any meeting on any resolution concerning an interested matter, provided he or she has disclosed the nature of his or her interest
A director of a Cayman Islands company also owes to the company duties to exercise independent judgment in carrying out his or her functions and to exercise reasonable skill, care and diligence, which has both objective and subjective elements. Recent Cayman Islands case law confirmed that directors must exercise the care, skill and diligence that would be exercised by a reasonably diligent person having the general knowledge, skill and experience reasonably to be expected of a person acting as a director. Additionally, a director must exercise the knowledge, skill and experience that he or she actually possesses.
Election and Terms of Directors
See “Item 10. Additional Information.—B. Memorandum and Articles of Association—Appointment, Disqualification and Removal of Directors.”
Board Committees
Our board of directors has established an (i) audit committee; and (ii) a compensation committee. In the future, our board of directors may establish other committees, as it deems appropriate, to assist with its responsibilities.
105
Audit Committee
Our audit committee consists of Alejandro Raul Scannapieco, and Benoit Fouilland and Silvia Mazzucchelli where bothall are co-chairmen of our audit committee. Alejandro Raul Scannapieco, and Benoit Fouilland and Silvia Mazzucchelli satisfy the criteria of an audit committee financial expert as set forth under the applicable rules of the SEC, and they also meet the criteria for independence set forth in Rule 10A-3 of the Exchange Act. Our audit committee assists our board of directors in overseeing our accounting and financial reporting processes and the audits of our consolidated financial statements. In addition, the audit committee will be directly responsible for the appointment, compensation, retention and oversight of the work of our independent registered public accounting firm.
102
Compensation Committee
Our compensation committee consists of Francisco Alvarez-Demalde and Arshad Matin. Our compensation committee is responsible for, among other things, establishing cash compensation levels, adopting and administering our bonus programs, reviewing and approving severance arrangements and employment agreements to maintain competitiveness and further our performance objectives, establishing and recommending to our board of directors corporate goals and objectives relevant to compensation for our executive officers (including the Co-Chief Executive Officers), as well as recommending to our board of directors the form and amount of cash-and equity-based and other compensation to be paid to the non-employee members of the board of directors. As a foreign private issuer, our compensation committee is not required to satisfy the requirements of 303A.05 of the Corporate Governance Rules of the NYSE, including to be made up by “independent directors” as defined in such rules. While we are not required to make a determination as to whether the members of our compensation committee are “independent directors” for purposes of Section 303A.02 of the Corporate Governance Rules of the NYSE, we are of the view that (1) Mr Alvarez-Demalde may or may not meet the independence requirements of such rule and (2) Mr. Matin would satisfy such independence requirements.
| D. | Employees |
As of December 31, 2022,2023, we had 1,3491,277 employees (including full-time employees, contractors, third-parties, and interns), including 32.5%32.7% in research and development, 27.9%26.9% in sales and marketing, 21.1% in professional services and customer support and 18.5%19.3% in general and administrative expenses. Of these employees, 71.2%73.1% are in Brazil and 28.8%26.9% are in our international locations.
In Brazil, it is mandatory to be affiliated with a workers union. Each year, we enter into an updated collective bargaining agreement. We believe we have a constructive relationship with these unions and we have not experienced any strikes, work stoppages or disputes leading to any form of downtime from our employees.
Talent acquisition strategy: Hiring is everyone’s job
We believe we are considered among the most impactful tech companies in our industry on a global basis and recognized among top students in the Latin American region as a career accelerator. We foster partnerships with top educational institutions across Brazil through VTEX Lab, our university partnership program we established in April 2018, that provides students with an immersive experience of continued learning and development. As of the date of this annual report, our engineering team consists of approximately 12.1%13.0% of VTEX Lab graduates and we continue to cultivate the future of tech talent at VTEX.
| E. | Share Ownership |
For information regarding the share ownership of our directors and senior management, see “Item 7. Major Shareholders and Related Party Transactions — A. Major Shareholders.” For information as to stock options granted to our directors, executive officers and other employees, see “Item 6. Directors, Senior Management and Employees — B. Compensation—Equity Incentive Plan.”
106
Disclosure of a registrant’s action to recover erroneously awarded compensation. |
Not applicable.
| ITEM 7. | MAJOR SHAREHOLDERS AND RELATED PARTY TRANSACTIONS |
| A. | Major Shareholders |
The following table and accompanying footnotes presents information relating to the beneficial ownership of our Class A common shares and Class B common shares as of December 31, 2022:2023:
103
each person, or group of affiliated persons, known by us to own beneficially 5% or more of our common shares;
each of our executive officers and directors individually; and
all executive officers and directors as a group.
Beneficial ownership is determined under SEC rules and generally includes voting or investment power over securities. Except in cases where community property laws apply or as indicated in the footnotes to this table, we believe that each shareholder identified in the table below possesses sole voting and investment power over all the Class A or Class B common shares shown as beneficially owned by the shareholder in the table.
Common shares subject to options, warrants or rights that are exercisable within 60 days from the date of this annual report, are considered to be outstanding and beneficially owned by the person who holds such options, warrants or rights for purposes of computing that person’s common share ownership, but are not treated as outstanding for the purpose of computing the percentage ownership of any other person.
The holders of our Class A common shares and Class B common shares have identical rights, except that holders of Class B common shares (1) are entitled to ten (10) votes per share, whereas holders of our Class A common shares are entitled to one (1) vote per share; (2) has certain conversion rights; and (3) are subject to certain transfer restrictions. For more information, see “Item 10. Additional Information—B. Memorandum and Articles of Association—Description of Share Capital.” Each Class B common share is convertible into one Class A common share.
107
| Common shares Beneficially Owned | ||||||||||||||||||||
| Class A | Class B | Total Voting Power (2) | ||||||||||||||||||
| Shares | %(1) | Shares | %(1) | % | ||||||||||||||||
5% Shareholders | ||||||||||||||||||||
Geraldo do Carmo Thomaz Júnior(3) | 1,524,100 | 1.8 | % | 35,420,307 | 32.8 | % | 30.6 | % | ||||||||||||
Mariano Gomide de Faria(3) | 1,524,100 | 1.8 | % | 35,420,307 | 32.8 | % | 30.6 | % | ||||||||||||
LA Holdings (Cayman) Ltd.(4) | 19,875,188 | 23.5 | % | 18,559,399 | 17.2 | % | 17.7 | % | ||||||||||||
Riverwood Managed Entities(5) | 3,739,875 | 4.4 | % | 11,255,046 | 10.4 | % | 10.0 | % | ||||||||||||
Affiliated of Dynamo(6) | 7,226,229 | 8.6 | % | — | — | 0.6 | % | |||||||||||||
Capital Research Global Investors(7) | 6,643,874 | 7.9 | % | — | — | 0.6 | % | |||||||||||||
Affiliated of Fourth Sail(8) | 4,548,068 | 5.4 | % | — | — | 0.4 | % | |||||||||||||
GIC Private Limited(9) | 4,413,559 | 5.2 | % | — | — | 0.4 | % | |||||||||||||
Affiliated of Lone Pine(10) | — | — | — | — | — | |||||||||||||||
Affiliated of Tiger Global(11) | — | — | — | — | — | |||||||||||||||
Total | 49,494,993 | 58.6 | % | 100,655,059 | 93.3 | % | 90.8 | % | ||||||||||||
Other Directors and Executive Officers | ||||||||||||||||||||
Francisco Alvarez-Demalde(5) | — | — | — | — | — | |||||||||||||||
Alejandro Raul Scannapieco(12) | 121,332 | 0.1 | % | — | — | 0.0 | % | |||||||||||||
Arshad Matin(13) | 45,500 | 0.1 | % | — | — | 0.0 | % | |||||||||||||
Benoit Fouilland(14) | 121,332 | 0.1 | % | — | — | 0.0 | % | |||||||||||||
André Spolidoro Ferreira Gomes(15) | 394,821 | 0.5 | % | 950,000 | 0.9 | % | 0.9 | % | ||||||||||||
Rafael do Amaral Forte(16) | 38,063 | 0.0 | % | 3,491,249 | 3.2 | % | 3.0 | % | ||||||||||||
Santiago Naranjo Alvarez(17) | 287,974 | 0.3 | % | — | — | 0.0 | % | |||||||||||||
Ricardo Camatta Sodré(18) | 226,250 | 0.3 | % | — | — | 0.0 | % | |||||||||||||
Fernanda Weiden(19) | — | — | — | — | — | |||||||||||||||
All directors and executive officers as a group (11 persons) | 4,283,472 | 5.1 | % | 75,281,863 | 69.8 | % | 65.1 | % | ||||||||||||
| Common shares Beneficially Owned | ||||||||||||||||||||
| Class A | Class B | Total Voting Power(2) | ||||||||||||||||||
| Shares | %(1) | Shares | %(1) | % | ||||||||||||||||
5% Shareholders | ||||||||||||||||||||
Geraldo do Carmo Thomaz Júnior(3) | 2,184,622 | 2.7 | % | 35,187,611 | 33.0 | % | 30.8 | % | ||||||||||||
Mariano Gomide de Faria(3) | 2,193,995 | 2.7 | % | 35,187,611 | 33.0 | % | 30.8 | % | ||||||||||||
LA Holdings DE LLC.(4) | 19,875,188 | 24.2 | % | 18,559,399 | 17.4 | % | 17.9 | % | ||||||||||||
Riverwood Managed Entities(5) | 5,014,896 | 6.1 | % | 10,555,046 | 9.9 | % | 9.6 | % | ||||||||||||
Affiliated of Dynamo(6) | 6,977,073 | 8.5 | % | — | — | 0.6 | % | |||||||||||||
GIC Private Limited (7) | 4,413,559 | 5.4 | % | — | — | 0.4 | % | |||||||||||||
Total | 40,659,333 | 49.6 | % | 99,489,667 | 93.3 | % | 90.1 | % | ||||||||||||
Other Directors and Executive Officers |
| |||||||||||||||||||
Francisco Alvarez-Demalde(5) | 70,424 | 0.1 | % | — | — | 0.0 | % | |||||||||||||
Alejandro Raul Scannapieco(8) | 131,090 | 0.2 | % | — | — | 0.0 | % | |||||||||||||
Arshad Matin(9) | 115,924 | 0.1 | % | — | — | 0.0 | % | |||||||||||||
Benoit Fouilland(10) | 131,090 | 0.2 | % | — | — | 0.0 | % | |||||||||||||
André Spolidoro Ferreira Gomes(11) | 573,873 | 0.7 | % | 900,000 | 0.8 | % | 0.8 | % | ||||||||||||
Santiago Naranjo Alvarez(12) | 335,550 | 0.4 | % | — | — | 0.0 | % | |||||||||||||
Ricardo Camatta Sodré(13) | 394,218 | 0.5 | % | — | — | 0.0 | % | |||||||||||||
Silvia Mazzucchelli(14) | 9,758 | 0.0 | % | — | — | 0.0 | % | |||||||||||||
All directors and executive officers as a group (10 persons) | 6,140,544 | 7.5 | % | 71,275,222 | 66.8 | % | 62.4 | % | ||||||||||||
| (1) | Percentage of the specific class of common shares, based on |
104
| (2) | Percentage of total voting power represents voting power with respect to all of our Class A common shares and Class B common shares, as a single class. Holders of our Class B common shares are entitled to 10 votes per share, whereas holders of our Class A common shares are entitled to one vote per share. For more information about the voting rights of our Class A common shares and Class B common shares, see “Item 10. Additional Information—B. Memorandum and Articles of Association—Description of Share Capital.” |
| (3) | Based on a statement on Amendment No. 2 to Schedule 13G jointly filed on February |
| (4) | Based on a statement on Amendment No. 1 to Schedule 13D filed on |
| (5) | Based on a statement on Schedule 13D jointly filed on |
108
| (6) | Based on a statement on Amendment No. 1 to Schedule 13G jointly filed on |
| (7) | Based on a statement on Schedule 13G |
|
|
|
|
Mr. Alejandro Raul Scannapieco’s, one of our directors, business address is |
Mr. Arshad Matin’s, one of our directors, business address is 1330 Post Oak Blvd., Suite 600, Houston, TX 77056. Mr. Matin owns |
Mr. Benoit Fouilland’s, one of our directors, business address is 7 |
Mr. Spolidoro, our Chief Strategy Officer, beneficially owns 247,821 Class A common shares in us directly and 900,000 Class B common shares in us directly and indirectly through his ownership of all participation interests in Botsmark LLC, an entity incorporated under the laws of Delaware. The business address for Mr. Spolidoro is 125 Kingsway, WC2B 6NH London, United Kingdom. Further includes |
105
|
Mr. Naranjo Alvarez, one of our executive officers, beneficially owns 147,300 Class A common shares in us directly. The business address for Naranjo Alvarez is 125 Kingsway, WC2B 6NH London, United Kingdom. Further includes |
Mr. Camatta Sodré, our Chief Financial Officer, beneficially owns 212,968 Class A common shares in us directly. The business address for Mr. Camatta Sodré is 125 Kingsway, WC2B 6NH London, United Kingdom. Further includes |
|
Registration Rights Agreement
We entered into a registration rights agreement, or the Registration Rights Agreement, with the following of our shareholders: LA Holdings (Cayman) Ltd., Geraldo do Carmo Thomas Júnior, Imbetiba Fund Inc., Abrolhos One Limited, Mira Limited, Data Center Holdings II LLC, IT Brazil Group II LLC, RCP II (Parallel B) Brazil Holdings LLC and RCP II Brazil Holdings LLC.
Subject to several exceptions, including underwriter cutbacks and our right to defer a demand registration under certain circumstances, our shareholders that are party to the registration rights agreement may require that we register for public resale under the Securities Act all common shares constituting registrable securities that they request be registered so long as the securities requested to be registered in each registration statement have an aggregate estimated market value of at least US$50,000,000. If we become eligible to register the sale of our securities on Form F-3 under the Securities Act, such shareholders have the right to require us to register the sale of the registrable securities held by them on Form F-3, subject to offering size and other restrictions.
109
If we propose to register any of our securities under the Securities Act for our own account or the account of any other holder (excluding any registration related to employee benefit plan, a corporate reorganization, other Rule 145 transactions, in connection with a dividend reinvestment plan or for the sole purpose of offering securities to another entity or its security holders in connection with the acquisition of assets or securities of such entity), such shareholders are entitled to notice of such registration and to request that we include registrable securities for resale on such registration statement, and we are required, subject to certain exceptions, to include such registrable securities in such registration statement.
In connection with the transfer of their registrable securities, the parties to the Registration Rights Agreement may assign certain of their respective rights under the Registration Rights Agreement under certain circumstances. In connection with the registrations described above, we will indemnify any selling shareholders and we will bear all fees, costs and expenses (except underwriting discounts and spreads).
| B. | Related Party Transactions |
In addition to the compensation arrangements with directors and executive officers described under “Item 6. Directors, Senior Management and Employees — B. Compensation” and certain other rights of certain of the holders of our common shares as described under “— A. Major Shareholders —Registration Rights Agreement,” the following is a description of each transaction since January 1, 20192021 and each currently proposed transaction in which the amount involved in the transactions is material to us and any related party. See note 22 to our consolidated financial statements for a description of the Company’s related party transactions.
Related Person Transaction Policy
Our related person transaction policy requires certain related party transactions to be approved by our board of directors or a designated committee thereof, which may include our audit committee.
106
Indemnification Agreements
We have entered into indemnification agreements with our directors and executive officers. The indemnification agreements and our amended and restated articles of association will require us to indemnify our directors and executive officers to the fullest extent permitted by law.
Agreements with our Executives
Certain of our executive officers have entered into employment agreements, certain of which provide for notice of termination periods and include restrictive covenants including with respect to confidentiality, non-compete and exclusivity. As of December 31, 2022,2023, none of our directors have entered into service agreements with us.
Relationships with our Directors and Executive Officers
As of December 31, 2023, Mr. do Carmo Thomaz Júnior and Mr. Gomide de Faria our co-chairman and co-chief executive officers directly or indirectly hold 39.1%38.6% of our common shares (and 61.2%61.6% of the voting power of our outstanding common shares).
For information as to stock options granted to our directors, executive officers and other employees, see “Item 6. Directors, Senior Management and Employees — B. Compensation—Equity Incentive Plan.”
| C. | Interests of Experts and Counsel |
Not applicable.
110
FINANCIAL INFORMATION |
| A. | Consolidated Statements and Other Financial Information |
The information included under Item 18 of this annual report is referred to and incorporated by reference into this Item 8A.
Legal and Administrative Proceedings
From time to time, we may become involved in litigation or other legal proceedings relating to claims arising from the ordinary course of business.
On October 9, 2020, Mirakl, Incorporated, a competitor in the ecommerce SaaS market, filed a complaint for unspecified damages and preliminary and permanent injunctive relief in the United States District Court for the District of Massachusetts against our subsidiary VTEX Commerce Cloud Solutions LLC, or VTEX U.S., and certain of its employees that were formerly employed by the plaintiff. The complaint alleges that such employees and VTEX U.S. misappropriated, retained and improperly failed to return to the plaintiff certain confidential and property information in violation of contractual, statutory and common law obligations to the plaintiff.
On April 14, 2021, the court denied our motion to dismiss. On October 4, 2021, the court granted our motion to appoint an independent expert to manage forensic discovery. On December 1, 2021, the court approved a forensic protocol to be employed by the independent expert. As of the date of this annual report the parties are conducting discovery. Although we plan to defend ourselves vigorously against such lawsuit, we are still not able to predict the outcomes of such lawsuit at this current early stage and our involvement or future proceedings relating to this matter could potentially be costly and time-consuming and subject us to reputational and monetary damages.
107
Dividends and Dividend Policy
We have not adopted a dividend policy with respect to payments of any future dividends by us. The amount of any dividends will depend on many factors, such as our results of operations, financial condition, cash requirements, prospects and other factors deemed relevant by our board of directors. We currently intend to retain all available funds and future earnings, if any, to fund the development and expansion of our business and we do not anticipate paying any cash dividends in the foreseeable future. Any future determination to pay dividends will be made at the discretion of our board of directors and will depend on various factors, including applicable laws, our results of operations, financial condition, cash requirements, future prospects and any other factors deemed relevant by our board of directors. For further information “Item 3. Key Information—D. Risk Factors —We have not adopted a dividend policy with respect to future dividends. If we do not declare any dividends in the future, investors will have to rely on the price appreciation of our Class A common shares in order to achieve a return on their investment.” As a holding company, our ability to pay dividends depends on our receipt of cash dividends from our operating subsidiaries, which may further restrict our ability to pay dividends as a result of their respective jurisdictions of incorporation (including imposing legal restrictions on dividend distribution by subsidiaries), agreements of our subsidiaries or covenants under future indebtedness that we or they may incur. Our ability to pay dividends is therefore directly related to positive and distributable net results from our subsidiaries. See “Item 3. Key Information—D. Risk Factors— Certain Risks Relating to Our Business and Industry—Our holding company structure makes us dependent on the operations of our subsidiaries.”
Certain Cayman Islands Legal Requirements Related to Dividends
Under the Companies Law and our Articles of Association, a Cayman Islands company may pay a dividend out of either its profit or share premium account, but a dividend may not be paid if this would result in the company being unable to pay its debts as they fall due in the ordinary course of business. According to our Articles of Association, dividends can be declared and paid out of funds lawfully available to us, which include the share premium account. Dividends, if any, would be paid in proportion to the number of common shares a shareholder holds. For further information with respect to taxes, see “Item 10. Additional Information—E. Taxation—Certain Cayman Islands Tax Considerations.”
111
| B. | Significant Changes |
Except as disclosed elsewhere in this annual report, we have not experienced any significant changes since the date of our audited consolidated financial statements included in this annual report.
THE OFFER AND LISTING |
| A. | Offer and Listing Details |
Our Class A common shares have been listed on the NYSE under the symbol “VTEX” since July 23, 2021. Prior to that date, there was no public trading market for our Class A common shares.
| B. | Plan of Distribution |
Not applicable.
| C. | Markets |
See “— Offer and Listing Details” above.
| D. | Selling Shareholders |
Not applicable.
108
| E. | Dilution |
Not applicable.
| F. | Expenses of the Issue |
Not applicable.
ADDITIONAL INFORMATION |
| A. |
|
Not applicable.
|
Description of Share Capital
We were incorporated on July 25, 2018, as a Cayman Islands exempted company with limited liability duly registered with the Cayman Islands Registrar of Companies. Our corporate purposes are unrestricted, and we have the authority to carry out any object not prohibited by any law as provided by Section 7(4) of Companies Act (Revised) of the Cayman Islands, or the Companies Act.
Our affairs are governed principally by: (1) Articles of Association; (2) the Companies Act; and (3) the common law of the Cayman Islands. As provided in our Articles of Association, subject to Cayman Islands law, we have full capacity to carry on or undertake any business or activity, do any act or enter into any transaction, and, for such purposes, full rights, powers and privileges. Our registered office is 4th floor, Harbour Place, 103 South Church Street, PO Box 10240, Grand Cayman, KYI-1002, Cayman Islands.
The following is a summary of the material provisions of our authorized share capital and our Articles of Association. This discussion does not purport to be complete and is qualified in its entirety by reference to our Memorandum and Articles of Association. The form of our Articles of Association is filed as an exhibit to this annual report.
112
Share Capital
Not applicable.
| B. |
|
Description of Share Capital
We were incorporated on July 25, 2018, as a Cayman Islands exempted company with limited liability duly registered with the Cayman Islands Registrar of Companies. Our corporate purposes are unrestricted, and we have the authority to carry out any object not prohibited by any law as provided by Section 7(4) of Companies Act (Revised) of the Cayman Islands, or the Companies Act.
Our affairs are governed principally by: (1) Articles of Association; (2) the Companies Act; and (3) the common law of the Cayman Islands. As provided in our Articles of Association, subject to Cayman Islands law, we have full capacity to carry on or undertake any business or activity, do any act or enter into any transaction, and, for such purposes, full rights, powers and privileges. Our registered office is 4th floor, Harbour Place, 103 South Church Street, PO Box 10240, Grand Cayman, KYI-1002, Cayman Islands.
The following is a summary of the material provisions of our authorized share capital and our Articles of Association. This discussion does not purport to be complete and is qualified in its entirety by reference to our Memorandum and Articles of Association. The form of our Articles of Association is filed as an exhibit to this annual report.
Share Capital
Our Articles of Association authorize two classes of common shares: Class A common shares, which are entitled to one (1) vote per share, and Class B common shares, which are entitled to ten (10) per share. Any holder of Class B common shares may convert his or her shares at any time into Class A common shares on a share-for-share basis. The rights of the two classes of common shares are otherwise identical, except as described below. See “—Anti-Takeover Provisions in our Articles of Association—Two Classes of Common Shares.”
Our Articles of Association authorize the issuance of up to 2,100,000,000 common shares of our authorized share capital. As of the date of this annual report, 77,694,185 Class A common shares and 106,457,170 Class B common shares of our authorized share capital were issued, fully paid and outstanding.
The remaining authorized but unissued shares are presently undesignated and may be issued by our board of directors as common shares of any class or as shares with preferred, deferred or other special rights or restrictions.
Treasury Shares
As of December 31, 2023 we did not hold any time into Class A common shares on a share-for-share basis. The rights of the two classes of common shares are otherwise identical, except as described below. See “—Anti-Takeover Provisions in our Articles of Association—Two Classes of Common Shares.”
Our Articles of Association authorize the issuance of up to 2,100,000,000 common shares of our authorized share capital. As of the date of this annual report, 81,143,035 Class A common shares and 107,849,494 Class B common shares of our authorized share capital were issued, fully paid and outstanding.
The remaining authorized but unissued shares are presently undesignated and may be issued by our board of directors as common shares of any class or as shares with preferred, deferred or other special rights or restrictions.
Treasury Stock
On December 31, 2022, the Company held 81,024 Class A common shares in treasury.
109
Issuance of Shares
Except as expressly provided in our Articles of Association, our board of directors has general and unconditional authority to allot, grant options over, offer or otherwise deal with or dispose of any unissued shares in the company’s capital without the approval of our shareholders (whether forming part of the original or any increased share capital), either at a premium or at par, with or without preferred, deferred or other special rights or restrictions, whether in regard to dividend, voting, return of capital or otherwise and to such persons, on such terms and conditions, and at such times as the directors may decide, but so that no share shall be issued at a discount, except in accordance with the provisions of the Companies Act. In accordance with its Articles of Association, we shall not issue bearer shares.
Our Articles of Association provide that at any time that there are Class A common shares in issue, additional Class B common shares may only be issued pursuant to (1) a share split, subdivision of shares or similar transaction or where a dividend or other distribution is paid by the issue of shares or rights to acquire shares or following capitalization of profits; or (2) a merger, consolidation, or other business combination involving the issuance of Class B common shares as full or partial consideration. In light of: (a) the above provisions; (b) the fact that future transfers by holders of Class B common shares will generally result in those shares converting to Class A common shares, subject to limited exceptions as provided in the Articles of Association; and (c) the ten-to-one voting ratio between our Class B common shares and Class A common shares, means that holders of our Class B common shares will in many situations continue to maintain control of all matters requiring shareholder approval. This concentration of ownership and voting power will limit or preclude investors’ ability to influence corporate matters for the foreseeable future.
Our Articles of Association also provide that the issuance of non-voting common shares requires the affirmative vote of a majority of the of then-outstanding Class A common shares.
Fiscal Year
Our fiscal year begins on January 1 of each year and ends on December 31 of the same year.
Voting Rights
The holders of the Class A common shares and Class B common shares have identical rights, except that (1) the holder of Class B common shares is entitled to ten (10) votes per share, whereas holders of Class A common shares are entitled to one (1) vote per share; and (2) Class B common shares have certain conversion rights. For more information see “—Conversion.” The holders of Class A common shares and Class B common shares vote together as a single class on all matters (including the election of directors) submitted to a vote of shareholders, except as provided below and as otherwise required by law.
Our Articles of Association provide as follows regarding the respective rights of holders of Class A common shares and Class B common shares:
| (1) |
|
| (2) |
|
| (3) |
|
110
As set forth in the Articles of Association, the holders of Class A common shares and Class B common shares, respectively, do not have the right to vote separately if the number of authorized shares of such class is increased or decreased. Rather, the number of authorized Class A common shares and Class B common shares may be increased or decreased (but not below the number of shares of such class then outstanding) by the affirmative vote of the holders of a majority of the voting power of the issued and outstanding Class A common shares and Class B common shares, voting together in a general meeting.
Preemptive or Similar Rights
The Class A common shares and Class B common shares are not entitled to preemptive rights upon transfer and are not subject to conversion (except as described below under “—Conversion”), redemption or sinking fund provisions.
Conversion
The outstanding Class B common shares are convertible at any time as follows: (1) at the option of the holder, a Class B common share may be converted at any time into one Class A common share; and (2) on the election of the holders of (A) two-thirds of the then issued and outstanding Class B common shares, prior to the tenth anniversary of our initial public offering, and (B) the majority of the then issued and outstanding Class B common shares following the tenth anniversary of our initial public offering.
In addition, each Class B common share will convert automatically into one Class A common share upon (1) any transfer, whether or not for value, except for certain transfers described in our Articles of Association, including transfer between controlling shareholders, transfers to affiliates and for tax and estate planning purposes, so long as the transferring holder continues to hold voting and dispositive power with respect to the shares transferred, or in the case of the controlling shareholders, one of the controlling shareholders continues to hold voting and dispositive power with respect to the shares transferred; or (2) if, at any time, the total number of the issued and outstanding Class B common shares represents less than 10% of the total number of shares outstanding.
Furthermore, the Company has agreed with each of the controlling shareholders that the Class B common shares held by each controlling shareholder will convert automatically into one Class A common share on the ninety-day anniversary of the death or permanent disability of such controlling shareholder, provided, however, that during such period the surviving controlling shareholder shall have the option (but not the obligation) to receive such Class B common shares in exchange for Class A common shares at a ratio of 1-to-1.
Equal Status
Except as expressly provided in our Articles of Association, Class A common shares and Class B common shares have the same rights and privileges and rank equally, share proportionally and are identical in all respects as to all matters. In the event of any merger, consolidation, scheme, arrangement or other business combination requiring the approval of our shareholders entitled to vote thereon (whether or not we are the surviving entity), the holders of Class A common shares shall have the right to receive, or the right to elect to receive, the same form of consideration as the holders of Class B common shares, and the holders of Class A common shares shall have the right to receive, or the right to elect to receive, at least the same amount of consideration on a per share basis as the holders of Class B common shares. In the event of any (1) tender or exchange offer to acquire any Class A common
111
Furthermore, the Company has agreed with each of the controlling shareholders that the Class B common shares held by each controlling shareholder will convert automatically into one Class A common share on the ninety-day anniversary of the death or permanent disability of such controlling shareholder, provided, however, that during such period the surviving controlling shareholder shall have the option (but not the obligation) to receive such Class B common shares in exchange for Class A common shares at a ratio of 1-to-1.
Equal Status
Except as expressly provided in our Articles of Association, Class A common shares and Class B common shares have the same rights and privileges and rank equally, share proportionally and are identical in all respects as to all matters. In the event of any merger, consolidation, scheme, arrangement or other business combination requiring the approval of our shareholders entitled to vote thereon (whether or not we are the surviving entity), the holders of Class A common shares shall have the right to receive, or the right to elect to receive, the same form of consideration as the holders of Class B common shares, and the holders of Class A common shares shall have the right to receive, or the right to elect to receive, at least the same amount of consideration on a per share basis as the holders of Class B common shares. In the event of any (1) tender or exchange offer to acquire any Class A common shares or Class B common shares by any third-party pursuant to an agreement to which we are a party; or (2) any tender or exchange offer by us to acquire any Class A common shares or Class B common shares, the holders of Class A common shares shall have the right to receive, or the right to elect to receive, the same form of consideration as the holders of Class B common shares, and the holders of Class A common shares shall have the right to receive, or the right to elect to receive, at least the same amount of consideration on a per share basis as the holders of Class B common shares.
Record Dates
For the purpose of determining shareholders entitled to notice of, or to vote at any general meeting of shareholders or any adjournment thereof, or shareholders entitled to receive dividend or other distribution payments, or in order to make a determination of shareholders for any other purpose, our board of directors may set a record date which shall not exceed forty (40) clear days prior to the date where the determination will be made.
General Meetings of Shareholders
As a condition of admission to a shareholders’ meeting, a shareholder must be duly registered as our shareholder at the applicable record date for that meeting and, in order to vote, all calls or installments then payable by such shareholder to us in respect of the shares that such shareholder holds must have been paid.
Subject to any special rights or restrictions as to voting then attached to any shares, at any general meeting every shareholder who is present in person or by proxy (or, in the case of a shareholder being a corporation, by its duly authorized representative not being himself or herself a shareholder entitled to vote) shall have one (1) vote per Class A common share and ten (10) per Class B common share.
As a Cayman Islands exempted company, we are not obliged by the Companies Act to call annual general meetings; however, the Articles of Association provide that in each year the company will hold an annual general meeting of shareholders, at a time determined by the board of directors; provided, that our board of directors has the discretion as to whether or not to hold an annual general meeting in 2021. The agenda for an annual general meeting of shareholders will only include such items as have been included therein by the board of directors.
Also, we may, but are not required to (unless required by the laws of the Cayman Islands), hold other extraordinary general meetings during the year. General meetings of shareholders will be held where the directors so decide. To the extent permitted by law, annual general meetings may also be held virtually.
The Companies Act provides shareholders a limited right to request a general meeting and does not provide shareholders with any right to put any proposal before a general meeting in default of a company’s Articles of Association. However, these rights may be provided in a company’s Articles of Association. Our Articles of Association provides that upon the requisition of one or more shareholders representing not less than one-third of the voting rights entitled to vote at general meetings, the board will convene an extraordinary general meeting and put the resolutions so requisitioned to a vote at such meeting. The Articles of Association provide no other right to put any proposals before annual general meetings or extraordinary general meetings.
115
Subject to regulatory requirements, the annual general meeting and any extraordinary general meetings must be called by not less than ten (10) clear days’ notice prior to the relevant shareholders meeting and convened by a notice, as discussed below. Alternatively, upon the prior consent of all holders entitled to receive notice, with regards to the annual general meeting, and the holders of 95% in par value of the shares entitled to attend and vote at an extraordinary general meeting, that meeting may be convened by a shorter notice and in a manner deemed appropriate by those holders.
We will give notice of each general meeting of shareholders by publication on its website and in any other manner that it may be required to follow in order to comply with Cayman Islands law, NYSE and SEC requirements. The holders of registered shares may be given notice of a shareholders’ meeting by means of letters sent to the addresses of those shareholders as registered in our shareholders’ register, or, subject to certain statutory requirements, by electronic means.
112
Holders whose shares are registered in the name of DTC or its nominee, which we expect will be the case for substantially all holders of Class A common shares, will not be a shareholder or member of the company and must rely on the procedures of DTC regarding notice of shareholders’ meetings and the exercise of rights of a holder of the Class A common shares.
A quorum for a general meeting consists of any one or more persons holding or representing by proxy not less than one-third of the aggregate voting power of all shares in issue and entitled to vote upon the business to be transacted.
A resolution put to a vote at a general meeting shall be decided on a poll. An ordinary resolution to be passed by the shareholders at a general meeting requires the affirmative vote of a simple majority of the votes cast by, or on behalf of, the shareholders entitled to vote, present in person or by proxy and voting at the meeting. A special resolution requires the affirmative vote on a poll of no less than two-thirds of the votes cast by the shareholders entitled to vote who are present in person or by proxy at a general meeting. Both ordinary resolutions and special resolutions may also be passed by a unanimous written resolution signed by all the shareholders of our Company, as permitted by the Companies Act and our Articles of Association.
Pursuant to our Articles of Association, general meetings of shareholders are to be chaired by the chairman of our board of directors or in his absence the vice-chairman of the board of directors. If both the chairman and vice-chairman of our board of directors are absent, the directors present at the meeting shall appoint one of them to be chairman of the general meeting. If neither the chairman nor another director is present at the general meeting within 15 minutes after the time appointed for holding the meeting, the shareholders present in person or by proxy and entitled to vote may elect any one of the shareholders to be chairman. The order of business at each meeting shall be determined by the chairman of the meeting, and he or she shall have the right and authority to prescribe such rules, regulations and procedures and to do all such acts and things as are necessary or desirable for the proper conduct of the meeting, including, without limitation, the establishment of procedures for the maintenance of order and safety, limitations on the time allotted to questions or comments on the affairs of the Company, restrictions on entry to such meeting after the time prescribed for the commencement thereof, and the opening and closing of the polls.
Liquidation Rights
If we are voluntarily wound up, the liquidator, after taking into account and giving effect to the rights of preferred and secured creditors and to any agreement between us and any creditors that the claims of such creditors shall be subordinated or otherwise deferred to the claims of any other creditors and to any contractual rights of set-off or netting of claims between us and any person or persons (including without limitation any bilateral or any multi-lateral set-off or netting arrangements between the company and any person or persons) and subject to any agreement between us and any person or persons to waive or limit the same, shall apply our property in satisfaction of its liabilities pari passu and subject thereto shall distribute the property amongst the shareholders according to their rights and interests into us.
116
Changes to Capital
Pursuant to the Articles of Association, we may from time to time by ordinary resolution:
increase our share capital by such sum, to be divided into shares of such amount, as the resolution shall prescribe;
consolidate and divide all or any of our share capital into shares of a larger amount than its existing shares;
| • | convert all or any of our paid-up shares into stock and reconvert that stock into paid up shares of any denomination; |
subdivide our existing shares or any of them into shares of a smaller amount; provided, that in the subdivision the proportion between the amount paid and the amount, if any, unpaid on each reduced share shall be the same as it was in the case of the share from which the reduced share is derived; or
113
cancel any shares which, at the date of the passing of the resolution, have not been taken or agreed to be taken by any person and diminish the amount of our share capital by the amount of the shares so canceled.
Our shareholders may by special resolution, subject to confirmation by the Grand Court of the Cayman Islands on an application by the Company for an order confirming such reduction, reduce our share capital or any capital redemption reserve in any manner permitted by law.
In addition, subject to the provisions of the Companies Act and our Articles of Association, we may:
issue shares on terms that they are to be redeemed or are liable to be redeemed;
purchase its own shares (including any redeemable shares); and
make a payment in respect of the redemption or purchase of its own shares in any manner authorized by the Companies Act, including out of its own capital.
Transfer of Shares
Subject to any applicable restrictions set forth in the Articles of Association, any of our shareholder may transfer all or any of his or her common shares by an instrument of transfer in the usual or common form or in the form prescribed by the NYSE or any other form approved by the Company’s board of directors.
The Class A common shares are traded on the NYSE in book-entry form and may be transferred in accordance with our Articles of Association and the NYSE rules and regulations.
However, our board of directors may, in its absolute discretion, decline to register any transfer of any common share which is either not fully paid up to a person of whom it does not approve or is issued under any share incentive scheme for employees which contains a transfer restriction that is still applicable to such common share. The board of directors may also decline to register any transfer of any common share unless:
a fee of such maximum sum as the NYSE may determine to be payable or such lesser sum as the board of directors may from time to time require is paid to us in respect thereof;
the instrument of transfer is lodged with us, accompanied by the certificate (if any) for the common shares to which it relates and such other evidence as our board of directors may reasonably require to show the right of the transferor to make the transfer;
117
the instrument of transfer is in respect of only one class of shares;
the instrument of transfer is properly stamped, if required;
the common shares transferred are free of any lien in our favor; and
in the case of a transfer to joint holders, the transfer is not to more than four joint holders.
If the directors refuse to register a transfer they are required, within two months after the date on which the instrument of transfer was lodged, to send to the transferee notice of such refusal.
Share Repurchase
The Companies Act and the Articles of Association permit us to purchase our own common shares, subject to certain restrictions. The board of directors may only exercise this power on our behalf, subject to the Companies Act, the Articles of Association and to any applicable requirements imposed from time to time by the SEC, the NYSE, or by any recognized stock exchange on which our securities are listed.
114
On August 8, 2022, our board of directors authorized us to repurchase Class A common shares, with par value of US$0.0001 per share, for an aggregate consideration of up to US$30.0 million. This authorization expired on August 8, 2023.
On August 8, 2023, our board of directors authorized us to repurchase Class A common shares, with par value of US$0.0001 per share, for an aggregate consideration of up to US$20.0 million. This authorization is scheduled to expire on August 8, 2023.2024.
See “Item 16E. Purchases of Equity Securities by the Issuer and Affiliated Purchasers” for additional information.
Dividends and Capitalization of Profits
We have not adopted a dividend policy with respect to payments of any future dividends by us. Subject to the Companies Act, our shareholders may, by resolution passed by a simple majority of the voting rights entitled to vote at a general meeting, declare dividends (including interim dividends) to be paid to shareholders but no dividend shall be declared in excess of the amount recommended by the board of directors. The board of directors may also declare dividends. Dividends may be declared and paid out of funds lawfully available to us. Except as otherwise provided by the rights attached to shares and our Articles of Association, all dividends shall be paid in proportion to the number of Class A common shares or Class B common shares a shareholder holds at the date the dividend is declared (or such other date as may be set as a record date); but, (1) if any share is issued on terms providing that it shall rank for dividend as from a particular date, that share shall rank for dividend accordingly; and (2) where we have shares in issue which are not fully paid up (as to par value) we may pay dividends in proportion to the amounts paid up on each share.
The holders of Class A common shares and Class B common shares shall be entitled to share equally in any dividends that may be declared in respect of our common shares from time to time. In the event that a dividend is paid in the form of Class A common shares or Class B common shares, or rights to acquire Class A common shares or Class B common shares, (1) the holders of Class A common shares shall receive Class A common shares, or rights to acquire Class A common shares, as the case may be; and (2) the holders of Class B common shares shall receive Class B common shares, or rights to acquire Class B common shares, as the case may be.
Appointment, Disqualification and Removal of Directors
We are managed by our board of directors. The Articles of Association provide that, unless otherwise determined by an ordinary resolution of shareholders, the board of directors will be composed of four (4) to eleven (11) directors, with the number being determined by a majority of the directors then in office. There are no provisions relating to retirement of directors upon reaching any age limit. The Articles of Association also provide that, while our shares are admitted to trading on the NYSE and we meet all other requirements set forth by U.S. securities laws to continue to qualify as a foreign private issuer, the board of directors must always comply with the residency and citizenship requirements of the U.S. securities laws applicable to foreign private issuers.
118
The Articles of Association provide that directors shall be elected by an ordinary resolution of our shareholders, which requires the affirmative vote of a simple majority of the votes cast on the resolution by the shareholders entitled to vote who are present, in person or by proxy, at the meeting. Each director shall be appointed and elected for such term as the resolution appointing him or her may determine or until his or her death, resignation or removal. Notwithstanding the foregoing, our controlling shareholders may appoint: (1) a majority of the total number of directors rounded upward to the nearest whole number, for so long as they hold at least 25% of our outstanding voting power; (2) 25% total number of directors rounded upward to the nearest whole number, for so long as they hold at least 10% of our outstanding voting power; and (3) 10% total number of directors rounded upward to the nearest whole number, for so long as they hold less than 10% but more than 5% of our outstanding voting power. The controlling shareholders may in like manner remove such director(s) appointed by them and appoint such replacement director(s).
115
Our Articles of Association provide that from and after the date on which our controlling shareholders (and/or their respective affiliates) no longer constitute a group that beneficially owns more than 50% of our outstanding voting power on the classifying date, (the Classifying Date), the directors shall be divided into three classes designated Class I, Class II and Class III. Each director shall serve for a term ending on the date of the third annual general meeting of the shareholders following the annual general meeting of the shareholders at which such director was elected as subject to the provisions of our Articles of Association, and being understood that for the first designation, directors initially designated as Class I Directors shall serve for a term ending on the date of the first annual general shareholders’ meeting following the Classifying Date, directors initially designated as Class II directors shall serve for a term ending on the second annual general meeting of shareholders following the Classifying Date, and directors initially designated as Class III directors shall serve for a term ending on the date of the third annual general meeting of the shareholders following the Classifying Date. For so long as our controlling shareholders hold at least 25% of our outstanding voting power, the directors appointed by our controlling shareholders shall be allocated to Class III and for so long as they hold more than 25% of our outstanding voting power (and therefore have the power to appoint a majority of the directors), the directors appointed by our controlling shareholders shall be allocated to Class III (which will accordingly be comprised solely of such directors) and the remainder of the directors appointed by our controlling shareholders will be allocated to Class II unless, in each case, our controlling shareholders otherwise determine.
Our directors are Geraldo do Carmo Thomaz Júnior, Mariano Gomide de Faria, Francisco Alvarez-Demalde, Alejandro Raul Scannapieco, Arshad Matin, Benoit Fouilland and Benoit Fouilland.Silvia Mazzucchelli. Alejandro Raul Scannapieco, and Benoit Fouilland and Silvia Mazzucchelli are members of our audit committee and “independent” as that term is defined under Rule 10A-3 of the Exchange Act. Arshad Matin is a member of our compensation committee and would be “independent” as that term is defined under Section 303A.02 of the Corporate Governance Rules of the NYSE.
Any vacancies on the board of directors that arise other than upon the removal of a director by resolution passed at a general meeting can be filled by the remaining directors (notwithstanding that they may constitute less than a quorum). Any such appointment shall be as an interim director to fill such vacancy until the next annual general meeting of shareholders.
Additions to the existing board (within the limits set pursuant to the Articles of Association) may be made by ordinary resolution of the shareholders.
Grounds for Removing a Director
Except for directors appointed by the controlling shareholders, which may be removed by them at any time at their discretion, before the expiration of his or her term of office, a director may only be removed for cause by ordinary resolution in accordance with the provisions of our Articles of Association. Cause shall mean, in relation to a director, the occurrence of any of the following events: (1) the person’s conviction by final judgment issued by a competent court or declaration of guilt before a competent court with respect to any offense considered an intentional crime or punishable by detention, or a torpid act, intentional fraud, improbity, theft or anti-ethic business conduct in the jurisdiction involved; (2) fraud, theft, financial dishonesty, misappropriation or embezzlement of funds by the person, whether before or after the date of his/her election, that adversely affects us; (3) breach or willful misconduct by the person in the performance of its obligations, including, among others, (a) uninterrupted or repeated omission or refusal to perform the obligations and duties established in the Articles of Association or in the applicable laws, (b) incapacity, by the person, to comply with the obligations and duties as a result of an alcohol or drug addiction; or (4) willful misconduct that causes material damages to or that adversely affects the financial situation or our commercial reputation.
119
The notice of the general meeting must contain a statement of the intention to remove the director and must be served on the director not less than ten (10) calendar days before the meeting. The director is entitled to attend the meeting and be heard on the motion for his removal.
The office of a director will be vacated automatically if he or she (1) becomes prohibited by law from being a director; (2) becomes bankrupt or makes an arrangement or composition with his creditors; (3) dies or is, in the opinion of all his co-directors, incapable by reason of mental disorder of discharging his duties as director; (4) resigns his office by notice to us; or (5) has for more than six months been absent without permission of the directors from meetings of the board of directors held during that period, and the remaining directors resolve that his or her office be vacated.
116
Proceedings of the Board of Directors
Our Articles of Association provide that our business is to be managed and conducted by the board of directors. The quorum necessary for the board meeting shall be a simple majority of the directors then in office (subject to there being a minimum of two (2) directors present) and business at any meeting shall be decided by a majority of votes. In the case of an equality of votes, the chairman shall have a casting vote. Subject to the provisions of the Articles of Association, the board of directors may regulate its proceedings as they determine is appropriate. Board meetings shall be held at least once every calendar quarter and shall take place in any location the directors may determine.
Subject to the provisions of the Articles of Association, to any directions given by ordinary resolution of the shareholders and the listing rules of the NYSE, the board of directors may from time to time at its discretion exercise all powers of VTEX, including, subject to the Companies Act, the power to issue debentures, bonds and other securities of the company, whether outright or as collateral security for any debt, liability or obligation of our company or of any third party.
Chairman and Vice-Chairman
Our board of directors will have at least one chairman who is elected and appointed by the controlling shareholders to act as the chairman at board meetings as long as the controlling shareholders hold at least 50% of all outstanding voting powers of the shareholders. Where the controlling shareholders do not have such voting power then the board of directors shall have a chairman elected and appointed by the board of directors to act as the chairman at board meetings. A vice-chairman may be elected to act in the absence of the chairman at board meetings in the same manner as above including controlling shareholders appointment.
The period for which the chairman and/or the vice-chairman shall hold office shall be determined in accordance with the Articles of Association. The chairman shall preside as chairman at every meeting of the board of directors at which he is present. Where the chairman is not present at a meeting of the board of directors, the vice-chairman, if any, shall act as chairman, or in his absence, the attending directors of the board of directors may choose one director to be the chairman of the meeting.
Inspection of Books and Records
Holders of our shares will have no general right under Cayman Islands law to inspect or obtain copies of the list of shareholders or corporate records of the Company. However, the board of directors may determine from time to time whether and to what extent our accounting records and books shall be open to inspection by shareholders who are not members of the board of directors. Notwithstanding the above, the Articles of Association provide shareholders with the right to receive annual financial statements. Such right to receive annual financial statements may be satisfied by publishing the same on the company’s website or filing such annual reports as we are required to file with the SEC.
120
Register of Shareholders
The Class A common shares are held through DTC, and DTC or Cede & Co., as nominee for DTC, recorded in the shareholders’ register as the holder of our Class A common shares.
Under Cayman Islands law, we must keep a register of shareholders that includes:
the names and addresses of the shareholders, a statement of the shares held by each member, and of the amount paid or agreed to be considered as paid, on the shares of each member;
117
the date on which the name of any person was entered on the register as a member; and
the date on which any person ceased to be a member.
Under Cayman Islands law, our register of shareholders is prima facie evidence of the matters set out therein (i.e., the register of shareholders will raise a presumption of fact on the matters referred to above unless rebutted) and a shareholder registered in the register of shareholders is deemed as a matter of Cayman Islands law to have prima facie legal title to the shares as set against his or her name in the register of shareholders. Once the register of shareholders has been updated, the shareholders recorded in the register of shareholders should be deemed to have legal title to the shares set against their name.
However, there are certain limited circumstances where an application may be made to a Cayman Islands court for a determination on whether the register of shareholders reflects the correct legal position. Further, the Cayman Islands court has the power to order that the register of shareholders maintained by a company should be rectified where it considers that the register of shareholders does not reflect the correct legal position. If an application for an order for rectification of the register of shareholders were made in respect of our ordinary shares, then the validity of such shares may be subject to re-examination by a Cayman Islands court.
Exempted Company
We are an exempted company with limited liability under the Companies Act. The Companies Act distinguishes between ordinary resident companies and exempted companies. Any company that is registered in the Cayman Islands but conducts business mainly outside of the Cayman Islands may apply to be registered as an exempted company. The requirements for an exempted company are essentially the same as for an ordinary company except for the exemptions and privileges listed below:
an exempted company does not have to file an annual return of its shareholders with the Registrar of Companies;
an exempted company’s register of shareholders is not open to inspection;
an exempted company does not have to hold an annual general meeting;
an exempted company may obtain an undertaking against the imposition of any future taxation (such undertakings are usually given for 20 years in the first instance);
an exempted company may register by way of continuation in another jurisdiction and be deregistered in the Cayman Islands;
an exempted company may register as a limited duration company; and
an exempted company may register as a segregated portfolio company.
“Limited liability” means that the liability of each shareholder is limited to the amount unpaid by the shareholder on the shares of the company (except in exceptional circumstances, such as involving fraud, the establishment of an agency relationship or an illegal or improper purpose or other circumstances in which a court may be prepared to pierce or lift the corporate veil).
121
Anti-Takeover Provisions in our Articles of Association
Some provisions of the Articles of Association may discourage, delay or prevent a change in our control or management that shareholders may consider favorable. In particular, our capital structure concentrates ownership of voting rights in the hands of our controlling shareholders. These provisions, which are summarized below, are expected to discourage coercive takeover practices and inadequate takeover bids. These provisions are also designed to encourage persons seeking to acquire our control to first negotiate with the board of directors. However, these
118
provisions could also have the effect of discouraging others from attempting hostile takeovers and, consequently, they may also inhibit temporary fluctuations in the market price of the Class A common shares that often result from actual or rumored hostile takeover attempts. These provisions may also have the effect of preventing changes in our management. It is possible that these provisions could make it more difficult to accomplish transactions that shareholders may otherwise deem to be in their best interests.
Two Classes of Common Shares
Our Class B common shares are entitled to ten (10) votes per share, while the Class A common shares are entitled to one (1) vote per share. Our controlling shareholders own a majority of our Class B common shares, they have the ability to elect certain directors (see “—Appointment, Disqualification and Removal of Directors” above) and to determine the outcome of most matters submitted for a vote of shareholders. This concentrated voting control could discourage others from initiating any potential merger, takeover, or other change of control transaction that other shareholders may view as beneficial.
So long as our controlling shareholders have the ability to determine the outcome of most matters submitted to a vote of shareholders as well as the overall management and direction of VTEX, third parties may be deterred in their willingness to make an unsolicited merger, takeover, or other change of control proposal, or to engage in a proxy contest for the election of directors. As a result, the fact that we have two classes of common shares may have the effect of depriving investors as a holder of Class A common shares of an opportunity to sell their Class A common shares at a premium over prevailing market prices and make it more difficult to replace the directors and management of VTEX.
Preferred Shares
Our board of directors is given wide powers to issue one or more classes or series of shares with preferred rights. Such preferences may include, for example, dividend rights, conversion rights, redemption privileges, enhanced voting powers and liquidation preferences.
Despite the anti-takeover provisions described above, under Cayman Islands law, our board of directors may only exercise the rights and powers granted to them under the Articles of Association, for what they believe in good faith to be in our best interests.
Protection of Non-Controlling Shareholders
The Grand Court of the Cayman Islands may, on the application of shareholders holding not less than one fifth of our shares in issue, appoint an inspector to examine the Company’s affairs and report thereon in a manner as the Grand Court shall direct.
Subject to the provisions of the Companies Act, any shareholder may petition the Grand Court of the Cayman Islands which may make a winding up order, if the court is of the opinion that this winding up is just and equitable.
122
Notwithstanding the U.S. securities laws and regulations that are applicable to us, general corporate claims against us by our shareholders must, as a general rule, be based on the general laws of contract or tort applicable in the Cayman Islands or their individual rights as shareholders as established by our Articles of Association.
The Cayman Islands courts ordinarily would be expected to follow English case law precedents, which permit a minority shareholder to commence a representative action against us, or derivative actions in our name, to challenge (1) an act which is ultra vires or illegal; (2) an act which constitutes a fraud against the minority and the wrongdoers themselves control VTEX; and (3) an irregularity in the passing of a resolution that requires a qualified (or special) majority.
119
Registration Rights
We entered into a registration rights agreement with certain pre-IPO shareholders representing a substantial portion of our issued share capital pursuant to which we granted them customary registration rights for the resale of the Class A common shares held by them (including Class A common shares acquired upon conversion of Class B common shares). Registration of these shares under the Securities Act would result in these shares becoming freely tradable without restriction under the Securities Act immediately upon the effectiveness of the registration, except for shares purchased by affiliates. Class A common shares covered by a registration statement will be eligible for sales in the public. In addition, even if such shareholders do not exercise their formal registration rights, they or entities controlled by them or their permitted transferees will, subject to the lock-up agreements described below, be able to sell their shares in the public market from time to time without registering them, subject to certain limitations on the timing, amount and method of those sales imposed by regulations promulgated by the SEC.
Principal Differences between Cayman Islands and U.S. Corporate Law
The Companies Act was modeled originally after similar laws in England and Wales but does not follow subsequent statutory enactments in England and Wales. In addition, the Companies Act differs from laws applicable to U.S. corporations and their shareholders. Set forth below is a summary of the significant differences between the provisions of the Companies Act applicable to us and the laws applicable to companies incorporated in the United States and their shareholders.
Mergers and Similar Arrangements
In certain circumstances the Companies Act allows for mergers or consolidations between two Cayman Islands companies, or between a Cayman Islands company and a company incorporated in another jurisdiction (provided, that is facilitated by the laws of that other jurisdiction).
Where the merger or consolidation is between two Cayman Islands companies, the directors of each company must approve a written plan of merger or consolidation, containing certain prescribed information. That plan of merger or consolidation must then be authorized by either (x) a special resolution (usually a majority of 662/3% in value) of the shareholders of each company; or (y) such other authorization, if any, as may be specified in such company’s articles of association. No shareholder resolution is required for a merger between a parent company (i.e., a company that owns at least 90% of the issued shares of each class in a subsidiary company) and its subsidiary company. The consent of each holder of a fixed or floating security interest of a constituent company must be obtained, unless the court waives such requirement. If the Cayman Islands Registrar of Companies is satisfied that the requirements of the Companies Act (which includes certain other formalities) have been complied with, the Registrar of Companies will register the plan of merger or consolidation. Where the merger or consolidation involves a foreign company, the procedure is similar, save that with respect to the foreign company, the director of the Cayman Islands company is required to make a declaration to the effect that, having made due enquiry, he is of the opinion that the requirements set out below have been met: (1) that the merger or consolidation is permitted or not prohibited by the constitutional documents of the foreign company and by the laws of the jurisdiction in which the foreign company is incorporated, and that those laws and any requirements of those constitutional documents have been or will be complied with; (2) that no petition or other similar proceeding has been filed and remains outstanding or order made or resolution adopted to wind up or liquidate the foreign company in any jurisdictions; (3) that no receiver, trustee, administrator or other similar person has been appointed in any
123
jurisdiction and is acting in respect of the foreign company, its affairs or property or any part thereof; (4) that no scheme, order, compromise or other similar arrangement has been entered into or made in any jurisdiction whereby the rights of creditors of the foreign company are and continue to be suspended or restricted.
Where the surviving company is the Cayman Islands company, the director of the Cayman Islands company is further required to make a declaration to the effect that, having made due enquiry, he is of the opinion that the following requirements have been met: (1) that the foreign company is able to pay its debts as they fall due and that the merger or consolidation is bona fide and not intended to defraud unsecured creditors of the foreign company; (2) that in respect of the transfer of any security interest granted by the foreign company to the surviving or consolidated company (a) consent or approval to the transfer has been obtained, released or waived; (b) the transfer is permitted by and has been approved in accordance with the constitutional documents of the foreign company; and (c) the laws of the jurisdiction of the foreign company with respect to the transfer have been or will be complied with; (3) that the foreign company will, upon the merger or consolidation becoming effective, cease to be incorporated, registered or exist under the laws of the relevant foreign jurisdiction; and (4) that there is no other reason why it would be against the public interest to permit the merger or consolidation.
120
Where the above procedures are adopted, the Companies Act provides for a right of dissenting shareholders to be paid a payment of the fair value of his shares upon their dissenting to the merger or consolidation if they follow a prescribed procedure. In essence, that procedure is as follows (1) the shareholder must give his written objection to the merger or consolidation to the constituent company before the vote on the merger or consolidation, including a statement that the shareholder proposes to demand payment for his shares if the merger or consolidation is authorized by the vote; (2) within 20 days following the date on which the merger or consolidation is approved by the shareholders, the constituent company must give written notice to each shareholder who made a written objection; (3) a shareholder must within 20 days following receipt of such notice from the constituent company, give the constituent company a written notice of his intention to dissent including, among other details, a demand for payment of the fair value of his shares; (4) within seven days following the date of the expiration of the period set out in paragraph (2) above or seven days following the date on which the plan of merger or consolidation is filed, whichever is later, the constituent company, the surviving company or the consolidated company must make a written offer to each dissenting shareholder to purchase his shares at a price that the company determines is the fair value and if the company and the shareholder agree the price within 30 days following the date on which the offer was made, the company must pay the shareholder such amount; and (5) if the company and the shareholder fail to agree a price within such 30 day period, within 20 days following the date on which such 30 day period expires, the company (and any dissenting shareholder) must file a petition with the Cayman Islands Grand Court to determine the fair value and such petition must be accompanied by a list of the names and addresses of the dissenting shareholders with whom agreements as to the fair value of their shares have not been reached by the company. At the hearing of that petition, the court has the power to determine the fair value of the shares together with a fair rate of interest, if any, to be paid by the company upon the amount determined to be the fair value. Any dissenting shareholder whose name appears on the list filed by the company may participate fully in all proceedings until the determination of fair value is reached. These rights of a dissenting shareholder may not be available in certain circumstances, for example, to dissenters holding shares of any class in respect of which an open market exists on a recognized stock exchange or recognized interdealer quotation system at the relevant date or where the consideration for such shares to be contributed are shares of any company listed on a national securities exchange or shares of the surviving or consolidated company.
Moreover, Cayman Islands law also has separate statutory provisions that facilitate the reconstruction or amalgamation of companies in certain circumstances, schemes of arrangement will generally be more suited for complex mergers or other transactions involving widely held companies, commonly referred to in the Cayman Islands as a “scheme of arrangement” which may be tantamount to a merger. In the event that a merger was sought pursuant to a scheme of arrangement (the procedure of which are more rigorous and take longer to complete than the procedures typically required to consummate a merger in the United States), the arrangement in question must be approved by a majority in number of each class of shareholders and creditors with whom the arrangement is to be made, and who must in addition represent three-fourths in value of each such class of shareholders or creditors, as the case may be, that are present and voting either in person or by proxy at a meeting, or meeting summoned for that purpose. The convening of the meetings and subsequently the terms of the arrangement must be sanctioned by the Grand Court of the Cayman Islands. While a dissenting shareholder would have the right to express to the court the view that the transaction should not be approved, the court can be expected to approve the arrangement if it satisfies itself that:
124
we are not proposing to act illegally or beyond the scope of our corporate authority and the statutory provisions as to majority vote have been complied with;
the shareholders have been fairly represented at the meeting in question;
the arrangement is such as a businessman would reasonably approve; and
the arrangement is not one that would more properly be sanctioned under some other provision of the Companies Act or that would amount to a “fraud on the minority.”
121
If a scheme of arrangement or takeover offer (as described below) is approved, any dissenting shareholder would have no rights comparable to appraisal rights, which would otherwise ordinarily be available to dissenting shareholders of United States corporations, providing rights to receive payment in cash for the judicially determined value of the shares.
Squeeze-Out Provisions
When a takeover offer is made and accepted by holders of 90.0% of the shares to whom the offer is made within four months, the offeror may, within a two-month period, require the holders of the remaining shares to transfer such shares on the terms of the offer. An objection may be made to the Grand Court of the Cayman Islands but is unlikely to succeed unless there is evidence of fraud, bad faith, collusion or inequitable treatment of the shareholders.
Further, transactions similar to a merger, reconstruction and/or an amalgamation may in some circumstances be achieved through other means to these statutory provisions, such as a share capital exchange, asset acquisition or control, through contractual arrangements, of an operating business.
Shareholders’ Suits
Our Cayman Islands counsel is not aware of any reported class action having been brought in a Cayman Islands court. Derivative actions have been brought in the Cayman Islands courts, and the Cayman Islands courts have confirmed the availability for such actions. In most cases, we will be the proper plaintiff in any claim based on a breach of duty owed to us, and a claim against (for example) our officers or directors usually may not be brought by a shareholder. However, based on English authorities, which would in all likelihood be of persuasive authority and be applied by a court in the Cayman Islands, exceptions to the foregoing principle apply in circumstances in which:
a company is acting or proposing to act illegally or beyond the scope of its authority;
the act complained of, although not beyond the scope of the authority, could be effected if duly authorized by more than the number of votes which have actually been obtained; or
those who control the company are perpetrating a “fraud on the minority.”
A shareholder may have a direct right of action against us where the individual rights of that shareholder have been infringed or are about to be infringed.
125
Corporate Governance
Cayman Islands law restricts transactions between a company and its directors unless there are provisions in the Articles of Association which provide a mechanism to alleviate possible conflicts of interest. Additionally, Cayman Islands law imposes on directors’ duties of care and skill and fiduciary duties to the companies which they serve. Under our Articles of Association, a director must disclose the nature and extent of his interest in any contract or arrangement, and following such disclosure and subject to any separate requirement under applicable law or the listing rules of the NYSE, and unless disqualified by the chairman of the relevant meeting, the interested director may vote in respect of any transaction or arrangement in which he or she is interested. The interested director shall be counted in the quorum at such meeting and the resolution may be passed by a majority of the directors present at the meeting.
Subject to the foregoing and our Articles of Association, our directors may exercise all the powers of VTEX to vote compensation to themselves or any member of their body in the absence of an independent quorum. We have established a Compensation Committee, but such committee is not required, nor is it expected, to be made up of independent directors or otherwise comply with Section 303A.05 of the Corporate Governance Rules of the NYSE. For further information see “Item 6. Directors, Senior Management and Employees—C. Board Practices —Compensation Committee.”
122
As a foreign private issuer, we are permitted to follow home country practice in lieu of certain corporate NYSE governance rules, subject to certain requirements. We currently rely, and will continue to rely, on the foreign private issuer exemption with respect to the following rules:
| • | Section 303A.01 of the Corporate Governance Rules of the NYSE, which requires that independent directors comprise a majority of a company’s board of directors. As al-lowed by the laws of the Cayman Islands, independent directors do not comprise a majority of our board of directors. |
Section 303A.04 of the Corporate Governance Rules of the NYSE, which requires that a company have a nomination committee comprised solely of “independent directors” as defined by NYSE. As allowed by the laws of the Cayman Islands, we do not have a nomination committee, nor do we have any current intention to establish one.
Section 303A.05 of the Corporate Governance Rules of the NYSE, which require that compensation for our executive officers and selection of our director nominees be determined by a majority of independent directors. Although we currently have a compensation committee, we are not required by the laws of the Cayman Island, nor do we intend, to have such committee comply with Section 303A.05 of the Corporate Governance Rules of the NYSE.
Borrowing Powers
Our directors may exercise all the powers of VTEX to borrow money and to mortgage or charge its undertaking, property and assets (present and future) and uncalled capital or any part thereof and to issue debentures, debenture stock, mortgages, bonds and other such securities whether outright or as security for any debt, liability or obligation of VTEX or of any third party. Such powers may be varied by a special resolution of shareholders (requiring a two-thirds majority vote).
Indemnification of Directors and Executive Officers and Limitation of Liability
The Companies Act does not limit the extent to which a company’s articles of association may provide for indemnification of directors and officers, except to the extent that it may be held by the Cayman Islands courts to be contrary to public policy, such as to provide indemnification against civil fraud or the consequences of committing a crime. Our Articles of Association provides that we shall indemnify and hold harmless our directors and officers against all actions, proceedings, costs, charges, expenses, losses, damages, liabilities, judgments, fines, settlements and other amounts incurred or sustained by such directors or officers, other than by reason of such person’s dishonesty, willful default or fraud, in or about the conduct of our company’s business or affairs (including as a result of any mistake of judgment) or in the execution or discharge of his duties, powers, authorities or discretions, including without prejudice to the generality of the foregoing, any costs, expenses, losses or liabilities incurred by such director or officer in defending (whether successfully or otherwise) any civil, criminal or other proceedings concerning us or our affairs in any court whether in the Cayman Islands or elsewhere. This standard of conduct is generally the same as permitted under the Delaware General Corporation Law for a Delaware corporation.
126
Insofar as indemnification for liabilities arising under the Securities Act may be permitted to our directors, officers or persons controlling the Company under the foregoing provisions, we have been informed that, in the opinion of the SEC, this indemnification is against public policy as expressed in the Securities Act and is therefore unenforceable.
Directors’ and Controlling Shareholders’ Fiduciary Duties
As a matter of Cayman Islands law, a director of a Cayman Islands company is in the position of a fiduciary with respect to the company. Accordingly, directors owe fiduciary duties to their companies to act bona fide in what they consider to be the best interests of the company, to exercise their powers for the purposes for which they are conferred and not to place themselves in a position where there is a conflict between their personal interests and their duty to the company. Accordingly, a director owes a company a duty not to make a profit based on his or her position as director (unless the company permits him or her to do so) and a duty not to put himself or
123
herself in a position where the interests of the company conflict with his or her personal interest or his or her duty to a third party. However, this obligation may be varied by the company’s articles of association, which may permit a director to vote on a matter in which he has a personal interest; provided, that he has disclosed that nature of his interest to the board of directors. Our Articles of Association provides that a director must disclose the nature and extent of his or her interest in any contract or arrangement, and following such disclosure and subject to any separate requirement under applicable law or the listing rules of the NYSE, and unless disqualified by the chairman of the relevant meeting, such director may vote in respect of any transaction or arrangement in which he or she is interested and may be counted in the quorum at the meeting.
A director of a Cayman Islands company also owes to the company duties to exercise independent judgment in carrying out his functions and to exercise reasonable skill, care and diligence, which has both objective and subjective elements. Recent Cayman Islands case law confirmed that directors must exercise the care, skill and diligence that would be exercised by a reasonably diligent person having the general knowledge, skill and experience reasonably to be expected of a person acting as a director. Additionally, a director must exercise the knowledge, skill and experience which he or she actually possesses.
A general notice may be given to the board of directors to the effect that (1) the director is a member or officer of a specified company or firm and is to be regarded as interested in any contract or arrangement which may after the date of the notice be made with that company or firm; or (2) he or she is to be regarded as interested in any contract or arrangement which may after the date of the notice to the board of directors be made with a specified person who is connected with him or her, will be deemed sufficient declaration of interest. This notice shall specify the nature of the interest in question. Following the disclosure being made pursuant to our Articles of Association and subject to any separate requirement under applicable law or the listing rules of the NYSE, and unless disqualified by the chairman of the relevant meeting, a director may vote in respect of any transaction or arrangement in which he or she is interested and may be counted in the quorum at the meeting.
In comparison, under Delaware corporate law, a director of a Delaware corporation has a fiduciary duty to the corporation and its shareholders. This duty has two components: the duty of care and the duty of loyalty. The duty of care requires that a director act in good faith, with the care that an ordinarily prudent person would exercise under similar circumstances. Under this duty, a director must inform himself or herself of, and disclose to shareholders, all material information reasonably available regarding a significant transaction. The duty of loyalty requires that a director act in a manner he or she reasonably believes to be in the best interests of the corporation. He or she must not use his or her corporate position for personal gain or advantage. This duty prohibits self-dealing by a director and mandates that the best interest of the corporation and its shareholders take precedence over any interest possessed by a director, officer or controlling shareholder and not shared by the shareholders generally. In general, actions of a director are presumed to have been made on an informed basis, in good faith and in the honest belief that the action taken was in the best interests of the corporation. However, this presumption may be rebutted by evidence of a breach of one of the fiduciary duties. Should such evidence be presented concerning a transaction by a director, a director must prove the procedural fairness of the transaction, and that the transaction was of fair value to the corporation.
127
Furthermore, as a matter of Cayman Islands law and in contrast to the position under Delaware corporate law, controlling shareholders of Cayman Islands companies do not owe fiduciary duties to those companies, other than the limited duty that applies to all shareholders to exercise their votes to amend a company’s articles of association in good faith in the interests of the company. The absence of this minority shareholder protection might impact the ability of minority shareholders to protect their interests.
Shareholder Proposals
Under the Delaware General Corporation Law, a shareholder has the right to put any proposal before the annual meeting of shareholders, provided it complies with the notice provisions in the governing documents. The Delaware General Corporation Law does not provide shareholders an express right to put any proposal before the annual meeting of shareholders, but Delaware corporations generally afford shareholders an opportunity to make proposals and nominations; provided, that they comply with the notice provisions in the certificate of incorporation or bylaws. A special meeting may be called by the board of directors or any other person authorized to do so in the governing documents, but shareholders may be precluded from calling special meetings.
124
The Companies Act provides shareholders with only limited rights to requisition a general meeting and does not provide shareholders with any right to put any proposal before a general meeting. However, these rights may be provided in a company’s articles of association. Our Articles of Association provides that upon the requisition of one or more shareholders representing not less than one-third of the voting rights entitled to vote at general meetings, the board will convene an extraordinary general meeting and put the resolutions so requisitioned to a vote at such meeting. The Articles of Association provide no other right to put any proposals before annual general meetings or extraordinary general meetings.
Cumulative Voting
Under the Delaware General Corporation Law, cumulative voting for elections of directors is not permitted unless the corporation’s certificate of incorporation specifically provides for it. Cumulative voting potentially facilitates the representation of minority shareholders on a board of directors since it permits the minority shareholder to cast all the votes to which the shareholder is entitled on a single director, which increases the shareholder’s voting power with respect to electing such director. As permitted under Cayman Islands law, our Articles of Association does not provide for cumulative voting. As a result, our shareholders are not afforded any less protections or rights on this issue than shareholders of a Delaware corporation.
Removal of Directors
The office of a director shall be vacated automatically if, among other things, he or she (1) becomes prohibited by law from being a director; (2) becomes bankrupt or makes an arrangement or composition with his creditors; (3) dies or is, in the opinion of all his co-directors, incapable by reason of mental disorder of discharging his duties as director; (4) resigns his office by notice to us; or (5) has for more than six months been absent without permission of the directors from meetings of the board of directors held during that period, and the remaining directors resolve that his/her office be vacated.
Transaction with Interested Shareholders
The Delaware General Corporation Law provides that; unless the corporation has specifically elected not to be governed by this statute, it is prohibited from engaging in certain business combinations with an “interested shareholder” for three years following the date that this person becomes an interested shareholder. An interested shareholder generally is a person or a group who or which owns or owned 15% or more of the target’s outstanding voting shares or who or which is an affiliate or associate of the corporation and owned 15% or more of the corporation’s outstanding voting shares within the past three years. This has the effect of limiting the ability of a potential acquirer to make a two-tiered bid for the target in which all shareholders would not be treated equally. The statute does not apply if, among other things, prior to the date on which the shareholder becomes an interested shareholder, the board of directors approves either the business combination or the transaction which resulted in the person becoming an interested shareholder. This encourages any potential acquirer of a Delaware corporation to negotiate the terms of any acquisition transaction with the target’s board of directors.
128
Cayman Islands law has no comparable statute. As a result, we cannot avail itself of the types of protections afforded by the Delaware business combination statute. However, although Cayman Islands law does not regulate transactions between a company and its significant shareholders, it does provide that the board of directors owe duties to ensure that these transactions are entered into bona fide in the best interests of the company and for a proper corporate purpose and, as noted above, a transaction may be subject to challenge if it has the effect of constituting a fraud on the minority shareholders.
Dissolution; Winding Up
Under the Delaware General Corporation Law, unless the board of directors approves the proposal to dissolve, dissolution must be approved by shareholders holding 100% of the total voting power of the corporation. If the dissolution is initiated by the board of directors, it may be approved by a simple majority of the corporation’s outstanding shares. Delaware law allows a Delaware corporation to include in its certificate of incorporation a supermajority voting requirement in connection with dissolutions initiated by the board. Under Cayman Islands law, a company may be wound up by either an order of the courts of the Cayman Islands or by a special resolution of its members or, if the company resolves by ordinary resolution that it be wound up because it is unable to pay its debts as they fall due. The court has authority to order winding up in a number of specified circumstances including where it is, in the opinion of the court, just and equitable to do so.
125
Under the Companies Act, we may be dissolved, liquidated or wound up by a special resolution of shareholders (requiring a two-thirds majority vote). Our Articles of Association also give its board of directors the authority to petition the Cayman Islands Court to wind-up VTEX.
Variation of Rights of Shares
Under the Delaware General Corporation Law, a corporation may vary the rights of a class of shares with the approval of a majority of the outstanding shares of that class, unless the certificate of incorporation provides otherwise. Under our Articles of Association, if the share capital is divided into more than one class of shares, the rights attached to any class may only be varied with the written consent of the holders of two-thirds of the shares of that class or the sanction of a special resolution passed at a separate meeting of the holders of the shares of that class.
Also, except with respect to share capital (as described above), alterations to our Articles of Association may only be made by special resolution of shareholders (requiring a two-thirds majority vote).
Amendment of Governing Documents
Under the Delaware General Corporation Law, a corporation’s certificate of incorporation may be amended only if adopted and declared advisable by the board of directors and approved by a majority of the outstanding shares entitled to vote, and the bylaws may be amended with the approval of a majority of the outstanding shares entitled to vote and may, if so provided in the certificate of incorporation, also be amended by the board of directors. Under Cayman Islands law, our Articles of Association generally (and save for certain amendments to share capital described in this section) may only be amended by special resolution of shareholders (requiring a two-thirds majority vote).
Rights of Non-Resident or Foreign Shareholders
There are no limitations imposed by our Articles of Association on the rights of non-resident or foreign shareholders to hold or exercise voting rights on our shares. In addition, there are no provisions in the Articles of Association governing the ownership threshold above which shareholder ownership must be disclosed.
129
Handling of Mail
Mail addressed to us and received at our registered office will be forwarded unopened to the forwarding address, which will be supplied by us. None of us, our directors, officers, advisors or service providers (including the organization which provides registered office services in the Cayman Islands) will bear any responsibility for any delay howsoever caused in mail reaching the forwarding address.
Cayman Islands Data Protection
We have certain duties under the Data Protection Act, 2017 of the Cayman Islands, or the DPL, based on internationally accepted principles of data privacy.
Privacy Notice
This privacy notice puts our shareholders on notice that through their investment in us they will provide us with certain personal information which constitutes personal data within the meaning of the DPL, or personal data.
126
Investor Data
We will collect, use, disclose, retain and secure personal data to the extent reasonably required only and within the parameters that could be reasonably expected during the normal course of business. We will only process, disclose, transfer or retain personal data to the extent legitimately required to conduct our activities of on an ongoing basis or to comply with legal and regulatory obligations to which we are subject. We will only transfer personal data in accordance with the requirements of the DPL, and will apply appropriate technical and organizational information security measures designed to protect against unauthorized or unlawful processing of the personal data and against the accidental loss, destruction or damage to the personal data.
In our use of this personal data, we will be characterized as a “data controller” for the purposes of the DPL, while our affiliates and service providers who may receive this personal data from us in the conduct of our activities may either act as our “data processors” for the purposes of the DPL or may process personal information for their own lawful purposes in connection with services provided to us.
We may also obtain personal data from other public sources. Personal data includes, without limitation, the following information relating to a shareholder and/or any individuals connected with a shareholder as an investor: name, residential address, email address, contact details, corporate contact information, signature, nationality, place of birth, date of birth, tax identification, credit history, correspondence records, passport number, bank account details, source of funds details and details relating to the shareholder’s investment activity.
Who this Affects
If you are a natural person, this will affect you directly. If you are a corporate investor (including, for these purposes, legal arrangements such as trusts or exempted limited partnerships) that provides us with personal data on individuals connected to you for any reason in relation your investment in us, this will be relevant for those individuals and you should transmit the content of this Privacy Notice to such individuals or otherwise advise them of its content.
How We May Use a Shareholder’s Personal Data
We may, as the data controller, collect, store and use personal data for lawful purposes, including, in particular: (1) where this is necessary for the performance of our rights and obligations under any agreements; (2) where this is necessary for compliance with a legal and regulatory obligation to which we are or may be subject (such as compliance with anti-money laundering and FATCA/CRS requirements); and/or (3) where this is necessary for the purposes of our legitimate interests and such interests are not overridden by your interests, fundamental rights or freedoms.
130
Should we wish to use personal data for other specific purposes (including, if applicable, any purpose that requires your consent), we will contact you.
Why We May Transfer Your Personal Data
In certain circumstances we may be legally obliged to share personal data and other information with respect to your shareholding with the relevant regulatory authorities such as the Cayman Islands Monetary Authority or the Tax Information Authority. They, in turn, may exchange this information with foreign authorities, including tax authorities.
We anticipate disclosing personal data to persons who provide services to us and their respective affiliates (which may include certain entities located outside the US, the Cayman Islands or the European Economic Area), who will process your personal data on our behalf.
127
The Data Protection Measures We Take
Any transfer of personal data by us or our duly authorized affiliates and/or delegates outside of the Cayman Islands shall be in accordance with the requirements of the DPL.
We and our duly authorized affiliates and/or delegates shall apply appropriate technical and organizational information security measures designed to protect against unauthorized or unlawful processing of personal data, and against accidental loss or destruction of, or damage to, personal data.
We shall notify you of any personal data breach that is reasonably likely to result in a risk to your interests, fundamental rights or freedoms or those data subjects to whom the relevant personal data relates.
| C. | Material Contracts |
On December 11, 2020, our subsidiaries, VTEX Brazil and VTEX Informática S.A., entered into a private pricing addendum with Amazon Web Services, Inc. and its affiliate, or AWS, supplementing the standard AWS customer agreement entered into when initially acquiring AWS’s cloud storage services. We pay a monthly charge based on our usage and are subject to an annual commitment payment. The agreement is valid until December 31, 2025.
For information concerning certain other contracts important to our business, see “Item 5. Operating and Financial Review and Prospects —B. Liquidity and Capital Resources” and “Item 4. Information on the Company—B. Business Overview—Our Recent Acquisitions”.
| D. | Exchange Controls |
The Cayman Islands currently has no exchange control restrictions.
Certain Latin American economies in which we operate are subject to significant foreign currency exchange controls and currency devaluation. See “Item 3. Key Information—A. Selected financial data” and “Item 3. Key Information—D. Risk Factors—Significant foreign currency exchange controls and currency devaluation in certain countries in which we operate which may have adverse effects on the economies of such countries, us and the price of our Class A common shares.”
| E. | Taxation |
The following summary contains a description of certain Cayman Islands and U.S. federal income tax consequences of the acquisition, ownership and disposition of our Class A common shares. It does not purport to be a comprehensive description of all the tax considerations that may be relevant to a decision to purchase our Class A common shares, is not applicable to all categories of investors, some of which may be subject to special rules, and does not address all of the Cayman Islands and U.S. federal income tax considerations applicable to any particular holder. The summary is based upon the tax laws of the Cayman Islands and the United States and regulations thereunder as of the date hereof, which are subject to change.
131
Prospective purchasers of our Class A common shares should consult their own tax advisors about the particular Cayman Islands and U.S. federal, state, local and other tax consequences to them of the acquisition, ownership and disposition of our Class A common shares.
Certain Cayman Islands Tax Considerations
The Cayman Islands laws currently levy no taxes on individuals or corporations based upon profits, income, gains or appreciation and there is no taxation in the nature of inheritance tax or estate duty or withholding tax applicable to us or to any holder of Class A common shares. There are no other taxes likely to be material to us levied by the government of the Cayman Islands except for stamp duties which may be applicable on instruments executed in, or after execution brought within the jurisdiction of the Cayman Islands. No stamp duty is payable in the Cayman Islands on transfers of shares of Cayman Islands companies except those which hold interests in land in the Cayman Islands. The Cayman Islands is not party to any double tax treaties which are applicable to any payments made by or to our company. There are no exchange control regulations or currency restrictions in the Cayman Islands.
128
As a Cayman Islands exempted company with limited liability, we applied for and successfully received an undertaking as to tax concessions pursuant to Section 6 of the Tax Concessions Act (Revised) of the Cayman Islands. This undertaking provides that, for a period of 20 years from the date of issue of the undertaking, no law thereafter enacted in the Cayman Islands imposing any taxes to be levied on profits, income, gains or appreciation will apply to us or our operations.
Payments of dividends and capital in respect of our Class A common shares will not be subject to taxation in the Cayman Islands and no withholding will be required on the payment of a dividend or capital to any holder of our Class A common shares, nor will gains derived from the disposal of our Class A common shares be subject to Cayman Islands income or corporation tax.
There is no income tax treaty or convention currently in effect between the United States and the Cayman Islands.
Certain United States Federal Income Tax Considerations
The following discussion describes certain U.S. federal income tax consequences of the ownership and disposition of our Class A common shares. This discussion deals only with Class A common shares that are held as capital assets by a U.S. Holder (as defined below).
As used herein, the term “U.S. Holder” means a beneficial owner of our Class A common shares that is, for U.S. federal income tax purposes, any of the following:
an individual who is a citizen or resident of the United States;
a corporation (or other entity treated as a corporation for U.S. federal income tax purposes) created or organized in or under the laws of the United States, any state thereof or the District of Columbia;
an estate the income of which is subject to U.S. federal income taxation regardless of its source; or
a trust if it (1) is subject to the primary supervision of a court within the United States and one or more United States persons have the authority to control all substantial decisions of the trust; or (2) has a valid election in effect under applicable United States Treasury regulations to be treated as a United States person.
132
This discussion is based upon provisions of the Internal Revenue Code of 1986, as amended, or the Code, and regulations, rulings and judicial decisions thereunder as of the date hereof. Those authorities may be changed, perhaps retroactively, so as to result in U.S. federal income tax consequences different from those summarized below.
This discussion does not represent a detailed description of the U.S. federal income tax consequences applicable to you if you are subject to special treatment under the U.S. federal income tax laws, including if you are:
a dealer or broker in securities;
a financial institution;
a regulated investment company;
a real estate investment trust;
129
an insurance company;
| • | a tax-exempt organization; |
a person holding our Class A common shares as part of an integrated or conversion transaction, a constructive sale or a straddle;
| • | a trader in securities that has elected the mark-to-market method of accounting for your securities; |
a person liable for alternative minimum tax;
a person who owns or is deemed to own 10% or more of all of our outstanding stock (by vote or value);
a partnership or other pass-through entity for U.S. federal income tax purposes;
a person required to accelerate the recognition of any item of gross income with respect to our Class A common shares as a result of such income being recognized on an applicable financial statement; or
a person whose “functional currency” for U.S. federal income tax purposes is not the U.S. dollar.
If a partnership (or other entity or arrangement treated as a partnership for U.S. federal income tax purposes) holds our Class A common shares, the tax treatment of a partner will generally depend upon the status of the partner and the activities of the partnership. If you are a partnership or partner of a partnership holding our Class A common shares, you should consult your tax advisors.
This summary does not contain a detailed description of all the U.S. federal income tax consequences to you in light of your particular circumstances and does not address the Medicare tax on net investment income, U.S. federal estate and gift taxes or the effects of any state, local or non-U.S. tax laws. If you are considering the purchase of our Class A common shares, you should consult your own tax advisors concerning the particular U.S. federal income tax consequences to you of the ownership and disposition of our Class A common shares, as well as the consequences to you arising under other U.S. federal tax laws (such as estate and gift tax laws) and the laws of any other taxing jurisdiction.
133
Taxation of Dividends
Subject to the discussion under “—Passive Foreign Investment Company” below, the gross amount of distributions on our Class A common shares will be taxable as dividends to the extent paid out of our current or accumulated earnings and profits, as determined under U.S. federal income tax principles. To the extent that the amount of any distribution exceeds our current and accumulated earnings and profits for a taxable year, the distribution will first be treated as a tax-free return of capital, causing a reduction in your tax basis in the Class A common shares, and to the extent the amount of the distribution exceeds your tax basis, the excess will be taxed as capital gain recognized on a sale or exchange (as discussed below under “—Taxation of Sales or Exchanges”). We do not, however, expect to determine earnings and profits in accordance with U.S. federal income tax principles. Therefore, you should expect that a distribution will generally be reported as a dividend for U.S. federal income tax purposes.
Any dividends that you receive will be includable in your gross income as ordinary income on the day actually or constructively received by you and, for purposes of calculating the U.S. foreign tax credit, such dividends will be treated as income from sources outside the United States and will generally constitute passive category income. Such dividends will not be eligible for the dividends received deduction generally allowed to corporations under the Code. Subject to applicable limitations (including a minimum holding period requirement), dividends received by non-corporate U.S. investors from a qualified foreign corporation may be treated as “qualified dividend income” that is subject to reduced rates of taxation. A foreign corporation is treated as a qualified foreign corporation with respect to dividends paid by that corporation on shares that are readily tradable on an established securities market in the United States. United States Treasury Department guidance indicates that our Class A common shares, which are listed on the NYSE, are readily tradable on an established
130
securities market in the United States. Thus, we believe that any dividends we pay on our Class A common shares to non-corporate U.S. Holders will be potentially eligible for these reduced tax rates. There can be no assurance, however, that our Class A common shares will be considered readily tradable on an established securities market in later years. In addition, non-corporate U.S. Holders will not be eligible for reduced tax rates on any dividends received from us if we are a passive foreign investment company (as discussed below under “—Passive Foreign Investment Company”) in the taxable year in which such dividends are paid or in the preceding taxable year. You should consult your own tax advisors regarding the application of these rules to your particular circumstances.
Distributions of Class A common shares, or rights to subscribe for Class A common shares, which are received as part of a pro rata distribution to all of our shareholders generally will not be subject to U.S. federal income tax.
Taxation of Sales or Exchanges
For U.S. federal income tax purposes, you will recognize taxable gain or loss on any sale, exchange or other taxable disposition of Class A common shares in an amount equal to the difference between the amount realized for the Class A common shares and your tax basis in the Class A common shares. Subject to the discussion under “—Passive Foreign Investment Company” below, such gain or loss will generally be capital gain or loss and will generally be long-term capital gain or loss if you have held the Class A common shares for more than one year. Long-term capital gains of non-corporate U.S. Holders (including individuals) are eligible for reduced rates of taxation. The deductibility of capital losses is subject to limitations. Any gain or loss recognized by you will generally be treated as U.S. source gain or loss.
Passive Foreign Investment Company
Based on the past and projected composition of our income and assets, and the valuation of our assets, including goodwill, we do not believe we were a passive foreign investment company, or PFIC, for our most recent taxable year, and we do not expect to become a PFIC in the current taxable year or the foreseeable future, although there can be no assurance in this regard.
In general, we will be a PFIC for any taxable year in which:
at least 75% of our gross income is passive income, or
at least 50% of the value (generally determined based on a quarterly average) of our assets is attributable to assets that produce, or are held for the production of, passive incomeincome.
134
For this purpose, passive income generally includes dividends, interest, royalties and rents (other than royalties and rents derived in the active conduct of a trade or business and not derived from a related person). In addition, cash and other assets readily convertible into cash are generally considered passive assets. If we own at least 25% (by value) of the stock of another corporation, for purposes of determining whether we are a PFIC, we will be treated as owning our proportionate share of the other corporation’s assets and receiving our proportionate share of the other corporation’s income.
The determination of whether we are a PFIC is made annually. Accordingly, it is possible that we may become a PFIC in the current or any future taxable year due to changes in our asset or income composition. Because we have valued our goodwill based on the market value of our Class A common shares, a decrease in the price of our Class A common shares may also result in our becoming a PFIC. If we are a PFIC for any taxable year during which you hold our Class A common shares, you will be subject to special tax rules discussed below.
If we are a PFIC for any taxable year during which you hold our Class A common shares and you do not make a timely mark-to-market election, as described below, you will be subject to special tax rules with respect to any “excess distribution” received and any gain realized from a sale or other disposition, including a pledge, of Class A common shares. Distributions received in a taxable year will be treated as excess distributions to the extent that they are greater than 125% of the average annual distributions received during the shorter of the three preceding taxable years or your holding period for the Class A common shares. Under these special tax rules:
131
the excess distribution or gain will be allocated ratably over your holding period for the Class A common shares,
the amount allocated to the current taxable year, and any taxable year prior to the first taxable year in which we were a PFIC, will be treated as ordinary income, and
the amount allocated to each other year will be subject to tax at the highest tax rate in effect for that year for individuals or corporations, as applicable, and the interest charge generally applicable to underpayments of tax will be imposed on the resulting tax attributable to each such year.
Although the determination of whether we are a PFIC is made annually, if we are a PFIC for any taxable year in which you hold our Class A common shares, you will generally be subject to the special tax rules described above for that year and for each subsequent year in which you hold the Class A common shares (even if we do not qualify as a PFIC in such subsequent years). However, if we cease to be a PFIC, you can avoid the continuing impact of the PFIC rules by making a special election to recognize gain as if your Class A common shares had been sold on the last day of the last taxable year during which we were a PFIC. You are urged to consult your own tax advisor about this election.
In lieu of being subject to the special tax rules discussed above, if we are a PFIC for any taxable year in which you hold our Class A common shares, you may make a mark-to-market election with respect to your Class A common shares provided such Class A common shares are treated as “marketable stock.” The Class A common shares generally will be treated as marketable stock if they are regularly traded on a “qualified exchange or other market” (within the meaning of the applicable Treasury regulations). A class of stock is considered “regularly traded” on a qualified exchange or other market for any calendar year during which such class of stock is traded, other than in de minimis quantities, on at least 15 days during each calendar quarter. The Class A common shares are listed on the NYSE, which is treated as a qualified exchange for these purposes, but no assurance can be given that the Class A common shares will be “regularly traded” for purposes of the mark-to-market election.
If you make an effective mark-to-market election, for each taxable year that we are a PFIC you will include as ordinary income the excess of the fair market value of your Class A common shares at the end of the year over your adjusted tax basis in the Class A common shares. You will be entitled to deduct as an ordinary loss in each such year the excess of your adjusted tax basis in the Class A common shares over their fair market value at the end of the year, but only to the extent of the net amount previously included in income as a result of the mark-to-market election. Your adjusted tax basis in the Class A common shares will be increased by the amount of any income inclusion and decreased by the amount of any deductions under the mark-to-market rules. In addition, upon the sale or other disposition of your Class A common shares in a year that we are a PFIC, any gain will be treated as ordinary income and, any loss will be treated as ordinary loss to the extent of the net amount of previously included income as a result of the mark-to-market election, and thereafter as capital loss.
135
If you make a mark-to-market election, it will be effective for the taxable year for which the election is made and all subsequent taxable years unless the Class A common shares are no longer regularly traded on a qualified exchange or other market, or the Internal Revenue Service, or the IRS, consents to the revocation of the election. However, because a mark-to-market election cannot be made for any lower-tier PFICs that we may own (as discussed below), you will generally continue to be subject to the special tax rules discussed above with respect to your indirect interest in any such lower-tier PFIC. You are urged to consult your tax advisor about the availability of the mark-to-market election, and whether making the election would be advisable in your particular circumstances.
Alternatively, you can sometimes avoid the special tax rules described above by electing to treat a PFIC as a “qualified electing fund” under Section 1295 of the Code. However, this option is not available to you with respect to our Class A common shares because we do not intend to comply with the requirements necessary to permit you to make this election.
132
If we are a PFIC for any taxable year during which you hold our Class A common shares and any of our non-U.S. subsidiaries is also a PFIC, you will be treated as owning a proportionate amount (by value) of the shares of the lower-tier PFIC for purposes of the application of the PFIC rules. You are urged to consult your tax advisors about the application of the PFIC rules to any of our subsidiaries.
You will generally be required to file IRS Form 8621 if you hold our Class A common shares in any year in which we are classified as a PFIC. You are urged to consult your tax advisors concerning the U.S. federal income tax consequences of holding Class A common shares if we are considered a PFIC in any taxable year.
Information Reporting and Backup Withholding
In general, information reporting will apply to dividends in respect of our Class A common shares and the proceeds from the sale, exchange or other disposition of Class A common shares that are paid to you within the United States (and in certain cases, outside the United States), unless you establish that you are an exempt recipient. Backup withholding may apply to such payments if you fail to provide a taxpayer identification number and a certification that you are not subject to backup withholding or if you fail to report in full dividend and interest income.
Backup withholding is not an additional tax. Any amounts withheld under the backup withholding rules will be allowed as a refund or a credit against your U.S. federal income tax liability provided the required information is timely furnished to the IRS.
Certain U.S. Holders are required to report information relating to our Class A common shares, subject to certain exceptions (including an exception for Class A common shares held in accounts maintained by certain financial institutions), by attaching a complete IRS Form 8938, Statement of Specified Foreign Financial Assets, with their tax return for each year in which they hold the Class A common shares. You are urged to consult your own tax advisors regarding information reporting requirements relating to your ownership of the Class A common shares.
| F. | Dividends and Paying Agents |
Not applicable.
| G. | Statement by Experts |
Not applicable.
136
| H. | Documents on Display |
We are subject to the informational requirements of the Exchange Act applicable to foreign private issuers. Accordingly, we are required to file reports and other information with the SEC, including annual reports on Form 20-F within four months from the end of each of our fiscal years, and reports on Form 6-K. You can read our SEC filings over the Internet at the SEC’s website at www.sec.gov. You may also read and copy any document we file with the SEC at its public reference room at 100 F. Street, N.E., Washington, D.C. 20549. You may obtain copies of these documents upon the payment of the fees prescribed by the SEC. Please call the SEC at 1-800-SEC-0330 for further information about the public reference room.
| I. | Subsidiary Information |
See note 2 to our audited consolidated financial statements for a description of ’ourour subsidiaries.
Annual Report to Security Holders |
Not applicable.
133
| ITEM 11. | QUANTITATIVE AND QUALITATIVE DISCLOSURES ABOUT MARKET RISK |
We are exposed to market risks in the ordinary course of our business, including the effects of foreign currency fluctuations, derivative financial instruments, credit risk and liquidity risk. Information relating to quantitative and qualitative disclosures about these market risks is described below:
Interest rate risk
The interest risk arises from the possibility of us incurring losses due to fluctuations in interest rates in respect of fair value of future cash flows of a financial instrument.
Our exposure to market risk for changes in interest rates relates primarily to our cash, cash equivalents, restricted cash, marketable securities and short-term investments. Our investments are made for capital preservation purposes and we do not enter into investments for trading or speculative purposes. We also have some exposure related to loans and financing subject to the variable interest rate. Our trade receivables account payable and other liabilities do not bear interest.
Our cash, cash equivalents, restricted cash, marketable securities and short-term investments consist primarily of interest-bearing accounts held by our parent company in US$. Such interest-earning instruments carry a degree of interest rate risk. To minimize interest rate risk, we intend to maintain our portfolio of cash equivalents in a variety of investment-grade securities, which may include commercial papers, money market funds, and government and non-government debt securities. Because of the short-term maturities of our cash, cash equivalents, restricted cash, and marketable securities, as of December 31, 2022,2023, we are not materially exposed to the risk of changes in market interest rates.
Foreign currency exchange risk
We have significant operations internationally that are denominated in foreign currencies. Our exposure to foreign exchange risk is primarily related to fluctuations between the U.S. Dollar and the Latin American countries in which we operate (primarily the Brazilian real, Argentine peso, Colombian peso and Chilean peso). We transact business in various foreign currencies and have significant international revenues and costs. Our cash flows, results of operations and certain of our intercompany balances that are exposed to foreign exchange rate fluctuations may differ materially from expectations and we may record significant gains or losses due to foreign currency fluctuations and related hedging activities. For further information see note 26.2.(c)(i) of our consolidated financial statements.
Our subsidiaries generate revenues and incur most of their expenses in the respective local currencies of the countries in which they operate. As a result, our subsidiaries use their local currency as their functional currency. In the years ended December 31, 2023 and 2022, 20.3% and 2021, 15.6% and 17.3% of our revenues were denominated in, or linked to, U.S. dollars, respectively. As of December 31, 20222023 and December 31, 2021,2022, our assets were represented by 66.1%61.3% and 69.6%66.1% in U.S. dollars, 33.9%38.7% and 30.4%33.9% in other currencies. As of December 31, 20222023 and December 31, 2021,2022, our liabilities, excluding our total shareholders’ equity, were represented by 13.2%11.7% and 16.9%13.2% in U.S. dollars, 86.8%88.3% and 83.1%86.8% in other currencies.
137
We are exposed to foreign exchange fluctuations on the revaluation of foreign currency assets and liabilities. We use foreign exchange derivative products to hedge intercompany loans, and debt for operational purposes. By their nature, derivative financial instruments involve risk, including the credit risk of non-performance by counterparties. We use derivatives for hedging purposes and not as speculative investments. For further information on how such derivatives are recognized and classified, see note 26.1 (ii) to our consolidated financial statements.
134
Capital management
Our policy is to maintain a strong capital base to secure investor, creditor, and market confidence and also to sustain future development of our business. Management monitors the return on capital, as well as the dividend yield to shareholders.
In addition, our objective to manage capital is to safeguard our ability to continue as a going concern and to provide returns for shareholders and benefits for other stakeholders, to maintain an optimal capital structure to reduce the cost of capital, and to have resources available in order to pursue more aggressively new growth opportunities.
We monitor capital based on net cash/net debt ratio.
DESCRIPTION OF SECURITIES OTHER THAN EQUITY SECURITIES |
| A. | Debt Securities |
Not applicable.
| B. | Warrants and Rights |
Not applicable.
| C. | Other Securities |
Not applicable.
| D. | American Depositary Shares |
Not applicable.
Part
135
PART II
DEFAULTS, DIVIDEND ARREARAGES AND DELINQUENCIES |
None.
MATERIAL MODIFICATIONS TO THE RIGHTS OF SECURITY HOLDERS AND USE OF PROCEEDS |
None.
138
CONTROLS AND PROCEDURES |
| A. | Disclosure Controls and Procedures |
We have evaluated, with the participation of our Co-Chief Executive Officers and Chief Financial Officer, the effectiveness of our disclosure controls and procedures (as defined in Rules 13a-15(e) and 15d-15(e) under the Exchange Act) as of December 31, 2022.2023. There are inherent limitations to the effectiveness of any system of disclosure controls and procedures, including the possibility of human error and the circumvention or overriding of the controls and procedures. Accordingly, even effective disclosure controls and procedures can only provide reasonable assurance of achieving their control objectives.
Based upon oursuch evaluation, our Co-Chief Executive Officers and Chief Financial Officer concluded that as a result of the material weakness in our internal control over financial reporting described in “B. Management’s Annual Report on Internal Control Over Financial Reporting” below,disclosure controls and procedures were effective as of December 31, 2022, our disclosure controls were not effective2023 to provide reasonable assurance that thematerial information required to be disclosed by us in the reports that we filefiled with, or submitsubmitted to the SEC under the Exchange Act was beingis (1) recorded, processed, summarized and reported within the time periods specified in the applicable rules and forms and that it was(2) accumulated for and communicated to our management, including our Co-Chief Executive Officers and Chief Financial Officer as appropriate to allow for timely decisions regarding the required disclosures.
| B. | Management’s Annual Report on Internal Control Over Financial Reporting |
Our management is responsible for establishing and maintaining adequate internal control over financial reporting, as such term is defined in Rule 13a-15(f) of the Exchange Act. Internal control over financial reporting is a process designed by, or under the supervision of, our Co-Chief Executive Officers and Chief Financial Officer and effected by our board of directors, management and other personnel to provide reasonable assurance regarding the reliability of financial reporting and the preparation of financial statements for external purposes in accordance with the International Financial Reporting Standards (IFRS)as issued by the International Accounting Standards Board (“IFRS Accounting Standards”) as issued by International Accounting Standards Board (IASB).
Because of its inherent limitations, internal control over financial reporting may not prevent or detect misstatement. Also, projections of any evaluation of the effectiveness of our internal control to future periods are subject to the risk that controls may become inadequate because of changes in conditions, or that the degree of compliance with the policies or procedures may deteriorate.
Our management, including the Co-Chief Executive Officers and Chief Financial Officer, has assessed the effectiveness of our internal control over financial reporting as of December 31, 20222023, based on the criteria described in Internal Control—Integrated Framework (2013) issued by the Committee of Sponsoring Organizations of the Treadway Commission, (COSOor COSO, and based on this assessment, our management has concluded that as of December 31, 2022, our internal controls over financial reporting was not effective to provide reasonable assurance regarding the reliabilityas of financial reporting and the preparationDecember 31, 2023.
Remediation of financial statements for external purposes in accordance with IFRS as issued by IASB.
Previously Reported Material Weakness in Internal Control over Financial Reporting
A material weakness is a deficiency, or a combination of deficiencies, in internal control over financial reporting, such that there is a reasonable possibility that a material misstatement of our annual or interim consolidated financial statements may not be prevented or detected on a timely basis.
As part ofpreviously disclosed in our assessment, weAnnual Report on Form 20-F for the fiscal year ended December 31, 2022, our management identified a material weakness in our internal controlscontrol over financial reporting as of December 31, 2022 related to the failure to maintain controls over the restrictrestricted access management procedures, regarding granting, revoking, and reviewing access and segregation of duties. Specifically, management determined that we did not maintain effectiveDue to the remediation measures taken by us to implement new processes, additional controls over applicationsspecific to ensure that IT general controls affecting financial IT applications and underlying accounting records are identified, tested, authorized and implemented appropriately. As a result, the effective functioning of access management, controls, process-level automation, IT-dependent controls and segregation of duties controls could have been compromised, which could result in misstatements potentially impacting financial statement accounts and disclosuresstrengthening the IT governance, management has concluded that would not be prevented or detected. Thisthis material weakness did not result in a material misstatement to our consolidated financial statements.has been remediated as of December 31, 2023.
139136
Remediation Plan and Actions
Our management is taking actions to remediate the deficiencies that resulted in the material weakness above and to improve the design and effectiveness of our IT general controls. These remediation actions include:
Expanding the management and governance over IT system & cyber controls;
Optimizing the process standardization of the Information Technology General Controls (ITGC) over the organization;
Implementing additional controls specific to segregation of duties; and
Providing trainings to the control owners involved in the deficiencies related.
Although we expect to complete the remediation activities by December 31, 2023 we cannot assure that our efforts will be effective or prevent any future material weakness or significant deficiency in our internal control over financial reporting. See “Item 3. Key Information — D. Risk Factors— Certain Risks Relating to Our Business and Industry — In preparing our consolidated financial statements, we have identified a material weakness in our internal control over financial reporting and, if we fail to implement and maintain effective internal controls over financial reporting, we may be unable to accurately report our results of operations, meet our reporting obligations or prevent fraud.”
| C. | Attestation Report of the Registered Public Accounting Firm |
This annual report does not include an attestation report of our registered public accounting regarding internal control over financial reporting firm due to a transition period established by rules of the SEC for emerging growth companies.
| D. | Changes in Internal Control Over Financial Reporting |
As reported in our annual report on Form 20-F forDuring the fiscal year ended December 31, 2021, our management identified material weaknesses in our control over financial reporting related to the lack of (i) the lack of an effective control environment and monitoring of controls, as a result of failure to maintain internal controls over financial reporting in response to risks of material misstatements; (ii) failure to maintain controls over the period-end financial reporting as a result of (1) failure to maintain controls related to consolidation and disclosure processes and (2) failure to maintain controls related to review and approval journal entries; (iii) failure to maintain controls related to restrict access management procedures, regarding granting, revoking and reviewing access and segregation of duties; and (iv) failure to control data flow and end-user computing, or EUC, basically interfaces, spreadsheets and key reports related to key controls and relevant Likely Sources of Potential Misstatement, or LSPM.
As part of our changes in internal control over financial reporting, as of the date ofperiod covered by this annual report for the year ended December 31, 2022, we have implemented a remediation plan with respect to the material weaknesses indicated above, including the hiring of several experienced personnel in our financial reporting and internal controls team, as well as engaging external advisors to assist us in addressing these material weaknesses. These measures included also the design, implementation of new processes, policies and procedures, improvements of the internal controls to provide additional levels of review and approval, enhancements of internal documentation, implementation of new software solutions and strengthening the training program for staff related to the requirements of IFRS, the rules and regulations of the SEC and the Sarbanes-Oxley Act, as well as the guidelines of COSO’s Internal Control Integrated Framework.
140
The measures in connection with the material weaknesses indicated in items (i), (ii) and (iv) above were implemented and evaluated by management during 2022 and as of December 31, 2022, management has completed the remediation activities for these material weaknesses. As a result, we concluded that we have remediated these previously reported material weaknesses related to (a) the lack of an effective control environment and monitoring of controls, as a result of failure to maintain internal controls over financial reporting in response to risks of material misstatements; (b) failure to maintain controls over the period-end financial reporting as a result of (1) failure to maintain controls related to consolidation and disclosure processes and (2) failure to maintain controls related to review and approval journal entries and (c) failure to control data flow and EUC, basically interfaces, spreadsheets and key reports related to key controls and relevant LSPM.
The other material weakness, as described in item (iii) above, remains asthe “Remediation of December 31, 2022. We have determined a remediation plan in connection with such material weakness, as indicated in “B. Management’s Annual Report on Internal Control Over Financial Reporting.”
With the exception of the changes listedPreviously Reported Material Weakness” section above, there were no other changes in our internal control over financial reporting (as such term is defined in Rules 13a-15(f) and 15d-15(f) under the Exchange Act) that occurred during the year ended December 31, 2022 that materially affected, or are reasonably likely to materially affect, our internal control over financial reporting.reporting as part of the remediation measures described above.
|
AUDIT COMMITTEE FINANCIAL EXPERT |
Our audit committee consists of Alejandro Raul Scannapieco, Benoit Fouilland and Benoit Fouilland.Silvia Mazzucchelli. Alejandro Raul Scannapieco, and Benoit Fouilland and Silvia Mazzucchelli are the co-chairmen of our audit committee. Alejandro Raul Scannapieco, and Benoit Fouilland and Silvia Mazzucchelli satisfy the criteria of an audit committee financial expert as set forth under the applicable rules of the SEC, and they also meet the criteria for independence set forth in Rule 10A-3 of the Exchange Act. Our audit committee assists our board of directors in overseeing our accounting and financial reporting processes and the audits of our consolidated financial statements. In addition, the audit committee will be directly responsible for the appointment, compensation, retention and oversight of the work of our independent registered public accounting firm. For more information, see “Item 6. Directors, Senior Management and Employees—C. Board Practices—Board Committees—Audit Committee.”
CODE OF ETHICS |
We have adopted a code of ethics, which is applicable to all of our directors, officers, employees and partners. Our code of ethics is publicly available on our investor relations website. We intend to disclose future amendments to, or waivers of, our code of conduct on the same page of our corporate website. Information contained on our website is not incorporated by reference into this annual report, and investors should not consider information contained on our website to be part of this annual report or in deciding whether to invest in our Class A common shares.
PRINCIPAL ACCOUNTANT FEES AND SERVICES |
Audit and Non-Audit Fees
The following table sets forth the aggregate fees by categories specified below in connection with certain professional services rendered by Pricewaterhousecoopers Auditores Independentes Ltda., our principal accountants, for the periods indicated. Our independent registered public accounting firm was Pricewaterhousecoopers Auditores Independentes Ltda. for the years ended December 31, 20222023 and 2021.2022.
141137
| Year Ended December 31, | Year Ended December 31, | |||||||||||||||
| 2022 | 2021 | 2023 | 2022 | |||||||||||||
| (in millions of US$) | (in millions of US$) | |||||||||||||||
Audit fees (1) | 0.5 | 0.8 | 0.5 | 0.5 | ||||||||||||
Audit-related fees | — | — | 0.0 | — | ||||||||||||
Tax fees | — | — | — | — | ||||||||||||
All other fees(2) | 0.1 | — | 0.0 | 0.1 | ||||||||||||
|
| |||||||||||||||
Total fees | 0.6 | 0.8 | 0.5 | 0.6 | ||||||||||||
|
| |||||||||||||||
| (1) | Audit fees include fees for the audit of our annual consolidated financial statements; review of our interim financial statements; and preparation and issuance of comfort letters in connection with our equity offering. |
| (2) | Other fees are any additional amounts for products and services provided by the principal accountants, other than the services reported above under “Audit fees”, “Audit-related fees” and “Tax fees that do not conflict with audit services”. |
Pursuant to the audit committee charter, our audit committee must review and approve, in advance, the scope, plans and fees of all audit and non-audit services provided by Pricewaterhousecoopers Auditores Independentes Ltda.
EXEMPTIONS FROM THE LISTING STANDARDS FOR AUDIT COMMITTEES |
Under the listed company audit committee rules of the NYSE and the SEC, we must comply with Rule 10A-3 under the Exchange Act, which requires that we establish an audit committee composed of members of the Board of Directors that meets specified requirements. The composition of our audit committee complies with the requirements of NYSE rules and Rule 10A-3 under the Exchange Act.
PURCHASES OF EQUITY SECURITIES BY THE ISSUER AND AFFILIATED PURCHASERS |
On August 8, 2022 our board of directors authorized the repurchase of shares of our Class A common shares for an aggregate consideration of up to US$30.0 million. The share repurchase program expired on August 8, 2023. On August 8, 2023 our board of directors authorized the repurchase of shares of our Class A common shares for an aggregate consideration of up to US$20.0 million. The share repurchase program is scheduled to expire on August 8, 2023.2024. Repurchases under the program may be made from time to time in open market or privately negotiated transactions in accordance with applicable laws, including Rule 10b-18. The share repurchase program does not obligate us to acquire any amount of common shares, and it may be suspended or discontinued at any time at our discretion. The timing and amount of shares repurchased (if any) will be determined by our management based on its evaluation of market conditions, applicable legal requirements and other factors. Repurchases may also be made under a Rule 10b5-1 plan. Any repurchased shares may be canceled or remain available for use in connection with our equity incentive plans and for other corporate purposes.
The following table summarizes the share repurchase activity for the year ended December 31, 20222023.
Period | Total Number Of Class A Common Shares Purchased | Average Price Paid per Class A Common Share (US$) (1) | Total Number of Class A Common Shares Purchased As Part of Publicly Announced Plans Or Program | Approximate Value of Class A Common Shares that May Yet Be Purchased Under the Plans (In US$ millions) (2) | ||||||||||||
August 1 - 31, 2022 | 913,584 | 4.00 | 913,584 | 26.3 | ||||||||||||
September 1 - 30, 2022 | 373,224 | 3.99 | 373,224 | 24.9 | ||||||||||||
October 1 - 31, 2022 | 510,350 | 3.85 | 510,350 | 22.9 | ||||||||||||
November 1 - 30, 2022 | 784,546 | 3.91 | 784,546 | 19.8 | ||||||||||||
December 1 - 31, 2022 | 706,256 | 3.60 | 706,256 | 17.3 | ||||||||||||
|
|
|
|
|
|
|
| |||||||||
Total | 3,287,960 | 3.87 | 3,287,960 | 17.3 | ||||||||||||
|
|
|
|
|
|
|
| |||||||||
Period | Total Number Of Class A Common Shares Purchased | Average Price Paid per Class A Common Share (US$)(1) | Total Number of Class A Common Shares Purchased As Part of Publicly Announced Plans Or Program | Approximate Value of Class A Common Shares that May Yet Be Purchased Under the Plans (In US$ millions)(2) | ||||||||||||
January 1 - 31, 2023 | 559,968 | 4.19 | 3,847,928 | 14.9 | ||||||||||||
February 1 - 28, 2023 | 205,085 | 4.32 | 4,053,013 | 14.0 | ||||||||||||
March 1 - 31, 2023 | 557,418 | 3.72 | 4,610,431 | 12.0 | ||||||||||||
April 1 - 30, 2023 | 442,584 | 3.58 | 5,053,015 | 10.4 | ||||||||||||
May 1 - 31, 2023 | 1,180,442 | 3.93 | 6,233,457 | 5.8 | ||||||||||||
June 1 - 30, 2023 | 514,582 | 4.37 | 6,748,039 | 3.5 | ||||||||||||
July 1 - 31, 2023 | 233,013 | 5.07 | 6,981,052 | 2.3 | ||||||||||||
August 1 - 31, 2023 | 804,535 | 5.69 | 7,785,587 | 15.6 | ||||||||||||
138
Period | Total Number Of Class A Common Shares Purchased | Average Price Paid per Class A Common Share (US$)(1) | Total Number of Class A Common Shares Purchased As Part of Publicly Announced Plans Or Program | Approximate Value of Class A Common Shares that May Yet Be Purchased Under the Plans (In US$ millions)(2) | ||||||||||||
September 1 - 30, 2023 | 1,002,480 | 5.40 | 8,788,067 | 10.2 | ||||||||||||
October 1 - 31, 2023 | 1,291,665 | 5.09 | 10,079,732 | 3.6 | ||||||||||||
November 1 - 30, 2023 | 597,074 | 5.98 | 10,676,806 | 0.0 | ||||||||||||
December 1 - 31, 2023 | 0 | 0 | 10,676,806 | 0.0 | ||||||||||||
Total | 7,388,846 | 4.75 | 10,676,806 | 0.0 | ||||||||||||
| (1) | Not including brokerage fees. |
| (2) | Please refer to Note 19.2(b) of our audited consolidated financial statements for additional detail. |
142
As December 31, 2022, 3,287,9602023, 7,388,846 Class A common shares had been repurchased pursuant to this share buyback program and we held 81,024there were no Class A common shares onheld in treasury as of suchthat date.
There were no other purchases of any class of registered equity securities of the Company by the Company or, to our knowledge, by any other affiliated purchaser.
CHANGE IN REGISTRANT’S CERTIFYING ACCOUNTANT |
None.
CORPORATE GOVERNANCE |
Cayman Islands law restricts transactions between a company and its directors unless there are provisions in the Articles of Association which provide a mechanism to alleviate possible conflicts of interest. Additionally, Cayman Islands law imposes on directors’ duties of care and skill and fiduciary duties to the companies which they serve. Under our Articles of Association, a director must disclose the nature and extent of his interest in any contract or arrangement, and following such disclosure and subject to any separate requirement under applicable law or the listing rules of the NYSE, and unless disqualified by the chairman of the relevant meeting, the interested director may vote in respect of any transaction or arrangement in which he or she is interested. The interested director shall be counted in the quorum at such meeting and the resolution may be passed by a majority of the directors present at the meeting.
Subject to the foregoing and our Articles of Association, our directors may exercise all the powers of VTEX to vote compensation to themselves or any member of their body in the absence of an independent quorum. We have established a Compensation Committee, but such committee is not required, nor is it expected, to be made up of independent directors or otherwise comply with Section 303A.05 of the Corporate Governance Rules of the NYSE. For further information see “Item 6. Directors, Senior Management and Employees—C. Board Practices —Compensation Committee.”
As a foreign private issuer, we are permitted to follow home country practice in lieu of certain corporate NYSE governance rules, subject to certain requirements. We currently rely, and will continue to rely, on the foreign private issuer exemption with respect to the following rules:
Section 303A.01 of the Corporate Governance Rules of the NYSE, which requires that independent directors comprise a majority of a company’s board of directors. As allowed by the laws of the Cayman Islands, independent directors do not comprise a majority of our board of directors.
Section 303A.04 of the Corporate Governance Rules of the NYSE, which requires that a company have a nomination committee comprised solely of “independent directors” as defined by NYSE. As allowed by the laws of the Cayman Islands, we do not have a nomination committee, nor do we have any current intention to establish one.
139
Section 303A.05 of the Corporate Governance Rules of the NYSE, which require that compensation for our executive officers and selection of our director nominees be determined by a majority of independent directors. Although we currently have a compensation committee, we are not required by the laws of the Cayman Island, nor do we intend, to have such committee comply with Section 303A.05 of the Corporate Governance Rules of the NYSE.
MINE SAFETY DISCLOSURE |
Not applicable.
DISCLOSURE REGARDING FOREIGN JURISDICTIONS THAT PREVENT INSPECTIONS |
Not applicable.
| ITEM 16J. | INSIDER TRADING POLICIES |
Not applicable.
| ITEM 16K. | CYBERSECURITY |
Cybersecurity Risk Management
(i) General description of risk management process
VTEX’s global cybersecurity risk management strategy is integrated into a complete security framework, which takes into account not only technological, but also commercial and reputational impacts. Our specialized Information Security team form the front line of defense against digital threats, ensuring that we can thrive in a challenging digital environment.
The Information Security Team
The Information Security team is a strategically organized team aimed at protecting the integrity, confidentiality, and availability of information. This team is made up of specialists divided into four distinct areas, each focused on managing specific types of risk:
The Blue Team is responsible for strengthening our defenses against cyberattacks focusing on prevention, detection, and response to threats.
The Red Team adopts a unique approach, simulating the mindset of a real adversary, who aims to materialize a risk to VTEX. By carrying out ethical intrusion tests, they are responsible for identifying and assessing gaps and vulnerabilities, providing valuable insights to further strengthen our cyber defenses.
The SecOps Team is responsible for establishing policies, standards, and procedures to ensure information security through a risk-oriented approach. This includes the Incident Response Plan, the Vulnerability Management Policy, and the Information Security Policy, among other essential guidelines. We believe the these frameworks ensure a comprehensive and effective approach to security risk management. When conducting the risk assessment, the SecOps team identifies and analyzes possible security threats, assessing the potential impact on data integrity, confidentiality, and availability. Based on this assessment, the team creates security controls and develops strategies and policies aimed at mitigating identified risks.
140
The Awareness Team, which operates within the SecOps Team structure, plays a vital role in employee awareness and training. Recognizing that security is a shared responsibility, this team educates VTEX about safe practices, strengthening the first line of defense against threats.
When a material risk is identified, with a potential impact on the Company or its clients, the Information Security Team takes immediate actions. The first step is to register the incident, calling in specialists to carry out an in-depth analysis of the scenario. Based on this assessment, actions are taken to contain the incident to limit the impact, identify the root cause, and adopt corrective measures to prevent future similar occurrences. The escalation process takes place simultaneously with the incident containment actions carried out by the Incident Response Team.
Escalation
We believe that the involvement of leadership is essential in our cybersecurity strategy, as it acts as an advocate for information security, ensuring the proper allocation of human and financial resources and strategic alignment with the organization’s objectives.
Depending on the severity of the incident, senior management can be involved in the incident management process. This ensures that our leadership is fully aware of the situation, enabling strategic decision-making in line with organizational objectives. This proactive and structured approach, backed up by the guidelines set out in an Information Security Incident Response Plan, ensures a quick and efficient response to events that could compromise information security, guaranteeing the continued protection of VTEX’s interests and those of its customers.
In situations where there is a real likelihood of a risk materializing, the Privacy & Security Committee is activated to conduct critical discussions. As further described below, this committee plays a crucial role in assessing the materiality of the incident in question. Once materiality has been determined, our Privacy and Security Committee communicates and involves the Audit Committee in the management of the incident and risk.
The Audit Committee is responsible for informing and keeping update our Board of Directors directly of the situation. This chain of responsibility ensures that, in cases of extreme relevance, senior management is immediately informed, allowing for agile decision-making in line with the company’s strategic interests.
This staggered approach, involving committees specialized in privacy, security, and auditing, guarantees a careful assessment of the materiality of critical incidents, providing effective management in situations with a high impact on the organization. For more details on the governance involved, see item “—Cybersecurity Governance” below.
Insurance
We currently maintain cybersecurity insurance for limited clients in the US and for the EU subsidiaries, but not a global coverage, and in the event we were to seek to obtain such insurance coverage, it may not be available on acceptable terms or may not be available in sufficient amounts to cover one or more large claims in connection with cybersecurity liabilities. Insurers could also deny coverage as to any future claim. The successful assertion of one or more large claims against us, or changes in any insurance policies we may enter into, including premium increases or the imposition of large deductible or coinsurance requirements, could have an adverse effect on our business, financial condition and results of operations.
(ii) Certifications
VTEX as a SaaS (Software as a Service) platform has different certifications on the internal control environment for different objectives:
Service Organization Control type 1: This certification is focused on evaluating the internal control environment with a focus on financial statements;
Service Organization Control type 2: Certification focused on evaluating the internal controls and technology environment with a focus on verifying how internal controls support the availability, integrity of information processing, reliability, and privacy of stored and processed data;
PCI DSS: Specific security certification for payment methods via credit card. Its purpose is to protect card data against fraud and violations.
For all certifications described above from the perspective of the year ended 12/31/2023, no exceptions or failures in internal controls were identified.
141
(iii) Cybersecurity due diligence
Before any supplier is registered in our purchasing systems, they are subject to a cybersecurity due diligence process, which covers aspects of compliance, privacy, and Information Security. Any relevant finding in the supplier’s cybersecurity due diligence process that could increase our exposure or expose us to a relevant risk prevents that supplier from being registered in our systems.
Additionally, we have adopted an automated process that requires any potential partners in our ecosystem be subject to a due diligence process before any Master Partner Agreement is signed. In this due diligence process, the potential partner is analyzed by the Compliance, Security, and Privacy teams concerning their technical and organizational measures, governance, controls, and procedures concerning cybersecurity incidents. The findings of this due diligence process are recorded and communicated to the team in charge of negotiating the contracts.
(iv) Past incidents and further impacts
In May 2021, the server of one of our third-party service providers in Chile that stores, among other things, certain of our customer’s consumer personal information processed through our platform, was accidentally made publicly available on the internet, and data of approximately 3,500 consumers from one of our customer’s became accessible without authorization. Although our customer is the data controller of its own consumers’ data and ultimately responsible for any privacy or security breaches involving such personal data, as our customer’s data processor, we may be also held jointly or severally liable if we (or our third-party service provider) are found not to have instituted adequate data security measures in our platform. As of the date of this annual report, we concluded the investigation regarding this incident and we confirmed that unauthorized third parties did not access the exposed consumer’s personal information. Additionally, we adopted measures to address the security flaw with such third-party service providers. See “—Certain Risks Relating to Our Business and Industry—A cyberattack, security breach or other unauthorized access or interruption to our information technology systems or those of our third-party service providers could delay or interrupt service to our customers and their customers, harm our reputation or subject us to significant liability.”
Cybersecurity Governance
In addition to our Information Security Team, our global cybersecurity risk management strategy is also implemented by (i) the Privacy & Security Committee; (ii) Audit Committee; and (iii) Board of Directors.
Privacy & Security Committee. The Privacy & Security Committee assesses whether there is materiality in privacy and/or information security incidents flagged by the Information Security Team to determine whether they should be escalated, executing contingency plans in the event of security incidents, and periodically reviewing privacy and information security policies and manuals, as applicable. When necessary, the Privacy & Security Committee, reports relevant risks and vulnerabilities to the Audit Committee and/or any other bodies reporting to the Board of Directors.
The findings and corrective actions about cybersecurity threats are discussed on an ordinary basis at our Privacy and Security Committee’s quarterly meetings. In such meetings the permanent member of the Compliance team, who reports periodically to senior management and the Audit Committee, becomes aware of any material cybersecurity threats, significant risk exposures, governance and control issues in the realm of cybersecurity requiring the attention of, or requested by, the Audit Committee.
The Privacy & Security Committee is currently composed of permanent members from the Legal, Compliance, Data Privacy, Security, and Growth teams, including C-Level; and extraordinary members from investor relations, PR, and Financial Reporting areas.
As of the date of this Annual Report, the members of the Privacy & Security Committee were the following:
142
| • | Joice Silva Mendes is currently the Security Manager at VTEX. Ms. Silva has more than 13 years of experience in the Technology area, almost 10 of which are dedicated to Information Security. She holds a bachelor’s degree in Information Technology and Networks from Universidade Federal de São Caetano do Sul and has several specializations in Security. |
| • | Gustavo Ramos Franco currently serves as VTEX Sr. Director of Engineering. Mr. Franco has more than 20 years of experience developing and managing systems and software engineering organizations associated with security, and privacy, including at VMware and at Google, among others where he was responsible for both incident lifecycle and disaster recovery testing programs for several years. |
| • | Thiago Athayde currently serves as VTEX’s head of Audit and Compliance. He has more than 17 years in external and internal positions in governance areas, like, Risk management, Compliance, Internal Controls, and Internal and External auditor at large corporations, including PwC, Praxair (Linde Group), and Naspers group. In these roles, he had the opportunity to help several administrations in the implementation of corporate cybersecurity risk management, evaluation of technology, and cyber controls, in addition to supporting evaluation in audit committees of publicly traded companies. Mr Athayde holds a Master of Business Administration and a B.A. in Business from the Federal University of Rio de Janeiro – Coppead and he is affiliated at RIMS, SCCE, and IIA. |
| • | Angela Bittencourt da Fonseca currently serves as VTEX Data Protection Officer. Ms. Bittencourt da Fonseca has more than five years of experience as internal and external counsel on privacy programs, incident response, and reporting to Data Protection Authorities around the globe. She holds first-line certifications CIPP/E, CIPM, and CDPO/BR, which cover the management of cybersecurity risks and vulnerabilities, privacy breaches, and reporting incidents to customers, and Data Protection Authorities. She has served on the IAPP (International Association of Privacy Professionals) Research Advisory Board. Ms. Fonseca is a dual-qualified attorney in Brazil and New York State. She holds a Master of Laws from Columbia University and a Law degree from the State University of Rio de Janeiro. |
Audit Committee. Our Audit Committee assists our Board of Directors in overseeing our accounting and financial reporting processes; processes related to cybersecurity; and the audits of our consolidated financial statements and security controls. The Audit Committee reports regularly to the Board of Directors concerning its activities and recommendations about cybersecurity, including any issues that arise for compliance with legal or regulatory requirements. The report to the Board of Directors may take the form of an oral report by the chairperson or any other member of the Committee designated by the Committee to make such report.
For more information on our Audit Committee, see “Item 6. Directors, Senior Management and Employees—C. Board Practices—Board Committees—Audit Committee.”
Board of Directors. Our Board of Directors ultimately oversees risk management within the Company and has established robust oversight mechanisms to ensure effective governance in managing risks associated with cybersecurity threats because VTEX recognizes the significance of these threats to our operational integrity and stakeholder confidence.
For more information on our Board of Directors, see “Item 6. Directors, Senior Management and Employees—A. Directors and Senior Management—Board of Directors.”
143
PartPART III
FINANCIAL STATEMENTS |
Not applicable.
FINANCIAL STATEMENTS |
See our consolidated financial statements beginning at page F-1.
EXHIBITS |
The following documents are filed as part of this annual report:
144
Exhibit No. | Description | |
| 101.SCH | ||
| 101.CAL | ||
| 101.DEF | XBRL Taxonomy Extension Definition Linkbase | |
| 101.LAB | ||
| 101.PRE | ||
| # | Portions of this exhibit have been omitted in accordance with the rules of the Securities and Exchange Commission. |
144145
SIGNATURES
The registrant hereby certifies that it meets all of the requirements for filing on Form 20-F and that it has duly caused and authorized the undersigned to sign this annual report on Form 20-F on its behalf.
| VTEX | ||||
| By: | /s/ Geraldo do Carmo Thomaz Júnior | |||
| Name: | Geraldo do Carmo Thomaz Júnior | |||
| Title: | Co-Chief Executive Officer | |||
| By: | /s/ Mariano Gomide de Faria | |||
| Name: | Mariano Gomide de Faria | |||
| Title: | Co-Chief Executive Officer | |||
| By: | /s/ Ricardo Camatta Sodré | |||
| Name: | Ricardo Camatta Sodré | |||
| Title: | Chief Financial Officer | |||
Date: March 2, 2023February 27, 2024
146
Auditor Name: PricewaterhouseCoopers Auditores Independentes Ltda. Auditor Location: Rio de Janeiro, Brazil Auditor Firm ID: 1351 | |||||||
Page | |||||||
| F-1 | |||||||
| F-2 | |||||||
| F-4 | |||||||
| F-5 | |||||||
| F-6 | |||||||
Note | December 31, 2023 | December 31, 2022 | ||||||||
ASSETS | ||||||||||
Current assets | ||||||||||
| Cash and cash equivalents | 5 | 28,035 | 24,394 | |||||||
| Restricted cash | 6 | — | 1,608 | |||||||
| Short-term investments | 7 | 181,374 | 214,164 | |||||||
| Trade receivables | 8 | 44,122 | 36,844 | |||||||
| Recoverable taxes | 9 | 6,499 | 5,122 | |||||||
| Deferred commissions | 1,005 | 663 | ||||||||
| Prepaid expenses | 10 | 5,143 | 4,152 | |||||||
| Derivative financial instruments | 26 | 53 | 117 | |||||||
| Other current assets | 22 | 93 | ||||||||
Total current assets | 266,253 | 287,157 | ||||||||
Non-current assets | ||||||||||
| Long-term investments | 7 | 2,000 | — | |||||||
| Trade receivables | 8 | 7,415 | 5,432 | |||||||
| Deferred tax assets | 11.1 | 19,926 | 17,710 | |||||||
| Prepaid expenses | 10 | 155 | 204 | |||||||
| Recoverable taxes | 9 | 4,454 | 3,334 | |||||||
| Deferred commissions | 2,924 | 1,790 | ||||||||
Other non-current assets | 902 | 957 | ||||||||
Right-of-use assets | 12 | 3,277 | 4,818 | |||||||
| Property and equipment, net | 13 | 2,697 | 3,909 | |||||||
| Intangible assets, net | 14 | 30,024 | 31,210 | |||||||
| Investments in joint venture | 1,118 | 1,152 | ||||||||
Total non-current assets | 74,892 | 70,516 | ||||||||
Total assets | 341,145 | 357,673 | ||||||||
Note | December 31, 2023 | December 31, 2022 | ||||||||||
LIABILITIES | ||||||||||||
Current liabilities | ||||||||||||
| Accounts payable and accrued expenses | 15 | 39,728 | 34,136 | |||||||||
| Loans and financing | 16 | — | 1,153 | |||||||||
| Taxes payable | 17 | 8,219 | 4,128 | |||||||||
| Lease liabilities | 12 | 1,863 | 1,898 | |||||||||
| Deferred revenue | 20.2 | 25,948 | 20,332 | |||||||||
| Accounts payable from acquisition of subsidiaries | 3.3 | — | 299 | |||||||||
| Other current liabilities | 1,486 | 70 | ||||||||||
Total current liabilities | 77,244 | 62,016 | ||||||||||
Non-current liabilities | ||||||||||||
| Accounts payable and accrued expenses | 15 | 1,632 | 511 | |||||||||
| Taxes payable | 17 | — | 160 | |||||||||
| Lease liabilities | 12 | 2,233 | 3,737 | |||||||||
| Deferred revenue | 20.2 | 16,584 | 13,923 | |||||||||
| Deferred tax liabilities | 11.2 | 2,668 | 2,464 | |||||||||
Other non-current liabilities | 452 | 185 | ||||||||||
Total non-current liabilities | 23,569 | 20,980 | ||||||||||
EQUITY | 19 | |||||||||||
| Issued capital | 18 | 19 | ||||||||||
| Capital reserve | 370,821 | 390,885 | ||||||||||
| Other reserves | (486 | ) | 127 | |||||||||
| Accumulated losses | (130,060 | ) | (116,373 | ) | ||||||||
Equity attributable to VTEX’s shareholders | 240,293 | 274,658 | ||||||||||
Non-controlling interests | 39 | 19 | ||||||||||
Total shareholders’ equity | 240,332 | 274,677 | ||||||||||
Total liabilities and equity | 341,145 | 357,673 | ||||||||||
Note | December 31, 2022 | December 31, 2021 | ||||||||
ASSETS | ||||||||||
Current assets | ||||||||||
Cash and cash equivalents | 5 | 24,394 | 121,006 | |||||||
Restricted cash | 6 | 1,608 | 1,183 | |||||||
Marketable securities and short-term investments | 7 | 214,164 | 177,191 | |||||||
Trade receivables | 8 | 36,844 | 34,682 | |||||||
Recoverable taxes | 9 | 5,122 | 6,881 | |||||||
Deferred commissions | 663 | 263 | ||||||||
Prepaid expenses | 10 | 4,152 | 7,911 | |||||||
Derivative financial instruments | 117 | — | ||||||||
Other current assets | 93 | 399 | ||||||||
Total current assets | 287,157 | 349,516 | ||||||||
Non-current assets | ||||||||||
Trade receivables | 8 | 5,432 | 6,143 | |||||||
Deferred tax assets | 11.1 | 17,710 | 12,572 | |||||||
Prepaid expenses | 10 | 204 | 343 | |||||||
Recoverable taxes | 9 | 3,334 | 556 | |||||||
Deferred commissions | 1,790 | 1,246 | ||||||||
Other non-current assets | 957 | 435 | ||||||||
Right-of-use assets | 12 | 4,818 | 5,183 | |||||||
Property and equipment, net | 13 | 3,909 | 4,711 | |||||||
Intangible assets, net | 14 | 31,210 | 33,644 | |||||||
Investments in joint venture | 1,152 | 621 | ||||||||
Total non-current assets | 70,516 | 65,454 | ||||||||
Total assets | 357,673 | 414,970 | ||||||||
Note | December 31, 2022 | December 31, 2021 | ||||||||
LIABILITIES | ||||||||||
Current liabilities | ||||||||||
Accounts payable and accrued expenses | 15 | 34,136 | 29,537 | |||||||
Loans and financing | 16 | 1,153 | 2,087 | |||||||
Taxes payable | 17 | 4,128 | 5,035 | |||||||
Lease liabilities | 12 | 1,898 | 1,105 | |||||||
Deferred revenue | 20.2 | 20,332 | 16,598 | |||||||
Derivative financial instruments | 26 | — | 133 | |||||||
Accounts payable from acquisition of subsidiaries | 3.3 | 299 | 4,260 | |||||||
Other current liabilities | 70 | 133 | ||||||||
Total current liabilities | 62,016 | 58,888 | ||||||||
Non-current liabilities | ||||||||||
Accounts payable and accrued expenses | 15 | 511 | 1,977 | |||||||
Loans and financing | 16 | — | 1,192 | |||||||
Taxes payable | 17 | 160 | 160 | |||||||
Lease liabilities | 12 | 3,737 | 4,886 | |||||||
Accounts payable from acquisition of subsidiaries | 3.3 | — | 2,163 | |||||||
Deferred revenue | 20.2 | 13,923 | 16,204 | |||||||
Deferred tax liabilities | 11.2 | 2,464 | 2,045 | |||||||
Other non-current liabilities | 185 | 266 | ||||||||
Total non-current liabilities | 20,980 | 28,893 | ||||||||
EQUITY | 19 | |||||||||
Issued Capital | 19 | 19 | ||||||||
Capital reserve | 390,885 | 390,466 | ||||||||
Other reserves | 127 | 652 | ||||||||
Accumulated losses | (116,373 | ) | (63,955 | ) | ||||||
Equity attributable to VTEX’s shareholders | 274,658 | 327,182 | ||||||||
Non-controlling interests | 19 | 7 | ||||||||
Total shareholders’ equity | 274,677 | 327,189 | ||||||||
Total liabilities and equity | 357,673 | 414,970 | ||||||||
Note | December 31, 2023 | December 31, 2022 | December 31, 2021 | |||||||||||
| Subscription revenue | 190,302 | 148,475 | 118,466 | |||||||||||
| Services revenue | 11,215 | 9,145 | 7,307 | |||||||||||
Total revenue | 20 | 201,517 | 157,620 | 125,773 | ||||||||||
| Subscription cost | (45,420 | ) | (41,408 | ) | (38,380 | ) | ||||||||
| Services cost | (15,529 | ) | (11,424 | ) | (11,212 | ) | ||||||||
Total cost | 21 | (60,949 | ) | (52,832 | ) | (49,592 | ) | |||||||
Gross profit | 140,568 | 104,788 | 76,181 | |||||||||||
Operating expenses | 21 | |||||||||||||
| General and administrative | (33,673 | ) | (28,348 | ) | (31,889 | ) | ||||||||
| Sales and marketing | (59,461 | ) | (67,798 | ) | (63,521 | ) | ||||||||
| Research and development | (60,116 | ) | (57,205 | ) | (45,186 | ) | ||||||||
| Other losses | (1,920 | ) | (1,356 | ) | (1,514 | ) | ||||||||
Loss from operations | (14,602 | ) | (49,919 | ) | (65,929 | ) | ||||||||
| Financial income | 46,374 | 23,770 | 7,414 | |||||||||||
| Financial expense | (43,367 | ) | (31,401 | ) | (12,058 | ) | ||||||||
Financial result, net | 23 | 3,007 | (7,631 | ) | (4,644 | ) | ||||||||
| Equity results | 1,008 | 1,106 | 587 | |||||||||||
Loss before income tax | (10,587 | ) | (56,444 | ) | (69,986 | ) | ||||||||
Income tax | ||||||||||||||
| Current | (5,182 | ) | (877 | ) | (1,646 | ) | ||||||||
| Deferred | 2,075 | 4,902 | 11,118 | |||||||||||
Total income tax | 11.3 | (3,107 | ) | 4,025 | 9,472 | |||||||||
Net loss for the year | (13,694 | ) | (52,419 | ) | (60,514 | ) | ||||||||
Attributable to controlling shareholders | (13,687 | ) | (52,418 | ) | (60,511 | ) | ||||||||
Non-controlling interest | (7 | ) | (1 | ) | (3 | ) | ||||||||
| Loss per share | 24 | |||||||||||||
Basic loss per share | (0.073 | ) | (0.275 | ) | (0.333 | ) | ||||||||
Diluted loss per share | (0.073 | ) | (0.275 | ) | (0.333 | ) | ||||||||
Note | December 31, 2022 | December 31, 2021 | December 31, 2020 | |||||||||||
Subscription revenue | 148,475 | 118,466 | 93,366 | |||||||||||
Services revenue | 9,145 | 7,307 | 5,310 | |||||||||||
Total revenue | 20 | 157,620 | 125,773 | 98,676 | ||||||||||
Subscription cost | (41,408 | ) | (38,380 | ) | (27,801 | ) | ||||||||
Services cost | (11,424 | ) | (11,212 | ) | (7,050 | ) | ||||||||
Total cost | 21 | (52,832 | ) | (49,592 | ) | (34,851 | ) | |||||||
Gross profit | 104,788 | 76,181 | 63,825 | |||||||||||
Operating expenses | 21 | |||||||||||||
General and administrative | (28,348 | ) | (31,889 | ) | (13,961 | ) | ||||||||
Sales and marketing | (67,798 | ) | (63,521 | ) | (23,844 | ) | ||||||||
Research and development | (57,205 | ) | (45,186 | ) | (19,039 | ) | ||||||||
Other losses | (1,356 | ) | (1,514 | ) | (462 | ) | ||||||||
Income (loss) from operations | (49,919 | ) | (65,929 | ) | 6,519 | |||||||||
Financial income | 23,770 | 7,414 | 3,904 | |||||||||||
Financial expense | (31,401 | ) | (12,058 | ) | (7,038 | ) | ||||||||
Financial result, net | 23 | (7,631 | ) | (4,644 | ) | (3,134 | ) | |||||||
Equity results | 1,106 | 587 | 78 | |||||||||||
Income (loss) before income tax | (56,444 | ) | (69,986 | ) | 3,463 | |||||||||
Income tax | ||||||||||||||
Current | (877 | ) | (1,646 | ) | (4,904 | ) | ||||||||
Deferred | 4,902 | 11,118 | 616 | |||||||||||
Total income tax | 11.3 | 4,025 | 9,472 | (4,288 | ) | |||||||||
Net loss for the year | (52,419 | ) | (60,514 | ) | (825 | ) | ||||||||
Attributable to controlling shareholders | (52,418 | ) | (60,511 | ) | (914 | ) | ||||||||
Non-controlling interest | (1 | ) | (3 | ) | 89 | |||||||||
Loss per share | 24 | |||||||||||||
Basic loss per share | (0.275 | ) | (0.333 | ) | (0.005 | ) | ||||||||
Diluted loss per share | (0.275 | ) | (0.333 | ) | (0.005 | ) | ||||||||
December 31, 2022 | December 31, 2021 | December 31, 2020 | ||||||||||
Net loss for the year | (52,419 | ) | (60,514 | ) | (825 | ) | ||||||
Items that are or may be reclassified subsequently to profit or loss: | ||||||||||||
| Foreign cumulative conversion adjustment | (525 | ) | 548 | 676 | ||||||||
Other comprehensive income (loss) for the year, net of taxes | (525 | ) | 548 | 676 | ||||||||
Total comprehensive loss for the year | (52,944 | ) | (59,966 | ) | (149 | ) | ||||||
December 31, 2023 | December 31, 2022 | December 31, 2021 | ||||||||||
| Net loss for the year | (13,694 | ) | (52,419 | ) | (60,514 | ) | ||||||
Items that may be reclassified subsequently to profit or loss: | ||||||||||||
| Foreign cumulative conversion adjustment | (613 | ) | (525 | ) | 548 | |||||||
Other comprehensive income (loss) for the year, net of taxes | (613 | ) | (525 | ) | 548 | |||||||
Total comprehensive loss for the year | (14,307 | ) | (52,944 | ) | (59,966 | ) | ||||||
Attributable to controlling shareholders | (14,319 | ) | (52,947 | ) | (59,967 | ) | ||||||
Non-controlling interest | 12 | 3 | 1 | |||||||||
Issued capital | Capital reserve | Other reserves | Accumulated losses | Equity attributable to VTEX’s shareholders | Non-controlling interests | Total shareholders’ equity | ||||||||||||||||||||||
At January 1, 2020 | 17 | 50,133 | (572 | ) | (2,530 | ) | 47,048 | 37 | 47,085 | |||||||||||||||||||
Net loss for the year | — | — | — | (914 | ) | (914 | ) | 89 | (825 | ) | ||||||||||||||||||
Other comprehensive income (loss) | — | — | 676 | — | 676 | — | 676 | |||||||||||||||||||||
Total comprehensive loss for the year | — | — | 676 | (914 | ) | (238 | ) | 89 | (149 | ) | ||||||||||||||||||
Transactions with owners of the Company | ||||||||||||||||||||||||||||
Exercise of stock options | — | 313 | — | — | 313 | — | 313 | |||||||||||||||||||||
Issue of ordinary shares as consideration for a business combination | — | 93 | — | 93 | — | 93 | ||||||||||||||||||||||
Capital contribution | — | 156,650 | — | — | 156,650 | — | 156,650 | |||||||||||||||||||||
Buyback of shares (note 19.2) | — | (131,047 | ) | — | — | (131,047 | ) | — | (131,047 | ) | ||||||||||||||||||
Share-based compensation | — | 2,803 | — | — | 2,803 | — | 2,803 | |||||||||||||||||||||
Total transactions with owners of the Company | — | 28,812 | — | — | 28,812 | — | 28,812 | |||||||||||||||||||||
At December 31, 2020 | 17 | 78,945 | 104 | (3,444 | ) | 75,622 | 126 | 75,748 | ||||||||||||||||||||
At January 1, 2021 | 17 | 78,945 | 104 | (3,444 | ) | 75,622 | 126 | 75,748 | ||||||||||||||||||||
Net loss for the year | — | — | — | (60,511 | ) | (60,511 | ) | (3 | ) | (60,514 | ) | |||||||||||||||||
Other comprehensive income (loss) | — | — | 548 | — | 548 | — | 548 | |||||||||||||||||||||
Total comprehensive loss for the year | — | — | 548 | (60,511 | ) | (59,963 | ) | (3 | ) | (59,966 | ) | |||||||||||||||||
Transactions with owners of the Company | — | |||||||||||||||||||||||||||
Exercise of stock options | — | 3,830 | — | — | 3,830 | — | 3,830 | |||||||||||||||||||||
Issue of ordinary shares as consideration for a business combination | — | 1,469 | — | — | 1,469 | — | 1,469 | |||||||||||||||||||||
Capital contribution | — | 1,000 | — | — | 1,000 | — | 1,000 | |||||||||||||||||||||
Issuance of common shares in initial public offering | 2 | 317,807 | — | — | 317,809 | — | 317,809 | |||||||||||||||||||||
Share issuance costs | — | (21,491 | ) | — | — | (21,491 | ) | — | (21,491 | ) | ||||||||||||||||||
Buyback of shares (note 19.2) | — | (407 | ) | — | — | (407 | ) | — | (407 | ) | ||||||||||||||||||
Share-based compensation | — | 9,217 | — | — | 9,217 | — | 9,217 | |||||||||||||||||||||
Transactions with non-controlling interests | — | — | — | — | — | 7 | 7 | |||||||||||||||||||||
Acquisition of non-controlling interests | — | 96 | — | — | 96 | (123 | ) | (27 | ) | |||||||||||||||||||
Total transactions with owners of the Company | 2 | 311,521 | — | — | 311,523 | (116 | ) | 311,407 | ||||||||||||||||||||
At December 31, 2021 | 19 | 390,466 | 652 | (63,955 | ) | 327,182 | 7 | 327,189 | ||||||||||||||||||||
At January 1, 2022 | 19 | 390,466 | 652 | (63,955 | ) | 327,182 | 7 | 327,189 | ||||||||||||||||||||
Net loss for the year | — | — | — | (52,418 | ) | (52,418 | ) | (1 | ) | (52,419 | ) | |||||||||||||||||
Other comprehensive income (loss) | — | — | (525 | ) | — | (525 | ) | — | (525 | ) | ||||||||||||||||||
Total comprehensive loss for the year | — | — | (525 | ) | (52,418 | ) | (52,943 | ) | (1 | ) | (52,944 | ) | ||||||||||||||||
Transactions with owners of the Company | — | |||||||||||||||||||||||||||
Exercise of stock options | — | 567 | — | — | 567 | — | 567 | |||||||||||||||||||||
Issued capital | Capital reserve | Other reserves | Accumulated losses | Equity attributable to VTEX’s shareholders | Non-controlling interests | Total shareholders’ equity | ||||||||||||||||||||||
At January 1, 2021 | 17 | 78,945 | 104 | (3,444 | ) | 75,622 | 126 | 75,748 | ||||||||||||||||||||
| Net loss for the year | — | — | — | (60,511 | ) | (60,511 | ) | (3 | ) | (60,514 | ) | |||||||||||||||||
| Other comprehensive income (loss) | — | — | 548 | — | 548 | — | 548 | |||||||||||||||||||||
Total comprehensive loss for the year | — | — | 548 | (60,511 | ) | (59,963 | ) | (3 | ) | (59,966 | ) | |||||||||||||||||
Transactions with owners of the Company | ||||||||||||||||||||||||||||
| Exercise of stock options | — | 3,830 | — | — | 3,830 | — | 3,830 | |||||||||||||||||||||
| Issue of ordinary shares as consideration for a business combination | — | 1,469 | — | — | 1,469 | — | 1,469 | |||||||||||||||||||||
| Capital contribution | — | 1,000 | — | — | 1,000 | — | 1,000 | |||||||||||||||||||||
| Issuance of common shares in initial public offering | 2 | 317,807 | — | — | 317,809 | — | 317,809 | |||||||||||||||||||||
| Share issuance costs | — | (21,491 | ) | — | — | (21,491 | ) | — | (21,491 | ) | ||||||||||||||||||
| Buyback of shares (note 19.2) | — | (407 | ) | — | — | (407 | ) | — | (407 | ) | ||||||||||||||||||
| Share-based compensation | — | 9,217 | — | — | 9,217 | — | 9,217 | |||||||||||||||||||||
Transactions with non-controlling interests | — | — | — | — | — | 7 | 7 | |||||||||||||||||||||
Acquisition of non-controlling interests | — | 96 | — | — | 96 | (123 | ) | (27 | ) | |||||||||||||||||||
Total transactions with owners of the Company | 2 | 311,521 | — | — | 311,523 | (116 | ) | 311,407 | ||||||||||||||||||||
At December 31, 2021 | 19 | 390,466 | 652 | (63,955 | ) | 327,182 | 7 | 327,189 | ||||||||||||||||||||
At January 1, 2022 | 19 | 390,466 | 652 | (63,955 | ) | 327,182 | 7 | 327,189 | ||||||||||||||||||||
| Net loss for the year | — | — | — | (52,418 | ) | (52,418 | ) | (1 | ) | (52,419 | ) | |||||||||||||||||
| Other comprehensive income (loss) | — | — | (525 | ) | — | (525 | ) | — | (525 | ) | ||||||||||||||||||
Total comprehensive loss for the year | — | — | (525 | ) | (52,418 | ) | (52,943 | ) | (1 | ) | (52,944 | ) | ||||||||||||||||
Transactions with owners of the Company | ||||||||||||||||||||||||||||
| Exercise of stock options | — | 567 | — | — | 567 | — | 567 | |||||||||||||||||||||
| Issue of ordinary shares as consideration for a business combination | — | 3 | — | — | 3 | — | 3 | |||||||||||||||||||||
| Share repurchase program (note 19.2) | — | (12,798 | ) | — | — | (12,798 | ) | — | (12,798 | ) | ||||||||||||||||||
| Share-based compensation | — | 12,647 | — | — | 12,647 | — | 12,647 | |||||||||||||||||||||
Transactions with non-controlling interests | — | — | — | — | — | 13 | 13 | |||||||||||||||||||||
Total transactions with owners of the Company | — | 419 | — | — | 419 | 13 | 432 | |||||||||||||||||||||
At December 31, 2022 | 19 | 390,885 | 127 | (116,373 | ) | 274,658 | 19 | 274,677 | ||||||||||||||||||||
At January 1, 2023 | 19 | 390,885 | 127 | (116,373 | ) | 274,658 | 19 | 274,677 | ||||||||||||||||||||
| Net loss for the year | — | — | — | (13,687 | ) | (13,687 | ) | (7 | ) | (13,694 | ) | |||||||||||||||||
| Other comprehensive income (loss) | — | — | (613 | ) | — | (613 | ) | — | (613 | ) | ||||||||||||||||||
Total comprehensive loss for the year | — | — | (613 | ) | (13,687 | ) | (14,300 | ) | (7 | ) | (14,307 | ) | ||||||||||||||||
Transactions with owners of the Company | ||||||||||||||||||||||||||||
| Exercise of stock options | — | 1,031 | — | — | 1,031 | — | 1,031 | |||||||||||||||||||||
| Share repurchase program (note 19.2) | — | (35,243 | ) | — | — | (35,243 | ) | — | (35,243 | ) | ||||||||||||||||||
| Share-based compensation | — | 14,148 | — | — | 14,148 | — | 14,148 | |||||||||||||||||||||
| Cancellation of shares | (1 | ) | — | — | — | (1 | ) | — | (1 | ) | ||||||||||||||||||
Transactions with non-controlling interests | — | — | — | — | — | 27 | 27 | |||||||||||||||||||||
Total transactions with owners of the Company | (1 | ) | (20,064 | ) | — | — | (20,065 | ) | 27 | (20,038 | ) | |||||||||||||||||
At December 31, 2023 | 18 | 370,821 | (486 | ) | (130,060 | ) | 240,293 | 39 | 240,332 | |||||||||||||||||||
Issue of ordinary shares as consideration for a business combination | — | 3 | — | — | 3 | — | 3 | |||||||||||||||||||||
Share repurchase program (note 19.2) | — | (12,798 | ) | — | — | (12,798 | ) | — | (12,798 | ) | ||||||||||||||||||
Share-based compensation | — | 12,647 | — | — | 12,647 | — | 12,647 | |||||||||||||||||||||
Transactions with non-controlling interests | — | — | — | — | — | 13 | 13 | |||||||||||||||||||||
Total transactions with owners of the Company | — | 419 | — | — | 419 | 13 | 432 | |||||||||||||||||||||
At December 31, 2022 | 19 | 390,885 | 127 | (116,373 | ) | 274,658 | 19 | 274,677 | ||||||||||||||||||||
December 31, 2023 | December 31, 2022 | December 31, 2021 | ||||||||||
Net loss for the year | (13,694 | ) | (52,419 | ) | (60,514 | ) | ||||||
Adjustments for: | ||||||||||||
| Depreciation and amortization | 5,018 | 4,616 | 4,072 | |||||||||
| Deferred income tax | (2,075 | ) | (4,902 | ) | (11,118 | ) | ||||||
| Loss on disposal of rights of use, property, equipment, and intangible assets | 874 | (9 | ) | 54 | ||||||||
| Expected credit losses from trade receivables | 1,472 | 852 | 887 | |||||||||
| Share-based compensation | 16,360 | 12,202 | 9,217 | |||||||||
| Provision for payroll taxes (share-based compensation) | 3,326 | (1,125 | ) | 7,611 | ||||||||
| Adjustment of hyperinflation | 19,369 | 5,175 | 2,274 | |||||||||
| Equity results | (1,008 | ) | (1,106 | ) | (587 | ) | ||||||
| Accrued interest | (23,757 | ) | (2,252 | ) | (264 | ) | ||||||
| Fair value (gains) losses | (10,332 | ) | 2,522 | (1,188 | ) | |||||||
| Others and foreign exchange, net | 8,298 | 2,786 | 930 | |||||||||
Change in operating assets and liabilities | ||||||||||||
| Trade receivables | (13,137 | ) | (3,579 | ) | (16,749 | ) | ||||||
| Recoverable taxes | (3,597 | ) | (671 | ) | (2,692 | ) | ||||||
| Prepaid expenses | (598 | ) | 3,947 | (2,741 | ) | |||||||
| Other assets | 583 | (583 | ) | 186 | ||||||||
| Accounts payable and accrued expenses | 855 | 5,229 | 7,417 | |||||||||
| Taxes payable | 7,347 | (1,495 | ) | 3,102 | ||||||||
| Deferred revenue | 6,948 | 1,157 | 12,330 | |||||||||
| Other liabilities | 1,925 | 745 | (364 | ) | ||||||||
Cash provided by (used in) operating activities | 4,177 | (28,910 | ) | (48,137 | ) | |||||||
| Income tax refund (paid) | 82 | (312 | ) | (4,854 | ) | |||||||
Net cash provided by (used in) operating activities | 4,259 | (29,222 | ) | (52,991 | ) | |||||||
Cash flows from investing activities | ||||||||||||
| Dividends received from joint venture | 1,138 | 147 | — | |||||||||
| Purchase of short and long-term investment | (135,442 | ) | (120,615 | ) | (177,816 | ) | ||||||
| Redemption of short-term investment | 171,200 | 78,011 | 17,910 | |||||||||
| Interest and dividend received from short-term investments | 2,106 | 1,110 | 588 | |||||||||
| Payment of business acquired | — | (1,692 | ) | (5,712 | ) | |||||||
| Acquisitions of intangible assets | — | — | (368 | ) | ||||||||
| Acquisitions of property and equipment | (472 | ) | (340 | ) | (1,383 | ) | ||||||
| Derivative financial instruments | (105 | ) | — | — | ||||||||
Net cash provided by (used in) investing activities | 38,425 | (43,379 | ) | (166,781 | ) | |||||||
Cash flows from financing activities | ||||||||||||
| Derivative financial instruments | — | (746 | ) | — | ||||||||
| Changes in restricted cash | 1,660 | (348 | ) | 246 | ||||||||
| Proceeds from the exercise of stock options | 1,031 | 567 | 3,830 | |||||||||
Net-settlement of share-based payment | (2,488 | ) | (1,615 | ) | (2,705 | ) | ||||||
| Capital increase | — | — | 1,000 | |||||||||
| Capital increase - issuance of common shares in initial public offering | — | — | 296,318 | |||||||||
| Buyback of shares | (35,243 | ) | (12,798 | ) | (2,423 | ) | ||||||
| Payment of loans and financing | (1,238 | ) | (2,651 | ) | (10,886 | ) | ||||||
| Interest paid | (5 | ) | (56 | ) | (104 | ) | ||||||
| Principal elements of lease payments | (1,574 | ) | (1,263 | ) | (913 | ) | ||||||
| Lease interest paid | (573 | ) | (670 | ) | (680 | ) | ||||||
Net cash provided by (used in) financing activities | (38,430 | ) | (19,580 | ) | 283,683 | |||||||
Net increase (decrease) in cash and cash equivalents | 4,254 | (92,181 | ) | 63,911 | ||||||||
Cash and cash equivalents, beginning of the year | 24,394 | 121,006 | 58,557 | |||||||||
| Effect of exchange rate changes | (613 | ) | (4,431 | ) | (1,462 | ) | ||||||
Cash and cash equivalents, end of the year | 28,035 | 24,394 | 121,006 | |||||||||
Non-cash transactions: | ||||||||||||
Lease liabilities arising from obtaining right-of-use | (251 | ) | 983 | 494 | ||||||||
| Issue of ordinary shares as consideration for a business combination | — | 3 | 1,469 | |||||||||
Unpaid amount related to acquisition of non-controlling interest | — | — | 27 | |||||||||
| Unpaid amount related to business combinations | — | — | 8,264 | |||||||||
| Dividends from joint venture used to pay accounts from acquisition of subsidiaries | — | 448 | — | |||||||||
Transactions with non-controlling interests | 27 | 13 | 7 | |||||||||
Note | December 31, 2022 | December 31, 2021 | December 31, 2020 | |||||||||||
Net loss for the year | (52,419 | ) | (60,514 | ) | (825 | ) | ||||||||
Adjustments for: | ||||||||||||||
Depreciation and amortization | 21 | 4,616 | 4,072 | 2,400 | ||||||||||
Deferred income tax | (4,902 | ) | (11,118 | ) | (616 | ) | ||||||||
Loss on disposal of rights of use, property, equipment, and intangible assets | 12,13,14 | (9 | ) | 54 | 132 | |||||||||
Expected credit losses from trade receivables | 852 | 887 | 972 | |||||||||||
Share-based compensation | 12,202 | 9,217 | 2,803 | |||||||||||
Provision for payroll taxes (share-based compensation) | (1,125 | ) | 7,611 | — | ||||||||||
Adjustment of hyperinflation | 5,175 | 2,274 | 779 | |||||||||||
Equity results | (1,106 | ) | (587 | ) | (78 | ) | ||||||||
Fair value (gains) losses | 2,522 | (1,188 | ) | (1,454 | ) | |||||||||
Others and foreign exchange, net | 534 | 666 | 1,714 | |||||||||||
Change in operating assets and liabilities | ||||||||||||||
Trade receivables | (3,579 | ) | (16,749 | ) | (10,104 | ) | ||||||||
Recoverable taxes | (671 | ) | (2,692 | ) | (2,215 | ) | ||||||||
Prepaid expenses | 3,947 | (2,741 | ) | (3,727 | ) | |||||||||
Other assets | (583 | ) | 186 | (13 | ) | |||||||||
Accounts payable and accrued expenses | 5,229 | 7,417 | 7,961 | |||||||||||
Taxes payable | (1,495 | ) | 3,102 | 5,944 | ||||||||||
Deferred revenue | 1,157 | 12,330 | 9,641 | |||||||||||
Other liabilities | 745 | (364 | ) | (210 | ) | |||||||||
Cash provided by (used in) operating activities | (28,910 | ) | (48,137 | ) | 13,104 | |||||||||
Income tax paid | (312 | ) | (4,854 | ) | (1,939 | ) | ||||||||
Net cash provided by (used in) operating activities | (29,222 | ) | (52,991 | ) | 11,165 | |||||||||
Cash flows from investing activities | ||||||||||||||
Dividends received from joint venture | 147 | — | — | |||||||||||
Purchase of short-term investment | 7 | (111,612 | ) | (177,816 | ) | — | ||||||||
Redemption of short-term investment | 7 | 78,011 | 1,053 | — | ||||||||||
Purchase of marketable securities | 7 | (9,003 | ) | — | (3,846 | ) | ||||||||
Redemption of marketable securities | 7 | — | 16,857 | 2,007 | ||||||||||
Interest and dividend received from short-term investments | 1,110 | 588 | 1,037 | |||||||||||
Payment of business acquired | (1,692 | ) | (5,712 | ) | (3,646 | ) | ||||||||
Acquisitions of intangible assets | 14 | — | (368 | ) | — | |||||||||
Acquisitions of property and equipment | 13 | (340 | ) | (1,383 | ) | (1,648 | ) | |||||||
Net cash used in investing activities | (43,379 | ) | (166,781 | ) | (6,096 | ) | ||||||||
Cash flows from financing activities | ||||||||||||||
Derivative financial instruments | (746 | ) | — | — | ||||||||||
Changes in restricted cash | (348 | ) | 246 | 1,337 | ||||||||||
Proceeds from the exercise of stock options | 567 | 3,830 | 313 | |||||||||||
Net-settlement of share-based payment | (1,615 | ) | (2,705 | ) | — | |||||||||
Capital increase | 19.2 | — | 1,000 | 156,650 | ||||||||||
| Capital increase - proceeds from initial public offering, net of transaction costs | — | 296,318 | — | |||||||||||
Buyback of shares | 19.2 | (12,798 | ) | (2,423 | ) | (129,031 | ) | |||||||
Payment of loans and financing | 16 | (2,651 | ) | (10,886 | ) | (2,999 | ) | |||||||
Interest paid | 16 | (56 | ) | (104 | ) | (186 | ) | |||||||
Principal elements of lease payments | 12 | (1,263 | ) | (913 | ) | (350 | ) | |||||||
Lease interest paid | 12 | (670 | ) | (680 | ) | (775 | ) | |||||||
Net cash provided by (used in) financing activities | (19,580 | ) | 283,683 | 24,959 | ||||||||||
Net increase (decrease) in cash and cash equivalents | (92,181 | ) | 63,911 | 30,028 | ||||||||||
Cash and cash equivalents, beginning of the year | 121,006 | 58,557 | 29,762 | |||||||||||
Effect of exchange rate changes | (4,431 | ) | (1,462 | ) | (1,233 | ) | ||||||||
Cash and cash equivalents, end of the year | 5 | 24,394 | 121,006 | 58,557 | ||||||||||
Non-cash transactions: | ||||||||||||||
Lease liabilities arising from obtaining right-of-use | 983 | 494 | 820 | |||||||||||
Accounts payable related to buyback of shares | — | — | 2,016 | |||||||||||
Issue of ordinary shares as consideration for a business combination | 19.2 | 3 | 1,469 | 93 | ||||||||||
Unpaid amount related to acquisition of non-controlling interest | 19.2 | — | 27 | — | ||||||||||
Unpaid amount related to business combinations | 3 | — | 8,264 | — | ||||||||||
| Dividends from joint venture used to pay accounts from acquisition of subsidiaries | 448 | — | — | |||||||||||
Transactions with non-controlling interests | 13 | 7 | — | |||||||||||
1 | General information |
Company | Place of business/ country of incorporation | Relationship | Principal business activity | % of Ownership as of December 31, | ||||||||||||||
2023 | 2022 | 2021 | ||||||||||||||||
| VTEX (“VTEX”) | Cayman | Holding | Technology Services | |||||||||||||||
| VTEX Argentina S.A. (“VTEX ARG”) | Argentina | Subsidiary | Technology Services | 100 | 100 | 100 | ||||||||||||
VTEX Brasil Tecnologia para E-commerce LTDA. (“VTEX Brazil”) | Brazil | Subsidiary | Technology Services | 100 | 100 | 100 | ||||||||||||
| VTEX Day Eventos LTDA (“VTEX DAY”) | Brazil | Subsidiary | Production of events | 100 | 100 | 100 | ||||||||||||
| Loja Integrada Tecnologia Para Softwares S.A. (“Loja Integrada”) | Brazil | Subsidiary | Technology Services | 98.68 | 99.58 | 99.87 | ||||||||||||
| Suiteshare Tecnologia da Informação S.A (“Suiteshare”) (i) | Brazil | Subsidiary | Technology Services | — | — | 100 | ||||||||||||
| VTEX Chile SPA (“VTEX CHI”) | Chile | Subsidiary | Subsidiary | 100 | 100 | 100 | ||||||||||||
| VTEX Colombia Tecnologia para Ecommerce S.A.S. (“VTEX COL”) | Colombia | Subsidiary | Technology Services | 100 | 100 | 100 | ||||||||||||
| VTEX Commerce Cloud Solutions LLC (“VTEX USA”) | USA | Subsidiary | Technology Services | 100 | 100 | 100 | ||||||||||||
| VTEX Ecommerce Platform Limited (“VTEX UK”) | UK | Subsidiary | Technology Services | 100 | 100 | 100 | ||||||||||||
Company | Place of business/ country of incorporation | Relationship | Principal business activity | % of Ownership as of December 31, | ||||||||||||||
2022 | 2021 | 2020 | ||||||||||||||||
| VTEX (“VTEX”) | Cayman | Holding | Technology Services | |||||||||||||||
| VTEX Informática S.A. (“VTEX ARG”) (i) | Argentina | Subsidiary | Technology Services | 100 | 100 | 96.54 | ||||||||||||
VTEX Brasil Tecnologia para Ecommerce LTDA. (“VTEX Brazil”) | Brazil | Subsidiary | Technology Services | 100 | 100 | 100 | ||||||||||||
| VTEX Day Eventos Ltda. (“VTEX DAY”) | Brazil | Subsidiary | Production of events | 100 | 100 | 100 | ||||||||||||
| Loja Integrada Tecnologia para Softwares S.A. (“Loja Integrada”) | Brazil | Subsidiary | Technology Services | 99.58 | 99.87 | 100 | ||||||||||||
| VTEX Intermediação de Cobrança Ltda. (“VTEX STORE”) (ii) | Brazil | Subsidiary | Technology Services | — | — | 99.99 | ||||||||||||
| Dlieve Tecnologia S.A. (“Dlieve”) (iii) | Brazil | Subsidiary | Technology Services | — | — | 100 | ||||||||||||
| Ciashop Soluções para Comércio Eletrônico S.A. (“Ciashop”) (iv) | Brazil | Subsidiary | Technology Services | — | — | 100 | ||||||||||||
| Suiteshare Tecnologia da Informação S.A (“Suiteshare”) (v) | Brazil | Subsidiary | Technology Services | — | 100 | — | ||||||||||||
Company | Place of business/ country of incorporation | Relationship | Principal business activity | % of Ownership as of December 31, | ||||||||||||||
2022 | 2021 | 2020 | ||||||||||||||||
VTEX Chile SPA (“VTEX CHI”) | Chile | Subsidiary | Technology Services | 100 | 100 | 100 | ||||||||||||
VTEX Colombia Tecnologia para Ecommerce S.A.S. (“VTEX COL”) | Colombia | Subsidiary | Technology Services | 100 | 100 | 100 | ||||||||||||
VTEX Commerce Cloud Solutions LLC (“VTEX USA”) | USA | Subsidiary | Technology Services | 100 | 100 | 100 | ||||||||||||
VTEX Ecommerce Platform Limited (“VTEX UK”) | UK | Subsidiary | Technology Services | 100 | 100 | 100 | ||||||||||||
EICOM Limited (“EICOM”) (vi) | UK | Subsidiary | Technology Services | — | — | 100 | ||||||||||||
Soluciones Cloud En Ecommerce S. De R.L. De C.V. (“VTEX MEX”) (vii) | Mexico | Subsidiary | Technology Services | 100 | 99.99 | 99.95 | ||||||||||||
EI Education S.A.P.I de C.V. (“Escuela de Internet or “Escuela”) | Mexico | Subsidiary | Technology Services | 100 | 100 | 100 | ||||||||||||
Peru Tecnologia para ECOMMERCE S.A.C. (“VTEX PERU”) (viii) | Peru | Subsidiary | Technology Services | 100 | 100 | — | ||||||||||||
VTEX Platform España, S.L. (“VTEX ESP”) (ix) | Spain | Subsidiary | Technology Services | 100 | — | — | ||||||||||||
VTEX Ecommerce Platform Limited—Sede Secondaria (“VTEX ITA”) (viii) | Italy | Branch | Technology Services | 100 | 100 | — | ||||||||||||
VTEX Ecommerce Platform Limited London—Sucursala Bucuresti (“VTEX ROM”) (viii) | Romania | Branch | Technology Services | 100 | 100 | — | ||||||||||||
VTEX Ecommerce Platform Limited – Sucursal em Portugal (“VTEX PORT”) ( | Portugal | Branch | Technology Services | 100 | 100 | — | ||||||||||||
Company | Place of business/ country of incorporation | Relationship | Principal business activity | % of Ownership as of December 31, | ||||||||||||||
2023 | 2022 | 2021 | ||||||||||||||||
| VTEX Mexico Soluciones en Ecommerce S.R.L. de C.V. (“VTEX MEX”) (ii) | Mexico | Subsidiary | Technology Services | 100 | 100 | 99.99 | ||||||||||||
| EICOM Business School S.A.P.I De C.V. (“Escuela”) | Mexico | Subsidiary | Technology Services | 100 | 100 | 100 | ||||||||||||
| Peru Tecnologia para ECOMMERCE S.A.C. (“VTEX PERU”) | Peru | Subsidiary | Technology Services | 100 | 100 | 100 | ||||||||||||
| VTEX Platform España, S.L. (“VTEX ESP”) (iii) | Spain | Subsidiary | Technology Services | 100 | 100 | — | ||||||||||||
| VTEX Ecommerce Platform Limited - Sede Secondaria (“VTEX ITA”) | Italy | Branch | Technology Services | 100 | 100 | 100 | ||||||||||||
| VTEX Ecommerce Platform Limited London - Sucursala Bucuresti (“VTEX ROM”) | Romania | Branch | Technology Services | 100 | 100 | 100 | ||||||||||||
| VTEX Ecommerce Platform Limited – Sucursal em Portugal (“VTEX PORT”) | Portugal | Branch | Technology Services | 100 | 100 | 100 | ||||||||||||
| (i) |
| Suiteshare was acquired in April 2021, refer to note 3.2 for additional details. In March 2022 it was merged into VTEX Brazil. |
In May 2021, the Group acquired the non-controlling interest of VTEX MEX. Refer to note 19.2(d) for additional details. |
| VTEX ESP was created in March/ 2022 to fulfill the Group’s operational needs. |
1.1 | Initial Public Offering “IPO” |
2 | Significant accounting policies |
2.1 | Basis of preparation |
a. | Compliance with IFRS |
b. | Historical cost convention |
c. | New standards, interpretations, and amendments adopted by the Group |
d. | New standards and interpretations not yet adopted |
2.2 | Principles of consolidation and equity accounting |
a. | Subsidiaries |
b. | Joint arrangements |
2.3 | Segment reporting |
a. | Segment revenue by region |
December 31, 2023 | December 31, 2022 | December 31, 2021 | ||||||||||
| Brazil | 109,470 | 86,066 | 66,464 | |||||||||
| Latin America - except Brazil | 70,302 | 55,770 | 48,038 | |||||||||
| Rest of the world | 21,745 | 15,784 | 11,271 | |||||||||
Total revenue by region | 201,517 | 157,620 | 125,773 | |||||||||
December 31, 2022 | December 31, 2021 | December 31, 2020 | ||||||||||
| Brazil | 86,066 | 66,464 | 56,485 | |||||||||
| Latin America - except Brazil | 55,770 | 48,038 | 36,486 | |||||||||
| Rest of the world | 15,784 | 11,271 | 5,705 | |||||||||
Total revenue by region | 157,620 | 125,773 | 98,676 | |||||||||
b. | Segment non-current assets by region |
December 31, 2022 | December 31, 2021 | December 31, 2023 | December 31, 2022 | |||||||||||||
| Brazil | 21,047 | 21,953 | 19,850 | 21,047 | ||||||||||||
| Latin America - except Brazil | 889 | 1,085 | 304 | 889 | ||||||||||||
| Rest of the world | 19,153 | 20,500 | 16,962 | 19,153 | ||||||||||||
Total non-current assets by region | 41,089 | 43,538 | 37,116 | 41,089 | ||||||||||||
2.4 | Foreign currency translation |
(i) | Functional and presentation currency |
(ii) | Transactions and balances |
(iii) | Group companies with a different functional currency |
2.5 | Cash and cash equivalents |
2.6 | Restricted cash |
2.7 |
Trade receivables |
2.9 | Property and equipment |
Class of Property and equipment | Useful life (years) | ||||
| Machinery and equipment | 10 | ||||
| Computers and peripherals | 5 | ||||
| Furniture and fixtures | 10 | ||||
| Leasehold improvements | 2-10 |
2.10 | Business combinations |
2.11 | Intangible assets |
a. | Goodwill |
b. | Customer relationship and intellectual property |
c. | Software |
d. | Trademark |
2.12 | Impairment of non-financial assets |
2.13 | Prepaid expenses |
2.14 | Loans and financing |
2.15 | Accounts payable and accrued expenses |
2.16 | Provisions |
2.17 | Current and deferred income tax |
2.18 | Share-based compensation |
2.19 | Revenue recognition |
a. | Subscriptions |
b. | Services |
2.20 | Deferred Costs |
2.21 | Leases |
2.22 | Distribution of dividends |
2.23 | Earnings per share |
a. | Basic earnings per share |
b. | Diluted earnings per share |
2.24 | Financial instruments |
a. | Classification |
b. | Recognition and derecognition |
c. | Measurement |
2.25 | IAS 29 - Financial reporting in Hyperinflationary Economies |
3.1 | Acquisition of WorkArea |
3.2 | Acquisition of Suiteshare |
3.3 | Accounts payable from acquisition of subsidiaries |
December 31, 2022 | ||||||||||
Earn-out - cash | ||||||||||
| 299 | ||||||||||
Total | ||||||||||
Asset | Valuation Methodology | Estimated Fair Value in thousands of U.S. dollars | Estimated useful life in years | |||||||
| Customer relationship | Multi-period excess earnings method | 6,780 | 8 | |||||||
| Software | Relief from royalty method | 310 | 3 | |||||||
December 31, 2022 | December 31, 2021 | |||||||
| Fixed installment - cash | — | 1,470 | ||||||
Earn-out - cash | 299 | 2,790 | ||||||
Current | 299 | 4,260 | ||||||
Earn-out - cash | — | 2,163 | ||||||
Non-current | — | 2,163 | ||||||
Total | 299 | 6,423 | ||||||
3.4 |
Date | Amount | |||
| 2023 | 299 | |||
Total | 299 | |||
Changes in balance payable from acquisition of subsidiaries |
2023 | 2022 | |||||||
Opening balance on January 1 | 299 | 6,423 | ||||||
| Payments of principal/finance charges - installments | — | (1,224 | ) | |||||
Payments of principal/finance charges - earn-out | — | (916 | ) | |||||
| Fixed installments adjustment | — | (362 | ) | |||||
| Earn-out adjustment (i) | (299 | ) | (3,740 | ) | ||||
| Accrued interest and others | — | 9 | ||||||
| Exchange differences | — | 109 | ||||||
Closing balance on December 31 | — | 299 | ||||||
2022 | 2021 | |||||||
Opening balance on January 1 | 6,423 | 4,000 | ||||||
| Addition due to acquisition - installments | — | 1,880 | ||||||
Addition due to acquisition - earn-out | — | 6,483 | ||||||
| Payments of principal/finance charges - installments | (1,224 | ) | (3,556 | ) | ||||
Payments of principal/finance charges - earn-out | (916 | ) | (1,378 | ) | ||||
| Fixed installments adjustment (i) | (362 | ) | 44 | |||||
Earn-out adjustment (i) | (3,740 | ) | (785 | ) | ||||
| Accrued interest and others | 9 | 62 | ||||||
| Exchange differences | 109 | (327 | ) | |||||
Closing balance on December 31 | 299 | 6,423 | ||||||
| (i) | earn-out, |
4 | Critical estimates and accounting judgments |
| i. | Recognition and measurement of provisions for tax, civil, and labor risks |
| ii. | Credit losses on trade receivables |
| iii. | Fair value of the consideration transferred in subsidiaries acquisition. |
| iv. | Impairment of non-financial assets |
| v. | Share-based compensation |
| vi. | Deferred tax |
| vii. | Useful life rate of intangible and fixed assets |
| i. | Lease term |
| ii. | Incremental lease rate |
5 | Cash and cash equivalents |
December 31, 2022 | December 31, 2021 | December 31, 2023 | December 31, 2022 | |||||||||||||
| Cash and cash bank deposits | 18,930 | 120,928 | 24,962 | 18,930 | ||||||||||||
| Time deposits and other investments | 2,271 | — | ||||||||||||||
| Investment funds | 3,193 | 78 | ||||||||||||||
| Time deposits, investment funds and others | 3,073 | 5,464 | ||||||||||||||
Total | 24,394 | 121,006 | 28,035 | 24,394 | ||||||||||||
6 | Restricted cash |
December 31, 2022 | December 31, 2021 | |||||||
| Restricted cash (i) | 1,608 | 1,183 | ||||||
Total | 1,608 | 1,183 | ||||||
December 31, 2023 | December 31, 2022 | |||||||
| Restricted cash (i) | — | 1,608 | ||||||
Total | — | 1,608 | ||||||
| (i) | As |
7 | Short and long-term investments |
December 31, 2023 | December 31, 2022 | |||||||
| Financial assets measured at fair value | 95,293 | 204,045 | ||||||
| Financial assets measured at amortized cost | 88,081 | 10,119 | ||||||
Short and long-term investments | 183,374 | 214,164 | ||||||
| Current | 181,374 | 214,164 | ||||||
Non-current (i) | 2,000 | — | ||||||
| (i) | Comprising ordinary shares of an unlisted entity acquired in October 2023, measured at fair value. The Group elected to recognize the changes in fair value of the existing instrument through profit or loss (“FVPL”). Refer to note 26.1(ii)a for additional details. |
measured by fair value |
December 31, 2022 | December 31, 2021 | |||||||
| Marketable securities | 10,119 | — | ||||||
| Short-term investments | 204,045 | 177,191 | ||||||
Marketable securities and short-term investments | 214,164 | 177,191 | ||||||
2023 | 2022 | |||||||
Opening balance on January 1 | 204,045 | 177,191 | ||||||
| Additions | 21,146 | 111,612 | ||||||
| Redemption | (136,672 | ) | (78,011 | ) | ||||
| Accrued dividend | 46 | — | ||||||
| Fair value gains (losses) | 9,823 | (4,766 | ) | |||||
| Exchange differences | (3,095 | ) | (1,981 | ) | ||||
Closing balance on December 31 | 95,293 | 204,045 | ||||||
2022 | 2021 | |||||||
Opening balance on January 1 | — | 16,969 | ||||||
| Additions | 9,003 | — | ||||||
| Redemption | — | (16,857 | ) | |||||
| Interest received | — | (324 | ) | |||||
| Accrued interest | 1,141 | — | ||||||
| Fair value gains (losses) | — | 212 | ||||||
| Exchange differences | (25 | ) | — | |||||
Closing balance on December 31 | 10,119 | — | ||||||
7.2 |
2022 | 2021 | |||||||
Opening balance on January 1 | 177,191 | — | ||||||
| Additions | 111,612 | 177,816 | ||||||
| Redemption | (78,011 | ) | (1,053 | ) | ||||
| Fair value gains (losses) | (4,766 | ) | 428 | |||||
| Exchange differences | (1,981 | ) | — | |||||
Closing balance on December 31 | 204,045 | 177,191 | ||||||
2023 | 2022 | |||||||
Opening balance on January 1 | 10,119 | — | ||||||
| Additions | 114,296 | 9,003 | ||||||
| Redemption | (34,528 | ) | — | |||||
| Accrued interest | 21,605 | 1,141 | ||||||
| Exchange differences | (23,411 | ) | (25 | ) | ||||
Closing balance on December 31 | 88,081 | 10,119 | ||||||
8 | Trade receivables |
December 31, 2022 | December 31, 2021 | |||||||
| Trade receivables | 43,084 | 41,972 | ||||||
| Expected credit losses | (808 | ) | (1,147 | ) | ||||
Total trade receivables | 42,276 | 40,825 | ||||||
| Current | 36,844 | 34,682 | ||||||
Non-current | 5,432 | 6,143 | ||||||
December 31, 2023 | December 31, 2022 | |||||||
| Trade receivables | 52,446 | 43,084 | ||||||
| Expected credit losses | (909 | ) | (808 | ) | ||||
Total trade receivables | 51,537 | 42,276 | ||||||
| Current | 44,122 | 36,844 | ||||||
Non-current | 7,415 | 5,432 | ||||||
2022 | 2021 | |||||||
Opening balance on January 1 | (1,147 | ) | (649 | ) | ||||
| Addition, net | (852 | ) | (887 | ) | ||||
| Addition from acquisition of subsidiaries | — | (100 | ) | |||||
Write-off | 1,114 | 429 | ||||||
| Exchange differences | 77 | 60 | ||||||
Closing balance on December 31 | (808 | ) | (1,147 | ) | ||||
2023 | 2022 | 2021 | ||||||||||
Opening balance on January 1 | (808 | ) | (1,147 | ) | (649 | ) | ||||||
| Addition, net | (1,472 | ) | (852 | ) | (887 | ) | ||||||
| Addition from acquisition of subsidiaries | — | — | (100 | ) | ||||||||
Write-off | 1,352 | 1,114 | 429 | |||||||||
| Exchange differences | 19 | 77 | 60 | |||||||||
Closing balance on December 31 | (909 | ) | (808 | ) | (1,147 | ) | ||||||
December 31, 2022 | December 31, 2021 | December 31, 2023 | December 31, 2022 | |||||||||||||
Current | 39,188 | 38,456 | 49,201 | 39,188 | ||||||||||||
Overdue: | ||||||||||||||||
| From 1 to 30 days | 2,087 | 1,251 | 1,810 | 2,087 | ||||||||||||
| From 31 to 60 days | 454 | 847 | 244 | 454 | ||||||||||||
| From 61 to 90 days | 359 | 439 | 227 | 359 | ||||||||||||
| From 91 to 120 days | 295 | 113 | 272 | 295 | ||||||||||||
| From 121 to 300 days | 701 | 866 | 692 | 701 | ||||||||||||
Total | 43,084 | 41,972 | 52,446 | 43,084 | ||||||||||||
9 | Recoverable taxes |
December 31, 2022 | December 31, 2021 | |||||||
| Recoverable income tax | 2,459 | 3,893 | ||||||
| Other recoverable taxes | 5,997 | 3,544 | ||||||
Total | 8,456 | 7,437 | ||||||
| Current | 5,122 | 6,881 | ||||||
Non-current | 3,334 | 556 | ||||||
December 31, 2023 | December 31, 2022 | |||||||
| Recoverable income tax | 1,832 | 2,459 | ||||||
| Other recoverable taxes | 9,121 | 5,997 | ||||||
Total | 10,953 | 8,456 | ||||||
| Current | 6,499 | 5,122 | ||||||
Non-current | 4,454 | 3,334 | ||||||
10 | Prepaid expenses |
December 31, 2022 | December 31, 2021 | |||||||
| Personnel | 948 | 1,322 | ||||||
| Suppliers (i) | 2,710 | 6,245 | ||||||
| Others | 698 | 687 | ||||||
Total | 4,356 | 8,254 | ||||||
| Current | 4,152 | 7,911 | ||||||
Non-current | 204 | 343 | ||||||
December 31, 2023 | December 31, 2022 | |||||||
| Personnel | 822 | 948 | ||||||
| Suppliers (i) | 3,643 | 2,710 | ||||||
| Others | 833 | 698 | ||||||
Total | 5,298 | 4,356 | ||||||
| Current | 5,143 | 4,152 | ||||||
Non-current | 155 | 204 | ||||||
| (i) | Refers mainly to advances payment to hosting and software suppliers. |
11 | Current and deferred tax |
11.1 | Deferred tax assets |
December 31, | December 31, | December 31, 2023 | December 31, 2022 | |||||||||||||
| Loss allowances for financial assets | 270 | 75 | ||||||||||||||
| Bonus provision | 1,712 | 750 | ||||||||||||||
| Lease | 392 | 366 | ||||||||||||||
| Share-based compensation (i) | 3,130 | 3,224 | ||||||||||||||
| Hyperinflationary adjustments | 37 | 89 | ||||||||||||||
| Tax loss (ii) | 10,513 | 6,445 | ||||||||||||||
| Others (iii) | 1,656 | 1,623 | ||||||||||||||
Total deferred tax assets | 17,710 | 12,572 | 19,926 | 17,710 | ||||||||||||
| (i) | Mainly related to RSU amounts that are treated as temporary differences until the instrument is vested. |
| (ii) | Tax losses increase is driven mainly by the current investment position of the Brazilian operations. These amounts are expected to be offset in the foreseeable future. In Brazil, tax losses are not subject to statute of limitation and ought to be used observing the limits established by the local tax legislation. |
| (iii) | Most of the amounts appointed as |
Movements | Loss allowances for financial assets | Bonus provision | Lease | Share-based compensation | Hyperinflationary adjustments | Tax Loss | Other | Total | ||||||||||||||||||||||||
At December 31, 2020 | 124 | 655 | 108 | 185 | 99 | 427 | 576 | 2,174 | ||||||||||||||||||||||||
| (Charged)/Credited to profit and loss (i) | (49 | ) | 95 | 258 | 2,852 | (10 | ) | 6,018 | 1,047 | 10,211 | ||||||||||||||||||||||
| To equity | — | — | — | 187 | — | — | — | 187 | ||||||||||||||||||||||||
At December 31, 2021 | 75 | 750 | 366 | 3,224 | 89 | 6,445 | 1,623 | 12,572 | ||||||||||||||||||||||||
| (Charged)/Credited to profit and loss (i) | 195 | 962 | 26 | (152 | ) | (52 | ) | 4,068 | 33 | 5,080 | ||||||||||||||||||||||
| To equity | — | — | — | 58 | — | — | — | 58 | ||||||||||||||||||||||||
At December 31, 2022 | 270 | 1,712 | 392 | 3,130 | 37 | 10,513 | 1,656 | 17,710 | ||||||||||||||||||||||||
Movements | Loss allowances for financial assets | Bonus provision | Lease | Share-based compensation | Hyperinflationary adjustments | Tax Loss | Other | Total | ||||||||||||||||||||||||
At December 31, 2021 | 75 | 750 | 366 | 3,224 | 89 | 6,445 | 1,623 | 12,572 | ||||||||||||||||||||||||
| (Charged)/Credited to profit and loss (i) | 195 | 962 | 26 | (152 | ) | (52 | ) | 4,068 | 33 | 5,080 | ||||||||||||||||||||||
| To equity | — | — | — | 58 | — | — | — | 58 | ||||||||||||||||||||||||
At December 31, 2022 | 270 | 1,712 | 392 | 3,130 | 37 | 10,513 | 1,656 | 17,710 | ||||||||||||||||||||||||
| (Charged)/Credited to profit and loss (i) | 69 | 559 | 4 | (66 | ) | (32 | ) | 1,403 | 279 | 2,216 | ||||||||||||||||||||||
At December 31, 2023 | 339 | 2,271 | 396 | 3,064 | 5 | 11,916 | 1,935 | 19,926 | ||||||||||||||||||||||||
| (i) | The differences between the amounts shown in the table above and the statements of profit or loss correspond to exchange rate variation. |
11.2 | Deferred tax liabilities |
December 31, 2022 | December 31, 2021 | |||||||
| Acquisition of subsidiaries | 1,409 | 1,687 | ||||||
| Temporary differences | 827 | 283 | ||||||
| Others | 228 | 75 | ||||||
Total deferred tax liabilities | 2,464 | 2,045 | ||||||
December 31, 2023 | December 31, 2022 | |||||||
| Acquisition of subsidiaries | 1,136 | 1,409 | ||||||
| Temporary differences | 1,499 | 827 | ||||||
| Others | 33 | 228 | ||||||
Total deferred tax liabilities | 2,668 | 2,464 | ||||||
Movements | Goodwill | Customer relationship | Intellectual property | Others | Total | Goodwill | Customer relationship | Intellectual property | Others | Total | ||||||||||||||||||||||||||||||
At December 31, 2020 | 187 | 325 | 219 | — | 731 | |||||||||||||||||||||||||||||||||||
| Acquisition of subsidiaries (i) | — | 1,424 | 65 | 59 | 1,548 | |||||||||||||||||||||||||||||||||||
| Charged/(Credited) to profit and loss | 96 | (285 | ) | (61 | ) | 16 | (234 | ) | ||||||||||||||||||||||||||||||||
At December 31, 2021 | 283 | 1,464 | 223 | 75 | 2,045 | 283 | 1,464 | 223 | 75.00 | 2,045 | ||||||||||||||||||||||||||||||
| Charged/(Credited) to profit and loss | 544 | (218 | ) | (60 | ) | 153 | 419 | |||||||||||||||||||||||||||||||||
At December 31, 2022 | 827 | 1,246 | 163 | 228 | 2,464 | 827 | 1,246 | 163 | 228 | 2,464 | ||||||||||||||||||||||||||||||
| Charged/(Credited) to profit and loss | ||||||||||||||||||||||||||||||||||||||||
At December 31, 2023 | 1,499 | 1,027 | 109 | 33 | 2,668 | |||||||||||||||||||||||||||||||||||
| (i) | The impact of deferred tax liabilities due to acquisition of subsidiaries increases the goodwill on the acquisition date. |
11.3 | Income Tax expense |
December 31, 2022 | December 31, 2021 | December 31, 2020 | ||||||||||
Current tax | ||||||||||||
| Current tax on profits for the year | (877 | ) | (1,646 | ) | (4,904 | ) | ||||||
(877 | ) | (1,646 | ) | (4,904 | ) | |||||||
Deferred income tax | ||||||||||||
| Decrease in deferred tax | 4,902 | 11,118 | 616 | |||||||||
4,902 | 11,118 | 616 | ||||||||||
Income tax | 4,025 | 9,472 | (4,288 | ) | ||||||||
December 31, 2023 | December 31, 2022 | December 31, 2021 | ||||||||||
Current tax | ||||||||||||
| Current tax on profits for the year | (5,182 | ) | (877 | ) | (1,646 | ) | ||||||
(5,182 | ) | (877 | ) | (1,646 | ) | |||||||
Deferred income tax | ||||||||||||
| Decrease in deferred tax | 2,075 | 4,902 | 11,118 | |||||||||
2,075 | 4,902 | 11,118 | ||||||||||
Income tax | (3,107 | ) | 4,025 | 9,472 | ||||||||
11.4 | Reconciliation of benefit (expenses) of income tax and social contribution |
December 31, 2023 | December 31, 2022 | December 31, 2021 | ||||||||||
Loss before income tax | (10,473 | ) | (56,444 | ) | (69,986 | ) | ||||||
| Tax at the Brazilian tax rate of 34% (i) | 3,561 | 19,191 | 23,795 | |||||||||
Tax effect of amounts which are not deductible (taxable) in calculating taxable income: | ||||||||||||
Technological innovation incentive law ( Lei do bem | 2,257 | — | — | |||||||||
| Restricted stock units | 2,661 | 1,398 | 451 | |||||||||
| Equity result | 405 | 329 | (1,232 | ) | ||||||||
| Difference to presumed tax regime | — | — | (1,047 | ) | ||||||||
| Stock option | (172 | ) | (53 | ) | (87 | ) | ||||||
| Unrecognized deferred tax assets (iii) | (6,031 | ) | (9,465 | ) | (8,438 | ) | ||||||
| Tax rate reconciliation (i) | (3,796 | ) | (6,381 | ) | (3,945 | ) | ||||||
| Other net differences | (1,992 | ) | (994 | ) | (25 | ) | ||||||
Income tax and social contribution for the year | (3,107 | ) | 4,025 | 9,472 | ||||||||
| Effective rate - % | 29.67 | % | (7.13 | %) | (13.53 | %) | ||||||
December 31, 2022 | December 31, 2021 | December 31, 2020 | ||||||||||
Profit (Loss) before income tax | (56,444 | ) | (69,986 | ) | 3,463 | |||||||
| Tax at the Brazilian tax rate of 34% (i) | 19,191 | 23,795 | (1,177 | ) | ||||||||
Tax effect of amounts which are not deductible (taxable) in calculating taxable income: | ||||||||||||
Technological innovation incentive law ( Lei do bem | — | — | 661 | |||||||||
| Restricted stock units | 1,398 | 451 | — | |||||||||
| Equity result | 329 | (1,232 | ) | 1,122 | ||||||||
| Difference to presumed tax regime | — | (1,047 | ) | (317 | ) | |||||||
| Stock option | (53 | ) | (87 | ) | (598 | ) | ||||||
| Unrecognized deferred tax assets (iii) | (9,465 | ) | (8,438 | ) | (1,753 | ) | ||||||
| Tax rate reconciliation (i) | (6,381 | ) | (3,945 | ) | (1,050 | ) | ||||||
| Other net differences | (994 | ) | (25 | ) | (1,176 | ) | ||||||
Income tax and social contribution for the year | 4,025 | 9,472 | (4,288 | ) | ||||||||
| Effective rate - % | (7.13 | %) | (13.53 | %) | (123.82 | %) | ||||||
| (i) | The tax expense was determined based on the Brazilian corporate income tax (CIT) rate considering that, currently, the Group’s biggest operation is in Brazil. This table reconciles the expected income tax expense, computed by applying the combined Brazilian tax rate of non-Brazilian operations were loss making, therefore reducing the consolidated earnings before income tax. |
| (ii) | Benefit related to the inclusion of research and development (technological innovation) expenses in the income tax basis for year 2020 as provided for by Law No. 11.196/05 - known as Lei do Bem |
| (iii) | Unrecognized deferred tax assets correspond to the tax benefit related to future utilization of net operating losses of certain operations, mainly the United States and the United Kingdom. In those cases, the deferred tax asset was not recognized due to the lack of expectation |
| of utilization of such net operating losses in the foreseeable future. The balance of the accumulated net operating losses of the Group’s US operations totaled US$64,867 on December 31, 2023 and US$55,780 on December 31, 2022, |
12 | Leases |
12.1 | Amounts recognized in the balance sheet |
December 31, 2022 | December 31, 2021 | |||||||
Right-of-use assets | ||||||||
| Office buildings | 4,818 | 5,183 | ||||||
Total | 4,818 | 5,183 | ||||||
December 31, 2023 | December 31, 2022 | |||||||
Right-of-use assets | ||||||||
| Office buildings | 3,277 | 4,818 | ||||||
Total | 3,277 | 4,818 | ||||||
December 31, 2022 | December 31, 2021 | December 31, 2023 | December 31, 2022 | |||||||||||||
Lease liabilities | ||||||||||||||||
| Current | 1,898 | 1,105 | 1,863 | 1,898 | ||||||||||||
Non-current | 3,737 | 4,886 | 2,233 | 3,737 | ||||||||||||
Total | 5,635 | 5,991 | 4,096 | 5,635 | ||||||||||||
2022 | 2021 | 2023 | 2022 | |||||||||||||
Right-of-use assets | ||||||||||||||||
Opening balance on January 1 | 5,183 | 5,076 | 4,818 | 5,183 | ||||||||||||
| New lease agreements | 942 | 384 | 85 | 942 | ||||||||||||
| Lease agreements from acquired subsidiaries | — | 722 | ||||||||||||||
| Remeasurement | 99 | 494 | (105 | ) | 99 | |||||||||||
| Depreciation | (1,347 | ) | (1,069 | ) | (1,500 | ) | (1,347 | ) | ||||||||
Write-off | (352 | ) | (110 | ) | (324 | ) | (352 | ) | ||||||||
| Hyperinflation adjustment | 5 | 1 | 8 | 5 | ||||||||||||
| Exchange differences | 288 | (315 | ) | 295 | 288 | |||||||||||
Closing balance on December 31 | 4,818 | 5,183 | 3,277 | 4,818 | ||||||||||||
2023 | 2022 | |||||||||||||||
Lease liabilities | ||||||||||||||||
Opening balance on January 1 | 5,635 | 5,991 | ||||||||||||||
| New lease agreements | 85 | 942 | ||||||||||||||
| Remeasurement | (336 | ) | 41 | |||||||||||||
| Interest added | 574 | 671 | ||||||||||||||
| Principal elements of lease payments | (1,574 | ) | (1,263 | ) | ||||||||||||
| Interest payment | (573 | ) | (670 | ) | ||||||||||||
Write-off | (94 | ) | (423 | ) | ||||||||||||
| Exchange differences | 379 | 346 | ||||||||||||||
Closing balance on December 31 | 4,096 | 5,635 | ||||||||||||||
2022 | 2021 | |||||||
Lease liabilities | ||||||||
Opening balance on January 1 | 5,991 | 6,153 | ||||||
| New lease agreements | 942 | 384 | ||||||
| Lease agreements from acquired subsidiaries | — | 446 | ||||||
| Remeasurement | 41 | 494 | ||||||
| Interest added | 671 | 696 | ||||||
| Principal elements of lease payments | (1,263 | ) | (913 | ) | ||||
| Interest payment | (670 | ) | (680 | ) | ||||
Write-off | (423 | ) | (111 | ) | ||||
| Exchange differences | 346 | (478 | ) | |||||
Closing balance on December 31 | 5,635 | 5,991 | ||||||
12.2 | Amounts recognized in the Statement of profit or loss |
December 31, 2022 | December 31, 2021 | December 31, 2020 | ||||||||||
| Depreciation charge of office buildings | 1,347 | 1,069 | 911 | |||||||||
| Interest expense (included in financial expense) | 671 | 696 | 775 | |||||||||
Total | 2,018 | 1,765 | 1,686 | |||||||||
December 31, 2023 | December 31, 2022 | December 31, 2021 | ||||||||||
| Depreciation charge of office buildings | 1,500 | 1,347 | 1,069 | |||||||||
| Interest expense (included in financial expense) | 574 | 671 | 696 | |||||||||
Total | 2,074 | 2,018 | 1,765 | |||||||||
13 | Property and equipment, net |
Leasehold Improvements | Machinery and equipment | Furniture and fixture | Computers and peripherals | Total | ||||||||||||||||
At December 31, | 2,248 | 185 | 453 | 1,665 | 4,551 | |||||||||||||||
| Acquisitions | 22 | 16 | 21 | 1,324 | 1,383 | |||||||||||||||
| Acquisitions of subsidiaries (note 3) | — | — | 36 | 26 | 62 | |||||||||||||||
| Adjustment of hyperinflation | — | — | 8 | 53 | 61 | |||||||||||||||
| Disposals/write-downs | — | — | (30 | ) | (25 | ) | (55 | ) | ||||||||||||
| Depreciation | (277 | ) | (27 | ) | (73 | ) | (620 | ) | (997 | ) | ||||||||||
| Exchange differences | (152 | ) | (13 | ) | (12 | ) | (117 | ) | (294 | ) | ||||||||||
At December 31, | 1,841 | 161 | 403 | 2,306 | 4,711 | |||||||||||||||
| Cost | 2,796 | 279 | 740 | 3,987 | 7,802 | |||||||||||||||
| Accumulated depreciation | (955 | ) | (118 | ) | (337 | ) | (1,681 | ) | (3,091 | ) | ||||||||||
Net book amount | 1,841 | 161 | 403 | 2,306 | 4,711 | |||||||||||||||
| Acquisitions | 16 | 13 | 56 | 255 | 340 | |||||||||||||||
| Adjustment of hyperinflation | 12 | — | 7 | 88 | 107 | |||||||||||||||
| Disposals/write-downs | (120 | ) | — | — | — | (120 | ) | |||||||||||||
| Depreciation | (428 | ) | (32 | ) | (72 | ) | (661 | ) | (1,193 | ) | ||||||||||
| Exchange differences | 110 | 9 | 14 | (69 | ) | 64 | ||||||||||||||
At December 31, | 1,431 | 151 | 408 | 1,919 | 3,909 | |||||||||||||||
| Cost | 2,811 | 307 | 836 | 4,346 | 8,300 | |||||||||||||||
| Accumulated depreciation | (1,380 | ) | (156 | ) | (428 | ) | (2,427 | ) | (4,391 | ) | ||||||||||
Net book amount | 1,431 | 151 | 408 | 1,919 | 3,909 | |||||||||||||||
Leasehold Improvements | Machinery and equipment | Furniture and fixture | Computers and peripherals | Total | ||||||||||||||||
At December 31, 2021 | 1,841 | 161 | 403 | 2,306 | 4,711 | |||||||||||||||
| Acquisitions | 16 | 13 | 56 | 255 | 340 | |||||||||||||||
| Adjustment of hyperinflation | 12 | — | 7 | 88 | 107 | |||||||||||||||
| Disposals/write-downs | (120 | ) | — | — | — | (120 | ) | |||||||||||||
| Depreciation | (428 | ) | (32 | ) | (72 | ) | (661 | ) | (1,193 | ) | ||||||||||
| Exchange differences | 110 | 9 | 14 | (69 | ) | 64 | ||||||||||||||
At December 31, 2022 | 1,431 | 151 | 408 | 1,919 | 3,909 | |||||||||||||||
| Cost | 2,811 | 307 | 836 | 4,346 | 8,300 | |||||||||||||||
| Accumulated depreciation | (1,380 | ) | (156 | ) | (428 | ) | (2,427 | ) | (4,391 | ) | ||||||||||
Net book amount | 1,431 | 151 | 408 | 1,919 | 3,909 | |||||||||||||||
| Acquisitions | 87 | 8 | 93 | 284 | 472 | |||||||||||||||
| Adjustment of hyperinflation | — | — | 1 | 143 | 144 | |||||||||||||||
| Disposals/write-downs | (264 | ) | (120 | ) | (134 | ) | (357 | ) | (875 | ) | ||||||||||
| Depreciation | (301 | ) | (21 | ) | (67 | ) | (665 | ) | (1,054 | ) | ||||||||||
| Exchange differences | 152 | 11 | (13 | ) | (49 | ) | 101 | |||||||||||||
At December 31, 2023 | 1,105 | 29 | 288 | 1,275 | 2,697 | |||||||||||||||
| Cost | 2,560 | 43 | 606 | 3,192 | 6,401 | |||||||||||||||
| Accumulated depreciation | (1,455 | ) | (14 | ) | (318 | ) | (1,917 | ) | (3,704 | ) | ||||||||||
Net book amount | 1,105 | 29 | 288 | 1,275 | 2,697 | |||||||||||||||
14 | Intangible assets, net |
Software | Trademark | Intellectual Property | Customer relationship | Goodwill | Other | Total | ||||||||||||||||||||||||||||||||||||||||||||||||||
At December 31, 2020 | 1,154 | — | 2,475 | 1,579 | 9,885 | — | 15,093 | |||||||||||||||||||||||||||||||||||||||||||||||||
| Acquisitions (i) | — | — | — | — | — | 368 | 368 | |||||||||||||||||||||||||||||||||||||||||||||||||
| Acquisitions of subsidiary (note 3) | 1,519 | 220 | — | 6,781 | 12,535 | 145 | 21,200 | |||||||||||||||||||||||||||||||||||||||||||||||||
| Amortization | (463 | ) | (12 | ) | (394 | ) | (1,100 | ) | — | (37 | ) | (2,006 | ) | |||||||||||||||||||||||||||||||||||||||||||
| Exchange differences | (426 | ) | (13 | ) | (134 | ) | 404 | (822 | ) | (20 | ) | (1,011 | ) | |||||||||||||||||||||||||||||||||||||||||||
Software | Trademark | Intellectual Property | Customer relationship | Goodwill | Others | Total | ||||||||||||||||||||||||||||||||||||||||||||||||||
At December 31, 2021 | 1,784 | 195 | 1,947 | 7,664 | 21,598 | 456 | 33,644 | 1,784 | 195 | 1,947 | 7,664 | 21,598 | 456 | 33,644 | ||||||||||||||||||||||||||||||||||||||||||
| Cost | 4,091 | 207 | 2,540 | 9,336 | 21,598 | 493 | 38,265 | |||||||||||||||||||||||||||||||||||||||||||||||||
| Accumulated amortization | (2,307 | ) | (12 | ) | (593 | ) | (1,672 | ) | — | (37 | ) | (4,621 | ) | |||||||||||||||||||||||||||||||||||||||||||
Net book amount | 1,784 | 195 | 1,947 | 7,664 | 21,598 | 456 | 33,644 | |||||||||||||||||||||||||||||||||||||||||||||||||
| Amortization | (438 | ) | (22 | ) | (346 | ) | (1,177 | ) | — | (93 | ) | (2,076 | ) | (438 | ) | (22 | ) | (346 | ) | (1,177 | ) | — | (93 | ) | (2,076 | ) | ||||||||||||||||||||||||||||||
| Others (ii) | — | — | — | — | (1,141 | ) | — | (1,141 | ) | |||||||||||||||||||||||||||||||||||||||||||||||
| Others (i) | — | — | — | — | (1,141 | ) | — | (1,141 | ) | |||||||||||||||||||||||||||||||||||||||||||||||
| Exchange differences | 92 | 11 | 104 | 42 | 508 | 26 | 783 | 92 | 11 | 104 | 42 | 508 | 26 | 783 | ||||||||||||||||||||||||||||||||||||||||||
At December 31, 2022 | 1,438 | 184 | 1,705 | 6,529 | 20,965 | 389 | 31,210 | 1,438 | 184 | 1,705 | 6,529 | 20,965 | 389 | 31,210 | ||||||||||||||||||||||||||||||||||||||||||
| Cost | 4,291 | 218 | 2,675 | 9,394 | 20,965 | 519 | 38,062 | 4,291 | 218 | 2,675 | 9,394 | 20,965 | 519 | 38,062 | ||||||||||||||||||||||||||||||||||||||||||
| Accumulated amortization | (2,853 | ) | (34 | ) | (970 | ) | (2,865 | ) | — | (130 | ) | (6,852 | ) | (2,853 | ) | (34 | ) | (970 | ) | (2,865 | ) | — | (130 | ) | (6,852 | ) | ||||||||||||||||||||||||||||||
Net book amount | 1,438 | 184 | 1,705 | 6,529 | 20,965 | 389 | 31,210 | 1,438 | 184 | 1,705 | 6,529 | 20,965 | 389 | 31,210 | ||||||||||||||||||||||||||||||||||||||||||
| Amortization | (424 | ) | (23 | ) | (691 | ) | (1,181 | ) | — | (96 | ) | (2,415 | ) | |||||||||||||||||||||||||||||||||||||||||||
| Exchange differences | 111 | 15 | 155 | 49 | 867 | 32 | 1,229 | |||||||||||||||||||||||||||||||||||||||||||||||||
At December 31, 2023 | 1,125 | 176 | 1,169 | 5,397 | 21,832 | 325 | 30,024 | |||||||||||||||||||||||||||||||||||||||||||||||||
| Cost | 4,649 | 238 | 2,962 | 9,490 | 21,832 | 566 | 39,737 | |||||||||||||||||||||||||||||||||||||||||||||||||
| Accumulated amortization | (3,524 | ) | (62 | ) | (1,793 | ) | (4,093 | ) | — | (241 | ) | (9,713 | ) | |||||||||||||||||||||||||||||||||||||||||||
Net book amount | 1,125 | 176 | 1,169 | 5,397 | 21,832 | 325 | 30,024 | |||||||||||||||||||||||||||||||||||||||||||||||||
| (i) |
Includes a US$244 related to the Ciashop earn-out adjustment of US$897 related to the Workarea acquisition. In January 2022 the Company carried out an assessment of the Purchase Price Consideration of Workarea’s acquisition, having identified an immaterial adjustment. The Purchase Price Consideration recognized on December 31, 2021, financial statements were based on a provisional assessment. In January 2022, the valuation sought by an independent valuation and assessment were completed. Also includes a fixed installment immaterial adjustment of |
14.1 | Impairment tests for goodwill |
15 | Accounts payable and accrued expenses |
December 31, 2023 | December 31, 2022 | |||||||
| Trade payables | 14,829 | 14,064 | ||||||
| Social charges | 7,428 | 5,537 | ||||||
| Profit-sharing | 13,147 | 9,484 | ||||||
| Provision for vacation and benefits | 5,935 | 5,506 | ||||||
| Others | 21 | 56 | ||||||
Total | 41,360 | 34,647 | ||||||
| Current | 39,728 | 34,136 | ||||||
Non-current | 1,632 | 511 | ||||||
December 31, 2022 | December 31, 2021 | |||||||
| Trade payables | 14,064 | 12,668 | ||||||
| Accounts payable to related parties (note 22.2) | — | 27 | ||||||
| Social charges | 5,537 | 7,048 | ||||||
| Profit-sharing | 9,484 | 7,203 | ||||||
| Provision for vacation and benefits | 5,506 | 4,333 | ||||||
| Others | 56 | 235 | ||||||
Total | 34,647 | 31,514 | ||||||
| Current | 34,136 | 29,537 | ||||||
Non-current | 511 | 1,977 | ||||||
16 | Loans and financing |
16.1 | Breakdown of loans and financing |
December 31, 2022 | December 31, 2021 | |||||||
| BNDES (i) | 189 | 891 | ||||||
| Itaú (ii) | 964 | 2,388 | ||||||
Total | 1,153 | 3,279 | ||||||
| Current | 1,153 | 2,087 | ||||||
Non-current | — | 1,192 | ||||||
December 31, 2023 | December 31, 2022 | |||||||
| BNDES (i) | — | 189 | ||||||
| Itaú (ii) | — | 964 | ||||||
Total | — | 1,153 | ||||||
| (i) | The Group raised R$15,577 (fifteen million five hundred seventy and seven thousand reais) corresponding to US$5,014 (five million and fourteen thousand US dollars) from Brazilian National Bank for Economic and Social Development (Banco Nacional de Desenvolvimento Econômico e Social or BNDES) to finance the development of new ecommerce technologies on March 13, 2017. The BNDES credit facility |
| (ii) | In June 2019, the Group raised €6,909 (six million nine hundred and nine thousand euros), corresponding to US$7,782 (seven million seven hundred andeighty-two US dollars) with Itaú Bank for working capital purposes. On the same date, a swap was contracted to hedge against foreign exchangerat e, converting the financial charges of the loan (1.77% p.a.) into an effective rate of CDI (*) + 2.65% p.a., designating the financial instrument as a fair value hedge (note 26.1(ii)). |
| (*) | Certificado de Depósito Interbancário |
16.2 | Changes in loans and financing |
2023 | 2022 | |||||||
Opening balance on January 1 | 1,153 | 3,279 | ||||||
| Payment of loans | (1,238 | ) | (2,651 | ) | ||||
| Interest charged | 4 | 62 | ||||||
| Interest paid | (5 | ) | (56 | ) | ||||
| Basis adjustment on the fair value hedge (i) | 42 | 273 | ||||||
| Exchange differences | 44 | 246 | ||||||
Closing balance on December 31 | — | 1,153 | ||||||
2022 | 2021 | |||||||
Opening balance on January 1 | 3,279 | 6,359 | ||||||
| Loans from acquisition of subsidiaries | — | 8,038 | ||||||
| Payment of loans (i) | (2,651 | ) | (11,002 | ) | ||||
| Interest charged | 62 | 94 | ||||||
| Interest paid | (56 | ) | (104 | ) | ||||
| Basis adjustment on the fair value hedge (ii) | 273 | 333 | ||||||
| Exchange differences | 246 | (439 | ) | |||||
Closing balance on December 31 | 1,153 | 3,279 | ||||||
| (i) |
17 | Taxes payable |
December 31, 2022 | December 31, 2021 | |||||||
| Income tax payable | 673 | 524 | ||||||
| Other taxes payable | 3,615 | 4,671 | ||||||
Total | 4,288 | 5,195 | ||||||
| Current | 4,128 | 5,035 | ||||||
Non-current (i) | 160 | 160 | ||||||
December 31, 2023 | December 31, 2022 | |||||||
| Income tax payable | 2,147 | 673 | ||||||
| Other taxes payable | 6,072 | 3,615 | ||||||
Total | 8,219 | 4,288 | ||||||
| Current | 8,219 | 4,128 | ||||||
Non-current | — | 160 | ||||||
18 | Contingencies |
December 31, 2022 | December 31, 2021 | December 31, 2023 | December 31, 2022 | |||||||||||||
| Civil | 6 | 17 | 48 | 6 | ||||||||||||
| Labor | 95 | 16 | 10 | 95 | ||||||||||||
| Tax | 84 | 53 | 170 | 84 | ||||||||||||
Total | 185 | 86 | 228 | 185 | ||||||||||||
December 31, 2022 | December 31, 2021 | December 31, 2023 | December 31, 2022 | |||||||||||||
| Civil | 118 | 123 | 114 | 118 | ||||||||||||
| Labor | — | 189 | 176 | — | ||||||||||||
| Tax | 878 | 10 | 1,067 | 878 | ||||||||||||
Total | 996 | 322 | 1,357 | 996 | ||||||||||||
19 | Shareholders’ equity |
19.1 | Issued capital |
December 31, 2022 | December 31, 2021 | December 31, 2023 | December 31, 2022 | |||||||||||||
| Number of ordinary nominative shares | 188,992,529 | 191,028,642 | 184,027,008 | 188,992,529 | ||||||||||||
| Par value | 0.0001 | 0.0001 | 0.0001 | 0.0001 | ||||||||||||
Total issued capital | 19 | 19 | 18 | 19 | ||||||||||||
19.2 | Capital reserve |
a. | Issue of ordinary shares as consideration for a business combination |
b. | Capital contribution and buyback of shares |
c. | Share-based payment |
d. | non-controlling interests |
Acquisition | of non-controlling interest |
e. |
Other reserves |
20 | Revenue from services provided |
20.1 | Disaggregation of revenue from contracts with customers |
December 31, 2022 | December 31, 2021 | December 31, 2020 | ||||||||||
Subscriptions | 162,132 | 129,292 | 100,611 | |||||||||
| Taxes on subscriptions | (13,657 | ) | (10,826 | ) | (7,245 | ) | ||||||
Subscription revenue | 148,475 | 118,466 | 93,366 | |||||||||
| Services provided | 9,799 | 8,154 | 5,599 | |||||||||
| Taxes on services | (654 | ) | (847 | ) | (289 | ) | ||||||
Services revenue | 9,145 | 7,307 | 5,310 | |||||||||
Total revenue | 157,620 | 125,773 | 98,676 | |||||||||
December 31, 2023 | December 31, 2022 | December 31, 2021 | ||||||||||
| Subscriptions | 208,777 | 162,132 | 129,292 | |||||||||
| Taxes on subscriptions | (18,475 | ) | (13,657 | ) | (10,826 | ) | ||||||
| Subscription revenue | 190,302 | 148,475 | 118,466 | |||||||||
| Services provided | 11,762 | 9,799 | 8,154 | |||||||||
| Taxes on services | (547 | ) | (654 | ) | (847 | ) | ||||||
Services revenue | 11,215 | 9,145 | 7,307 | |||||||||
Total revenue | 201,517 | 157,620 | 125,773 | |||||||||
20.2 | Contract assets and deferred revenue related to contracts with customers |
December 31, 2023 | December 31, 2022 | |||||||
| Current contract assets relating to subscription | 30,077 | 21,310 | ||||||
| Current contract assets relating to services | 1,975 | 2,096 | ||||||
| Loss allowance | (120 | ) | (101 | ) | ||||
Total contract assets | 31,932 | 23,305 | ||||||
December 31, 2022 | December 31, 2021 | |||||||
Current contract assets relating to subscription | 21,310 | 22,151 | ||||||
Current contract assets relating to services | 2,096 | 2,917 | ||||||
Loss allowance | (101 | ) | (150 | ) | ||||
Total contract assets | 23,305 | 24,918 | ||||||
Current | 17,873 | 18,775 | ||||||
Non-current | 5,432 | 6,143 | ||||||
Deferred revenue - subscription | 31,504 | 30,735 | ||||||
Deferred revenue - services | 2,751 | 2,067 | ||||||
Total deferred revenue | 34,255 | 32,802 | ||||||
Current | 20,332 | 16,598 | ||||||
Non-current | 13,923 | 16,204 | ||||||
| Current | 24,517 | 17,873 | ||||||
Non-current | 7,415 | 5,432 | ||||||
| Deferred revenue - subscription | 40,671 | 31,504 | ||||||
| Deferred revenue - services | 1,861 | 2,751 | ||||||
Total deferred revenue | 42,532 | 34,255 | ||||||
| Current | 25,948 | 20,332 | ||||||
Non-current | 16,584 | 13,923 | ||||||
21 | Costs and expenses |
December 31, 2022 | December 31, 2021 | December 31, 2020 | ||||||||||
Personnel (i) | 122,988 | 109,368 | 46,280 | |||||||||
IT Outsourcing, software and hosting expenses (ii) | 40,229 | 37,860 | 24,783 | |||||||||
Marketing and events | 8,720 | 8,649 | 3,861 | |||||||||
Outsourced services (iii) | 20,204 | 23,493 | 10,383 | |||||||||
Traveling | 4,223 | 2,224 | 1,071 | |||||||||
Depreciation and amortization | 4,616 | 4,072 | 2,400 | |||||||||
Facilities | 2,906 | 2,211 | 1,570 | |||||||||
Expected credit losses | 852 | 887 | 972 | |||||||||
Other | 2,801 | 2,938 | 837 | |||||||||
Total | 207,539 | 191,702 | 92,157 | |||||||||
Subscription cost | 41,408 | 38,380 | 27,801 | |||||||||
Services cost | 11,424 | 11,212 | 7,050 | |||||||||
General and administrative | 28,348 | 31,889 | 13,961 | |||||||||
Sales and marketing | 67,798 | 63,521 | 23,844 | |||||||||
Research and development | 57,205 | 45,186 | 19,039 | |||||||||
Other losses | 1,356 | 1,514 | 462 | |||||||||
Total | 207,539 | 191,702 | 92,157 | |||||||||
December 31, 2023 | December 31, 2022 | December 31, 2021 | ||||||||||
| Personnel (i) | 125,976 | 122,988 | 109,368 | |||||||||
| IT Outsourcing, software and hosting expenses | 40,000 | 40,229 | 37,860 | |||||||||
| Marketing and events | 4,351 | 8,720 | 8,649 | |||||||||
| Outsourced services | 23,175 | 20,204 | 23,493 | |||||||||
| Traveling | 6,153 | 4,223 | 2,224 | |||||||||
| Depreciation and amortization | 5,018 | 4,616 | 4,072 | |||||||||
| Facilities | 3,228 | 2,906 | 2,211 | |||||||||
| Expected credit losses | 1,472 | 852 | 887 | |||||||||
| Others | 6,746 | 2,801 | 2,938 | |||||||||
Total | 216,119 | 207,539 | 191,702 | |||||||||
| Subscription cost | 45,420 | 41,408 | 38,380 | |||||||||
| Services cost | 15,529 | 11,424 | 11,212 | |||||||||
| General and administrative | 33,673 | 28,348 | 31,889 | |||||||||
| Sales and marketing | 59,461 | 67,798 | 63,521 | |||||||||
| Research and development | 60,116 | 57,205 | 45,186 | |||||||||
| Other losses | 1,920 | 1,356 | 1,514 | |||||||||
Total | 216,119 | 207,539 | 191,702 | |||||||||
| (i) | This amount refers to personnel compensation (such as wages and benefits) and share-based compensation (refer to note 25 for additional details on share-based compensation). |
22 | Related party transactions |
22.1 | Key management personnel compensation |
December 31, 2022 | December 31, 2021 | December 31, 2020 | ||||||||||
Total short-term remuneration of key management personnel | 3,107 | 3,010 | 2,441 | |||||||||
Share-based compensation | 5,116 | 5,262 | 987 | |||||||||
Total | 8,223 | 8,272 | 3,428 | |||||||||
December 31, 2023 | December 31, 2022 | December 31, 2021 | ||||||||||
| Total short-term remuneration of key management personnel | 3,194 | 3,107 | 3,010 | |||||||||
| Share-based compensation | 6,895 | 5,116 | 5,262 | |||||||||
Total | 10,089 | 8,223 | 8,272 | |||||||||
Financial result, net |
December 31, 2022 | December 31, 2021 | December 31, 2020 | ||||||||||
Interest and dividend earned on bank deposits and financial investments | 2,252 | 264 | 556 | |||||||||
Foreign exchange gains | 7,321 | 3,035 | 2,058 | |||||||||
Gains from fair value of financial instruments (i) | 4,822 | 2,317 | 174 | |||||||||
Gains from marketable securities and short-term investments (ii) | 9,079 | 1,614 | 1,116 | |||||||||
Other financial income | 296 | 184 | — | |||||||||
Financial income | 23,770 | 7,414 | 3,904 | |||||||||
Foreign exchange losses | (8,505 | ) | (4,223 | ) | (4,401 | ) | ||||||
Losses from fair value of financial instruments (i) | (2,458 | ) | (2,510 | ) | (582 | ) | ||||||
Interest on loans | (62 | ) | (94 | ) | (219 | ) | ||||||
| Interest on lease liabilities | (671 | ) | (696 | ) | (775 | ) | ||||||
Losses from marketable securities and short-term | (13,845 | ) | (974 | ) | — | |||||||
| Adjustment of hyperinflation | (5,175 | ) | (2,274 | ) | (779 | ) | ||||||
| Other financial expenses | (685 | ) | (1,287 | ) | (282 | ) | ||||||
Financial expense | (31,401 | ) | (12,058 | ) | (7,038 | ) | ||||||
Financial result, net | (7,631 | ) | (4,644 | ) | (3,134 | ) | ||||||
December 31, 2023 | December 31, 2022 | December 31, 2021 | ||||||||||
| Interest and dividend earned on bank deposits and financial investments | 23,757 | 2,252 | 264 | |||||||||
| Foreign exchange gains | 6,517 | 7,321 | 3,035 | |||||||||
| Gains from fair value of financial instruments (i) | 4,476 | 4,822 | 2,317 | |||||||||
| Gains from short and long-term investments | 11,427 | 9,079 | 1,614 | |||||||||
| Other financial income | 197 | 296 | 184 | |||||||||
Financial income | 46,374 | 23,770 | 7,414 | |||||||||
| Foreign exchange losses | (16,891 | ) | (8,505 | ) | (4,223 | ) | ||||||
| Losses from fair value of financial instruments (i) | (3,960 | ) | (2,458 | ) | (2,510 | ) | ||||||
| Interest on loans | (4 | ) | (62 | ) | (94 | ) | ||||||
| Interest on lease liabilities | (574 | ) | (671 | ) | (696 | ) | ||||||
| Losses from short and long-term investments | (1,604 | ) | (13,845 | ) | (974 | ) | ||||||
| Adjustment of hyperinflation | (19,369 | ) | (5,175 | ) | (2,274 | ) | ||||||
| Other financial expenses | (965 | ) | (685 | ) | (1,287 | ) | ||||||
Financial expense | (43,367 | ) | (31,401 | ) | (12,058 | ) | ||||||
Financial result, net | 3,007 | (7,631 | ) | (4,644 | ) | |||||||
| (i) | Refers to gain and losses on change in the fair value of derivative financial earn-out (Refer to note 26.1). |
24 | Earnings (loss) per share |
December 31, 2023 | December 31, 2022 | December 31, 2021 | ||||||||||
| Net loss attributable to the controlling shareholders of the Group | (13,687 | ) | (52,419 | ) | (60,514 | ) | ||||||
| Weighted average number of outstanding common shares (thousands) | 186,365 | 190,695 | 181,554 | |||||||||
Basic loss per share | (0.073 | ) | (0.275 | ) | (0.333 | ) | ||||||
December 31, 2022 | December 31, 2021 | December 31, 2020 | ||||||||||
| Loss attributable to the stockholders of the Group | (52,419 | ) | (60,514 | ) | (825 | ) | ||||||
| Weighted average number of outstanding common shares (thousands) | 190,695 | 181,554 | 168,350 | |||||||||
Basic and diluted loss per share | (0.275 | ) | (0.333 | ) | (0.005 | ) | ||||||
December 31, 2023 | December 31, 2022 | December 31, 2021 | ||||||||||
| Net loss attributable to the controlling shareholders of the Group | (13,687 | ) | (52,419 | ) | (60,514 | ) | ||||||
| Weighted average number of outstanding common shares (thousands) | 186,365 | 190,695 | 181,554 | |||||||||
Diluted loss per share | (0.073 | ) | (0.275 | ) | (0.333 | ) | ||||||
25 | Share-based compensation |
25.1 | Share-based compensation: VTEX |
Number of options (thousands) | Weighted average exercise price | Remaining contractual terms in years | Weighted average grant date fair value | |||||||||||||
At January 1, 2020 | 6,880 | 0.71 | 5.03 | 0.50 | ||||||||||||
| Granted during the year | 7,382 | 10.41 | — | 5.01 | ||||||||||||
| Forfeit during the year | (815 | ) | 7.79 | — | 4.11 | |||||||||||
| Migration to RSU | (2,587 | ) | 1.48 | — | 1.48 | |||||||||||
| Exercised during the year | (1,182 | ) | 1.38 | — | 0.42 | |||||||||||
At December 31, 2020 | 9,678 | 2.90 | 5.65 | 0.68 | ||||||||||||
| Granted during the year | 1,799 | 10.66 | — | 5.10 | ||||||||||||
| Forfeit during the year | (156 | ) | 8.76 | — | 4.44 | |||||||||||
| Exercised during the year (i) | (2,512 | ) | 1.44 | — | 0.44 | |||||||||||
At December 31, 2021 | 8,809 | 4.78 | 5.37 | 1.58 | ||||||||||||
| Granted during the year | 3,910 | 4.39 | — | 1.98 | ||||||||||||
| Forfeit during the year | (2,508 | ) | 7.22 | — | 3.19 | |||||||||||
| Exercised during the year (i) | (497 | ) | 1.14 | — | 0.46 | |||||||||||
At December 31, 2022 | 9,714 | 4.18 | 4.37 | 1.41 | ||||||||||||
Stock options exercisable as of December 31, 2022 | 3,270 | 3.82 | 3.95 | 1.07 | ||||||||||||
Number of options (thousands) | Weighted average exercise price | Remaining contractual terms in years | Weighted average grant date fair value | |||||||||||||
At December 31, 2020 | 9,678 | 2.90 | 5.65 | 0.68 | ||||||||||||
| Granted | 1,799 | 10.66 | — | 5.10 | ||||||||||||
| Forfeit | (156 | ) | 8.76 | — | 4.44 | |||||||||||
| Exercised | (2,512 | ) | 1.44 | — | 0.44 | |||||||||||
At December 31, 2021 | 8,809 | 4.78 | 5.37 | 1.58 | ||||||||||||
| Granted | 3,910 | 4.39 | — | 1.98 | ||||||||||||
| Forfeit | (2,508 | ) | 7.22 | — | 3.19 | |||||||||||
| Exercised | (497 | ) | 1.14 | — | 0.46 | |||||||||||
At December 31, 2022 | 9,714 | 4.18 | 4.37 | 1.41 | ||||||||||||
| Granted | 1,653 | 4.87 | — | 2.42 | ||||||||||||
| Forfeit | (513 | ) | 6.44 | — | 3.72 | |||||||||||
| Exercised (i) | (958 | ) | 1.02 | — | 0.52 | |||||||||||
At December 31, 2023 | 9,896 | 4.17 | 3.86 | 1.44 | ||||||||||||
Stock options exercisable as of December 31, 2023 | 4,783 | 4.41 | 3.49 | 1.18 | ||||||||||||
| (i) | The number of stock options withheld for tax purposes was |
Number of RSUs (thousands) | Weighted average grant date fair value | |||||||
At December 31, 2020 | 2,583 | 1.37 | ||||||
| Granted | 1,619 | 13.88 | ||||||
| Forfeit | (576 | ) | 3.34 | |||||
| Settled | (625 | ) | 1.57 | |||||
At December 31, 2021 | 3,001 | 7.70 | ||||||
| Granted | 2,354 | 5.94 | ||||||
| Forfeit | (940 | ) | 7.91 | |||||
| Settled | (906 | ) | 5.86 | |||||
At December 31, 2022 | 3,509 | 6.94 | ||||||
| Granted | 2,588 | 4.90 | ||||||
| Forfeit | (284 | ) | 6.61 | |||||
| Settled (i) | (2,094 | ) | 5.57 | |||||
At December 31, 2023 | 3,720 | 6.32 | ||||||
Number of RSUs (thousands) | Weighted average grant date fair value | |||||||
At January 1, 2020 | — | — | ||||||
RSU granted due tomigration | 2,343 | 1.57 | ||||||
RSU granted (ordinary grants) | 276 | 1.27 | ||||||
Forfeit during the year | (36 | ) | 0.65 | |||||
At December 31, 2020 | 2,583 | 1.37 | ||||||
| RSU granted | 1,619 | 13.88 | ||||||
| Forfeit during the year | (576 | ) | 3.34 | |||||
| Settled (i) | (625 | ) | 1.57 | |||||
At December 31, 2021 | 3,001 | 7.70 | ||||||
| RSU granted | 2,354 | 5.94 | ||||||
| Forfeit during the year | (940 | ) | 7.91 | |||||
| Settled (i) | (906 | ) | 5.86 | |||||
At December 31, 2022 | 3,509 | 6.94 | ||||||
| (i) | The number of RSUs withheld for tax purposes was |
25.2 | Share-based compensation: Loja Integrada |
Number of options (thousands) | Weighted average exercise price | Remaining contractual terms in years | Weighted average grant date fair value | |||||||||||||
At December 31, 2020 | — | — | — | — | ||||||||||||
| Granted during the year | 23.57 | 12.37 | — | 5.47 | ||||||||||||
| Forfeit during the year | — | — | — | — | ||||||||||||
| Exercised during the year | — | — | — | — | ||||||||||||
At December 31, 2021 | 23.57 | 12.37 | 6.35 | 5.47 | ||||||||||||
| Granted during the year | — | — | — | — | ||||||||||||
| Forfeit during the year | (15.15 | ) | 12.78 | — | 5.82 | |||||||||||
| Exercised during the year | — | — | — | — | ||||||||||||
At December 31, 2022 | 8.42 | 13.48 | 5.35 | 5.66 | ||||||||||||
Stock options exercisable as of December 31, 2022 | 6.31 | 13.48 | 5.35 | 5.49 | ||||||||||||
Number of options (thousands) | Weighted average exercise price | Remaining contractual terms in years | Weighted average grant date fair value | |||||||||||||
At December 31, 2020 | — | — | — | — | ||||||||||||
| Granted | 23.57 | 12.37 | — | 5.47 | ||||||||||||
| Forfeit | — | — | — | — | ||||||||||||
| Exercised | — | — | — | — | ||||||||||||
At December 31, 2021 | 23.57 | 12.37 | 6.35 | 5.47 | ||||||||||||
| Granted | — | — | — | — | ||||||||||||
| Forfeit | (15.15 | ) | 12.78 | — | 5.82 | |||||||||||
| Exercised | — | — | — | — | ||||||||||||
At December 31, 2022 | 8.42 | 13.48 | 5.35 | 5.66 | ||||||||||||
| Granted | — | — | — | — | ||||||||||||
| Forfeit | — | — | — | — | ||||||||||||
| Exercised | — | — | — | — | ||||||||||||
At December 31, 2023 | 8.42 | 14.81 | 4.35 | 6.17 | ||||||||||||
Stock options exercisable as of December 31, 2023 | 8.42 | 14.81 | 4.35 | 6.17 | ||||||||||||
Number of RSUs (thousands) | Weighted average grant date fair value | |||||||
At December 31, 2020 | — | — | ||||||
| RSU granted | 94.90 | 11.22 | ||||||
| Settled (i) | (11.87 | ) | 11.22 | |||||
At December 31, 2021 | 83.03 | 11.22 | ||||||
| RSU granted | 327.27 | 6.54 | ||||||
| Forfeit during the year | (76.24 | ) | 10.70 | |||||
| Settled (i) | (48.78 | ) | 9.69 | |||||
At December 31, 2022 | 285.28 | 6.42 | ||||||
Number of RSUs (thousands) | Weighted average grant date fair value | |||||||
At December 31, 2021 | — | — | ||||||
| Granted | 94.90 | 11.22 | ||||||
| Settled | (11.87 | ) | 11.22 | |||||
At December 31, 2021 | 83.03 | 11.22 | ||||||
| Granted | 327.27 | 6.54 | ||||||
| Forfeit | (76.24 | ) | 10.70 | |||||
| Settled | (48.78 | ) | 9.69 | |||||
At December 31, 2022 | 285.28 | 6.42 | ||||||
| Granted | 115.00 | 5.10 | ||||||
| Forfeit | (82.25 | ) | 5.50 | |||||
| Settled (i) | (77.15 | ) | 7.17 | |||||
At December 31, 2023 | 240.89 | 6.49 | ||||||
| (i) | The number of RSUs withheld for tax purposes was |
25.3 | Amounts recognized in the statement of profit or loss |
December 31, 2023 | December 31, 2022 | December 31, 2021 | ||||||||||
| Subscription cost | (205 | ) | (502 | ) | (696 | ) | ||||||
| Services cost | (464 | ) | (156 | ) | (376 | ) | ||||||
| General and administrative | (7,254 | ) | (4,366 | ) | (7,087 | ) | ||||||
| Sales and marketing | (4,382 | ) | (2,885 | ) | (5,530 | ) | ||||||
| Research and development | (7,380 | ) | (4,844 | ) | (5,896 | ) | ||||||
Total | (19,685 | ) | (12,753 | ) | (19,585 | ) | ||||||
December 31, 2022 | December 31, 2021 | December 31, 2020 | ||||||||||
| Subscription cost | (502 | ) | (696 | ) | (84 | ) | ||||||
| Services cost | (156 | ) | (376 | ) | (78 | ) | ||||||
| General and administrative | (4,366 | ) | (7,087 | ) | (1,011 | ) | ||||||
| Sales and marketing | (2,885 | ) | (5,530 | ) | (991 | ) | ||||||
| Research and development | (4,844 | ) | (5,896 | ) | (1,131 | ) | ||||||
Total | (12,753 | ) | (19,585 | ) | (3,295 | ) | ||||||
26 | Financial Instruments |
26.1 | Financial instruments by category |
(i) | Financial instruments valued at amortized cost |
December 31, 2022 | December 31, 2021 | |||||||
Financial assets: | ||||||||
| Cash and cash equivalents | 24,394 | 121,006 | ||||||
| Restricted cash | 1,608 | 1,183 | ||||||
| Marketable securities | 10,119 | — | ||||||
| Trade receivables | 42,276 | 40,825 | ||||||
Total | 78,397 | 163,014 | ||||||
Financial liabilities: | ||||||||
| Trade payables | 14,064 | 12,695 | ||||||
| Lease liabilities | 5,635 | 5,991 | ||||||
| Loans and financing | 1,153 | 3,279 | ||||||
| Accounts payable from acquisition of subsidiaries | — | 1,470 | ||||||
Total | 20,852 | 23,435 | ||||||
December 31, 2023 | December 31, 2022 | |||||||
Financial assets: | ||||||||
| Cash and cash equivalents | 28,035 | 24,394 | ||||||
| Restricted cash | — | 1,608 | ||||||
| Short-term investments | 88,081 | 10,119 | ||||||
| Trade receivables | 51,537 | 42,276 | ||||||
Total | 167,653 | 78,397 | ||||||
Financial liabilities: | ||||||||
| Trade payables | 14,829 | 14,064 | ||||||
| Lease liabilities | 4,096 | 5,635 | ||||||
| Loans and financing | — | 1,153 | ||||||
Total | 18,925 | 20,852 | ||||||
(ii) | Financial instruments valued at fair value through profit or loss |
Carrying amount | ||||||||
December 31, 2023 | December 31, 2022 | |||||||
Financial assets: | ||||||||
| Short and long-term investments | 95,293 | 204,045 | ||||||
| Derivative financial instruments (i) | 53 | 117 | ||||||
Total | 95,346 | 204,162 | ||||||
Carrying amount | ||||||||
December 31, 2022 | December 31, 2021 | |||||||
Financial assets: | ||||||||
Short-term investments | 204,045 | 177,191 | ||||||
Derivative financial instruments (i) | 117 | — | ||||||
Total | 204,162 | 177,191 | ||||||
Carrying amount | ||||||||
December 31, 2022 | December 31, 2021 | |||||||
Financial liabilities: | ||||||||
Derivative financial instruments | — | 133 | ||||||
Accounts payable from acquisition of subsidiary (“earn out”) | 299 | 4,953 | ||||||
Total | 299 | 5,086 | ||||||
Carrying amount | ||||||||
December 31, 2023 | December 31, 2022 | |||||||
Financial liabilities: | ||||||||
| Accounts payable from acquisition of subsidiary (“earn out”) | — | 299 | ||||||
Total | — | 299 | ||||||
| (i) | In |
December 31, 2022 | December 31, 2021 | December 31, 2020 | ||||||||||
Net gain (loss) on financial instruments | 2,364 | (193 | ) | (174 | ) | |||||||
December 31, 2023 | December 31, 2022 | December 31, 2021 | ||||||||||
| Net gain (loss) on financial instruments | 516 | 2,364 | (193 | ) | ||||||||
December 31, 2023 | December 31, 2022 | December 31, 2021 | ||||||||||
| Net gain (loss) on short and long-term investments | 9,823 | (4,766 | ) | 640 | ||||||||
December 31, 2022 | December 31, 2021 | December 31, 2020 | ||||||||||
Net gain (loss) on marketable securities and short-term investments | (4,766 | ) | 640 | 1,116 | ||||||||
a. | Fair value hierarchy |
December 31, 2023 | ||||||||||||
Level 1 | Level 2 | Level 3 | ||||||||||
Assets | ||||||||||||
| Short-term investments | 93,293 | — | — | |||||||||
| Long-term investments | — | — | 2,000 | |||||||||
| Derivative financial instruments | — | 53 | — | |||||||||
December 31, 2022 | ||||||||||||||||
Level 1 | Level 2 | Level 3 | ||||||||||||||
Assets | ||||||||||||||||
Short-term investments | 204,045 | — | — | |||||||||||||
Derivative financial instruments | — | 117 | — | |||||||||||||
Liabilities | ||||||||||||||||
Accounts payable from acquisition of subsidiary (“earn-out”) | — | — | 299 | |||||||||||||
2022 | 2021 | |||||||
Opening balance on January 1 | 4,953 | 542 | ||||||
| Acquisitions of subsidiaries | — | 6,483 | ||||||
Payments of principal/finance charges - earn-out | (916 | ) | (1,378 | ) | ||||
Earn-out adjustment | (3,740 | ) | (785 | ) | ||||
| Exchange differences | 2 | 91 | ||||||
Closing balance on December 31 | 299 | 4,953 | ||||||
Investment in unquoted company | Contingent consideration | |||||||
Opening balance on January 1, 2022 | — | 4,953 | ||||||
Payments of principal/finance charges - earn-out | — | (916 | ) | |||||
Earn-out adjustment | — | (3,740 | ) | |||||
| Exchange differences | — | 2 | ||||||
Closing balance on December 31, 2022 | — | 299 | ||||||
Earn-out adjustment | — | (299 | ) | |||||
| Additions | 2,000 | — | ||||||
Closing balance on December 31, 2023 | 2,000 | — | ||||||
b. | Fair |
Carrying amount | Fair value | |||||||
Financial assets: | ||||||||
| Marketable securities | 10,119 | 9,948 | ||||||
Total | 10,119 | 9,948 | ||||||
Financial liabilities: | ||||||||
| Loans and financing | 1,153 | 990 | ||||||
Total | 1,153 | 990 | ||||||
December 31, 2023 | December 31, 2022 | |||||||||||||||
Carrying amount | Fair value | Carrying amount | Fair value | |||||||||||||
Financial assets: | ||||||||||||||||
| Short-term investments | 20,872 | 21,443 | 10,119 | 9,948 | ||||||||||||
Total | 20,872 | 21,443 | 10,119 | 9,948 | ||||||||||||
Financial liabilities: | ||||||||||||||||
| Loans and financing | — | — | 1,153 | 990 | ||||||||||||
Total | — | — | 1,153 | 990 | ||||||||||||
26.2 | Financial risk management |
a. | Credit risk |
(i) | Risk Management |
(ii) | Impairment of financial assets |
(iii) | Trade receivables and contract assets |
Days past due | ||||||||||||||||||||||||||||
As of December 31, 2022 | ||||||||||||||||||||||||||||
Current | More than 30 | More than 60 | More than 120 | More than 180 | More than 270 | More than 300 | ||||||||||||||||||||||
Tier 1 | 0.28 | % | 1.66 | % | 4.18 | % | 16.82 | % | 47.00 | % | 87.08 | % | 100.00 | % | ||||||||||||||
Tier 2 | 0.43 | % | 10.86 | % | 24.25 | % | 50.98 | % | 68.68 | % | 92.28 | % | 100.00 | % | ||||||||||||||
Tier 3 | 1.15 | % | 18.72 | % | 30.24 | % | 56.91 | % | 77.94 | % | 96.91 | % | 100.00 | % | ||||||||||||||
Others | 0.92 | % | 5.61 | % | 12.50 | % | 74.13 | % | 95.64 | % | 98.57 | % | 100.00 | % | ||||||||||||||
Days past due | ||||||||||||||||||||||||||||
As of December 31, 2023 | ||||||||||||||||||||||||||||
Current | More than 30 | More than 60 | More than 120 | More than 180 | More than 270 | More than 300 | ||||||||||||||||||||||
Tier 1 | 0.17 | % | 1.49 | % | 3.67 | % | 14.72 | % | 38.49 | % | 85.78 | % | 100.00 | % | ||||||||||||||
Tier 2 | 0.45 | % | 11.90 | % | 27.72 | % | 63.56 | % | 83.38 | % | 94.20 | % | 100.00 | % | ||||||||||||||
Tier 3 | 1.27 | % | 23.08 | % | 38.67 | % | 65.30 | % | 81.19 | % | 98.04 | % | 100.00 | % | ||||||||||||||
Others | 1.24 | % | 8.26 | % | 15.17 | % | 49.70 | % | 74.63 | % | 98.90 | % | 100.00 | % | ||||||||||||||
Days past due | Days past due | |||||||||||||||||||||||||||||||||||||||||||||||||||||||
As of December 31, 2021 | As of December 31, 2022 | |||||||||||||||||||||||||||||||||||||||||||||||||||||||
Current | More than 30 | More than 60 | More than 120 | More than 180 | More than 270 | More than 300 | Current | More than 30 | More than 60 | More than 120 | More than 180 | More than 270 | More than 300 | |||||||||||||||||||||||||||||||||||||||||||
Tier 1 | 0.35 | % | 2.12 | % | 5.93 | % | 24.68 | % | 53.91 | % | 87.56 | % | 100.00 | % | 0.28 | % | 1.66 | % | 4.18 | % | 16.82 | % | 47.00 | % | 87.08 | % | 100.00 | % | ||||||||||||||||||||||||||||
Tier 2 | 0.57 | % | 11.78 | % | 26.32 | % | 53.94 | % | 71.59 | % | 95.92 | % | 100.00 | % | 0.43 | % | 10.86 | % | 24.25 | % | 50.98 | % | 68.68 | % | 92.28 | % | 100.00 | % | ||||||||||||||||||||||||||||
Tier 3 | 1.61 | % | 28.20 | % | 50.25 | % | 80.79 | % | 86.94 | % | 95.85 | % | 100.00 | % | 1.15 | % | 18.72 | % | 30.24 | % | 56.91 | % | 77.94 | % | 96.91 | % | 100.00 | % | ||||||||||||||||||||||||||||
Others | 1.86 | % | 9.75 | % | 14.68 | % | 45.79 | % | 77.04 | % | 96.97 | % | 100.00 | % | 0.92 | % | 5.61 | % | 12.50 | % | 74.13 | % | 95.64 | % | 98.57 | % | 100.00 | % | ||||||||||||||||||||||||||||
b. | Liquidity risk |
Less than 1 year | Between 1 and 2 years | More than 2 years | ||||||||||
December 31, 2022 | ||||||||||||
Non-derivatives | ||||||||||||
| Account payables | 34,136 | 372 | 208 | |||||||||
| Loans and financing | 1,153 | — | — | |||||||||
| Lease liabilities | 1,898 | 1,804 | 2,437 | |||||||||
Accounts payable from acquisition of subsidiaries | 299 | — | — | |||||||||
Other liabilities | 70 | — | — | |||||||||
Total non-derivatives | 37,556 | 2,176 | 2,645 | |||||||||
Less than 1 year | Between 1 and 2 years | More than 2 years | ||||||||||
December 31, 2023 | ||||||||||||
Non-derivatives | ||||||||||||
| Trade payables | 14,829 | — | — | |||||||||
| Loans and financing | — | — | — | |||||||||
| Lease liabilities | 1,863 | 1,408 | 1,123 | |||||||||
Total non-derivatives | 16,692 | 1,408 | 1,123 | |||||||||
Less than 1 year | Between 1 and 2 years | More than 2 years | ||||||||||
December 31, 2021 | ||||||||||||
Non-derivatives | ||||||||||||
Account payables | 29,537 | 1,243 | 836 | |||||||||
Loans and financing | 2,087 | 1,253 | — | |||||||||
Lease liabilities | 1,105 | 1,471 | 3,665 | |||||||||
Accounts payable from acquisition of subsidiaries | 4,260 | 2,274 | — | |||||||||
Other liabilities | 133 | 190 | — | |||||||||
Total non-derivatives | 37,122 | 6,431 | 4,501 | |||||||||
Derivatives | ||||||||||||
Net settled | 133 | — | — | |||||||||
Total derivatives | 133 | — | — | |||||||||
Less than 1 year | Between 1 and 2 years | More than 2 years | ||||||||||
December 31, 2022 | ||||||||||||
Non-derivatives | ||||||||||||
| Trade payables | 34,136 | 372 | 208 | |||||||||
| Loans and financing | 1,153 | — | — | |||||||||
| Lease liabilities | 1,898 | 1,804 | 2,437 | |||||||||
| Accounts payable from acquisition of subsidiaries | 299 | — | — | |||||||||
Total non-derivatives | 37,486 | 2,176 | 2,645 | |||||||||
c. | Market risk |
(i) | Foreign Currency risk |
| Foreign currency sensitivity analysis | ||||||||||||
| -10% | Actual | +10% | ||||||||||
| Net revenue | 183,027 | 201,517 | 220,007 | |||||||||
| Costs and operating expenses | (197,239 | ) | (216,119 | ) | (234,998 | ) | ||||||
| Loss from operation | (14,212 | ) | (14,602 | ) | (14,992 | ) | ||||||
| Total Shareholders’ equity | 240,722 | 240,332 | 239,942 | |||||||||
Foreign currency sensitivity analysis | ||||||||||||
-10% | Actual | +10% | ||||||||||
Net revenue | 143,420 | 157,620 | 171,820 | |||||||||
Costs and operating expenses | (190,016 | ) | (207,539 | ) | (225,062 | ) | ||||||
Loss from operation | (46,596 | ) | (49,919 | ) | (53,243 | ) | ||||||
Total Shareholders’ equity | 278,001 | 274,677 | 271,354 | |||||||||
Exposure at December 31, 2022 | Risk | -10% | 10% | |||||||||||||
Assets | 12,171 | | Brazilian Real /U.S. Dollar (2021 – 5.57 2022 – 5.29) | | 1,217 | (1,217 | ) | |||||||||
Liabilities | (2,603 | ) | (260 | ) | 260 | |||||||||||
| 9,568 | 957 | (957 | ) | |||||||||||||
Assets | 114 | | Argentine Peso/U.S. Dollar (2021 – 102.69 2022 – 177.10) | | 11 | (11 | ) | |||||||||
Liabilities | (8,647 | ) | (865 | ) | 865 | |||||||||||
| (8,533 | ) | (854 | ) | 854 | ||||||||||||
Assets | 115 | | Mexican Peso/U.S. Dollar (2021 – 20.45 2022 – 19.48) | | 12 | (12 | ) | |||||||||
Liabilities | — | — | — | |||||||||||||
| 115 | 12 | (12 | ) | |||||||||||||
Assets | 5,356 | | British Pounds/U.S. Dollar (2021 – 0.74 2022 – 0.83) | | 536 | (536 | ) | |||||||||
Liabilities | (1,894 | ) | (189 | ) | 189 | |||||||||||
| 3,462 | 347 | (347 | ) | |||||||||||||
Assets | 579 | | Colombian Peso/U.S. Dollar (2021 – 4,068.51 2022 – 4,846.04) | | 58 | (58 | ) | |||||||||
Liabilities | (535 | ) | (54 | ) | 54 | |||||||||||
| 44 | 4 | (4 | ) | |||||||||||||
Assets | 240 | | Peruvian sol/ U.S. Dollar (2021 – 3.99 2022 – 3.81) | 24 | (24 | ) | ||||||||||
Liabilities | (973 | ) | (97 | ) | 97 | |||||||||||
| (733 | ) | (73 | ) | 73 | ||||||||||||
Assets | 1,589 | | Chilean Peso/ U.S. Dollar (2021 – 851.60 2022 – 852.17) | 159 | (159 | ) | ||||||||||
Liabilities | (661 | ) | (66 | ) | 66 | |||||||||||
| 928 | 93 | (93 | ) | |||||||||||||
Total at December 31, 2022 | 4,851 | 486 | (486 | ) | ||||||||||||
Exposure at December 31, 2023 | Risk | -10% | 10% | |||||||||||
| Assets | 16,226 | Brazilian Real /U.S. Dollar (2023 – 4.85 2022 – 5.29) | 1,623 | (1,623 | ) | |||||||||
| Liabilities | (3,284 | ) | (328 | ) | 328 | |||||||||
| 12,942 | 1,294 | (1,294 | ) | |||||||||||
| Assets | 1,763 | Argentine Peso/U.S. Dollar (2023 – 808.47 2022 – 177.10) | 176 | (176 | ) | |||||||||
| Liabilities | (52 | ) | (5 | ) | 5 | |||||||||
| 1,711 | 171 | (171 | ) | |||||||||||
| Assets | 211 | Mexican Peso/U.S. Dollar (2023 – 16.93 2022 – 19.48) | 21 | (21 | ) | |||||||||
| Liabilities | — | — | — | |||||||||||
| 211 | 21 | (21 | ) | |||||||||||
| Assets | 11,421 | British Pounds/U.S. Dollar (2023 – 0.79 2022 – 0.83) | 1,142 | (1,142 | ) | |||||||||
| Liabilities | (11,962 | ) | (1,196 | ) | 1,196 | |||||||||
| (541 | ) | 54 | 54 | |||||||||||
| Assets | 558 | Colombian Peso/U.S. Dollar (2023 – 3,873.55 2022 – 4,846.04) | 56 | (56 | ) | |||||||||
| Liabilities | — | — | — | |||||||||||
| 558 | 56 | (56 | ) | |||||||||||
| Assets | 1,078 | Peruvian sol/U.S. Dollar (2023 – 3.71 2022 – 3.81 ) | 108 | (108 | ) | |||||||||
| Liabilities | (759 | ) | (76 | ) | 76 | |||||||||
| 319 | 32 | 32 | ||||||||||||
| Assets | 912 | Chilean Peso/U.S. Dollar (2023 – 878.87 2022 – 852.17) | 91 | (91 | ) | |||||||||
| Liabilities | — | — | ||||||||||||
| 912 | 91 | (91 | ) | |||||||||||
Total at December 31, 2023 | 16,112 | 1,611 | (1,611 | ) | ||||||||||
Exposure at December 31, 2021 | Risk | -10% | 10% | |||||||||||
Assets | 4,147 | Brazilian Real /U.S. Dollar (2020 –5.20 2021 – 5.57) | 415 | (415 | ) | |||||||||
Liabilities | (6,216 | ) | (622 | ) | 622 | |||||||||
(2,069 | ) | (207 | ) | 207 | ||||||||||
Assets | 97 | Argentine Peso/U.S. Dollar (2020 – 84.17 2021 – 102.69) | 10 | (10 | ) | |||||||||
Liabilities | (2,862 | ) | (286 | ) | 286 | |||||||||
(2,765 | ) | (276 | ) | 276 | ||||||||||
Assets | 271 | Mexican Peso/U.S. Dollar (2020 – 19.92 2021 – 20.45) | 27 | (27 | ) | |||||||||
Liabilities | (2,881 | ) | (288 | ) | 288 | |||||||||
(2,610 | ) | (261 | ) | 261 | ||||||||||
Assets | 15,730 | British Pounds/U.S. Dollar (2020 – 0.73 2021 – 0.74) | 1,573 | (1,573 | ) | |||||||||
Liabilities | (1,228 | ) | (123 | ) | 123 | |||||||||
14,502 | 1,450 | (1,450 | ) | |||||||||||
Assets | 8 | Colombian Peso/U.S. Dollar (2020 – 3,438.59 2021 – 4,068.51) | 1 | (1 | ) | |||||||||
Liabilities | (1,920 | ) | (192 | ) | 192 | |||||||||
(1,912 | ) | (191 | ) | 191 | ||||||||||
Assets | 525 | Peruvian sol/U.S. Dollar (2020 – 3.62 2021 – 3.99) | 53 | (53 | ) | |||||||||
Liabilities | (1,193 | ) | (119 | ) | 119 | |||||||||
(668 | ) | (66 | ) | 66 | ||||||||||
Assets | 472 | Euro/U.S. Dollar (2021 – 0.88) | 47 | (47 | ) | |||||||||
Liabilities | (41 | ) | (4 | ) | 4 | |||||||||
431 | 43 | (43 | ) | |||||||||||
Exposure at December 31, 2022 | Risk | -10% | 10% | |||||||||||
| Assets | 12,171 | Brazilian Real /U.S. Dollar (2021 – 5.57 2022 – 5.29) | 1,217 | (1,217 | ) | |||||||||
| Liabilities | (2,603 | ) | (260 | ) | 260 | |||||||||
| 9,568 | 957 | (957 | ) | |||||||||||
| Assets | 114 | Argentine Peso/U.S. Dollar (2021 – 102.69 2022 – 177.10) | 11 | (11 | ) | |||||||||
| Liabilities | (8,647 | ) | (865 | ) | 865 | |||||||||
| (8,533 | ) | (854 | ) | 854 | ||||||||||
| Assets | 115 | Mexican Peso/U.S. Dollar (2021 – 20.45 2022 – 19.48) | 12 | (12 | ) | |||||||||
| Liabilities | — | — | — | |||||||||||
| 115 | 12 | (12 | ) | |||||||||||
| Assets | 5,356 | British Pounds/U.S. Dollar (2021 – 0.74 2022 – 0.83) | 536 | (536 | ) | |||||||||
| Liabilities | (1,894 | ) | (189 | ) | 189 | |||||||||
| 3,462 | 347 | (347 | ) | |||||||||||
| Assets | 579 | Colombian Peso/U.S. Dollar (2021 – 4,068.51 2022 – 4,846.04) | 58 | (58 | ) | |||||||||
| Liabilities | (535 | ) | (54 | ) | 54 | |||||||||
| 44 | 4 | (4 | ) | |||||||||||
| Assets | 240 | Peruvian sol/U.S. Dollar (2021 – 3.99 2022 – 3.81) | 24 | (24 | ) | |||||||||
| Liabilities | (973 | ) | (97 | ) | 97 | |||||||||
| (733 | ) | (73 | ) | 73 | ||||||||||
| Assets | 1,589 | Chilean Peso/U.S. Dollar (2021 – 851.60 2022 – 852.17) | 159 | (159 | ) | |||||||||
| Liabilities | (661 | ) | (66 | ) | 66 | |||||||||
| 928 | 93 | (93 | ) | |||||||||||
Total at December 31, 2022 | 4,851 | 486 | (486 | ) | ||||||||||
Assets | 176 | Romanian leu/U.S. Dollar (2021 – 4.35) | 18 | (18 | ) | |||||||||
Liabilities | (10 | ) | (1 | ) | 1 | |||||||||
166 | 17 | (17 | ) | |||||||||||
Assets | 597 | Chilean Peso/U.S. Dollar (2020 – 711.25 2021 – 851.60) | 60 | (60 | ) | |||||||||
Liabilities | (407 | ) | (41 | ) | 41 | |||||||||
190 | 19 | (19 | ) | |||||||||||
Total at December 31, 2021 | 5,265 | 528 | (528 | ) |
(ii) | Interest rate risk |
26.3 | Capital management |
December 31, 2022 | December 31, 2021 | |||||||
Loans and financing | 1,153 | 3,279 | ||||||
Lease liabilities | 5,635 | 5,991 | ||||||
Accounts payable from acquisition of subsidiaries | 299 | 6,423 | ||||||
(-) Cash and cash equivalent | (24,394 | ) | (121,006 | ) | ||||
(-) Short-term and Marketable securities | (214,164 | ) | (177,191 | ) | ||||
Adjusted net cash/debt | (231,471 | ) | (282,504 | ) | ||||
Total Equity attributable to VTEX’s shareholders | 274,658 | 327,182 | ||||||
Financial leverage ratio | 84.28 | % | 86.34 | % | ||||
December 31, 2023 | December 31, 2022 | |||||||
| Loans and financing | — | 1,153 | ||||||
| Lease liabilities | 4,096 | 5,635 | ||||||
| Accounts payable from acquisition of subsidiaries | — | 299 | ||||||
| (-) Cash and cash equivalent | (28,035 | ) | (24,394 | ) | ||||
| (-) Short and long-term investments | (183,374 | ) | (214,164 | ) | ||||
Adjusted net cash | (207,313 | ) | (231,471 | ) | ||||
| Total Equity attributable to VTEX’s shareholders | 240,293 | 274,658 | ||||||
Financial leverage ratio | 86.28 | % | 84.28 | % | ||||
27 |