![[keegan201020fannualreport001.jpg]](https://capedge.com/proxy/20-F/0001217160-10-000141/keegan201020fannualreport001.jpg)
[ ]
REGISTRATION STATEMENT PURSUANT TO SECTION 12(b) OR (g) OF THE SECURITIES EXCHANGE ACT OF 1934
OR
[X]
ANNUAL REPORT PURSUANT TO SECTION 13 OR 15(d) OF THE SECURITIES EXCHANGE ACT OF 1934
| [ ] | REGISTRATION STATEMENT PURSUANT TO SECTION 12(b) OR (g) OF THE SECURITIES EXCHANGE ACT OF 1934 |
| OR |
[X] | ANNUAL REPORT PURSUANT TO SECTION 13 OR 15(d) OF THE SECURITIES EXCHANGE ACT OF 1934 |
OR
[ ]
TRANSITION REPORT PURSUANT TO SECTION 13 OR 15(d) OF THE SECURITIES EXCHANGE ACT OF 1934
2011
| OR |
| [ ] | TRANSITION REPORT PURSUANT TO SECTION 13 OR 15(d) OF THE SECURITIES EXCHANGE ACT OF 1934 |
OR
[ ]
SHELL COMPANY REPORT PURSUANT TO SECTION 13 OR 15(d) OF THE SECURITIES EXCHANGE ACT OF 1934
| OR |
| [ ] | SHELL COMPANY REPORT PURSUANT TO SECTION 13 OR 15(d) OF THE SECURITIES EXCHANGE ACT OF 1934 |
Tony M. Ricci,
683-8193greg.mccunn@keeganresources.com
2011.
oInternational Financial Reporting Standards as issued
[ ]
oOther [X]
x
PART I | 1 | ||
| ITEM | IDENTITY OF DIRECTORS, SENIOR MANAGEMENT AND ADVISORS | 1 | |
| ITEM | OFFER STATISTICS AND EXPECTED TIMETABLE | 1 | |
| ITEM | KEY INFORMATION | 1 | |
| ITEM | INFORMATION ON THE COMPANY | 8 | |
| ITEM | UNRESOLVED STAFF COMMENTS |
| |
| ITEM | OPERATING AND FINANCIAL REVIEW AND PROSPECTS |
| |
| ITEM | DIRECTORS, SENIOR MANAGEMENT, AND EMPLOYEES |
| |
| ITEM 7. | MAJOR SHAREHOLDERS AND RELATED PARTY TRANSACTIONS |
| |
| ITEM 8. | FINANCIAL INFORMATION |
| |
| Esaase Lawsuit | 52 | ||
| |||
ITEM 9. | THE OFFER AND LISTING |
| |
| ITEM 10. | ADDITIONAL INFORMATION |
| |
| ITEM | QUANTITATIVE AND QUALITATIVE DISCLOSURES ABOUT MARKET RISK |
| |
| ITEM 12. | DESCRIPTION OF SECURITIES OTHER THAN EQUITY SECURITIES |
| |
PART II |
| ||
| ITEM 13. | DEFAULTS, DIVIDEND ARREARAGES AND DELINQUENCIES |
| |
| ITEM 14. | MATERIAL MODIFICATIONS TO THE RIGHTS OF SECURITY HOLDERS AND USE OF PROCEEDS |
| |
| ITEM 15. | CONTROLS AND PROCEDURES |
| |
| ITEM 16A. | AUDIT COMMITTEE FINANCIAL EXPERT |
| |
| ITEM | CODE OF ETHICS |
| |
| ITEM 16C. | PRINCIPAL ACCOUNTING FEES AND SERVICES |
| |
| ITEM 16D. | EXEMPTIONS FROM THE LISTING STANDARDS FOR AUDIT COMMITTEES |
| |
| ITEM 16E. | PURCHASES OF EQUITY SECURITIES BY KEEGAN/AFFILIATED PURCHASERS |
| |
| ITEM 16F. | CHANGE IN REGISTRANTS CERTIFYING ACCOUNTANT | 72 | |
| ITEM 16G. | CORPORATE GOVERNANCE | 72 | |
PART III |
| ||
|
|
| |
| ITEM | FINANCIAL STATEMENTS |
| |
| ITEM 18. | FINANCIAL STATEMENTS | 73 | |
| ITEM 19. | EXHIBITS |
| |
Mineral Reserve | The terms “mineral reserve,” “proven mineral reserve” and “probable mineral reserve” used in Keegan Resources Inc.’s (“Keegan” or the “Company”) disclosure are Canadian mining terms that are defined in accordance with National Instrument 43-101 - Standards of Disclosure for Mineral Projects (“NI 43-101”) under the guidelines set out in the Canadian Institute of Mining, Metallurgy and Petroleum (the “CIM”) Best Practice Guidelines for the Estimation of Mineral Resource and Mineral Reserves (the “CIM Standards”), adopted by the CIM Council on November 23, 2003. These definitions differ from the definitions in the United States Securities and Exchange Commission (the “SEC”) Industry Guide 7 under the Securities Act of 1933, as amended (the “Securities Act”). Under Industry Guide 7 standards, mineralization may not be classified as a “reserve” unless the determination has been made that the mineralization could be economically and legally produced or extracted at the time the reserve determination is made. Under Industry Guide 7 standards, a “final” or “bankable” feasibility study is required to report reserves, the three-year historical average price is used in any reserve or cash flow analysis to designate reserves and the primary environmental analysis or report must be filed with the appropriate governmental authority. |
Mineral Resource | The terms “mineral resource,” “measured mineral resource,” “indicated mineral resource” and “inferred mineral resource” used in the Registrant’s disclosure are Canadian mining terms that are defined in accordance with NI 43-101 under the guidelines set out in the CIM Standards; however, these terms are not defined terms under Industry Guide 7 and are normally not permitted to be used in reports and registration statements filed with the SEC. Investors are cautioned not to assume that any part or all of mineral deposits in these categories will ever be converted into reserves. “Inferred mineral resources” have a great amount of uncertainty as to their existence, and great uncertainty as to their economic feasibility. It cannot be assumed that all or any part of an inferred mineral resource will ever be upgraded to a higher category. Under Canadian rules, estimates of inferred mineral resources may not form the basis of feasibility or pre-feasibility studies, except in rare cases. Investors are cautioned not to assume that all or any part of an inferred mineral resource exists or is economically mineable. |
ITEM 1
IDENTITY OF DIRECTORS, SENIOR MANAGEMENT AND ADVISORS
| ITEM 1 | IDENTITY OF DIRECTORS, SENIOR MANAGEMENT AND ADVISORS |
Directors and Senior Management
Advisers
Auditors
ITEM 2
OFFER STATISTICS AND EXPECTED TIMETABLE
| ITEM 2 | OFFER STATISTICS AND EXPECTED TIMETABLE |
ITEM 3
KEY INFORMATION
| ITEM 3 | KEY INFORMATION |
Selected Financial Data
Year Ended March 31, 2010 | Year Ended March 31, 2009 | Year Ended March 31, 2008 | Year Ended March 31, 2007 | Year Ended March 31, 2006 | ||
CANADIAN GAAP | ||||||
Revenue | Nil | Nil | Nil | Nil | Nil | |
Expenses | ($6,943) | ($3,619) | ($4,170) | ($3,641) | ($1,798) | |
Other Income (Expenses) | ($30) | ($557) | ($146) | ($740) | ($1,191) | |
Loss for the Period | ($6,973) | ($4,176) | ($4,316) | ($4,381) | ($2,989) | |
Loss Per Share | ($0.18) | ($0.15) | ($0.17) | ($0.28) | ($0.31) | |
Wtg. Avg. Shares (000) | 38,019 | 28,233 | 24,605 | 15,595 | 9,602 | |
Period-End Shares | 45,047 | 28,505 | 27,468 | 22,808 | 12,164 | |
Working Capital | $47,945 | $2,504 | $15,064 | $13,907 | $625 | |
Resource Properties | $41,123 | $30,358 | $19,105 | $7,198 | $1,449 | |
Long-Term Debt | Nil | Nil | Nil | Nil | Nil | |
Capital Stock | $104,887 | $43,096 | $40,489 | $25,459 | $4,982 | |
Shareholders’ Equity | $89,386 | $33,065 | $34,293 | $21,142 | $2,112 | |
Total Assets | $90,534 | $33,718 | $34,670 | $21,494 | $2,372 | |
US GAAP | ||||||
Net Loss | ($17,738) | ($15,234) | ($14,549) | ($9,661) | ($4,095) | |
Loss Per Share | ($0.47) | ($0.54) | ($0.59) | ($0.62) | ($0.43) | |
Resource Properties | $2,975 | $2,975 | $2,779 | $1,105 | $343 | |
Shareholders’ Equity | $51,238 | $5,682 | $17,968 | $15,049 | $1,006 | |
Total Assets | $52,386 | $6,335 | $18,344 | $15,401 | $1,266 | |
Year Ended March 31, 2011 | Year Ended March 31, 2010 | Year Ended March 31, 2009 | Year Ended March 31, 2008 | Year Ended March 31, 2007 | |
| CANADIAN GAAP | |||||
| Revenue | Nil | Nil | Nil | Nil | Nil |
| Expenses | ($12,785) | ($6,943) | ($3,619) | ($4,170) | ($3,641) |
| Other Income (Expenses) | ($126) | ($30) | ($557) | ($146) | ($740) |
| Loss for the Period | ($12,910) | ($6,973) | ($4,176) | ($4,316) | ($4,381) |
| Loss Per Share | ($0.26) | ($0.18) | ($0.15) | ($0.17) | ($0.28) |
| Wtg. Avg. Shares (000) | 49,178 | 38,019 | 28,233 | 24,605 | 15,595 |
| Period-End Shares (000) | 74,885 | 45,047 | 28,505 | 27,468 | 22,808 |
| Working Capital | $224,459 | $47,995 | $2,504 | $15,064 | $13,907 |
| Resource Properties | $74,843 | $41,123 | $30,358 | $19,105 | $7,198 |
| Long-Term Debt | Nil | Nil | Nil | Nil | Nil |
| Capital Stock | 314,408 | $104,887 | $43,096 | $40,489 | $25,459 |
| Shareholders’ Equity | $295,077 | $89,386 | $33,065 | $34,293 | $21,142 |
| Total Assets | $304,916 | $90,534 | $33,718 | $34,670 | $21,494 |
| US GAAP | |||||
| Net Loss | ($44,988) | ($17,738) | ($15,234) | ($14,549) | ($9,661) |
| Loss Per Share | ($0.91) | ($0.47) | ($0.54) | ($0.59) | ($0.62) |
| Resource Properties | $4,165 | $2,975 | $2,975 | $2,779 | $1,105 |
| Shareholders’ Equity | $224,379 | $51,238 | $5,682 | $17,968 | $15,049 |
| Total Assets | $234,218 | $52,386 | $6,335 | $18,344 | $15,401 |
Period | Average | High | Low | Close | |
Fiscal Year Ended March 31, 2010 | $1.09 | 1.26 | $1.01 | $1.02 | |
Fiscal Year Ended March 31, 2009 | $1.13 | $1.30 | $0.98 | $1.26 | |
Fiscal Year Ended March 31, 2008 | $1.03 | $1.16 | $0.92 | $1.03 | |
Fiscal Year Ended March 31, 2007 | $1.14 | $1.19 | $1.10 | $1.15 | |
Fiscal Year Ended March 31, 2006 | $1.19 | $1.27 | $1.13 | $1.17 | |
Period | Average | High | Low | Close |
| Fiscal Year Ended March 31, 2011 | $0.93 | $1.03 | $1.00 | $1.02 |
| Fiscal Year Ended March 31, 2010 | $1.09 | $1.26 | $1.01 | $1.02 |
| Fiscal Year Ended March 31, 2009 | $1.13 | $1.30 | $0.98 | $1.26 |
| Fiscal Year Ended March 31, 2008 | $1.03 | $1.16 | $0.92 | $1.03 |
| Fiscal Year Ended March 31, 2007 | $1.14 | $1.19 | $1.10 | $1.15 |
Dec. 2009 | Jan. 2010 | Feb. 2010 | Mar. 2010 | Apr. 2010 | May 2010 | ||
Average | $1.05 | $1.04 | $1.06 | $1.02 | $1.01 | $1.04 | |
High | $1.07 | $1.07 | $1.08 | $1.06 | $1.02 | $1.08 | |
Low | $1.04 | $1.02 | $1.04 | $1.01 | $0.99 | $1.01 | |
Close | $1.05 | $1.07 | $1.05 | $1.02 | $1.02 | $1.04 | |
Dec. 2010 | Jan. 2011 | Feb. 2011 | Mar. 2011 | Apr. 2011 | May 2011 | |
| Average | $1.01 | $0.99 | $0.99 | $0.98 | $0.96 | $0.97 |
| High | $1.02 | $1.00 | $1.00 | $0.99 | $0.97 | $0.98 |
| Low | $1.00 | $0.99 | $0.97 | $0.97 | $0.96 | $0.95 |
| Close | $1.00 | $1.00 | $0.97 | $0.97 | $0.95 | $0.97 |
Capitalization and Indebtedness
Reasons for the Offer and Use of Proceeds
Risk Factors
4
•
unanticipated adverse geotechnical conditions;
•
incorrect data on which engineering assumptions are made;
•
costs of constructing and operating a mine in a specific environment;
•
cost of processing and refining;
•
availability of economic sources of power;
•
availability of qualified staff;
•
adequacy of water supply;
•
adequate access to the site including competing land uses (such as agriculture and illegal mining);
•
unanticipated transportation costs and shipping incidents and losses;
•
significant increases in the cost of diesel fuel, cyanide or other major components of operating costs;
•
government regulations (including regulations relating to prices, royalties, duties, taxes, permitting, restrictions on production, quotas on exportation of minerals, as well as the costs of protection of the environment and agricultural lands);
| · | unanticipated adverse geotechnical conditions; |
| · | incorrect data on which engineering assumptions are made; |
| · | costs of constructing and operating a mine in a specific environment; |
| · | cost of processing and refining; |
| · | availability of economic sources of power; |
| · | availability of qualified staff; |
| · | adequacy of water supply; |
| · | adequate access to the site including competing land uses (such as agriculture and illegal mining); |
| · | unanticipated transportation costs and shipping incidents and losses; |
| · | significant increases in the cost of diesel fuel, cyanide or other major components of operating costs; |
•
fluctuations in gold prices;
•
accidents, labour actions and force majeure events;
•
the identification of potential gold mineralization based on superficial analysis;
•
availability of prospective land;
•
availability of government-granted exploration and exploitation permits;
•
the quality of our management and our geological and technical expertise; and
•
the funding available for exploration and development.
| · | government regulations (including regulations relating to prices, royalties, duties, taxes, permitting, restrictions on production, quotas on exportation of minerals, as well as the costs of protection of the environment and agricultural lands); |
| · | fluctuations in gold prices; |
| · | accidents, labour actions and force majeure events; |
| · | the identification of potential gold mineralization based on superficial analysis; |
| · | availability of prospective land; |
| · | availability of government-granted exploration and exploitation permits; |
| · | the quality of our management and our geological and technical expertise; and |
| · | the funding available for exploration and development. |
7
The submissionRetrieval (commonly known as “SEDAR”), an electronic database maintained on behalf of proxy and annual meeting of shareholder information (preparedthe Canadian provincial securities regulators, but are only required to Canadian standards)be furnished to the SEC on Form 6-K results6-K.
ITEM 4
INFORMATION ON THE COMPANY
| ITEM 4 | INFORMATION ON THE COMPANY |
History and Development of the Company
Financings
The Company has financed its operations through funds raised in public/private placements of common shares and shares issued upon exercise of stock options and share purchase warrants. Over the past three fiscal years, the Company raised funds through the issuance of the following common shares:
Fiscal Year | Nature of Share Issuance | Number of Shares | Amount | |
Fiscal 2008 | Private Placement, net of share issue costs | 3,300,000 | $12,358,089 | |
Exercise of share purchase warrants | 1,115,470 | $2,033,528 | ||
Exercise of share purchase options | 200,000 | $184,000 | ||
Fiscal 2009 | Exercise of share purchase warrants | 773,000 | $1,982,700 | |
Exercise of share purchase options | 263,905 | $242,793 | ||
Fiscal 2010 | Bought deal share offering, net of share issue costs | 8,000,000 | $18,059,533 | |
Brokered private placement, net of share issue costs | 7,015,000 | $39,003,739 | ||
Exercise of share purchase warrants | 162,667 | $504,268 | ||
Exercise of share purchase options | 1,289,903 | $2,301,880 | ||
8
Capital Expenditures
The Company’s principal capital expenditures (there have been no material divestitures) over the three fiscal years ended March 31, 2009 are as follows:
Year | Resource property acquisition costs | Deferred exploration costs | Furniture, equipment and leasehold improvements | Total |
2008 | $1,515,725 | $9,861,207 | $110,459 | $11,487,391 |
2009 | $237,161 | $10,901,528 | $119,631 | $11,258,320 |
2010 | $nil | $9,368,626 | $214,751 | $10,979,934 |
Item 4.B
Business Overview
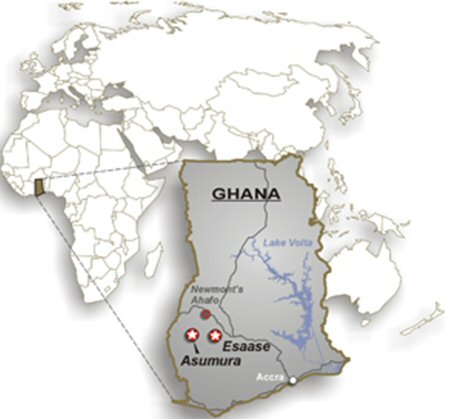
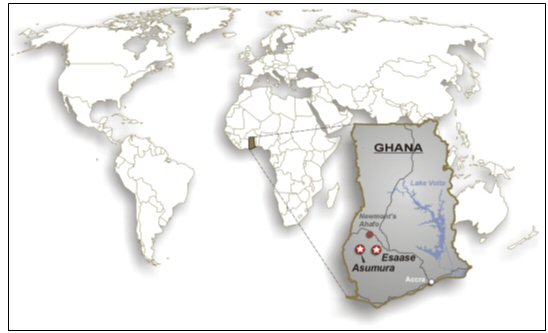
Keegan is a natural resource company currently engaged in the acquisition and exploration of mineral resources in West Ghana.
On June 11, 2003, Keegan announced that it had entered into a letter of intent to purchase an interest in a property located in Australia. On July 22, 2003, Keegan announced that it had decided not to proceed with this transaction because, upon further examination of the property, management determined that it did not warrant further exploration.
On September 5, 2003, Keegan announced that it entered into another letter of intent to purchase a 100% interest in some mining claims located in British Columbia. This agreement was also terminated during the year ended March 31, 2004 because, upon further examination of the property, management determined that it did not warrant further exploration.
9
On March 4, 2005, Keegan announced that it had entered into an option agreement to acquire a 100% interest in the Regent Gold Silver Project located in Mineral County, Nevada. Keegan terminated its interest in this property in 2007 due to its focus on its properties in Ghana.
On June 2, 2005, Keegan announced that it had entered into an option agreement to acquire a 100% interest in the Fri Property located in Nye County, Nevada. During the fiscal year ended March 31, 2006, the Company decided not to pursue its option pertaining to the Fri Property because, after completing preliminary exploration work, management determined that the results did not warrant further exploration work.
On December 7, 2005, Keegan announced that it had entered into an option agreement to acquire a 100% interest in the Black Velvet Gold Project located in Pershing County, Nevada. Keegan terminated its interest in this property in 2007 due to its focus on its properties in Ghana.
Fiscal Year | Nature of Share Issuance | Number of Shares | Amount |
| Fiscal 2008 | Private Placement, net of share issue costs | 3,300,000 | $12,358,089 |
| Exercise of share purchase warrants | 1,115,470 | $2,033,528 | |
| Exercise of share purchase options | 200,000 | $184,000 | |
| Fiscal 2009 | Exercise of share purchase warrants | 773,000 | $1,982,700 |
| Exercise of share purchase options | 263,905 | $242,793 | |
| Fiscal 2010 | Bought deal share offering, net of share issue costs | 8,000,000 | $18,059,533 |
| Brokered private placement, net of share issue costs | 7,015,000 | $39,003,739 | |
| Exercise of share purchase warrants | 162,667 | $504,268 | |
| Exercise of share purchase options | 1,289,903 | $2,301,880 | |
| Fiscal 2011 | Bought deal share offering, net of share issue costs | 28,405,000 | $202,184,925 |
| Exercise of share purchase warrants | 237,333 | 735,732 | |
| Exercise of share purchase options | 1,195,132 | 3,704,178 |
| Year | Resource property acquisition costs | Deferred exploration costs | Furniture, equipment and leasehold improvements | Total |
| 2009 | $237,161 | $10,901,528 | $119,631 | $11,258,320 |
2010 2011 | $nil $639,220 | $9,319,015 $21,238,903 | $214,751 $320,843 | $9,533,766 $22,198,966 |
(a)
undertake additional exploration at the Esaase Property to add to the existing resource estimates and convert additional resources from inferred to measured and indicated resources categories. Exploration will consist of reverse circulation drilling of current exploration and resource extension targets and core drilling targeting higher grade targets of the deposit down dip and along strike to the north;
(b)
complete metallurgical and hydrogeological drill programs in conjunction with engineering studies to support the Esaase Property’s pre-feasibility and feasibility studies;
(c)
continue working with local communities, the Ghanaian government and the Ghanaian Enviromental Protection Agency (the “EPA”) to both advance community relations and the permitting of the Esaase Property; and,
(d)
continue exploration of the Asumura Property.
| (a) | complete the pre-feasibility and feasibility studies for the Esaase Gold project; |
| (b) | continue exploration at Esaase to add to the existing resource estimates and convert additional resources to an indicated resources category. Exploration will consist of reverse circulation and core drilling of current exploration and resource extension targets including down dip on the deposit, with-in the Dawohodo concession and along the B and D zones to the north east of the deposit; |
| (c) | commence detailed engineering studies for the ultimate design and operation of facilities at Esaase and review potential purchases for long-lead capital purchases; |
| (d) | continue working with local communities, the Ghanaian government and the EPA to both advance community relations and the permitting of the Esaase project. |
2012
During2012
Esaase gold project.
11
future as the Company further advances the development of its Esaase Gold project.
Organization Structure
| Subsidiary name | Jurisdiction | Ownership |
| Keegan Resources Ghana Limited | Ghana | 90% |
| Keegan International (Barbados) Inc. | Barbados | 100% |
| Keegan Ghana (Barbados) Inc. | Barbados | 100% |
Quicksilver Ventures (Nevada) Inc. | Nevada, USA | 100% |
international tax planning.
Property, Plant and Equipment
UMS is a private company which Keegan acquired the sole common share on April 14, 2010. UMS has certain directors in common with the Company and was incorporated to provide geological, corporate development, administrative and management services to, and incur third party costs on behalf of, the Company, its subsidiaries and other publically listed mining companies on a full cost recovery basis pursuant to a service agreement.
lease are approximately $30,000.
The Asumura Property
12
-
US$10,000 upon signing the agreement (paid);
-
US$30,000 on or before October 8, 2006 (paid through the issuance of 16,775 shares)
-
US$60,000 on or before October 8, 2007. (paid through the issuance of 20,087 shares)
| - | US$10,000 upon signing the agreement (paid); |
| - | US$30,000 on or before October 8, 2006 (paid through the issuance of 16,775 shares) |
| - | US$60,000 on or before October 8, 2007. (paid through the issuance of 20,087 shares) |
-
common shares with a value of US$10,000 upon regulatory approval (issued 13,899 shares);
-
common shares with a value of US$30,000 based on the 10 day average closing price prior to issuance on or before October 8, 2006 (issued 16,775 shares); and,
-
common shares with a value of US$60,000 based on the 10 day average closing price prior to issuance on or before October 8, 2007 (issued 20,088 shares).
| - | common shares with a value of US$10,000 upon regulatory approval (issued 13,899 shares); |
| - | common shares with a value of US$30,000 based on the 10 day average closing price prior to issuance on or before October 8, 2006 (issued 16,775 shares); and, |
| - | common shares with a value of US$60,000 based on the 10 day average closing price prior to issuance on or before October 8, 2007 (issued 20,088 shares). |
-
US$80,000 on or before July 31, 2005, (incurred);
-
an additional US$400,000 on or before July 31, 2006 (incurred); and
-
an additional US$520,000 on or before July 31, 2007 (incurred).
| - | US$80,000 on or before July 31, 2005, (incurred); |
| - | an additional US$400,000 on or before July 31, 2006 (incurred); and |
| - | an additional US$520,000 on or before July 31, 2007 (incurred). |
13
14
15
| Asumura Gold Property Deferred Costs | Three Months June 30, 2010 | Three Months Sept 30, 2010 | Three Months Dec 31, 2010 | Three Months March 31, 2011 | Year March 31, 2011 |
| Camp Operations | $78,450 | $42,991 | $27,498 | $32,836 | $181,775 |
| Equipment and Infrastructure Costs | 6,936 | 6,351 | 9,901 | 6,241 | 29,429 |
| Exploration Support Costs | 67,278 | 83,046 | 89,773 | 56,090 | 296,187 |
| Exploration Drilling | 140,965 | 320,910 | 351,214 | 209,890 | 1,022,979 |
| Total for the period: | $293,629 | $453,298 | $478,386 | $305,057 | $1,530,370 |
| Beginning balance: | 6,391,911 | 6,685,540 | 7,138,838 | 7,617,224 | 6,391,911 |
| Ending balance: | $6,685,540 | $7,138,838 | $7,617,224 | $7,922,281 | $7,922,281 |
|
|
|
|
|
|
|
|
|
|
72,000. Rock Formations and Mineralization of Potential Economic Significance
16
Esaase Gold Property
| Esaase Gold Property Deferred Costs | Three Months | Three Months | Three Months | Three Months | Year |
| 30-Jun-10 | 30-Sep-10 | 31-Dec-10 | 31-Mar-11 | 31-Mar-11 | |
| Acquisition Costs | $- | $- | $149,861 | $1,020,578 | $1,170,439 |
| Asset retirement obligation | 5,126,210 | 5,126,210 | |||
| Camp operations | 132,755 | 166,457 | 169,878 | 157,068 | 626,158 |
| Development support costs | 379,072 | 266,496 | 537,049 | 714,175 | 1,896,792 |
| Equipment and infrastructure costs | 457,788 | 283,859 | 306,135 | 194,255 | 1,242,037 |
| Exploration support costs | 1,030,532 | 954,109 | 1,137,147 | 1,633,108 | 4,754,896 |
| Exploration drilling | 1,180,405 | 2,333,914 | 1,272,341 | 207,158 | 4,993,818 |
| Engineering studies | 219,296 | 314,962 | 630,065 | 870,150 | 2,034,473 |
| Health, safety and environmental studies | 174,589 | 295,013 | 192,050 | 537,900 | 1,199,552 |
| Technical and In-fill Drilling | 671,062 | 293,077 | 1,005,373 | 3,651,870 | 5,621,382 |
| Stock-based compensation | 650,555 | 450,711 | 814,139 | 1,608,350 | 3,523,755 |
| Total for the period: | $4,896,054 | $5,358,598 | $6,214,038 | $15,720,822 | $32,189,512 |
| Beginning balance: | 34,731,217 | 39,627,271 | 44,985,869 | 51,199,907 | 34,731,217 |
| Ending balance: | $39,627,271 | $44,985,869 | $51,199,907 | $66,920,729 | $66,920,729 |
17
![[keegan201020fannualreport003.jpg]](https://capedge.com/proxy/20-F/0001217160-10-000141/keegan201020fannualreport003.jpg)
18
![[keegan201020fannualreport004.jpg]](https://capedge.com/proxy/20-F/0001217160-10-000141/keegan201020fannualreport004.jpg)
19
20
21
22
23
Report.
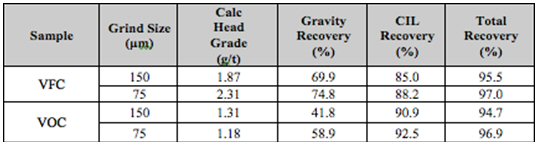
Table 1: Esaase PropertyDrilling and Sampling Statistics
Method | Number | Average Length | Total Metres |
RC | 597 | 160 | 95,572 |
RC Precollars with diamond tails | 166 | 302 | 50,205 |
Diamond | 82 | 210 | 17,220 |
Total | 845 | 672 | 162,997 |
24
25
0.1ppm
Table 2:viability.
Cautionary Note to U.S. Investors Concerning Estimates of Indicated Mineral Resources. The following paragraph and accompanying table refers to “indicated mineral resources”. We advise U.S. investors that while this term is recognized and, in certain circumstances, required by Canadian securities regulations (under National Instrument 43-101 - Standards of Disclosure for Mineral Projects, as adopted by the Canadian Securities Administrators), it is not recognized by the U.S. Securities and Exchange Commission. The estimation of “indicated mineral resources” involves greater uncertainty as to their economic feasibility than the estimation of proven and probable reserves. U.S. investors are cautioned not to assume that any part or all of the mineral deposits in this category will ever be converted into reserves. Cautionary Note to U.S. Investors Concerning Estimates of Inferred Mineral Resources. The following paragraph and accompanying table below also refers to “inferred mineral resources”. We advise U.S. investors that while this term is recognized and, in certain circumstances, required by Canadian securities regulations (under National Instrument 43-101 - Standards of Disclosure for Mineral Projects, as adopted by the Canadian Securities Administrators), it is not recognized by the U.S. Securities and Exchange Commission. The estimation of “inferred mineral resources” involves far greater uncertainty as to their existence, economic viability and legal feasibility than the estimation of other categories of resources. It cannot be assumed that all or any part of an inferred mineral resource will ever be upgraded to a higher category. Under Canadian securities legislation, estimates of inferred mineral resources may not form the basis of feasibility or pre-feasibility studies, or economic studies, except in rare cases. U.S. investors are cautioned not to assume that part or all of an inferred mineral resource exists, or is economically or legally mineable. |
Lower | Tonnes | Average Grade | Gold Metal |
Indicated | |||
0.4 | 57.987 | 1.2 | 2.278 |
0.5 | 49.248 | 1.4 | 2.153 |
0.6 | 41.942 | 1.5 | 2.025 |
0.7 | 35.748 | 1.7 | 1.898 |
0.8 | 30.656 | 1.8 | 1.777 |
0.9 | 26.322 | 2.0 | 1.660 |
1.0 | 22.782 | 2.1 | 1.552 |
Inferred | |||
0.4 | 41.664 | 1.2 | 1.653 |
0.5 | 34.054 | 1.4 | 1.546 |
0.6 | 28.573 | 1.6 | 1.451 |
0.7 | 24.430 | 1.7 | 1.365 |
0.8 | 20.649 | 1.9 | 1.275 |
0.9 | 17.914 | 2.1 | 1.201 |
1.0 | 15.852 | 2.2 | 1.139 |
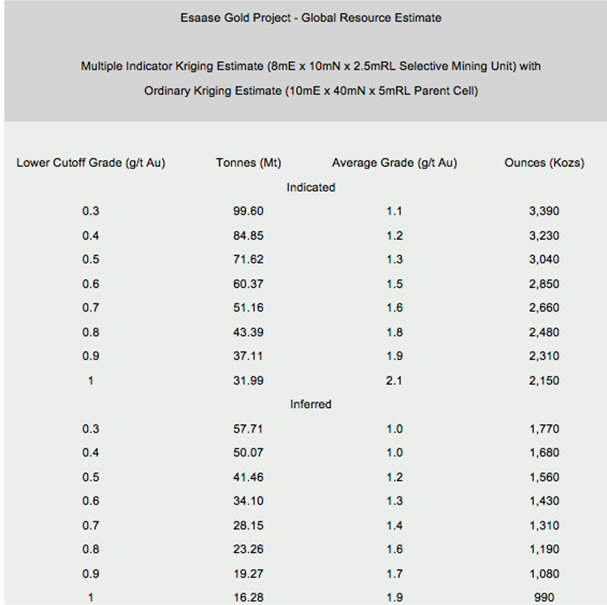
gold (an increase of 42%) in an Indicated Mineral Resource category with an average grade of 1.2 g/t Au at a 0.4 g/t Au cutoff and 1.68 million ounces of gold (an increase of 2%) in an Inferred Mineral Resource category at an average grade of 1.0 g/t Au applying a 0.4 g/t Au cut-off for a total inferred and indicated resource of 4.91 Moz of gold. A total of 770 holes drilled at collar spacing ranging from 25m by 40m to 40m by 80m and over 190,000m of drilling were used to establish the resource. This resource estimation represents over 3.5 km of strike length along the A-1 structure and includes drilling done in the B-1 and D-1 mineralized zones.
26
27
![[keegan201020fannualreport006.jpg]](https://capedge.com/proxy/20-F/0001217160-10-000141/keegan201020fannualreport006.jpg)
|
|
|
|
|
|
|
|
|

|
|
|
|
|
|
Cautionary Note to U.S. Investors Concerning Estimates of Indicated Mineral Resources. The disclosure below uses the term “indicated mineral resources”. We advise U.S. investors that while this term is recognized and, in certain circumstances, required by Canadian securities regulations (under National Instrument 43-101 - Standards of Disclosure for Mineral Projects, as adopted by the Canadian Securities Administrators), it is not recognized by the U.S. Securities and Exchange Commission. The estimation of “indicated mineral resources” involves greater uncertainty as to their economic feasibility than the estimation of proven and probable reserves. U.S. investors are cautioned not to assume that any part or all of the mineral deposits in this category will ever be converted into reserves. Cautionary Note to U.S. Investors Concerning Estimates of Inferred Mineral Resources. The disclosure below also uses the term “inferred mineral resources”. We advise U.S. investors that while this term is recognized and, in certain circumstances, required by Canadian securities regulations (under National Instrument 43-101 - Standards of Disclosure for Mineral Projects, as adopted by the Canadian Securities Administrators), it is not recognized by the U.S. Securities and Exchange Commission. The estimation of “inferred mineral resources” involves far greater uncertainty as to their existence, economic viability and legal feasibility than the estimation of other categories of resources. It cannot be assumed that all or any part of an inferred mineral resource will ever be upgraded to a higher category. Under Canadian securities legislation, estimates of inferred mineral resources may not form the basis of feasibility or pre-feasibility studies, or economic studies, except in rare cases. U.S. investors are cautioned not to assume that part or all of an inferred mineral resource exists, or is economically or legally mineable. |
28
Development and Exploration programs in progress
Keegan has completed additional post-Study metallurgical, geotechnical, and hydrological (in progress) drilling of the deposit on the Esaase Property. Keegan is also in the midst of an extensive exploration drill program, as well as undertake additional exploration to add to the existing resource estimates and convert additional resources to an indicated resources category. Drilling has and will be taking place both along strike of the existing resource, on subsidiary targets, internal to the existing resource as well as down dip. Keegan is also contemplating further acquisitions in the area.
The budget for fiscal 2011 exploration and development on the Esaase Property has a total budget of US$18,800,000 which consists of:
|
|
|
|
|
|
|
|
|
|
|
|
|
|
ITEM 4A
UNRESOLVED STAFF COMMENTS
| ITEM 4A | UNRESOLVED STAFF COMMENTS |
ITEM 5
OPERATING AND FINANCIAL REVIEW AND PROSPECTS
| ITEM 5 | OPERATING AND FINANCIAL REVIEW AND PROSPECTS |
29
30
$735,732 from the exercise of broker’s warrants.
Cash and cash equivalents increased by $24,711,254 from $2,001,118The Company may also consider other forms of project financing that may include but won’t be limited to, debt.
The other sources of funds potentially available to the Company are through the exercise of 237,333 broker warrants with an exercise price of $7.50 and of the outstanding 214,000 share purchase warrants at $3.10 per share which expire November 26, 2010 and stock options with terms as follows:
Exercise price | Number outstanding at June 25, 2010 | Expiry date | Number exercisable at June 25, 2010 | |
$1.16 | 120,000 | November 22, 2010 | 120,000 | |
$2,48 | 40,000 | February 2, 2011 | 40,000 | |
$2.44 | 387,909 | November 10, 2011 | 387,909 | |
$3.60 | 50,000 | October 17, 2012 | 50,000 | |
$4.20 | 550,000 | February 5, 2013 | 550,000 | |
$1.12 | 12,500 | January 15, 2014 | - | |
$3.31 | 170,000 | June 2, 2014 | 127,500 | |
$3.10 | 225,000 | July 2, 2014 | 140,625 | |
$3.10 | 75,000 | July 17, 2014 | 46,875 | |
$4.01 | 485,000 | October 6, 2014 | 242,500 | |
$6.50 | 220,000 | Dec 14, 2014 | 110,000 | |
$6.19 | 1,625,000 | May 26, 2014 | 406,250 | |
3,960,409 | 2,232,597 |
31
| Number outstanding at | Number exercisable at | ||
| Exercise price | March 31, 2011 | Expiry date | March 31, 2011 |
| $2.44 | 305,000 | November 10, 2011 | 305,000 |
| $3.60 | 25,000 | October 17, 2012 | 25,000 |
| $4.20 | 440,000 | February 5, 2013 | 440,000 |
| $1.12 | 12,500 | January 15, 2014 | 12,500 |
| $3.31 | 120,000 | June 2, 2014 | 120,000 |
| $3.10 | 225,000 | July 2, 2014 | 225,000 |
| $3.10 | 75,000 | July 17, 2014 | 75,000 |
| $4.01 | 416,250 | October 6, 2014 | 355,625 |
| $6.50 | 220,000 | December 14, 2014 | 192,500 |
| $6.19 | 1,505,000 | May 26, 2015 | 912,500 |
| $7.83 | 115,000 | October 20, 2015 | 43,125 |
| $9.00 | 225,000 | November 30, 2015 | 84,375 |
| $8.00 | 2,530,000 | March 17, 2016 | 632,500 |
| 6,213,750 | 3,423,125 | ||
Financing
Research and Development, Patents and Licenses, etc.
Trend Information
Off-Balance Sheet Arrangements
Tabular Disclosure of Contractual Obligations
On May 20, 2010, the Company negotiated the cancellation their existing lease commitment set to expire on November 30, 2013. In its place, the Company signed a letter of guarantee over the premises and transferred the lease plus an extension of the lease to May 31, 2015 to Universal Mineral Services Ltd. (“UMS”). The amount guaranteed are the monthly rent payments of $ 23,767 plus operating costs over the term of the lease.
UMS is a private company which Keegan acquired the sole common share on April 14, 2010. UMS has certain directors in common with the Company and was incorporated to provide geological, corporate development, administrative and management services to, and incur third party costs on behalf of, the Company, its subsidiaries and other publically listed mining companies on a full cost recovery basis pursuant to a service agreement.
To date, no service agreement has been signed and no related party balances with UMS are outstanding.
32
2011 | 68,140 | |
2012 | 68,140 | |
2013 | 68,140 | |
$ 204,420 |
| Payments due by period | |||||
| Contractual Obligations | Total | Less than 1 year | 1-3 years | 3-5 years | More than 5 years |
| $ | $ | $ | $ | $ | |
| Operating Lease Obligations | 2,451,182 | 586,088 | 1,770,354 | 94,740 | - |
| Total | 2,451,182 | 586,088 | 1,770,345 | 94,740 | - |
ITEM 6
DIRECTORS, SENIOR MANAGEMENT, AND EMPLOYEES
| ITEM 6 | DIRECTORS, SENIOR MANAGEMENT, AND EMPLOYEES |
Directors and Senior Management
Name | Position | Age |
|
Maurice Tagami | President, CEO & Director |
| April 16, 2010 |
Shawn Wallace | Director / Executive Chair |
| March 3, 2010 |
Marcel de Groot(1) | Director / Chair of Audit/Compensation/Nominating Committee |
| Oct 1, 2009 |
Keith Minty | Director / Chair of Technical Committee |
| Oct 1, 2009 |
Tony Ricci | Chief Financial Officer |
| November 21, 2005 |
Michael Bebek(2) Greg McCunn | Corporate Secretary Incoming Chief Financial Officer |
35 42 | December 1, 2005 April 4, 2011 |
Robert J. McLeod(1) | Director |
| February 3, 2005 |
Gordon J. Fretwell (1) | Director |
| February 24, 2004 |
Dan McCoy | Director / Chief Geologist |
| November 25, 2004 |
(1)
Member of Audit Committee
| (1) | Member of Audit Committee |
| (2) | Michael Bebek resigned as Corporate Secretary in August 2010. |
Position | From | Until |
Keegan Resources Inc., Executive Chair | March 2010 | Present |
623845BC Ltd., President | March 2001 | Present |
Hunter Dickenson Inc. | September 1989 | March 2001 |
Glenbriar Technologies Inc., Director | April 2003 | March 2004 |
Advanced Projects, Director | March 2000 | May 2001 |
Skye Resources Inc., Director | May 2001 | Jan 2002 |
|
| Present |
Cayden Resources Inc., Director | July 2009 | Present |
Full Metal Minerals Corp., Director Georgetown Capital Corp., Director | November 2009 February 2011 | Present Present |
33
Position | From | Until |
Keegan Resources Inc., President & CEO | July 2009 | Present |
Brett Resources Inc. Director | May 2008 | Present |
Kobex Resources Ltd., COO | February 2007 | June 2009 |
Self Employed Consultant | Jan 2006 | January 2007 |
Canico Resources Corp., Sr. Project Manager | May 2003 | December 2005 |
Self-Employed | September 2001 | April 2003 |
Eurozinc Mining Corp., Manager of Metallurgy | November 1999 | August 2001 |
Sutton Resources, Manager of Metallurgy | July 1996 | October 1999 |
Position | From | Until |
Independent Consultant | March 2004 | Present |
Underworld Resources Inc., Director | December 2006 | Present |
Luna Gold Corp., Director | June 2000 | Present |
Sandstorm Resources Ltd., Director | April 2008 | March 2009 |
Ashton Mining of Canada, Director | October 2006 | January 2007 |
Diamond Fields International, CFO | April 2003 | February 2004 |
Chalk Media Corp., Director | November 2003 | November 2004 |
Independent Consultant Keegan Resources Inc., Independent Director | October 1999 July 2009 | April 2003 Present |
34
Position | From | Until |
Placer Dome, Senior Geologist | January 1997 | November 2004 |
Keegan Resources Cayden Resouces Inc., Director Georgetown Capital Corp., Independent Director | November 2004 September 2010 February 2011 | Present Present Present |
Position | From | Until |
Self-employed consultant | 1994 | Present |
CFO and Director, Norsement Mining Inc. | August 2005 | October 2007 |
CFO, Director, Keegan Resources Inc. | November 2005 November 2005 |
April 2011 September 2007 |
CFO, Remstar Resources Ltd. | April 2006 | June 2010 |
CFO and Secretary Altair Ventures | January 2006 | Present |
CFO, Petaquilla Minerals Ltd. | November 2006 | January 2008 |
CFO, Mosam Capital Corp. | March 2006 | April 2008 |
Director, Milk Capital Corporation | December 2006 | Present |
CFO, Petaquilla Copper Ltd. | January 2007 | January 2008 |
CFO and Director, Lornex Capital Inc. | May 2008 | June 2010 |
President and Director Jantar Resources Ltd. | May 2008 | Present |
CFO, EmerGeo Solutions Inc. CEO and Director, Georgetown Capital Corp. | May 2008 February 2011 | Present Present |
Position | From | Until |
|
|
|
|
|
|
Keegan Resources Inc., |
|
|
| May 2011 | Present |
| Farallon Mining Ltd., CFO | June 2008 | January 2011 |
| Zincore Metals Inc., VP Project Development | June 2007 | June 2008 |
Hunter Dickinson Inc., Senior project Analyst and Engineer Placer Dome Ltd., Senior Analyst, Corporate Development Teck Resources |
March 2006 February 2004 January 2001 |
June 2007 March 2006 February 2004 |
35
Position | From | Until |
Miramar Mining Inc., Project Manager | January 2000 | January 2003 |
Atna Resources Inc., Vice President | January 2003 | January 2004 |
Keegan Resources Inc., Director | January 2004 | Present |
Full Metals Minerals Corp., VP Exploration and Director | June 2003 | Present |
Position | From | Until |
Keegan Resources Inc., Director | October 2009 | Present |
Thani Dubai Mining Ltd., COO | April 2008 | Present |
Star Gold Mines Inc., Director | May 2007 | April 2009 |
K. Minty & Associates, President | February 2003 | December 2007 |
China Diamond Corp., Director | March 2006 | September 2006 |
Crow Fight Resources, President & CEO | April 2003 | August 2003 |
Beartooth Platinum, President & CEO | August 2004 | April 2005 |
North American Palladium, President & CEO | December 1997 | February 2003 |
36
Compensation
Annual Compensation | ||||||
Payouts | ||||||
Name and | Year | Salary | Bonus | LTIP | All Other | Total Cash Compensation ($) |
Shawn Wallace | 2010 | 145,000 | Nil | Nil | Nil | 145,000 |
Maurice Tagami President & CEO | 2010 | 107,500 | Nil | Nil | Nil | 107,500 |
Daniel T. McCoy Director/ Chief Geologist | 2010 | 198,051 | 50,000 | Nil | 21,480 | 269,531 |
Tony M. Ricci CFO | 2010 | Nil | Nil | Nil | 98,410 | 98,410 |
Michael Bebek Corporate Secretary | 2010 | 81,585 | 15,000 | Nil | Nil | 96,585 |
Robert J. McLeod Director | 2010 | 11,650 | Nil | Nil | Nil | 11,650 |
Gordon J. Fretwell Director | 2010 | 11,650 | Nil | Nil | Nil | 11,650 |
Marcel de Groot Director | 2010 | 11,725 | Nil | Nil | Nil | 11,650 |
Keith Minty Director | 2010 | 9,300 | Nil l | Nil | Nil | 9,300 |
| Annual Compensation | ||||||
| Payouts | ||||||
Name and Principal Position | Year | Salary ($) | Bonus ($) | LTIP Pay-outs ($) | All Other Compensation ($) | Total Cash Compensation ($) |
Shawn Wallace Executive Chair | 2011 | 256,042 | 40,000 | Nil | Nil | 296,042 |
Maurice Tagami President & CEO | 2011 | 270,000 | 50,000 | Nil | Nil | 320,000 |
Daniel T. McCoy Director/ Chief Geologist | 2011 | Nil | Nil | Nil | 256,507 | 256,507 |
Tony M. Ricci CFO | 2011 | 93,750 | Nil | Nil | 15,850 | 109,600 |
Michael Bebek Corporate Secretary | 2011 | 60,000 | 5,000 | Nil | Nil | 65,000 |
Richard Haslinger VP | 2011 | 48,570 | 10,000 | Nil | Nil | 58,570 |
Andrea Zaradic VP | 2011 | 30,625 | Nil | Nil | Nil | 30,625 |
Robert J. McLeod Director | 2011 | 25,000 | Nil | Nil | Nil | 25,000 |
Gordon J. Fretwell Director | 2011 | 25,0000 | Nil | Nil | Nil | 25,000 |
Marcel de Groot Director | 2011 | 32,500 | Nil | Nil | Nil | 32,500 |
Keith Minty Director | 2011 | 30,000 | Nil l | Nil | Nil | 30,000 |
37
2011:
Name | Number of Options Held | % Of Total Options Granted | Exercise Price per Share | Grant Date | Expiration Date | Mkt. Value of Securities Underlying Options on Date of Grant |
Tony Ricci | 75,000 | 34% | $1.16 | 11/21/05 | 11/21/10 | $1.16 |
25,000 | 2% | $2.44 | 11/10/06 | 11/10/11 | $2.44 | |
30,000 | 3% | $4.20 | 02/05/08 | 02/05/13 | $4.20 | |
100,000 | 21% | $4.01 | 06/10/09 | 06/10/14 | $4.01 | |
Shawn Wallace | 150,000 | 17% | $4.20 | 02/05/08 | 02/05/13 | $4.20 |
50,000 | 29% | $3.31 | 02/06/09 | 02/06/14 | $3.31 | |
50,000 | 10% | $4.01 | 06/10/09 | 06/10/14 | $4.01 | |
Maurice Tagami | 150,000 | 50% | $3.10 | 02/07/10 | 02/07/14 | $3.10 |
50,000 | 10% | $4.01 | 06/10/09 | 06/10/14 | $4.01 | |
Dan McCoy | 32,909 | 18% | $2.44 | 11/10/06 | 11/10/11 | $2.44 |
75,000 | 8% | $4.20 | 02/05/08 | 02/05/13 | $4.20 | |
50,000 | 10% | $4.01 | 06/10/09 | 06/10/14 | $4.01 | |
Marcel de Groot | 75,000 | 25% | $3.10 | 02/07/10 | 02/07/14 | $3.10 |
25,000 | 5% | $4.01 | 06/10/09 | 06/10/14 | $4.01 | |
Keith Minty | 75,000 | 25% | $3.10 | 02/07/10 | 02/07/14 | $3.10 |
25,000 | 5% | $4.01 | 06/10/09 | 06/10/14 | $4.01 | |
Gordon Fretwell | 25,000 | 5% | $4.01 | 06/10/09 | 06/10/14 | $4.01 |
25,000 | 2% | $2.44 | 11/10/06 | 11/10/11 | $2.44 | |
20,000 | 2% | $4.20 | 02/05/08 | 02/05/13 | $4.20 | |
Rob Mcleod | 25,000 | 5% | $4.01 | 06/10/09 | 06/10/14 | $4.01 |
50,000 | 4% | $2.44 | 11/10/06 | 11/10/11 | $2.44 | |
20,000 | 2% | $4.20 | 02/05/08 | 02/05/13 | $4.20 | |
Michael Bebek | 50,000 | 4% | $2.44 | 11/10/06 | 11/10/11 | $2.44 |
50,000 | 5% | $4.20 | 02/05/08 | 02/05/13 | $4.20 | |
25,000 | 5% | $4.01 | 06/10/09 | 06/10/14 | $4.01 | |
38
Name | Number of Options Held | % Of Total Options Granted | Exercise Price per Share | Grant Date | Expiration Date | Mkt. Value of Securities Underlying Options on Date of Grant |
| Tony Ricci | 75,000 | 34% | $1.16 | 11/21/05 | 11/21/10 | $1.16 |
| 25,000 | 2% | $2.44 | 11/10/06 | 11/10/11 | $2.44 | |
| 30,000 | 3% | $4.20 | 02/05/08 | 02/05/13 | $4.20 | |
100,000 45,000 | 21% | 4.01 $6.19 | 06/10/09 05/26/10 | 06/10/14 05/16/2015 | $4.01 $6.19 | |
| Shawn Wallace | 150,000 | 17% | $4.20 | 02/05/08 | 02/05/13 | $4.20 |
| 50,000 | 29% | $3.31 | 02/06/09 | 02/06/14 | $3.31 | |
50,000 125,000 220,000 250,000 | 10% | $4.01 $6.19 $8.00 | 06/10/09 01/27/10 05/26/10 03/17/11 | 06/10/14 01/27/15 05/26/15 03/17/16 | $4.01 $6.19 $8.00 | |
| Maurice Tagami | 150,000 | 50% | $3.10 | 02/07/10 | 02/07/14 | $3.10 |
50,000 125,000 220,000 250,000 | 10% | $4.01 $6.19 $8.00 | 06/10/09 01/27/10 05/26/10 03/17/11 | 06/10/14 01/27/15 05/26/15 03/17/16 | $4.01 $6.19 $8.00 | |
| Dan McCoy | 32,909 | 18% | $2.44 | 11/10/06 | 11/10/11 | $2.44 |
| 75,000 | 8% | $4.20 | 02/05/08 | 02/05/13 | $4.20 | |
50,000 125,000 220,000 150,000 | 10% | $4.01 $6.19 $8.00 | 06/10/09 01/27/10 05/26/10 03/17/11 | 06/10/14 01/27/15 05/26/15 03/17/16 | $4.01 $6.19 $8.00 | |
| Marcel de Groot | 75,000 | 25% | $3.10 | 02/07/10 | 02/07/14 | $3.10 |
25,000 45,000 45,000 50,000 | 5% | $4.01 $6.19 $8.00 | 06/10/09 01/27/10 05/26/10 03/17/11 | 06/10/14 01/27/15 05/26/15 03/17/16 | $4.01 $6.19 $8.00 | |
| Keith Minty | 75,000 | 25% | $3.10 | 02/07/10 | 02/07/14 | $3.10 |
25,000 45,000 45,000 50,000 | 5% | $4.01 $6.19 $8.00 | 06/10/09 01/27/10 05/26/10 03/17/11 | 06/10/14 01/27/15 05/26/15 03/17/16 | $4.01 $6.19 $8.00 | |
| Gordon Fretwell | 25,000 | 5% | $4.01 | 06/10/09 | 06/10/14 | $4.01 |
| 25,000 | 2% | $2.44 | 11/10/06 | 11/10/11 | $2.44 | |
20,000 45,000 45,000 50,000 | 2% | $4.20 $6.19 $8.00 | 02/05/08 01/27/10 05/26/10 03/17/11 | 02/05/13 01/27/15 05/26/15 03/17/16 | $4.20 $6.19 $8.00 | |
| Rob Mcleod | 25,000 | 5% | $4.01 | 06/10/09 | 06/10/14 | $4.01 |
| 50,000 | 4% | $2.44 | 11/10/06 | 11/10/11 | $2.44 | |
20,000 45,000 45,000 50,000 | 2% | $4.20 $6.19 $8.00 | 02/05/08 01/27/10 05/26/10 03/17/11 | 02/05/13 01/27/15 05/26/15 03/17/16 | $4.20 $6.19 $8.00 | |
| Michael Bebek | 50,000 | 4% | $2.44 | 11/10/06 | 11/10/11 | $2.44 |
| 50,000 | 5% | $4.20 | 02/05/08 | 02/05/13 | $4.20 | |
25,000 50,000 45,000 | 5% | $4.01 $6.19 | 06/10/09 01/27/10 05/26/10 | 06/10/14 01/27/15 05/26/15 | $4.01 $6.19 |
During the fiscal 2010, Shawn Wallace exercised 225,00050,000 options at a price of $2.44 per share, 22,500 options at a price of $6.19 per share, 21,875 options at a price of $4.01 per share, and 50,000 options at a price of $4.20 per share.
During fiscal 2010,2011, Dan McCoy exercised 194,410 options at a price of $0.92 per share and 150,49341,598 options at a price of $2.44 per share, and 32,909 options at a price of $2.44 per share.
Board Practices
39
2011.
40
to the extent feasible, the responsibility to satisfy itself as to the integrity of the chief executive officer and other executive officers and that the chief executive officers and the other executive officers create a culture of integrity throughout the Company;
responsibility for the adoption of a strategic planning process and approval of a strategic plan;
responsibility for the identification of the principal risks of the Company’s business and ensuring the implementation of appropriate systems to manage these risks;
oversight over succession planning;
responsibility over appointing, monitoring, evaluating and, where necessary, terminating senior management;
responsibility for the implementation of a communication policy for the Company regarding disclosure of corporate information;
responsibility for the Company’s internal control and management information systems including accounting systems, and
responsibility over developing the Company’s approach to corporate governance, including developing a set of corporate governance principles and guidelines that are specifically applicable to the Company.
41
Employees
Share Ownership
Title of Class | Name of Beneficial Owner | Amount and Nature of Beneficial Ownership | Percent of Class |
Common | Shawn Wallace | 267,200 | 1% |
Common | Maurice Tagami | 200,000 | 1% |
Common | Daniel T. McCoy | 356,600 | 1% |
Common | Tony M. Ricci | 275,000 | * |
Common | Marcel Degroot | 100,000 | * |
Common | Robert J. McLeod | 164,500 | * |
Common | Gordon J. Fretwell | 121,300 | * |
Common | Keith Minty | 145,000 | * |
Common | Michael Bebek | 170,000 | * |
Total | 1,799,600 | 3.9 % |
Title of Class | Name of Beneficial Owner | Amount and Nature of Beneficial Ownership | Percent of Class |
| Common | Shawn Wallace | 720,000 | * |
| Common | Maurice Tagami | 670,000 | * |
| Common | Daniel T. McCoy | 495,600 | * |
| Common | Tony M. Ricci | 250,000 | * |
| Common | Marcel Degroot | 195,000 | * |
| Common | Robert J. McLeod | 190,000 | * |
| Common | Gordon J. Fretwell | 165,000 | * |
| Common | Keith Minty | 145,000 | * |
| Total | 2,830,600 | 3.8 % |
.
42
Report on Form 20-F for the year ended March 31, 2009, as filed with the SEC on July 1, 2009.
the number of Common Shares issuable to insiders as a group under the New2008 Option Plan, when combined with Common Shares issuable to insiders under all the Company’s other security based compensation plans, may not exceed 10% of the issued Common Shares within any 12 month period;
the number of Common Shares issuable to insiders as a group under the New2008 Option Plan, when combined with Common Shares issuable to insiders under all the Company’s other security based compensation plans, may not exceed 10% of the Company’s issued Common Shares at any time;
options to purchase Common Shares granted to any one Consultant within any 12 month period may not exceed 2% of the issued and outstanding Common Shares of the Company;
the number of Common Shares, in aggregate, issuable to all Employees conducting Investor Relations Activities, in any 12 month period, must not exceed 2% of the issued and outstanding Common Shares of the Company;
all options granted to Consultants performing Investor Relations Activities must vest in stages over 12 months with no more than 25% of the options vesting in any three month period;
no exercise price of an option granted to an insider may be reduced nor an extension to the term of an option granted to an insider extended without further approval of the disinterested shareholders of the Company; and
the maximum aggregate number of Common Shares issuable upon exercise of Options to non-employee directors must not exceed 1% of the total common shares of the Company outstanding at any time and no more than $100,000 in total award value per non-employee director on an annual calendar basis.
43
all options granted under the New2008 Option Plan are non-assignable and non-transferable and are issuable for a period of up to five years;
for stock options granted to employees or service providers (inclusive of management company employees), the Company must ensure that the proposed optionee is a bona fide employee or service provider (inclusive of management company employees), as the case may be, of the Company or any subsidiary;
if an optionee ceases to be employed by the Company (other than as a result of termination with cause), or ceased to provide services to the Company, or ceases to act as a director or officer of the Company or a subsidiary of the Company, any option held by such optionee may be exercised at the earlier of the date of expiration of the term of 90 days after the date such optionee ceases to be employed as an officer or director or, as the case may be;
if an optionee dies, any vested option held by him at the date of death will become exercisable by the optionee’s lawful personal representatives, heirs or executors until the earlier of one year after the date of death of such optionee and the date of expiration of the term otherwise applicable to such option;
in the case of an optionee being dismissed from employment or service for cause, such optionee’s options, whether or not vested at the date of dismissal, will immediately terminate without right to exercise same;
the minimum exercise price of an option granted under the New2008 Option Plan must not be less than the Market Price calculated the day before the grant (as defined in the New2008 Option Plan);
vesting of options shall be in accordance with the option commitment in the New2008 Option Plan or otherwise, at the discretion of the Board, and will generally be subject to: (i) the service provider remaining employed by or continuing to provide services to the Company or any of its affiliates as well as, at the discretion of the Board, achieving certain milestones which may be defined by the Board from time to time or receiving a satisfactory performance review by the Company or any of its affiliates during the vesting period; or (ii) the service provider remaining as a Director of the Company or any of its affiliates during the vesting period;
the maximum aggregate number of shares issuable upon exercise of options to non-employee directors must not exceed 1% of the total common shares of the Company outstanding at any time and no more than $100,000 in total award value per non-employee director on an annual calendar basis; and
the Board reserves the right in its absolute discretion to terminate the New2008 Option Plan with respect to all New2008 Option Plan shares in respect of Options which have not yet been granted under the New2008 Option Plan.
44
it may make amendments which are of a typographical, grammatical or clerical nature only;
it may change the vesting provisions of an option or the New2008 Option Plan;
it may change the termination provision of an option or the New2008 Option Plan which does not entail an extension beyond 5 years from the original expiry date of an option;
it may amend the expiry date of an option of non-Insider optionees which does not entail an extension beyond 5 years from the original date of grant;
it may add a cashless exercise feature payable in cash or shares to the New2008 Option Plan;
it may make amendments necessary as a result of changes in securities laws applicable to the Company;
if the Company becomes listed or quoted on a stock exchange or stock market senior to the TSX, it may make such amendments as may be required by the policies of such senior stock exchange or stock market; and
ITEM 7.
MAJOR SHAREHOLDERS AND RELATED PARTY TRANSACTIONS
| ITEM 7. | MAJOR SHAREHOLDERS AND RELATED PARTY TRANSACTIONS |
Major Shareholders
Related Party Transactions
During the year ended March 31, 2010 and to June 25, 2010, the
Included in professional fees is $Nil (2008 - $Nil; 2008 - $24,119) paid or accrued for legal fees tohas a consulting agreement with a company controlled by Gordon Fretwell, a director of the Company and $98,410 (2009 - $76,660; 2008 - $51,380) for accounting fees to Tony M. Ricci Inc., a private company controlled by Tony M. Ricci, CFO of the Company.
Included in consulting fees, wages and benefits is $Nil (2009 - $91,270; 2008 - $65,722) paid or accrued for consulting fees paid to Michael Bebek, the Company’s corporate secretary.
45
The Company entered into a consulting agreement with Dan McCoy, President and a director of the Company in the amount of US$12,000 17,500 per month plus benefits for the period up to May 1, 2009February 28, 2011 and US$ 17,5008,750 plus benefits there after. During the year ended March 31, 2010,2011, the Company paid consulting fees, benefits and benefitsa bonus of $269,531 (2009$306,507 (2010 - $211,632; 2008$269,531; 2009 - $183,258)$211,632) under this agreement.
These chargescosts have been included in resource properties.
Management believes that all of these transactions were on terms at least as favorable to Keegan as could have been obtained from unaffiliated third parties.
Accounting Fees
Keegan paid accounting fees of $98,410 (2009 - $76,660; 2008 - $51,380) to Tony M. Ricci, Inc., a company controlled by Tony M. Ricci, CFO of the Company.
Amounts Owing to Senior Management/Directors
As at March 31, 2010, there is $70,028 (March 31, 2009 - $61,939) owing senior management or members of the Board of Directors.
Interests of Experts and Counsel
ITEM 8.
FINANCIAL INFORMATION
| ITEM 8. | FINANCIAL INFORMATION |
Consolidated Statements and Other Financial Information
46
Legal Proceedings
Esaase Lawsuit
| Esaase Lawsuit |
Dividends
47
Significant Changes
ITEM 9.
THE OFFER AND LISTING
| ITEM 9. | THE OFFER AND LISTING |
Common Share Trading Information
Period | High | Low | |
Year Ended: | |||
March 31, 2010 | 7.98 | 2.25 | |
March 31, 2009 | 5.85 | 0.49 | |
March 31, 2008 | 5.49 | 2.22 | |
March 31, 2007 | 4.95 | 1.30 | |
March 31, 2006 | 2.75 | 1.51 | |
Quarter Ended: | |||
March 31, 2010 | 7.34 | 5.35 | |
December 31, 2009 | 7.98 | 3.65 | |
September 30, 2009 | 4.40 | 2.25 | |
June 30, 2009 | 4.39 | 2.25 | |
March 31, 2009 | 3.07 | 1.01 | |
December 31, 2008 | 1.99 | 0.49 | |
September 30, 2008 | 3.50 | 1.46 | |
June 30, 2008 | 5.85 | 3.12 | |
Month Ended: | |||
May 31, 2010 | 7.00 | 5.51 | |
April 30, 2010 | 6.82 | 6.07 | |
March 31, 2010 | 6.41 | 5.73 | |
February 28, 2010 | 6.56 | 5.35 | |
January 31, 2010 | 7.34 | 5.77 | |
December 31, 2009 | 7.75 | 6.20 | |
48
Period | High | Low |
Year Ended: March 31, 2011 | 9.29 | 4.92 |
| March 31, 2010 | 7.98 | 2.25 |
| March 31, 2009 | 5.85 | 0.49 |
| March 31, 2008 | 5.49 | 2.22 |
| March 31, 2007 | 4.95 | 1.30 |
| March 31, 2006 | 2.75 | 1.51 |
| Quarter Ended: | ||
March 31, 2011 December 31, 2010 September 30, 2010 June 30, 2010 March 31, 2010 | 9.03 9.29 8.70 7.00 7.34 | 7.25 7.16 4.92 5.30 5.35 |
| December 31, 2009 | 7.98 | 3.65 |
| September 30, 2009 | 4.40 | 2.25 |
| June 30, 2009 | 4.39 | 2.25 |
| Month Ended: | ||
| May 31, 2011 | 8.80 | 7.38 |
| April 30, 2011 | 9.24 | 8.25 |
| March 31, 2011 | 9.03 | 7.25 |
| February 28, 2011 | 7.77 | 7.30 |
| January 31, 2011 | 8.86 | 7.27 |
| December 31, 2010 | 9.29 | 8.63 |
12
Period | High | Low | |
Year Ended: | |||
March 31, 2010 | 7.57 | 1.76 | |
March 31, 2009 | 5.76 | 0.36 | |
March 31, 2008 | N/A | N/A | |
March 31, 2007 | N/A | N/A | |
March 31, 2006 | N/A | N/A | |
Quarter Ended: | |||
March 31, 2010 | 7.10 | 5.03 | |
December 31, 2009 | 7.57 | 3.36 | |
September 30, 2009 | 4.13 | 1.91 | |
June 30, 2009 | 4.00 | 1.76 | |
March 31, 2009 | 2.68 | 0.79 | |
December 31, 2008 | 1.89 | 0.36 | |
September 30, 2008 | 3.56 | 1.37 | |
June 30, 2008 | 5.76 | 3.18 | |
Month Ended: | |||
May 31, 2010 | 6.93 | 5.14 | |
April 30, 2010 | 6.78 | 5.98 | |
March 31, 2010 | 6.29 | 5.55 | |
February 28, 2010 | 6.17 | 5.03 | |
January 31, 2010 | 7.10 | 5.40 | |
December 31, 2009 | 7.42 | 5.89 | |
Period | High | Low |
| Year Ended: | ||
March 31, 2011 March 31, 2010 | 9.20 7.57 | 4.70 1.76 |
| March 31, 2009 | 5.76 | 0.36 |
| March 31, 2008 | N/A | N/A |
| March 31, 2007 | N/A | N/A |
| March 31, 2006 | N/A | N/A |
Quarter Ended: | ||
March 31, 2011 December 31, 2010 September 30, 2010 June 30, 2010 March 31, 2010 | 9.20 9.19 8.48 6.93 7.10 | 7.30 6.96 4.70 5.11 5.03 |
| December 31, 2009 | 7.57 | 3.36 |
| September 30, 2009 | 4.13 | 1.91 |
| June 30, 2009 | 4.00 | 1.76 |
| Month Ended: | ||
| May 31, 2011 | 9.24 | 7.60 |
| April 30, 2011 | 9.65 | 8.54 |
| March 31, 2011 | 9.20 | 7.32 |
| February 28, 2011 | 7.87 | 7.37 |
| January 31, 2011 | 9.00 | 7.30 |
| December 31, 2010 | 9.19 | 8.58 |
2011.
49
Effective Date of Issuance | Number of Share Purchase Warrants Currently Outstanding | Year #1 | Year #2 | Expiration Date of Share Purchase Warrants |
05/27/09 | 214,000 | $3.10 | $3.10 | 11/27/10 |
214,000 |
Effective Date of Issuance | Number of Share Purchase Warrants Currently Outstanding | Year #1 | Year #2 | Expiration Date of Share Purchase Warrants |
| February 17, 2013 | 284,050 | $7.50 | $7.50 | February 17, 2015 |
| 284,050 |
Effective Date
. The effective date of the Shareholder Rights Plan is September 1, 2006 (the “Effective Date”).Term
. The Shareholder Rights Plan will terminate on the sixth anniversary of the Effective Date, subject to ratification by the shareholders at the Meeting and to reconfirmation by shareholders at the third annual general meeting thereafter.Shareholder Approval.
For the Shareholder Rights Plan to continue in effect following the Meeting, the Shareholder Rights Plan Resolution must be approved by a majority of the votes cast at the Meeting by shareholders voting in person and by proxy.Issue of Rights.
On the Effective Date, one right (a “Right”) is issued and attached to each Common share outstanding and will attach to each Common share subsequently issued.Rights Exercise Privilege.
The Rights will separate from the Common shares and will be exercisable eight business days (or such later business day as may be determined by the board of directors) (the “Separation Time”) after a person has acquired, or commences or publicly announces or discloses its intention to commence a take-over bid to acquire, 20% or more of the Common shares, other than by an acquisition pursuant to a take-over bid permitted by the Shareholder Rights Plan (a “Permitted Bid”). The acquisition by any person (an “Acquiring Person”) of 20% or more of the Common shares, other than by way of a Permitted Bid, is referred to as a “Flip-in Event”. Any Rights held by an Acquiring Person will become void upon the occurrence of a Flip-in Event. From and after the Separation Time, each Right (other than those held by the Acquiring Person), will permit the purchase of CDN$100 worth of Common shares (at the market50
Certificates and Transferability
. Prior to the Separation Time, the Rights will be evidenced by a legend imprinted on certificates for Common shares issued from and after the Effective Date and will not be transferable separately from the Common shares. From and after the Separation Time, the Rights will be evidenced by Rights certificates which will be transferable and traded separately from the Common shares.(g)
the take-over bid must be made by way of a take-over bid circular;
the take-over bid must be made to all holders of Common shares;
the take-over bid must be outstanding for a minimum period of 60 days and Common shares tendered pursuant to the take-over bid may not be taken up and paid for prior to the expiry of such 60-day period and only if at such time more than 50% of the Common shares held by shareholders other than the bidder, its affiliates and persons acting jointly or in concert with the bidder (collectively, the “Independent Shareholders”) have been tendered to the take-over bid and not withdrawn;
the Common shares deposited pursuant to the take-over bid may be withdrawn until taken up and paid for; and
if more than 50% of the Common shares held by Independent Shareholders are tendered to the take-over bid within such 60-day period, then the bidder must make a public announcement of that fact and the take-over bid must remain open for deposits of Common shares for an additional 10 business days from the date of such public announcement.
Waiver and Redemption.
The board of directors may, prior to the Flip-in Event, waive the dilutive effects of the Shareholder Rights Plan in respect of a particular Flip-in Event resulting from a take-over bid made by way of a take-over bid circular to all holders of Common shares, or to waive one or more of the requirements of a Permitted Bid, or a Competing Permitted Bid, in which event such waiver would be deemed also to be a waiver in respect of any other Flip-in Event, and any such requirement, occurring under a take-over bid made by way of a take-over bid circular to all holders of Common shares. The board of directors may also waive the Shareholder Rights Plan in respect of a particular Flip-in Event that has occurred through inadvertence, provided that the Acquiring Person that inadvertently triggered such Flip-in Event reduces its beneficial holdings to less than 20% of the outstanding voting shares of the Company within 14 days or such later date as may be specified by the board of directors. With the majority consent of shareholders or Rights holders at any time prior to the later of a Flip-in Event and the Separation time, the board of directors may at its option redeem all, but not less than all, of the outstanding Rights at a price of CDN$0.00001 each.Exemptions for Investment Advisors
. Investment advisors (for client accounts), trust companies (acting in their capacities as trustees and administrators), statutory bodies managing investment funds (for employee benefit plans, pension plans, insurance plans or various public bodies) and administrators or trustees of registered pension funds or plans acquiring greater than 20% of the Common shares are exempted from triggering a Flip-in Event, provided that they are not making, or are not part of a group making, or proposing to make or participate in, or has not announced a current intention to make, a take-over bid.51
Exemptions for Lock-up Agreements.
A person is deemed not to be the beneficial owner of Common shares if the holder of such Common shares has agreed to deposit or tender its Common shares pursuant to a “Permitted Lock-up Agreement” to a take-over bid (the “Lock-up Bid”) made by such person. In order for an agreement to constitute a Permitted Lock-up Agreement, certain conditions must be met including, among other things, (i) any “break-up” fees payable by the tendering shareholder, cannot exceed in the aggregate the greater of the cash equivalent of 2.5% of the price or value of the consideration payable under the Lock-up Bid and 50% of the amount by which the price or value of the consideration payable under another take-over bid or transaction exceeds the price or value of the consideration that would have been received under the Lock-up Bid and (ii) the terms of such agreement are publicly disclosed and a copy of which is madeSupplements and Amendments.
The Company is authorized to make amendments to the Shareholder Rights Plan to correct any clerical or typographical error or to maintain the validity of the Shareholder Rights Plan as a result of changes in law, regulation or rules. Prior to the Meeting, the Company is authorized to amend or supplement the Shareholder Rights Plan as the board of directors may in good faith deem necessary or desirable. No such amendments have been made to date. The Company will issue a press release relating to any significant amendment made to the Shareholder Rights Plan prior to the Meeting and will advise the shareholders of any such amendment at the Meeting. Other amendments or supplements to the Shareholder Rights Plan may be made with the prior approval of shareholders or Rights holders.Statement on Form 20-F.
Markets
ITEM 10.
ADDITIONAL INFORMATION
| ITEM 10. | ADDITIONAL INFORMATION |
Share Capital
Memorandum and Articles of Association
Material Contracts
Exchange Controls
52
The Company does not believe the Investment Act will have any affect on it or on its non-Canadian shareholders due to a number of factors including the nature of its operations.
A The size and nature of a proposed transaction may give rise to an obligation to notify the Director to seek an advance ruling.
| (a) | first, if it was an investment to acquire control (within the meaning of the Investment Act) and the value of the Company’s assets, as determined under Investment Act regulations, was CDN$5 million or more; |
| (b) | second, if an order for review was made by the federal cabinet of the Canadian government on the grounds that the investment related to Canada’s cultural heritage or national identity (as prescribed under the Investment Act), regardless of asset value; |
| (c) | third, if an order for review was made by the federal cabinet of the Canadian government on the grounds that an investment by a non-Canadian could be injurious to national security, regardless of asset value. |
For a direct acquisition that would result in anacquirer. An acquisition of control for the purposes of the Company, subject to the exception for “WTO-investors” that are controlled by persons who are resident in World Trade Organization (“WTO”) member nations,Investment Act also could occur as a proposed investment would be reviewable where the valueresult of the acquired assets is $5 million or more, or if an order for review was madeacquisition by the federal cabinet on the grounds that the investment related to Canada’s cultural heritage or national identity, regardless of the value of the assets of the Company.
For a proposed indirect acquisition that would result in an acquisition of control of the Company through the acquisition of a non-Canadian parent entity, the investment would be reviewable where (a) the value of the Canadian assets acquired in the transaction is $50 millionall or more, or (b) the value of the Canadian assets is greater than 50% of the value ofsubstantially all of the assets acquiredCompany’s assets.
In the case of a direct acquisition by or from a “WTO investor”, the threshold is significantly higher, and is adjusted for inflation each year. The 2008 threshold is $295 million. Other than the exception noted below, an indirect acquisition involving a WTO investor is not reviewable under the Investment Act.
The higher WTO threshold for direct investments and the exemption for indirect investments do not apply where the relevant Canadian business is carrying on the following businesses that have been deemed to be sensitive: (i) the production of uranium and the ownership ofor own an interest in a producing uranium property in Canada; (ii)Canada, or provide any financial service or transportation service, as the provision of any “financial service”; (iii) the provision of any “transportation service”; or (iv) a “cultural business”.
rules governing these businesses are different.
(a)
acquisition of common shares of the Company by a person in the ordinary course of that person’s business as a trader or dealer in securities,
(b)
acquisition of control of the Company in connection with the realization of security granted for a loan or other financial assistance and not for a purpose related to the provisions on the Investment Act, and
53
(c)
acquisition of control of the Company by reason of an amalgamation, merger, consolidation or corporate reorganization following which the ultimate direct or indirect control in fact of the Company, through the ownership of common shares, remained unchanged.
including:
| (a) | an acquisition of common shares of the Company by a person in the ordinary course of that person’s business as a trader or dealer in securities, |
| (b) | an acquisition of control of the Company in connection with the realization of security granted for a loan or other financial assistance and not for a purpose related to the provisions on the Investment Act, and |
| (c) | an acquisition of control of the Company by reason of an amalgamation, merger, consolidation or corporate reorganization following which the ultimate direct or indirect control in fact of the Company, through the ownership of common shares, remained unchanged. |
Taxation
54
As long as
Furthermore, on March 4, 2010, the Department of Finance (Canada) announced in the 2010 Federal Budget that it is proposing to amend the definition of “taxable Canadian property”certain other circumstances specified in the Tax Act to exclude (unless otherwise deemed to be taxable Canadian property)Act.
Non-Resident Holders for whom the common shares may be considered or be deemed to be consideredas taxable Canadian property should consult their own tax advisors, including with respect to any relief that may be available under the provisions of the Tax Treaty, if applicable.
any applicable income tax treaty or convention.
CONSIDERATIONS
The following discussionconsequences to U.S. Holders of the acquisition, ownership, and disposition of common shares. Each U.S. Holder should consult its own tax advisor regarding the U.S. federal, U.S. federal alternative minimum, U.S. federal estate and gift, U.S. state and local, and foreign tax consequences relating to the acquisition, ownership and disposition of common shares.
| · | an individual who is a citizen or resident of the U.S.; |
| · | a corporation (or other entity taxable as a corporation for U.S. federal income tax purposes) organized under the laws of the U.S., any state thereof or the District of Columbia; |
| · | an estate whose income is subject to U.S. federal income taxation regardless of its source; or |
| · | a trust that (1) is subject to the primary supervision of a court within the U.S. and the control of one or more U.S. persons for all substantial decisions or (2) has a valid election in effect under applicable Treasury Regulations to be treated as a U.S. person. |
not a U.S. Holders
As used herein, a (“U.S. Holder”) includes a holder of common shares of the Company who is a citizen or resident of the United States, a corporation created or organized in or under the laws of the United States or of any political subdivision thereof, an estate whose income is taxable in the United States irrespective of source or a trust subject to the primary supervision of a court within the United States and control of a United States fiduciary as described in Section 7701(a)(30) of the Code.Holder. This summary does not address the U.S. federal income tax consequences to non-U.S. Holders arising from and relating to the acquisition, ownership, and disposition of common shares. Accordingly, a non-U.S. Holder should consult its own tax advisor regarding the U.S. Holderfederal, U.S. federal alternative minimum, U.S. federal estate and gift, U.S. state and local, and foreign tax consequences (including the potential application of and operation of any income tax treaties) relating to the acquisition, ownership, and disposition of common shares.
55
Distribution on Common Sharesmore of the Company
U.S. Holders receiving dividend distributions (including constructive dividends) with respect to common sharesgross income of the Company is passive income (the “income test”) or (b) 50% or more of the value of the Company’s assets either produce passive income or are required to include in grossheld for the production of passive income, for United States Federal income tax purposesbased on the gross amountquarterly average of such distributions equal to the U.S. dollarfair market value of such distributions onassets (the “asset test”). “Gross income” generally includes all sales revenues less the datecost of receipt (based ongoods sold, and “passive income” generally includes, for example, dividends, interest, certain rents and royalties, certain gains from the exchange rate onsale of stock and securities, and certain gains from commodities transactions.
In Deductions for capital losses are subject to significant limitations under the caseCode.
Dividendsloss, and generally will be U.S. source income or loss for foreign tax credit purposes. Each U.S. Holder should consult its own U.S. tax advisor regarding the U.S. federal income tax consequences of receiving, owning, and disposing of foreign currency.
foreign tax credit rules.
Foreign Tax Credit
For individuals whose entire income from sources outside the United States consists of qualified passive income, the total amount of creditable foreign taxes paid or accrued during the taxable year does not exceed $300 ($600IRS in the case of a joint return) and an election is made under section 904(j), the limitation on credit does not apply.
Atimely manner. Each U.S. Holder who pays (or has withheld from distributions) Canadian income tax with respect to the ownership of common shares of the Company may be entitled, at the option of the U.S. Holder, to either a deduction or a tax credit for such foreign tax paid or withheld. Generally, it will be more advantageous to claim a credit because a credit reduces United States Federal income taxes on a dollar-for-dollar basis, while a deduction merely reduces the taxpayer’s income subject to tax. This election is made on a year-by-year basis and applies to all foreign income taxes (or taxes in lieu of income tax) paid by (or withheld from) the U.S. Holder during the year. There are significant and complex limitations which apply to the credit, among which is the general limitation that the credit cannot exceed the proportionate share of the U.S. Holder’s United States income tax liability that the U.S. Holder’s foreign source income bears to h is/her orshould consult its worldwide taxable income in the determination of the application of this limitation. The various items of income and deduction must be classified into foreign and domestic sources. Complex rules govern this classification process. In addition, this limitation is calculated separately with respect to specific classes of income such as “passive income”, “high withholding tax interest”, “financial services income”, “shipping income”, and certain other classifications of income. Dividends distributed by the Company will generally constitute “passive income” or, in the case of certain U.S. Holders, “financial services income” for these purposes. The availability of the foreign tax credit and the application of the limitations on the credit are fact specific and management urges holders and prospective holders of common shares of the Company to consult their own tax advisorsadvisor regarding their individual circumstances.
56
Disposition of Common Shares of the Company
A U.S. Holder will recognize gain or loss upon the sale of common shares of the Company equal to the difference, if any, between (I) the amount of cash plus the fair market value of any property received,information reporting and (ii) the shareholder’s tax basis in the common shares of the Company. Preferential tax rates apply to long-term capital gains of U.S. Holders, which are individuals, estates or trusts. This gain or loss will be capital gain or loss if the common shares are capital assets in the hands of the U.S. Holder, which will be a short-term or long-term capital gain or loss depending upon the holding period of the U.S. Holder. Gains and losses are netted and combined according to special rules in arriving at the overall capital gain or loss for a particular tax year. Deductions for net capital losses are subject to significant limitations. For U.S. Holders, which are not corporations, any unused portion of such net capital loss may be carri ed over to be used in later tax years until such net capital loss is thereby exhausted, but individuals may not carry back capital losses. For U.S. Holders, which are corporations (other than corporations subject to Subchapter S of the Code), an unused net capital loss may be carried back three years from the loss year and carried forward five years from the loss year to be offset against capital gains until such net capital loss is thereby exhausted.
Other Considerations
In the following circumstances, the above sections of the discussion may not describe the United States Federal income tax consequences resulting from the holding and disposition of common shares of the Company.
Foreign Personal Holding Company
If at any time during a taxable year more than 50% of the total combined voting power or the total value of the Company’s outstanding shares is owned, actually or constructively, by five or fewer individuals who are citizens or residents of the United States and 60% (50% after the first tax year) or more of the Company’s gross income for such year was derived from certain passive sources (e.g. from interest income received from its subsidiaries), the Company would be treated as a “foreign personal holding company.” In that event, U.S. Holders that hold common shares of the Company would be required to include in gross income for such year their allocable portions of such passive income to the extent the Company does not actually distribute such income.
The Company does not believe that it currently has the status of a “foreign personal holding company”. However, there can be no assurance that the Company will not be considered a foreign personal holding company for the current or any future taxable year.
Foreign Investment Company
If 50% or more of the combined voting power or total value of the Company’s outstanding shares are held, actually or constructively, by citizens or residents of the United States, United States domestic partnerships or corporations, or estates or trusts other than foreign estates or trusts (as defined by the Code Section 7701(a)(31), and the Company is found to be engaged primarily in the business of investing, reinvesting, or trading in securities, commodities, or any interest therein, it is possible that the Company might be treated as a “foreign investment company” as defined in Section 1246 of the Code, causing all or part of any gain realized by a U.S. Holder selling or exchanging common shares of the Company to be treated as ordinary income rather than capital gains.
57
Passive Foreign Investment Company
As a foreign corporation with U.S. Holders, the Company could potentially be treated as a passive foreign investment company (“PFIC”), as defined in Section 1297 of the Code, depending upon the percentage of the Company’s income which is passive, or the percentage of the Company’s assets which is held for the purpose of producing passive income.
Certain United States income tax legislation contains rules governing PFICs, which can have significant tax effects on U.S. shareholders of foreign corporations. These rules do not apply to non-U.S. shareholders. Section 1297 (a) of the Code defines a PFIC as a corporation that is not formed in the United States and, for any taxable year, either (I) 75% or more of its gross income is “passive income”, which includes interest, dividends and certain rents and royalties or (ii) the average percentage, by fair market value (or, if the company is a controlled foreign corporation or makes an election, by adjusted tax basis), of its assets that produce or are held for the production of “passive income” is 50% or more. The taxation of a US shareholder who owns stock in a PFIC is extremely complex and is therefore beyond the scope of this discussion. Management urges US persons to consult with their own tax advisors with regards to the impact of these rules.
Controlled Foreign Corporation
A Controlled Foreign Corporation (CFC) is a foreign corporation more than 50% of whose stock by vote or value is, on any day in the corporation’s tax year, owned (directly or indirectly) by U.S. Shareholders. If more than 50% of the voting power of all classes of stock entitled to vote is owned, actually or constructively, by citizens or residents of the United States, United States domestic partnerships and corporations or estates or trusts other than foreign estates or trusts, each of whom own actually or constructively 10% or more of the total combined voting power of all classes of stock of the Company could be treated as a “controlled foreign corporation” under Subpart F of the Code. This classification would affect many complex results, one of which is the inclusion of certain income of a CFC, which is subject to current U.S. tax. The United States generally taxes United States Shareholders of a CFC currently on their pro rata shares of the Subpart F income of the CFC. Such United States Shareholders are generally treated as having received a current distribution out of the CFC’s Subpart F income and are also subject to current U.S. tax on their pro rata shares of the CFC’s earnings invested in U.S. property. The foreign tax credit described above may reduce the U.S. tax on these amounts. In addition, under Section 1248 of the Code, gain from the sale or exchange of shares by a U.S. Holder of common shares of the Corporation which is or was a United States Shareholder at any time during the five-year period ending with the sale or exchange is treated as ordinary income to the extent of earnings and profits of the Company (accumulated in corporate tax years beginning after 1962, but only while the shares were held and while the Company was “controlled”) attributable to the shares sold or exchanged. If a foreign corporation is both a PFIC and a CFC, the foreign corporation generally will not be treated as a PFIC with resp ect to the United States Shareholders of the CFC. This rule generally will be effective for taxable years of United States Shareholders beginning after 1997 and for taxable years of foreign corporations ending with or within such taxable years of United States Shareholders. The PFIC provisions continue to apply in the case of PFIC that is also a CFC with respect to the U.S. Holders that are less than 10% shareholders. Because of the complexity of Subpart F, a more detailed review of these rules is outside of the scope of this discussion.
The amount of any backup withholding will not constitute additional tax and will be allowed as a credit against the U.S. Holder’s federal income tax liability.
Filing of Information Returns. Under a number of circumstances, United States Investor acquiring shares of the Company may be required to file an information return with the Internal Revenue Service Center where they are required to file their tax returns with a duplicate copy to the Internal Revenue Service Center, Philadelphia, PA 19255. In particular, any United States Investor who becomes the owner, directly or indirectly, of 10% or more of the shares of the Company will be required to file such a return. Other filing requirements may apply, and management urges United States Investors to consult their own tax advisors concerning these requirements.
58
rules.
Dividends and paying Agents
Statement by Experts
Document on Display
ITEM 11
QUANTITATIVE AND QUALITATIVE DISCLOSURES ABOUT MARKET RISK
ITEM 11.A
Quantitative Information about Market Risk
www.SEDAR.com.
ITEM 11 Item 11.A | QUANTITATIVE AND QUALITATIVE DISCLOSURES ABOUT MARKET RISK Quantitative Information about Market Risk |
Credit risk
$244,880.
Liquidity risk
Market risk
Interest rate risk
59
Foreign currency risk
Cash and cash equivalents | March 31, 2010 | March 31, 2009 | |
US dollars | $ 11,689,000 | $ 159,991 | |
Ghana Cedis | 138,624 | 744,403 |
| March 31, 2011 | March 31, 2010 | |||||
| USD | Ghana Cedis | AUD | USD | Ghana Cedis | AUD | |
| Cash and cash equivalents | 62,188,642 | 337,577 | - | 11,873,686 | 99,172 | - |
| Accounts payable | (80,639) | (3,586,750) | (386,702) | (57,568) | (829,482) | (25,194) |
| Net exposure | 62,108,003 | (3,249,173) | (386,702) | 11,816,118 | (730,310) | (25,194) |
Qualitative Information about Market Risk
ITEM 12.
DESCRIPTION OF SECURITIES OTHER THAN EQUITY SECURITIES
| ITEM 12. | DESCRIPTION OF SECURITIES OTHER THAN EQUITY SECURITIES |
ITEM 13.
DEFAULTS, DIVIDEND ARREARAGES AND DELINQUENCIES
| ITEM 13. | DEFAULTS, DIVIDEND ARREARAGES AND DELINQUENCIES |
ITEM 14.
MATERIAL MODIFICATIONS TO THE RIGHTS OF SECURITY HOLDERS AND USE OF PROCEEDS
| ITEM 14. | MATERIAL MODIFICATIONS TO THE RIGHTS OF SECURITY HOLDERS AND USE OF PROCEEDS |
60
ITEM 15.
CONTROLS AND PROCEDURES
ITEM 15. CONTROLS AND PROCEDURES
2011.
61
Reporting.
Changes in internal control over financial reporting.
ITEM 16A.
AUDIT COMMITTEE FINANCIAL EXPERT
| ITEM 16A. | AUDIT COMMITTEE FINANCIAL EXPERT |
ITEM 16.B
CODE OF ETHICS
| ITEM 16.B | CODE OF ETHICS |
A copy of the Code is available on the Company’s corporate website atwww.keeganresources.com/s/ CorporateGovernance.asp.
62
ITEM 16C.
PRINCIPAL ACCOUNTING FEES AND SERVICES
| ITEM 16C. | PRINCIPAL ACCOUNTING FEES AND SERVICES |
Fiscal 2010 | Fiscal 2009 | |
Audit Fees(1) | $182,000(5) | $63,132 |
Audit Related Fees(2) | -- | 51,844 |
Tax Fees(3) | 3,000(5) | 2,912 |
All Other Fees(4) | -- | -- |
Totals | $185,000 | $114,344 |
(1)
“Audit Fees” include fees necessary to perform the annual audit and quarterly reviews of the Corporation’s consolidated financial statements. Audit Fees include fees for review of tax provisions and for accounting consultations on matters reflected in the financial statements. Audit Fees also include audit or other attest services required by legislation or regulation, such as comfort letters, consents, reviews of securities filings and statutory audits.
(2)
“Audit-Related Fees” include services that are traditionally performed by the auditor. These audit-related services include employee benefit audits, due diligence assistance, accounting consultations on proposed transactions, internal control reviews and audit or attest services not required by legislation or regulation.
(3)
“Tax Fees” include fees for all tax services other than those included in “Audit Fees” and “Audit-Related Fees”. This category includes fees for tax compliance, tax planning and tax advice. Tax planning and tax advice includes assistance with tax audits and appeals, tax advice related to mergers and acquisitions, and requests for rulings or technical advice from tax authorities.
(4)
“All Other Fees” include all other non-audit services.
(5)
Fees are only estimate and are unbilled as at the date of this 20-F Annual Report.
Fiscal 2011 | Fiscal 2010 | ||
Audit Fees (1) | $221,775 | $182,000 | |
Tax Fees (2) | $2,800 | 3,000 | |
| Totals | $224,575 | $185,000 | |
| (1) | “Audit Fees” include fees necessary to perform the annual audit and quarterly reviews of the Corporation’s consolidated financial statements. Audit Fees include fees for review of tax provisions and for accounting consultations on matters reflected in the financial statements. Audit Fees also include audit or other attest services required by legislation or regulation, such as comfort letters, consents, reviews of securities filings and statutory audits. |
| (2) | “Tax Fees” include fees for all tax services other than those included in “Audit Fees” and “Audit-Related Fees”. This category includes fees for tax compliance, tax planning and tax advice. Tax planning and tax advice includes assistance with tax audits and appeals, tax advice related to mergers and acquisitions, and requests for rulings or technical advice from tax authorities. |
ITEM 16D.
EXEMPTIONS FROM THE LISTING STANDARDS FOR AUDIT COMMITTEES
| ITEM 16D. | EXEMPTIONS FROM THE LISTING STANDARDS FOR AUDIT COMMITTEES |
ITEM 16E.
PURCHASES OF EQUITY SECURITIES BY KEEGAN/AFFILIATED PURCHASERS
| ITEM 16E. | PURCHASES OF EQUITY SECURITIES BY KEEGAN/AFFILIATED PURCHASERS |
ITEM 16F.
CHANGE IN REGISTRANTS CERTIFYING ACCOUNTANT
| ITEM 16F. | CHANGE IN REGISTRANTS CERTIFYING ACCOUNTANT |
ITEM 16G.
CORPORATE GOVERNANCE
| ITEM 16G. | CORPORATE GOVERNANCE |
63
ITEM 17.
FINANCIAL STATEMENTS
| ITEM 17. | FINANCIAL STATEMENTS |
ITEM 18.
FINANCIAL STATEMENTS
| ITEM 18. | FINANCIAL STATEMENTS |
ITEM 19.
EXHIBITS
|
|
|
|
|
|
|
|
|
|
|
|
|
|
|
|
|
|
|
|
|
|
|
|
|
|
|
|
|
|
|
|
|
|
|
|
|
|
(1)
Incorporated by reference from our Registration Statement on Form 20-F filed with the SEC on October 17, 2006.
(2)
Incorporated by reference from our Annual Report on Form 20-F filed with the SEC on September 30, 2008.
(3)
Incorporated by reference from our Annual Report on Form 20-F filed with the SEC on July 1, 2009.
64
![[keegan201020fannualreport008.jpg]](https://capedge.com/proxy/20-F/0001217160-10-000141/keegan201020fannualreport008.jpg)

_______________________
65
2009
2011.
| Greg McCunn” |
Vancouver, Canada June |
66
![[keegan201020fannualreport009.jpg]](https://capedge.com/proxy/20-F/0001217160-10-000141/keegan201020fannualreport009.jpg)
REPORT OF
 | Tel: 604 688 5421 Fax: 604 688 5132 www.bdo.ca | BDO Canada LLP 600 Cathedral Place 925 West Georgia Street Vancouver BC V6C 3L2 Canada |
AUDITOR’S REPORT
(“the Company”)
CONSOLIDATED FINANCIAL STATEMENTS
We conducted our audits in accordance with Canadian generally accepted auditing standards and the standards of the Public Company Accounting Oversight Board (United States). Those standards require that we plan and perform an audit to obtain reasonable assurance about whether the consolidated financial statements are free offrom material misstatement. Canadian generally accepted auditing standards require that we comply with ethical requirements.
statements.
| BDO Canada LLP, a Canadian limited liability partnership, is a member of BDO International Limited, a UK company limited by guarantee, and forms part of the international BDO network of independent member firms. |
INTERNAL CONTROLS OVER FINANCIAL REPORTING
67
We conducted our audit of internal control over financial reporting in accordance with the standards of the Public Company Accounting Oversight Board (United States). Those standards require that we plan and perform the audit to obtain reasonable assurance about whether effective internal control over financial reporting was maintained in all material respects.
audit opinion on the Company’s internal control over financial reporting.
A company’s internal control over financial reporting includes those policies and procedures that (i) pertain to the maintenance of records that, in reasonable detail, accurately and fairly reflect the transactions and dispositions of the assets of the company;Company; (ii) provide reasonable assurance that transactions are recorded as necessary to permit preparation of financial statements in accordance with generally accepted accounting principles, and that receipts and expenditures of the companyCompany are being made only in accordance with authorizations of management and directors of the company;Company; and (iii) provide reasonable assurance regarding prevention or timely detection of unauthorized acquisition, use, or disposition of the company’sCompany’s assets that could have a material effect on the financial statements.
(signed) “BDO Canada LLP”
2011
| KEEGAN RESOURCES INC. | |||||||||
(An Exploration Stage Company) | |||||||||
| Consolidated Balance Sheets | |||||||||
As at March 31, 2011 and 2010 | Expressed in Canadian Dollars | ||||||||
| 2011 | 2010 | ||||||||
| Assets | |||||||||
| Current assets: | |||||||||
| Cash and cash equivalents | $ | 229,144,989 | $ | 48,712,372 | |||||
| Receivables | 244,880 | 122,669 | |||||||
| Prepaid expenses and deposits | 146,084 | 257,561 | |||||||
| 229,535,953 | 49,092,602 | ||||||||
| Furniture, equipment and leasehold improvements (note 3) | 537,111 | 318,242 | |||||||
| Resource properties and deferred exploration costs (note 4) | 74,843,010 | 41,123,128 | |||||||
| $ | 304,916,074 | $ | 90,533,972 | ||||||
| Liabilities | |||||||||
| Current liabilities: | |||||||||
| Accounts payable and accrued liabilities (note 7) | $ | 5,076,974 | $ | 1,097,951 | |||||
| Non-current liabilities: | |||||||||
| Asset retirement obligations (note 5) | 4,762,009 | 49,860 | |||||||
| 9,838,983 | 1,147,811 | ||||||||
| Shareholders’ Equity | |||||||||
| Share capital (note 6) | 314,407,860 | 104,887,236 | |||||||
| Contributed surplus (note 6(e)) | 17,163,323 | 8,082,767 | |||||||
| Deficit accumulated | (36,494,092 | ) | (23,583,842 | ) | |||||
| 295,077,091 | 89,386,161 | ||||||||
| $ | 304,916,074 | $ | 90,533,972 | ||||||
| Commitments (note 9) | |||||||||
| Contingencies (note 10) | |||||||||
| Subsequent event (note 14) | |||||||||
| Approved by the Board of Directors: | |||||||||
| “Shawn Wallace” | “Marcel de Groot” | ||||||||
| Director | Director | ||||||||
| KEEGAN RESOURCES INC. | ||||||||||||
(An Exploration Stage Company) | ||||||||||||
| Consolidated Statements of Operations and Deficit | ||||||||||||
| Years ended March 31, 2011, 2010 and 2009 | Expressed in Canadian Dollars | |||||||||||
| 2011 | 2010 | 2009 | ||||||||||
| Administration expenses: | ||||||||||||
| Amortization | $ | 101,974 | $ | 64,634 | $ | 40,346 | ||||||
| Bank charges and interest | 36,232 | 19,054 | 25,287 | |||||||||
| Consulting fees, directors’ fees and | ||||||||||||
| wages and benefits (note 7) | 2,415,249 | 1,733,946 | 1,379,953 | |||||||||
| Donation expense | 82,000 | 488,200 | - | |||||||||
| Office, rent and administration | 754,874 | 579,594 | 411,322 | |||||||||
| Professional fees (note 7) | 437,970 | 453,499 | 448,308 | |||||||||
| Regulatory, transfer agent and shareholder | ||||||||||||
| information | 185,783 | 220,772 | 241,999 | |||||||||
| Stock-based compensation (note 6(c)) | 7,799,995 | 2,099,085 | 586,652 | |||||||||
| Travel, promotion and investor relations | 970,548 | 1,283,965 | 485,032 | |||||||||
| 12,784,625 | 6,942,749 | 3,618,899 | ||||||||||
| Other expenses (income): | ||||||||||||
| Interest and other income | (490,851 | ) | (114,994 | ) | (222,703 | ) | ||||||
| Foreign exchange loss | 609,194 | 117,960 | 608,492 | |||||||||
| Gain on sale of marketable securities | (215,666 | ) | - | - | ||||||||
| Mineral property evaluation costs | 222,948 | - | - | |||||||||
| Write-off of equipment | - | 26,971 | 1,112 | |||||||||
| Write-off of interest in resources properties (note 4(c)) | - | - | 170,596 | |||||||||
| 125,625 | 29,937 | 557,497 | ||||||||||
| Loss and comprehensive loss for the year | 12,910,250 | 6,972,686 | 4,176,396 | |||||||||
| Deficit accumulated, beginning of year | 23,583,842 | 16,611,156 | 12,434,760 | |||||||||
| Deficit accumulated, end of year | $ | 36,494,092 | $ | 23,583,842 | $ | 16,611,156 | ||||||
| Weighted average number of | ||||||||||||
| shares outstanding | 49,177,957 | 38,018,679 | 28,233,377 | |||||||||
| Loss per share - basic and diluted | $ | 0.26 | $ | 0.18 | $ | 0.15 | ||||||
BDO Canada LLP, a Canadian limited liability partnership, is a member of BDO International Limited, aUK company limited by guarantee, and forms part of the international BDO network ofindependent member firms
68
| KEEGAN RESOURCES INC. | ||||||||||||
(An Exploration Stage Company) | ||||||||||||
| Consolidated Statements of Cash Flows | ||||||||||||
Years ended March 31, 2011, 2010 and 2009 | Expressed in Canadian Dollars | |||||||||||
| 2011 | 2010 | 2009 | ||||||||||
| restated (note 2k) | restated (note 2k) | |||||||||||
| Cash provided by (used in): | ||||||||||||
| Operating activities: | ||||||||||||
| Net loss for the period | $ | (12,910,250 | ) | $ | (6,972,686 | ) | $ | (4,176,396 | ) | |||
| Items not involving cash: | ||||||||||||
| Amortization | 101,974 | 64,634 | 40,346 | |||||||||
| Gain on sale of marketable securities | (215,666 | ) | - | - | ||||||||
| Stock-based compensation | 7,799,995 | 2,099,085 | 586,652 | |||||||||
| Stock-based donation | - | 486,000 | - | |||||||||
| Unrealized foreign exchange loss | 252,610 | 223,087 | 173,484 | |||||||||
| Write-off of equipment | - | 27,639 | 1,112 | |||||||||
| Write-off of interest in resource properties | - | - | 170,596 | |||||||||
| Changes in non-cash working capital: | ||||||||||||
| Accounts payable and accrued liabilities | 1,116,591 | (6,793 | ) | 80,095 | ||||||||
| Prepaid expenses and deposits | 107,269 | (168,798 | ) | (33,905 | ) | |||||||
| Receivables | (122,211 | ) | (73,628 | ) | 87,109 | |||||||
| (3,869,688 | ) | (4,321,460 | ) | (3,070,907 | ) | |||||||
| Investing activities: | ||||||||||||
| Acquisition of interest in resource properties | (639,220 | ) | - | (237,161 | ) | |||||||
| Purchase of marketable securities | (145,921 | ) | - | - | ||||||||
| Proceeds from sale of marketable securities | 361,587 | - | - | |||||||||
| Purchase of buildings, furniture, equipment and | ||||||||||||
| leasehold improvements | (320,843 | ) | (214,751 | ) | (119,631 | ) | ||||||
| Deferred exploration costs | (21,238,903 | ) | (9,319,015 | ) | (10,901,528 | ) | ||||||
| (21,983,300 | ) | (9,533,766 | ) | (11,258,320 | ) | |||||||
| Financing activities: | ||||||||||||
| Common shares issued for cash, net of share | ||||||||||||
| issuance costs | 207,277,430 | 59,869,420 | 2,225,493 | |||||||||
| Impact of foreign exchange on cash and cash | ||||||||||||
| equivalents | (991,825 | ) | (302,940 | ) | (136,201 | ) | ||||||
| Increase (Decrease) in cash and cash equivalents | 180,432,617 | 45,711,254 | (12,239,935 | ) | ||||||||
| Cash and cash equivalents, beginning of year | 48,712,372 | 3,001,118 | 15,241,053 | |||||||||
| Cash and cash equivalents, end of year | $ | 229,144,989 | $ | 48,712,372 | $ | 3,001,118 | ||||||
| Supplemental disclosure of cash flow information: | ||||||||||||
| Cash paid for: | ||||||||||||
| Interest | $ | - | $ | - | $ | - | ||||||
| Income taxes | $ | - | $ | - | $ | - | ||||||
| Non-cash investing and financing activities: | ||||||||||||
| Mineral property costs included | ||||||||||||
| in accounts payable, change | $ | 3,191,794 | $ | 499,899 | $ | 148,872 | ||||||
| Stock-based compensation included in | ||||||||||||
| mineral properties | $ | 3,523,755 | $ | 839,198 | $ | 136,411 | ||||||
| Reclassification of contributed surplus on | ||||||||||||
| exercise of options and brokers’ warrants | ||||||||||||
| (note 6(e)) | $ | 2,895,789 | $ | 1,959,664 | $ | 381,249 | ||||||
| Warrants issued for services: | ||||||||||||
| Share issue costs | $ | 652,595 | $ | 523,924 | $ | - |
Consolidated Balance Sheets
| Consolidated Schedule of Resource Property Costs | ||||||||||||
Years ended March 31, 2011 and 2010 | Expressed in Canadian Dollars | |||||||||||
| Ghana | ||||||||||||
| Esaase | Asumura | Total | ||||||||||
| Balance, March 31, 2009 | $ | 24,388,371 | $ | 5,969,574 | $ | 30,357,945 | ||||||
| Acquisition costs: | ||||||||||||
| Cash and accrued | - | - | - | |||||||||
| Deferred exploration costs: | ||||||||||||
| Asset retirement obligation | 49,860 | - | 49,860 | |||||||||
| Camp operations | 330,840 | 46,509 | 377,349 | |||||||||
| Development support costs | 147,928 | - | 147,928 | |||||||||
| Equipment and infrastructure | 423,860 | 25,557 | 449,417 | |||||||||
| Engineering studies | 176,050 | - | 176,050 | |||||||||
| Exploration drilling | 4,043,602 | 43,877 | 4,087,479 | |||||||||
| Exploration support costs | 3,596,512 | 306,394 | 3,902,906 | |||||||||
Health, safety and environmental studies | 147,972 | - | 147,972 | |||||||||
| Stock-based compensation | 839,198 | - | 839,198 | |||||||||
| Technical and in-fill drilling | 587,024 | - | 587,024 | |||||||||
| 10,342,846 | 422,337 | 10,765,183 | ||||||||||
| Balance, March 31, 2010 | 34,731,217 | 6,391,911 | 41,123,128 | |||||||||
| Acquisition costs: | ||||||||||||
| Cashand accrued (note 4(a)) | 1,170,439 | - | 1,170,439 | |||||||||
Asset retirement obligation (note 5) | 5,126,210 | - | 5,126,210 | |||||||||
| Deferred exploration costs: | ||||||||||||
| Camp operations | 626,158 | 181,775 | 807,933 | |||||||||
| Development support costs | 1,896,792 | - | 1,896,792 | |||||||||
| Equipment and infrastructure | 1,242,037 | 29,429 | 1,271,466 | |||||||||
| Engineering studies | 2,034,473 | - | 2,034,473 | |||||||||
| Exploration drilling | 4,993,818 | 1,022,979 | 6,016,797 | |||||||||
| Exploration support costs | 4,754,896 | 296,187 | 5,051,083 | |||||||||
Health, safety and environmental studies | 1,199,552 | - | 1,199,552 | |||||||||
| Stock-based compensation | 3,523,755 | - | 3,523,755 | |||||||||
| Technical and in-fill drilling | 5,621,382 | - | 5,621,382 | |||||||||
| 31,019,073 | 1,530,370 | 32,549,443 | ||||||||||
| Balance, March 31, 2011 | $ | 66,920,729 | $ | 7,922,281 | $ | 74,843,010 | ||||||
As at March 31, 2010 and 2009
Expressed in Canadian Dollars
2010 | 2009 | |
Assets | ||
Current assets: | ||
Cash and cash equivalents | $ 26,712,372 | $ 2,001,118 |
Short-term investments (note 3) | 22,000,000 | 1,000,000 |
Receivables | 122,669 | 49,041 |
Prepaid expenses and deposits | 257,561 | 106,628 |
49,092,602 | 3,156,787 | |
Furniture, equipment and leasehold improvements (note 4) | 318,242 | 203,068 |
Resource properties and deferred exploration costs (note 5) | 41,123,128 | 30,357,945 |
$ 90,533,972 | $ 33,717,800 | |
Liabilities | ||
Current liabilities | ||
Accounts payable and accrued liabilities (note 7) | $ 1,147,811 | $ 652,656 |
Shareholders’ Equity | ||
Share capital (note 6) | 104,887,236 | 43,096,076 |
Contributed surplus (note 6(e)) | 8,082,767 | 6,580,224 |
Deficit accumulated | (23,583,842) | (16,611,156) |
89,386,161 | 33,065,144 | |
$ 90,533,972 | $ 33,717,800 |
Commitments (note 8)
Contingencies (note 10)
Subsequent events (notes 8 and 14)
| |
|
|
69
Consolidated Statements of Operations, Comprehensive Loss and Deficit
Years ended March 31, 2010, 2009 and 2008
Expressed in Canadian Dollars
2010 | 2009 | 2008 | |
Expenses: | |||
Amortization | $ 64,634 | $ 40,346 | $ 22,973 |
Bank charges and interest | 19,054 | 25,287 | 25,043 |
Consulting fees, directors’ fees and wages and benefits (note 7) | 1,733,946 | 1,379,953 | 912,756 |
Donation expense (note 6(b)) | 488,200 | - | - |
Office, rent and administration | 579,594 | 411,322 | 372,774 |
Professional fees (note 7) | 453,499 | 448,308 | 159,808 |
Regulatory, transfer agent and shareholder Information | 220,772 | 241,999 | 199,156 |
Stock-based compensation (note 6(c)) | 2,099,085 | 586,652 | 1,710,911 |
Travel, promotion and investor relations | 1,283,965 | 485,032 | 766,627 |
6,942,749 | 3,618,899 | 4,170,048 | |
Other expenses (income) | |||
Interest and other income | (114,994) | (222,703) | (476,034) |
Write-off of equipment | 26,971 | 1,112 | - |
Write-off of interest in resource properties (Note 5(b)) | - | 170,596 | - |
Foreign exchange loss | 117,960 | 608,492 | 622,028 |
29,937 | 557,497 | 145,994 | |
Loss and comprehensive loss for the year | 6,972,686 | 4,176,396 | 4,316,042 |
Deficit accumulated, beginning of year | 16,611,156 | 12,434,760 | 8,118,718 |
Deficit accumulated, end of year | $ 23,583,842 | $ 16,611,156 | $ 12,434,760 |
Loss per share - basic and diluted | $ 0.18 | $ 0.15 | $ 0.17 |
Weighted average number of shares outstanding | 38,018,679 | 28,233,377 | 24,605,326 |
SEE ACCOMPANYING NOTES
70
KEEGAN RESOURCES INC.
(An Exploration Stage Company)
Consolidated Statements of Cash Flows
Years ended March 31, 2010, 2009 and 2008
Expressed in Canadian Dollars
2010 | 2009 | 2008 | |
Cash provided by (used in): | |||
Operations: | |||
Loss for the year | $ (6,972,686) | $ (4,176,396) | $ (4,316,042) |
Items not involving cash: | |||
Amortization | 64,634 | 40,346 | 22,973 |
Stock based compensation | 2,099,085 | 586,652 | 1,710,911 |
Stock-based donations | 486,000 | - | - |
Unrealized foreign exchange | 223,087 | 173,484 | - |
Write-off of equipment | 27,639 | 1,112 | - |
Write-off of interest in resource properties | - | 170,596 | - |
Changes in non-cash working capital: | |||
Accounts payable and accrued liabilities | 43,067 | 80,095 | 296,781 |
Prepaid expenses and deposits | (168,798) | (33,905) | (17,993) |
Receivables | (73,628) | 87,109 | (79,157) |
(4,271,600) | (3,070,907) | (2,382,527) | |
Investing: | |||
Purchase of furniture, equipment and leasehold improvements | (214,751) | (119,631) | (110,459) |
Acquisition of interest in resource properties | - | (237,161) | (1,515,725) |
Short-term investments | (21,000,000) | (1,000,000) | - |
Deferred exploration | (9,368,875) | (10,901,528) | (9,861,207) |
(30,583,626) | (12,258,320) | (11,487,391) | |
Financing: | |||
Shares issued for cash, net of share issue costs | 59,869,420 | 2,225,493 | 14,954,456 |
59,869,420 | 2,225,493 | 14,954,456 | |
Impact of foreign exchange on cash and cash Equivalents | (302,940) | (136,201) | - |
Increase (decrease) in cash and cash equivalents | 24,711,254 | (13,239,935) | 1,084,538 |
Cash and cash equivalents, beginning of year | 2,001,118 | 15,241,053 | 14,156,515 |
Cash and cash equivalents, end of year | $ 26,712,372 | $ 2,001,118 | $ 15,241,053 |
Supplemental disclosure of cash flow information: | |||
Cash paid for: | |||
Interest | $ - | $ - | $ - |
Income taxes | - | - | - |
Non-cash investing and financing activities: | |||
Shares issued pursuant to resource property option agreement | - | - | 158,360 |
Change in Accounts payable related to Investing activities | 549,759 | 148,872 | - |
Reclassification of contributed surplus on exercise of options and brokers’ warrants (note 6(e)) | 1,959,664 | 381,249 | 296,181 |
Warrants issued for services: Share issue costs (note 6(b)) | 523,924 | - | 378,839 |
SEE ACCOMPANYING NOTES
71
KEEGAN RESOURCES INC.
(An Exploration Stage Company)
Consolidated Schedule of Resource Property Costs
Years ended March 31, 2010 and 2009
Expressed in Canadian Dollars
Ghana | |||
Esaase | Asumura | Total | |
Balance, March 31, 2008 | $ 14,508,394 | $ 4,596,175 | $ 19,104,569 |
Acquisition costs: | |||
Cash | 195,569 | 41,592 | 237,161 |
Deferred exploration costs: | |||
Assays | 654,647 | 213,257 | 867,904 |
Consulting | 515,622 | 86,278 | 601,900 |
Drilling | 6,212,649 | 480,600 | 6,693,249 |
Equipment and related costs | 581,870 | 188,397 | 770,267 |
Field supplies | 241,204 | 67,261 | 308,465 |
Geological fees and expenses | 146,845 | 10,678 | 157,523 |
Office and miscellaneous | 79,127 | 19,312 | 98,439 |
Property maintenance | (5,705) | - | (5,705) |
Stock-based compensation | 136,411 | - | 136,411 |
Travel and accommodation | 153,358 | 10,258 | 163,616 |
Wages and salaries | 968,380 | 426,362 | 1,394,742 |
9,684,408 | 1,502,403 | 11,186,811 | |
Less: write-off of property costs | - | (170,596) | (170,596) |
Balance, March 31, 2009 | 24,388,371 | 5,969,574 | 30,357,945 |
Acquisition costs: | |||
Cash | - | - | - |
Deferred exploration costs | |||
Assays | 935,740 | 29,880 | 965,620 |
Consulting | 178,467 | 35,197 | 213,664 |
Drilling | 4,630,626 | 43,877 | 4,674,503 |
Engineering | 471,950 | - | 471,950 |
Equipment and related costs | 423,860 | 25,557 | 449,417 |
Field supplies | 264,499 | 44,542 | 309,041 |
Geological fees and expenses | 271,944 | - | 271,944 |
Office and miscellaneous | 192,901 | 23,620 | 216,521 |
Property maintenance | 137,939 | 22,889 | 160,828 |
Stock-based compensation | 839,198 | - | 839,198 |
Travel and accommodation | 442,553 | 26,794 | 469,347 |
Wages and salaries | 1,553,169 | 169,981 | 1,723,150 |
10,342,846 | 422,337 | 10,765,183 | |
Balance, March 31, 2010 | $ 34,731,217 | $ 6,391,911 | $ 41,123,128 |
SEE ACCOMPANYING NOTES
72
KEEGAN RESOURCES INC.
(An Exploration Stage Company)
Expressed in Canadian Dollars
Nature of operations
and going concern
Significant accounting policies,
change in accounting policy, and recent accounting pronouncements
(a)
Basis of consolidation
| (a) | Basis of consolidation |
| Subsidiary name | Jurisdiction | Ownership | |||
| Keegan Resources Ghana Limited | Ghana | 90 | %(note 4(a)) | ||
| Keegan International (Barbados) Inc. | Barbados | 100 | % | ||
| Keegan Ghana (Barbados) Inc. | Barbados | 100 | % | ||
| Quicksilver Ventures (Nevada) Inc | Nevada, USA | 100 | % | ||
(b)
Financial instruments
i.
Financial assets and financial liabilities
The Company’s financial instruments are comprised of cash and cash equivalents, receivables and accounts payable and accrued liabilities. Financial instruments are measured and classified as follows:
•
Held-for-trading financial instruments are measured at fair value. All gains and losses resulting from changes in their fair value are included in net earnings (loss) in the period in which they arise. Cash and cash equivalents and short-term investments are classified as held-for-trading and are measured at fair value.
73
Expressed in Canadian Dollars
| 2. | Significant accounting policies, change in accounting policy, and recent accounting pronouncements (continued) |
2.
Significant accounting policies (continued)
Financial instruments (continued)
i.
Financial assets and financial liabilities (continued)
| i. | Financial assets and financial liabilities |
•
Held-to-maturity investments, loans and receivables, and other financial liabilities are initially measured at fair value and subsequently measured at amortized cost. Amortization of premiums or discounts and transaction costs are amortized into net earnings (loss), using the effective interest method less any impairment. Receivables are classified as loans and receivables and accounts payable and accrued liabilities are classified as other financial liabilities.
| The Company’s financial instruments are comprised of cash and cash equivalents, receivables and accounts payable and accrued liabilities. Financial instruments are measured and classified as follows: |
| · | Held-for-trading financial instruments are measured at fair value. All gains and losses resulting from changes in their fair value are included in net earnings (loss) in the period in which they arise. Cash and cash equivalents are classified as held-for-trading and are measured at fair value. |
| · | Held-to-maturity investments, loans and receivables, and other financial liabilities are initially measured at fair value and subsequently measured at amortized cost. Amortization of premiums or discounts and transaction costs are amortized into net earnings (loss), using the effective interest method less any impairment. Receivables are classified as loans and receivables and accounts payable and accrued liabilities are classified as other financial liabilities. |
| · | Available-for-sale financial assets are measured at fair value, with unrealized gains and losses recorded in other comprehensive income until the asset is realized, at which time they will be recorded in net earnings (loss). Other than temporary impairments on available-for-sale financial assets are recorded in net earnings (loss). |
| · | Derivatives embedded in other financial instruments or non-financial contracts (the “host instrument”) are treated as separate derivatives with fair value changes recognized in the statement of operations when their economic characteristics and risks are not clearly and closely related to those of the host instrument, and the combined instrument or contract is not held for trading. There were no embedded derivatives identified in a review of the Company’s contracts. Free-standing derivatives that meet the definition of an asset or liability are measured at their fair value and reported in the Company’s financial statements. |
•
Available-for-sale financial assets are measured at fair value, with unrealized gains and losses recorded in other comprehensive income until the asset is realized, at which time they will be recorded in net earnings (loss). Other than temporary impairments on available-for-sale financial assets are recorded in net earnings (loss).
•
Derivatives embedded in other financial instruments or non-financial contracts (the “host instrument”) are treated as separate derivatives with fair value changes recognized in the statement of operations when their economic characteristics and risks are not clearly and closely related to those of the host instrument, and the combined instrument or contract is not held for trading. There were no embedded derivatives identified in a review of the Company’s contracts. Free-standing derivatives that meet the definition of an asset or liability are measured at their fair value and reported in the Company’s financial statements.
Transaction Costs
Cash and cash equivalents
Furniture, equipment and leasehold improvements
Furniture, equipment and leasehold improvements are carried at cost less accumulated amortization. Amortization is determined at rates which will reduce original cost to estimated residual value over the useful life of each asset. The annual rates used to compute amortization are as follows:
Furniture, equipment and leasehold improvements are carried at cost less accumulated amortization. Amortization is determined at rates which will reduce original cost to estimated residual value over the useful life of each asset. The annual rates used to compute amortization are as follows: |
| Asset | Basis | Rate | ||
Furniture and equipment | declining balance |
| % | |
| Computers |
| declining balance |
| % |
Leasehold improvements |
| term of lease |
74
Expressed in Canadian Dollars
| 2. | Significant accounting policies, change in accounting policy, and recent accounting pronouncements (continued) |
2.
Significant accounting policies (continued)
Resource properties and deferred exploration costs
value.
Asset retirement obligations
| The fair value of a liability for an asset retirement obligation, such as site reclamation costs, is recognized in the period in which it is incurred if a reasonable estimate of fair value can be made. The Company is required to record the estimated present value of future cash flows associated with site reclamation as a liability when the liability is incurred and increase the carrying value of the related assets for that amount. The obligations recognized are statutory, contractual or legal obligations. The liability is accreted over time for changes in the fair value of the liability through charges to accretion, which is included in the statement of operations. The costs capitalized upon initial recognition of an obligation are amortized in a manner consistent with the depletion of the related asset. |
The fair value of a liability for an asset retirement obligation, such as site reclamation costs, is recognized in the period in which it is incurred if a reasonable estimate of fair value can be made. The Company is required to record the estimated present value of future cash flows associated with site reclamation as a liability when the liability is incurred and increase the carrying value of the related assets for that amount. The obligations recognized are statutory, contractual or legal obligations. The liability is accreted over time for changes in the fair value of the liability through charges to accretion, which is included in the statement of operations. The costs capitalized upon initial recognition of an obligation are amortized in a manner consistent with the depletion of the related asset.
75
| Comprehensive income consists of net loss and other comprehensive income (“OCI”). OCI represents changes in shareholders’ equity during a period arising from transactions and other events with non-owner sources. For the period covered by these financial statements comprehensive loss and net loss are the same. |
Expressed in Canadian Dollars
| 2. | Significant accounting policies, change in accounting policy, and recent accounting pronouncements (continued) |
2.
Significant accounting policies (continued)
(g)
Comprehensive loss
Comprehensive income consists of net loss and other comprehensive income (“OCI”). OCI represents changes in shareholders’ equity during a period arising from transactions and other events with non-owner sources. For the period covered by these financial statements comprehensive loss and net loss are the same.
Foreign currency translation
Loss Earnings per share
.
For the years ended March 31, 2010, 2009 and 2008, common equivalent shares (consisting of shares issuable on exercise of stock options and warrants), totaling 3,221,840, 5,194,410 and 9,347,565 respectively, were not included in the computation of diluted loss per share because the effect was anti-dilutive.
| For the years ended March 31, 2011, 2010 and 2009, common equivalent shares (consisting of shares issuable on exercise of stock options and warrants), totaling 6,497,800, 3,221,840, and 5,194,410 respectively, were not included in the computation of diluted loss per share because the effect was anti-dilutive. |
Stock-based compensation
| Under the fair value based method, stock-based payments to non-employees are measured at the fair value of the goods and/or services received, or the fair value of the equity instruments issued, or liabilities incurred, whichever is more reliably measurable. The fair value of stock-based payments to non-employees is periodically re-measured until counterparty performance is complete, and any change therein is recognized over the performance period of the award. The cost of stock-based payments to non-employees that are fully vested and non-forfeitable at the grant date is measured and recognized at that date. |
76
cash equivalents.
Expressed in Canadian Dollars
| 2. | Significant accounting policies, change in accounting policy, and recent accounting pronouncements (continued) |
2.
Significant
(k)
Adoption
The Companythese investments in the fact that they can be liquidated before maturity. This change in accounting policy has adopted the following new accounting standards issued by the Canadian Institute of Chartered Accountants (“CICA”).
i.
Credit riskbeen accounted for retroactively, and the fair valuecomparative consolidated balance sheets and consolidated statements of financial assetscash flows as at and financial liabilities
Emerging Issues Committee ("EIC") abstract 173,Credit Risk and the Fair Value of Financial Assets and Financial Liabilities ("EIC-173"), provides guidance on how to take into account an entity's own credit risk and the credit risk of the counter party in determining the fair value of financial assets and financial liabilities, including derivative instruments, for presentation and disclosure purposes. The application of EIC-173 did not result in a material impact on the Company's consolidated financial statements.
ii.
Goodwill and intangible assets
Canadian Institute of Chartered Accountants (“CICA”) Handbook Section 3064,Goodwill and Intangible Assets (“Section 3064”) replaces CICA Handbook Section 3062,Goodwill and Intangible Assets and establishes standards for the recognition, measurement and disclosure of goodwill and intangible assets. CICA Handbook Section 1000,Financial StatementConcepts is amended to clarify criteria for recognition of an asset. CICA Handbook Section 3450,Research and Development Costs is replaced by guidance in Section 3064. EIC 27Revenues and Expenditures During the Pre-Operating Period is no longer applicable for entities that have adopted Section 3064. A number of other EIC abstracts have consequential amendments. CICA Accounting Guideline 11Enterprises in the Development Stage is also amended to delete references to deferred costs and to provide guidance on development costs as intangible assets under CICA 3064. The adoption of this Section did not result in a material impact on the Company’s consolidated financial statements.
iii.
Mining exploration costs
EIC abstract 174,Mining Exploration Costs(“EIC-174”), which supersedes EIC abstract 126,Accounting by Mining Enterprises for Exploration Costs, provides guidance for mining exploration entities on the capitalization of exploration costs and the review of exploration costs for impairment. EIC-174 is applicable for the Company’s interim and annual consolidated financial statements for its fiscal year ending March 31, 2010, with retrospective application. The application of EIC-174 did not result in a material impact on the Company’s consolidated financial statements.
iv.
Financial instruments – disclosures
The CICA amended Handbook Section 3862 – “Financial Instruments – Disclosures” (“Section 3862”) to include additional disclosure requirements about fair value measurements of financial instruments and to enhance liquidity risk disclosure requirements for publicly accountable enterprises. The amendments have been incorporated into the Company’s consolidated financial statements for its fiscal year ended March 31, 2010.
77
KEEGAN RESOURCES INC.
(An Exploration Stage Company)
Notes to Consolidated Financial Statements, page 6
Years2010 have been restated. The effect of the change on the consolidated balance sheets as at March 31, 2010 is a decrease of the short-term investments by $22,000,000 and an increase in the cash and cash equivalents by the same amount. The effect of the change on the consolidated cash flows statements for the year ended March 31, 2010 2009 and 2008
Expressed in Canadian Dollars
2.
Significant accounting policies (continued)
(k)
Adoption of New Accounting Policies
v.
Financial instruments – recognition and measurement
The CICA amended Handbook Section 3855 – “Financial Instruments – Recognition and Measurement” (“Section 3855”). Section 3855 was amended to provide additional guidance concerning the assessment of embedded derivatives upon reclassification ofis a financial asset outdecrease of the held-for-trading category, amendcash used in investing activities by $21,000,000 (2009 - $1,000,000), an increase in cash and cash equivalents by the definitionsame amount, and an increase in the cash and cash equivalents, end of loans and receivables, amendyear by $22,000,000. The change in the categories of financial assets into which debt instruments are required or permitted to be classified, amend the impairment guidance for held-to-maturity debt instruments and require reversal of impairment losses on available-for-sale debt instruments when conditions have changed. The additional guidance on assessment of embedded derivatives is applicable for reclassifications made on or after July 1, 2009. All other amendments are applicable as of April 1, 2009. The adoption of these amendmentsaccounting policy did not result in a materialhave an impact on the Company’s consolidated financia l statements.
opening retained earnings.
Recent Accounting Pronouncements Issued But Not Yet Implemented
International financial reporting standards (“IFRS”)
In 2006, the Canadian Accounting Standards Board (“AcSB”) published a new strategic plan that will significantly affect financial reporting requirements for Canadian companies. The AcSB strategic plan outlines the convergence of Canadian GAAP with IFRS over an expected five year transitional period. In February 2008, the AcSB announced that 2011 is the changeover date for publicly accountable companies to use IFRS, replacing Canadian GAAP. This date is for interim and annual financial statements relating to fiscal years beginning on or after January 1, 2011. The transition date of April 1, 2011 will require the restatement for comparative purposes of amounts reported by the Company for the year ending March 31, 2011. In July 2008, the Canadian Securities Administrators announced that early adoption would be allowed in 2009 subject to seeking exemptive relief. While the Company has begun assessing the adoption of IFRS for 2011, th e financial reporting impact of the transition to IFRS has not been fully estimated at this time.
ii.
| CICA Handbook Section 1601, Consolidated Financial Statements, and Section 1602, Non-Controlling Interests, replace Section 1600, Consolidated Financial Statements. Section 1601 establishes standards for the preparation of consolidated financial statements. Section 1602 establishes standards for accounting for a non-controlling interest in a subsidiary in consolidated financial statements subsequent to a business combination. It is equivalent to the corresponding provisions of IFRS standard, International Accounting Standards (“IAS”) 27 (Revised), Consolidated and Separate Financial Statements. The sections apply to interim and annual consolidated financial statements relating to fiscal years beginning on or after January 1, 2011. Earlier adoption is permitted. The Company will adopt this standard on April 1, 2011. The Company is currently evaluating the impact of this new standard on its consolidated financial statements. |
CICA Handbook Section 1582, Business Combinations, replaces Section 1581 and establishes standards for the accounting for a business combination. It provides the Canadian equivalent to IFRS 3 - Business Combinations. This applies to a transaction in which the acquirer obtains control of one or more businesses. Most assets acquired and liabilities assumed, including contingent liabilities that are considered to be improbable, will be measured at fair value. Any interest in the acquiree owned prior to obtaining control will be remeasured at fair value at the acquisition date, eliminating the need for guidance on step acquisitions. Additionally, a bargain purchase will result in recognition of a gain and acquisition costs must be expensed. Earlier application is permitted. The Company will adopt this standard on April 1, 2011. The Company is currently evaluating the impact of the adoption of this new standard on its consolidated financial statements. |
CICA Handbook Section 1601,Consolidated Financial Statements,and Section 1602,Non-Controlling Interests, replace Section 1600,Consolidated Financial Statements. Section 1601 establishes standards for the preparation of consolidated financial statements. Section 1602 establishes standards for accounting for a non-controlling interest in a subsidiary in consolidated financial statements subsequent to a business combination. It is equivalent to the corresponding provisions of IFRS standard, International Accounting Standards (“IAS”) 27 (Revised),Consolidated and Separate Financial Statements. The sections apply to interim and annual consolidated financial statements relating to fiscal years beginning on or after January 1, 2011. Earlier adoption is permitted. The Company expects to adopt this standard on April 1, 2011.
| iii. | Financial instruments – recognition and measurement |
| CICA Handbook Section 3855 was amended in June 2010 to clarify the application of the effective interest rate method after a debt instrument has been impaired and when an embedded prepayment option is separated from its host debt instrument at initial recognition. The amendments are applicable for the Company’s interim and annual financial statements for its fiscal year beginning April 1, 2011 with earlier adoption permitted. The Company will adopt this standard on April 1, 2011 and does not expect a material impact on its consolidated financial statements. |
78
6
Expressed in Canadian Dollars
| 2. | Significant accounting policies, change in accounting policy, and recent accounting pronouncements (continued) |
2.
Significant accounting policies (continued)
Recent Accounting Pronouncements Issued But Not Yet Implemented
(continued)
iii.
Business combinations
CICA Handbook Section 1582,Business Combinations, replaces Section 1581 and establishes standards for the accounting for a business combination. It provides the Canadian equivalent to IFRS 3 -Business Combinations. This applies to a transaction in which the acquirer obtains control of one or more businesses. Most assets acquired and liabilities assumed, including contingent liabilities that are considered to be improbable, will be measured at fair value. Any interest in the acquiree owned prior to obtaining control will be remeasured at fair value at the acquisition date, eliminating the need for guidance on step acquisitions. Additionally, a bargain purchase will result in recognition of a gain and acquisition costs must be expensed. Earlier application is permitted. The Company expects to adopt this standard on April 1, 2011.
| iv. | International Financial Reporting Standards (“IFRS”) |
| In 2006, the Canadian Accounting Standards Board (“AcSB”) published a new strategic plan that will significantly affect financial reporting requirements for Canadian companies. The AcSB strategic plan outlines the convergence of Canadian GAAP with IFRS over a five-year transitional period. In February 2008, the CICA Accounting Standards Board confirmed that the changeover to IFRS from Canadian GAAP will be required for publicly accountable enterprises, effective for the interim and annual financial statements relating to fiscal years beginning on or after January 1, 2011. The transition date of April 1, 2011 will require the restatement for comparative purposes of amounts reported by the Company for the year ending March 31, 2011. The Company has assessed the impact of adopting IFRS on financial statement presentation and accounting policies selection and currently is in a process of preparation of the Company’s IFRS opening balance sheet and note disclosures. The Company’s IT, accounting and financial reporting systems are not expected to be significantly impacted. Further, the Company has in place internal and disclosure control procedures to ensure continued effectiveness during the transition period. |
Short-term Investments
As at March 31, 2010 and 2009, short-term investments consist of Guaranteed Investment Certificates (“GICs”) held at a Canadian brokerage firm. As at March 31, 2010 and 2009, the fair value of the short-term investments approximated their respective carrying values.
March 31, 2010 |
| ||
Maturity | Interest rate | Carrying value | |
December 13, 2010 | 0.60% | 22,000,000 | |
Short-term investments | $ 22,000,000 |
March 31, 2009 |
| ||
Maturity | Interest rate | Carrying value | |
May 28, 2009 | 3.15% | $ 1,000,000 | |
Short-term investments | $ 1,000,000 |
4.
Furniture, equipment and leasehold improvements
Accumulated | Net book | |||
March 31, 2010 | Cost | amortization | value | |
Furniture and equipment | 180,241 | 43,628 | 136,613 | |
Computers | 132,921 | 39,426 | 93,495 | |
Leasehold improvements | 113,875 | 25,751 | 88,134 | |
$ 427,037 | $ 108,795 | $ 318,242 |
| Accumulated | Net book | |||||||||||
| March 31, 2011 | Cost | amortization | value | |||||||||
| Furniture and equipment | 245,680 | 77,478 | 168,202 | |||||||||
| Computers | 300,509 | 91,025 | 209,484 | |||||||||
| Leasehold improvements | 201,691 | 42,266 | 159,425 | |||||||||
| $ | 747,880 | $ | 210,769 | $ | 537,111 | |||||||
79
| Accumulated | Net book | |||||||||||
| March 31, 2010 | Cost | amortization | value | |||||||||
| Furniture and equipment | 180,241 | 43,628 | 136,613 | |||||||||
| Computers | 132,921 | 39,426 | 93,495 | |||||||||
| Leasehold improvements | 113,875 | 25,741 | 88,134 | |||||||||
| $ | 427,037 | $ | 108,795 | $ | 318,242 | |||||||
| 4. | Resource properties and deferred exploration costs |
KEEGAN RESOURCES INC.
(An Exploration Stage Company)
Notes to Consolidated Financial Statements, page 8
Years ended March 31, 2010, 2009 and 2008
Expressed in Canadian Dollars
4.
Furniture, equipment and leasehold improvements (continued)
Accumulated | Net book | |||
March 31, 2009 | Cost | amortization | value | |
Furniture and equipment | $ 142,639 | $ 45,096 | $ 97,543 | |
Computers | 65,365 | 29,467 | 35,898 | |
Leasehold improvements | 83,933 | 14,306 | 69,627 | |
$ 291,937 | $ 88,869 | $ 203,068 |
5.
Resource properties and deferred exploration costs
(a)
Esaase Gold Property
On May 3, 2006, the Company entered into an option agreement with Sametro Co. Ltd. (“Sametro”) to purchase a 100% interest in the Esaase gold property in southwest Ghana, subject to the underlying 10% interest, 3% NSR of the Ghanaian government in all mining projects in Ghana, and a 0.5% NSR owed to the Bonte Liquidation Committee. Under the terms of the agreement, the Company was to make a series of cash payments totaling US$890,000, issue 780,000 common shares and incur minimum exploration expenditures of US$2,250,000 over a three year period.
During the year ended March 31, 2008, after having already made cash payments of US$500,000, issued 40,000 common shares and completed the full exploration expenditure requirement, the Company renegotiated the option agreement so that all further cash and share payments were no longer owed. In lieu of these payments, the Company paid $850,000 to a creditor of Sametro and issued 40,000 additional common shares to Sametro. Subsequent to these payments, the Company was granted the full Esaase Mining Lease by the Minerals Commission and Minister of Mines, Lands and Forestry with no further obligation to any party aside from the NSR and government commitments.
During the year ended March 31, 2008, the Company purchased 100% private ownership of the Jeni Concession mining lease and exploration rights. The Jeni Concession lies directly to the southwest and contiguous to the Esaase Gold property. In consideration for the acquisition of the mining lease, Keegan paid US$50,000 to the Bonte Liquidation Committee and US$50,000 to the Minerals Commission of Ghana for the title transfer. The Ghanaian government retains a standard 10% carried interest and 3% NSR and the Bonte Liquidation Committee retains a 0.5% NSR.
80
| (a) | Esaase Gold Property |
| On May 3, 2006,the Company entered into an option agreement with Sametro Co. Ltd. (“Sametro”) to purchase a 100% interest in the Esaase Gold property in the southwest part of the Republic of Ghana (“Ghana”), West Africa. The property is asubject to the underlying 10% interest and 5% royalty (see note 10(a))to the Ghanaian government and a 0.5% royalty payable to the Bonte Liquidation Committee. Under the terms of the agreement, the Company was to make a series of cash payments totaling US$890,000, issue 780,000 common shares and incur minimum exploration expenditures of US$2,250,000 over a three year period. |
| During the year ended March 31, 2008, after having already made cash payments of US$500,000, issued 40,000 common shares and completed the full exploration expenditure requirement, the Company renegotiated the option agreement so that all further cash and share payments were no longer owed. In lieu of these payments, the Company paid US$850,000 to a creditor of Sametro and issued 40,000 additional common shares to Sametro. |
| Subsequent to these payments, the Company was granted the full Esaase Mining Lease by the Minerals Commission and Minister of Mines, Lands and Forestry with no further obligation to any party aside from the NSR and government commitments. |
| During the year ended March 31, 2008, the Company purchased 100% private ownership of the Jeni Concession mining lease and exploration rights. The Jeni Concession lies directly to the southwest and contiguous to the Esaase Gold property. In consideration for the acquisition of the mining lease, Keegan paid US$50,000 to the Bonte Liquidation Committee and US$50,000 to the Minerals Commission of Ghana for the title transfer. The Ghanaian government retains a standard 10% carried interest and 3% royalty based on the existing mining lease and the Bonte Liquidation Committee retains a 0.5% royalty. |
| Subsequent to the granting of the Esaase and Jeni mining leases, the Ghanaian government amended the royalty scheme in Ghana to a 5% royal for all mining projects and uncertainty now exists as to the final royalty rate applicable to the property (see note 10(a)). |
During the year ended March 31, 2011, the Company made a payment of $ 591,660 (US$ 600,000) plus certain acquisition costs to acquire a 100% interest in the Dawohodo prospecting concession, an adjacent mineral concession to the Esaase Gold property. A further payment of US$500,000 is payable pursuant to the agreement. This payment was made subsequent to March 31, 2011. |
| Free carried interest to the Ghanaian government |
| Pursuant to the provisions of the Ghanaian statute, as at March 31, 2011,the Ghanaian government acquired, for zero proceeds, a 10% free carried interest in the rights and obligations of the mineral operations of the Esaase Gold Property through an interest in Keegan Resources Ghana Limited (“Keegan Ghana”).Keegan Ghanareserved 10% of its common shares for issuance to the Ghanaian government, and one government representative was appointed to the Board of Directors of Keegan Ghana. The Ghanaian government is entitled to 10% of declared dividends from the net profit of Keegan Ghana at the end of a financial year. |
| 4. | Resource properties and deferred exploration costs (continued) |
| (b) | Asumura Gold Project |
| The Company entered into an option agreement with GTE Ventures Limited (“GTE”) dated February 18, 2005 and subsequently amended, through which it acquired an undivided 100% private interest in the Asumura Reconnaissance Concession (“Asumura property”) located in Ghana. |
| The Asumura property is subject to a 3.5% royalty; 50% of which may be purchased for US$2,000,000 from GTE and the remaining 50% may be purchased for an additional US$4,000,000. If the property is converted to a Mining License, in accordance with Ghanaian law, it will become subject to a 5% royalty and 10% ownership by the Ghanaian government (see note 10(a)). |
| (c) | Write-off of interest in resources properties |
| During the years ended March 31, 2011 and 2010 no deferred acquisition and exploration costs related to resource properties were written-off. During the year ended March 31, 2009, the Company decided not to pursue its option agreement to earn a 100% ownership of a reconnaissance concession in Ghana (Mt. Olives concession) and as a result, $170,596 in acquisition and deferred exploration expenditures were written-off. |
| 5. | Asset retirement obligations |
| The asset retirement obligations provision relates to current and historical disturbance caused to the mineral concessions with in the area of interest of the Esaase Gold Property. Management has determined that these areas will be included as part of the project’s life-of-mine rehabilitation program. The estimated present value of future cash flows associated with this constructive obligation has been recorded as a non-current provision. |
| Esaase development project | Year ended | Year ended | ||||||
| March 31, 2011 | March 31, 2010 | |||||||
| Opening balance | $ | 49,860 | $ | - | ||||
| Additions | 4,712,149 | 49,860 | ||||||
| Closing Balance | $ | 4,762,009 | $ | 49,860 | ||||
| 2011 | 2010 | |||||||
| Undiscounted and uninflated estimated future cash obligation | $ | 8,186,463 | $ | 9,860 | ||||
| Expected term until settlement | 13 years | 1 year | ||||||
| Inflation rate | 2.49 | % | - | |||||
| Discount rate | 6.60 | % | - | |||||
| 6. | Share capital and contributed surplus |
Expressed in Canadian Dollars
5.
Resource properties
(b)
Asumura Gold Project
The Company entered into an option agreement with GTE Ventures Limited (“GTE”) dated February 18, 2005 and subsequently amended, through which it acquired an undivided 100% private interest in the Asumura Reconnaissance Concession (“Asumura property”) located in the Republic of Ghana, West Africa.
The Asumura property is subject to a 3.5% NSR royalty; 50% of which may be purchased for US$2,000,000 from GTE and the remaining 50% may be purchased for an additional US$4,000,000. If the property is converted to a Mining License, in accordance with Ghanaian law, it will become subject to a 3-6% NSR (3% is the standard amount) and 10% ownership by the Ghanaian government.
On March 27, 2008, the Company entered into an option agreement with Mt. Olives Goldfields, Ltd. (“Mt. Olives”) to earn a 100% ownership of the Mt. Olives Reconnaissance Concession located in Ghana. Under the option agreement, the Company was required to pay US$70,000 upon signing of the agreement and US$300,000 over a four year period. In addition, the Company will pay US$80,000 when the full interest is earned and title to the property is transferred in the Company’s name. Under the agreement, the Company was required to expend US$500,000 in work commitments over a four year period. During the year ended March 31, 2009, the Company decided not to pursue its option agreement on the Mt. Olives concession and as a result, $170,596 in acquisition and deferred exploration expenditures were written-off.
6.
Share capital
(a)
Authorized
Unlimited common shares without par value; and
100,000,000 preferred shares without par value
81
| (b) | Issued and outstanding common shares |
| Number of shares | Amount | ||
| Balance, March 31, 2008 | 27,467,648 | $ | 40,489,334 |
| Issued for cash: | |||
| Pursuant to the exercise of warrants | |||
| - at $2.40 | 623,000 | 1,495,200 | |
| - at $3.25 | 150,000 | 487,500 | |
| Pursuant to the exercise of options | |||
| - at $0.92 | 263,905 | 242,793 | |
| Transferred from contributed surplus for the exercise | |||
| of options and warrants | - | 1,959,664 | |
| Balance, March 31, 2009 | 28,504,553 | $ | 43,096,076 |
| Issued for cash: | |||
| Pursuant to private placements | |||
| - at $2.40 | 8,000,000 | 19,200,000 | |
| - at $5.90 | 7,015,000 | 41,388,500 | |
| Share issuance costs | - | (4,049,152 ) | |
| Pursuant to the exercise of warrants | |||
| - at $3.10 | 162,667 | 504,268 | |
| Pursuant to the exercise of options | |||
| - at $0.92 | 609,410 | 560,657 | |
| - at $1.12 | 50,000 | 56,000 | |
| - at $1.16 | 25,000 | 29,000 | |
| - at $2.44 | 475,493 | 1,160,203 | |
| - at $2.48 | 20,000 | 49,600 | |
| - at $3.38 | 19,000 | 64,220 | |
| - at $4.20 | 91,000 | 382,200 | |
| Transferred from contributed surplus for the exercise | |||
| of options and warrants | - | 1,959,664 | |
| Issued in donation | 75,000 | 486,000 | |
| Balance, March 31, 2010 | 45,047,123 | $ | 104,887,236 |
| Issued for cash: | |||
| Pursuant to a bought deal financing at $7.50 | 28,405,000 | 213,037,500 | |
| Share issuance costs, cash | - | (10,199,980) | |
| Share issuance costs, fair value of warrants | |||
| granted to underwriters | - | (652,595 ) | |
| Pursuant to the exercise of warrants | |||
| - at $3.10 | 237,333 | 735,732 | |
| Pursuant to the exercise of options | |||
| - at $1.12 | 37,500 | 42,000 | |
| - at $1.16 | 200,000 | 232,000 | |
| - at $2.44 | 349,507 | 852,797 | |
| - at $2.48 | 40,000 | 99,200 | |
| - at $3.31 | 50,000 | 165,500 | |
| - at $3.60 | 75,000 | 270,000 | |
| - at $4.01 | 65,625 | 263,156 | |
| - at $4.20 | 280,000 | 1,176,000 | |
| - at $6.19 | 97,500 | 603,525 | |
| Transferred from contributed surplus for the exercise | |||
| of options and warrants | - | 2,895,789 | |
| Balance, March 31, 2011 | 74,884,588 | $ | 314,407,860 |
Expressed in Canadian Dollars
Share capital (continued)
(b)
Issued and outstanding common shares
contributed surplus (continued)
Number of Shares | Amount | ||
Balance, March 31, 2007 | 22,808,178 | 25,459,176 | |
Issued on acquisition of resource properties | |||
- at $3.65 | 40,000 | 146,000 | |
- at $3.09 | 4,000 | 12,360 | |
Issued for cash | |||
Pursuant to a private placement | |||
- at $4.10 | 3,300,000 | 13,530,000 | |
Share issuance costs | - | (1,171,911) | |
Pursuant to the exercise of warrants | |||
- at $1.00 | 505,250 | 505,250 | |
- at $2.40 | 535,220 | 1,284,528 | |
- at $3.25 | 75,000 | 243,750 | |
Pursuant to the exercise of options | |||
- at $0.92 | 200,000 | 184,000 | |
Transferred from contributed surplus for the exercise of options and warrants | - | 296,181 | |
Balance, March 31, 2008 | 27,467,648 | 40,489,334 | |
Issued for cash: | |||
Pursuant to the exercise of warrants | |||
- at $2.40 | 623,000 | 1,495,200 | |
- at $3.25 | 150,000 | 487,500 | |
Pursuant to the exercise of options | |||
- at $0.92 | 263,905 | 242,793 | |
Transferred from contributed surplus for the exercise of options and warrants | - | 381,249 | |
Balance, March 31, 2009 | 28,504,553 | $ 43,096,076 | |
Issued for cash: | |||
Pursuant to private placements | |||
- at $2.40 | 8,000,000 | 19,200,000 | |
- at $5.90 | 7,015,000 | 41,388,500 | |
Share issuance costs | - | (4,049,152) | |
Pursuant to the exercise of warrants | |||
- at $3.10 | 162,667 | 504,268 | |
Pursuant to the exercise of options | |||
- at $0.92 | 609,410 | 560,657 | |
- at $1.12 | 50,000 | 56,000 | |
- at $1.16 | 25,000 | 29,000 | |
- at $2.44 | 475,493 | 1,160,203 | |
- at $2.48 | 20,000 | 49,600 | |
- at $3.38 | 19,000 | 64,220 | |
- at $4.20 | 91,000 | 382,200 | |
Transferred from contributed surplus for the exercise of options and warrants | - | 1,959,664 | |
Issued in donation | 75,000 | 486,000 | |
Balance, March 31, 2010 | 45,047,123 | $ 104,887,236 |
82
KEEGAN RESOURCES INC.
(An Exploration Stage Company)
Notes to Consolidated Financial Statements, page 11
Years ended March 31, 2010, 2009 and 2008
Expressed in Canadian Dollars
6.
Share capital (continued)
Issued and outstanding common shares (continued)
During the year ended March 31, 2010, the Company also completed a brokered private placement pursuant to an underwriting agreement dated May 8, 2009, under which the underwriters purchased an aggregate of 8,000,000 common shares of the Company at a price of $2.40 per common share for total gross proceeds of $19,200,000. Pursuant to the underwriting agreement, the Company paid a commission to the underwriters equivalent to 5% of the gross proceeds raised or $960,000 and incurred other issuance costs totaling $180,467. In addition, the Company issued 400,000 warrants to the underwriters which is equal to 5% of the total common shares sold. Each warrant will entitle the underwriters to purchase a common share of the Company at a price of $3.10 per share for a period of 18 months. The fair value of the warrants, $523,924, has been included in share issuance costs.
| During the year ended March 31, 2010, the Company also completed a brokered private placement pursuant to an underwriting agreement dated May 8, 2009,under which the underwriters purchased an aggregate of 8,000,000 common shares of the Company at a price of $2.40 per common share for total gross proceeds of $19,200,000. Pursuant to the underwriting agreement, the Company paid a commission to the underwriters equivalent to 5% of the gross proceeds raised or $960,000 and incurred other issuance costs totaling $180,467. In addition, the Company issued 400,000 warrants to the underwriters which is equal to 5% of the total common shares sold. Each warrant will entitle the underwriters to purchase a common share of the Company at a price of $3.10 per share for a period of 18 months. The fair value of the warrants, $523,924, has been included in share issuance costs. |
During the year ended March 31, 2008, the Company issued 40,000 shares with a fair value of $3.65 per share and 4,000 shares with a fair value of $3.09 per share pursuant to the Esaase property option agreement (note 5(a)). The shares issued on acquisition of resources properties fair value was determined by the trading price of the Company’s shares on the date they were issued.
During the year ended March 31, 2008, the Company completed a brokered private placement of 3,300,000 units of the Company at a price of $4.10 per unit for total gross proceeds of $13,530,000, pursuant to a letter of engagement with a syndicate of underwriters. Each unit consisted of one common share and one-half of one transferable common share purchase warrant of the Company. Each whole share purchase warrant shall be exercisable into one common share of the Company at a price of $5.25 per share for a period of 18 months expiring May 27, 2009. The underwriters received a cash commission of $793,072 plus 330,000 broker warrants having a fair value of $378,839 and exercisable at a price of $4.25 per broker warrant for a period of 18 months expiring May 27, 2009.
83
KEEGAN RESOURCES INC.
(An Exploration Stage Company)
Notes to Consolidated Financial Statements, page 12
Years ended March 31, 2010, 2009 and 2008
Expressed in Canadian Dollars
6.
Share capital (continued)
(b)
Issued and outstanding common shares (continued)
During the year ended March 31, 2008, an aggregate of 1,115,470 common shares were issued for gross proceeds of $2,033,528 on exercise of warrants and broker’s warrants. In addition, a reclassification of $180,477 from contributed surplus to share capital was recorded on the exercise of broker’s warrants.
During the year ended March 31, 2008, 200,000 common shares were issued for gross proceeds of $184,000 on exercise of options. In addition, a reclassification of $115,704 from contributed surplus to share capital was recorded on the exercise of these options.
Stock options
As summary of the status of options granted under the Company’s stock option plan for the three years ended March 31, 2010 is presented below:
Number of shares | Weighted average Exercise price | ||
Balance, March 31, 2007 | 2,072,315 | 1.75 | |
Granted | 1,026,000 | 4.14 | |
Exercised | (200,000) | 0.92 | |
Balance, March 31, 2008 | 3,528,315 | 2.49 | |
Granted | 100,000 | 1.12 | |
Exercised | (263,905) | 0.92 | |
Forfeited | (150,000) | 3.30 | |
Balance, March 31, 2009 | 3,214,410 | 2.54 | |
Granted | 1,175,000 | 4.14 | |
Exercised | (1,289,903) | 1.78 | |
Forfeited | (115,000) | 3.05 | |
Balance, March 31, 2010 | 2,984,507 | $ 3.48 |
84
KEEGAN RESOURCES INC.
(An Exploration Stage Company)
Notes to Consolidated Financial Statements, page 13
Years ended March 31, 2010, 2009 and 2008
Expressed in Canadian Dollars
6.
Share capital (continued)
(c)
Stock options (continued)
2011:
Exercise price | Number outstanding at March 31, 2010 | Expiry date | Number exercisable at March 31, 2010 | |
$1.16 | 195,000 | November 22, 2010 | 195,000 | |
$2,48 | 40,000 | February 2, 2011 | 40,000 | |
$2.44 | 679,507 | November 10, 2011 | 679,507 | |
$3.60 | 100,000 | October 17, 2012 | 100,000 | |
$4.20 | 745,000 | February 5, 2013 | 745,000 | |
$1.12 | 50,000 | January 15, 2014 | 37,500 | |
$3.31 | 170,000 | June 2, 2014 | 106,250 | |
$3.10 | 225,000 | July 2, 2014 | 112,500 | |
$3.10 | 75,000 | July 17, 2014 | 37,500 | |
$4.01 | 485,000 | October 6, 2014 | 181,875 | |
$6.50 | 220,000 | Dec 14, 2014 | 82,500 | |
2,984,507 | 2,317,632 |
| Number outstanding at | Number exercisable at | ||
| Exercise price | March 31, 2011 | Expiry date | March 31, 2011 |
| $2.44 | 305,000 | November 10, 2011 | 305,000 |
| $3.60 | 25,000 | October 17, 2012 | 25,000 |
| $4.20 | 440,000 | February 5, 2013 | 440,000 |
| $1.12 | 12,500 | January 15, 2014 | 12,500 |
| $3.31 | 120,000 | June 2, 2014 | 120,000 |
| $3.10 | 225,000 | July 2, 2014 | 225,000 |
| $3.10 | 75,000 | July 17, 2014 | 75,000 |
| $4.01 | 416,250 | October 6, 2014 | 355,625 |
| $6.50 | 220,000 | December 14, 2014 | 192,500 |
| $6.19 | 1,505,000 | May 26, 2015 | 912,500 |
| $7.83 | 115,000 | October 20, 2015 | 43,125 |
| $9.00 | 225,000 | November 30, 2015 | 84,375 |
| $8.00 | 2,530,000 | March 17, 2016 | 632,500 |
| 6,213,750 | 3,423,125 | ||
| Weighted average contractual life | |||
| remaining at March 31, 2011 (years) | 4.04 | 3.48 |
| (c) | Stock options (continued) |
| Number | Weighted average | |||||||
| of shares | Exercise price | |||||||
| Balance, March 31, 2008 | 3,533,315 | $ | 2.49 | |||||
| Granted | 100,000 | 1.12 | ||||||
| Exercised | (263,905 | ) | 0.92 | |||||
| Forfeited | (150,000 | ) | 3.30 | |||||
| Balance, March 31, 2009 | 3,219,410 | $ | 2.54 | |||||
| Granted | 1,175,000 | 4.14 | ||||||
| Exercised | (1,289,903 | ) | 1.78 | |||||
| Forfeited | (115,000 | ) | 3.05 | |||||
| Balance, March 31, 2010 | 2,989,507 | $ | 3.48 | |||||
| Granted | 4,495,000 | 7.39 | ||||||
| Exercised | (1,195,132 | ) | 3.10 | |||||
| Forfeited | (75,625 | ) | 4.20 | |||||
| Balance, March 31, 2011 | 6,213,750 | $ | 6.37 | |||||
$5.41.
2010 | 2009 | 2008 | ||
Risk-free interest rate | 2.35% | 1.48% | 3.18% | |
Expected dividend yield | 0% | 0% | 0% | |
Stock price volatility | 93% | 86% | 89% | |
Expected life of options | 3.71 years | 3.67 years | 4.23 years |
| 2011 | 2010 | 2009 | ||||||||||
| Risk free interest rate | 2.21 | % | 2.35 | % | 1.48 | % | ||||||
| Expected dividend yield | 0 | % | 0 | % | 0 | % | ||||||
| Stock price volatility | 88 | % | 93 | % | 86 | % | ||||||
| Expected life of options | 3.63 years | 3.71 years | 3.67 years | |||||||||
The weighted average fair value of options granted during the year ended March 31, 2010 was $3.28 (2009 - $0.70; 2008 - $2.92) per option.
| The weighted average fair value of options granted during year ended March 31, 2011 was $4.67 (2010 - $3.28, 2009 - $0.70) per option. |
| (d) | Warrants |
| The following warrants were outstanding at March 31, 2011. Each warrant entitles the holder to purchase one common share of the company as follows: |
(d)
Warrants
| Number outstanding at | Number exercisable at | |||
| Exercise price | March 31, 2011 | Expiry date | March 31, 2011 | |
| $ | 7.50 | 284,050 | February 17, 2013 | 284,050 |
| 284,050 | 284,050 |
The following warrants were outstanding at March 31, 2010. Each warrant entitles the holder to purchase one common share of the Company as follows:
Exercise price | Number outstanding at March 31, 2010 | Expiry date | Number exercisable at March 31, 2010 | |
$3.10 | 237,333 | November 26, 2010 | 237,333 | |
237,333 | 237,333 |
85
13
Expressed in Canadian Dollars
Share capital and contributed surplus (continued)
Warrants (continued)
Exercise price | Expiry date | March 31, 2010 | Issued | Exercised | Expired | March 31, 2011 | |||||||||||||||||
| $ | 7.50 | February17, 2013 | - | 284,050 | - | - | 284,050 | ||||||||||||||||
| $ | 3.10 | November 26, 2010 | 237,333 | - | (237,333 | ) | - | - | |||||||||||||||
| 237,333 | 284,050 | (237,333 | ) | - | 284,050 | ||||||||||||||||||
Exercise | Expiry date | March 31, | Issued | Exercised | Expired | March 31, | |
$ 4.25 | May 27, 2009 | 330,000 | - | - | (330,000) | - | |
$ 5.25 | May 27, 2009 | 1,650,000 | - | - | (1,650,000) | - | |
$ 3.10 | November 26, 2010 | - | 400,000 | (162,667) | - | 237,333 | |
1,980,000 | 400,000 | (162,667) | (1,980,000) | 237,333 |
| The fair value of $652,595 of the 284,050 brokers’ warrants issued during the year ended March 31, 2011 was included in share issuance costs (note 6 (b)). |
Exercise price | Expiry date | March 31, 2009 | Issued | Exercised | Expired | March 31, 2010 | |||||||||||||||||
| $ | 4.25 | May 27, 2009 | 330,000 | - | - | (330,000 | ) | - | |||||||||||||||
| $ | 5.25 | May 27, 2009 | 1,650,000 | - | - | (1,650,000 | ) | - | |||||||||||||||
| $ | 3.10 | November 26, 2010 | - | 400,000 | (162,667 | ) | - | 237,333 | |||||||||||||||
| 1,980,000 | 400,000 | (162,667 | ) | (1,980,000 | ) | 237,333 | |||||||||||||||||
| The fair value of $523,924 of the 400,000 brokers’ warrants issued during the year ended March 31, 2010 was included in share issuance costs (note 6 (b)). |
Exercise price | Expiry date | March 31, 2008 | Issued | Exercised | Expired | March 31, 2009 | |||||||||||||||||
| $ | 2.40 | May 16, 2007 | 630,500 | - | (623,000 | ) | (7,500 | ) | - | ||||||||||||||
| $ | 3.25 | February 16, 2009 | 3,208,750 | - | (150,000 | ) | (3,058,750 | ) | - | ||||||||||||||
| $ | 4.25 | May 27, 2009 | 330,000 | - | - | - | 330,000 | ||||||||||||||||
| $ | 5.25 | May 27, 2009 | 1,650,000 | - | - | - | 1,650,000 | ||||||||||||||||
| 5,819,250 | - | (773,000 | ) | (3,066,250 | ) | 1,980,000 | |||||||||||||||||
Exercise | Expiry date | March 31, | Issued | Exercised | Expired | March 31, | |
$ 2.40 | May 16, 2007 | 630,500 | - | (623,000) | (7,500) | - | |
$ 3.25 | February 16, 2009 | 3,208,750 | - | (150,000) | (3,058,750) | - | |
$ 4.25 | May 27, 2009 | 330,000 | - | - | - | 330,000 | |
$ 5.25 | May 27, 2009 | 1,650,000 | - | - | - | 1,650,000 | |
5,819,250 | - | (773,000) | (3,066,250) | 1,980,000 |
The continuity of share purchase warrants for the year ended March 31, 2008 is as follows:
Exercise | Expiry date | March 31, | Issued | Exercised | Expired | March 31, | |
$ 1.00 | October 13, 2007 | 505,250 | - | (505,250) | - | - | |
$ 2.40 | May 16, 2007 | 1,165,720 | - | (535,220) | - | 630,500 | |
$ 3.25 | Jan 19, 2008 | 3,283,750 | - | (75,000) | - | 3,208,750 | |
$ 4.25 | May 27, 2009 | - | 330,000 | - | - | 330,000 | |
$ 5.25 | May 27, 2009 | - | 1,650,000 | - | - | 1,650,000 | |
4,954,720 | 1,980,000 | (1,115,470) | - | 5,819,250 |
The fair value of $523,924 of the brokers’ warrants issued during the year ended March 31, 2010 (2009 - $nil; 2008 - $378,839) was included in share issuance costs.
| 2011 | 2010 | 2009 | ||||||||||
| Risk free interest rate | 1.79 | % | 0.97 | % | - | |||||||
| Expected dividend yield | 0 | % | 0 | % | - | |||||||
| Stock price volatility | 55 | % | 117.54 | % | - | |||||||
| Expected life of warrants | 2.0 years | 1.5 years | - | |||||||||
2010 | 2009 | 2008 | ||
Risk-free interest rate | 0.97% | - | 3.74% | |
Expected dividend yield | 0% | - | 0% | |
Stock price volatility | 117.54% | - | 66.4% | |
Expected life of warrants | 1.5 years | - | 1.5 years |
| The weighted average fair value of broker warrants granted during the year ended March 31, 2011 was approximately $2.30(2010 - $1.31) per broker warrant. |
The weighted average fair value of broker warrants granted during the year ended March 31, 2010 was $1.31 (2009 - $nil; 2008 - $1.33) per broker warrant.
86
14
Expressed in Canadian Dollars
Share capital and contributed surplus (continued)
Contributed surplus
2010 | 2009 | 2008 | ||
Balance, beginning of year | $ 6,580,224 | $ 6,238,410 | $ 3,801,353 | |
Stock-based compensation | 2,938,283 | 723,063 | 2,354,399 | |
Brokers’ warrants issued | 523,924 | - | 378,839 | |
Transferred to share capital for the exercise of options and brokers’ warrants | (1,959,664) | (381,249) | (296,181) | |
Balance, end of year | $ 8,082,767 | $ 6,580,224 | $ 6,238,410 |
| 2011 | 2010 | 2009 | ||||||||||
| Balance, beginning of year | $ | 8,082,767 | $ | 6,580,224 | $ | 6,238,410 | ||||||
| Stock-based compensation | 11,323,750 | 2,938,283 | 7,232,063 | |||||||||
| Brokers’ warrants issued | 652,595 | 523,924 | - | |||||||||
| Transferred to share capital for the exercise | ||||||||||||
| of options and brokers’ warrants | (2,895,789 | ) | (1,959,664 | ) | (381,249 | ) | ||||||
| Balance, end of year | $ | 17,163,323 | $ | 8,082,767 | $ | 6,580,224 | ||||||
Shareholder rights plan
Related party transactions
The Company has a consulting agreement with a director and officer of the Company in the amount of US$12,000
| The Company has a consulting agreement with a company controlled by a director of the Company in the amount of US$ 17,500 per month plus benefits up to February 28, 2011 and US$ 8,750 plus benefits |
| Included in consulting fees, wages and benefits is $nil (2010 - $nil; 2009 - $91,270) paid or accrued for consulting fees paid to an officer of the Company during the year ended March 31, 2011. |
| During the year ended March 31, 2011, the Company included in professional fees $15,850 (2010 - $98,410; 2009 - $76,660) for accounting fees paid or accrued to a company controlled by an officer of the Company. |
| During the year ended March 31, 2011, the Company paid or accrued $nil (2010 - $112,954, 2009 - $155,404) for geological consulting fees to a former director of the Company. These costs have been included in resource properties. |
| During the year ended March31, 2011, the Company billed $223,264 (2010 - $nil; 2009 - $nil) to companies with directors and officers in common in respect to recovery of general and administration costs |
| These transactions were conducted in the normal course of operations and were measured by the exchange amount, which is the amount agreed upon by the transacting parties. |
Included in consulting fees, wages and benefits is $nil (2009 - $91,270; 2008 - $65,722) paid or accrued for consulting fees paid to an officer of the Company during the year ended March 31, 2010.
Included in professional fees is $nil (2009 - $nil; 2008 - $24,119) paid or accrued for legal fees$70,028) owing to a company controlled by a director of the Company and $98,410 (2009 - $76,660; 2008 - $51,380) for accounting fees to a company controlled by an officer of the Company during the year ended March 31, 2010.
During the year ended March 31, 2010, the Company paid or accrued $112,954 (2009 - $155,404; 2008 - $125,138) for geological consulting fees to a director of the Company. These costs have been included in resource properties.
During the year ended March 31, 2010, the Company paid directors’ fees of $46,425 (2009 - 21,600; 2008 - $6,000) to certain directors and a former director of the Company.
These transactions were measured by the exchange amount, which is the amount agreed upon by the transacting parties.
Included in accounts payable and accrued liabilitiesreceivables as at March 31, 2011 is an aggregate amount of $25,598(2010 is $70,028 (March 31, 2009 - $61,939) owing to$nil) due from companies with directors of the Company and a company controlled by a director and officer of the Company.
87
officers in common.
| The Company has accumulated foreign resource deductions totaling $38,397,548 (2010 - $22,627,113) and non-capital losses of approximately $19,865,000 (2010 - $12,484,000) in Canada and $2,703,000 (2009 - $1,937,000) in Ghana for income tax purposes, which may be carried forward to reduce taxable income of future years. The non-capital losses expire as follows: |
| Ghana | Canada | Total | ||||||||||
| 2012 | 173,908 | - | 173,908 | |||||||||
| 2013 | 272,784 | - | 272,784 | |||||||||
| 2014 | 622,727 | 54,776 | 677,503 | |||||||||
| 2015 | 673,498 | 369,545 | 1,043,043 | |||||||||
| 2016 | 960,126 | - | 960,126 | |||||||||
| 2026 | - | 1,098,124 | 1,098,124 | |||||||||
| 2027 | - | 1,406,794 | 1,406,794 | |||||||||
| 2028 | - | 2,170,432 | 2,170,432 | |||||||||
| 2029 | - | 2,517,510 | 2,517,510 | |||||||||
| 2030 | - | 4,379,038 | 4,379,038 | |||||||||
| 2031 | - | 7,868,482 | 7,868,482 | |||||||||
| 2,703,043 | 19,864,701 | 22,567,744 | ||||||||||
| A reconciliation of the income tax provision computed at statutory rates to the reported income tax provision is: |
| 2011 | 2010 | 2009 | ||||||||||
| Average statutory tax rate | 28 | % | 29.63 | % | 30.38 | % | ||||||
| Loss before income taxes | $ | (12,910,000 | ) | $ | (6,973,000 | ) | $ | (4,176,000 | ) | |||
| Expected income tax recovery | (3,615,000 | ) | (2,066,000 | ) | (1,269,000 | ) | ||||||
| Increase (decrease) in income tax recovery resulting from: | ||||||||||||
Mineral exploration costs not deductible for tax | 2,619,000 | 1,838,000 | 245,000 | |||||||||
Stock based compensation | 2,184,000 | 622,000 | 178,000 | |||||||||
Other permanent differences | (38,000 | ) | 18,000 | 133,000 | ||||||||
Change in statutory rates | 44,000 | 311,000 | 172,000 | |||||||||
Share issuance costs | (2,550,000 | ) | (881,000 | ) | - | |||||||
| Other | (443,000 | ) | (214,000 | ) | - | |||||||
Increase in the valuation allowance | 1,799,000 | 372,000 | 541,000 | |||||||||
| Income tax recovery | $ | - | $ | - | $ | - | ||||||
Expressed in Canadian Dollars
Commitments
As at March 31, 2010, the Company has contractual comments with certain service providers in Ghana and Canada. The amounts due under these contracts and their payment terms are as follows:
2011 | 68,140 | |
2012 | 68,140 | |
2013 | 68,140 | |
$ 204,420 |
On May 20, 2010, the Company negotiated the cancellation of its existing lease commitment set to expire on November 30, 2013. In its place, the Company signed a letter of guarantee over the premises and transferred the lease plus an extension of the lease to May 31, 2015 to Universal Mineral Services Ltd. (“UMS”). The amount guaranteed are the monthly rent payments of $ 23,767 plus operating costs over the term of the lease.
UMS is a private company which Keegan acquired the sole common share on April 14, 2010. UMS has certain directors in common with the Company and was incorporated to provide geological, corporate development, administrative and management services to, and incur third party costs on behalf of, the Company, its subsidiaries and other publically listed mining companies on a full cost recovery basis pursuant to a service agreement.
To date, no service agreement has been signed and no related party balances are outstanding.
9.
Income taxes
The Company has accumulated foreign resource deductions totaling $22,627,113 (2009 - $25,367,002) and non-capital losses of approximately $12,484,000 (2009 - $7,674,000) in Canada and $1,937,000 (2009 - $1,483,000) in Ghana for income tax purposes, which may be carried forward to reduce taxable income of future years. The non-capital losses expire as follows:
Ghana | Canada | Total | ||
2010 | - | - | - | |
2011 | - | - | - | |
2012 | 193,268 | - | 193,268 | |
2013 | 303,150 | - | 303,150 | |
2014 | 692,048 | 54,776 | 746,824 | |
2015 | 748,471 | 369,545 | 1,118,016 | |
2026 | - | 1,098,124 | 1,098,124 | |
2027 | - | 1,406,794 | 1,406,794 | |
2028 | - | 2,170,432 | 2,170,432 | |
2029 | - | 2,517,510 | 2,517,510 | |
2030 | - | 4,867,037 | 4,867,037 | |
1,936,937 | 12,484,218 | 14,421,155 |
88
KEEGAN RESOURCES INC.
(An Exploration Stage Company)
Notes to Consolidated Financial Statements, page 17
Years ended March 31, 2010, 2009 and 2008
Expressed in Canadian Dollars
9.
Income taxes (continued)
A reconciliation of the income tax provision computed at statutory rates to the reported income tax provision is as follows:
2010 | 2009 | 2008 | ||
Average statutory tax rate | 29.63% | 30.38% | 31.9% | |
Loss before income taxes | $ (6,973,000) | $(4,176,000) | $(4,316,000) | |
Expected income tax recovery | (2,066,000) | (1,269,000) | (1,393,000) | |
Increase (decrease) in income tax recovery resulting from: | ||||
Mineral exploration costs not deductible for tax | 1,838,000 | 245,000 | 403,000 | |
Stock based compensation | 622,000 | 178,000 | 445,000 | |
Other permanent differences | 18,000 | 133,000 | 59,000 | |
Change in statutory rates | 311,000 | 172,000 | 226,000 | |
Share issuance costs | (881,000) | - | (206,000) | |
Other | (214,000) | - | - | |
Increase in the valuation allowance | 372,000 | 541,000 | 466,000 | |
Income tax recovery | $ - | $ - | $ - |
2010 | 2009 | 2008 | ||
Non-capital and capital losses | $ 3,814,000 | $ 2,570,000 | $ 1,690,000 | |
Foreign development and exploration expenditures | (2,768,000) | (1,283,000) | (1,038,000) | |
Share issuance costs | 834,000 | 240,000 | 349,000 | |
Capital assets | 43,000 | 24,000 | 11,000 | |
1,923,000 | 1,551,000 | 1,012,000 | ||
Less: valuation allowance | (1,923,000) | (1,551,000) | (1,012,000) | |
$ - | $ - | $ - |
| 2011 | 2010 | 2009 | ||||||||||
| Non-capital and capital losses | $ | 5,642,000 | $ | 3,814,000 | $ | 2,570,000 | ||||||
| Foreign development and exploration expenditures | (5,074,000 | ) | (2,768,000 | ) | (1,283,000 | ) | ||||||
| Share issuance costs | 2,608,000 | 834,000 | 240,000 | |||||||||
| Unrealized foreign exchange loss | 497,000 | - | - | |||||||||
| Furniture, equipment and leasehold improvements | 49,000 | 43,000 | 24,000 | |||||||||
| 3,722,000 | 1,923,000 | 1,551,000 | ||||||||||
| Less: valuation allowance | (3,722,000 | ) | (1,923,000 | ) | (1,551,000 | ) | ||||||
| $ | - | $ | - | $ | - | |||||||
| The Company has recorded a valuation allowance against its future income tax assets as it was determined that under current conditions it is not more like-than-not that these future tax benefits in Canada and Ghana will be realized. |
| As at March 31, 2011, the Company has contractual commitments with certain service providers in Ghana and Canada. The amounts due under these contracts and their payment terms are as follows: |
| 2012 | $ | 586,088 | ||
| 2013 | 633,478 | |||
| 2014 | 568,438 | |||
| 2015 | 568,438 | |||
| 2016 | 94,740 | |||
| $ | 2,451,182 |
10.
Contingencies
Keegan Resources Ghana Ltd. was named jointly with the Ghana Minerals Commission as a co-defendant in a legal suit by the company that had originally optioned the Esaase goldGold property to the Company. The Plaintiff is alleging certain irregularities in connection with the closing of the option resulting in Keegan Ghana’s acquisition of the Esaase gold property and the issuing of the requisite regulatory approvals under Ghanaian Law. Keegan Ghana has refuted the allegations on grounds that it had at all material times acted legally and in good faith and has therefore filed a defense and counter-claim against the Plaintiff. The Company is of the view after discussion with Ghanaian Counsel that the allegations are totally without legal merit and will be vigorously defended. The Ghana Minerals Commission has also denied the allegations and filed a defense to the suit. The Comp any’sCompany’s potential liability for damages, if any, is currently not determinable.
89
Geographic Information |
| The Company operates in one reportable operating segment, being the exploration and development of resource properties. |
| March 31, 2011 | Canada | Ghana | Total | |||||||||
| Furniture, equipment and leasehold improvements | $ | 417,261 | $ | 119,850 | $ | 537,111 | ||||||
| Resource properties and deferred exploration costs | - | 74,843,010 | 74,843,010 | |||||||||
| $ | 417,261 | $ | 74,962,860 | $ | 75,380,121 | |||||||
| March 31, 2010 | Canada | Ghana | Total | |||||||||
| Furniture, equipment and leasehold improvements | $ | 218,388 | $ | 99,854 | $ | 318,242 | ||||||
| Resource properties and deferred exploration costs | - | 41,123,128 | 41,123,128 | |||||||||
| $ | 218,388 | $ | 41,222,982 | $ | 41,441,370 | |||||||
Expressed in Canadian Dollars
11.
Segmented information
Geographic Information
The Company operates in one reportable operating segment, being the exploration and development of resource properties.
Canada | Ghana | Total | ||
2010 | ||||
Furniture, equipment and leasehold improvements | $ 218,388 | $ 99,854 | $ 318,242 | |
Resource properties and deferred exploration costs | - | 41,123,128 | 41,123,128 | |
$ 218,388 | $ 41,222,982 | $ 41,441,370 |
Canada | Ghana | Total | ||
2009 | ||||
Furniture, equipment and leasehold improvements | $ 159,534 | $ 43,534 | $ 203,068 | |
Resource properties and deferred exploration costs | - | 30,357,945 | 30,357,945 | |
$ 159,534 | $ 30,401,479 | $ 30,561,013 |
Financial instruments
Level 1 – fair values based on unadjusted quoted prices in active markets for identical assets or liabilities;
Level 2 – fair values based on inputs that are observable for the asset or liability, either directly or indirectly; and
Level 3 – fair values based on inputs for the asset or liability that are not based on observable market data.
The fair value of these financial instruments approximates their carrying value, unless otherwise noted.
| ||||
Level 1 |
|
| ||
|
|
|
| |
|
|
|
| |
|
|
|
90
KEEGAN RESOURCES INC.
(An Exploration Stage Company)
Notes to Consolidated Financial Statements, page 19
Years ended March 31, 2010, 2009 and 2008
Expressed in Canadian Dollars
12.
Financial instruments (continued)
| Level 2 – fair values based on inputs that are observable for the asset or liability, either directly or indirectly; and |
|
| Level 3 – fair values based on inputs for the asset or liability that are not based on observable market data. |
| The fair value of these financial instruments approximates their carrying value, unless otherwise noted. |
| March 31, 2011 | ||||||||||
| Category | Carrying Value | Amount | Fair value hierarchy Level 1 | |||||||
| Financial Assets | ||||||||||
| Cash and cash equivalents | Held-for-trading | Fair value | $ | 229,144,989 | $ | 229,144,989 | ||||
Receivables excluding sales taxes refundable | Loans and receivables | Amortized cost | 95,816 | N/A | ||||||
| $ | 229,240,805 | $ | 229,144,989 | |||||||
| Financial Liabilities | ||||||||||
Accounts payable and accrued liabilities | Other financial liabilities | Amortized cost | $ | 5,076,974 | N/A | |||||
| $ | 5,076,974 | N/A | ||||||||
| March 31, 2010 | ||||||||||
| Category | Carrying Value | Amount | Fair value hierarchy Level 1 | |||||||
| Financial Assets | ||||||||||
| Cash and cash equivalents | Held-for-trading | Fair value | $ | 48,712,372 | $ | 48,712,372 | ||||
| Receivables | Loans and receivables | Amortized cost | 39,662 | N/A | ||||||
| $ | 48,752,034 | $ | 48,712,372 | |||||||
| Financial Liabilities | ||||||||||
Accounts payable and accrued liabilities | Other financial liabilities | Amortized cost | $ | 1,097,951 | N/A | |||||
| $ | 1,097,951 | N/A | ||||||||
|
|
|
| |
|
|
|
| |
|
|
|
Unless otherwise noted, it is management’s opinion that the Company is not exposed to significant credit, liquidity, or market risks arising from these financial instruments. The risk exposure is summarized as follows:
Credit risk
Liquidity risk
Market risk
Interest rate risk
Interest rate risk is the risk that the fair value or future cash flows of a financial instrument will fluctuate because of changes in market interest rates.
| Interest rate risk is the risk that the fair value or future cash flows of a financial instrument will fluctuate because of changes in market interest rates. |
The Company’s cash and cash equivalents attract interest at floating rates and have maturities of 90 days or less. The interest is typical of Canadian banking rates, which are at present low, however the conservative investment strategy mitigates the risk of deterioration to the investment. A change of 100 basis points in the interest rates would not be material to the financial statements.
| The Company’s cash and cash equivalents attract interest at floating rates and have maturities of 90 days or less or maturity over ninety days but redeemable on demand without penalty. The interest is typical of Canadian banking rates, which are at present low, however the conservative investment strategy mitigates the risk of deterioration to the investment. A sensitivity analysis suggests that a change of 100 basis points in the interest rates would result in a corresponding increase or decrease in net loss of approximately $2,291,754 as at March 31, 2011. A change of 100 basis points in the interest would have not been material to the financial statements as at March 31, 2010. |
Foreign currency risk
The Company is exposed to the financial risk related to the fluctuation of foreign exchange rates. The Company has offices in Canada and Ghana and holds cash in Canadian, United States and Ghanaian Cedi currencies in line with forecasted expenditures. A significant change in the currency exchange rates between the Canadian dollar relative to US dollar and Ghanaian Cedi could have an effect on the Company’s results of operations, financial position or cash flows. At March 31, 2010, the Company had no hedging agreements in place with respect to foreign exchange rates.
| The Company is exposed to the financial risk related to the fluctuation of foreign exchange rates. The Company has offices in Canada and Ghana and holds cash in Canadian, United States and Ghanaian Cedi currencies in line with forecasted expenditures. A significant change in the currency exchange rates between the Canadian dollar relative to US dollar (“USD”), Ghanaian Cedi and the Australian dollar (“AUS”) could have an effect on the Company’s results of operations, financial position or cash flows. At March 31, 2011 and 2010, the Company had no hedging agreements in place with respect to foreign exchange rates. |
| The Company is exposed to currency risk through the following financial assets and liabilities denominated in currencies other than Canadian dollars: |
91
| March 31, 2011 | March 31, 2010 | |||||||||||||||||||||||
| USD | Ghana Cedis | AUD | USD | Ghana Cedis | AUD | |||||||||||||||||||
Cash and cash equivalents | 62,188,642 | 337,577 | - | 11,873,686 | 99,172 | - | ||||||||||||||||||
| Accounts payable | (80,639 | ) | (3,586,750 | ) | (386,702 | ) | (57,568 | ) | (829,482 | ) | (25,194 | ) | ||||||||||||
| Net exposure | 62,108,003 | (3,249,173 | ) | (386,702 | ) | 11,816,118 | (730,310 | ) | (25,194 | ) | ||||||||||||||
| A 10% appreciation or deprecation of the above mentioned currencies compared with the Canadian dollar would result in a corresponding increase or decrease in net loss of approximately $5,847,212 as at March 31, 2011 (2010 - $1,106,062). |
Expressed in Canadian Dollars
Financial instruments (continued)
Market risk (continued)
ii.
Foreign currency risk (continued)
| Other price risk is the risk that the future cash flows of a financial instrument will fluctuate because of changes in market prices, other than those arising from currency risk or interest rate risk. As at March 31, 2011 and 2010, the Company was not exposed to other price risk. |
The Company is exposed to currency risk through the following financial assets denominated in currencies other than Canadian dollars:
Cash and cash equivalents | March 31, 2010 | March 31, 2009 | |
US dollars | $ 11,689,000 | $ 159,991 | |
Ghana Cedis | 138,624 | 744,403 |
A 10% appreciation or deprecation of the above mentioned currencies compared with the Canadian dollar would result in an corresponding increase or decrease in net loss of approximately $1,182,000 as at March 31, 2010 (March 31, 2009 - $90,000).
Fair value
| (e) | Items of income, expense, gains or losses |
| 2011 | 2010 | 2009 | ||||||||||
| Interest income from held-for-trading financial assets | $ | 478,467 | $ | 114,994 | $ | 222,702 | ||||||
| Interest expense from other financial liabilities | - | - | - | |||||||||
| Realized gain on available-for-sale financial assets | $ | 215,666 | $ | - | $ | - | ||||||
Capital management
| 2011 | 2010 | |||||||
| Cash and cash equivalents | $ | 229,144,989 | $ | 48,712,372 | ||||
| Shareholders’ equity | $ | 295,077,091 | $ | 89,386,161 | ||||
92
2011.
Expressed in Canadian Dollars
Subsequent events
event
The following events occurred subsequent
(a)
There were 599,098 common shares issued pursuant to2011, the Company received an aggregate of $1,629,173 upon the exercise of 419,200 stock options for gross proceeds of $1,673,499.
(b)
There were 23,333 common shares issued pursuant to the exercise of broker warrants for gross proceeds of $72,332.
(c)
The Company granted incentive stock options to employees and directors to purchase 1,625,000 common shares at ana weighted average exercise price of $6.19$3.89 per share expiring five years from dateshare.
the 2010 comparative figures have been reclassified to conform to the current year’s presentation.
15.
These consolidated financial statements have been prepared in accordance with Canadian GAAP. A description of US GAAP and practices prescribed by the US Securities and Exchange Commission (collectively US GAAP) that result in material measurement differences from Canadian GAAP are as follows:
| These consolidated financial statements have been prepared in accordance with Canadian GAAP. A description of US GAAP and practices prescribed by the US Securities and Exchange Commission (collectively US GAAP) that result in material measurement differences from Canadian GAAP are as follows: |
Resource properties and deferred exploration costs
| Under Canadian GAAP, the Company’s accounting policy is to defer all expenditures related to mineral property exploration and development. Both Canadian and US GAAP require that long-lived assets be reviewed for impairment whenever events or changes in circumstances indicate that the carrying amount of an asset may not be recoverable. US GAAP requires mineral property exploration and land use costs to be charged to operations as incurred until economically proven and probable mineral reserves have been established and a final feasibility study has been completed. Accordingly, for all periods presented, the Company has expensed all mineral property exploration and land use costs for US GAAP purposes. The costs remaining for US GAAP purposes, if any, relate to mineral property acquisition costs under which the Company acquired an ownership interest in a given mineral property. |
| For Canadian GAAP, cash flows relating to mineral property exploration and land use costs are reported as investing activities. For US GAAP, these costs would be characterized as operating activities. |
income taxes
For Canadian GAAP, cash flows relating to mineral property exploration and land use costs are reported as investing activities. For US GAAP, these costs would be characterized as operating activities.
| In July 2006, the FASB issued an interpretation of ASC 740 — Income Taxes (“ASC 740”) which addresses the accounting for uncertainty in income taxes. This interpretation clarifies the accounting for income taxes by prescribing a minimum recognition threshold that a tax position is required to meet before being recognized in the financial statements. It also provides guidance on derecognition, classification, interest and penalties, accounting in interim periods, disclosures, and transition. |
93
| The Company is subject to income taxes in Canada and the Republic of Ghana. The tax years of major tax jurisdictions that remain subject to examination as of March 31, 2011 are as follows: |
| Canada | 2004 to 2011 | |
| Ghana | 2006 to 2011 |
Expressed in Canadian Dollars
15.
(b)
Accounting for uncertainty in income taxes
In July 2006, the FASB issued an interpretation of ASC 740 — Income Taxes (“ASC 740”) which addresses the accounting for uncertainty in income taxes. This interpretation clarifies the accounting for income taxes by prescribing a minimum recognition threshold that a tax position is required to meet before being recognized in the financial statements. It also provides guidance on derecognition, classification, interest and penalties, accounting in interim periods, disclosures, and transition.
The Company is subject to income taxes in Canada and the Republic of Ghana. The tax years of major tax jurisdictions which remain subject to examination as of March 31, 2010 are as follows:
|
|
| Pursuant to the provisions of ASC 718-20 the Company applied the modified-prospective transition method. Under this method, the fair value provisions of ASC 718-20 are applied to new employee share-based payment awards granted or awards modified, repurchased, or cancelled after January 1, 2006. Measurement and attribution of compensation cost for unvested awards at January 1, 2006, granted prior to |
| The following is a summary for stock options as at March 31: |
| 2011 | 2010 | 2009 | ||||||||||
| Outstanding stock options | 6,213,750 | 2,984,507 | 3,214,410 | |||||||||
| Exercisable stock options | 3,423,125 | 2,317,632 | 2,907,910 | |||||||||
| Aggregate intrinsic value of options outstanding | $ | 13,515,367 | $ | 8,510,028 | $ | 3,048,594 | ||||||
| Weighted average contractual term | 4.04 years | 3.03 years | 2.64 years | |||||||||
(c) Stock-based compensation
| The aggregate intrinsic value represents the difference between the Company’s closing stock price on March 31, 2011 and the exercise price of the award, multiplied by the number of in-the-money options. |
Pursuant to the provisions of ASC 718-20 the Company applied the modified-prospective transition method. Under this method, the fair value provisions of ASC 718-20 are applied to new employee share-based payment awards granted or awards modified, repurchased, or cancelled after January 1, 2006. Measurement and attribution of compensation cost for unvested awards at January 1, 2006, granted prior to the adoption of ASC 718-20 are recognized based upon the provisions of SFAS 123. The cumulative effect of a change in accounting principle to reflect forfeitures for prior periods was determined to be immaterial and not recorded.
The following is a summary for stock options as at March 31:
2010 | 2009 | ||
Outstanding stock options | 2,984,507 | 3,214,410 | |
Exercisable stock options | 2,317,632 | 2,907,910 | |
Aggregate intrinsic value of options outstanding | $8,510,028 | $3,048,594 | |
Weighted average contractual term | 3.03 years | 2.64 years |
The aggregate intrinsic value represents the difference between the Company’s closing stock price on March 31, 2010 and the exercise price of the award, multiplied by the number of in-the-money options.
94
KEEGAN RESOURCES INC.
(An Exploration Stage Company)
Notes to Consolidated Financial Statements, page 23
Years ended March 31, 2010, 2009 and 2008
Expressed in Canadian Dollars
15.
United States generally accepted accounting principles (continued)
(d)
Adoption of New Accounting Policies
i.
Financial Accounting Standards Board’s Codification of US GAAP
On July 1, 2009, the FASB’s Codification of US GAAP (the “Codification”) was issued to create a consolidated reference source for all authoritative non-governmental US GAAP. The Codification was not intended to change US GAAP, but rather reorganize existing guidance by accounting topic to allow easier identification of applicable standards. References in the Company’s consolidated financial statements to US GAAP have been updated to reflect the Codification.
ii.
Business combinations
In December 2007, the FASB issued ASC 805 — Business Combinations (“ASC 805”) (formerly referred to as FAS 141R) which is effective for fiscal years beginning after December 15, 2008. ASC 805, which will replace FAS 141, is applicable to business combinations consummated after the effective date of December 15, 2008. This Standard modifies the accounting of certain aspects of business combinations. The adoption of ASC 805 did not have a material impact on the Company’s consolidated financial statements.
iii.
810 – Non-controlling interests
In December 2007, the FASB also issued ASC 810 - Non-controlling Interests in Consolidated Financial Statements (“ASC 810”)810). ASC 810 will changerequires losses be attributed to the accountingnon-controlling interest even if they exceed its carrying amount and reporting for minority interests, which will be re-characterized as non-controlling interests andbe classified as a component of equity. ASC 810 requires retroactive adoptionUnder Canadian GAAP losses are attributed to non-controlling interest up to its carrying amount and non-controlling interest is recognized between liabilities and shareholders equity of the presentation and disclosure requirements for existing minority interests. SFAS No. 160 is effective for fiscal years beginning on or after December 15, 2008 and interim periods within those fiscal years. The adoption of ASC 810 did not have a material impact on the Company’s consolidated financial statements.
balance sheet.
iv.
Derivative Instruments and Hedging Activities
In March 2008, the FASB issued ASC 815 “Disclosures about Derivative Instruments and Hedging Activities” (“ASC 815”). This Statement requires enhanced disclosures about an entity’s derivative and hedging activities and thereby improves the transparency of financial reporting. This Statement is effective for fiscal years and interim periods beginning after November 15, 2008, with early application encouraged. This Statement encourages, but does not require, comparative disclosures for earlier periods at initial adoption. The adoption of ASC 815 did not have a material impact on the Company’s consolidated financial statements.
95
KEEGAN RESOURCES INC.
(An Exploration Stage Company)
Notes to Consolidated Financial Statements, page 24
Years ended March 31, 2010, 2009 and 2008
Expressed in Canadian Dollars
15.
United States generally accepted accounting principles (continued)
(d)
v.
Subsequent events
| i. | Accounting of Transfers of Financial Assets an amendment of FASB No. 140 |
In May 2009, the FASB issued ASC 855, “Subsequent Events” (“ASC 855”). This Statement established general standards of accounting for and disclosures of events that occur after the balance sheet date but before financial statements are issued or are available to be issued. In particular, this Statement details the period after the balance sheet date during which management of a reporting entity should evaluate events or transactions that may occur for potential recognition or disclosure in the financial statements; the circumstances under which an entity should recognize events or transactions occurring after the balance sheet date in its financial statements; and the disclosures that an entity should make about events or transactions that occur after the balance sheet date. The adoption of ASC 855 did not have a material impact on the Company’s consolidated financial statements.
vi.
The Fair Value Measurement of Liabilities
In August 2009, the FASB issued ASU 2009-05 “Measuring Liabilities at Fair Value” (“ASU 2009-05”), which provides amendments to Subtopic 820-10 “Fair Value Measurements and Disclosures — Overall” and is effective prospectively for interim periods beginning after October 1, 2009 for the Company. ASU 2009-05 provides clarification that in circumstances in which a quoted price in an active market for the identical liability is not available, a reporting entity is required to measure fair value using one of the valuation techniques that uses (a) the quoted price of the identical liability when traded as asset; (b) quoted prices for similar liabilities when traded as assets; or another valuation technique that is consistent with the principles of Topic 820 “Fair Value Measurements and Disclosures”. Therefore, the fair value of the liability shall reflect non-pe rformance risk, including but not limited to a reporting entity’s own credit risk. ASU 2009-05 also clarifies that when estimating the fair value of a liability, a reporting entity is not required to include a separate input or adjustment to other inputs relating to the existence of a restriction that prevents the transfer of liability. The adoption of ASU 2009-05 did not have a material impact on the Company’s consolidated financial statements.
vii.
Equity method investees
Effective January 1, 2009 the Company adopted the FASB’s guidance on equity method investment accounting considerations which is included in ASC 323 — Investments — Equity Method and Joint Ventures and applicable for fiscal years beginning on or after December 15, 2008. The guidance indicates when investments accounted for using the equity method are impaired and the appropriate initial measurement and accounting for subsequent changes in ownership percentages. The adoption of this guidance did not result in a material impact to the Company’s consolidated financial statements.
96
KEEGAN RESOURCES INC.
(An Exploration Stage Company)
Notes to Consolidated Financial Statements, page 25
Years ended March 31, 2010, 2009 and 2008
Expressed in Canadian Dollars
15.
United States generally accepted accounting principles (continued)
(e)
Recent Accounting Pronouncements Issued But Not Yet Implemented
i.
Accounting of Transfers of Financial Assets an amendment of FASB No. 140
| (e) | Adoption of New Accounting Policies (continued) |
| i. | Accounting of Transfers of Financial Assets an amendment of FASB No. 140 (continued) |
standard did not have a material impact on the Company’s financial statements.
(f)
Reconciliation
The effect of the above measurement differences between Canadian GAAP and US GAAP (including practices prescribed by the SEC)standard did not have a material impact on the consolidated balance sheets and statements of operations, comprehensive loss and deficit and cash flows is summarized as follows:
Company’s financial statements.
| (f) | As permitted by the Securities Exchange Commission, the Company will not provide reconciliations between local generally accepted accounting principles and US GAAP, following the adoption of IFRS for periods starting on April 1, 2011. |
| (g) | Reconciliation |
97
| The effect of the above measurement differences between Canadian GAAP and US GAAP (including practices prescribed by the SEC) on the consolidated balance sheets and statements of operations, comprehensive loss and deficit and cash flows is summarized as follows: |
| Reconciliation of losses reported to US GAAP: |
| 2011 | 2010 | 2009 | ||||||||||
| Net loss and comprehensive loss as reported in accordance with Canadian GAAP | $ | (12,910,250 | ) | $ | (6,972,686 | ) | $ | (4,176,396 | ) | |||
| Adjustments: | ||||||||||||
| Mineral property exploration costs (note 16(a)) | (32,549,443 | ) | (10,765,183 | ) | (11,057,807 | ) | ||||||
| Net loss and comprehensive loss under US GAAP | $ | (45,459,693 | ) | $ | (17,737,869 | ) | $ | (15,234,203 | ) | |||
| Less: Loss attributable to non-controlling interest US GAAP (note 16(d)) | 471,776 | - | - | |||||||||
| Loss attributable to shareholders US GAAP | (44,987,917 | ) | - | - | ||||||||
| Basic and diluted loss per share under US GAAP | $ | (0.91 | ) | $ | (0.47 | ) | $ | (0.54 | ) | |||
24
Expressed in Canadian Dollars
15.
(f)
Reconciliation of losses reported to US GAAP:
| Reconciliation of total assets, liabilities and shareholders’ equity to US GAAP: |
2010 | 2009 | 2008 | |||||
Net loss and comprehensive loss as reported in accordance with Canadian GAAP | $ | (6,972,686) | $ | (4,176,396) | $ | (4,316,042) | |
Adjustments: | |||||||
Mineral property exploration costs (note 15(a)) | (10,765,183) | (11,057,807) | (10,232,744) | ||||
Net loss and comprehensive loss under US GAAP | $ | (17,737,869) | $ | (15,234,203) | $ | (14,548,786) | |
Net loss per share under US GAAP | $ | (0.47) | $ | (0.54) | $ | (0.59) |
| 2011 | 2010 | |||||||
| Total assets under Canadian GAAP | $ | 304,916,074 | $ | 90,533,972 | ||||
| Adjustments: | ||||||||
| Mineral property exploration costs (note 16(a)) | (70,697,780 | ) | (38,148,337 | ) | ||||
| Total assets under US GAAP | $ | 234,218,294 | $ | 52,385,635 | ||||
| Total liabilities under Canadian and US GAAP | $ | 9,838,983 | $ | 1,147,811 | ||||
| Total shareholders’ equity under Canadian GAAP | $ | 295,077,091 | $ | 89,386,161 | ||||
| Adjustments: | ||||||||
| Mineral property exploration costs (note 16(a)) | (70,697,780 | ) | (38,148,337 | ) | ||||
| Accumulated deficit attributable to non-controlling interest (note 4(a),16(d)) | 5,389,036 | - | ||||||
| Shareholders’ equity attributable to shareholders under US GAAP | 229,768,347 | 51,237,824 | ||||||
| Shareholders’ equity attributable to non-controlling interest under US GAAP (note 16(d)) | (5,389,036 | ) | - | |||||
| Total shareholders’ equity under US GAAP | 224,379,311 | 51,237,824 | ||||||
| Total liabilities and shareholders’ equity under US GAAP | $ | 234,218,294 | $ | 52,385,635 | ||||
Reconciliation of total assets, liabilities and shareholders’ equity to US GAAP:
2010 | 2009 | ||||
Total assets under Canadian GAAP | $ | 90,533,972 | $ | 33,717,800 | |
Adjustments: | |||||
Mineral property exploration costs (note 15(a)) | (38,148,337) | (27,383,154) | |||
Total assets under US GAAP | $ | 52,385,635 | $ | 6,334,646 | |
Total liabilities under Canadian and US GAAP | $ | 1,147,811 | $ | 652,656 | |
Total shareholders’ equity under Canadian GAAP | 89,386,161 | 33,065,144 | |||
Adjustments: | |||||
Mineral property exploration costs (note 15(a)) | (38,148,337) | (27,383,154) | |||
Total shareholders’ equity under US GAAP | 51,237,824 | 5,681,990 | |||
Total liabilities and shareholders’ equity under US GAAP | $ | 52,385,635 | $ | 6,334,646 |
| Reconciliation of consolidated statements of cash flows under US GAAP: |
Reconciliation of consolidated statements of cash flows under US GAAP:
| 2011 | 2010 | 2009 | ||||||||||
| Restated (note 2k) | Restated (note 2k) | |||||||||||
| Cash used in operating activities under Canadian GAAP | $ | (3,869,688 | ) | $ | (4,321,460 | ) | $ | (3,070,907 | ) | |||
| Adjustments: | ||||||||||||
| Mineral property exploration costs (note 16(a)) | (21,238,903 | ) | (9,319,015 | ) | (10,901,528 | ) | ||||||
| Cash used in operating activities under US GAAP | $ | (25,108,591 | ) | $ | (13,640,475 | ) | $ | (13,972,435 | ) | |||
2010 | 2009 | 2008 | |||||
Cash used in operating activities under Canadian GAAP | $ | (4,271,600) | $ | (3,207,108) | $ | (2,382,527) | |
Adjustments: | |||||||
Mineral property exploration costs (note 15(a)) | (9,386,875) | (10,901,528) | (9,861,207) | ||||
Cash used in operating activities under US GAAP | $ | (13,658,475) | $ | (14,108,636) | $ | (12,243,734) |
| 2011 | 2010 | 2009 | ||||||||||
| Cash used in investing activities under Canadian GAAP | $ | (21,983,300 | ) | $ | (9,533,766 | ) | $ | (12,258,320 | ) | |||
| Adjustments: | ||||||||||||
| Mineral property exploration costs (note 16(a)) | 21,238,903 | 9,319,015 | 10,901,528 | |||||||||
| Cash used in investing activities under US GAAP | $ | (744,397 | ) | $ | (214,751 | ) | $ | (1,356,792 | ) | |||
98
| ITEM 19. | EXHIBITS |
KEEGAN RESOURCES INC.
(An Exploration Stage Company)
Notes to Consolidated Financial Statements, page 27
Years ended March 31, 2010, 2009 and 2008
Expressed in Canadian Dollars
15.
United States generally accepted accounting principles (continued)
(f)
Reconciliation (continued)
2010 | 2009 | 2008 | |||||
Cash used in investing activities under Canadian GAAP | $ | (30,583,626) | $ | (12,258,320) | $ | (11,487,391) | |
Adjustments: | |||||||
Mineral property exploration costs (note 15(a)) | 9,368,875 | 10,901,528 | 9,861,207 | ||||
Cash used in investing activities under US GAAP | $ | (21,214,751) | $ | (1,356,792) | $ | (1,626,184) |
99
| Exhibit | Description of Exhibit |
| 1.1 | Certificate of Incorporation (1) |
| 1.2 | Certificate of Name Change (1) |
| 1.3 | Articles (1) |
| 1.5 | Notice of Alteration (1) |
| 4.1 | Asumura Project – Agreement dated February 18, 2005 between the Company and GTE Ventures Limited (1) |
| 4.2 | Esaase Project – Agreement dated May 9, 2006 between the Company and Sammetro Co. Ltd. (1) |
| 4.3 | Option agreement dated March 27, 2008 with Mt. Olives Goldfields, Ltd. (2) |
| 4.4 | Jeni Concession mining lease and exploration rights. (2) |
| 4.5 | Dan McCoy Consulting Agreement – Agreement between the Company and Dan McCoy dated January 1, 2005 (1) |
| 4.6 | 2008 Share Option Plan (3) |
| 8.1 | List of Subsidiaries – See Item 4.C. |
| 12.1 | 302 Certification of Chief Executive Officer |
| 12.2 | 302 Certification of Chief Financial Officer |
| 13.1 | 906 Certification of Chief Executive Officer |
| 13.2 | 906 Certification of Chief Financial Officer |
| 15.1 | Letter by BDO Canada LLP - Preferable accounting principle |
| (1) | Incorporated by reference from our Registration Statement on Form 20-F filed with the SEC on October 17, 2006. |
Dated: June | By: “Maurice Tagami” |
Maurice Tagami, President and CEO |
100